Embed Size (px)
Citation preview

Primary Data Analysis Node (P-DAN) Report
3rd Joint Project Team Meeting for Sentinel Asia STEP3 (JPTM2016)
Dr. Masahiko NAGAI
Associate Professor, Center for Spatial Information Science, The University of Tokyo, Japan
Space Agencies Disaster ManagementAgencies
Disasters
SatelliteObservation
DataUtilization
Information Provision
Data Request
DPN DAN End User
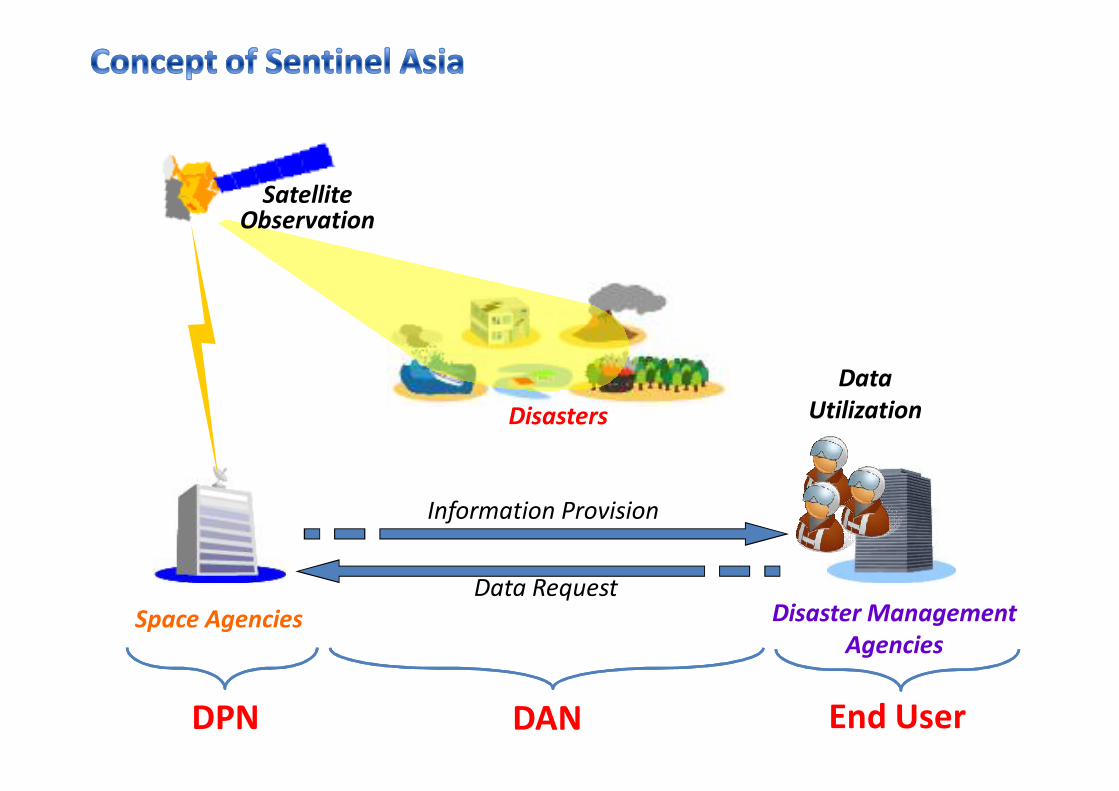
Space Agencies Disaster ManagementAgencies
Disasters
SatelliteObservation
DataUtilization
Information Provision
Data Request
DPN DAN End User
Activities for DAN Network for University and
Research Institution Advanced analysis InSAR, etc. Training for instructor
Activity for End User Support as a helpdesk Basic RS and GIS process Map making
4
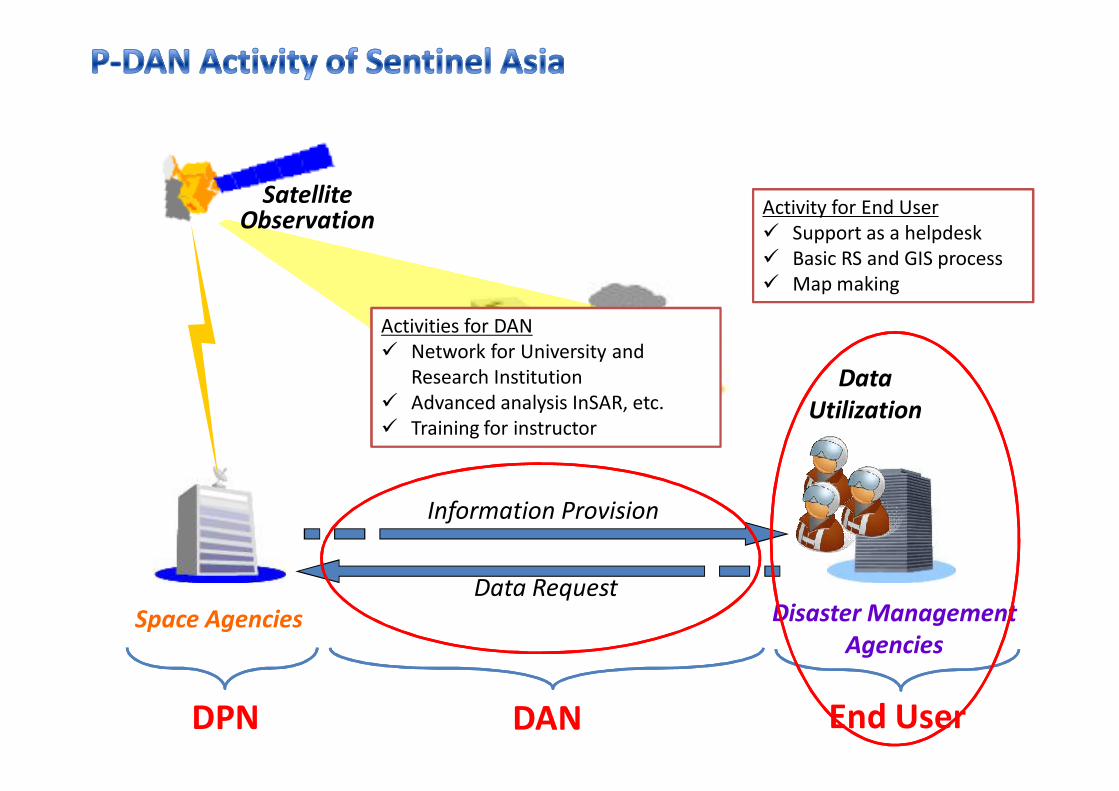
Strategy of Capacity Building
Disaster Management AgenciesNetwork for Universities and Research Institutions
University of Tokyo
Keio University
Tokyo University of Marine Science and Technology
AIT
University of Philippines
Indonesia University
Chulalongkorn University
NationalUniversity of Laos
etc.

Cloud-based System for Archive, Integration and Analysis
Satellite data
5
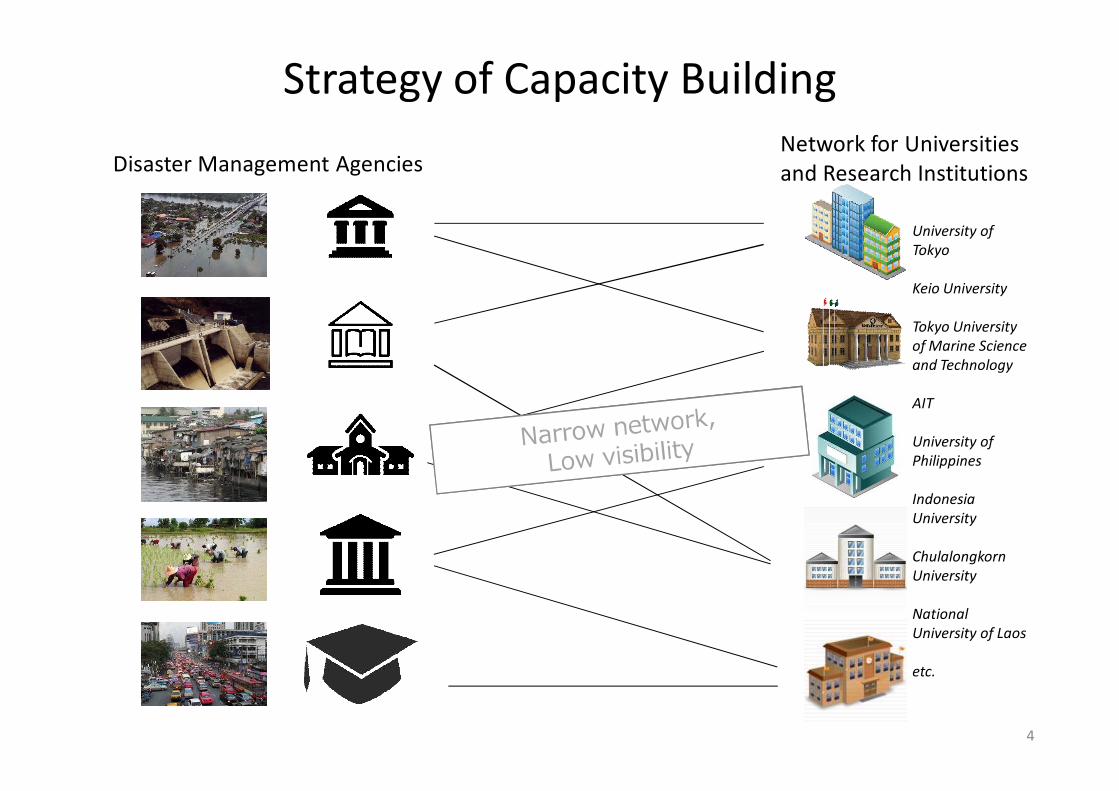
Strategy of Capacity Building
University of Tokyo
Keio University
Tokyo University of Marine Science and Technology
AIT
University of Philippines
Indonesia University
Chulalongkorn University
NationalUniversity of Laos
etc.
Disaster Management AgenciesNetwork for Universities and Research Institutions
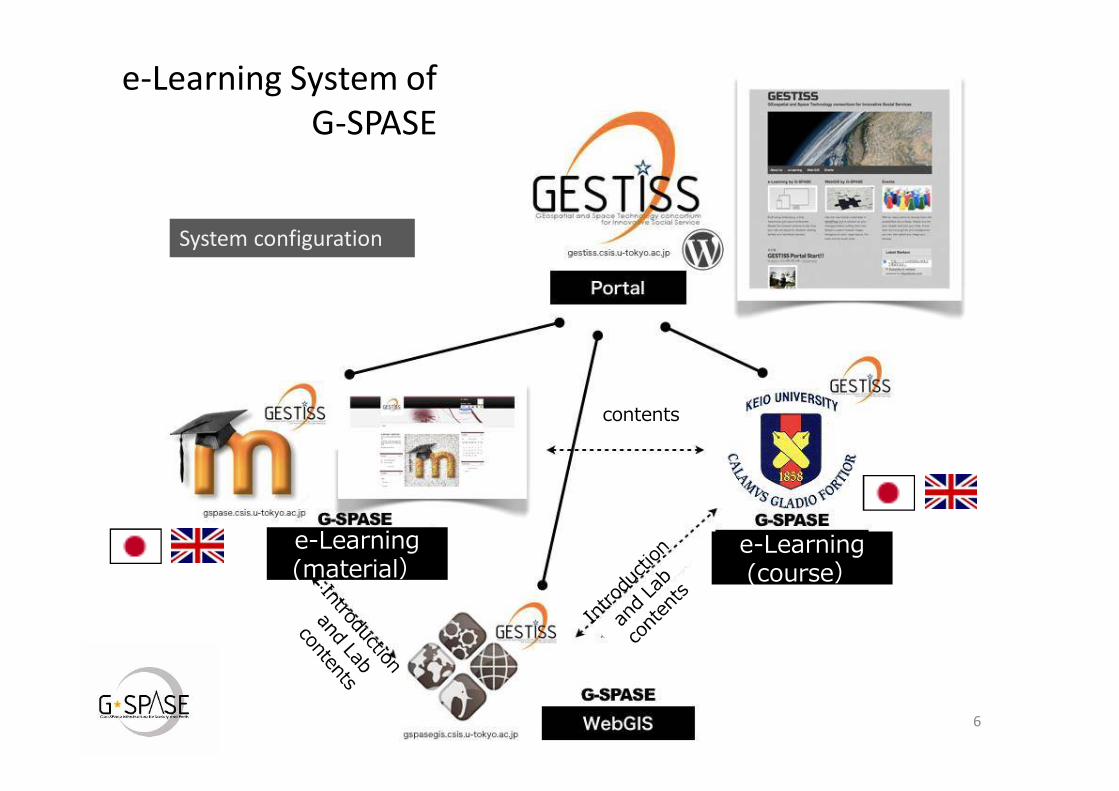
contents
e-Learning(course)
e-Learning(material)
e-Learning System of G-SPASE
System configuration
6
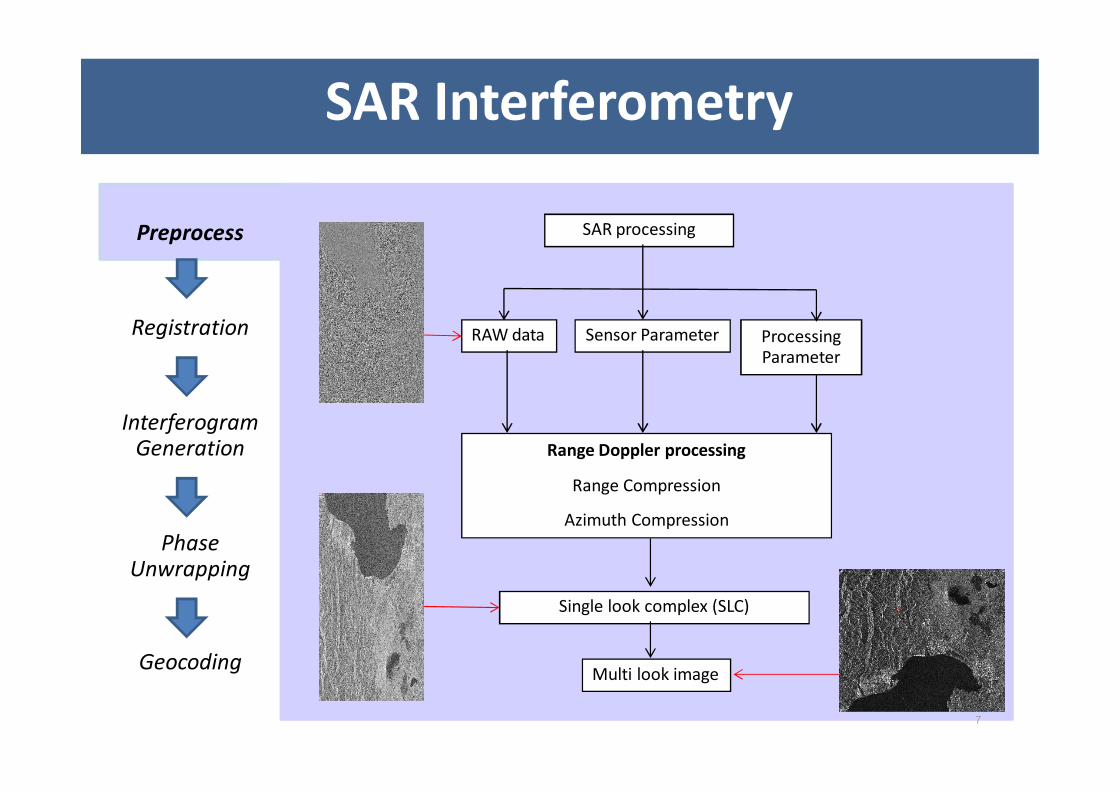
Summary of methodology of InSAR processing
Preprocess
Registration
InterferogramGeneration
Phase Unwrapping
Geocoding
SAR Interferometry
Range Doppler processing
Range Compression
Azimuth Compression
Single look complex (SLC)
Multi look image
SAR processing
RAW data Sensor Parameter Processing Parameter
7
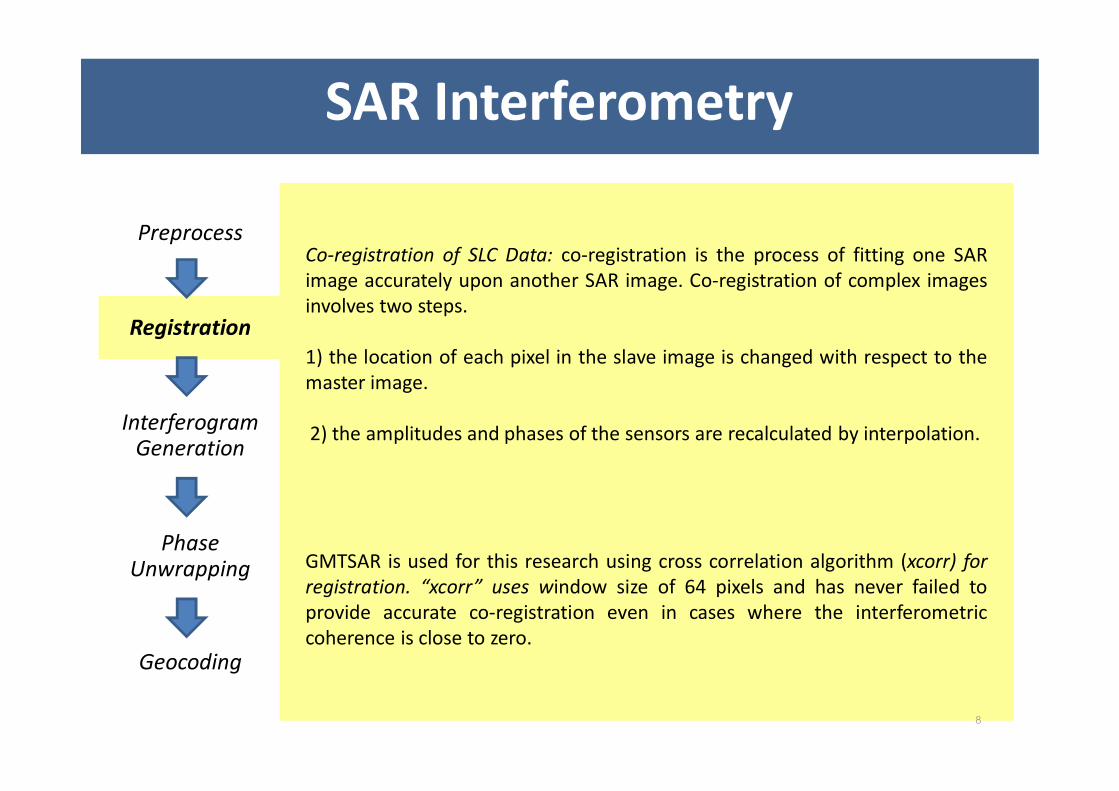
Preprocess
Registration
InterferogramGeneration
Phase Unwrapping
Geocoding
Co-registration of SLC Data: co-registration is the process of fitting one SARimage accurately upon another SAR image. Co-registration of complex imagesinvolves two steps.
1) the location of each pixel in the slave image is changed with respect to themaster image.
2) the amplitudes and phases of the sensors are recalculated by interpolation.
GMTSAR is used for this research using cross correlation algorithm (xcorr) forregistration. “xcorr” uses window size of 64 pixels and has never failed toprovide accurate co-registration even in cases where the interferometriccoherence is close to zero.
Summary of methodology of InSAR processingSummary of methodology of InSAR processingSAR Interferometry
8
Preprocess
Registration
InterferogramGeneration
Phase Unwrapping
Geocoding
Summary of methodology of InSAR processingSAR Interferometry
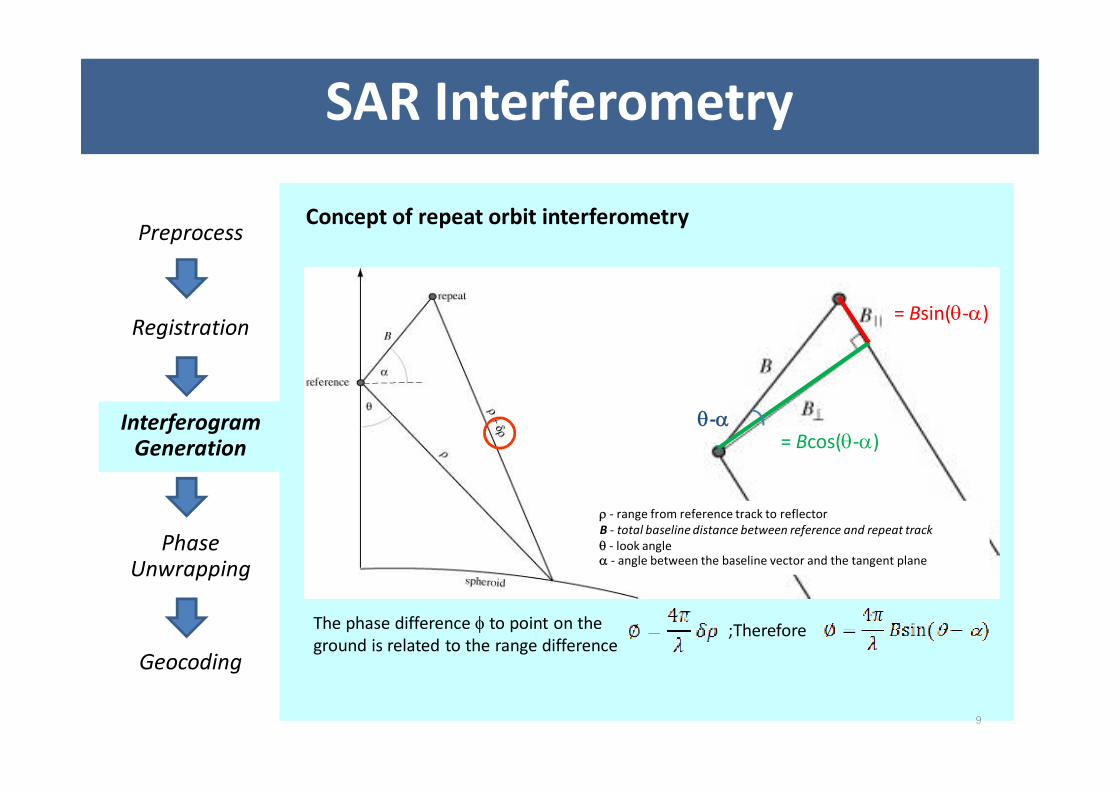
Concept of repeat orbit interferometry
The phase difference to point on the ground is related to the range difference
;Therefore
- range from reference track to reflectorB - total baseline distance between reference and repeat track - look angle - angle between the baseline vector and the tangent plane
= Bcos(-)
= Bsin(-)
-
9
Preprocess
Registration
InterferogramGeneration
Phase Unwrapping
Geocoding
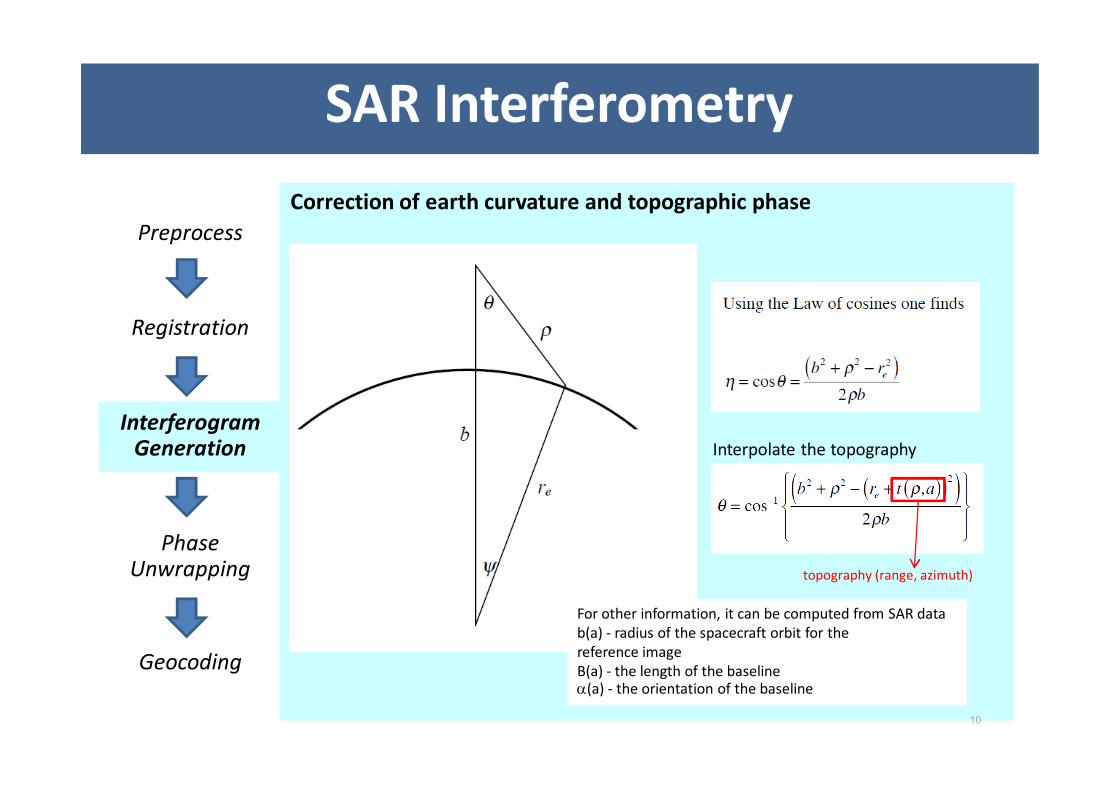
Summary of methodology of InSAR processingSAR InterferometryCorrection of earth curvature and topographic phase
Interpolate the topography
For other information, it can be computed from SAR datab(a) - radius of the spacecraft orbit for thereference imageB(a) - the length of the baseline(a) - the orientation of the baseline
topography (range, azimuth)
10

Preprocess
Registration
InterferogramGeneration
Phase Unwrapping
Geocoding
Summary of methodology of InSAR processingSAR InterferometryPhase due to earth curvature and topography
Law of cosine
It can be rewritten as
Phase to range =
Reference: GMTSAR (2011)
= -B sin (-)
11
It can be rewritten as
Preprocess
Registration
InterferogramGeneration
Phase Unwrapping
Geocoding
SAR Interferometry
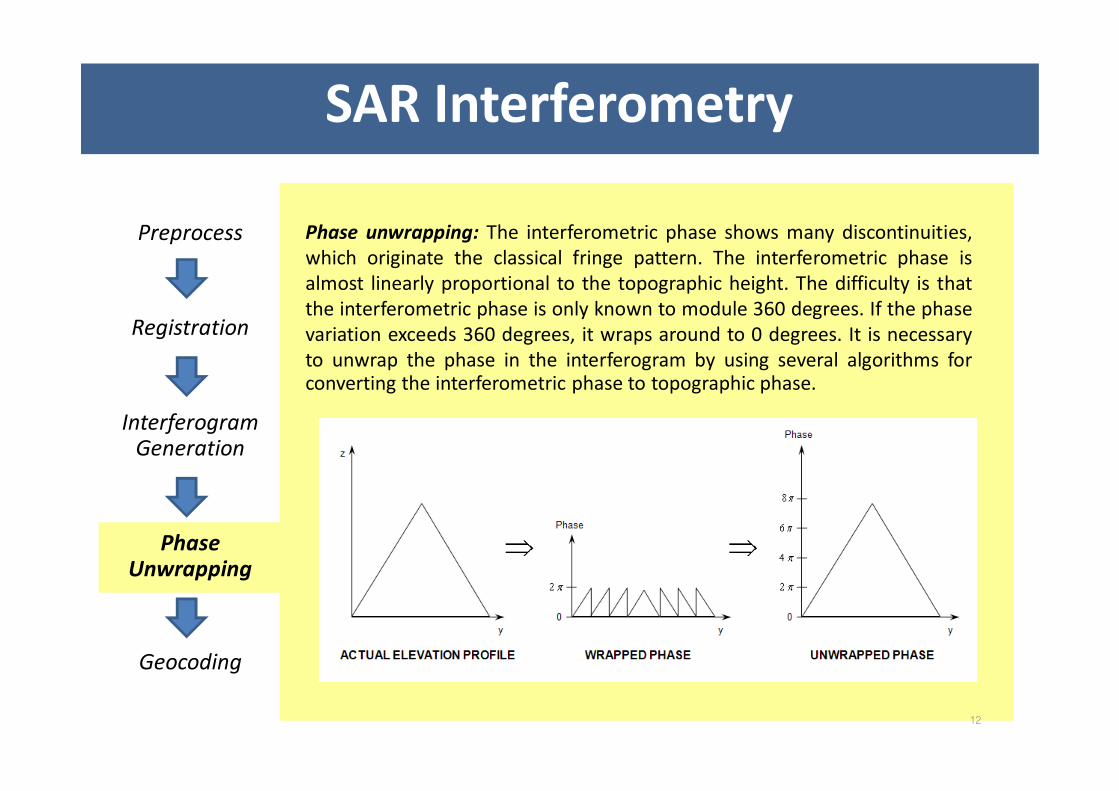
Phase unwrapping: The interferometric phase shows many discontinuities,which originate the classical fringe pattern. The interferometric phase isalmost linearly proportional to the topographic height. The difficulty is thatthe interferometric phase is only known to module 360 degrees. If the phasevariation exceeds 360 degrees, it wraps around to 0 degrees. It is necessaryto unwrap the phase in the interferogram by using several algorithms forconverting the interferometric phase to topographic phase.
12

Preprocess
Registration
InterferogramGeneration
Phase Unwrapping
Geocoding
SAR Interferometry
The final step is to geocode all the products by transforming from the range/azimuth coordinate system of the master image to longitude and latitude.
Geocode
Amplitude image
Interferogram image13
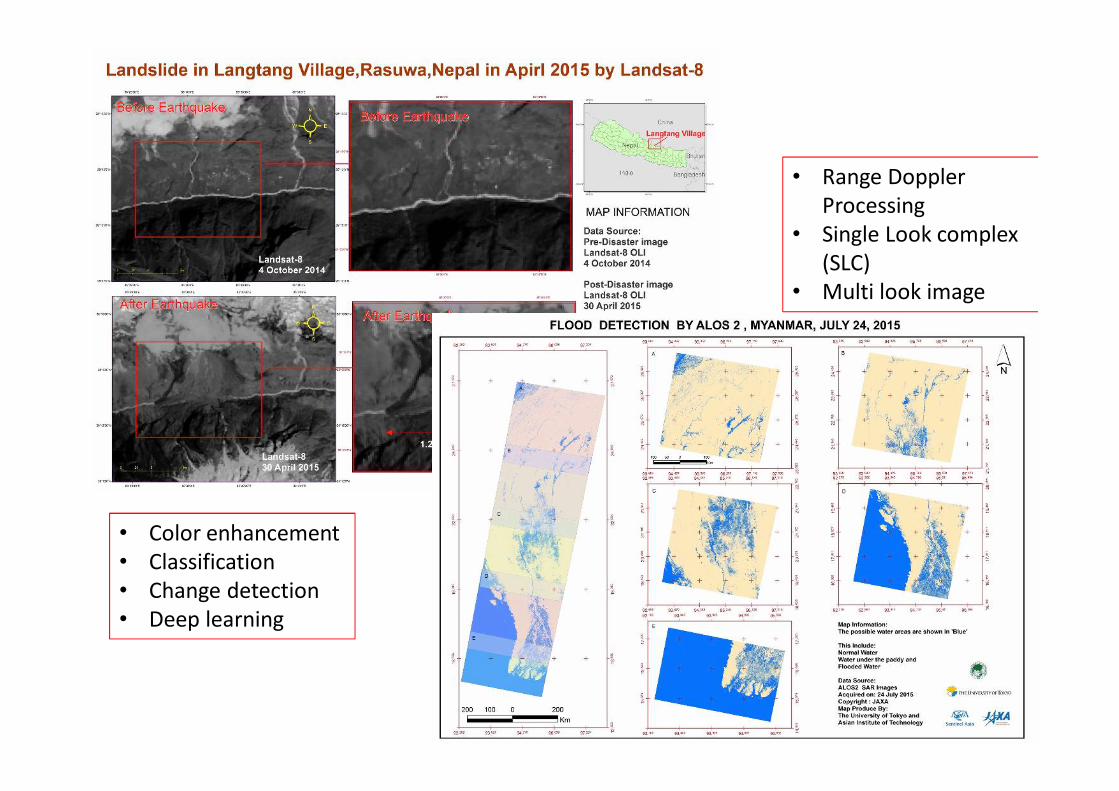
• Range Doppler Processing
• Single Look complex (SLC)
• Multi look image
• Color enhancement• Classification• Change detection• Deep learning
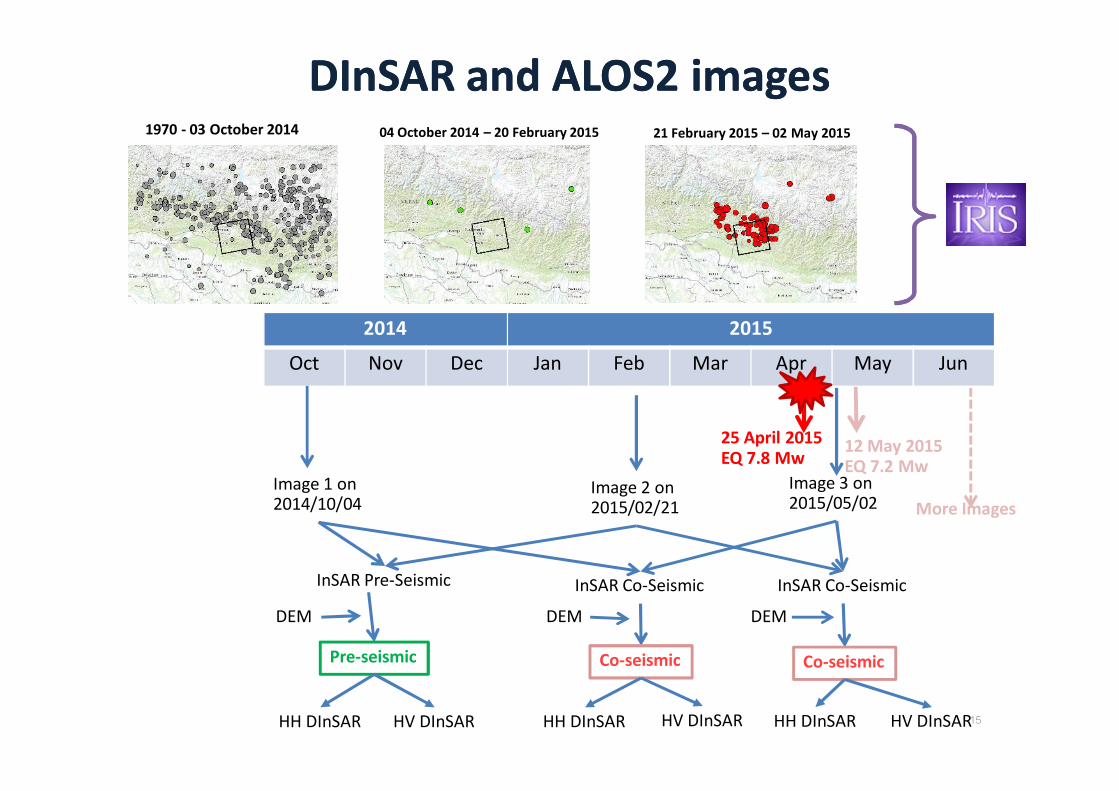
DInSARDInSAR and ALOSand ALOS2 2 imagesimages
Image 1 on 2014/10/04
Image 3 on2015/05/02
Image 2 on2015/02/21
2014 2015
Oct Nov Dec Jan Feb Mar Apr May Jun
25 April 2015EQ 7.8 Mw
InSAR Pre-Seismic InSAR Co-Seismic
DEM DEM
Pre-seismic Co-seismic
12 May 2015EQ 7.2 Mw
More Images
InSAR Co-Seismic
DEM
Co-seismic
1970 - 03 October 2014 04 October 2014 – 20 February 2015 21 February 2015 – 02 May 2015
HH DInSAR HV DInSAR HH DInSAR HV DInSAR HH DInSAR HV DInSAR15
16
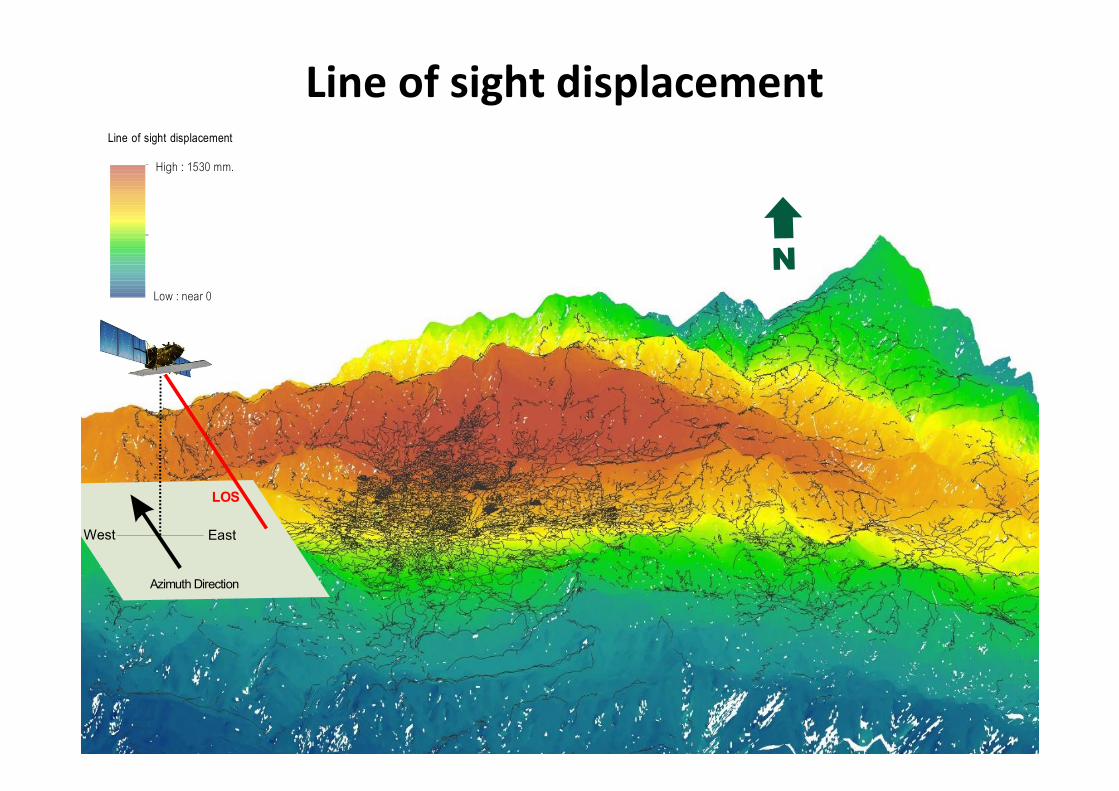
Azimuth Direction
LOS
West East
Line of sight displacement
N
High : 1530 mm.
Low : near 0
Line of sight displacement
17
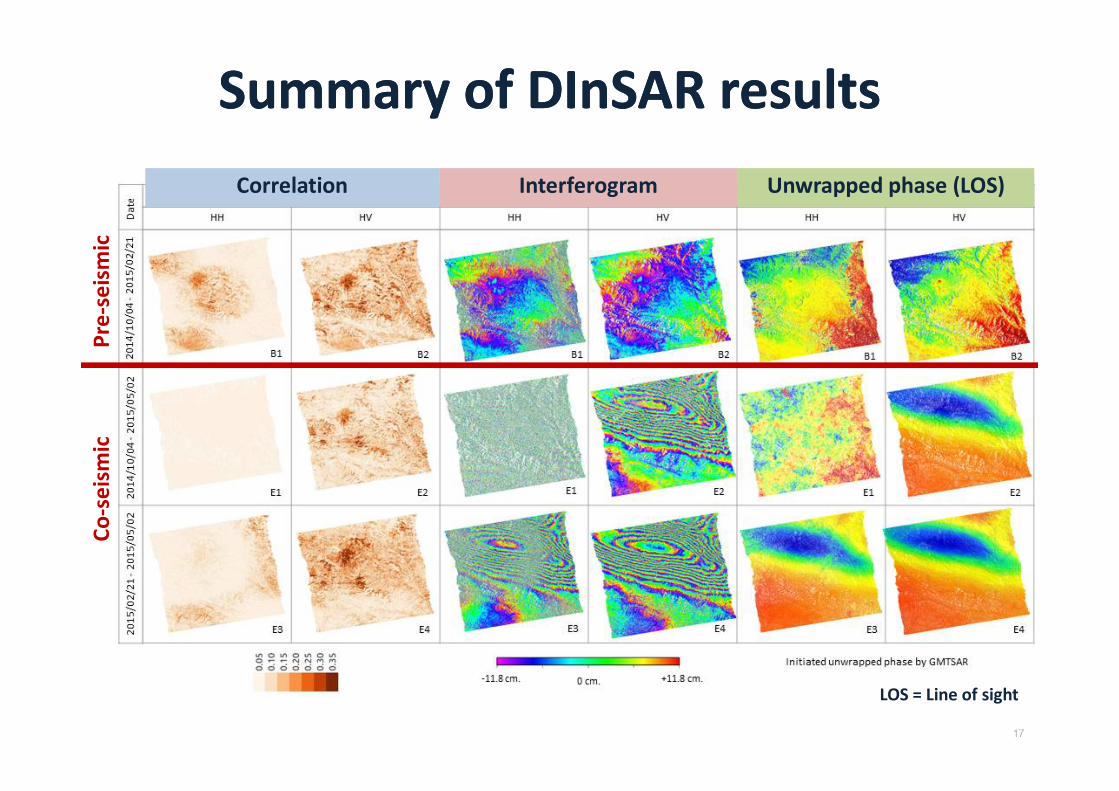
Summary of Summary of DInSARDInSAR results results Pr
e-se
ism
icCo
-sei
smic
Correlation Interferogram Unwrapped phase (LOS)
LOS = Line of sight
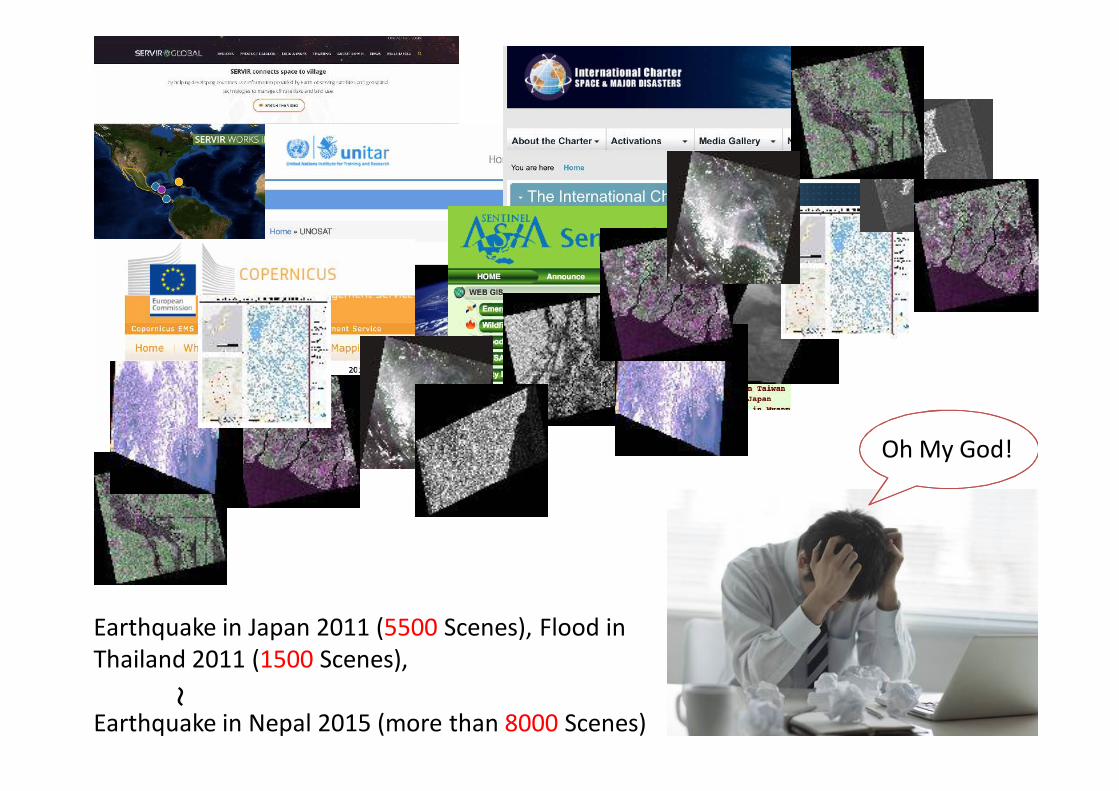
Earthquake in Japan 2011 (5500 Scenes), Flood in Thailand 2011 (1500 Scenes),
Earthquake in Nepal 2015 (more than 8000 Scenes)
Oh My God!
〜

A Solution; Cloud-based System for Archive, Integration and Analysis
!Co-work on the same platform!
Share data, tools, ideas and experiences!
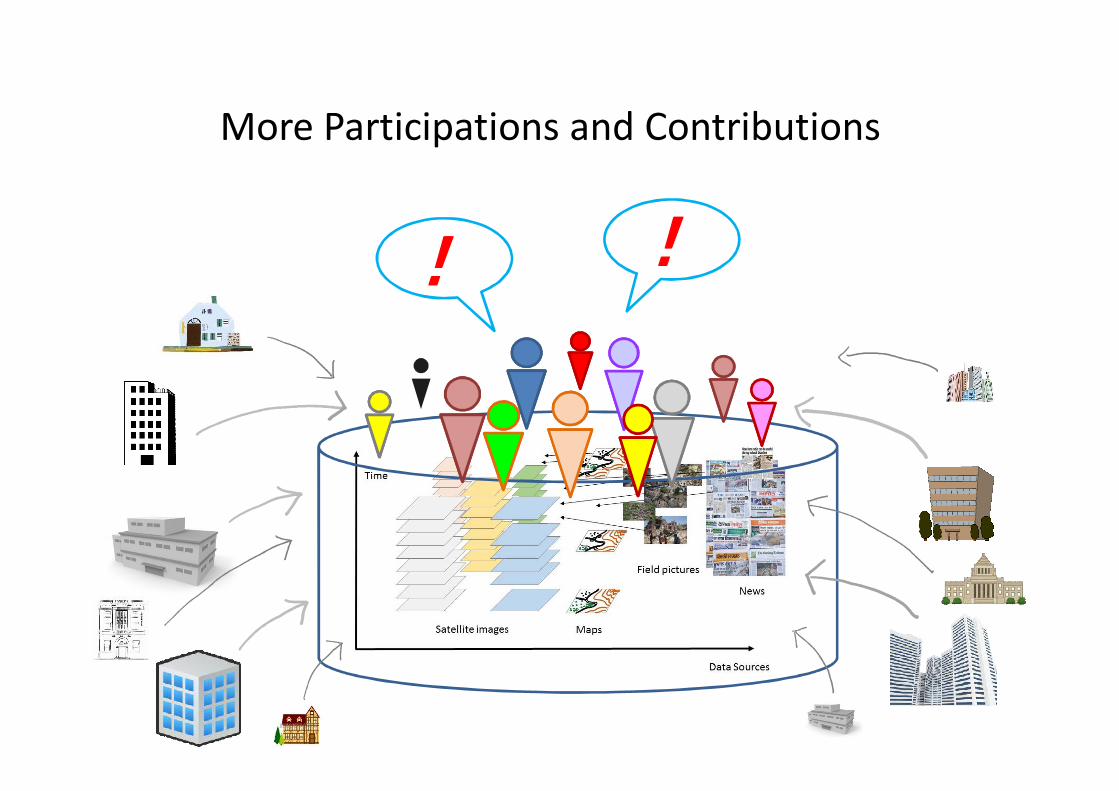
More Participations and Contributions
!!

http://gestiss.org
Emergency Data Analysis team
Faculty in RSGIS: 7Faculty in DPMM: 2Student in RSGIS: 15Nepalese: many

Satellite Data: Dec. 4, 14:00Analyzed Product: Dec 4, 17:00
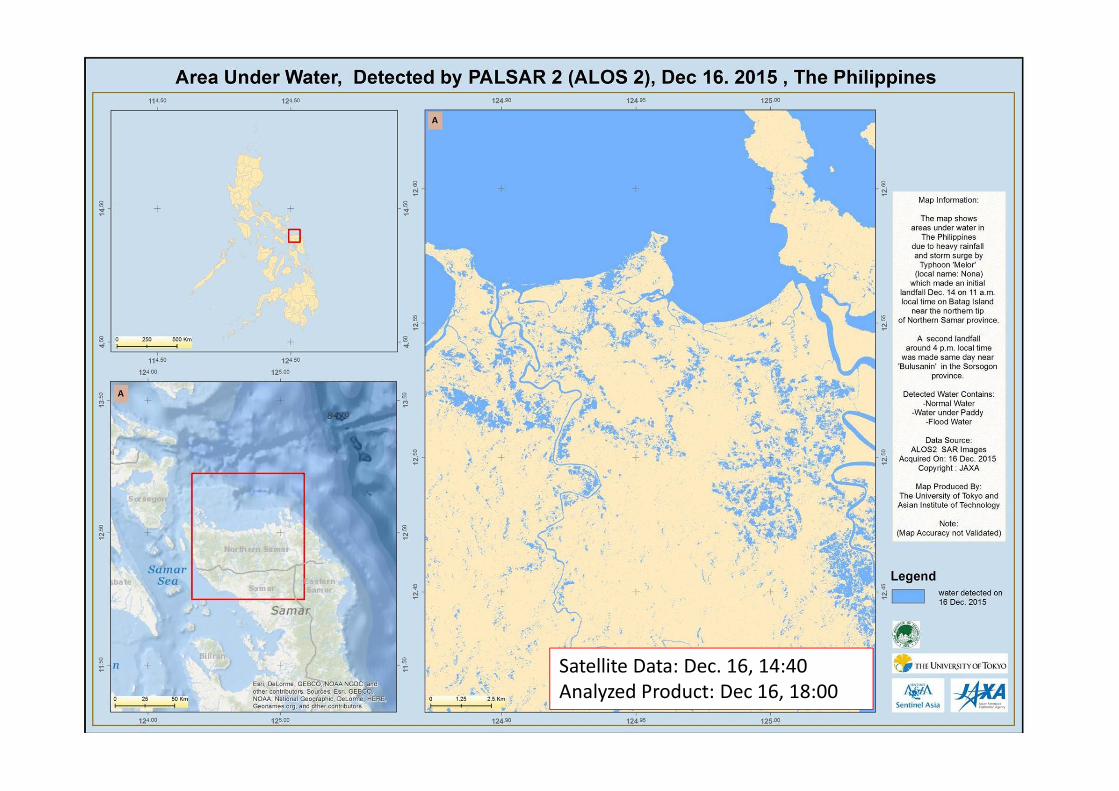
Satellite Data: Dec. 16, 14:40Analyzed Product: Dec 16, 18:00