Embed Size (px)
Citation preview

Sustainable use of Baltic Sea natural resources based on ecological engineering and biogas production
S A R A K A R L S S O N
Master of Science Thesis Stockholm 2009


EXAMENSARBETE
UTFÖRT VID
INDUSTRIELL EKOLOGI KUNGLIGA TEKNISKA HÖGSKOLAN
Sara Karlsson
Sustainable use of Baltic Sea natural resources based on ecologcial engineering and biogas
production: System analysis and case study Trelleborg
Supervisor & Examiner:
Fredrik Gröndahl

TRITA-IM 2009:08
ISSN 1402-7615
Industriell Ekologi
Skolan för Industriell teknik och management
Kungliga Tekniska Högskolan
www.ima.kth.se

i
Abstract
Eutrophication is one of the most serious environmental problems in the Baltic Sea due to factors such as nutrient discharges from different sources and long residence time. Eutrophication gives rise to increased primary production, often followed by oxygen depletion and disruption of important ecosystems. An action plan has been created by the Helsinki Commission (HELCOM) in order to achieve good ecological status of the Baltic Sea in the year of 2021. According to the action plan, 21 000 tonnes of nitrogen and 290 tonnes of phosphorus shall be decreased of the annual discharge from Sweden.
The aim of methods within ecological engineering is to solve environmental problems, and the applications ranging from the harvesting of existing ecosystems to the construction of new ecosystems. This study evaluates if harvest of algae, reed, and mussels can help meeting the goals of the action plan considerably, in accordance with areas and biomass amounts that need to be harvested, and to assess the efficiency of the three biomasses with regards to nutrient reduction. The potential of harvested biomasses as substrates in biogas production and as fertilizers is investigated, and how much fossil CO2 that can be saved from being released to the atmosphere if net energy benefits, calculated from energy budgets in the biogas process, replaces fossil fuels.
Life cycle inventories which extend from the harvest (i.e. from the Baltic coast of Sweden) to the production of biogas have been made in order to investigate the biogas potential of algal, reed, and mussel biomass. Suitability of the three biomasses as fertilizers has been assessed through comparison between nutrient sufficiency of crops and nutrient contents of the three biomasses (i.e. based on quotients of nitrogen).
The quantity of biomass in the areas that can be harvested can help meeting the goals of the action plan drawn up by HELCOM, and mussels show to be most efficient with regards to nutrient reduction efficiency. Reed has the highest net energy benefit followed by algae, and both biomasses show potential of further investigation as substrates in the biogas production process. Mussels have low net energy benefit and thus are not a suitable substrate in biogas production. The three biomasses are suitable as fertilizers with respect to contents of nitrogen but the content of phosphorus occurs under the sufficiency levels for the crops (i.e. peas, grain, and sugar beets). For algae and reed, the potassium contents occur above the sufficiency level for peas and grain but under the level for sugar beets, mussels contain lower levels of potassium than the need of the investigated crops.
Keywords: eutrophication, ecological engineering, biogas, LCI, Baltic Sea, reed, mussels, algae, fertilizer, CO2

ii
Sammanfattning Eutrofiering är ett av de största miljöhoten i Östersjön och orsakas av faktorer som utsläpp av näringsämnen från olika källor samt lång uppehållstid. Eutrofiering ger upphov till ökad primärproduktion där syrebrist och störning av viktiga ekosystem är vanliga påföljder. En aktionsplan har utformats av HELCOM som fastställer att Sverige ska reducera 21 000 ton kväve och 290 ton fosfor av de årliga utsläppen till Östersjön, med syftet att uppnå god ekologisk status år 2021. Metoder inom ecological engineering innefattar sund skörd av existerande ekosystem med syftet att lösa miljöproblem. I den här studien undersöks om skörd av alger, vass och musslor kan hjälpa till att möta miljömålen med påtaglig effekt, samt mängder och ytor som måste skördas av de tre biomassorna. Effektiviteten med avseende på näringsreducering hos de tre biomassorna jämförs. Potentialen för användning av de skördade biomassorna som substrat i biogasproduktion samt som gödningsmedel undersöks, samt hur mycket CO2 som kan besparas att släppas ut till atmosfären om nettoenergi från energibudgetar i biogasprocessen ersätter fossila bränslen. Energibudgetar som sträcker sig från skörd till biogasproduktion har utformats samt näringsinnehåll av de tre biomassorna jämfördes med näringsbehov hos vissa grödor för att ta reda på biomassornas eventuella potential som gödningsmedel.
Beträffande biomassor och areor som finns att skörda visade det sig att metoderna kan möta miljömålen utformade av HELCOM. Musslor visade sig vara den mest effektiva biomassan att skörda med avseende på näringsämnesreducering. Vass erhöll högst nettoenergiutbyte (i.e. baserat på energibudgetarna) följt av alger, därmed finns potential för vidare undersökning av de båda biomassorna som substrat i biogasprocesser. Nettoenergiutbytet i biogasprocessen hos musslor var lågt vilket visar att musslorna inte är lämpligt som substrat. De tre biomassorna uppvisar lämplighet som gödningsmedel med avseende på kväveinnehåll men innehållet av fosfor ligger under näringsbehovet hos de grödor som undersöktes. Alger och vass uppfyller kaliumbehovet hos ärter och spannmål, men inte hos sockerbetor. Musslornas kaliuminnehåll är lägre än näringsbehovet hos samtliga grödor.
Nyckelord: eutrofiering, ecological engineering, biogas, LCI, Östersjön, vass, blåmusslor, alger, gödningsmedel, CO2

iii
Table of contents Abstract Sammanfattning Acknowledgements Contents Abbrevations 1 Introduction 1
1.1 Initiatives within ecological engineering 4 1.2 Aim 5 1.3 Biomasses in the Baltic Proper 6
1.3.1 Algae 6 1.3.2 Reed 6 1.3.3 Mussels 8
1.4 Harvest techniques 9 1.4.1 Aquatic Plant Harvester RS 2000 9 1.4.2 Long line mussel farm 10 1.5 Biogas production 11 1.5.1 Volatile solids 11
1.5.2 Microbiology 11
2 Methods 13 2.1 Biomass contents 14 2.2 Nutrient amounts and areas 15 2.2.1 Nutrient amounts 15 2.2.2 Areas 17 LCI 23 2.3 System boundaries 19 2.4 Energy benefit 20 2.5 Energy demand from harvest 23
2.6 Energy demand from transport 26 2.7 Heating- and electricity demands 27 2.8 Energy balance 28 2.9 Transport distance from net energy benefits 29 2.10 Indirect energy benefits 29 2.11 Positive environmental effects 30
2.12 Suitability as fertilizer 31
3 Results 31 3.1 Biomass contents 31 3.2 Nutrient amounts and areas 34 3.2.1 Nutrient amounts 34 3.2.2 Areas 36 LCI 38 3.3 Energy benefit 38

iv
3.4 Energy demands 40 3.4.1 Harvest 40 3.4.2 Transport 41
3.4.3 Heating and electricity 43 3.5 Energy balance 43 3.6 Transport distance from net energy benefits 45 3.7 Indirect energy benefits 46 3.8 Positive environmental effects 47
3.9 Suitability as fertilizer 48 4 Discussion 49 5 Conclusion 55 6 References 57 7 Appendix, equations symbols 63
Abbreviations
LCI Life Cycle Inventory
ww wet weight
dw dry weight
vs volatile solids
HELCOM The Helsinki Commission

v
Acknowledgements
Thanks to Fredrik Gröndahl, Nils Brandt, and Maria Malmström for encouragement and
guidance, to Carl Hellström for support, to Patrik Salin at RS-Planering Ltd and all others
who have contributed with help and ideas.

1
1 Introduction
Eutrophication, the phenomenon when primary production is increased in an aquatic
ecosystem due to increased input of nutrients (Lundberg, 2005), is one of the most
serious environmental problems in the Baltic Sea (Gröndahl, 2008). The Baltic proper
reaches from the Danish straits in the south to Åland sea in the north (SMF, 2005) with
an area of 211*103 km3 and a volume of 13 * 103 (Artioli et al, 2008)(see Figure 1.1).
The eutrophication occurs due to long residence time of the Baltic Sea (i.e. 54 months)
and high land based nutrient discharges. Nutrients are discharged to the Baltic Proper
through different sources such as terrestrial sources, atmospheric deposition, release from
sediment, and exchanges across marine boundaries (Artioli et al, 2008). Leakage of
nutrients from agriculture is the main source that gives rise to algal blooms and
eutrophication (Jordbruksverket, 2005).
Figure 1.1. The Baltic Sea where the thick black lines indicates the division into five sub-areas (Kautsky & Kautsky, 2000).

2
The increased primary production is often followed by oxygen depletion (Lindahl et al,
2005) as oxygen is consumed in the breakdown of organic matter that originate from
heavy algal blooms (Gray, 2002) and growth of one-year filamentous algae, i.e. green,
brown and red algae, eliminates seaweed (Malm & Engkvist, 2001). Filamentous algae
grow on seaweed and thus prevent its photosynthesis and nutrient uptake, and also grow
on the bottoms and thus prevent the fertilized eggs of the seaweed from attaching to the
bottom (Malm & Engkvist, 2001). Biodiversity in coastal areas is important, and seaweed
creates essential environments for other species (Brenner, 2007). The algae can be
removed due to the shading and sweeping effects of well established seaweed, but in
most cases the algae replaces seaweed and thus prevents its new recruitment. Large parts
of the filamentous algae come loose and stratify at beaches and at ground shores in
enormous amounts during the late part of summer, a problem that especially occurs in the
south of Sweden (see Figure 1.2). The consequences are decreased coastal extensions and
degradation of the most productive ecosystems of the sea. This gives rise to long term
negative effects on the important ecosystems and to negative economical effects on
tourism and fishing industry (Malm & Engkvist, 2001).
Figure 1.2. Enormous amounts of red algae on a shore in the south of Sweden (Malm & Engkvist, 2001). An action plan has been drawn up by HELCOM which states that Sweden should reduce
21 000 tonnes of nitrogen and 290 tonnes of phosphorus of annual discharge, with the
purpose to reach healthy ecological status in the year of 2021 (Miljödepartementet,
2008). In order to balance the surplus of nutrients from the Baltic Proper and to

3
considerably meet the environmental goal of the action plan, satisfying measures need to
be undertaken.
By applying methods within ecological engineering (i.e. harvest of naturally
occurring biomasses such as algae, reed, and mussels) nutrients can be reduced from the
sea and alternative products from harvested biomass, such as biogas and fertilizer, can be
generated. Potential amounts that can be harvested from the Baltic coastline of Sweden
determine, among other things, the extent of nutrient reduction and product extraction
from the biomasses. In order to investigate if the methods could help meeting the goals
according to the action plan, data for occurrence of the biomasses (i.e. of algae, reed and
mussels) and corresponding nutrient concentrations have been collected.
LCI, which extends from the harvest (i.e. from the Baltic coast of Sweden) to the
production of biogas has been made in order to investigate the biogas potential of the
three biomasses. Net energy benefits have been calculated from energy balances where
the energy demands, which include harvest, transport from harvest location to biogas
plant, heating- and electricity demands in the biogas production process have been
subtracted from the energy benefits. The biomass (i.e. of algae, reed, and mussels
respectively) in the energy balances corresponds to one tonne of nitrogen.
In order to examine the suitability as fertilizers, nutrient contents of the three
biomasses have been compared to nutrient sufficiency of nitrogen, phosphorus and
potassium of crops. A limiting factor when used as fertilizer is the biomass content of
heavy metals, i.e. cadmium. Limiting values of amount of cadmium as grams per hectare
per year have been stated by KRAV and whether biomasses of algae, reed, and mussels
exceed the limiting values need to be further investigated.
The alternative products give rise to positive environmental effects and indirect
energy benefits i.e. net discharges of fossil CO2 to the atmosphere is reduced when fossil
fuels are replaced to biogas and energy is saved when harvested biomass replaces
artificial fertilizer.
Harvesting techniques studied in this work are Aquatic plant harvester RS 2000
for the harvesting of algae and reeds, a floating device suitable for harvesting of water
plants. Harvesting of long line mussel farms have been studied for mussels, which is a
technology developed in Sweden

4
1.1 Initiatives of Ecological engineering
The aim of methods within ecological engineering is to solve environmental problems
using methods ranging from the harvesting of existing ecosystems to the construction of
new ecosystem (Mitch & Jorgensen, 1989). Initiatives of Ecological engineering methods
are being undertaken by the municipality of Trelleborg and future initiatives are being
planned as well; nutrients will be removed from the southern coast of Sweden through
harvest of macro algae and Cyanobacteria. The harvested biomass will be used in biogas
production and digester sludge of macro algae have potential to be used as fertilizer after
removal of heavy metals. Growth and harvest of reed in new wetlands and large scale
biogas production will be established (Gröndahl & Müller, 2008). Until now small scale
mussel farming have taken place in the Baltic Sea, but within a near future, a project of
greater scale will occur where test farms of mussels will be performed in three areas of
the Baltic Sea; Trosa skärgård, Kalmarsund, and Puck Bay at Gdansbukten in Poland.
The project is financed by Stiftelsen Baltic Sea 2020 and its main goal is to improve the
water quality (Sveriges radio, 2009).
Earlier initiatives with the aim of removing nutrients through harvest of reed from
Kållandsundet in Sweden have been performed by the municipality of Lidköping
(Fredriksson, 2002). Finland and Estonia have done similar approaches in the Baltic Sea
(Natura 2000 Networking programme, 2007). Nutrient removal through harvest of macro
algae restrains negative effects of eutrophication (EU-life algae, 2001). A pilot studie of
Gröndahl (2008) showed that harvest of the nitrogen fixing Nodularia spumigena, which
provide the Baltic Sea with a relatively great amount of nitrogen, may restrain the effects
of eutrophication in the Baltic Sea. A test farm of mussels at Askö marine research center
in the Stockholm archipelago, with good outcome regarding the conditions of the Baltic
Sea, has been provided by Nils Kautsky (Wessman, 2007). Mussel farming as a way of
improving the water quality has been performed along the Swedish west coast for a long
time (Sveriges radio, 2009). Nitrogen removal through mussel farms from the Gullmar
fjord of the Swedish west coast have been shown by Lindahl et al (2005) to mitigate
problems of eutrophication and that product such as agricultural fertilizer, seafood and
fodder may be produced.

5
Detox AB, a company that within the environmental area offers technical consulting
services, was commissioned by the municipality of Trelleborg to investigate the
possibility of producing biogas from collected algae (Lindstedt, 2009). The collected
algae had a significant content of organic material, but the content of inorganic material,
mainly sand, showed to be significant (Davidsson, 2007). Result from Ascue & Nordberg
(1998) shows that pretreatment of green algae in the biogas process, in order to increase
the availability of the substrate to the microorganisms is essential (Melin, 2001). Even
higher biogas potential compared to the theoretical value of algae has been shown by
Hansson (1983), which can be a result of beneficial graft of microorganisms in the biogas
process (Melin, 2001). According to Baran et al (2002), favorable results have been
received from laboratory experiments with biogas production from reed (Eno, 2001).
Most biogas plants apply processes where substrates of low dry matter content is used
and problems might appear with substrates of high dry matter content, such as reed. Thus
dry anaerobic digestion might be an alternative. However one draw back with this
method is lack of experience, which makes it difficult to conclude whether it would be an
effective measure or not (Eno, 2001). Lim et al (2008) have shown that anaerobic
digestion of blue mussels can be ecologically, economically and socially feasible.
1.2 Aim
According to the action plan drawn up by HELCOM Sweden shall decrease 21 000
tonnes of nitrogen and 290 tonnes of phosphorus of its annual discharge in order to
achieve good ecological status in the year of 2021. The aim of this work is to evaluate if
methods within ecological engineering (i.e. harvest of algae, reed, and mussels) can help
meeting the goals of the action plan considerably, in accordance with biomass amounts
and areas that need to be harvested, and to compare the effectiveness of three biomasses
with respect to nutrient reduction. To provide energy budgets that reach from harvest to
biogas production, to calculate energy balances for the three biomasses, to compare the
net energy benefits in order to investigate if biogas potential occurs and to examine the
suitability as fertilizer with respect to nutrient contents in comparison to nutrient
sufficiency of crops.

6
1.3 Biomasses in the Baltic proper
1.3.1 Algae
Heavy algal blooms in the Baltic Proper occur due to the surplus of nutrients and the
internal distribution of nitrogen and phosphorus (SMHI, 2007), i.e. exchanges with
sediments and across marine boundaries (Artioli et al, 2008). The potential amount of
algae that can be harvested from the Baltic South coast of Sweden i.e. from Malmö to
Simrishamn amounts to approximately 43 068 tonnes of dry weight per year (Davidsson
& Ulfsdotter Turesson, 2008). The calculations of the potential amount of algae are
estimated by Detox AB. The collection of algal biomass is assumed to take place in the
water, and include the area from the coastline and 100 meters out in the water. The
assumption of the quantities of algal biomass per hectare is based on the present
collection performed by the municipality of Trelleborg (Barwén, 2009). The algal dry
weight content of nitrogen, phosphorus, and potassium, is approximately 3.0 %, 0.2 %,
and 1.3 % respectively (Davidsson & Ulfsdotter Turesson, 2008).
1.3.2 Reed
Reed is a freshwater species that show tolerance to different growth conditions (Soetaert
et al, 2004), and tolerates salinity of 15-20 PSU. It can grow during >20 PSU if its deep
roots can reach water with lower salinity (Soetaert et al, 2004). In Baltic proper vertical
and horizontal salinity gradients are formed from a mix of marine water from the North
Sea and land based fresh drainage water (Artioli et al, 2008). The salinity level decreases
towards northeast (Lindqvist, 2008), and is about 6-8 PSU in the Baltic Proper and
increases further south, to about 15-20 PSU in the southern Kattegat (Kautsky &
Kautsky, 2000).
Reed is mainly thought to uptake nutrients from the soils, but can thrive on a
range of substrates. When exposed to eutrophied water, reed extracts nutrients on the
lower part of the culm through finely branched roots (Granéli, 1984). Rhizomes are the
perennial underground biomass of reed that store nutrients and photosynthetic products.
Annual stems are developed out of the rhizomes (Hansen et al, 2007). Due to the storage
within the rhizomes, reed is able to grow fast in late spring, with no dependence of
photosynthesis (Granéli, 1984). The rhizomes also play a role in vegetative spreading of

7
reed (Hansen et al, 2007). The panicles constitute of hundreds of spikelets and each
spikelet have got around six hermaphrodite florets (Ishii & Kadono, 2002). In early
autumn shoots are formed out of the rhizomes, which stay dormant until the next spring
(Granéli, 1984) (see Figure 1.3).
Figure 1.3. Grass structure of Phragmites australis (From Hannaway, 2000).
Reed grows along the Baltic coast in large monospecific stands, on a wide variety of
substrates (Granéli, 1984). There are no documentations of the specific amount of reed
biomass growing along the Baltic coast of Sweden (Granéli, 2008) but the total reed area
of Sweden amounts to 100 000 hectares (Hansson & Fredriksson, 2004). The biomass
above ground amounts to 1 kg dw m-2 (Granéli, 1984) according to investigation of reed
stands in the middle and in the south of Sweden performed in August (Fredriksson,
2002). The nutrient content per kg dry weight is 0.94 g nitrogen, 0.9 g phosphorus and
6.6 g potassium (Fredriksson, 2002).

8
1.3.3 Mussels
Blue mussels (i.e. Mytilus edulis) grow on hard substrates down to depths over 30 m and
prefer salinity above 18 S. As a result of the low salinity in the brackish environment of
the Baltic Proper (as depicted above), the growth rate and size is reduced compared to the
North Sea (Kautsky & Kautsky, 2000) to around 3 cm (Fiskeriverket, 2007). Mussels
clean water by filter feeding (Rice, 2001) through their gills (Griffin et al, 2006) and feed
on phytoplankton (Ribeiro Guevara et al, 2005), which they sort with respect to
nutritional value (see Figure 1.4). The filtration rate is around 1- 4 liters per hour (Rice,
2001).
Figure 1.4. Nutrition and respiration of a blue mussel (From Aquascope, 2000).
Faeces and pseudofaeces of mussels are aggregated through coating with mucus (Zhou et
al, 2006) which makes the material more resistant to re-suspension (Griffin et al, 2006)
and make them sink at velocities around 40 times compared to other particles (uncoated
with lower densities) (Zhou et al, 2006). Thus the turbidity decreases, the benthic
productivity increases (Griffin et al, 2006) and a top-down control of phytoplankton
biomass is created (Zhou et al, 2006). Although the physiological conditions are not
ideal, M. edulis is dominating the Baltic Sea and 90% of the animal biomass growing on
hard bottoms constitutes of M.edulis (Kautsky & Kautsky, 2000). The nutrient content of
mussels amounts to approximately 1.1 % nitrogen and 0.07 % phosphorus (Haamer et al,
1999) and the potassium content to 0.12 % (Olrog & Christensson, 2003).

9
1.4 Harvest techniques
1.4.1 Aquatic Plant Harvester RS 2000
Aquatic Plant Harvester RS 2000 is a floating device (see Figure 1.5) constructed with
front conveyors which makes harvest of water plants, such as algae and reed possible. It
has got two steplessly adjustable paddle wheels with their own hydraulic circuits and
three cutters of which two are vertical and one is horizontal (RS-Planering AB, 2008).
The rate of harvest varies and depends among other things on locations of unloading
spots for the harvest machine. Normally the harvesting rate of collecting algae is faster
than the rate of collecting reed, because unlike reed, algae do not cover the water surface
to the same extent. Generally, algae can be harvested at an approximate rate of 0.7
hectares per hour and reed at a rate of 0.4 hectares per hour for straw lengths of 2.5
meters (about 0.7 hectares per hour for straws of 1 meters) (Salin, 2009).
Figure 1.5. Aquatic Plant Harvester RS 2000 (From RS-Planering AB, 2008).

10
1.4.2 Long line mussel farm
The long line mussel farm is a method of farming mussels (see Figure 1.6). Rope wires
are held up by floating barrels, and from the rope wires, mussel lines are hanged
(Sanchez et al, 2004). Every unit consists of approximately 9 lines and the long line farm
functions as a three-dimensional bio filter (Griffin et al, 2006) with an area of
approximately 0.5 ha (Lindqvist, 2008, see Figure 1.2.2). Mussel farms demand water
depths of 6-25 m at sheltered areas (Lindahl et al, 2005), the Stockholm archipelago has a
water area of 372 500 hectares (Nordiska Ministerrådet, 2009). While the settling of the
mussels occurs, mussel rigs are rigged up. Settling is the phenomenon when freely
swimming mussel larvae settle down, and the larvae settle on the mussel rigs from where
they feed on foodstuffs that naturally exists in the surrounding water. The time for
settling varies depending on water temperature but generally starts in mid June and
continues the summer through (Sanchez et al, 2004). After about 2.5 years about 75
tonnes wet weight per mussel farm can be harvested (Lindqvist, 2008). The mussels are
harvested through scraping the mussels off the lines by a machine (Sanchez et al, 2004).
Figure 1.6. Description of a long line mussel farm (From Norell, 2005).

11
1.5 Biogas production
1.5.1 Volatile solids
The volatile solids (vs) constitute the organic matter content of a substrate (Persson,
2006). Biogas is formed when volatile solids are broken down anaerobically (Berglund &
Börjesson, 2003) by methane forming microorganisms (Nilsson, 2000). Biogas mainly
consists of methane (50-60 volume-%) and carbondioxide (25-40 volume-%) (Nilsson,
2000) and can also contain hydrogen gas, sulphur-hydrogen, and steam (Berglund &
Börjesson, 2003). Different factors have influence on the biogas production, such as
temperature and technique of the biogas production process, pre-treatment of the
substrate and chemical composition of the substrate (Berglund & Börjesson, 2003).
Biogas is formed during anaerobic conditions, thus molecules with small amounts
of oxygen, such as fat, generates higher amount of methane compared to other molecules
(Berglund & Börjesson, 2003), such as proteins followed by carbohydrates (Nilsson,
2000). The nitrogen content of proteins is higher compared to the other molecules
mentioned (i.e. carbohydrates and fat). In the degradation process, the organically bound
nitrogen is transformed to ammonia, which has an inhibitive effect on the
microorganisms (Nilsson, 2000). The methane potential of algae, reed, mussels, and
sludge, amounts to 200 l CH4/kg volatile solids, 180 l CH4/kg volatile solids, 8 l CH4/0.5
kg wet weight, and 0.625 m3 CH4/kg volatile solids respectively (Davidsson, 2007,
Fredriksson, 2002, Lim et al, 2008, and Lantz, 2007 respectively).
1.5.2 Microbiology Biogas is formed through anaerobic degradation of organic matter by specialized
microorganisms (Berglund, 2006), the formation occurs in four steps. In the hydrolysis
step, extracellular enzymes transform complex polymers of the organic matter to
monomers, i.e. fat is hydrolyzed into fatty acids, proteins into amino acids and cellulose
into simple sugars. In the acid formation step, fermentative bacteria degrade the
monomers (i.e. from the hydrolysis step) to shorter fatty acids, alcohols, hydrogen gas,
and carbon dioxide. In the acetic acid formation step, the degraded monomers from the
previous step are transformed to acetic acid, hydrogen gas, and carbon dioxide. The
methane formation step is performed by sensitive bacteria that develop methane from
12
acetic acid or carbon dioxide and hydrogen i.e. created in the acetic acid formation step.
High concentration of ammonia, phosphorus, potassium, heavy metals, sulphur, and
certain fatty acids can restrain the sensitive methane forming bacteria (Nilsson, 2000).

13
2 Methods
Eutrophication is one of the most serious environmental problems in the Baltic Sea due to
factors such as long residence time and nutrient discharges from different sources,
especially agricultural. Eutrophication gives rise to increased primary production, often
followed by oxygen depletion and disruption of important ecosystems and decreased
coastal extensions, which has negative economical effects on tourism and fishing
industry.
In order to achieve good ecological status of the Balitc Sea in the year of 2021, an
action plan has been created by the Helsinki Commission (HELCOM). The action plan
states that Sweden should reduce 21 000 tonnes of nitrogen and 290 tonnes of phosphorus
of its annual discharge to the Baltic Sea (see Table 2.1). This thesis is a first step in a
tenability and potential study in order to determine if ecological engineering through the
harvesting of algae, reed, and mussels along the Swedish Baltic coast considerably can
help to meet these environmental goals.
In order to capture the biogas potential of the biomass of algae, reeds and mussels,
LCI that stretches between harvesting and biogas production has been created. The
energy demands in the LCI represent harvest, transportation from harvest spot to a central
biogas plant and electricity- and heating demands and the energy benefits represent the
potential of methane extraction of the three biomasses in the life cycle inventories.
Indirect energy benefits arise when artificial fertilizer is replaced by biomass of
algae, reed, and mussels. Energy demands for production of artificial fertilizer per kg
nitrogen and per kg phosphorus are used in order to determine indirect energy benefits
when biomass corresponding to one tonne of nitrogen replaces artificial fertilizers.
Nutrient contents of the three biomasses are compared to nutrient sufficiency of nitrogen,
phosphorus, and potassium of crops in order to examine the suitability as fertilizers. The
amount of fossil CO2 that can be saved from being released into the atmosphere is
calculated with the purpose to find positive environmental effects as a result of the
replacement of fossil fuels to biogas.

14
2.1 Biomass contents of nutrients
Biomass contents of nutrients, dry weight and volatile solids have been collected from the
literature and the data of the three biomasses is together with corresponding references
presented in Table 1.1. In order to receive the same unit for each biomass, the contents
have been converted into a proportion of wet weight (i.e. nutrients, dry weight and
volatile solids) as shown in Equation 1. In Equation 2, wet weight volatile solid contents
of algae, reed, mussels, and sludge were calculated.
Wet weight nutrient proportions (i.e. nitrogen and phosphorus) of algae, reed, and
mussels respectively, Nwij, was calculated as
Nwij = Ndij * γi (1)
Where Ndij is dry weight nutrient content (i.e. nitrogen and phosphorus) of algae, reed,
and mussels respectively, and γi is wet weight dry weight proportion of algae, reed, and
mussels respectively (i.e. i represents algae, reed, and mussels respectively and j
represent nitrogen and phosphorus, respectively).
Wet weight volatile solid proportion of algae, reed, mussels, and sludge respectively, εi,
was calculated as
εi = δi * γi (2)
Where δi = proportion volatile solids of dry weight and γi = proportion dry weight of wet
weight, of algae, reed, mussels, and sludge (i.e. i represents algae, reed, mussels, and
sludge respectively).

15
Table 1.1 Biomass contents of nutrients, dry weight, and volatile solids. Dry weight
[kg dw kg-1 ww]
Nitrogen content
[kg N kg-1 dw]
Phosphorus content
[kg P kg-1 dw]
Volatile solids
content [kg vs kg-1
dw]
Algae 0.13a* 0.025e* 0.0021 e* 0.65h*
Reed 0.35b 0.009f 0.0009 f 0.95f
Mussels 0.02c 0.53 g, i 0.034 g, i 0.86c
Sludge 0.045d* n.a. n.a. 0.68d* aFransson [11]; bEno [9]; cLim et al [24]; dLantz [23]. eDavidsson and Ulfsdotter Turesson [7]; fFredriksson [12]; gHaamer et al [17]; hDavidsson [6], iRecalculated from Lim et al [24]; n.a.- not addressed. *Average of reported values.
2.2 Nutrient amounts and areas
2.2.1 Nutrient amounts
In order to estimate the potential amounts of nutrients that annually can be harvested
from the Baltic Sea, data for occurrence of the biomasses (i.e. of algae, reed, and
mussels) and corresponding nutrient concentrations were collected. With the purpose to
investigate if the methods can help to meet the objectives of the action plan substantially
(i.e that states that Sweden shall reduce 21 000 tonnes of nitrogen and 290 tonnes of
phosphorus of its annual discharge), the data of potential amounts of nutrients were
compared to the nutrient amounts of the action plan.
According to report from Davidsson & Ulfsdotter Turesson (2008) the potential amount
of algal biomass that annually can be harvested from the Swedish south coast that reaches
from Malmö to Simrishamn amounts to 43 068 tonnes of dry weight. The calculations of
the potential amount are made by Detox AB. The collection is assumed to take place in
the water, with an area that extends 100 meters into the water from the coastline. The
assumption of the quantities of algal biomass per hectare is based on the present
collection performed by the municipality of Trelleborg (Barwén, 2009). The
corresponding wet weight (i.e. of 43 068 tonnes of dry weight) was calculated and from
wet weight nutrient contents, the content of nitrogen and phosphorus of the
corresponding biomass was calculated (see Equation 3). The nutrient amounts of the algal

16
biomass were calculated as shares of the nutrient amounts of the action plan in order to
investigate whether obvious influence occurred.
Contents of nitrogen and phosphorus, y,nalgae and y,palgae [tonnes] of the potential biomass
that annually can be harvested from the Swedish south coast, was calculated as
yi,algae = walgae* Nwalgae (3)
Where walgae = the corresponding wet weight of potential dry weight of algae that
annually can be harvested from the Swedish south coast and Nwalgae = share nutrients (i.e.
N and P) of wet weight of algae.
Reed grows in shallow bays as large mono-specific stands in the Baltic Proper (Granéli,
1984) but the exact area is not documented (Granéli, 2008). Mussel farms demand
sheltered areas at water depths of 6-25 meters (Lindahl et al, 2005). While there are no
documentations of potential biomasses of reed and mussels that annually can be
harvested from the Baltic coastline of Sweden, the potential amount of nitrogen harvested
through algae (i.e. y,nalgae) was used as a comparative measure in this work. The
biomasses of reed and mussels, in order to achieve the same amount of nitrogen and the
amount of phosphorus in the corresponding biomass was calculated as shown in
Equations 4-5. The amount of phosphorus in the corresponding biomass was calculated
as a percentage of the amount of phosphorus in the action plan.
The amount of wet weight, of reed and mussels, wni, that need to be harvested in order to
achieve y,nalgae (i.e. the potential amount of nitrogen harvested through algae used as a
comparative measure in this work) was calculated as
wni = (1 /αi)*y,nalgae (4)
Where αi is wet weight nitrogen proportion of reed and mussels.

17
The amount of phosphorus in biomass of reed and mussels corresponding to 1100 tonnes
of nitrogen respectively, y,pi was calculated as
y,pi = βi * wni (5)
2.2.2 Areas
Data were searched for in order to determine the area of reed that need to be harvested
and the water area that need to be covered with mussel farms in order to harvest the
potential amount of nitrogen (i.e. used as a comparative measure in this work) annually
from the Swedish Baltic coastline. In order to receive these results, data of the amount of
reed per hectare and the area and the amount of biomass per mussel farm were collected
from the literature (see Table 2.2). The areas were calculated as shown in Equations 6-8,
and in order to evaluate the realism of the calculated areas in comparison to the Baltic
coast of Sweden, corresponding areas were compared with Swedish total reed area and
with the water area in the Stockholm archipelago. Swedish total reed area and the water
area of the Stockholm archipelago were collected from reports of Hansson & Fredriksson
(2004) and Nordiska ministerrådet (2009), respectively (see Table 2.2).
Nitrogen content per hectare, Ni of reed and mussels, respectively, where calculated as
Ni = Bi * αi (6)
Where Bi is wet weight per hectare of reed and mussels, respectively.
The area of reed that need to be harvested and the water area that need to be covered with
mussel farms in order to annually harvest 1100 tonnes of nitrogen, Ai, was calculated as
shown in Equation 6. While harvest of mussel farms occur every 2.5 years, the area that
annually need to be harvested has been multiplied by 2.5 i.e. in order to receive the area
that need to be covered with mussel farms in order to receive 1100 tonnes of nitrogen
annually.
Ai = y,nalgae / Ni (7)

18
In order to appreciate results in Equation 7, Areed and Amussels were calculated as
proportions, Si of Swedish total reed area and of the water area of the Stockholm
archipelago as
Si = Ai/Ti (8)
Where Si represents the proportions and Treed = Swedish total reed area and Tmussels = the
water area of the Stockholm archipelago.
Table 2.2. Biomass of the reeds and mussels per area unit, Swedish total reed area, and the water area of the Stockholm archipelago. Reed [kg dw m-2]
Mussels [tonnes ww ha-1]
Swedish total reed area [ha]
Water area of the Stockholm archipelago [ha]
Area of a mussel farm [ha]
1.0a 150b 100 000c 372 500d 0.5b aGranéli, 1984; bLindqvist, 2008; cHansson & Fredriksson, 2004; dNordiska ministerrådet, 2009

19
Life cycle inventory
Life cycle inventory that reaches from the harvest (i.e. of algae, reed, and mussels from
the Swedish Baltic coast line) to the production of biogas has been created. The energy
benefit represents the potential of methane extraction of the three biomasses and the
energy consumed during the harvest, transportation from harvest site to a central biogas
plant, and electricity- and heating needs representing the energy requirements of the life
cycle inventory. Energy balances where energy demands are subtracted from energy
benefit were calculated in order to examine the potential of energy extraction of the three
biomasses.
2.3 System boundaries
The LCI embraces harvest including transportation back and forth between harvest spot
and shore, transport from shore to biogas plant, heating and electricity demands in the
biogas plant. No consideration is taken of any storing of the biomasses that may occur.
While digestate may potentially be used for other products, e.g. liquid, agricultural
fertilizer, energy demands from transportation and handling of digester sludge is not
included within the system boundaries. Energy requirements from the upgrading of
biogas (and other fuels) are also exempt (see Figure 1.5). The energy demand in the
biogas production process i.e. heating and electricity is calculated as shares of the energy
in the biogas produced, which in reality would be individual according to substrate used
in the process. Positive environmental effects are based on the amounts of fossil CO2 that
can be saved from being released into the atmosphere i.e. if biogas from net energy
benefits, calculated in the LCA, replaces a fossil fuel. No account has been taken to the
CO2 emissions from the life cycle of fuels (i.e. biogas and fossil fuels). The suitability of
the biomasses as fertilizers is only based on the comparison between nutrient contents of
the biomasses and nutrient sufficiency of some crops. No investigation concerning heavy
metal contents (i.e. cadmium), toxins etc. has been done.

20
Figure 1.5. Energy scheme in the biogas production process that reaches from harvest to biogas production of biomasses of algae, reed, and mussels.
2.4 Energy benefit
Factors such as volatile solid content of biomass, and how well suited the organic matter
of the volatile solids are as substrates for the microorganisms in the biogas production
process have got influence on the energy potential. Data, in order to investigate the
energy potential of algae, reed, and mussels and to appreciate the energy potential of the
three biomasses in comparison to a reference, where searched for. Data of liter CH4 that
can be extracted from biomass per kg volatile solids of algae and reed, respectively, and
per 0.5 kg wet weight of mussels, and volatile solid biogas potential of sludge has been
collected from the literature (see Table 3.1).

21
Kg wet weight of mussels were transformed to kg volatile solids in Equation 9 in order to
make mussels comparable to the other two biomasses, including sludge. The energy
potential per tonne volatile solids of the substrates was calculated in Equation 10. In
order to further analyze the energy potential of the three biomasses including sludge,
energy potential per tonne dry weight and wet weight respectively, were calculated in
Equations 11-12.
The energy potential in terms of liter CH4 per kg volatile solids of mussels,κmussels was
calculated as
κmussels = ιmussels /( γmussel * δmussel) (9)
Where ιmussels = energy potential as liter CH4 per kg wet weight of mussels
The energy in units of MJ/tonne volatile solids, μvs_i, of algae, reed, mussels, and sludge
was calculated as
μvs_i = κi* λ*1000 (10)
Where κi = energy potential as liter CH4 per kg volatile solids of algae, reed, mussels, and
sludge respectively, and λ = MJ/l CH4
MJ/tonne dry weight, μdw_i , and wet weight, μww_i , of algae, reed, mussels, and sludge
respectively, was calculated as
μdw_i = μvs_i * δi (11)
μww_i = μdw_i * γi (12)

22
To determine the energy potential for biomass of equivalent amounts of nitrogen, energy
potential of biomass corresponding to one tonne of nitrogen was calculated as shown in
Equation 13. In order to visualize the energy benefits of biomass corresponding to one
tonne of nitrogen, number of Swedish average households that annually can be heated
from the corresponding energy benefit was calculated as shown in Equation 14. In order
to receive these results, data of energy demand from annual heating of an average
Swedish household were collected from report of Davidsson & Ulfsdotter Turesson
(2008) shown in Table 3.1.
The energy benefit from biomass corresponding to one tonne of nitrogen of algae, reed,
and mussels respectively, μN_i, was calculated as
μN_i = μww_i /αi (13)
The number of Swedish average households that annually can be heated from the energy
benefit of biomass corresponding to one tonne of nitrogen, Hb, was calculated as
Hb = μN_i / Hd (14)
Where Hd is heating demand of an average Swedish household (transformed to MJ from
kWh).
Table 3.1. Methane yield of algae, reed, mussels, and sludge. Algae [l CH4 kg-1 vs]
Reed [l CH4 kg-1 vs]
Mussels [l CH4 kg-1 0.5 ww]
Sludge [m3 kg-1 vs]
200a 180b 8c 0.625d* aDavidsson, 2007; bFredriksson, 2002; cLim et al, 2008; Lantz, 2007; *average of reported values

23
2.5 Energy demand from harvest
The harvest technique for algae and reed studied in this life cycle analysis is a prototype
called Aquatic plant harvester RS 2000 and the technique studied for mussels is harvest
of long-line mussel farms. To determine the energy demand of Aquatic plant harvester
RS 2000, data of harvest capacity and energy consumption were collected. Hectares
harvested per hour of algae and reed, tonnes of wet weight harvested per hour of algae
and working hours per day were received from Salin (2008) and tonnes of reed dry
weight harvested per hectare from report of Fredriksson (2002) (see Table 4.1a).
Calculations with respect to the harvesting capacity of RS 2000 (i.e. for algae and reed)
are shown in Equations 15-18.
Hectares harvested per day of algae and reed, νday_i were calculated as
νday_i = hday * νi (15)
Where hday = hours per working day and νalgae = hectares harvested per hour of algae and
reed respectively.
Tonnes wet weight harvested per day of algae, ξday_algae, and reed, ξday_reed, were
calculated in Equations 16-17.
ξday_algae = ξalgae * hday (16)
Where ξalgae = tonnes of wet weight harvested per hour of algae
ξday_reed = νday_reed* ξdw_reed / γreed (17)
Where νday_reed = hectares harvested per day of reed, and ξdw_reed = tonnes of dry weight
per hectare of reed.
Tonnes of nitrogen harvested per day of algae and reed respectively, ξN_i was calculated
as
ξN_i = ξday_i * αi (18)

24
Table 4.1a. Harvest velocity of Aquatic Plant harvester RS 2000 and occurrence of reed. Algae [ha hr-1]
Algae [tonne ww hr-1]
Reed [ha hr-1]
Reed [g dw m-2]
0.7a 9a 0.4a 1002b aSalin, 2008; bFredriksson, 2002
Table 4.1b. Working hours per day and energy demand per day of Aquatic Plant harvester RS 2000. Working day [hrs]
Energy demand RS 2000 [l diesel working day-1]
Energy content of diesel [MJ l-1diesel]
8a 50a* 41.5 b aSalin, 2008; bBörjesson, 2006 *Including harvest, idling, and transportation between harvest location and shore.
2.5.1 Energy demand from harvest of algae and reed with Aquatic Plant Harvester
RS 2000
Energy demand per day (as liter diesel per 8 hours working day), which includes idling,
harvesting and transportation to the shore, was received from Salin (2008) and energy
content (as MJ per liter diesel) were received from the report of Börjesson (2006)(see
Table 4.1b). Calculations of energy demand from harvest of algal- and reed biomass of
one tonne wet weight and of biomass equal to one tonne of nitrogen are shown in
Equations 19-21.
Energy demand per working day [MJ] with RS 2000, Ers2000, was transformed from liter
diesel/day as
Ers2000 = [l diesel/day]*[MJ/l diesel] = [MJ/day] (19)
Energy demand per tonne wet weight of algae and reed respectively, Eww_i harvested was
calculated as
Eww_i = Ers2000 / ξday_i (20)

25
Energy demand of biomass corresponding to one tonne nitrogen of reed and algae
respectively, EN_i was calculated as
EN_i = Ers2000 / ξN_i (21)
2.5.2 Energy demand from harvest of mussels per long-line mussel farm
Data of energy demand, which includes harvest of mussel bands and transportation to
harvest location (i.e. there and back), per long-line mussel farm were received from
Lindqvist (2008) and Granhed (2009)(see Table 4.2). Calculations of energy demand
from harvest of mussel biomass equal to one tonne wet weight and of mussel biomass
equal to one tonne of nitrogen are shown in Equations 22-24.
Energy demand from harvest of a long-line mussel farm including transport, El-l, was
transformed from liter diesel/day as
El-l = [l diesel/mussel farm]*[MJ/l diesel] = [MJ/mussel farm] (22)
Energy demand per tonne mussel wet weight, Eww_mussels, was calculated as
Eww_mussels = El-l / ξl-l (23)
Where ξl-l = tonnes of mussel wet weight per long-line mussel farm.
Energy demand to harvest mussel biomass corresponding to one of tonne nitrogen,
EN_mussels, was calculated as
EN_mussels = El-l / (ξl-l * αmussel) (24)

26
Table 4.2. Biomass per mussel farm and energy demands including harvest of mussel farm and transport. Biomass per mussel farm [tonnes]
Harvest time per mussel farm [hrs]
Energy demand of harvest [l diesel hr-1]
Transport time [hrs]
Energy demand of transport [l diesel hr-1]
75a 30b 15b 2b 50b aLindqvist, 2008 bGranhed, 2009.
2.6 Energy demand from transport
The energy demand from transport between the harvest location and a central biogas
plant is included in this work. In order to determine the energy demand from transport of
biomass per tonne wet weight and equal to one tonne nitrogen a distance of 10 km and
100 km respectively, data from report of Berglund and Börjesson (2003) was used. The
energy demand from the report (e.g. Berglund and Börjesson (2003)) 8 MJ was based on
transport per tonne of dry weight including 30% dw per kilometer with 4-tonne-trucks.
Dry weight of 30 % was transformed to its corresponding wet weight and the energy
demand from transporting biomass per tonne wet weight per 10 km and 100 km
respectively, was calculated by Equation 25. Energy demand from transportation biomass
of algae, reed, and mussels, equal to one tonne of nitrogen per 10 km and 100 km
respectively, was calculated in Equation 26. The transport distance varies depending on
locations of the harvest area and of the biogas plant used in the process. Due to this fact,
energy demands due to different transport distances are presented in Chapter 7.

27
The energy demand from transporting biomass per tonne wet weight a distance of 10 km
and 100 km respectively, ς_i was calculated as
ς_ i = ς * i / ρww (25)
Where ς is energy demand per tonne of dry weight per km, i represents 10 km and 100
km and ρww represents wet weight of transported biomass.
The energy demand from transportation of biomass equal to one tonne of nitrogen of
algae, reed and mussels respectively, 10 km and 100 km, ςN_ij, was calculated as
ςN_ij = (1 / αi )* ς_ij (26)
Where i represents transport distances of 10 km and 100 km and j represents algae, reed,
and mussels respectively.
2.7 Heating- and electricity demand
Heating- and electricity demands occur in the biogas process from heating and
hygienization and from stirring, pumping, and milling the substrate etc (Berglund &
Börjesson, 2003). In this study heating- and electricity demands are estimated as percent
of the energy content of the biogas produced (13 % and 11 % from heating and electricity
respectively). These shares where collected from the report of Berglund & Börjesson
(2003) and was based on mesophilic digestion. In reality, the composition of the substrate
and the design of the biogas plant control the size of these demands (Berglund &
Börjesson, 2003).

28
The demands are calculated for biogas production from biomass equal to one tonne of
nitrogen, Deh_i, of algae, reed, and mussels respectively, as
Deh_i = Deh * μN_i (27)
Where Deh is demand from heating and electricity in the biogas process and μN_i is energy
benefit from biomass corresponding to one tonne of nitrogen of algae, reed, and mussels
respectively.
2.8 Energy balance
In order to investigate the energy potential of the three biomasses, energy balances were
calculated from the energy benefits and energy demands of the life cycle analyses. The
energy demands from harvest, transport, heating, and electricity were subtracted from the
energy benefit. Depending on the location of the harvest spot and of the nearest biogas
plant, the transport distance varies. In order to visualize the influence of energy demand
regarding transport distance, energy balances excluding energy demand from transport
(i.e. including energy demand from harvest, heating and electricity) were calculated in
Equation 28 for biomass corresponding to one tonne of nitrogen of algae, reed, and
mussels respectively. In Equation 29 energy balances including transport distances of 10
km and 100 km, were calculated. In order to visualize the positive net energy benefit
from Equation 29 (i.e. including demands from transport of 10 km and 100 km,
respectively), the number of Swedish average households that annually can be heated
were calculated in Equation 30.
The energy balance excluding energy demand from transport, Eb, was calculated as
Eb = μN_i – (EN_i + Deh_i) (28)
The energy balance including transport distance of 10 km and 100 km respectively, Eb_i,
was calculated as
Eb_i = Eb = μN_i – (EN_i + ςN _i j + Deh_i) (29)

29
The number of Swedish households that can be heated from positive net energy benefits
from energy balances including transport of 10 km and 100 km respectively, Hb_ij, was
calculated as
Hb_ij = Eb_ij / Hd (30)
Where i represents transport distances of 10 km and 100 km respectively and j represents
algae, reed, and mussels respectively.
2.9 Distance that the biomasses can be transported before the net energy benefit is
consumed
The distance that biomass can be transported before the positive net energy benefit is
consumed, Dnet was calculated as
Dnet = Eb / ςN _1km (31)
Where ςN _1km = energy demand from transportation of biomass per km
(net energy benefit per tonne wet weight is shown in Figures 6.1-6.2)
2.10 Indirect energy benefits
When an artificial fertilizer is replaced by biomass of algae, reed, and mussels indirect
energy benefits arise. The energy demands for production of artificial fertilizer per kg
nitrogen (45 MJ) and per kg phosphorus (25 MJ), are received from the report of
Berglund & Börjesson (2003)(see Table 9). In this thesis it is assumed that no
corresponding energy cost arise from using biomass of algae, reed, and mussels as
fertilizer. The energy demands are used to determine the indirect energy benefits when
biomass corresponding to one tonne of nitrogen replaces artificial fertilizer. The energy
savings are visualized as number of average Swedish households that annually can be
heated from the corresponding energy, calculated as shown in Equation 32.

30
The number of average Swedish households that annually can be heated from indirect
energy benefits from biomass corresponding to one tonne of nitrogen, Hieb, was
calculated as
Hieb = ((1*EbN + (1/αi)*βi*EbP)*1000)/Hd (32)
Where EbN, and EbP are energy demand from production of artificial fertilizer per kg
nitrogen, and per kg phosphorus respectively. αi = share nitrogen and βi= share
phosphorus, of algae, reed, and mussel wet weight respectively and Hd = heating demand
of an average Swedish household.
2.11 Positive enironmental effects
With the purpose to find positive environmental effects as a result of the replacement of
fossil fuels to biogas, the amount of CO2 that can be saved from being released into the
atmosphere was calculated. Data of annual CO2 discharge from an oil heated household is
used from Hägglund & Huring (2004) and amounts to 8 tonnes. The CO2 discharge when
net energy benefits from biogas production of biomass corresponding to one tonne of
nitrogen replaces oil heating of Swedish average households was calculated in Equation
33. The net energy benefits are received from energy balances including a transport
distance of 10 km and 100 km, respectively of biomass corresponding to one tonne of
nitrogen as shown in Equation 29.
The CO2 discharge when net energy benefits from biogas production of biomass
corresponding to one tonne of nitrogen, Eb_ij, replaces oil heating of Swedish average
households, Db_i, was calculated as
Db_i = Hb_ij * D (33)
Where D is CO2 discharge from an oil heated household (i.e. i = algae, reed, and mussels
and j = 10 km and 100 km).

31
2.12 Suitability as fertilizer
In order to investigate the suitability as fertilizers, the relationships between different
nutrients (i.e. nitrogen, phosphorus, and potassium) of the three biomasses where
compared to nutrient sufficiency of crops from a report of Davidsson (2007). The nutrient
contents in the report where given as quotients of nitrogen (see Table 11).
Table 11. Nutrient sufficiency of crops as quotients of nitrogen. Peas [N:P:K]
Grain [N:P:K]
Sugar beets [N:P:K]
1:0.11:0.28a
1:0.10:0.49a 1:0.17:1a
aDavdisson, 2007

32

33
3 Results 3.1 Biomass content of nutrients and volatile solids
The wet weight nutrient contents (i.e. nitrogen and phosphorus) of algae, reed, and
mussels are shown in Figure 3.1.1. Dry weight as percentage of wet weight, the content
of volatile solids as percentage of dry weight and wet weight of algae, reed, mussels, and
sludge are shown in Figure 3.1.2. The contents as percentage of wet weight of the three
biomasses were calculated in Equations 1-2. The wet weight nutrient content is higher for
mussels compared to algae and reed. The wet weight nitrogen content of mussels is over
three times higher than that of algae and reed. The wet weight phosphorus content of
mussels is over two times higher than that of algae and reed (see Figure 1.1).
0
0.2
0.4
0.6
0.8
1
1.2
Algae Reed Mussels
Nut
rient
con
tent
s [w
w-%
]
Figure 3.1.1. Wet weight nutrient contents [%] of algae, reed, and mussels where the bar to the left (black) represents nitrogen and the bar to the right (striped) represents phosphorus.

34
The dry weight volatile solid content of reed exceeds 90 % followed by mussels, sludge,
and algae of 86 %, 68 %, and 65 % respectively (see Figure 3.1.2). Due to higher wet
weight dry weight content of reed compared to mussels, sludge, and algae, i.e. 17, 8, and
3 times higher, the differences with respect to wet weight volatile solid content increase
even more. The wet weight volatile solid content of reed is 19, 11 and 4 times higher
compared to mussels, sludge and algae respectively (see Figure 3.1.2).
0
20
40
60
80
100
120
Algae Reed Mussels Sludge
Biom
ass
com
posi
tions
[bio
mas
s-%
Figure 3.1.2 . Wet weight dry weight-, dry weight volatile solid-, and wet weight volatile solid contents of algae, reed, mussels, and sludge. The bar to the left represents dry weight volatile solid content, the intermediate bar represents wet weight dry weight content and the bar to the right represents wet weight volatile solid contents of algae, reed, mussels, and sludge.
3.2 Nutrient amounts and areas
3.2.1 Nutrient amounts
In order to achieve good ecological status of the Baltic Sea in the year of 2021, an action
plan has been created by the Helsinki Commission (HELCOM) (Miljödepartementet,
2008). According to the action plan, 21 000 tonnes of nitrogen and 290 tonnes of
phosphorus shall be decreased of the annual discharge from Sweden. The working
hypothesis of this work is that Ecological engineering methods can considerably help
meeting these environmental goals through the harvest of algae, reed and/or mussels

35
along the Swedish Baltic coastline. The potential amount of algal biomass that annually
can be harvested from the Swedish south coast, that reaches from Malmö to Simrishamn
amounts to approximately 330 000 tonnes of wet weight (see Figure 3.2.1). This potential
amount of algal biomass corresponds to 1100 tonnes of nitrogen and 91 tonnes of
phosphorus (see Figure 3.2.2), which corresponds to 5 % nitrogen and 31 % phosphorus
of the amounts of the action plan (see Table 3.1.1).
As there is no documentation of the potential biomasses of reed and mussels that
annually can be harvested form the Baltic coastline of Sweden, the potential amount of
nitrogen harvested through algae (i.e. 1100 tonnes) is used as a comparative measure in
this work. The biomass (i.e. wet weight) of reed and mussels that need to be harvested in
order to achieve the same amount of nitrogen amounts to 330 000 and 100 000 tonnes of
wet weight, respectively (see Figure 3.2.1), calculated from data of wet weight nitrogen
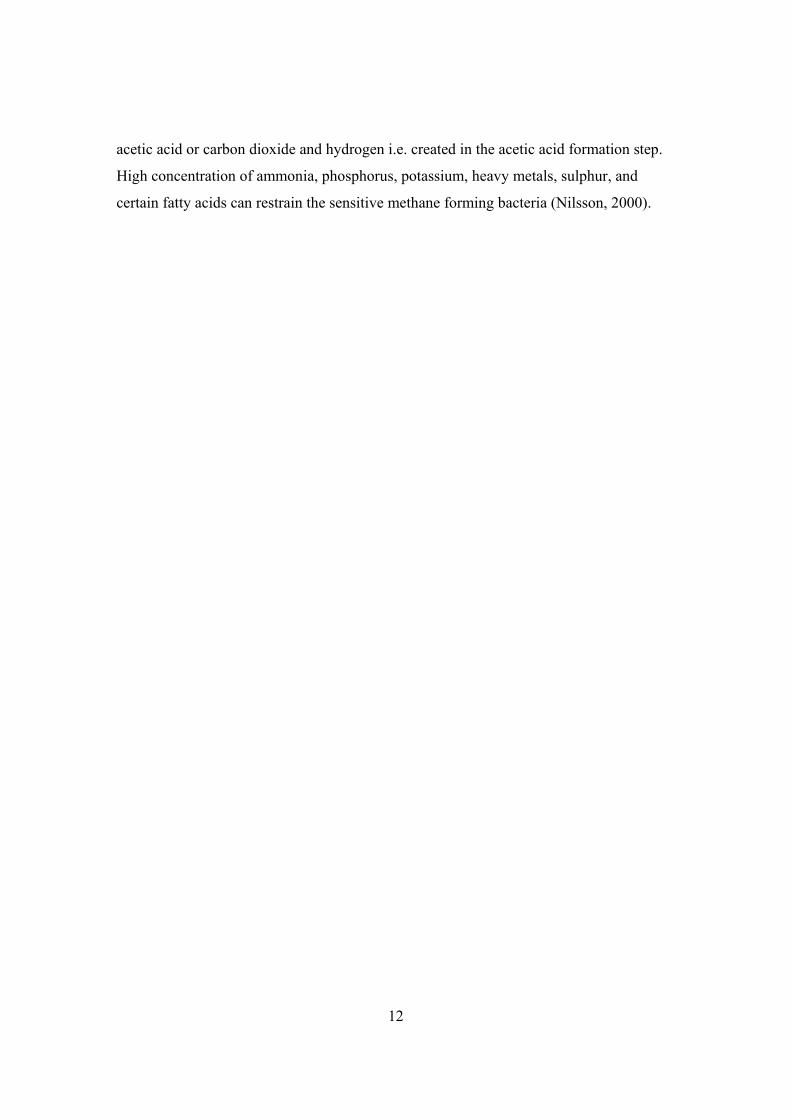
content in Equation 4. The amount of phosphorus in the corresponding biomass is 105
tonnes for reed and 70 tonnes for mussels (see Figure 3.2.2). The biomasses of reed and
mussels that correspond to 1100 tonnes nitrogen and the phosphorus contents of the
biomasses are calculated from data of wet weight nitrogen and phosphorus contents in
Equation 5.
Figure 3.2.1 Wet weight of biomass of algae, reed, and mussels [tonnes] corresponding to 1100 tonnes of nitrogen (i.e. used as a comparative measure in this work) respectively.
36
0
20
40
60
80
100
120
Algae Reed Mussels
P-c
onte
nt/1
100
tonn
es N
[ton
nes]
Figure 3.2.2 Phosphorus content of biomass of algae, reed mussels [tonnes] corresponding to 1100 tonnes nitrogen respectively. Table 3.2.1 1100 tonnes of nitrogen and corresponding amounts of phosphorus (i.e. of algae, reed, and mussel biomass respectively) as percent of the nutrient amounts of the action plan
Nitrogen Phosphorus
Nutrient amount according to the action plan [tonnes] 21 000a 290a
Algae i [%] 5.0 31
Reed ii [%] 5.0 36
Mussels iii [%] 5.0 24 a Miljödepartementet, 2008
i. On the Swedish South coast ii. Along part of the Baltic coast line of Sweden
iii. Part of the water area of the Stockholm archipelago
3.2.2 Areas
The area of reed that needs to be harvested and the water area that need to be covered
with mussel farms in order to reduce 1100 tonnes of nitrogen from the Baltic coast line of
Sweden annually, amounts to 12 000 hectares and 1700 hectares respectively. The areas
were calculated by using data of amount of reed per hectare, the area and amount of
biomass per mussel farm and the concentration of nitrogen of the three biomasses (see

37
Equations 6-7). There is no documentation of potential biomasses of reed and mussels
that annually can be harvested from the Baltic coast line of Sweden. In order to
appreciate the realism of the calculated areas, they were compared to Swedish total reed
area of 100 000 hectares and the water area of the Stockholm archipelago of 372 500
hectares (collected from reports of Hansson & Fredriksson (2004) and Nordiska
ministerrådet (2009)). The areas of reed and mussels respectively, were calculated as
proportions of the areas in Equation 8. The result showed that the areas, in order to
annually reduce 1100 tonnes of nitrogen, correspond to 11.7 % of Swedish total reed area
and 0.45 % of the water area of the Stockholm archipelago (see Table 3.2.1).
Table 3.2.2 Areas to harvest biomass equivalent to 1100 tonnes of nitrogen of reed and mussels, respectively, and the areas as percent of Swedish total reed area and of the water area of the Stockholm archipelago.
Area [ha] share [%]
Reed 12 000 11i
Mussels 1 700 0.45 ii i. of Swedish total reed area
ii. of the water area of the Stockholm archipelago

38
LCI
In order to determine the biogas potential of biomasses of algae, reed, and mussels, LCI
has been made which extends from the harvest (i.e. from the Baltic coast of Sweden) to
the production of biogas. Energy balances have been calculated from the LCI, where
energy demands were subtracted from energy benefits regarding biomass corresponding
to one tonne of nitrogen (i.e. of algae, reed, and mussels respectively). The energy benefit
represents the potential of methane extraction of the three biomasses and the energy
demands include harvest, transportation from the harvest spot to the biogas plant and
heating- and electricity demands from the biogas production process. The energy benefits
and the energy demands are further described in Chapters 3.3 and 3.4. In Chapter 3.5
energy demands in relation to energy benefits are presented and Chapter 3.8 contains
energy balances.
3.3 Energy benefit
The energy potential of biomass from algae, reed, and mussels was calculated from data
of liter CH4 that can be extracted per kg volatile solids in Chapter 2.3. The energy
potential of biomass depends on factors such as share of volatile solids of the biomass
and how well suited the organic matter of the volatile solids is as substrates for the
microorganisms in the biogas production process. Figure 2.3.1 presents the energy
potential per tonne of volatile solids, dry weight, and wet weight, respectively, for the
three biomasses and sludge in order to appreciate the biogas potential in comparison to a
reference (see Equations 9-12).
The energy content per tonne volatile solids is highest in mussels, i.e. 1.4 times
higher than in sludge and 4-5 times higher than in reed and algae. The relative order of
the substrates based on energy content per tonne dry weight is similar to those of volatile
solids i.e. 2, 4, and 6 times higher of mussels than that of sludge, reed, and algae
respectively, (even though the dry volatile solid content of mussels is lower compared to
reed, see Figure 3.1.2). The energy content per tonne wet weight is between 3 and 4 times
higher in reed compared to the other substrates (see Figure 3.3.1), this is due to high wet
weight volatile solid content of reed, i.e. 18, 11, and 4 times higher than that of mussels,
sludge, and algae respectively (see Figure 3.1.2).

39
Figure 3.3.1 Energy benefit per tonne wet weight, dry weight, and volatile solids of algae, reed, mussels, and sludge respectively. For the four substrates, the bar to the left represents energy potential per tonne wet weight, the intermediate bar represents energy potential per tonne dry weight and the bar to the right represents energy potential per tonne volatile solids.
The energy benefit of reed is superior compared to that of algae and mussels and shows 4
and 13 times higher value compared to algae and reed respectively (see Figure 3.3.2).
The wet weight nitrogen content of reed and algae is similar (0.3 %), and therefore
corresponds to similar amounts of biomass (for nitrogen content of wet weight, see
Figure 3.1.1). The reason why the energy benefit of reed still is higher is the higher
energy potential per tonne biomass compared to algae (see Figure 3.3.1).
The nitrogen content of mussels is three times higher compared to algae and reed,
and a smaller amount of biomass of mussels corresponds to one tonne of nitrogen
compared to algae and reed (for nitrogen content of wet weight, see Figure 3.1.1), another
factor is that algae and reed have higher energy benefit per tonne wet weight compared to
mussels (see Figure 3.3.1). The number of Swedish average households that annually can
be heated from the biogas benefit from biomass including one tonne of nitrogen is 3.0, 12
and 1.0 of algae, reed, and mussels respectively (see Table 3.3, Equations 13-14)

40
Figure 3.3.2 Energy potential of biomass equal to one tonne of nitrogen.
3.4 Energy demands
3.4.1 Harvest
The harvest technique of algae and reed is different from the one of mussels and the
energy demand per tonne biomass (i.e. wet weight) is almost 11 and 13 times higher
for mussels compared to algae and reed respectively, as shown in Figure 3.4.1. The
energy demand for biomass corresponding to one tonne of nitrogen is three and four
times higher for mussels compared to algae and reed, respectively (see Table 3.4.2).
The differences between mussels and the other two biomasses decrease due to the
over three times higher nitrogen content of mussels compared to algae and reed (i.e. a
smaller amount of mussel wet weight need to be harvested in order to receive the
same amount of nitrogen). Both energy demand per tonne wet weight and for biomass
including one tonne of nitrogen are similar for algae and reed, due to similar wet
weight content of nitrogen (for nitrogen content of wet weight, see Figure 3.1.1, see
Equations 15-24).

41
3.4.2 Transport
The energy demand per 10 km for transportation per tonne biomass (i.e wet weight of
algae, reed and mussels, respectively) amounts to 27 MJ. The energy demand per 10
km for transportation of biomass of one tonne wet weight and including one tonne of
nitrogen respectively, is presented in Figure 3.4.1 and 3.4.2 (for calculations of
energy demand from transport, see Equation. 25-26). The energy demand for biomass
including one tonne of nitrogen is more than three times lower for mussels than for
algae and reed. This is due to the over three times higher nitrogen content of mussels
compared to algae and reed (i.e. less biomass need to be transported in order to
achieve the same amount of nitrogen). The energy demand for algae and reed are
similar due to similar wet weight content of nitrogen (for nitrogen content of wet
weight, see Figure 3.1.1). Depending on the location of the harvesting point and of
the nearest biogas plant, the transport distance of the biomass varies. In order to
visualize the influence of energy demand with regard to transport distances, energy
balances including energy demands for different transport distances are presented in
Chapter 3.5.
3.4.3 Heating- and electricity
Heating- and electricity demands occur in the biogas production process. Data for the
demands as percentages of the energy content of biogas produced concerning a
central biogas plant were received from the report of Berglund & Börjesson (2003).
The energy demands were calculated as percentages of the energy content of biogas
produced in Equation 27. Summarized demands from heating and electricity are
shown for the three biomasses per tonne wet weight in Figure 3.4.1 and for biomass
corresponding to one tonne nitrogen in Figure 4.2. The energy demand from heating
and electricity from biogas production of one tonne wet weight is almost five times
higher for reed than for algae and mussels respectively, as shown in Figure 3.4.1. The
energy demand from heating and electricity from biogas production of biomass
corresponding to one tonne of nitrogen is almost 4 times higher for reed compared to
algae and almost 13 times higher for reed compared to mussels (see Figure 3.4.2).

42
0
100
200
300
400
500
600
Algae Reed Mussels
Ener
gy d
eman
d [M
J/to
nne
ww
]
Figure 3.4.1. Energy demand [MJ tonne-1 ww] where lower dashed area represents harvesting, intermediate black area represents transportation and upper dashed area represents biogas production for algae, reed and mussels.
Figure 3.4.2 Energy demand [MJ tonne-1 N] where lower dashed area represents harvesting, intermediate black area represents transportation and upper dashed area represents biogas production for algae, reed and mussels.

43
3.5 Energy balance
In the energy balances, energy demands are subtracted from energy benefits. The energy
demands in the life cycle analysis include those related to harvest, transportation from the
harvest spot to the biogas plant, and heating- and electricity demands in the biogas
production. Depending on the location of the harvest spot and of the nearest biogas plant,
the transport distance varies. In order to visualize the influence of energy demand
according to transport distances, energy balances excluding energy demand from
transport (i.e. including energy demand from harvest, heating and electricity) have been
calculated. The net energy benefit, based on biomass corresponding to one tonne of
nitrogen, is highest for reed , i.e. 42, and 4 times higher compared to mussels and algae,
respectively (see Figure 3.5.1). In order to visualize the influence from transport
distances, energy balances including transport distance of 10 km and 100 km are
presented in Figure 3.5.2. From the positive net energy benefits of algae, reed, and
mussels respectively, where a transport distance of 10 km has been included, 2.9, and 0.2
households can be heated respectively. When a transport distance of 100 km has been
included, 1.0 and 8.0 households can be heated from algal and reed biomass respectively.
The corresponding energy balance of mussels is negative (see Table 3.5, Equations 28-
30).

44
0.E+00
1.E+05
2.E+05
3.E+05
4.E+05
5.E+05
6.E+05
Algae Reed Mussels
Net
ene
rgy
bene
fit [M
J/to
nne
N]
Figure 3.5.1 Energy balances excluding energy demand from transport (i.e. including energy demand from harvest, heating and electricity) for biomasses corresponding to one tonne of nitrogen of algae, reed and mussels.
-1.00E+05
0.00E+00
1.00E+05
2.00E+05
3.00E+05
4.00E+05
5.00E+05
6.00E+05
Algae Reed Mussels
Net
ene
rgy
bene
fit [M
J/to
nne
N]
Figure 3.5.2 Energy balances for algae, reed and mussels including transport distances where the left bar represents demand of 10 km and the right bar of 100 km.

45
Table 3.5. Number of Swedish average households that can be heated from the positive net energy benefits from biomass including 1 tonne of nitrogen of algae, reed, and mussels respectively, including transport distances of 10 km and 100 km respectively (i.e. in Figure 3.5.2) Households (10 km) Households (100 km)
Algae 2.0 1.0
Reed 9.0 8.0
Mussels 0.2 -
3.6 Transport distance from net energy benefits
Depending on location of the harvesting point and of the nearest biogas plant, the
transport distance varies. The maximum distance that the biomass can be transported
before the net energy benefit is used up was calculated as shown in Equation 31. No
considerations have been taken to energy costs for upgrading of biogas to vehicle gas or
manufacturing of other fuels used in the process (i.e. diesel) in the calculations.
The distance that biomass can be transported by using its corresponding net
energy benefit is 670 km for reed, 180 km for algae, and 54 km for mussels. Figure 3.6.1
show the relationship between the net energy benefit (where energy demands from
harvest, electricity- and heating have been subtracted from energy benefit) and the energy
transport demand per km for reed. Where the two lines intersect, the value on the x-axis
shows how far the biomass can be transported before the net energy benefit is consumed.

46
Figure 3.6.2 The relationship between the net energy benefit (per tonne wet weight where energy demands from harvest, electricity- and heating have been subtracted from energy benefit) and the energy transport demand per km for reed. 3.7 Indirect energy benefits
When artificial fertilizer is replaced by harvested biomasses of algae, reed, and mussels,
indirect energy benefits arise. The biomasses are assumed to be ready for usage as
fertilizer, without energy costs from manufacturing (unlike the case with artificial
fertilizer). The energy demand for production of artificial fertilizer is 45 MJ per kg
nitrogen and 25 MJ per kg phosphorus. Indirect energy benefits that follow replacement
of artificial fertilizer to biomass corresponding to one tonne of nitrogen (i.e. used as a
comparative measure in this work, see Chapter 3.2.1) and amounts of Swedish average
households that annually can be heated were calculated in Equation 32. The energy
benefit is slightly higher for reed followed by algae, and mussels, due to slightly higher
phosphorus content per tonne nitrogen of reed. From biomass corresponding to one tonne
of nitrogen, of algae, reed and mussels, respectively; approximately one household can be
heated per year. Similar energy demands for transportation, and spreading on arable land
of the biomasses and of an artificial fertilizer is assumed to occur.
47
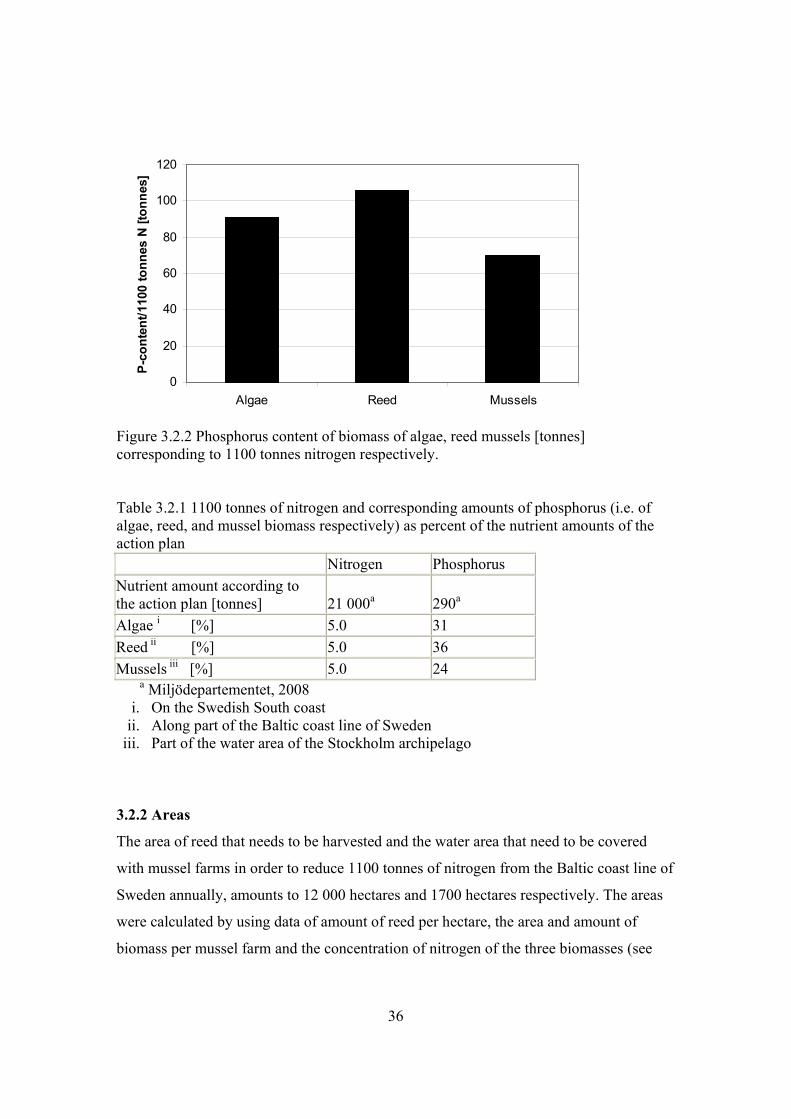
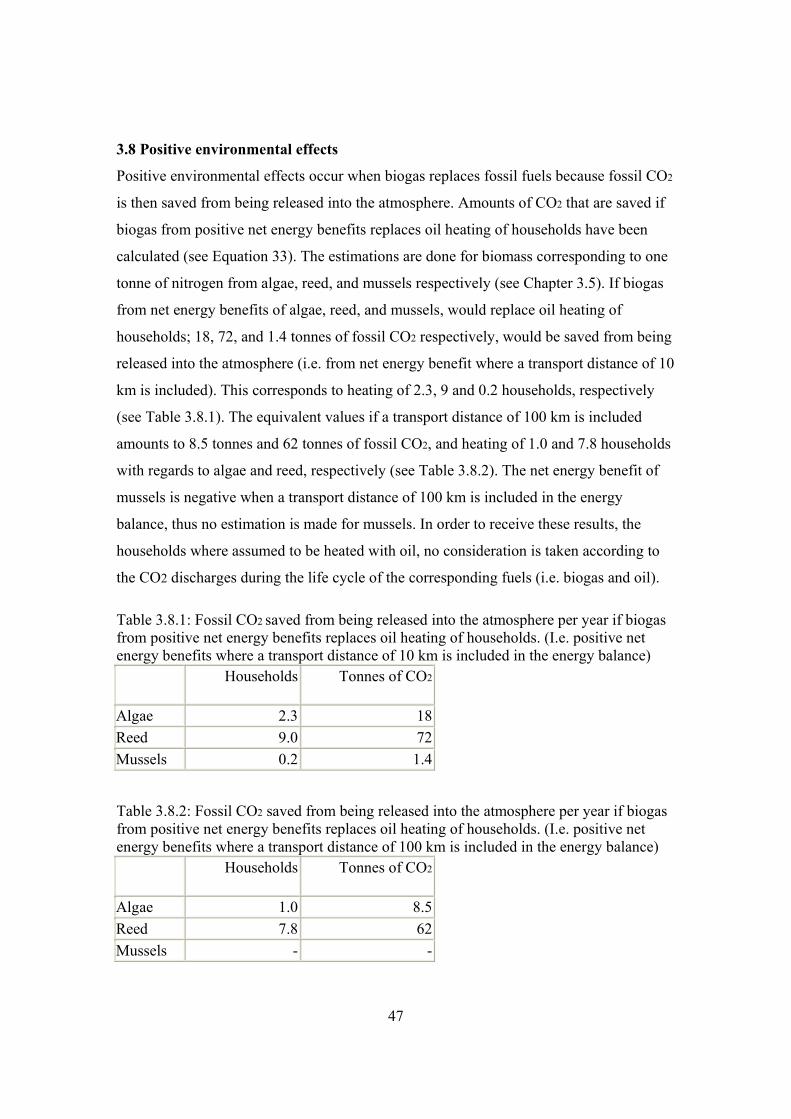
3.8 Positive environmental effects
Positive environmental effects occur when biogas replaces fossil fuels because fossil CO2
is then saved from being released into the atmosphere. Amounts of CO2 that are saved if
biogas from positive net energy benefits replaces oil heating of households have been
calculated (see Equation 33). The estimations are done for biomass corresponding to one
tonne of nitrogen from algae, reed, and mussels respectively (see Chapter 3.5). If biogas
from net energy benefits of algae, reed, and mussels, would replace oil heating of
households; 18, 72, and 1.4 tonnes of fossil CO2 respectively, would be saved from being
released into the atmosphere (i.e. from net energy benefit where a transport distance of 10
km is included). This corresponds to heating of 2.3, 9 and 0.2 households, respectively
(see Table 3.8.1). The equivalent values if a transport distance of 100 km is included
amounts to 8.5 tonnes and 62 tonnes of fossil CO2, and heating of 1.0 and 7.8 households
with regards to algae and reed, respectively (see Table 3.8.2). The net energy benefit of
mussels is negative when a transport distance of 100 km is included in the energy
balance, thus no estimation is made for mussels. In order to receive these results, the
households where assumed to be heated with oil, no consideration is taken according to
the CO2 discharges during the life cycle of the corresponding fuels (i.e. biogas and oil).
Table 3.8.1: Fossil CO2 saved from being released into the atmosphere per year if biogas from positive net energy benefits replaces oil heating of households. (I.e. positive net energy benefits where a transport distance of 10 km is included in the energy balance)
Households Tonnes of CO2
Algae 2.3 18
Reed 9.0 72
Mussels 0.2 1.4
Table 3.8.2: Fossil CO2 saved from being released into the atmosphere per year if biogas from positive net energy benefits replaces oil heating of households. (I.e. positive net energy benefits where a transport distance of 100 km is included in the energy balance)
Households Tonnes of CO2
Algae 1.0 8.5
Reed 7.8 62
Mussels - -

48
3.9 Suitability as fertilizer in accordance with nutrient content
In order to assess the suitability of biomass of algae, reed and mussels as fertilizers
according to contents of nitrogen, phosphorus, and potassium, the relationships between
the nutrients (i.e. based on quotients of nitrogen) of the three biomasses where compared
to nutrient sufficiency of crops from the report of Davidsson (2007). Table 3.9.1 shows
nutrient sufficiency of peas, grain and sugar beets, and Table 3.9.2 shows nutrient
contents in algae, reed and mussels. Comparison of the two tables show that there is a
good potential of using all three biomasses as fertilizers with regards to the content of
nitrogen, but the content of phosphorus occurs under the sufficiency levels of the crops.
For algae and reed, the potassium contents occur above the level of peas and grain but
under the level for sugar beets, for mussels the potassium content occurs under the
sufficiency of all three crops.
Table 3.9.1 Nutrient sufficiency of crops (as quotients of nitrogen). N:P:K
Peas 1:0.11:0.28a
Grain 1:0.16:0.17a
Sugar beets 1:0.17:1a aDavidsson, 2007
Table 3.9.2 Nutrient contents in algae, reed and mussels. N:P:K
Algae 1:0.10:0.49
Reed 1: 0.10:0.70
Mussels 1:0.06:0.10

49
Discussion
In order to achieve good ecological status of the Baltic Sea in the year of 2021, an action
plan has been created by the Helsinki Commission (Miljödepartementet, 2008).
According to the action plan, 21 000 tonnes of nitrogen and 290 tonnes of phosphorus
shall be decreased of the annual discharge from Sweden. The working hypothesis of this
work is that Ecological engineering methods can considerably help meeting these
environmental goals through the harvest of algae, reed, and mussels along the Swedish
Baltic coastline. The nitrogen and phosphorus content of mussels is almost three and two
times higher compared to algae and reed respectively, which have similar nutrient
contents (see Figure 3.1.1). Because of this fact, cultivation and harvesting of mussels are
most effective in terms of nutrient reduction from the Baltic coast of Sweden, in
comparison to harvest of algae and reed.
The potential amount of nutrients of algal biomass that annually can be harvested from
the South coast showed, i.e. 5 % of nitrogen and 31 % of phosphorus respectively, can
help meeting the nutrient goals of the action plan. The calculations of the potential
amounts of algae from collection along the Southern coast of Sweden are made by Detox
AB. The collection is assumed to take place in the water, with an area that reaches 100
meters out in the water from the coastline. The assumption of the quantities of algal
biomass per hectare is based on the present collection performed by the municipality of
Trelleborg (Barwén, 2009). Something that need to be carefully considered while
harvesting algae is to restrict the harvesters from collecting important seaweed that create
essential environments for other species. According to Jönsson (2001) a rich animal life
exists in the algal mats, thus not only algae are collected during harvest but also the
species living there.
While there are no documentations of potential biomasses of reed and mussels that
annually can be harvested from the Baltic coastline of Sweden, the potential amount of
nitrogen harvested through algae, i.e. 1100 tonnes of nitrogen have been used as a
comparative measure in this work. The corresponding amount of phosphorus harvested
through reed, and mussels, answers to 36 %, and 24 % respectively, of the action plan.

50
The harvestable areas of reed along the Swedish Baltic coastline in this
work is an estimation based on data from the literature showing that reed grow as large,
monospecific stands along the Baltic coast line of Sweden, and data of Swedish total reed
area from report of Hansson & Fredriksson (2004). The areas suitable for mussel farming
in the Swedish archipelago is based on data of the water area of the Stockholm
archipelago from Svenska ministerrådet (2009) and conditions suitable for mussel farms
(i.e. areas covered from wind and with certain depths from report of Lindahl et al (2005).
In order to harvest 1100 tonnes of nitrogen through reed, 11 % of Swedish total reed area
along the Baltic coastline of Sweden needs to be harvested. To harvest the same amount
through mussels, 0.44 % of the water area of the Stockholm archipelago needs to be
covered with mussel farms. The Swedish archipelago is a popular area for outdoor
activities, and in order to determine which certain areas that can be covered with mussel
farms, solutions need to be made locally. There are no documentations of the total reed
area of the Swedish Baltic coastline (Granéli, 2008). The potential areas that can be
harvested of the three biomasses from the Baltic coastline of Sweden need to be further
investigated.
The harvesting technique of algae and reed studied in this work is the Aquatic Plant
Harvester, RS 2000, a floating device suitable for harvest of water plants (RS Planering
AB, 2008). A floating device is preferable for harvest of reed, because it prevents the
rhizome from being damaged (Hansson & Fredriksson, 2004). The fast growing
vegetation, important for fish species, is easily damaged by land based harvesting
techniques (Heikkilä & Mattila, 2000). Long line mussel farming is a farming technique
developed in Sweden and is beneficial in comparison to bottom scraping (Sanchez et al,
2004). A drawback with the mussel farms is that the sediment underneath the farm can be
overloaded and increased sedimentation can give rise to decreased oxygen concentrations
underneath the farms. But these negative effects only occur locally and the overall
positive environmental effects need to be considered (Lindahl et al, 2005).
LCI which reaches from the harvesting of biomass to the production of biogas
have been created in order to determine the biogas potential of the three biomasses. The
energy demand in the process represents the demands from harvesting, transportation

51
from harvest location to a central biogas plant, heating, and electricity demands from the
biogas production process. The energy benefit represents the potential methane extraction
of the biomasses.
Mussels contain the highest amount of energy per tonne volatile solids, 1.4 times
higher than sludge and between 4 and 5 times higher than algae and reed, respectively
(see Figure 3.3.2). Even though the dry weight volatile solid content is highest in reed
(followed by mussels, sludge, and algae, see Figure 3.1.2) the energy dry weight content
of mussels is higher (see Figure 3.3.1).
With respect to wet weight, reed contains most energy, i.e. between 3 and 4 times
higher compared to sludge, algae, and mussels respectively (see Figure 3.3.1). This is due
to superior wet weight volatile solid content of reed, i.e. 18, 11, and 4 times higher,
compared to mussels, sludge, and algae, respectively (see Figure 3.1.2).
The chemical composition of the substrates has influence on the biogas
production (Berglund & Börjesson, 2003). The nitrogen content of mussels is higher
compared to the other biomasses. In the degradation process, organically bound nitrogen
is transformed to ammonia, which has an inhibitive effect on the microorganisms
(Nilsson, 2000). Lignin, which increases in reed biomass in the autumn is hard to digest
in the biogas process (Eno, 2007), in order to achieve a greater amount of methane from
reed, harvest before autumn is to prefer.
The energy demand from transport is the same for the three biomasses, the
transport distance varies depending on the location of the biogas plant and of the
harvesting point, in this study 10 km is used for simplicity (see Figure 3.4.1). The same
technique is used to harvest algae and reed and therefore, similar energy demands occur
(see Figure 3.4.1). It is normally less time consuming to collect algae than reed, because,
unlike reed, algae do not cover the whole water surface (Salin, 2008).
The energy demand of mussels is higher due to a more energy demanding
harvesting process (Granhed, 2009). In reality, the harvest demand in the LCI varies
depending on transport distances (i.e. between harvest location and shore) and occurrence
of biomass.

52
The heating- and electricity demands in the biogas production process is calculated as
share of the energy content received, and is therefore proportional to energy contents of
the three biomasses, i.e. between three, and four times higher of reed than that of algae,
and mussels respectively (see Figure 3.4.1). The assumption that the energy demands are
proportional to the energy content in the biogas produced is simplifying. In reality these
demands depend on substrate composition etc. The electricity demand depend on the
substrates requirement of milling, cutting, pumping, and stirring, etc and the heating
demand on the necessity of heating and hygienization (Berglund & Börjesson, 2003).
Depending on the location of the harvesting area and of the biogas plant, the transport
distance varies. The net energy benefit excluding transport demand, according to energy
balances based on biomass corresponding to one tonne nitrogen, is the highest for reed ,
i.e. 42, and 4 times higher compared to mussels and algae, respectively (see Figure 3.5.1).
The maximum distance that the biomass of algae, reed, and mussels can be transported
before the net energy benefit is used up is 670 km, 180 km, and 54 km respectively.
In order to visualize the influence from transport distances, energy balances including
transport distance of 10 km and 100 km are presented in Figure 3.5.2. According to these
results, potential occurs of further investigation concerning reed and algae. The suitability
of reed as substrate in biogas production is also documented in the study of Hansson &
Fredriksson (2004). The low net energy benefit of mussels shows that mussels are not a
suitable substrate for biogas production. According to Lindahl et al (2005) an alternative
is to use mussels (i.e. instead of fish meal) in chicken feed.
When biogas replaces fossil fuels, positive environmental effects occur because
fossil CO2 is then saved from being released into the atmosphere. From the positive net
energy benefits of reed biomass (i.e. corresponding to one tonne of nitrogen) from energy
balances including a transport distance of 10 km (see Figure 3.5.2), 72 tonnes of fossil
CO2 would be saved from being released to the atmosphere, which corresponds to
heating of 9 Swedish households annually. The corresponding amounts that would be
saved by algae and mussels are 18 and 1.4 tonnes respectively which equals heating of 2
and 0.2 households annually (see Table 3.8.1). In order to receive these results, the

53
households where assumed to be heated with oil, release of fossil CO2 from preparation
of fuels is not taken into account (i.e. oil and biogas).
Indirect energy benefits that follow replacement of artificial fertilizer to biomass
corresponding to equal amounts of nitrogen is slightly higher for reed followed by algae,
and mussels. This is due to higher phosphorus content per tonne nitrogen of reed
biomass. The indirect energy benefits correspond to annual heating of approximately one
average Swedish household per biomass. There is a good potential of using all three
biomasses as fertilizers regarding the content of nitrogen but the content of phosphorus
occurs under the sufficiency levels of the crops. For algae and reed, the potassium
contents occur above the level of peas and grain but under the level of sugar beets.
Regarding mussels the potassium content occurs under the sufficiency of all three crops
(see Tables 3.9.1 and 3.9.2).
A limiting factor in the usage of fertilizer is the biomass content of heavy metals,
i.e. Cadmium. Cd is a heavy metal that accumulates in the ground and is therefore
available for plants a long time after its supply (Davidsson, 2007). Results from
Davidsson (2007) show that algal content of all heavy metals, except for Cd, occur far
below the limiting values and Olrog & Christensson (2003) show similar results for
mussels. In comparison to other water plants, reed is a pure substrate, with low heavy
metal contents, and is suitable as fertilizer on arable land, according to Fredriksson
(2002). Methods to remove heavy metals exist. One drawback that can occur is loss of
organic material while purifying the biomasses from Cd, which will have negative
impacts on biogas potential of the biomasses (Davidsson & Ulfsdotter Turesson, 2008,
Melin, 2001).

54

55
Conclusion
An action plan has been created by the Helsinki Commission (HELCOM) in order to
achieve good ecological status of the Baltic Sea in the year of 2021. According to the
action plan, 21 000 tonnes of nitrogen, and 290 tonnes of phosphorus shall be decreased
of the annual discharge from Sweden. Methods within ecological engineering can help
meeting the environmental goals through the harvest of algae, reed, and mussels
considerably, both regarding areas and amounts that need to be harvested along the
Swedish Baltic coastline.
While there are no documentations of potential biomasses of reed and
mussels that annually can be harvested from the Baltic coastline of Sweden, the potential
amount of nitrogen harvested through algae from the Swedish south coast, i.e. 1100
tonnes, have been used as a comparative measure in this work. The calculation of the
algal biomass is based on an assumption that the algae are collected from the water
within an area that reaches 100 metres out from the coastline (i.e. between Malmö and
Simrishamn) and assumptions of the quantities of algal biomass per hectare is based on
the present collection performed by the municipality of Trelleborg (Barwén, 2009). The
potential amount of nutrients of algal biomass that annually can be harvested from the
South coast corresponds to 5 % of nitrogen and 31 % of phosphorus respectively, of the
total reduction in the action plan (see Table 3.2.1).
In order to harvest 1100 tonnes of nitrogen through reed, 11 % of the
Swedish total reed area along the Baltic coastline of Sweden needs to be harvested. To
harvest the same amount through mussels, 0.44 % of the water area of the Stockholm
archipelago needs to be covered with mussel farms (see Table 3.2.2). These areas are
estimations based on data of the Swedish total reed area, and of the water area of the
Stockholm archipelago. In order to determine the potential amounts of the three
biomasses that annually can be harvested from the Baltic coastline of Sweden, further
investigations about occurrence, disturbance of ecosystems associated to harvest, and
disturbance of outdoor life (i.e. covering of mussel farms in recreational areas) are
needed.
Farming and harvesting of mussels is most efficient based on wet weight as
regards nutrient reduction from the Baltic coastline of Sweden, in comparison to harvest

56
of algae and reed. The nitrogen and phosphorus contents of mussels are almost three, and
two times higher compared to algae and reed, respectively (see Figure 3.1.1).
In order to investigate the biogas potential of the three biomasses LCI,
which extends from the harvesting of biomass to the production of biogas has been
created. The energy benefit is represented by the potential methane extraction of each
biomass (see Figure 3.3.1). The energy demand in the process includes the demands from
harvest, transportation from harvest location to a central biogas plant and heating and
electricity demands in the biogas production process (see Figure 3.4.1). In reality, the
transport distance varies depending on location of harvest area and of the biogas plant.
The harvesting energy demand in the LCI varies with transport distances (i.e. between
harvest and shore) and occurrence of biomass. In this study, it is assumed that the energy
demands are proportional to the energy content in the biogas produced, which is a
simplification. In reality these demands depend on substrate composition and on the
design of the biogas plant.
According to the energy balances, based on biomass corresponding to one tonne
of nitrogen, reed has the highest net energy benefit followed by algae. Mussels showed to
have low net energy benefit (see Figure 3.5.1). The conclusion is that biogas production
from reed and algae has a positive potential and is worthy of further investigation, and
that mussels are not a suitable substrate in biogas production.
Mussels have potential of being used in chicken feed (i.e. instead of fish meal)
according to Lindahl et al (2005), as an alternative product. Another product that possibly
can be received from the harvested biomasses is fertilizer, the study shows that all three
biomasses have potential regarding the nutrient content of nitrogen but the content of
phosphorus occurs under the sufficiency levels of the crops investigated (i.e. peas, grain,
and sugar beets). For algae and reed, the potassium contents occur above the level of peas
and grain but under the level of sugar beets, for mussels the potassium content occurs
under the sufficiency of all three crops (see Tables 3.9.1 and 3.9.2).
Cd is a limiting factor of using the biomasses as fertilizers on arable land.
While it accumulates in the ground, it is difficult to investigate the biomasses suitability
as fertilizer regarding Cd. In order to draw more accurate conclusions, i.e. regarding
heavy metal contents, closer studies need to be performed.

57
References Artioli Y., Friedrich J., Gilbert A. J., McQuatters-Gollop A., Mee L. D., Vermaat J. E., Wulff F., Humborg C., Palmeri L., Pollehne F., 2008, Nutrient budgets for European seas: A measure of the effectiveness of nutrient reduction policies, Marine Pollution Bulletin, p. 1609–1617, Vol. 56, Stockholm, Sweden. Aqua scope, 2000, http://www.vattenkikaren.gu.se/defaulte.html (accessed March 3, 2009) Barwén Johan, Personal communication, Apr 2009, Detox Biogas AB, Malmö, Sweden
Berglund M., 2006, Biogas Production from a System Analytical Perspective, Lunds Tekniska Högskola, Akademisk avhandling, Lund, Sweden.
Berglund M. & Börjesson P., 2003, Energianalys av biogassystem, Lunds Tekniska Högskola, Rapport 44, Lund, Sweden. (In Swedish)
Björnsson L., 2008, Biogasprocessen teknik, mikrobiologi och kemi, Faktablad sammanställt för Biogas syd, Malmö, Sweden. (In Swedish)
Brenner U., 2007, Egentliga Östersjön – en unik blandning av salt och sött, Våra havsområden del 2, HavsUtsikt 3. (In Swedish) Börjesson P., 2006, Livscykelanalys av Salixproduktion, Lunds Tekniska Högskola, Rapport nr 60, Lund, Sweden. (In Swedish)
Davidsson Å., 2007, Tång och alger som en naturresurs och förnyelsebar energikälla. Trelleborgs kommun, Sammandrag av rapport steg 1, Detox AB, Malmö, Sweden. (In Swedish) Davidsson Å., Ulfsdotter Turesson E., 2008, Tång och alger som en naturresurs och förnyelsebar energikälla. Trelleborgs kommun, Sammandrag av rapport steg 2, Detox AB, Malmö, Sweden. (In Swedish)
Ek Anders, Personal communication, Dec 2008, Tekniska verken, Linköping, Sweden. Eno K., 2001, Produktionsvåtmarker mot övergödning – en litteraturstudie, Examensarbete, Högskolan i Halmstad, Halmstad, Sweden. (In Swedish)
Fiskeriverket, 2007, Musselodlingar förbättrar vattenkvalitén, http://www.fiskeriverket.se/sidorutanformenyn/reportage/musselodlingarforbattrarvattenkvaliten.4.5994f41e110b6bbe5b680003577.html (accessed April 10, 2009)

58
Fransson Liisa, Personal communication, Dec 2008, Detox AB, Malmö, Sweden.
Fredriksson H., 2002, Storskalig sommarskörd av vass – energiåtgång, kostnader och flöden av växtnäring för system med skörd och efterföljande behandling, Examensarbete, Sveriges lantbruksuniversitet, Uppsala, Sweden. (In Swedish) Grané1i W., 1984, Reed Phragmites australis (Cav.) Trin. ex Steudel as an Energy Source in Sweden; Biomass, p. 183-208, Vol. 4.
Granéli Wilhelm, Personal communication, Professor, Head, Dept. of Ecology, Liminology at the University of Lund, Dec 2008, Lund, Sweden.
Granhed Anders, Personal communication, Mar 2009, Scanfjord, V Frölunda, Sweden. Grey J. S., Wu R.S., Or Y. Y., 2002, Effects of hypoxia and organic enrichment on the coastal marine environment, p. 249-279, Vol. 238, Marine ecology progress series, Hong kong, China. Griffin A., Klaus D., Pappas A., 2006, Improving Lagoon Water Quality through Mussel Stock Enhancement: A Case Study of the UCSB Campus Lagoon; Restoration Ecology http://66.102.1.104/scholar?hl=sv&lr=&q=cache:nWQ5owhd8xcJ:www.bren.ucsb.edu/academics/courses/217/Field%2520Research%2520Project/Griffin,%2520Klaus%2520and%2520Pappas-%2520217%2520Final%2520Paper.doc+ (accessed Oct 10, 2008) Gröndahl F., 2008, Removal of Surface Blooms of the Cyanobacteria Nodularia spumigena: A Pilot Project Conducted in the Baltic Sea, Ambio, p. 79-84, Vol. 37, Stockholm, Sweden.
Gröndahl, F. & Müller, M., 2008, The Trelleborg Concept – Sustainable development for the Baltic Sea Region. Baltic Cities Environmental Bulletin, p. 13, No 2.
Haamer J., Holm A.-S., Edebo L., Lindahl O., Norén F., Hernroth B., 1999, Strategisk musselodling för att skapa kretslopp och balans i ekosystemet – kunskapsöversikt och förslag till åtgärder; Karås Peter; Rekryteringsmiljöer för kustbestånd av abborre, gädda och gös, Fiskeriverket rapport 6. (In Swedish)

59
Hannaway D. B., 2000, Grass Growth and Regrowth for Improved Management, Oregon state university, http://images.google.se/imgres?imgurl=http://forages.oregonstate.edu/projects/regrowth/grass_diagram.gif&imgrefurl=http://forages.oregonstate.edu/projects/regrowth/print.cfm%3FPageID%3D11&usg=__gApWFDWXdhC9yJeuURlBSJDme2I=&h=487&w=350&sz=10&hl=sv&start=3&um=1&tbnid=M27Vdn-Bp5M_CM:&tbnh=129&tbnw=93&prev=/images%3Fq%3DGrass%2BGrowth%2Band%2BRegrowth%2Bfor%2BImproved%2BManagement%26hl%3Dsv%26sa%3DN%26um%3D1 (accessed Dec 6, 2008)
Hansen D. L., Lambertini C., Jampeetong A., Brix H., Lambertini C., Jampeetong A., Brix H., 2007, Clone-specific differences in Phragmites australis: Effects of ploidy level and geographic origin, Aquatic Botany, p. 269–279, Vol. 86, Aarhus, Denmark.
Hansson P.-A., Fredriksson H., 2004, Use of summer harvested common reed (Phragmites australis) as nutrient source for organic crop production in Sweden, Agriculture, Ecosystems and Environment, p. 365–375, Vol. 102, Uppsala, Sweden.
Hägglund B., Huring A., 2004, På väg mot en hållbar framtid, Miljöfakta 2004, Livsmiljö Skellefteå, Skellefteå kommun, Sweden. http://www.skelleftea.se/default.aspx?id=4962 (accessed Dec 19, 2008)
Ishii J., Kadonob Y., 2002, Factors influencing seed production of Phragmites australis; Aquatic Botany, p. 129–141, Vol.72, Kobe, Japan. Jordbruksverket, 2005, Jordbruket och övergödningen, http://www.sjv.se/download/18.677019f111ab5ecc5be8000127/%C3%96verg%C3%B6dningen+och+jordbruket-till+pdf4.pdf (accessed Nov 10, 2008)
Jöborn A., Oscarsson H. G., Sköld M., Sterner H., 2001. Algae in excess-harvesting for life. EU-life algae, Länstyrelsen i Västra Götaland, Sweden. Jönsson, B., 2001, Teknisk rapport för algskördare och skörd under perioden 1997-2000, Tjärnö Marinbiologiska Laboratorium, EU life algae, Strömstad, Sweden. (In Swedish)
Kautsky L. & Kautsky N., 2000, Seas at The Millennium: An Environmental Evaluation, The Baltic Sea, including Bothnian Sea and Bothnian Bay, ed. Sheppard C.R.C. Publicerad av Pergamon, 2000, p. 1-14, Ch. 8. Lantz M., 2007, Ökat utnyttjande av befintliga biogasanläggningar, Lunds Tekniska Högskola, Rapport nr 63, Lund, Sweden. (In Swedish)

60
Lim Y.-G., Niwa C., Nagao N., Tatsuki T., 2008, Solubilization and methanogenesis of blue mussels in saline mesophilic anaerobic biodegradation, International Biodeterioration & Biodegradation, p. 251–260, Vol. 61, Tokyo, Japan. Lindahl O., Hart R., Hernroth B., Kollberg S., Loo L.-O., Olrog L., Rehnstam-Holm A.-S., Svensson J., Svensson S., Syversen U., 2005, Improving Marine Water Quality by Mussel Farming: A Profitable Solution for Swedish Society, Ambio, p. 131–138, Vol. 34. Lindqvist M., 2008, Värdet av musselodlingar som reningsåtgärd i en kostnadseffektiv rening av kväve och fosfor från Östersjön, Examensarbete, Sveriges lantbruksuniversitet, Ultuna, Sweden. (In Swedish)
Lindstedt T., 2009, Stinkande tång värmer 7 000 villor, Sydsvenskan.se, http://sydsvenskan.se/skane/trelleborg/article329080/Stinkande-tang-varmer-7-000-villor.html (accessed Jan 11, 2009)
Lundberg C., 2005, Eutrophication in the Baltic Sea from area-specific biological effects to interdisciplinary consequences, Environmental and Marine Biology, Department of Biology, Åbo, Finland. Melin, Y., 2001, Alternativ användning av marina fintrådiga alger, Länsstyrelsen Västra Götaland, EU life algae project, Rapport nr 41, Länstyrelsen i Västra Götaland, Sweden. (In Swedish)
Miljödepartementet, 2008, Regionalpolitik, http://www.regeringen.se/sb/d/10846/a/92174 (accessed Nov 11, 2008)
Mitsch, W.J. & Jorgensen, S.E., 1989, Introduction to ecological engineering, Ecological Engineering, ed. W.J. Mitsch and S.E. Jorgensen, J. Wiley & Sons, p. 3-12, New York, USA.
Natura 2000 Networking Programme (2007) Reed strategy in Finland and Estonia Workshop Report. www.natura.org/nnp_workshop_reports/ee_estonia_report.pdf (Accessed April 22, 2008). Nordiska ministerrådet, http://www.skargarden.com/files/Tabellbilagatkomplementet.doc, (accessed Dec 14, 2008). (In Swedish) Norell H., 2005, Eco-services of mussel farms – An energy and cost comparison with traditional alternatives, Examensarbete, Kungliga tekniska högskolan, Stockholm, Sweden.

61
Olrog L., Christensson E., 2003, Musselodling och jordbruk i samverkan; Report from Hushållningssällskapet väst, in part financed with EU funds through CULMINATION Program, Part 3. Persson M., 2006, Basdata om biogas, Svenskt gastekniskt center, http://www.sgc.se/dokument/BiogasfolderA5.pdf, (accessed Dec 12, 2008). (In Swedish) Ribeiro Guevara S., Arribe´re M., Bubach D., Vigliano P., Rizzo A., Alonso M., Sa´nchez R., 2005, Silver contamination on abiotic and biotic compartments of Nahuel Huapi National Park lakes, Science of the Total Environment, p.119–134, Vol. 336, Patagonia, Argentina. Rice M. A., 2001, Environmental Impacts of Shellfish Aquaculture: Filter Feeding to Control Eutrophication, Department of Fisheries, Animal & Veterinary Science University of Rhode Island, Kingston, USA. RS-Planering AB, http://www.rsplanering.fi/eng/rs2000/rs2000.htm (accessed Oct 9, 2008).
Salin Patrik, Personal communication, Dec 2008 and Jan 2009, RS- planering AB, Pargas, Finland. Sanchez A., Nordwall F., Smith S., Larsson S., 2004, Musselodling En kretsloppsnäring för god miljö och hälsa samt ny sysselsättning i skärgården. Fiskeriverkets utredning, pp 3-37, Fiskeriverket, Göteborg, Sweden. (In Swedish) Sandell Daniel, Personal communication, Dec 2008, Biogas Malmberg Water, Åhus, Sweden. Soetaert K., Hoffmann M., Meire P., Starink M., van Oevelen D., van Regenmortel S., Cox T., 2004, Modeling growth and carbon allocation in two reed beds (Phragmites australis) in the Scheldt estuary, Aquatic Botany, p. 211–234, Vol. 79
SMF, Stockholms marina forskningscentrum, 2005, Fakta om Östersjön: Östersjön i siffror http://www.smf.su.se/havet/fakta/siffror.html
Sveriges radio, 2009-02-13, Blåmusslor ska rädda Östersjön, http://www.sr.se/cgi-bin/kalmar/nyheter/artikel.asp?Artikel=2633718, (accessed April 15, 2009). (In Swedish) Södertörns fjärrvärme, 2008, Årsredovisning, http://www.sodertornsfjarrvarme.se/Documents/Pdf-dokument/SFAB%20%C3%85rsber%C3%A4ttelse_2008.pdf (accessed Jan 4, 2009). (In Swedish)

62
Wessman M., 2007, Musselodling – en alternative reningsmetod för kväveutsläpp i Östersjön, Examensarbete, Kungliga tekniska högskolan, Stockholm, Sweden. (In Swedish)
Zhou Y., Yang H., Zhang T., Qin P., Xu X., Zhang F., 2006, Density-dependent effects on seston dynamics and rates of filtering and biodeposition of the suspension-cultured scallop Chlamys farreri in a eutrophic bay (northern China): An experimental study in semi-in situ flow-through systems, Journal of Marine Systems, p. 143– 158, Vol. 59

63
Appendix Equation symbols Chapter 2.1
Nwij = wet weight nutrient proportions (i.e. N and P) of algae, reed, and mussels
respectively
Ndij= dry weight nutrient contents (i.e. nitrogen and phosphorus) of algae, reed, and
mussels respectively
αi= wet weight nitrogen proportion of algae, reed, and mussel respectively
βi= wet weight phosphorus proportion of algae, reed, and mussel respectively
γi= wet weight dry weight proportion of algae, reed, mussel, and sludge respectively
δi = dry weight volatile solids proportion of algae, reed, mussels, and sludge respectively
εi = wet weight volatile solids proportion of algal, reed, mussel, and sludge respectively
Chapter 2.2.1
y,nalgae = Contents of nitrogen [tonnes] of potential biomass that annually can be
harvested from the Swedish south coast
y,pi = Contents of phosphorus [tonnes] of algal, reed, and mussel biomass corresponding
to 1100 tonnes of nitrogen respectively
walgae = corresponding wet weight of potential biomass that annually can be harvested
from the Swedish south coast
wn,i= amount of mussel and reed wet weight [tonnes] corresponding to 1100 tonnes of
nitrogen respectively
Chapter 2.2.2
Ni= nitrogen content per hectare of reed, and mussel biomass respectively
Bi = wet weight per hectare of reed and mussels, respectively
Areed = area of reed that need to be harvested in order to annually reduce 1100 tonnes of
nitrogen

64
Amussels = water area that need to be covered with mussels in order to annually reduce
1100 tonnes of nitrogen
Sreed = share of Swedish total reed area that need to be harvested in order to reduce 1100
tonnes of nitrogen from the Swedish Baltic coastline annually
Smussels = share of the water area of Stockholm’s archipelago that need to be covered with
mussel farms in order to reduce 1100 tonnes of nitrogen from the Swedish Baltic
coastline annually
Treed = Swedish total reed area
Tmussels = The water area of Stockholm’s archipelago
Chapter 2.4
ιmussels = energy potential as liter CH4 per kg wet weight of mussels
κ i = energy potential as liter CH4 per kg volatile solids of algae, reed, mussels, and
sludge respectively
λ = MJ/l CH4
μvs_i = MJ/tonne volatile solids of algae, reed, mussels, and sludge respectively
μdw_i = MJ/tonne dry weight of algae, reed, mussels, and sludge respectively
μww_i = MJ/tonne wet weight of algae, reed, mussels, and sludge respectively
μN_i = MJ/ biomass corresponding to one tonne of nitrogen of algae, reed, and mussels
respectively
Hd = heating demand of an average Swedish household
Hb = Number of Swedish average households that annually can be heated from the energy
benefit of biomass corresponding to one tonne of nitrogen
Chapter 2.5
hday = hours per working day
νi= hectares harvested per hour of algae, and reed respectively
νday_i= hectares harvested per day of algae, and reed respectively
ξi = tonnes of wet weight harvested per hour of algae, and reed respectively
ξdw_reed = tonnes of dry weight per hectare of reed

65
ξday_i = tonnes of wet weight harvested per day of algae, and reed respectively
ξN_i = tonnes of nitrogen harvested per day of algae, and reed respectively
Chapter 2.5.1
Ers2000 = Energy demand per working day with RS 2000
Eww_i = Energy demand per tonne algal, reed, and mussel wet weight harvested
respectively
Chapter 2.5.2
El-l = Energy demand from harvest of a long-line mussel farm including transport
ξl-l = tonnes of mussel wet weight per long-line mussel farm
ξl-l_N = Tonnes of nitrogen harvested per long-line musself farm
EN_i = energy demand to harvest biomass corresponding to one tonne nitrogen of
algae, reed, and mussels respectively
Chapter 2.6
ρww =Dry weight of 30 % transformed to its corresponding wet weight
ς_i = Energy demand from transporting biomass per tonne a distance of 10 km, and 100
km respectively
ς = energy demand per tonne of dry weight per km
ςs = energy demand as share of energy content
ςN _ij = Energy demand from transport biomass (i.e. of algae, reed, and mussels
respectively) corresponding to one tonne of nitrogen 10 km and 100 km respectively
Chapter 2.7
Deh = energy demand from electricity and heating in the biogas process as share of energy
content of biogas produced
Deh_i = energy demand from heating and electricity in the biogas process of biomass of
algae, reed, and mussels corresponding to one tonne of nitrogen respectively

66
Chapter 2.8
Eb = Energy balance excluding energy demand from transport
Eb_i = Energy balance including transport distance of 10 km, and 100 km respectively
Hb_ij = Number of Swedish households that can be heated from positive net energy
benefits from energy balances including transport distances of 10 km and 100 km (i.e.
where i = 10 km and 100 km and j = algae, reed, and mussels)
Chapter 2.9
Dnet = The distance that biomass can be transported before its positive net energy benefit
is consumed
ςN _1km = energy demand from transportation of biomass per km
Chapter 2.10
Hieb = The number of average Swedish households that annually can be heated from
indirect energy benefits from biomass corresponding to one tonne of nitrogen
Ebi = Energy demand for production of artificial fertilizer per kg nitrogen, and phosphorus
respectively
Chapter 2.11
D = CO2 discharge from an oil heated household
Db_i = The CO2 discharge when net energy benefits from biogas production of biomass
corresponding to one tonne of nitrogen, Eb_i, as deduced above, replaces oil heating of
Swedish average households (i.e. where i = algae, reed, and mussels).


TRITA-IM 2009:08 ISSN 1402-7615 Industrial Ecology, Royal Institute of Technology www.ima.kth.se