Embed Size (px)
Citation preview
Unit 1: Basic Economic Concepts
1
REVIEW 1. Explain relationship between scarcity and choices2. Differentiate between price and cost 3. Differentiate between consumer and capital goods4. Give examples of each of the 4 Factors of
Production5. Define tradeoffs 6. Define opportunity cost7. Name 10 different teachers at SHS.
2
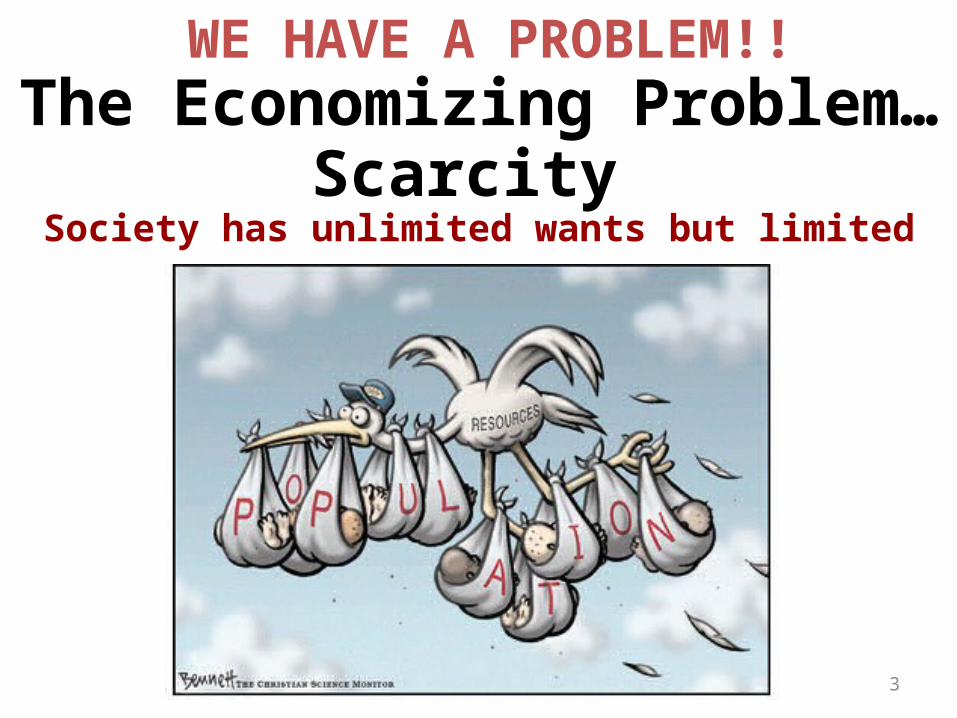
Society has unlimited wants but limited resources
The Economizing Problem…Scarcity
WE HAVE A PROBLEM!!
3
The Production Possibilities Curve
(PPC)Using Economic Models…
Step 1: Explain concept in wordsStep 2: Use numbers as examplesStep 3: Generate graphs from numbersStep 4: Make generalizations using graph
4
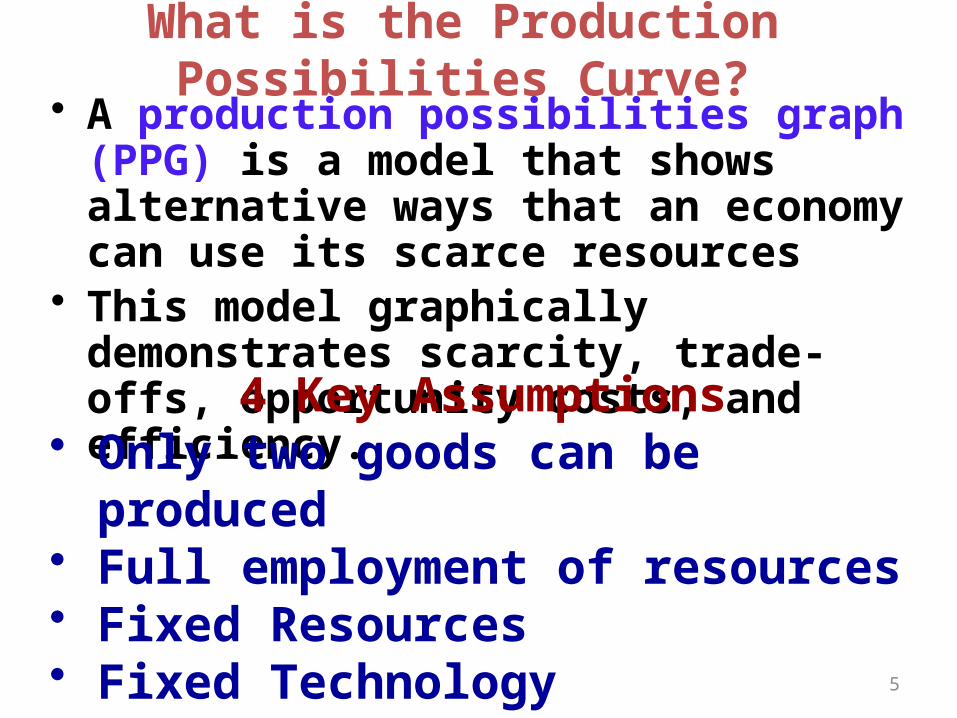
What is the Production Possibilities Curve?• A production possibilities graph (PPG) is a
model that shows alternative ways that an economy can use its scarce resources
• This model graphically demonstrates scarcity, trade-offs, opportunity costs, and efficiency.
4 Key Assumptions• Only two goods can be produced • Full employment of resources• Fixed Resources• Fixed Technology
5
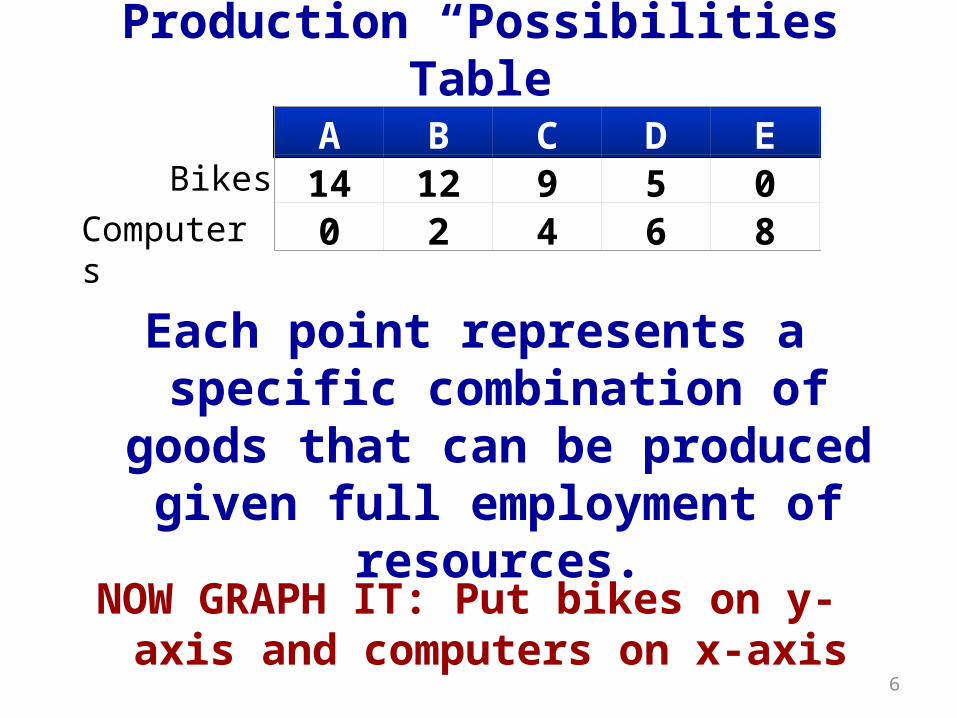
A B C D E f14 12 9 5 0 00 2 4 6 8 10
Bikes
Computers
NOW GRAPH IT: Put bikes on y-axis and computers on x-axis
Production “Possibilities” Table
Each point represents a specific combination of goods that can be
produced given full employment of resources.
6
Bik
es
Computers
14
12
10
8
6
4
2
0
0 2 4 6 8 10
A
B
C
D
E
G
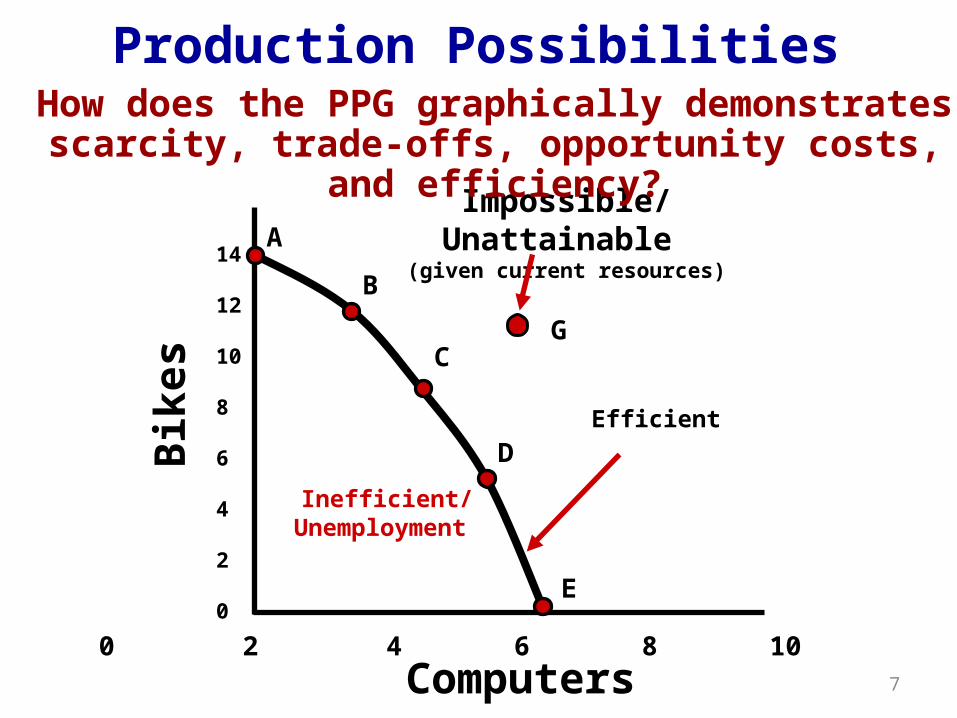
Inefficient/ Unemployment
Impossible/Unattainable (given current resources)
Efficient
Production PossibilitiesHow does the PPG graphically demonstrates scarcity,
trade-offs, opportunity costs, and efficiency?
7
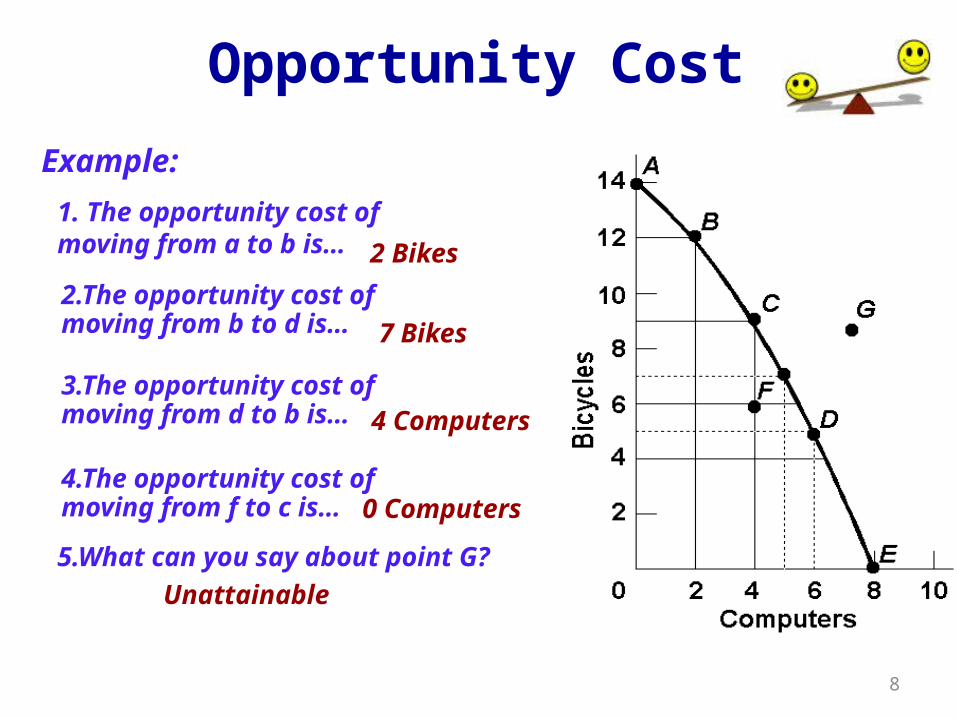
2 Bikes
2.The opportunity cost of moving from b to d is…
4.The opportunity cost of moving from f to c is…
3.The opportunity cost of moving from d to b is…
7 Bikes
4 Computers
0 Computers
5.What can you say about point G?
Unattainable
1. The opportunity cost of moving from a to b is…
Example:
Opportunity Cost
8
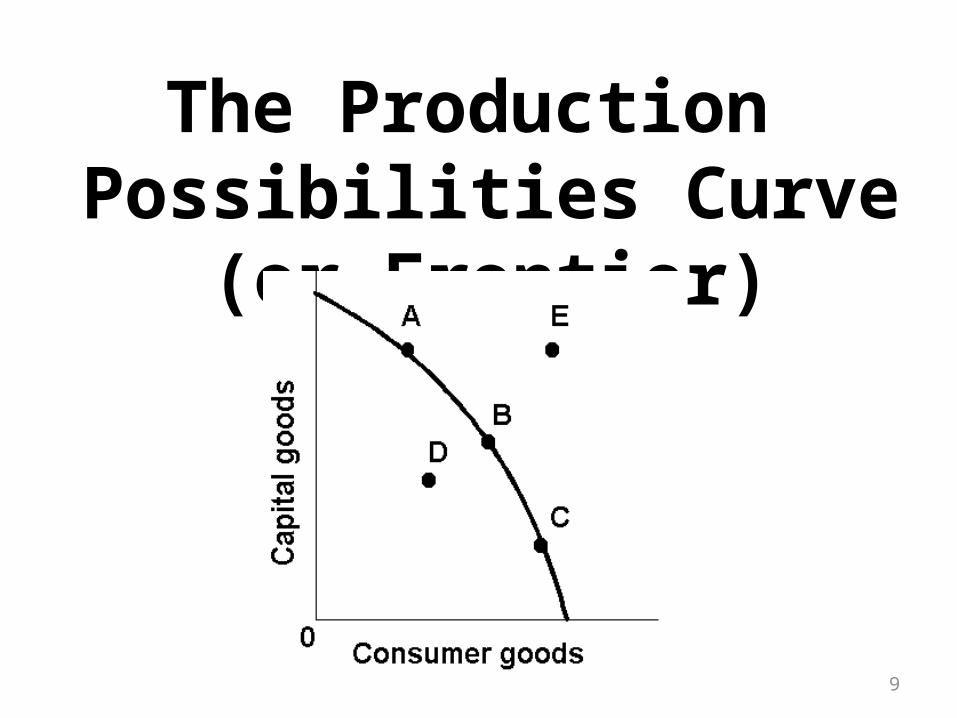
The Production Possibilities Curve (or Frontier)
9
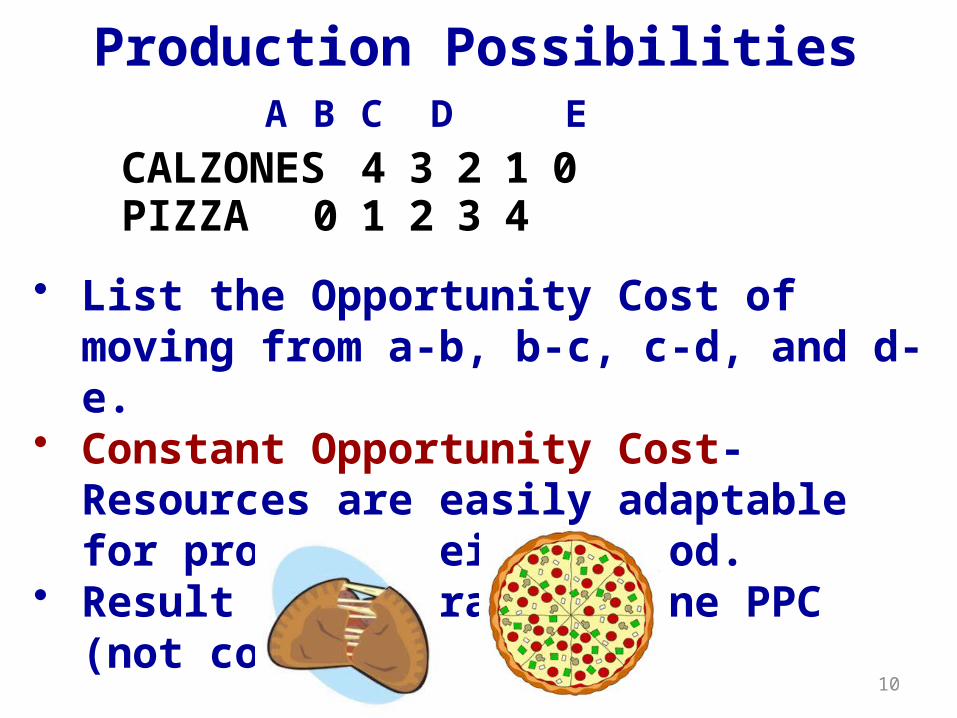
PIZZA 0 1 2 3 4CALZONES 4 3 2 1 0
• List the Opportunity Cost of moving from a-b, b-c, c-d, and d-e.
• Constant Opportunity Cost- Resources are easily adaptable for producing either good.
• Result is a straight line PPC (not common)
Production PossibilitiesA B C D E
10
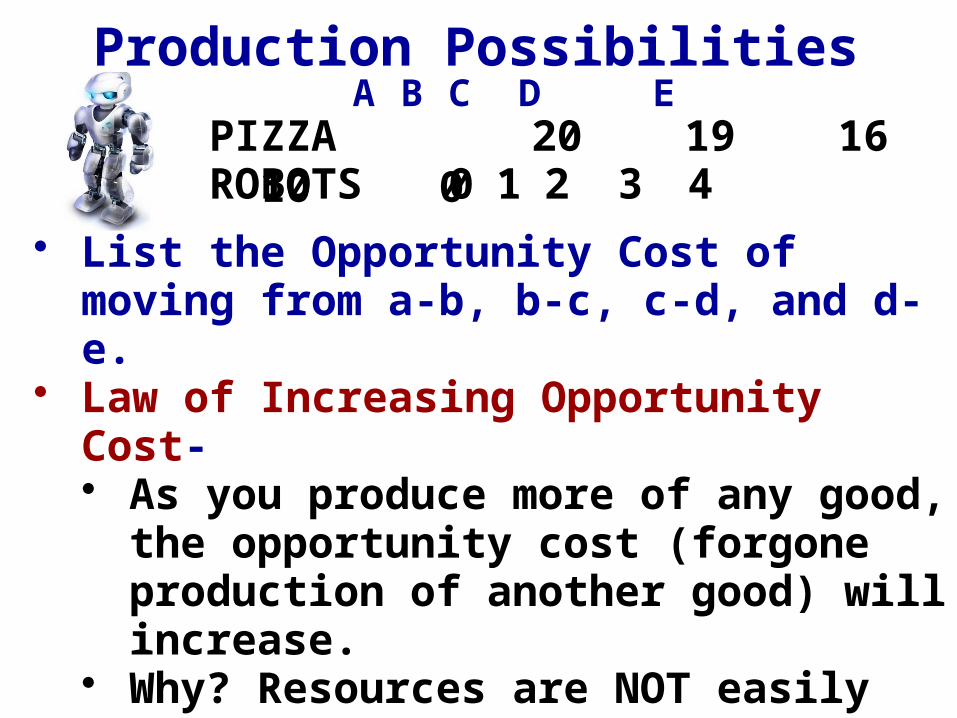
PIZZA 20 19 16 10 0ROBOTS 0 1 2 3 4
• List the Opportunity Cost of moving from a-b, b-c, c-d, and d-e.
• Law of Increasing Opportunity Cost-• As you produce more of any good, the
opportunity cost (forgone production of another good) will increase.
• Why? Resources are NOT easily adaptable to producing both goods.
• Result is a bowed out (Concave) PPC
A B C D EProduction Possibilities

Paul Solman Video
Production Possibilities
12
Shifting the Production Possibilities Curve
13
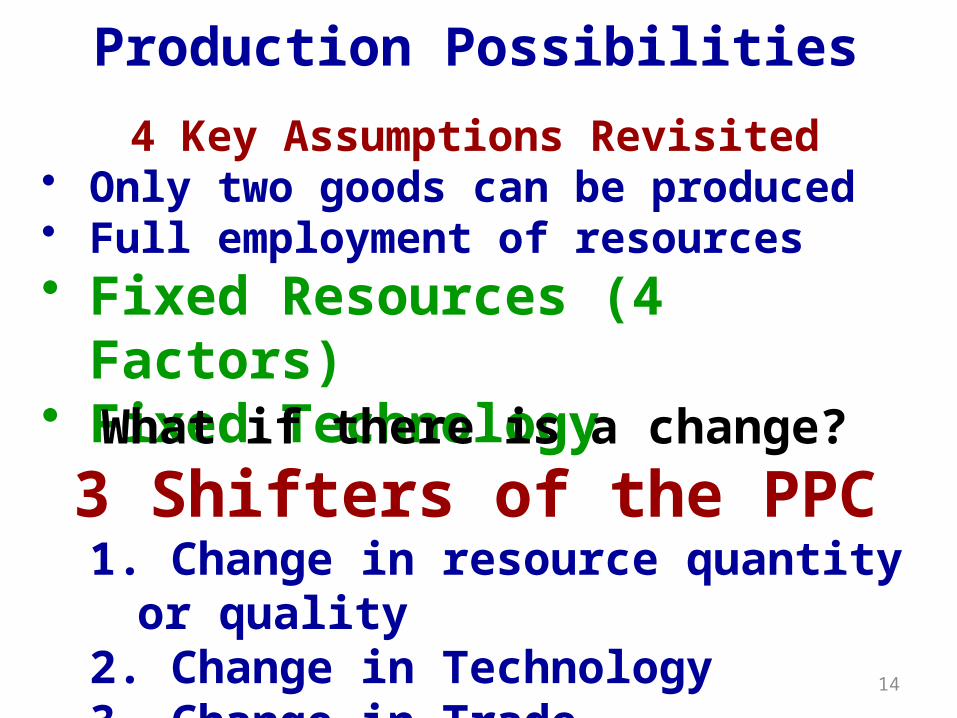
4 Key Assumptions Revisited• Only two goods can be produced • Full employment of resources• Fixed Resources (4 Factors)• Fixed Technology
What if there is a change?
3 Shifters of the PPC1. Change in resource quantity or quality 2. Change in Technology3. Change in Trade 14
Production Possibilities
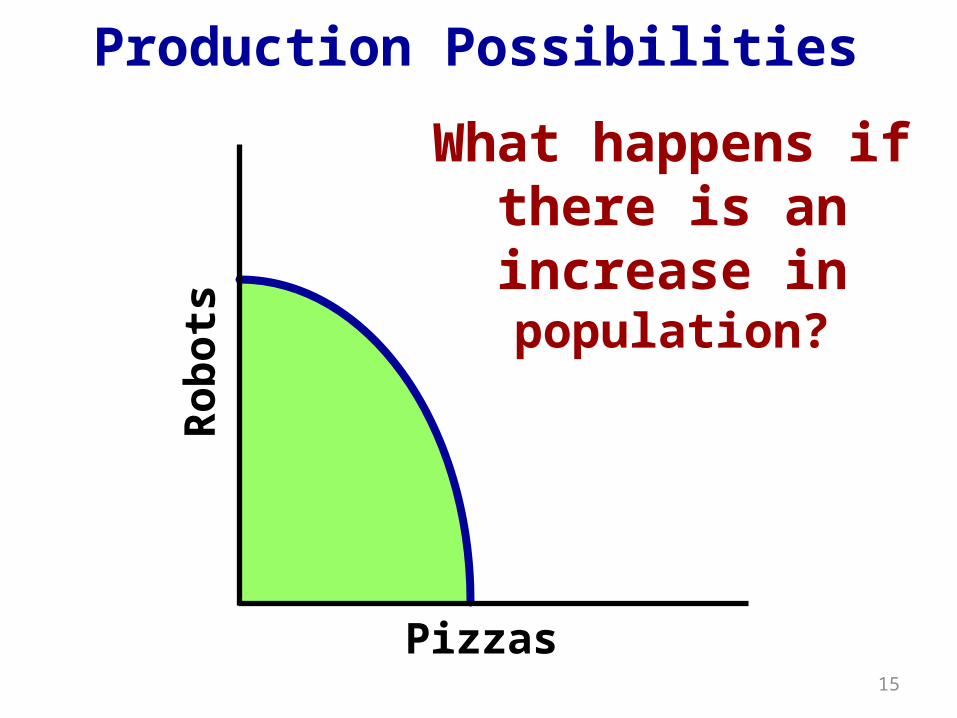
Ro
bo
ts
Pizzas
What happens if there is an increase
in population?
15
Production Possibilities
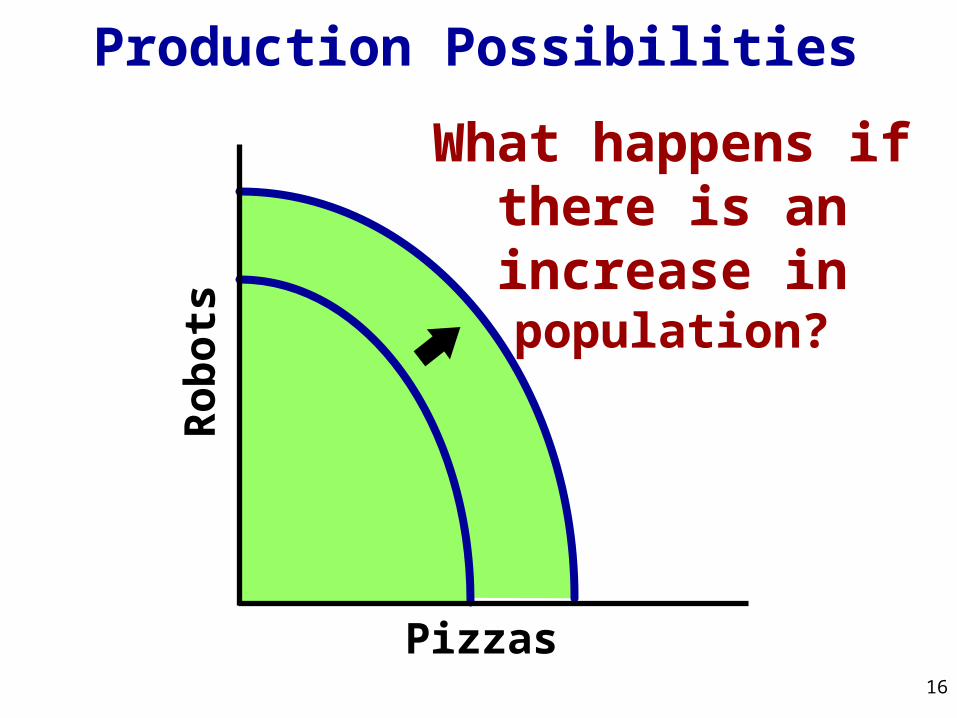
Ro
bo
ts
Pizzas
What happens if there is an increase
in population?
16
Production Possibilities
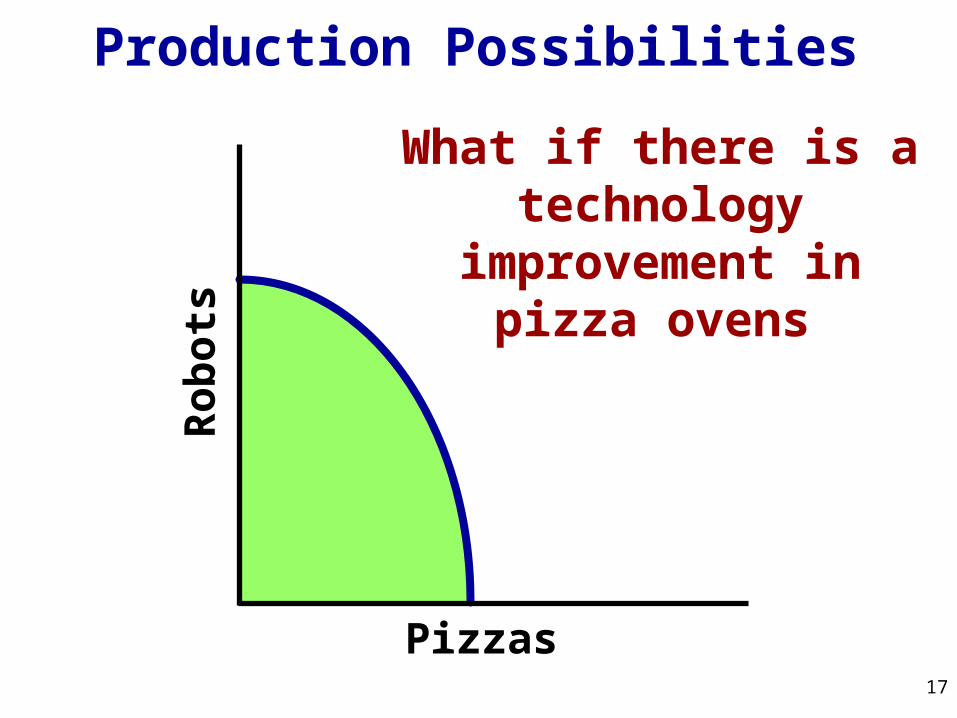
Ro
bo
ts
Pizzas
What if there is a technology improvement
in pizza ovens
17
Production Possibilities
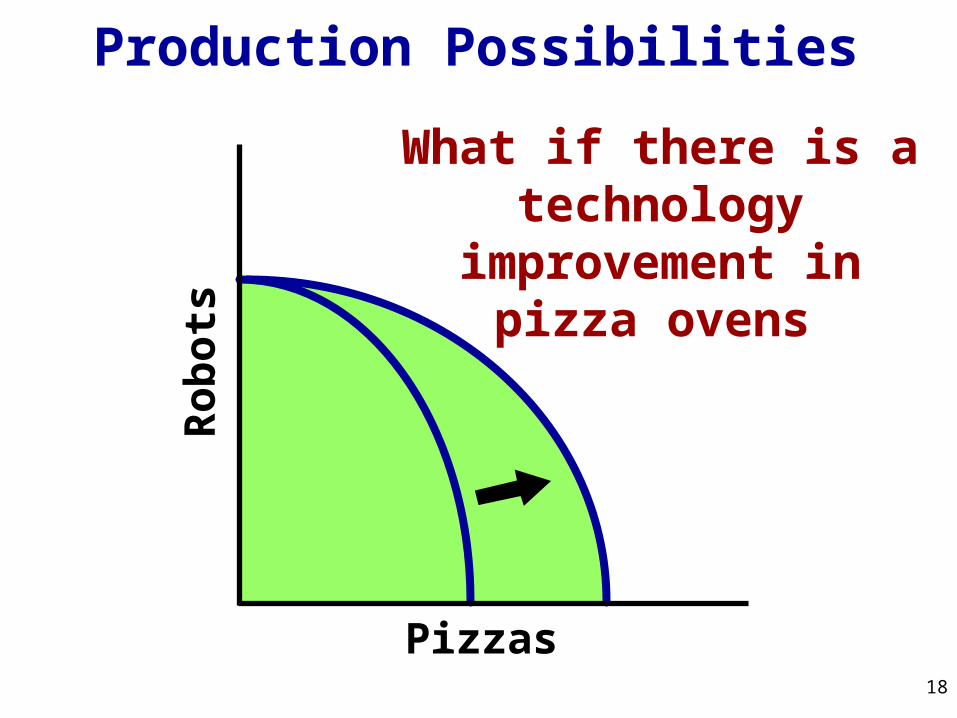
Ro
bo
ts
Pizzas
What if there is a technology improvement
in pizza ovens
18
Production Possibilities
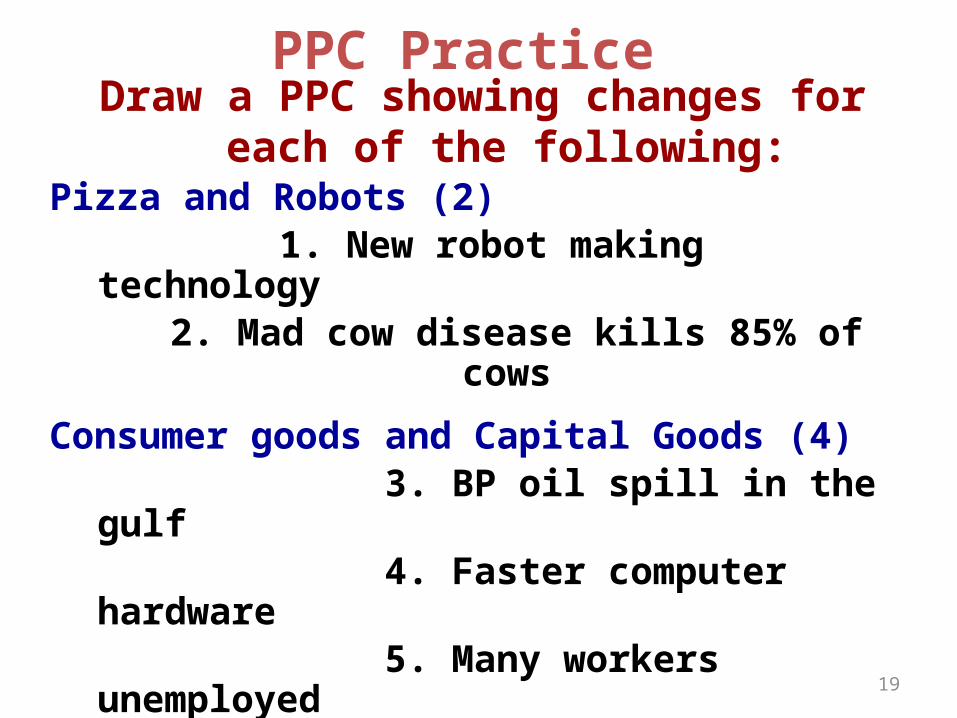
PPC PracticeDraw a PPC showing changes for each of the
following:Pizza and Robots (2)
1. New robot making technology 2. Mad cow disease kills 85% of cows
Consumer goods and Capital Goods (4) 3. BP oil spill in the gulf 4. Faster computer hardware 5. Many workers unemployed 6. Significant increases in education
19
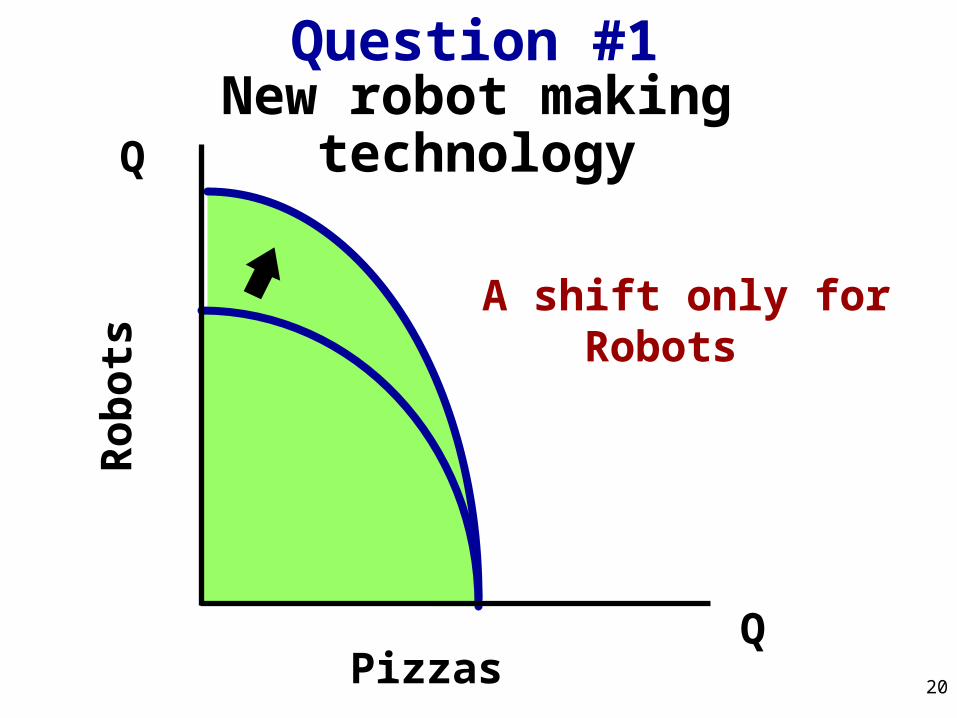
New robot making technologyQ
Q
Ro
bo
ts
Pizzas
Question #1
20
A shift only for Robots
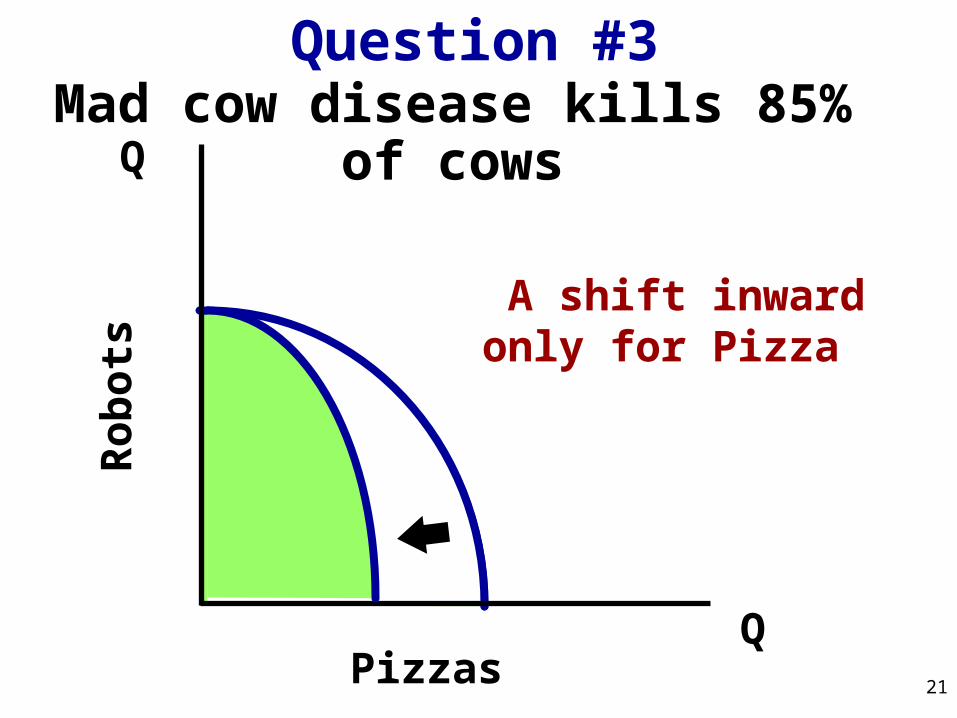
Mad cow disease kills 85% of cowsQ
Q
Ro
bo
ts
Pizzas
Question #3
21
A shift inward only for Pizza
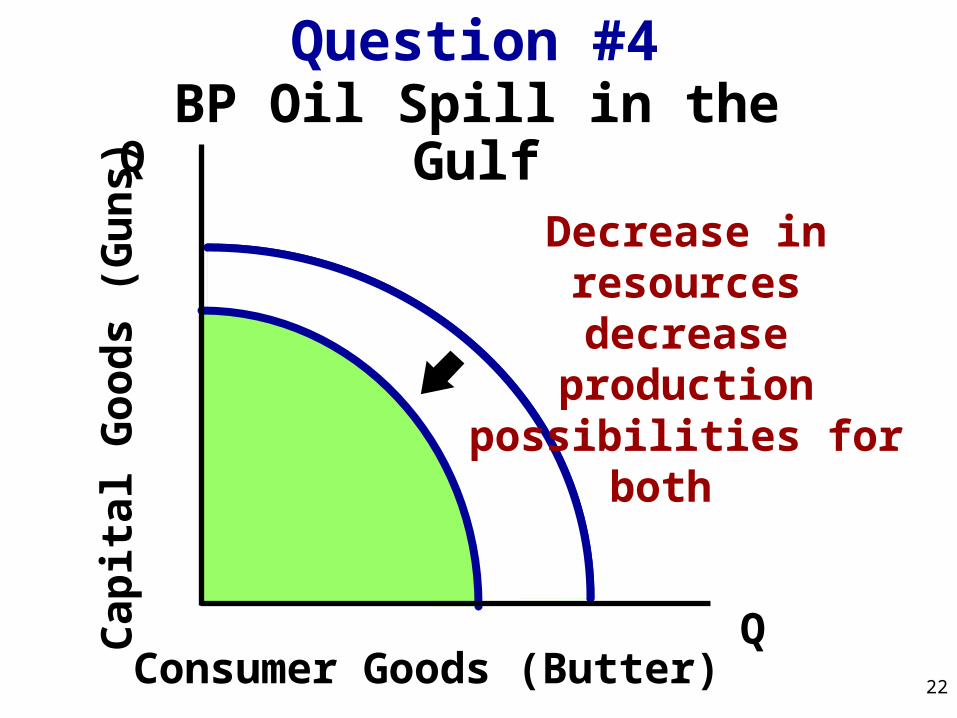
BP Oil Spill in the GulfQ
Q
Cap
ital
Go
od
s (G
un
s)
Consumer Goods (Butter)
Question #4
22
Decrease in resources decrease production
possibilities for both
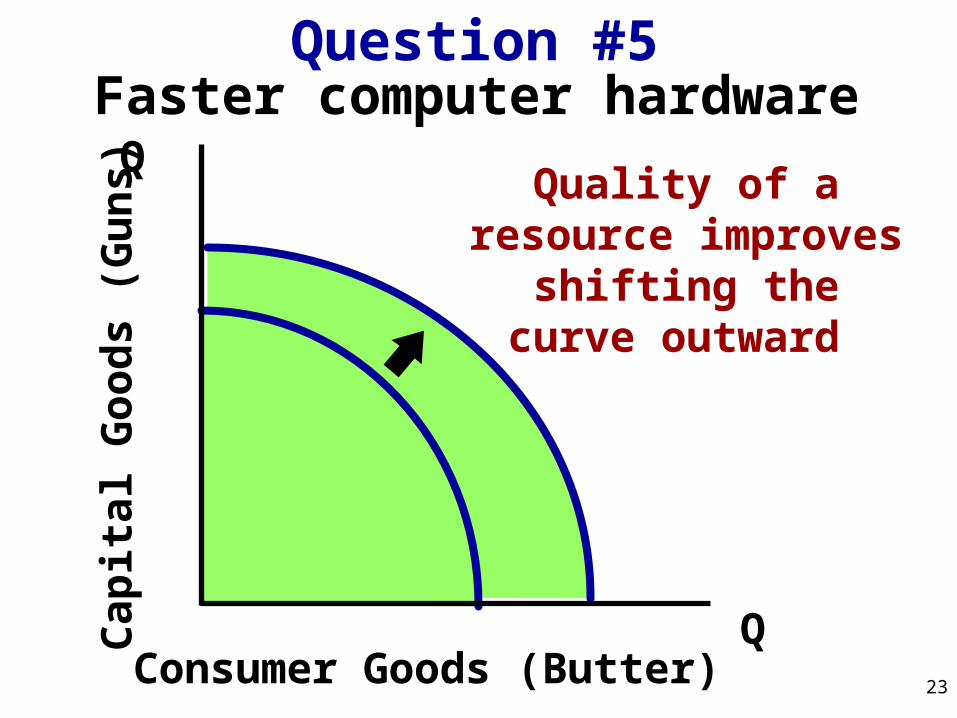
Faster computer hardwareQ
Q
Cap
ital
Go
od
s (G
un
s)
Consumer Goods (Butter)
Question #5
23
Quality of a resource improves shifting the
curve outward
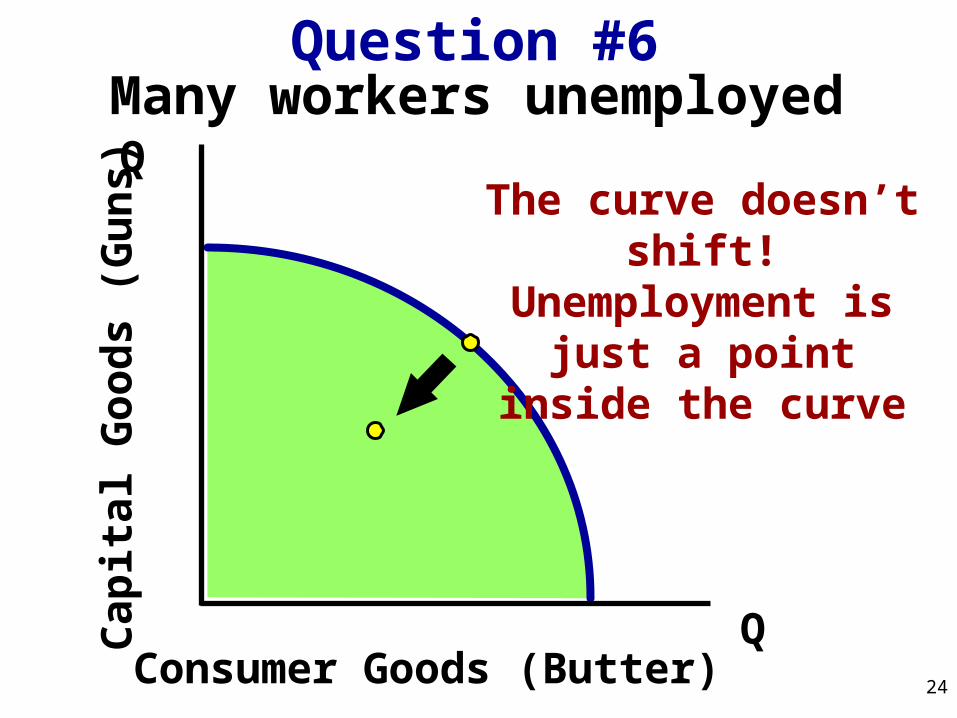
Many workers unemployedQ
Q
Cap
ital
Go
od
s (G
un
s)
Consumer Goods (Butter)
Question #6
24
The curve doesn’t shift!Unemployment is just a point inside the curve
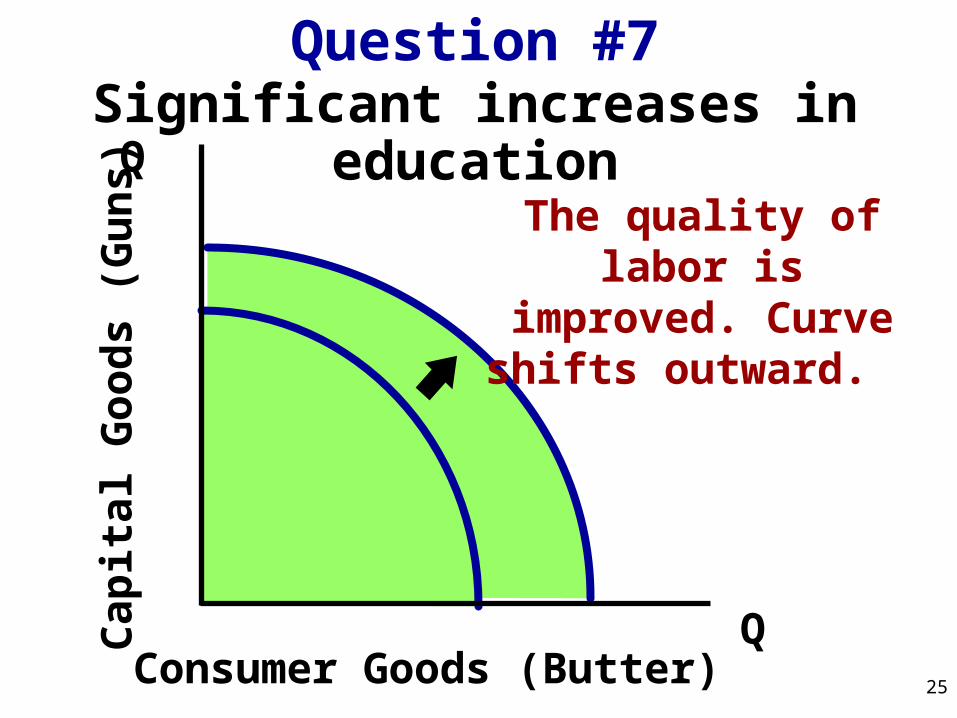
Significant increases in educationQ
Q
Cap
ital
Go
od
s (G
un
s)
Consumer Goods (Butter)
Question #7
25
The quality of labor is improved. Curve shifts
outward.