Embed Size (px)
Citation preview
CBD
Distr. GENERAL UNEP/CBD/MCB/EM/2014/4/INF/2 5 September 2014 ENGLISH ONLY
EXPERT WORKSHOP TO PROVIDE CONSOLIDATED PRACTICAL GUIDANCE AND A TOOLKIT FOR MARINE SPATIAL PLANNING
Montreal, 9-11 September 2014
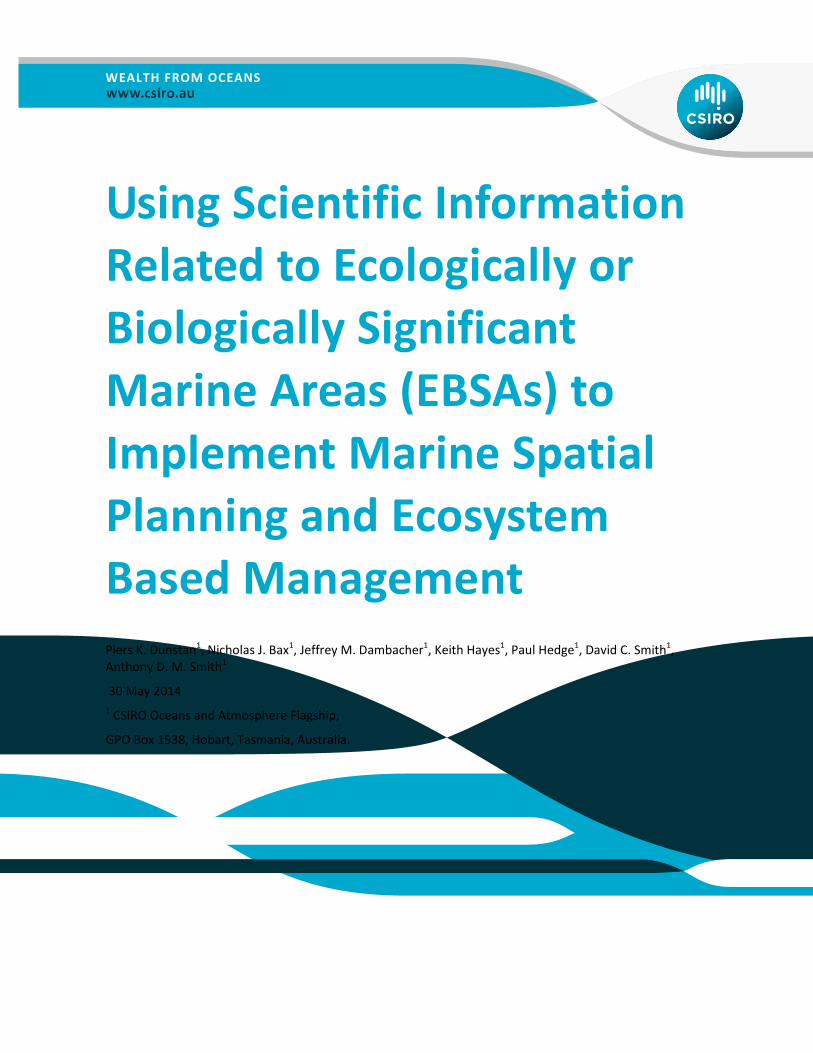
USING SCIENTIFIC INFORMATION RELATED TO ECOLOGICALLY OR BIOLOGICALLY SIGNIFICANT MARINE AREAS (EBSAS) TO IMPLEMENT MARINE SPATIAL PLANNING AND ECOSYSTEM BASED MANAGEMENT
Note by the Executive Secretary
1. The Executive Secretary is circulating herewith a document submitted by the Commonwealth Scientific and Industrial Research Organisation (CSIRO) of Australia, as a background information for the participants at the Expert Workshop to Provide Consolidated Practical Guidance and a Toolkit for Marine Spatial Planning. .
2. The document is being made available in the form and language in which it was received by the Secretariat.
WEALTH FROM OCEANS
Using Scientific Information Related to Ecologically or
Biologically Significant Marine Areas (EBSAs) to Implement Marine Spatial Planning and Ecosystem Based Management
Piers K. Dunstan1, Nicholas J. Bax1, Jeffrey M. Dambacher1, Keith Hayes1, Paul Hedge1, David C. Smith1, Anthony D. M. Smith1
30 May 2014
1 CSIRO Oceans and Atmosphere Flagship,
GPO Box 1538, Hobart, Tasmania, Australia.

Citation
Piers K. Dunstan, Nicholas J. Bax, Jeffrey M. Dambacher, Keith Hayes, Paul Hedge, David C. Smith, Anthony D. M. Smith (2014) Using Scientific Information related to Ecologically or Biologically Significant Marine Areas (EBSAs) to Implement Marine Spatial Planning and Ecosystem Based Management. CSIRO, Australia.
Copyright and disclaimer
© 2014 CSIRO To the extent permitted by law, all rights are reserved and no part of this publication covered by copyright may be reproduced or copied in any form or by any means except with the written permission of CSIRO.
Important disclaimer
CSIRO advises that the information contained in this publication comprises general statements based on scientific research. The reader is advised and needs to be aware that such information may be incomplete or unable to be used in any specific situation. No reliance or actions must therefore be made on that information without seeking prior expert professional, scientific and technical advice. To the extent permitted by law, CSIRO (including its employees and consultants) excludes all liability to any person for any consequences, including but not limited to all losses, damages, costs, expenses and any other compensation, arising directly or indirectly from using this publication (in part or in whole) and any information or material contained in it.

3
1 Abstract
The 194 Parties to the Convention on Biological Diversity (CBD) agreed in 2008 on the need to identify Ecologically or Biologically Significant Marine Areas (EBSAs) in the world’s oceans to focus future conservation and management efforts. In 2010, the Parties instructed the CBD Secretariat to initiate a series of regional workshops to facilitate the description of areas meeting at least one of 7 “scientific criteria for identifying EBSA in need of protection”. By March 2014, 9 workshops had, by consensus, described 207 areas meeting the EBSA criteria in approximately 68% of the world’s oceans. The workshops comprised experts nominated by more than 100 governments and a similar number of regional and global non government and intergovernmental organisations. Each workshop has been supported by a technical team which provided collated data on the region and mapping expertise during the workshop. A clear and agreed framework is required to start the dialogue between policy makers, stakeholders, scientists and the public. We review a suite of the existing MSP, EBM, fisheries and conservation frameworks to determine their common elements and suggest how they can be synthesised. We propose an adaptive hierarchical approach that takes key elements from existing frameworks and show how it can be applied within national jurisdictions and in areas beyond national jurisdiction. The adaptive hierarchical process encourages early implementation of MSP/EBM using available scientific knowledge and governance and supports the gradual progress to more complex and information rich structures as needed and appropriate. The EBSA process provides a sound basis for developing the scientific advice to support national and international management of the world’s oceans by identifying marine systems and the criteria for which they are valued by regional experts

2 Introduction
Since November 2011, the Convention on Biological Diversity (CBD) has embarked on a series of workshops to facilitate the description of areas meeting the criteria for Ecologically or Biologically Significant Marine Areas (EBSAs) in the world’s oceans. The primary genesis for this work began as an output of CBD workshops in 2005 and 2007 aimed at developing “scientific criteria for identifying ecologically or biologically significant marine areas in need of protection”. These criteria were adopted by the 9th meeting of the CBD Conference of Parties (COP). At the 10th meeting of the CBD COP, Parties noted that the application of the ecologically or biologically significant areas (EBSA) criteria is a scientific and technical exercise and that the selection of conservation and management measures in areas meeting the EBSA criteria is a matter for States and competent intergovernmental organizations, in accordance with international law, including the United Nations Convention on the Law of the Sea.1 At COP 10, Parties also instructed the Secretariat of the CBD to organise regional workshops to facilitate the description of areas meeting the EBSA criteria in support of the efforts of governments and relevant organizations in identifying EBSAs.2 The initial motivation for these efforts can be traced back to the United Nations Conference on Environment and Development (the Rio “Earth Summit”; 1992) and Johannesburg Plan of Implementation (JPOI; 2002) and were motivated by concerns of increasing activity in marine areas beyond national jurisdiction and the need to improve conservation and sustainable use. What is apparent is that the process has been largely driven from a conservation perspective. It is worth asking if this exclusive focus can be extended to meet the dual objectives of the CBD to achieve biodiversity conservation and sustainable use?
The first EBSA workshop was held in the Western South Pacific in November 2011. Since then, there have been 8 additional workshops, covering approximately 68% of the world’s oceans. The workshops comprise experts nominated by the governments from within the regions and experts nominated by regional and global non‐governmental and intergovernmental organisations. Each workshop has been supported by a technical team who provide collated data on the region and mapping expertise during the workshop (Dunn et al. 2014). Areas are nominated at the workshops by consensus, with all experts able to express opinions on the scientific information presented. There have been 207 areas described as meeting the EBSA criteria, with 62 of them either wholly or partly in areas beyond national jurisdiction (ABNJ). EBSAs are categorized against all of the EBSA criteria, but need only meet at least one of the criterion. EBSAs have been described for an enormous diversity of areas, from large scale oceanographic features (e.g., Pacific high productivity area and the Bengula current), individual seamounts (e.g., atlantis seamount in the southern Indian Ocean), spawning areas (e.g., Southern Blue Fin Tuna spawning grounds), areas of high diversity (e.g., Archipel des Bijagos, Guinée‐Bissau), and foraging ground for seabirds (e.g., Clipperton Fracture Zone Petrel Foraging Area). A complete summary of the first 6 workshops can be found in UNEP/CBD/SBSTTA/17/6.
As noted previously, the original motivation for the CBDs work on EBSAs was to identify areas in need of protection in open ocean and deep‐sea areas (Dunn et al. 2014). This was to help meet Aichi Target 11, to have 10% of the world’s oceans conserved through effectively and equitably managed, ecologically representative and well connected systems of protected areas and other effective area‐based conservation measures by 2020. To date most emphasis has been made toward meeting the 10% target using Marin Protected Areas (MPAs), with relatively little consideration of other effective area‐based conservation approaches included in Target 11. Moreover, there has been little consideration of how progress on Target
1 Decision X/29 of the Conference of the Parties to the CBD 2 Ibid

5
11 could be linked with Target 6, which has the goal of achieving sustainably managed fisheries using ecosystem based approaches by 2020. Recent analyses of the effectiveness of MPAs suggest that, unless certain criteria are met (i.e., no‐take, old MPAs, large MPAs, isolated and well enforced), there will be little difference in the diversity inside and outside MPAs (Edgar et al. 2014). This leads to two possible conclusions, either more effort needs to be taken to make MPAs meet the criteria above (including retrofitting existing ones found to be inadequate), or that MPAs are ineffective in some circumstances and other more effective area‐based tools are needed. In many circumstances, MPAs alone will not be adequate alone in addressing ecosystem health and biodiversity conservation and, as is the case with fisheries, an integrated strategy of management levers is more appropriate (Fulton et al. 2014).
One difficulty in evaluating whether MPAs are effective as required under Target 11, is that despite MPAs often having well articulated high‐level objectives (e.g., the conservation of marine biodiversity), it is much rarer to find MPAs with clearly defined operational objectives that are linked to management actions and monitoring (e.g., increase coral cover by 50% by 2020) (Kemp et al. 2012; Stelzenmuller et al. 2013). In fisheries, a long‐term history of declining stocks (FAO 2011) have lead to the understanding that operational objectives and associated monitoring are critical to determining management interventions, while an ecosystem based approach is essential for the longer term viability of target stocks and the resources that they depend on. Over the last decade, there have been numerous management frameworks proposed to help deal with marine conservation and fisheries management and to reduce conflict with other marine industries. Marine Spatial Planning (MSP) and Ecosystem Based Management (EBM) are two of the key unifying ideas of many of these frameworks.
The needs of governments and competent organisations are broader than just protection. Despite the increasing proportions of the globe in protected areas, marine biodiversity continues to decline (Marris 2011, Marvier et al 2011, Butchart et al 2012). There are a variety of causes for this continued decline, but the implication (though controversial) is that it is insufficient to conserve nature independently of development. Instead, conservation should be part of development with many assets conserved in a managed environment and not only set aside for preservation in a pristine state. In terms of the Aichi targets this suggests that effective marine conservation will require achieving both Targets 6 and 11.
Effective management objectives, cumulative impact assessment and monitoring are difficult for “single sector” MPAs or fisheries, and they are significantly more difficult for multi‐sector EBM or MSP. A clear framework is required, but the multiplicity of frameworks present a complicated pathway forward for management. Here, we review a suite of the existing MSP, EBM, fisheries and conservation frameworks to determine their common elements and propose an adaptive hierarchical approach to meet the key objectives. We will review and suggest how they can be synthesised. We propose a framework that takes key elements from other frameworks and shows how it can be applied by States and competent intergovernmental organizations. We show how a shared approach across different agencies can lead to improved sustainable use and conservation. We propose an adaptive hierarchical process that allows beginning implementation of MSP/EBM based on existing scientific knowledge and management processes and allows gradual progress to more complex and information rich processes where needed and appropriate.

3 Elements of Marine Spatial Planning and Ecosystem Based Management
Since the beginning of the current century, concepts of ecosystem based management, marine spatial planning, adaptive management and the precautionary principle have become established in the scientific literature. However, practical examples of implementation are less common. These ideas have two separate beginnings, coming independently from fisheries and conservation sciences. The development of an ecosystem approach to fisheries can be traced back hundreds of years (Caddy and Cochrane 2001), but only in recent decades has the necessity of an ecosystem approach that balances ecological, social, economic and political imperatives been acknowledged (Smith et al. 2007). The most important changes that has occurred in fisheries in the last 100 years has been the agreement and ratification of the United Nations Convention on the Law of the Sea, and the subsequent agreement on highly migratory species (the United Nations Agreement for the Implementation of the Provisions of the United Nations Convention on the Law of the Sea of 10 December 1982 relating to the Conservation and Management of Straddling Fish Stocks and Highly Migratory Fish Stocks, also known as the “UN Fish Stocks Agreement”). These agreements gave states the jurisdiction to manage fisheries within their exclusive economic zones and set the framework for the establishment of regional fishery bodies to manage high seas fisheries at the regional level. Despite some successes, many stocks remain overexploited (Caddy and Cochrane 2001, Worm et al. 2009, FAO 2011).
Similar ideas have been evolving in conservation science, starting with the World Conference on Human Environment (1972), and progressing through the United Nations Conference on Environment and Development (the Rio “Earth Summit”, 1992) and the World Summit on Sustainable Development (2002). These conferences lead to the establishment of the Convention on Biological Diversity, leading to the Aichi targets and the eventual target of 10% of marine areas in effectively managed marine protected areas or other forms of effective spatial management. These ideas have resulted in pushes for large scale networks of marine protected areas, using a variety of frameworks and decision support tools.
Both ecosystem based management and marine spatial planning are encompassed with an ecosystem approach as described jointly the SCBD (Secretariat of the Convention on Biological Diversity) (2004) and FAO (Garcia et al. 2004). An ecosystem based approach to management allowing for multiple use using EBSA should also encompasses concepts around Marine Spatial Planning. EBSA are identified within Ehler and Douvere (2009) as key components of MSP. Ehler and Douvere (2009) describe MSP as the spatial component of EBM. EBM will encompass a broader range of possible tools that may not necessarily be spatial (eg Individually Transferable Quotas (ITQ), gear controls, conditional permitting of activities, discharge controls), but even non‐spatial tools will have a spatial component due to limits to maritime jurisdictions. Thus, existing examples of MSP and EBM have both spatial and non‐spatial components (eg Day 2002, Olsen et al. 2007).
In order to understand how MSP and EBM are organised and implemented between different jurisdictions, we conducted a review of the more commonly cited MSP and EBM implementation guidelines or frameworks. We find that guides share a suite of common elements that can be expanded or collapsed to meet different aspiration and operational objectives. MSP and EBM can cover a wide range of approaches and scenarios. It can be modified to meet different needs and different levels of capacity. There are numerous guides and frameworks to implementing EBM and MSP.

7
Curtin and Prellezo (2010) reviewed a wide range of potential EBM frameworks and applications. They make a number of important points. They note that adaptive management is key to managing systems that are unlikely to ever be fully understood. Ecosystem based management is a central aspect of dealing with cumulative impacts and is fundamentally geographically based. The incorporation of social and economic spheres is a key component of successful implementation of EBM. Irrespective of the framework they emphasise that implementation must be incremental and collaborative. It is also important to note that many of the examples of EBM used by the authors are also used as examples of MSP in other publications (eg the Great Barrier Reef).
Integrated Ecosystem Assessment (IEA) has been proposed as a “framework for organizing science in order to inform decisions in marine EBM at multiple scales and across sectors” (Levin et al. 2009). The framework described by Levin et al. 2009 has 5 steps; Scoping, Indicator Development, Risk Analysis, Management Strategy Evaluation and Monitoring and Evaluation. The first step, “Scoping”, involves the identification of ecosystem objectives and threats. This step involves the identification of sub‐systems most relevant to management. The next step is the identification and validation of indicators of ecosystem state. The third step is risk analysis to evaluate the risk to the indicators posed by human activities and natural processes. The fourth step involves the use of ecosystem modelling frameworks to conduct management strategy evaluation. The final step is the monitoring and evaluation of management interventions using indicators.
Systematic conservation planning (SCP) takes a conservation‐based approach and identifies an 11 stage framework for conservation planning (Pressey and Bottrill 2009). This framework was itself derived from various other attempts to synthesise a variety of other conservation approaches (Gordon et al. 2005, Bottrill et al. 2006, Redford et al. 2003). The first four stages identify and engage key stakeholders and scope cost and goals. The next two stages (5 and 6) are scientific steps relating to the identification of data on threats, socio‐economic values and biodiversity. The 7th to 10th steps are management stages focused on the assessment of current and proposed objectives and the identification of new conservation areas. The 11th stage is focused on review and monitoring. This is intended to be an iterative process to ensure that the goals and objectives are being met.
Marine Spatial Planning (Douvere et al. 2007, Douvere 2008, Ehler and Douvere 2009) is designed to offer countries an operational framework to balance the needs of biodiversity conservation with the needs of sustainable development. Ehler and Douvere (2009) suggest that achieving this balance is one of the key components of any EBM approach. Originally derived from ideas originating from experience in zoning the Great Barrier Reef Marine Park (Day 2002), it has been extended to encompass a more diverse suite of sectors. The approach identifies 10 steps, with steps 1 to 4 identifying stakeholders and financial support, steps 5 and 6 examining past and future conditions, steps 7 and 8 on developing and implementing a spatial management plan and steps 9 and 10 to monitor and adapt. Ehler and Douvere (2009) emphasis that the process is not linear and has many feedback loops and is not designed to replace single sector management but rather to complement it.
The FAO Ecosystem Approach to Fisheries (EAF) outlines a number of key steps, with key activities identified within each step. The EAF tool box (Fletcher and Bianchi 2014, FAO 2014) identifies four key steps with between two and four tasks within each step. The first focuses on planning, scoping, stakeholder engagement and identifying objectives. The second on identification of assets and priorities, including risk assessment. The third step focuses on management, including operational objectives, indicators and management options. The final step is monitoring and performance reviews. As part of the formal monitoring and evaluation, the performance of management at meeting the operational objectives is continually updated.

Of direct relevance to the framework developed in this paper are the fisheries adaptive management cycle and hierarchical or tier‐based risk assessments. Australia has implemented a harvest strategy policy for commonwealth (federal) fisheries that follows a typical adaptive management cycle (Smith et al. 2007, Smith et al. 2008, Smith et al. 2014). A harvest strategy specifies the monitoring program, the indicators to be calculated from monitoring data (via an assessment) and use of those indicators in management decisions (through decision rules) to achieve the fishery management objectives.
The Ecological Risk Assessment for the Effects of Fishing (ERAEF) is a hierarchical risk assessment framework that allows for the prioritisation of monitoring, assessment and management intervention for species that are at risk to the effects of fishing (Hobday et al. 2011). The framework has several tiers or levels from qualitative (Level 1) to fully quantitative (Level 3). Level 1 allows low risk species to be identified relatively easily and cost effectively, allowing time and resources to be directed to higher risk species at higher levels in the framework. The approach has been adopted by the Marine Stewardship Council and is one of the tools identified by the FAO‐EAF toolbox.

9
Concepts linking each framework
IEA MSP AFMA Harvest Strategy SCP FAO EAF
1. The need for scoping and stakeholder engagement
Scoping Identifying need and establishing authority
Obtaining financial support
Organizing the process through pre‐planning
Organizing stakeholder participation
Scoping, Stakeholder engagement and RAGs
Scoping & costing the planning process
Identifying & involving stakeholders
Describing the context for conservation area
Identifying conservation goals
1.1 Initial process planning and stakeholder support
1.2 Defining the fishery, societal values and high level objectives
1.3 Finalise a scoping (EAF baseline) report
2. Scientific information on the status of the system
Indicator development
Defining and analysing existing conditions
Stock Assessment
Collecting data on socio‐economic variables & threats Collecting data on biodiversity& other natural features
2.1 Asset and Issue identification
3. Scientific inputs to address interactions between pressures and ecosystems,
Risk Analysis Defining and analysing future conditions
ERAEAF 2.2 Issue prioritisation and risk assessment
4. Clear management objectives and processes
Management strategy development
Preparing and approving the spatial management plan Implementing and enforcing the spatial management plan
Harvest Strategy Control Rules
Policy and management response
Setting conservation objectives
Reviewing current achievement of objectives
Selecting additional conservation areas
Applying conservation actions to selected areas
3.1 Determine operational objectives
3.2 Indicator and Performance Measure selection
3.3 Management option evaluation and selection
5. A formalised process for monitoring and evaluation
Monitoring and evaluation
Monitoring and evaluating performance
Adapting the spatial management process
Monitoring
Maintaining & monitoring conservation areas
4.1 Develop an Operational Plan and monitor its progress 4.2 Formalization of the management ‘plan’
4.3 Review performance of the Management system

4.4 Reporting, communication and auditing of performance
Table 1. Comparison of EBM & MSP guidelines. IEA is Integrated Ecosystem Assessment (Levin et al 2009), MSP is Marine Spatial Planning (Ehler and Douvere 2009). AFMA ERAEAF is the Australian Fisheries Management Authority Ecosystem Approach (Smith et al. 2014, Hobday et al. 2011). SCP is Systematic Conservation Planning (Pressey and Bottrill 2009). FAO EAF is the FAO Ecosystem Approach to Fisheries (Fletcher and Bainchi 2014)

1
The five frameworks we have reviewed come from two very different realms of scientific endeavour; conservation science, and fisheries science. However, they all show a set of commonalities and aspire to achieve similar goals. The five overarching concepts linking each framework are (1) the need for scoping and stakeholder engagement, (2) scientific information on the status of the system, (3) scientific inputs to address interactions between pressures and ecosystems, (4) clear management objectives and processes, and (5) a formalised process for monitoring and evaluation (Table 1). Every framework emphasises the need for adaptive management (Curtin and Prellezo 2010). Without adaptive management we cannot hope to manage systems where we are uncertain about key ecological and biological process.
It is also important to note the difference between aspirational objectives (ie Aichi Targets) and operational objectives, which have associated thresholds for agreed management action. Both play important but different roles in management. Aspirational targets are set in the first phase of management (ie scoping). They set the general tenor of the process and represent broad agreement among consulted stakeholders on a particular outcome. Hilborn (2007) notes that there are four main components to successful fisheries: biological, economic, social and political. Past management has often focused solely on target species to meet economic and social goals and ignored the broader effects of fishing. In addition, the human aspects of the management cycle have been very poorly studied (Fulton et al. 2011) , limiting both the sustainability of fisheries and broader agreement on what is an acceptable trade‐off between production and environmental impact. Consultation and consideration of the aspirations of all four categories of stakeholders is required in moving towards EBM. Different objectives lead to different outcomes and an emphasis on a single objective can lead to perverse results with regard to EBM (Hilborn 2007). Likewise, Redford et al. (2003) noted that many of the different conservation approaches varied in terms of aspirational and operational objectives, and differences in aspirational objectives are often most prevalent. While conservation frameworks frequently focus on protection and the identification of areas to be protected with the least cost, fisheries frameworks focus on sustainable fisheries, food security and livelihoods. Nonetheless, both share common management frameworks. And while they may emphasise different steps or include additional steps depending on the aspirational objectives, the underlying sequence of scoping, information, objectives, action, monitoring and review. The point of origin for most of the conflicts will be when the aspirational objectives do not include all stakeholders.
Operational objectives are the key to a functioning adaptive management cycle. These objectives, and their associated thresholds, targets and limits, identify the points where actions must be taken if aspirational objectives are to be met. Each operational objective will have one or more indicators that will trigger different management actions (including review). The monitoring and evaluation of the indicators will determine over time if management is working of if changes need to be made.

4 Examples of areas meeting the EBSA criteria from the regional workshops
The EBSA workshops have described 207 areas meeting the EBSA criteria since 2011. The areas were described as part of a purely scientific process that did not consider either the pressures on those areas, nor the management activities that might be occurring in the areas. This is a strength of the process because it allows the discussion on ecological and biological values without discussing how current activities might be altered. For each area, the biological and ecological components that meet one or more of the seven EBSA criteria are described in detail in the reports of these EBSA workshops. The ecological and biological components are the biodiversity values of the system. To illustrate these values, we have used three examples from the workshops that describe different systems and different values.
4.1 Coral Seamount and Fracture Zone Feature3*
The Coral Seamount is located in the south west Indian Ocean, approximately 1500km south west of South Africa. The seamount is one of the better know areas in the south ocean and has had significant survey effort from the Southern Indian Ocean Deep Sea Fisheries Association (Shotten 2006), a multi agency collaboration on the RV Nansen (Rogers et al. 2009) and a more recent cruise on the RV James Cook (Rogers and Taylor 2012). The Coral Seamount is unique in the south west Indian ocean, containing a seamount that summits in ca. 300m, beside a deep sea trench that extends to over 5200 metres below sea level. The area described as meeting the EBSA criteria lies below highly productive sub‐Antarctic waters, described as the Agulhas Front (Area No. 11). However, the biodiversity values highlighted in the description of this area are connected to the unique geomorphology of the area (EBSA Criterion 1), the vulnerability of the Scleractinian coral reefs to disturbance (EBSA Criterion 4), and the high biodiversity of the seamount (Rogers and Taylor 2012). The seamount is occupied by a diversity of benthic invertebrates, including octocorals, sponges, scleractinian corals (Solenosmilia variabilis and Caryophyllia antarctica) and zoanthid anemones (Rogers and Taylor 2012). The seamount shows clear distribution from depths of 800m to the summit, with habitats dominated by sediment, hermit crabs and gastropods, followed by polycheate tubes and a summit covered with sponges and small coral thickets (Rogers and Taylor 2012).
3 Area No. 23 from the Southern Indian Ocean Regional Workshop to Facilitate the Description of Ecologically or Biologically Significant Marine Areas (EBSAs). Workshop report available at: http://www.cbd.int/doc/meetings/mar/ebsa‐sio‐01/official/ebsa‐sio‐01‐04‐en.pdf *Note: This area has not yet been considered by the Conference of the Parties to the CBD. The analysis in this paper is based on the scientific information contained in the report of the Southern Indian Ocean Regional Workshop to Facilitate the Description of Ecologically or Biologically Significant Marine Areas (EBSAs).

3
Figure 1. Map of the Coral Seamount and Fracture Zone Feature area.
4.2 Equatorial High‐Productivity Zone4
The Central Pacific high productivity zone is a large‐scale oceanographic feature, comprising the western extent of flow from the Humbolt current up the west coast of South America and across the Pacific as the south equatorial current. It brings cool, nutrient‐rich waters to the surface waters of the central Pacific Ocean supporting high primary production over a large area. The Pacific south equatorial current initiates along the coast of South America and flows west along the equator into the central Pacific (Ganachaud et al. 2011). The associated warm pool, responsible for significant fisheries production in the central western Pacific is linked to this area. Primary and secondary productivity between the cool tongue and the warm pool have potential linkages, in part through the Eastern Warm Pool Convergence Zone (Grandperrin 1978; Lehodey 2001; Picaut et al. 2001; Lehodey et al. 2011). There is the potential for changes in the eastern pacific linked to climate change to effect fisheries production in the western Pacific, via the linkage through this area. The area is identified as a unique feature in the western south Pacific (EBSA Criterion 1) and as an area of high productivity (EBSA Criterion 5).
4 Area 16 from the Western South Pacific Regional Workshop to Facilitate the Description of Ecologically or Biologically Significant Marine Areas (EBSAs). Workshop report available at: http://www.cbd.int/doc/meetings/mar/rwebsa‐wspac‐01/official/rwebsa‐wspac‐01‐sbstta‐16‐inf‐06‐en.pdf

Figure 2. Map of the Equatorial High‐Productivity Zone
4.3 Dorsal De Nazca Y De Salas Y Gómez5*
The Dorsal De Nzaca Y De Salas Y Gomez area is focused around the Salas y Gomez and Nazca ridges in the south eastern Pacific Ocean. The area we are considering here is only the area in ABNJ. It contains approximately 110 seamounts with summit depths between the surface and 2000m (Parin et al. 1997). The area is a recognised hotspot for biological endemism, with 41.2% of fishes and 46.3% of invertebrates endemic to the area (Parin et al., 1997). The ridges provide habitat for a number of long‐lived species including deep water sharks (Parin and Kotlyar, 2007) and reef building corals. They have been identified as areas for aggregations of thresher sharks and swordfish (Litvinov 1989, Yañez et al., 2004, 2006, 2009) and are a breeding zone for the Chilean jack mackerel (Trachurus murphyi) (Arcos et al., 2001; Anon., 2007). The ridges are also a frequent habitat for blue whales (Hucke‐Gaete et al. 2004)) and leatherback turtles (Shillinger, 2008). The area meets the criteria for uniqueness (EBSA Criterion 1), life history (EBSA Criterion
5 Area 18 from the Eastern Tropical and Temperate Pacific Regional Workshop to Facilitate the Description of Ecologically or Biologically Significant Marine Areas (EBSAs). Workshop report available at: http://www.cbd.int/doc/meetings/mar/ebsa‐ettp‐01/official/ebsa‐ettp‐01‐04‐en.pdf * Note: This area has not yet been considered by the Conference of the Parties to the CBD. The analysis in this paper is based on the scientific information contained in the report of the Eastern Tropical and Temperate Pacific Regional Workshop to Facilitate the Description of Ecologically or Biologically Significant Marine Areas (EBSAs).

5
2), threatened species (EBSA Criterion 3), vulnerability (EBSA Criterion 4), biological diversity (EBSA Criterion 6) and naturalness (EBSA Criterion 7).
Figure 3. Map of the Dorsal De Nazca Y De Salas Y Gómez area

5 Proposed framework to use the scientific information related to EBSAs for MSP & EBM
The common elements of the five reviewed MSP/EBM frameworks can be used to design a framework that incorporates the process of describing EBSA that has occurred to this date and identifies ways in which the scientific information used to describe EBSAs can also be used to inform MSP and EBM. (Table 1).
In decision X/29 of the Conference of the Parties to the CBD, Parties noted that the application of the ecologically or biologically significant areas (EBSA) criteria is a scientific and technical exercise and that the selection of conservation and management measures in areas meeting the EBSA criteria is a matter for States and competent intergovernmental organizations, in accordance with international law, including the United Nations Convention on the Law of the Sea. As such, this proposed framework provides a tool that could potentially be used by governments and competent organizations in supporting the application of MSP and EBM in areas meeting the EBSA criteria.
These are (1) Scoping ‐ Understanding the political/institutional and social domain and motivations for management; (2) EBSA ‐ Understanding the ecological/biological values in the system; (3) Impact ‐ Understanding the interaction between ecological/biological values and pressures; (4) Informing a management response based on the values, pressures and socio‐economic values; and (5) Monitoring the effectiveness of management through indicators that can detect changes on the values. The five steps, corresponding to the 5 concepts linking frameworks in Table 1, can be revisited in an iterative and hierarchical fashion, so that the initial cycle can be completed relatively quickly to inform and support the next cycle. It is important that the early cycles be completed relatively rapidly to maintain the impetus and to avoid the pursuit of perfection or “analysis paralysis”. The first steps should be based on existing science and used by existing authorities. It is only after at least one round of the adaptive cycle that the development of new science, new legislation or establishing new authorities should be considered. In this way, the limitations and problems of existing science and management can be identified and new programs can be designed to specifically target those limits and problems, as appropriate.
We have also considered the development of the EBSA process to date in deciding on the appropriate steps (Table 1). We suggest an approach with five steps and identify the input of the scientific information related to EBSAs to each step, where appropriate. As noted in the previous section, setting objectives in the scoping step can determine the number and form of different steps in each framework. We feel that the proposed framework outline captures the key components of MSP and EBM. Depending on the objective, different steps can be selected and different process prioritised and other steps added in. Any framework that is decided upon should have increasing levels of scientific information, complexity and costs, a hierarchical approach consistent with the ideas expressed in the tiered harvest strategies (Smith et al 2008) and ERAEAF. Each step should have and number of levels of increasing rigour in the scientific and management inputs and outputs. Each increasing level would impose greater requirements in the form of capacity, time, cost and scientific knowledge, but would yield increasing benefits in terms of ecosystem outcomes. It is envisaged that the first level would be easy to implement with low capacity and scientific requirements. The increasing levels of complexity are shown in Figure 4, illustrating the links between each of the framework steps.

7
Figure 4. Schematic diagram of the process to use scientific information related to EBSAs within an MSP/EBM framework. The numbers refer to the levels articulated in the text below. It is similar to many other frameworks, with the exception that it acknowledges that it is MSP/EBM. It can be started with very simple tools and slowly built upon as capacity and scientific understanding increases.
1. Scoping ‐ Understanding the political/institutional and social domain and motivations for management .
This step identifies the key drivers for management and the stakeholders who have an interest in the area being managed. It identifies the aspirational objectives of the system (eg maintain biodiversity, maximum sustainable yield, economic growth) in terms of ecological/biological, social, economic and political. All of the frameworks reviewed in this study agree that detailed stakeholder participation is key to this initial step, as it provides legitimacy for future steps. This step will be primarily conducted in conjunction with the agencies responsible for the management of the system.
Example hierarchical levels would include:
1.1. Small single sector/use stakeholder engagement with aspirational objectives focused on

the needs of that sector and consideration of one of political, economic, social or ecological/biological objectives.
1.2. Multiple sectors considered with multiple political, economic, social or ecological/biological objectives.
1.3. Consideration of all sectors, current states and future activities. All political, economic, social or ecological/biological objectives considered.
2. EBSA ‐ Understanding the ecological/biological values in the system. This step is where most of the key information related to the EBSA criteria is described and summarised. As ecosystems are large and extremely complicated, there is a need for a suite of tools that can be used to simplify the characterization of the ecosystem. Use of the EBSA criteria allows the prioritisation of the “Relevant Subsystem” (Dambacher et al. in press) or the “abstraction of ecosystems into sub‐systems thought to be most influential to the management issues at hand” (Levin et al. 2009). It is also done in an environment that does not consider the uses or the management of the systems, thus an area of high fisheries productivity (eg Benguela Current, Area No. 43, UNEP/CBD/RW/EBSA/SEA/1/4) is just as relevant as an area with unique biodiversity that is subject to less development/exploitation (eg Archipelago de Galapagos y Prolongacion Occidental, Area No. 10, UNEP/CBD/RW/EBSA/ETTP/1/4). We use the term “biodiversity values” for the ecosystem components described as meeting the EBSA criteria.
Example hierarchical levels would include:
2.1. Developing EBSA descriptions based on traditional knowledge and existing scientific information.
2.2. Incorporation of information from industry and other sources, combined with targeted surveys and sampling of the ecosystem values and associated components
2.3. Full ecosystem monitoring with information used to update the biodiversity values articulated in the EBSA descriptions
3. Impact ‐ Understanding the interaction between ecological/biological values (EBSA) and pressures. The values identified in the EBSA description and identification process can be overlayed with the current pressures that exist within the area. However, to identify which biodiversity values may be impacted and the cumulative impact of multiple sectors over time, models of the relevant subsystem that incorporate understanding of the ecosystem components are needed. In the simplest case, this may be a simple matrix of values and pressures, identifying which values in the relevant subsystem are most likely to be impacted. With increasing understanding of the biodiversity values and ecosystem components, it is possible to construct qualitative ecosystem models that allow for a more formal quantitative analysis of the cumulative impacts of pressures on biodiversity and ecosystem values (Dambacher et al. 2009, Dambacher et al. 2010, Hosack and Dambacher 2012). Finally, in areas with a high degree of scientific capacity, statistical models can provide information on key thresholds to trigger management interventions and numerical ecosystem models analysis of future scenarios (Fulton et al 2011). With increasing data, understanding of each area meeting the EBSA criteria will improve, supporting a more refined understanding of the ecosystem. Better data will support improved analyses of trends and resilience.
Example hierarchical levels would include:
3.1. Development of simple conceptual models of potential interactions between biodiversity values and pressures.
3.2. Development of qualitative models of cumulative impact that incorporate an understanding of ecosystem structure and impacts of pressures on specific values.
3.3. Development of statistical models to identify thresholds and trends and numerical ecosystem models to explore future scenarios.

9
4. Informing a management response based on the values, pressures and socio‐economic values. The information resulting from the previous three steps provides management agencies an opportunity to focus management interventions on particular pressures that are acting on the identified values in the area meeting the EBSA criteria. At this point, the setting of operational objectives for the relevant subsystem (ie area meeting the EBSA criteria) is critical to the effective management of the system. These objectives should include social, economic, political and ecological/biological components so that the area can be managed sustainably. The goal is to use the improved understanding of the ecosystem to identify the minimum intervention that will meet the operational objectives and ensure that the aspirational objectives are met. Identifying the minimum intervention that is needed will require a good understanding of how the pressures are likely to interact with the values. The minimum intervention should only target the pressures that interact with the values. Using this approach would emphasise the use of sectoral management arrangements, unless there are cumulative impacts that span multiple sectors. For example, fisheries agencies would be responsible for managing deep‐sea benthic fisheries, except in circumstances where other sectors impacted the same biodiversity values in the area. If deep‐sea mining were to also be undertaken in the same area, then the cumulative impact of these activities would have to be assessed, resulting in different interventions. In some circumstances, the number of values and complexity of ecosystems might render single sector approaches inefficient and marine protected areas would be required.
Example hierarchical levels would be:
4.1. Identification of operational objectives with clearly articulated thresholds to trigger actions from conceptual ecosystem models. These thresholds may result from a formal process of expert and stakeholder elicitation (eg Hosack and Dambacher 2012). The links between pressures and values should be identified and a heuristic understanding of the whole ecosystem should be used to identify which management interventions will have the greatest impact.
4.2. An improved understanding of ecosystem structure should be used to build qualitative models, building on knowledge from monitoring and scientific sampling . These models can be used to identify the direct and indirect impacts of pressures on biodiversity values.
4.3. Management Strategy Evaluation using qualitative, statistical and numerical ecosystem models to identify thresholds and alternative management scenarios to meet operational objectives.
5. Monitoring the effectiveness of management through indicators that can detect changes on the values.
Understanding if the management interventions are meeting the operational objectives and can achieve the aspirational objectives will be met through evaluating performance by monitoring. Monitoring programs should be linked to the operational objectives, the indicator must measure the degree to which the operational objective has been met and characterize trends in the biodiversity value. Monitoring and evaluation, with a focus on understanding the effectiveness of management interventions through continued monitoring and assessment of key indicators and the performance of the management initiatives.
Example hierarchical levels would be:
5.1. Utilising existing programs and capabilities to monitor the pressures and values identified for each area meeting the EBSA criteria. This may include a heuristic understanding of how the area has changed. Indicators are identified from conceptual models (step 3.1) using current ecosystem knowledge.
5.2. Building capacity to target particular biodiversity values and identifying the degree of

confidence on the current state of each biodiversity value. Targeting of scientific sampling linked to operational objectives. Indicators identified from qualitative models (step 3.2).
5.3. Full scientific monitoring program with a sampling design to allow identification of threshold and trends from data. Statistical models used to track performance and trends of values relative to operational objectives. Identification of indicators improved with additional data (step 3.3).
This approach to utilising scientific information related to EBSAs for management is designed to be hierarchical in nature. Completing a cycle of adaptive management at any level would meet the objectives of an ecosystem approach. It may not be possible or necessary to move beyond comparatively simple approaches in some circumstances. This recognises that there will be different capacity to implement each step in the adaptive cycle and that the first level can be completed with relatively little capacity. However, as scientific capacity and governance increases, more complex steps can be completed, allowing a move from level 1 to level 2 and then eventually from level 2 to level 3. It is envisaged that level 3 is will present significant challenges to most countries, especially once the domains of social, economic, political and ecological/biological are considered.

11
6 Application of framework to areas described as meeting the EBSA criteria by the Regional Workshops
The utility of the proposed framework can be demonstrated using the examples provided previously. The examples cover three distinct ecosystems with significantly different characteristics. The Coral Seamount and Fracture Zone Feature is an example of a deep‐sea ecosystem, focusing primarily on the benthic ecology and biology. The Equatorial High Productivity Zone is a large scale pelagic ocean feature. The Dorsal De Nazca Y De Salas Y Gómez area includes a combination of deep‐sea features that rise to near the surface, combined with extensive pelagic biodiversity values. The next steps in the framework would be the identification of potential pressures on the system (level 3.1) and the development of qualitative models (level 3.2).
A preliminary assessment of these areas indicates the presence of the following potential pressures in these areas: pelagic fisheries, benthic fisheries, ocean acidification and potential changes in nutrient levels due to climate change. This is not an exhaustive list of pressures, but is sufficient to demonstrate how an impact assessment might initially occur.
We have constructed illustrative qualitative models of the relevant‐subsystems of each of the example areas meeting the EBSA criteria. The key ecosystem components that are, or interact with, the biodiversity values are shown as yellow nodes. Positive (lines terminating in arrows) or negative (lines terminating in round circles) interactions between the components are shown. This model of the relevant subsystem can be used to clearly articulate the links between components and pressures and can be used in mathematical analyses to identify indicator groups and relative/cumulative impacts.
Pelagic Fisheries
Benthic Fisheries
Ocean Acidification
Change in Nutrients due to Climate Change
Coral Seamount
Equatorial High‐Productivity Zone
Dorsal De Nazca Y De Salas Y Gómez
Highly unlikely interaction
Possible interaction
Likely interaction
Highly likely interaction
Table 2. Potential interactions between pressures and values identified in the example areas meeting the EBSA criteria. This preliminary analysis does not include all potential pressures or interactions.

6.1 Coral Seamount and Fracture Zone Feature
We identified three potential pressures of concern to the ecosystem described in the EBSA documentation and in the references contained therein. The pressures are fishing activity, (PR1 in Figure 5), ocean acidification (PR2 in Figure 5) and a southward shift of the sub‐Antarctic convergence (T3). The framework outlined above serves to characterize potential interactions between biodiversity values and pressures, as per step 3.1. Figure 5 illustrates a qualitative model of the relevant sub‐system, as per step 3.2.
Figure 5. Illustrative qualitative model of possible relevant (step 3.2) subsystem for Coral Seamount and Fracture zone. The model concentrates on the seamount and not on the adjacent fracture zone. The ecosystem components are: MFSC, matrix forming stony corals; SFF, sessile filter feeders; EP, epizooic predators; EFF, epizoic filter feeders; DR, detrital rain; BP, benthopelagic organisms; SL, scattering layer; PP, primary production; T1, fishing (trawling and longline); T2, ocean acidification; T3, southward shift of the subtropical convergence zone. Lines with arrows represent positive effects and lines with closed circles represent negative effects.
Qualitative models allow a mathematical analysis of the relevant subsystem, the development of an understanding of how the pressures might interact with the rest of the system, and can be used to identify indicators of ecosystem health. It is clear from the qualitative ecosystem model that there is the potential
13
for all pressures to adversely affect the system (Figure 5). However, we only have the ability to directly manage the impacts occurring from fishing activities (PR1). Most fishing activity within this area is managed under the auspices of the Southern Indian Ocean Deep Sea Fishing Association (SIODFA) as a benthic protected area, and will soon be managed by the Southern Indian Ocean Fisheries Agreement (SIOFA). However, to manage the areas effectively on an ecosystem basis, SIOFA needs to be able to access information on the state of the other pressures and understand the state and trend of the biodiversity values. This is currently only possible on an ad hoc basis.
6.2 Equatorial High‐Productivity Zone
This area does not have any immediate pressures that are acting on the values identified in the EBSA description. However, climate change has the potential to affect temperature and productivity in the area (Figure 6). The other potential pressure is fishing activity on the top predators and medium sized pelagic fish, specifically tuna species. This pressure is currently managed by the Western and Central Pacific Fisheries Commission (WCPFC). While fisheries production is unlikely to increase over the whole of the Pacific (Bell et al. 2011), there is the potential for shifts in production. The outputs of CMIP5 (http://pcmdi‐cmip.llnl.gov/cmip5/availability.html) suggest that temperatures in this area will increase, increasing the probability of reductions in the productivity in the EBSA.
The potential interaction between fisheries and shift in productivity has been noted (Bell et al. 2011). There is the potential for shifts in areas with high fisheries catches due to climate change, which will have implications for the management of the area. The biodiversity value (high productivity) should be monitored, preferably through satellite observation and information passed to the relevant fisheries agencies to ensure that tuna stocks in the area are sustainably managed.

Figure 6. Illustrative qualitative model of possible relevant subsystem (step 3.2) for the Equatorial High Productivity Zone. The model concentrates on the seamount and not on the adjacent fracture zone. The ecosystem components are: NUT, Nutrients; Dia, Diatoms; Cop, Copeopods; Cru, Planktonic Crustecea; MN, ; SP, Small Pelagic Fish; MSP Mid‐sized Pelagic Fish; TP, Top Predators; SB, Sea Birds; Pre1, Pelagic Fishing (Mostly Purse Seine); Pre2, Change in nutrient loads. Lines with arrows represent positive effects and lines with closed circles represent negative effects.
15
6.3 Dorsal De Nazca Y De Salas Y Gómez
This area had the highest number of biodiversity values identified of the examples given here. It is a complex system that includes both benthic and pelagic components (Figure 7). There are potentially four pressures acting on the system, Benthic fisheries (Pres‐1), pelagic fisheries (Pres‐2), ocean acidification (Pres‐4) and Changes in nutrients due to climate change (Pres‐3). These pressures have the potential to impact throughout the entire system. For example, pelagic fisheries (Pres‐2) may have a net negative effect on benthic invertebrates (BI) through the link from top predators (TP) to demersal fish (DF). Conversely, increasing nutrients due to climate change has the potential to generate positive effects throughout the system. The major jack mackerel fishery occurs to the south of this EBSA and is managed by the South Pacific Regional Fisheries Management Organisation (SPRFMO). In this area, there is a significant swordfish fishery, which is managed by the Inter‐American Tropical Tuna Commission (IATTC). There does not appear to be a significant benthic fishery in the area.
Given the complexity of the values in the area, the relatively small amount of fisheries in the area and the potential for the effects of the different pressures to cascade through the system, it would be appropriate to consider the some areas within the EBSA as potential candidates for a marine protected area. It will be difficult to manage the area within an ecosystem approach when the values are so diverse, while continuing to exploit pelagic species, especially when the effects of climate change are uncertain. Alternatively, careful monitoring of pressures and impacts might allow continued sustainable use. This analysis is only preliminary and more work is needed to fully articulate the system, feedbacks and pressures.

Figure 7. Illustrative qualitative model of possible relevant subsystem (step 3.2) for the Dorsal De Nazca Y De Salas Y Gómez. The model covers all the features identified in the EBSA description, including the seamounts and pelagic zone. The ecosystem components are: NUT, Nutrients; Dia, Diatoms; Cop, Copeopods; Cru, Planktonic Crustecea; MN, Micronekton ; SP, Small Pelagic Fish; MSP Mid‐sized Pelagic Fish; TP, Top Predators; SB, Sea Birds; Squ, Squid; Det, Detrital rain; DF Demersal Fish; Cor, matrix forming stony corals; FF, filter feeders; BI, Benthic Invertebrates; CA, Coraline Algae; BMC, Bentho Pelagic Micro Crustacea; Pres‐1, Benthic Trawling; Pres‐2 Pelagic Fisheries;, Pres‐3 Changes in nutrient loads; Pres‐4 Ocean Acidification. Lines with arrows represent positive effects and lines with closed circles represent negative effects.

17
Conclusion
There are many approaches to marine spatial planning and ecosystem based management that expand on detailed technical ideas that are difficult to implement and require significant scientific input. What we have tried to articulate here is an approach that can be started simply, using a basic understanding of ecosystems, and slowly expanded, as needed, to meet more complex demands. A common theme amongst all of the frameworks reviewed was an adaptive cycle. However, this can be difficult to begin and simple starting points are needed. Once the cycle has begun, hierarchical levels can be used to add extra components and allow for prioritisation.
The key interfaces for science and knowledge are the description and potential identification of an EBSA (step 2), the interaction between pressures and the area meeting the EBSA criteria (step 3) and monitoring and evaluation (step 5). These steps represent the main point of interface between science and policy and are where most scientific information will feed into the adaptive cycle. In contrast, scientists will have a much more limited role to play in the scoping (step 1) and management (step 4) steps. These are the key points where other stakeholders will participate in the framework and where considerations of economic, social and political objectives will be included. It may also be worth considering if a process similar to a harvest management strategy might be worth including in the framework to improve responsiveness and allow better integration of social and economic objectives and the incentivisation of particular activities (Smith et al. 2014)
One of the unanswered questions that has emerged from the EBSA process, at least from a scientific perspective, has been what steps should follow the description and potential identification of an EBSA. This paper attempts to outline potential steps to be taken after the EBSA process, including potential approaches to selecting the appropriate body to manage activities in a given area meeting the EBSA criteria. As identified in the examples, there are already agencies responsible for the management of specific pressures, and each of these has committed to adopting an ecosystem approach. Each of those agencies clearly has primacy in managing specific pressures. However, there is currently no body that is responsible for managing the interactions between the pressures on each system, for identifying new pressures, for identifying cumulative impacts, and the relative contribution of each pressure to the cumulative impact. Information from the EBSA process would provide the technical means to estimate these impacts. This agency would not necessarily have a management focus, leaving the management of each sector to the appropriate agency. However, the absence of any mechanism for aggregating and reporting pressures from each sector so that the full impacts can be understood limits the ability of each sectoral body to manage activities on an ecosystem basis. Communication between these sectoral bodies will be understandably ad‐hoc until such a mechanism is established. The scientific work to describe and identify EBSAs provides the beginning of such a mechanism.
19
7 References
Anon., 2007. Report from Chile on jack mackerel research and stock assessment. Paper
SPRFMO‐III‐SWG‐18 presented at Third Scientific Working Group of South pacific Regional
Fisheries Organisation, 25‐27 April 2007 in Reñaca, Chile. http://www.southpacificrfmo.org/third‐swg‐meeting/
Arcos, D., L. Cubillos & S. Nuñez. (2001). The jack mackerel fishery and El Niño 1997‐1998
effects off Chile. Progress in Ocenography, 49(1), 597‐617.
Bell, J.D., Johnson, J.E. and Hobday, A.J. (2011) Vulnerability of Tropical Pacific Fisheries and
Aquaculture to Climate Change. Secretariat of the Pacific Community, Noumea, New
Caledonia
Bottrill , M., Didier , K., Baumgartner , J., Boyd ,C., Loucks ,C., Oglethorpe ,J. et al. (2006) Selecting Conservation Targets for Landscape‐scale Priority Setting: A Comparative Assessment of Selection Processes Used by Five Conservation NGOs for a Landscape in Samburu, Kenya. World Wildlife Fund, Washington, DC, USA.
Butchart S. H. M., Walpole M., Collen B., van Strien A., Scharlemann J. R. P. W., Almond R. E. A., Baillie J. E. M., Bomhard B., Brown C., Bruno J., Carpenter K. E., Carr G. v. M., Chanson J., Chenery A. M., Csirke J., Davidson N. C., Dentener F., Foster M., Galli A., Galloway J. N., Genovesi P., Gregory R. D., Hockings M., Kapos V., Lamarque J.‐F., Leverington F., Loh J., McGeoch M. A., McRae L., Minasyan A., Morcillo M. H.Nn., Oldfield T. E. E., Pauly D., Quader S., Revenga C., Sauer J. R., Skolnik B., Spear D., Stanwell‐Smith D., Stuart S. N., Symes A., Tierney M., Tyrrell T. D., Vie J.C. & Watson R. (2012) Global Biodiversity: Indicators of Recent Declines. Science 328, 1164‐8.
Caddy, J.F and Cochrane, K.L. (2001) A review of fisheries management past and present and some future perspectives for the third millennium. Ocean and Coastal Management, 44:653‐682.
Curtin, R., and Prellezo, R. (2010). Understanding marine ecosystem based management: A literature review. Marine Policy 34: 821‐830.
Secretariat of the Convention on Biological Diversity (2004) The Ecosystem Approach,
(CBD Guidelines) Montreal: Secretariat of the Convention on Biological Diversity 50 p.
Dambacher, J.M., Gaughan, D.J., Rochet, M.J., Rossingol, P.A. and Trenkel, V.M. (2009) Qualitative modelling and indicators of exploited ecosystems. Fish and Fisheries, 10: 305‐322.
Dambacher, J.M., Young, J.W, Olsen, R.J., Allain, V., Galvan‐Magana, F., Lansdel, M.J., Bocanegra‐Castillo, N., Alatorre‐Ramirez, V., Cooper, S.P., Duffy, L.M. (2010) Analyzing pelagic food webs leading to top predators in the Pacific Ocean: A graph‐theoretic approach. Progress in Oceanography 86:152‐165.
Dambacher, J.M., Rothlisberg, P.C., Loneragan, N.R. (in press) Representing fishery and ecosystem dynamics of Australia’s Northern Prawn Fishery with qualitative mathematical models. Ecological Applications.
Day J. (2002) Zoning lessons from the Great Barrier Reef Marine Park. Ocean and
Coastal Management 45:139–156.
Douvere, F., Maes, F. , Vanhulle, A., Schrijvers, J. (2007) The role of marine spatial planning in sea use management: The Belgian case. Marine Policy 31:182‐191
Dunn D.C., Ardron J., Bax N., Bernal P., Cleary J., Cresswell I., Donnelly B, Dunstan P, Gjerde K, Johnson D, Kaschner K, Lscelles B., Rice J., von Nordheim H., Wood L., Halpin P.N. (2014) The Convention on Biological Diversity's Ecologically or Biologically Significant Areas: Origins, development, and current status. Marine Policy, http://dx.doi.org/10.1016/j.marpol.2013.12.002i
Douvere, F. (2008) The importance of marine spatial planning in advancing ecosystem‐based sea use management. Marine Policy 32: 762‐771
Dunn, D.C., Ardron J., Bax, N., Bernal, P., Cleary, J., Cresswell, I., Donnelly, B., Dunstan, P., Gjerde, K., Johnson, D., Kaschner, K., Lascelles, b., Rice, J., von Nordheim, H., Wood, L., Halpin, P.N. (2014) The Convention on Biological Diversity's Ecologically or Biologically Significant Areas: Origins, development, and current status, Marine Policy, 49:137‐145, http://dx.doi.org/10.1016/j.marpol.2013.12.002.
Edgar, G. J., Stuart‐Smith, R. D.;,Willis, T. J., Kininmonth, S., Baker, S. C., Banks, S., Barrett, N. S., Becerro, M. A., Bernard, A. T. F., Berkhout, J., Buxton, C. D., Campbell, S. J., Cooper, A. T., Davey, M., Edgar, S. C., Forsterra, G., Galvan, D. E., Irigoyen, A. J., Kushner, D. J., Moura, R., Parnell, P. E., Shears, N. T., Soler, G., Strain, E. M. A. and Thomson, R. J. (2014). Global conservation outcomes depend on marine protected areas with five key features, 506 : 216‐220.
Ehler, C, and Douvere, F.. (2009) Marine Spatial Planning: a step‐by‐step approach toward ecosystem‐based management. Intergovernmental Oceanographic Commission and Man and the Biosphere Programme. IOC Manual and Guides No. 53, ICAM Dossier No. 6. Paris: UNESCO. 2009 (English).
FAO (2011) Review of the state of world marine Fishery resources. FAO Fisheries and Aquaculture Technical Paper No. 569. Rome, FAO. 2011. 334 pp
Fletcher W.J. And Bianchi G. (2014) The FAO e EAF toolbox: Making the ecosystem approach accessible to all fisheries. Ocean & Coastal Management 90 (2014) 20‐26. http://dx.doi.org/10.1016/j.ocecoaman.2013.12.014
Fulton, E. A., Link, J. S., Kaplan, I. C., Savina‐Rolland, M., Johnson, P., Ainsworth, C., Horne, P., Gorton, R., Gamble, R. J., Smith, A. D. M. and Smith, D. C. (2011) Lessons in modelling and management of marine

21
ecosystems: the Atlantis experience. Fish and Fisheries, 12: 171–188. doi: 10.1111/j.1467‐2979.2011.00412.x
Fulton EA, Smith ADM, Smith DC, Johnson P (2014) An Integrated Approach Is Needed for Ecosystem Based Fisheries Management: Insights from Ecosystem‐Level Management Strategy Evaluation. PLoS ONE 9(1): e84242. doi:10.1371/journal.pone.0084242
Ganachaud, A.S., Gupta, A.S., Orr, J.C., Wijfels, S.E., Ridgway, K.R., Hemer, M.A., Maes, C.,
Steinberg, C.R., Tribollet, A.D., Qui, B. and Kruger, J.C. (2011). Observed and expected changes
to the tropical Pacific Ocean. In Bell J., Johnson JE, Hobday AJ (Ed.), Vulnerability of Tropical
Pacific Fisheries and Aquaculture to Climate Change. Secretariat of the Pacific Community.
Noumea New Caledonia
Garcia, S.M.; Zerbi, A.; Aliaume, C.; Do Chi, T.; Lasserre, G. (2004) The ecosystem approach to fisheries. Issues, terminology, principles, institutional foundations, implementation and outlook.
FAO Fisheries Technical Paper. No. 443. Rome, FAO. 2003. 71 p.
Gordon , E.A., Franco, O.E., Tyrrell, M.L. (2005) Protecting Biodiversity: A Guide to Criteria used by Global Conservation Organizations. Yale School of Forestry and EnvironmentalStudies, New Haven, USA.
Grandperrin, R. (1978) Influence of currents on the production of tropical seas: consequences for
fisheries. Fisheries Newsletter No. 17, South Pacific Commission, Noumea, New Caledonia. pp
14 ‐20
Hilborn, R. (2007) Defining success in fisheries and conflicts in objectives. Marine Policy 31:153‐158. doi:10.1016/j.marpol.2006.05.014
Hobday, A.J., Smith, A.D.M., Stobutzki, I.C., Bulman, C., Daley, R., Dambacher, J.M., Deng, R.A, . Dowdney, J., Fuller, M., Furlani, D., Griffiths, S.P., Johnson, D., Kenyon, R., Knuckey, I.A., Ling, S.D, Pitcher, R., Sainsbury, K.J., Sporcic, M., Smith, T., Turnbull, C., Walker, T.I, Wayte, S.E., Webb, H., Williams, A., Wise, B.S., Zhou, S. (2011) Ecological risk assessment for the effects of fishing, Fisheries Research 108(2–3):372‐384, http://dx.doi.org/10.1016/j.fishres.2011.01.013.
Hosack, G.R. and Dambacher, J.M. (2012). Ecological Indicators for the Exclusive Economic
Zone of Australia’s South East Marine Region. A report prepared for the Australian Government
Department of Sustainability, Environment, Water, Population and Communities. CSIRO Wealth
from Oceans Flagship, Hobart.
Hucke‐Gaete, R., L.P. Osman, C.A. Moreno, K.P. Findlay & D.K. Ljungblad (2004). Discovery of a blue whale feeding and nursing ground in southern Chile. Proc. R. Soc. Lond. Ser. B 271: S170–S173.

Kemp J., Jenkins G. P., Smith D. C. & Fulton E. A. (2012) Measuring the performance of spatial managment in marine protected areas. Oceanography and Marine Biology: An Annual Review 50, 287‐314.
Lehodey, P. 2001. The pelagic ecosystem of the tropical Pacific Ocean: Dynamic spatial modelling and spatial consequences of ENSO. Progress in Oceanography 49: 439‐468.
Lehodey, P., Hampton, J., Brill, R.W., Nicol, S., Senina, I., Calmettes, B., Pörtner, H.O., Bopp, L.,
Ilyina,T., Johann D. Bell, and J. Sibert (2011). Vulnerability of oceanic fisheries in the tropical
Pacific to climate change. In Bell J., Johnson JE, Hobday AJ (Ed.), Vulnerability of Tropical
Pacific Fisheries and Aquaculture to Climate Change. Secretariat of the Pacific Community.
Noumea New Caledonia.
Levin PS, Fogarty MJ, Murawski SA, Fluharty D (2009) Integrated ecosystem assessments: Developing the scientific basis for ecosystem‐based management of the ocean. PLoS Biol 7(1): e1000014. doi:10.1371/journal.pbio.1000014
Litvinov, F.F. 1989. Struktura epipelagicheskogo taksocena Elasmobranchii v Atlanticheskom i
Tikhom okeanakh i ee izmeneniya v noveyshee geologicheskoe vremya. Voprosy Ikhtyologii, 29,
973–984
Marris E. J. (2011) Rambunctious Garden: Saving Nature in a Post‐Wild World. Bloomsbury USA, 224 pp.
Marvier M., Kareiva P. & Lalasz R. (2011) Conservation in the anthropocene: Beyond Solitude and Fragility. Breathrough Journal 2. http://thebreakthrough.org/index.php/journal/past‐issues/issue‐2/conservation‐in‐the‐anthropocene
Olsen, E., Gjøsæter, H., Røttingen, I., Dommasnes, A., Fossum, P. (2007) The Norwegian ecosystem‐based management plan for the Barents Sea. ICES Journal of Marine Science 64 (4): 599‐602. doi:10.1093/icesjms/fsm005
Parin, N.V., A.N. Mironov & K.N. Nesis. 1997. Biology of the Nazca and Sala y Gómez
submarine ridges, an outpost of the Indo‐West Pacific fauna in the Eastern Pacific Ocean:
composition and distribution of the fauna, its communities and history. In: A.V. Gebruk et al.
(ed.). The biogeography of the oceans. Adv. Mar. Biol., 32, 145‐242.
Parin, N.V. and A. N. Kotlyar. 2007. On Finding of Shark of the Genus Somniosus (Squalidae) at
the Submarine Ridge of Nazca (Southeastern Pacific). Journal of Ichthyology, 47(8), 669–672.
Picaut, J., Iovalalen, M., Delcroix, T., Masia, F., Murtugudde, R. and Vialard, J. 2001. The oceanic zone of convergence on the eastern edge of the Pacific warm pool: A synthesis of results and

23
implications for El Niño‐Southern Oscillation and biogeochemical phenomena. Journal of
Geophysical Research 106 (C2): 2363‐2386
Pressey, R.L. and Bottrill, M.C. (2009) Approaches to landscape‐ and seascape‐scale conservation planning: convergence, contrasts and challenges. Oryx, 43(4), 464–475 doi:10.1017/S0030605309990500
Redford, K.H., Coppolillo, P., Sanderson, E.W., Dafonseca, G.A.B., Dinerstein, E., Groves, C., Mace, G., Maginnis, S., Mittermeier, R.A., Noss, R., Olson, D., Robinson, J.G., Vedder, A., Wright, M. (2003) Mapping the conservation landscape. Conservation Biology, 17, 116–131.
Rogers AD, Alvheim O, Bemanaja E, Benivary D, Boersch‐Supan PH, Bornman T, Cedras R, DuPlessis N, Gotheil S, Hoines A, Kemp K, Kristiansen J, Letessier T, Mangar V, Mazungula N,
Mørk T, Pinet P, Read J, Sonnekus T (2009) Cruise Report ”Dr. Fritjof Nansen” Southern
Indian Ocean Seamounts (IUCN/ UNDP/ ASCLME/ NERC /EAF Nansen Project 2009
Cruise 410) 12th November – 19th December, 2009. International Union for theConservation of Nature, Gland, Switzerland, 188pp.
Rogers AD, Taylor ML (2012) Benthic biodiversity of seamounts in the southwest Indian Ocean
Cruise report – R/V James Cook 066 Southwest Indian Ocean Seamounts expedition –November 7th – December 21st, 2011. 235pp.
Secretariat of the Convention on Biological Diversity (2004) The Ecosystem Approach,
(CBD Guidelines) Montreal: Secretariat of the Convention on Biological Diversity 50 p.
Shillinger, G.L., Palacios, D.M., Bailey, H., Bograd, S.J., Swithenbank, A.M., Gaspar, P., Wallace, B.P., Spotila, J.R., Paladino, F.V., Piedra, R., Eckert, S.A., Block, B.A. (2008) Persistent leatherback turtle migrations present opportunities for conservation. PLOS Biology 6(7): e171. doi:10.1371/journal.pbio.0060171
Shotton, R. (2006) Management of demersal fisheries resources of the southern Indian Ocean. Report of the fourth and fifth Ad Hoc Meetings on Potential Management Initiatives of Deepwater Fisheries Operators in the Southern Indian Ocean (Kameeldrift East, South Africa, 12–19 February 2006 and Albion, Petite Rivière, Mauritius, 26–28 April 2006) including specification of benthic protected areas and a 2006 programme of fisheries research. FAO Fisheries Circular. No. 1020. Rome, FAO. 2006. 90p.
Smith, A. D. M., Fulton, E. J., Hobday, A. J., Smith, D. C., and Shoulder, P. 2007. Scientific tools to support the practical implementation of ecosystem‐based fisheries management. ICES Journal of Marine Science, 64: 633–639.
Smith, A.D.M., Smith, D.C, Tuck, G.N., Klaer, N., Punt, A.E, Knuckey, I., Prince, J., Morison, A., Kloser, R., Haddon, M., Wayte, S., Day, J., Fay, G., Pribac, F., Fuller, M., Taylor, B., Little, L.R (2008) Experience in implementing harvest strategies in Australia's south‐eastern fisheries, Fisheries Research, 94(3):373‐379. http://dx.doi.org/10.1016/j.fishres.2008.06.006.

Smith, A. D. M., Smith D. C., Haddon, M., Knuckey, I., Sainsbury, K. J., and Sloan, S. 2014. Implementing harvest strategies in Australia: 5 years on. – ICES Journal of Marine Science, 71: 195–203.
Stelzenmuller V., Breen P., Stamford T., Thomsen F., Badalamenti F., Borja Ã. n., Buhl‐Mortensen L., Carlstom J., D’Anna G., Dankers N., Degraer S., Dujin M., Fiorentino F., Galparsoro I., Giakoumi S., Gristina M., Johnson K., Jones P. J. S., Katsanevakis S., Knittweis L., Kyriazi Z., Pipitone C., Piwowarczyk J., Rabaut M., Sorensen T. K., van Dalfsen J., Vassilopoulou V., Vega Fernandez T. s., Vincx M., Voge S., Weber A., Wijkmark N., Jak R., Qiu W. & ter Hofstede R. (2013) Monitoring and evaluation of spatially managed areas: A generic framework for implementation of ecosystem based marine management and its application. Marine Policy 37, 149‐164.
Worm B., Hilborn R., Baum J. K., Branch T. A., Collie J. S., Costello C., Fogarty M. J., Fulton E. A., Hutchings J. A., Jennings S., Jensen O. P., Lotze H. K., Mace P. M., McClanahan T. R., Minto C., Palumbi S. R., Parma A. M., Ricard D., Rosenberg A. A., Watson R. & Zeller D. (2009) Rebuilding Global Fisheries. Science 325, 578‐85.
Yáñez, E., C. Silva, J. Marabolí, F. Gómez, N. Silva, E. Morales, A. Bertrand, J. Campalans, A.
Gamonal, J. Chong, P. Rojas, B. Menares & J.I. Sepúlveda. 2004. Caracterización ecológica y
pesquera de la Cordillera de Nazca como área de crianza del pez espada. Informe Final Proyecto
FIP N° 2002‐04: 388 pp.
Yáñez, E., C. Silva, N. Silva, A. Ordenes, F. Leiva, P. Rojas, J. Chong, J. Campalans, S. Palma,
G. Claramunt, C. Oyarzún, R. Meléndez & R. Vega. 2006. Caracterización ecológica y pesquera
de Cordillera de Nazca como área de crianza del pez espada. Fase II. Informe Final Proyecto FIP
2004‐34: 236 pp.
Yáñez, E., C. Silva, M. Barbieri1, A. Órdenes & R. Vega. 2009. Environmental conditions
associated with swordfish size compositions and catches off the Chilean coast. Lat. Am. J. Aquat.
Res., 37(1), 71‐81. http://www.lajar.cl/pdf/imar/v37n1/Articulo_37_1_6.pdf


CONTACT US
t 1300 363 400 +61 3 9545 2176 e [email protected] w www.csiro.au
YOUR CSIRO
Australia is founding its future on science and innovation. Its national science agency, CSIRO, is a powerhouse of ideas, technologies and skills for building prosperity, growth, health and sustainability. It serves governments, industries, business and communities across the nation.
FOR FURTHER INFORMATION
Oceans and Atmosphere Piers Dunstan t +61 3 6232 5382 e [email protected]

UNEP/CBD/MCBEM/2014/4/INF/2 Page 2