Embed Size (px)
Citation preview

JOURNAL OF ANALYTICAL ATOMIC SPECTROMETRY, MARCH 1994, VOL. 9 443
Vaporization of Silicon and Germanium as Molecular Species in Electrothermal Atomizers* Paolo Tittarelli, Claudio Biff i and Veselin Kmetovt Stazione Sperimenfale per i Combustibili, Wale A. De Gasperi 3, 20097 San Donato Milanese MI, Italy
The vaporization of Si and Ge and their respective oxides was recorded using an ultraviolet spectrometer with diode-array detection. The samples were analysed as aqueous slurries using thermal programmes that are normally employed for trace analysis. Both the elements and the respective oxides form the monoxides SiO(g) and GeO(g) during atomization. In the presence of compounds containing S, CaSO, or FeS,, the gaseous sulfides SiS and GeS were observed. While in the case of Si it is possible to obtain SiS as a unique species from wall vaporization, with Ge the presence of GeS is always associated with that of GeO. The spectral characteristics of the compounds identified are reported. The presence of SiS has also been detected during the atomization of a bituminous coal. Keywords: Electrothermal atomic absorption spectrometry; molecular absorption; silicon monoxide and monosulfide; germanium monoxide and monosulfide
The formation of molecular species during the vaporization of samples in electrothermal atomic absorption spectrometry (ETAAS) has attracted the interest of several spectroscopists, because of the potential advantages and disadvantages as a result of the presence of such species during the atomization step. Among the advantages cited should be the possibility of determining elements that have resonance lines lying in the far ultraviolet (UV), because of the formation of molecules that absorb in the UV range or elements that exhibit relevant thermal stability but that are easily vaporized as molecular compounds.'-2 The main disadvantages can be identified as the loss of analyte as molecular species and the presence of non-specific absorption, which in some cases shows structured spectral behaviour.
In the analysis of solids the problem due to non-specific absorption is greatly enhanced in comparison with the analysis of ~olutions.~ This is especially the case for solids having a high inorganic matter content, such as coal ashes, minerals and soils, where the presence of molecular species is particularly evident. During the atomization step, owing to the fast heating rate, the decomposition of the matrix leads to fast evolution of molecular v a p o ~ r s . ~ In the materials cited above, Si is often the major component, present as the oxide or silicate, and can reach concentration levels of up to 30-40% m/m; therefore it is a potential source of non-specific absorption in the analysis of these materials.
The vaporization characteristics of the Group 14 elements have been examined extensively. Frech and Cedergren, have calculated the conditions for the formation of gaseous species of Si, and have given evidence for the formation of SiO(g) above 1600K and the dramatic change in distribution of gaseous Si species as a result of small changes in the partial pressure of OF Miiller-Vogt and Wendl' have evaluated the reactions taking place in the condensed phase, while Rademeyer and Vermaak6 have followed the formation of SiO(g) and SiC2(g) and deduced from the presence of these species a mechanism for the atomization of Si. The UV absorption spectrum of SiO(g) has already been obtained during the vaporization of Si02.3
In the case of Ge, Dittrich et aL7 have reported the spectrum for GeS(g), with evidence to support that it is GeS given by the absorption bands located between 280 and 290nm. Kolb et aL8 have found that Ge is lost as GeO(g) above 1100 K, ~~
* Presented at the XXVIII Colloquium Spectroscopicurn Internationale (CSI) Post-Symposium on Graphite Techniques in Analytical Spectroscopy, Durham, UK, July 4-7 1993.
t On leave from Centre of Analytical Chemistry and Applied Spectroscopy, University of Plovdiv, Plovdiv, Bulgaria.
unless high temperatures and reducing conditions are achieved during the atomization. Recently Doidge and McAllisterg have shown that equilibrium calculations indicate the formation of GeO(g), even at 800 K. Various workers have emphasised that the atomization of Ge is strongly affected by the properties of the graphite surface, the addition of acids and bases and the partial pressure of 02.
In the studies cited above, the atomization of Si (at ng levels) was followed through the thermal treatment of aqueous solu- tions. The present work was carried out to investigate the formation in the gaseous phase of molecular species of Si that originate during the atomization of solid samples. Thermal conditions as close as possible to those employed for the determination of trace elements were used. Also, the behaviour of Ge was investigated to support the spectroscopic obser- vations made for Si and the identification of molecular species. In this instance Si and Ge were considered as major constitu- ents of solid matrices, and the amounts of these elements vaporized were at microgram levels. Sulfates and sulfides were added to the Si and Ge compounds to simulate the presence of S, as is found in real samples, and to investigate the formation of S species in the vapour phase. In particular, FeS2 was used as the sulfide and CaSO, as the sulfate. Both salts are found in minerals, for instance coals, in addition to Si oxides and silicates.
The formation and persistence of molecular species was followed using a spectrometer that has already been used for the characterization of the vapour phase originating from the vaporization of s l~ r r i e s .~ The instrumental approach" is simi- lar to those proposed by Shekiro et al." and Majidi et a l l2 While Tittarelli et a1." and Shekiro et al." employed a deuterium lamp, Majidi et ~ 1 . ' ~ employed a plasma as the UV source. In all instrumentation mentioned, a diode array was used as the detector. Owing to the capability of continuously collecting spectra, these approaches are suitable for the investi- gation of fast transient phenomena occurring in the vapour phase.
Experimental Instrumentation
The instrumental set-up (Jasco KS-100M diode-array spec- trometer and Perkin-Elmer HGA-400 atomizer) has already been described and used for the evaluation of the behaviour of ~lurries.~ In the present study the wavelength range from 190 to 340nm was focused on the diode array to provide better information about the presence of molecular species absorbing at around 200 nm, in the spectral region where the
Publ
ishe
d on
01
Janu
ary
1994
. Dow
nloa
ded
by U
nive
rsity
of
War
saw
on
27/1
0/20
14 1
3:16
:41.
View Article Online / Journal Homepage / Table of Contents for this issue

444 JOURNAL OF ANALYTICAL ATOMIC SPECTROMETRY, MARCH 1994, VOL. 9
analytical lines of As and Se are located. The correction of non-specific absorption is a crucial aspect in the determination of these elements in ~1urries.l~ The time for collection of the spectra was 0.1 or 0.2 s and the time interval between consecu- tive spectra was 0.1, 0.2 or 0.5 s. Pyrolitic graphite coated graphite tubes and platforms were used.
Reagents Samples of Si, SiOz, Ge, GeO, and CaSO4.2H,O with purity above 99.5% were purchased from Johnson Matthey, Karlsruhe, Germany. Iron sulfide (FeS, pyrite) was a mineral sample; its purity (>95%) was checked through the determi- nation of the Fe and S contents. All compounds were ground down to particle dimensions of below 10 pm. The Bituminous Coal examined was Standard Reference Material SRM 1632b Trace Elements in Coal (Bituminous) supplied by the National Institute of Standards and Technology (NIST), Gaithersburg, MD, USA.
Procedure The solid samples were diluted with water to obtain slurries of 0.5% m/m and maintained under magnetic stirring prior to injection of the samples into the atomizer. There was no addition of nitric acid to the slurries of pure compounds to avoid, as much as possible, the formation of gaseous nitrogen species during the sample treatment. The slurries were prepared daily. A 10 pl aliquot of each slurry was injected into the graphite tube.
A 1% m/m slurry of the Bituminous Coal was prepared in nitric acid as previously de~cribed.~ The thermal programmes applied to the samples were similar to those employed for the determination of trace elements in slurries of environmental samples3 and consisted of drying, ashing and atomization steps. However, as the aim of the work was to examine the formation of molecular vapours, the term vaporization will be used in the following discussions instead of atomization. Two distinct ranges of ashing and vaporization temperatures were applied for Si and Ge (Table 1). The vaporization temperatures were reached under pyrometer control and the spectra were collected at the beginning of the vaporization step. The spectra reported in the figures were obtained using vaporization from the platform.
Results and Discussion In a previous paper it was shown that the presence of intense and structured absorption bands during the atomization of slurries occurs only at wavelengths below 280 nm.3 This obser- vation was related to the type of samples examined in that particular study (soils, sludges and ashes), the band systems of SiO and of A1 species being the most relevant features of the vapour phase.
The vapour-phase behaviour of the Bituminous Coal SRM 1632b, vaporized according to a thermal programme developed for the determination of Cd (platform atomization), is shown in Fig. 1. Two distinct systems of absorption bands were observed and are attributed to gaseous SiS. The first system, lying between 265 and 320nm, shows bands with the profile degraded to red (transition 1Z-1rI).14 The second system, between 210 and 250 nm, consists of sharp bands evenly spaced
Table 1 Instrumental parameters for the vaporization of Si and Ge compounds
Element Ashing/"C Vaporization/"C
Ge 700- 1000 16OO-20OO Si 1000-1200 1800-2400
* Ar flow set to 0 during vaporization.
0.3
Q)
C a 2 a n
a 0.15
(I) -.. i
i=
0 1 0 200 225 250 275 300 325 350
Wave lengt h/n m
Fig. 1 Spectra collected during the vaporization of SRM 1632b. Ashing temperature 800 "C, atomization 1700 "C. Addition of 8 pg of Pd and 6 pg of Mg. Collection time 0.2 s, interval 0.5 s. Scale marks on the time scale also represent zero absorbance for the correspond- ing spectrum
(transition 1Z+X-E).14 The two systems almost extend over the UV range covered by the spectrometer. No other band systems were detectable, only the outstanding atomic line of Mg at 285.1 nm, added as a modifier.
The Bituminous Coal SRM 1632b contains 1.89%m/m S and 1.4% m/m Si, hence, both S and Si can be considered as major elements present during the atomization. The S com- pounds of coals are divided into three classes: sulfates, sulfides (pyrite) and organic sulfur. Sulfur species derived from the decomposition of such compounds can react with Si and form SiS. The appearance of SiS occurs at low temperature. This is in agreement with the observations of Frech and Cedergren,, who calculated that the formation of SiS(g) occurs above 1330 K and at partial pressure of 0, lower than 1 x lo-', atm (1 atm = 101 325 Pa). At higher partial pressure the formation of SiS would be limited by the concurrent formation of SiO.
Vaporization of Silicon To evaluate the formation of SiO(g) and SiS(g), Si and SiO, were vaporized alone, in the presence of FeS,, considered as a 'supplier' of S species during the vaporization step, and in the presence of CaSO,, considered as 'supplier' of S and 0 species.
The behaviour of Si and SiO, during vaporization at 2000 "C is shown in Fig. 2. Both compounds form SiO(g) (band system 'C-'II between 205 and 250nm).14 The formation of SiO(g) during the vaporization of SiO, has already been shown;3 the spectra obtained from SiO, are reported for comparison. In the case of Si, the formation of SiO is due to the diffusion of 0, into the tube through the dosing hole.15 From the calcu- lations made by Frech and Cedergren,, SiO(g) represents the major component at 2000 "C with a sufficient partial pressure of 02. Gilmutdinov et have recently demonstrated that the concentration of 0, in a pyrolitic graphite coated graphite tube is higher than generally accepted. The appearance of SiO during the vaporization of Si is faster than in the case of SiO, (Fig. 2); this observation holds for all thermal conditions applied. This behaviour can be explained according to the lower thermal stability of Si (m.p. 1410 "C) in comparison with that of SiO, (m.p. 1610°C).'7 Owing to the large amount of Si loaded onto the platform, the supply of SiO(g) is continuous and the concentration remains almost constant during the vaporization step. It is proposed that SiO(g) is formed through
Publ
ishe
d on
01
Janu
ary
1994
. Dow
nloa
ded
by U
nive
rsity
of
War
saw
on
27/1
0/20
14 1
3:16
:41.
View Article Online

JOURNAL OF ANALYTICAL ATOMIC SPECTROMETRY, MARCH 1994, VOL. 9 445
0.6
al
C m 0.3
5: a 0
" ,? 1 I A
, \ 1 .t5 * J Y Y W 4 2 . 5 E
M "-
190 215 240 265 290 315 340 Wavelengt h/nm
Fig. 2 Spectra collected during the vaporization of A, Si and B, SiOa at 200°C. Collection time 0.2 s, interval 0.5 s (see Fig. 1 for explanation)
an heterogeneous reaction between Si(1) and 02. In the case of Si02 the release of SiO(g) occurs after the decomposition of the molten oxide.
As already mentioned, CaSO, and FeS2 were used to intro- duce S species during the vaporization of Si and SO2. The vaporization of CaSO, alone, shown in Fig. 3, indicates a series of consecutive reactions. The sulfate is decomposed on the graphite surface with formation, after about 0.2 s, of SO2 (there is an even succession of bands between 260 and 340 nm). This event is followed by the appearance of CS ('Z-'II transition with an outstanding band at 257.6 nm). The forma- tion of SO, and CS has already been demonstrated, and the molecular absorption of CS has been used to determine the S
2 .o
1 .o
I-- t I - ' - - - . t v ~ ~~ v 190 215 240 265 290 315 340
Wavel engt h/nm
content in fuel o ik2 The SO2 can easily be dissociated to SO (dissociation energy of SO, is 1.4eV). However, the presence of SO, cannot be confirmed as its absorption bands are diffuse and overlap with the very intense bands of SO,. There is no clear evidence to advance an unambiguous mechanism of CS formation, as the heterogeneous reaction between SO(g) and surface carbon or the reduction of CaSO, on the surface and release of CS(g) can both be proposed equally. In the last five spectra shown in Fig. 3 (from 1.0 to 1.5 s), the CS bands decrease, however, this coincides with the appearance of a series of sharp and intense bands below 210nm attributable to the fourth positive system of CO ('S'rI tran~ition). '~ The formation of CO by reaction of the 0, entering the dosing- hole has been studied by Sturgeon and Falk," who found the pco to be 1 x atm at 2200 K in a graphite atomizer similar to that used in this work. However, vaporization cycles of CaO performed under the same experimental conditions do not show the presence of such an intense system. Therefore, CO forms during the vaporization of CaSO, in the vapour phase as a product of the decomposition of the sulfate. It is suggested that the CS molecules (dissociation energy 7.4 eV)I7 form CO (dissociation energy 11.1 eV) by reaction with the carbon sites oxidized by the decomposition of SO,.
The evolution of the species is very fast (about 1.5 s for the appearance of the various species) even at 2000 "C, and continu- ous acquisition of the spectra with short collection time and time interval between the spectra is required. Different sulfates (such as Na,S04) give rise consecutively to SO2, CS and CO. An increase in the vaporization temperature affects the kinetics of the process and CS can hardly be detected above 2200°C if the interval between the acquisition of consecutive spectra is set to 0.5 s. The acquisition of spectra at fixed times, with multiple runs and stepwise increases in the wavelength, can lead to some loss of temporal resolution, hence different sulfates could show the formation of SO, or CS depending on the vaporization temperature. l8
When Si is vaporized in the presence of CaSO,, the most relevant effect is the appearance of the absorption systems of Si molecular species (Fig. 4). The presence of CS lasts only
1.6
al
C m e 5: a 11
t 0 190 215 240 265 290 315 340
Wavelen gt h/n m
Fig. 3 Spectra collected during the vaporization of CaSO, at 2000 "C. Collection time 0.1 s, interval 0.1 s (see Fig. 1 for explanation)
Fig. 4 Spectra collected during the vaporization of Si and CaSO, at 2000 "C. Collection time 0.1 s, interval 0.1 s (see Fig. 1 for explanation)
Publ
ishe
d on
01
Janu
ary
1994
. Dow
nloa
ded
by U
nive
rsity
of
War
saw
on
27/1
0/20
14 1
3:16
:41.
View Article Online
446 JOURNAL OF ANALYTICAL ATOMIC SPECTROMETRY, MARCH 1994, VOL. 9
0.2 s and is immediately followed by the appearance of the band system of SiS(g) between 260 and 310 nm and the SiO(g) system between 215 and 250 nm. The absorption bands of SiO overlap with the SiS system at short wavelength (Figs. 1 and 2). The intensity of SO, and CS bands decreases when CaSO, is vaporized in the presence of Si (Figs. 3 and 4). This behaviour suggests that CaSO, partly decomposes to SO2 and CS and partly reacts with Si in the condensed phase to form SiS(s), which sublimates at low temperature (940 "C).
Hence SiS(g) can be obtained through the following reactions:
CaS0, + Si-+SiS(s) ( 1 )
SiS (s)-+ SiS( g) (2) The SiO(g) is obtained through the reaction of Si with 0, as described for the vaporization of Si alone, because the appear- ance of SiO proceeds as is shown in Fig. 2. During the vaporization of SiO, and sulfate, as the appearance of the Si molecular species is delayed, CS vapours last for 0.5 s and are followed by the appearance of SiS and SiO.
The evolution of the species observed in Fig. 4 is represented in Fig. 5 in a different way. The consecutive formation of CS and CO (or SiS) is indicated by the appearance time of CS and CO, and the features of the concentration profiles. The formation of SiS(g) after the evolution of SO, and CS indicates that both S02(g) and CS(g), derived from the reaction of CaSO, with C, could be precursors of SiS(g) by direct gas-solid reaction:
CaSO,+C+SO,(g) or CS(g) ( 3 ) S02(g)+ Si+SiS(s) or SiS(g) (4) CS(g) + Si-+SiS(s) or SiS(g) (5)
SiS(s)+ SiS( g) (6) The formation of SiS(s) or SiS(g), indicated in reactions (4) and (5), depends on the temperature. However, it is not possible to assess the relative likelihood of the solid-solid and gas-solid mechanisms from the vaporization data.
The profile of the SiO evolution is similar to that of SiS and it not reported in Fig. 5.
On increasing the vaporization temperature to 2400 "C, the bands of SiO are less evident and the presence of Si absorption can be observed at 251.6 nm (Fig. 6). The difference between the reactivity of Si and Si02 in the formation of molecular species is particularly evident in Fig. 6. After 1 s, in the case of SiO,, the molecular absorption of CS is still intense even at high temperature. In both situations the formation of SiS seems slightly favourable in comparison with that of SiO.
The vaporization from the wall of both SiO and Si02 does not produce remarkable differences with the platform vaporiz- ation in the temperature range examined.
0.10 r 1
0 0.5 1 .o 1.5 Time/s
Fig.5 Evolution of molecular species during the vaporization of Si and CaS04 at 2000°C: A, SO,; B, CS; C, Co; and D, SiS
0.8
0.4
al
: o e 2 $ 0.8
0.4
0' 1 I 1 I I 1 190 215 240 265 290 315 340
Wavelengthtnm
Fig. 6 Spectra collected during the vaporization of A, Si and B, SiO, after 1.0 s: (a) at 2000°C; and (b) at 2400°C
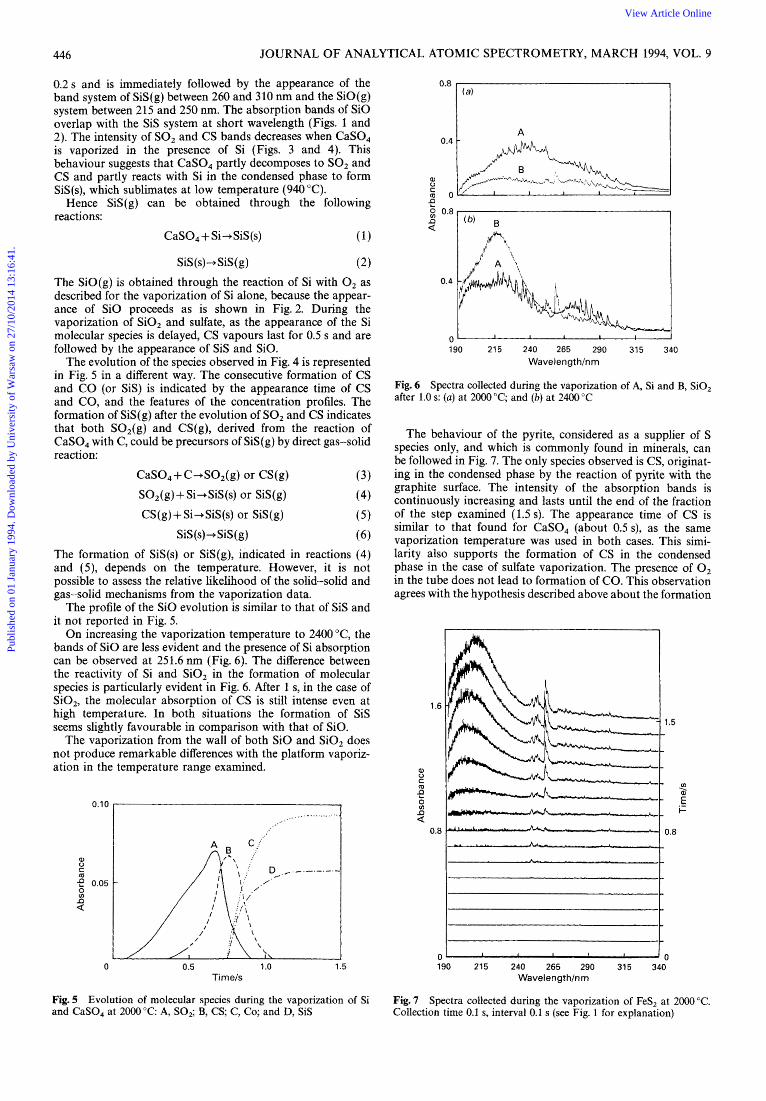
The behaviour of the pyrite, considered as a supplier of S species only, and which is commonly found in minerals, can be followed in Fig. 7. The only species observed is CS, originat- ing in the condensed phase by the reaction of pyrite with the graphite surface. The intensity of the absorption bands is continuously increasing and lasts until the end of the fraction of the step examined (1.5 s). The appearance time of CS is similar to that found for CaSO, (about 0.5 s), as the same vaporization temperature was used in both cases. This simi- larity also supports the formation of CS in the condensed phase in the case of sulfate vaporization. The presence of O2 in the tube does not lead to formation of CO. This observation agrees with the hypothesis described above about the formation
1.6
s m ; Ll a
1 .5
v) \
.- E k-
I t
0 190 215 240 265 290 315 340
Wave le n g t h/n m
Fig. 7 Collection time 0.1 s, interval 0.1 s (see Fig. 1 for explanation)
Spectra collected during the vaporization of FeS, at 2000 "C.
Publ
ishe
d on
01
Janu
ary
1994
. Dow
nloa
ded
by U
nive
rsity
of
War
saw
on
27/1
0/20
14 1
3:16
:41.
View Article Online

JOURNAL OF ANALYTICAL ATOMIC SPECTROMETRY, MARCH 1994, VOL. 9
A - A . ~ . -
I I I I I
447
of CO through the reduction of SO, (or SO) on the graphite and reaction of CS on the oxidized sites.
The simultaneous vaporization of Si and FeS, leads to the formation of SiS(g) as the main component of the vapour phase (Fig. 8). The system at short wavelengths is slightly perturbed by the presence of some SiO(g). As no CS can be detected, the pyrite reacts directly with the high load of Si on the platform. When the vaporization of Si and FeS2 is per- formed from the wall the same behaviour reported in Fig. 8 is observed. The only difference is represented by the absence of perturbations in the appearance of the 'Z-'Z system of SiS, which indicates the absence of detectable SiO. The reaction with O2 entering through the dosing hole is probably less favourable in the case of wall atomization in comparison with the platform. The cloud of O2 is in fact mainly distributed around the hole.I6 The vaporization of SiO, and FeS, leads to some increase in the intensity of the bands of SiO at the end of the vaporization step, but the features of the vapour phase are similar to those reported in Fig. 8.
Vaporization of Germanium The behaviour of Ge follows the trend observed for Si, although the appearance of molecular species occurs about 300 "C below that of Si species (Ge m.p. 940 "C).
The irregular behaviour of Ge during atomization has been attributed to the loss of the element as molecular species by various as GeO and GeS are very volatile (b.p. 710 and 430 "C, respectively). Frech and Baxterlg concluded that the conditions for the quantitative formation of Ge atoms are not readily achieved." The instrumental conditions and the presence of acids affect the formation of GeO and GeS, and consequently the efficiency of atomization. The spectrum of GeS(g) has been shown and the evolution of GeS has been followed at a fixed wavelength at one of the most intense bands of the 'C-'lJ ~ y s t e m . ~
The spectral behaviour of Ge vaporized at 1700 "C is shown in Fig. 9. As in the case of Si, the monoxide GeO(g) is formed during the vaporization of the element. The GeO spectrum is characterized by the presence of two systems. The one between 230 and 300nm is due to the 'Z-lII transition, while the one
1.6
8 0, :: m
a 4 0.8
1.5
Fig.8 Spectra collected during the vaporization of Si and FeSz at 2000 "C. Collection time 0.1 s, interval 0.1 s (see Fig. 1 for explanation)
1.6
0)
C m < 0.8 n s a
I
0 190 215 240 265 290 315 340
Wavelengthhm
Fig. 9 Collection time 0.1 s, interval 0.2 s (see Fig. 1 for explanation)
Spectra collected during the vaporization of Ge at 1700°C.
below 230 nm is attributed to a lZ-'Z tran~iti0n.l~ The features of the GeO spectrum compare well with those of SiO, except for the system at short wavelengths, which occurs below 190nm in the case of Si. The vaporization of GeO, leads to the formation of GeO(g), analogous with the behaviour of Si and SiO,. Above 1700°C the evolution of GeO is very fast and also occurs during the fast heating from the ashing to the atomization step.
The presence of CaSO, gives rise to the formation of GeS(g) and GeO(g) as already shown for Si (Fig. 10). The spectrum of GeS is characterized by the band system between 280 and 340nm, attributable to the 'E-'n transition, and the system of sharp bands between 220 and 240 nm ('Z-'C, tran~ition). '~ At 1700"C, CO, SO, and CS molecules cannot be detected owing to the low temperature. The spectrum reported by
2.0
.4
a, C v) (II --. e E P F a 1.0
.7
r.c" t 0 190 215 240 265 290 315 340
Wave I e n g t h/n m
Fig. 10 Spectra collected during the vaporization of Ge and CaSO, at 1700°C. Collection time 0.1 s, interval 0.2 s (see Fig. 1 for explanation)
Publ
ishe
d on
01
Janu
ary
1994
. Dow
nloa
ded
by U
nive
rsity
of
War
saw
on
27/1
0/20
14 1
3:16
:41.
View Article Online

448 JOURNAL OF ANALYTICAL ATOMIC SPECTROMETRY, MARCH 1994, VOL. 9
Dittrich et ~ l . , ~ obtained during the atomization of Ge in the absence of sulfuric acid, can be attributed to GeO(g), which forms easily during the thermal treatment.
The presence of FeS, leads to a vapour-phase behaviour very similar to that obtained in the presence of CaSO, (Fig. 11). The vapour species appear at the very beginning of the step, while in the case of CaSO, the appearance of these species is delayed. Although Dittrich et uL7 have suggested that GeS(g) is formed through a gas-phase reaction, Doidge and McAllisterg proposed that the formation of GeS occurs in the condensed phase, as they detected this species in an electrother- mal vaporization mass spectrometry system operating under vacuum. The formation of GeS in the condensed phase with the fast evolution of the vapours follows the solid-solid mechanism proposed for SiS.
The main difference between Si and Ge concerns the pres- ence, in the case of Ge, of GeO(g) in any of the thermal conditions examined, regardless of the type of vaporization (from the platform or from the wall) or the type of S species added, while in the case of Si it is possible to obtain SiS(g) as single molecular species from wall vaporization.
Spectral Characteristics
The spectra of the gaseous oxides and sulfides of Si and Ge are shown in Fig. 12. Spectrum D is the sum of the spectra of GeS and GeO. The band systems for Ge species are shifted to higher wavelengths in comparison with those of the Si species. As already mentioned, the 'C.-lC transition for SiO falls below 190 nm. The wavelengths and relative intensities of the bands of the 'Z-'II systems are reported in Table2. The spectral data compare well with those reported by Pearse and Gaydon,', although the relative intensities of the bands are fairly different in some instances. It should also be pointed out that the band systems of the diatomic molecules CS and CO as shown in the previous figures belong to 1C.-'17 transitions, and this type of transition is clearly observed in ab~orpti0n.l~
Some of the band systems (SiO and SiS) can be observed in real samples that have appropriate Si contents. During the atomization of trace elements, the correction of such non- specific absorption is therefore required. Ohlsson and Frech2* showed the splitting of the bands of PO and the consequent over-correction of the background for some analytical lines in inverse Zeeman-effect ETAAS.
When the Zeeman effect is used for the correction of non-
2.0 r 1
.4
u) -. E
.7 ir
0 190 215 240 265 290 315 340
Wavelengthlnm
Fig. 11 Spectra collected during the vaporization of Ge and FeS, at 1700 "C. Collection time 0.1 s, interval 0.2 s (see Fig. 1 for explanation)
0.6
a,
& 0.4
2 u) a d
1 1
B r, Y \ I ' 0.2
A 1
0 190 215 240 265 290 315 340
Wavelengt h/n m
Fig. 12 Spectra of: A, SiO; B, GeO; C, SiS; and D, GeO+GeS
Table 2 Spectral data of Si and Ge oxides and sulfides
SiO SiS GeO GeS
A/nm I,*
213.6 3 215.3 3 217.3 6 219.4 4 221.1 9 223.1 4 225.1 10 229.2 10 234.0 8 236.0 5 238.1 2 240.8 6 248.3 4 250.6 2 256.1 1 258.1 1
Afnm
253.8 255.2 256.6 258.6 260.0 262.0 263.7 265.7 267.8 271.5 273.9 275.6 277.6 282.1 285.8 288.5 295.3 297.4 302.5 304.5
I r 7 7 9 8 9 7
10 6
10 9 6 8 8 6 3 6 4 3 1 1
A/nm I ,
234.7 4 238.1 6 241.5 8 243.5 7 244.9 9 247.2 7 248.6 9 25k.O 7 252.7 10 256.8 9 261.2 8 263.2 4 265.6 6 268.0 6 272.7 4 275.1 2 277.5 1 280.2 3 288.0 2 296.2 1 298.9 1
Alnm I,
282.4 7 285.1 8 288.2 10 291.2 10 294.6 9 298.0 8 301.5 6 302.8 5 304.8 3 306.6 5 310.3 3 312.0 3 315.9 3 321.8 2 328.0 1 334.1 1
*Relative intensities, I,, refer to the most intense band of each system and are calculated from the baseline of the system.
specific absorption, the various bands behave in different ways according to the type of transitions involved. The 'C-'Z system of SiS (Fig. 12), although consisting of sharp and symmetrical bands, does not show any splitting of the bands in the presence of a magnetic field, as the magnetic moment associated with the orbital and spin angular moments of the electrons is zero." The magnetic moment associated with orbital and spin angular moments of electrons represents the major contribution to the total magnetic moment of a diatomic molecule, therefore the splitting of bands would be very small even for very intense magnetic fields. In the case of the 'Z-'II transitions (systems of SiO and SiS at high wavelength), the band splitting is given by the magnetic moment of the 'I7 state, which corresponds to 1 J T-l. Hence, splitting of molecular lines having width similar to that observed for atoms can occur, but only for low values of the total angular momentum, J.,l Therefore the interference of SiO and SiS with background correction using the Zeeman effect, owing to splitting of molecular lines, should appear in limited and defined positions of the UV spectrum and only a few lines of analytical interest could be affected.
The same observations made for the splitting of Si species
Publ
ishe
d on
01
Janu
ary
1994
. Dow
nloa
ded
by U
nive
rsity
of
War
saw
on
27/1
0/20
14 1
3:16
:41.
View Article Online

JOURNAL OF ANALYTICAL ATOMIC SPECTROMETRY, MARCH 1994, VOL. 9 449
can be extended to Ge. The analysis of slurries having Ge as a major element is not reported, however, the presence of sulfuric acid in solutions containing Ge at high concentration could be a potential source of over-correction owing to the formation of GeS(g).
The presence of S species in slurries could lead to loss of trace elements as sulfides. However, it has been shown3 that the addition of a Pd-Mg modifier to a slurry decreases the intensity of the molecular bands of SiO. This effect, although not examined in the present work, could be extended to SiS. The increase in ashing and atomization temperatures, attain- able when chemical modifiers are used, further reduces the presence of molecular species in the vapour phase.
The authors gratefully acknowledge a research fellowship granted to V.K. by the Commission of the European Communities (contract No. ERB-CIPA-CT-920371).
References Dittrich, K., CRC Crit. Rev. Anal. Chem., 1986, 16, 233. Tittarelli, P., and Lavorato, G., Anal. Chim. Acta, 1987, 201, 59. Tittarelli, P., and Biffi, C., J. Anal. At. Spectrom., 1992, 7, 409. Frech, W., and Cedergren, A., Anal. Chim. Acta, 1980, 113, 227. Muller-Vogt, G., and Wendl, W., Anal. Chem., 1981, 53, 651. Rademeyer, C. J., and Vermaak, I., J. Anal. At . Spectrom., 1992, 7 , 347. Dittrich, K., Mandry, R., Mothes, R., and Judelevic, J. G., Analyst, 1985,110, 169.
8
9
10 11
12
13 14
15
16
17
18
19
20
21
Kolb, A., Muller-Vogt, G., and Wendl, W., Spectrochim. Acta, Part B, 1987, 42, 951. Doidge, P. S., and McAllister, T., J. Anal. At . Spectrom., 1993, 8, 403. Tittarelli, P., Lancia, R., and Zerlia, T., Anal. Chem., 1985,57,2002. Shekiro, J. M., Skogerboe, R. K., and Taylor, H. E., Anal. Chem., 1988,60, 2578. Majidi, V., Ratliff, J., and Owens, M., Appl. Spectrosc., 1991, 45, 473. Biffi, C., and Tittarelli, P., Riv. Combust., 1991, 45, 197. Pearse, R. W. B., and Gaydon, A. G., The IdentiJcation of Molecular Spectra, Chapman and Hall, London, 3rd edn., 1963. Sturgeon, R. E., and Falk, H., Spectrochim. Acta, Part B, 1988, 43, 421. Gilmutdinov, A. K., Chakrabarti, C. L., Hutton, J. C., and Mrasov, R. M., J. Anal. At . Spectrom., 1992, 7, 1047. CRC Handbook of Chemistry and Physics, ed. Weast, R. C., CRC Press, Boca Raton, 64th edn., 1983. Welz, B., Bozsai, G., Sperling, M., and Radziuk, B., J. Anal. At. Spectrom., 1992, 7 , 505. Frech, W., and Baxter, D. C., Spectrochim. Acta, Part B, 1990, 45, 867. Ohlsson, K. E. A., and Frech, W., J. Anal. At . Spectrorn., 1989, 4, 379. Herzberg, G., Spectra of Diatomic Molecules, Van Nostrand, Princeton, 2nd edn., 1955,
Paper 31047376 Received August 5, 1993
Accepted October 12, 1993
Publ
ishe
d on
01
Janu
ary
1994
. Dow
nloa
ded
by U
nive
rsity
of
War
saw
on
27/1
0/20
14 1
3:16
:41.
View Article Online