6.3 Population ChangeWorld Geography 3200/02
Start
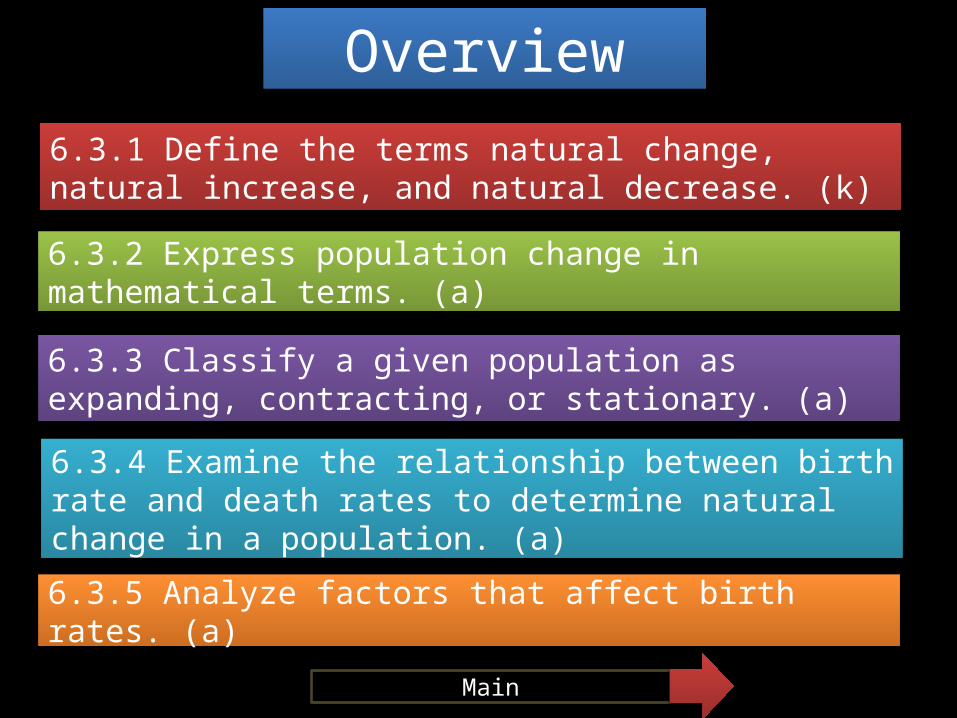
Overview6.3.1 Define the terms natural change, natural increase, and natural decrease. (k)
6.3.2 Express population change in mathematical terms. (a)
6.3.3 Classify a given population as expanding, contracting, or stationary. (a)
6.3.4 Examine the relationship between birth rate and death rates to determine natural change in a population. (a)
6.3.5 Analyze factors that affect birth rates. (a)
Main
6.3.8 Given population data, calculate dependency ratios. (a)
6.3.9 Describe the factors that contribute to a graying of the population. (k)
6.3.10 Project future population trends from data provided. (i)
6.3.6 Analyze factors that affect death rates.(a)
6.3.7 Define the term dependency ratio. (k)
Overview
Main
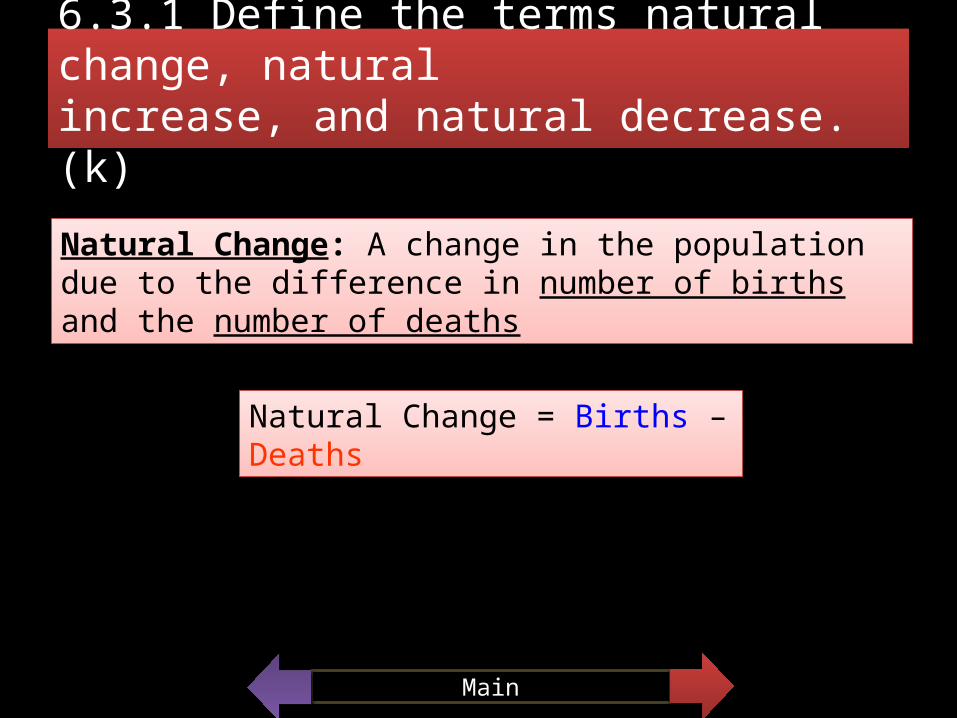
6.3.1 Define the terms natural change, naturalincrease, and natural decrease. (k)
Main
Natural Change: A change in the population due to the difference in number of births and the number of deaths
Natural Change = Births – Deaths
• Natural Increase - population is growing because the number of births are greater than the number of deaths.
• 5500 Births - 4800 Deaths• Population had a NATURAL INCREASE of 700 people.
• Natural Decrease - population is shrinking because the number of births are less than the number of deaths.
* 6300 Births - 7800 Deaths* Population had a NATURAL DECREASE of 1500 people.
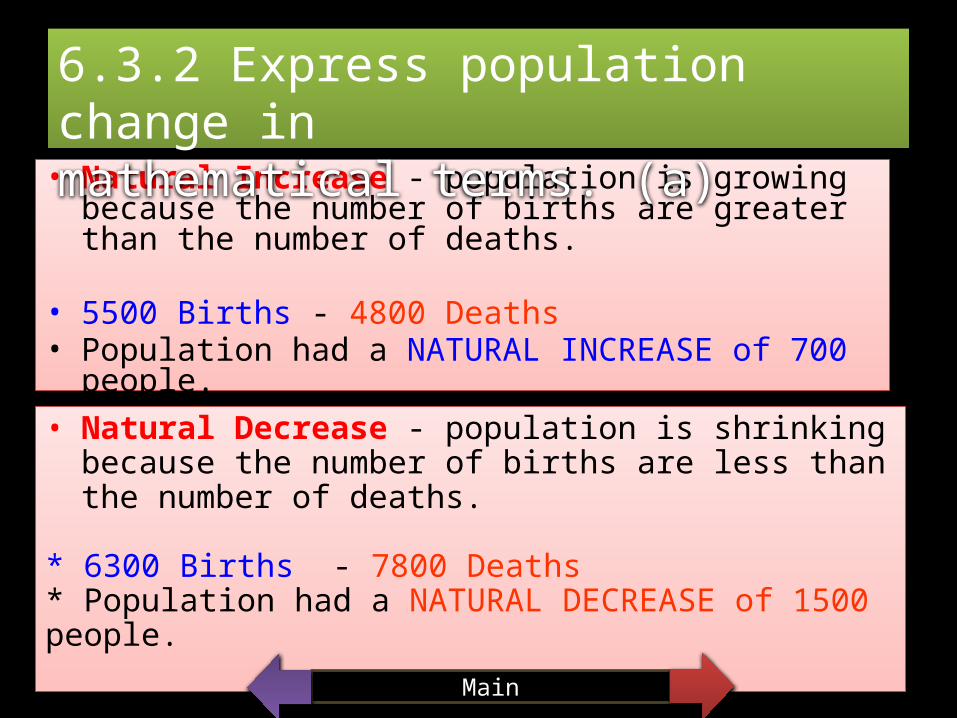
6.3.2 Express population change inmathematical terms. (a)
Main
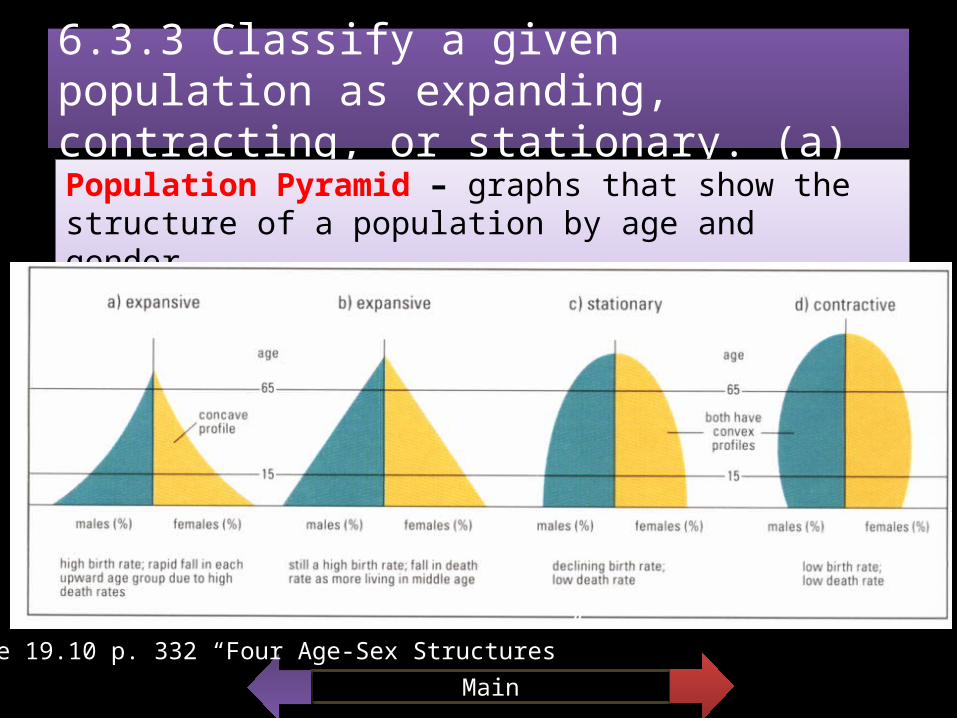
6.3.3 Classify a given population as expanding,contracting, or stationary. (a)
Main
Population Pyramid – graphs that show the structure of a population by age and gender.
Figure 19.10 p. 332 “Four Age-Sex Structures”
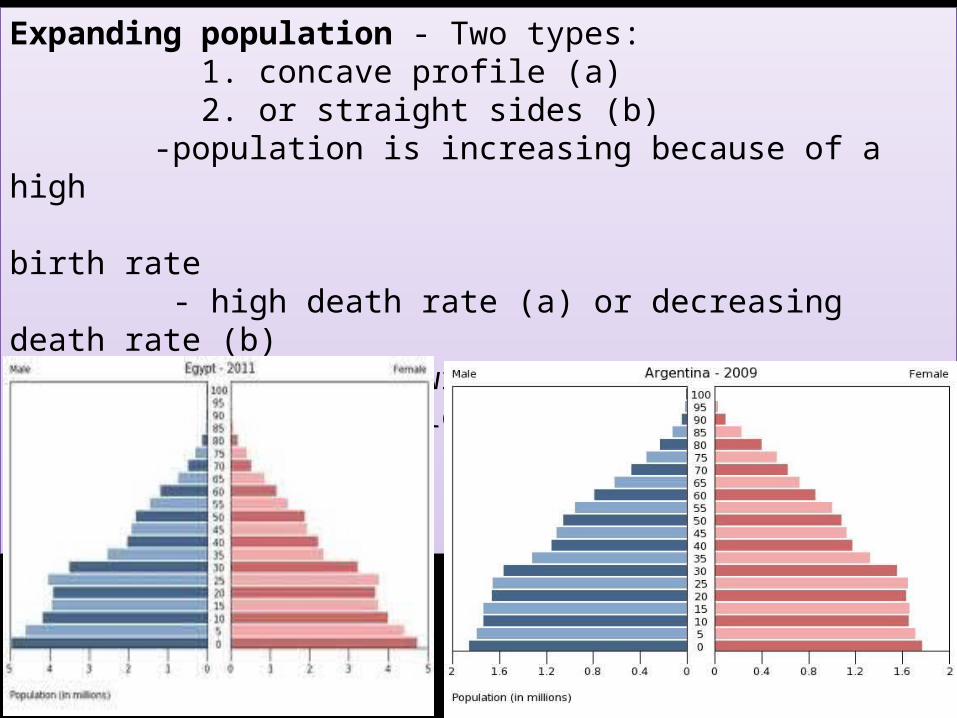
Expanding population - Two types: 1. concave profile (a) 2. or straight sides (b)
-population is increasing because of a high birth rate
- high death rate (a) or decreasing death rate (b) - pyramid is wide at the bottom - usually indicates undeveloped or developing
countries
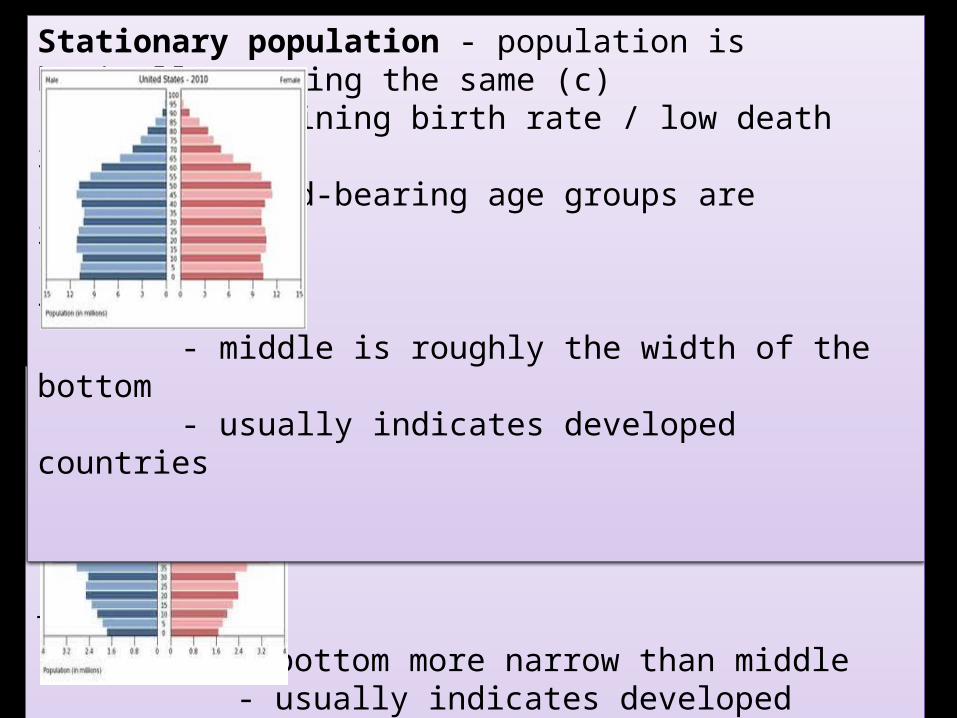
Contracting population - population is decreasing (d) - low birth rate / low death rate - child-bearing age are not replacing
themselves - bottom more narrow than middle - usually indicates developed countries
Stationary population - population is basically staying the same (c)- declining birth rate / low death rate- child-bearing age groups are replacing
themselves- middle is roughly the width of the bottom- usually indicates developed countries
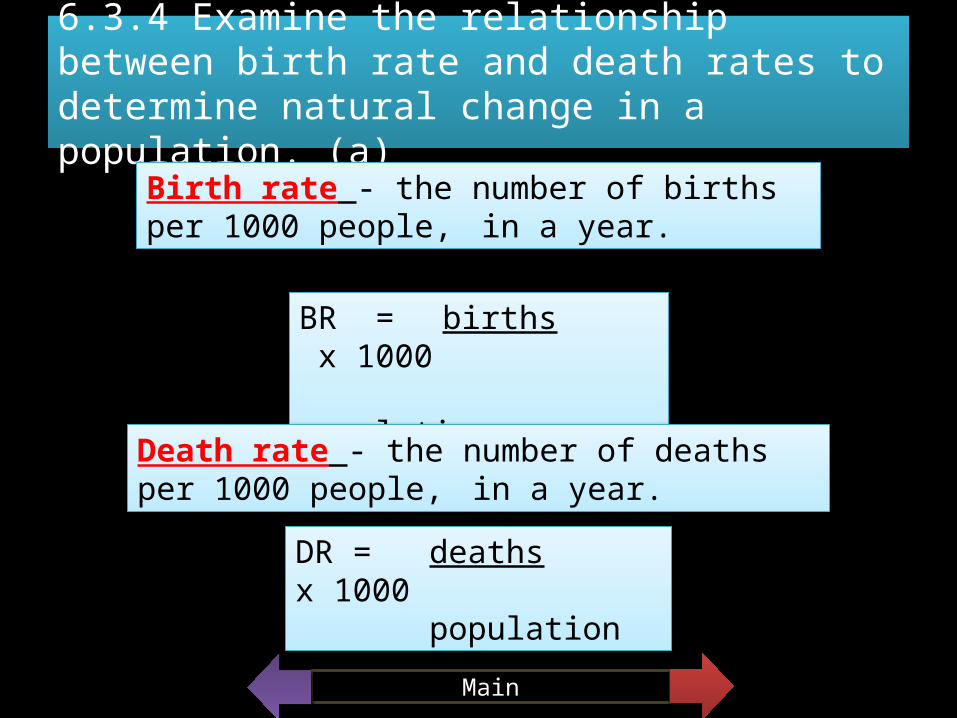
6.3.4 Examine the relationship between birth rate and death rates to determine natural change in a population. (a)
Main
Birth rate - the number of births per 1000 people, in a year.
BR = births x 1000 population
Death rate - the number of deaths per 1000 people, in a year.
DR = deaths x 1000 population
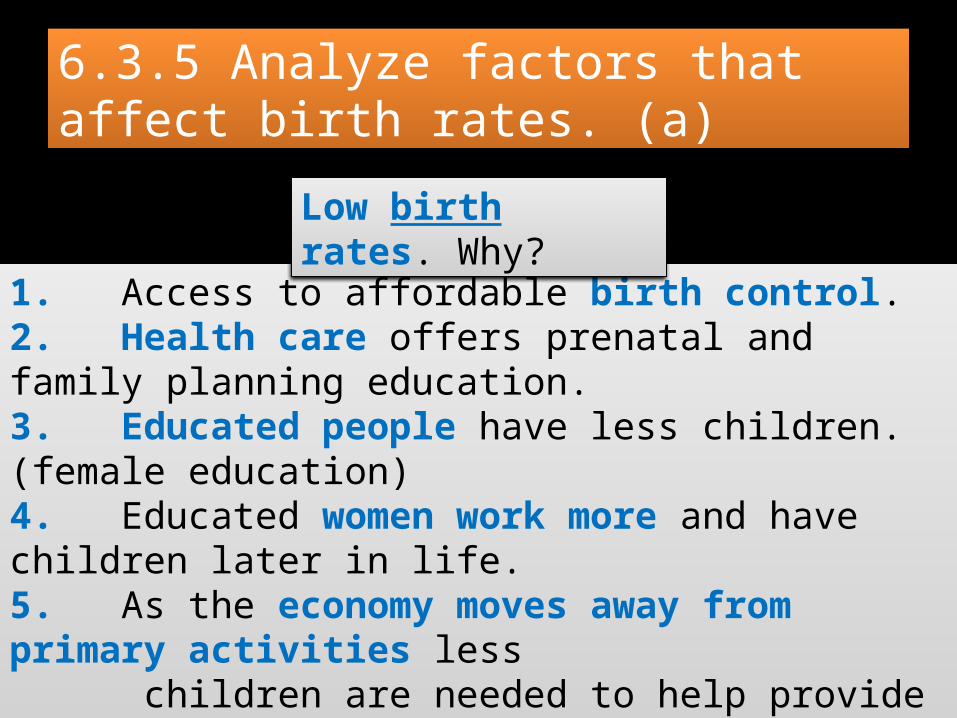
6.3.5 Analyze factors that affect birth rates. (a)
Main
1. Access to affordable birth control.2. Health care offers prenatal and family planning education.3. Educated people have less children. (female education)4. Educated women work more and have children later in life.5. As the economy moves away from primary activities less children are needed to help provide income.
Low birth rates. Why?
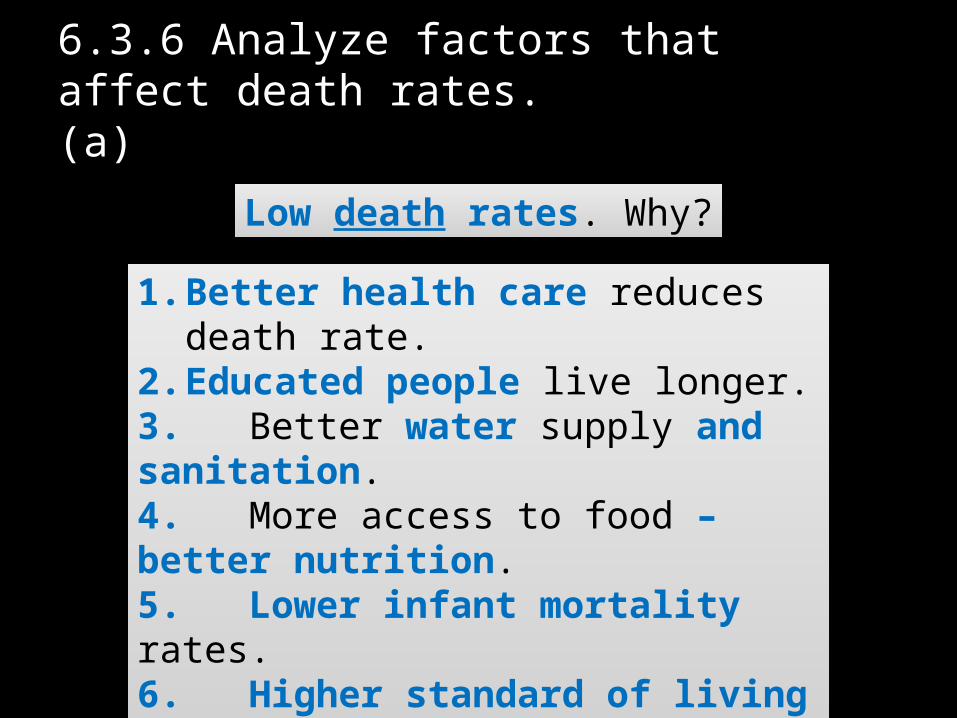
6.3.6 Analyze factors that affect death rates.(a)
Main
1. Better health care reduces death rate.2. Educated people live longer.3. Better water supply and sanitation.4. More access to food – better nutrition.5. Lower infant mortality rates.6. Higher standard of living leads to all of the above.
Low death rates. Why?
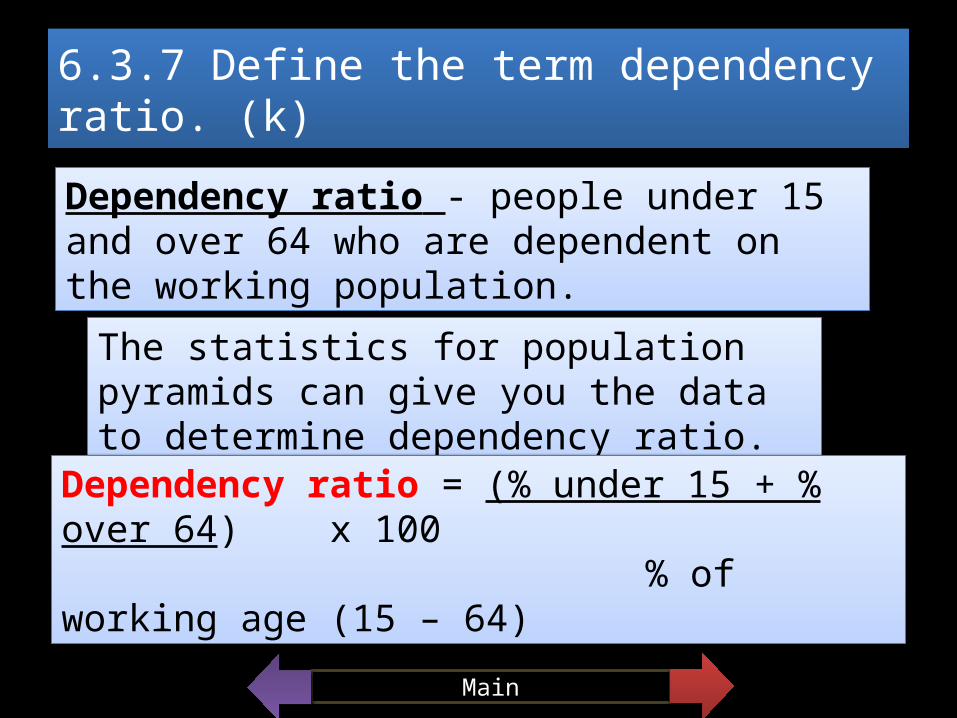
6.3.7 Define the term dependency ratio. (k)
Main
Dependency ratio - people under 15 and over 64 who are dependent on the working population.
The statistics for population pyramids can give you the data to determine dependency ratio.
Dependency ratio = (% under 15 + % over 64) x 100 % of working age (15 – 64)
6.3.8 Given population data, calculatedependency ratios. (a)
Main
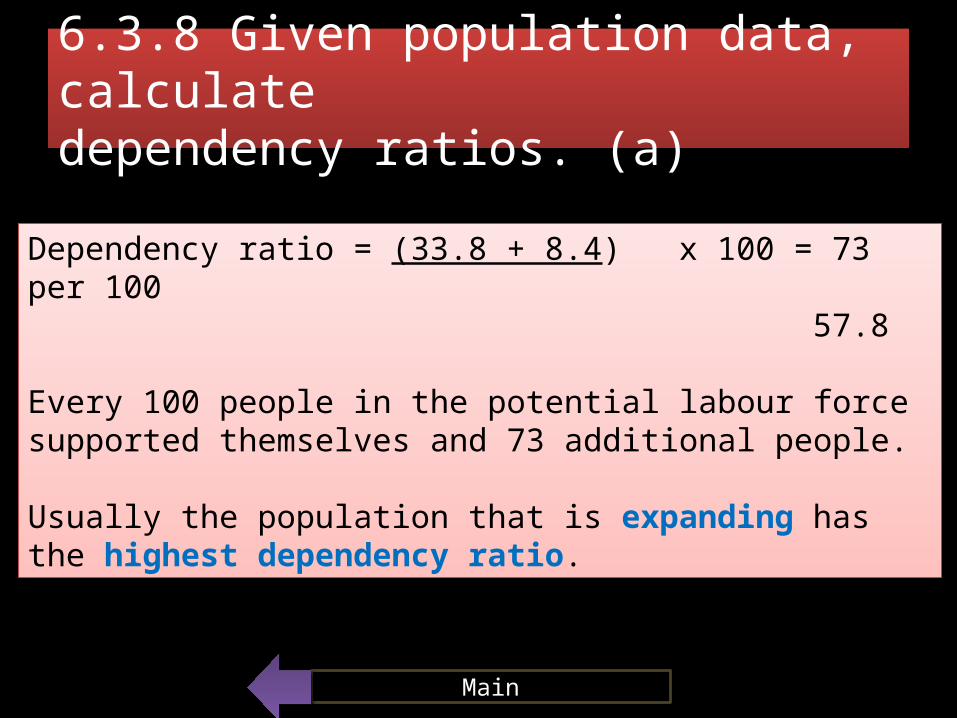
Dependency ratio = (33.8 + 8.4) x 100 = 73 per 100 57.8
Every 100 people in the potential labour force supported themselves and 73 additional people.
Usually the population that is expanding has the highest dependency ratio.
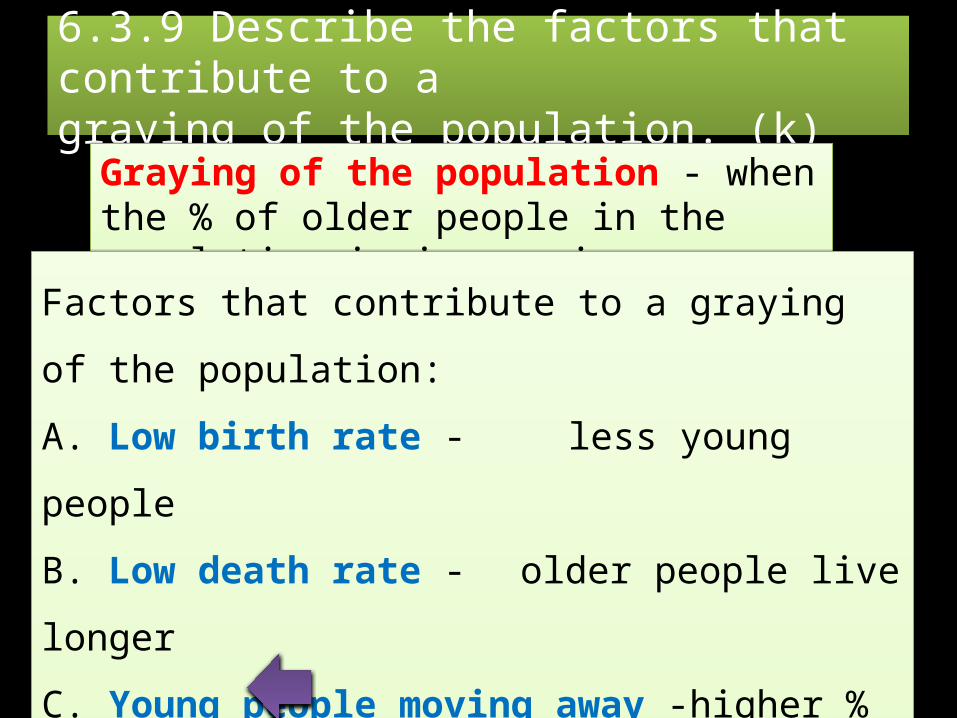
6.3.9 Describe the factors that contribute to agraying of the population. (k)
Main
Graying of the population - when the % of older people in the population is increasing.
Factors that contribute to a graying of the population:
A. Low birth rate - less young people
B. Low death rate - older people live longer
C. Young people moving away -higher % of older people
D. Better health care - people live longer
E. Higher standard of living - people live longer
Recommended