Embed Size (px)
Citation preview
Research and Applications
Validation of an internationally derived patient severity
phenotype to support COVID-19 analytics from electronic
health record data
Jeffrey G. Klann ,1 Hossein Estiri ,1 Griffin M. Weber ,2 Bertrand Moal ,3
Paul Avillach ,4 Chuan Hong ,4 Amelia L.M. Tan ,4 Brett K. Beaulieu-Jones ,4
Victor Castro,5 Thomas Maulhardt ,6 Alon Geva ,7,8 Alberto Malovini ,9
Andrew M. South ,10 Shyam Visweswaran ,11 Michele Morris ,11
Malarkodi J. Samayamuthu,11 Gilbert S. Omenn ,12 Kee Yuan Ngiam ,13
Kenneth D. Mandl ,8 Martin Boeker ,6 Karen L. Olson ,8 Danielle L. Mowery ,14
Robert W. Follett ,15 David A. Hanauer ,16 Riccardo Bellazzi ,9,17
Jason H. Moore ,14 Ne-Hooi Will Loh ,18 Douglas S. Bell ,15
Kavishwar B. Wagholikar ,19 Luca Chiovato,9,20 Valentina Tibollo,9
Siegbert Rieg ,21 Anthony L.L.J. Li,22 Vianney Jouhet ,23 Emily Schriver,24
Zongqi Xia ,25 Meghan Hutch,26 Yuan Luo,26 Isaac S. Kohane,4,* The Consortium for
Clinical Characterization of COVID-19 by EHR (4CE) (CONSORTIA AUTHOR),
Gabriel A. Brat ,4,* and Shawn N. Murphy27,28,*
1Laboratory of Computer Science, Department of Medicine, Massachusetts General Hospital, Harvard Medical School, Boston,
Massachusetts, USA, 2Department of Biomedical Informatics, Department of Medicine, Beth Israel Deaconess Medical Center,
Harvard Medical School, Boston, Massachusetts, USA, 3IAM Unit, Public Health Department , Bordeaux University Hospital, Bor-
deaux, France, 4Department of Biomedical Informatics, Harvard Medical School, Boston, Massachusetts, USA, 5Research Infor-
mation Science and Computing, Mass General Brigham, Boston, Massachusetts, USA, 6Institute of Medical Biometry and
Statistics, Medical Center Freiburg, Faculty of Medicine, University of Freiburg, Freiburg, Germany, 7Department of Anesthesiol-
ogy, Critical Care, and Pain Medicine, Boston Children’s Hospital, Boston, Massachusetts, USA, 8Computational Health Informat-
ics Program, Boston Children’s Hospital, Boston, Massachusetts, USA, 9Laboratory of Informatics and Systems Engineering for
Clinical Research, Istituti Clinici Scientifici Maugeri IRCCS, Pavia, Italy, 10Section of Nephrology, Department of Pediatrics, Bren-
ner Children’s Hospital, Wake Forest School of Medicine, Winston Salem, North Carolina, USA, 11Department of Biomedical Infor-
matics, University of Pittsburgh, Pittsburgh, Pennsylvania, USA, 12Department of Computational Medicine and Bioinformatics,
University of Michigan, Ann Arbor, Michigan, USA, 13Department of Biomedical Informatics-WisDM, National University Health
System, Singapore, 14Department of Biostatistics, Epidemiology, and Informatics, Institute for Biomedical Informatics, University
of Pennsylvania Perelman School of Medicine, Philadelphia, Pennsylvania, USA, 15Department of Medicine, David Geffen School
of Medicine at UCLA, Los Angeles, California, USA, 16Department of Learning Health Sciences, University of Michigan Medical
School, Ann Arbor, Michigan, USA, 17Department of Electrical, Computer and Biomedical Engineering, University of Pavia, Italy,18Division of Critical Care, National University Health System, Singapore, 19Department of Medicine, Massachusetts General Hos-
pital, Boston, Massachusetts, USA, 20Department of Internal Medicine and Medical Therapy, University of Pavia, Pavia, Italy,21Division of Infectious Diseases, Department of Medicine II, Medical Center Freiburg, Faculty of Medicine, University of Frei-
burg, Freiburg, Germany, 22National Center for Infectious Diseases, Tan Tock Seng Hospital, Singapore, 23ERIAS-INSERM U1219
BPH, Bordeaux University Hospital, Bordeaux, France, 24Data Analytics Center, Penn Medicine, Philadelphia, Pennsylvania, USA,25Department of Neurology, University of Pittsburgh, Pittsburgh, Pennsylvania, USA, 26Department of Preventive Medicine, North-
western University Feinberg School of Medicine, Chicago, Illinois, USA, 27Department of Neurology, Massachusetts General Hos-
VC The Author(s) 2021. Published by Oxford University Press on behalf of the American Medical Informatics Association.
This is an Open Access article distributed under the terms of the Creative Commons Attribution Non-Commercial License (http://creativecommons.org/licenses/by-nc/4.0/),
which permits non-commercial re-use, distribution, and reproduction in any medium, provided the original work is properly cited. For commercial re-use, please contact
[email protected] 1411
Journal of the American Medical Informatics Association, 28(7), 2021, 1411–1420
doi: 10.1093/jamia/ocab018
Advance Access Publication Date: 4 May 2021
Research and Applications
Dow
nloaded from https://academ
ic.oup.com/jam
ia/article/28/7/1411/6132348 by guest on 11 September 2022

pital, Boston, Massachusetts, USA, and 28Research Information Science and Computing, Mass General Brigham, Boston, Massa-
chusetts, USA
*Authors contributed equally.
Corresponding Author: Jeffrey G. Klann, 50 Staniford St., Suite 750, Boston, MA 02114, USA ([email protected])
Received 8 October 2020; Revised 14 January 2021; Editorial Decision 25 January 2021; Accepted 29 January 2021
ABSTRACT
Objective: The Consortium for Clinical Characterization of COVID-19 by EHR (4CE) is an international collabora-
tion addressing coronavirus disease 2019 (COVID-19) with federated analyses of electronic health record (EHR)
data. We sought to develop and validate a computable phenotype for COVID-19 severity.
Materials and Methods: Twelve 4CE sites participated. First, we developed an EHR-based severity phenotype
consisting of 6 code classes, and we validated it on patient hospitalization data from the 12 4CE clinical sites
against the outcomes of intensive care unit (ICU) admission and/or death. We also piloted an alternative ma-
chine learning approach and compared selected predictors of severity with the 4CE phenotype at 1 site.
Results: The full 4CE severity phenotype had pooled sensitivity of 0.73 and specificity 0.83 for the combined out-
come of ICU admission and/or death. The sensitivity of individual code categories for acuity had high variabil-
ity—up to 0.65 across sites. At one pilot site, the expert-derived phenotype had mean area under the curve of
0.903 (95% confidence interval, 0.886-0.921), compared with an area under the curve of 0.956 (95% confidence
interval, 0.952-0.959) for the machine learning approach. Billing codes were poor proxies of ICU admission,
with as low as 49% precision and recall compared with chart review.
Discussion: We developed a severity phenotype using 6 code classes that proved resilient to coding variability
across international institutions. In contrast, machine learning approaches may overfit hospital-specific orders.
Manual chart review revealed discrepancies even in the gold-standard outcomes, possibly owing to heteroge-
neous pandemic conditions.
Conclusions: We developed an EHR-based severity phenotype for COVID-19 in hospitalized patients and vali-
dated it at 12 international sites.
Key words: novel coronavirus, disease severity, computable phenotype, medical informatics, data networking, data interoperability
INTRODUCTION
Background and significanceThe coronavirus disease 2019 (COVID-19) pandemic has stretched
healthcare systems around the world to capacity. The need for ac-
tionable and reliable data has highlighted the value of the electronic
health record (EHR). In particular, practice patterns and patient
outcomes recorded in the EHR can be rapidly aggregated and ana-
lyzed to promote learning, discovery, and clinical feedback.1 Despite
large international investments to build such research networks,2–4
progress has been slow5; COVID-19 has challenged our informatics
infrastructures and highlighted continued weaknesses.6
The Consortium for Clinical Characterization of COVID-19 by
EHR (4CE) is a recently convened volunteer consortium of over 340
international hospitals that are leveraging EHR data and clinical ex-
pertise to develop robust informatics-driven investigations into
COVID-19. The approach relies on shared analytics scripts support-
ing 2 common research analytics formats in which analysis is local
and aggregation is central.7,8 By leveraging investments in standard
analytic models while respecting data governance and patient pri-
vacy, we completed the initial phase of the study within 2 months of
the pandemic’s beginning, characterizing COVID-19 comorbidities
and laboratory test values from 96 hospitals worldwide.9
To understand patient disease courses and investigate outcomes using
EHR data, reliable and robust measures of disease severity are critical. In-
tuitively, outcomes such as intensive care unit (ICU) admission and in-
hospital death seemed to be good correlates of severity. Early work in
4CE attempted to use these outcomes as severity measures, but it became
apparent that these data are not reliably available in all environments.
Therefore, 4CE sought to develop a reasonable proxy measure of worse
outcomes in hospitalized patients with COVID-19 based on widely avail-
able EHR data such as medication, diagnosis, and lab codes. This combi-
nation of codes is essentially a computable phenotype, which is
commonly used in medical informatics to detect the presence of a disease
state through proxy measures when no single validated data element for
a disease exists or when individual diagnosis codes are mediocre predic-
tors of actual disease presence.10–13
The most common method for defining a computable phenotype is
through clinical and informatics expertise, wherein terms are specified
that correlate clinical experience with the phenotype. However, a phe-
notype can make sense clinically yet have poor performance due to cod-
ing anomalies and variation between sites. Alternatively, it is possible to
define phenotypes using a data-driven approach that uses statistical
algorithms to find predictors of the desired outcomes directly from the
data. These can also exhibit generalization problems due to overfitting.
Thus, an important next step for either approach is to validate the phe-
notype, which can be done by comparing the concordance between the
derived phenotype and the desired outcome—for which it is a proxy—
at multiple sites. Although a variety of methods for defining an outcome
are possible, the most reliable method of validating a computable phe-
notype is to perform chart review, which is considered the gold standard
of truth about the patient.14,15 For example, identification of ICU
admissions is not always accurate, especially in a pandemic, in which
formal protocols are not always followed. In hospitals where hallways
were converted into ad hoc ICUs to support the surge of sick patients,
1412 Journal of the American Medical Informatics Association, 2021, Vol. 28, No. 7
Dow
nloaded from https://academ
ic.oup.com/jam
ia/article/28/7/1411/6132348 by guest on 11 September 2022

standardized EHR data elements such as “transfer to ICU” would not
be properly recorded. Manual chart review (and perhaps natural lan-
guage processing in the near future) would be the only method to dis-
cover a patient’s ICU status.
Existing severity measuresThere has been heightened interest in disease severity measures since
the outbreak of COVID-19.16 We performed a review of 26 early
COVID-19 studies. Five used ICU admission as the severity mea-
sure, 1 used American Thoracic Society criteria for severity of
community-acquired pneumonia,17 and the rest used the World
Health Organization (WHO) definition.18 Other severity measures
have been suggested19; however, they are not widely used or well
validated.
The WHO broadly defines “severe” disease as fever or suspected
respiratory infection, plus 1 of the following: respiratory rate >30
breaths/min, severe respiratory distress, or arterial oxygen satura-
tion measured by pulse oximeter �93% while breathing room air.18
The WHO definition includes patients admitted to the hospital with
pneumonia who can be managed on medical wards and are not criti-
cally ill. The best evidence suggests that about 85% of such patients
will never progress to critical illness such as acute respiratory dis-
tress syndrome (ARDS).20
ICU admission cannot be used as a severity measure in 4CE be-
cause many sites do not have these data available in their EHRs.
4CE is only collecting common EHR data classes (demographics, di-
agnoses, medications, labs, and International Classification of Dis-
eases [ICD] procedure codes), and thus a 4CE severity measure must
include only these classes. The WHO definition has the same issue
and is also very inclusive. It is most accurately a proxy for hospital
admission (moderate disease), rather than a difficult hospital course
(severe disease). As such, the WHO definition is too sensitive for
4CE’s goal of identifying patients with severe disease.
ObjectiveWe set out to develop an EHR-driven severity phenotype as a proxy
for worse clinical course in hospitalized patients with COVID-19
and validate it against the outcomes ICU admission and/or death in
a subset of the global 4CE consortium. Because outcome data had
uncertain accuracy, we performed a focused chart review to better
understand validation performance. Finally, we compared a data-
driven algorithm at 1 site to the expert-derived 4CE phenotype to
understand the strengths and weaknesses of the 2 approaches.
MATERIALS AND METHODS
Defining severityFirst, we developed a 4CE severity phenotype that is both clinically
reasonable and possible to identify across our diverse sites. To do
this, we needed to limit severity to the EHR data classes that 4CE is
collecting: demographics, diagnoses, medications, labs, and ICD
procedure codes. We did not use outcomes (eg, ICU admission),
symptoms (eg, wheezing), or vital signs (eg, respiratory rate), as
these are not widely or reliably available in EHRs.
We used the WHO severity definition as a starting point and 2
authors (G.M.W. and G.A.B.) identified a much more specific diag-
nosis group: patients who required invasive mechanical ventilation
for acute respiratory failure or vasoactive medication infusions for
shock.
We created a value set of EHR data elements that suggest these
disease states, based on commonly available data classes:
• Lab test: partial pressure of carbon dioxide or partial pressure of
oxygen• Medication: sedatives/anesthetics or treatment for shock• Diagnosis: ARDS, ventilator-associated pneumonia• Procedure: endotracheal tube insertion or invasive mechanical
ventilation21
These data elements correlate with many individual standard
codes. To identify standard codes, we cross-referenced the i2b2 on-
tology in the ACT (Accrual to Clinical Trials) network.2 This is a
comprehensive terminology dictionary of 2.5 million codes found in
many EHRs, with individual codes arranged hierarchically in folders
describing the above concepts. The result was a list of �100 codes in
the ICD-9 and ICD-10, LOINC (Logical Observation Identifiers
Names and Codes), and RxNorm formats, which are international
standards used for research. These are listed in Supplementary Table
A1 and on the Github sites for 4CE data extraction and the ACT
COVID ontology.22,23
Local sites expanded these standard codes to match their local
codes. Often, this was assisted with previous mappings from i2b2
where local items were a child folder of the standard code.24 When
mappings were not straightforward, the terms that most closely
matched the definition were used, maximizing semantic equivalence
across sites. For example, some U.S. sites had both Current Proce-
dural Terminology (CPT) and ICD procedure codes; the CPT codes
were not added when ICD was available. In contrast, because some
European sites do not use the U.S. Clinical Modifications of ICD-
10, other coding systems like Operation and Procedure Classifica-
tion codes were added to identify invasive mechanical ventilation.
Because the presence of any of these codes suggest severe disease,
patients were assigned the severity phenotype if any code in the
value set was generated during the hospital course. This makes the
algorithm robust to practice variation—if one site does not include,
for example, medication codes, then the severity phenotype can still
be assigned through other code categories. Note that for laboratory
tests, the phenotype uses the existence of these codes and not the as-
sociated value, because performing the test (eg, partial pressure of
oxygen) suggests disease severity. Similarly, medication administra-
tion, regardless of the dose, indicates severe illness.
Network-wide analysis: 4CE severity validationTo validate the 4CE severity phenotype (and discover whether it ac-
tually works in practice), a subset of 12 sites with the necessary data
identified patients who were admitted to the ICU and/or who died.
Although not a perfect equivalence to severe disease or hospital
course, ICU admission and death are objective measures that can be
gleaned from patient data. We defined 3 options for confirming ICU
admission, in order from most to least accurate:
1. Chart review. This is considered the gold standard for identifying
outcomes like ICU admission and could have been particularly
useful in crisis situations like the COVID-19 pandemic. Nonethe-
less, chart review is time-consuming and laborious, so this option
was impractical without substantial human resources.
2. Local hospital data. Hospital systems have idiosyncratic meth-
ods of determining ICU status, but they tend to be fairly accurate
because they are used to determine admission, discharge, and
transfer status and to manage hospital bed allocation. However,
not all sites had access to local hospital data, and expertise was
Journal of the American Medical Informatics Association, 2021, Vol. 28, No. 7 1413
Dow
nloaded from https://academ
ic.oup.com/jam
ia/article/28/7/1411/6132348 by guest on 11 September 2022

required to incorporate this information into a data warehouse.
Such limitations underscored the rationale for development of
the severity phenotype.
3. Specific ICU Current Procedural Terminology (CPT) Procedure
Codes. In the United States, healthcare providers and hospitals
use CPT codes to bill for provided critical care services. CPT
codes for billing time spent providing critical care (99291,
99292) provide a third option for defining ICU admission. These
CPT codes were not used to define the severity phenotype.
Each site computed a set of 2 � 2 tables comparing the 4CE se-
verity phenotype with 3 outcomes (death only, ICU only, and ICU
or death) (Supplementary Table A2) for all patients in the 4CE co-
hort. The 4CE cohort included all hospitalized patients with a posi-
tive test for SARS-CoV-2 (severe acute respiratory syndrome
coronavirus 2) from 7 days before to 14 days after the hospitaliza-
tion. Sites calculated sensitivity, specificity, positive predictive value
(PPV), negative predictive value (NPV), and F1 score from these
tables. We used a fixed-effects meta-analysis model to estimate
pooled scores over all sites. Sites then calculated the performance of
individual code classes by computing the sensitivity for the same set
of 3 outcomes. This analysis gave further insight into the compo-
nents of the phenotype’s performance at each site. Sensitivity would
be highest for the full phenotype, as the trait is assigned when any
code in the 4CE severity value set is present. Additionally, each site
reported its approach for confirming ICU admission, total number
of ICU beds (to give a sense of site capacity), and any variation from
the standard 4CE severity definition or cohort definition. Sites per-
formed these analyses between August 5, 2020, and September 18,
2020, reflecting cases that were recorded from March to August
2020.
To understand the practical differences between methods of de-
fining ICU admission, we performed a limited analysis at 2 sites. We
used a set of chart-reviewed ICU admission data among 866 con-
firmed COVID-19 patients from Massachusetts General Hospital
(MGH) between March 8 and June 3, 2020. Extensive manual chart
reviews were completed by trained reviewers, including physicians,
pharmacists, research nurses, and clinical research coordinators.25
University of Freiburg Medical Center in Germany (UKFR) provided
a set of ICU admission flags obtained from manual chart review of
168 patients in their 4CE COVID-19 cohort that were directly re-
lated to their COVID-19 hospitalization. We compared coded ICU
admissions to the chart-reviewed data at MGH and UKFR for
patients in the 4CE cohort. These overlapping data sets allowed us
to compare the 2 definitions of ICU admission with the 4CE severity
phenotype. We also compared the performance of the chart-
reviewed definition to CPT code-based ICU admission (99291 and
99292) using MGH data.
Data-driven pilot analysisIt is possible to define a phenotype using a data-driven (rather than
expert-driven) approach. To better understand the differences be-
tween a data-driven vs expert-driven severity phenotype, we under-
took a machine learning approach at a single site, Mass General
Brigham, using an existing computable phenotyping pipeline.
First, we evaluated the classification performance of the 4CE se-
verity phenotype. Second, we performed automated computable
phenotyping using the minimize sparsity maximize relevance
(MSMR) dimensionality reduction algorithm to select codes from
among all possible data elements.26,27 In both approaches, we ap-
plied generalized linear models (GLMs) with a logit link, binomial
distribution, and component-wise functional gradient boosting28,29
to develop the computational models. We used the 4CE cohort with
ICU admission and/or death as the target for prediction. We trained
and tested the models using an 80–20 train-test split, which we iter-
ated 9 times to capture potential variability in performance metrics
due to sampling. Model tuning was performed via 5-fold cross-
validation. To evaluate the 2 computable phenotyping models, we
calculated the area under the receiver operating characteristic curve
(AUROC) on the held-out test sets.
RESULTS
4CE severity analysisTwelve sites participated in this analysis. The site names, locations,
number of hospital beds, number of ICU beds (not reflecting surge ca-
pacity), and total 4CE cohort size (rounded to the nearest 10) are shown
in Table 1. We also included the data source used for ICU admission
and whether the site’s code mapping included any significant additions
to the severity value set. (For example, European sites do not use the
U.S. ICD-10-CM, so additional standard codes were needed.) In further
results, site names were replaced by a randomly assigned region identi-
fier (either USAx for sites in the United States or GLOBALx for others).
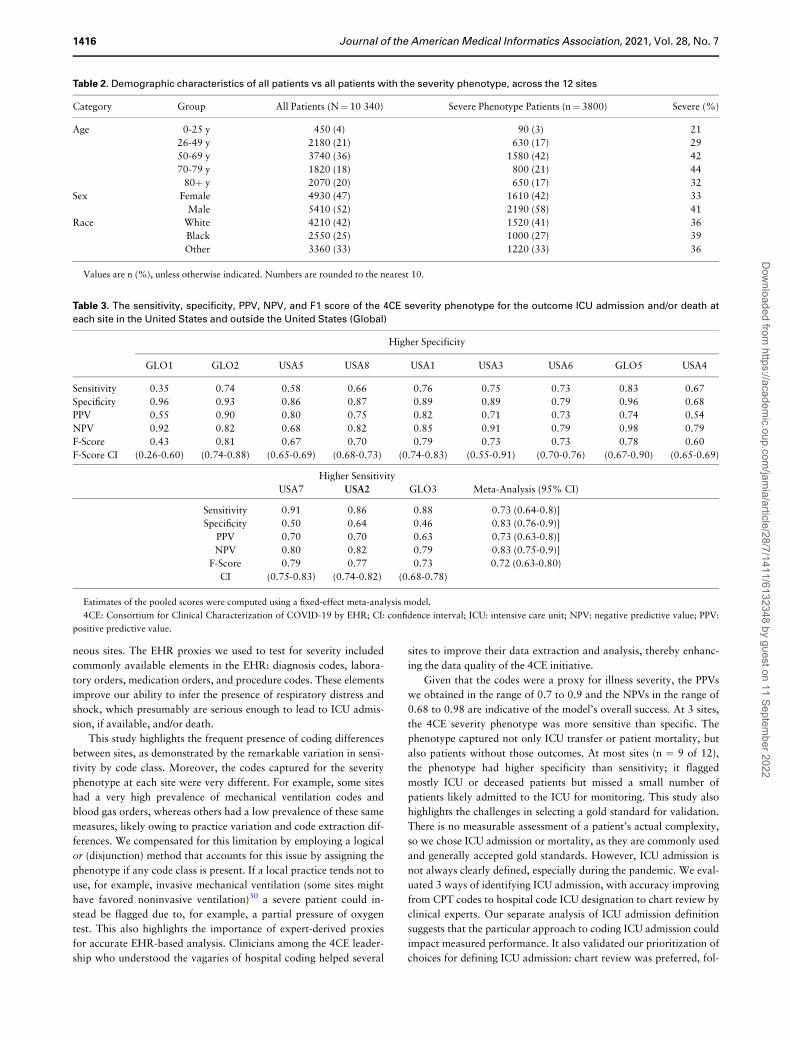
The demographic characteristics of the cohorts (all patients vs all
patients with the severity phenotype) across the 12 sites are shown
in Table 2.
Sites reported the sensitivity, specificity, PPV, and NPV of the
4CE severity phenotype for the outcome of ICU admission and/or
death. The pooled F score over 12 sites was estimated as 0.72 (95%
confidence interval [CI], 0.63-0.80) using a fixed-effect meta-analy-
sis model. The pooled sensitivity was 0.73 (95% CI, 0.64-0.82) with
mean 0.73 (range, 0.56). The pooled specificity was 0.83 (95% CI,
0.76-0.91) with mean 0.80 (range, 0.5). The sensitivity, specificity,
PPV, NPV, and F-score by site can be seen in Table 3. Sites also
computed these measures separately for ICU admission and death.
The pooled specificity went down for the individual outcomes (0.79
for ICU, 0.67 for death), but sensitivity was higher (0.77 for ICU,
0.76 for death). The statistics for the individual outcomes can be
seen in Supplementary Table A3 in the Appendix.
Sites computed the sensitivity of individual code classes to under-
stand how each contributed to the performance of the overall met-
ric. Code classes demonstrated high variability of sensitivity across
sites (Figure 1). For example, the anesthetic medication class had
sensitivity ranging from 0.15 to 0.76. Code class sensitivity for the
separate outcomes of ICU admission and death can be seen in Sup-
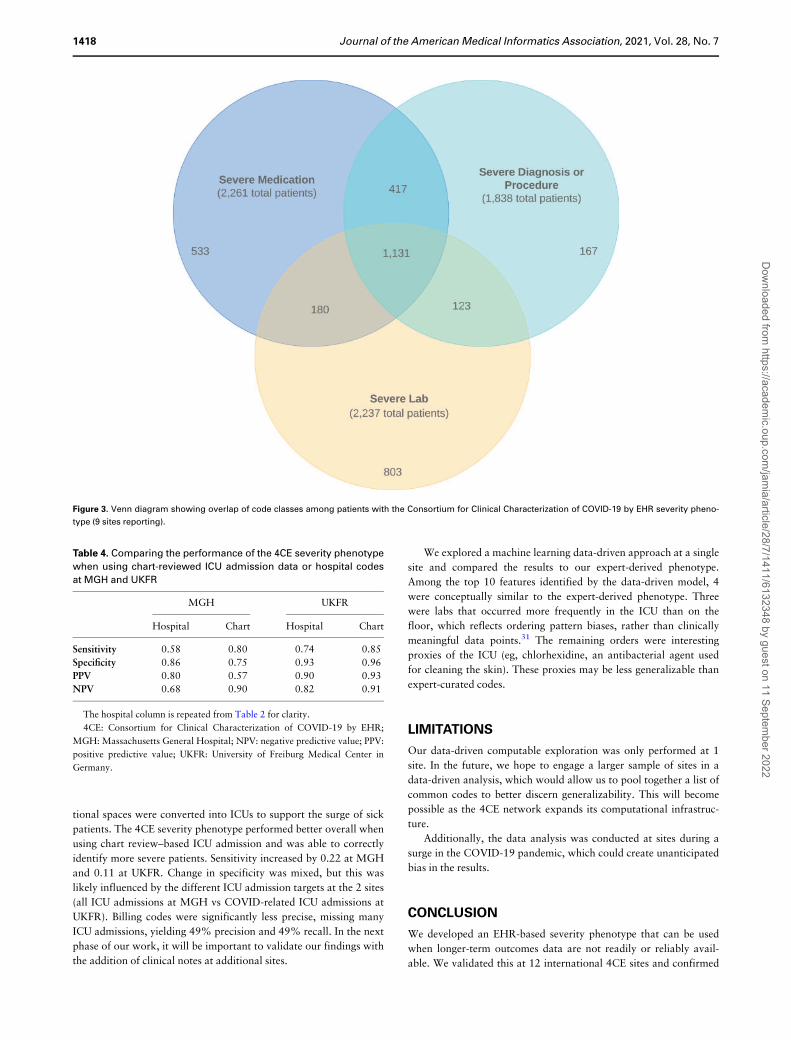
plementary Figures A1 to A3. Figure 2 shows the percentage of all
severe patients with a code in each class. Figure 3 shows the overlap
of high-level code classes in a Venn diagram.
Comparison of ICU definitionsWe computed the precision and recall of code-defined ICU admis-
sion using chart review as the reference at MGH and UKFR. At
MGH, we found agreement for ICU admission with 97% precision
and 83% recall. At UKFR, we measured 78% precision and 85% re-
call. At MGH, we also compared agreement of CPT-code ICU ad-
mission definition to chart-reviewed ICU admission and found a
49% precision and 49% recall.
We also recomputed summary statistics of the performance of
our 4CE severity phenotype for the outcome of ICU admission and/
or death using the chart-reviewed definition of ICU. At MGH and
UKFR, the sensitivity was higher using the chart-reviewed definition
1414 Journal of the American Medical Informatics Association, 2021, Vol. 28, No. 7
Dow
nloaded from https://academ
ic.oup.com/jam
ia/article/28/7/1411/6132348 by guest on 11 September 2022

(MGH: 0.80 vs 0.58 using hospital codes; UKFR: 0.85 vs 0.74 using
hospital codes). Specificity went down at MGH (0.75 vs 0.86 using
hospital codes), while it went up slightly at UKFR (0.96 vs 0.93 us-
ing hospital codes).
The differences between UKFR and MGH (lower agreement pre-
cision and higher specificity performance at UKFR) are likely due to
UKFR identifying only COVID-19–related ICU admissions, while
MGH identified all ICU admissions during the COVID-19 hospitali-
zation.
The full sets of summary statistics are reported in Table 4 and
Supplementary Table A4.
Data-driven pilotThe GLM model trained using the 4CE severity codes performed with a
mean AUROC of 0.903 (95% CI, 0.886-0.921) on the Mass General
Brigham COVID-19 cohort. The GLM model trained on MSMR-
selected codes (from among all possible diagnosis, medication, and
LOINC codes) resulted in a mean AUROC of 0.956 (95% CI, 0.952-
0.959) (see Figure 4).
The MSMR-based algorithm’s top 10 codes (by odds ratio) fell
into the following categories:
• Similar to the 4CE definition: partial pressure of carbon dioxide,
partial pressure of oxygen, ARDS, sedatives• Reflective of ICU ordering patterns: d-dimer, immature granulo-
cytes, albumin• Surprising proxies of severity: chlorhexidine, glycopyrrolate, pal-
liative care encounter
DISCUSSION
When using EHR-derived data for research, we often adopt proxies
for outcomes, especially if these outcomes are infrequently or
poorly recorded in the EHR. Validation of these proxies is essential
so that we can understand their strengths and limitations. Further-
more, to perform research on a network and especially at global
scale, the outcome proxies must use data types broadly available
through most EHRs and also be validated at multiple sites to ac-
count for differences in coding patterns. Examining subgroup per-
formance of the codes can further improve our ability to
understand cross-site differences.
In this study, our primary aim was to develop and validate an
EHR-based severity phenotype for the international 4CE consortium
to enable network-wide research on COVID-19 across heteroge-
Table 1. Participating 4CE sites and metadata on ICU and 4CE coding definitions, number of beds, and 4CE cohort size (rounded to the near-
est 10)
Healthcare System City Country Hospitals Total Beds ICU Beds ICU Data
Source
4CE Cohort Size Additional Codes in
Value Set
Mass General Brigham
(Partners HealthCare)
Boston, Mas-
sachusetts
United States 10 3418 292 Hospital data 3290 None
University of Pennsylvania Philadelphia,
Pennsylva-
nia
United States 5 2469 515 Hospital data 2330 Hospital data for in-
tubation and ven-
tilation
University of Pittsburgh Pittsburgh,
Pennsylva-
nia
United States 39 8400 589 CPT code and
hospital lo-
cation
990 CPT codes for intu-
bation and venti-
lation
Beth Israel Deaconess Medi-
cal Center
Boston, Mas-
sachusetts
United States 1 673 77 Hospital data 690 None
University of Michigan Ann Arbor,
Michigan
United States 3 1043 141 CPT code and
hospital lo-
cation
420 None
University of California, Los
Angeles
Los Angeles,
California
United States 2 786 192 Hospital data 430 None
Bordeaux University Hospital Bordeaux France 3 2676 180 Hospital data 360 CCAM (French pro-
cedure codes)
Istituti Clinici Scientifici
Maugeri
Pavia, Lumez-
zane/Bre-
scia, Milan
Italy 3 775 0 N/A (rehab
hospital—
no ICU)
260 None
Medical Center, University of
Freiburg
Freiburg Germany 1 1660 132 Hospital data 190 ICD-10 GM and
OPS codes
Boston Children’s Hospital Boston, Mas-
sachusetts
United States 1 404 107 ICU note type 60 None
National University Hospital Singapore Singapore 1 1556 65 Hospital data 260 SNOMED codes for
diagnoses; TOSP
billing codes for
procedures
St. Luke’s University Health
Network
Bethlehem,
Pennsylva-
nia
United States 12 1700 287 Hospital data 1230 None
4CE: Consortium for Clinical Characterization of COVID-19 by EHR; CPT: Current Procedural Terminology; ICD-10: International Classification of Dis-
eases–Tenth Revision–German Modification; ICU: intensive care unit; N/A: Not Applicable; OPS: Operation and Procedure Classification; SNOMED: Systema-
tized Nomenclature of Medicine; TOSP: Table of Surgical Procedures.
Journal of the American Medical Informatics Association, 2021, Vol. 28, No. 7 1415
Dow
nloaded from https://academ
ic.oup.com/jam
ia/article/28/7/1411/6132348 by guest on 11 September 2022
neous sites. The EHR proxies we used to test for severity included
commonly available elements in the EHR: diagnosis codes, labora-
tory orders, medication orders, and procedure codes. These elements
improve our ability to infer the presence of respiratory distress and
shock, which presumably are serious enough to lead to ICU admis-
sion, if available, and/or death.
This study highlights the frequent presence of coding differences
between sites, as demonstrated by the remarkable variation in sensi-
tivity by code class. Moreover, the codes captured for the severity
phenotype at each site were very different. For example, some sites
had a very high prevalence of mechanical ventilation codes and
blood gas orders, whereas others had a low prevalence of these same
measures, likely owing to practice variation and code extraction dif-
ferences. We compensated for this limitation by employing a logical
or (disjunction) method that accounts for this issue by assigning the
phenotype if any code class is present. If a local practice tends not to
use, for example, invasive mechanical ventilation (some sites might
have favored noninvasive ventilation)30 a severe patient could in-
stead be flagged due to, for example, a partial pressure of oxygen
test. This also highlights the importance of expert-derived proxies
for accurate EHR-based analysis. Clinicians among the 4CE leader-
ship who understood the vagaries of hospital coding helped several
sites to improve their data extraction and analysis, thereby enhanc-
ing the data quality of the 4CE initiative.
Given that the codes were a proxy for illness severity, the PPVs
we obtained in the range of 0.7 to 0.9 and the NPVs in the range of
0.68 to 0.98 are indicative of the model’s overall success. At 3 sites,
the 4CE severity phenotype was more sensitive than specific. The
phenotype captured not only ICU transfer or patient mortality, but
also patients without those outcomes. At most sites (n ¼ 9 of 12),
the phenotype had higher specificity than sensitivity; it flagged
mostly ICU or deceased patients but missed a small number of
patients likely admitted to the ICU for monitoring. This study also
highlights the challenges in selecting a gold standard for validation.
There is no measurable assessment of a patient’s actual complexity,
so we chose ICU admission or mortality, as they are commonly used
and generally accepted gold standards. However, ICU admission is
not always clearly defined, especially during the pandemic. We eval-
uated 3 ways of identifying ICU admission, with accuracy improving
from CPT codes to hospital code ICU designation to chart review by
clinical experts. Our separate analysis of ICU admission definition
suggests that the particular approach to coding ICU admission could
impact measured performance. It also validated our prioritization of
choices for defining ICU admission: chart review was preferred, fol-
Table 2. Demographic characteristics of all patients vs all patients with the severity phenotype, across the 12 sites
Category Group All Patients (N¼ 10 340) Severe Phenotype Patients (n¼ 3800) Severe (%)
Age 0-25 y 450 (4) 90 (3) 21
26-49 y 2180 (21) 630 (17) 29
50-69 y 3740 (36) 1580 (42) 42
70-79 y 1820 (18) 800 (21) 44
80þ y 2070 (20) 650 (17) 32
Sex Female 4930 (47) 1610 (42) 33
Male 5410 (52) 2190 (58) 41
Race White 4210 (42) 1520 (41) 36
Black 2550 (25) 1000 (27) 39
Other 3360 (33) 1220 (33) 36
Values are n (%), unless otherwise indicated. Numbers are rounded to the nearest 10.
Table 3. The sensitivity, specificity, PPV, NPV, and F1 score of the 4CE severity phenotype for the outcome ICU admission and/or death at
each site in the United States and outside the United States (Global)
Higher Specificity
GLO1 GLO2 USA5 USA8 USA1 USA3 USA6 GLO5 USA4
Sensitivity 0.35 0.74 0.58 0.66 0.76 0.75 0.73 0.83 0.67
Specificity 0.96 0.93 0.86 0.87 0.89 0.89 0.79 0.96 0.68
PPV 0.55 0.90 0.80 0.75 0.82 0.71 0.73 0.74 0.54
NPV 0.92 0.82 0.68 0.82 0.85 0.91 0.79 0.98 0.79
F-Score 0.43 0.81 0.67 0.70 0.79 0.73 0.73 0.78 0.60
F-Score CI (0.26-0.60) (0.74-0.88) (0.65-0.69) (0.68-0.73) (0.74-0.83) (0.55-0.91) (0.70-0.76) (0.67-0.90) (0.65-0.69)
Higher Sensitivity
USA7 USA2 GLO3 Meta-Analysis (95% CI)
Sensitivity 0.91 0.86 0.88 0.73 (0.64-0.8)]
Specificity 0.50 0.64 0.46 0.83 (0.76-0.9)]
PPV 0.70 0.70 0.63 0.73 (0.63-0.8)]
NPV 0.80 0.82 0.79 0.83 (0.75-0.9)]
F-Score 0.79 0.77 0.73 0.72 (0.63-0.80)
CI (0.75-0.83) (0.74-0.82) (0.68-0.78)
Estimates of the pooled scores were computed using a fixed-effect meta-analysis model.
4CE: Consortium for Clinical Characterization of COVID-19 by EHR; CI: confidence interval; ICU: intensive care unit; NPV: negative predictive value; PPV:
positive predictive value.
1416 Journal of the American Medical Informatics Association, 2021, Vol. 28, No. 7
Dow
nloaded from https://academ
ic.oup.com/jam
ia/article/28/7/1411/6132348 by guest on 11 September 2022

lowed by hospital codes, and then billing data. The gold standard
for validation is chart review, and the differences between what is
actually recorded in a patient’s chart and what data elements are
available in the EHR are not always appreciated. In our analysis,
chart review as compared with hospital data had precision of 97%
(MGH) and 78% (UKFR) and recall of 83% (MGH) and 85%
(UKFR), owing largely to ICU admissions missed in hospital codes.
This is probably due to pandemic conditions, in which nontradi-
Figure 1. Sensitivity of code classes to identify intensive care unit (ICU) admission and/or death. ARDS: acute respiratory distress syndrome; PaCO2: partial pres-
sure of carbon dioxide; PaO2: partial pressure of oxygen; RX: medication.
Figure 2. Percentage of patients identified by the Consortium for Clinical Characterization of COVID-19 by EHR severity phenotype, broken down by code class.
ARDS: acute respiratory distress syndrome; PaCO2: partial pressure of carbon dioxide; PaO2: partial pressure of oxygen; RX: medication.
Journal of the American Medical Informatics Association, 2021, Vol. 28, No. 7 1417
Dow
nloaded from https://academ
ic.oup.com/jam
ia/article/28/7/1411/6132348 by guest on 11 September 2022
tional spaces were converted into ICUs to support the surge of sick
patients. The 4CE severity phenotype performed better overall when
using chart review–based ICU admission and was able to correctly
identify more severe patients. Sensitivity increased by 0.22 at MGH
and 0.11 at UKFR. Change in specificity was mixed, but this was
likely influenced by the different ICU admission targets at the 2 sites
(all ICU admissions at MGH vs COVID-related ICU admissions at
UKFR). Billing codes were significantly less precise, missing many
ICU admissions, yielding 49% precision and 49% recall. In the next
phase of our work, it will be important to validate our findings with
the addition of clinical notes at additional sites.
We explored a machine learning data-driven approach at a single
site and compared the results to our expert-derived phenotype.
Among the top 10 features identified by the data-driven model, 4
were conceptually similar to the expert-derived phenotype. Three
were labs that occurred more frequently in the ICU than on the
floor, which reflects ordering pattern biases, rather than clinically
meaningful data points.31 The remaining orders were interesting
proxies of the ICU (eg, chlorhexidine, an antibacterial agent used
for cleaning the skin). These proxies may be less generalizable than
expert-curated codes.
LIMITATIONS
Our data-driven computable exploration was only performed at 1
site. In the future, we hope to engage a larger sample of sites in a
data-driven analysis, which would allow us to pool together a list of
common codes to better discern generalizability. This will become
possible as the 4CE network expands its computational infrastruc-
ture.
Additionally, the data analysis was conducted at sites during a
surge in the COVID-19 pandemic, which could create unanticipated
bias in the results.
CONCLUSION
We developed an EHR-based severity phenotype that can be used
when longer-term outcomes data are not readily or reliably avail-
able. We validated this at 12 international 4CE sites and confirmed
Figure 3. Venn diagram showing overlap of code classes among patients with the Consortium for Clinical Characterization of COVID-19 by EHR severity pheno-
type (9 sites reporting).
Table 4. Comparing the performance of the 4CE severity phenotype
when using chart-reviewed ICU admission data or hospital codes
at MGH and UKFR
MGH UKFR
Hospital Chart Hospital Chart
Sensitivity 0.58 0.80 0.74 0.85
Specificity 0.86 0.75 0.93 0.96
PPV 0.80 0.57 0.90 0.93
NPV 0.68 0.90 0.82 0.91
The hospital column is repeated from Table 2 for clarity.
4CE: Consortium for Clinical Characterization of COVID-19 by EHR;
MGH: Massachusetts General Hospital; NPV: negative predictive value; PPV:
positive predictive value; UKFR: University of Freiburg Medical Center in
Germany.
1418 Journal of the American Medical Informatics Association, 2021, Vol. 28, No. 7
Dow
nloaded from https://academ
ic.oup.com/jam
ia/article/28/7/1411/6132348 by guest on 11 September 2022

its good performance, owing largely to its inclusiveness and breadth.
We discovered many coding differences in individual EHR elements
across sites. Additionally, we explored the comparison of an expert-
derived proxy to a data-driven acuity score that maximized perfor-
mance at individual sites. Finally, we found differences in ICU ad-
mission definitions, revealing that chart review captured
information that was not reliable in hospital administrative data.
FUNDING
This work was supported by: National Institutes of Health (NIH) National
Institute of Neurological Disorders and Stroke Grant No. R01NS098023;
NIH Eunice Kennedy Shriver National Institute of Child Health and Human
Development Grant No. K12 HD047349; NIH National Heart, Lung, and
Blood Institute Grant Nos. K23-HL148394, L40-HL148910, and
U01HL121518; NIH National Center for Advancing Translational Sciences
Grant Nos. U01TR002623, UL1-TR001420, UL1-TR001878, UL1-
TR002240, UL1-TR001881, UL1-TR00185705, and 5UL1-TR001857-05;
NIH National Library of Medicine Grant Nos. R01 LM012095 and
R01LM013345; NIH National Human Genome Research Institute Grant
No. 5R01HG009174-04; and German Federal Ministry of Education and Re-
search Grant No. FKZ 01ZZ1801B.
AUTHOR CONTRIBUTIONS
JGK led the study and writing the manuscript. All authors approved the man-
uscript and contributed substantially. A table including full contributions is
listed in Supplementary Table B1.
ETHICS APPROVAL
Each institution reported obtaining proper institutional review board ap-
proval for data sharing. Certifications of waivers or approval were collected
by the consortium. As data were transmitted in aggregate, no patient level
data were available from any site.
SUPPLEMENTARY MATERIAL
Supplementary Appendix is available at Journal of the American Medical In-
formatics Association online.
ACKNOWLEDGMENTS
The authors thank all members of the 4CE Consortium (see list in the Supple-
mentary Appendix) and all the effort and hard work of the local teams at the
12 sites. Thanks also to Brigitta Gough and Margaret Vella for their help in
preparing this manuscript for submission, which was itself a massive under-
taking.
CONFLICT OF INTEREST STATEMENT
RB and AM are shareholders of Biomeris s.r.l. KDM is an advisor to Medal,
Inc.
Figure 4. Receiver-operating characteristic curves when using a general linear model (GLM) boost algorithm on Consortium for Clinical Characterization of
COVID-19 by EHR (4CE)–defined features vs a data-driven approach.
Journal of the American Medical Informatics Association, 2021, Vol. 28, No. 7 1419
Dow
nloaded from https://academ
ic.oup.com/jam
ia/article/28/7/1411/6132348 by guest on 11 September 2022

DATA SHARING
All data collected for this study is presented in the manuscript or appendix.
The 4CE provides additional visualizations and data for other consortium
projects (https://covidclinical.net).
REFERENCES
1. Friedman CP, Allee NJ, Delaney BC, et al. The science of learning health sys-
tems: foundations for a new journal. Learn Health Sys 2017; 1 (1): e10020.
2. Visweswaran S, Becich MJ, D’Itri VS, et al. Accrual to clinical trials
(ACT): a clinical and translational science award consortium network.
JAMIA Open 2018; 1 (2): 147–52.
3. Collins FS, Hudson KL, Briggs JP, et al. PCORnet: turning a dream into
reality. J Am Med Inform Assoc 2014; 21 (4): 576–7.
4. Swiss Personalized Health Network (SPHN). https://sphn.ch/. Accessed
September 3, 2020.
5. Budrionis A, Bellika JG. The learning healthcare system: where are we
now? a systematic review. J Biomed Inform 2016; 64: 87–92.
6. Surma V, Kudchadkar S, Bembea M, et al. The critical care learning healthcare
system: time to walk the walk. Crit Care Med 2020; 48 (12): 1907–9.
7. Hripcsak G, Duke JD, Shah NH, et al. Observational health data sciences
and informatics (ohdsi): opportunities for observational researchers. Stud
Health Technol Inform 2015; 216: 574–8.
8. Murphy SN, Weber G, Mendis M, et al. Serving the enterprise and beyond
with informatics for integrating biology and the bedside (i2b2). J Am Med
Inform Assoc 2010; 17 (2): 124–30.
9. Brat GA, Weber GM, Gehlenborg N, et al. International electronic health
record-derived COVID-19 clinical course profiles: the 4CE consortium.
NPJ Digit Med 2020; 3: 109.
10. Shivade C, Raghavan P, Fosler-Lussier E, et al. A review of approaches to
identifying patient phenotype cohorts using electronic health records. J
Am Med Inform Assoc 2014; 21 (2): 221–30.
11. Hripcsak G, Albers DJ. Next-generation phenotyping of electronic health
records. J Am Med Inform Assoc 2013; 20 (1): 117–21.
12. Rasmussen LV, Thompson WK, Pacheco JA, et al. Design patterns for the
development of electronic health record-driven phenotype extraction
algorithms. J Biomed Inform 2014; 51: 280–6.
13. Yu S, Ma Y, Gronsbell J, et al. Enabling phenotypic big data with Phe-
Norm. J Am Med Inform Assoc 2018; 25 (1): 54–60.
14. Newton KM, Peissig PL, Kho AN, et al. Validation of electronic medical
record-based phenotyping algorithms: results and lessons learned from the
eMERGE network. J Am Med Inform Assoc 2013; 20 (e1): e147–54.
15. Rubbo B, Fitzpatrick NK, Denaxas S, et al. Use of electronic health records to
ascertain, validate and phenotype acute myocardial infarction: A systematic re-
view and recommendations. Int J Cardiol 2015; 187: 705–11.
16. Guan W-J, Ni Z-Y, Hu Y, et al. Clinical Characteristics of Coronavirus
Disease 2019 in China. N Engl J Med 2020; 382 (18): 1708–20.
17. Li H-Y, Guo Q, Song W-D, et al. Modified IDSA/ATS minor criteria for
severe community-acquired pneumonia best predicted mortality. Medi-
cine (Baltimore) 2015; 94 (36): e1474.
18. World Health Organization. Clinical management of severe acute respira-
tory infection (SARI) when COVID-19 disease is suspected: interim guid-
ance, 13 March 2020. World Health Organization 2020. https://www.
who.int/docs/default-source/coronaviruse/clinical-management-of-novel-
cov.pdf. Accessed June 17, 2020.
19. American College of Emergency Physicians. Diagnosis when there is no
testing. https://www.acep.org/corona/covid-19-field-guide/diagnosis/diag-
nosis-when-there-is-no-testing/. Accessed September 3, 2020.
20. Ye Z, Rochwerg B, Wang Y, et al. Treatment of patients with nonsevere
and severe coronavirus disease 2019: an evidence-based guideline. CMAJ
2020; 192 (20): E536–45. doi:10.1503/cmaj.200648
21. Tobin MJ. Advances in mechanical ventilation. N Engl J Med 2001; 344
(26): 1986–96.
22. Visweswaran S. ACT-COVID-Ontology. 2020. https://github.com/
shyamvis/ACT-COVID-Ontology. Accessed January 5, 2021.
23. 4CE Consortium. 4CE Phase 1.1 Data Extraction. 2020. https://
github.com/covidclinical/Phase1.1SqlDataExtraction. Accessed January
5, 2021.
24. Klann JG, Abend A, Raghavan VA, et al. Data interchange using i2b2. J
Am Med Inform Assoc 2016; 23 (5): 909–15.
25. MGH COVID-19 registry. 2020. https://rc.partners.org/about/projects-
initiatives/new-covid-19-research-tools-researchers/covid-19-external-
data-sets#mgh-covid-registry. Accessed September 8, 2020.
26. Estiri H, Strasser ZH, Klann JG, et al. Transitive sequencing medical
records for mining predictive and interpretable temporal representations.
Patterns (N Y) 2020; 1 (4): 100051.
27. Estiri H, Vasey S, Murphy SN. Transitive sequential pattern mining for
discrete clinical data. In: Michalowski M, Moskovitch R, eds. Artificial In-
telligence in Medicine. New York, NY: Springer; 2020: 414–24.
28. Hothorn T, Buhlmann P, Kneib T, et al. Model-based boosting 2.0. J
Mach Learn Res 2010; 11: 2109–13.
29. Hothorn T, Buhlmann P, Kneib T, et al. mboost: model-based boosting.
2012. https://cran.r-project.org/web/packages/mboost/index.html.
Accessed January 5, 2021.
30. Essay P, Mosier J, Subbian V. Rule-based cohort definitions for acute re-
spiratory failure: electronic phenotyping algorithm. JMIR Med Inform
2020; 8 (4): e18402.
31. Agniel D, Kohane IS, Weber GM. Biases in electronic health record data
due to processes within the healthcare system: retrospective observational
study. BMJ 2018; 361: k1479.
1420 Journal of the American Medical Informatics Association, 2021, Vol. 28, No. 7
Dow
nloaded from https://academ
ic.oup.com/jam
ia/article/28/7/1411/6132348 by guest on 11 September 2022