Embed Size (px)
Citation preview
C i t y o f j a c k s o n v i l l eC o m p r e h e n s i v e A n n u a l F i n a n c i a l R e p o r t F i s c a l Y e a r 2 0 1 7
CCIITTYY OOFF JJAACCKKSSOONNVVIILLLLEE,, FFLLOORRIIDDAA
CCOOMMPPRREEHHEENNSSIIVVEE AANNNNUUAALL FFIINNAANNCCIIAALL RREEPPOORRTT FFOORR TTHHEE FFIISSCCAALL YYEEAARR EENNDDEEDD SSEEPPTTEEMMBBEERR 3300,, 22001177
PPRREEPPAARREEDD BBYY TTHHEE DDEEPPAARRTTMMEENNTT OOFF FFIINNAANNCCEE AACCCCOOUUNNTTIINNGG DDIIVVIISSIIOONN

DRAFT
(This page is intentionally left blank.)
City of Jacksonville, Florida
Comprehensive Annual Financial Report For the Fiscal Year Ended September 30, 2017 TABLE OF CONTENTS INTRODUCTORY SECTION LETTER OF TRANSMITTAL ............................................................................................. i – xvii CERTIFICATE OF ACHIEVEMENT FOR EXCELLENCE
IN FINANCIAL REPORTING ............................................................................................ xviii ORGANIZATIONAL CHART ................................................................................................... xix LISTING OF CITY OFFICERS, CONSTITUTIONAL OFFICEHOLDERS,
AND CITY COUNCIL OFFICIALS AND STAFF ....................................................... xx - xxi FINANCIAL SECTION REPORT OF INDEPENDENT CERTIFIED PUBLIC ACCOUNTANTS ..............................1 – 3 INDEPENDENT AUDITOR’S REPORT ON INTERNAL CONTROL OVER FINANCIAL REPORTING AND ON COMPLIANCE AND OTHER MATTERS BASED ON AN AUDIT OF FINANCIAL STATEMENTS PERFORMED IN ACCORDANCE WITH GOVERNMENT AUDITING STANDARDS .......................................................................................................4 – 5 MANAGEMENT'S DISCUSSION AND ANALYSIS ........................................................... 7 - 20 BASIC FINANCIAL STATEMENTS CITYWIDE FINANCIAL STATEMENTS Statement of Net Position ..............................................................................................................22 Statement of Activities ...................................................................................................................23 FUND FINANCIAL STATEMENTS Balance Sheet - Governmental Funds .................................................................................... 28 - 29 Reconciliation of the Governmental Funds Balance
Sheet to the Statement of Net Position .....................................................................................31
Statement of Revenues, Expenditures and Changes in Fund Balances - Governmental Funds ........................................................................................................ 32 - 33
FINANCIAL SECTION (CONTINUED) Reconciliation of the Statement of Revenues, Expenditures and Changes
in Fund Balances - Governmental Funds to the Statement of Activities .................................34 Statement of Net Position - Proprietary Funds ...................................................................... 36 - 37
Statement of Revenues, Expenses and Changes in Fund Net Position -
Proprietary Funds .....................................................................................................................39 Statement of Cash Flows - Proprietary Funds ....................................................................... 40 - 43 Statement of Fiduciary Net Position ..............................................................................................46 Statement of Changes in Fiduciary Net Position ...........................................................................47 MAJOR COMPONENT UNITS Combining Statement of Net Position – Component Units ................................................... 50 - 51 Combining Statement of Activities – Component Units ...................................................... 52 - 53 NOTES TO THE FINANCIAL STATEMENTS ............................................................. 55 -151 REQUIRED SUPPLEMENTARY INFORMATION Schedule of Revenues, Expenditures and Changes in Fund Balances -
Budget and Actual - General Fund .........................................................................................154 Notes to Required Supplemental Information ................................................................... 155 - 156 Schedule of Contributions -
City of Jacksonville Retirement System.................................................................................157 Schedule of Changes in Net Pension Liability -
City of Jacksonville Retirement System........................................................................ 158 -159
Schedule of Money-Weighted Rate of Return City of Jacksonville Retirement System.................................................................................160
Notes to Required Supplementary Information - City of Jacksonville Retirement System....................................................................... 161 - 162
Schedule of the City’s Proportionate Share of Net Pension Liability ..............................................................................................................163
FINANCIAL SECTION (CONTINUED) Schedule of Contributions -
Police and Fire Retirement System ........................................................................................164
Schedule of Contributions - Police and Fire Pension Fund, Senior Staff Voluntary Retirement Plan ................................165
Schedule of Changes in Net Pension Liability - Police and Fire Retirement System .............................................................................. 166 - 167
Schedule of Changes in Net Pension Liability - Police and Fire Pension Fund, Senior Staff Voluntary Retirement Plan ................................168
Schedule of Money-Weighted Rate of Return
Police and Fire Retirement System ........................................................................................169 Schedule of Funding Progress -
Employment Benefits Other than Pension (OPEB) ...............................................................170 COMBINING INDIVIDUAL FUND STATEMENTS AND SCHEDULES GOVERNMENTAL FUNDS
Combining Balance Sheet - Nonmajor Governmental Funds ...................................... 174 - 180 Combining Statement of Revenues, Expenditures and
Changes in Fund Balances - Nonmajor Governmental Funds ............................... 182 - 188
Budgetary Comparison Schedules - Nonmajor Governmental Funds ......................... 190 - 197 PROPRIETARY FUNDS
Combining Statement of Net Position - Nonmajor Enterprise Funds .......................... 200 - 201
Combining Statement of Revenues, Expenses and
Changes in Fund Net Position - Nonmajor Enterprise Funds ................................ 202 - 203 Combining Statement of Cash Flows - Nonmajor Enterprise Funds ........................... 204 - 207
FINANCIAL SECTION (CONTINUED) INTERNAL SERVICE FUNDS
Combining Statement of Net Position - Internal Service Funds .................................. 210 - 211
Combining Statement of Revenues, Expenses and
Changes in Fund Net Position - Internal Service Funds ........................................ 212 - 213 Combining Statement of Cash Flows - Internal Service Funds ................................... 214 - 217
FIDUCIARY FUNDS
PENSION TRUST FUNDS
Combining Statement of Fiduciary Net Position - Pension Trust Funds .........................220
Combining Statement of Changes in Fiduciary Net Position - Pension Trust Funds ....................................................................................................221
AGENCY FUNDS
Combining Statement of Fiduciary Assets and Liabilities -
Agency Funds .................................................................................................... 222 - 223
Combining Statement of Changes in Assets and Liabilities Fiduciary Funds - All Agency Funds .............................................................................................. 224 - 226
COMPONENT UNITS Balance Sheet – Jacksonville Housing Finance Authority ....................................................228 Statement of Revenues, Expenditures and Changes in Fund Balances -
Jacksonville Housing Finance Authority...........................................................................229
FINANCIAL SECTION (CONTINUED) SUPPLEMENTAL INFORMATION
Schedule of Long-Term Bonded Indebtedness ............................................................ 232 - 237
Schedule of Debt Service Requirements Compared
to Cash in Sinking Fund Long-Term Obligations .................................................. 238 - 241
Schedule of Debt Service Requirements to Maturity - Governmental Activities Revenue Bonds Supported by General Fund ......................................................... 242 - 249
Schedule of Debt Service Requirements to Maturity -
Governmental Activities Special Revenue Bonds Supported by Better Jacksonville Plan Revenues ........... 250 - 252
Schedule of Debt Service Requirements to Maturity -
Governmental Activities Revenue Bonds Supported by Better Jacksonville Plan Revenues ........................ 254 - 257
Schedule of Debt Service Requirements to Maturity -
Governmental Activities Notes Payable Supported by Better Jacksonville Plan Revenues ....................................258
Schedule of Debt Service Requirements to Maturity -
Governmental Activities Special Revenue Bonds and Notes Payable from Internal Service Operations ..... 260 - 264
Schedule of Debt Service Requirements to Maturity -
Payable from Enterprise Funds .............................................................................. 266 - 270
Schedule of Self Insurance - Workers Compensation ................................................. 272 - 273 Schedule of Self Insurance – General Liability ........................................................... 274 - 275 Balance Sheet - General Fund by subfund .............................................................................276 Schedule of Revenues, Expenditures and Changes in Fund Balances - General Fund by subfund ..................................................................................................277
STATISTICAL SECTION (UNAUDITED) Table of Contents .........................................................................................................................279 Financial Trends................................................................................................................. 281 - 291
Net Position by Components .................................................................................... 282 - 283 Changes in Net Position ............................................................................................ 284 - 287 Fund Balances, Governmental Funds .................................................................................288 Changes in Fund Balances, Governmental Funds .................................................... 290 - 291
Revenue Capacity .............................................................................................................. 293 - 301
Assessed Value and Estimated Actual Value of Taxable Property .......................... 294 - 295 Direct and Overlapping Property Tax Rates .......................................................................296 Principal Property Taxpayers .................................................................................... 298 - 299 Property Tax Levies and Collections ........................................................................ 300 - 301
Debt Capacity..................................................................................................................... 303 - 313
Ratios of Outstanding Debt by Type to Personal Income and Per Capita ................ 304 - 305 Direct and Overlapping Governmental Activities Debt ......................................................306 Legal Debt Margin Information ..........................................................................................306 Pledged Revenue Coverage ...................................................................................... 308 - 313
Demographic and Economic Information .......................................................................... 314 - 316
Demographic and Economic Statistics ...............................................................................315 Principal Employers ............................................................................................................316
Operating Information ....................................................................................................... 318 - 325
Personnel Distribution by Department Classified Positions ..............................................319 Operating Indicators by Function/Program .............................................................. 320 - 323 Capital Asset Statistics by Function/Program........................................................... 324 - 325

LETTER OF TRANSMITTAL

OFFICE OF THE MAYOR
June 22, 2018 Dear Citizens: As we celebrate the 50th anniversary of Jacksonville’s consolidation, I am pleased to present the Comprehensive Annual Financial Report detailing the bold, innovative and disciplined fiscal management services and practices of my administration this past fiscal year. As mayor, I hold an unwavering respect for the effort behind every tax dollar the City receives. To be good stewards of the public trust we work so hard to earn, we must ensure that every dollar is spent wisely, and maximizes returns to taxpayers and benefits for our community. As you will see in the details of this report, Jacksonville is in its strongest fiscal position in recent years. With a solution in place to our long-standing pension debt crisis, we have more financial stability and resources available to invest in our city’s future. My time as an accountant in the private sector has shown me the importance of budgets to illuminate priorities and to demonstrate what an organization holds most valuable. My administration has made our priorities clear. With three balanced budgets, we have made significant investments in public safety, economic growth, neighborhood development, and improving the health and well-being of our citizens. With a continuing commitment to sound financial management and innovative practices, I am confident that our city’s success and momentum will continue to grow. Sincerely, Lenny Curry Mayor

(This page is intentionally left blank.)
v
June 22, 2018 The Honorable Mayor Lenny Curry Members of the City Council Citizens of Jacksonville INTRODUCTION The Comprehensive Annual Financial Report (CAFR) of the City of Jacksonville, Florida (the City) for the fiscal year ended September 30, 2017 is hereby submitted. The financial reporting entity includes all funds of the consolidated government of the City of Jacksonville and Duval County, as well as all of its component units. Component units are legally separate organizations for which the City is financially accountable and, for financial statement purposes, are either blended with the activities of the City or discretely presented. Responsibility for both the accuracy of the data and the completeness and fairness of its presentation, including all disclosures, rests with the City. Management believes the data, as presented, is accurate in all material respects. It is presented in a manner designed to set forth the financial position and the results of operations of the City on a government-wide and fund basis. Disclosures necessary to enable the reader to gain an understanding of the City’s financial activities are included. Internal controls are designed to provide reasonable assurance that the financial statements are free from material misstatement. Management is primarily responsible for internal control. There are inherent limitations of internal control due to cost/benefit considerations of providing the control as a certain degree of risk would be unavoidable due to the cost of providing the control. Also, effectiveness of control procedures may be diminished due to collusion where several employees conspire to circumvent the control. As part of the independent audit process, the Chief Financial Officer issues a letter of representation that attests to his responsibility to establish and maintain effective internal control over financial reporting among other things. The letter also acknowledges his responsibility for the design and implementation of programs and controls to provide reasonable assurance that fraud is prevented and detected. Management acknowledges that they have no knowledge of misstatements in the financial statements of the City or of any fraud or suspected fraud that could have a material effect on the financial statements.
vi
The City’s Independent Auditor, Carr, Riggs & Ingram, LLC (CRI), issued an opinion letter as required by City Charter, Section 5.11; Chapter 218.39, Florida Statutes and Chapter 10.550 Rules of the Florida Auditor General, which is contained in the Financial Section of this document. CRI, based on its audit and the reports of component unit auditors, has opined that the financial statements present fairly, in all material respects, the financial position and changes in financial position of the City as of and for the year ended September 30, 2017. Generally Accepted Accounting Principles (GAAP) requires that management provide a narrative introduction, overview and analysis to accompany the basic financial statements in the form of Management’s Discussion and Analysis (MD&A). This letter of transmittal is designed to complement the MD&A and should be read in conjunction with it. The City of Jacksonville’s MD&A can be found immediately following the report of the independent certified public accountants. PROFILE OF THE CONSOLIDATED GOVERNMENT Governmental Framework The City of Jacksonville was consolidated with Duval County in 1968 to streamline government and eliminate the cost of duplicative City and County services. Four municipalities were not consolidated: Atlantic Beach, Jacksonville Beach, Neptune Beach and Baldwin. The City has entered into interlocal agreements with the unconsolidated entities to provide cost effective services to residents in unconsolidated Duval County. The City operates under a strong Mayor/City Council form of government. The 19-member City Council is made up of 14 district council members and 5 at-large council members. These 20 elected officials stand for election every four years (having no mid-term elections) and are subject to a two-term limitation. The Charter of the Consolidated Government of the City of Jacksonville provides for three branches: Executive, Legislative and Judicial. The Executive branch includes the Office of the Mayor and Constitutional officers: Sheriff, Tax Collector, Property Appraiser, Supervisor of Elections and the Duval County School Board. The Legislative branch includes the City Council and a group of standing committees. There is also a Council Auditor and Council Secretary. The Judicial branch includes: the Circuit Court, County Court, Clerk of the Circuit Court, State Attorney, Public Defender and Medical Examiner. The independent Office of Inspector General provides additional oversight to promote increased accountability, integrity, and oversight of the City. Certain governmental entities are organized as independent authorities and/or commissions in city government, which include: Jacksonville Aviation Authority (JAA) Jacksonville Electric Authority (JEA- electric, water and wastewater utilities) Jacksonville Port Authority (JPA) Jacksonville Transportation Authority, (JTA- operates the mass transit system) Jacksonville Public Library Kids Hope Alliance (KHA) Each authority/commission is subject to annual budget submission to the City and approval by the City Council.
vii
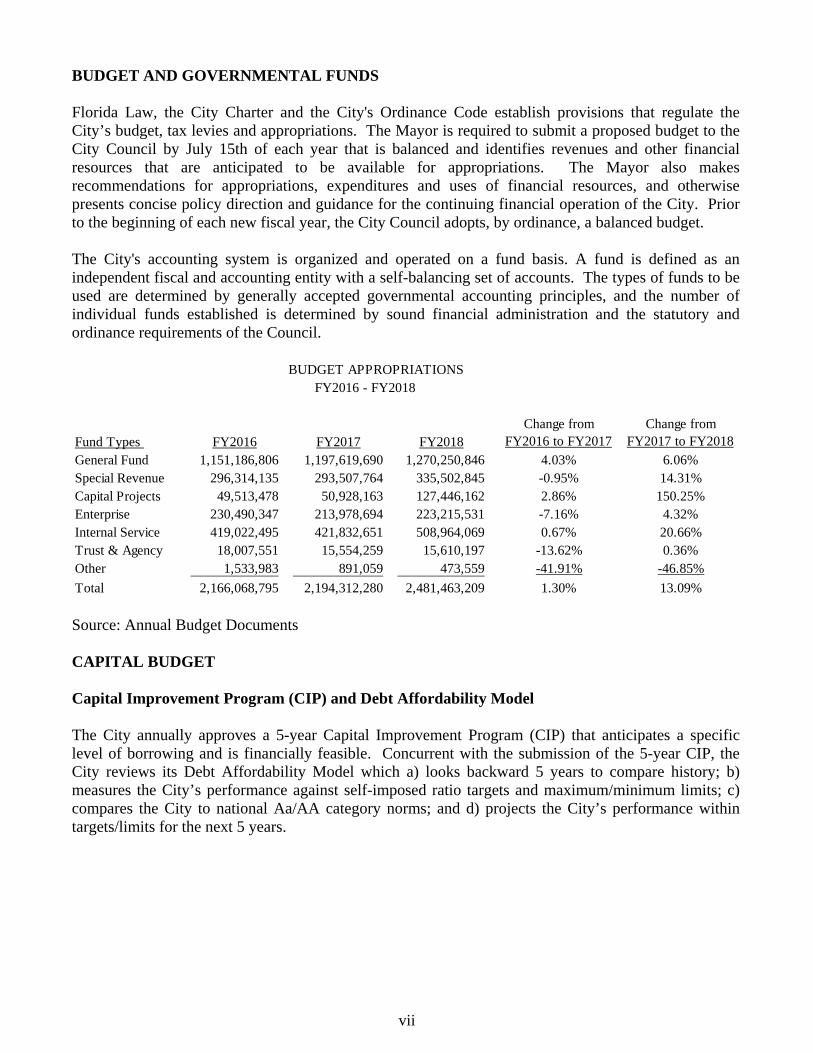
BUDGET AND GOVERNMENTAL FUNDS Florida Law, the City Charter and the City's Ordinance Code establish provisions that regulate the City’s budget, tax levies and appropriations. The Mayor is required to submit a proposed budget to the City Council by July 15th of each year that is balanced and identifies revenues and other financial resources that are anticipated to be available for appropriations. The Mayor also makes recommendations for appropriations, expenditures and uses of financial resources, and otherwise presents concise policy direction and guidance for the continuing financial operation of the City. Prior to the beginning of each new fiscal year, the City Council adopts, by ordinance, a balanced budget. The City's accounting system is organized and operated on a fund basis. A fund is defined as an independent fiscal and accounting entity with a self-balancing set of accounts. The types of funds to be used are determined by generally accepted governmental accounting principles, and the number of individual funds established is determined by sound financial administration and the statutory and ordinance requirements of the Council.
Source: Annual Budget Documents CAPITAL BUDGET Capital Improvement Program (CIP) and Debt Affordability Model
The City annually approves a 5-year Capital Improvement Program (CIP) that anticipates a specific level of borrowing and is financially feasible. Concurrent with the submission of the 5-year CIP, the City reviews its Debt Affordability Model which a) looks backward 5 years to compare history; b) measures the City’s performance against self-imposed ratio targets and maximum/minimum limits; c) compares the City to national Aa/AA category norms; and d) projects the City’s performance within targets/limits for the next 5 years.
BUDGET APPROPRIATIONS FY2016 - FY2018
Change from Change fromFund Types FY2016 FY2017 FY2018 FY2016 to FY2017 FY2017 to FY2018General Fund 1,151,186,806 1,197,619,690 1,270,250,846 4.03% 6.06%Special Revenue 296,314,135 293,507,764 335,502,845 -0.95% 14.31%Capital Projects 49,513,478 50,928,163 127,446,162 2.86% 150.25%Enterprise 230,490,347 213,978,694 223,215,531 -7.16% 4.32%Internal Service 419,022,495 421,832,651 508,964,069 0.67% 20.66%Trust & Agency 18,007,551 15,554,259 15,610,197 -13.62% 0.36%Other 1,533,983 891,059 473,559 -41.91% -46.85%Total 2,166,068,795 2,194,312,280 2,481,463,209 1.30% 13.09%
viii
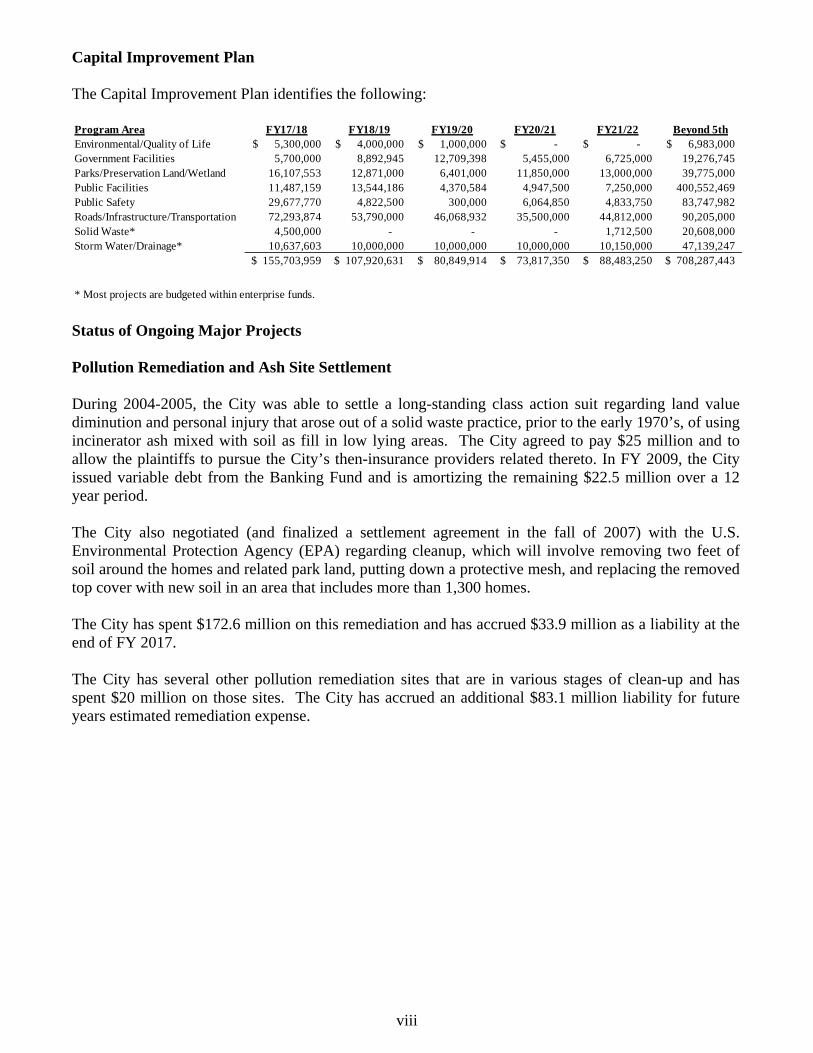
Capital Improvement Plan
The Capital Improvement Plan identifies the following:
Status of Ongoing Major Projects
Pollution Remediation and Ash Site Settlement
During 2004-2005, the City was able to settle a long-standing class action suit regarding land value diminution and personal injury that arose out of a solid waste practice, prior to the early 1970’s, of using incinerator ash mixed with soil as fill in low lying areas. The City agreed to pay $25 million and to allow the plaintiffs to pursue the City’s then-insurance providers related thereto. In FY 2009, the City issued variable debt from the Banking Fund and is amortizing the remaining $22.5 million over a 12 year period.
The City also negotiated (and finalized a settlement agreement in the fall of 2007) with the U.S. Environmental Protection Agency (EPA) regarding cleanup, which will involve removing two feet of soil around the homes and related park land, putting down a protective mesh, and replacing the removed top cover with new soil in an area that includes more than 1,300 homes. The City has spent $172.6 million on this remediation and has accrued $33.9 million as a liability at the end of FY 2017.
The City has several other pollution remediation sites that are in various stages of clean-up and has spent $20 million on those sites. The City has accrued an additional $83.1 million liability for future years estimated remediation expense.
Program Area FY17/18 FY18/19 FY19/20 FY20/21 FY21/22 Beyond 5thEnvironmental/Quality of Life 5,300,000$ 4,000,000$ 1,000,000$ -$ -$ 6,983,000$ Government Facilities 5,700,000 8,892,945 12,709,398 5,455,000 6,725,000 19,276,745 Parks/Preservation Land/Wetland 16,107,553 12,871,000 6,401,000 11,850,000 13,000,000 39,775,000 Public Facilities 11,487,159 13,544,186 4,370,584 4,947,500 7,250,000 400,552,469 Public Safety 29,677,770 4,822,500 300,000 6,064,850 4,833,750 83,747,982 Roads/Infrastructure/Transportation 72,293,874 53,790,000 46,068,932 35,500,000 44,812,000 90,205,000 Solid Waste* 4,500,000 - - - 1,712,500 20,608,000 Storm Water/Drainage* 10,637,603 10,000,000 10,000,000 10,000,000 10,150,000 47,139,247
155,703,959$ 107,920,631$ 80,849,914$ 73,817,350$ 88,483,250$ 708,287,443$
* Most projects are budgeted within enterprise funds.
ix
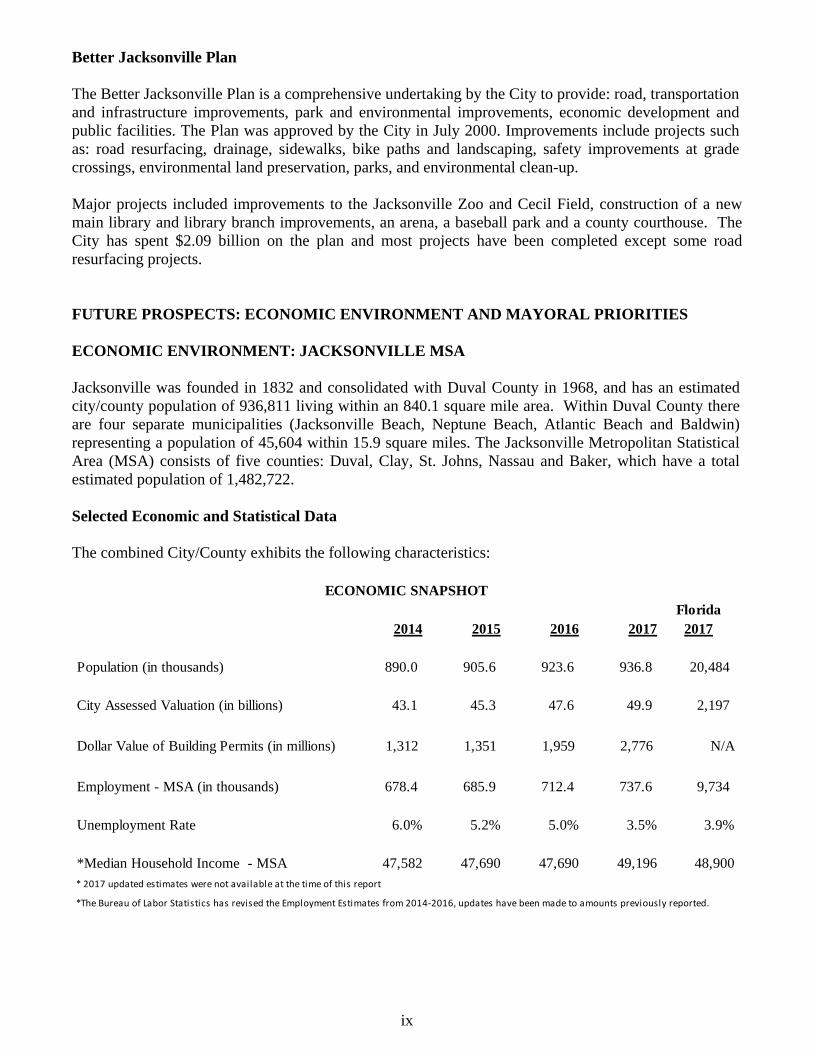
Better Jacksonville Plan The Better Jacksonville Plan is a comprehensive undertaking by the City to provide: road, transportation and infrastructure improvements, park and environmental improvements, economic development and public facilities. The Plan was approved by the City in July 2000. Improvements include projects such as: road resurfacing, drainage, sidewalks, bike paths and landscaping, safety improvements at grade crossings, environmental land preservation, parks, and environmental clean-up. Major projects included improvements to the Jacksonville Zoo and Cecil Field, construction of a new main library and library branch improvements, an arena, a baseball park and a county courthouse. The City has spent $2.09 billion on the plan and most projects have been completed except some road resurfacing projects. FUTURE PROSPECTS: ECONOMIC ENVIRONMENT AND MAYORAL PRIORITIES ECONOMIC ENVIRONMENT: JACKSONVILLE MSA Jacksonville was founded in 1832 and consolidated with Duval County in 1968, and has an estimated city/county population of 936,811 living within an 840.1 square mile area. Within Duval County there are four separate municipalities (Jacksonville Beach, Neptune Beach, Atlantic Beach and Baldwin) representing a population of 45,604 within 15.9 square miles. The Jacksonville Metropolitan Statistical Area (MSA) consists of five counties: Duval, Clay, St. Johns, Nassau and Baker, which have a total estimated population of 1,482,722. Selected Economic and Statistical Data The combined City/County exhibits the following characteristics:
Florida2014 2015 2016 2017 2017
Population (in thousands) 890.0 905.6 923.6 936.8 20,484
City Assessed Valuation (in billions) 43.1 45.3 47.6 49.9 2,197
Dollar Value of Building Permits (in millions) 1,312 1,351 1,959 2,776 N/A
Employment - MSA (in thousands) 678.4 685.9 712.4 737.6 9,734
Unemployment Rate 6.0% 5.2% 5.0% 3.5% 3.9%
*Median Household Income - MSA 47,582 47,690 47,690 49,196 48,900* 2017 updated estimates were not available at the time of this report
*The Bureau of Labor Statistics has revised the Employment Estimates from 2014‐2016, updates have been made to amounts previously reported.
ECONOMIC SNAPSHOT
x
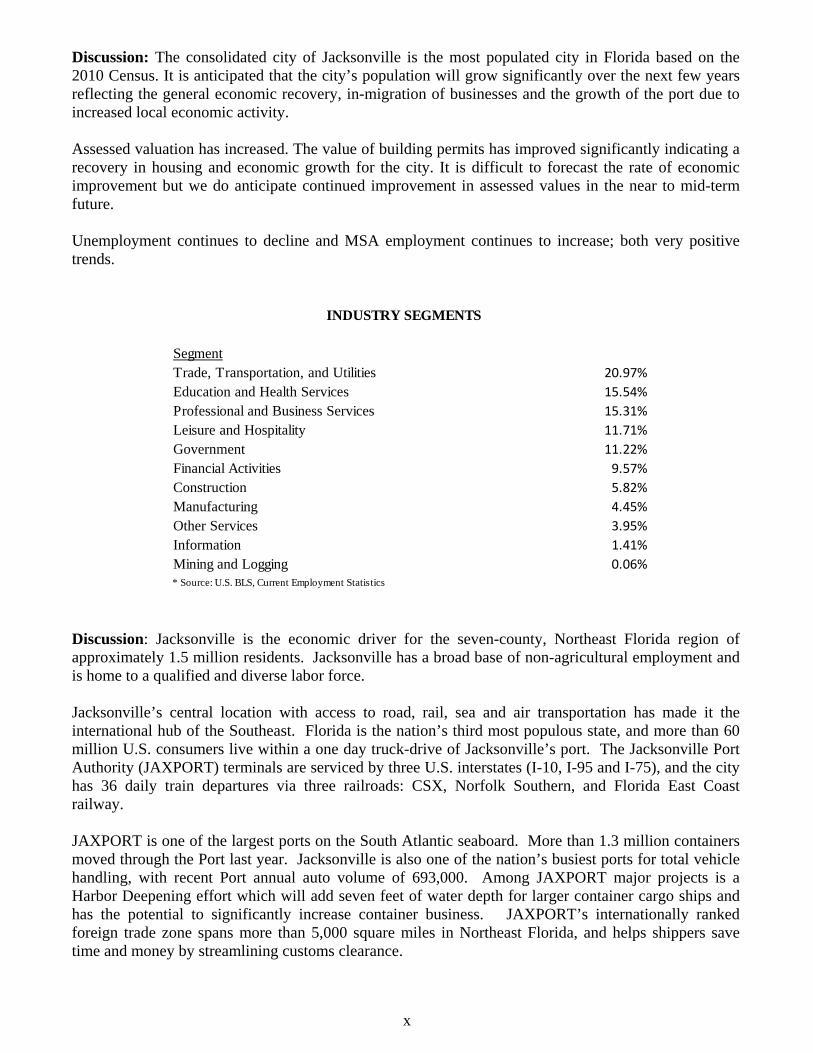
Discussion: The consolidated city of Jacksonville is the most populated city in Florida based on the 2010 Census. It is anticipated that the city’s population will grow significantly over the next few years reflecting the general economic recovery, in-migration of businesses and the growth of the port due to increased local economic activity. Assessed valuation has increased. The value of building permits has improved significantly indicating a recovery in housing and economic growth for the city. It is difficult to forecast the rate of economic improvement but we do anticipate continued improvement in assessed values in the near to mid-term future. Unemployment continues to decline and MSA employment continues to increase; both very positive trends.
Discussion: Jacksonville is the economic driver for the seven-county, Northeast Florida region of approximately 1.5 million residents. Jacksonville has a broad base of non-agricultural employment and is home to a qualified and diverse labor force. Jacksonville’s central location with access to road, rail, sea and air transportation has made it the international hub of the Southeast. Florida is the nation’s third most populous state, and more than 60 million U.S. consumers live within a one day truck-drive of Jacksonville’s port. The Jacksonville Port Authority (JAXPORT) terminals are serviced by three U.S. interstates (I-10, I-95 and I-75), and the city has 36 daily train departures via three railroads: CSX, Norfolk Southern, and Florida East Coast railway. JAXPORT is one of the largest ports on the South Atlantic seaboard. More than 1.3 million containers moved through the Port last year. Jacksonville is also one of the nation’s busiest ports for total vehicle handling, with recent Port annual auto volume of 693,000. Among JAXPORT major projects is a Harbor Deepening effort which will add seven feet of water depth for larger container cargo ships and has the potential to significantly increase container business. JAXPORT’s internationally ranked foreign trade zone spans more than 5,000 square miles in Northeast Florida, and helps shippers save time and money by streamlining customs clearance.
Segment Trade, Transportation, and Utilities 20.97%Education and Health Services 15.54%Professional and Business Services 15.31%Leisure and Hospitality 11.71%Government 11.22%Financial Activities 9.57%Construction 5.82%Manufacturing 4.45%Other Services 3.95%Information 1.41%Mining and Logging 0.06%* Source: U.S. BLS, Current Employment Statistics
INDUSTRY SEGMENTS
xi
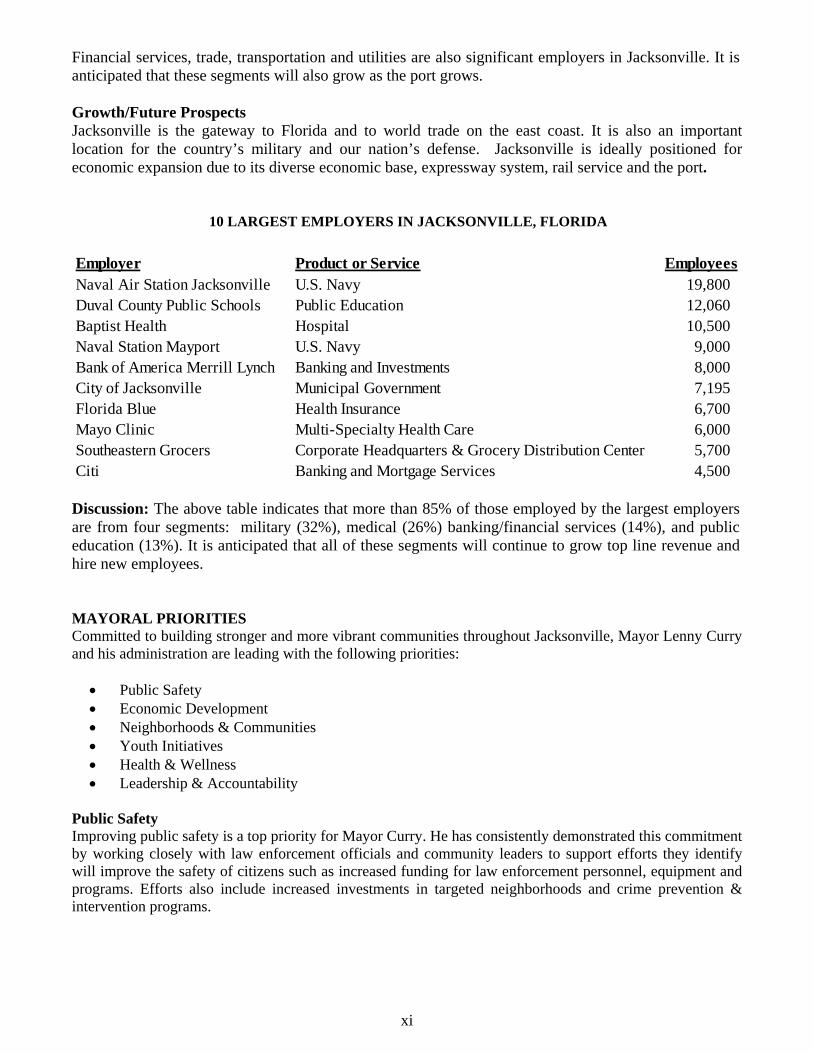
Financial services, trade, transportation and utilities are also significant employers in Jacksonville. It is anticipated that these segments will also grow as the port grows. Growth/Future Prospects Jacksonville is the gateway to Florida and to world trade on the east coast. It is also an important location for the country’s military and our nation’s defense. Jacksonville is ideally positioned for economic expansion due to its diverse economic base, expressway system, rail service and the port.
10 LARGEST EMPLOYERS IN JACKSONVILLE, FLORIDA
Discussion: The above table indicates that more than 85% of those employed by the largest employers are from four segments: military (32%), medical (26%) banking/financial services (14%), and public education (13%). It is anticipated that all of these segments will continue to grow top line revenue and hire new employees. MAYORAL PRIORITIES Committed to building stronger and more vibrant communities throughout Jacksonville, Mayor Lenny Curry and his administration are leading with the following priorities:
• Public Safety • Economic Development • Neighborhoods & Communities • Youth Initiatives • Health & Wellness • Leadership & Accountability
Public Safety Improving public safety is a top priority for Mayor Curry. He has consistently demonstrated this commitment by working closely with law enforcement officials and community leaders to support efforts they identify will improve the safety of citizens such as increased funding for law enforcement personnel, equipment and programs. Efforts also include increased investments in targeted neighborhoods and crime prevention & intervention programs.
Employer Product or Service EmployeesNaval Air Station Jacksonville U.S. Navy 19,800 Duval County Public Schools Public Education 12,060 Baptist Health Hospital 10,500 Naval Station Mayport U.S. Navy 9,000 Bank of America Merrill Lynch Banking and Investments 8,000 City of Jacksonville Municipal Government 7,195 Florida Blue Health Insurance 6,700 Mayo Clinic Multi-Specialty Health Care 6,000 Southeastern Grocers Corporate Headquarters & Grocery Distribution Center 5,700 Citi Banking and Mortgage Services 4,500

xii
Economic Development Jacksonville has seen tremendous momentum in economic development with more jobs and opportunities for people and businesses throughout our city. With support from partners like the JAX Chamber and the State of Florida, Mayor Curry remains committed to creating the conditions that attract businesses where citizens can secure employment opportunities to support their families. Neighborhoods & Communities A successful city is characterized by neighborhoods where citizens feel safe, have access to quality infrastructure and resources, and are supported by a thriving economy. The Curry administration is making efforts to strengthen and invest in Jacksonville neighborhoods – block by block – ensuring a good quality of life for every resident. Youth Initiatives Mayor Curry is dedicated to enhancing services, programs and opportunities that support youth leadership and development. Last year, the mayor created the Kids Hope Alliance: The Jacksonville Partnership for Children, Youth & Families, merging the efforts of the Jacksonville Children’s Commission and Jax Journey. The new organization will build upon programs like the Mayor’s Summer Jobs program, which provides youth ages 16 to 21 with work experience and mentorship. Participants gain an increased understanding and knowledge of the work environment, employer expectations and personal responsibility. Health & Wellness Research supports that the health and well-being of residents is a key indicator to the vitality and health of a community. Seeking to improve its ranking, The City of Jacksonville launched Journey to One, a health initiative with programs, opportunities, and partners who share the mission of equipping every citizen, in every ZIP code, with resources, offerings and conditions to live well in Jacksonville. Leadership & Accountability Since day one, Mayor Curry’s administration has been focused on challenging the status quo and ensuring that citizens receive the greatest return possible on their taxpayer dollars. This mission led to the successful passage of the mayor’s pension reform plan, which has placed the City in its strongest fiscal position in recent years. With the threat of unsustainable pension contributions mitigated, the City is now better able to invest in priorities and programs that better serve the people of Jacksonville.

xiii
xiv
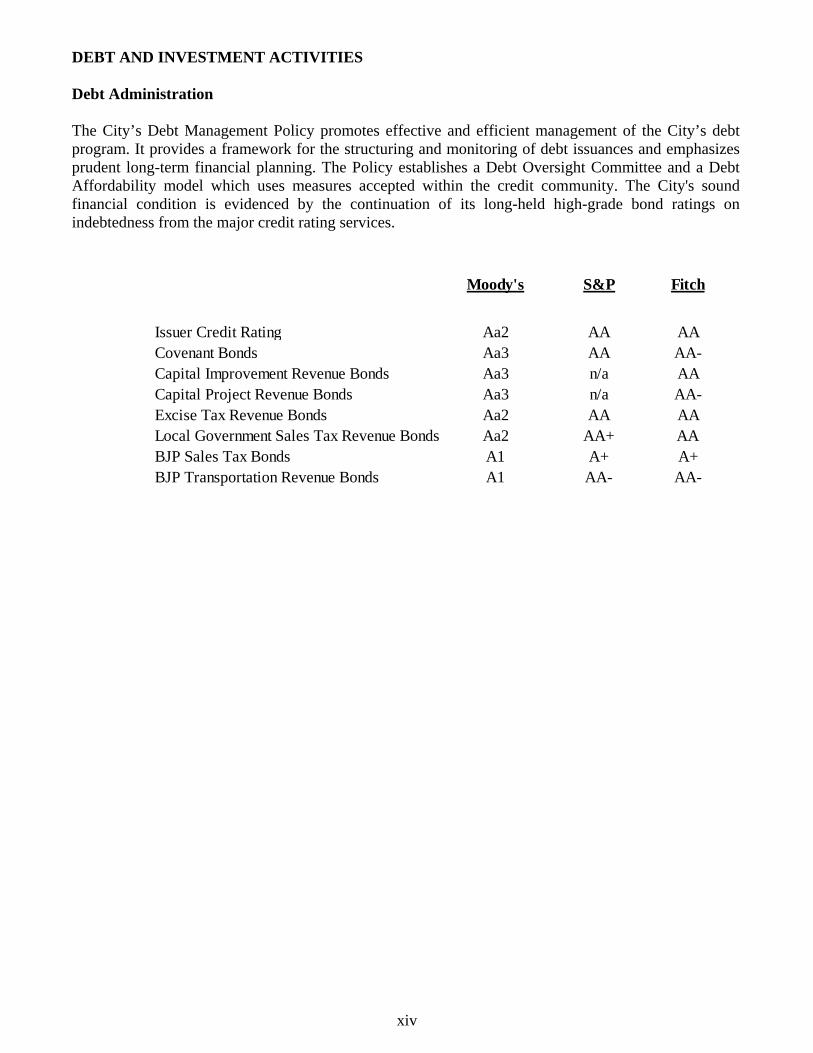
DEBT AND INVESTMENT ACTIVITIES Debt Administration The City’s Debt Management Policy promotes effective and efficient management of the City’s debt program. It provides a framework for the structuring and monitoring of debt issuances and emphasizes prudent long-term financial planning. The Policy establishes a Debt Oversight Committee and a Debt Affordability model which uses measures accepted within the credit community. The City's sound financial condition is evidenced by the continuation of its long-held high-grade bond ratings on indebtedness from the major credit rating services.
Moody's S&P Fitch
Issuer Credit Rating Aa2 AA AACovenant Bonds Aa3 AA AA-Capital Improvement Revenue Bonds Aa3 n/a AACapital Project Revenue Bonds Aa3 n/a AA-Excise Tax Revenue Bonds Aa2 AA AALocal Government Sales Tax Revenue Bonds Aa2 AA+ AABJP Sales Tax Bonds A1 A+ A+BJP Transportation Revenue Bonds A1 AA- AA-
xv
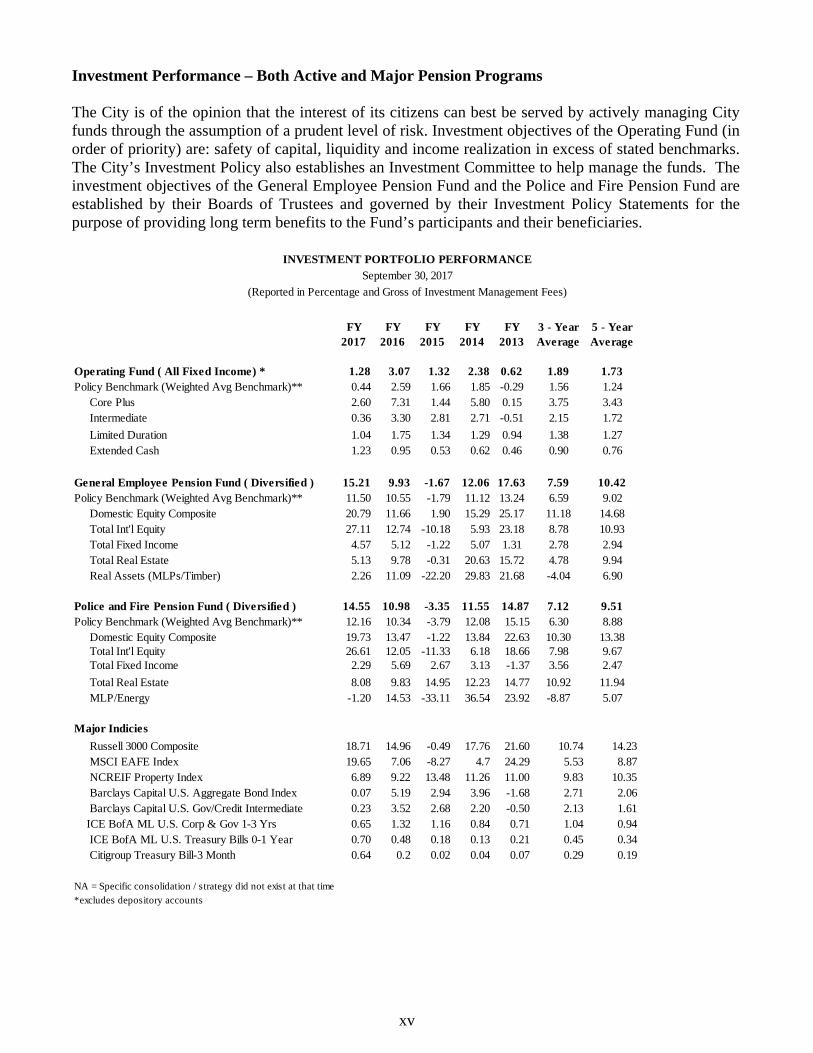
Investment Performance – Both Active and Major Pension Programs The City is of the opinion that the interest of its citizens can best be served by actively managing City funds through the assumption of a prudent level of risk. Investment objectives of the Operating Fund (in order of priority) are: safety of capital, liquidity and income realization in excess of stated benchmarks. The City’s Investment Policy also establishes an Investment Committee to help manage the funds. The investment objectives of the General Employee Pension Fund and the Police and Fire Pension Fund are established by their Boards of Trustees and governed by their Investment Policy Statements for the purpose of providing long term benefits to the Fund’s participants and their beneficiaries.
FY 2017
FY 2016
FY 2015
FY 2014
FY 2013
3 - Year Average
5 - Year Average
Operating Fund ( All Fixed Income) * 1.28 3.07 1.32 2.38 0.62 1.89 1.73Policy Benchmark (Weighted Avg Benchmark)** 0.44 2.59 1.66 1.85 -0.29 1.56 1.24 Core Plus 2.60 7.31 1.44 5.80 0.15 3.75 3.43 Intermediate 0.36 3.30 2.81 2.71 -0.51 2.15 1.72 Limited Duration 1.04 1.75 1.34 1.29 0.94 1.38 1.27 Extended Cash 1.23 0.95 0.53 0.62 0.46 0.90 0.76
General Employee Pension Fund ( Diversified ) 15.21 9.93 -1.67 12.06 17.63 7.59 10.42Policy Benchmark (Weighted Avg Benchmark)** 11.50 10.55 -1.79 11.12 13.24 6.59 9.02 Domestic Equity Composite 20.79 11.66 1.90 15.29 25.17 11.18 14.68 Total Int'l Equity 27.11 12.74 -10.18 5.93 23.18 8.78 10.93 Total Fixed Income 4.57 5.12 -1.22 5.07 1.31 2.78 2.94 Total Real Estate 5.13 9.78 -0.31 20.63 15.72 4.78 9.94 Real Assets (MLPs/Timber) 2.26 11.09 -22.20 29.83 21.68 -4.04 6.90
Police and Fire Pension Fund ( Diversified ) 14.55 10.98 -3.35 11.55 14.87 7.12 9.51Policy Benchmark (Weighted Avg Benchmark)** 12.16 10.34 -3.79 12.08 15.15 6.30 8.88 Domestic Equity Composite 19.73 13.47 -1.22 13.84 22.63 10.30 13.38 Total Int'l Equity 26.61 12.05 -11.33 6.18 18.66 7.98 9.67 Total Fixed Income 2.29 5.69 2.67 3.13 -1.37 3.56 2.47 Total Real Estate 8.08 9.83 14.95 12.23 14.77 10.92 11.94 MLP/Energy -1.20 14.53 -33.11 36.54 23.92 -8.87 5.07
Major Indicies Russell 3000 Composite 18.71 14.96 -0.49 17.76 21.60 10.74 14.23 MSCI EAFE Index 19.65 7.06 -8.27 4.7 24.29 5.53 8.87 NCREIF Property Index 6.89 9.22 13.48 11.26 11.00 9.83 10.35 Barclays Capital U.S. Aggregate Bond Index 0.07 5.19 2.94 3.96 -1.68 2.71 2.06 Barclays Capital U.S. Gov/Credit Intermediate 0.23 3.52 2.68 2.20 -0.50 2.13 1.61 ICE BofA ML U.S. Corp & Gov 1-3 Yrs 0.65 1.32 1.16 0.84 0.71 1.04 0.94 ICE BofA ML U.S. Treasury Bills 0-1 Year 0.70 0.48 0.18 0.13 0.21 0.45 0.34 Citigroup Treasury Bill-3 Month 0.64 0.2 0.02 0.04 0.07 0.29 0.19
NA = Specific consolidation / strategy did not exist at that time*excludes depository accounts
INVESTMENT PORTFOLIO PERFORMANCESeptember 30, 2017
(Reported in Percentage and Gross of Investment Management Fees)
xvi
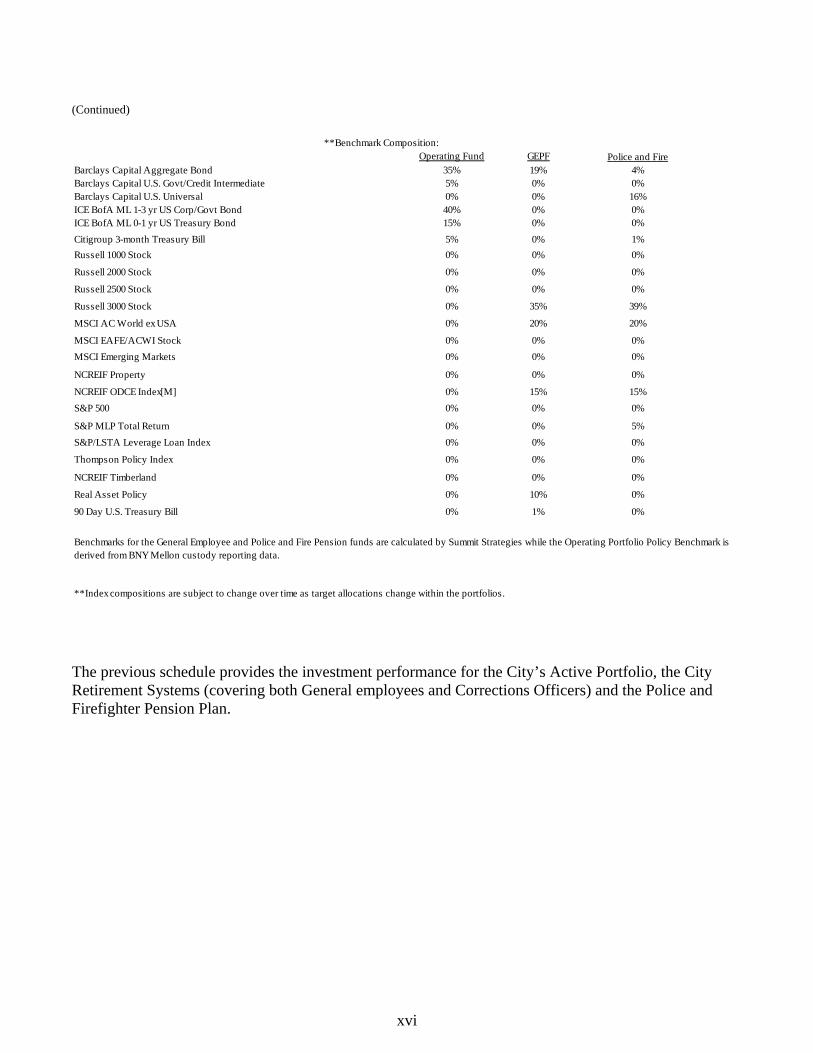
(Continued)
The previous schedule provides the investment performance for the City’s Active Portfolio, the City Retirement Systems (covering both General employees and Corrections Officers) and the Police and Firefighter Pension Plan.
Barclays Capital Aggregate BondBarclays Capital U.S. Govt/Credit IntermediateBarclays Capital U.S. UniversalICE BofA ML 1-3 yr US Corp/Govt BondICE BofA ML 0-1 yr US Treasury BondCitigroup 3-month Treasury BillRussell 1000 Stock
Russell 2000 Stock
Russell 2500 Stock
Russell 3000 Stock
MSCI AC World ex USA
MSCI EAFE/ACWI StockMSCI Emerging Markets
NCREIF Property
NCREIF ODCE Index[M]S&P 500
S&P MLP Total ReturnS&P/LSTA Leverage Loan Index
Thompson Policy Index
NCREIF Timberland
Real Asset Policy
90 Day U.S. Treasury Bill
39%
0%
0%
0%
0%
0%
0%
0%
35%
0%
0% 20% 20%
0%
0%
35%
1%
0%0%
4%0%5%
40%15%
0%
0%
0%
5%
0%
0%
**Benchmark Composition:
5%
Police and FireOperating Fund GEPF19%0%
0%0%0%
0% 0% 16%
**Index compositions are subject to change over time as target allocations change within the portfolios.
0%
Benchmarks for the General Employee and Police and Fire Pension funds are calculated by Summit Strategies while the Operating Portfolio Policy Benchmark is derived from BNY Mellon custody reporting data.
0%
0%
0%
15%
0% 10% 0%
0%
0%
0%
0%
1% 0%
0%
0% 0%
0% 0%
0%
0%
0%
0%
15%
0%
0%
0%
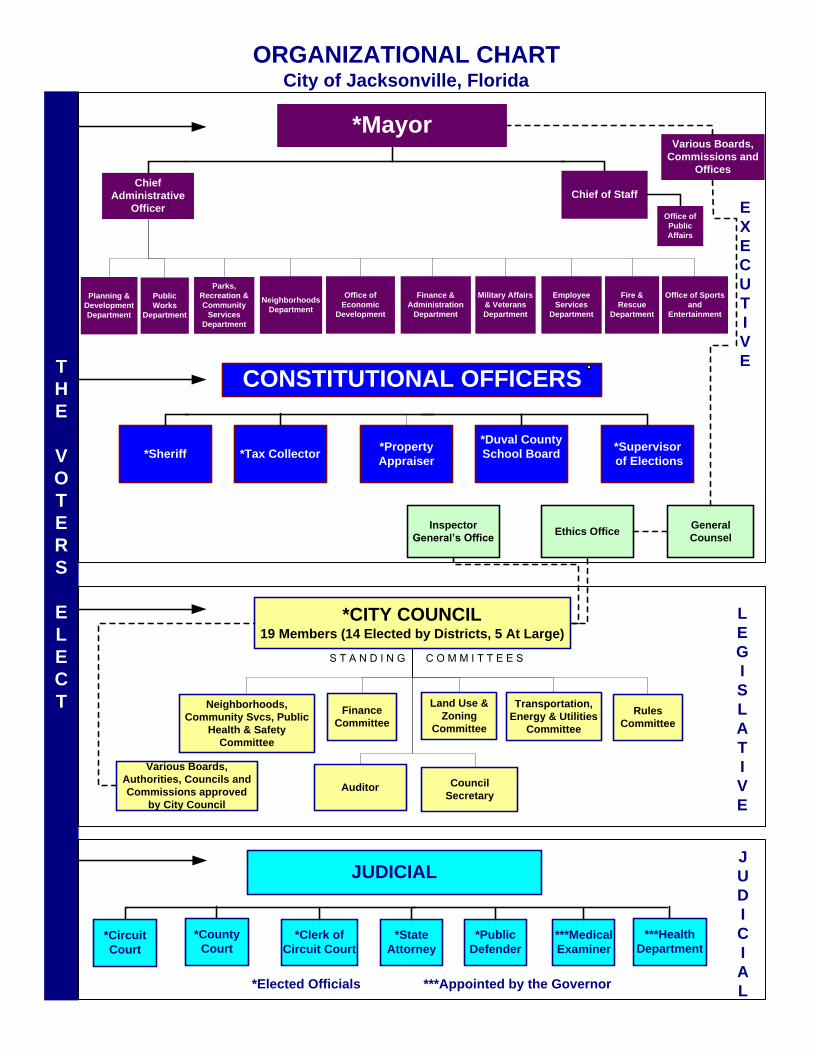
*CITY COUNCIL19 Members (14 Elected by Districts, 5 At Large)
Finance
Committee
Land Use &
Zoning
Committee
Neighborhoods,
Community Svcs, Public
Health & Safety
Committee
Transportation,
Energy & Utilities
Committee
Rules
Committee
Auditor Council
Secretary
General
Counsel
Various Boards,
Authorities, Councils and
Commissions approved
by City Council
*Mayor
Parks,
Recreation &
Community
Services
Department
Military Affairs
& Veterans
Department
Fire &
Rescue
Department
Finance &
Administration
Department
Various Boards,
Commissions and
Offices
T
H
E
V
O
T
E
R
S
E
L
E
C
T
*Sheriff *Tax Collector*Property
Appraiser
*Duval County
School Board*Supervisor
of Elections
*Circuit
Court
*County
Court*Clerk of
Circuit Court
*State
Attorney
*Public
Defender
***Medical
Examiner
ORGANIZATIONAL CHARTCity of Jacksonville, Florida
L
E
G
I
S
L
A
T
I
V
E
E
X
E
C
U
T
I
V
E
J
U
D
I
C
I
A
L
Chief
Administrative
Officer
*Elected Officials ***Appointed by the Governor
Planning &
Development
Department
Office of
Economic
Development
Employee
Services
Department
Neighborhoods
Department
CONSTITUTIONAL OFFICERS
Public
Works
Department
***Health
Department
JUDICIAL
Ethics Office
S T A N D I N G C O M M I T T E E S
Office of Sports
and
Entertainment
Chief of Staff
Office of
Public
Affairs
Inspector
General’s Office
xx
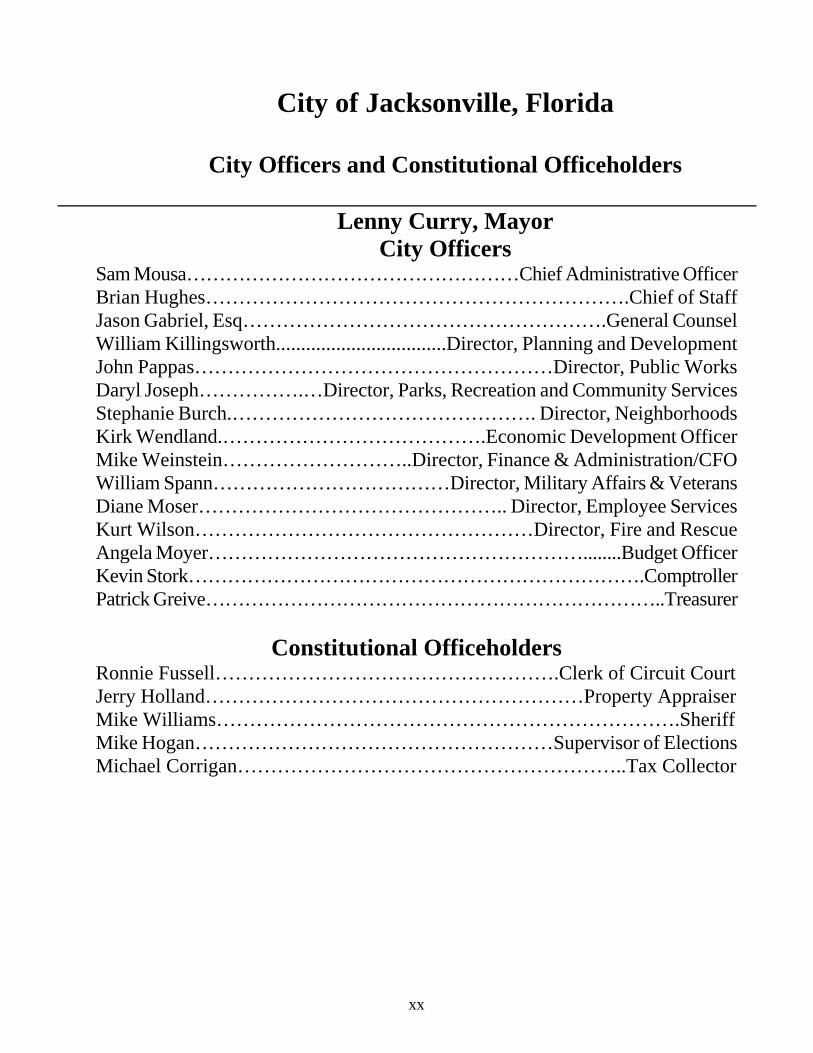
City of Jacksonville, Florida City Officers and Constitutional Officeholders Lenny Curry, Mayor City Officers Sam Mousa……………………………………………Chief Administrative Officer Brian Hughes……………………………………………………….Chief of Staff Jason Gabriel, Esq……………………………………………….General Counsel William Killingsworth..................................Director, Planning and Development John Pappas………………………………………………Director, Public Works Daryl Joseph…………….…Director, Parks, Recreation and Community Services Stephanie Burch.………………………………………. Director, Neighborhoods Kirk Wendland.………………………………….Economic Development Officer Mike Weinstein………………………..Director, Finance & Administration/CFO William Spann………………………………Director, Military Affairs & Veterans Diane Moser……………………………………….. Director, Employee Services Kurt Wilson……………………………………………Director, Fire and Rescue Angela Moyer…………………………………………………........Budget Officer Kevin Stork…………………………………………………………….Comptroller Patrick Greive……………………………………………………………..Treasurer
Constitutional Officeholders Ronnie Fussell…………………………………………….Clerk of Circuit Court Jerry Holland…………………………………………………Property Appraiser Mike Williams…………………………………………………………….Sheriff Mike Hogan………………………………………………Supervisor of Elections Michael Corrigan…………………………………………………..Tax Collector
xxi
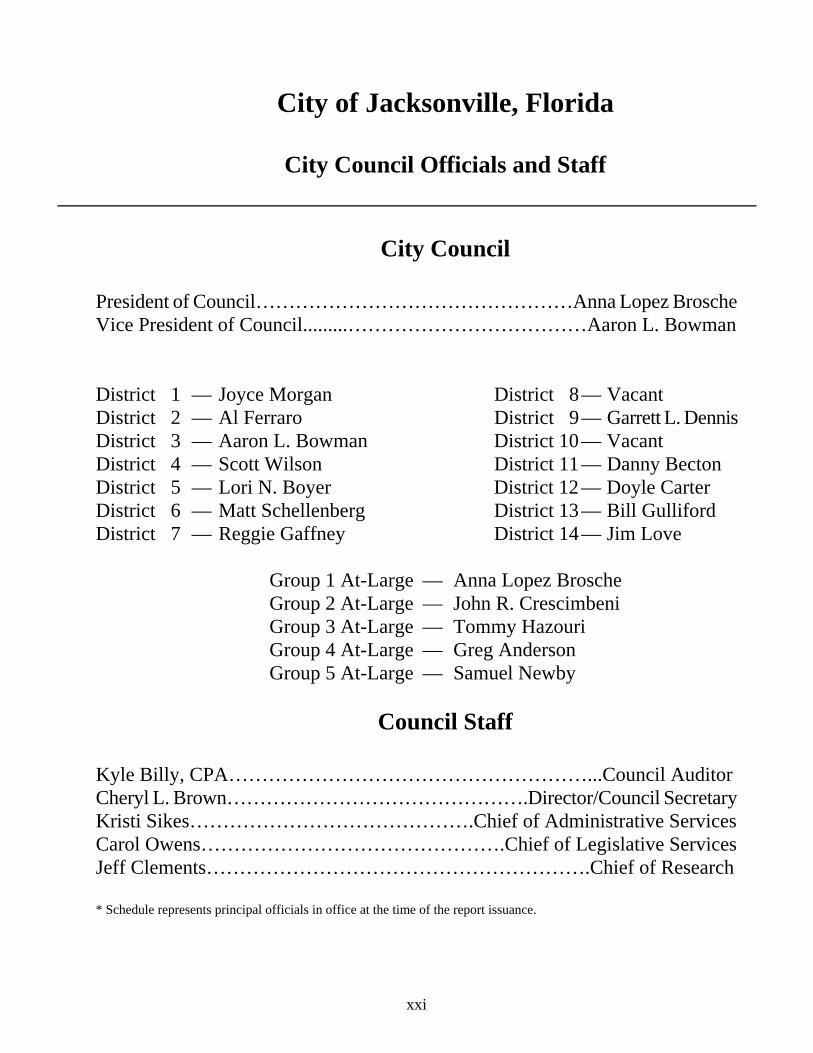
City of Jacksonville, Florida City Council Officials and Staff City Council President of Council…………………………………………Anna Lopez Brosche Vice President of Council.........………………………………Aaron L. Bowman District 1 — Joyce Morgan District 8 — Vacant District 2 — Al Ferraro District 9 — Garrett L. Dennis District 3 — Aaron L. Bowman District 10 — Vacant District 4 — Scott Wilson District 11 — Danny Becton District 5 — Lori N. Boyer District 12 — Doyle Carter District 6 — Matt Schellenberg District 13 — Bill Gulliford District 7 — Reggie Gaffney District 14 — Jim Love
Group 1 At-Large — Anna Lopez Brosche Group 2 At-Large — John R. Crescimbeni Group 3 At-Large — Tommy Hazouri Group 4 At-Large — Greg Anderson Group 5 At-Large — Samuel Newby
Council Staff Kyle Billy, CPA………………………………………………...Council Auditor Cheryl L. Brown……………………………………….Director/Council Secretary Kristi Sikes…………………………………….Chief of Administrative Services Carol Owens……………………………………….Chief of Legislative Services Jeff Clements………………………………………………….Chief of Research * Schedule represents principal officials in office at the time of the report issuance.

(This page is intentionally left blank.)
INDEPENDENT AUDITOR’S REPORT
The Honorable Mayor and Members of the City CouncilCity of Jacksonville, Florida
Report on the Financial Statements
We have audited the accompanying financial statements of the governmental activities, the businesstype activities, the aggregate discretely presented component units, each major fund and the aggregateremaining fund information of the City of Jacksonville, Florida (the “City”), as of and for the year endedSeptember 30, 2017, and the related notes to the financial statements, which collectively comprise theCity’s basic financial statements as listed in the table of contents.
Management’s Responsibility for the Financial Statements
Management is responsible for the preparation and fair presentation of these financial statements inaccordance with accounting principles generally accepted in the United States of America; this includesthe design, implementation, and maintenance of internal control relevant to the preparation and fairpresentation of financial statements that are free from material misstatement, whether due to fraud orerror.
Auditor’s Responsibility
Our responsibility is to express opinions on these financial statements based on our audit. We did notaudit the financial statements of JEA, which represents approximately 87%, 79%, and 89%, respectively,of the assets, net position, and revenues of the aggregate discretely presented component units. Wealso did not audit the financial statements of Jacksonville Transportation Authority which representsapproximately 5%, 8%, and 7%, respectively, of the assets, net position, and revenues of the aggregatediscretely presented component units. We also did not audit the financial statements of JacksonvillePort Authority, which represents approximately 8%, 12%, and 4%, respectively, of the assets, netposition, and revenues of the aggregate discretely presented component units. Those statements wereaudited by other auditors whose reports have been furnished to us, and our opinion insofar as it relatesto the amounts included for JEA, Jacksonville Transportation Authority and Jacksonville Port Authority, isbased solely on the reports of the other auditors. We conducted our audit in accordance with auditingstandards generally accepted in the United States of America and the standards applicable to financialaudits contained in Government Auditing Standards, issued by the Comptroller General of the UnitedStates. Those standards require that we plan and perform the audit to obtain reasonable assuranceabout whether the financial statements are free from material misstatement.
-1-
An audit involves performing procedures to obtain audit evidence about the amounts and disclosures inthe financial statements. The procedures selected depend on the auditor’s judgment, including theassessment of the risks of material misstatement of the financial statements, whether due to fraud orerror. In making those risk assessments, the auditor considers internal control relevant to the entity’spreparation and fair presentation of the financial statements in order to design audit procedures thatare appropriate in the circumstances, but not for the purpose of expressing an opinion on theeffectiveness of the entity’s internal control. Accordingly, we express no such opinion. An audit alsoincludes evaluating the appropriateness of accounting policies used and the reasonableness ofsignificant accounting estimates made by management, as well as evaluating the overall presentation ofthe financial statements.
We believe that the audit evidence we have obtained is sufficient and appropriate to provide a basis forour audit opinions.
Opinions
In our opinion, based on our audit and the reports of the other auditors, the financial statementsreferred to above present fairly, in all material respects, the respective financial position of thegovernmental activities, the business type activities, the aggregate discretely presented componentunits, each major fund and the aggregate remaining fund information of the City, as of September 30,2017, and the respective changes in financial position and, where applicable, cash flows thereof for theyear then ended in accordance with accounting principles generally accepted in the United States ofAmerica.
Change in Accounting Principle
As discussed in Note 15. H. to the financial statements, the City implemented the provisions of GASBStatement 77, Tax Abatement Disclosures. Our opinions are not modified with respect to this matter.
Required Supplementary Information
Accounting principles generally accepted in the United States of America require that management’sdiscussion and analysis, the schedule of revenue, expenditures and changes in fund balance – budgetand actual (budgetary basis) – general fund, and other postemployment benefits and pension schedulesas listed in the table of contents be presented to supplement the basic financial statements. Suchinformation, although not a part of the basic financial statements, is required by the GovernmentalAccounting Standards Board who considers it to be an essential part of financial reporting for placing thebasic financial statements in an appropriate operational, economic, or historical context. We and otherauditors have applied certain limited procedures to the required supplementary information inaccordance with auditing standards generally accepted in the United States of America, which consistedof inquiries of management about the methods of preparing the information and comparing theinformation for consistency with management’s responses to our inquiries, the basic financialstatements, and other knowledge we obtained during our audit of the basic financial statements. We donot express an opinion or provide any assurance on the information because the limited procedures donot provide us with sufficient evidence to express an opinion or provide any assurance.
-2-
Supplementary and Other Supplemental Information
Our audit was conducted for the purpose of forming opinions on the financial statements thatcollectively comprise the City’s basic financial statements. The introductory section, combining andindividual fund statements and schedules, other supplemental information and the statistical section,are presented for purposes of additional analysis and are not a required part of the basic financialstatements.
The combining and individual fund statements and schedules, and other supplemental information arethe responsibility of management and were derived from and relate directly to the underlyingaccounting and other records used to prepare the financial statements. Such information has beensubjected to the auditing procedures applied in the audit of the basic financial statements and certainadditional procedures, including comparing and reconciling such information directly to the underlyingaccounting and other records used to prepare the financial statements or to the basic financialstatements themselves, and other additional procedures in accordance with auditing standardsgenerally accepted in the United States of America by us and the other auditors. In our opinion, basedon our audit, the procedures performed as described above, and the reports of other auditors, thecombining and individual fund statements and schedules, and other supplemental information are fairlystated, in all material respects, in relation to the basic financial statements as a whole.
This introductory section and statistical section have not been subjected to the auditing proceduresapplied by us and the other auditors in the audit of the basic financial statements and, accordingly, wedo not express an opinion or provide any assurance on them.
Other Reporting Required by Government Auditing Standards
In accordance with Government Auditing Standards, we have also issued our report dated June 22, 2018,on our consideration of the City’s internal control over financial reporting and on our tests of itscompliance with certain positions of laws, regulations, contracts, and grant agreements and othermatters. That report does not include the results of the other auditors’ testing of internal control overfinancial reporting or compliance and other matters that are reported on separately by those auditors.The purpose of that report is solely to describe the scope of our testing of internal control over financialreporting and compliance and the results of that testing, and not to provide an opinion on theeffectiveness of the City’s internal control over financial reporting or on compliance. That report is anintegral part of an audit performed in accordance with Government Auditing Standards in consideringthe City’s internal control over financial reporting and compliance.
Jacksonville, FloridaJune 22, 2018
-3-
INDEPENDENT AUDITOR’S REPORT ON INTERNAL CONTROL OVER FINANCIAL REPORTING AND ON COMPLIANCE AND OTHER MATTERS BASED ON AN AUDIT OF FINANCIAL STATEMENTS PERFORMED IN ACCORDANCE WITH GOVERNMENT AUDITING STANDARDS
To the Honorable Mayor and Members of the City Council City of Jacksonville, Florida
We have audited, in accordance with auditing standards generally accepted in the United States of America and the standards applicable to financial audits contained in Government Auditing Standards issued by the Comptroller General of the United States, the financial statements of the governmental activities the business‐type activities, the aggregate discretely presented component units, each major fund, and the aggregate remaining fund information of the City of Jacksonville, Florida (the “City”) as of and for the year ended September 30, 2017, and the related notes to the financial statements, which collectively comprise the City’s basic financial statements, and have issued our report thereon dated June 22, 2018. Our report includes a reference to other auditors who audited the financial statements of JEA, Jacksonville Transportation Authority and Jacksonville Port Authority. Our report also includes an emphasis of matter paragraph relating to the City’s adoption of Governmental Accounting Standards Board (GASB) Statement No. 77, Tax Abatement Disclosures, effective for reporting periods beginning after December 15, 2015. This report does not include the results of the other auditors’ testing of internal control over financial reporting or compliance and other matters that are reported on separately by those auditors.
Internal Control over Financial Reporting
In planning and performing our audit of the financial statements, we considered the City’s internal control over financial reporting (internal control) to determine the audit procedures that are appropriate in the circumstances for the purpose of expressing our opinions on the financial statements, but not for the purpose of expressing an opinion on the effectiveness of the City’s internal control. Accordingly, we do not express an opinion on the effectiveness of the City’s internal control.
A deficiency in internal control exists when the design or operation of a control does not allow management or employees, in the normal course of performing their assigned functions, to prevent, or detect and correct, misstatements on a timely basis. A material weakness is a deficiency, or a combination of deficiencies, in internal control, such that there is a reasonable possibility that a material misstatement of the entity’s financial statements will not be prevented, or detected and corrected on a timely basis. A significant deficiency is a deficiency, or a combination of deficiencies, in internal control that is less severe than a material weakness, yet important enough to merit attention by those charged with governance.
-4-
Our consideration of internal control was for the limited purpose described in the first paragraph of thissection and was not designed to identify all deficiencies in internal control that might be materialweaknesses or, significant deficiencies. Given these limitations, during our audit we did not identify anydeficiencies in internal control that we consider to be material weaknesses. However, materialweaknesses may exist that have not been identified.
Compliance and Other Matters
As part of obtaining reasonable assurance about whether the City’s financial statements are free frommaterial misstatement, we performed tests of its compliance with certain provisions of laws,regulations, contracts, and grant agreements, noncompliance with which could have a direct andmaterial effect on the determination of financial statement amounts. However, providing an opinion oncompliance with those provisions was not an objective of our audit, and accordingly, we do not expresssuch an opinion. The results of our tests disclosed no instances of noncompliance or other matters thatare required to be reported under Government Auditing Standards.
Purpose of this Report
The purpose of this report is solely to describe the scope of our testing of internal control andcompliance and the results of that testing, and not to provide an opinion on the effectiveness of theCity’s internal control or on compliance. This report is an integral part of an audit performed inaccordance with Government Auditing Standards in considering the City’s internal control andcompliance. Accordingly, this communication is not suitable for any other purpose.
Jacksonville, FloridaJune 22, 2018
-5-

(This page is intentionally left blank.)
-6-

MANAGEMENT'S DISCUSSION AND ANALYSIS
-7-
MANAGEMENT’S DISCUSSION AND ANALYSIS The City of Jacksonville’s discussion and analysis is designed to provide an objective and easy to read overview of the City’s financial activities focusing on significant financial issues, as well as identifying material deviations from the financial plan (the approved budget), changes in the City’s financial position (its ability to address the next and subsequent year challenges), and individual fund issues or concerns. The Management’s Discussion and Analysis (MD&A) is designed to focus on the current year’s activities, resulting changes and currently known facts. The information contained within this MD&A should be considered only as a part of the City’s Comprehensive Annual Financial Report (CAFR). Financial Highlights
• The City’s General Fund operations had total revenues of $1.1 billion in fiscal year 2017. • Property tax revenues in the General Fund experienced a $25.9 million, 4.6% increase. There were also increases in
sales & tourist taxes, intergovernmental, charges for services, fines & forfeitures and other revenues. • JEA Contribution increased $1.6 million in fiscal year 2017. • Community & utility service taxes revenues had a combined $2.4 million decrease in addition to smaller decreases in
local business taxes and licenses, permits & fees and interest. • General Fund total increase in revenues was $37.2 million in fiscal year 2017. • General Fund total expenses increased by 52 million, 5.5%, primarily due to increased spending in Fire Rescue and
the Sheriff’s Office. • Total governmental activities revenues increased by $72.4 million in fiscal year 2017 a 4.6% increase over fiscal year
2016. • Total governmental activity expenses increased $169.8 million in fiscal year 2017.
Additional information that explains these financial highlights may be found on following pages of this report. City Highlights Fiscal year 2017 had a number of positive outcomes. Some of the impact and improvements were as follows:
• The announcement of 15 projects that are projected to create more than 2,400 jobs and nearly $446 million in private capital investment. Seven of the 15 projects are located in City Council Districts 7, 8 and 9, promising more than $287 million in private capital investment in the northwest area of Jacksonville.
• The JSEB Access to Capital Program was reestablished and contracted with a nationally recognized micro lender, Accion, to manage the program.
• Reestablished the Global Cities Initiative (GCI), in partnership with JAXUSA. This program will assist small to medium sized businesses to expand the City’s exporting capabilities.
• Continued to partner with national development company Hillwood to market and develop one of the City’s biggest assets, Cecil Commerce Center. Major developments included the construction of Amazon’s 1 million square foot distribution center and Hillwood’s 400,000 square foot industrial spec building.
• JIA Community Redevelopment Area Progress o Amazon completed its 2.4 million square foot distribution center o Funding for Armsdale and Duval Road improvements was approved o Approved infrastructure improvements for the River City Crossing redevelopment project, which will create
160 new jobs and $33.8 million in private capital investment • Renewal of Arlington Community Redevelopment Area Progress
o Initiated a zoning overlay effort with the City’s Planning & Development Department o Partnered with JTA, FDOT and Public Works to implement street improvements for University and Merrill
Roads. • King Soutel Crossing Community Redevelopment Area Progress
o Worked to update the CRA plan to capture potential infrastructure projects to help transform the area.
-8-
OVERVIEW OF THE BASIC FINANCIAL STATEMENTS
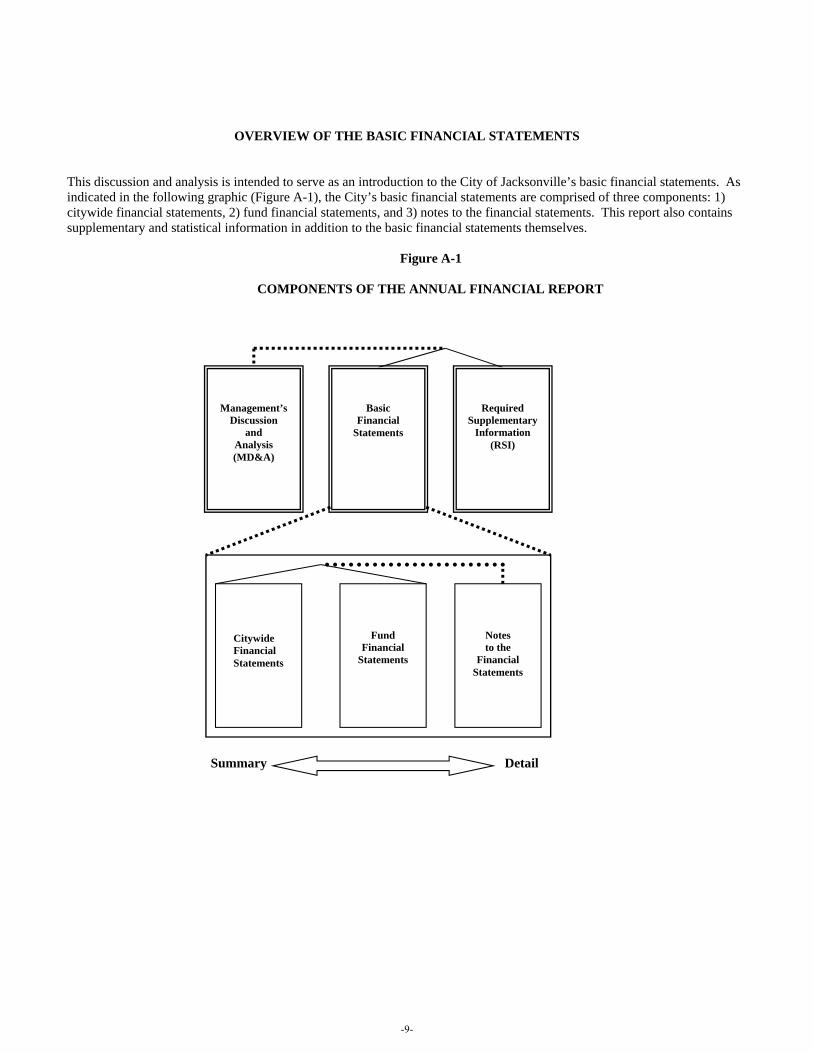
This discussion and analysis is intended to serve as an introduction to the City of Jacksonville’s basic financial statements. As indicated in the following graphic (Figure A-1), the City’s basic financial statements are comprised of three components: 1) citywide financial statements, 2) fund financial statements, and 3) notes to the financial statements. This report also contains supplementary and statistical information in addition to the basic financial statements themselves.
Figure A-1
COMPONENTS OF THE ANNUAL FINANCIAL REPORT
Summary Detail
Management’s
Discussion and
Analysis (MD&A)
Basic Financial
Statements
Required Supplementary
Information (RSI)
Citywide Financial
Statements
Fund
Financial Statements
Notes to the
Financial Statements
-9-
Citywide Basic Financial Statements The citywide basic financial statements are designed to provide readers with a broad overview of the City of Jacksonville’s finances, in a manner similar to a private-sector business. The focus of the Statement of Net Position is designed to be similar to bottom line results for the City and its governmental and business-type activities. This statement combines and consolidates governmental funds, current financial resources (short-term spendable resources) with capital assets and long term obligations. The Statement of Activities distinguishes functions of the City of Jacksonville that are principally supported by taxes and intergovernmental revenues (governmental activities such as: police, fire, public works, recreation, and general administration) from other functions that are intended to recover all or a significant portion of their costs through user fees and charges (business-type activities such as: solid waste, stormwater, sports complex, motor vehicle and public parking).
Component Units are other governmental units over which the City can exercise influence and/or may be obligated to provide financial subsidy. The City of Jacksonville’s component units are as follows: Jacksonville Electric Authority (JEA), Jacksonville Transportation Authority (JTA), Jacksonville Port Authority (JPA), and Jacksonville Housing Finance Authority. Separate financial statements are published by JEA, JTA, and JPA. The focus of the statements is on the primary government and the presentation allows the user to address the relationship with the Component Units.
The two statements (Statement of Net Position and Statement of Activities) demonstrate how the City’s net position has changed. Increases or decreases in net position are good indicators of whether the City’s financial health is improving or deteriorating over time. Other non-financial factors such as changes in the City’s property tax base are important considerations to assess the City’s overall financial condition.
Fund Financial Statements A fund is a grouping of related accounts used to maintain control over resources that have been segregated for specific activities or objectives. Traditional users of governmental financial statements will find the Fund Financial Statements presentation more familiar. The focus is on Major Funds, rather than fund types, which provides detailed information about the most significant funds. The City of Jacksonville, like other state and local governments, uses funds to ensure and demonstrate compliance with financial requirements imposed by law, bond covenants and local administrative and legislative actions. All of the City’s funds can be divided into three categories: governmental funds, proprietary funds and fiduciary funds.
Governmental Funds Governmental funds are used to account for essentially the same functions reported as governmental activities in the citywide basic financial statements. However, unlike the citywide basic financial statements, governmental fund financial statements focus on near-term inflows and outflows of spendable resources, as well as on balances of spendable resources available at the end of the fiscal year. Such information may be useful in evaluating a government’s near-term financing requirements. Since the focus of governmental funds is narrower than that of the citywide basic financial statements, it is useful to compare the information presented for governmental funds with similar information presented for governmental activities in the citywide basic financial statements. This allows readers to better understand the long-term impact of the government’s near-term financing decisions. Both the governmental fund balance sheet and the governmental fund statement of revenues, expenditures, and changes in fund balances provide a reconciliation to facilitate this comparison between governmental funds and governmental activities. Governmental fund information is presented separately in the governmental fund balance sheet and in the governmental fund statement of revenues, expenditures, and changes in fund balances for the General Fund, Special Bonded Debt Obligations Fund and Better Jacksonville Plan Special Bonded Debt Obligations Fund, all of which are considered to be major funds. Information from other non-major funds is combined into a single, aggregated presentation.
-10-
Proprietary Funds Proprietary funds provide the same type of information as the business-type activities in the citywide basic financial statements, only in more detail. The proprietary fund financial statements can be found in the Fund Financial Statements section of this report. The City of Jacksonville maintains two types of proprietary funds.
Enterprise funds are used to report the same functions presented as business-type activities in the citywide basic financial statements. The City uses enterprise funds to report separate information on operations such as Solid Waste Disposal, Stormwater Services and City Venues which are all major funds. The Sports Complex Capital, Motor Vehicle Inspection and Public Parking are non-major enterprise funds. The internal service funds are used to account for activities that provide goods and services to the City’s other programs and activities. Since the internal service funds predominantly benefit governmental rather than business-type functions, they have been included within governmental activities in the citywide basic financial statements.
Fiduciary Funds The City of Jacksonville is the trustee, or fiduciary, for trusts such as the City employee’s retirement plans. Because of a trust arrangement, these assets can be used only for the trust beneficiaries. The City is responsible for ensuring that the assets reported in these funds are used for their intended purposes. All of the City of Jacksonville’s fiduciary activities are reported in a separate statement of fiduciary net position and a statement of changes in fiduciary net position. These activities are excluded from the citywide basic financial statements because the assets cannot be used to support or finance the City’s programs or operations. The Fiduciary Funds Statement of Changes in Net Position can be found in the Fund Financial Statement section of this report.
Notes to the Financial Statements The notes to the financial statements provide additional information that is essential to a full understanding of the data provided in the citywide and fund financial statements. The notes can be found as a part of the Basic Financial Statements section of this report. Other Information This report additionally includes required supplementary information (RSI) containing budgetary comparisons with related notes and the progress of the City’s employee pension obligations and other post-employment obligations. The combined statements in connection with non-major governmental and enterprise funds, internal service funds, fiduciary funds and non-major component units are presented following the required supplemental information. Additional statistical information is presented to give report users a better historical perspective and assist in assessing current financial status and trends of the governmental unit. Economic data is presented to allow a broader understanding of the economic and social environment in which the City government operates.
-11-
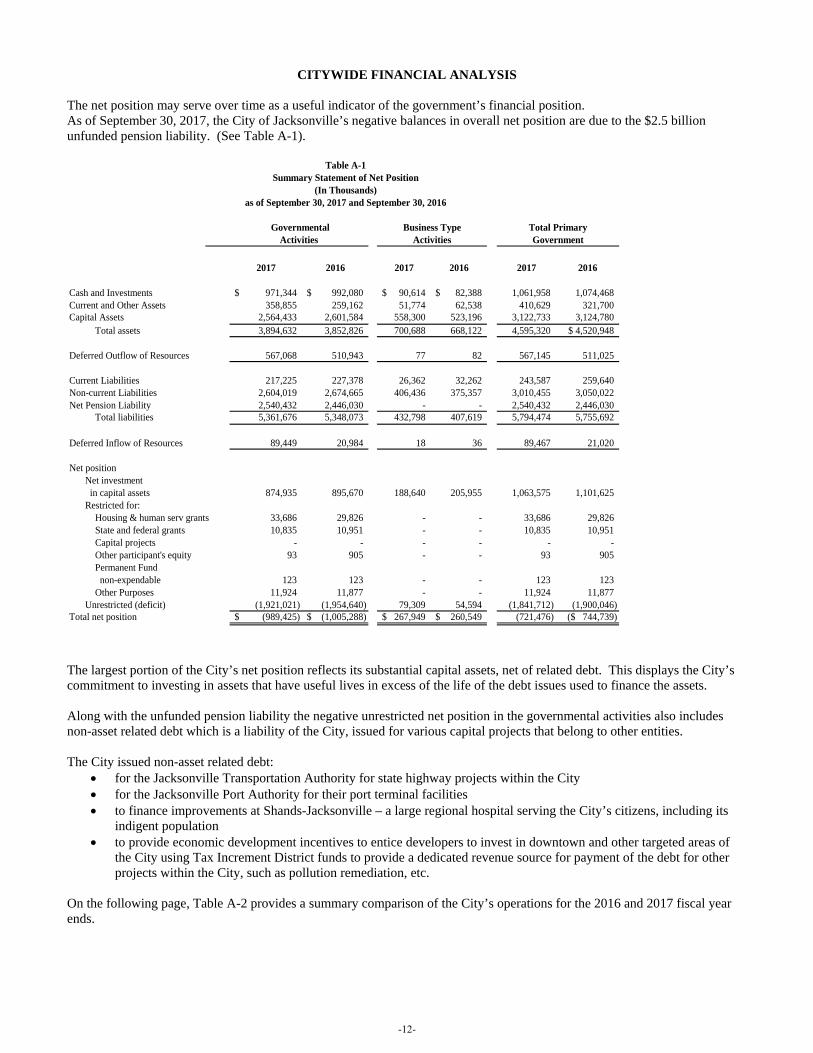
CITYWIDE FINANCIAL ANALYSIS The net position may serve over time as a useful indicator of the government’s financial position. As of September 30, 2017, the City of Jacksonville’s negative balances in overall net position are due to the $2.5 billion unfunded pension liability. (See Table A-1).
2017 2016 2017 2016 2017 2016
Cash and Investments 971,344$ 992,080$ 90,614$ 82,388$ 1,061,958 1,074,468 Current and Other Assets 358,855 259,162 51,774 62,538 410,629 321,700 Capital Assets 2,564,433 2,601,584 558,300 523,196 3,122,733 3,124,780
Total assets 3,894,632 3,852,826 700,688 668,122 4,595,320 $ 4,520,948
Deferred Outflow of Resources 567,068 510,943 77 82 567,145 511,025
Current Liabilities 217,225 227,378 26,362 32,262 243,587 259,640 Non-current Liabilities 2,604,019 2,674,665 406,436 375,357 3,010,455 3,050,022 Net Pension Liability 2,540,432 2,446,030 - - 2,540,432 2,446,030
Total liabilities 5,361,676 5,348,073 432,798 407,619 5,794,474 5,755,692
Deferred Inflow of Resources 89,449 20,984 18 36 89,467 21,020
Net positionNet investment in capital assets 874,935 895,670 188,640 205,955 1,063,575 1,101,625 Restricted for:
Housing & human serv grants 33,686 29,826 - - 33,686 29,826 State and federal grants 10,835 10,951 - - 10,835 10,951 Capital projects - - - - - - Other participant's equity 93 905 - - 93 905 Permanent Fund non-expendable 123 123 - - 123 123 Other Purposes 11,924 11,877 - - 11,924 11,877
Unrestricted (deficit) (1,921,021) (1,954,640) 79,309 54,594 (1,841,712) (1,900,046) Total net position (989,425)$ (1,005,288)$ 267,949$ 260,549$ (721,476) ($ 744,739)
Table A-1Summary Statement of Net Position
(In Thousands)as of September 30, 2017 and September 30, 2016
Total PrimaryGovernment
GovernmentalActivities Activities
Business Type
The largest portion of the City’s net position reflects its substantial capital assets, net of related debt. This displays the City’s commitment to investing in assets that have useful lives in excess of the life of the debt issues used to finance the assets. Along with the unfunded pension liability the negative unrestricted net position in the governmental activities also includes non-asset related debt which is a liability of the City, issued for various capital projects that belong to other entities. The City issued non-asset related debt:
• for the Jacksonville Transportation Authority for state highway projects within the City • for the Jacksonville Port Authority for their port terminal facilities • to finance improvements at Shands-Jacksonville – a large regional hospital serving the City’s citizens, including its
indigent population • to provide economic development incentives to entice developers to invest in downtown and other targeted areas of
the City using Tax Increment District funds to provide a dedicated revenue source for payment of the debt for other projects within the City, such as pollution remediation, etc.
On the following page, Table A-2 provides a summary comparison of the City’s operations for the 2016 and 2017 fiscal year ends.
-12-
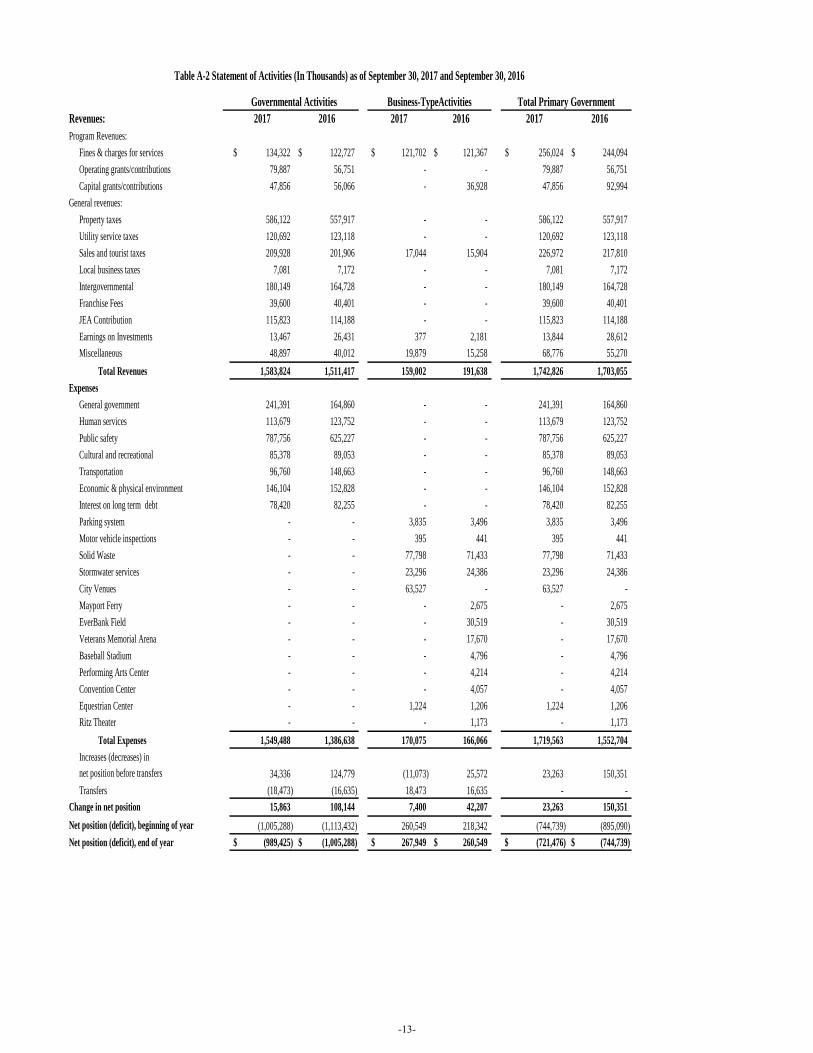
Revenues: 2017 2016 2017 2016 2017 2016Program Revenues:
Fines & charges for services 134,322$ 122,727$ 121,702$ 121,367$ 256,024$ 244,094$ Operating grants/contributions 79,887 56,751 - - 79,887 56,751 Capital grants/contributions 47,856 56,066 - 36,928 47,856 92,994
General revenues: Property taxes 586,122 557,917 - - 586,122 557,917 Utility service taxes 120,692 123,118 - - 120,692 123,118 Sales and tourist taxes 209,928 201,906 17,044 15,904 226,972 217,810 Local business taxes 7,081 7,172 - - 7,081 7,172 Intergovernmental 180,149 164,728 - - 180,149 164,728 Franchise Fees 39,600 40,401 - - 39,600 40,401 JEA Contribution 115,823 114,188 - - 115,823 114,188 Earnings on Investments 13,467 26,431 377 2,181 13,844 28,612 Miscellaneous 48,897 40,012 19,879 15,258 68,776 55,270
Total Revenues 1,583,824 1,511,417 159,002 191,638 1,742,826 1,703,055 Expenses
General government 241,391 164,860 - - 241,391 164,860 Human services 113,679 123,752 - - 113,679 123,752 Public safety 787,756 625,227 - - 787,756 625,227 Cultural and recreational 85,378 89,053 - - 85,378 89,053 Transportation 96,760 148,663 - - 96,760 148,663 Economic & physical environment 146,104 152,828 - - 146,104 152,828 Interest on long term debt 78,420 82,255 - - 78,420 82,255 Parking system - - 3,835 3,496 3,835 3,496 Motor vehicle inspections - - 395 441 395 441 Solid Waste - - 77,798 71,433 77,798 71,433 Stormwater services - - 23,296 24,386 23,296 24,386 City Venues - - 63,527 - 63,527 - Mayport Ferry - - - 2,675 - 2,675 EverBank Field - - - 30,519 - 30,519 Veterans Memorial Arena - - - 17,670 - 17,670 Baseball Stadium - - - 4,796 - 4,796 Performing Arts Center - - - 4,214 - 4,214 Convention Center - - - 4,057 - 4,057 Equestrian Center - - 1,224 1,206 1,224 1,206 Ritz Theater - - - 1,173 - 1,173
Total Expenses 1,549,488 1,386,638 170,075 166,066 1,719,563 1,552,704 Increases (decreases) innet position before transfers and special item 34,336 124,779 (11,073) 25,572 23,263 150,351 Transfers (18,473) (16,635) 18,473 16,635 - -
Change in net position 15,863 108,144 7,400 42,207 23,263 150,351 Net position (deficit), beginning of year as restated (1,005,288) (1,113,432) 260,549 218,342 (744,739) (895,090) Net position (deficit), end of year (989,425)$ (1,005,288)$ 267,949$ 260,549$ (721,476)$ (744,739)$
Table A-2 Statement of Activities (In Thousands) as of September 30, 2017 and September 30, 2016
Total Primary GovernmentGovernmental Activities Business-TypeActivities
-13-
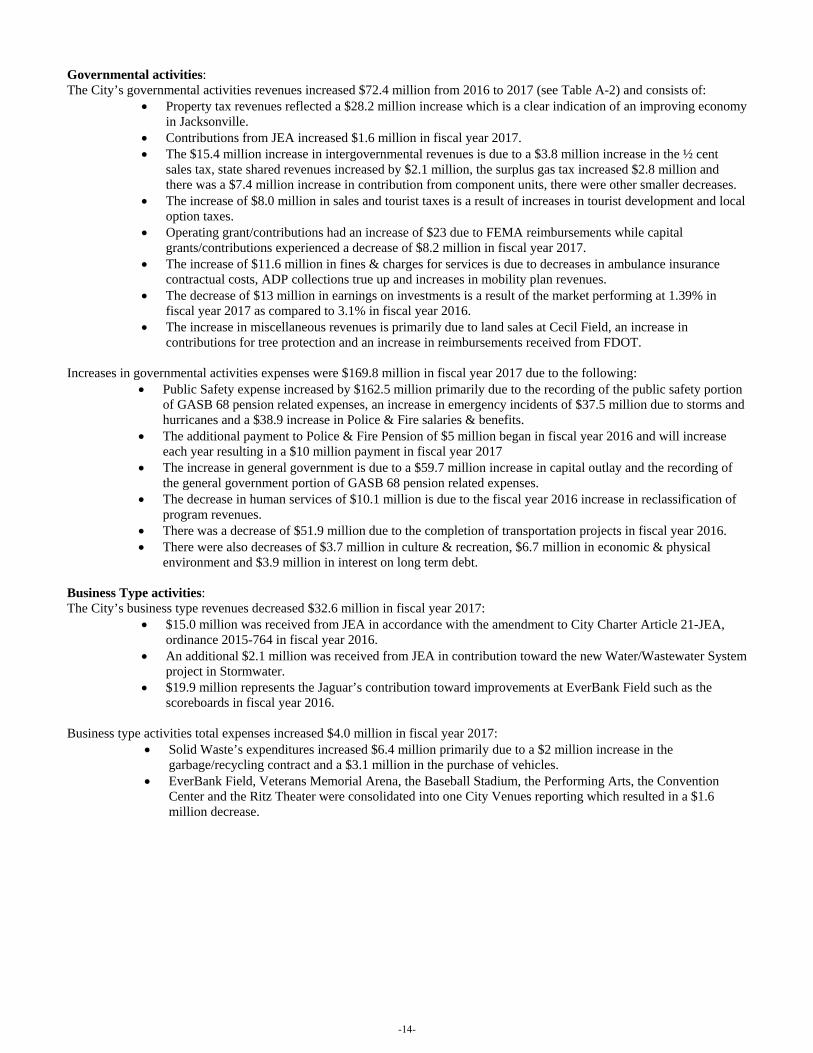
Governmental activities: The City’s governmental activities revenues increased $72.4 million from 2016 to 2017 (see Table A-2) and consists of:
• Property tax revenues reflected a $28.2 million increase which is a clear indication of an improving economy in Jacksonville.
• Contributions from JEA increased $1.6 million in fiscal year 2017. • The $15.4 million increase in intergovernmental revenues is due to a $3.8 million increase in the ½ cent
sales tax, state shared revenues increased by $2.1 million, the surplus gas tax increased $2.8 million and there was a $7.4 million increase in contribution from component units, there were other smaller decreases.
• The increase of $8.0 million in sales and tourist taxes is a result of increases in tourist development and local option taxes.
• Operating grant/contributions had an increase of $23 due to FEMA reimbursements while capital grants/contributions experienced a decrease of $8.2 million in fiscal year 2017.
• The increase of $11.6 million in fines & charges for services is due to decreases in ambulance insurance contractual costs, ADP collections true up and increases in mobility plan revenues.
• The decrease of $13 million in earnings on investments is a result of the market performing at 1.39% in fiscal year 2017 as compared to 3.1% in fiscal year 2016.
• The increase in miscellaneous revenues is primarily due to land sales at Cecil Field, an increase in contributions for tree protection and an increase in reimbursements received from FDOT.
Increases in governmental activities expenses were $169.8 million in fiscal year 2017 due to the following:
• Public Safety expense increased by $162.5 million primarily due to the recording of the public safety portion of GASB 68 pension related expenses, an increase in emergency incidents of $37.5 million due to storms and hurricanes and a $38.9 increase in Police & Fire salaries & benefits.
• The additional payment to Police & Fire Pension of $5 million began in fiscal year 2016 and will increase each year resulting in a $10 million payment in fiscal year 2017
• The increase in general government is due to a $59.7 million increase in capital outlay and the recording of the general government portion of GASB 68 pension related expenses.
• The decrease in human services of $10.1 million is due to the fiscal year 2016 increase in reclassification of program revenues.
• There was a decrease of $51.9 million due to the completion of transportation projects in fiscal year 2016. • There were also decreases of $3.7 million in culture & recreation, $6.7 million in economic & physical
environment and $3.9 million in interest on long term debt.
Business Type activities: The City’s business type revenues decreased $32.6 million in fiscal year 2017:
• $15.0 million was received from JEA in accordance with the amendment to City Charter Article 21-JEA, ordinance 2015-764 in fiscal year 2016.
• An additional $2.1 million was received from JEA in contribution toward the new Water/Wastewater System project in Stormwater.
• $19.9 million represents the Jaguar’s contribution toward improvements at EverBank Field such as the scoreboards in fiscal year 2016.
Business type activities total expenses increased $4.0 million in fiscal year 2017: • Solid Waste’s expenditures increased $6.4 million primarily due to a $2 million increase in the
garbage/recycling contract and a $3.1 million in the purchase of vehicles. • EverBank Field, Veterans Memorial Arena, the Baseball Stadium, the Performing Arts, the Convention
Center and the Ritz Theater were consolidated into one City Venues reporting which resulted in a $1.6 million decrease.
-14-
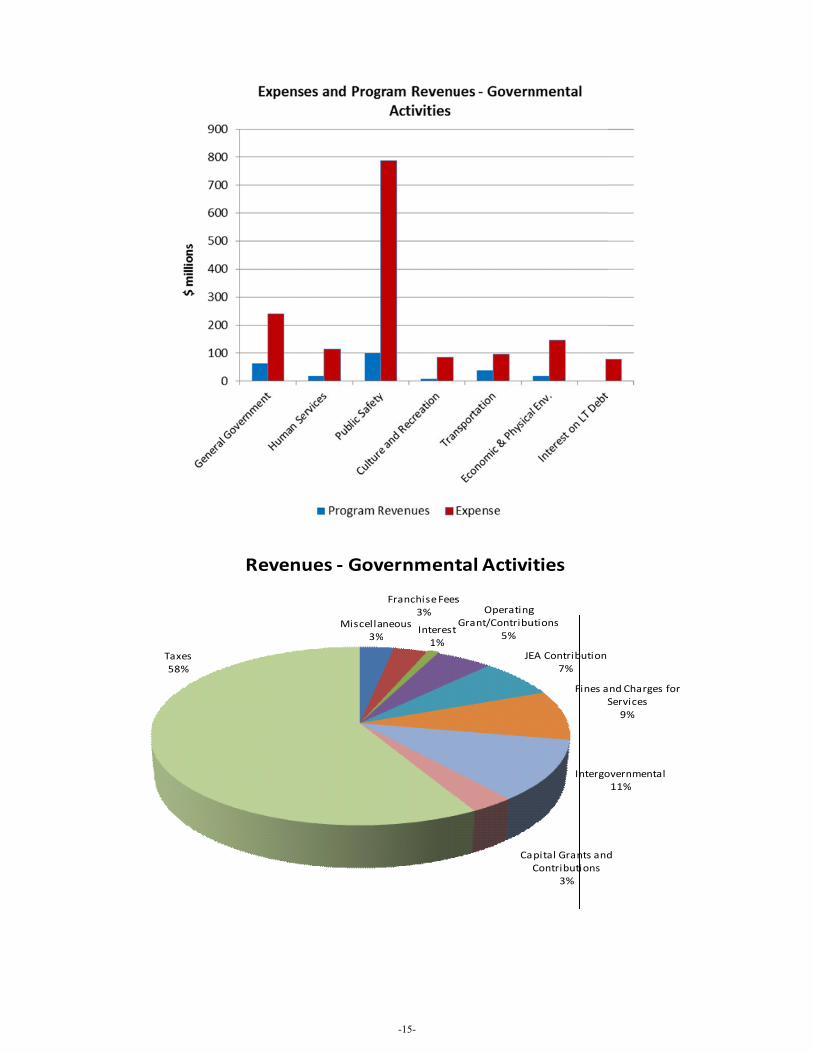
Taxes58%
Revenu
Miscella3%
ues ‐ Gov
aneous%
Franchise Fees3%
Interest1%
vernment
s
t
OperatingGrant/Contribu
5%
JE
Ca
tal Activi
g utions
EA Contribution7%
Fines aS
Intergo
pital Grants andContributions
3%
ties
nd Charges for Services
9%
overnmental 11%
d
-15-
Culture and Recreation
6% Interest on LT Debt 5%
Human Services 7%
Economic & Physical Env. 9%
General Government 16%
Transportation 6%
Public Safety 51%
Expenses - Governmental Activities
-16-
FINANCIAL ANALYSIS OF THE CITY GOVERNMENT’S FUNDS As noted earlier, the City of Jacksonville uses fund accounting to ensure and demonstrate compliance with finance-related legal requirements. Governmental Funds: The focus of the City’s governmental funds is to provide information on near-term inflows, outflows and balances of spendable resources. Such information is useful in assessing the City’s financing requirements. In particular, unassigned fund balance may serve as a useful measure of a government’s net resources available for spending at the end of fiscal year 2017. The City uses fund accounting to ensure and demonstrate compliance with finance-related legal requirements. All non-major funds of each governmental fund type with legally adopted annual budgets are included in the Combining Schedule of Revenue, Expenditures, and Changes in Fund Balance – Budget and Actual, which can be found in the Combining Individual Fund Statements and Schedules. The General Fund and Major Special Revenue Fund Schedule of Revenues, Expenditures, and Changes in Fund Balances - Budget and Actual is included as Required Supplementary Information following the Notes to the Financial Statements. The General Fund is the chief operating fund of the City. At the end of the current fiscal year, the unassigned fund balance of the General Fund was $90 million. The General Fund’s total fund balance was $210,415 million, with $56.2 million committed by City Council as an emergency reserve. The City’s Reserve Policy for the General Fund is covered by Section 106.107 of the City’s municipal code. The policy requires that the emergency reserve shall not be used except as initiated by the Mayor through written communication to City Council, explaining the emergency, with subsequent approval by two-thirds votes of all City Council members. The Emergency Reserve can be used to address unanticipated non-reimbursed expenditures arising out of a hurricane, tornado, other major weather related events, and/or other massive infrastructure failures or disasters, whether man made or caused by nature. Under normal circumstances, the City would first elect to utilize the Operating Reserve before considering use of its Emergency Reserve. Key factors affecting changes in major funds and fund balance in fiscal year 2017 operations are as follows: General Fund:
• Property taxes account for 50.5% of the General Fund revenue and increased by $25.9 million, 4.6% increase over the previous fiscal year. Interest revenue decreased $2.2 million due to a lower return in fiscal year 2017. General Fund revenues had an overall increase of $37.2 million and an overall increase in expenditures of $52.9 million as compared to fiscal year 2016. The millage rate for the City of Jacksonville remained the same from fiscal year 2016 to 2017 at 11.4419
Special Bonded Debt – Better Jacksonville Plan Obligations (BJP): • Outstanding long term BJP debt principal payments decreased by $11.4 million for fiscal year 2016 due to the
amortization schedule of BJP Transportation bonds, which were structured to match expected revenues over time. The City redeemed a total of $42.9 million in BJP bonds. Interest and other fiscal charges decreased by $5.9 million due to the prior year’s refunding activities that included the prepayment of interest costs due in FY 17 and lower overall outstanding BJP debt.
Special Bonded Debt – Obligations: • Outstanding long term Special Obligation debt principal payments increased $0.9 million for fiscal year 2017 due to
year over year differences in the amortization schedule. The City redeemed a total of $50.8 million in Special Obligation bonds with a decrease of $1.6 million in interest and other fiscal charges.
Proprietary Funds: The City’s proprietary funds provide the same type of information found in the government-wide business-type activities financial statements, but in more detail. Solid Waste, Storm Water Services and City Venues are reported as major proprietary funds in fiscal year 2017.
-17-
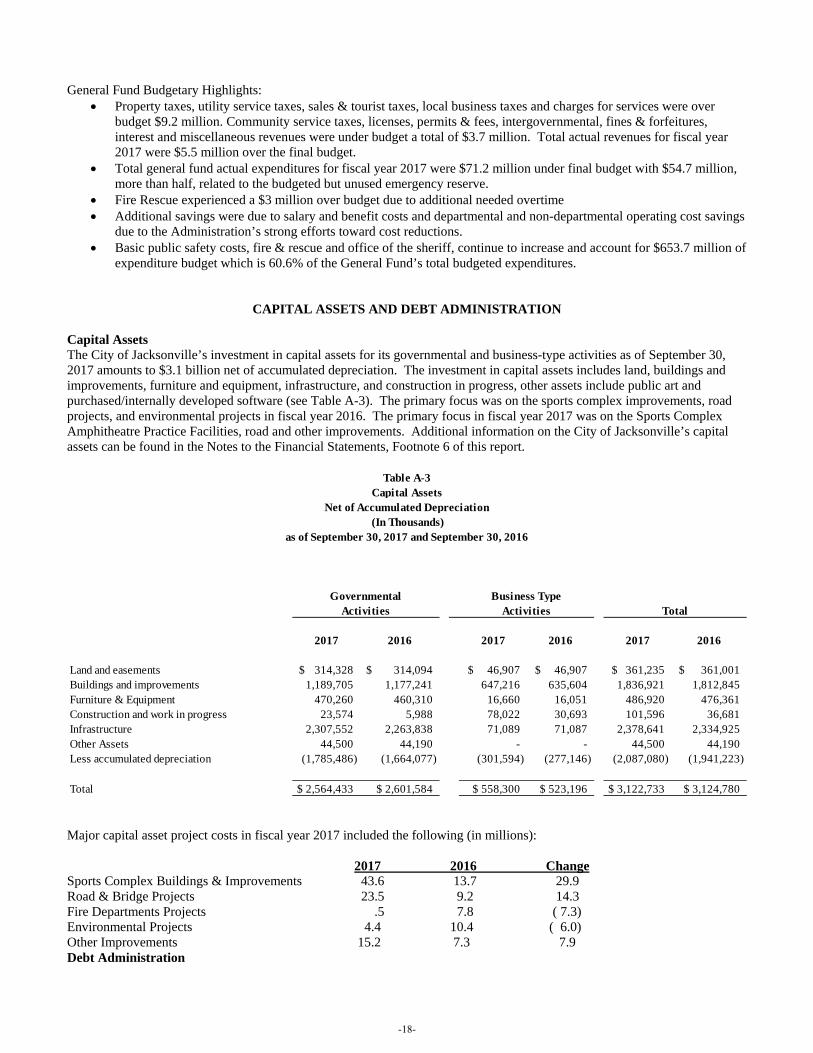
General Fund Budgetary Highlights:
• Property taxes, utility service taxes, sales & tourist taxes, local business taxes and charges for services were over budget $9.2 million. Community service taxes, licenses, permits & fees, intergovernmental, fines & forfeitures, interest and miscellaneous revenues were under budget a total of $3.7 million. Total actual revenues for fiscal year 2017 were $5.5 million over the final budget.
• Total general fund actual expenditures for fiscal year 2017 were $71.2 million under final budget with $54.7 million, more than half, related to the budgeted but unused emergency reserve.
• Fire Rescue experienced a $3 million over budget due to additional needed overtime • Additional savings were due to salary and benefit costs and departmental and non-departmental operating cost savings
due to the Administration’s strong efforts toward cost reductions. • Basic public safety costs, fire & rescue and office of the sheriff, continue to increase and account for $653.7 million of
expenditure budget which is 60.6% of the General Fund’s total budgeted expenditures.
CAPITAL ASSETS AND DEBT ADMINISTRATION
Capital Assets The City of Jacksonville’s investment in capital assets for its governmental and business-type activities as of September 30, 2017 amounts to $3.1 billion net of accumulated depreciation. The investment in capital assets includes land, buildings and improvements, furniture and equipment, infrastructure, and construction in progress, other assets include public art and purchased/internally developed software (see Table A-3). The primary focus was on the sports complex improvements, road projects, and environmental projects in fiscal year 2016. The primary focus in fiscal year 2017 was on the Sports Complex Amphitheatre Practice Facilities, road and other improvements. Additional information on the City of Jacksonville’s capital assets can be found in the Notes to the Financial Statements, Footnote 6 of this report.
Major capital asset project costs in fiscal year 2017 included the following (in millions): 2017 2016 Change Sports Complex Buildings & Improvements 43.6 13.7 29.9 Road & Bridge Projects 23.5 9.2 14.3 Fire Departments Projects .5 7.8 ( 7.3) Environmental Projects 4.4 10.4 ( 6.0) Other Improvements 15.2 7.3 7.9 Debt Administration
2017 2016 2017 2016 2017 2016
Land and easements 314,328$ 314,094$ 46,907$ 46,907$ 361,235$ 361,001$ Buildings and improvements 1,189,705 1,177,241 647,216 635,604 1,836,921 1,812,845 Furniture & Equipment 470,260 460,310 16,660 16,051 486,920 476,361 Construction and work in progress 23,574 5,988 78,022 30,693 101,596 36,681 Infrastructure 2,307,552 2,263,838 71,089 71,087 2,378,641 2,334,925 Other Assets 44,500 44,190 - - 44,500 44,190 Less accumulated depreciation (1,785,486) (1,664,077) (301,594) (277,146) (2,087,080) (1,941,223) Total $ 2,564,433 $ 2,601,584 $ 558,300 $ 523,196 $ 3,122,733 $ 3,124,780
Activities Activities Total
Table A-3Capital Assets
Net of Accumulated Depreciation(In Thousands)
as of September 30, 2017 and September 30, 2016
Governmental Business Type
-18-
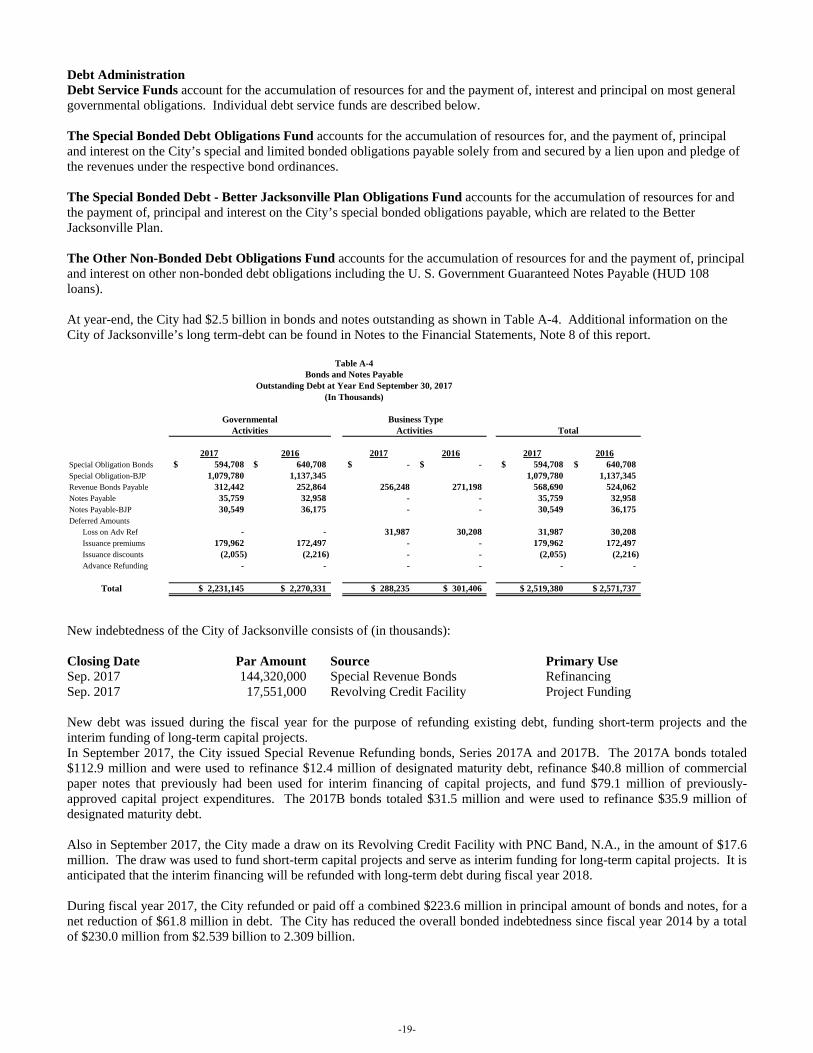
Debt Administration Debt Service Funds account for the accumulation of resources for and the payment of, interest and principal on most general governmental obligations. Individual debt service funds are described below. The Special Bonded Debt Obligations Fund accounts for the accumulation of resources for, and the payment of, principal and interest on the City’s special and limited bonded obligations payable solely from and secured by a lien upon and pledge of the revenues under the respective bond ordinances. The Special Bonded Debt - Better Jacksonville Plan Obligations Fund accounts for the accumulation of resources for and the payment of, principal and interest on the City’s special bonded obligations payable, which are related to the Better Jacksonville Plan. The Other Non-Bonded Debt Obligations Fund accounts for the accumulation of resources for and the payment of, principal and interest on other non-bonded debt obligations including the U. S. Government Guaranteed Notes Payable (HUD 108 loans). At year-end, the City had $2.5 billion in bonds and notes outstanding as shown in Table A-4. Additional information on the City of Jacksonville’s long term-debt can be found in Notes to the Financial Statements, Note 8 of this report.
2017 2016 2017 2016 2017 2016
Special Obligation Bonds 594,708$ 640,708$ -$ -$ 594,708$ 640,708$ Special Obligation-BJP 1,079,780 1,137,345 1,079,780 1,137,345 Revenue Bonds Payable 312,442 252,864 256,248 271,198 568,690 524,062 Notes Payable 35,759 32,958 - - 35,759 32,958 Notes Payable-BJP 30,549 36,175 - - 30,549 36,175 Deferred Amounts
Loss on Adv Ref - - 31,987 30,208 31,987 30,208 Issuance premiums 179,962 172,497 - - 179,962 172,497 Issuance discounts (2,055) (2,216) - - (2,055) (2,216) Advance Refunding - - - - - -
Total $ 2,231,145 $ 2,270,331 $ 288,235 $ 301,406 $ 2,519,380 $ 2,571,737
GovernmentalActivities
Table A-4
Outstanding Debt at Year End September 30, 2017(In Thousands)
Bonds and Notes Payable
Business TypeActivities Total
New indebtedness of the City of Jacksonville consists of (in thousands): Closing Date Par Amount Source Primary Use Sep. 2017 144,320,000 Special Revenue Bonds Refinancing Sep. 2017 17,551,000 Revolving Credit Facility Project Funding New debt was issued during the fiscal year for the purpose of refunding existing debt, funding short-term projects and the interim funding of long-term capital projects. In September 2017, the City issued Special Revenue Refunding bonds, Series 2017A and 2017B. The 2017A bonds totaled $112.9 million and were used to refinance $12.4 million of designated maturity debt, refinance $40.8 million of commercial paper notes that previously had been used for interim financing of capital projects, and fund $79.1 million of previously-approved capital project expenditures. The 2017B bonds totaled $31.5 million and were used to refinance $35.9 million of designated maturity debt. Also in September 2017, the City made a draw on its Revolving Credit Facility with PNC Band, N.A., in the amount of $17.6 million. The draw was used to fund short-term capital projects and serve as interim funding for long-term capital projects. It is anticipated that the interim financing will be refunded with long-term debt during fiscal year 2018. During fiscal year 2017, the City refunded or paid off a combined $223.6 million in principal amount of bonds and notes, for a net reduction of $61.8 million in debt. The City has reduced the overall bonded indebtedness since fiscal year 2014 by a total of $230.0 million from $2.539 billion to 2.309 billion.
-19-
ECONOMIC FACTORS AND NEXT YEAR’S BUDGETS AND RATES
The State of Florida, by constitution, does not have a state personal income tax and therefore the State operates primarily using sales, gasoline and corporate income taxes. Local governments (cities, counties and school boards) primarily rely on property and a limited array of permitted other taxes (sales, gasoline, utilities services, etc.) and fees (franchise, occupational license, etc.) for their governmental activities. There are a limited number of state-shared revenues and recurring and non-recurring (one-time) grants from both the state and federal governments. Other Economic Factors:
• The unemployment rate for the City of Jacksonville is 3.5%, at the end of fiscal year 2017. • The population of the City of Jacksonville at the end of fiscal year 2017 was 936.8 thousand. • Jacksonville has the largest Empowerment Zone in the nation. • Jacksonville has a major port, is home to the National Football League’s (NFL) Jacksonville Jaguars, is the insurance
and financial center of Florida and is the site of key U.S. Navy bases. Budget Highlights for fiscal 2017-20178
• The fiscal year 2017-2018 budget focuses heavily on public safety with the addition of one hundred forty two public safety positions and the associated operating and equipment costs for:
o One hundred new police officers in the Office of the Sheriff. With this budget Mayor Curry has added a total of one hundred eighty police officers and eighty community service officers since taking office.
o Seven positions for a full-time rescue unit at fire station #73. o Eighteen positions for new fire station #63. o Seventeen firefighter positions.
• The fiscal year 2017-2018 capital improvement plan totaled $155.7 million while only authorizing $104.8 million in additional borrowing.
• The City and all of its employee unions reached a three year labor agreement during fiscal year 2016-2017. The agreement significantly impacted the current year budget and will impact the City’s future budget for many years.
CONTACTING THE CITY’S FINANCIAL MANAGEMENT This financial report is designed to provide our citizens, taxpayers, customers, investors and creditors with a general overview of the City’s finances and to demonstrate the City’s accountability for the money it receives. If you have questions about this report or need additional financial information, contact the Department of Finance, Accounting Division, 117 West Duval Street, Suite 375, Jacksonville, Florida 32202, or call (904) 630-1250.
-20-

CITYWIDE FINANCIAL
STATEMENTS
-21-
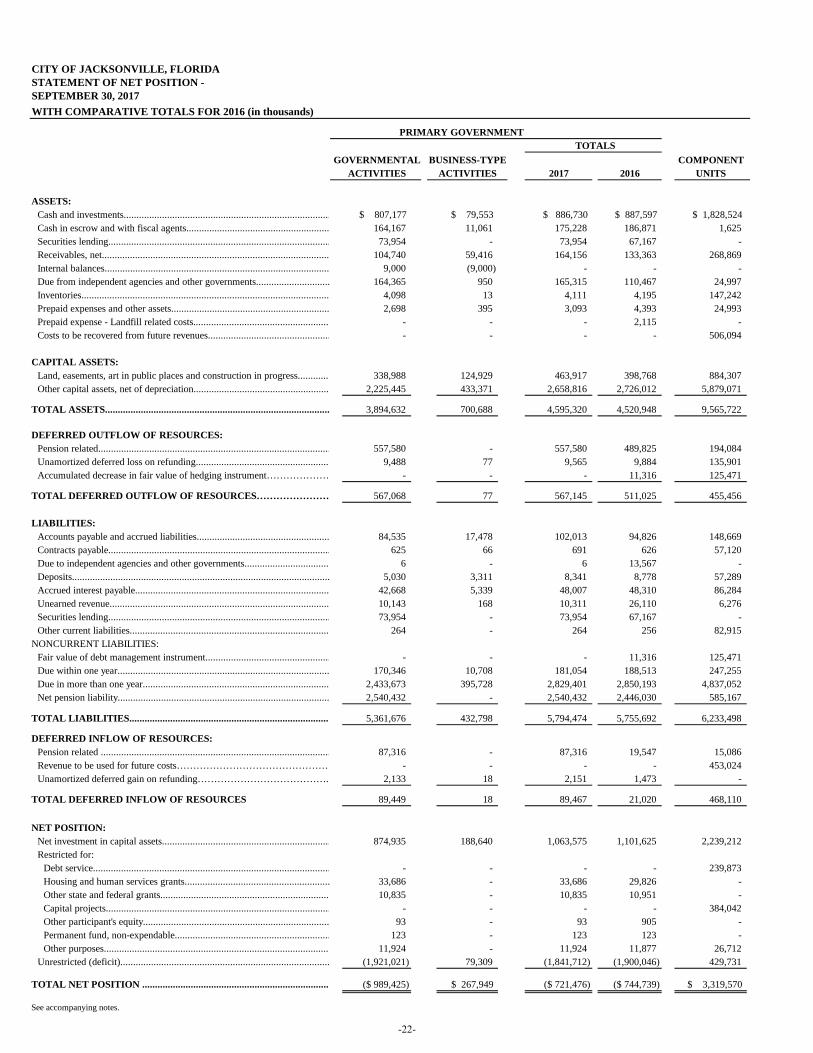
CITY OF JACKSONVILLE, FLORIDASTATEMENT OF NET POSITION -SEPTEMBER 30, 2017WITH COMPARATIVE TOTALS FOR 2016 (in thousands)
TOTALSGOVERNMENTAL BUSINESS-TYPE COMPONENT
ACTIVITIES ACTIVITIES 2017 2016 UNITS
ASSETS:Cash and investments................................................................................. $ 807,177 $ 79,553 $ 886,730 $ 887,597 $ 1,828,524 Cash in escrow and with fiscal agents........................................................ 164,167 11,061 175,228 186,871 1,625 Securities lending....................................................................................... 73,954 - 73,954 67,167 - Receivables, net......................................................................................... 104,740 59,416 164,156 133,363 268,869 Internal balances........................................................................................ 9,000 (9,000) - - - Due from independent agencies and other governments............................. 164,365 950 165,315 110,467 24,997 Inventories................................................................................................. 4,098 13 4,111 4,195 147,242 Prepaid expenses and other assets.............................................................. 2,698 395 3,093 4,393 24,993 Prepaid expense - Landfill related costs...................................................... - - - 2,115 - Costs to be recovered from future revenues................................................ - - - - 506,094
CAPITAL ASSETS:Land, easements, art in public places and construction in progress............. 338,988 124,929 463,917 398,768 884,307 Other capital assets, net of depreciation...................................................... 2,225,445 433,371 2,658,816 2,726,012 5,879,071
TOTAL ASSETS........................................................................................ 3,894,632 700,688 4,595,320 4,520,948 9,565,722
DEFERRED OUTFLOW OF RESOURCES:Pension related........................................................................................... 557,580 - 557,580 489,825 194,084 Unamortized deferred loss on refunding..................................................... 9,488 77 9,565 9,884 135,901 Accumulated decrease in fair value of hedging instrument………………… - - - 11,316 125,471
TOTAL DEFERRED OUTFLOW OF RESOURCES…………………… 567,068 77 567,145 511,025 455,456
LIABILITIES:Accounts payable and accrued liabilities.................................................... 84,535 17,478 102,013 94,826 148,669 Contracts payable....................................................................................... 625 66 691 626 57,120 Due to independent agencies and other governments.................................. 6 - 6 13,567 - Deposits..................................................................................................... 5,030 3,311 8,341 8,778 57,289 Accrued interest payable............................................................................ 42,668 5,339 48,007 48,310 86,284 Unearned revenue...................................................................................... 10,143 168 10,311 26,110 6,276 Securities lending....................................................................................... 73,954 - 73,954 67,167 - Other current liabilities............................................................................... 264 - 264 256 82,915
NONCURRENT LIABILITIES:Fair value of debt management instrument................................................. - - - 11,316 125,471 Due within one year................................................................................... 170,346 10,708 181,054 188,513 247,255 Due in more than one year......................................................................... 2,433,673 395,728 2,829,401 2,850,193 4,837,052 Net pension liability................................................................................... 2,540,432 - 2,540,432 2,446,030 585,167
TOTAL LIABILITIES............................................................................... 5,361,676 432,798 5,794,474 5,755,692 6,233,498
DEFERRED INFLOW OF RESOURCES:Pension related .......................................................................................... 87,316 - 87,316 19,547 15,086 Revenue to be used for future costs………………………………………… - - - - 453,024 Unamortized deferred gain on refunding…………………………………. 2,133 18 2,151 1,473 -
TOTAL DEFERRED INFLOW OF RESOURCES 89,449 18 89,467 21,020 468,110
NET POSITION:Net investment in capital assets.................................................................. 874,935 188,640 1,063,575 1,101,625 2,239,212 Restricted for:
Debt service............................................................................................. - - - - 239,873 Housing and human services grants......................................................... 33,686 - 33,686 29,826 - Other state and federal grants................................................................... 10,835 - 10,835 10,951 - Capital projects........................................................................................ - - - - 384,042 Other participant's equity......................................................................... 93 - 93 905 - Permanent fund, non-expendable............................................................. 123 - 123 123 - Other purposes......................................................................................... 11,924 - 11,924 11,877 26,712
Unrestricted (deficit).................................................................................. (1,921,021) 79,309 (1,841,712) (1,900,046) 429,731
TOTAL NET POSITION .......................................................................... ($ 989,425) $ 267,949 ($ 721,476) ($ 744,739) $ 3,319,570
See accompanying notes.
PRIMARY GOVERNMENT
-22-
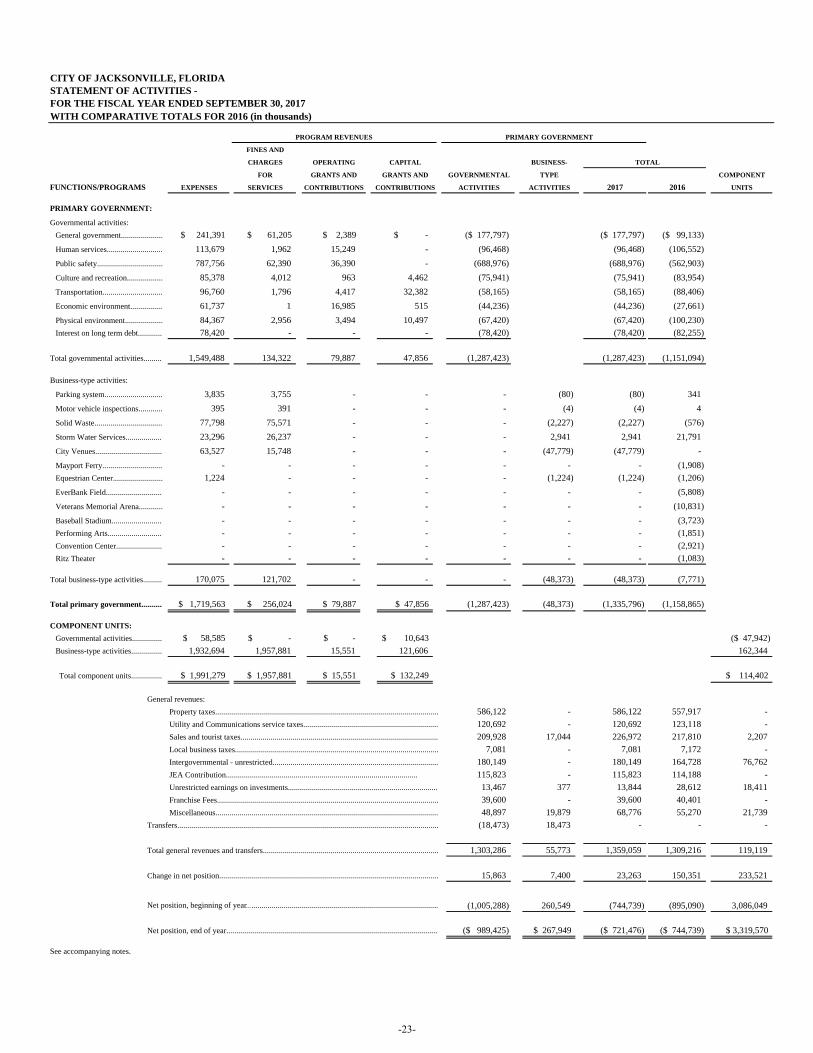
CITY OF JACKSONVILLE, FLORIDASTATEMENT OF ACTIVITIES -FOR THE FISCAL YEAR ENDED SEPTEMBER 30, 2017WITH COMPARATIVE TOTALS FOR 2016 (in thousands)
PROGRAM REVENUES PRIMARY GOVERNMENT
FINES AND
CHARGES OPERATING CAPITAL BUSINESS- TOTAL
FOR GRANTS AND GRANTS AND GOVERNMENTAL TYPE COMPONENT
FUNCTIONS/PROGRAMS EXPENSES SERVICES CONTRIBUTIONS CONTRIBUTIONS ACTIVITIES ACTIVITIES 2017 2016 UNITS
PRIMARY GOVERNMENT: Governmental activities:
General government..................... $ 241,391 $ 61,205 $ 2,389 $ - ($ 177,797) ($ 177,797) ($ 99,133)Human services............................ 113,679 1,962 15,249 - (96,468) (96,468) (106,552) Public safety................................. 787,756 62,390 36,390 - (688,976) (688,976) (562,903) Culture and recreation.................. 85,378 4,012 963 4,462 (75,941) (75,941) (83,954) Transportation.............................. 96,760 1,796 4,417 32,382 (58,165) (58,165) (88,406) Economic environment................ 61,737 1 16,985 515 (44,236) (44,236) (27,661) Physical environment................... 84,367 2,956 3,494 10,497 (67,420) (67,420) (100,230) Interest on long term debt............ 78,420 - - - (78,420) (78,420) (82,255)
Total governmental activities.......... 1,549,488 134,322 79,887 47,856 (1,287,423) (1,287,423) (1,151,094)
Business-type activities:
Parking system............................. 3,835 3,755 - - - (80) (80) 341 Motor vehicle inspections............ 395 391 - - - (4) (4) 4 Solid Waste.................................. 77,798 75,571 - - - (2,227) (2,227) (576) Storm Water Services................... 23,296 26,237 - - - 2,941 2,941 21,791 City Venues.................................. 63,527 15,748 - - - (47,779) (47,779) - Mayport Ferry.............................. - - - - - - - (1,908) Equestrian Center......................... 1,224 - - - - (1,224) (1,224) (1,206) EverBank Field............................. - - - - - - - (5,808) Veterans Memorial Arena............ - - - - - - - (10,831) Baseball Stadium.......................... - - - - - - - (3,723) Performing Arts............................ - - - - - - - (1,851) Convention Center....................... - - - - - - - (2,921) Ritz Theater - - - - - - - (1,083)
Total business-type activities.......... 170,075 121,702 - - - (48,373) (48,373) (7,771)
Total primary government........... $ 1,719,563 $ 256,024 $ 79,887 $ 47,856 (1,287,423) (48,373) (1,335,796) (1,158,865) COMPONENT UNITS:
Governmental activities............... $ 58,585 $ - $ - $ 10,643 ($ 47,942)Business-type activities................ 1,932,694 1,957,881 15,551 121,606 162,344
Total component units................ $ 1,991,279 $ 1,957,881 $ 15,551 $ 132,249 $ 114,402
General revenues:
Property taxes................................................................................................................ 586,122 - 586,122 557,917 - Utility and Communications service taxes.................................................................... 120,692 - 120,692 123,118 - Sales and tourist taxes................................................................................................... 209,928 17,044 226,972 217,810 2,207 Local business taxes...................................................................................................... 7,081 - 7,081 7,172 - Intergovernmental - unrestricted................................................................................... 180,149 - 180,149 164,728 76,762 JEA Contribution................................................................................................ 115,823 - 115,823 114,188 -
Unrestricted earnings on investments........................................................................... 13,467 377 13,844 28,612 18,411 Franchise Fees............................................................................................................... 39,600 - 39,600 40,401 -
Miscellaneous................................................................................................................ 48,897 19,879 68,776 55,270 21,739 Transfers................................................................................................................................... (18,473) 18,473 - - -
Total general revenues and transfers........................................................................................ 1,303,286 55,773 1,359,059 1,309,216 119,119
Change in net position.............................................................................................................. 15,863 7,400 23,263 150,351 233,521
Net position, beginning of year................................................................................................. (1,005,288) 260,549 (744,739) (895,090) 3,086,049
Net position, end of year.......................................................................................................... ($ 989,425) $ 267,949 ($ 721,476) ($ 744,739) $ 3,319,570
See accompanying notes.
-23-

(This page is intentionally left blank.)
-24-

FUND FINANCIAL STATEMENTS
-25-

(This page is intentionally left blank.)
-26-
MAJOR GOVERNMENTAL FUNDS: GENERAL FUND
The General Fund is the principal fund of the City and is used to account for all activities not included in other funds. The General Fund accounts for the normal recurring activities of the City (i.e, police, fire, public works, courts, general government, etc.). These activities are funded principally by property taxes, intergovernmental revenues, and licenses and fees.
DEBT SERVICE FUNDS
The Special Bonded Debt Obligations Fund accounts for the accumulation of resources for, and the payment of, principal and interest on the City’s special and limited bonded obligations, which are payable solely from and secured by a lien upon and pledge of the revenues under the respective bond ordinances. The Special Bonded Debt - Better Jacksonville Plan Obligations Fund accounts for the accumulation of resources for, and the payment of, principal and interest on the City's special bonded obligations payable, which are related to the Better Jacksonville Plan.
-27-
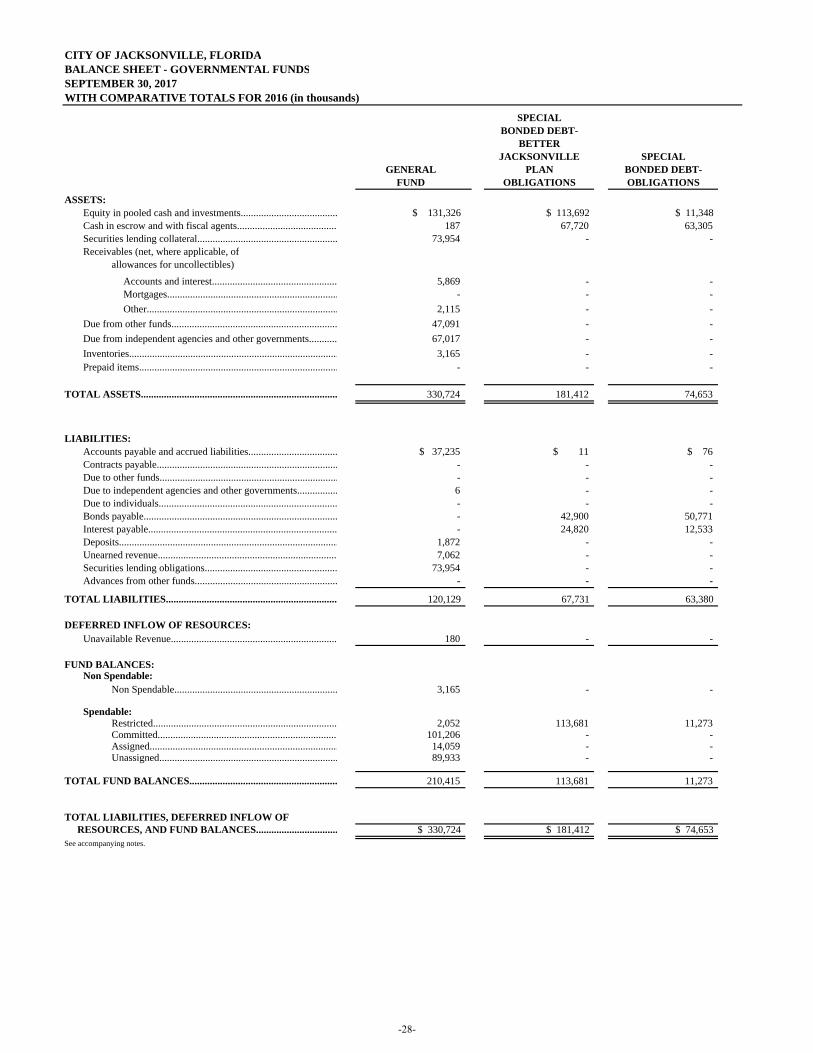
CITY OF JACKSONVILLE, FLORIDABALANCE SHEET - GOVERNMENTAL FUNDSSEPTEMBER 30, 2017WITH COMPARATIVE TOTALS FOR 2016 (in thousands)
SPECIALBONDED DEBT-
BETTERJACKSONVILLE SPECIAL
GENERAL PLAN BONDED DEBT-FUND OBLIGATIONS OBLIGATIONS
ASSETS:Equity in pooled cash and investments...................................... $ 131,326 $ 113,692 $ 11,348 Cash in escrow and with fiscal agents....................................... 187 67,720 63,305 Securities lending collateral....................................................... 73,954 - - Receivables (net, where applicable, of
allowances for uncollectibles):
Accounts and interest................................................. 5,869 - - Mortgages................................................................... - - - Other........................................................................... 2,115 - -
Due from other funds................................................................. 47,091 - - Due from independent agencies and other governments........... 67,017 - - Inventories.................................................................................. 3,165 - - Prepaid items.............................................................................. - - -
TOTAL ASSETS............................................................................. 330,724 181,412 74,653
LIABILITIES:Accounts payable and accrued liabilities................................... $ 37,235 $ 11 $ 76Contracts payable....................................................................... - - - Due to other funds...................................................................... - - - Due to independent agencies and other governments................ 6 - - Due to individuals...................................................................... - - - Bonds payable............................................................................ - 42,900 50,771 Interest payable.......................................................................... - 24,820 12,533 Deposits...................................................................................... 1,872 - - Unearned revenue...................................................................... 7,062 - - Securities lending obligations.................................................... 73,954 - - Advances from other funds........................................................ - - -
TOTAL LIABILITIES................................................................... 120,129 67,731 63,380
DEFERRED INFLOW OF RESOURCES: Unavailable Revenue................................................................. 180 - -
FUND BALANCES: Non Spendable:
Non Spendable................................................................ 3,165 - -
Spendable:Restricted........................................................................ 2,052 113,681 11,273 Committed...................................................................... 101,206 - - Assigned.......................................................................... 14,059 - - Unassigned...................................................................... 89,933 - -
TOTAL FUND BALANCES.......................................................... 210,415 113,681 11,273
TOTAL LIABILITIES, DEFERRED INFLOW OF RESOURCES, AND FUND BALANCES................................ $ 330,724 $ 181,412 $ 74,653 See accompanying notes.
-28-
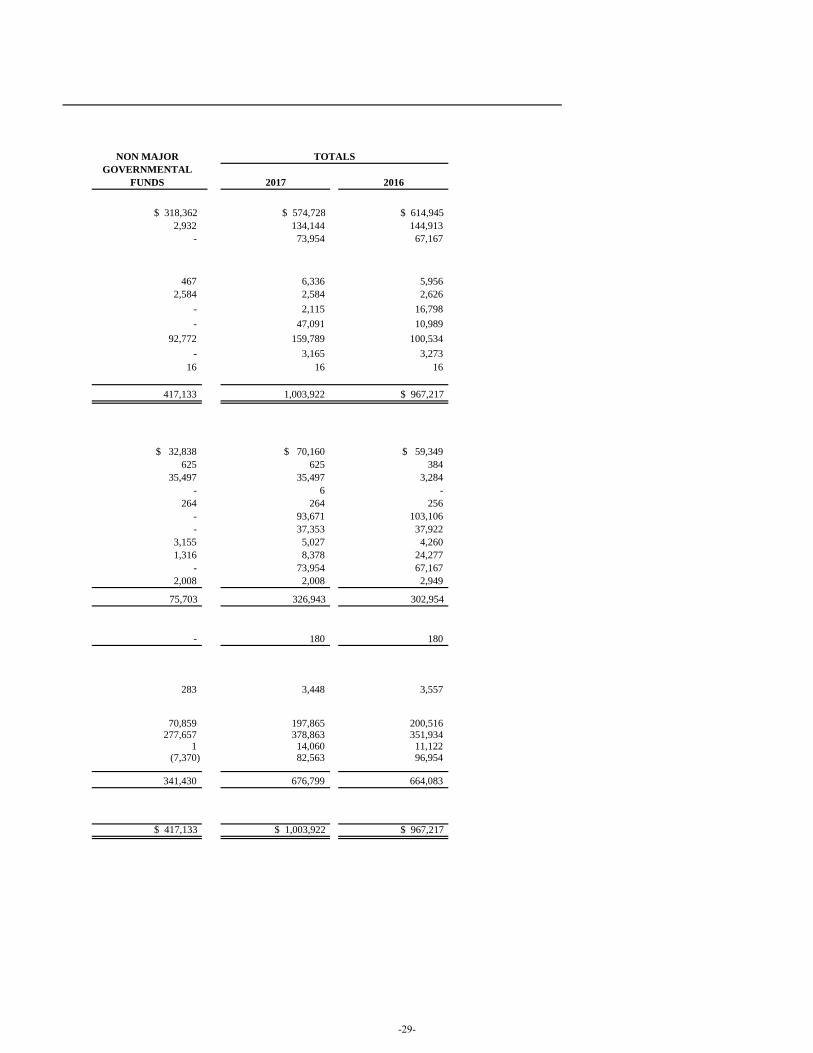
NON MAJOR TOTALSGOVERNMENTAL
FUNDS 2017 2016
$ 318,362 $ 574,728 $ 614,945 2,932 134,144 144,913
- 73,954 67,167
467 6,336 5,956 2,584 2,584 2,626
- 2,115 16,798 - 47,091 10,989
92,772 159,789 100,534 - 3,165 3,273
16 16 16
417,133 1,003,922 $ 967,217
$ 32,838 $ 70,160 $ 59,349625 625 384
35,497 35,497 3,284 - 6 -
264 264 256 - 93,671 103,106 - 37,353 37,922
3,155 5,027 4,260 1,316 8,378 24,277
- 73,954 67,167 2,008 2,008 2,949
75,703 326,943 302,954
- 180 180
283 3,448 3,557
70,859 197,865 200,516 277,657 378,863 351,934
1 14,060 11,122 (7,370) 82,563 96,954
341,430 676,799 664,083
$ 417,133 $ 1,003,922 $ 967,217
-29-

(This page is intentionally left blank.)
-30-
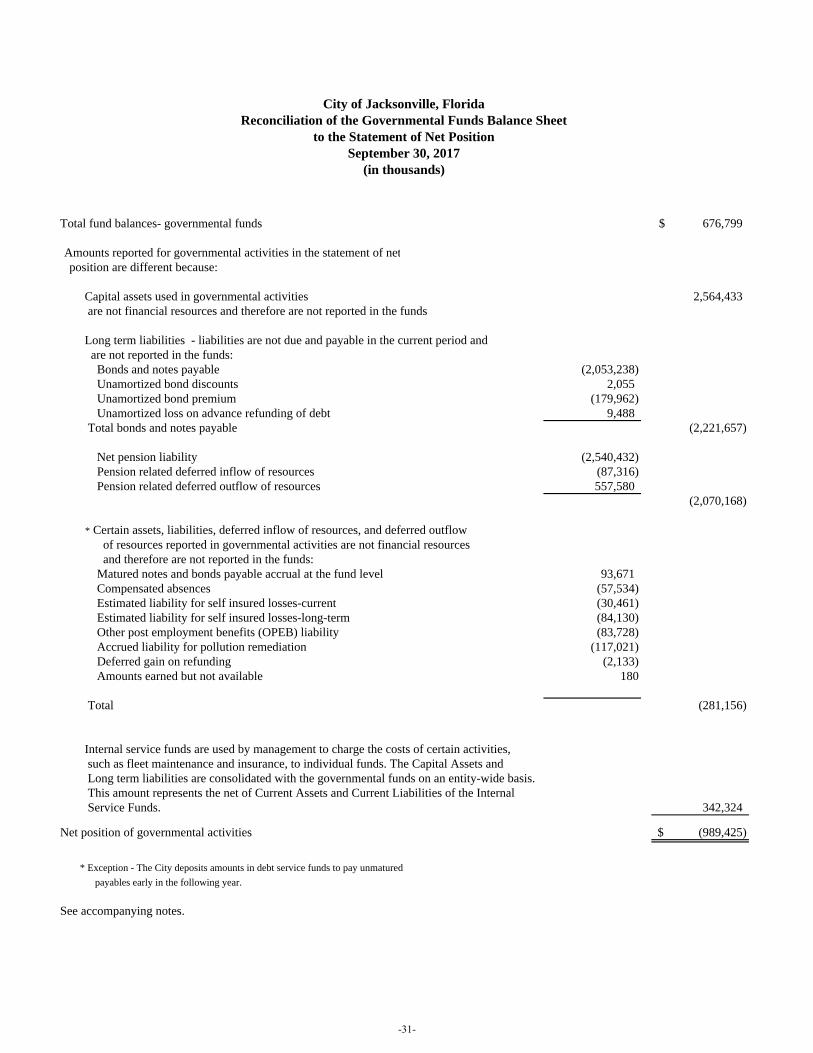
Total fund balances- governmental funds 676,799$
Amounts reported for governmental activities in the statement of net position are different because: Capital assets used in governmental activities 2,564,433 are not financial resources and therefore are not reported in the funds
Long term liabilities - liabilities are not due and payable in the current period and are not reported in the funds: Bonds and notes payable (2,053,238) Unamortized bond discounts 2,055 Unamortized bond premium (179,962) Unamortized loss on advance refunding of debt 9,488 Total bonds and notes payable (2,221,657)
Net pension liability (2,540,432) Pension related deferred inflow of resources (87,316) Pension related deferred outflow of resources 557,580
(2,070,168)
* Certain assets, liabilities, deferred inflow of resources, and deferred outflow of resources reported in governmental activities are not financial resources and therefore are not reported in the funds: Matured notes and bonds payable accrual at the fund level 93,671 Compensated absences (57,534) Estimated liability for self insured losses-current (30,461) Estimated liability for self insured losses-long-term (84,130) Other post employment benefits (OPEB) liability (83,728) Accrued liability for pollution remediation (117,021) Deferred gain on refunding (2,133) Amounts earned but not available 180
Total (281,156)
Internal service funds are used by management to charge the costs of certain activities, such as fleet maintenance and insurance, to individual funds. The Capital Assets and Long term liabilities are consolidated with the governmental funds on an entity-wide basis. This amount represents the net of Current Assets and Current Liabilities of the Internal Service Funds. 342,324
(989,425)$
* Exception - The City deposits amounts in debt service funds to pay unmatured payables early in the following year.
See accompanying notes.
Net position of governmental activities
City of Jacksonville, FloridaReconciliation of the Governmental Funds Balance Sheet
to the Statement of Net PositionSeptember 30, 2017
(in thousands)
-31-
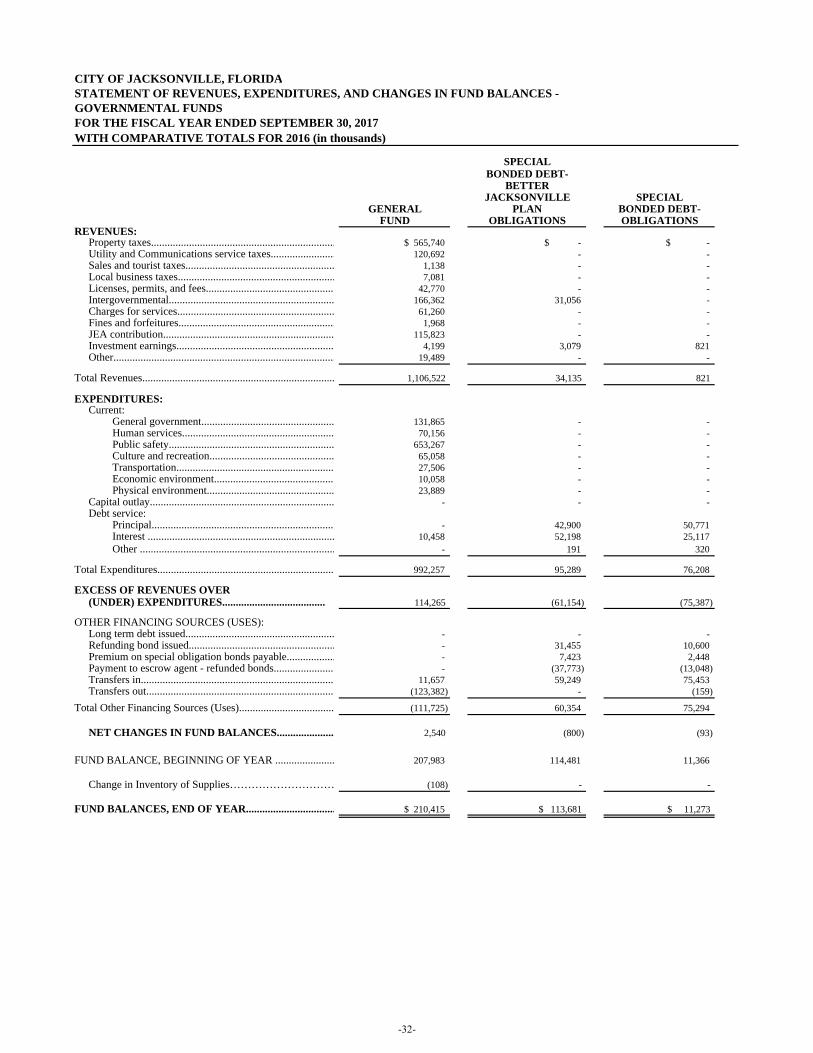
CITY OF JACKSONVILLE, FLORIDASTATEMENT OF REVENUES, EXPENDITURES, AND CHANGES IN FUND BALANCES - GOVERNMENTAL FUNDSFOR THE FISCAL YEAR ENDED SEPTEMBER 30, 2017WITH COMPARATIVE TOTALS FOR 2016 (in thousands)
SPECIALBONDED DEBT-
BETTERJACKSONVILLE SPECIAL
GENERAL PLAN BONDED DEBT-FUND OBLIGATIONS OBLIGATIONS
REVENUES:Property taxes.................................................................... $ 565,740 $ - $ -Utility and Communications service taxes........................ 120,692 - - Sales and tourist taxes....................................................... 1,138 - - Local business taxes.......................................................... 7,081 - - Licenses, permits, and fees............................................... 42,770 - - Intergovernmental............................................................. 166,362 31,056 - Charges for services.......................................................... 61,260 - - Fines and forfeitures.......................................................... 1,968 - - JEA contribution............................................................... 115,823 - - Investment earnings.......................................................... 4,199 3,079 821 Other.................................................................................. 19,489 - -
Total Revenues....................................................................... 1,106,522 34,135 821
EXPENDITURES:Current:
General government................................................. 131,865 - - Human services........................................................ 70,156 - - Public safety............................................................. 653,267 - - Culture and recreation.............................................. 65,058 - - Transportation.......................................................... 27,506 - - Economic environment............................................ 10,058 - - Physical environment............................................... 23,889 - -
Capital outlay.................................................................... - - - Debt service:
Principal................................................................... - 42,900 50,771 Interest ..................................................................... 10,458 52,198 25,117 Other ........................................................................ - 191 320
Total Expenditures................................................................. 992,257 95,289 76,208
EXCESS OF REVENUES OVER(UNDER) EXPENDITURES...................................... 114,265 (61,154) (75,387)
OTHER FINANCING SOURCES (USES):Long term debt issued....................................................... - - - Refunding bond issued...................................................... - 31,455 10,600 Premium on special obligation bonds payable.................. - 7,423 2,448 Payment to escrow agent - refunded bonds...................... - (37,773) (13,048) Transfers in....................................................................... 11,657 59,249 75,453 Transfers out..................................................................... (123,382) - (159)
Total Other Financing Sources (Uses)................................... (111,725) 60,354 75,294
NET CHANGES IN FUND BALANCES..................... 2,540 (800) (93)
FUND BALANCE, BEGINNING OF YEAR ...................... 207,983 114,481 11,366
Change in Inventory of Supplies………………………… (108) - -
FUND BALANCES, END OF YEAR................................. $ 210,415 $ 113,681 $ 11,273
-32-
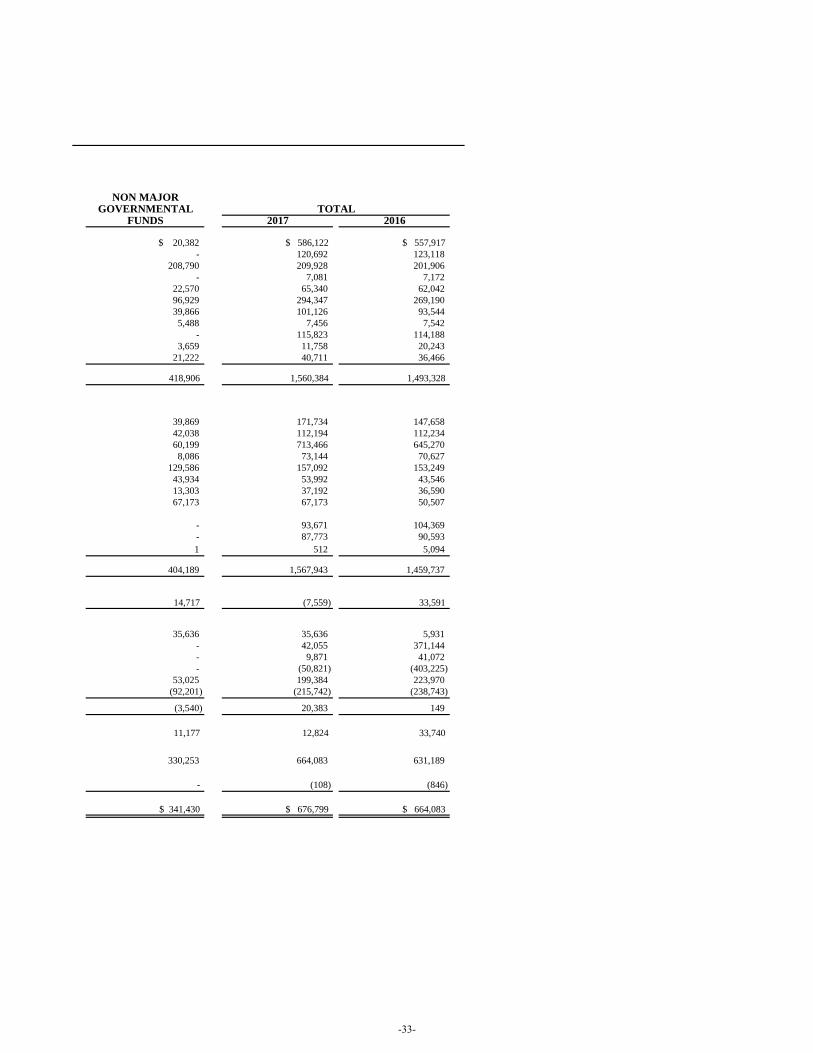
NON MAJOR
GOVERNMENTAL TOTALFUNDS 2017 2016
$ 20,382 $ 586,122 $ 557,917 - 120,692 123,118
208,790 209,928 201,906 - 7,081 7,172
22,570 65,340 62,042 96,929 294,347 269,190 39,866 101,126 93,544 5,488 7,456 7,542
- 115,823 114,188 3,659 11,758 20,243
21,222 40,711 36,466
418,906 1,560,384 1,493,328
39,869 171,734 147,658 42,038 112,194 112,234 60,199 713,466 645,270 8,086 73,144 70,627
129,586 157,092 153,249 43,934 53,992 43,546 13,303 37,192 36,590 67,173 67,173 50,507
- 93,671 104,369 - 87,773 90,593 1 512 5,094
404,189 1,567,943 1,459,737
14,717 (7,559) 33,591
35,636 35,636 5,931 - 42,055 371,144 - 9,871 41,072 - (50,821) (403,225)
53,025 199,384 223,970 (92,201) (215,742) (238,743)
(3,540) 20,383 149
11,177 12,824 33,740
330,253 664,083 631,189
- (108) (846)
$ 341,430 $ 676,799 $ 664,083
-33-
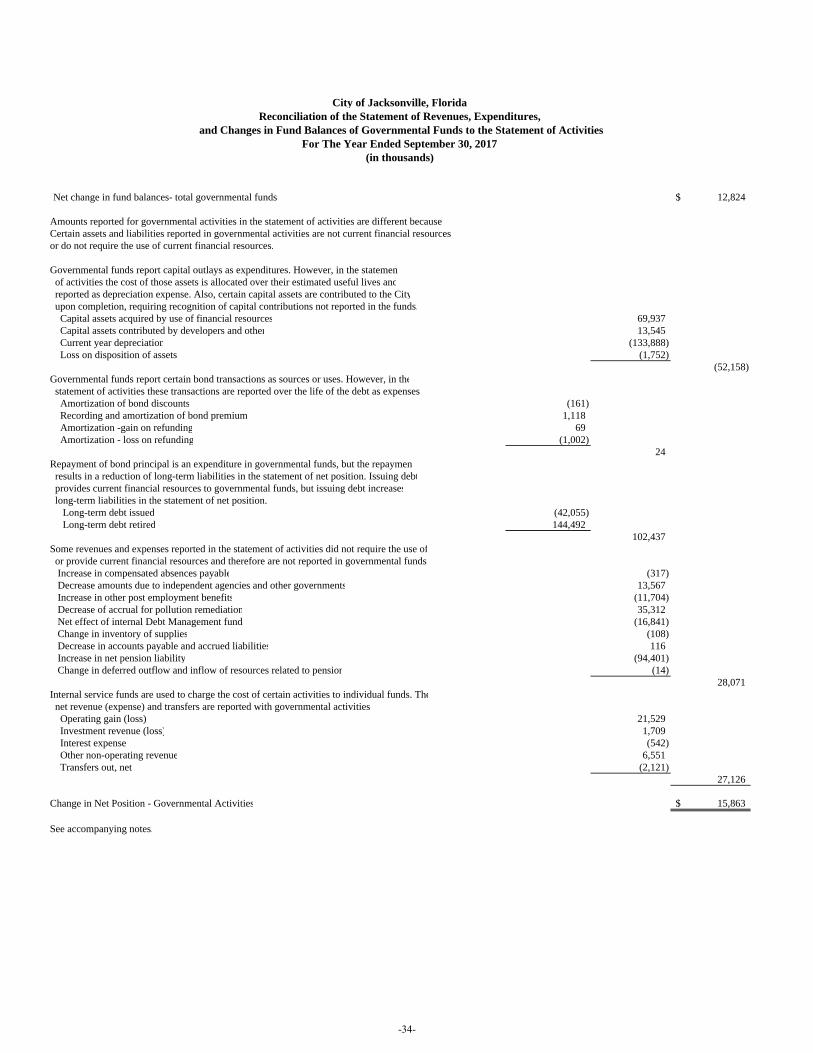
Net change in fund balances- total governmental funds: 12,824$
Amounts reported for governmental activities in the statement of activities are different becauseCertain assets and liabilities reported in governmental activities are not current financial resources or do not require the use of current financial resources.
Governmental funds report capital outlays as expenditures. However, in the statement of activities the cost of those assets is allocated over their estimated useful lives and reported as depreciation expense. Also, certain capital assets are contributed to the City upon completion, requiring recognition of capital contributions not reported in the funds. Capital assets acquired by use of financial resources 69,937 Capital assets contributed by developers and other 13,545 Current year depreciation (133,888) Loss on disposition of assets (1,752)
(52,158) Governmental funds report certain bond transactions as sources or uses. However, in the statement of activities these transactions are reported over the life of the debt as expenses. Amortization of bond discounts (161) Recording and amortization of bond premium 1,118 Amortization -gain on refunding 69 Amortization - loss on refunding (1,002)
24 Repayment of bond principal is an expenditure in governmental funds, but the repayment results in a reduction of long-term liabilities in the statement of net position. Issuing debt provides current financial resources to governmental funds, but issuing debt increases long-term liabilities in the statement of net position. Long-term debt issued (42,055) Long-term debt retired 144,492
102,437 Some revenues and expenses reported in the statement of activities did not require the use of or provide current financial resources and therefore are not reported in governmental funds Increase in compensated absences payable (317) Decrease amounts due to independent agencies and other governments 13,567 Increase in other post employment benefits (11,704) Decrease of accrual for pollution remediation 35,312 Net effect of internal Debt Management fund (16,841) Change in inventory of supplies (108) Decrease in accounts payable and accrued liabilities 116 Increase in net pension liability (94,401) Change in deferred outflow and inflow of resources related to pension (14)
28,071 Internal service funds are used to charge the cost of certain activities to individual funds. The net revenue (expense) and transfers are reported with governmental activities Operating gain (loss) 21,529 Investment revenue (loss) 1,709 Interest expense (542) Other non-operating revenue 6,551 Transfers out, net (2,121)
27,126
15,863$
See accompanying notes.
Change in Net Position - Governmental Activities
City of Jacksonville, FloridaReconciliation of the Statement of Revenues, Expenditures,
and Changes in Fund Balances of Governmental Funds to the Statement of ActivitiesFor The Year Ended September 30, 2017
(in thousands)
-34-
MAJOR ENTERPRISE FUNDS:
Enterprise Funds account for operations that are financed and operated in a manner similar to private business enterprises and where the costs of providing goods or services to the general public are recovered primarily through user charges; or where the City has decided that determination of net income is appropriate for capital maintenance, public policy, management control, accountability or other purposes. Individual major enterprise funds are described below.
The Solid Waste Disposal Fund accounts for collection, recycling and disposal of commercial and residential garbage services throughout the city, including the operation of three municipally owned landfill sites, two of which are closed.
The City Venues Fund accounts for events held at EverBank Field, Veterans Memorial Arena, the Baseball Field, Times Union Center for the Performing Arts, Prime Osborn Convention Center, and Ritz Theater. The Storm Water Services Fund accounts for the storm water utility financed by service charges, to be used to pay the expenses of constructing and maintaining the storm water management system.
-35-
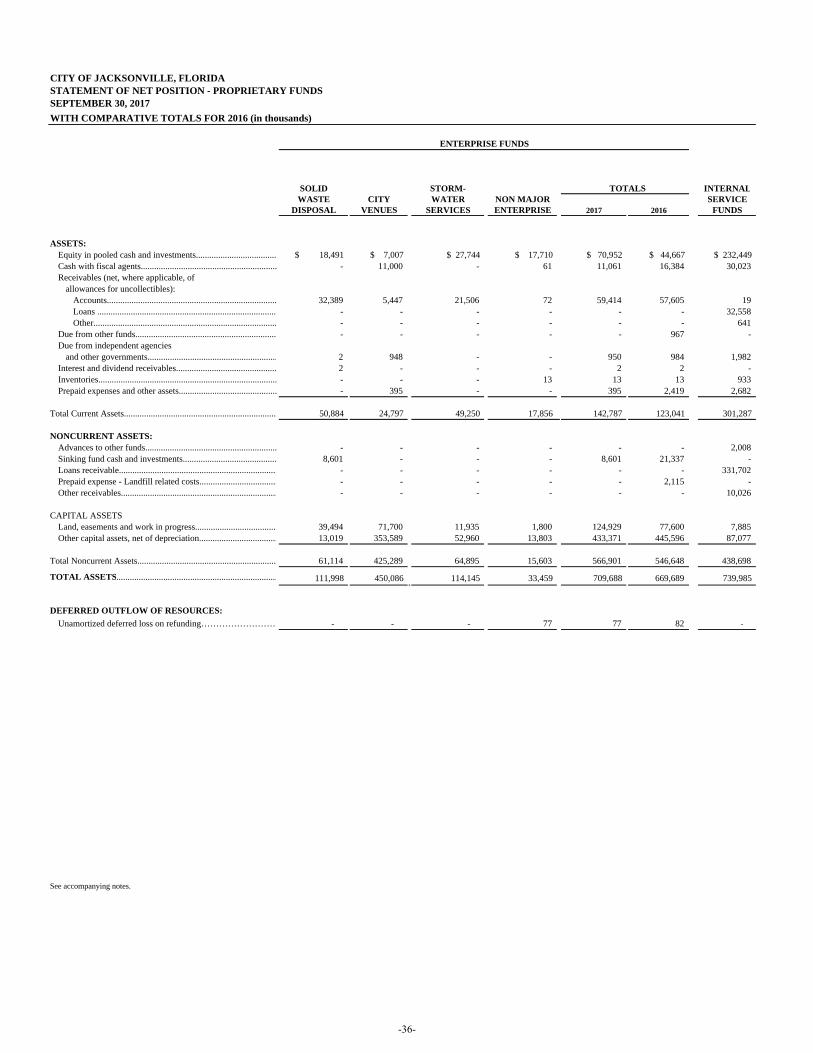
CITY OF JACKSONVILLE, FLORIDASTATEMENT OF NET POSITION - PROPRIETARY FUNDSSEPTEMBER 30, 2017 WITH COMPARATIVE TOTALS FOR 2016 (in thousands)
SOLID STORM- TOTALS INTERNALWASTE CITY WATER NON MAJOR SERVICE
DISPOSAL VENUES SERVICES ENTERPRISE 2017 2016 FUNDS
ASSETS: Equity in pooled cash and investments.................................... $ 18,491 $ 7,007 $ 27,744 $ 17,710 $ 70,952 $ 44,667 $ 232,449 Cash with fiscal agents............................................................. - 11,000 - 61 11,061 16,384 30,023 Receivables (net, where applicable, of
allowances for uncollectibles): Accounts............................................................................ 32,389 5,447 21,506 72 59,414 57,605 19 Loans ................................................................................ - - - - - - 32,558 Other.................................................................................. - - - - - - 641
Due from other funds............................................................... - - - - - 967 - Due from independent agencies
and other governments.......................................................... 2 948 - - 950 984 1,982 Interest and dividend receivables............................................. 2 - - - 2 2 - Inventories................................................................................ - - - 13 13 13 933 Prepaid expenses and other assets............................................ - 395 - - 395 2,419 2,682
Total Current Assets.................................................................... 50,884 24,797 49,250 17,856 142,787 123,041 301,287
NONCURRENT ASSETS: Advances to other funds........................................................... - - - - - - 2,008 Sinking fund cash and investments.......................................... 8,601 - - - 8,601 21,337 - Loans receivable....................................................................... - - - - - - 331,702 Prepaid expense - Landfill related costs................................... - - - - - 2,115 - Other receivables...................................................................... - - - - - - 10,026
CAPITAL ASSETS:Land, easements and work in progress..................................... 39,494 71,700 11,935 1,800 124,929 77,600 7,885 Other capital assets, net of depreciation................................... 13,019 353,589 52,960 13,803 433,371 445,596 87,077
Total Noncurrent Assets.............................................................. 61,114 425,289 64,895 15,603 566,901 546,648 438,698
TOTAL ASSETS........................................................................ 111,998 450,086 114,145 33,459 709,688 669,689 739,985
DEFERRED OUTFLOW OF RESOURCES:Unamortized deferred loss on refunding……………………… - - - 77 77 82 -
See accompanying notes.
ENTERPRISE FUNDS
-36-
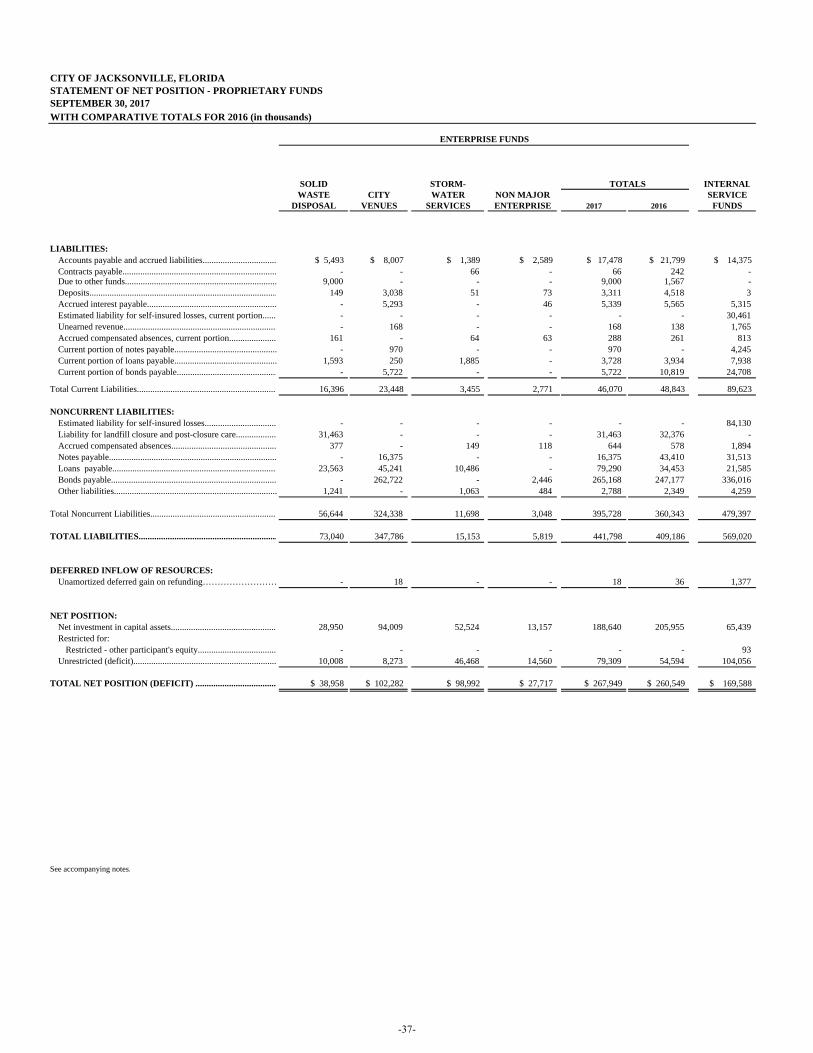
CITY OF JACKSONVILLE, FLORIDA STATEMENT OF NET POSITION - PROPRIETARY FUNDS SEPTEMBER 30, 2017WITH COMPARATIVE TOTALS FOR 2016 (in thousands)
SOLID STORM- TOTALS INTERNALWASTE CITY WATER NON MAJOR SERVICE
DISPOSAL VENUES SERVICES ENTERPRISE 2017 2016 FUNDS
LIABILITIES:Accounts payable and accrued liabilities................................. $ 5,493 $ 8,007 $ 1,389 $ 2,589 $ 17,478 $ 21,799 $ 14,375 Contracts payable..................................................................... - - 66 - 66 242 - Due to other funds.................................................................... 9,000 - - - 9,000 1,567 - Deposits.................................................................................... 149 3,038 51 73 3,311 4,518 3 Accrued interest payable.......................................................... - 5,293 - 46 5,339 5,565 5,315 Estimated liability for self-insured losses, current portion....... - - - - - - 30,461 Unearned revenue..................................................................... - 168 - - 168 138 1,765 Accrued compensated absences, current portion..................... 161 - 64 63 288 261 813 Current portion of notes payable.............................................. - 970 - - 970 - 4,245 Current portion of loans payable.............................................. 1,593 250 1,885 - 3,728 3,934 7,938 Current portion of bonds payable............................................. - 5,722 - - 5,722 10,819 24,708
Total Current Liabilities............................................................... 16,396 23,448 3,455 2,771 46,070 48,843 89,623
NONCURRENT LIABILITIES:
Estimated liability for self-insured losses................................ - - - - - - 84,130 Liability for landfill closure and post-closure care.................. 31,463 - - - 31,463 32,376 - Accrued compensated absences............................................... 377 - 149 118 644 578 1,894 Notes payable........................................................................... - 16,375 - - 16,375 43,410 31,513 Loans payable.......................................................................... 23,563 45,241 10,486 - 79,290 34,453 21,585 Bonds payable.......................................................................... - 262,722 - 2,446 265,168 247,177 336,016 Other liabilities......................................................................... 1,241 - 1,063 484 2,788 2,349 4,259
Total Noncurrent Liabilities......................................................... 56,644 324,338 11,698 3,048 395,728 360,343 479,397
TOTAL LIABILITIES.............................................................. 73,040 347,786 15,153 5,819 441,798 409,186 569,020
DEFERRED INFLOW OF RESOURCES:Unamortized deferred gain on refunding……………………… - 18 - - 18 36 1,377
NET POSITION: Net investment in capital assets............................................... 28,950 94,009 52,524 13,157 188,640 205,955 65,439 Restricted for:
Restricted - other participant's equity................................... - - - - - - 93 Unrestricted (deficit)................................................................ 10,008 8,273 46,468 14,560 79,309 54,594 104,056
TOTAL NET POSITION (DEFICIT) ..................................... $ 38,958 $ 102,282 $ 98,992 $ 27,717 $ 267,949 $ 260,549 $ 169,588
See accompanying notes.
ENTERPRISE FUNDS
-37-

(This page is intentionally left blank.)
-38-
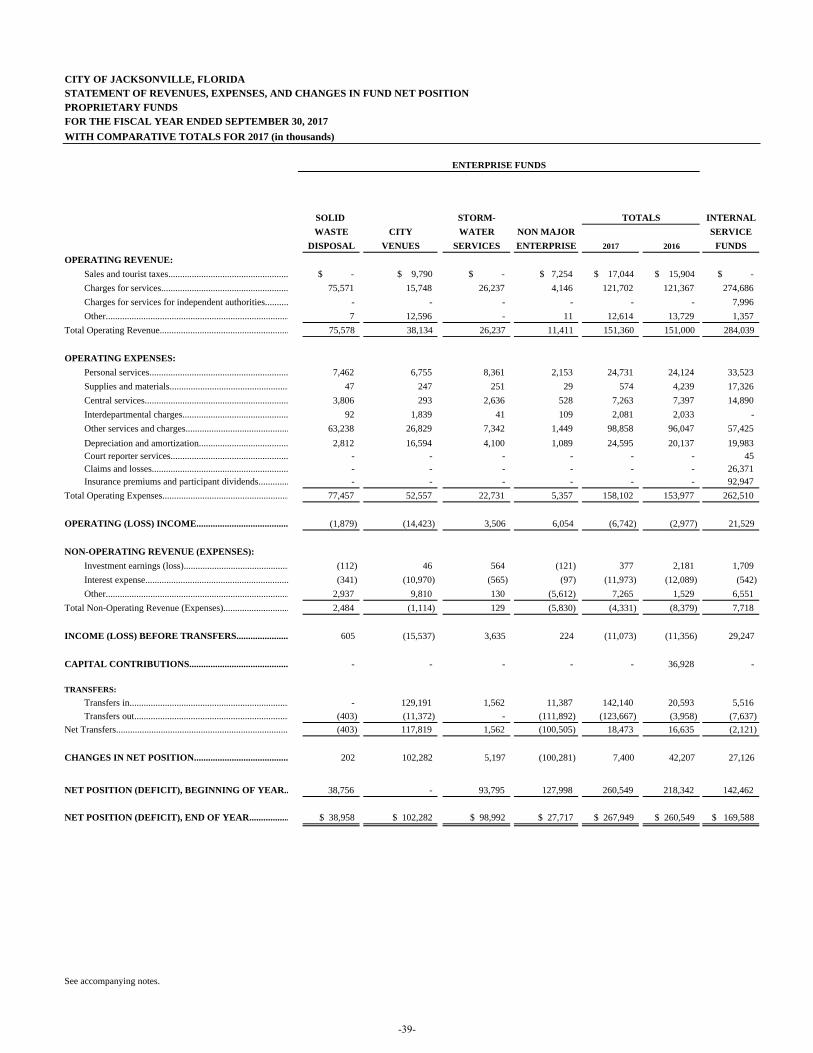
CITY OF JACKSONVILLE, FLORIDASTATEMENT OF REVENUES, EXPENSES, AND CHANGES IN FUND NET POSITIONPROPRIETARY FUNDSFOR THE FISCAL YEAR ENDED SEPTEMBER 30, 2017 WITH COMPARATIVE TOTALS FOR 2017 (in thousands)
SOLID STORM- TOTALS INTERNALWASTE CITY WATER NON MAJOR SERVICE
DISPOSAL VENUES SERVICES ENTERPRISE 2017 2016 FUNDSOPERATING REVENUE:
Sales and tourist taxes................................................... $ - $ 9,790 $ - $ 7,254 $ 17,044 $ 15,904 $ -Charges for services...................................................... 75,571 15,748 26,237 4,146 121,702 121,367 274,686 Charges for services for independent authorities.......... - - - - - - 7,996 Other.............................................................................. 7 12,596 - 11 12,614 13,729 1,357
Total Operating Revenue....................................................... 75,578 38,134 26,237 11,411 151,360 151,000 284,039
OPERATING EXPENSES: Personal services........................................................... 7,462 6,755 8,361 2,153 24,731 24,124 33,523 Supplies and materials................................................... 47 247 251 29 574 4,239 17,326 Central services............................................................. 3,806 293 2,636 528 7,263 7,397 14,890 Interdepartmental charges............................................. 92 1,839 41 109 2,081 2,033 - Other services and charges............................................ 63,238 26,829 7,342 1,449 98,858 96,047 57,425 Depreciation and amortization...................................... 2,812 16,594 4,100 1,089 24,595 20,137 19,983 Court reporter services.................................................. - - - - - - 45 Claims and losses.......................................................... - - - - - - 26,371 Insurance premiums and participant dividends............. - - - - - - 92,947
Total Operating Expenses...................................................... 77,457 52,557 22,731 5,357 158,102 153,977 262,510
OPERATING (LOSS) INCOME....................................... (1,879) (14,423) 3,506 6,054 (6,742) (2,977) 21,529
NON-OPERATING REVENUE (EXPENSES): Investment earnings (loss)............................................. (112) 46 564 (121) 377 2,181 1,709 Interest expense............................................................. (341) (10,970) (565) (97) (11,973) (12,089) (542) Other.............................................................................. 2,937 9,810 130 (5,612) 7,265 1,529 6,551
Total Non-Operating Revenue (Expenses)............................ 2,484 (1,114) 129 (5,830) (4,331) (8,379) 7,718
INCOME (LOSS) BEFORE TRANSFERS...................... 605 (15,537) 3,635 224 (11,073) (11,356) 29,247
CAPITAL CONTRIBUTIONS.......................................... - - - - - 36,928 -
TRANSFERS:Transfers in.................................................................... - 129,191 1,562 11,387 142,140 20,593 5,516 Transfers out.................................................................. (403) (11,372) - (111,892) (123,667) (3,958) (7,637)
Net Transfers......................................................................... (403) 117,819 1,562 (100,505) 18,473 16,635 (2,121)
CHANGES IN NET POSITION........................................ 202 102,282 5,197 (100,281) 7,400 42,207 27,126
NET POSITION (DEFICIT), BEGINNING OF YEAR.. 38,756 - 93,795 127,998 260,549 218,342 142,462
NET POSITION (DEFICIT), END OF YEAR................. $ 38,958 $ 102,282 $ 98,992 $ 27,717 $ 267,949 $ 260,549 $ 169,588
See accompanying notes.
ENTERPRISE FUNDS
-39-
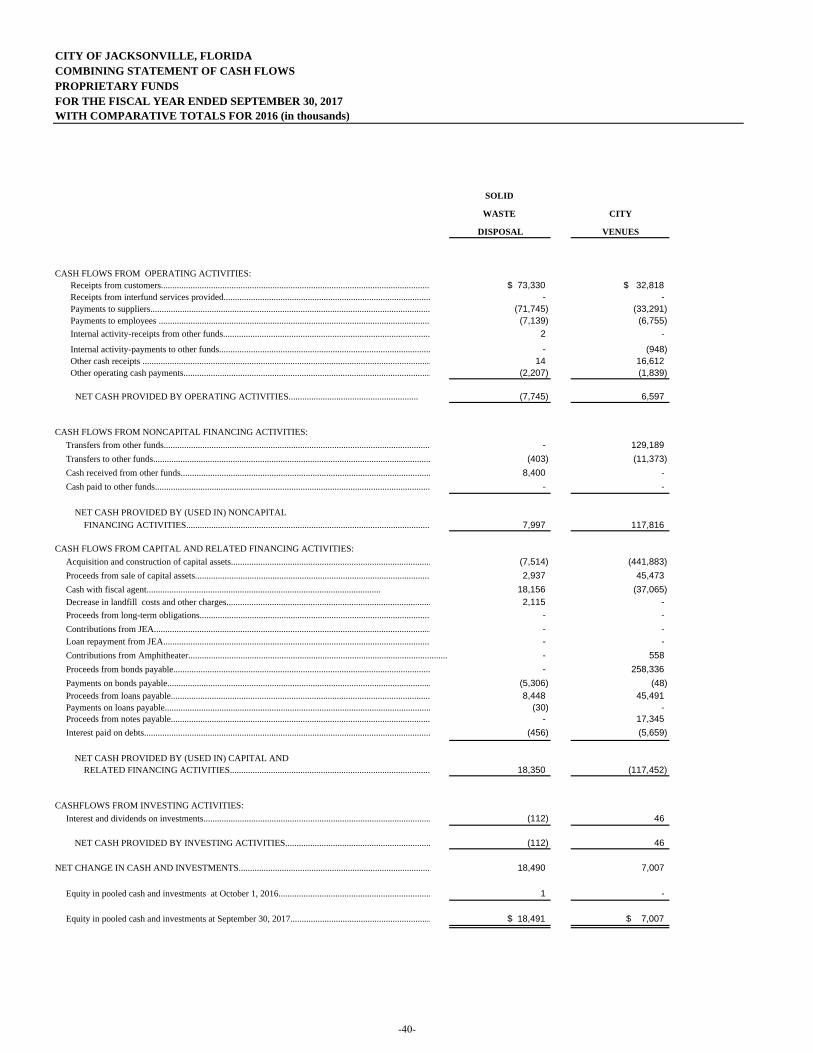
CITY OF JACKSONVILLE, FLORIDACOMBINING STATEMENT OF CASH FLOWS PROPRIETARY FUNDSFOR THE FISCAL YEAR ENDED SEPTEMBER 30, 2017WITH COMPARATIVE TOTALS FOR 2016 (in thousands)
SOLID
WASTE CITY
DISPOSAL VENUES
CASH FLOWS FROM OPERATING ACTIVITIES: Receipts from customers...................................................................................................................... $ 73,330 $ 32,818 Receipts from interfund services provided........................................................................................... - - Payments to suppliers........................................................................................................................... (71,745) (33,291) Payments to employees ....................................................................................................................... (7,139) (6,755) Internal activity-receipts from other funds........................................................................................... 2 -
Internal activity-payments to other funds............................................................................................. - (948) Other cash receipts ............................................................................................................................... 14 16,612 Other operating cash payments............................................................................................................. (2,207) (1,839)
NET CASH PROVIDED BY OPERATING ACTIVITIES......................................................... (7,745) 6,597
CASH FLOWS FROM NONCAPITAL FINANCING ACTIVITIES: Transfers from other funds..................................................................................................................... - 129,189 Transfers to other funds.......................................................................................................................... (403) (11,373) Cash received from other funds.............................................................................................................. 8,400 - Cash paid to other funds......................................................................................................................... - -
NET CASH PROVIDED BY (USED IN) NONCAPITAL FINANCING ACTIVITIES........................................................................................................... 7,997 117,816
CASH FLOWS FROM CAPITAL AND RELATED FINANCING ACTIVITIES:
Acquisition and construction of capital assets........................................................................................ (7,514) (441,883) Proceeds from sale of capital assets....................................................................................................... 2,937 45,473 Cash with fiscal agent....................................................................................................... 18,156 (37,065) Decrease in landfill costs and other charges.......................................................................................... 2,115 - Proceeds from long-term obligations..................................................................................................... - - Contributions from JEA.......................................................................................................................... - - Loan repayment from JEA..................................................................................................................... - - Contributions from Amphitheater................................................................................................................... - 558 Proceeds from bonds payable................................................................................................................. - 258,336 Payments on bonds payable.................................................................................................................... (5,306) (48) Proceeds from loans payable.................................................................................................................. 8,448 45,491 Payments on loans payable..................................................................................................................... (30) - Proceeds from notes payable.................................................................................................................. - 17,345 Interest paid on debts.............................................................................................................................. (456) (5,659)
NET CASH PROVIDED BY (USED IN) CAPITAL AND RELATED FINANCING ACTIVITIES........................................................................................ 18,350 (117,452)
CASHFLOWS FROM INVESTING ACTIVITIES: Interest and dividends on investments.................................................................................................... (112) 46
NET CASH PROVIDED BY INVESTING ACTIVITIES................................................................ (112) 46
NET CHANGE IN CASH AND INVESTMENTS.................................................................................... 18,490 7,007
Equity in pooled cash and investments at October 1, 2016................................................................... 1 -
Equity in pooled cash and investments at September 30, 2017.............................................................. $ 18,491 $ 7,007
-40-
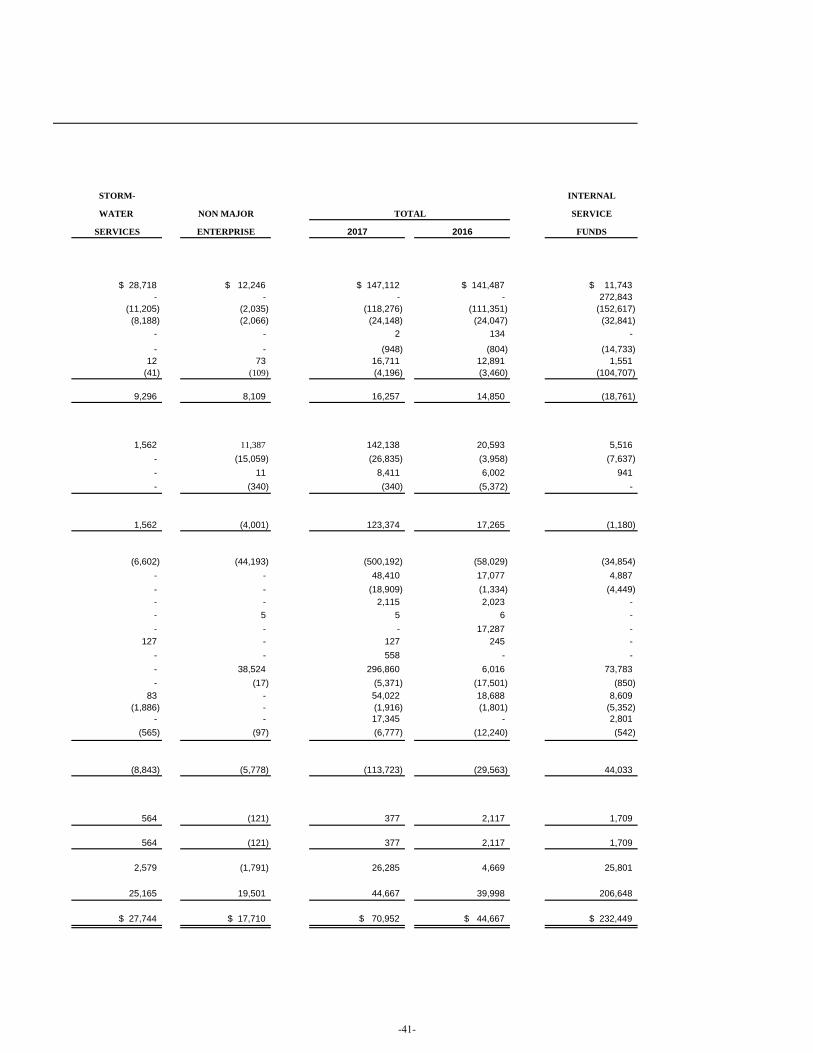
STORM- TOTALS INTERNAL
WATER NON MAJOR TOTAL SERVICE
SERVICES ENTERPRISE 2017 2016 FUNDS
$ 28,718 $ 12,246 $ 147,112 $ 141,487 $ 11,743- - - - 272,843
(11,205) (2,035) (118,276) (111,351) (152,617) (8,188) (2,066) (24,148) (24,047) (32,841)
- - 2 134 -
- - (948) (804) (14,733) 12 73 16,711 12,891 1,551
(41) (109) (4,196) (3,460) (104,707)
9,296 8,109 16,257 14,850 (18,761)
1,562 11,387 142,138 20,593 5,516 - (15,059) (26,835) (3,958) (7,637) - 11 8,411 6,002 941 - (340) (340) (5,372) -
1,562 (4,001) 123,374 17,265 (1,180)
(6,602) (44,193) (500,192) (58,029) (34,854) - - 48,410 17,077 4,887 - - (18,909) (1,334) (4,449) - - 2,115 2,023 - - 5 5 6 - - - - 17,287 -
127 - 127 245 - - - 558 - - - 38,524 296,860 6,016 73,783 - (17) (5,371) (17,501) (850)
83 - 54,022 18,688 8,609 (1,886) - (1,916) (1,801) (5,352)
- - 17,345 - 2,801 (565) (97) (6,777) (12,240) (542)
(8,843) (5,778) (113,723) (29,563) 44,033
564 (121) 377 2,117 1,709
564 (121) 377 2,117 1,709
2,579 (1,791) 26,285 4,669 25,801
25,165 19,501 44,667 39,998 206,648
$ 27,744 $ 17,710 $ 70,952 $ 44,667 $ 232,449
-41-
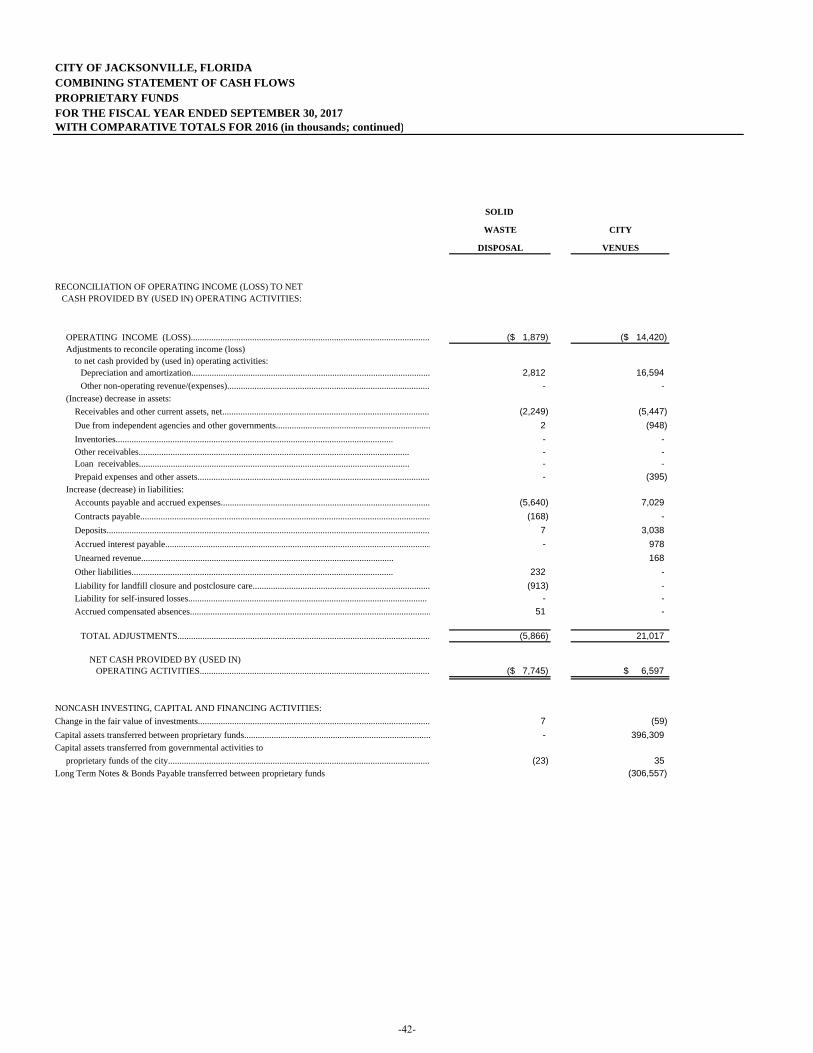
CITY OF JACKSONVILLE, FLORIDA COMBINING STATEMENT OF CASH FLOWS PROPRIETARY FUNDS FOR THE FISCAL YEAR ENDED SEPTEMBER 30, 2017 WITH COMPARATIVE TOTALS FOR 2016 (in thousands; continued)
SOLID
WASTE CITY
DISPOSAL VENUES
RECONCILIATION OF OPERATING INCOME (LOSS) TO NET CASH PROVIDED BY (USED IN) OPERATING ACTIVITIES:
OPERATING INCOME (LOSS)......................................................................................................... ($ 1,879) ($ 14,420)Adjustments to reconcile operating income (loss)
to net cash provided by (used in) operating activities:Depreciation and amortization......................................................................................................... 2,812 16,594Other non-operating revenue/(expenses)......................................................................................... - -
(Increase) decrease in assets:Receivables and other current assets, net........................................................................................... (2,249) (5,447) Due from independent agencies and other governments.................................................................... 2 (948) Inventories.......................................................................................................................... - - Other receivables....................................................................................................................... - - Loan receivables....................................................................................................................... - - Prepaid expenses and other assets...................................................................................................... - (395)
Increase (decrease) in liabilities:Accounts payable and accrued expenses............................................................................................ (5,640) 7,029 Contracts payable................................................................................................................................ (168) - Deposits.............................................................................................................................................. 7 3,038 Accrued interest payable..................................................................................................................... - 978 Unearned revenue............................................................................................................... 168 Other liabilities................................................................................................................... 232 - Liability for landfill closure and postclosure care.............................................................................. (913) - Liability for self-insured losses......................................................................................................... - - Accrued compensated absences.......................................................................................................... 51 -
TOTAL ADJUSTMENTS............................................................................................................... (5,866) 21,017
NET CASH PROVIDED BY (USED IN)OPERATING ACTIVITIES..................................................................................................... ($ 7,745) $ 6,597
NONCASH INVESTING, CAPITAL AND FINANCING ACTIVITIES:Change in the fair value of investments...................................................................................................... 7 (59) Capital assets transferred between proprietary funds.................................................................................. - 396,309 Capital assets transferred from governmental activities to
proprietary funds of the city................................................................................................................... (23) 35 Long Term Notes & Bonds Payable transferred between proprietary funds (306,557)
-42-
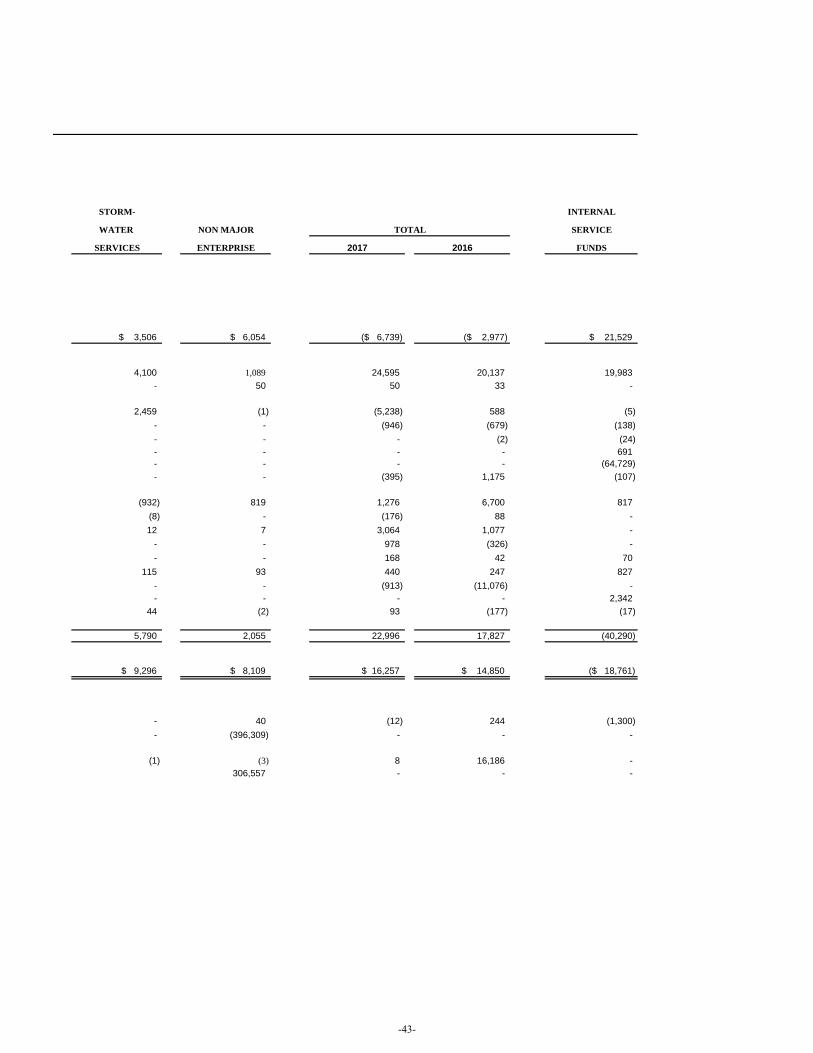
STORM- TOTALS INTERNAL
WATER NON MAJOR TOTAL SERVICE
SERVICES ENTERPRISE 2017 2016 FUNDS
$ 3,506 $ 6,054 ($ 6,739) ($ 2,977) $ 21,529
4,100 1,089 24,595 20,137 19,983 - 50 50 33 -
2,459 (1) (5,238) 588 (5) - - (946) (679) (138) - - - (2) (24) - - - - 691 - - - - (64,729) - - (395) 1,175 (107)
(932) 819 1,276 6,700 817 (8) - (176) 88 - 12 7 3,064 1,077 -
- - 978 (326) - - - 168 42 70
115 93 440 247 827 - - (913) (11,076) - - - - - 2,342
44 (2) 93 (177) (17)
5,790 2,055 22,996 17,827 (40,290)
$ 9,296 $ 8,109 $ 16,257 $ 14,850 ($ 18,761)
- 40 (12) 244 (1,300) - (396,309) - - -
(1) (3) 8 16,186 - 306,557 - - -
-43-

(This page is intentionally left blank.)
-44-
FIDUCIARY FUND LEVEL STATEMENTS
PENSION TRUST FUNDS are funds administered by independent boards for which the City performs a fiduciary role under a defined benefit, defined contribution and disability programs. The participant's retirement annuity is based on a statutory formula using such factors as age, average salary, length of service and others.
PRIVATE PURPOSE TRUST FUND is used to report all trust arrangements, other than those properly reported in pension trust funds, under which principal and income benefit individuals. The City reports its James Brady Disabled Scholarship, Michael Jackson Music Scholarship, J.B. Smith Memorial Scholarship, and Lex Hester Memorial Scholarship funds as private purpose trusts.
AGENCY FUNDS are funds which hold monies in an agency capacity for various government units, individuals or funds.
-45-
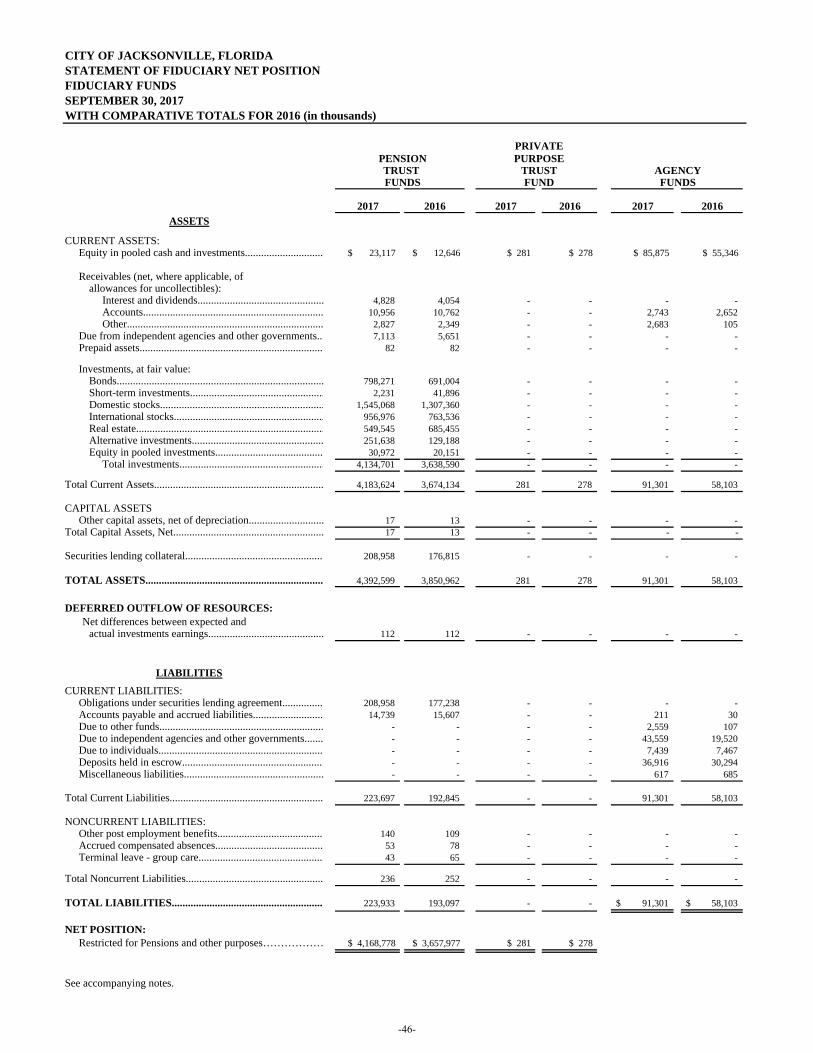
CITY OF JACKSONVILLE, FLORIDASTATEMENT OF FIDUCIARY NET POSITIONFIDUCIARY FUNDSSEPTEMBER 30, 2017 WITH COMPARATIVE TOTALS FOR 2016 (in thousands)
PRIVATEPENSION PURPOSETRUST TRUST AGENCYFUNDS FUND FUNDS
2017 2016 2017 2016 2017 2016
ASSETS
CURRENT ASSETS:Equity in pooled cash and investments............................. $ 23,117 $ 12,646 $ 281 $ 278 $ 85,875 $ 55,346
Receivables (net, where applicable, ofallowances for uncollectibles):
Interest and dividends............................................... 4,828 4,054 - - - - Accounts................................................................... 10,956 10,762 - - 2,743 2,652 Other......................................................................... 2,827 2,349 - - 2,683 105
Due from independent agencies and other governments... 7,113 5,651 - - - - Prepaid assets..................................................................... 82 82 - - - -
Investments, at fair value:Bonds............................................................................. 798,271 691,004 - - - - Short-term investments.................................................. 2,231 41,896 - - - - Domestic stocks............................................................. 1,545,068 1,307,360 - - - - International stocks........................................................ 956,976 763,536 - - - - Real estate...................................................................... 549,545 685,455 - - - - Alternative investments................................................. 251,638 129,188 - - - - Equity in pooled investments........................................ 30,972 20,151 - - - -
Total investments...................................................... 4,134,701 3,638,590 - - - -
Total Current Assets............................................................... 4,183,624 3,674,134 281 278 91,301 58,103
CAPITAL ASSETSOther capital assets, net of depreciation............................ 17 13 - - - -
Total Capital Assets, Net........................................................ 17 13 - - - -
Securities lending collateral.................................................... 208,958 176,815 - - - -
TOTAL ASSETS.................................................................. 4,392,599 3,850,962 281 278 91,301 58,103
DEFERRED OUTFLOW OF RESOURCES:Net differences between expected and
actual investments earnings........................................... 112 112 - - - -
LIABILITIES
CURRENT LIABILITIES:Obligations under securities lending agreement................ 208,958 177,238 - - - - Accounts payable and accrued liabilities.......................... 14,739 15,607 - - 211 30 Due to other funds............................................................. - - - - 2,559 107 Due to independent agencies and other governments....... - - - - 43,559 19,520 Due to individuals.............................................................. - - - - 7,439 7,467 Deposits held in escrow..................................................... - - - - 36,916 30,294 Miscellaneous liabilities.................................................... - - - - 617 685
Total Current Liabilities......................................................... 223,697 192,845 - - 91,301 58,103
NONCURRENT LIABILITIES:Other post employment benefits........................................ 140 109 - - - - Accrued compensated absences........................................ 53 78 - - - - Terminal leave - group care............................................... 43 65 - - - -
Total Noncurrent Liabilities................................................... 236 252 - - - -
TOTAL LIABILITIES......................................................... 223,933 193,097 - - 91,301$ 58,103$
NET POSITION: Restricted for Pensions and other purposes……………… $ 4,168,778 $ 3,657,977 $ 281 $ 278
See accompanying notes.
-46-
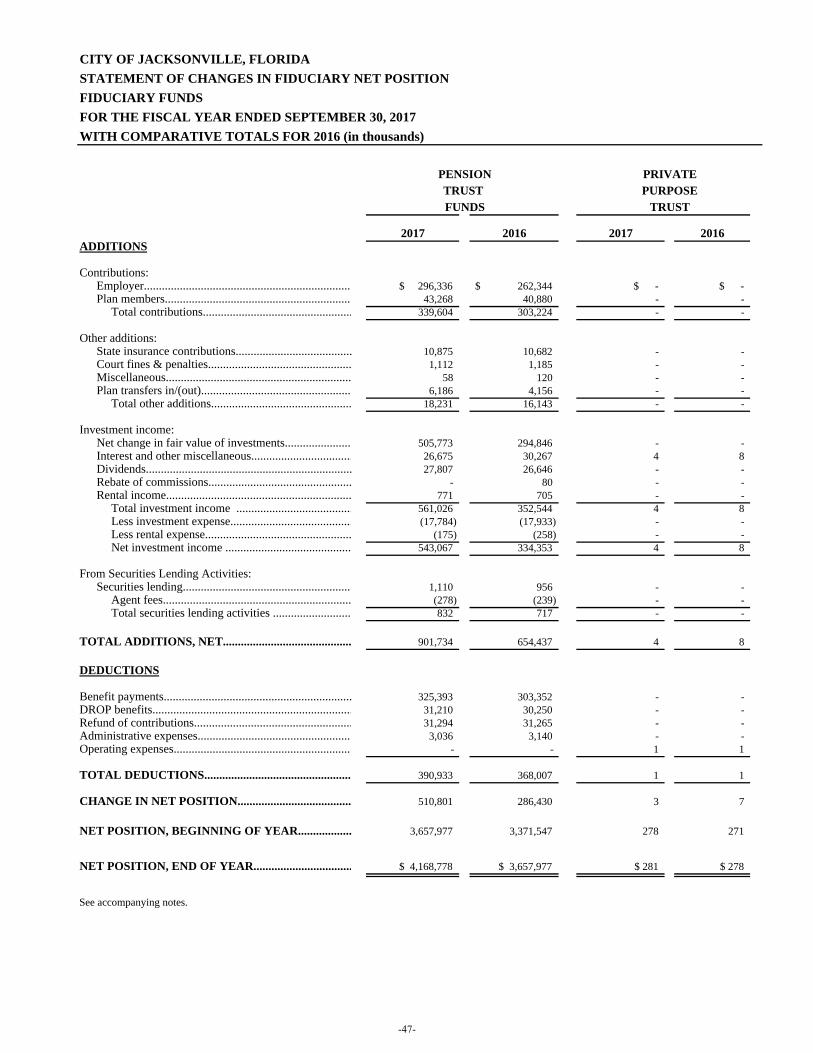
CITY OF JACKSONVILLE, FLORIDASTATEMENT OF CHANGES IN FIDUCIARY NET POSITIONFIDUCIARY FUNDSFOR THE FISCAL YEAR ENDED SEPTEMBER 30, 2017WITH COMPARATIVE TOTALS FOR 2016 (in thousands)
PENSION PRIVATETRUST PURPOSEFUNDS TRUST
2017 2016 2017 2016ADDITIONS
Contributions:Employer...................................................................... $ 296,336 262,344$ $ - $ -Plan members............................................................... 43,268 40,880 - -
Total contributions.................................................. 339,604 303,224 - -
Other additions:State insurance contributions....................................... 10,875 10,682 - - Court fines & penalties................................................ 1,112 1,185 - - Miscellaneous.............................................................. 58 120 - - Plan transfers in/(out)................................................... 6,186 4,156 - -
Total other additions............................................... 18,231 16,143 - -
Investment income:Net change in fair value of investments....................... 505,773 294,846 - - Interest and other miscellaneous.................................. 26,675 30,267 4 8 Dividends..................................................................... 27,807 26,646 - - Rebate of commissions................................................ - 80 - - Rental income.............................................................. 771 705 - -
Total investment income ....................................... 561,026 352,544 4 8 Less investment expense......................................... (17,784) (17,933) - - Less rental expense................................................. (175) (258) - - Net investment income .......................................... 543,067 334,353 4 8
From Securities Lending Activities:Securities lending......................................................... 1,110 956 - -
Agent fees............................................................... (278) (239) - - Total securities lending activities .......................... 832 717 - -
TOTAL ADDITIONS, NET........................................... 901,734 654,437 4 8
DEDUCTIONS
Benefit payments............................................................... 325,393 303,352 - - DROP benefits................................................................... 31,210 30,250 - - Refund of contributions..................................................... 31,294 31,265 - - Administrative expenses.................................................... 3,036 3,140 - - Operating expenses............................................................ - - 1 1
TOTAL DEDUCTIONS.................................................. 390,933 368,007 1 1
CHANGE IN NET POSITION...................................... 510,801 286,430 3 7
NET POSITION, BEGINNING OF YEAR.................. 3,657,977 3,371,547 278 271
NET POSITION, END OF YEAR................................. $ 4,168,778 $ 3,657,977 $ 281 $ 278
See accompanying notes.
-47-

(This page is intentionally left blank.)
-48-
COMPONENT UNITS Component Units are legally separate organizations for which the primary government is financially accountable. Financial accountability is defined as the appointment of a voting majority of the component unit's governing body with certain exceptions, and either (a) the ability to impose will by the primary government; or (b) the potential for the organization to provide financial benefits to, or impose financial burdens on the primary government. Financial accountability may also be determined if the component unit is fiscally dependent on the City and a potential financial benefit / burden relationship exists. MAJOR COMPONENT UNITS:
The JEA manages and operates an electric utility system and a water and sewer utility system in the Consolidated City of Jacksonville/Duval County area.
The Jacksonville Transportation Authority is responsible for construction, improvement, and maintenance of the Jacksonville Expressway System and operation of the City’s mass transit systems, including bus and automated skyway express throughout Duval County.
The Jacksonville Port Authority manages and operates the City’s marine port facilities.
NON MAJOR COMPONENT UNIT:
The Jacksonville Housing Finance Authority provides money for loans and technical assistance for construction and rehabilitation of housing to alleviate a shortage of housing and capital for investment in housing in Jacksonville.
-49-
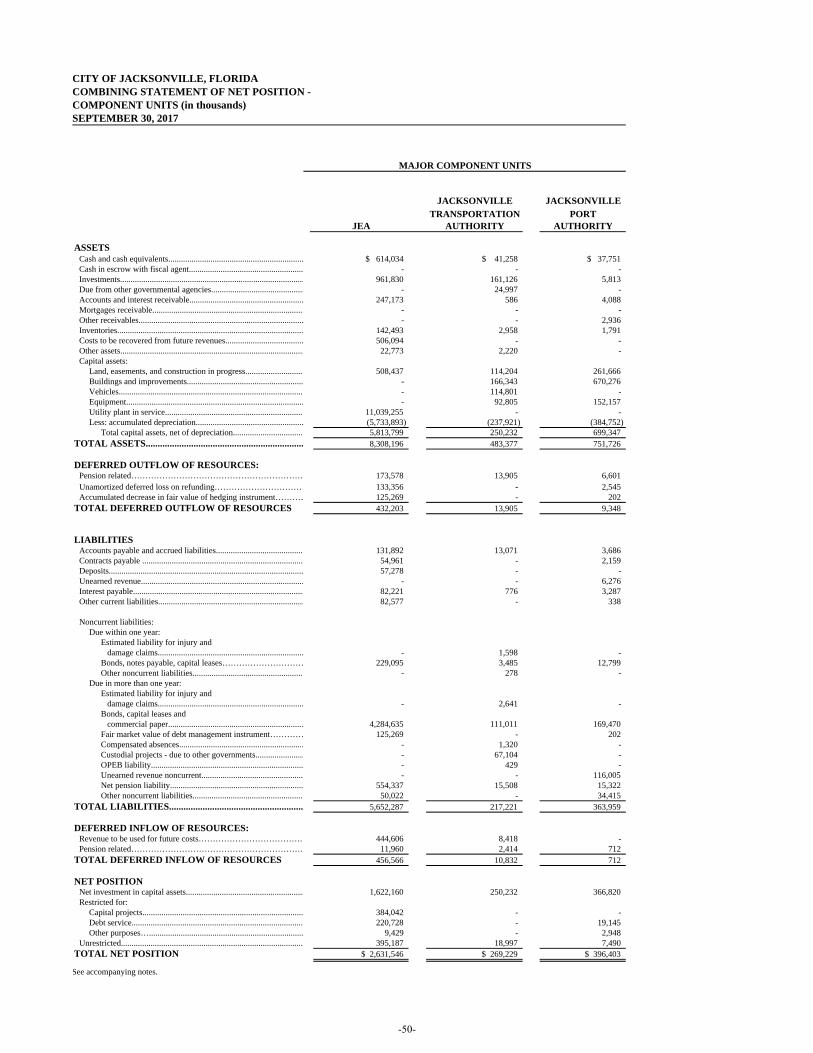
CITY OF JACKSONVILLE, FLORIDACOMBINING STATEMENT OF NET POSITION -COMPONENT UNITS (in thousands)SEPTEMBER 30, 2017
JACKSONVILLE JACKSONVILLE TRANSPORTATION PORT
JEA AUTHORITY AUTHORITY
ASSETS Cash and cash equivalents................................................................ $ 614,034 $ 41,258 $ 37,751Cash in escrow with fiscal agent...................................................... - - - Investments....................................................................................... 961,830 161,126 5,813 Due from other governmental agencies............................................ - 24,997 - Accounts and interest receivable...................................................... 247,173 586 4,088 Mortgages receivable....................................................................... - - - Other receivables.............................................................................. - - 2,936 Inventories........................................................................................ 142,493 2,958 1,791 Costs to be recovered from future revenues..................................... 506,094 - - Other assets....................................................................................... 22,773 2,220 - Capital assets:
Land, easements, and construction in progress........................... 508,437 114,204 261,666 Buildings and improvements....................................................... - 166,343 670,276 Vehicles....................................................................................... - 114,801 - Equipment.................................................................................... - 92,805 152,157 Utility plant in service................................................................. 11,039,255 - - Less: accumulated depreciation................................................... (5,733,893) (237,921) (384,752)
Total capital assets, net of depreciation................................. 5,813,799 250,232 699,347 TOTAL ASSETS.................................................................. 8,308,196 483,377 751,726
DEFERRED OUTFLOW OF RESOURCES:
Pension related……………………………………………………… 173,578 13,905 6,601 Unamortized deferred loss on refunding…………………………… 133,356 - 2,545 Accumulated decrease in fair value of hedging instrument………… 125,269 - 202
TOTAL DEFERRED OUTFLOW OF RESOURCES 432,203 13,905 9,348
LIABILITIES Accounts payable and accrued liabilities......................................... 131,892 13,071 3,686 Contracts payable ............................................................................ 54,961 - 2,159 Deposits............................................................................................ 57,278 - - Unearned revenue............................................................................. - - 6,276 Interest payable................................................................................. 82,221 776 3,287 Other current liabilities..................................................................... 82,577 - 338
Noncurrent liabilities: Due within one year:
Estimated liability for injury and damage claims..................................................................... - 1,598 - Bonds, notes payable, capital leases………………………… 229,095 3,485 12,799 Other noncurrent liabilities.................................................... - 278 -
Due in more than one year: Estimated liability for injury and damage claims..................................................................... - 2,641 - Bonds, capital leases and commercial paper................................................................ 4,284,635 111,011 169,470 Fair market value of debt management instrument………… 125,269 - 202 Compensated absences........................................................... - 1,320 - Custodial projects - due to other governments....................... - 67,104 - OPEB liability........................................................................ - 429 - Unearned revenue noncurrent................................................ - - 116,005 Net pension liability............................................................... 554,337 15,508 15,322 Other noncurrent liabilities.................................................... 50,022 - 34,415
TOTAL LIABILITIES........................................................ 5,652,287 217,221 363,959
DEFERRED INFLOW OF RESOURCES: Revenue to be used for future costs………………………………. 444,606 8,418 - Pension related……………………………………………………… 11,960 2,414 712
TOTAL DEFERRED INFLOW OF RESOURCES 456,566 10,832 712
NET POSITION Net investment in capital assets........................................................ 1,622,160 250,232 366,820 Restricted for:
Capital projects............................................................................ 384,042 - - Debt service................................................................................. 220,728 - 19,145 Other purposes…......................................................................... 9,429 - 2,948
Unrestricted...................................................................................... 395,187 18,997 7,490 TOTAL NET POSITION $ 2,631,546 $ 269,229 $ 396,403
See accompanying notes.
MAJOR COMPONENT UNITS
-50-
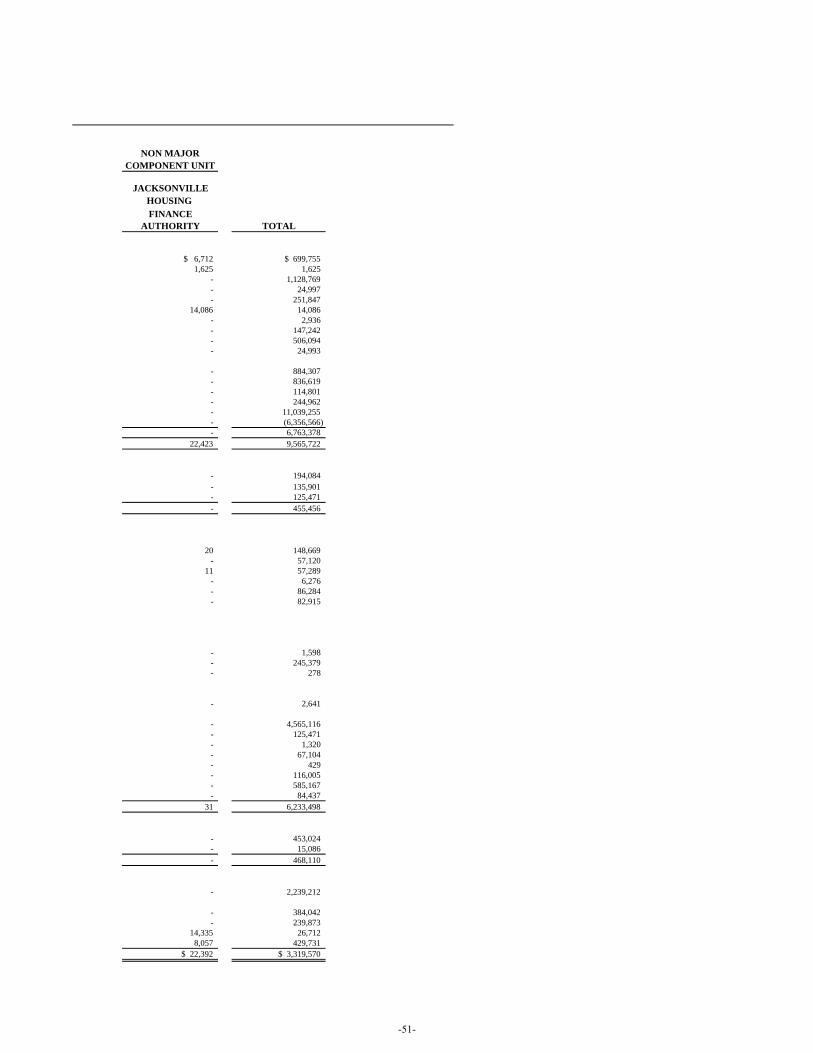
NON MAJOR COMPONENT UNIT
JACKSONVILLEHOUSING FINANCE
AUTHORITY TOTAL
$ 6,712 $ 699,7551,625 1,625
- 1,128,769 - 24,997 - 251,847
14,086 14,086 - 2,936 - 147,242 - 506,094 - 24,993
- 884,307 - 836,619 - 114,801 - 244,962 - 11,039,255 - (6,356,566) - 6,763,378
22,423 9,565,722
- 194,084 - 135,901 - 125,471 - 455,456
20 148,669 - 57,120
11 57,289 - 6,276 - 86,284 - 82,915
- 1,598 - 245,379 - 278
- 2,641
- 4,565,116 - 125,471 - 1,320 - 67,104 - 429 - 116,005 - 585,167 - 84,437
31 6,233,498
- 453,024 - 15,086 - 468,110
- 2,239,212
- 384,042 - 239,873
14,335 26,712 8,057 429,731
$ 22,392 $ 3,319,570
-51-
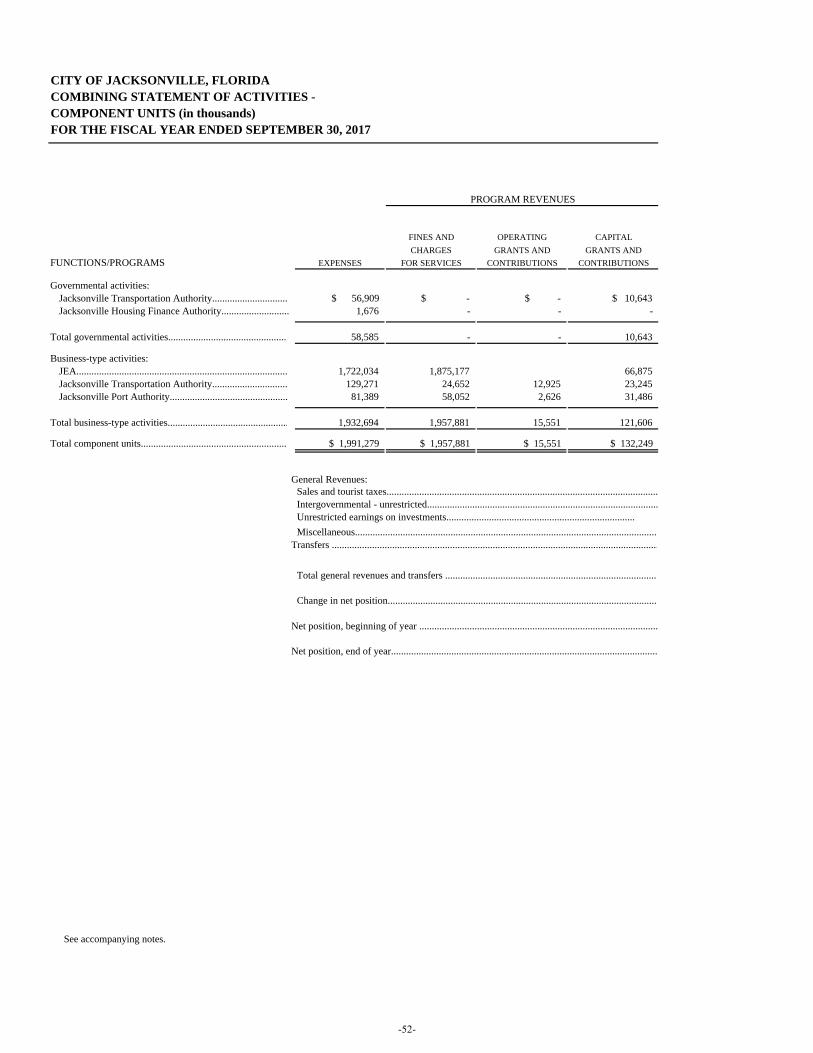
CITY OF JACKSONVILLE, FLORIDACOMBINING STATEMENT OF ACTIVITIES -COMPONENT UNITS (in thousands)FOR THE FISCAL YEAR ENDED SEPTEMBER 30, 2017
FINES AND OPERATING CAPITAL CHARGES GRANTS AND GRANTS AND
FUNCTIONS/PROGRAMS EXPENSES FOR SERVICES CONTRIBUTIONS CONTRIBUTIONS
Governmental activities:Jacksonville Transportation Authority.............................. $ 56,909 $ - $ - $ 10,643Jacksonville Housing Finance Authority........................... 1,676 - - -
Total governmental activities................................................ 58,585 - - 10,643
Business-type activities: JEA.................................................................................... 1,722,034 1,875,177 66,875Jacksonville Transportation Authority.............................. 129,271 24,652 12,925 23,245 Jacksonville Port Authority............................................... 81,389 58,052 2,626 31,486
Total business-type activities................................................ 1,932,694 1,957,881 15,551 121,606
Total component units........................................................... $ 1,991,279 $ 1,957,881 $ 15,551 $ 132,249
General Revenues:Sales and tourist taxes............................................................................................................Intergovernmental - unrestricted............................................................................................
Unrestricted earnings on investments........................................................................... Miscellaneous........................................................................................................................Transfers ..................................................................................................................................Special Item - JTA transfer of Ferry operation........................................................................
Total general revenues and transfers .....................................................................................
Change in net position............................................................................................................
Net position, beginning of year ...............................................................................................
Net position, end of year..........................................................................................................
See accompanying notes.
PROGRAM REVENUES
-52-
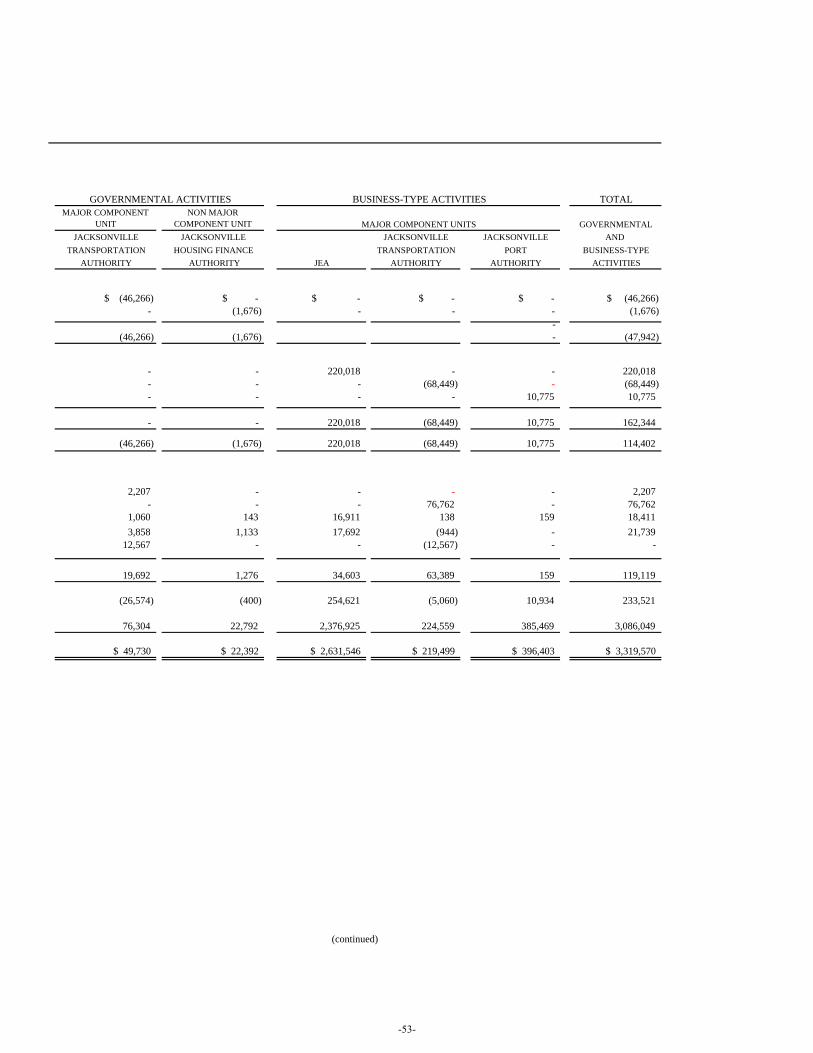
TOTALMAJOR COMPONENT
UNIT NON MAJOR
COMPONENT UNIT GOVERNMENTALJACKSONVILLE JACKSONVILLE JACKSONVILLE JACKSONVILLE AND
TRANSPORTATION HOUSING FINANCE TRANSPORTATION PORT BUSINESS-TYPEAUTHORITY AUTHORITY JEA AUTHORITY AUTHORITY ACTIVITIES
$ (46,266) $ - $ - $ - $ - $ (46,266)- (1,676) - - - (1,676)
- (46,266) (1,676) - (47,942)
- - 220,018 - - 220,018 - - - (68,449) - (68,449) - - - - 10,775 10,775
- - 220,018 (68,449) 10,775 162,344
(46,266) (1,676) 220,018 (68,449) 10,775 114,402
2,207 - - - - 2,207 - - - 76,762 - 76,762
1,060 143 16,911 138 159 18,411 3,858 1,133 17,692 (944) - 21,739
12,567 - - (12,567) - - - - - - - -
19,692 1,276 34,603 63,389 159 119,119
(26,574) (400) 254,621 (5,060) 10,934 233,521
76,304 22,792 2,376,925 224,559 385,469 3,086,049
$ 49,730 $ 22,392 $ 2,631,546 $ 219,499 $ 396,403 $ 3,319,570
BUSINESS-TYPE ACTIVITIESGOVERNMENTAL ACTIVITIES
(continued)
MAJOR COMPONENT UNITS
-53-

(This page is intentionally left blank.)
-54-
CITY OF JACKSONVILLE, FLORIDA NOTES TO FINANCIAL STATEMENTS FOR THE FISCAL YEAR ENDED SEPTEMBER 30, 2017
1. SUMMARY OF SIGNIFICANT ACCOUNTING POLICIES ............................... 58 - 73 A. Basis of Presentation ..............................................................................................58 B. Financial Reporting Entity ............................................................................. 58 - 62 C. Basic Financial Statements ....................................................................................63 D. Fund Structure ................................................................................................ 63 - 65 E. Basis of Accounting ...............................................................................................66 F. Cash, Cash Equivalents and Investments ........................................................….67 G. Receivables ............................................................................................................67 H. Inventories .............................................................................................................67 I. Capital Assets ........................................................................................................68 J. Contributions .........................................................................................................68 K. Interfund Activity ..................................................................................................68 L. Restricted Assets ....................................................................................................69 M. Compensated Absences .........................................................................................69 N. Risk Financing ............................................................................................... 69 - 70 O. Pension Costs .........................................................................................................70 P. Landfill Closure and Postclosure Care Costs .......................................................70 Q. Long-Term Obligations .........................................................................................71 R. Categories and Classification of Fund Balance .....................................................71 S. Bond Discounts, Premiums and Issuance Costs ....................................................72 T. Deferred Loss on Debt Refundings........................................................................72 U. Use of Estimates ....................................................................................................72 V. Reclassification ......................................................................................................72 W. Summarized Comparative Information ..................................................................72 X. Prepaids ..................................................................................................................73 Y. Accounting Pronouncements .................................................................................73
2. BUDGETARY DATA .....................................................................................................73 3. CASH, INVESTMENTS AND SECURITIES LENDING ..................................... 74 - 84
A. Cash on Deposit .....................................................................................................74 B. Investments and Investment Practices ........................................................... 74 - 83 C. Securities Lending ......................................................................................... 83 - 84
4. ACCOUNTS, MORTGAGES, AND OTHER RECEIVABLE .......................................85
5. PROPERTY TAXES .......................................................................................................86
A. Ad Valorem Property Taxes ..................................................................................86 B. The Property Tax Calendar ....................................................................................86
6. CAPITAL ASSET ACTIVITY ................................................................................87 – 88
-55-
CITY OF JACKSONVILLE, FLORIDA NOTES TO FINANCIAL STATEMENTS FOR THE FISCAL YEAR ENDED SEPTEMBER 30, 2017
7. INTERFUND RECEIVABLES, PAYABLES, ADVANCES AND TRANSFERS ............................................................................................90 – 94 8. LONG-TERM OBLIGATIONS ............................................................................95 – 112
A. Bonds and Loans Outstanding ...................................................................... 95 - 97 B. Debt Service Requirement to Maturity .......................................................... 98 - 99 C. Changes in Long-Term Liabilities ............................................................. 100 - 101 D. Reconciliation of Debt Issued to Financial Reporting Classification ..................102 E. Pledged Revenues ................................................................................................103 F. New Indebtedness Issued .....................................................................................104 G. Demand Bonds .....................................................................................................105 H. Non-Asset Debt ....................................................................................................106 I. Defeased Debt ......................................................................................................107 J. Derivative Instrument Payments and Hedged Debt ................................... 108 - 110 K. Conduit Debt ........................................................................................................111 L. Interest Expense ...................................................................................................112 M. Component Unit Long-term Debt ........................................................................112
9. PENSION PLANS ............................................................................................... 113 - 123
A. Pension Plans ............................................................................................. 113 - 120 B. Pension Liability, Expense, Deferred Outflows And Deferred Inflows of Resources Related to Pensions ....................... 121 - 123 C. Defined Contribution Plan ...................................................................................123 D. Unfunded Pension Liability .................................................................................124
10. POST EMPLOYMENT BENEFITS OTHER THAN PENSION (OPEB) ......... 125 - 127 11. DEFERRED COMPENSATION PROGRAM ..............................................................127 12. RISK FINANCING ............................................................................................. 127 - 131
A. Public Liability and Workers Compensation ............................................. 127 - 130 B. Self-Insured Health Plan ......................................................................................131
13. OTHER REQUIRED INDIVIDUAL FUND AND COMPLIANCE
DISCLOSURES ................................................................................................... 132 - 134 A. Compliance with Finance Related Legal and Contractual Provisions .................132 B. Fund Deficits ........................................................................................................132 C. Landfill Closure and Postclosure Care Costs ............................................133 – 134
-56-
CITY OF JACKSONVILLE, FLORIDA NOTES TO FINANCIAL STATEMENTS FOR THE FISCAL YEAR ENDED SEPTEMBER 30, 2017
14. LESSOR OPERATING LEASE .......................................................................... 134 - 137 A. Jacksonville Jaguars, LLC. ........................................................................ 134 - 137 B. Shands Jacksonville .............................................................................................137
15. LITIGATION, CONTINGENCIES, AND COMMITMENTS ........................... 137 - 143 A. Litigation ..............................................................................................................137 B. Grants and Contracts ............................................................................................138 C. Self-Insurance ......................................................................................................138 D. Pollution Remediation ............................................................................... 138 - 140 E. Garage Development Agreement .........................................................................140
F. Construction and other significant Commitments ...............................................141 G. Encumbrance Commitments ................................................................................142 H. Tax Abatements ...................................................................................................143 16. MAJOR DISCRETELY PRESENTED COMPONENT UNITS - ADDITIONAL
DISCLOSURE ........................................................................................... 144 - 146 17. SUBSEQUENT EVENTS .............................................................................................146
18. NET POSITION ................................................................................................... 147 - 148
A. Additional Disclosure ................................................................................ 147 - 148
19. FUND BALANCE DISCLOSURE ..................................................................... 148 - 151 A. Fund Balance Classification ...................................................................... 150 - 151
-57-
CITY OF JACKSONVILLE, FLORIDA NOTES TO FINANCIAL STATEMENTS FOR THE FISCAL YEAR ENDED SEPTEMBER 30, 2017
1. SUMMARY OF SIGNIFICANT ACCOUNTING POLICIES
The accounting policies of the City of Jacksonville, Florida (the City) conform to accounting principles generally accepted in the United States (GAAP) as applicable to governments. The following is a summary of the more significant policies. Notes 1C through 19 are note disclosures of the primary government with significant disclosures for major component units incorporated within. Additional significant component unit disclosures are presented in Note 16.
A. Basis of Presentation:
The accompanying financial statements of the City have been prepared in conformity with GAAP as prescribed by the Governmental Accounting Standards Board (GASB). GASB is the accepted standard-setting body for establishing governmental accounting and financial reporting principles for units of local government.
B. Financial Reporting Entity:
The City is a consolidated city/county political entity created by Chapter 67-1320 of the Laws of Florida. When consolidation occurred on October 1, 1968, all existing municipalities, authorities and public agencies within Duval County, except for the Duval County School Board, were merged into a single new corporate and political entity also known as the City of Jacksonville. At the same time, however, the cities of Jacksonville Beach, Atlantic Beach, Neptune Beach and the Town of Baldwin elected to retain local autonomy for certain municipal purposes and were reconstituted as separate and distinct urban service districts. The consolidated city government, which is comprised of an elected City Council (19 members) and mayor, provides, under the administration of the appointed chief administrative officer, services to 936,811 residents living in an 840.1 square-mile area.
To conform to the traditional county organization of government in the State of Florida, the City retained the offices of the Sheriff, Property Appraiser, Tax Collector, Supervisor of Elections, and Clerk of the Circuit Court, which are also elected by the citizenry. These officers are considered to be not only county officers, but also officers of the consolidated government, and therefore are considered as part of the primary government. The three beach cities and the Town of Baldwin continue to function as separate municipal governments.
This report includes all funds, departments, agencies, boards and commissions, and other organizational units that are administered by the mayor and/or controlled by or dependent upon the City Council as set forth in the City Charter. The City, a primary government, has also considered for inclusion all potential component units for which it may be financially accountable and other organizations for which the nature and significance of their relationship with the City are such that exclusion would cause the City's financial statements to be misleading or incomplete. In GASB codification section 2100 Defining the Financial Reporting Entity, the GASB has set forth criteria to be considered in determining financial accountability.
-58-
CITY OF JACKSONVILLE, FLORIDA NOTES TO FINANCIAL STATEMENTS FOR THE FISCAL YEAR ENDED SEPTEMBER 30, 2017
1. SUMMARY OF SIGNIFICANT ACCOUNTING POLICIES (continued) B. Financial Reporting Entity: (continued)
These criteria include appointing a voting majority of an organization's governing body and (1) the ability of the City to impose its will on that organization; or (2) the potential for the organization to provide specific financial benefits to or impose specific financial burdens on the City. Additionally, an entity may also meet the criteria for inclusion if the organization is fiscally dependent on the City and the potential financial benefit/burden relationship mentioned above exists.
As required by GAAP, these financial statements present the City of Jacksonville (the primary government) and its component units. The City has identified and included within the financial reporting entity, as its component units, legally separate organizations for which the City is financially accountable or for which a significant relationship with the City exists such that exclusion would cause the City's financial statements to be misleading or incomplete.
The Jacksonville Public Library Board and the Downtown Investment Authority (DIA) are classified as dependent special districts. Per GASB codification section 2100, the Library Board and DIA are not considered component units as they are not legally separate organizations. Therefore, these activities are included as part of the primary government.
Blended Component Unit. There are two component units, which are legally separate from the City, but are so intertwined with the City that they are, in substance, the same as the City. They are reported as part of the City and blended into the appropriate funds.
The Jacksonville Police and Fire Pension Board of Trustees, created under Article 22 of the City Charter, provide retirement services and benefits to eligible employees of the Office of the Sheriff and the Department of Fire and Rescue. The City appoints two members of the five-member board; one member is a police officer; one member is a firefighter; and the remaining member is appointed by the other four members. As sponsor, the City has the ability to modify the plan and to approve the defined benefit contribution to the Police and Fire Pension Board of Trustees in the City's annual budget. The Police and Fire Pension Board of Trustees issues separate financial statements on the fund, which may be obtained from its administrative office at One West Adams Street, Suite 100, Jacksonville, Florida 32202-3616. These transactions are blended in the Fiduciary Funds. Community redevelopment agencies (CRAs) JIA, KingSoutel Crossing, Renew Arlington, Southside, and Northbank Downtown are blended component units that are reported within the Tax Increment Districts special revenue fund. The City serves as the Board for JIA, KingSoutel Crossing, and Renew Arlington CRAs. The Downtown Investment Authority serves as the Board for Southside and Northbank Downtown. The CRAs are blended because City Council has an operational responsibility and because of the existence of a financial benefit/burden relationship. The CRAs issue a separate report that may be obtained from the City. Requests for information may be addressed to the City Comptroller, City of Jacksonville, 117 West Duval Street, Suite 375, Jacksonville, Florida 32202.
-59-
CITY OF JACKSONVILLE, FLORIDA NOTES TO FINANCIAL STATEMENTS FOR THE FISCAL YEAR ENDED SEPTEMBER 30, 2017
1. SUMMARY OF SIGNIFICANT ACCOUNTING POLICIES (continued) B. Financial Reporting Entity: (continued)
Discrete Component Units. These component units are entities that are legally separate from the City, but are financially accountable to the City, or whose relationships with the City are such that exclusion would cause the City's financial statements to be misleading or incomplete. The component units are reported separately to emphasize that they are legally separate from the primary government and are governed by separate boards. The footnotes include financial data for these entities. Each component unit listed below has a September 30 fiscal year end.
Major Component Units
JEA (formerly known as the Jacksonville Electric Authority) was created by Chapter 67-1569 of the Laws of Florida to own, manage, and operate an electric utility system and a water and sewer utility system in Jacksonville and any or all counties adjacent thereto. The governing body of the JEA consists of seven members appointed by the mayor and confirmed by the City Council. The City has the ability to impose its will on JEA, manifested principally through formal budgetary approval. The JEA engages only in business-type activities and issues separate financial statements, which may be obtained from its administrative office in the JEA Plaza at 21 West Church Street, Jacksonville, Florida 32202. The Jacksonville Port Authority (JPA) was created by Chapter 2001-319 of the Laws of Florida to operate, manage, and control the publicly owned seaport and ancillary facilities located within Duval County and outside such boundary lines. The governing body of the JPA consists of seven members, four of whom are appointed by the mayor and confirmed by the City Council, and three of whom are appointed by the governor. The City can impose its will on the JPA through modification and approval of its budgets, which ensures strong accountability to the local constituent citizenry. The JPA engages only in business-type activities and issues separate financial statements. Requests for information may be addressed to the chief financial officer, Jacksonville Port Authority, P.O. Box 3005, Jacksonville, FL 32206-0005. The Jacksonville Transportation Authority (JTA) is a public body politic and corporate agency of the State of Florida under Chapter 349 of the Florida Statutes. The governing body of the JTA consists of seven members, three of whom are appointed by the governor of Florida, three of whom are appointed by the mayor and confirmed by the City Council, and the seventh member is the district two secretary of the Florida Department of Transportation.
-60-
CITY OF JACKSONVILLE, FLORIDA NOTES TO FINANCIAL STATEMENTS FOR THE FISCAL YEAR ENDED SEPTEMBER 30, 2017
1. SUMMARY OF SIGNIFICANT ACCOUNTING POLICIES (continued) B. Financial Reporting Entity: (continued)
The JTA is empowered to construct, improve, operate and lease the Jacksonville Expressway System. The JTA is, however, fiscally dependent upon the City under Section 14 of the City Charter through approval of its budgets, which ensures strong accountability to the local constituent citizenry. Additionally, a financial burden relationship exists through the provisions of an interlocal agreement. The JTA engages in both governmental and business-type activities and issues separate financial statements, which may be obtained from its administrative office at 121 West Forsyth Street, Suite 200, Jacksonville, Florida 32202. Non-major Component Units
The Jacksonville Housing Finance Authority (JHFA), formerly known as the Duval County Housing Finance Authority (DCHFA), was created by City Ordinance 2003-1058, to alleviate a shortage of housing and capital investment for the people of Duval County, pursuant to Florida Statutes, Section 159.604. The City appoints all seven of the board members. The City has the ability to impose its will on the JHFA. The JHFA operates in conjunction with the Jacksonville Housing Commission, also created by Ordinance 2003-1058, and has the rights and duties necessary under Florida Statutes, Chapter 159, Part IV, to preserve outstanding debt, issue new debt and to shield the City from financial liability. The bonds issued and outstanding are included in Note 8K Conduit Debt. The JHFA engages only in governmental activities. There are no separately issued financial statements for the JHFA, whose financial activity is accounted for by the City. The JHFA financial statements are presented in the financial section of the City report.
The Jacksonville Health Facilities Authority, created under Chapter 490 of the City Ordinance Code pursuant to Chapter 154 Part III, Laws of Florida, provides appropriate additional means to assist in the development, improvement and maintenance of the public health. The Health Facilities Authority provides a method for the financing and refinancing, on a tax-exempt basis, projects on behalf of private corporations and organized not-for-profits that are authorized by law to provide hospital or nursing home services, thus providing facilities at favorable interest costs with a resultant decrease in health care costs for the users of health facilities within the City. All five members are appointed by the City Council, and the City is able to impose its will on the Health Facilities Authority.
-61-
CITY OF JACKSONVILLE, FLORIDA NOTES TO FINANCIAL STATEMENTS FOR THE FISCAL YEAR ENDED SEPTEMBER 30, 2017
1. SUMMARY OF SIGNIFICANT ACCOUNTING POLICIES (continued) B. Financial Reporting Entity: (continued)
The bonds issued by the Health Facilities Authority are special limited obligations of the Health Facilities Authority and the principal and interest are payable from rental payments. The principal and interest on the bonds shall never constitute an indebtedness of the City of Jacksonville, Duval County, the State of Florida or any municipality or political subdivision thereof. Accordingly, the bonds issued and outstanding are included in Note 8K Conduit Debt. During the fiscal year presented, the Health Facilities Authority had no financial transactions or assets and liabilities to report. Therefore, there are no separately issued financial statements.
Related Organizations The Jacksonville Housing Authority (JHA) is governed by a seven member board, whose members are appointed by the mayor and confirmed by City Council. However, the City does not have the ability to impose its will on JHA. The City cannot remove appointed members from the JHA Board at will. JHA managers are appointed by the JHA Board of Directors. The Board approves the operating budget and amendments to the budget. The City does not exercise influence in JHA management or operations. It does not approve JHA budgets, and does not provide or collect major revenues of the JHA. Accordingly, the financial activities of the JHA are not included in the City's financial statements.
The Duval County Research and Development Authority (Authority) is governed by a five member board whose members are appointed by the City Council. However, the City does not have the ability to impose its will on the Authority. The City does not exercise influence over the management or operations of the Authority and is not financially accountable for the actions of the Authority. Accordingly, the financial activities of the Authority are not included in the City's financial statements.
Jointly Governed Organization
The North Florida Transportation Planning Organization (TPO) is an independent regional transportation planning agency for Duval, Clay, Nassau and St. Johns counties. The mayor, three Jacksonville City council members, and various other leaders of the other affiliated communities and transportation agencies make up the board. There are currently 15 voting board members and five non-voting members.
The City does not have an ongoing financial interest or responsibility to the TPO. However, since the board includes members from each of the governments that created it, the TPO is considered a jointly governed organization of the City.
-62-
CITY OF JACKSONVILLE, FLORIDA NOTES TO FINANCIAL STATEMENTS FOR THE FISCAL YEAR ENDED SEPTEMBER 30, 2017
1. SUMMARY OF SIGNIFICANT ACCOUNTING POLICIES (continued) C. Basic Financial Statements:
The basic financial statements include both citywide and fund level statements. The City, as the primary government, is reported separately from its component units. The citywide statements report on all of the activities of the City and its component units except those that are fiduciary in nature.
Statements for fiduciary activities, such as employee pension plans, are presented in a separate section of this report. Both the citywide and fund level statements classify primary activities of the City as either governmental activities, which are primarily supported by taxes and intergovernmental revenues, or business type activities, which are primarily supported by user fees and charges.
The citywide statement of net position reports all assets, deferred outflows of resources, liabilities, and deferred inflow of resources of the City, including both long-term assets and long-term debt and other obligations. The statement of activities reports the degree to which direct expenses of City functions are offset by program revenues, which include program specific grants and charges for services provided by a specific function. Direct expenses are those that are clearly identifiable with a specific function or program. The net cost of these programs is funded from general revenues such as taxes, intergovernmental revenue and interest earnings.
The fund level statements report on governmental, proprietary and fiduciary fund activities. Major individual governmental funds and major individual enterprise funds are reported as separate columns in the fund level financial statements.
Since the fund level statements for governmental activities are presented using a different measurement focus and basis of accounting than the citywide statements governmental column (as discussed under Basis of Accounting in this summary of significant accounting policies), a reconciliation is presented on the page following each governmental fund financial statement that briefly explains the adjustments necessary to convert the fund level statements into the citywide governmental column presentations.
As a general rule, the effect of interfund activity has been eliminated from the citywide financial statements.
D. Fund Structure: The City's accounts are maintained in accordance with the principles of fund accounting to
ensure compliance with limitations and restrictions placed on the use of resources available to it. Under fund accounting, individual funds are established for the purpose of carrying on activities or attaining objectives in accordance with specific regulations, restrictions or limitations. Each individual fund is a self-balancing set of accounts recording assets, liabilities and residual equities or balances and revenues, expenditures / expenses and changes therein. For financial statement presentation, funds with similar characteristics, including those component units referenced above, are grouped into generic classifications as required by GAAP. A brief description of these classifications follows:
-63-
CITY OF JACKSONVILLE, FLORIDA NOTES TO FINANCIAL STATEMENTS FOR THE FISCAL YEAR ENDED SEPTEMBER 30, 2017
1. SUMMARY OF SIGNIFICANT ACCOUNTING POLICIES (continued) D. Fund Structure: (continued)
Governmental Funds. These funds report transactions related to resources received and used for those services traditionally provided by city/county government. The following are major governmental funds used by the City: General Fund - The General Fund is the general operating fund of the City. It is used to account for all financial resources except those required to be accounted for in another fund.
Debt Service Funds:
The Special Bonded Debt – Better Jacksonville Plan Obligations Fund accounts for the accumulation of resources for, and the payment of, principal and interest on the City’s special bonded obligations payable, which are related to the Better Jacksonville Plan.
The Special Bonded Debt Obligations Fund accounts for the accumulation of resources for, and the payment of, principal and interest on the City’s special and limited bonded obligations, which are payable solely from and secured by a lien upon and pledge of the revenues under the respective bond ordinances. Other Non-major Governmental Funds: This is the aggregate of all of the non-major governmental funds.
Proprietary Funds. These funds report transactions related to activities similar to those found in the private sector. Major proprietary funds include:
The Solid Waste Disposal Fund accounts for the collection, recycling, and disposal of commercial and residential garbage services throughout the City, including the operation of three municipally owned landfill sites, two of which are closed. The City Venues Fund accounts for events held at EverBank Field, Veterans Memorial Arena, the Baseball Stadium, Times Union Center for the Performing Arts, Prime Osborn Convention Center, and Ritz Theater. The Storm Water Services Fund accounts for the storm water utility financed by service charges, to be used for paying for costs of constructing and maintaining the storm water management system.
-64-
CITY OF JACKSONVILLE, FLORIDA NOTES TO FINANCIAL STATEMENTS FOR THE FISCAL YEAR ENDED SEPTEMBER 30, 2017
1. SUMMARY OF SIGNIFICANT ACCOUNTING POLICIES (continued) D. Fund Structure: (continued)
Other Non-major Enterprise - This is the aggregate of all of the non-major enterprise funds.
Proprietary funds distinguish operating revenues and expenses from non-operating revenues and expenses. Operating revenues and expenses generally result from providing services and producing and delivering goods in connection with the funds' principal ongoing operation. The principal operating revenues for the City's proprietary funds are charges to customers for sales and services. Operating expenses include direct expenses of providing the goods or services, administrative expenses, and depreciation on capital assets. All revenues and expenses not meeting this definition are reported as non-operating revenues and expenses.
In addition, the City reports the following fund types:
Internal Service Funds - These funds account for services provided primarily to various departments of the City and to other governmental agencies. Since these funds principally service City departments, internal service fund statements are consolidated into the governmental activities column in the citywide presentation. These activities are fleet management, copy center, information technologies, legal, risk management activities, group health, public works, and the internal debt management fund. Services provided to other governmental agencies are not considered to be material.
Private-purpose Trust Funds - These funds account for resources legally held in trust for the benefit of individuals pursuing higher education in music and urban studies. Earnings on invested resources may be used to support these activities but no expenditure may be made from the principal of these funds.
Pension Trust Funds - These funds account for the activities of the Jacksonville Retirement System and the Police and Fire Pension funds, which accumulate resources for pension benefit payments for qualified employees.
Permanent Fund - This fund is used to account for activities of the City relative to cemetery maintenance at specified locations. Fund resources are restricted. Only earnings on invested resources may be used to support these activities.
Agency Funds - These custodial funds account for monies held as an agent for other governmental units or individuals. The City utilizes several agency funds including the Treasurer Fund to clear cash received and disbursed, the Tax Collector Fund accounts for the collection of all taxes, revenues and other cash, the Clerk of the Circuit Court Fund accounts for revenues collected by the court system, the Plat Deposits Fund accounts for collateral to insure the completion of public improvements, the Duval County School Readiness Coalition Fund accounts for similar collections, the Florida Retirement System Fund accounts for a multiple-employer, cost-sharing defined benefit plan for certain City employees who elected to remain with the State of Florida Retirement System, and the Sheriffs Fund accounts for deposits held in accordance with statutes for civil action, safeguarding of monetary evidence, and inmate funds.
-65-
CITY OF JACKSONVILLE, FLORIDA NOTES TO FINANCIAL STATEMENTS FOR THE FISCAL YEAR ENDED SEPTEMBER 30, 2017
1. SUMMARY OF SIGNIFICANT ACCOUNTING POLICIES (continued) E. Basis of Accounting:
The accounting and financial reporting treatment applied to a fund is determined by its measurement focus. The citywide financial statements are reported using the economic resources measurement focus and the accrual basis of accounting, as are the proprietary and fiduciary pension trust fund financial statements. Agency funds are accounted for using the full accrual basis of accounting. Agency funds are custodial in nature (i.e., assets equal liabilities) and do not measure the results of operations. Under this method, revenues are recorded when earned and expenses are recorded when a liability is incurred, regardless of the timing of the related cash flows. Property taxes are recognized as revenue in the year in which they are levied for. Grants and similar items are recognized as revenue when all eligibility requirements imposed by the provider are met.
Governmental fund financial statements are reported using a current financial resources measurement focus and the modified accrual basis of accounting. With this measurement focus only current assets, current liabilities, deferred outflow of resources, and deferred inflow of resources generally are included on the balance sheet. Operating statements of these funds present increases (i.e., revenues and other financing sources) and decreases (i.e., expenditures and other financing uses) in net current assets.
Under the modified accrual basis of accounting, revenues are recognized when susceptible to accrual (i.e., when they become both measurable and available). "Measurable" means the amount of the transaction can be determined and "available" means collectible within the current period or soon enough thereafter to be used to pay liabilities of the current period. Major revenues that are determined to be susceptible to accrual include property taxes, taxpayer-assessed tax revenues including sales and utilities services taxes, state shared revenue, intergovernmental revenue, charges for services and investment income. Generally, the City considers a 60-day availability period for revenue recognition. Federal and state grants collected on a reimbursement basis are recognized as revenue when reimbursable expenditures are made, and the City considers amounts received within one year as available. Ambulance billings also have a one year availability period.
Expenditures are recorded when the related fund liability is incurred, except for items that are not planned to be liquidated with expendable available resources. The City records an accrual for debt service liabilities and expenditures by providing financial resources to a debt service fund for payment of liabilities that will mature early in the following year. Exceptions to the general modified accrual expenditure recognition criteria include capital lease obligations that are recognized when paid, and payments for compensated absences, pension, OPEB (other post-employment benefits), pollution remediation obligations, and claims and judgments that are recognized when due.
The City's policy is to use restricted resources first, then unrestricted resources, when both are available for use to fund an activity.
-66-
CITY OF JACKSONVILLE, FLORIDA NOTES TO FINANCIAL STATEMENTS FOR THE FISCAL YEAR ENDED SEPTEMBER 30, 2017
1. SUMMARY OF SIGNIFICANT ACCOUNTING POLICIES (continued) F. Cash, Cash Equivalents, and Investments:
Cash, cash equivalents and investments and related accrued investment earnings are reported in the financial statements as “Equity in cash and investments” under the City’s “pooling” concept (See Note 3). All monies, which are not legally restricted to separate administration, are pooled together for investment purposes while each individual fund and/or account is maintained on a daily transaction basis by the City Treasurer. Cash in escrow with fiscal agents is not included in the Statement of Cash Flows ending balances as the funds have been sent to trustee entities to be held for payment of bond principal and interest. Investment earnings are distributed in accordance with the participating funds’ relative percentage of investments. All fund types deposit monies into the equity in cash and investment pool of the City. The Proprietary Fund types use this pool as a demand deposit account, and accordingly all amounts in the pool are considered cash and cash equivalents for purposes of the Statement of Cash Flows. Operating and Pension Trust investments are stated at fair value, generally based on quoted market prices except as disclosed herein. Securities, traded on national or international exchanges are valued at the last reported sales price at current exchange rates. The fair value of real estate investments are based on independent appraisals or estimates of fair value as provided by third party fund managers. Investments that do not have an established market are reported at estimated fair value as provided by third party fund managers. Increases and decreases in the fair value of investments are reported as investment income. The City of Jacksonville’s swap policy allows for the use of interest rate swaps and other financial instruments to manage the City’s financial exposure. This policy went into effect on October 1, 2003 and was revised on August 9, 2011. While the City is authorized to utilize interest rate swaps to manage the interest rate risk associated with various assets, no investment interest rate swaps were used during the reporting period.
G. Receivables: Receivables are stated net of estimated allowances for uncollectible amounts, which are determined based on past collection experience and current economic conditions, to the net realizable values. Types of receivables include amounts that are principally due from the State of Florida for state-shared revenues, mortgage, loan, and other receivables that have arisen in the ordinary course of business. Certain receivables and some mortgage receivables are related to loans made for economic development purposes. Repayment of these loans is contingent upon a number of economic factors that are outside of the control of the City. Due to the uncertainty over the ultimate collectability of these amounts, an allowance has been recorded in the amount equal to the balance of the receivable.
H. Inventories:
Inventories of materials and supplies are determined by both physical counts and through perpetual inventory systems stated at cost, which approximates market, using the average weighted costing method. Reported inventories in governmental funds are included within nonspendable fund balance because it is not in spendable form. In proprietary fund types, inventories are expended when consumed.
-67-
CITY OF JACKSONVILLE, FLORIDA NOTES TO FINANCIAL STATEMENTS FOR THE FISCAL YEAR ENDED SEPTEMBER 30, 2017
1. SUMMARY OF SIGNIFICANT ACCOUNTING POLICIES (continued)
I. Capital Assets: All purchased capital assets are recorded at cost when historical records are available and at estimated cost when no historical records exist. Donated capital assets are valued at their acquisition value on the date received. Generally, capital assets costing $1,000 or more and having a useful life of more than one year are capitalized. Infrastructure is capitalized based on the accumulated amounts charged to specific capital projects on an annual basis. The costs of normal maintenance and repairs that do not add to the value of the asset or materially extend asset lives are not capitalized. Capital assets are reported in the applicable governmental or business-type column in the citywide financial statements, and in the Proprietary Fund Level Statements. Depreciation on all capital assets is calculated using the straight line method over the following useful lives:
Infrastructure - Other 12 - 50 years Infrastructure - Bridges 100 years
Buildings and improvements 12 - 45 years Furniture, equipment and library books 3 - 10 years Software Development 10 years
The City capitalizes collections, such as artwork. The City has a collection of artwork in various sites throughout the interior and exterior of its public facilities. The value of the art is expected to either remain the same or increase over time, so it is not depreciated. Software development is capitalized if over a threshold of $30,000.
J. Contributions: Contributions in the form of cash and capital assets to the governmental activities of the City are recognized on the Statement of Activities as revenues in the period they are received. Contributions of capital assets, primarily completed infrastructure from developers, are recognized at the fair value at the date of donation. All contributions are reported on the Statement of Activities as program revenues, with operating contributions reported separately from capital contributions.
K. Interfund Activity:
Interfund activity within and among the City’s three fund categories (governmental, proprietary, and fiduciary) are classified as reciprocal interfund activity and nonreciprocal interfund activity. Reciprocal interfund resources flow between funds with an expectation of repayment and are reported as interfund receivable and payables.
Nonreciprocal interfund activities are flows of assets between funds without an equivalent flow of assets in return or without a requirement for repayment and are reported as transfers in governmental funds in the other financing sources section as well as after the non-operating revenues and expenses section in proprietary funds.
-68-
CITY OF JACKSONVILLE, FLORIDA NOTES TO FINANCIAL STATEMENTS FOR THE FISCAL YEAR ENDED SEPTEMBER 30, 2017
1. SUMMARY OF SIGNIFICANT ACCOUNTING POLICIES (continued) L. Restricted Assets:
Assets are reported as restricted in the Citywide Statement of Net Position and the enterprise fund level statements when constraints are placed on net position use. The constraints are either: (1) externally imposed by creditors, grantors, contributors, or laws or regulations of other governments; or (2) imposed by law or through constitutional provisions or enabling legislation.
M. Compensated Absences:
City employees may accumulate earned personal leave benefits (compensated absences) at various rates within limits specified in collective bargaining agreements. This liability reflects amounts attributable to employee services already rendered, cumulative, probable for payment, and reasonably estimated in conformity with GASB Statement No. 16, Accounting for Compensated Absences. Compensated absences liabilities are accrued when incurred in the citywide financial statements, and the proprietary and fiduciary fund level financial statements. No expenditure is reported in the governmental funds for these amounts until the payment is made. No liability is recorded for nonvesting, accumulated sick pay benefits. Compensated absences liability is determined based on current rates of pay.
N. Risk Financing: Pursuant to Florida Statute 768.28 “Sovereign Immunity” the City is self-insured for general and automobile liability for state tort claims in excess of $200,000 per person, and $300,000 per occurrence. The City has a package excess liability policy, which provides coverage for general liability at limits of $5 million per occurrence with a policy aggregate limit of $5 million and $1 million per occurrence for Automobile Liability. These limits are subject to a $1.5 million self-insured retention for the City and all other participating entities. The City continues to purchase a miscellaneous policy for Out-of State Automobile Liability for JSO and JFRD with $1 million in coverage, without a self-insured retention, for those instances where JSO or JFRD must cross state lines. The City has an excess worker’s compensation policy with a self-insured retention of $1.5 million per occurrence and includes unlimited statutory coverage for worker’s compensation benefits, except a $50 million aggregate limit for communicable disease and a $1 million limit for employer’s liability. The liability for self-insured losses is based on individual case estimates for reported claims, historical loss data and valuations performed by independent actuaries as of September 30, 2017, for incurred but not yet reported claims, claims development, and unallocated loss adjustment expenses. The liability for self-insured losses is accounted for in the Self-Insurance Fund (internal service fund) that pays for claims made against the City.
-69-
CITY OF JACKSONVILLE, FLORIDA NOTES TO FINANCIAL STATEMENTS FOR THE FISCAL YEAR ENDED SEPTEMBER 30, 2017
1. SUMMARY OF SIGNIFICANT ACCOUNTING POLICIES (continued) N. Risk Financing: (continued)
Effective January 1, 2015 the City elected to move from a fully insured plan to a self-funded arrangement for its group health coverage. The City obtained stop-loss insurance with a $550,000 specific deductible. For 2017 the deductible was increased to $600,000. Once a claim exceeds this threshold, the City is reimbursed for any excess expenses. The plan is funded by contributions from the City and employees. These funds reside in an internal service fund which is used exclusively for Employee Benefits. Florida statutes require a safe harbor threshold to be maintained in plan reserves. See Note 12 for additional risk financing disclosure.
O. Pension Costs: Substantially all permanent, full-time employees of the City are covered under two city
sponsored defined benefit pension plans and a city sponsored defined contribution plan. For purposes of measuring the net pension liability, deferred outflows of resources and deferred inflows of resources related to pensions, pension expense and fiduciary net position; the City and the Pension plans use the same basis for reporting as outlined in the notes to the financial statements. Employer contributions made subsequent to the measurement date and before the fiscal year end are recorded as deferred outflow of resources. Investments are reported at fair value.
P. Landfill Closure and Postclosure Care Costs: The City recognizes municipal solid waste landfill closure and postclosure care costs under the State of Florida's Solid Waste Management Act of 1988, regulations of the Federal Environmental Protection Agency (EPA), and GASB Statement No. 62, Codification of Accounting and Financial Reporting Guidance contained in pre-November 30, 1989 FASB and AICPA pronouncements. For those landfills that stopped accepting solid waste prior to final implementation of the 1988 Act and EPA regulations, the total cost of municipal solid waste landfill (MSWLF) closure is recognized as a prepaid expense in the Solid Waste Disposal Enterprise Fund. The City issued bonds to pay for closure costs on closed landfills. Post-closure care costs on closed landfills are recorded as a liability based on engineer’s estimates. The City Council establishes rates that are designed to recover costs and believes it is reasonable to assume that such rates, which will recover the costs, can be charged to and collected from customers. The City intends to recover these MSWLF costs through future operating revenues of the Solid Waste Disposal Enterprise Fund. Accordingly, MSWLF costs are recognized as expenses each year to match the flow of revenue and bonds principal payments, thereby reducing the deferred charge. Expenses for closure and postclosure care costs are recorded each year and the liability is adjusted to the engineer’s estimate. MSWLF closure and postclosure care costs incurred for landfills accepting solid waste after final implementation of the 1988 Act and EPA regulations are recognized as an expense. A liability is recorded based upon the landfill capacity used during that year applied to the engineer’s estimate of closure and postclosure care costs. (See Note 13C.)
-70-
CITY OF JACKSONVILLE, FLORIDA NOTES TO FINANCIAL STATEMENTS FOR THE FISCAL YEAR ENDED SEPTEMBER 30, 2017
1. SUMMARY OF SIGNIFICANT ACCOUNTING POLICIES (continued) Q. Long-Term Obligations:
In the city-wide financial statements, and proprietary funds in the fund financial statements, long-term debt and other long-term obligations are reported as liabilities in the applicable governmental activities, business-type activities, or proprietary funds statement of net position.
Special obligation bonds, which are supported by certain pledged revenues (other than ad valorem taxes), do not constitute a debt of the City and the City is not obligated to pay the bonds except from revenues pledged for such debt payments.
Each governmental fund that has long-term liabilities, such as, compensated absences and pension liabilities are responsible for liquidating the same. Non Asset Bonds are created when the City issues debt and either (a) constructs an asset which will become the asset of another entity (e.g. State of Florida), (b) contributes proceeds to another entity (e.g. Shands Jacksonville Hospital) to participate in a construction project, or (c) provides an economic incentive to a development or redevelopment project. Part of the Better Jacksonville Plan (BJP) referendum was to make improvements to state roads and/or interchanges with/between state roads. While these projects enhance traffic movements in and around Jacksonville, the constructed assets and the future maintenance responsibility are transferred to the Florida Department of Transportation. Additionally, under the BJP program, the City provided for non-capital expenditures, such as septic tank remediation and ash clean up, from debt proceeds, which will not result in a capital asset of the City. The City has also provided grants to Shands Jacksonville Hospital, a provider of health care for indigents, from debt proceeds. The City and/or its Community Redevelopment Authority (CRA) districts, to encourage target development, will enter into incentive agreements (including grants and loans) which are, in some instances, designed to be repaid by either the CRA’s tax increment revenues and/or the developer.
R. Categories and Classification of Fund Balance: Fund balance is classified using a hierarchy based primarily on the extent to which a government is bound to observe constraints imposed upon the use of the resources reported in governmental funds. Under GASB 54, fund balance categories include Nonspendable, Restricted, Committed, Assigned, and Unassigned. These classifications reflect not only the nature of funds, but also provide clarity to the level of constraint placed upon fund balance. Fund balance can have different levels of restraint, such as external versus internal compliance requirements. Unassigned fund balance is a residual classification within the General Fund. The General Fund should be the only fund that reports a positive unassigned balance. In all other funds, unassigned is limited to negative residual fund balance. For further details of the various fund balance classifications refer to Note 19.
-71-
CITY OF JACKSONVILLE, FLORIDA NOTES TO FINANCIAL STATEMENTS FOR THE FISCAL YEAR ENDED SEPTEMBER 30, 2017
1. SUMMARY OF SIGNIFICANT ACCOUNTING POLICIES (continued) S. Bond Discounts, Premiums and Issuance Costs:
In the fund financial statements, governmental funds recognize bond discounts, premiums and issuance costs in the current period. The face amount of debt issued and bond premiums are reported as other financing sources while discounts on debt issuance is reported as other financing uses. Issuance costs, whether or not withheld from the debt proceeds received, are reported as debt service expenditures.
In the city-wide financial statements and for proprietary funds, material bond discounts and/or premiums are deferred and amortized as a component of interest expense over the term of the bonds using the straight-line method, which approximates the effective interest method. Issuance costs are expensed in the period in which they are incurred.
T. Deferred Loss on Debt Refundings: Losses resulting from advance refundings of debt in the city-wide and proprietary fund statements are deferred and amortized, using a straight-line method, which approximates the effective interest method, over the shorter of the life of the new debt or the remaining life of the old debt. The amount deferred is reported as a component of Deferred Outflows in the accompanying financial statements and is expensed and reported as a component of interest expense.
U. Use of Estimates: The preparation of financial statements, in accordance with GAAP, requires management to make estimates and assumptions that affect the reported amounts of assets and liabilities and disclosure of contingent assets and liabilities at the date of the financial statements, and the reported amount of revenues and expenses during the reporting period. Actual results could differ from those estimates.
V. Reclassifications: Certain 2016 amounts have been reclassified to conform to the 2017 presentation. Additionally, amounts in the separately issued financial statements of component units have been reclassified to conform to the presentation of the primary government.
W. Summarized Comparative Information:
The basic financial statements include certain prior-year summarized comparative information in total but not at the level of detail required for a presentation in conformity with generally accepted accounting principles. Accordingly, such information should be read in conjunction with the City’s financial statements for the year ended September 30, 2016, from which the summarized information was derived. Limited 2016 comparative information was adjusted for comparability on some of the financial statements.
-72-
CITY OF JACKSONVILLE, FLORIDA NOTES TO FINANCIAL STATEMENTS FOR THE FISCAL YEAR ENDED SEPTEMBER 30, 2017
1. SUMMARY OF SIGNIFICANT ACCOUNTING POLICIES (continued) X. Prepaids:
Prepaid items consist of certain costs that have been paid prior to the end of the fiscal year, but represent items that are applicable to future accounting periods. These amounts do not constitute available spendable resources even though they are a component of current assets. Prepaids are processed using the consumption method.
Y. Accounting Pronouncements: In fiscal year 2017, the City adopted new statement of financial accounting standards issued by the GASB:
• GASB Statement No. 77, Tax Abatement Disclosures • GASB Statement No. 82, Pension Issues – certain amendments of GASB Statements
67, 68, and 73 GASB Statement No. 77 provides users of financial statements additional information about tax abatements to better assess related effects on revenue sufficiency for the period, related legal and contractual obligations, the use of financial resources, and the net position and economic condition over time. (see Note 15H) GASB 82 addresses certain issues in pension reporting related to payroll measures in the required supplementary information, selection of assumptions, and classification of employer-paid contributions. The Governmental Accounting Standards Board has issued statements that will become effective in 2018. The statements address:
• Accounting and Financial Reporting for Postemployment Benefits Other Than Pensions (OPEB);
• Irrevocable Split-Interest Agreements; • Omnibus 2017 – to address various practice issues identified in the implementation or
application of other GASB Statements • Certain Debt Extinguishment issues
The City is currently evaluating the effects that these statements will have on its 2018 financial statements.
2. BUDGETARY DATA The City presents a Budgetary Comparison Schedule for the General Fund as Required Supplementary Information. For this reporting period, no special revenue funds met the major fund criteria. The City’s budgetary comparison reporting and Notes to Required Supplementary Information containing descriptions of the City’s budgetary policies and processes are included in the Required Supplementary Information section of this report.
(The remainder of this page is intentionally left blank)
-73-
CITY OF JACKSONVILLE, FLORIDA NOTES TO FINANCIAL STATEMENTS FOR THE FISCAL YEAR ENDED SEPTEMBER 30, 2017
3. CASH, INVESTMENTS AND SECURITIES LENDING A. Cash on Deposit
The City maintains a cash and investment pool that is available for use by all funds except for monies legally restricted to separate administration (i.e. pension plan custodians and deferred compensation plan administrators). The “Equity in cash and investments” on the City Wide Financial Statements, consists of cash and investments owned by each fund and defined as resources that can be liquidated without delay or penalty. Cash and investments held separately where contractual arrangements and bond covenants require such arrangements, are classified as “restricted assets.” Investment earnings are allocated to the individual funds monthly based on the funds’ weighted average daily cash and investment balance. At September 30, 2017, primary government deposits in financial institutions totaled $174.2 million. Monies on deposit with financial institutions in the form of demand deposit accounts, time deposit accounts and certificates of deposit are defined as public deposits. All of the City’s public deposits are held in qualified public depositories pursuant to State of Florida Statutes, Chapter 280, “Florida Security for Public Deposits Act”, and covered by federal depository insurance. For amounts in excess of such federal depository insurance the Act provides that all qualified public depositories are required to pledge eligible collateral having a market value equal to or greater than the average daily or monthly balance of all public deposits, times the depository’s collateral pledging level. The pledging level may range from 50% to 125% depending upon the depository’s financial condition and establishment period. The Public Deposit Security Trust Fund has a procedure to allocate and recover losses in the event of a default or insolvency. When public deposits are made in accordance with Chapter 280, no public depositor is liable for any loss thereof. Any losses to public depositors are covered by applicable deposit insurance, sales of securities pledged as collateral and, if necessary, assessments against other qualified public depositories of the same type as the depository in default.
B. Investments and Investment Practices
1. a. General Operating Investments The City’s operating fund investment guidelines are defined by City Ordinance Code Section 110, Part 2 and a written Investment Policy (the “Policy”) as approved by City Council. The Policy establishes a diversified investment strategy, both by type of investment and by manager, a minimum credit quality, and duration limitations. An internal Investment Committee has oversight, within Policy limits, of the implementation and direction of investment strategies. The Policy is reviewed annually for any adjustments due to changes or developments within the investment markets that may provide enhanced investment and/or risk management opportunities. The City’s Pension Funds and Component units maintain their own investment policies.
-74-
CITY OF JACKSONVILLE, FLORIDA NOTES TO FINANCIAL STATEMENTS FOR THE FISCAL YEAR ENDED SEPTEMBER 30, 2017
3. CASH, INVESTMENTS AND SECURITIES LENDING (continued) B. Investments and Investment Practices (continued)
1. a. General Operating Investments (continued) Other than operating cash invested overnight through the City’s zero balance sweep accounts, all invested cash is managed by third-party money managers. Performance benchmarks for the Portfolio are established in the Investment Policy and performance benchmarks for each of the specific third party managers are established by the Investment Committee. The Policy defines the Average Duration and Compliance Categories for investments. Compliance Category limits are stated as a percentage of the Fiscal Year 2016 Normal Portfolio Balance of $897 million, which is defined by Ordinance as the average total portfolio balance for the proceeding twelve months. Performance and compliance reports are prepared for the Investment Committee monthly. The City employs an independent investment custodian who takes direction from the money managers and independently settles all trades. The custodian provides performance and compliance reporting at both the portfolio level and by individual manager. The following schedule reports portfolio compliance at year end, as well as the maximum exposure for each compliance category during the year. Certain compliance categories include assets also measured in another compliance category, i.e. “US Government” issued treasury bonds are also appropriately included in the “US Government plus agencies” category. As a result, the amounts reported as year-end compliance exposures exceed the portfolio balance at year end in aggregate.
(The remainder of this page is intentionally left blank)
-75-
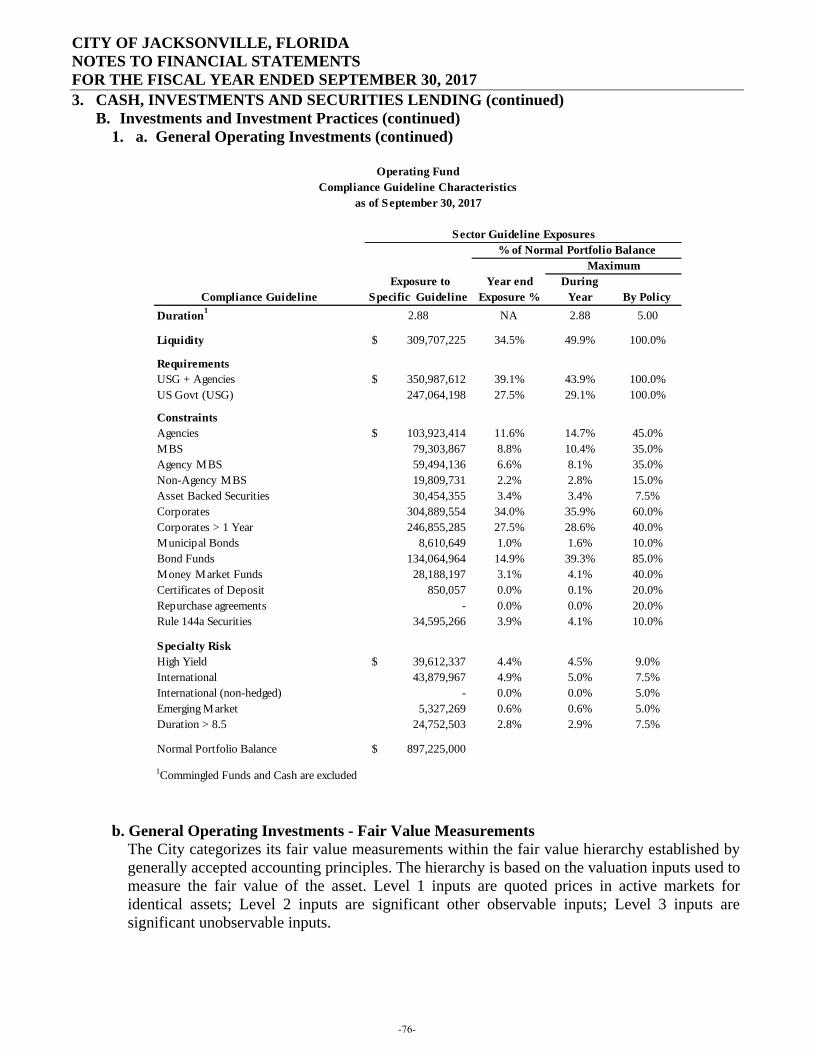
CITY OF JACKSONVILLE, FLORIDA NOTES TO FINANCIAL STATEMENTS FOR THE FISCAL YEAR ENDED SEPTEMBER 30, 2017
3. CASH, INVESTMENTS AND SECURITIES LENDING (continued) B. Investments and Investment Practices (continued)
1. a. General Operating Investments (continued)
b. General Operating Investments - Fair Value Measurements The City categorizes its fair value measurements within the fair value hierarchy established by generally accepted accounting principles. The hierarchy is based on the valuation inputs used to measure the fair value of the asset. Level 1 inputs are quoted prices in active markets for identical assets; Level 2 inputs are significant other observable inputs; Level 3 inputs are significant unobservable inputs.
Compliance Guideline Exposure to
Specific Guideline Year end
Exposure % During
Year By PolicyDuration1 2.88 NA 2.88 5.00
Liquidity 309,707,225$ 34.5% 49.9% 100.0%
RequirementsUSG + Agencies 350,987,612$ 39.1% 43.9% 100.0%US Govt (USG) 247,064,198 27.5% 29.1% 100.0%
ConstraintsAgencies 103,923,414$ 11.6% 14.7% 45.0%MBS 79,303,867 8.8% 10.4% 35.0%Agency MBS 59,494,136 6.6% 8.1% 35.0%Non-Agency MBS 19,809,731 2.2% 2.8% 15.0%Asset Backed Securities 30,454,355 3.4% 3.4% 7.5%Corporates 304,889,554 34.0% 35.9% 60.0%Corporates > 1 Year 246,855,285 27.5% 28.6% 40.0%Municipal Bonds 8,610,649 1.0% 1.6% 10.0%Bond Funds 134,064,964 14.9% 39.3% 85.0%Money Market Funds 28,188,197 3.1% 4.1% 40.0%Certificates of Deposit 850,057 0.0% 0.1% 20.0%Repurchase agreements - 0.0% 0.0% 20.0%Rule 144a Securities 34,595,266 3.9% 4.1% 10.0%
Specialty RiskHigh Yield 39,612,337$ 4.4% 4.5% 9.0%International 43,879,967 4.9% 5.0% 7.5%International (non-hedged) - 0.0% 0.0% 5.0%Emerging Market 5,327,269 0.6% 0.6% 5.0%Duration > 8.5 24,752,503 2.8% 2.9% 7.5%
Normal Portfolio Balance 897,225,000$
1Commingled Funds and Cash are excluded
Operating FundCompliance Guideline Characteristics
as of September 30, 2017
Maximum% of Normal Portfolio Balance
Sector Guideline Exposures
-76-
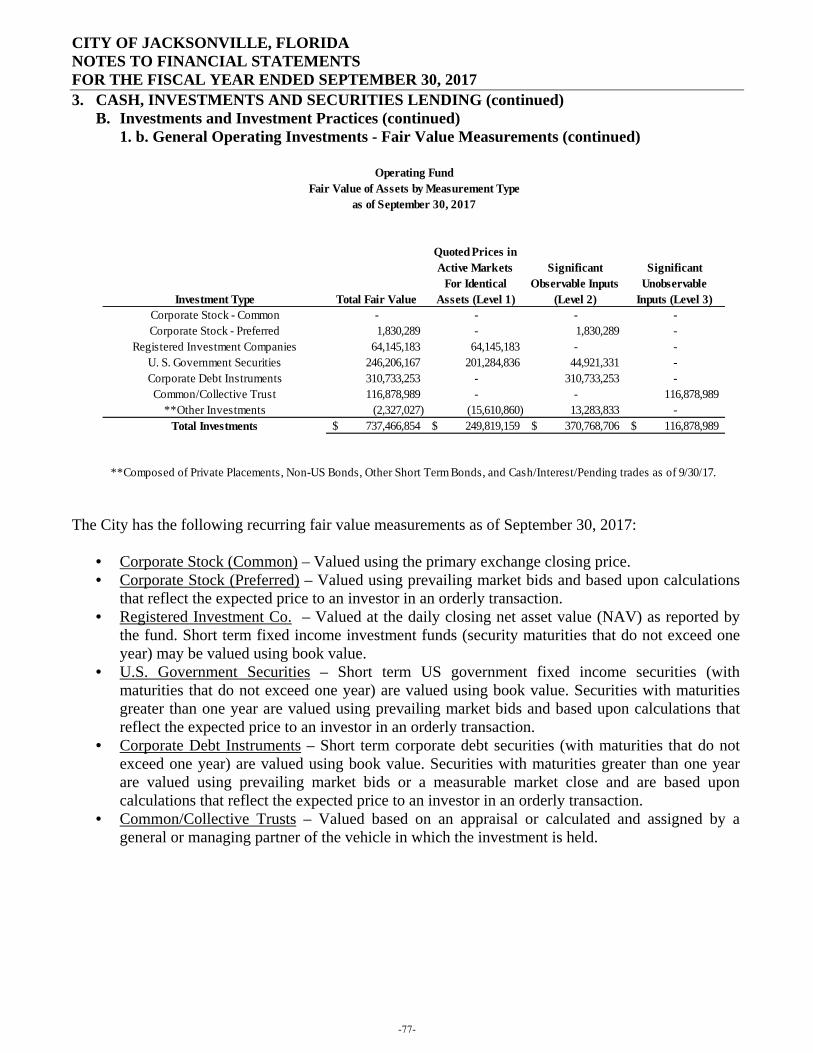
CITY OF JACKSONVILLE, FLORIDA NOTES TO FINANCIAL STATEMENTS FOR THE FISCAL YEAR ENDED SEPTEMBER 30, 2017
3. CASH, INVESTMENTS AND SECURITIES LENDING (continued) B. Investments and Investment Practices (continued)
1. b. General Operating Investments - Fair Value Measurements (continued)
The City has the following recurring fair value measurements as of September 30, 2017:
• Corporate Stock (Common) – Valued using the primary exchange closing price. • Corporate Stock (Preferred) – Valued using prevailing market bids and based upon calculations
that reflect the expected price to an investor in an orderly transaction. • Registered Investment Co. – Valued at the daily closing net asset value (NAV) as reported by
the fund. Short term fixed income investment funds (security maturities that do not exceed one year) may be valued using book value.
• U.S. Government Securities – Short term US government fixed income securities (with maturities that do not exceed one year) are valued using book value. Securities with maturities greater than one year are valued using prevailing market bids and based upon calculations that reflect the expected price to an investor in an orderly transaction.
• Corporate Debt Instruments – Short term corporate debt securities (with maturities that do not exceed one year) are valued using book value. Securities with maturities greater than one year are valued using prevailing market bids or a measurable market close and are based upon calculations that reflect the expected price to an investor in an orderly transaction.
• Common/Collective Trusts – Valued based on an appraisal or calculated and assigned by a general or managing partner of the vehicle in which the investment is held.
Investment Type Total Fair Value
Quoted Prices in Active Markets
For Identical Assets (Level 1)
Significant Observable Inputs
(Level 2)
Significant Unobservable
Inputs (Level 3)Corporate Stock - Common - - - -Corporate Stock - Preferred 1,830,289 - 1,830,289 -
Registered Investment Companies 64,145,183 64,145,183 - -U. S. Government Securities 246,206,167 201,284,836 44,921,331 -Corporate Debt Instruments 310,733,253 - 310,733,253 -Common/Collective Trust 116,878,989 - - 116,878,989
**Other Investments (2,327,027) (15,610,860) 13,283,833 -Total Investments 737,466,854$ 249,819,159$ 370,768,706$ 116,878,989$
**Composed of Private Placements, Non-US Bonds, Other Short Term Bonds, and Cash/Interest/Pending trades as of 9/30/17.
Fair Value of Assets by Measurement Typeas of September 30, 2017
Operating Fund
-77-
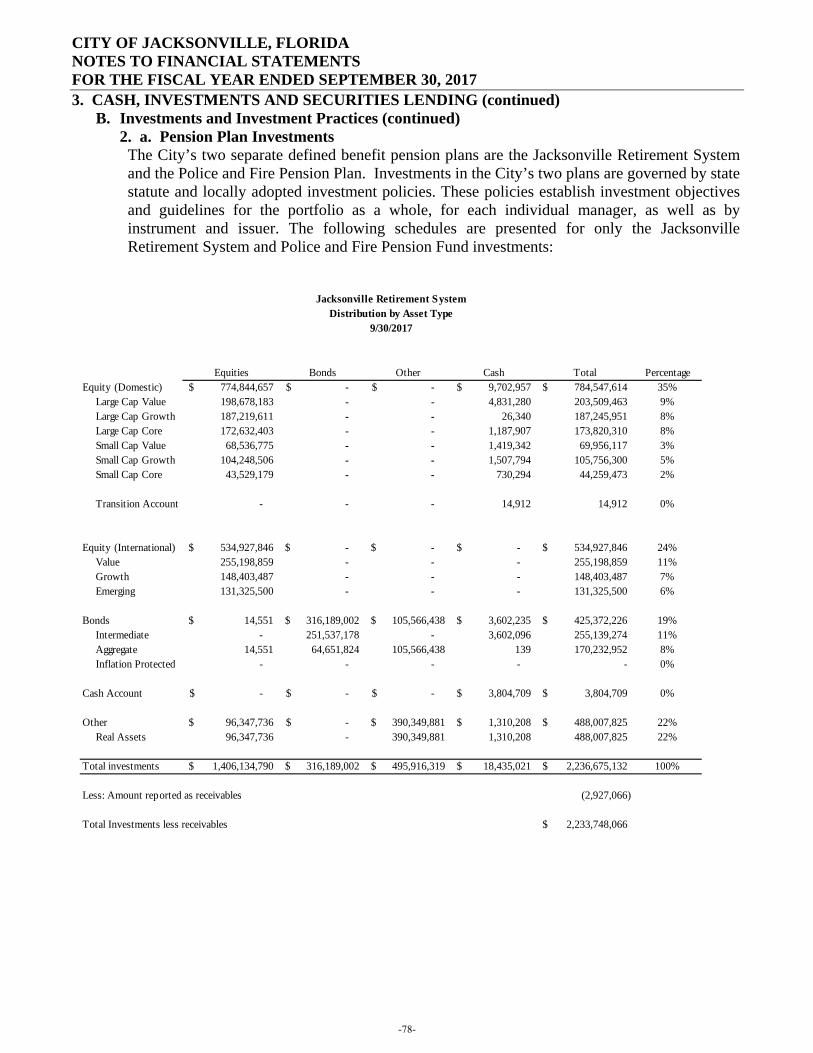
CITY OF JACKSONVILLE, FLORIDA NOTES TO FINANCIAL STATEMENTS FOR THE FISCAL YEAR ENDED SEPTEMBER 30, 2017
3. CASH, INVESTMENTS AND SECURITIES LENDING (continued) B. Investments and Investment Practices (continued)
2. a. Pension Plan Investments The City’s two separate defined benefit pension plans are the Jacksonville Retirement System and the Police and Fire Pension Plan. Investments in the City’s two plans are governed by state statute and locally adopted investment policies. These policies establish investment objectives and guidelines for the portfolio as a whole, for each individual manager, as well as by instrument and issuer. The following schedules are presented for only the Jacksonville Retirement System and Police and Fire Pension Fund investments:
Equities Bonds Other Cash Total PercentageEquity (Domestic) 774,844,657$ -$ -$ 9,702,957$ 784,547,614$ 35% Large Cap Value 198,678,183 - - 4,831,280 203,509,463 9% Large Cap Growth 187,219,611 - - 26,340 187,245,951 8% Large Cap Core 172,632,403 - - 1,187,907 173,820,310 8% Small Cap Value 68,536,775 - - 1,419,342 69,956,117 3% Small Cap Growth 104,248,506 - - 1,507,794 105,756,300 5% Small Cap Core 43,529,179 - - 730,294 44,259,473 2%
Transition Account - - - 14,912 14,912 0%
Equity (International) 534,927,846$ -$ -$ -$ 534,927,846$ 24% Value 255,198,859 - - - 255,198,859 11% Growth 148,403,487 - - - 148,403,487 7% Emerging 131,325,500 - - - 131,325,500 6%
Bonds 14,551$ 316,189,002$ 105,566,438$ 3,602,235$ 425,372,226$ 19% Intermediate - 251,537,178 - 3,602,096 255,139,274 11% Aggregate 14,551 64,651,824 105,566,438 139 170,232,952 8% Inflation Protected - - - - - 0%
Cash Account -$ -$ -$ 3,804,709$ 3,804,709$ 0%
Other 96,347,736$ -$ 390,349,881$ 1,310,208$ 488,007,825$ 22% Real Assets 96,347,736 - 390,349,881 1,310,208 488,007,825 22%
Total investments 1,406,134,790$ 316,189,002$ 495,916,319$ 18,435,021$ 2,236,675,132$ 100%
Less: Amount reported as receivables (2,927,066)
Total Investments less receivables 2,233,748,066$
Jacksonville Retirement SystemDistribution by Asset Type
9/30/2017
-78-
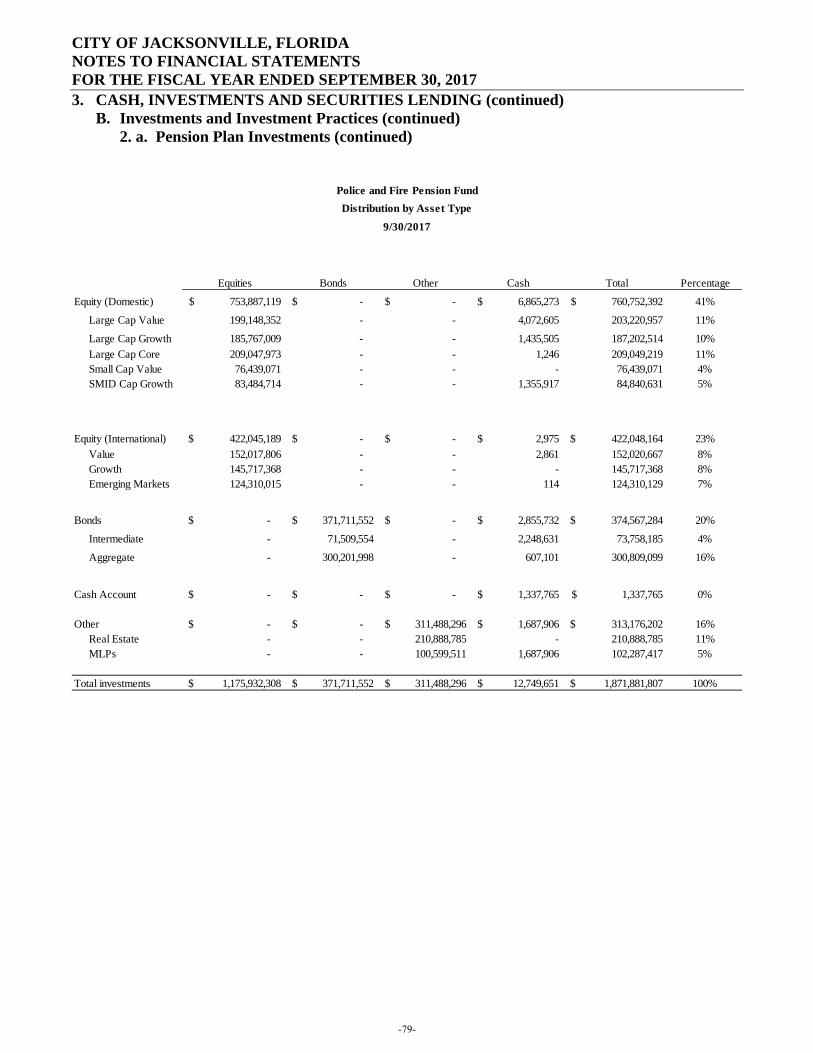
CITY OF JACKSONVILLE, FLORIDA NOTES TO FINANCIAL STATEMENTS FOR THE FISCAL YEAR ENDED SEPTEMBER 30, 2017
3. CASH, INVESTMENTS AND SECURITIES LENDING (continued) B. Investments and Investment Practices (continued)
2. a. Pension Plan Investments (continued)
Equities Bonds Other Cash Total Percentage
Equity (Domestic) 753,887,119$ -$ -$ 6,865,273$ 760,752,392$ 41%
Large Cap Value 199,148,352 - - 4,072,605 203,220,957 11%
Large Cap Growth 185,767,009 - - 1,435,505 187,202,514 10% Large Cap Core 209,047,973 - - 1,246 209,049,219 11% Small Cap Value 76,439,071 - - - 76,439,071 4% SMID Cap Growth 83,484,714 - - 1,355,917 84,840,631 5%
Equity (International) 422,045,189$ -$ -$ 2,975$ 422,048,164$ 23% Value 152,017,806 - - 2,861 152,020,667 8% Growth 145,717,368 - - - 145,717,368 8% Emerging Markets 124,310,015 - - 114 124,310,129 7%
Bonds -$ 371,711,552$ -$ 2,855,732$ 374,567,284$ 20%
Intermediate - 71,509,554 - 2,248,631 73,758,185 4%
Aggregate - 300,201,998 - 607,101 300,809,099 16%
Cash Account -$ -$ -$ 1,337,765$ 1,337,765$ 0%
Other -$ -$ 311,488,296$ 1,687,906$ 313,176,202$ 16% Real Estate - - 210,888,785 - 210,888,785 11% MLPs - - 100,599,511 1,687,906 102,287,417 5%
Total investments 1,175,932,308$ 371,711,552$ 311,488,296$ 12,749,651$ 1,871,881,807$ 100%
9/30/2017
Police and Fire Pension FundDistribution by Asset Type
-79-
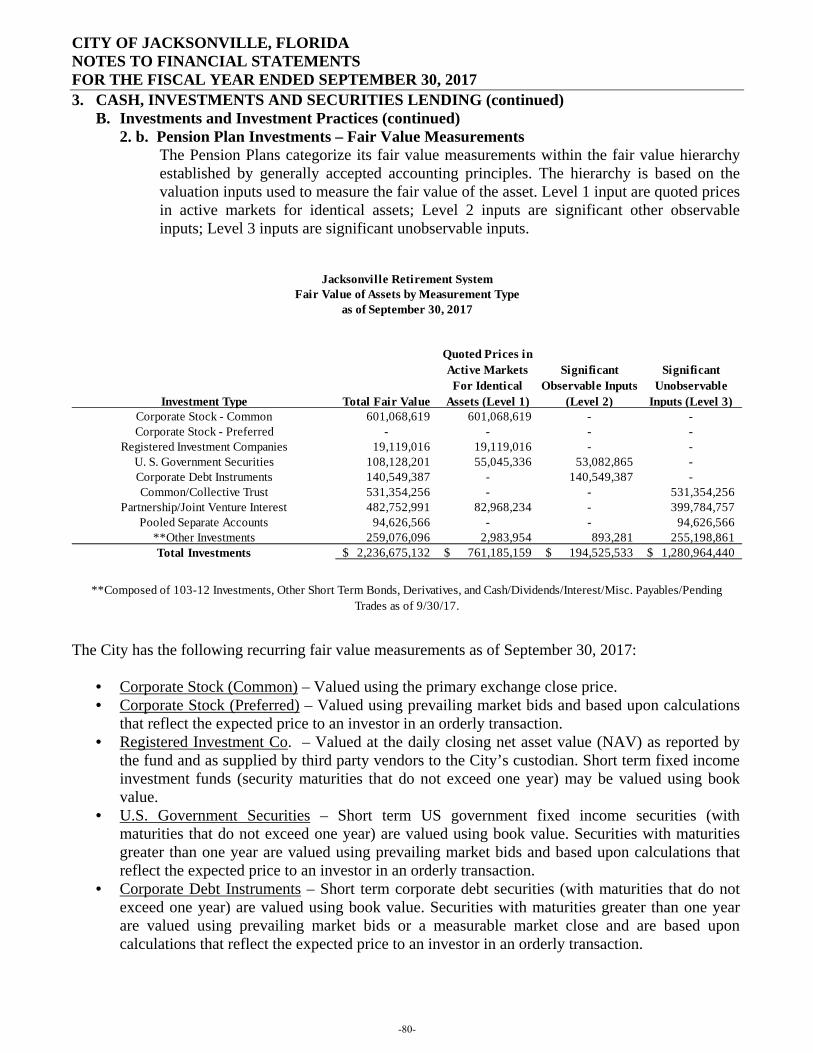
CITY OF JACKSONVILLE, FLORIDA NOTES TO FINANCIAL STATEMENTS FOR THE FISCAL YEAR ENDED SEPTEMBER 30, 2017
3. CASH, INVESTMENTS AND SECURITIES LENDING (continued) B. Investments and Investment Practices (continued)
2. b. Pension Plan Investments – Fair Value Measurements The Pension Plans categorize its fair value measurements within the fair value hierarchy established by generally accepted accounting principles. The hierarchy is based on the valuation inputs used to measure the fair value of the asset. Level 1 input are quoted prices in active markets for identical assets; Level 2 inputs are significant other observable inputs; Level 3 inputs are significant unobservable inputs.
The City has the following recurring fair value measurements as of September 30, 2017:
• Corporate Stock (Common) – Valued using the primary exchange close price. • Corporate Stock (Preferred) – Valued using prevailing market bids and based upon calculations
that reflect the expected price to an investor in an orderly transaction. • Registered Investment Co. – Valued at the daily closing net asset value (NAV) as reported by
the fund and as supplied by third party vendors to the City’s custodian. Short term fixed income investment funds (security maturities that do not exceed one year) may be valued using book value.
• U.S. Government Securities – Short term US government fixed income securities (with maturities that do not exceed one year) are valued using book value. Securities with maturities greater than one year are valued using prevailing market bids and based upon calculations that reflect the expected price to an investor in an orderly transaction.
• Corporate Debt Instruments – Short term corporate debt securities (with maturities that do not exceed one year) are valued using book value. Securities with maturities greater than one year are valued using prevailing market bids or a measurable market close and are based upon calculations that reflect the expected price to an investor in an orderly transaction.
Investment Type Total Fair Value
Quoted Prices in Active Markets For Identical
Assets (Level 1)
Significant Observable Inputs
(Level 2)
Significant Unobservable
Inputs (Level 3)Corporate Stock - Common 601,068,619 601,068,619 - -Corporate Stock - Preferred - - - -
Registered Investment Companies 19,119,016 19,119,016 - -U. S. Government Securities 108,128,201 55,045,336 53,082,865 -Corporate Debt Instruments 140,549,387 - 140,549,387 -Common/Collective Trust 531,354,256 - - 531,354,256
Partnership/Joint Venture Interest 482,752,991 82,968,234 - 399,784,757Pooled Separate Accounts 94,626,566 - - 94,626,566
**Other Investments 259,076,096 2,983,954 893,281 255,198,861Total Investments 2,236,675,132$ 761,185,159$ 194,525,533$ 1,280,964,440$
Jacksonville Retirement SystemFair Value of Assets by Measurement Type
as of September 30, 2017
**Composed of 103-12 Investments, Other Short Term Bonds, Derivatives, and Cash/Dividends/Interest/Misc. Payables/Pending Trades as of 9/30/17.
-80-
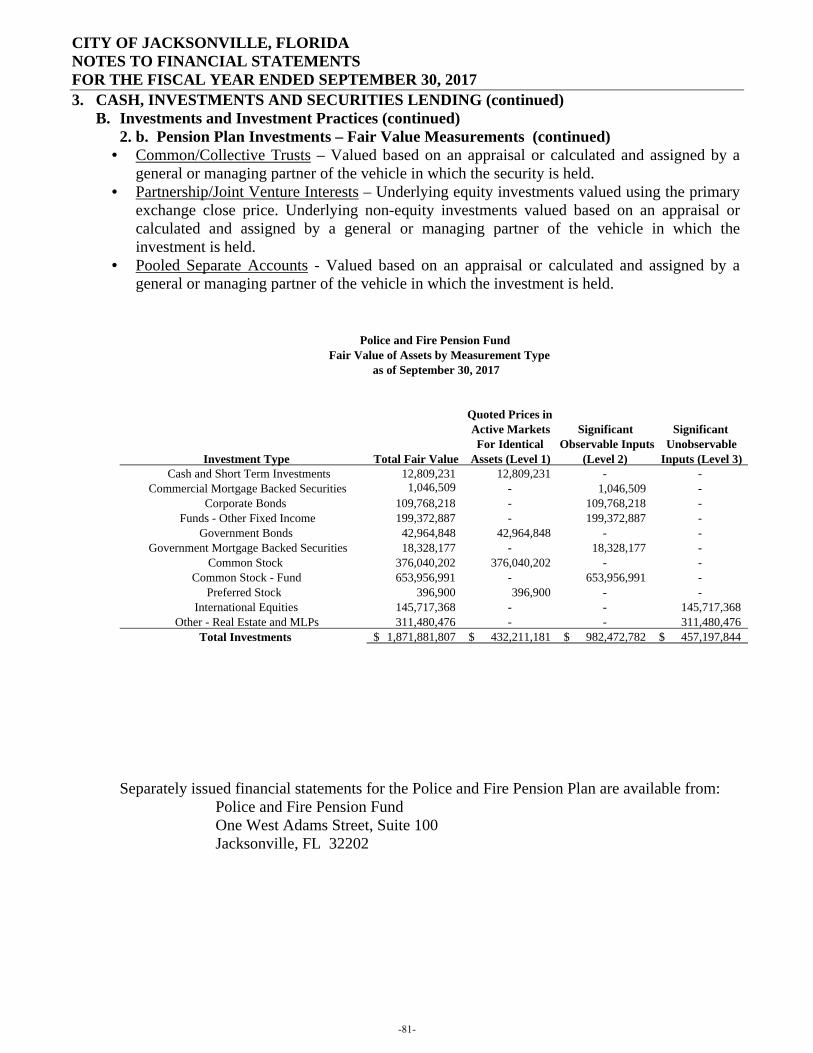
CITY OF JACKSONVILLE, FLORIDA NOTES TO FINANCIAL STATEMENTS FOR THE FISCAL YEAR ENDED SEPTEMBER 30, 2017
3. CASH, INVESTMENTS AND SECURITIES LENDING (continued) B. Investments and Investment Practices (continued)
2. b. Pension Plan Investments – Fair Value Measurements (continued) • Common/Collective Trusts – Valued based on an appraisal or calculated and assigned by a
general or managing partner of the vehicle in which the security is held. • Partnership/Joint Venture Interests – Underlying equity investments valued using the primary
exchange close price. Underlying non-equity investments valued based on an appraisal or calculated and assigned by a general or managing partner of the vehicle in which the investment is held.
• Pooled Separate Accounts - Valued based on an appraisal or calculated and assigned by a general or managing partner of the vehicle in which the investment is held.
Separately issued financial statements for the Police and Fire Pension Plan are available from:
Police and Fire Pension Fund One West Adams Street, Suite 100 Jacksonville, FL 32202
Investment Type Total Fair Value
Quoted Prices in Active Markets For Identical
Assets (Level 1)
Significant Observable Inputs
(Level 2)
Significant Unobservable
Inputs (Level 3)Cash and Short Term Investments 12,809,231 12,809,231 - -
Commercial Mortgage Backed Securities 1,046,509 - 1,046,509 -Corporate Bonds 109,768,218 - 109,768,218 -
Funds - Other Fixed Income 199,372,887 - 199,372,887 -Government Bonds 42,964,848 42,964,848 - -
Government Mortgage Backed Securities 18,328,177 - 18,328,177 -Common Stock 376,040,202 376,040,202 - -
Common Stock - Fund 653,956,991 - 653,956,991 -Preferred Stock 396,900 396,900 - -
International Equities 145,717,368 - - 145,717,368Other - Real Estate and MLPs 311,480,476 - - 311,480,476
Total Investments 1,871,881,807$ 432,211,181$ 982,472,782 $ 457,197,844$
Police and Fire Pension FundFair Value of Assets by Measurement Type
as of September 30, 2017
-81-
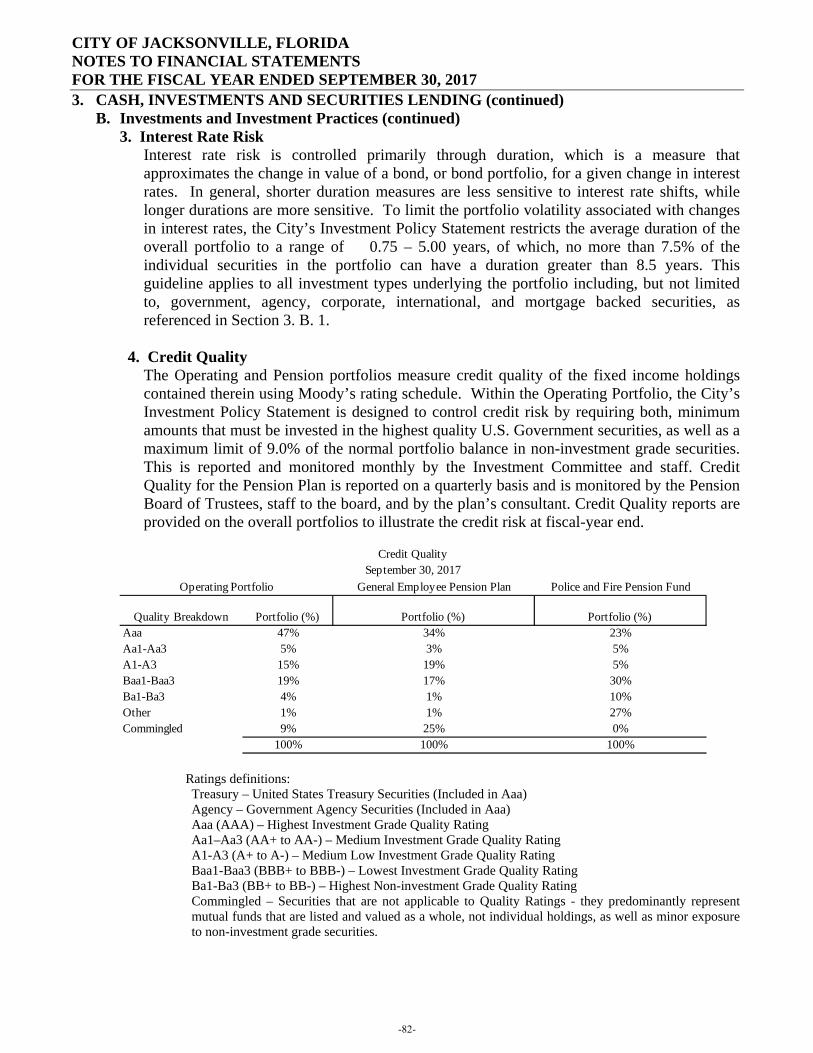
CITY OF JACKSONVILLE, FLORIDA NOTES TO FINANCIAL STATEMENTS FOR THE FISCAL YEAR ENDED SEPTEMBER 30, 2017
3. CASH, INVESTMENTS AND SECURITIES LENDING (continued) B. Investments and Investment Practices (continued)
3. Interest Rate Risk Interest rate risk is controlled primarily through duration, which is a measure that approximates the change in value of a bond, or bond portfolio, for a given change in interest rates. In general, shorter duration measures are less sensitive to interest rate shifts, while longer durations are more sensitive. To limit the portfolio volatility associated with changes in interest rates, the City’s Investment Policy Statement restricts the average duration of the overall portfolio to a range of 0.75 – 5.00 years, of which, no more than 7.5% of the individual securities in the portfolio can have a duration greater than 8.5 years. This guideline applies to all investment types underlying the portfolio including, but not limited to, government, agency, corporate, international, and mortgage backed securities, as referenced in Section 3. B. 1.
4. Credit Quality The Operating and Pension portfolios measure credit quality of the fixed income holdings contained therein using Moody’s rating schedule. Within the Operating Portfolio, the City’s Investment Policy Statement is designed to control credit risk by requiring both, minimum amounts that must be invested in the highest quality U.S. Government securities, as well as a maximum limit of 9.0% of the normal portfolio balance in non-investment grade securities. This is reported and monitored monthly by the Investment Committee and staff. Credit Quality for the Pension Plan is reported on a quarterly basis and is monitored by the Pension Board of Trustees, staff to the board, and by the plan’s consultant. Credit Quality reports are provided on the overall portfolios to illustrate the credit risk at fiscal-year end.
Ratings definitions: Treasury – United States Treasury Securities (Included in Aaa) Agency – Government Agency Securities (Included in Aaa) Aaa (AAA) – Highest Investment Grade Quality Rating Aa1–Aa3 (AA+ to AA-) – Medium Investment Grade Quality Rating A1-A3 (A+ to A-) – Medium Low Investment Grade Quality Rating Baa1-Baa3 (BBB+ to BBB-) – Lowest Investment Grade Quality Rating Ba1-Ba3 (BB+ to BB-) – Highest Non-investment Grade Quality Rating Commingled – Securities that are not applicable to Quality Ratings - they predominantly represent mutual funds that are listed and valued as a whole, not individual holdings, as well as minor exposure to non-investment grade securities.
General Employee Pension Plan Police and Fire Pension Fund
Quality Breakdown Portfolio (%) Portfolio (%) Portfolio (%)Aaa 47% 34% 23%Aa1-Aa3 5% 3% 5%A1-A3 15% 19% 5%Baa1-Baa3 19% 17% 30%Ba1-Ba3 4% 1% 10%Other 1% 1% 27%Commingled 9% 25% 0%
100% 100% 100%
Operating Portfolio
Credit QualitySeptember 30, 2017
-82-
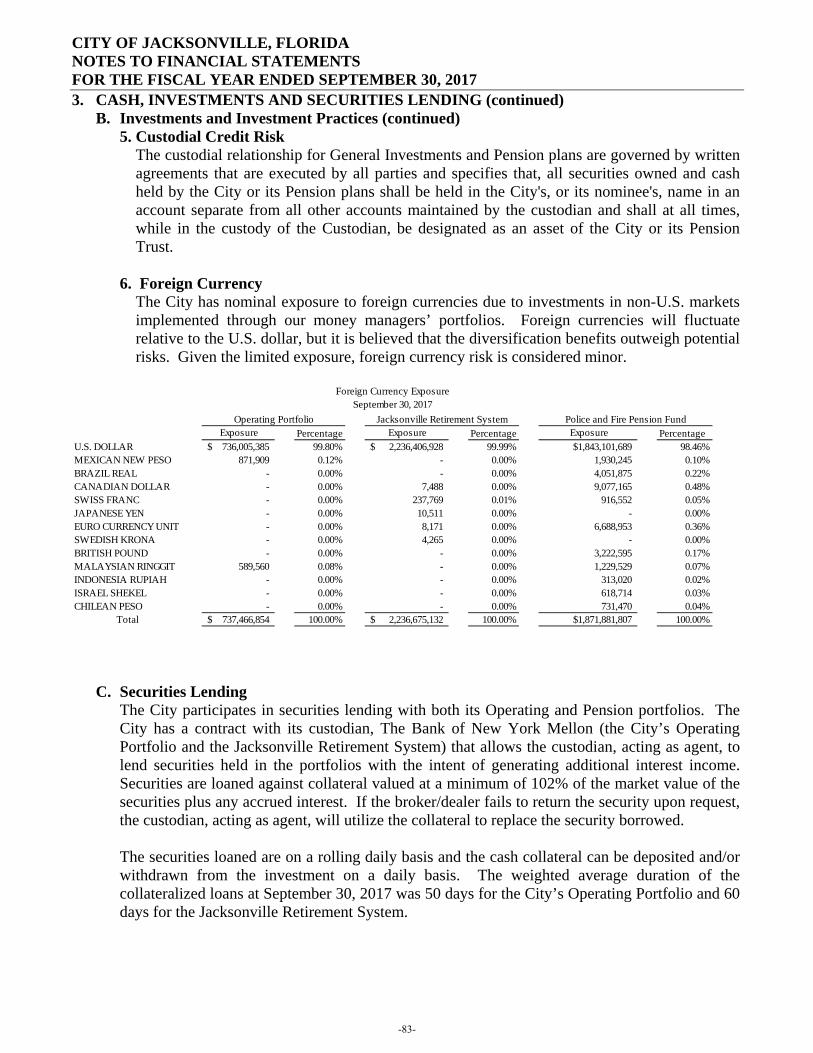
CITY OF JACKSONVILLE, FLORIDA NOTES TO FINANCIAL STATEMENTS FOR THE FISCAL YEAR ENDED SEPTEMBER 30, 2017
3. CASH, INVESTMENTS AND SECURITIES LENDING (continued) B. Investments and Investment Practices (continued)
5. Custodial Credit Risk The custodial relationship for General Investments and Pension plans are governed by written agreements that are executed by all parties and specifies that, all securities owned and cash held by the City or its Pension plans shall be held in the City's, or its nominee's, name in an account separate from all other accounts maintained by the custodian and shall at all times, while in the custody of the Custodian, be designated as an asset of the City or its Pension Trust.
6. Foreign Currency The City has nominal exposure to foreign currencies due to investments in non-U.S. markets implemented through our money managers’ portfolios. Foreign currencies will fluctuate relative to the U.S. dollar, but it is believed that the diversification benefits outweigh potential risks. Given the limited exposure, foreign currency risk is considered minor.
C. Securities Lending The City participates in securities lending with both its Operating and Pension portfolios. The City has a contract with its custodian, The Bank of New York Mellon (the City’s Operating Portfolio and the Jacksonville Retirement System) that allows the custodian, acting as agent, to lend securities held in the portfolios with the intent of generating additional interest income. Securities are loaned against collateral valued at a minimum of 102% of the market value of the securities plus any accrued interest. If the broker/dealer fails to return the security upon request, the custodian, acting as agent, will utilize the collateral to replace the security borrowed. The securities loaned are on a rolling daily basis and the cash collateral can be deposited and/or withdrawn from the investment on a daily basis. The weighted average duration of the collateralized loans at September 30, 2017 was 50 days for the City’s Operating Portfolio and 60 days for the Jacksonville Retirement System.
Exposure Percentage Exposure Percentage Exposure PercentageU.S. DOLLAR 736,005,385$ 99.80% 2,236,406,928$ 99.99% $1,843,101,689 98.46%MEXICAN NEW PESO 871,909 0.12% - 0.00% 1,930,245 0.10%BRAZIL REAL - 0.00% - 0.00% 4,051,875 0.22%CANADIAN DOLLAR - 0.00% 7,488 0.00% 9,077,165 0.48%SWISS FRANC - 0.00% 237,769 0.01% 916,552 0.05%JAPANESE YEN - 0.00% 10,511 0.00% - 0.00%EURO CURRENCY UNIT - 0.00% 8,171 0.00% 6,688,953 0.36%SWEDISH KRONA - 0.00% 4,265 0.00% - 0.00%BRITISH POUND - 0.00% - 0.00% 3,222,595 0.17%MALAYSIAN RINGGIT 589,560 0.08% - 0.00% 1,229,529 0.07%INDONESIA RUPIAH - 0.00% - 0.00% 313,020 0.02%ISRAEL SHEKEL - 0.00% - 0.00% 618,714 0.03%CHILEAN PESO - 0.00% - 0.00% 731,470 0.04%
Total 737,466,854$ 100.00% 2,236,675,132$ 100.00% $1,871,881,807 100.00%
Police and Fire Pension Fund
Foreign Currency ExposureSeptember 30, 2017
Jacksonville Retirement SystemOperating Portfolio
-83-
CITY OF JACKSONVILLE, FLORIDA NOTES TO FINANCIAL STATEMENTS FOR THE FISCAL YEAR ENDED SEPTEMBER 30, 2017
3. CASH, INVESTMENTS AND SECURITIES LENDING (continued) C. Securities Lending (continued)
The net asset value of the collateral may fluctuate and potentially subject the City to credit risk if the above-mentioned 102% daily adjusted collateral were to fall below 100%. As of September 30, 2017, the City of Jacksonville maintained a sufficient 102% collateral on loaned securities. During the fiscal year ended September 30, 2017; Securities Lending net income was $431 thousand ($90 thousand Operating, $341 thousand Jacksonville Retirement System). The City reviews the custodian’s securities lending operations on a monthly basis to ensure the appropriate risk/return trade-off. For accounting purposes, the Statements of Net Position and Changes in Net Position reflect the increase in assets, liabilities, interest income and expense associated with securities lending activity.
(The remainder of this page is intentionally left blank)
-84-
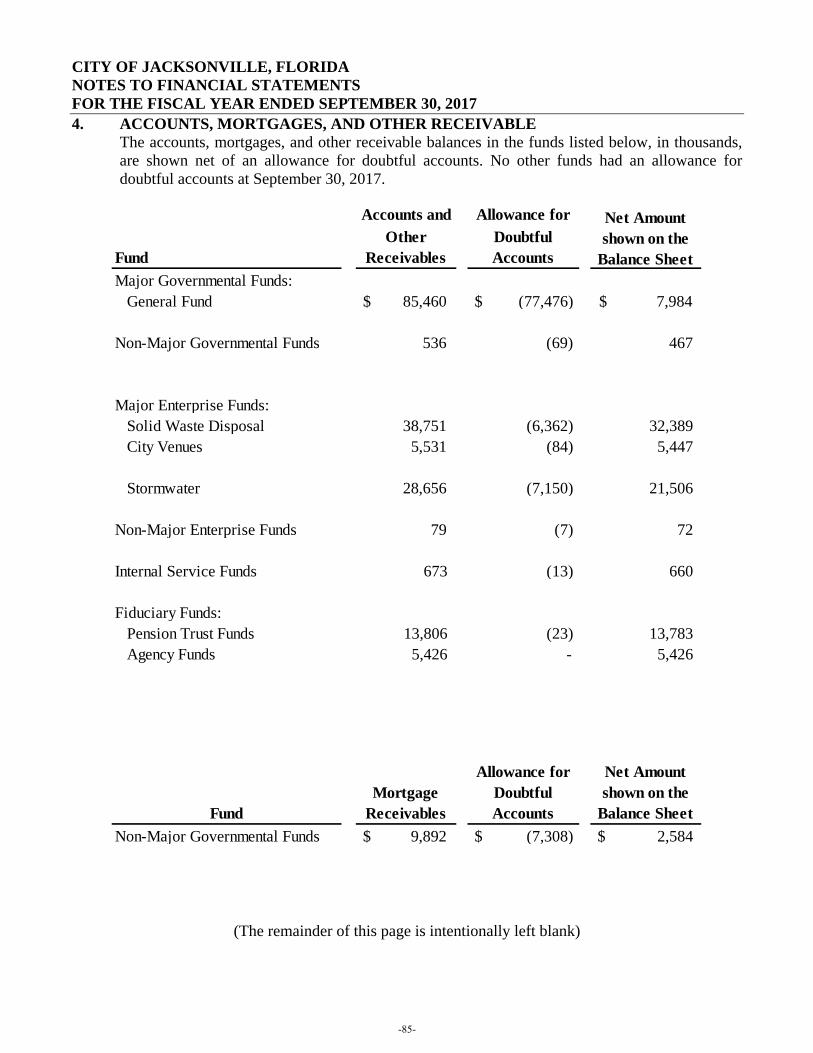
CITY OF JACKSONVILLE, FLORIDA NOTES TO FINANCIAL STATEMENTS FOR THE FISCAL YEAR ENDED SEPTEMBER 30, 2017
4. ACCOUNTS, MORTGAGES, AND OTHER RECEIVABLE The accounts, mortgages, and other receivable balances in the funds listed below, in thousands, are shown net of an allowance for doubtful accounts. No other funds had an allowance for doubtful accounts at September 30, 2017.
(The remainder of this page is intentionally left blank)
Accounts and Allowance for
FundOther
ReceivablesDoubtful Accounts
Major Governmental Funds: General Fund $ 85,460 $ (77,476) 7,984$
Non-Major Governmental Funds 536 (69) 467
Major Enterprise Funds: Solid Waste Disposal 38,751 (6,362) 32,389 City Venues 5,531 (84) 5,447
Stormwater 28,656 (7,150) 21,506
Non-Major Enterprise Funds 79 (7) 72
Internal Service Funds 673 (13) 660
Fiduciary Funds: Pension Trust Funds 13,806 (23) 13,783 Agency Funds 5,426 - 5,426
FundMortgage
Receivables
Allowance for Doubtful Accounts
Net Amount shown on the
Balance SheetNon-Major Governmental Funds $ 9,892 $ (7,308) $ 2,584
Net Amount shown on the
Balance Sheet
-85-
CITY OF JACKSONVILLE, FLORIDA NOTES TO FINANCIAL STATEMENTS FOR THE FISCAL YEAR ENDED SEPTEMBER 30, 2017
5. PROPERTY TAXES A. Ad Valorem Property Taxes:
Property tax collections are governed by Chapter 197, Florida Statutes. The Duval County Tax Collector bills and collects all property taxes levied within the consolidated city/county. Discounts of 4, 3, 2, and 1% are allowed for early payment in November, December, January, and February, respectively. The total millage rate levied by the City was 11.44190 for the fiscal year ended September 30, 2017.
The Florida Constitution, as amended under Article VII, Section 4, limits the increase in homestead property valuations for ad valorem tax purposes to a maximum of the lesser of (i) three percent (3%) of the assessment for the prior year, or (ii) the percent change in the Consumer Price Index for the preceding calendar year. The first tax year in which the limitations of these constitutional provisions applied was January 1, 1995. Calendar year 1995 is the base year upon which assessed just value of the homestead property is determined. For non-homesteaded property, increases are capped at 10% of the previous year’s assessed value, regardless of market value changes. This process is referred to as “recapture” and was enacted into law in 2009. It does not apply to any millage levied by the School Board. (Section 193.1555 FS)
B. Property Tax Calendar:
The Tax Collector remits collected taxes at least monthly to the City. The City recognizes property tax revenue as it is received from the Tax Collector since virtually all taxes levied will be collected through the tax collection process within the fiscal year levied for. The calendar of events is as follows: January 1 Property taxes are based on assessed value at this date as determined
by the Duval County Property Appraiser. July 1 Assessment roll approved by the state. September 30 Millage resolution approved by the City Council. October 1 Beginning of fiscal year for which taxes have been levied. November 30 Last day for 4% maximum discount. April 1 Unpaid property taxes become delinquent. May 31 Tax certificates are sold by the Duval County Tax Collector by this
date. This is the first lien date on the properties.
-86-
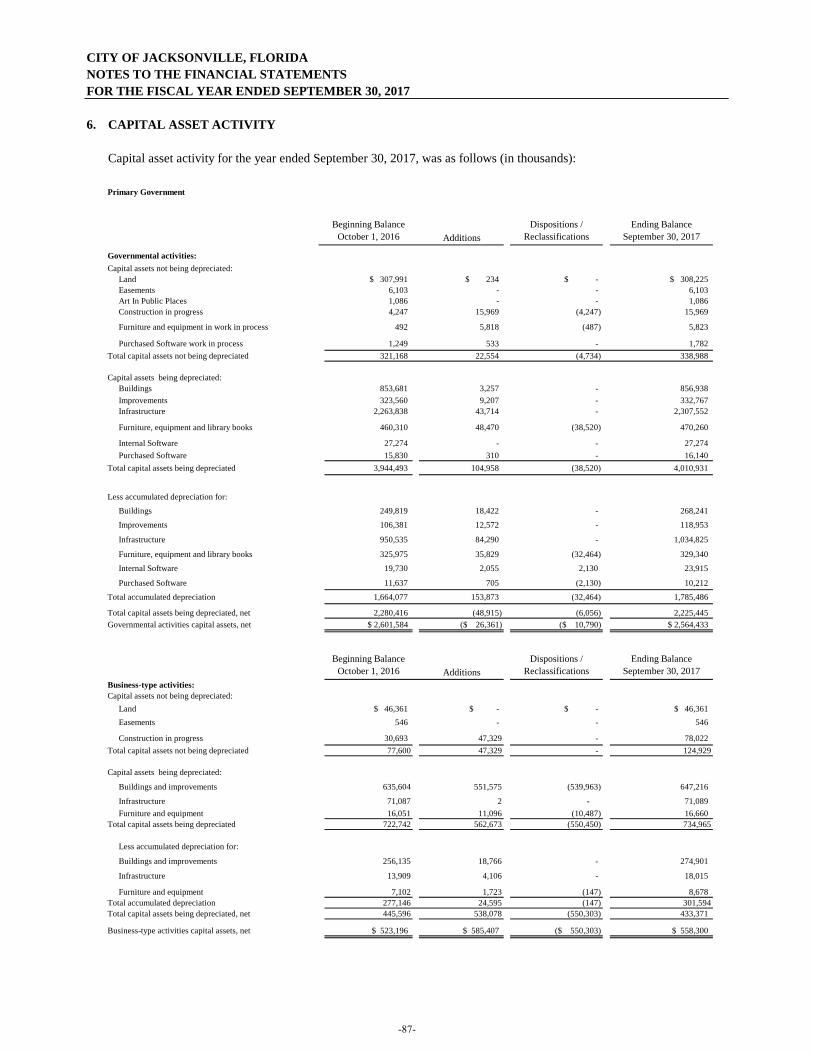
CITY OF JACKSONVILLE, FLORIDANOTES TO THE FINANCIAL STATEMENTSFOR THE FISCAL YEAR ENDED SEPTEMBER 30, 2017
6. CAPITAL ASSET ACTIVITY
Capital asset activity for the year ended September 30, 2017, was as follows (in thousands):
Primary Government
Beginning Balance October 1, 2016 Additions
Dispositions / Reclassifications
Ending Balance September 30, 2017
Governmental activities:Capital assets not being depreciated:
Land $ 307,991 $ 234 $ - $ 308,225Easements 6,103 - - 6,103 Art In Public Places 1,086 - - 1,086 Construction in progress 4,247 15,969 (4,247) 15,969
Furniture and equipment in work in process 492 5,818 (487) 5,823
Purchased Software work in process 1,249 533 - 1,782 Total capital assets not being depreciated 321,168 22,554 (4,734) 338,988
Capital assets being depreciated:Buildings 853,681 3,257 - 856,938 Improvements 323,560 9,207 - 332,767 Infrastructure 2,263,838 43,714 - 2,307,552
Furniture, equipment and library books 460,310 48,470 (38,520) 470,260
Internal Software 27,274 - - 27,274 Purchased Software 15,830 310 - 16,140
Total capital assets being depreciated 3,944,493 104,958 (38,520) 4,010,931
Less accumulated depreciation for:
Buildings 249,819 18,422 - 268,241
Improvements 106,381 12,572 - 118,953
Infrastructure 950,535 84,290 - 1,034,825
Furniture, equipment and library books 325,975 35,829 (32,464) 329,340
Internal Software 19,730 2,055 2,130 23,915
Purchased Software 11,637 705 (2,130) 10,212
Total accumulated depreciation 1,664,077 153,873 (32,464) 1,785,486
Total capital assets being depreciated, net 2,280,416 (48,915) (6,056) 2,225,445 Governmental activities capital assets, net $ 2,601,584 ($ 26,361) ($ 10,790) $ 2,564,433
Beginning Balance October 1, 2016 Additions
Dispositions / Reclassifications
Ending Balance September 30, 2017
Business-type activities:Capital assets not being depreciated:
Land $ 46,361 $ - $ - $ 46,361Easements 546 - - 546
Construction in progress 30,693 47,329 - 78,022 Total capital assets not being depreciated 77,600 47,329 - 124,929
Capital assets being depreciated:
Buildings and improvements 635,604 551,575 (539,963) 647,216
Infrastructure 71,087 2 - 71,089 Furniture and equipment 16,051 11,096 (10,487) 16,660
Total capital assets being depreciated 722,742 562,673 (550,450) 734,965
Less accumulated depreciation for:
Buildings and improvements 256,135 18,766 - 274,901
Infrastructure 13,909 4,106 - 18,015
Furniture and equipment 7,102 1,723 (147) 8,678 Total accumulated depreciation 277,146 24,595 (147) 301,594Total capital assets being depreciated, net 445,596 538,078 (550,303) 433,371
Business-type activities capital assets, net $ 523,196 $ 585,407 ($ 550,303) $ 558,300
-87-
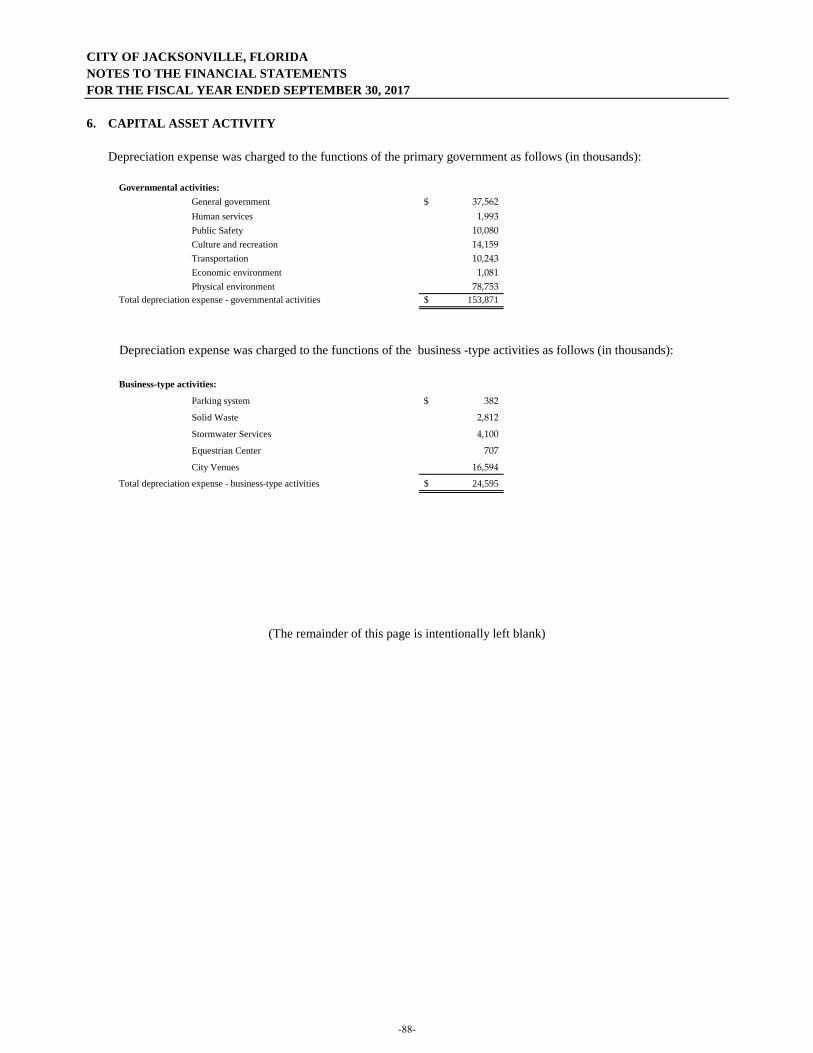
CITY OF JACKSONVILLE, FLORIDANOTES TO THE FINANCIAL STATEMENTSFOR THE FISCAL YEAR ENDED SEPTEMBER 30, 2017
6. CAPITAL ASSET ACTIVITY
Depreciation expense was charged to the functions of the primary government as follows (in thousands):
Governmental activities:General government 37,562$ Human services 1,993 Public Safety 10,080 Culture and recreation 14,159 Transportation 10,243 Economic environment 1,081 Physical environment 78,753
Total depreciation expense - governmental activities 153,871$
Depreciation expense was charged to the functions of the business -type activities as follows (in thousands):
Business-type activities:
Parking system 382$
Solid Waste 2,812
Stormwater Services 4,100
Equestrian Center 707
City Venues 16,594
Total depreciation expense - business-type activities 24,595$
(The remainder of this page is intentionally left blank)
-88-

DRAFT
(This page is intentionally left blank.)
-89-
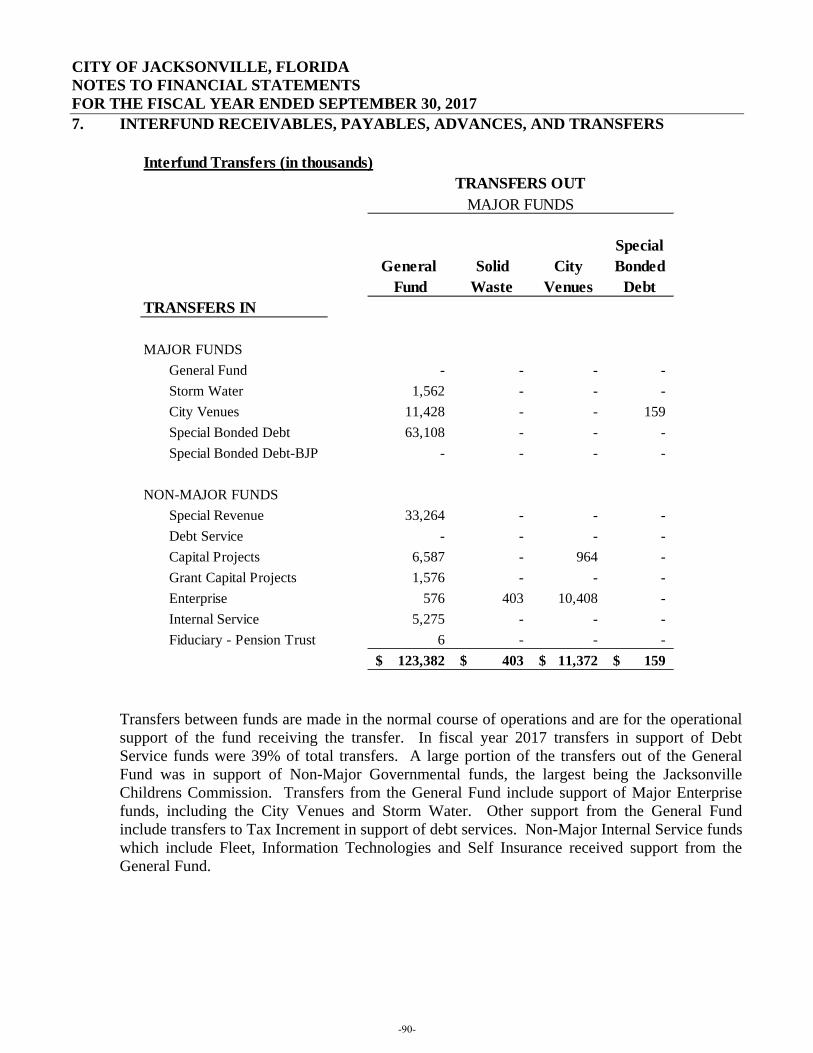
CITY OF JACKSONVILLE, FLORIDA NOTES TO FINANCIAL STATEMENTS FOR THE FISCAL YEAR ENDED SEPTEMBER 30, 2017
7. INTERFUND RECEIVABLES, PAYABLES, ADVANCES, AND TRANSFERS
Transfers between funds are made in the normal course of operations and are for the operational support of the fund receiving the transfer. In fiscal year 2017 transfers in support of Debt Service funds were 39% of total transfers. A large portion of the transfers out of the General Fund was in support of Non-Major Governmental funds, the largest being the Jacksonville Childrens Commission. Transfers from the General Fund include support of Major Enterprise funds, including the City Venues and Storm Water. Other support from the General Fund include transfers to Tax Increment in support of debt services. Non-Major Internal Service funds which include Fleet, Information Technologies and Self Insurance received support from the General Fund.
Interfund Transfers (in thousands)
Special
General Solid City BondedFund Waste Venues Debt
TRANSFERS IN
MAJOR FUNDSGeneral Fund - - - - Storm Water 1,562 - - - City Venues 11,428 - - 159 Special Bonded Debt 63,108 - - - Special Bonded Debt-BJP - - - -
NON-MAJOR FUNDSSpecial Revenue 33,264 - - - Debt Service - - - - Capital Projects 6,587 - 964 - Grant Capital Projects 1,576 - - - Enterprise 576 403 10,408 - Internal Service 5,275 - - - Fiduciary - Pension Trust 6 - - -
123,382$ 403$ 11,372$ 159$
TRANSFERS OUTMAJOR FUNDS
-90-
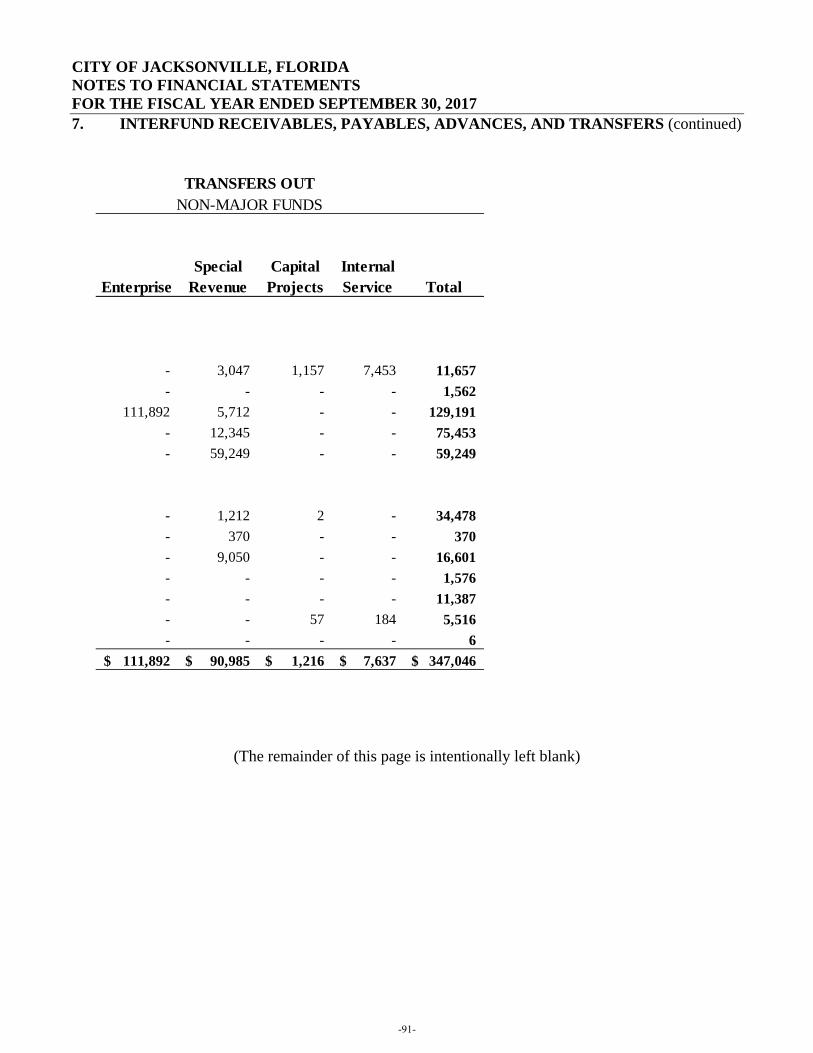
CITY OF JACKSONVILLE, FLORIDA NOTES TO FINANCIAL STATEMENTS FOR THE FISCAL YEAR ENDED SEPTEMBER 30, 2017
7. INTERFUND RECEIVABLES, PAYABLES, ADVANCES, AND TRANSFERS (continued)
(The remainder of this page is intentionally left blank)
Special Capital Internal
Enterprise Revenue Projects Service Total
- 3,047 1,157 7,453 11,657 - - - - 1,562
111,892 5,712 - - 129,191 - 12,345 - - 75,453 - 59,249 - - 59,249
- 1,212 2 - 34,478 - 370 - - 370 - 9,050 - - 16,601 - - - - 1,576 - - - - 11,387 - - 57 184 5,516 - - - - 6
111,892$ 90,985$ 1,216$ 7,637$ 347,046$
NON-MAJOR FUNDSTRANSFERS OUT
-91-
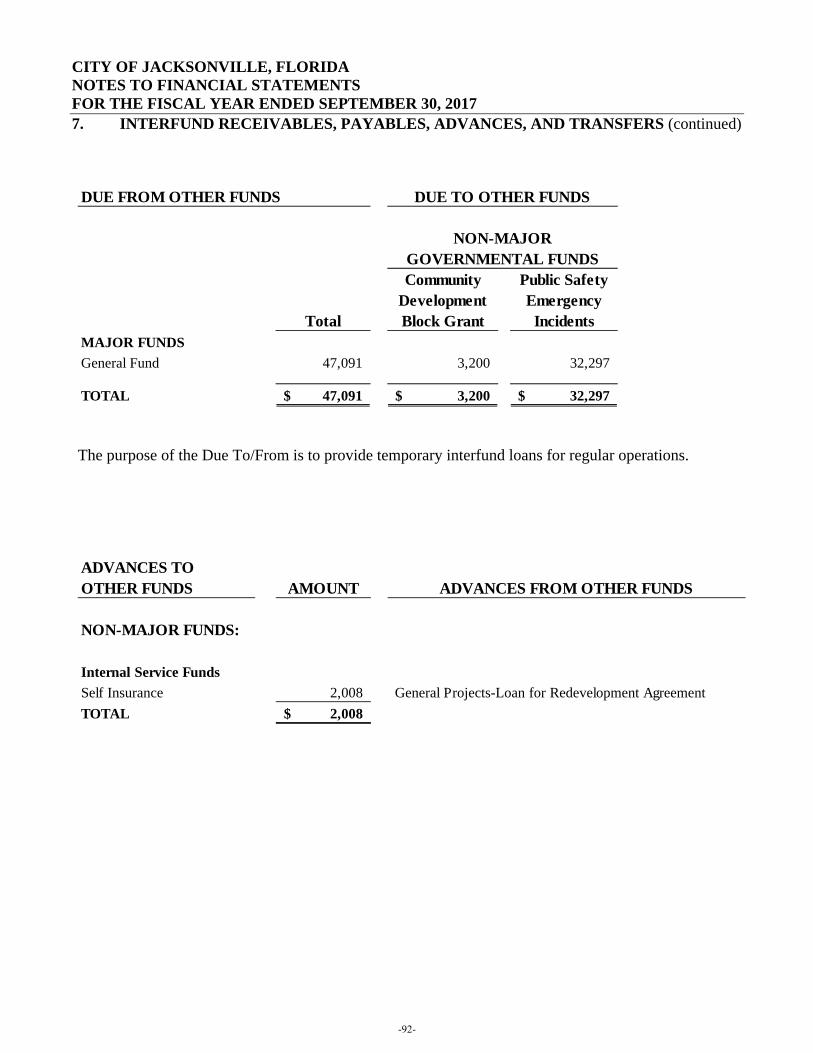
CITY OF JACKSONVILLE, FLORIDA NOTES TO FINANCIAL STATEMENTS FOR THE FISCAL YEAR ENDED SEPTEMBER 30, 2017
7. INTERFUND RECEIVABLES, PAYABLES, ADVANCES, AND TRANSFERS (continued)
The purpose of the Due To/From is to provide temporary interfund loans for regular operations.
Total
Community Development Block Grant
Public Safety Emergency
IncidentsMAJOR FUNDSGeneral Fund 47,091 3,200 32,297
TOTAL 47,091$ 3,200$ 32,297$
NON-MAJOR GOVERNMENTAL FUNDS
DUE FROM OTHER FUNDS DUE TO OTHER FUNDS
ADVANCES TOOTHER FUNDS AMOUNT
NON-MAJOR FUNDS:
Internal Service FundsSelf Insurance 2,008 General Projects-Loan for Redevelopment Agreement TOTAL 2,008$
ADVANCES FROM OTHER FUNDS
-92-
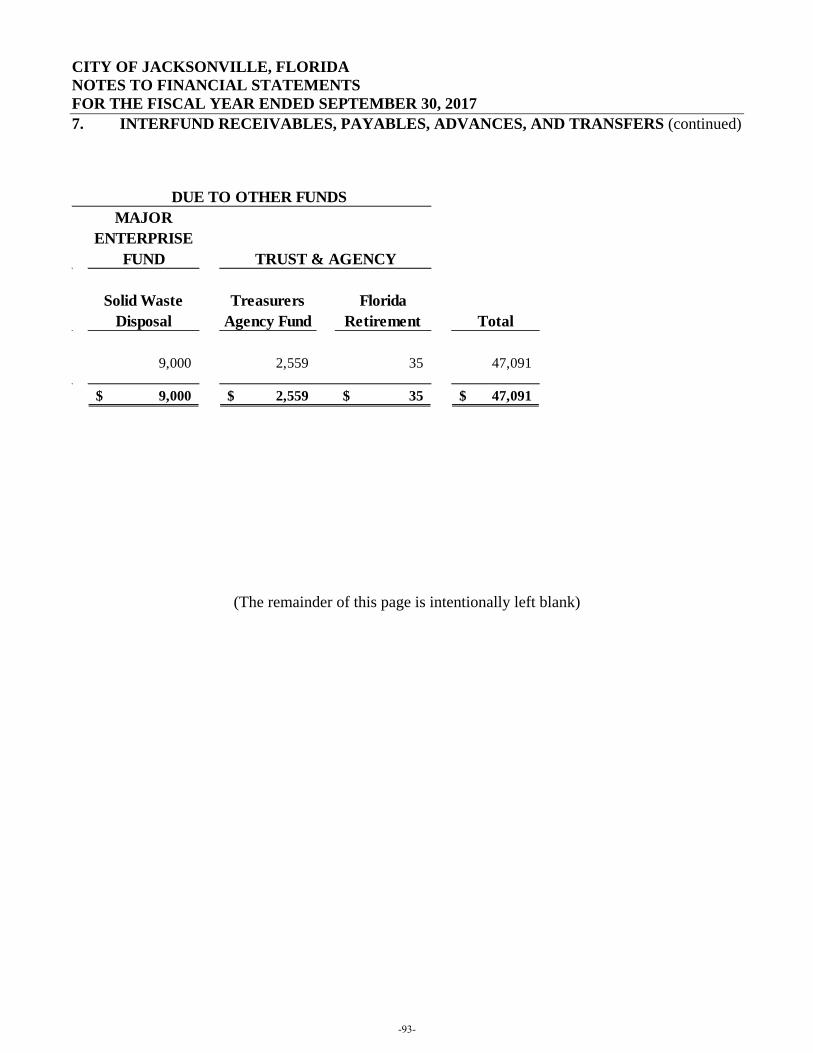
CITY OF JACKSONVILLE, FLORIDA NOTES TO FINANCIAL STATEMENTS FOR THE FISCAL YEAR ENDED SEPTEMBER 30, 2017
7. INTERFUND RECEIVABLES, PAYABLES, ADVANCES, AND TRANSFERS (continued)
(The remainder of this page is intentionally left blank)
MAJOR ENTERPRISE
FUND
Solid Waste Disposal
Treasurers Agency Fund
Florida Retirement Total
9,000 2,559 35 47,091
9,000$ 2,559$ 35$ 47,091$
TRUST & AGENCY
DUE TO OTHER FUNDS
-93-
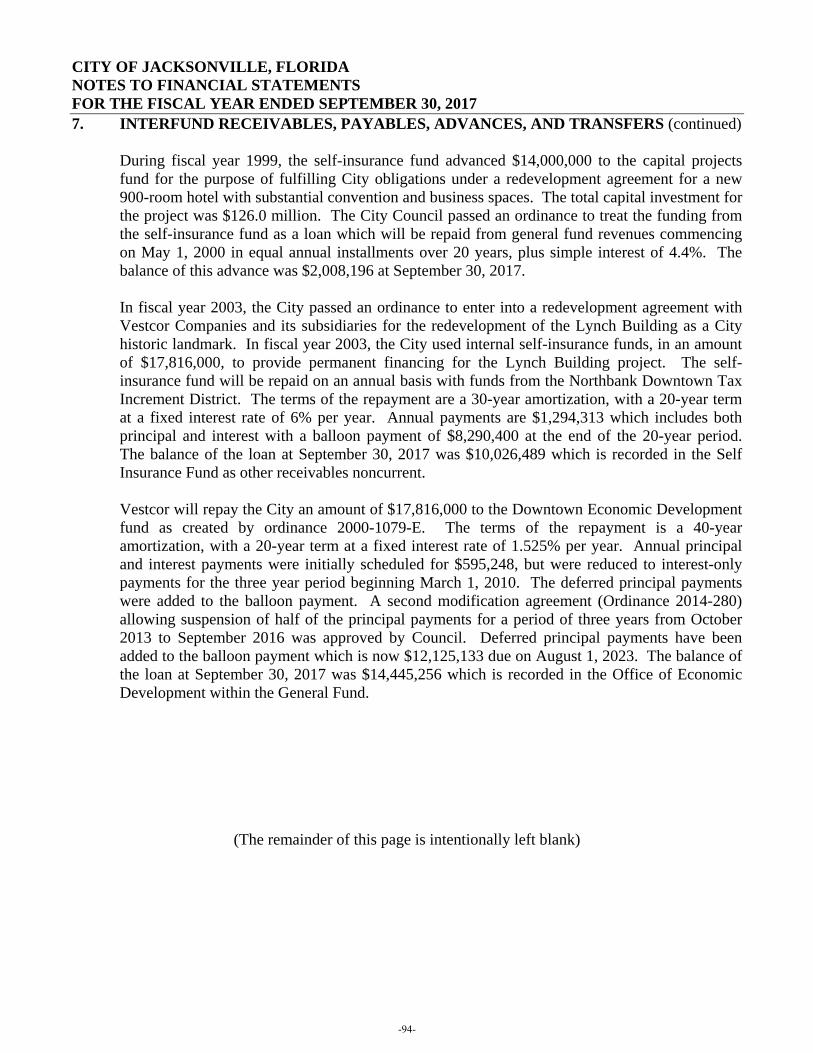
CITY OF JACKSONVILLE, FLORIDA NOTES TO FINANCIAL STATEMENTS FOR THE FISCAL YEAR ENDED SEPTEMBER 30, 2017
7. INTERFUND RECEIVABLES, PAYABLES, ADVANCES, AND TRANSFERS (continued)
During fiscal year 1999, the self-insurance fund advanced $14,000,000 to the capital projects fund for the purpose of fulfilling City obligations under a redevelopment agreement for a new 900-room hotel with substantial convention and business spaces. The total capital investment for the project was $126.0 million. The City Council passed an ordinance to treat the funding from the self-insurance fund as a loan which will be repaid from general fund revenues commencing on May 1, 2000 in equal annual installments over 20 years, plus simple interest of 4.4%. The balance of this advance was $2,008,196 at September 30, 2017. In fiscal year 2003, the City passed an ordinance to enter into a redevelopment agreement with Vestcor Companies and its subsidiaries for the redevelopment of the Lynch Building as a City historic landmark. In fiscal year 2003, the City used internal self-insurance funds, in an amount of $17,816,000, to provide permanent financing for the Lynch Building project. The self-insurance fund will be repaid on an annual basis with funds from the Northbank Downtown Tax Increment District. The terms of the repayment are a 30-year amortization, with a 20-year term at a fixed interest rate of 6% per year. Annual payments are $1,294,313 which includes both principal and interest with a balloon payment of $8,290,400 at the end of the 20-year period. The balance of the loan at September 30, 2017 was $10,026,489 which is recorded in the Self Insurance Fund as other receivables noncurrent. Vestcor will repay the City an amount of $17,816,000 to the Downtown Economic Development fund as created by ordinance 2000-1079-E. The terms of the repayment is a 40-year amortization, with a 20-year term at a fixed interest rate of 1.525% per year. Annual principal and interest payments were initially scheduled for $595,248, but were reduced to interest-only payments for the three year period beginning March 1, 2010. The deferred principal payments were added to the balloon payment. A second modification agreement (Ordinance 2014-280) allowing suspension of half of the principal payments for a period of three years from October 2013 to September 2016 was approved by Council. Deferred principal payments have been added to the balloon payment which is now $12,125,133 due on August 1, 2023. The balance of the loan at September 30, 2017 was $14,445,256 which is recorded in the Office of Economic Development within the General Fund.
(The remainder of this page is intentionally left blank)
-94-
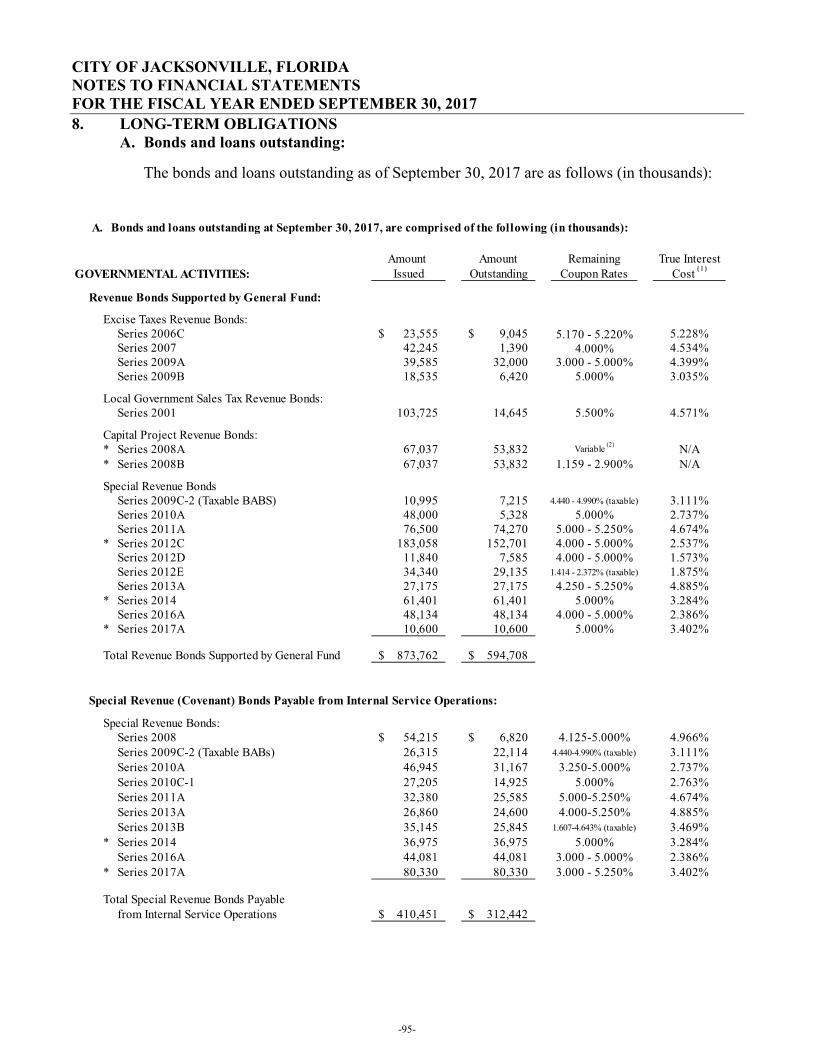
CITY OF JACKSONVILLE, FLORIDA NOTES TO FINANCIAL STATEMENTS FOR THE FISCAL YEAR ENDED SEPTEMBER 30, 20178. LONG-TERM OBLIGATIONS
A. Bonds and loans outstanding:
The bonds and loans outstanding as of September 30, 2017 are as follows (in thousands):
A. Bonds and loans outstanding at September 30, 2017, are comprised of the following (in thousands):
Amount Amount Remaining True InterestGOVERNMENTAL ACTIVITIES: Issued Outstanding Coupon Rates Cost (1)
Revenue Bonds Supported by General Fund:
Excise Taxes Revenue Bonds:Series 2006C 23,555$ 9,045$ 5.170 - 5.220% 5.228%Series 2007 42,245 1,390 4.000% 4.534%Series 2009A 39,585 32,000 3.000 - 5.000% 4.399%Series 2009B 18,535 6,420 5.000% 3.035%
Local Government Sales Tax Revenue Bonds:Series 2001 103,725 14,645 5.500% 4.571%
Capital Project Revenue Bonds:* Series 2008A 67,037 53,832 Variable (2) N/A* Series 2008B 67,037 53,832 1.159 - 2.900% N/A
Special Revenue Bonds Series 2009C-2 (Taxable BABS) 10,995 7,215 4.440 - 4.990% (taxable) 3.111%Series 2010A 48,000 5,328 5.000% 2.737%Series 2011A 76,500 74,270 5.000 - 5.250% 4.674%
* Series 2012C 183,058 152,701 4.000 - 5.000% 2.537%Series 2012D 11,840 7,585 4.000 - 5.000% 1.573%Series 2012E 34,340 29,135 1.414 - 2.372% (taxable) 1.875%Series 2013A 27,175 27,175 4.250 - 5.250% 4.885%
* Series 2014 61,401 61,401 5.000% 3.284%Series 2016A 48,134 48,134 4.000 - 5.000% 2.386%
* Series 2017A 10,600 10,600 5.000% 3.402%
Total Revenue Bonds Supported by General Fund 873,762$ 594,708$
Special Revenue (Covenant) Bonds Payable from Internal Service Operations:
Special Revenue Bonds:Series 2008 54,215$ 6,820$ 4.125-5.000% 4.966%Series 2009C-2 (Taxable BABs) 26,315 22,114 4.440-4.990% (taxable) 3.111%Series 2010A 46,945 31,167 3.250-5.000% 2.737%Series 2010C-1 27,205 14,925 5.000% 2.763%Series 2011A 32,380 25,585 5.000-5.250% 4.674%Series 2013A 26,860 24,600 4.000-5.250% 4.885%Series 2013B 35,145 25,845 1.607-4.643% (taxable) 3.469%
* Series 2014 36,975 36,975 5.000% 3.284%Series 2016A 44,081 44,081 3.000 - 5.000% 2.386%
* Series 2017A 80,330 80,330 3.000 - 5.250% 3.402%
Total Special Revenue Bonds Payablefrom Internal Service Operations 410,451$ 312,442$
-95-
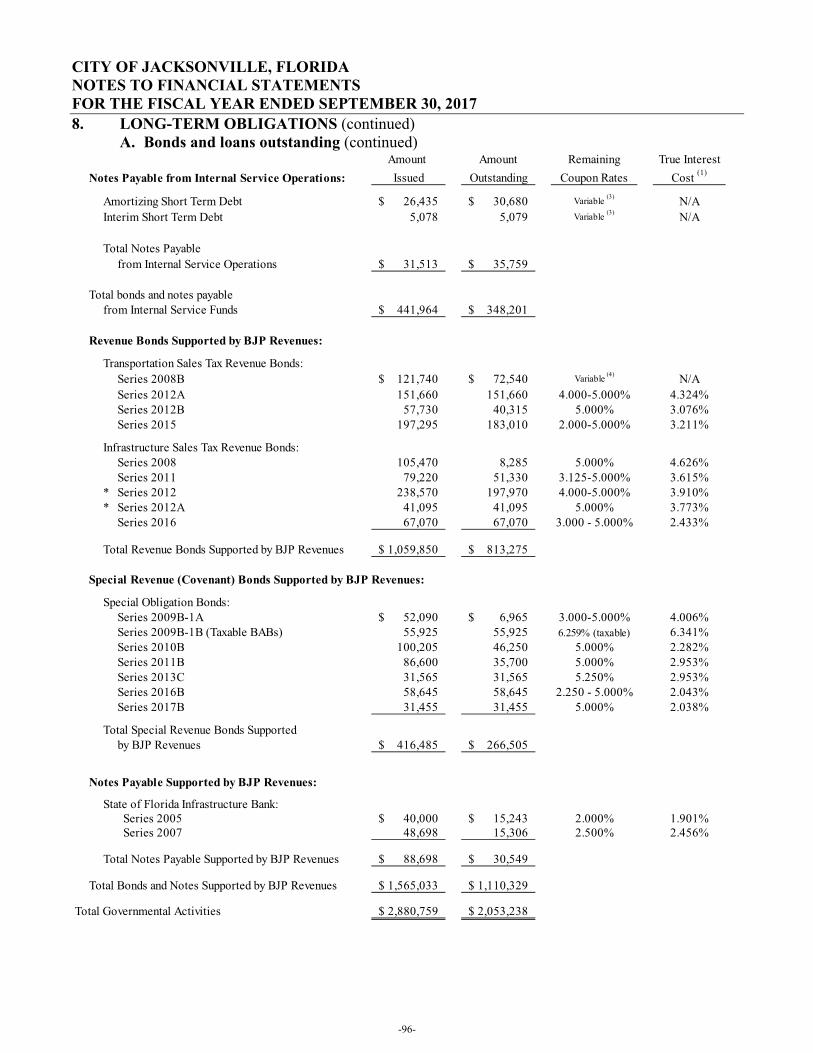
CITY OF JACKSONVILLE, FLORIDA NOTES TO FINANCIAL STATEMENTS FOR THE FISCAL YEAR ENDED SEPTEMBER 30, 20178. LONG-TERM OBLIGATIONS (continued)
A. Bonds and loans outstanding (continued)Amount Amount Remaining True Interest
Notes Payable from Internal Service Operations: Issued Outstanding Coupon Rates Cost (1)
Amortizing Short Term Debt 26,435$ 30,680$ Variable (3) N/AInterim Short Term Debt 5,078 5,079 Variable (3) N/A
Total Notes Payablefrom Internal Service Operations 31,513$ 35,759$
Total bonds and notes payable from Internal Service Funds 441,964$ 348,201$
Revenue Bonds Supported by BJP Revenues:
Transportation Sales Tax Revenue Bonds:Series 2008B 121,740$ 72,540$ Variable (4) N/ASeries 2012A 151,660 151,660 4.000-5.000% 4.324%Series 2012B 57,730 40,315 5.000% 3.076%Series 2015 197,295 183,010 2.000-5.000% 3.211%
Infrastructure Sales Tax Revenue Bonds:Series 2008 105,470 8,285 5.000% 4.626%Series 2011 79,220 51,330 3.125-5.000% 3.615%
* Series 2012 238,570 197,970 4.000-5.000% 3.910%* Series 2012A 41,095 41,095 5.000% 3.773%
Series 2016 67,070 67,070 3.000 - 5.000% 2.433%
Total Revenue Bonds Supported by BJP Revenues 1,059,850$ 813,275$
Special Revenue (Covenant) Bonds Supported by BJP Revenues:
Special Obligation Bonds:Series 2009B-1A 52,090$ 6,965$ 3.000-5.000% 4.006%Series 2009B-1B (Taxable BABs) 55,925 55,925 6.259% (taxable) 6.341%Series 2010B 100,205 46,250 5.000% 2.282%Series 2011B 86,600 35,700 5.000% 2.953%Series 2013C 31,565 31,565 5.250% 2.953%Series 2016B 58,645 58,645 2.250 - 5.000% 2.043%Series 2017B 31,455 31,455 5.000% 2.038%
Total Special Revenue Bonds Supported by BJP Revenues 416,485$ 266,505$
Notes Payable Supported by BJP Revenues:
State of Florida Infrastructure Bank: Series 2005 40,000$ 15,243$ 2.000% 1.901% Series 2007 48,698 15,306 2.500% 2.456%
Total Notes Payable Supported by BJP Revenues 88,698$ 30,549$
Total Bonds and Notes Supported by BJP Revenues 1,565,033$ 1,110,329$
Total Governmental Activities 2,880,759$ 2,053,238$
-96-
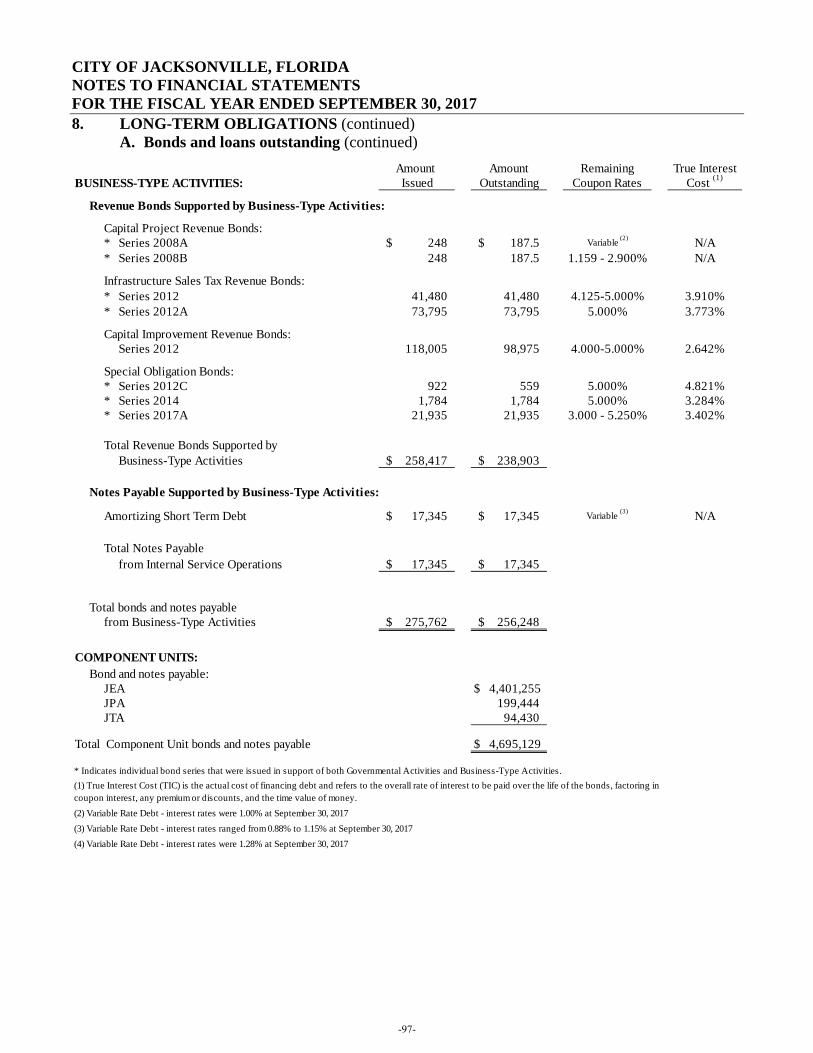
CITY OF JACKSONVILLE, FLORIDA NOTES TO FINANCIAL STATEMENTS FOR THE FISCAL YEAR ENDED SEPTEMBER 30, 2017
8. LONG-TERM OBLIGATIONS (continued) A. Bonds and loans outstanding (continued)
Amount Amount Remaining True InterestBUSINESS-TYPE ACTIVITIES: Issued Outstanding Coupon Rates Cost (1)
Revenue Bonds Supported by Business-Type Activities:
Capital Project Revenue Bonds:* Series 2008A 248$ 187.5$ Variable (2) N/A* Series 2008B 248 187.5 1.159 - 2.900% N/A
Infrastructure Sales Tax Revenue Bonds:* Series 2012 41,480 41,480 4.125-5.000% 3.910%* Series 2012A 73,795 73,795 5.000% 3.773%
Capital Improvement Revenue Bonds:Series 2012 118,005 98,975 4.000-5.000% 2.642%
Special Obligation Bonds:* Series 2012C 922 559 5.000% 4.821%* Series 2014 1,784 1,784 5.000% 3.284%* Series 2017A 21,935 21,935 3.000 - 5.250% 3.402%
Total Revenue Bonds Supported byBusiness-Type Activities 258,417$ 238,903$
Notes Payable Supported by Business-Type Activities:
Amortizing Short Term Debt 17,345$ 17,345$ Variable (3) N/A
Total Notes Payablefrom Internal Service Operations 17,345$ 17,345$
Total bonds and notes payable from Business-Type Activities 275,762$ 256,248$
COMPONENT UNITS:Bond and notes payable:
JEA $ 4,401,255 JPA 199,444JTA 94,430
Total Component Unit bonds and notes payable $ 4,695,129
* Indicates individual bond series that were issued in support of both Governmental Activities and Business-Type Activities.(1) True Interest Cost (TIC) is the actual cost of financing debt and refers to the overall rate of interest to be paid over the life of the bonds, factoring in coupon interest, any premium or discounts, and the time value of money.(2) Variable Rate Debt - interest rates were 1.00% at September 30, 2017(3) Variable Rate Debt - interest rates ranged from 0.88% to 1.15% at September 30, 2017(4) Variable Rate Debt - interest rates were 1.28% at September 30, 2017
-97-
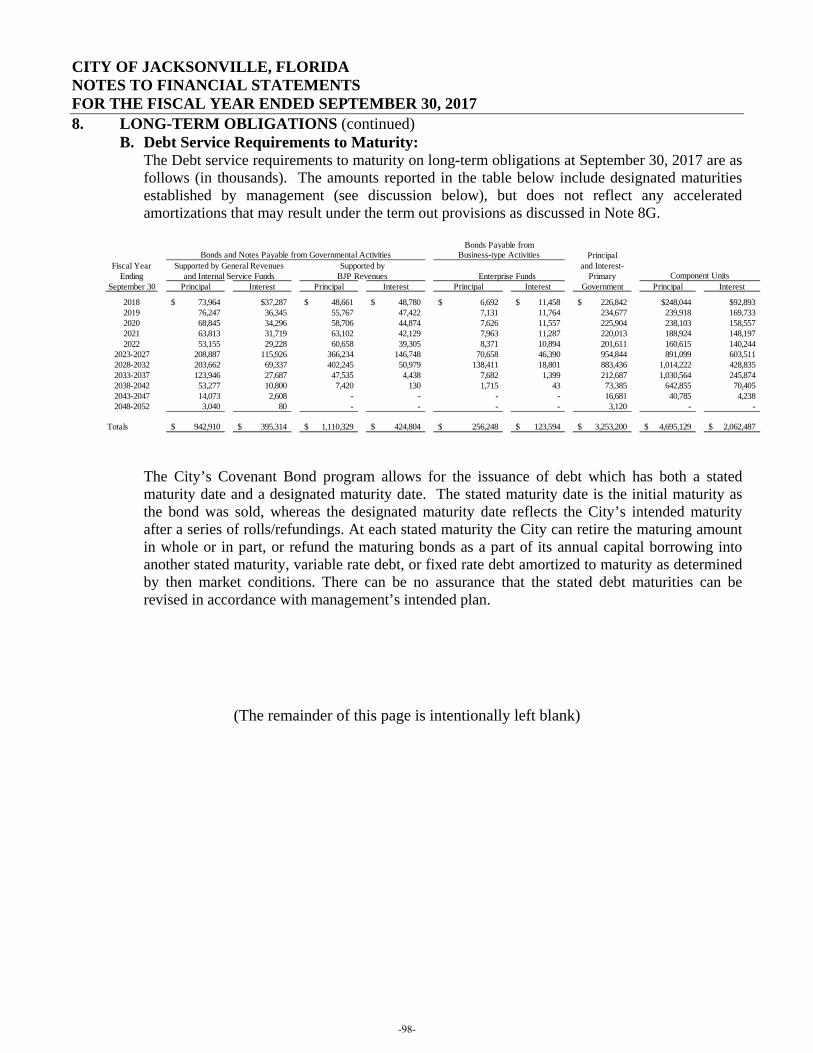
CITY OF JACKSONVILLE, FLORIDA NOTES TO FINANCIAL STATEMENTS FOR THE FISCAL YEAR ENDED SEPTEMBER 30, 2017
8. LONG-TERM OBLIGATIONS (continued) B. Debt Service Requirements to Maturity:
The Debt service requirements to maturity on long-term obligations at September 30, 2017 are as follows (in thousands). The amounts reported in the table below include designated maturities established by management (see discussion below), but does not reflect any accelerated amortizations that may result under the term out provisions as discussed in Note 8G.
The City’s Covenant Bond program allows for the issuance of debt which has both a stated maturity date and a designated maturity date. The stated maturity date is the initial maturity as the bond was sold, whereas the designated maturity date reflects the City’s intended maturity after a series of rolls/refundings. At each stated maturity the City can retire the maturing amount in whole or in part, or refund the maturing bonds as a part of its annual capital borrowing into another stated maturity, variable rate debt, or fixed rate debt amortized to maturity as determined by then market conditions. There can be no assurance that the stated debt maturities can be revised in accordance with management’s intended plan.
(The remainder of this page is intentionally left blank)
Principal
Fiscal Year Supported by General Revenues Supported by and Interest-Ending and Internal Service Funds BJP Revenues Enterprise Funds Primary
September 30 Principal Interest Principal Interest Principal Interest Government Principal Interest
2018 73,964$ $37,287 48,661$ 48,780$ 6,692$ 11,458$ 226,842$ $248,044 $92,8932019 76,247 36,345 55,767 47,422 7,131 11,764 234,677 239,918 169,733 2020 68,845 34,296 58,706 44,874 7,626 11,557 225,904 238,103 158,557 2021 63,813 31,719 63,102 42,129 7,963 11,287 220,013 188,924 148,197 2022 53,155 29,228 60,658 39,305 8,371 10,894 201,611 160,615 140,244
2023-2027 208,887 115,926 366,234 146,748 70,658 46,390 954,844 891,099 603,511 2028-2032 203,662 69,337 402,245 50,979 138,411 18,801 883,436 1,014,222 428,835 2033-2037 123,946 27,687 47,535 4,438 7,682 1,399 212,687 1,030,564 245,874 2038-2042 53,277 10,800 7,420 130 1,715 43 73,385 642,855 70,405 2043-2047 14,073 2,608 - - - - 16,681 40,785 4,238 2048-2052 3,040 80 - - - - 3,120 - -
Totals 942,910$ 395,314$ 1,110,329$ 424,804$ 256,248$ 123,594$ 3,253,200$ 4,695,129$ 2,062,487$
Bonds and Notes Payable from Governmental Activities
Component Units
Bonds Payable fromBusiness-type Activities
-98-
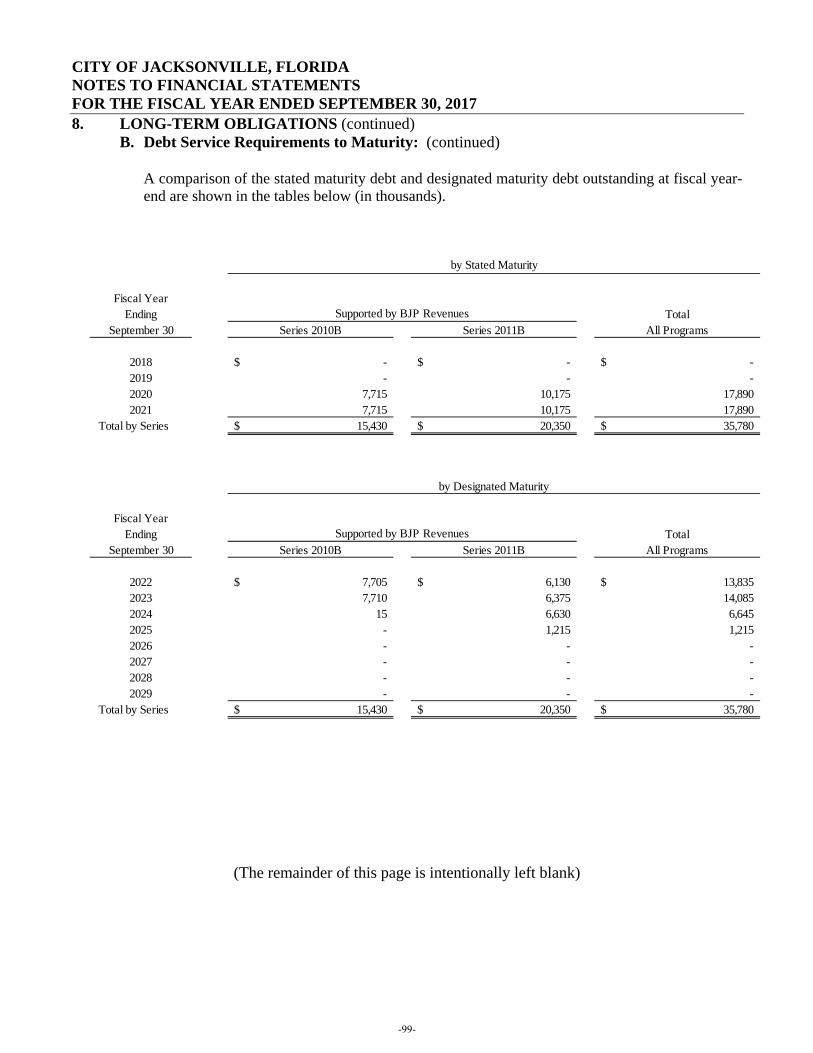
CITY OF JACKSONVILLE, FLORIDA NOTES TO FINANCIAL STATEMENTS FOR THE FISCAL YEAR ENDED SEPTEMBER 30, 2017
8. LONG-TERM OBLIGATIONS (continued) B. Debt Service Requirements to Maturity: (continued)
A comparison of the stated maturity debt and designated maturity debt outstanding at fiscal year-end are shown in the tables below (in thousands).
(The remainder of this page is intentionally left blank)
Fiscal YearEnding Total
September 30 Series 2010B Series 2011B All Programs
2018 -$ -$ -$ 2019 - - - 2020 7,715 10,175 17,890 2021 7,715 10,175 17,890
Total by Series 15,430$ 20,350$ 35,780$
Fiscal YearEnding Total
September 30 Series 2010B Series 2011B All Programs
2022 7,705$ 6,130$ 13,835$ 2023 7,710 6,375 14,085 2024 15 6,630 6,645 2025 - 1,215 1,215 2026 - - - 2027 - - - 2028 - - - 2029 - - -
Total by Series 15,430$ 20,350$ 35,780$
Supported by BJP Revenues
Supported by BJP Revenues
by Stated Maturity
by Designated Maturity
-99-
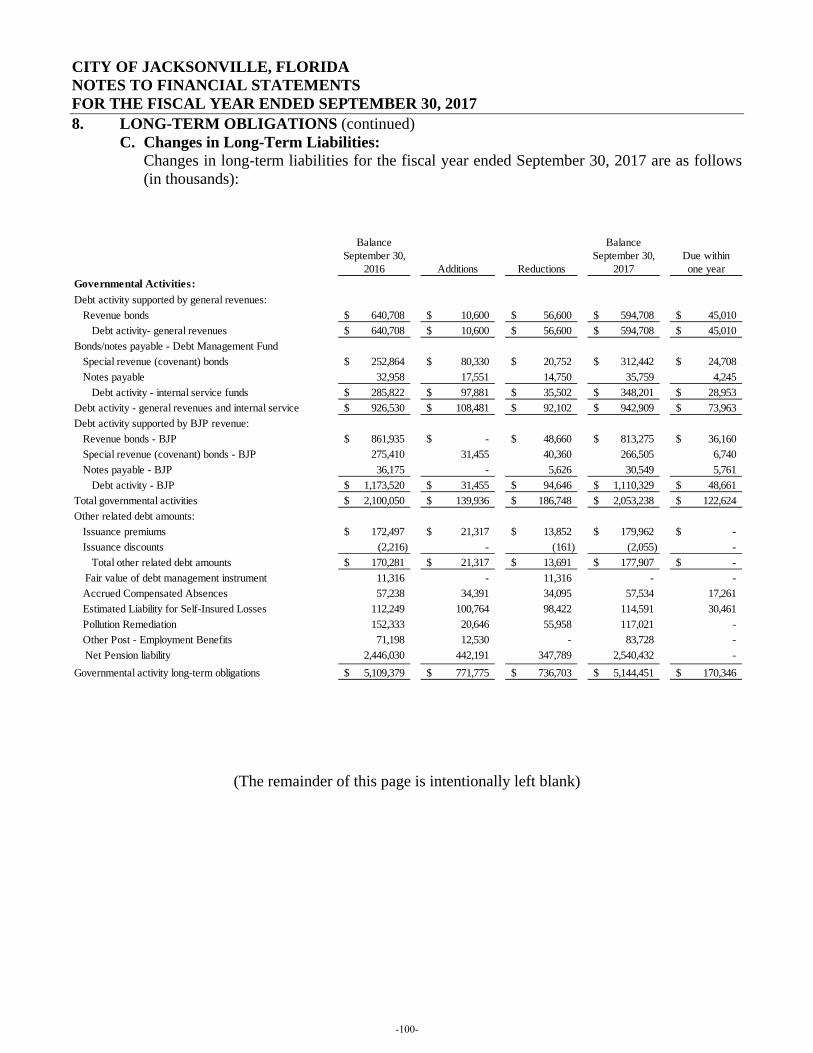
CITY OF JACKSONVILLE, FLORIDA NOTES TO FINANCIAL STATEMENTS FOR THE FISCAL YEAR ENDED SEPTEMBER 30, 2017
8. LONG-TERM OBLIGATIONS (continued) C. Changes in Long-Term Liabilities:
Changes in long-term liabilities for the fiscal year ended September 30, 2017 are as follows (in thousands):
(The remainder of this page is intentionally left blank)
Balance BalanceSeptember 30, September 30, Due within
2016 Additions Reductions 2017 one yearGovernmental Activities:Debt activity supported by general revenues: Revenue bonds 640,708$ 10,600$ 56,600$ 594,708$ 45,010$ Debt activity- general revenues 640,708$ 10,600$ 56,600$ 594,708$ 45,010$ Bonds/notes payable - Debt Management Fund Special revenue (covenant) bonds 252,864$ 80,330$ 20,752$ 312,442$ 24,708$ Notes payable 32,958 17,551 14,750 35,759 4,245 Debt activity - internal service funds 285,822$ 97,881$ 35,502$ 348,201$ 28,953$ Debt activity - general revenues and internal service 926,530$ 108,481$ 92,102$ 942,909$ 73,963$ Debt activity supported by BJP revenue: Revenue bonds - BJP 861,935$ -$ 48,660$ 813,275$ 36,160$ Special revenue (covenant) bonds - BJP 275,410 31,455 40,360 266,505 6,740 Notes payable - BJP 36,175 - 5,626 30,549 5,761 Debt activity - BJP 1,173,520$ 31,455$ 94,646$ 1,110,329$ 48,661$ Total governmental activities 2,100,050$ 139,936$ 186,748$ 2,053,238$ 122,624$ Other related debt amounts: Issuance premiums 172,497$ 21,317$ 13,852$ 179,962$ -$ Issuance discounts (2,216) - (161) (2,055) - Total other related debt amounts 170,281$ 21,317$ 13,691$ 177,907$ -$
Fair value of debt management instrument 11,316 - 11,316 - - Accrued Compensated Absences 57,238 34,391 34,095 57,534 17,261 Estimated Liability for Self-Insured Losses 112,249 100,764 98,422 114,591 30,461 Pollution Remediation 152,333 20,646 55,958 117,021 - Other Post - Employment Benefits 71,198 12,530 - 83,728 -
Net Pension liability 2,446,030 442,191 347,789 2,540,432 - g gGovernmental activity long-term obligations 5,109,379$ 771,775$ 736,703$ 5,144,451$ 170,346$
-100-
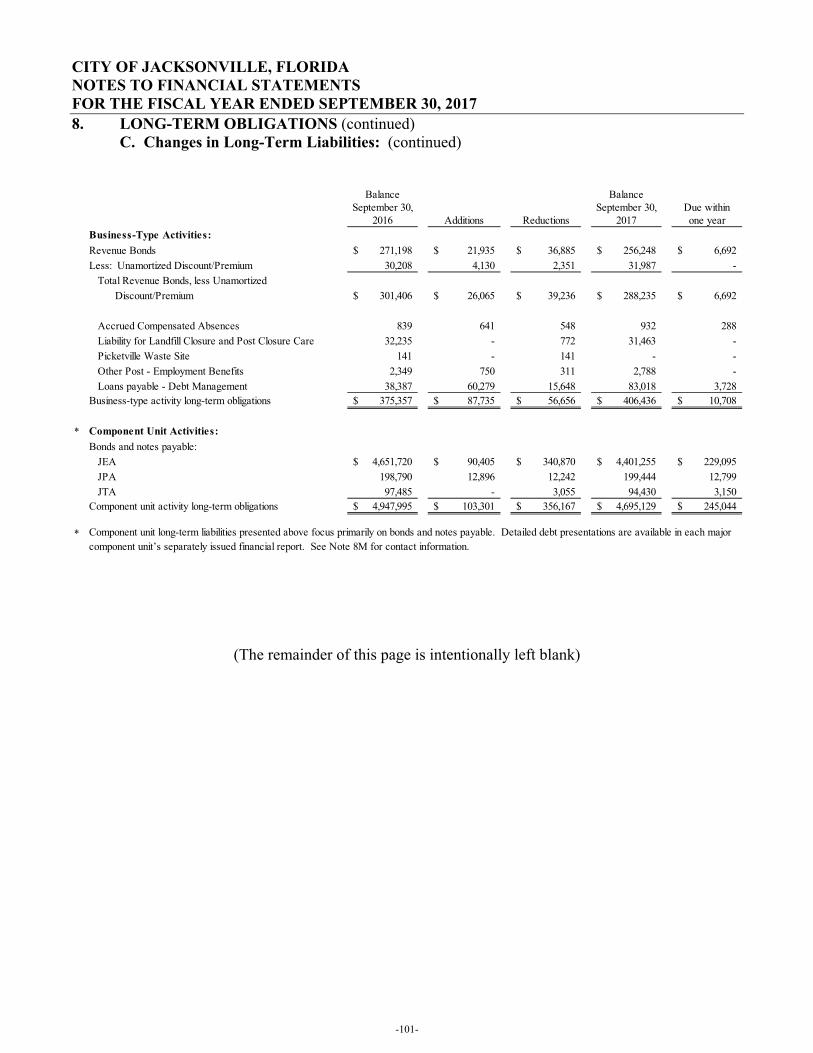
CITY OF JACKSONVILLE, FLORIDA NOTES TO FINANCIAL STATEMENTS FOR THE FISCAL YEAR ENDED SEPTEMBER 30, 20178. LONG-TERM OBLIGATIONS (continued)
C. Changes in Long-Term Liabilities: (continued)
(The remainder of this page is intentionally left blank)
Balance BalanceSeptember 30, September 30, Due within
2016 Additions Reductions 2017 one yearBusiness-Type Activities:Revenue Bonds 271,198$ 21,935$ 36,885$ 256,248$ 6,692$ Less: Unamortized Discount/Premium 30,208 4,130 2,351 31,987 - Total Revenue Bonds, less Unamortized Discount/Premium 301,406$ 26,065$ 39,236$ 288,235$ 6,692$
Accrued Compensated Absences 839 641 548 932 288 Liability for Landfill Closure and Post Closure Care 32,235 - 772 31,463 - Picketville Waste Site 141 - 141 - - Other Post - Employment Benefits 2,349 750 311 2,788 - Loans payable - Debt Management 38,387 60,279 15,648 83,018 3,728 Business-type activity long-term obligations 375,357$ 87,735$ 56,656$ 406,436$ 10,708$
* Component Unit Activities:Bonds and notes payable: JEA 4,651,720$ 90,405$ 340,870$ 4,401,255$ 229,095$ JPA 198,790 12,896 12,242 199,444 12,799 JTA 97,485 - 3,055 94,430 3,150 Component unit activity long-term obligations 4,947,995$ 103,301$ 356,167$ 4,695,129$ 245,044$
* Component unit long-term liabilities presented above focus primarily on bonds and notes payable. Detailed debt presentations are available in each major component unit’s separately issued financial report. See Note 8M for contact information.
-101-
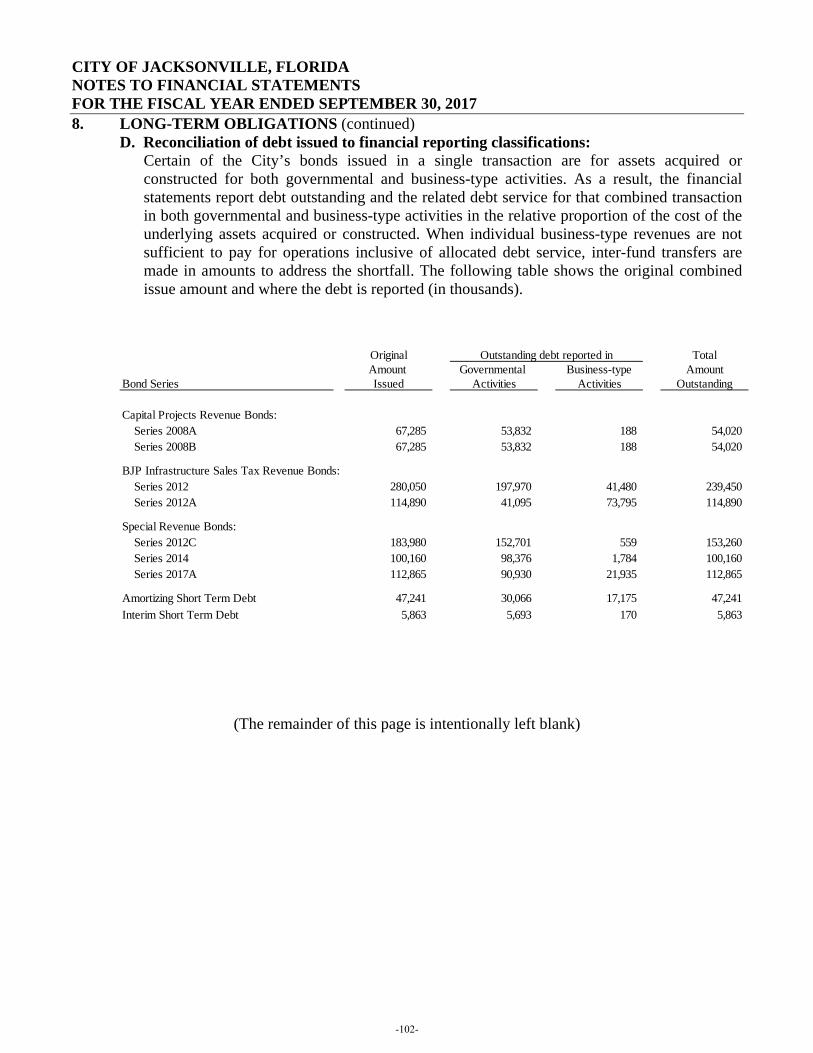
CITY OF JACKSONVILLE, FLORIDA NOTES TO FINANCIAL STATEMENTS FOR THE FISCAL YEAR ENDED SEPTEMBER 30, 2017
8. LONG-TERM OBLIGATIONS (continued) D. Reconciliation of debt issued to financial reporting classifications:
Certain of the City’s bonds issued in a single transaction are for assets acquired or constructed for both governmental and business-type activities. As a result, the financial statements report debt outstanding and the related debt service for that combined transaction in both governmental and business-type activities in the relative proportion of the cost of the underlying assets acquired or constructed. When individual business-type revenues are not sufficient to pay for operations inclusive of allocated debt service, inter-fund transfers are made in amounts to address the shortfall. The following table shows the original combined issue amount and where the debt is reported (in thousands).
(The remainder of this page is intentionally left blank)
Original Outstanding debt reported in TotalAmount Governmental Business-type Amount
Bond Series Issued Activities Activities Outstanding
Capital Projects Revenue Bonds:Series 2008A 67,285 53,832 188 54,020 Series 2008B 67,285 53,832 188 54,020
BJP Infrastructure Sales Tax Revenue Bonds:Series 2012 280,050 197,970 41,480 239,450 Series 2012A 114,890 41,095 73,795 114,890
Special Revenue Bonds:Series 2012C 183,980 152,701 559 153,260 Series 2014 100,160 98,376 1,784 100,160 Series 2017A 112,865 90,930 21,935 112,865
Amortizing Short Term Debt 47,241 30,066 17,175 47,241 Interim Short Term Debt 5,863 5,693 170 5,863
-102-
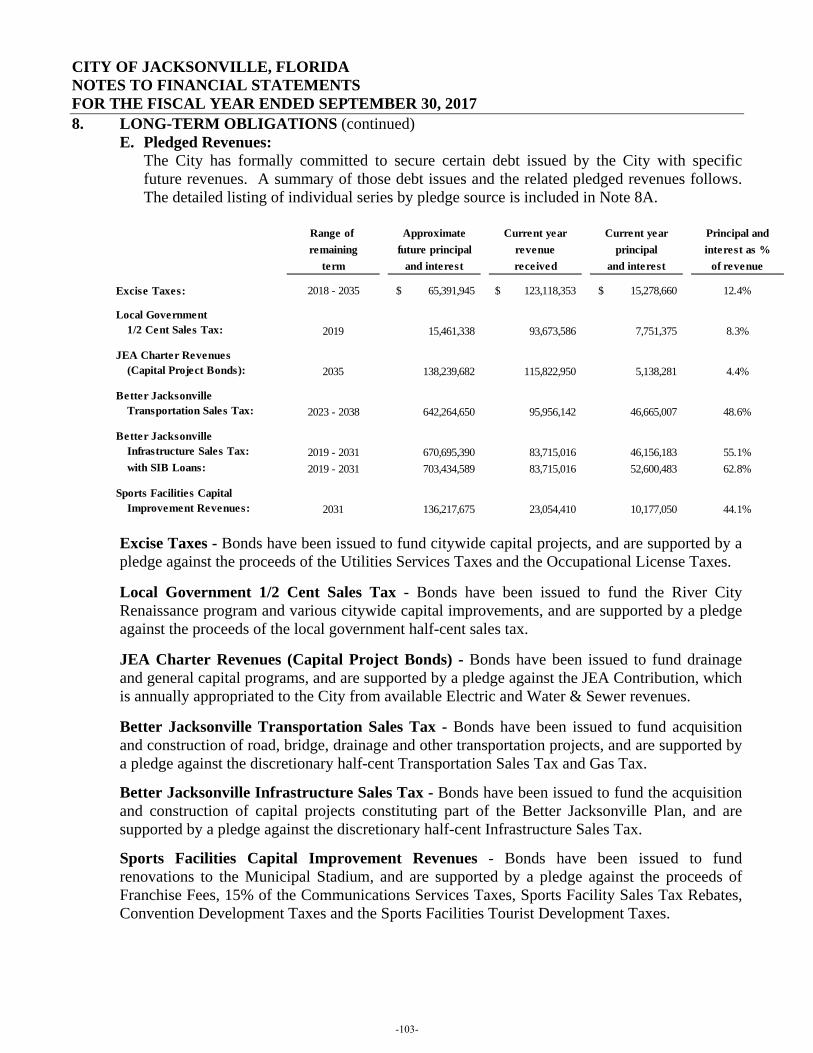
CITY OF JACKSONVILLE, FLORIDA NOTES TO FINANCIAL STATEMENTS FOR THE FISCAL YEAR ENDED SEPTEMBER 30, 2017
8. LONG-TERM OBLIGATIONS (continued) E. Pledged Revenues:
The City has formally committed to secure certain debt issued by the City with specific future revenues. A summary of those debt issues and the related pledged revenues follows. The detailed listing of individual series by pledge source is included in Note 8A.
Excise Taxes - Bonds have been issued to fund citywide capital projects, and are supported by a pledge against the proceeds of the Utilities Services Taxes and the Occupational License Taxes. Local Government 1/2 Cent Sales Tax - Bonds have been issued to fund the River City Renaissance program and various citywide capital improvements, and are supported by a pledge against the proceeds of the local government half-cent sales tax. JEA Charter Revenues (Capital Project Bonds) - Bonds have been issued to fund drainage and general capital programs, and are supported by a pledge against the JEA Contribution, which is annually appropriated to the City from available Electric and Water & Sewer revenues. Better Jacksonville Transportation Sales Tax - Bonds have been issued to fund acquisition and construction of road, bridge, drainage and other transportation projects, and are supported by a pledge against the discretionary half-cent Transportation Sales Tax and Gas Tax.
Better Jacksonville Infrastructure Sales Tax - Bonds have been issued to fund the acquisition and construction of capital projects constituting part of the Better Jacksonville Plan, and are supported by a pledge against the discretionary half-cent Infrastructure Sales Tax.
Sports Facilities Capital Improvement Revenues - Bonds have been issued to fund renovations to the Municipal Stadium, and are supported by a pledge against the proceeds of Franchise Fees, 15% of the Communications Services Taxes, Sports Facility Sales Tax Rebates, Convention Development Taxes and the Sports Facilities Tourist Development Taxes.
Range of Approximate Current year Current year Principal andremaining future principal revenue principal interest as %
term and interest received and interest of revenue
Excise Taxes: 2018 - 2035 65,391,945$ 123,118,353$ 15,278,660$ 12.4%
Local Government 1/2 Cent Sales Tax: 2019 15,461,338 93,673,586 7,751,375 8.3%
JEA Charter Revenues (Capital Project Bonds): 2035 138,239,682 115,822,950 5,138,281 4.4%
Better JacksonvilleTransportation Sales Tax: 2023 - 2038 642,264,650 95,956,142 46,665,007 48.6%
Better Jacksonville Infrastructure Sales Tax: 2019 - 2031 670,695,390 83,715,016 46,156,183 55.1%with SIB Loans: 2019 - 2031 703,434,589 83,715,016 52,600,483 62.8%
Sports Facilities Capital Improvement Revenues: 2031 136,217,675 23,054,410 10,177,050 44.1%
-103-
CITY OF JACKSONVILLE, FLORIDA NOTES TO FINANCIAL STATEMENTS FOR THE FISCAL YEAR ENDED SEPTEMBER 30, 2017
8. LONG-TERM OBLIGATIONS (continued) F. New Indebtedness Issued:
On September 20, 2017, the City closed on the sale of $112.9 million Special Revenue & Refunding Bonds, Series 2017A. The 2017A bonds have a true interest cost of 3.22% and an average coupon rate of 5.06% with a mandatory sinking schedule beginning October 1, 2018, and a maturity date of October 1, 2047. The proceeds of the 2017A bonds were used to refund a portion of the City’s Special Revenue Bonds, Series 2010A ($12.4 million) issued as Designated Maturity Debt; refund a portion of the City’s commercial paper notes ($40.8 million); and fund previously-approved capital project expenditures ($79.1 million). The issuance provided net proceeds of $133.7 million, which is inclusive of underwriter’s discount and cost of issuance totaling $0.7 million. On September 20, 2017, the City closed on the sale of $31.5 million Special Revenue Refunding Bonds, Series 2017B. The 2017B bonds have a true interest cost of 2.30% and an average coupon rate of 5.00% with a mandatory sinking schedule beginning October 1, 2024, and a maturity date of October 1, 2028. The proceeds of the 2017B bonds were used to refund a portion of the City’s Special Revenue Bonds, Series 2010B ($15.4 million) and Special Revenue Refunding Bonds, Series 2011B ($20.4 million), both issued as Designated Maturity Debt. The issuance provided net proceeds of $38.9 million, which is inclusive of underwriter’s discount and cost of issuance totaling $0.2 million. On September 27, 2017, the City made a draw on its Revolving Credit Facility with PNC Bank, N.A., in the amount of $17.6 million for the purposes of funding short-term projects and interim funding for long-term projects. The outstanding principal of draws on the Revolving Credit Facility bear interest at a fluctuating rate of 70% of the LIBOR Monthly Floating Rate, plus 0.28%.
(Remainder of page intentionally left blank)
-104-
CITY OF JACKSONVILLE, FLORIDA NOTES TO FINANCIAL STATEMENTS FOR THE FISCAL YEAR ENDED SEPTEMBER 30, 2017
8. LONG-TERM OBLIGATIONS (continued) G. Demand Bonds Issued by the City: The series of demand bonds listed below meets the criteria for inclusion as long term debt of
the City. $67,285,000 Capital Projects Bonds, Series 2008A:
Bond Terms - The Series 2008A Capital Projects Bonds (the Bonds) are uninsured variable rate demand bonds which mature and are remarketed every seven days at a reset interest rate. Liquidity Agreement Terms - Liquidity for the Bonds is provided by a Letter of Credit and Reimbursement Agreement (the Agreement) with the Bank of America (the Bank) dated July 1, 2008 and expiring July 15, 2018. Terms of Take Out - The Agreement contains a mandatory purchase provision requiring the Bank to purchase the Bonds if the Agreement is not replaced or renewed by the expiration date. If either i) the Bonds were to be purchased by the Bank or ii) the Bank extends an advance to the City under the Letter of Credit, then the City would be required to amortize the balance of the Bonds ($52,060,000 as of the current termination date) over 10 equal semi-annual installments beginning 6 months after the date of purchase or advance. As of September 30, 2017, there were no advances outstanding or bank bonds held under this Agreement.
(Remainder of page intentionally left blank)
-105-
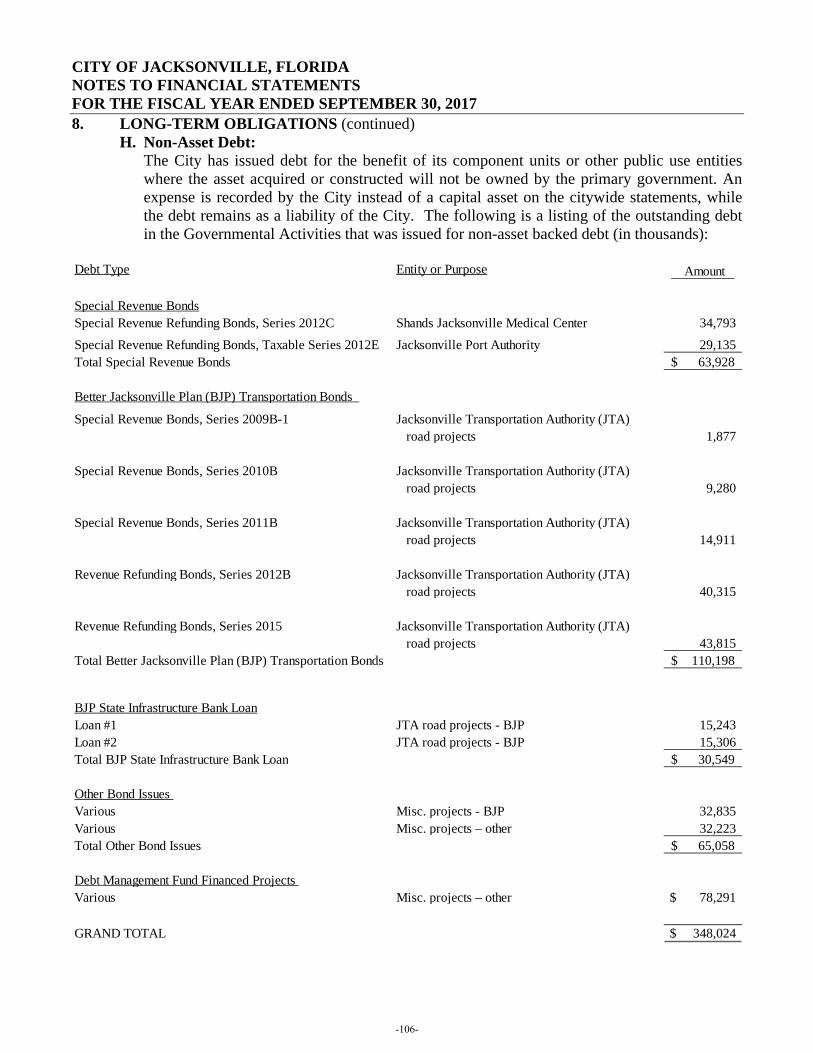
CITY OF JACKSONVILLE, FLORIDA NOTES TO FINANCIAL STATEMENTS FOR THE FISCAL YEAR ENDED SEPTEMBER 30, 2017
8. LONG-TERM OBLIGATIONS (continued) H. Non-Asset Debt:
The City has issued debt for the benefit of its component units or other public use entities where the asset acquired or constructed will not be owned by the primary government. An expense is recorded by the City instead of a capital asset on the citywide statements, while the debt remains as a liability of the City. The following is a listing of the outstanding debt in the Governmental Activities that was issued for non-asset backed debt (in thousands):
Debt Type Entity or Purpose Amount
Special Revenue Refunding Bonds, Series 2012C Shands Jacksonville Medical Center 34,793
Special Revenue Refunding Bonds, Taxable Series 2012E Jacksonville Port Authority 29,135 Total Special Revenue Bonds 63,928$
Better Jacksonville Plan (BJP) Transportation Bonds
Special Revenue Bonds, Series 2009B-1 Jacksonville Transportation Authority (JTA) road projects 1,877
Special Revenue Bonds, Series 2010B Jacksonville Transportation Authority (JTA) road projects 9,280
Special Revenue Bonds, Series 2011B Jacksonville Transportation Authority (JTA) road projects 14,911
Revenue Refunding Bonds, Series 2012B Jacksonville Transportation Authority (JTA) road projects 40,315
Revenue Refunding Bonds, Series 2015 Jacksonville Transportation Authority (JTA) road projects 43,815
Total Better Jacksonville Plan (BJP) Transportation Bonds 110,198$
BJP State Infrastructure Bank LoanLoan #1 JTA road projects - BJP 15,243 Loan #2 JTA road projects - BJP 15,306 Total BJP State Infrastructure Bank Loan 30,549$
Other Bond Issues Various Misc. projects - BJP 32,835 Various Misc. projects – other 32,223 Total Other Bond Issues 65,058$
Debt Management Fund Financed Projects Various Misc. projects – other $ 78,291
GRAND TOTAL $ 348,024
Special Revenue Bonds
-106-
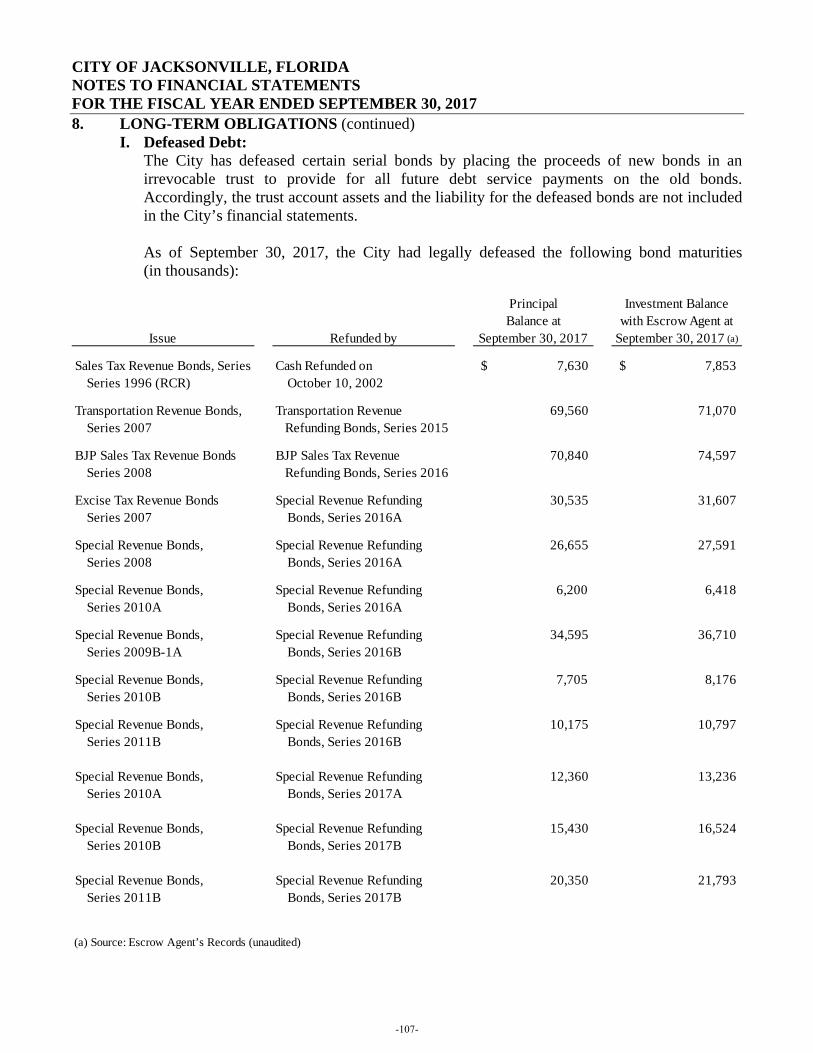
CITY OF JACKSONVILLE, FLORIDA NOTES TO FINANCIAL STATEMENTS FOR THE FISCAL YEAR ENDED SEPTEMBER 30, 2017
8. LONG-TERM OBLIGATIONS (continued) I. Defeased Debt:
The City has defeased certain serial bonds by placing the proceeds of new bonds in an irrevocable trust to provide for all future debt service payments on the old bonds. Accordingly, the trust account assets and the liability for the defeased bonds are not included in the City’s financial statements. As of September 30, 2017, the City had legally defeased the following bond maturities (in thousands):
Issue Refunded by
Principal Balance at
September 30, 2017
Investment Balance with Escrow Agent at
September 30, 2017 (a)
Sales Tax Revenue Bonds, Series Cash Refunded on $ 7,630 $ 7,853 Series 1996 (RCR) October 10, 2002
Transportation Revenue Bonds, Transportation Revenue 69,560 71,070 Series 2007 Refunding Bonds, Series 2015
BJP Sales Tax Revenue Bonds BJP Sales Tax Revenue 70,840 74,597 Series 2008 Refunding Bonds, Series 2016
Excise Tax Revenue Bonds Special Revenue Refunding 30,535 31,607 Series 2007 Bonds, Series 2016A
Special Revenue Bonds, Special Revenue Refunding 26,655 27,591 Series 2008 Bonds, Series 2016A
Special Revenue Bonds, Special Revenue Refunding 6,200 6,418 Series 2010A Bonds, Series 2016A
Special Revenue Bonds, Special Revenue Refunding 34,595 36,710 Series 2009B-1A Bonds, Series 2016B
Special Revenue Bonds, Special Revenue Refunding 7,705 8,176 Series 2010B Bonds, Series 2016B
Special Revenue Bonds, Special Revenue Refunding 10,175 10,797 Series 2011B Bonds, Series 2016B
Special Revenue Bonds, Special Revenue Refunding 12,360 13,236 Series 2010A Bonds, Series 2017A
Special Revenue Bonds, Special Revenue Refunding 15,430 16,524 Series 2010B Bonds, Series 2017B
Special Revenue Bonds, Special Revenue Refunding 20,350 21,793 Series 2011B Bonds, Series 2017B
(a) Source: Escrow Agent’s Records (unaudited)
-107-
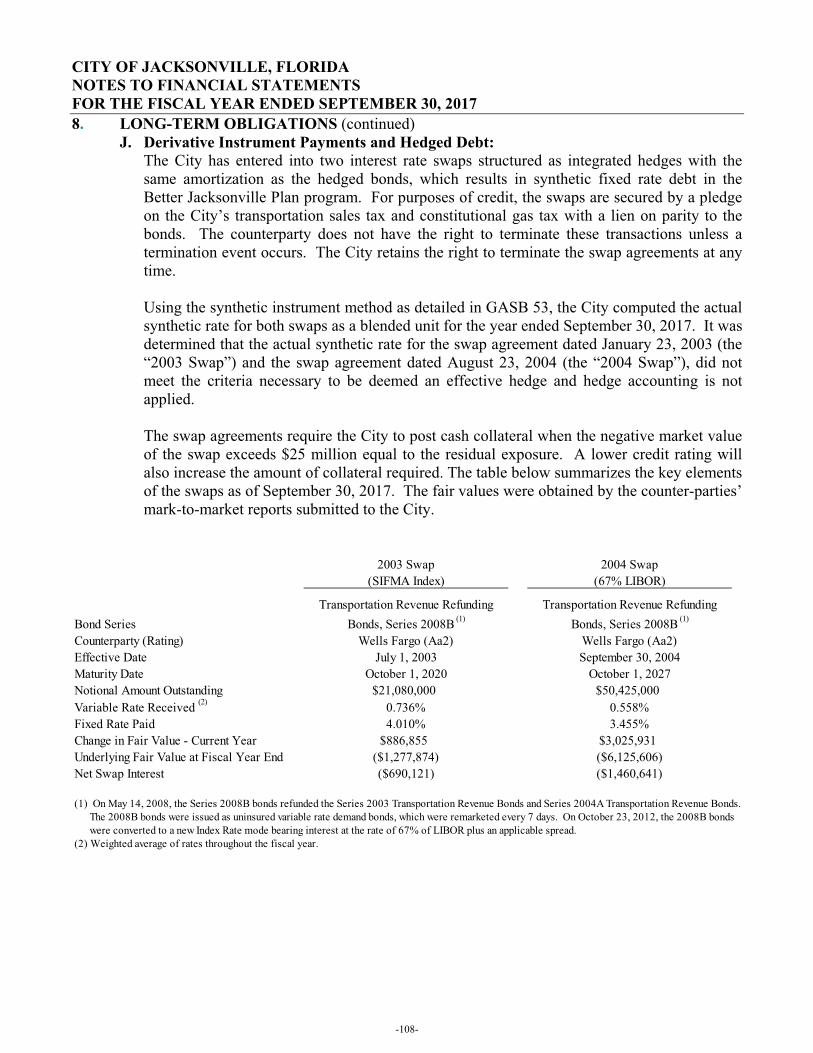
CITY OF JACKSONVILLE, FLORIDA NOTES TO FINANCIAL STATEMENTS FOR THE FISCAL YEAR ENDED SEPTEMBER 30, 20178. LONG-TERM OBLIGATIONS (continued)
J. Derivative Instrument Payments and Hedged Debt:The City has entered into two interest rate swaps structured as integrated hedges with the same amortization as the hedged bonds, which results in synthetic fixed rate debt in the Better Jacksonville Plan program. For purposes of credit, the swaps are secured by a pledge on the City’s transportation sales tax and constitutional gas tax with a lien on parity to the bonds. The counterparty does not have the right to terminate these transactions unless a termination event occurs. The City retains the right to terminate the swap agreements at any time.
Using the synthetic instrument method as detailed in GASB 53, the City computed the actual synthetic rate for both swaps as a blended unit for the year ended September 30, 2017. It was determined that the actual synthetic rate for the swap agreement dated January 23, 2003 (the “2003 Swap”) and the swap agreement dated August 23, 2004 (the “2004 Swap”), did not meet the criteria necessary to be deemed an effective hedge and hedge accounting is not applied.
The swap agreements require the City to post cash collateral when the negative market value of the swap exceeds $25 million equal to the residual exposure. A lower credit rating will also increase the amount of collateral required. The table below summarizes the key elements of the swaps as of September 30, 2017. The fair values were obtained by the counter-parties’ mark-to-market reports submitted to the City.
2003 Swap 2004 Swap(SIFMA Index) (67% LIBOR)
Bond SeriesTransportation Revenue Refunding
Bonds, Series 2008B (1)Transportation Revenue Refunding
Bonds, Series 2008B (1)
Counterparty (Rating) Wells Fargo (Aa2) Wells Fargo (Aa2)Effective Date July 1, 2003 September 30, 2004Maturity Date October 1, 2020 October 1, 2027Notional Amount Outstanding $21,080,000 $50,425,000Variable Rate Received (2) 0.736% 0.558%Fixed Rate Paid 4.010% 3.455%Change in Fair Value - Current Year $886,855 $3,025,931Underlying Fair Value at Fiscal Year End ($1,277,874) ($6,125,606)Net Swap Interest ($690,121) ($1,460,641)
(1) On May 14, 2008, the Series 2008B bonds refunded the Series 2003 Transportation Revenue Bonds and Series 2004A Transportation Revenue Bonds. The 2008B bonds were issued as uninsured variable rate demand bonds, which were remarketed every 7 days. On October 23, 2012, the 2008B bonds were converted to a new Index Rate mode bearing interest at the rate of 67% of LIBOR plus an applicable spread.(2) Weighted average of rates throughout the fiscal year.
-108-
CITY OF JACKSONVILLE, FLORIDA NOTES TO FINANCIAL STATEMENTS FOR THE FISCAL YEAR ENDED SEPTEMBER 30, 2017
8. LONG-TERM OBLIGATIONS (continued) J. Derivative Instrument Payments and Hedged Debt (continued)
Credit Risk - As of September 30, 2017, the City was not exposed to credit risk (the risk of economic loss due to a counterparty default on the swap agreements) because each swap had a negative fair value. However, should interest rates change and the fair values of the swaps become positive, the City would then be exposed to credit risk in the amount of the swap’s fair value. Basis Risk - Basis risk is the exposure of the issuer to the difference between the floating rate paid on a variable rate bond and the floating rate received from the swap counterparty. This may occur when the floating rate on the bonds is based on a different index than that is used under the swap agreement. This basis mismatch may result in a revenue shortfall when the variable rate payment received from the swap counterparty is less than the variable rate payment due on the bonds. As of September 30, 2017, the City has two floating-to-fixed rate swaps outstanding. The 2003 Swap agreement provides that the City receive a variable rate payment based on the SIFMA index. The 2004 Swap agreement provides that the City receive a variable rate payment of 67% of the one month LIBOR rate. On October 1, 2012, the City’s outstanding bonds related to the two swaps were converted to a variable Index Rate mode based on 67% of the one month LIBOR rate plus a spread. Therefore, the City is exposed to basis risk on the 2003 Swap. The City is currently not exposed to basis risk on the 2004 Swap.
Market Risk - As of September 30, 2017, the swaps expose the City to market risk (the risk of loss due to the pricing of the swap under the current economic environment) because each swap currently has a negative fair value. If the swaps were to be terminated under the current economic conditions, the City would be liable to the counterparty for a make-whole payment in the amount equal to the negative fair value.
(Remainder of page intentionally left blank)
-109-
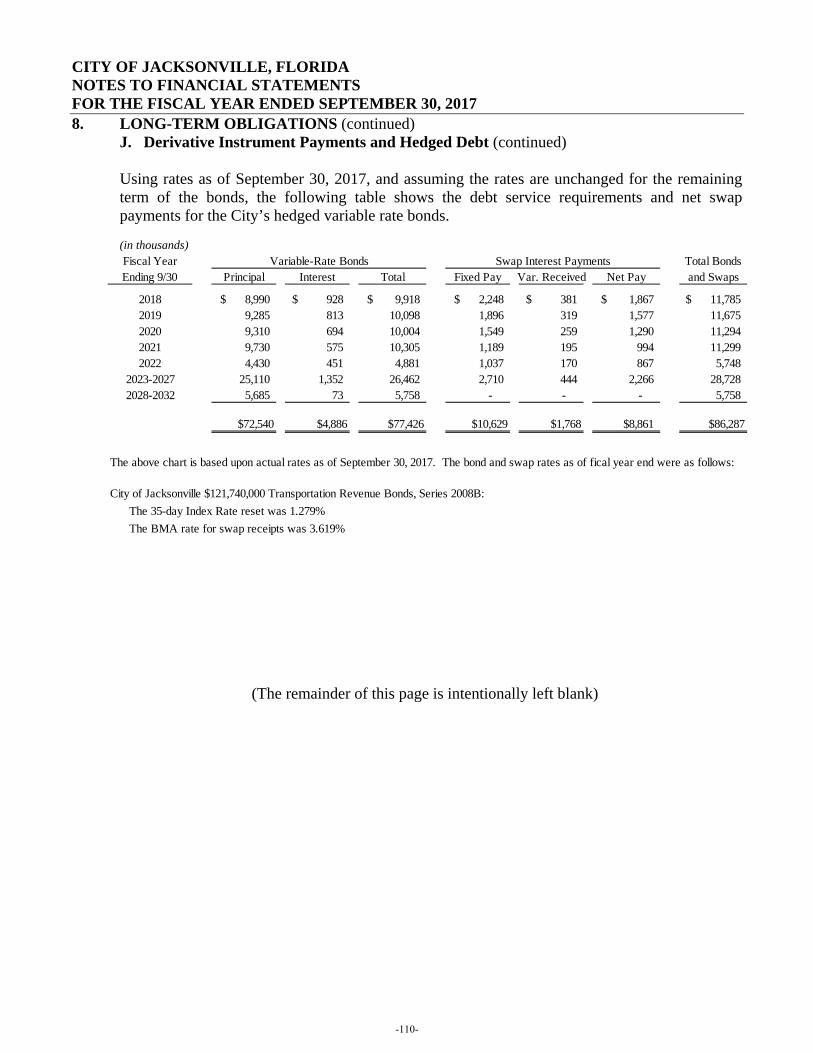
CITY OF JACKSONVILLE, FLORIDA NOTES TO FINANCIAL STATEMENTS FOR THE FISCAL YEAR ENDED SEPTEMBER 30, 2017
8. LONG-TERM OBLIGATIONS (continued) J. Derivative Instrument Payments and Hedged Debt (continued)
Using rates as of September 30, 2017, and assuming the rates are unchanged for the remaining term of the bonds, the following table shows the debt service requirements and net swap payments for the City’s hedged variable rate bonds. (in thousands)
(The remainder of this page is intentionally left blank)
Fiscal Year Total BondsEnding 9/30 Principal Interest Total Fixed Pay Var. Received Net Pay and Swaps
2018 8,990$ 928$ 9,918$ 2,248$ 381$ 1,867$ 11,785$ 2019 9,285 813 10,098 1,896 319 1,577 11,675 2020 9,310 694 10,004 1,549 259 1,290 11,294 2021 9,730 575 10,305 1,189 195 994 11,299 2022 4,430 451 4,881 1,037 170 867 5,748
2023-2027 25,110 1,352 26,462 2,710 444 2,266 28,728 2028-2032 5,685 73 5,758 - - - 5,758
$72,540 $4,886 $77,426 $10,629 $1,768 $8,861 $86,287
The above chart is based upon actual rates as of September 30, 2017. The bond and swap rates as of fical year end were as follows:
City of Jacksonville $121,740,000 Transportation Revenue Bonds, Series 2008B: The 35-day Index Rate reset was 1.279% The BMA rate for swap receipts was 3.619%
Swap Interest PaymentsVariable-Rate Bonds
-110-
CITY OF JACKSONVILLE, FLORIDA NOTES TO FINANCIAL STATEMENTS FOR THE FISCAL YEAR ENDED SEPTEMBER 30, 2017
8. LONG-TERM OBLIGATIONS (continued) K. Conduit Debt:
The City issued certain conduit debt in the form of industrial development revenue bonds (IDB's) and private activity bonds (PAB's) to provide financial assistance to private-sector entities for the acquisition and construction of industrial and commercial facilities deemed to be in the public interest. Conduit debt refers to certain limited-obligation revenue bonds or similar debt instruments issued by the City for the express purpose of providing capital financing for a specific nongovernmental third party. Although conduit debt bears the name of the City as issuer, it is collateralized by the resources provided by the loan with the third party on whose behalf they are issued. The City acts solely as a conduit issuer with respect to the debt. Conduit debt is collateralized by the property financed and is payable solely from payments received on the underlying mortgage loans. Upon repayment of the IDB's and PAB's, ownership of the acquired facilities transfers to the private-sector entity on whose behalf the bonds were issued. None of the assets or revenues of the City are pledged to the payment of IDB's or PAB's and under the constitution and laws of Florida, the City may not legally pledge any of its revenues or assets to the payment thereof. Neither the City, the state, nor any political subdivision thereof is obligated in any manner for repayment of the bonds. Accordingly, the bonds are not reported as liabilities in the accompanying financial statements. As of September 30, 2017, the City had $148,819,066 IDB's and PAB's total principal outstanding. From time to time, certain issues of such conduit debt may be in default or under investigation as to tax-exempt status of interest on such debt, however, this has no effect on the City's financial position. As of September 30, 2017, the City had a total of $94,811,367 in conduit debt consisting of Jacksonville Housing Finance Authority, formerly Duval County Housing Finance Authority Single Family and Multi-Family Bonds outstanding. The amount of Single Family Housing Revenue Bonds outstanding was $0. The amount of Multi-Family Housing Bonds outstanding was $94,811,367. Refunding of previous issues make up $0 of the total amount outstanding. As of September 30, 2017, additional conduit debt includes $1,029,104,401 Jacksonville Health Facilities Authority Bonds outstanding.
(The remainder of this page is intentionally left blank)
-111-
CITY OF JACKSONVILLE, FLORIDA NOTES TO FINANCIAL STATEMENTS FOR THE FISCAL YEAR ENDED SEPTEMBER 30, 2017
8. LONG-TERM OBLIGATIONS (continued) L. Interest Expense:
Total interest expense for the fiscal year ended September 30, 2017 was $78.4 million for governmental activities and $12.0 million for business-type activities.
M. Component Unit Long-Term Debt: The long-term debt presentations for the major component units in Note 8A through Note 8C contains highly summarized data. Detailed debt presentations are available in each major component unit’s separately issued financial report, which may be obtained from the finance offices below. JEA 21 West Church Street Jacksonville, Florida 32202 JPA P.O. Box 3005 Jacksonville, Florida 32206-0005 JTA 121 West Forsyth Street, Suite 200 Jacksonville, Florida 32202
(The remainder of this page is intentionally left blank)
-112-
CITY OF JACKSONVILLE, FLORIDA NOTES TO FINANCIAL STATEMENTS FOR THE FISCAL YEAR ENDED SEPTEMBER 30, 2017
9. A. PENSION PLANS The City’s pension plans adopted GASB Statement No. 67, Financial reporting for Pension Plans – an amendment of GASB Statement No. 25, Financial reporting for Pension Plans required for fiscal periods beginning after June 15, 2013 in fiscal year 2014. This Statement modifies financial reporting by state and local government pension plans that present pension trust funds. The City adopted GASB Statement No. 68, Accounting and Financial Reporting for Pension – an amendment of GASB Statement No. 27, and Statement No. 71, Pension Transition for Contributions Made Subsequent to the Measurement Date—an amendment of GASB Statement No. 68 required for fiscal periods beginning after June 15, 2014, in fiscal year 2015. This Statement modifies accounting and financial reporting by state and local governments for pensions. Accordingly, disclosures required for the City’s pension plans are presented in accordance with GASB Statement No. 67, and disclosures required for employers regarding pension plans are presented in accordance with GASB Statement No. 68 as modified by GASB Statement No. 71. 1. Summary of Significant Accounting Policies
a) Basis of Accounting – The City’s pension trust financial statements are prepared using the accrual basis of accounting. Contributions, benefit payments and refunds are recognized when due and payable in accordance with the terms of each plan. The Florida Constitution and the Division of Retirement requires plan contributions be made annually in amounts determined by an actuarial valuation stated as a percent of covered payroll or in dollars. The Florida Division of Retirement reviews and approves the City’s actuarial report to ensure compliance with actuarial standards.
b) Method Used to Value Investments – Investments are reported at fair value. Securities traded on a national or international exchange are valued at the last reported sales price at current exchange rates. The fair value of real estate investments is based on independent appraisals or estimates of fair value as provided by third party fund managers. Investments that do not have an established market are reported at estimated fair value as provided by third party fund managers. Investments are managed by third party money managers while cash and securities are generally held by the City’s independent custodian. The City receives a monthly reconciliation of any material differences in pricing by the custodian and manager.
2. Plan Description a) Plan Administration - The City sponsors two public employee retirement systems (PERS)
administered by separate pension boards of trustees that provide retirement, death and disability benefits: the City of Jacksonville Retirement System (JRS) and the Police and Fire Pension Plan. The JRS arises out of Chapter 16 of the City Charter, Chapter 120 of Ordinance Code of the City of Jacksonville, and Chapter 112, Part VII, Florida Statutes. The City Council is responsible for establishing or amending the pension plan provisions. The Police and Fire Plan (PFPF) is administered independently by a five-member board. Substantially all employees of the City participate in one of these two plans with less than 1% of City employees participating in the State of Florida Retirement System.
The JRS is a multiple employer cost sharing, contributory defined benefit pension plan
with a defined contribution alternative. JRS includes both the General Employees Retirement Plan (GERP) and the Corrections Officers Retirement Plan (CORP). Effective October 1, 2009, the City added an employee choice defined contribution alternative to the defined benefit plan for all members of the GERP. The City hired a third party administrator to assist employees with the management of their individual accounts within a number of investment options including model portfolios.
-113-
CITY OF JACKSONVILLE, FLORIDA NOTES TO FINANCIAL STATEMENTS FOR THE FISCAL YEAR ENDED SEPTEMBER 30, 2017
9. A. PENSION PLANS (continued) 2. Plan Description (continued)
a) Plan Administration (continued) All full-time employees of the City, JEA (Jacksonville Electric Authority), JHA (Jacksonville Housing Authority) and NFTPO (North Florida Transportation Planning Authority) are eligible to participate in GERP upon employment. All certified corrections officers employed by the City are eligible to participate in the CORP upon employment. There are no separately issued financial statements for the City of Jacksonville Retirement System.
b) The Jacksonville Retirement System is administered by a nine (9) member Board of Trustees. The Board is comprised of the following officers:
i. The Chief Administrative Officer of the City or designee; ii. The Chief Financial Officer or designee;
iii. The Chief Human Resources Officer; iv. The Chairperson of the General Employees’ Pension Advisory Committee; v. The Chairperson of the Corrections Officers’ Advisory Committee;
vi. A GERP retiree chosen by the Retired Employees’ Association; vii. A retired corrections officer chosen by the Corrections Officers’ Advisory
Committee. viii. Two citizens appointed by the City Council with professional experience in
finance, investments, economics, pension management, pension administration and/or accounting.
The General Employees’ Advisory Committee consists of seven (7) members. Six (6) members are elected from among the active contributing participants of the GERP and one (1) member is a retiree elected by the Retired Employees Association. Committee members are elected in even years for a two (2) year term. The Advisory Committee performs all fact finding duties for retirement benefit applications, recommends approval or denial of benefits and reviews all applications to participate in the GERP to the Board of Trustees. The Corrections Officers Advisory Committee consists of five (5) members who must be active contributing members of the CORP. Committee members are elected in even years for a two (2) year term. The Advisory Committee performs all fact finding duties for retirement benefit applications, recommends approval or denial of benefits and all applications to participate in the CORP to the Board of Trustees.
3. The Police and Fire Pension Plan is a single-employer contributory defined benefit pension plan covering all full-time certified police officers and firefighters employed by the City of Jacksonville Sheriff’s Office and Fire and Rescue Department, respectively. The separately issued financial statements for the PFPF are available from the Police and Fire Pension Fund, located at One West Adams Street, Suite 100, Jacksonville, FL 32202.
-114-
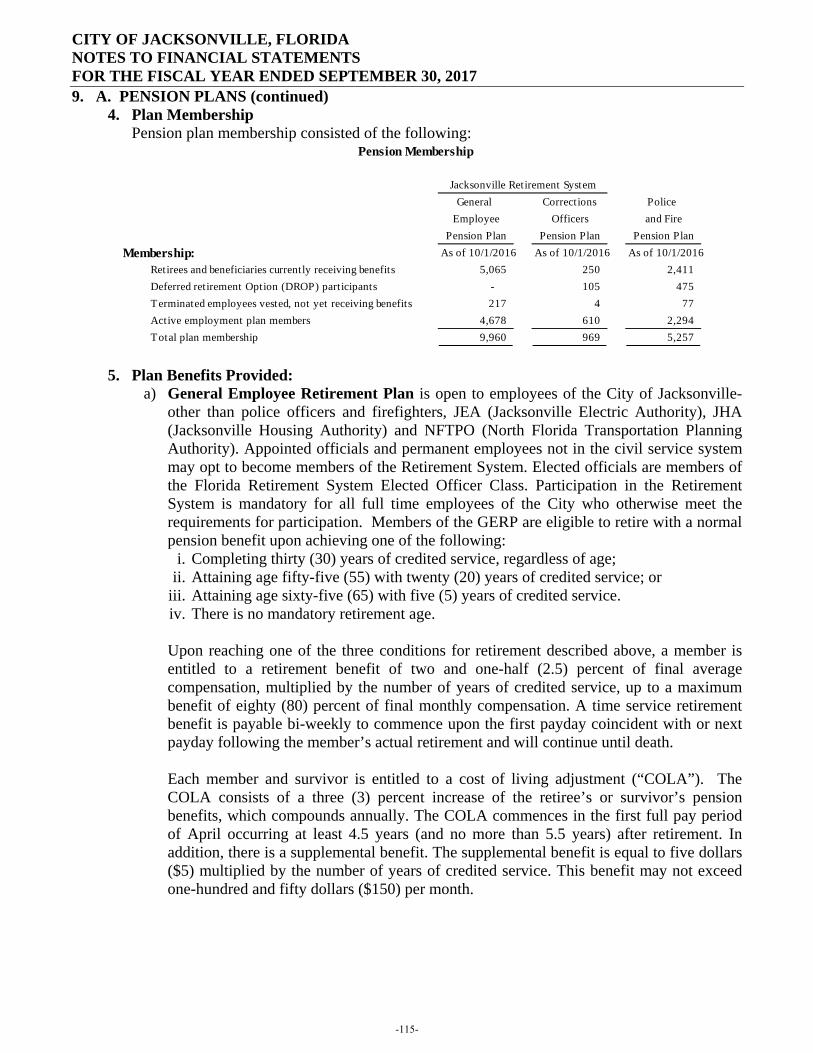
CITY OF JACKSONVILLE, FLORIDA NOTES TO FINANCIAL STATEMENTS FOR THE FISCAL YEAR ENDED SEPTEMBER 30, 2017
9. A. PENSION PLANS (continued) 4. Plan Membership
Pension plan membership consisted of the following:
5. Plan Benefits Provided: a) General Employee Retirement Plan is open to employees of the City of Jacksonville-
other than police officers and firefighters, JEA (Jacksonville Electric Authority), JHA (Jacksonville Housing Authority) and NFTPO (North Florida Transportation Planning Authority). Appointed officials and permanent employees not in the civil service system may opt to become members of the Retirement System. Elected officials are members of the Florida Retirement System Elected Officer Class. Participation in the Retirement System is mandatory for all full time employees of the City who otherwise meet the requirements for participation. Members of the GERP are eligible to retire with a normal pension benefit upon achieving one of the following:
i. Completing thirty (30) years of credited service, regardless of age; ii. Attaining age fifty-five (55) with twenty (20) years of credited service; or
iii. Attaining age sixty-five (65) with five (5) years of credited service. iv. There is no mandatory retirement age.
Upon reaching one of the three conditions for retirement described above, a member is entitled to a retirement benefit of two and one-half (2.5) percent of final average compensation, multiplied by the number of years of credited service, up to a maximum benefit of eighty (80) percent of final monthly compensation. A time service retirement benefit is payable bi-weekly to commence upon the first payday coincident with or next payday following the member’s actual retirement and will continue until death. Each member and survivor is entitled to a cost of living adjustment (“COLA”). The COLA consists of a three (3) percent increase of the retiree’s or survivor’s pension benefits, which compounds annually. The COLA commences in the first full pay period of April occurring at least 4.5 years (and no more than 5.5 years) after retirement. In addition, there is a supplemental benefit. The supplemental benefit is equal to five dollars ($5) multiplied by the number of years of credited service. This benefit may not exceed one-hundred and fifty dollars ($150) per month.
General Corrections Police Employee Officers and Fire
Pension Plan Pension Plan Pension PlanMembership: As of 10/1/2016 As of 10/1/2016 As of 10/1/2016
Retirees and beneficiaries currently receiving benefits 5,065 250 2,411 Deferred retirement Option (DROP) participants - 105 475 Terminated employees vested, not yet receiving benefits 217 4 77 Active employment plan members 4,678 610 2,294 Total plan membership 9,960 969 5,257
Jacksonville Retirement System
Pension Membership
-115-
CITY OF JACKSONVILLE, FLORIDA NOTES TO FINANCIAL STATEMENTS FOR THE FISCAL YEAR ENDED SEPTEMBER 30, 2017
9. A. PENSION PLANS (continued) 5. Plan Benefits Provided (continued)
b) The Corrections Officers’ Retirement Plan is open solely to corrections officer employees of the City. Participation in the Retirement System is mandatory for all full time corrections officers of the City who otherwise meet the requirements for participation. Members of the Corrections Officers’ Retirement Plan are eligible to retire with a full pension benefit upon achieving one of the following:
i. completing twenty (20) years of service, regardless of age; or ii. attaining age sixty-five (65) with five (5) years of service.
iii. There is no mandatory retirement age. Upon reaching one of the above described conditions required for a time service retirement. A member's time service retirement benefit is calculated as follows:
i. The first twenty (20) years of credited service are multiplied by three (3) percent of final monthly compensation, up to a maximum of sixty (60) percent of final monthly compensation.
ii. For service time beyond twenty (20) years of credited service, the number of years and months in excess of twenty (20) years is multiplied by two (2) percent of final monthly compensation, up to a maximum of twenty (20) percent of final monthly compensation.
A member's time service retirement benefit may not exceed eighty (80) percent of final monthly compensation. A time service retirement is payable on a bi-weekly basis and will continue until death. Each member and survivor is entitled to a cost of living adjustment (“COLA”). The COLA consists of a three (3) percent annual increase of the retiree’s or survivor’s pension benefits, which compounds annually. In addition, there is a supplemental benefit equal to five dollars ($5) multiplied by the number of years of credited service. This benefit may not exceed one-hundred and fifty dollars ($150) per month. The Deferred Retirement Option Program (“DROP”) is a program in which a member defers receipt of normal retirement benefits while continuing employment with the City. If a member elects to participate in the DROP, they must terminate their employment with the City of Jacksonville and retire from service no later than the end of the DROP participation period previously designated. Upon the effective date of participating in the DROP, a member’s years of service and final monthly compensation become frozen for purposes of determining pension benefits. Additional service beyond the date of DROP participation no longer accrues any additional benefits under the Retirement System. The deferred monthly retirement benefits accrue in the Corrections Officers’ Pension Plan on behalf of the member, plus interest compounded monthly, for the time of DROP participation. The interest paid on the DROP balance accrues at the same rate as the investment portfolio held by the Retirement System. In addition, the Corrections Officers Pension Plan will deduct two (2) percent from base pay and any service raise of DROP participants as their member contributions instead of the normal eight (8) percent deduction.
-116-
CITY OF JACKSONVILLE, FLORIDA NOTES TO FINANCIAL STATEMENTS FOR THE FISCAL YEAR ENDED SEPTEMBER 30, 2017
9. A. PENSION PLANS (continued) 5. Plan Benefits Provided (continued)
b) The Corrections Officers’ Retirement Plan (continued) - Upon termination of employment, the member will receive the total DROP benefits and begin to receive the previously determined normal retirement benefits. The money that accumulates during DROP participation may be distributed in accordance with the criteria set forth in Municipal Code Section 120. The balance of the DROP benefits held in trust for DROP Participants totaled $15.6 million as of September 30, 2017.
c) The Police and Fire Pension plan provides retirement, disability and death benefits. Retirement benefits are calculated as 3 percent of the employee’s final 2-year average salary times the employee’s years of service up to 20 years and 2 percent thereafter (80 percent maximum benefit). Employees with 5 or more years of continuous service are eligible to retire at 20 years from the date of employment. Benefits are increased 3 percent annually after retirement.
Employees are eligible for non-duty related death and disability benefits after 10 years of service and for duty-related death and disability benefits upon hire. Terminated vested employees have the option to withdraw their contributions, while non-vested terminated employees must withdraw their contributions. In April 2017, the City Council passed legislation dedicating a Pension Liability Surtax as a funding source for the General Employees’ Retirement Plan, Corrections Officers’ Plan and the Police and Fire Pension Plan. The benefits that were modified in 2015, impacting both existing employees and new hires were repealed by the new legislation. The bill deletes the definitions of Group I and Group II members (hired before and after the effective date of Ordinance 2015-304-E) and provides that no employee hired on or after October 1, 2017 is eligible for membership in the Police and Fire defined benefit pension plan and must be a member of the defined contribution plan. The employee contribution rate to the defined benefit pension is increased from 8% to 10% of salary and the employer contribution is set as the actuarially determined Employer Contribution as provided in relevant statutes and ordinances. For a full breakdown of the new benefit package please see City Ordinance Code Section 121, Part 2. For a full description of benefits provided by PFPF, refer to the separately issued financial statements for the Police and Fire Pension Plan that are available from the Police and Fire Pension Fund, located at One West Adams Street, Suite 100, Jacksonville, FL 32202.
d) Florida Retirement System Plan Description - The City also participates in the Florida Retirement System (FRS), a multiple-employer cost-sharing retirement system which covers less than 1% of the City’s full-time employees. FRS is a defined-benefit contributory retirement plan, administered by the State of Florida, Division of Retirement. The System provides vesting of benefits after six years of creditable service. Members are eligible for normal retirement after they have met one of the following; (1) after 30 years of service regardless of age; (2) six years of service and age 62; or (3) 25 years special risk service (age 55 if not continuous). Early retirement may be taken any time after completing six years of service; however, there is a 5% benefit reduction for each year prior to normal retirement.
-117-
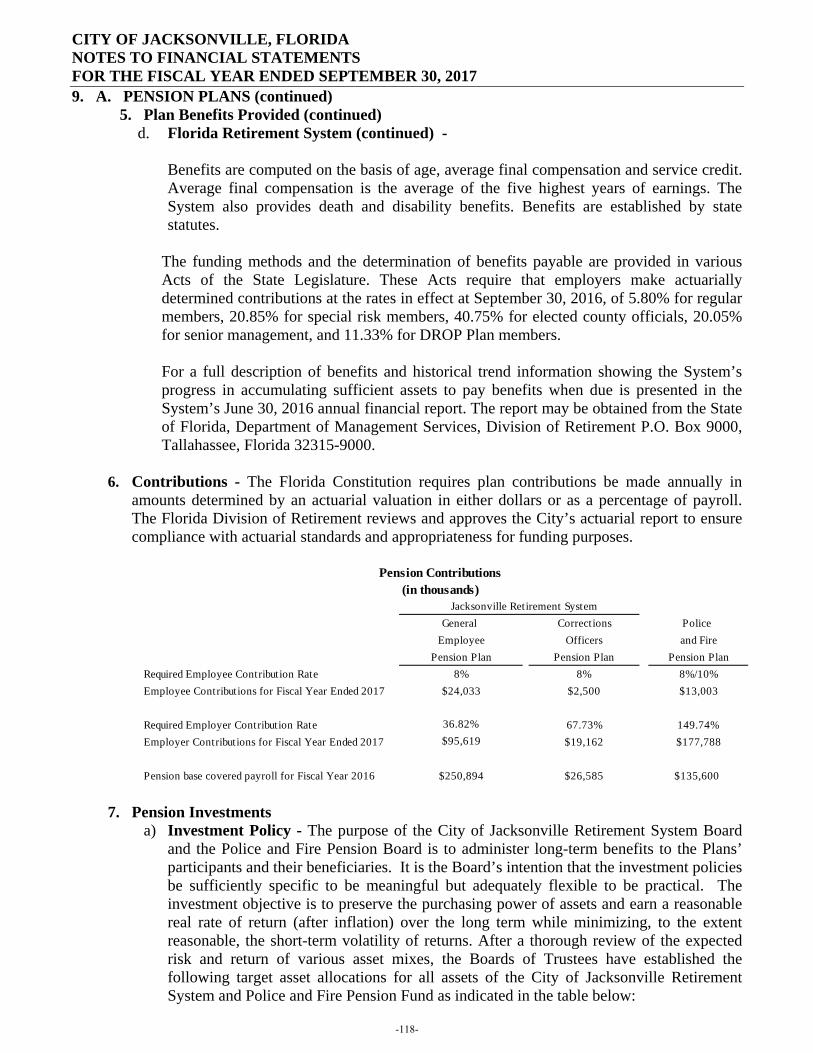
CITY OF JACKSONVILLE, FLORIDA NOTES TO FINANCIAL STATEMENTS FOR THE FISCAL YEAR ENDED SEPTEMBER 30, 2017
9. A. PENSION PLANS (continued) 5. Plan Benefits Provided (continued)
d. Florida Retirement System (continued) -
Benefits are computed on the basis of age, average final compensation and service credit. Average final compensation is the average of the five highest years of earnings. The System also provides death and disability benefits. Benefits are established by state statutes.
The funding methods and the determination of benefits payable are provided in various Acts of the State Legislature. These Acts require that employers make actuarially determined contributions at the rates in effect at September 30, 2016, of 5.80% for regular members, 20.85% for special risk members, 40.75% for elected county officials, 20.05% for senior management, and 11.33% for DROP Plan members. For a full description of benefits and historical trend information showing the System’s progress in accumulating sufficient assets to pay benefits when due is presented in the System’s June 30, 2016 annual financial report. The report may be obtained from the State of Florida, Department of Management Services, Division of Retirement P.O. Box 9000, Tallahassee, Florida 32315-9000.
6. Contributions - The Florida Constitution requires plan contributions be made annually in
amounts determined by an actuarial valuation in either dollars or as a percentage of payroll. The Florida Division of Retirement reviews and approves the City’s actuarial report to ensure compliance with actuarial standards and appropriateness for funding purposes.
7. Pension Investments
a) Investment Policy - The purpose of the City of Jacksonville Retirement System Board and the Police and Fire Pension Board is to administer long-term benefits to the Plans’ participants and their beneficiaries. It is the Board’s intention that the investment policies be sufficiently specific to be meaningful but adequately flexible to be practical. The investment objective is to preserve the purchasing power of assets and earn a reasonable real rate of return (after inflation) over the long term while minimizing, to the extent reasonable, the short-term volatility of returns. After a thorough review of the expected risk and return of various asset mixes, the Boards of Trustees have established the following target asset allocations for all assets of the City of Jacksonville Retirement System and Police and Fire Pension Fund as indicated in the table below:
General Corrections Police Employee Officers and Fire
Pension Plan Pension Plan Pension PlanRequired Employee Contribution Rate 8% 8% 8%/10%Employee Contributions for Fiscal Year Ended 2017 $24,033 $2,500 $13,003
Required Employer Contribution Rate 36.82% 67.73% 149.74%Employer Contributions for Fiscal Year Ended 2017 $95,619 $19,162 $177,788
Pension base covered payroll for Fiscal Year 2016 $250,894 $26,585 $135,600
(in thousands)Pension Contributions
Jacksonville Retirement System
-118-
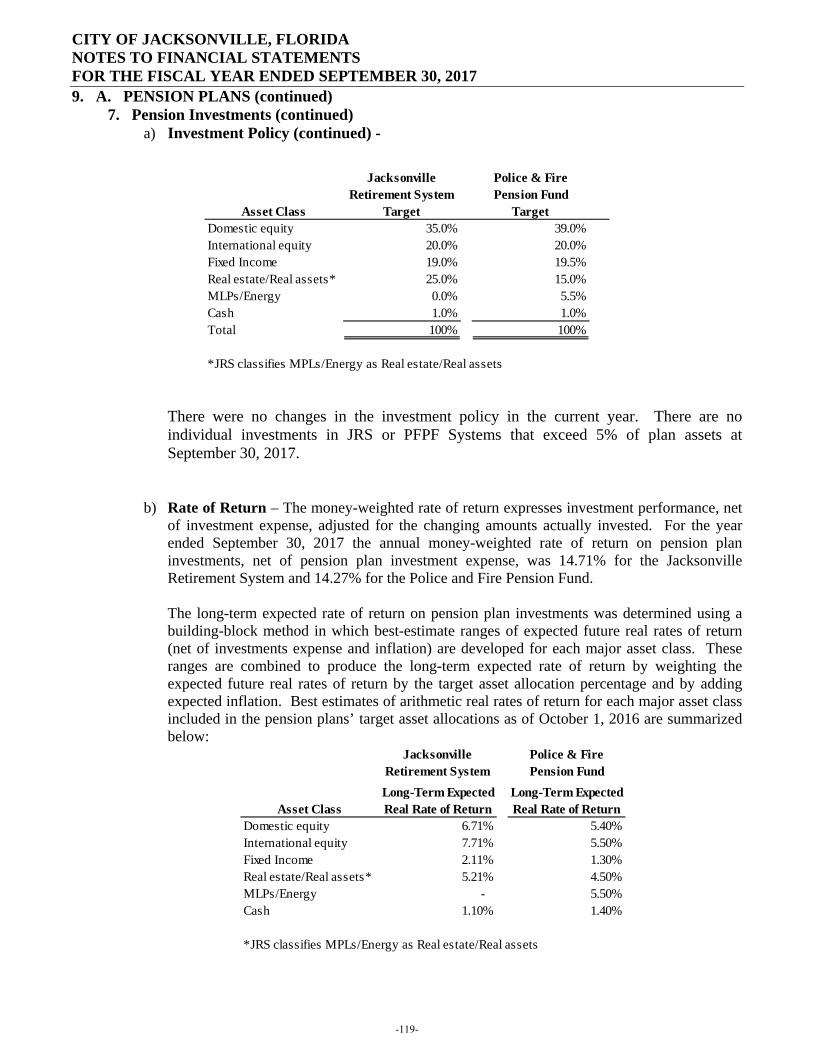
CITY OF JACKSONVILLE, FLORIDA NOTES TO FINANCIAL STATEMENTS FOR THE FISCAL YEAR ENDED SEPTEMBER 30, 2017
9. A. PENSION PLANS (continued) 7. Pension Investments (continued)
a) Investment Policy (continued) -
There were no changes in the investment policy in the current year. There are no individual investments in JRS or PFPF Systems that exceed 5% of plan assets at September 30, 2017.
b) Rate of Return – The money-weighted rate of return expresses investment performance, net of investment expense, adjusted for the changing amounts actually invested. For the year ended September 30, 2017 the annual money-weighted rate of return on pension plan investments, net of pension plan investment expense, was 14.71% for the Jacksonville Retirement System and 14.27% for the Police and Fire Pension Fund.
The long-term expected rate of return on pension plan investments was determined using a building-block method in which best-estimate ranges of expected future real rates of return (net of investments expense and inflation) are developed for each major asset class. These ranges are combined to produce the long-term expected rate of return by weighting the expected future real rates of return by the target asset allocation percentage and by adding expected inflation. Best estimates of arithmetic real rates of return for each major asset class included in the pension plans’ target asset allocations as of October 1, 2016 are summarized below:
Jacksonville Retirement System
Police & Fire Pension Fund
Asset Class Target TargetDomestic equity 35.0% 39.0%International equity 20.0% 20.0%Fixed Income 19.0% 19.5%Real estate/Real assets* 25.0% 15.0%MLPs/Energy 0.0% 5.5%Cash 1.0% 1.0%Total 100% 100%
*JRS classifies MPLs/Energy as Real estate/Real assets
Jacksonville Retirement System
Police & Fire Pension Fund
Asset Class Long-Term Expected Real Rate of Return
Long-Term Expected Real Rate of Return
Domestic equity 6.71% 5.40%International equity 7.71% 5.50%Fixed Income 2.11% 1.30%Real estate/Real assets* 5.21% 4.50%MLPs/Energy - 5.50%Cash 1.10% 1.40%
*JRS classifies MPLs/Energy as Real estate/Real assets
-119-
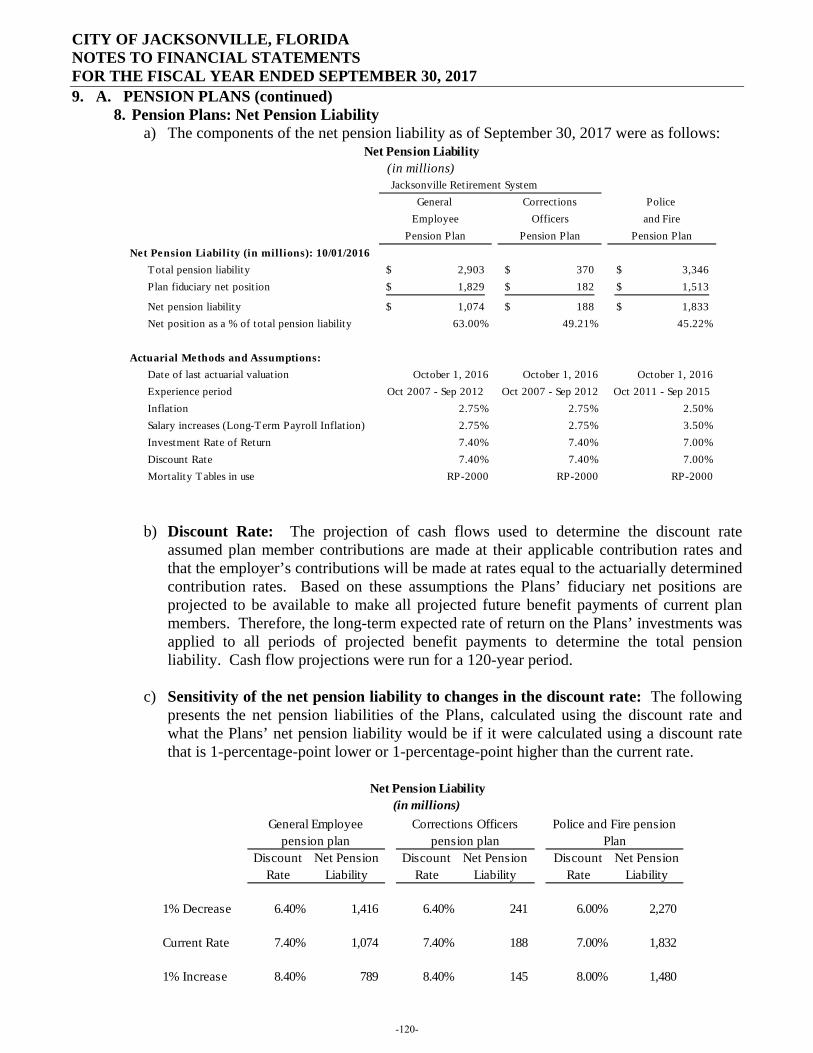
CITY OF JACKSONVILLE, FLORIDA NOTES TO FINANCIAL STATEMENTS FOR THE FISCAL YEAR ENDED SEPTEMBER 30, 2017
9. A. PENSION PLANS (continued) 8. Pension Plans: Net Pension Liability
a) The components of the net pension liability as of September 30, 2017 were as follows:
b) Discount Rate: The projection of cash flows used to determine the discount rate assumed plan member contributions are made at their applicable contribution rates and that the employer’s contributions will be made at rates equal to the actuarially determined contribution rates. Based on these assumptions the Plans’ fiduciary net positions are projected to be available to make all projected future benefit payments of current plan members. Therefore, the long-term expected rate of return on the Plans’ investments was applied to all periods of projected benefit payments to determine the total pension liability. Cash flow projections were run for a 120-year period.
c) Sensitivity of the net pension liability to changes in the discount rate: The following
presents the net pension liabilities of the Plans, calculated using the discount rate and what the Plans’ net pension liability would be if it were calculated using a discount rate that is 1-percentage-point lower or 1-percentage-point higher than the current rate.
Jacksonville Retirement SystemGeneral Corrections Police
Employee Officers and FirePension Plan Pension Plan Pension Plan
Net Pension Liability (in millions): 10/01/2016Total pension liability 2,903$ 370$ 3,346$ Plan fiduciary net position 1,829$ 182$ 1,513$
Net pension liability 1,074$ 188$ 1,833$ Net position as a % of total pension liability 63.00% 49.21% 45.22%
Actuarial Methods and Assumptions:Date of last actuarial valuation October 1, 2016 October 1, 2016 October 1, 2016Experience period Oct 2007 - Sep 2012 Oct 2007 - Sep 2012 Oct 2011 - Sep 2015Inflation 2.75% 2.75% 2.50%Salary increases (Long-Term Payroll Inflation) 2.75% 2.75% 3.50%Investment Rate of Return 7.40% 7.40% 7.00%Discount Rate 7.40% 7.40% 7.00%Mortality Tables in use RP-2000 RP-2000 RP-2000
Net Pension Liability(in millions)
Discount Rate
Net Pension Liability
Discount Rate
Net Pension Liability
Discount Rate
Net Pension Liability
1% Decrease 6.40% 1,416 6.40% 241 6.00% 2,270
Current Rate 7.40% 1,074 7.40% 188 7.00% 1,832
1% Increase 8.40% 789 8.40% 145 8.00% 1,480
Net Pension Liability(in millions)
General Employee pension plan
Corrections Officers pension plan
Police and Fire pension Plan
-120-
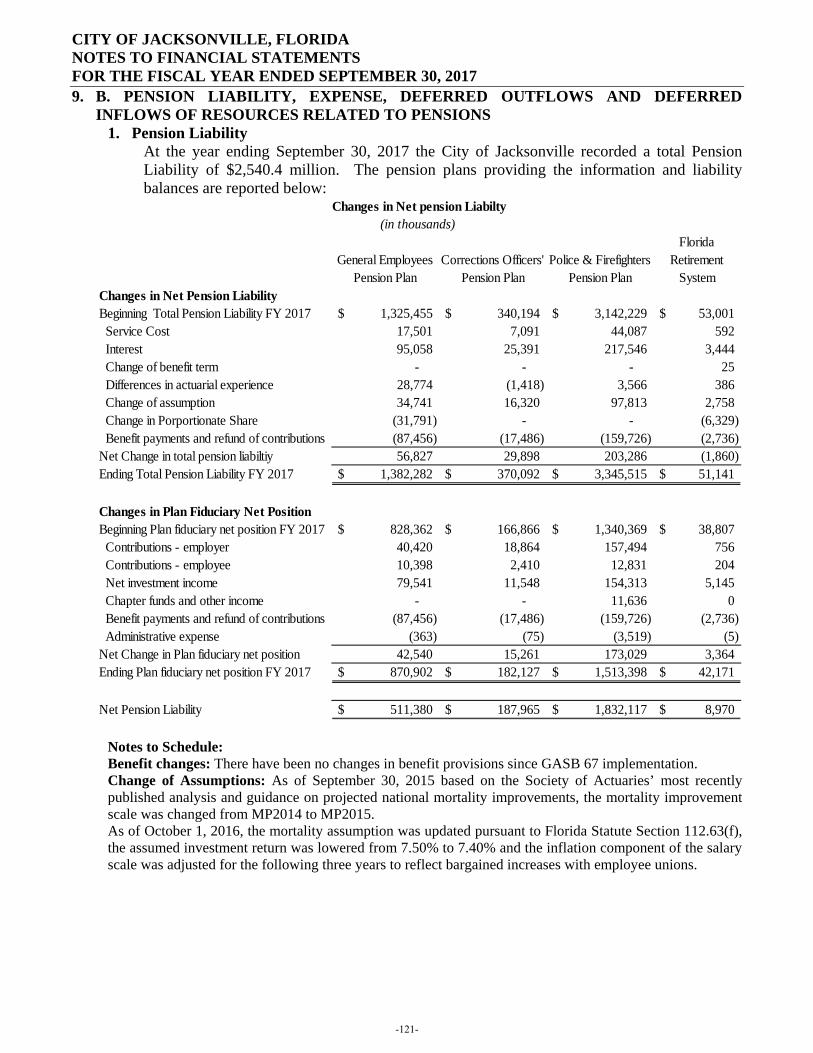
CITY OF JACKSONVILLE, FLORIDA NOTES TO FINANCIAL STATEMENTS FOR THE FISCAL YEAR ENDED SEPTEMBER 30, 2017
9. B. PENSION LIABILITY, EXPENSE, DEFERRED OUTFLOWS AND DEFERRED INFLOWS OF RESOURCES RELATED TO PENSIONS
1. Pension Liability At the year ending September 30, 2017 the City of Jacksonville recorded a total Pension Liability of $2,540.4 million. The pension plans providing the information and liability balances are reported below:
Notes to Schedule: Benefit changes: There have been no changes in benefit provisions since GASB 67 implementation. Change of Assumptions: As of September 30, 2015 based on the Society of Actuaries’ most recently published analysis and guidance on projected national mortality improvements, the mortality improvement scale was changed from MP2014 to MP2015. As of October 1, 2016, the mortality assumption was updated pursuant to Florida Statute Section 112.63(f), the assumed investment return was lowered from 7.50% to 7.40% and the inflation component of the salary scale was adjusted for the following three years to reflect bargained increases with employee unions.
General Employees Pension Plan
Corrections Officers' Pension Plan
Police & Firefighters Pension Plan
Florida Retirement
SystemChanges in Net Pension LiabilityBeginning Total Pension Liability FY 2017 1,325,455$ 340,194$ 3,142,229$ 53,001$ Service Cost 17,501 7,091 44,087 592 Interest 95,058 25,391 217,546 3,444 Change of benefit term - - - 25 Differences in actuarial experience 28,774 (1,418) 3,566 386 Change of assumption 34,741 16,320 97,813 2,758 Change in Porportionate Share (31,791) - - (6,329) Benefit payments and refund of contributions (87,456) (17,486) (159,726) (2,736) Net Change in total pension liabiltiy 56,827 29,898 203,286 (1,860) Ending Total Pension Liability FY 2017 1,382,282$ 370,092$ 3,345,515$ 51,141$
Changes in Plan Fiduciary Net PositionBeginning Plan fiduciary net position FY 2017 828,362$ 166,866$ 1,340,369$ 38,807$ Contributions - employer 40,420 18,864 157,494 756 Contributions - employee 10,398 2,410 12,831 204 Net investment income 79,541 11,548 154,313 5,145 Chapter funds and other income - - 11,636 0 Benefit payments and refund of contributions (87,456) (17,486) (159,726) (2,736) Administrative expense (363) (75) (3,519) (5) Net Change in Plan fiduciary net position 42,540 15,261 173,029 3,364 Ending Plan fiduciary net position FY 2017 870,902$ 182,127$ 1,513,398$ 42,171$
Net Pension Liability 511,380$ 187,965$ 1,832,117$ 8,970$
Changes in Net pension Liabilty(in thousands)
-121-
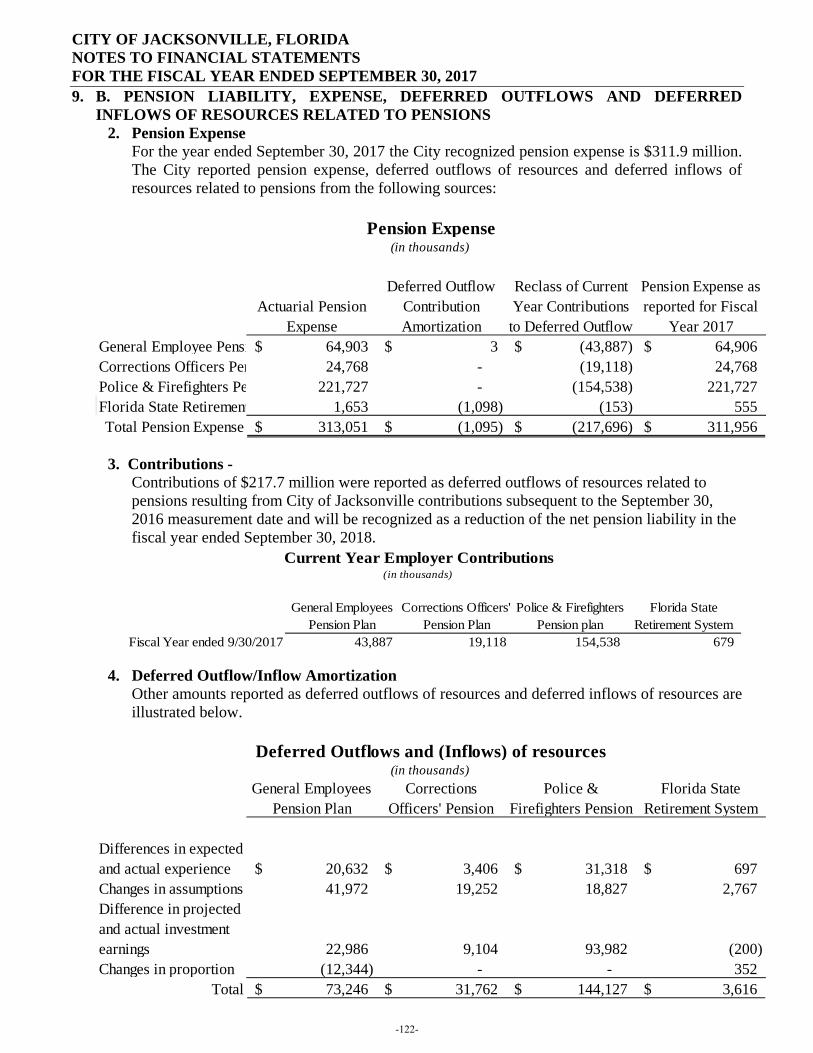
CITY OF JACKSONVILLE, FLORIDA NOTES TO FINANCIAL STATEMENTS FOR THE FISCAL YEAR ENDED SEPTEMBER 30, 2017
9. B. PENSION LIABILITY, EXPENSE, DEFERRED OUTFLOWS AND DEFERRED INFLOWS OF RESOURCES RELATED TO PENSIONS
2. Pension Expense For the year ended September 30, 2017 the City recognized pension expense is $311.9 million. The City reported pension expense, deferred outflows of resources and deferred inflows of resources related to pensions from the following sources:
3. Contributions -
Contributions of $217.7 million were reported as deferred outflows of resources related to pensions resulting from City of Jacksonville contributions subsequent to the September 30, 2016 measurement date and will be recognized as a reduction of the net pension liability in the fiscal year ended September 30, 2018.
4. Deferred Outflow/Inflow Amortization
Other amounts reported as deferred outflows of resources and deferred inflows of resources are illustrated below.
Actuarial Pension Expense
Deferred Outflow Contribution Amortization
Reclass of Current Year Contributions to Deferred Outflow
Pension Expense as reported for Fiscal
Year 2017General Employee Pensi 64,903$ 3$ (43,887)$ 64,906$ Corrections Officers Pen 24,768 - (19,118) 24,768 Police & Firefighters Pe 221,727 - (154,538) 221,727 Florida State Retirement 1,653 (1,098) (153) 555 Total Pension Expense 313,051$ (1,095)$ (217,696)$ 311,956$
Pension Expense(in thousands)
General Employees Pension Plan
Corrections Officers' Pension Plan
Police & Firefighters Pension plan
Florida State Retirement System
Fiscal Year ended 9/30/2017 43,887 19,118 154,538 679
Current Year Employer Contributions(in thousands)
General Employees Pension Plan
Corrections Officers' Pension
Police & Firefighters Pension
Florida State Retirement System
Differences in expected and actual experience 20,632$ 3,406$ 31,318$ 697$ Changes in assumptions 41,972 19,252 18,827 2,767 Difference in projected and actual investment earnings 22,986 9,104 93,982 (200) Changes in proportion (12,344) - - 352
Total 73,246$ 31,762$ 144,127$ 3,616$
Deferred Outflows and (Inflows) of resources(in thousands)
-122-
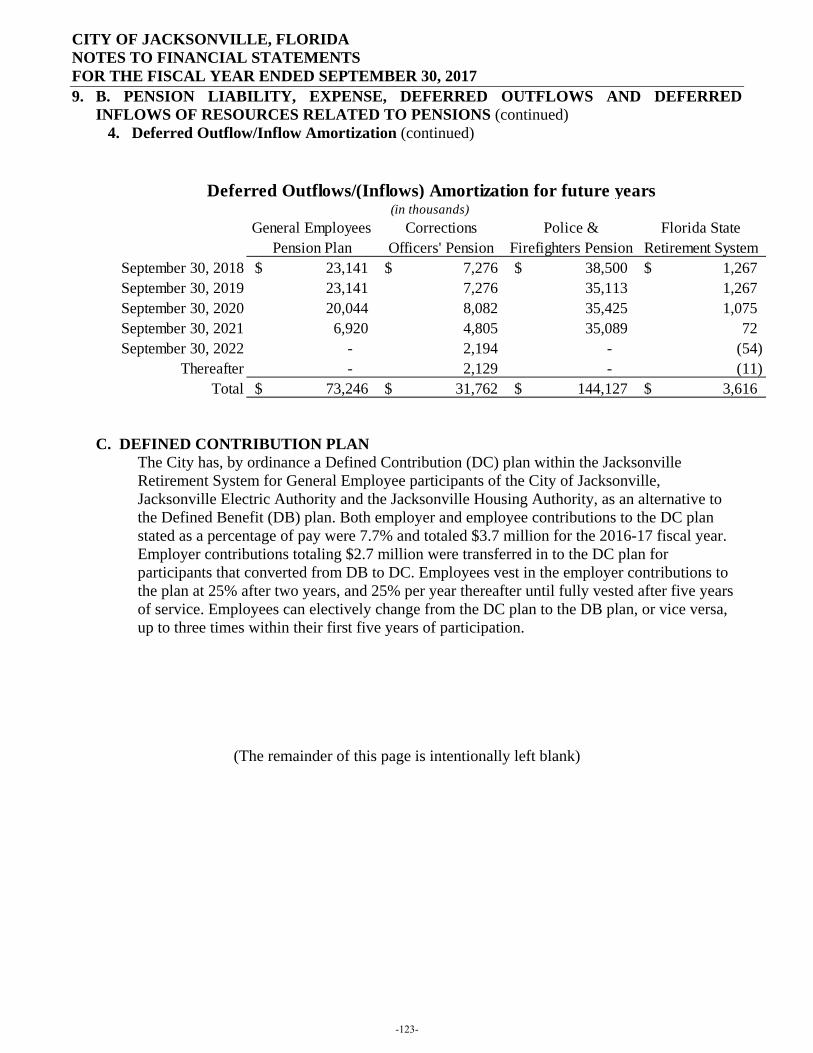
CITY OF JACKSONVILLE, FLORIDA NOTES TO FINANCIAL STATEMENTS FOR THE FISCAL YEAR ENDED SEPTEMBER 30, 2017
9. B. PENSION LIABILITY, EXPENSE, DEFERRED OUTFLOWS AND DEFERRED INFLOWS OF RESOURCES RELATED TO PENSIONS (continued)
4. Deferred Outflow/Inflow Amortization (continued)
C. DEFINED CONTRIBUTION PLAN
The City has, by ordinance a Defined Contribution (DC) plan within the Jacksonville Retirement System for General Employee participants of the City of Jacksonville, Jacksonville Electric Authority and the Jacksonville Housing Authority, as an alternative to the Defined Benefit (DB) plan. Both employer and employee contributions to the DC plan stated as a percentage of pay were 7.7% and totaled $3.7 million for the 2016-17 fiscal year. Employer contributions totaling $2.7 million were transferred in to the DC plan for participants that converted from DB to DC. Employees vest in the employer contributions to the plan at 25% after two years, and 25% per year thereafter until fully vested after five years of service. Employees can electively change from the DC plan to the DB plan, or vice versa, up to three times within their first five years of participation.
(The remainder of this page is intentionally left blank)
General Employees Pension Plan
Corrections Officers' Pension
Police & Firefighters Pension
Florida State Retirement System
September 30, 2018 23,141$ 7,276$ 38,500$ 1,267$ September 30, 2019 23,141 7,276 35,113 1,267 September 30, 2020 20,044 8,082 35,425 1,075 September 30, 2021 6,920 4,805 35,089 72 September 30, 2022 - 2,194 - (54)
Thereafter - 2,129 - (11) Total 73,246$ 31,762$ 144,127$ 3,616$
Deferred Outflows/(Inflows) Amortization for future years(in thousands)
-123-
CITY OF JACKSONVILLE, FLORIDA NOTES TO FINANCIAL STATEMENTS FOR THE FISCAL YEAR ENDED SEPTEMBER 30, 2017
9. D. UNFUNDED PENSION LIABILITY
The City recorded its unfunded pension liability in the City-wide Governmental Activities financial statements. There was not an allocation of this liability to the proprietary funds/Business-type Activities or fiduciary funds as there is not an expectation that those type funds/activities will be paying or raising rates to pay for the unfunded liability.
Police and Fire Pension and Corrections Pension are governmental fund activities so their entries are recorded in the City-wide Governmental Activities financial statements as well.
Mayor Curry and his Administration worked with the state to allow the City to dedicate a Pension Liability Surtax toward funding the City’s underfunded DB Pension systems, which passed both House and Senate and Governor Scott signed. The citizens then passed the referendum during fiscal year 2016 approving the extension of the sales tax. In April 2017, the City Council passed legislation dedicating the sales tax as a funding source for the General Employees’ Retirement Plan, Corrections Officers’ Plan and the Police and Fire Pension Plan. The sales tax will remain in effect until the earlier of December 31, 2060 or when it is determined by the actuarial report to the Florida Department of Management Services that the funding level of each of the City’s three defined benefit retirement plans are expected to reach or exceed 100% funding level in that year. In order for a plan to benefit from the sales tax revenue, the General Employees’ Retirement Plan (GERP), was closed to new members and employees as of September 30, 2017. Employee contribution rates for GERP participants increased from 8% to 10%. Employees who participate in the defined benefit plan will continue to participate with no changes in benefits. New employees hired after September 30, 2017 will enter the General Employees Defined Contribution Plan. Ongoing defined contribution participants and new employees continue to contribute 8% of salary while employer contributions to the defined contribution plan increased from 8% to 12%.
(The remainder of this page is intentionally left blank)
-124-
CITY OF JACKSONVILLE, FLORIDA NOTES TO FINANCIAL STATEMENTS FOR THE FISCAL YEAR ENDED SEPTEMBER 30, 2017
10. POST EMPLOYEMENT BENEFITS OTHER THAN PENSION (OPEB) Plan Description: The City provides retirees with the option to purchase health insurance from the City’s single employer, experience rated health insurance contract plan (Plan) that provides medical benefits to active and eligible retirees at the City’s group rate as mandated by Florida Statute 112.0801 and therefore has an implicit rate subsidy benefit for the retirees’ participation. As of the valuation date, the Plan had approximately 6,987 active participants and 1,097 retirees receiving benefits. The Plan does not issue a separate publicly available financial report. Funding Policy: To date, the City has followed a pay-as-you-go funding policy, contributing only those amounts necessary to provide for its portion of current year benefit costs and expenses plus any addition to the reserve for accrued costs incurred but not yet reported, as determined as part of the insurance contract. The contribution requirements of Plan members are established by the City. The City pays any remaining required amounts after contributions of plan members are taken into account. Currently, retired members pay the full premium associated with the coverage elected; no direct City subsidy is currently applicable; however, there is an implicit cost discussed below. Spouses and other dependents are also eligible for coverage, and the member is responsible for payment of the applicable premiums. Plan members contributed $5.2 million in premiums for fiscal year 2017, representing 28.7% of the total fiscal year 2017 OPEB cost. State of Florida law prohibits the City from separately rating retirees and active employees. The City therefore assigns to both groups equal, blended-rate premiums. Although both groups are assigned the same blended rate premiums, GAAP requires the actuarial liabilities to be calculated using age-adjusted premiums approximating claim costs for retirees separate from active members. The use of age-adjusted premiums results in the full expected retiree obligation recognized in this disclosure. Annual OPEB Cost and Net OPEB obligation: The City’s annual other postemployment benefit cost (expense) is calculated based on the annual required contribution of the employer (ARC). The City has elected to calculate the ARC and related information using the Entry Age Normal Salary Based Cost Method. The ARC represents a level of funding that, if paid on an ongoing basis, is projected to cover normal costs each year and to amortize any unfunded actuarial liability (or funding excess) over a period not to exceed 30 years on an open basis. It is calculated assuming a level percentage of projected payroll. Annual requirements include a 3% general inflation rate assumption, a 4.0% discount rate, compounded annually, based on assumptions that the plan will be unfunded. The annual health care cost trend rate was assumed at 7% at September 30, 2017 grading down by 0.5% each year until an ultimate health care cost trend rate is reached in 2022 of 4.5%. The projected salary increase assumption is 3.5% per year.
-125-
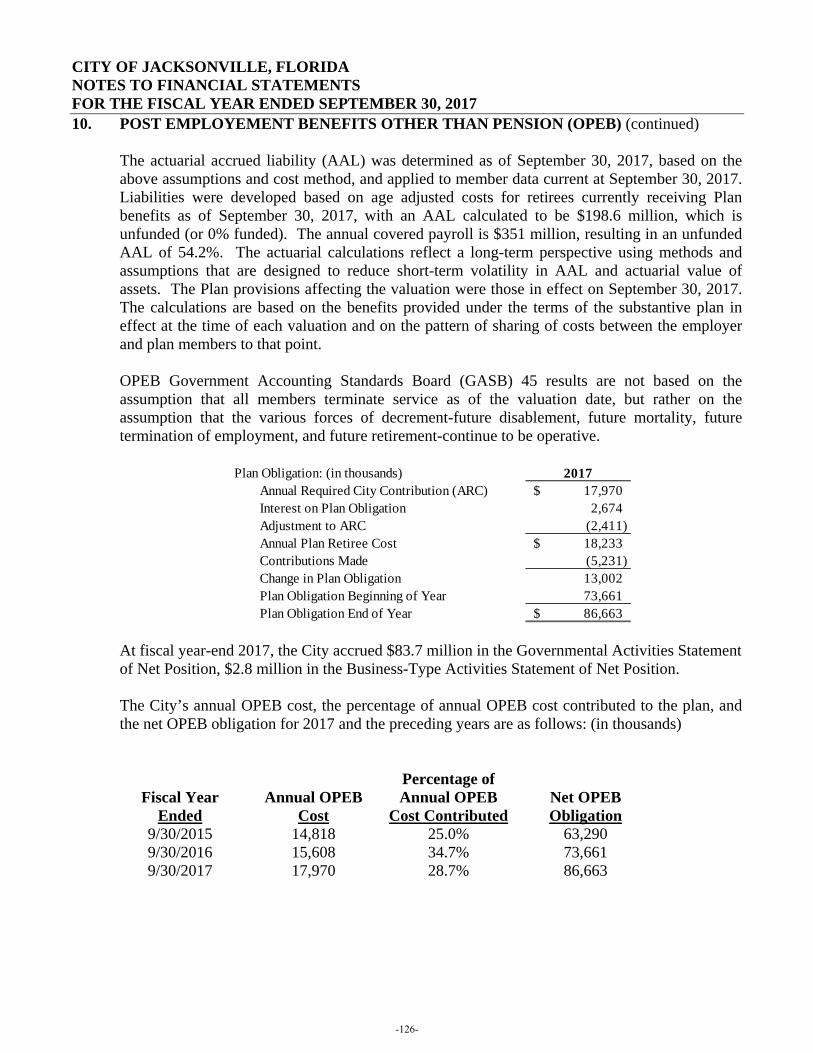
CITY OF JACKSONVILLE, FLORIDA NOTES TO FINANCIAL STATEMENTS FOR THE FISCAL YEAR ENDED SEPTEMBER 30, 2017
10. POST EMPLOYEMENT BENEFITS OTHER THAN PENSION (OPEB) (continued) The actuarial accrued liability (AAL) was determined as of September 30, 2017, based on the above assumptions and cost method, and applied to member data current at September 30, 2017. Liabilities were developed based on age adjusted costs for retirees currently receiving Plan benefits as of September 30, 2017, with an AAL calculated to be $198.6 million, which is unfunded (or 0% funded). The annual covered payroll is $351 million, resulting in an unfunded AAL of 54.2%. The actuarial calculations reflect a long-term perspective using methods and assumptions that are designed to reduce short-term volatility in AAL and actuarial value of assets. The Plan provisions affecting the valuation were those in effect on September 30, 2017. The calculations are based on the benefits provided under the terms of the substantive plan in effect at the time of each valuation and on the pattern of sharing of costs between the employer and plan members to that point. OPEB Government Accounting Standards Board (GASB) 45 results are not based on the assumption that all members terminate service as of the valuation date, but rather on the assumption that the various forces of decrement-future disablement, future mortality, future termination of employment, and future retirement-continue to be operative.
At fiscal year-end 2017, the City accrued $83.7 million in the Governmental Activities Statement of Net Position, $2.8 million in the Business-Type Activities Statement of Net Position. The City’s annual OPEB cost, the percentage of annual OPEB cost contributed to the plan, and the net OPEB obligation for 2017 and the preceding years are as follows: (in thousands)
Percentage of Fiscal Year Annual OPEB Annual OPEB Net OPEB
Ended Cost Cost Contributed Obligation 9/30/2015 14,818 25.0% 63,290 9/30/2016 15,608 34.7% 73,661 9/30/2017 17,970 28.7% 86,663
Plan Obligation: (in thousands) 2017Annual Required City Contribution (ARC) 17,970$ Interest on Plan Obligation 2,674 Adjustment to ARC (2,411) Annual Plan Retiree Cost 18,233$ Contributions Made (5,231) Change in Plan Obligation 13,002 Plan Obligation Beginning of Year 73,661 Plan Obligation End of Year 86,663$
-126-
CITY OF JACKSONVILLE, FLORIDA NOTES TO FINANCIAL STATEMENTS FOR THE FISCAL YEAR ENDED SEPTEMBER 30, 2017
10. POST EMPLOYEMENT BENEFITS OTHER THAN PENSION (OPEB) (continued) Actuarial valuations of an ongoing plan involve estimates of the value of reported amounts and assumptions about the probability of occurrence of events far into the future. Examples include assumptions about future employment, mortality, and the healthcare cost trend. Amounts determined regarding the funded status of the plan and the annual required contributions of the employer are subject to continual revision as actual results are compared with past expectations and new estimates are made about the future. The schedule of funding progress, presented as required supplementary information (RSI) following the notes to the financial statements, presents multiyear trend information about whether the actuarial value of plan assets is increasing or decreasing over time relative to the actuarial accrued liabilities for benefits.
11. DEFERRED COMPENSATION PROGRAM The City offers its employees a deferred compensation program created in accordance with Internal Revenue Code (IRC) Section 457 and Chapter 112.215, Florida Statutes. During the year ended September 30, 1999, the City complied with the requirements of subsection (g) of IRC Section 457 and, accordingly, all assets and income of the plan are held in trust for the exclusive benefit of the participants and their beneficiaries. Pursuant to the provisions of GASB Statement No. 32, Accounting and Financial Reporting for Internal Revenue Code Section 457 Deferred Compensation Plans, the financial statements do not display deferred compensation balances in an Agency Fund.
12. RISK FINANCING A. Public Liability and Workers Compensation: The City is exposed to various risks of loss related to torts, theft, damage to and destruction of assets, errors and omission, injuries to employees and natural disasters. The Risk Management Division (“Division”) administers the self-insured public liability (general liability and automobile liability) and workers’ compensation coverages (the “Program”). The Program covers the activities of the City general government and the JEA, Jacksonville Housing Authority, Jacksonville Port Authority, and the Jacksonville Aviation Authority (“Members”). Jacksonville’s City Ordinance, Chapter 128, establishes the Program’s self-insurance fund. The Program is a combination of self-insurance, coupled with certain layers of excess coverage to mitigate aberrant and substantial unexpected losses. The City does transfer some its risk through the purchase of insurance for its other exposures. The City purchases Watercraft, Wharfingers Liability, Out of State Automobile Liability, Aviation, Crime, Property and other certain General Liability policies (Rails to Trails, Power Lines Easement, Riverwalk, and Voting Precincts) to transfer risk. These policies are subject to sublimits, policy aggregates (where applicable) terms, conditions and exclusions as noted in the policies. Coverages are applicable to specific entities listed as named insureds. The attached schedule indicates the major categories of coverage transferred to insurers.
-127-
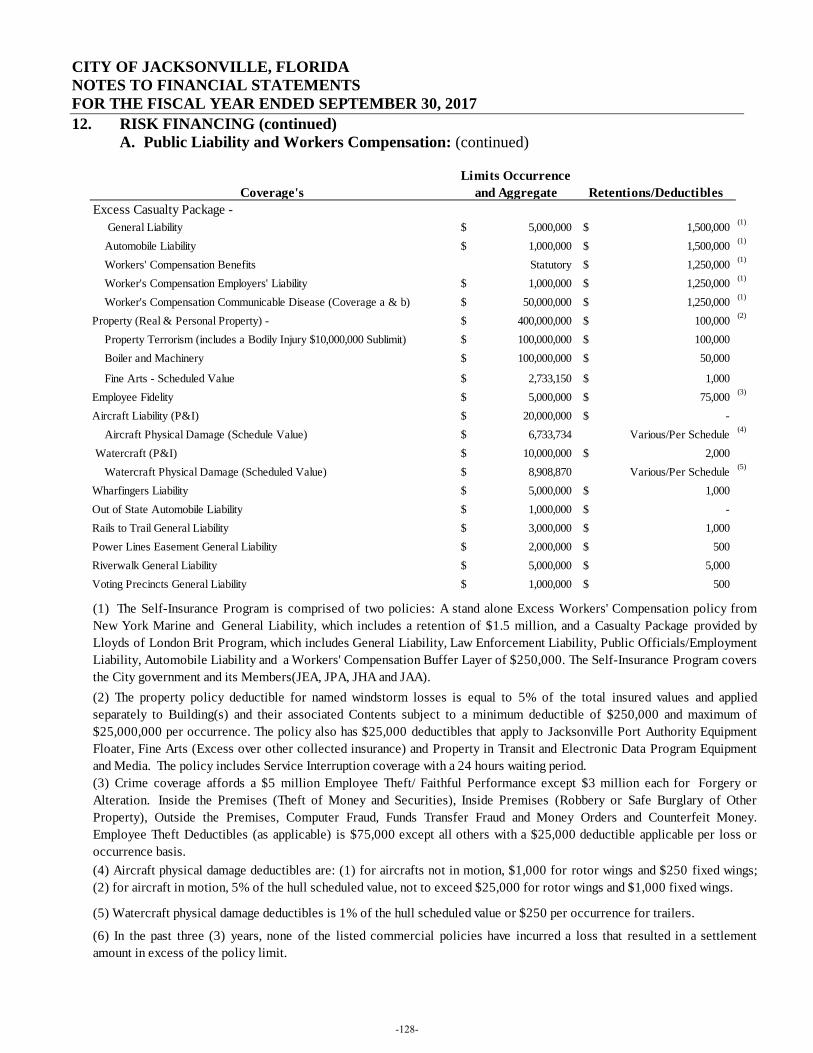
CITY OF JACKSONVILLE, FLORIDA NOTES TO FINANCIAL STATEMENTS FOR THE FISCAL YEAR ENDED SEPTEMBER 30, 2017
12. RISK FINANCING (continued) A. Public Liability and Workers Compensation: (continued)
Coverage'sLimits Occurrence
and Aggregate Retentions/DeductiblesExcess Casualty Package - General Liability 5,000,000$ 1,500,000$ (1)
Automobile Liability 1,000,000$ 1,500,000$ (1)
Workers' Compensation Benefits Statutory 1,250,000$ (1)
Worker's Compensation Employers' Liability 1,000,000$ 1,250,000$ (1)
Worker's Compensation Communicable Disease (Coverage a & b) 50,000,000$ 1,250,000$ (1)
Property (Real & Personal Property) - 400,000,000$ 100,000$ (2)
Property Terrorism (includes a Bodily Injury $10,000,000 Sublimit) 100,000,000$ 100,000$ Boiler and Machinery 100,000,000$ 50,000$
Fine Arts - Scheduled Value 2,733,150$ 1,000$ Employee Fidelity 5,000,000$ 75,000$ (3)
Aircraft Liability (P&I) 20,000,000$ -$ Aircraft Physical Damage (Schedule Value) 6,733,734$ Various/Per Schedule (4)
Watercraft (P&I) 10,000,000$ 2,000$ Watercraft Physical Damage (Scheduled Value) 8,908,870$ Various/Per Schedule (5)
Wharfingers Liability 5,000,000$ 1,000$
Out of State Automobile Liability 1,000,000$ -$
Rails to Trail General Liability 3,000,000$ 1,000$
Power Lines Easement General Liability 2,000,000$ 500$
Riverwalk General Liability 5,000,000$ 5,000$
Voting Precincts General Liability 1,000,000$ 500$
(4) Aircraft physical damage deductibles are: (1) for aircrafts not in motion, $1,000 for rotor wings and $250 fixed wings;(2) for aircraft in motion, 5% of the hull scheduled value, not to exceed $25,000 for rotor wings and $1,000 fixed wings.
(6) In the past three (3) years, none of the listed commercial policies have incurred a loss that resulted in a settlementamount in excess of the policy limit.
(3) Crime coverage affords a $5 million Employee Theft/ Faithful Performance except $3 million each for Forgery orAlteration. Inside the Premises (Theft of Money and Securities), Inside Premises (Robbery or Safe Burglary of OtherProperty), Outside the Premises, Computer Fraud, Funds Transfer Fraud and Money Orders and Counterfeit Money.Employee Theft Deductibles (as applicable) is $75,000 except all others with a $25,000 deductible applicable per loss oroccurrence basis.
(1) The Self-Insurance Program is comprised of two policies: A stand alone Excess Workers' Compensation policy fromNew York Marine and General Liability, which includes a retention of $1.5 million, and a Casualty Package provided byLloyds of London Brit Program, which includes General Liability, Law Enforcement Liability, Public Officials/EmploymentLiability, Automobile Liability and a Workers' Compensation Buffer Layer of $250,000. The Self-Insurance Program coversthe City government and its Members(JEA, JPA, JHA and JAA). (2) The property policy deductible for named windstorm losses is equal to 5% of the total insured values and appliedseparately to Building(s) and their associated Contents subject to a minimum deductible of $250,000 and maximum of$25,000,000 per occurrence. The policy also has $25,000 deductibles that apply to Jacksonville Port Authority EquipmentFloater, Fine Arts (Excess over other collected insurance) and Property in Transit and Electronic Data Program Equipmentand Media. The policy includes Service Interruption coverage with a 24 hours waiting period.
(5) Watercraft physical damage deductibles is 1% of the hull scheduled value or $250 per occurrence for trailers.
-128-
CITY OF JACKSONVILLE, FLORIDA NOTES TO FINANCIAL STATEMENTS FOR THE FISCAL YEAR ENDED SEPTEMBER 30, 2017
12. RISK FINANCING (continued) A. Public Liability and Workers Compensation: (continued)
Annually, as of September 30, the Program has a third party actuary review the claim history for all open claim years. The actuary projects the ultimate claim payment obligation (including the incurred but not reported claims and claim development) for each year’s claim experience and the probable loss fund cost for the new fiscal year. The City uses in-house defense counsel for General and Automobile Liability and outside defense counsel for Workers’ Compensation. The City’s Self-Insurance Program liability is established at the expected confidence level on a four percent (4%) discounted basis in the amount of $102,753,000 for General Liability, Automobile Liability and Workers’ Compensation. Actuarial also projects $7,078,000 of unallocated loss adjustment expenses on a four percent (4%) discounted basis at the expected confidence level. The probable loss fund estimate is used to budget the self-insurance fund for general liability, automobile liability, and workers’ compensation. As an internal service fund, charges are billed to the various funds and component units of the City. If an adjustment is necessary to increase the reported fund liability to reflect the actuary’s estimated ultimate claim payment, then the self-insurance fund will either draw upon its accumulated net assets and/or initiate a year-end billing to the City itself and component units of the City. The City’s practice of cash funding the projected ultimate claims payment is intended to temporarily accumulate net assets, which can be used to meet changes in estimates over time. Projected ultimate claims payment experience is as of the end of each fiscal year, even though some payments may not be made until a later date. The City maintains separate fiscal year accounting, which allows any excess revenues available to be returned to the City itself, and component units and the accumulation of an operating reserve authorized by the City of Jacksonville Ordinance Code Section 106.106. As of September 30, 2017, the City has a Surplus in the Self-Insurance fund of $1,672 (in thousands) and an operating reserve in the amount of $3,839 (in thousands) for a combined net asset surplus of $5,511 (in thousands). In the Supplemental Section of the City’s Comprehensive Annual Financial Report, is a trend information schedule for general/auto liability and workers’ compensation, entitled “Schedule of Self-Insurance Ten Year Claims Development Information,” which reflects the claims paid and liability projection development of each of the most recent ten years as of September 30, 2017.
(The remainder of this page is intentionally left blank)
-129-
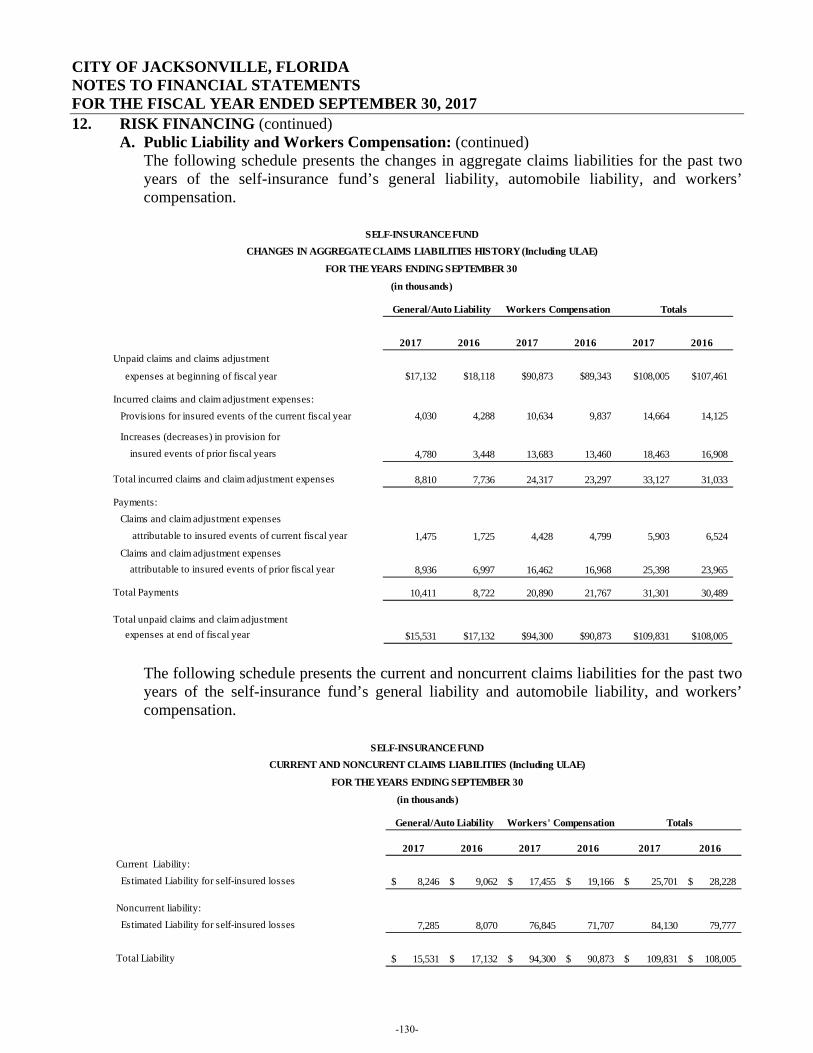
CITY OF JACKSONVILLE, FLORIDA NOTES TO FINANCIAL STATEMENTS FOR THE FISCAL YEAR ENDED SEPTEMBER 30, 2017
12. RISK FINANCING (continued) A. Public Liability and Workers Compensation: (continued)
The following schedule presents the changes in aggregate claims liabilities for the past two years of the self-insurance fund’s general liability, automobile liability, and workers’ compensation.
The following schedule presents the current and noncurrent claims liabilities for the past two years of the self-insurance fund’s general liability and automobile liability, and workers’ compensation.
2017 2016 2017 2016 2017 2016Unpaid claims and claims adjustment
expenses at beginning of fiscal year $17,132 $18,118 $90,873 $89,343 $108,005 $107,461
Incurred claims and claim adjustment expenses: Provisions for insured events of the current fiscal year 4,030 4,288 10,634 9,837 14,664 14,125
Increases (decreases) in provision for insured events of prior fiscal years 4,780 3,448 13,683 13,460 18,463 16,908
Total incurred claims and claim adjustment expenses 8,810 7,736 24,317 23,297 33,127 31,033 Payments: Claims and claim adjustment expenses attributable to insured events of current fiscal year 1,475 1,725 4,428 4,799 5,903 6,524 Claims and claim adjustment expenses attributable to insured events of prior fiscal year 8,936 6,997 16,462 16,968 25,398 23,965 Total Payments 10,411 8,722 20,890 21,767 31,301 30,489
Total unpaid claims and claim adjustment expenses at end of fiscal year $15,531 $17,132 $94,300 $90,873 $109,831 $108,005
SELF-INSURANCE FUNDCHANGES IN AGGREGATE CLAIMS LIABILITIES HISTORY (Including ULAE)
FOR THE YEARS ENDING SEPTEMBER 30
(in thousands)
General/Auto Liability Workers Compensation Totals
2017 2016 2017 2016 2017 2016Current Liability: Estimated Liability for self-insured losses 8,246$ 9,062$ 17,455$ 19,166$ 25,701$ 28,228$
Noncurrent liability: Estimated Liability for self-insured losses 7,285 8,070 76,845 71,707 84,130 79,777
Total Liability 15,531$ 17,132$ 94,300$ 90,873$ 109,831$ 108,005$
SELF-INSURANCE FUNDCURRENT AND NONCURENT CLAIMS LIABILITIES (Including ULAE)
FOR THE YEARS ENDING SEPTEMBER 30
(in thousands)
General/Auto Liability Workers' Compensation Totals
-130-
CITY OF JACKSONVILLE, FLORIDA NOTES TO FINANCIAL STATEMENTS FOR THE FISCAL YEAR ENDED SEPTEMBER 30, 2017
12. RISK FINANCING (continued) B. Self-Insured Health Plan:
Effective January 1, 2015 the City elected to move from a fully insured plan to a self-funded arrangement for its group health coverage. The primary driver of this decision was the prohibitive cost of commercial health insurance. The City utilizes Florida Blue as the third party administrator which provides claims adjudication services, provider network contracting and maintenance, and other valuable services. Florida Blue pays claims as they are incurred and bills the City monthly. In order to better manage the risk, the City has contracted for stop-loss insurance with a $600,000 specific deductible in 2017. Once a claim exceeds this threshold, the City is reimbursed for any excess expenses.
The plan is funded by contributions from the City and employees. These funds reside in an internal service fund which is used exclusively for Employee Benefits. The beginning balance of this fund as of January 1, 2015 was $6,479,716. The City received a pro-share settlement from Florida Blue of $1,547,615. This was the result of superior claims performance that the City experienced in CY2013 and CY2014 as a fully insured health plan.
Incurred but not reported (IBNR) claims were estimated at $4,760,000 as of September 30, 2017 and are recorded as a liability on the Statement of Net Position. Changes in the reported liability since January 1, 2015 resulted from the following:
Fiscal Year
Ended
Beginning Balance
Claims and Changes in Estimates
Claim and Expense Payments
Ending Balance
2015 $ - $57,548,858 $53,350,352 $4,198,505 2016 $4,198,505 $74,913,963 $74,868,603 $4,243,865 2017 $4,243,865 $74,309,716 $73,793,479 $4,760,102
As of September 30, 2017 the operating gain was $33,276,585. The Florida state statutes require a safe harbor threshold to be maintained in plan reserves. This threshold for FY2017 is $11,751,804 and the City has plan reserves of $39,756,302.
(The remainder of this page is intentionally left blank)
-131-
CITY OF JACKSONVILLE, FLORIDA NOTES TO FINANCIAL STATEMENTS FOR THE FISCAL YEAR ENDED SEPTEMBER 30, 2017
13. OTHER REQUIRED INDIVIDUAL FUND AND COMPLIANCE DISCLOSURES A. Compliance with Finance Related Legal and Contractual Provisions:
In the opinion of management, the City has no violations of finance related legal and contractual provisions.
B. Fund Deficits: The following individual funds had a fund deficit at September 30, 2017, (in thousands): Governmental Funds Net Position Public Safety ($7,370) The Public Safety fund had excess expenditures due to Tropical Storms and Hurricanes in fiscal year 2017. These expenditures are anticipated to be reimbursed by FEMA, the Federal Emergency Management Agency.
(The remainder of this page is intentionally left blank.)
-132-
CITY OF JACKSONVILLE, FLORIDA NOTES TO FINANCIAL STATEMENTS FOR THE FISCAL YEAR ENDED SEPTEMBER 30, 2017
13. OTHER REQUIRED INDIVIDUAL FUND AND COMPLIANCE DISCLOSURES C. Landfill Closure and Postclosure Care Costs:
The State of Florida's Solid Waste Management Act of 1988 and regulations of the U.S. Environmental Protection Agency (EPA) and the State of Florida Department of Environmental Protection (FDEP) require the City to be responsible for constructing and maintaining the final landfill cover, monitoring ground water and methane gas, and continuing leachate management 30 years after its municipally owned landfills stop accepting solid waste and are closed. The estimated total costs of municipal solid waste landfill (MSWLF) closure and post closure (long-term) care costs reported by the City are based upon professional consulting engineers' studies prepared annually pursuant to rules promulgated by EPA and FDEP. However, existing EPA and FDEP closure and long-term regulations may change which might require the City to revise its MSWLF cost estimates used in the future. MSWLF costs, for open landfills, are recognized in accordance with GASB Statement No. 18, Accounting for Municipal Solid Waste Landfill Closure and Post Closure Care Costs. A liability of the Solid Waste Disposal Enterprise Fund is recorded based upon landfill capacity used at fiscal year-end and a current operating expense of the Fund in the fiscal year in which the MSWLF costs are recovered through earned, operating revenue. Expenses for closure and long-term care costs are funded from future operating revenues of the Solid Waste Disposal fund and bond proceeds. As noted in Note 1. P, the application of SFAS No. 71 resulted in certain costs being capitalized and amortized to later periods. The City obtained bond proceeds to support closure and long-term care cost for North and East landfills and Picketville Waste Site. At September 30, 2017 the prepaid balance of the capitalized cost is $0, which during the year the City amortized $2.1 million. Active Landfill – Trail Ridge The closure and long-term liability for Trail Ridge as of September 30, 2017 is $30.9 million which represents an increase of $200 thousand compared to the preceding year. This increase resulted from adjustments for inflation and current annual closure and long-term care cost estimates. The percentage of landfill capacity used is estimated to be 74.63%, with an estimated life of 33.50 years.
Inactive Landfills – North and East North and East landfills closed October 1999 and April 1992, respectively. The long-term liability for North as of September 30, 2017 is $570 thousand for 1 year. When compared to the preceding year, the liability balances decreased $930 thousand in aggregate, due to adjustments for current annual closure cost estimates and costs paid for performing and monitoring closure work.
-133-
CITY OF JACKSONVILLE, FLORIDA NOTES TO FINANCIAL STATEMENTS FOR THE FISCAL YEAR ENDED SEPTEMBER 30, 2017
13. OTHER REQUIRED INDIVIDUAL FUND AND COMPLIANCE DISCLOSURES C. Landfill Closure and Long-term Care Costs: (continued)
Annually, the City is required by Chapter 62-701.630 of the Florida Administrative Code, to accumulate resources for payment of closure and long-term care cost. The City is in compliance with these requirements. As of September 30, 2017, $17.6 million, which includes $3.4 million for accelerated payments, have been accumulated for payment of closure and long-term care cost (see summary below). Accelerated payments are payments in excess of the required financial assurance balances that are held in reserves for contingencies and are used to offset future operational cost.
14. LESSOR OPERATING LEASE
A. Jacksonville Jaguars, LLC. - The City entered into a lease dated September 7, 1993, pursuant to which the City leases EverBank Field, a City owned stadium, and adjacent practice facilities to the Jacksonville Jaguars, Inc. (Jaguars) for a period of 30 years from the first National Football League (NFL) regular season play in 1995; Amendment 5, executed September 6, 2002, extends the lease an additional five years. The City uses the City Venues enterprise fund to record the stadium, practice facilities, other related capital assets, and all the related revenues and expenses from use of the stadium and practice facilities under this lease agreement.
The lease entitles the Jaguars to use the stadium on game days, for practices and summer training camp, and for the period necessary before game days. During other periods of time, the City has the right to use the stadium, except for certain administrative spaces, training facilities, suites, and other areas that are for the exclusive use of the Jaguars. For the first five years, rent is deferred in the amount of $250,000 per year; in years 6-10 rent is $500,000 per year; in years 11-20 $1,000,000; and in the final 15 years $1.25 million, including the lease extension. Amendment 8, executed January 2006, reduced the total Jaguars rent obligations by $8,600,000, which was provided through rental reductions in the amount of $1,433,333 for six payments beginning with the November 2005 payment through the June 2008 payment.
Trail Ridge North Total
Current cost of closure 13,675,946$ -$ 13,675,946$
Annual cost of long-term care - 569,862 569,862
Accelerated funds above state minimum 3,383,206 - 3,383,206
Total balance in escrow account 17,059,152$ 569,862$ 17,629,014$
-134-
CITY OF JACKSONVILLE, FLORIDA NOTES TO FINANCIAL STATEMENTS FOR THE FISCAL YEAR ENDED SEPTEMBER 30, 2017
14. LESSOR OPERATING LEASE (continued) A. Jacksonville Jaguars, LLC. (continued)
Amendment 8 also reduces supplemental lease obligations, with the City’s acceptance of payment from the Jaguars in the amount of $10,197,891 for the full satisfaction of amounts due for Super Bowl net revenues. Rents from years 11 through the end of the lease are subject to escalation based on one-half of any increase in the Consumer Price Index, but not to exceed 2.5% per year. In addition, the Jaguars are obligated to pay supplemental rent in an amount equal to the annual debt service incurred by the City for certain costs of renovation of $53.1 million requested by the Jaguars over a 30 year period with interest computed on a tax-exempt basis; inclusive of Amendment 7 executed May 27, 2004. The lease generally permits the City to retain revenues from City events at the stadium, with some exceptions. Amendments 8 and 12 outline provisions for advertising revenue generated from electronic signage for different stadium functions. The City is required to provide electricity, water and sewer services for the stadium at its expense. The City must maintain the stadium and all leasehold improvements. Per Amendment 8, the City agreed to provide $1,000,000 for additional electronic signs. The City is required to pay for game day personnel, excluding concessions, on the days of Jaguar games. Amendment 8 gives the Jaguars the responsibility to provide concessions to all events within the concessions area. The Jaguars retain all net revenues from concessions and similar sales on NFL game days. The lease obligates the Jaguars to maintain its franchise at the stadium in Jacksonville and to not relocate unless it pays the City certain guaranteed amounts. Amendment 9 outlines a revenue sharing agreement for the stadium naming rights and provides the parameters for the marketing of the stadium name. Also, Amendment 9 details additional advertising rights and allows for certain fixed signage at the stadium. However, the subsequent naming rights agreement with EverBank eliminated the City participation in revenue generated from the stadium naming rights. Amendment 10 outlines the accepted procedures for the use of the City established Sports Complex Capital Maintenance Fund. The agreement allows the Jaguars to advance fund certain capital, repair and maintenance projects at the stadium and receive reimbursement from the City. Amendment 10 also establishes the procedures for the creation of the related capital improvement plan. Amendment 12 outlines provisions of various improvements to the stadium, including new video boards, renovations and improvements to the North End Zone (NEZ), and stadium Wi-Fi improvements. Total project improvements cost over $60 million, with the City financing approximately $44 million. Amendment 13 clarifies or modifies miscellaneous provisions of the lease, and outlines certain rights of the City and Jaguars with regards to the electric signage included in the improvements of Amendment 12.
-135-
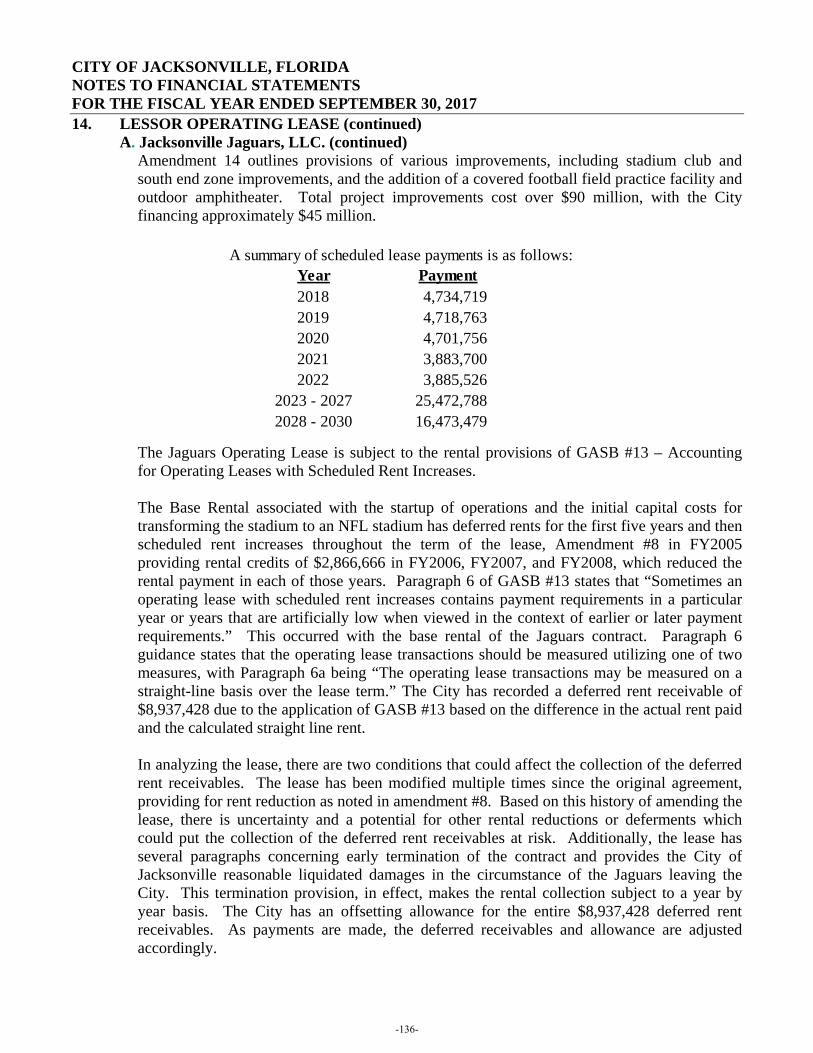
CITY OF JACKSONVILLE, FLORIDA NOTES TO FINANCIAL STATEMENTS FOR THE FISCAL YEAR ENDED SEPTEMBER 30, 2017
14. LESSOR OPERATING LEASE (continued) A. Jacksonville Jaguars, LLC. (continued)
Amendment 14 outlines provisions of various improvements, including stadium club and south end zone improvements, and the addition of a covered football field practice facility and outdoor amphitheater. Total project improvements cost over $90 million, with the City financing approximately $45 million.
The Jaguars Operating Lease is subject to the rental provisions of GASB #13 – Accounting for Operating Leases with Scheduled Rent Increases. The Base Rental associated with the startup of operations and the initial capital costs for transforming the stadium to an NFL stadium has deferred rents for the first five years and then scheduled rent increases throughout the term of the lease, Amendment #8 in FY2005 providing rental credits of $2,866,666 in FY2006, FY2007, and FY2008, which reduced the rental payment in each of those years. Paragraph 6 of GASB #13 states that “Sometimes an operating lease with scheduled rent increases contains payment requirements in a particular year or years that are artificially low when viewed in the context of earlier or later payment requirements.” This occurred with the base rental of the Jaguars contract. Paragraph 6 guidance states that the operating lease transactions should be measured utilizing one of two measures, with Paragraph 6a being “The operating lease transactions may be measured on a straight-line basis over the lease term.” The City has recorded a deferred rent receivable of $8,937,428 due to the application of GASB #13 based on the difference in the actual rent paid and the calculated straight line rent. In analyzing the lease, there are two conditions that could affect the collection of the deferred rent receivables. The lease has been modified multiple times since the original agreement, providing for rent reduction as noted in amendment #8. Based on this history of amending the lease, there is uncertainty and a potential for other rental reductions or deferments which could put the collection of the deferred rent receivables at risk. Additionally, the lease has several paragraphs concerning early termination of the contract and provides the City of Jacksonville reasonable liquidated damages in the circumstance of the Jaguars leaving the City. This termination provision, in effect, makes the rental collection subject to a year by year basis. The City has an offsetting allowance for the entire $8,937,428 deferred rent receivables. As payments are made, the deferred receivables and allowance are adjusted accordingly.
A summary of scheduled lease payments is as follows:Year Payment2018 4,734,719 2019 4,718,763 2020 4,701,756 2021 3,883,700 2022 3,885,526
2023 - 2027 25,472,788 2028 - 2030 16,473,479
-136-
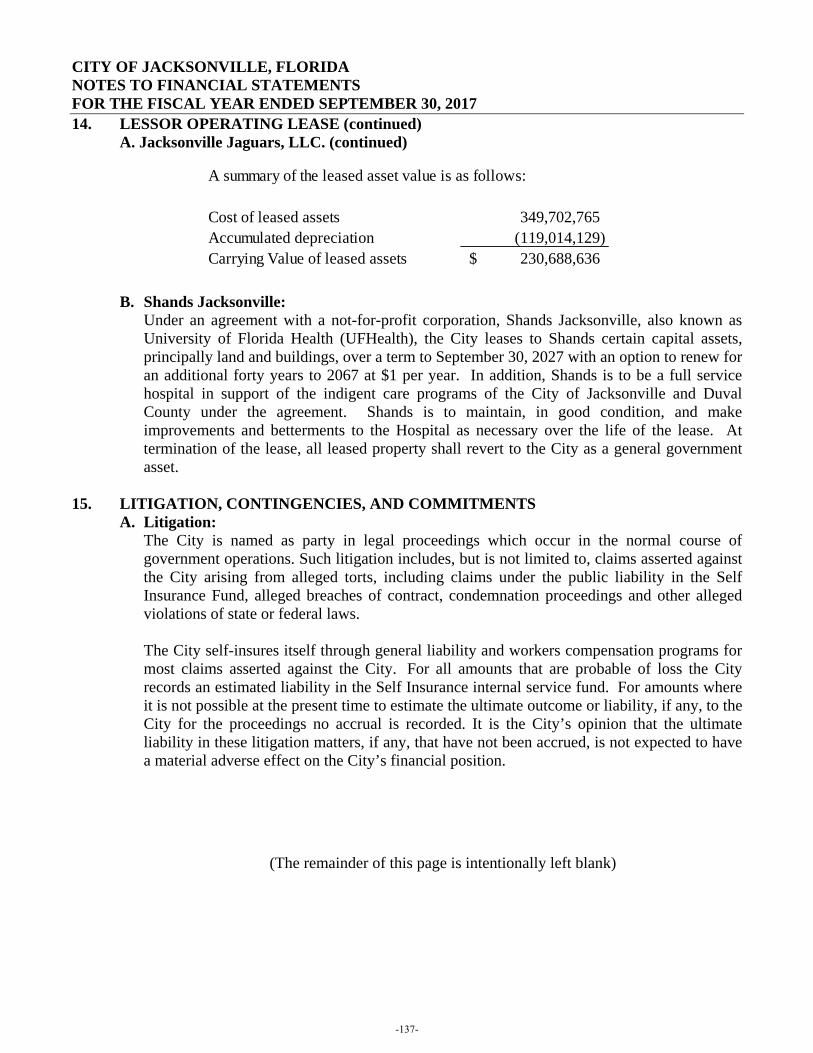
CITY OF JACKSONVILLE, FLORIDA NOTES TO FINANCIAL STATEMENTS FOR THE FISCAL YEAR ENDED SEPTEMBER 30, 2017
14. LESSOR OPERATING LEASE (continued) A. Jacksonville Jaguars, LLC. (continued)
B. Shands Jacksonville: Under an agreement with a not-for-profit corporation, Shands Jacksonville, also known as
University of Florida Health (UFHealth), the City leases to Shands certain capital assets, principally land and buildings, over a term to September 30, 2027 with an option to renew for an additional forty years to 2067 at $1 per year. In addition, Shands is to be a full service hospital in support of the indigent care programs of the City of Jacksonville and Duval County under the agreement. Shands is to maintain, in good condition, and make improvements and betterments to the Hospital as necessary over the life of the lease. At termination of the lease, all leased property shall revert to the City as a general government asset.
15. LITIGATION, CONTINGENCIES, AND COMMITMENTS
A. Litigation: The City is named as party in legal proceedings which occur in the normal course of government operations. Such litigation includes, but is not limited to, claims asserted against the City arising from alleged torts, including claims under the public liability in the Self Insurance Fund, alleged breaches of contract, condemnation proceedings and other alleged violations of state or federal laws. The City self-insures itself through general liability and workers compensation programs for most claims asserted against the City. For all amounts that are probable of loss the City records an estimated liability in the Self Insurance internal service fund. For amounts where it is not possible at the present time to estimate the ultimate outcome or liability, if any, to the City for the proceedings no accrual is recorded. It is the City’s opinion that the ultimate liability in these litigation matters, if any, that have not been accrued, is not expected to have a material adverse effect on the City’s financial position.
(The remainder of this page is intentionally left blank)
A summary of the leased asset value is as follows:
Cost of leased assets 349,702,765 Accumulated depreciation (119,014,129) Carrying Value of leased assets 230,688,636$
-137-
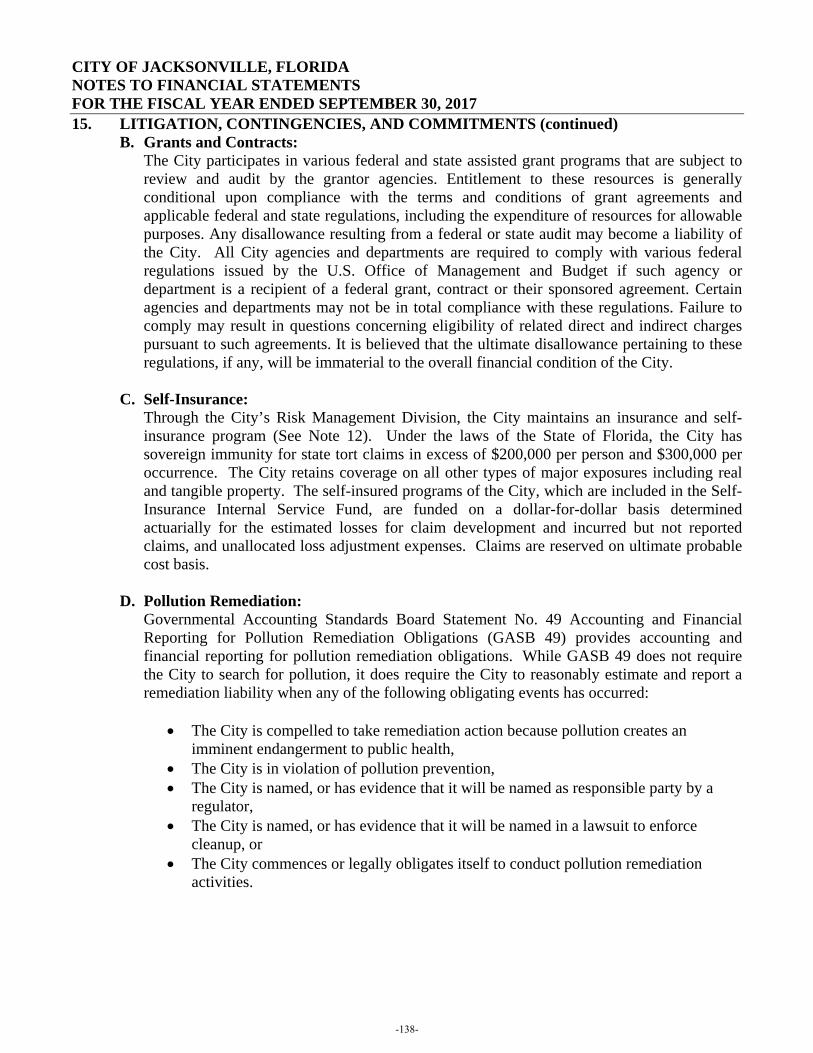
CITY OF JACKSONVILLE, FLORIDA NOTES TO FINANCIAL STATEMENTS FOR THE FISCAL YEAR ENDED SEPTEMBER 30, 2017
15. LITIGATION, CONTINGENCIES, AND COMMITMENTS (continued) B. Grants and Contracts:
The City participates in various federal and state assisted grant programs that are subject to review and audit by the grantor agencies. Entitlement to these resources is generally conditional upon compliance with the terms and conditions of grant agreements and applicable federal and state regulations, including the expenditure of resources for allowable purposes. Any disallowance resulting from a federal or state audit may become a liability of the City. All City agencies and departments are required to comply with various federal regulations issued by the U.S. Office of Management and Budget if such agency or department is a recipient of a federal grant, contract or their sponsored agreement. Certain agencies and departments may not be in total compliance with these regulations. Failure to comply may result in questions concerning eligibility of related direct and indirect charges pursuant to such agreements. It is believed that the ultimate disallowance pertaining to these regulations, if any, will be immaterial to the overall financial condition of the City.
C. Self-Insurance:
Through the City’s Risk Management Division, the City maintains an insurance and self-insurance program (See Note 12). Under the laws of the State of Florida, the City has sovereign immunity for state tort claims in excess of $200,000 per person and $300,000 per occurrence. The City retains coverage on all other types of major exposures including real and tangible property. The self-insured programs of the City, which are included in the Self-Insurance Internal Service Fund, are funded on a dollar-for-dollar basis determined actuarially for the estimated losses for claim development and incurred but not reported claims, and unallocated loss adjustment expenses. Claims are reserved on ultimate probable cost basis.
D. Pollution Remediation: Governmental Accounting Standards Board Statement No. 49 Accounting and Financial Reporting for Pollution Remediation Obligations (GASB 49) provides accounting and financial reporting for pollution remediation obligations. While GASB 49 does not require the City to search for pollution, it does require the City to reasonably estimate and report a remediation liability when any of the following obligating events has occurred:
• The City is compelled to take remediation action because pollution creates an imminent endangerment to public health,
• The City is in violation of pollution prevention, • The City is named, or has evidence that it will be named as responsible party by a
regulator, • The City is named, or has evidence that it will be named in a lawsuit to enforce
cleanup, or • The City commences or legally obligates itself to conduct pollution remediation
activities.
-138-
CITY OF JACKSONVILLE, FLORIDA NOTES TO FINANCIAL STATEMENTS FOR THE FISCAL YEAR ENDED SEPTEMBER 30, 2017
15. LITIGATION, CONTINGENCIES, AND COMMITMENTS (continued) D. Pollution Remediation: (continued)
The City recorded a pollution remediation liability as of September 30, 2017 of approximately $117.02 million (See Note 8. C for schedule) using the expected cash flow technique. Under this technique, the City estimated a reasonable range of potential outlays and multiplied those outlays by their probability of occurring. However, this liability could change over time due to changes in cost of goods and services, changes in remediation technology, or changes in laws and regulations governing the remediation efforts. The following paragraphs provide further details on the more significant sites. Whitehouse Waste Oil Pits Superfund Site The US Environmental Protection Agency (USEPA) identified the City as a potential responsible party (PRP) at the Whitehouse Waste Oil Pits Superfund Site in western Duval County. The City and other (PRPs) participated in the USEPA’s Pilot Allocation Project which resulted in the USEPA assuming as much as 65% of the liability at the site, with the City being allocated less than 10% of the liability. The USEPA estimates $20 million site costs, with the City paying approximately $2 million over the life of the project (which includes a 30 year operations and maintenance period). Site work was substantially complete in October 2006 when operations and maintenance work began. The PRPs have more than $1.9 million on deposit to fund operations and maintenance; however until USEPA officially declares the remedial action complete, the prospect for additional work remains. In January 2008, the City met with adjacent property owners to negotiate the purchase of additional private property to account for the location of the remedial berm. The City and other PRPs settled with the USEPA which had sought reimbursement of its cost of a removal action in 1995, regarding the Bill Johns Waste Oil Site. The City's liability is based on contracting with the waste oil service to empty used oil collection points operated under a recycling grant from the State. The remedial action was completed in late 2006 and early 2007 and following approval of the Remedial Action Report (May 2007), the site was approved for the 30 year long term Operations and Maintenance of the facility. The PRP are responsible for the long term O&M costs for the total 30 year period. We are currently in year 12 of the 30 year period.
-139-
CITY OF JACKSONVILLE, FLORIDA NOTES TO FINANCIAL STATEMENTS FOR THE FISCAL YEAR ENDED SEPTEMBER 30, 2017
15. LITIGATION, CONTINGENCIES, AND COMMITMENTS (continued) D. Pollution Remediation: (continued)
Ash Sites The City has identified four sites that were used for incinerator ash waste. The common practice during the 1950s and 1960s was to incinerate garbage and then mix the residual ash waste with other soil and use it as fill dirt. The City and the USEPA signed an agreement in 1999 to develop a plan to remediate the four sites. In order to make the sites and surrounding areas safe from a variety of residual pollutants, the City has proposed to the EPA a plan to clean up the areas by removing the top two feet of soil, placing a barrier, and then replacing the topsoil with untainted dirt. The project is estimated to take several years to complete once started and a cost estimate of $33.95 million has been accrued based on the City’s estimate used in its five year capital project plan. As of September 30, 2017, the Ash Sites accumulated approximately $172.56 million of expenditures. Other Sites FDEP had identified five sites of potential liability the City is responsible for. These sites are: Burke St. Lime Pitts, Doe Boy Dump Site, Gold Merit/Pope Plan, Confederate Park, and Southside Incinerator Site. These projects, which are estimated to take several years to complete once started, have an estimated cost of $39.22 million, which has been accrued by the City and included in the City’s five year capital projects plan. Various other remediation sites exist within the City and $43.86 million has been accrued for their estimated liability based on their inclusion in the City’s five year capital projects plan. The Picketville Waste Dump Site future costs are dependent upon information received from the USEPA and FDEP for the final groundwater monitoring report. The City has completed its longterm O&M responsibilities. However, groundwater impacts above regulatory levels were still present in the last samples for the final report. The City recommended continued groundwater monitoring in lieu of additional assessment and/or remediation.
E. Garage Development Agreement: The City entered into agreements for a private developer to construct and operate three parking garages. Two of the garages are to support the sports complex and the other is to support a new courthouse site. The current agreement provides an operating subsidy to support debt service, operating deficits, required reserves, and percentage return of equity, totaling approximately $4 million per year. Associated therewith, the City has options to buyout the current business arrangement, refinance the related non-city debt and assume operational control thereof.
(The remainder of this page is intentionally left blank.)
-140-
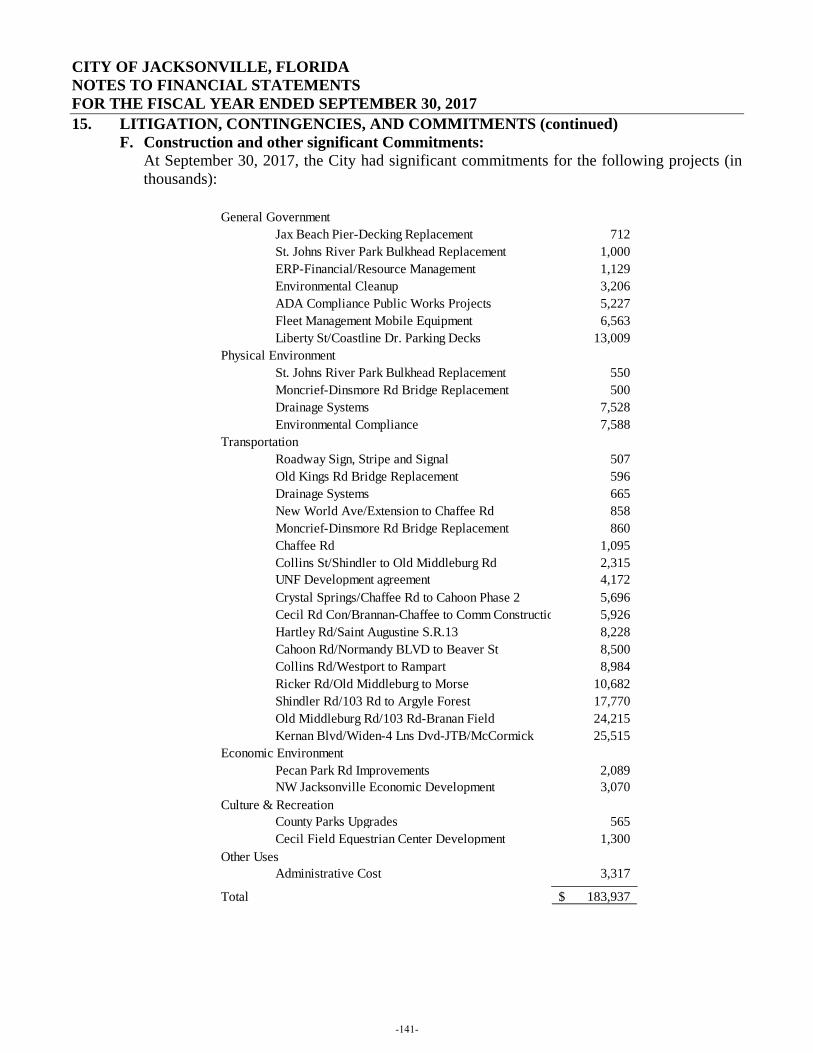
CITY OF JACKSONVILLE, FLORIDA NOTES TO FINANCIAL STATEMENTS FOR THE FISCAL YEAR ENDED SEPTEMBER 30, 2017
15. LITIGATION, CONTINGENCIES, AND COMMITMENTS (continued) F. Construction and other significant Commitments:
At September 30, 2017, the City had significant commitments for the following projects (in thousands):
General GovernmentJax Beach Pier-Decking Replacement 712 St. Johns River Park Bulkhead Replacement 1,000 ERP-Financial/Resource Management 1,129 Environmental Cleanup 3,206 ADA Compliance Public Works Projects 5,227 Fleet Management Mobile Equipment 6,563 Liberty St/Coastline Dr. Parking Decks 13,009
Physical EnvironmentSt. Johns River Park Bulkhead Replacement 550 Moncrief-Dinsmore Rd Bridge Replacement 500 Drainage Systems 7,528 Environmental Compliance 7,588
TransportationRoadway Sign, Stripe and Signal 507 Old Kings Rd Bridge Replacement 596 Drainage Systems 665 New World Ave/Extension to Chaffee Rd 858 Moncrief-Dinsmore Rd Bridge Replacement 860 Chaffee Rd 1,095 Collins St/Shindler to Old Middleburg Rd 2,315 UNF Development agreement 4,172 Crystal Springs/Chaffee Rd to Cahoon Phase 2 5,696 Cecil Rd Con/Brannan-Chaffee to Comm Constructio 5,926 Hartley Rd/Saint Augustine S.R.13 8,228 Cahoon Rd/Normandy BLVD to Beaver St 8,500 Collins Rd/Westport to Rampart 8,984 Ricker Rd/Old Middleburg to Morse 10,682 Shindler Rd/103 Rd to Argyle Forest 17,770 Old Middleburg Rd/103 Rd-Branan Field 24,215 Kernan Blvd/Widen-4 Lns Dvd-JTB/McCormick 25,515
Economic EnvironmentPecan Park Rd Improvements 2,089 NW Jacksonville Economic Development 3,070
Culture & RecreationCounty Parks Upgrades 565 Cecil Field Equestrian Center Development 1,300
Other UsesAdministrative Cost 3,317
Total 183,937$
-141-
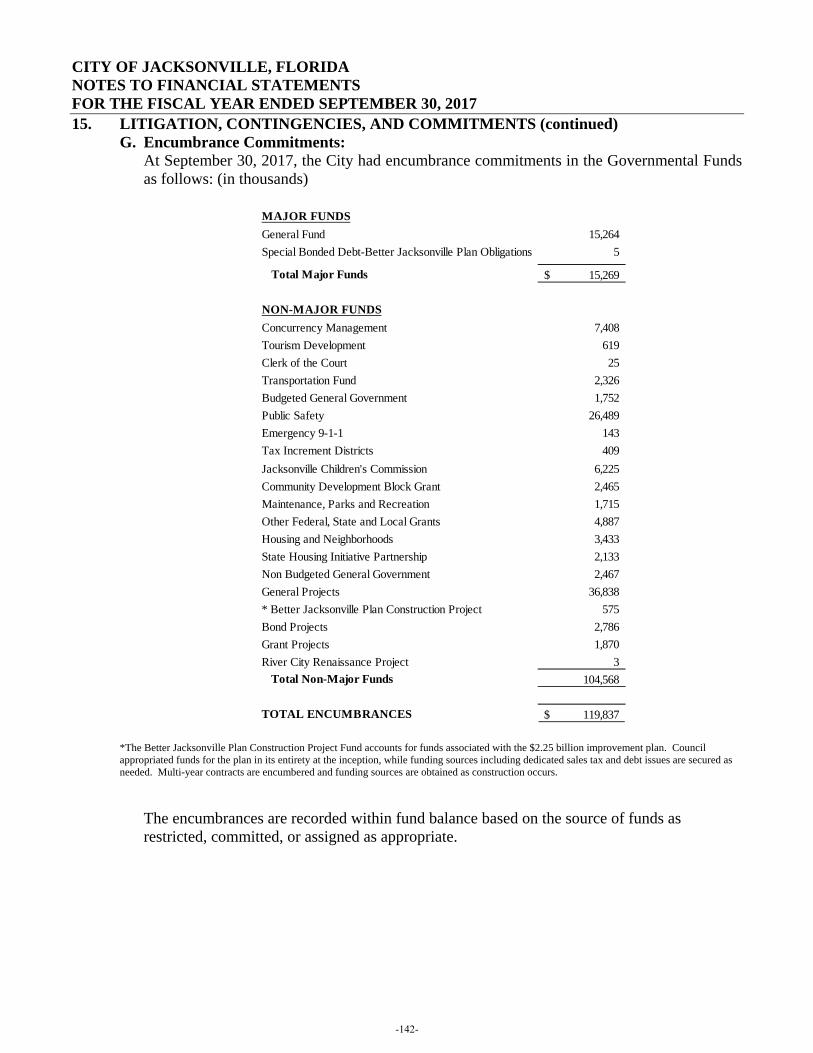
CITY OF JACKSONVILLE, FLORIDA NOTES TO FINANCIAL STATEMENTS FOR THE FISCAL YEAR ENDED SEPTEMBER 30, 2017
15. LITIGATION, CONTINGENCIES, AND COMMITMENTS (continued) G. Encumbrance Commitments:
At September 30, 2017, the City had encumbrance commitments in the Governmental Funds as follows: (in thousands)
*The Better Jacksonville Plan Construction Project Fund accounts for funds associated with the $2.25 billion improvement plan. Council appropriated funds for the plan in its entirety at the inception, while funding sources including dedicated sales tax and debt issues are secured as needed. Multi-year contracts are encumbered and funding sources are obtained as construction occurs.
The encumbrances are recorded within fund balance based on the source of funds as restricted, committed, or assigned as appropriate.
MAJOR FUNDSGeneral Fund 15,264 Special Bonded Debt-Better Jacksonville Plan Obligations 5
Total Major Funds 15,269$
NON-MAJOR FUNDSConcurrency Management 7,408 Tourism Development 619 Clerk of the Court 25 Transportation Fund 2,326 Budgeted General Government 1,752 Public Safety 26,489 Emergency 9-1-1 143 Tax Increment Districts 409 Jacksonville Children's Commission 6,225 Community Development Block Grant 2,465 Maintenance, Parks and Recreation 1,715 Other Federal, State and Local Grants 4,887 Housing and Neighborhoods 3,433 State Housing Initiative Partnership 2,133 Non Budgeted General Government 2,467 General Projects 36,838 * Better Jacksonville Plan Construction Project 575 Bond Projects 2,786 Grant Projects 1,870 River City Renaissance Project 3 Total Non-Major Funds 104,568
TOTAL ENCUMBRANCES 119,837$
-142-
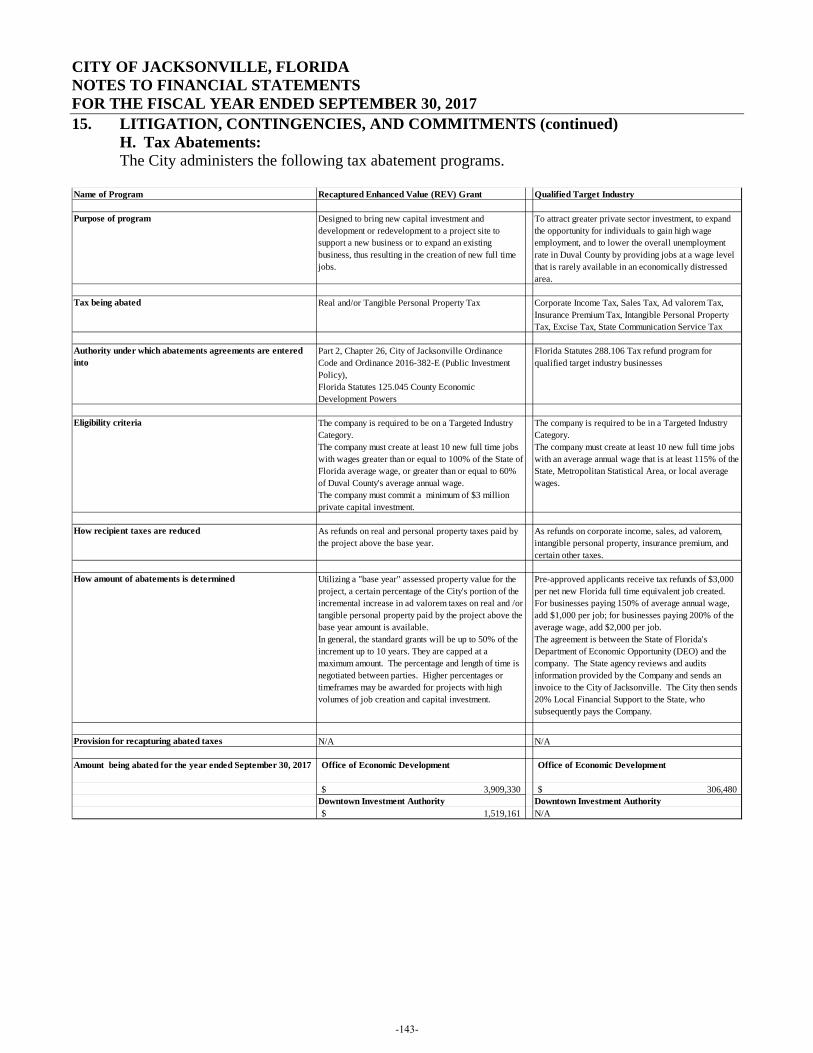
CITY OF JACKSONVILLE, FLORIDA NOTES TO FINANCIAL STATEMENTS FOR THE FISCAL YEAR ENDED SEPTEMBER 30, 2017
15. LITIGATION, CONTINGENCIES, AND COMMITMENTS (continued) H. Tax Abatements: The City administers the following tax abatement programs.
Name of Program Recaptured Enhanced Value (REV) Grant Qualified Target Industry
Purpose of program Designed to bring new capital investment and development or redevelopment to a project site to support a new business or to expand an existing business, thus resulting in the creation of new full time jobs.
To attract greater private sector investment, to expand the opportunity for individuals to gain high wage employment, and to lower the overall unemployment rate in Duval County by providing jobs at a wage level that is rarely available in an economically distressed area.
Tax being abated Real and/or Tangible Personal Property Tax Corporate Income Tax, Sales Tax, Ad valorem Tax, Insurance Premium Tax, Intangible Personal Property Tax, Excise Tax, State Communication Service Tax
Authority under which abatements agreements are entered into
Part 2, Chapter 26, City of Jacksonville Ordinance Code and Ordinance 2016-382-E (Public Investment Policy), Florida Statutes 125.045 County Economic Development Powers
Florida Statutes 288.106 Tax refund program for qualified target industry businesses
Eligibility criteria The company is required to be on a Targeted Industry Category. The company must create at least 10 new full time jobs with wages greater than or equal to 100% of the State of Florida average wage, or greater than or equal to 60% of Duval County's average annual wage. The company must commit a minimum of $3 million private capital investment.
The company is required to be in a Targeted Industry Category. The company must create at least 10 new full time jobs with an average annual wage that is at least 115% of the State, Metropolitan Statistical Area, or local average wages.
How recipient taxes are reduced As refunds on real and personal property taxes paid by the project above the base year.
As refunds on corporate income, sales, ad valorem, intangible personal property, insurance premium, and certain other taxes.
How amount of abatements is determined Utilizing a "base year" assessed property value for the project, a certain percentage of the City's portion of the incremental increase in ad valorem taxes on real and /or tangible personal property paid by the project above the base year amount is available. In general, the standard grants will be up to 50% of the increment up to 10 years. They are capped at a maximum amount. The percentage and length of time is negotiated between parties. Higher percentages or timeframes may be awarded for projects with high volumes of job creation and capital investment.
Pre-approved applicants receive tax refunds of $3,000 per net new Florida full time equivalent job created. For businesses paying 150% of average annual wage, add $1,000 per job; for businesses paying 200% of the average wage, add $2,000 per job. The agreement is between the State of Florida's Department of Economic Opportunity (DEO) and the company. The State agency reviews and audits information provided by the Company and sends an invoice to the City of Jacksonville. The City then sends 20% Local Financial Support to the State, who subsequently pays the Company.
Provision for recapturing abated taxes N/A N/A
Amount being abated for the year ended September 30, 2017 Office of Economic Development Office of Economic Development
3,909,330$ 306,480$ Downtown Investment Authority Downtown Investment Authority
1,519,161$ N/A
-143-
CITY OF JACKSONVILLE, FLORIDA NOTES TO FINANCIAL STATEMENTS FOR THE FISCAL YEAR ENDED SEPTEMBER 30, 2017
16. MAJOR DISCRETELY PRESENTED COMPONENT UNITS - ADDITIONAL DISCLOSURE
During fiscal year 2017, the City had financial transactions with its discretely presented component units classified as follows for financial reporting purposes: A. JEA:
Contribution - On October 1, 1968, the City turned its electrical department over to the newly created JEA. Additionally, on June 1, 1997, the JEA assumed the operation and all related assets and liabilities of the water and sewer system from the City. The JEA is required by the City Charter to contribute annually to the General Fund of the City an amount not to exceed 5.513 mills per kilowatt per hour sold and at a rate of 2.149 mills per cubic feet of water sold. For the fiscal year ended September 30, 2017 these contributions total $115,822,950. Such contributions to the City’s General Fund are for the use of the public right-of-way in connection with its electric distribution system and its water sewer distribution and collection system and are based on calculations contained within section 21.07 of the City Charter. Franchise Fees - Effective April 1, 2008, the City enacted a 3% franchise fee from designated revenues of the Electric and Water and Sewer Utility systems. The ordinance authorizes JEA to pass through these fees to its electric and water and sewer funds. For the year ended September 30, 2017, the City received from JEA $27,709,859 and $10,534,196 of its electric and water and sewer funds.
B. Jacksonville Transportation Authority (JTA) :
Local Option One-Half Cent Sales Tax - On August 11, 1989, Jacksonville citizens voted for the removal of all tolls from county/city bridges and certain roads and replaced the revenue with a local option one-half cent sales tax that provides a permanent funding source for the construction and maintenance of the City’s roads and bridges; the operation and maintenance of the bus system and the refinancing of existing bonds issued for the construction of such bridges and roads. All collections from the one-half cent sales tax are statutorily required to be remitted to the JTA. Accordingly, the City remitted all collections from the one-half cent sales tax to the JTA in the amount of $86 million in fiscal year 2017. Such collection and payment by the City of this local option one-half cent sales tax is recorded in the Transportation Special Revenue fund as revenue and a transportation expenditure in the equal amount. The JTA reports the transfer from the City as sales tax revenue. In fiscal year 2000, the City and the JTA entered into an interlocal agreement for the purpose of jointly exercising the separate powers of each to the maximum extent allowable by the law in the development, scheduling, financing, planning, permitting, design, construction, and implementation of a $750 million Road, Bridge and Drainage Capital Improvement Work Program. The term of the agreement commenced on October 1, 2000 and was to continue in effect until all of the bonds were paid in full or defeased in accordance with their terms. The City and JTA agreed to pledge the Sales Tax and the Constitutional Gas Tax for the payment of bonds issued to implement the program.
-144-
CITY OF JACKSONVILLE, FLORIDA NOTES TO FINANCIAL STATEMENTS FOR THE FISCAL YEAR ENDED SEPTEMBER 30, 2017
16. MAJOR DISCRETELY PRESENTED COMPONENT UNITS - ADDITIONAL DISCLOSURE (continued)
B. Jacksonville Transportation Authority (JTA): (continued)
Any funds available above debt service would be collected in a pay-as-you-go fund to assist with the payment of program expenditures. In addition, the City made available revenues from the Local Option Gas Tax for the operation of the JTA’s Mass Transit Division. Beginning September 1, 2016, a new interlocal agreement between the City and JTA went into effect. The Sales Tax and Constitutional Gas Tax continue to be pledged for the program’s debt service. Any Sales Tax revenues available above debt service are returned to JTA and may be used for certain transportation-related purposes as defined by the agreement. Revenues from the Constitutional Gas Tax are to be used for debt service only if the Sales Tax revenues are insufficient. Any Constitutional Gas Tax revenues available above debt service are split equally between the City and JTA. In addition, the new interlocal agreement provides that five-sixths of the Local Option Gas Tax be made available to JTA for the development, construction, operation and/or maintenance of certain roadway projects managed by JTA as identified in the agreement’s exhibits. In connection with a bill that the Jacksonville City Council passed on March 15, 2017, the City is relieved of a long standing $13,567,000 liability for roadway projects that the Jacksonville Transportation Authority (JTA) built during road construction associated with the Better Jacksonville Plan. The reduction of the liability is reflected in the 2017 citywide statements.
C. Jacksonville Port Authority (JPA): Interlocal Agreement - In connection with a major port and marine facilities capital improvement project (the “Project”), the City and the JPA entered into an Interlocal Agreement upon the issuance of $43,605,140 Excise Taxes Revenue Bonds, Series 1993 (the “1993 Bonds”). Subsequent to this transaction, the parties entered into an Amended and Restated Interlocal Agreement in conjunction with the issuance of $57,150,000 Excise Taxes Revenue Bonds, Series 1996B (the “1996B Bonds”). The 1996B Bonds were refunded by the Excise Taxes Revenue Refunding Bonds, Series 2001A (the “2001A Bonds”). The 1993 Bonds were partially refunded by the Excise Taxes Revenue Refunding and Improvement Bonds, Series 2003C (the “2003C Bonds). The 2003C Bonds were partially refunded by the Special Revenue Refunding Bonds, Series 2012E (the “2012E” Bonds, and together with the 1993 Bonds, 2001A Bonds and 2003C Bonds, the “Bonds”). Under the Amended and Restated Interlocal Agreement, the City agreed to issue the Bonds to finance the Project, and the JPA, in consideration therefore, agreed to reimburse the City for debt service payments on the Bonds from certain revenues allocated to the JPA. Any insufficiency in the extent of such revenues allocated to the JPA under the Amended and Restated Interlocal Agreement or any amendments to the Amended and Restated Interlocal Agreement does not affect in any manner any obligation of the City pursuant to the terms of the Bonds.
-145-
CITY OF JACKSONVILLE, FLORIDA NOTES TO FINANCIAL STATEMENTS FOR THE FISCAL YEAR ENDED SEPTEMBER 30, 2017
16. MAJOR DISCRETELY PRESENTED COMPONENT UNITS - ADDITIONAL DISCLOSURE (continued)
C. Jacksonville Port Authority (JPA): (continued)
The amended and restated Interlocal Agreement is not for the benefit of the holders of the Bonds and the JPA has no obligation under that Amended and Restated Interlocal Agreement to any third party bondholder. The revenues allocated to the JPA are not pledged as security for the Bonds. The Amended and Restated Interlocal Agreement provides for the allocation of three sources of revenue (collectively referred to as the “Pledged Revenues”) by the City to the JPA. The first source of revenue relates to the allocation of half of the increased revenues in the Telecommunications Tax, which is 85% of the Communication Services Tax (the “Authority Allocation No. 1”). The second source of revenue relates to the amount calculated by multiplying one quarter (.25) mills by the gross kilowatt hours (as defined in Article 21 of the City Charter) sold by JEA during the twelve month period ending May 31 of the prior fiscal year (the “Authority Allocation No. 2”). The third source of revenues relates to the $800,000 annual contribution remitted by the City to the JPA as described in Section 5(a) of the JPA act. Such Pledged Revenues are to be applied by the City to the payment of debt service on the Bonds for such fiscal year prior to being paid to the JPA. For the fiscal year ended September 30, 2017, the amount of Pledged Revenues in excess of the debt service requirements of the Bonds was $2.85 million with a total of $2.88 million being distributed to JPA. In previous years, the City expended $43.1 million on the Project from proceeds of the 1993 Bonds for the benefit of the JPA under the Amended and Restated Interlocal Agreement, which completed the 1993 Bond Program. In previous years, the City expended $64 million on the Project from proceeds (inclusive of investment earnings) of the 1996B Bonds for the benefit of the JPA under the Interlocal Agreement. The City accounted for these expenditures in the Capital Projects Funds. The City does not capitalize these capital outlay expenditures. The capital assets related to these projects are owned by JPA and these amounts are noted earlier as Non-Asset Debt of the City in Note 8H.
17. SUBSEQUENT EVENTS On February 23, 2018, Standard & Poor’s Ratings Services raised its rating on the City of Jacksonville’s special revenue bonds to ‘AA’ from ‘AA-’.
(The remainder of this page is intentionally left blank)
-146-
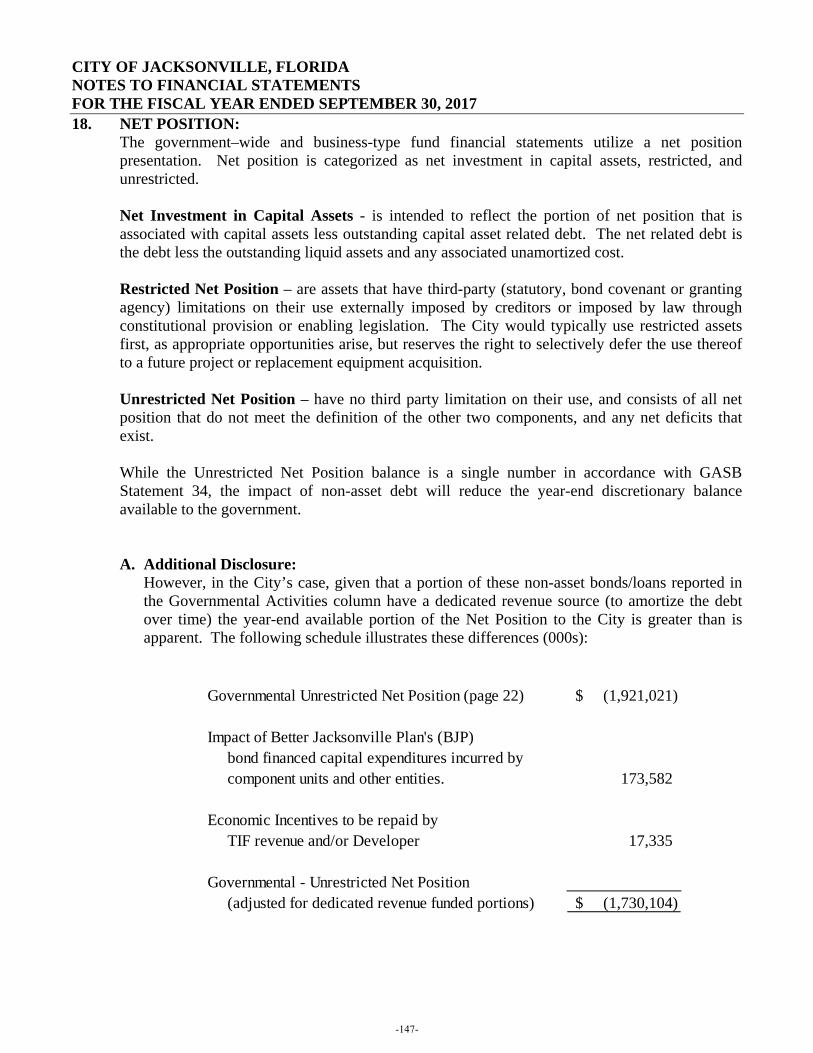
CITY OF JACKSONVILLE, FLORIDA NOTES TO FINANCIAL STATEMENTS FOR THE FISCAL YEAR ENDED SEPTEMBER 30, 2017
18. NET POSITION: The government–wide and business-type fund financial statements utilize a net position presentation. Net position is categorized as net investment in capital assets, restricted, and unrestricted. Net Investment in Capital Assets - is intended to reflect the portion of net position that is associated with capital assets less outstanding capital asset related debt. The net related debt is the debt less the outstanding liquid assets and any associated unamortized cost. Restricted Net Position – are assets that have third-party (statutory, bond covenant or granting agency) limitations on their use externally imposed by creditors or imposed by law through constitutional provision or enabling legislation. The City would typically use restricted assets first, as appropriate opportunities arise, but reserves the right to selectively defer the use thereof to a future project or replacement equipment acquisition. Unrestricted Net Position – have no third party limitation on their use, and consists of all net position that do not meet the definition of the other two components, and any net deficits that exist. While the Unrestricted Net Position balance is a single number in accordance with GASB Statement 34, the impact of non-asset debt will reduce the year-end discretionary balance available to the government.
A. Additional Disclosure: However, in the City’s case, given that a portion of these non-asset bonds/loans reported in the Governmental Activities column have a dedicated revenue source (to amortize the debt over time) the year-end available portion of the Net Position to the City is greater than is apparent. The following schedule illustrates these differences (000s):
Governmental Unrestricted Net Position (page 22) (1,921,021)$
Impact of Better Jacksonville Plan's (BJP) bond financed capital expenditures incurred by component units and other entities. 173,582
Economic Incentives to be repaid by TIF revenue and/or Developer 17,335
Governmental - Unrestricted Net Position (adjusted for dedicated revenue funded portions) (1,730,104)$
-147-
CITY OF JACKSONVILLE, FLORIDA NOTES TO FINANCIAL STATEMENTS FOR THE FISCAL YEAR ENDED SEPTEMBER 30, 2017
18. NET POSITION: (continued) A. Additional Disclosure: (continued)
Because the BJP program has dedicated sales tax revenue sources which will be used to repay the related debt service and either the CRA’s tax increment financing (TIF) revenue or the Developer repayments are anticipated to address the related debt service principal and all or a portion of the interest, the Government Unrestricted Net Position (adjusted for dedicated revenue funded portions of non-asset debt) more truly reflect the General Government’s available (although partially tentatively targeted) portion of net position.
19. FUND BALANCE DISCLOSURE: In accordance with Governmental Accounting Standards Board Statement 54, Fund Balance Reporting and Governmental Fund Type Definitions, the City classifies governmental fund balances as follows: Nonspendable - includes fund balance amounts that cannot be spent either because it is not in spendable form or because of legal or contractual requirements. Spendable Fund Balance
Restricted – includes fund balance amounts that are constrained for specific purposes which are externally imposed by providers, such as creditors or amounts constrained due to constitutional provisions or enabling legislation.
Committed – includes fund balance amounts that are constrained for specific purposes
that are internally imposed by the government through formal action of the highest level of decision making authority, City Council, through the issuance of an ordinance. Commitments may only be changed through the same type of formal action that created the commitment.
Assigned – includes spendable fund balance amounts that are intended to be used for
specific purposes that are neither considered restricted or committed. Fund Balance may be assigned through the following: 1) The Director of Finance is authorized by City Council to assign amounts for a specific purpose. (2) The City Council has authorized the Director of Finance, in coordination with the Council Auditor, to recapture excess fund balance that isn’t restricted or committed and transfer the excess to the General Fund – General Service District. Excess fund balance that is not recaptured is classified as assigned by the Director of Finance to be used for the purpose of the subfund.
Unassigned - includes residual positive fund balance within the General Fund that has not
been classified within the other above mentioned categories. Unassigned fund balance may also include negative balances for any governmental fund if expenditures exceed amounts restricted or committed for those specific purposes.
-148-
CITY OF JACKSONVILLE, FLORIDA NOTES TO FINANCIAL STATEMENTS FOR THE FISCAL YEAR ENDED SEPTEMBER 30, 2017
19. FUND BALANCE DISCLOSURE: (continued) The City uses restricted amounts first when both restricted and unrestricted fund balance is available unless there are legal documents/contracts that prohibit doing this, such as in grant agreements requiring dollar for dollar spending. Additionally, the City would first use committed, then assigned, and lastly unassigned amounts of unrestricted fund balance when expenditures are made, with the exception of the emergency reserve established by the City Council. Under normal circumstances, the City would first elect to utilize the Operating Reserve (Unassigned fund balance in the General Fund) before considering use of its Emergency Reserve. The City Council established an emergency reserve policy and fund beginning with the fiscal year 2006 budget and amended with Ordinance 2010-852-E, which added “The Emergency Reserve can be used to address unanticipated non-reimbursed expenditures arising out of a hurricane, tornado, other major weather related events, and/or other massive infrastructure failures or other disasters, whether man made or caused by nature.” The emergency reserve is contained as a separate subfund within the General Fund and is included in each annual budget. The emergency reserve shall not be used except as initiated by the mayor through written communication to the City Council, explaining the emergency, and requires approval by two-thirds vote of all City Council members. The emergency reserve will be classified as committed fund balance. The City does not have a formal minimum fund balance policy. However, the City’s Ordinance Code addresses various targeted reserve positions and the Administration calculates targets and actuals to report the results annually to City Council. A schedule of City fund balances is provided in the following pages.
(The remainder of this page is intentionally left blank)
-149-
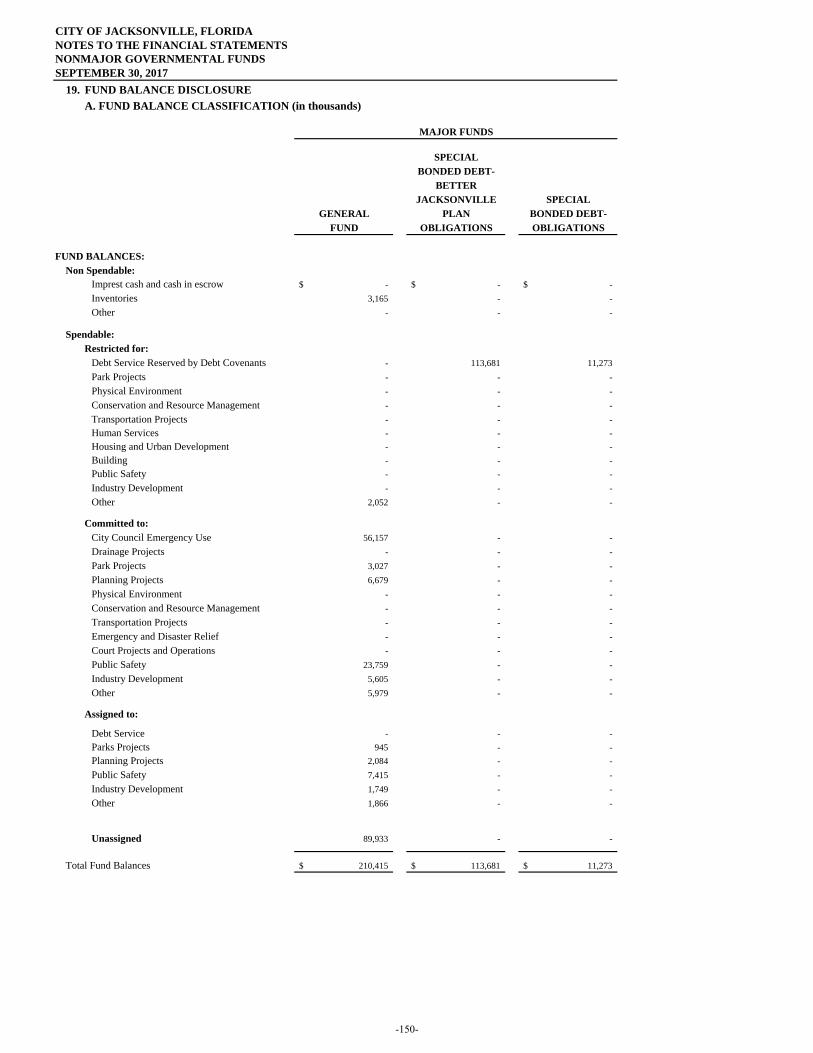
CITY OF JACKSONVILLE, FLORIDANOTES TO THE FINANCIAL STATEMENTSNONMAJOR GOVERNMENTAL FUNDSSEPTEMBER 30, 2017
19. FUND BALANCE DISCLOSUREA. FUND BALANCE CLASSIFICATION (in thousands)
SPECIALBONDED DEBT-
BETTERJACKSONVILLE SPECIAL
GENERAL PLAN BONDED DEBT-FUND OBLIGATIONS OBLIGATIONS
FUND BALANCES:
Non Spendable: Imprest cash and cash in escrow -$ -$ -$ Inventories 3,165 - - Other - - -
Spendable:
Restricted for: Debt Service Reserved by Debt Covenants - 113,681 11,273 Park Projects - - - Physical Environment - - - Conservation and Resource Management - - - Transportation Projects - - -
- - - - - -
- - - Public Safety - - - Industry Development - - - Other 2,052 - -
Committed to:
City Council Emergency Use 56,157 - - Drainage Projects - - - Park Projects 3,027 - - Planning Projects 6,679 - - Physical Environment - - - Conservation and Resource Management - - - Transportation Projects - - - Emergency and Disaster Relief - - - Court Projects and Operations - - - Public Safety 23,759 - - Industry Development 5,605 - - Other 5,979 - -
Assigned to:
Debt Service - - - Parks Projects 945 - - Planning Projects 2,084 - - Public Safety 7,415 - - Industry Development 1,749 - - Other 1,866 - -
Unassigned 89,933 - -
Total Fund Balances 210,415$ 113,681$ 11,273$
MAJOR FUNDS
Building
Human ServicesHousing and Urban Development
-150-
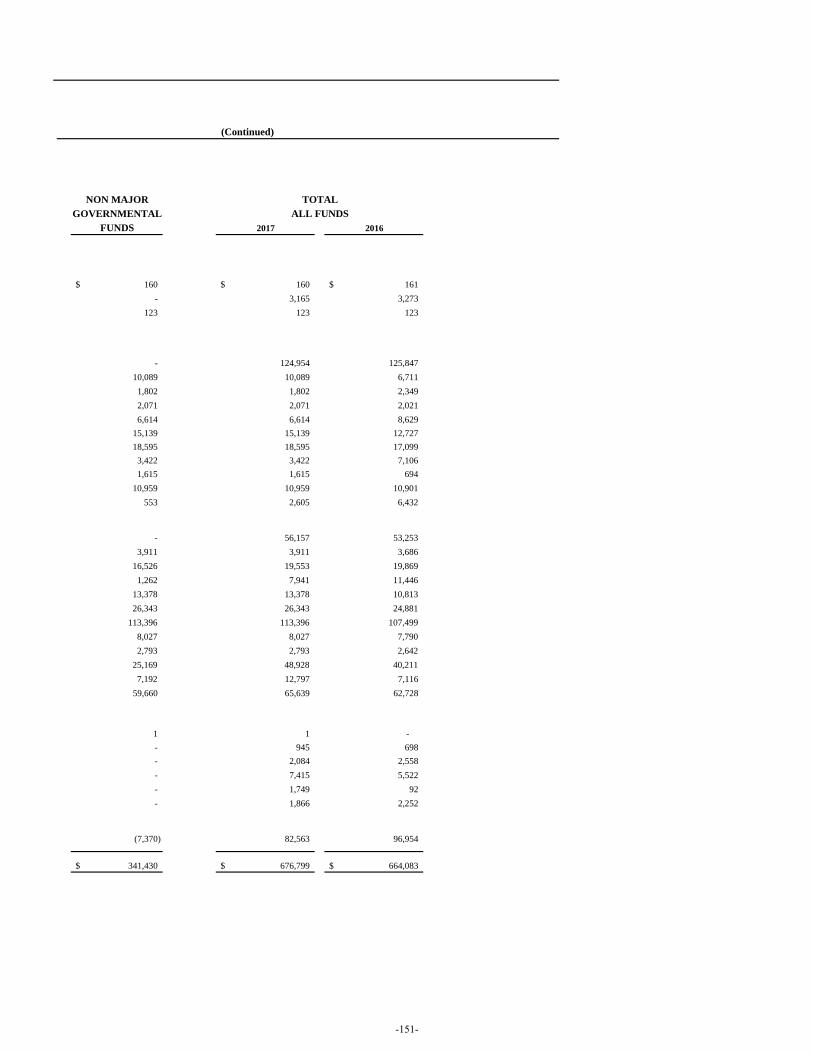
NON MAJORGOVERNMENTAL ALL FUNDS
FUNDS 2017 2016
160$ 160$ 161$ - 3,165 3,273
123 123 123
- 124,954 125,847
10,089 10,089 6,711 1,802 1,802 2,349 2,071 2,071 2,021 6,614 6,614 8,629
15,139 15,139 12,727 18,595 18,595 17,099
3,422 3,422 7,106 1,615 1,615 694
10,959 10,959 10,901 553 2,605 6,432
- 56,157 53,253
3,911 3,911 3,686 16,526 19,553 19,869
1,262 7,941 11,446 13,378 13,378 10,813 26,343 26,343 24,881
113,396 113,396 107,499 8,027 8,027 7,790 2,793 2,793 2,642
25,169 48,928 40,211 7,192 12,797 7,116
59,660 65,639 62,728
1 1 - - 945 698 - 2,084 2,558 - 7,415 5,522 - 1,749 92 - 1,866 2,252
(7,370) 82,563 96,954
341,430$ 676,799$ 664,083$
(Continued)
TOTAL
-151-

(This page is intentionally left blank.)
-152-

REQUIRED SUPPLEMENTAL INFORMATION
-153-
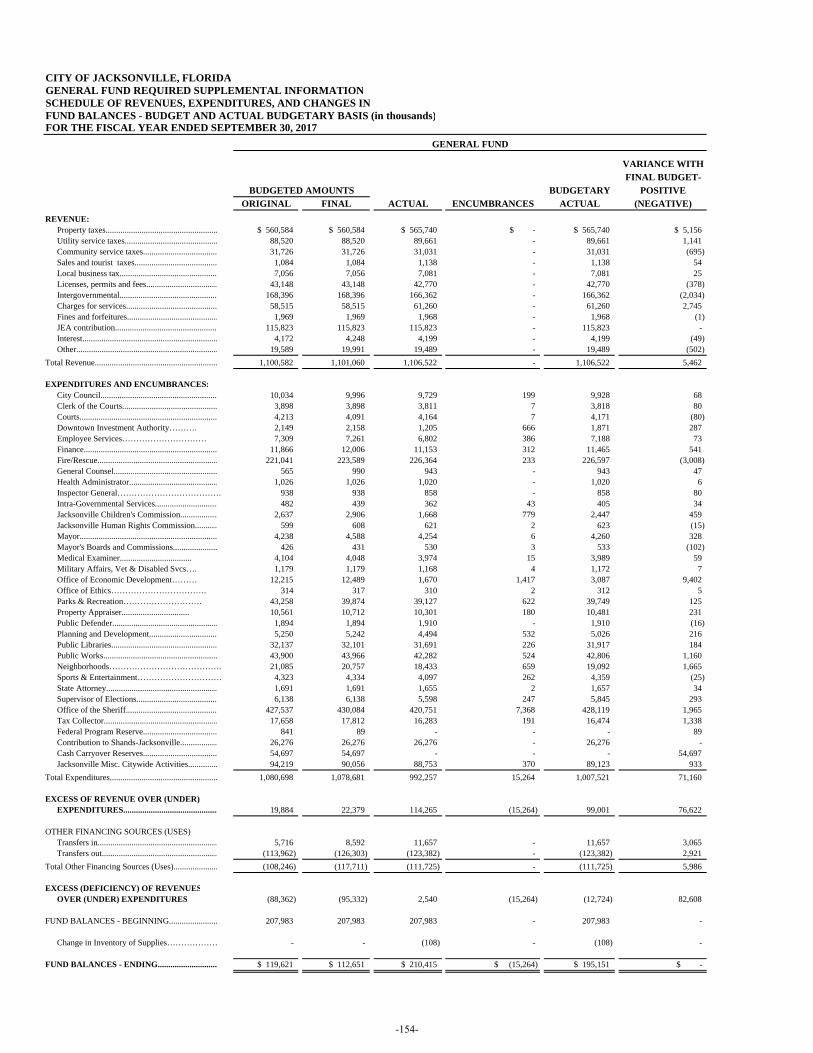
CITY OF JACKSONVILLE, FLORIDAGENERAL FUND REQUIRED SUPPLEMENTAL INFORMATIONSCHEDULE OF REVENUES, EXPENDITURES, AND CHANGES INFUND BALANCES - BUDGET AND ACTUAL BUDGETARY BASIS (in thousands)FOR THE FISCAL YEAR ENDED SEPTEMBER 30, 2017
VARIANCE WITH FINAL BUDGET- BUDGETARY POSITIVE ORIGINAL FINAL ACTUAL ENCUMBRANCES ACTUAL (NEGATIVE)
REVENUE: Property taxes..................................................... $ 560,584 $ 560,584 $ 565,740 $ - $ 565,740 $ 5,156Utility service taxes............................................ 88,520 88,520 89,661 - 89,661 1,141 Community service taxes................................... 31,726 31,726 31,031 - 31,031 (695) Sales and tourist taxes....................................... 1,084 1,084 1,138 - 1,138 54 Local business tax.............................................. 7,056 7,056 7,081 - 7,081 25 Licenses, permits and fees.................................. 43,148 43,148 42,770 - 42,770 (378)Intergovernmental.............................................. 168,396 168,396 166,362 - 166,362 (2,034)Charges for services........................................... 58,515 58,515 61,260 - 61,260 2,745Fines and forfeitures........................................... 1,969 1,969 1,968 - 1,968 (1)JEA contribution................................................ 115,823 115,823 115,823 - 115,823 - Interest................................................................ 4,172 4,248 4,199 - 4,199 (49)Other................................................................... 19,589 19,991 19,489 - 19,489 (502)
Total Revenue.......................................................... 1,100,582 1,101,060 1,106,522 - 1,106,522 5,462
EXPENDITURES AND ENCUMBRANCES: City Council....................................................... 10,034 9,996 9,729 199 9,928 68 Clerk of the Courts............................................. 3,898 3,898 3,811 7 3,818 80 Courts................................................................. 4,213 4,091 4,164 7 4,171 (80) Downtown Investment Authority………. 2,149 2,158 1,205 666 1,871 287 Employee Services………………………… 7,309 7,261 6,802 386 7,188 73 Finance............................................................... 11,866 12,006 11,153 312 11,465 541 Fire/Rescue......................................................... 221,041 223,589 226,364 233 226,597 (3,008) General Counsel................................................. 565 990 943 - 943 47 Health Administrator.......................................... 1,026 1,026 1,020 - 1,020 6 Inspector General………………………………. 938 938 858 - 858 80 Intra-Governmental Services.............................. 482 439 362 43 405 34 Jacksonville Children's Commission.................. 2,637 2,906 1,668 779 2,447 459 Jacksonville Human Rights Commission........... 599 608 621 2 623 (15) Mayor................................................................. 4,238 4,588 4,254 6 4,260 328 Mayor's Boards and Commissions..................... 426 431 530 3 533 (102) Medical Examiner................................... 4,104 4,048 3,974 15 3,989 59 Military Affairs, Vet & Disabled Svcs…. 1,179 1,179 1,168 4 1,172 7 Office of Economic Development……… 12,215 12,489 1,670 1,417 3,087 9,402 Office of Ethics……………………………. 314 317 310 2 312 5 Parks & Recreation………………………. 43,258 39,874 39,127 622 39,749 125 Property Appraiser................................. 10,561 10,712 10,301 180 10,481 231 Public Defender.................................................. 1,894 1,894 1,910 - 1,910 (16) Planning and Development................................ 5,250 5,242 4,494 532 5,026 216 Public Libraries.................................................. 32,137 32,101 31,691 226 31,917 184 Public Works...................................................... 43,900 43,966 42,282 524 42,806 1,160 Neighborhoods…………………………………. 21,085 20,757 18,433 659 19,092 1,665 Sports & Entertainment………………………… 4,323 4,334 4,097 262 4,359 (25) State Attorney..................................................... 1,691 1,691 1,655 2 1,657 34 Supervisor of Elections...................................... 6,138 6,138 5,598 247 5,845 293 Office of the Sheriff........................................... 427,537 430,084 420,751 7,368 428,119 1,965 Tax Collector...................................................... 17,658 17,812 16,283 191 16,474 1,338 Federal Program Reserve................................... 841 89 - - - 89 Contribution to Shands-Jacksonville.................. 26,276 26,276 26,276 - 26,276 - Cash Carryover Reserves................................... 54,697 54,697 - - - 54,697 Jacksonville Misc. Citywide Activities.............. 94,219 90,056 88,753 370 89,123 933
Total Expenditures................................................... 1,080,698 1,078,681 992,257 15,264 1,007,521 71,160
EXCESS OF REVENUE OVER (UNDER) EXPENDITURES............................................. 19,884 22,379 114,265 (15,264) 99,001 76,622
OTHER FINANCING SOURCES (USES)
Transfers in......................................................... 5,716 8,592 11,657 - 11,657 3,065 Transfers out....................................................... (113,962) (126,303) (123,382) - (123,382) 2,921
Total Other Financing Sources (Uses)..................... (108,246) (117,711) (111,725) - (111,725) 5,986
EXCESS (DEFICIENCY) OF REVENUES OVER (UNDER) EXPENDITURES (88,362) (95,332) 2,540 (15,264) (12,724) 82,608
FUND BALANCES - BEGINNING....................... 207,983 207,983 207,983 - 207,983 -
Change in Inventory of Supplies……………… - - (108) - (108) -
FUND BALANCES - ENDING............................ $ 119,621 $ 112,651 $ 210,415 $ (15,264) $ 195,151 $ -
GENERAL FUND
BUDGETED AMOUNTS
-154-
CITY OF JACKSONVILLE, FLORIDA NOTES TO REQUIRED SUPPLEMENTARY INFORMATION FOR THE FISCAL YEAR ENDED SEPTEMBER 30, 2017
1. BUDGETARY DATA
The City uses the following procedures in establishing the budgetary data reflected in the financial statements.
A. The City adopts its budget in accordance with Chapters 129 and 200, Florida Statutes,
the City Charter and Municipal Ordinance Code.
(1) The Mayor's Proposed Budget is presented to the City Council on the second Tuesday in July; the budget ordinance, millage levy ordinance and related resolutions are introduced.
(2) During the first Council meeting in September, public hearings are held on both
the budget and the millage rate. Following the public hearings, the Council adopts a tentative budget and tentative millage rate. A final budget and millage is adopted by full Council, and is effective on October 1.
The City presents a Budgetary Comparison Schedule as Required Supplementary Information for the General Fund and each major special revenue fund with a legally adopted budget. For the Fiscal Year 2017, no special revenue funds met the criteria to be reported as a major fund. The City has opted to make this presentation in the format and classifications of the budget document. These schedules report actual expenditures using generally accepted accounting principles as well as expenditures on the budgetary basis, which include amounts encumbered for future spending.
B. The City adopts annual budgets for the General Fund, certain Special Revenue Funds,
and Proprietary Funds. The City reports Budgetary Comparisons for its General Fund and Major Special Revenue Funds in the Required Supplementary Information section of the report. None of these funds had an excess of expenditures over appropriations for the year ended September 30, 2017. Proprietary Fund budgets are adopted for management control purposes. The City is not required to include Budgetary Comparisons for Proprietary Funds in this report. Project or program budgets, which may not coincide with the City's fiscal year, or which may exceed a single annual period, are adopted by separate ordinance for most Special Revenue Funds and Capital Project Funds. Budgets are not formally adopted for Debt Service Funds as internal spending controls are set by compliance with bond covenants. The Special Revenue Funds which are not annually budgeted include the following: Public Safety, Community Development Block Grant, Job Training Partnership Act Grant, Maintenance Parks and Recreation, Other Federal, State and Local Grants, Better Jacksonville Trust Fund, Housing Services, State Housing Initiative Partnership, Non-Budgeted General Government, Clerk of Court, and American Recovery & Reinvestment Act.
-155-
CITY OF JACKSONVILLE, FLORIDA NOTES TO REQUIRED SUPPLEMENTARY INFORMATION FOR THE FISCAL YEAR ENDED SEPTEMBER 30, 2017
1. BUDGETARY DATA (continued) C. Level of Budgetary Control - Expenditures may not exceed appropriations and are
controlled in the following manner:
(1) The budget is adopted by ordinance which sets the legal level of control at the fund level by department.
(2) The City adopted more stringent administrative policies that control expenditures
at the major category (Personal Services, Operating Expense, Capital Outlay, Debt Service) level within divisions within individual funds.
(3) The City, additionally, adopted a Municipal Ordinance Code Policy that provides
transfer authority to the mayor, without City Council approval, within an individual fund if the total transferred funds for a specific purpose, project or issue is under $500,000 during the fiscal year. These transfers are reported to the Finance Committee on a quarterly basis.
D. Supplemental Appropriations - The City Council may, through passage of an
ordinance, amend the budget in any manner permissible under state and local law, with one exception. Bond covenants, trust and agency agreements, and certain clauses of ordinances in effect may restrict certain budgetary items in terms of amount or use. In certain instances the City may supplement the appropriations in a fund due to unexpected high levels of receipts or under estimates of carry forward balances. Supplemental appropriations to the Fiscal Year 2017 Annual Budget Ordinance were made throughout the year, the effects of which were not material.
E. All appropriations in annually budgeted funds, except for amounts corresponding to outstanding encumbrances, lapse at year-end or at the close of the authorizing project/program, unless specifically carried forward by ordinance.
F. Formal budgetary integration is used as a management control device for all funds of
the City, except certain Debt Service Funds as explained in Note to RSI 1.C.
G. The City’s Annual Financial Plan, or published budget document, may be obtained from the City’s Budget Office located at 117 West Duval Street, Suite 325, Jacksonville, Florida 32202.
H. The Clerk of Court special revenue fund budget is not approved by the City. The
Court subfund is submitted and approved by the State and is based on the State’s July 1st to June 30th fiscal year.
-156-
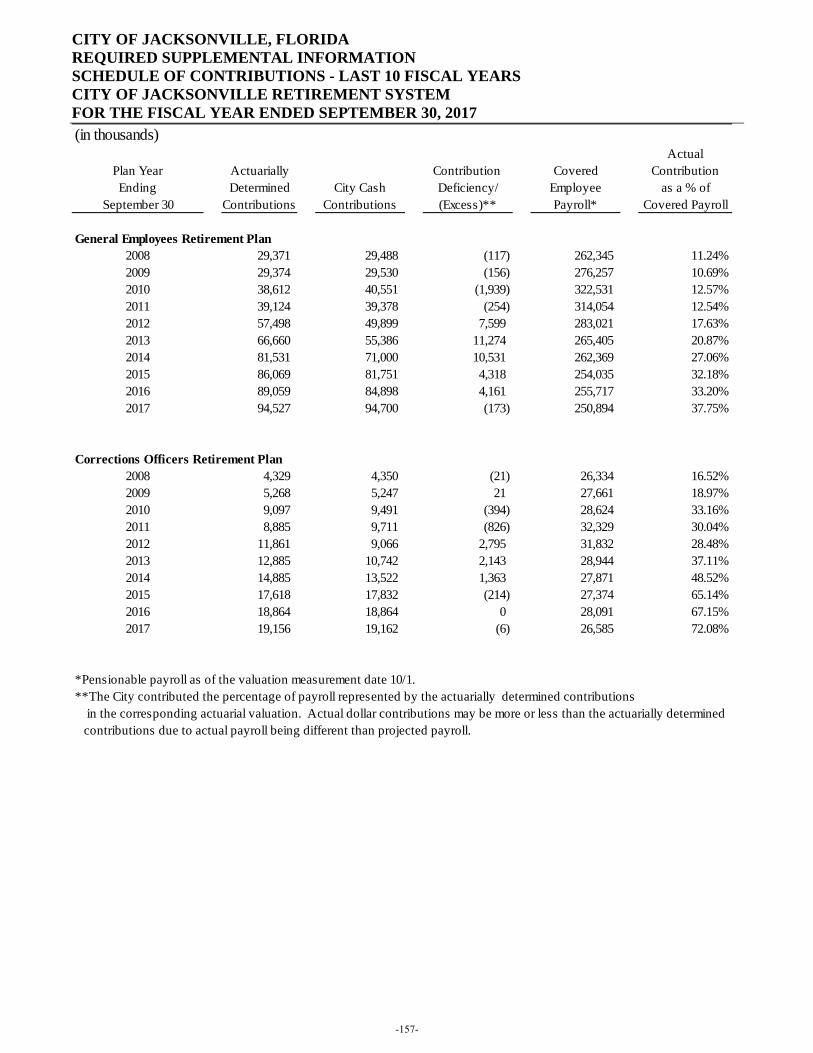
CITY OF JACKSONVILLE, FLORIDA REQUIRED SUPPLEMENTAL INFORMATION SCHEDULE OF CONTRIBUTIONS - LAST 10 FISCAL YEARS CITY OF JACKSONVILLE RETIREMENT SYSTEM FOR THE FISCAL YEAR ENDED SEPTEMBER 30, 2017
(in thousands)Actual
Plan Year Actuarially Contribution Covered ContributionEnding Determined City Cash Deficiency/ Employee as a % of
September 30 Contributions Contributions (Excess)** Payroll* Covered Payroll
General Employees Retirement Plan2008 29,371 29,488 (117) 262,345 11.24%2009 29,374 29,530 (156) 276,257 10.69%2010 38,612 40,551 (1,939) 322,531 12.57%2011 39,124 39,378 (254) 314,054 12.54%2012 57,498 49,899 7,599 283,021 17.63%2013 66,660 55,386 11,274 265,405 20.87%2014 81,531 71,000 10,531 262,369 27.06%2015 86,069 81,751 4,318 254,035 32.18%2016 89,059 84,898 4,161 255,717 33.20%2017 94,527 94,700 (173) 250,894 37.75%
Corrections Officers Retirement Plan2008 4,329 4,350 (21) 26,334 16.52%2009 5,268 5,247 21 27,661 18.97%2010 9,097 9,491 (394) 28,624 33.16%2011 8,885 9,711 (826) 32,329 30.04%2012 11,861 9,066 2,795 31,832 28.48%2013 12,885 10,742 2,143 28,944 37.11%2014 14,885 13,522 1,363 27,871 48.52%2015 17,618 17,832 (214) 27,374 65.14%2016 18,864 18,864 0 28,091 67.15%2017 19,156 19,162 (6) 26,585 72.08%
*Pensionable payroll as of the valuation measurement date 10/1.**The City contributed the percentage of payroll represented by the actuarially determined contributions in the corresponding actuarial valuation. Actual dollar contributions may be more or less than the actuarially determined contributions due to actual payroll being different than projected payroll.
-157-
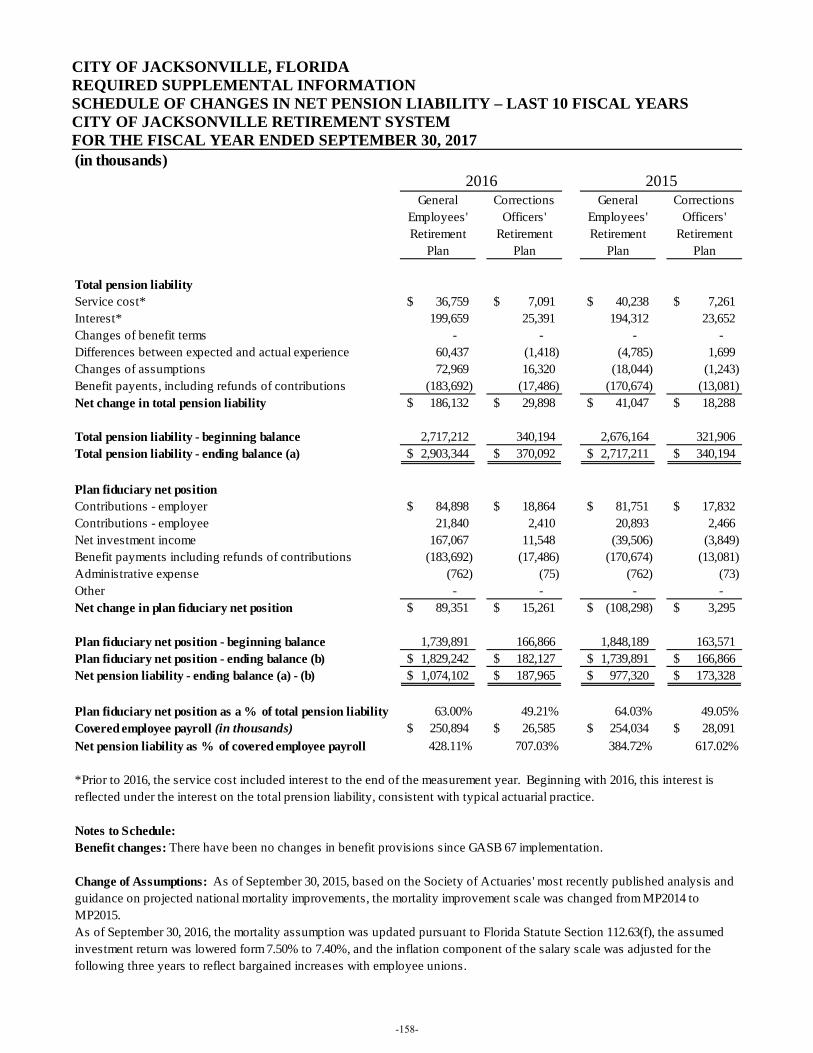
CITY OF JACKSONVILLE, FLORIDA REQUIRED SUPPLEMENTAL INFORMATION SCHEDULE OF CHANGES IN NET PENSION LIABILITY – LAST 10 FISCAL YEARS CITY OF JACKSONVILLE RETIREMENT SYSTEM FOR THE FISCAL YEAR ENDED SEPTEMBER 30, 2017
(in thousands)
General Employees' Retirement
Plan
Corrections Officers'
Retirement Plan
General Employees' Retirement
Plan
Corrections Officers'
Retirement Plan
Total pension liabilityService cost* 36,759$ 7,091$ 40,238$ 7,261$ Interest* 199,659 25,391 194,312 23,652 Changes of benefit terms - - - - Differences between expected and actual experience 60,437 (1,418) (4,785) 1,699 Changes of assumptions 72,969 16,320 (18,044) (1,243) Benefit payents, including refunds of contributions (183,692) (17,486) (170,674) (13,081) Net change in total pension liability 186,132$ 29,898$ 41,047$ 18,288$
Total pension liability - beginning balance 2,717,212 340,194 2,676,164 321,906 Total pension liability - ending balance (a) 2,903,344$ 370,092$ 2,717,211$ 340,194$
Plan fiduciary net positionContributions - employer 84,898$ 18,864$ 81,751$ 17,832$ Contributions - employee 21,840 2,410 20,893 2,466 Net investment income 167,067 11,548 (39,506) (3,849) Benefit payments including refunds of contributions (183,692) (17,486) (170,674) (13,081) Administrative expense (762) (75) (762) (73) Other - - - - Net change in plan fiduciary net position 89,351$ 15,261$ (108,298)$ 3,295$
Plan fiduciary net position - beginning balance 1,739,891 166,866 1,848,189 163,571 Plan fiduciary net position - ending balance (b) 1,829,242$ 182,127$ 1,739,891$ 166,866$ Net pension liability - ending balance (a) - (b) 1,074,102$ 187,965$ 977,320$ 173,328$
Plan fiduciary net position as a % of total pension liability 63.00% 49.21% 64.03% 49.05%Covered employee payroll (in thousands) 250,894$ 26,585$ 254,034$ 28,091$ Net pension liability as % of covered employee payroll 428.11% 707.03% 384.72% 617.02%
Notes to Schedule:Benefit changes: There have been no changes in benefit provisions since GASB 67 implementation.
As of September 30, 2016, the mortality assumption was updated pursuant to Florida Statute Section 112.63(f), the assumed investment return was lowered form 7.50% to 7.40%, and the inflation component of the salary scale was adjusted for the following three years to reflect bargained increases with employee unions.
2016
*Prior to 2016, the service cost included interest to the end of the measurement year. Beginning with 2016, this interest is reflected under the interest on the total prension liability, consistent with typical actuarial practice.
2015
Change of Assumptions: As of September 30, 2015, based on the Society of Actuaries' most recently published analysis and guidance on projected national mortality improvements, the mortality improvement scale was changed from MP2014 to MP2015.
-158-
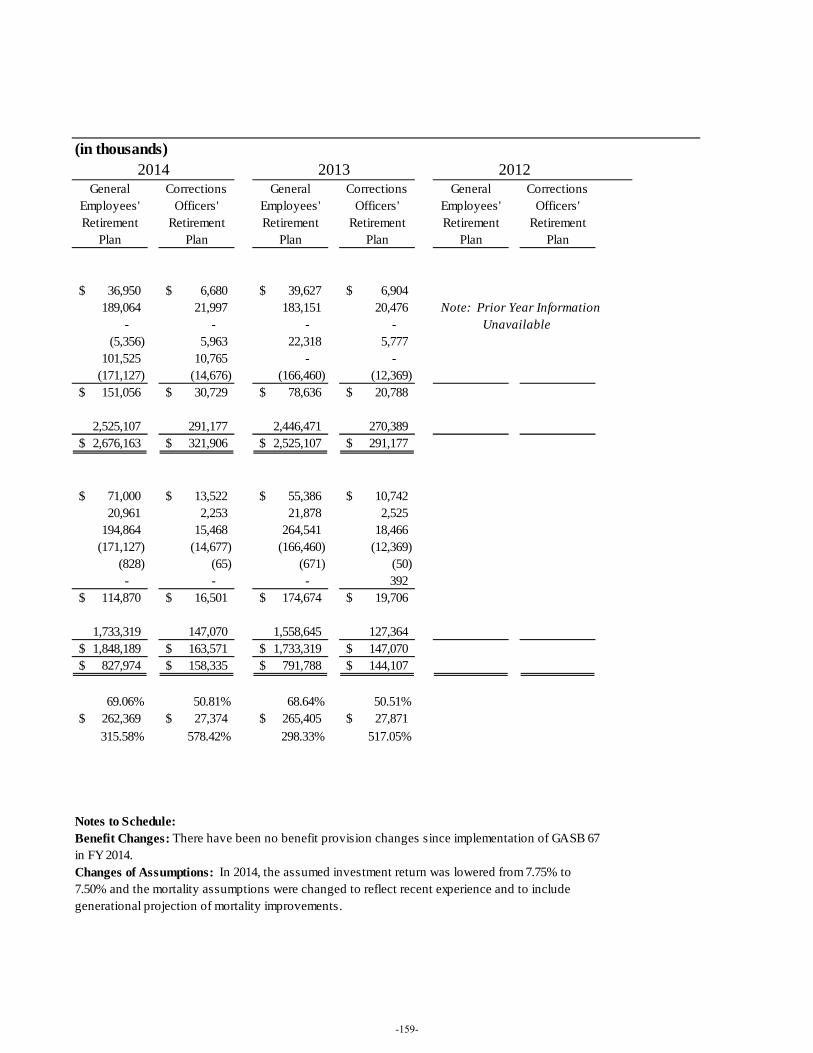
(in thousands)
General Employees' Retirement
Plan
Corrections Officers'
Retirement Plan
General Employees' Retirement
Plan
Corrections Officers'
Retirement Plan
General Employees' Retirement
Plan
Corrections Officers'
Retirement Plan
36,950$ 6,680$ 39,627$ 6,904$ 189,064 21,997 183,151 20,476 Note: Prior Year Information
- - - - Unavailable(5,356) 5,963 22,318 5,777
101,525 10,765 - - (171,127) (14,676) (166,460) (12,369) 151,056$ 30,729$ 78,636$ 20,788$
2,525,107 291,177 2,446,471 270,389 2,676,163$ 321,906$ 2,525,107$ 291,177$
71,000$ 13,522$ 55,386$ 10,742$ 20,961 2,253 21,878 2,525
194,864 15,468 264,541 18,466 (171,127) (14,677) (166,460) (12,369)
(828) (65) (671) (50) - - - 392
114,870$ 16,501$ 174,674$ 19,706$
1,733,319 147,070 1,558,645 127,364 1,848,189$ 163,571$ 1,733,319$ 147,070$
827,974$ 158,335$ 791,788$ 144,107$
69.06% 50.81% 68.64% 50.51%262,369$ 27,374$ 265,405$ 27,871$ 315.58% 578.42% 298.33% 517.05%
Benefit Changes: There have been no benefit provision changes since implementation of GASB 67 in FY 2014.
2014 2013 2012
Notes to Schedule:
Changes of Assumptions: In 2014, the assumed investment return was lowered from 7.75% to 7.50% and the mortality assumptions were changed to reflect recent experience and to include generational projection of mortality improvements.
-159-
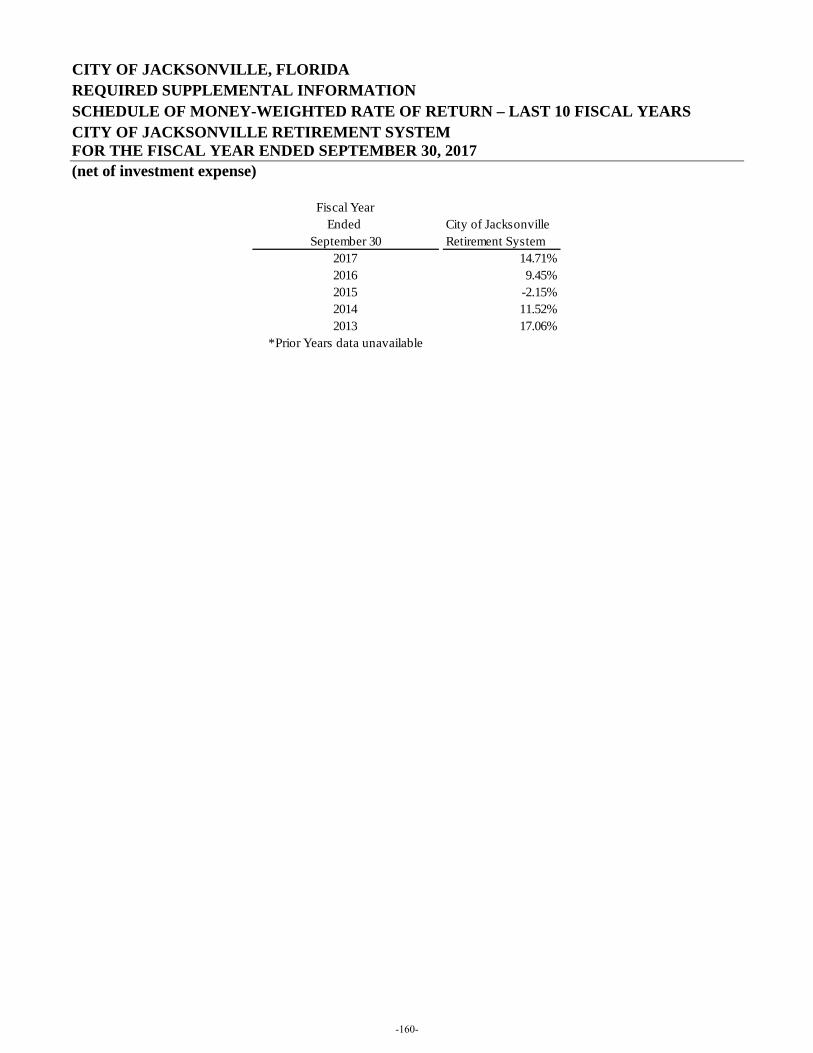
CITY OF JACKSONVILLE, FLORIDA REQUIRED SUPPLEMENTAL INFORMATION SCHEDULE OF MONEY-WEIGHTED RATE OF RETURN – LAST 10 FISCAL YEARS CITY OF JACKSONVILLE RETIREMENT SYSTEM FOR THE FISCAL YEAR ENDED SEPTEMBER 30, 2017
(net of investment expense)
Fiscal YearEnded City of Jacksonville
September 30 Retirement System2017 14.71%2016 9.45%2015 -2.15%2014 11.52%2013 17.06%
*Prior Years data unavailable
-160-
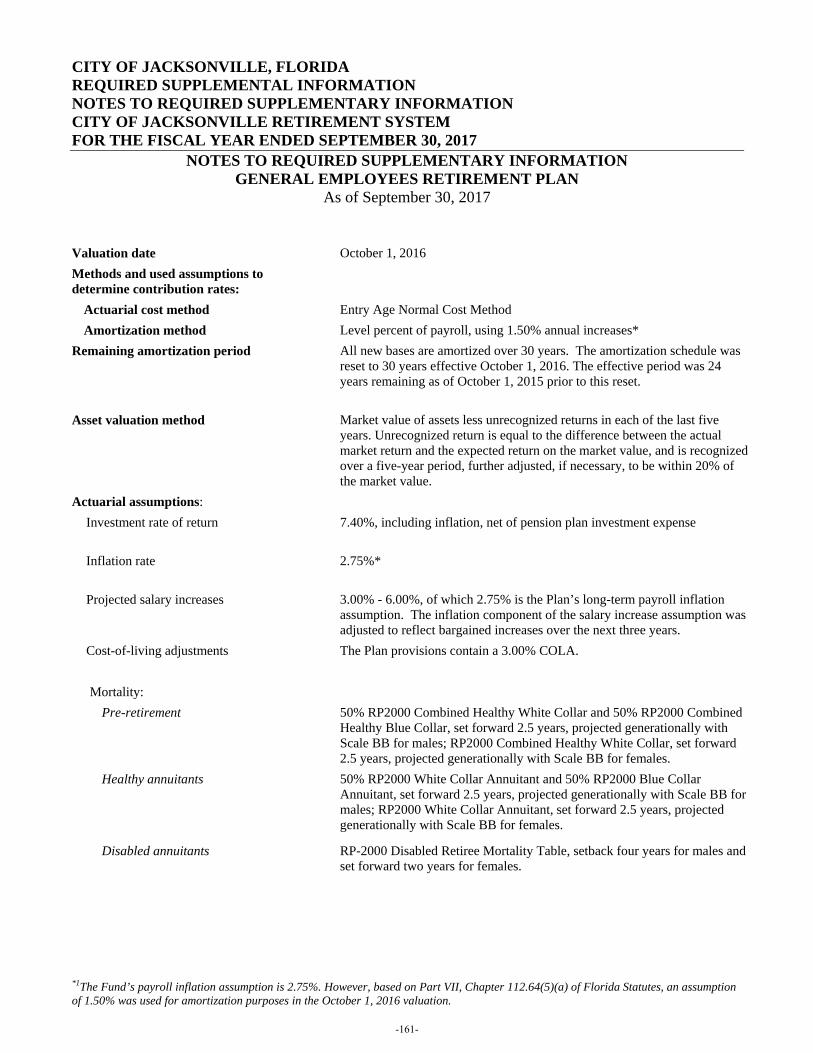
CITY OF JACKSONVILLE, FLORIDA REQUIRED SUPPLEMENTAL INFORMATION NOTES TO REQUIRED SUPPLEMENTARY INFORMATION CITY OF JACKSONVILLE RETIREMENT SYSTEM FOR THE FISCAL YEAR ENDED SEPTEMBER 30, 2017
NOTES TO REQUIRED SUPPLEMENTARY INFORMATION GENERAL EMPLOYEES RETIREMENT PLAN
As of September 30, 2017 Valuation date October 1, 2016 Methods and used assumptions to determine contribution rates:
Actuarial cost method Entry Age Normal Cost Method Amortization method Level percent of payroll, using 1.50% annual increases* Remaining amortization period All new bases are amortized over 30 years. The amortization schedule was
reset to 30 years effective October 1, 2016. The effective period was 24 years remaining as of October 1, 2015 prior to this reset.
Asset valuation method Market value of assets less unrecognized returns in each of the last five years. Unrecognized return is equal to the difference between the actual market return and the expected return on the market value, and is recognized over a five-year period, further adjusted, if necessary, to be within 20% of the market value.
Actuarial assumptions: Investment rate of return 7.40%, including inflation, net of pension plan investment expense Inflation rate
2.75%*
Projected salary increases 3.00% - 6.00%, of which 2.75% is the Plan’s long-term payroll inflation assumption. The inflation component of the salary increase assumption was adjusted to reflect bargained increases over the next three years.
Cost-of-living adjustments The Plan provisions contain a 3.00% COLA. Mortality:
Pre-retirement 50% RP2000 Combined Healthy White Collar and 50% RP2000 Combined Healthy Blue Collar, set forward 2.5 years, projected generationally with Scale BB for males; RP2000 Combined Healthy White Collar, set forward 2.5 years, projected generationally with Scale BB for females.
Healthy annuitants 50% RP2000 White Collar Annuitant and 50% RP2000 Blue Collar Annuitant, set forward 2.5 years, projected generationally with Scale BB for males; RP2000 White Collar Annuitant, set forward 2.5 years, projected generationally with Scale BB for females.
Disabled annuitants RP-2000 Disabled Retiree Mortality Table, setback four years for males and set forward two years for females.
*1The Fund’s payroll inflation assumption is 2.75%. However, based on Part VII, Chapter 112.64(5)(a) of Florida Statutes, an assumption of 1.50% was used for amortization purposes in the October 1, 2016 valuation.
-161-
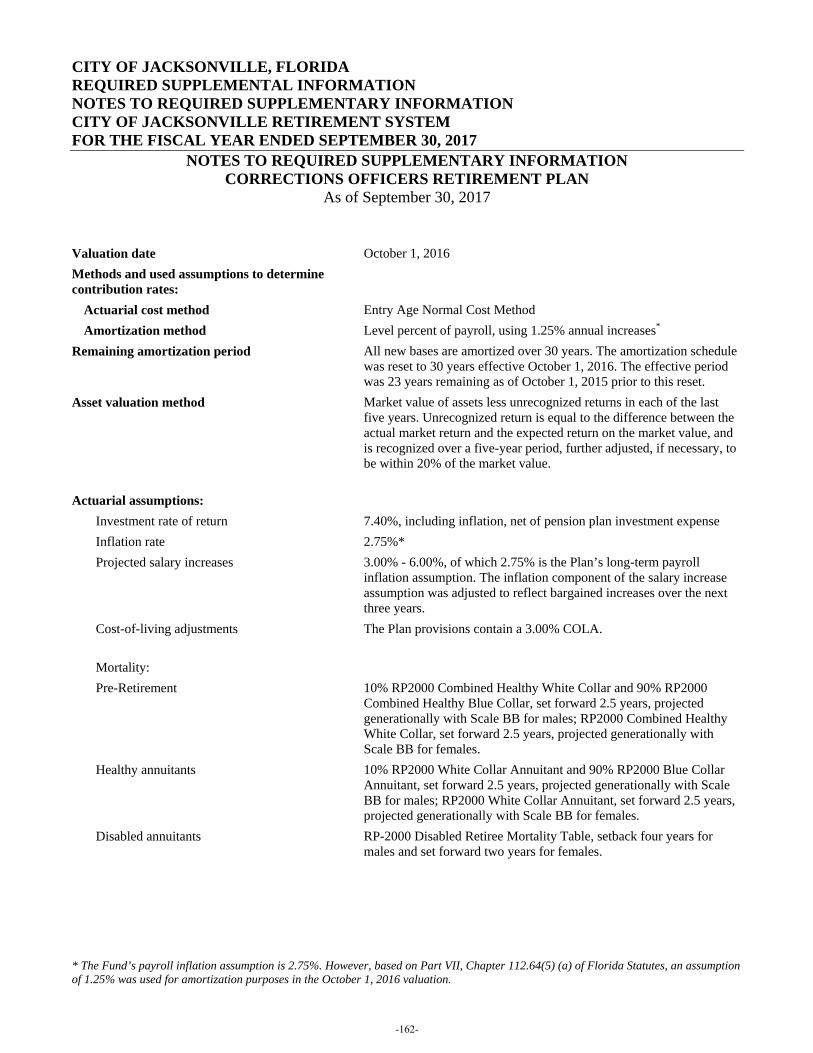
CITY OF JACKSONVILLE, FLORIDA REQUIRED SUPPLEMENTAL INFORMATION NOTES TO REQUIRED SUPPLEMENTARY INFORMATION CITY OF JACKSONVILLE RETIREMENT SYSTEM FOR THE FISCAL YEAR ENDED SEPTEMBER 30, 2017
NOTES TO REQUIRED SUPPLEMENTARY INFORMATION CORRECTIONS OFFICERS RETIREMENT PLAN
As of September 30, 2017
Valuation date October 1, 2016 Methods and used assumptions to determine contribution rates:
Actuarial cost method Entry Age Normal Cost Method Amortization method Level percent of payroll, using 1.25% annual increases* Remaining amortization period All new bases are amortized over 30 years. The amortization schedule
was reset to 30 years effective October 1, 2016. The effective period was 23 years remaining as of October 1, 2015 prior to this reset.
Asset valuation method Market value of assets less unrecognized returns in each of the last five years. Unrecognized return is equal to the difference between the actual market return and the expected return on the market value, and is recognized over a five-year period, further adjusted, if necessary, to be within 20% of the market value.
Actuarial assumptions: Investment rate of return 7.40%, including inflation, net of pension plan investment expense Inflation rate 2.75%* Projected salary increases 3.00% - 6.00%, of which 2.75% is the Plan’s long-term payroll
inflation assumption. The inflation component of the salary increase assumption was adjusted to reflect bargained increases over the next three years.
Cost-of-living adjustments The Plan provisions contain a 3.00% COLA.
Mortality: Pre-Retirement 10% RP2000 Combined Healthy White Collar and 90% RP2000
Combined Healthy Blue Collar, set forward 2.5 years, projected generationally with Scale BB for males; RP2000 Combined Healthy White Collar, set forward 2.5 years, projected generationally with Scale BB for females.
Healthy annuitants 10% RP2000 White Collar Annuitant and 90% RP2000 Blue Collar Annuitant, set forward 2.5 years, projected generationally with Scale BB for males; RP2000 White Collar Annuitant, set forward 2.5 years, projected generationally with Scale BB for females.
Disabled annuitants RP-2000 Disabled Retiree Mortality Table, setback four years for males and set forward two years for females.
* The Fund’s payroll inflation assumption is 2.75%. However, based on Part VII, Chapter 112.64(5) (a) of Florida Statutes, an assumption of 1.25% was used for amortization purposes in the October 1, 2016 valuation.
-162-
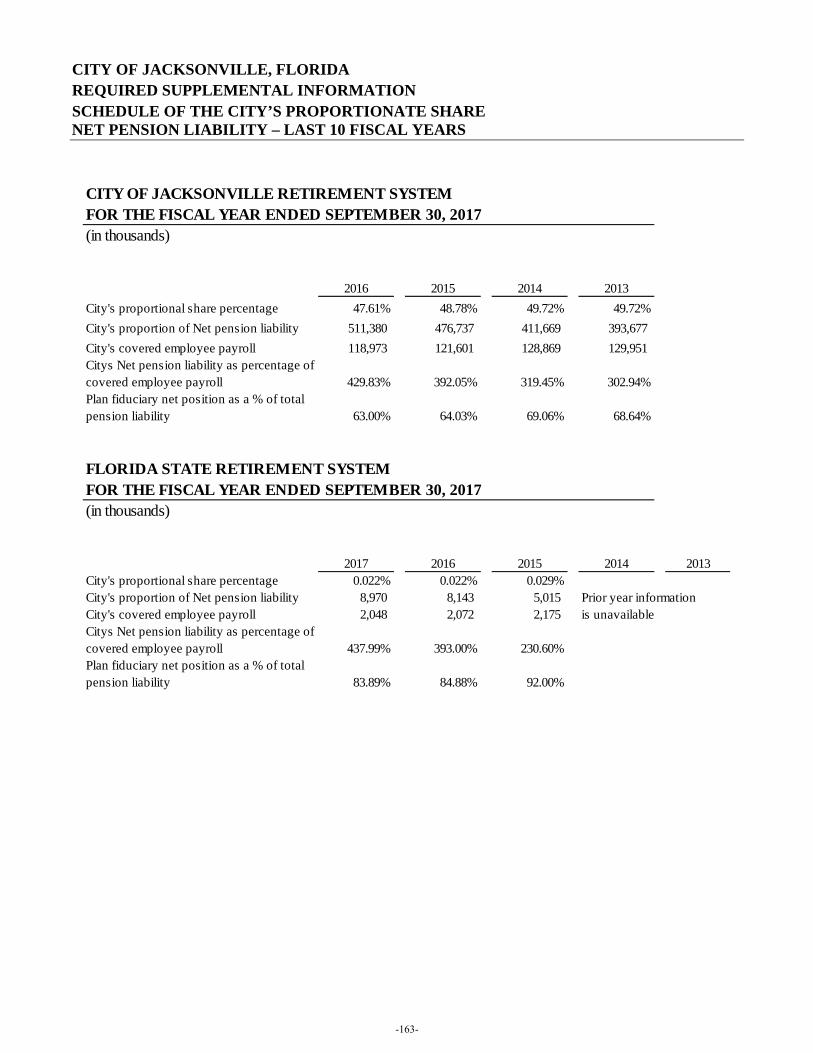
CITY OF JACKSONVILLE, FLORIDA REQUIRED SUPPLEMENTAL INFORMATION SCHEDULE OF THE CITY’S PROPORTIONATE SHARE NET PENSION LIABILITY – LAST 10 FISCAL YEARS
CITY OF JACKSONVILLE RETIREMENT SYSTEMFOR THE FISCAL YEAR ENDED SEPTEMBER 30, 2017(in thousands)
2016 2015 2014 2013City's proportional share percentage 47.61% 48.78% 49.72% 49.72%City's proportion of Net pension liability 511,380 476,737 411,669 393,677 City's covered employee payroll 118,973 121,601 128,869 129,951 Citys Net pension liability as percentage of covered employee payroll 429.83% 392.05% 319.45% 302.94%Plan fiduciary net position as a % of total pension liability 63.00% 64.03% 69.06% 68.64%
FLORIDA STATE RETIREMENT SYSTEMFOR THE FISCAL YEAR ENDED SEPTEMBER 30, 2017(in thousands)
2017 2016 2015 2014 2013City's proportional share percentage 0.022% 0.022% 0.029%City's proportion of Net pension liability 8,970 8,143 5,015 Prior year informationCity's covered employee payroll 2,048 2,072 2,175 is unavailableCitys Net pension liability as percentage of covered employee payroll 437.99% 393.00% 230.60%Plan fiduciary net position as a % of total pension liability 83.89% 84.88% 92.00%
-163-
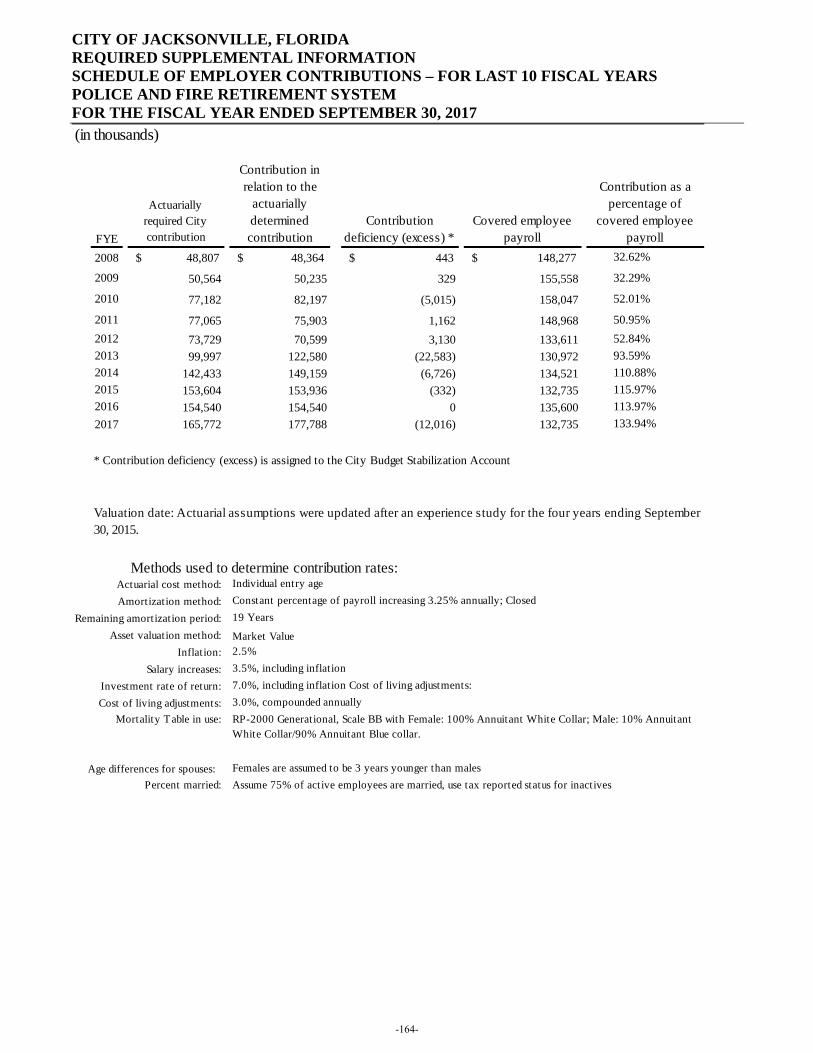
CITY OF JACKSONVILLE, FLORIDA REQUIRED SUPPLEMENTAL INFORMATION SCHEDULE OF EMPLOYER CONTRIBUTIONS – FOR LAST 10 FISCAL YEARS POLICE AND FIRE RETIREMENT SYSTEM FOR THE FISCAL YEAR ENDED SEPTEMBER 30, 2017
(in thousands)
Actuarially required City contribution
Contribution in relation to the
actuarially determined contribution
Contribution deficiency (excess) *
Covered employee payroll
Contribution as a percentage of
covered employee payroll
2008 $ 48,807 $ 48,364 $ 443 $ 148,277 32.62%
2009 50,564 50,235 329 155,558 32.29%
2010 77,182 82,197 (5,015) 158,047 52.01%
2011 77,065 75,903 1,162 148,968 50.95%2012 73,729 70,599 3,130 133,611 52.84%2013 99,997 122,580 (22,583) 130,972 93.59%2014 142,433 149,159 (6,726) 134,521 110.88%2015 153,604 153,936 (332) 132,735 115.97%2016 154,540 154,540 0 135,600 113.97%2017 165,772 177,788 (12,016) 132,735 133.94%
Methods used to determine contribution rates:Actuarial cost method:Amortization method:
Remaining amortization period:Asset valuation method:
Inflation:Salary increases:
Investment rate of return:Cost of living adjustments:
Mortality Table in use:
Age differences for spouses: Percent married: Assume 75% of active employees are married, use tax reported status for inactives
3.5%, including inflation7.0%, including inflation Cost of living adjustments:3.0%, compounded annuallyRP-2000 Generational, Scale BB with Female: 100% Annuitant White Collar; Male: 10% Annuitant White Collar/90% Annuitant Blue collar.
Females are assumed to be 3 years younger than males
Individual entry ageConstant percentage of payroll increasing 3.25% annually; Closed 19 Years
Market Value2.5%
Valuation date: Actuarial assumptions were updated after an experience study for the four years ending September 30, 2015.
* Contribution deficiency (excess) is assigned to the City Budget Stabilization Account
FYE
-164-
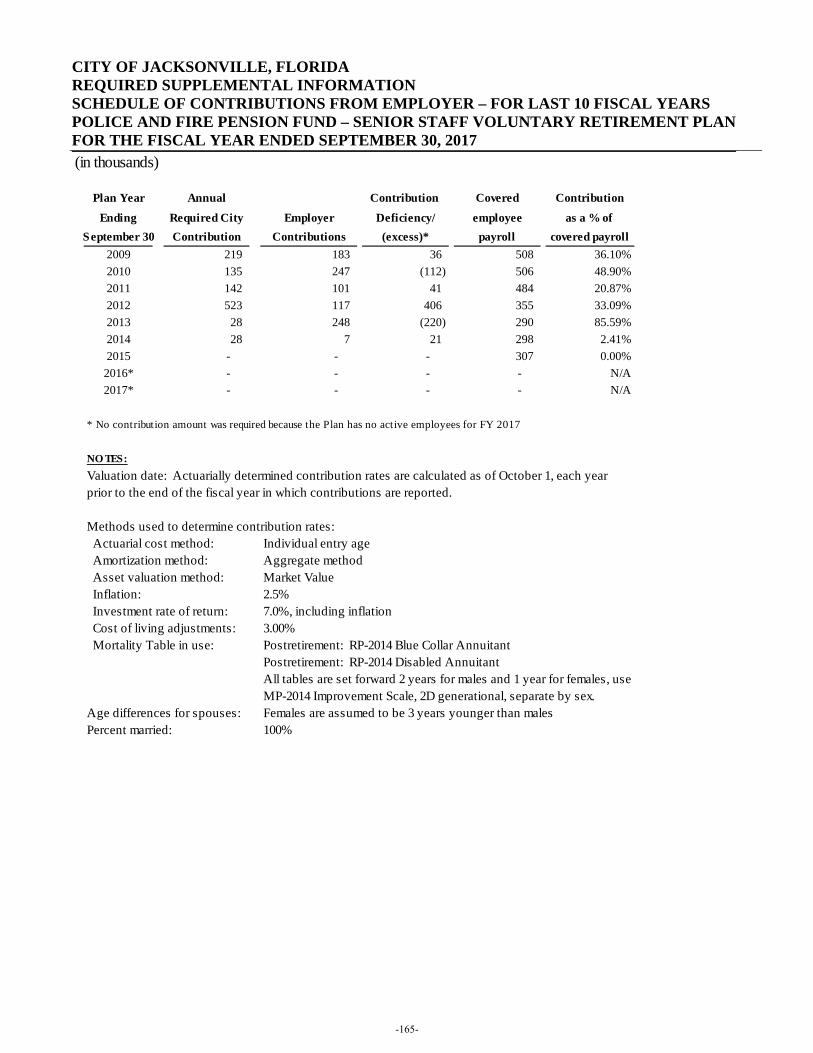
CITY OF JACKSONVILLE, FLORIDA REQUIRED SUPPLEMENTAL INFORMATION SCHEDULE OF CONTRIBUTIONS FROM EMPLOYER – FOR LAST 10 FISCAL YEARS POLICE AND FIRE PENSION FUND – SENIOR STAFF VOLUNTARY RETIREMENT PLAN FOR THE FISCAL YEAR ENDED SEPTEMBER 30, 2017
(in thousands)
Plan Year Annual Contribution Covered Contribution
Ending Required City Employer Deficiency/ employee as a % of September 30 Contribution Contributions (excess)* payroll covered payroll
2009 219 183 36 508 36.10%2010 135 247 (112) 506 48.90%2011 142 101 41 484 20.87%2012 523 117 406 355 33.09%2013 28 248 (220) 290 85.59%2014 28 7 21 298 2.41%2015 - - - 307 0.00%2016* - - - - N/A2017* - - - - N/A
* No contribution amount was required because the Plan has no active employees for FY 2017
NO TES: Valuation date: Actuarially determined contribution rates are calculated as of October 1, each year
Actuarial cost method: Individual entry age Amortization method: Aggregate method Asset valuation method: Market Value Inflation: 2.5% Investment rate of return: 7.0%, including inflation Cost of living adjustments: 3.00% Mortality Table in use: Postretirement: RP-2014 Blue Collar Annuitant
Postretirement: RP-2014 Disabled AnnuitantAll tables are set forward 2 years for males and 1 year for females, useMP-2014 Improvement Scale, 2D generational, separate by sex.
Age differences for spouses: Females are assumed to be 3 years younger than malesPercent married: 100%
prior to the end of the fiscal year in which contributions are reported.
Methods used to determine contribution rates:
-165-
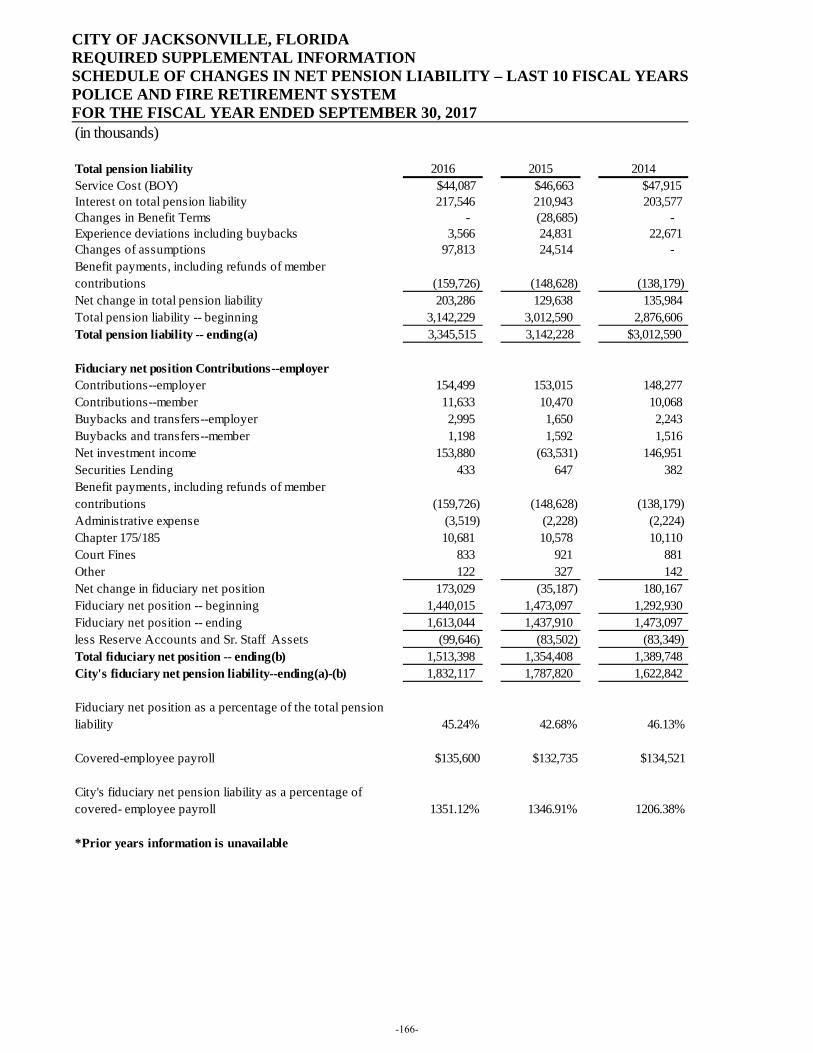
CITY OF JACKSONVILLE, FLORIDA REQUIRED SUPPLEMENTAL INFORMATION SCHEDULE OF CHANGES IN NET PENSION LIABILITY – LAST 10 FISCAL YEARS POLICE AND FIRE RETIREMENT SYSTEM FOR THE FISCAL YEAR ENDED SEPTEMBER 30, 2017
(in thousands)
Total pension liability 2016 2015 2014Service Cost (BOY) $44,087 $46,663 $47,915Interest on total pension liability 217,546 210,943 203,577 Changes in Benefit Terms - (28,685) - Experience deviations including buybacks 3,566 24,831 22,671 Changes of assumptions 97,813 24,514 - Benefit payments, including refunds of member contributions (159,726) (148,628) (138,179)Net change in total pension liability 203,286 129,638 135,984 Total pension liability -- beginning 3,142,229 3,012,590 2,876,606 Total pension liability -- ending(a) 3,345,515 3,142,228 $3,012,590
Fiduciary net position Contributions--employerContributions--employer 154,499 153,015 148,277 Contributions--member 11,633 10,470 10,068 Buybacks and transfers--employer 2,995 1,650 2,243 Buybacks and transfers--member 1,198 1,592 1,516 Net investment income 153,880 (63,531) 146,951 Securities Lending 433 647 382 Benefit payments, including refunds of member contributions (159,726) (148,628) (138,179)Administrative expense (3,519) (2,228) (2,224)Chapter 175/185 10,681 10,578 10,110 Court Fines 833 921 881 Other 122 327 142 Net change in fiduciary net position 173,029 (35,187) 180,167 Fiduciary net position -- beginning 1,440,015 1,473,097 1,292,930 Fiduciary net position -- ending 1,613,044 1,437,910 1,473,097 less Reserve Accounts and Sr. Staff Assets (99,646) (83,502) (83,349)Total fiduciary net position -- ending(b) 1,513,398 1,354,408 1,389,748 City's fiduciary net pension liability--ending(a)-(b) 1,832,117 1,787,820 1,622,842
Fiduciary net position as a percentage of the total pension liability 45.24% 42.68% 46.13%
Covered-employee payroll $135,600 $132,735 $134,521
City's fiduciary net pension liability as a percentage of covered- employee payroll 1351.12% 1346.91% 1206.38%
*Prior years information is unavailable
-166-
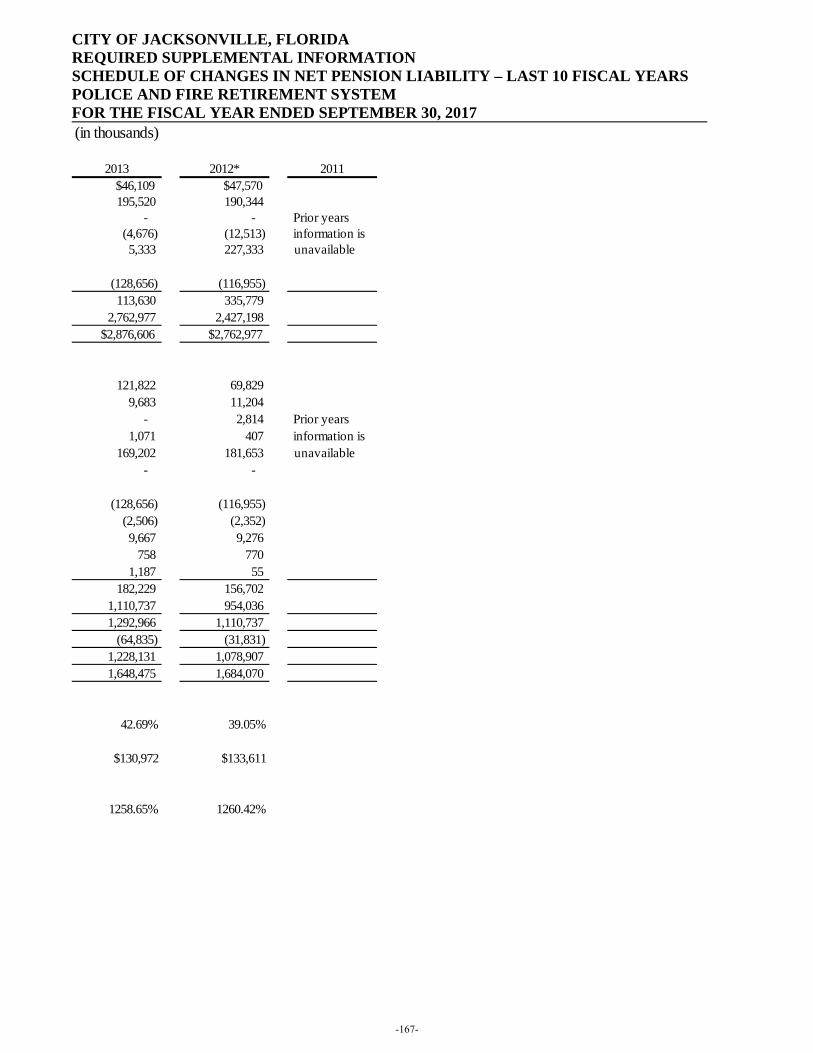
CITY OF JACKSONVILLE, FLORIDA REQUIRED SUPPLEMENTAL INFORMATION SCHEDULE OF CHANGES IN NET PENSION LIABILITY – LAST 10 FISCAL YEARS POLICE AND FIRE RETIREMENT SYSTEM FOR THE FISCAL YEAR ENDED SEPTEMBER 30, 2017
(in thousands)
2013 2012* 2011$46,109 $47,570
195,520 190,344 - - Prior years (4,676) (12,513) information is 5,333 227,333 unavailable
(128,656) (116,955) 113,630 335,779 2,762,977 2,427,198
$2,876,606 $2,762,977
121,822 69,829 9,683 11,204 - 2,814 Prior years 1,071 407 information is 169,202 181,653 unavailable - -
(128,656) (116,955) (2,506) (2,352) 9,667 9,276 758 770 1,187 55 182,229 156,702 1,110,737 954,036 1,292,966 1,110,737 (64,835) (31,831) 1,228,131 1,078,907 1,648,475 1,684,070
42.69% 39.05%
$130,972 $133,611
1258.65% 1260.42%
-167-
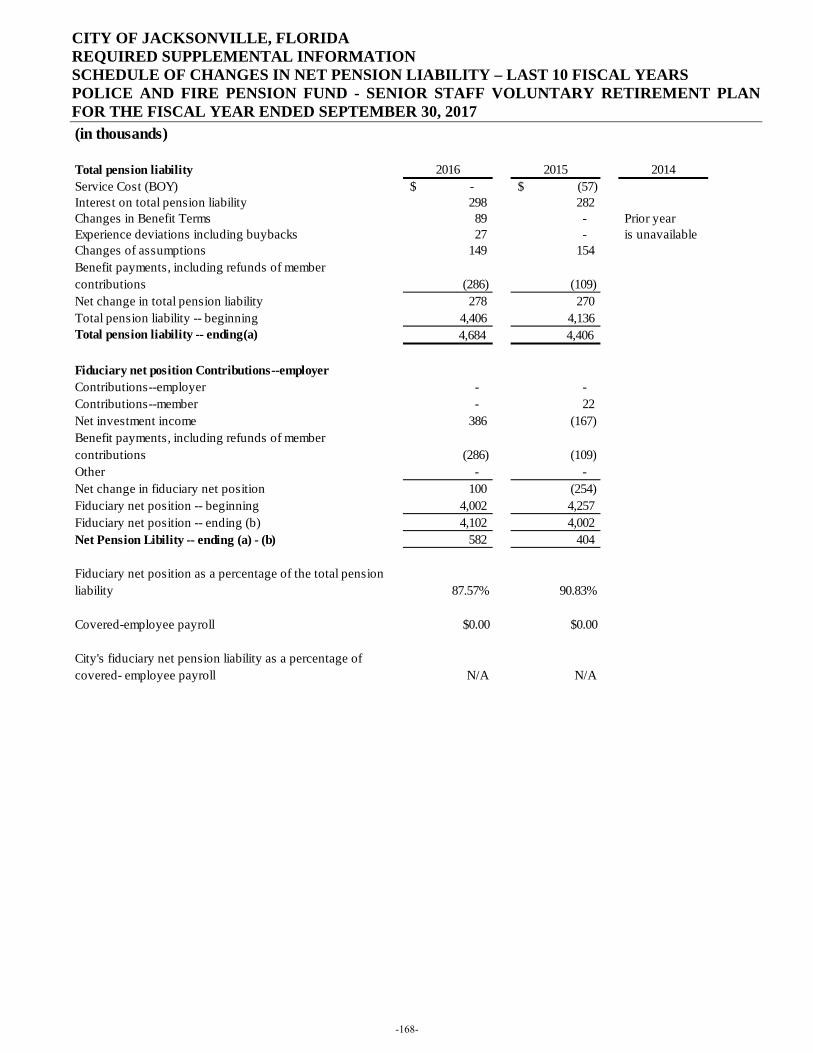
CITY OF JACKSONVILLE, FLORIDA REQUIRED SUPPLEMENTAL INFORMATION SCHEDULE OF CHANGES IN NET PENSION LIABILITY – LAST 10 FISCAL YEARS POLICE AND FIRE PENSION FUND - SENIOR STAFF VOLUNTARY RETIREMENT PLAN FOR THE FISCAL YEAR ENDED SEPTEMBER 30, 2017
(in thousands)
Total pension liability 2016 2015 2014Service Cost (BOY) -$ (57)$ Interest on total pension liability 298 282 Changes in Benefit Terms 89 - Prior year Experience deviations including buybacks 27 - is unavailable Changes of assumptions 149 154 Benefit payments, including refunds of member contributions (286) (109)Net change in total pension liability 278 270 Total pension liability -- beginning 4,406 4,136 Total pension liability -- ending(a) 4,684 4,406
Fiduciary net position Contributions--employerContributions--employer - - Contributions--member - 22 Net investment income 386 (167)Benefit payments, including refunds of member contributions (286) (109)Other - - Net change in fiduciary net position 100 (254)Fiduciary net position -- beginning 4,002 4,257 Fiduciary net position -- ending (b) 4,102 4,002 Net Pension Libility -- ending (a) - (b) 582 404
Fiduciary net position as a percentage of the total pension liability 87.57% 90.83%
Covered-employee payroll $0.00 $0.00
City's fiduciary net pension liability as a percentage of covered- employee payroll N/A N/A
-168-
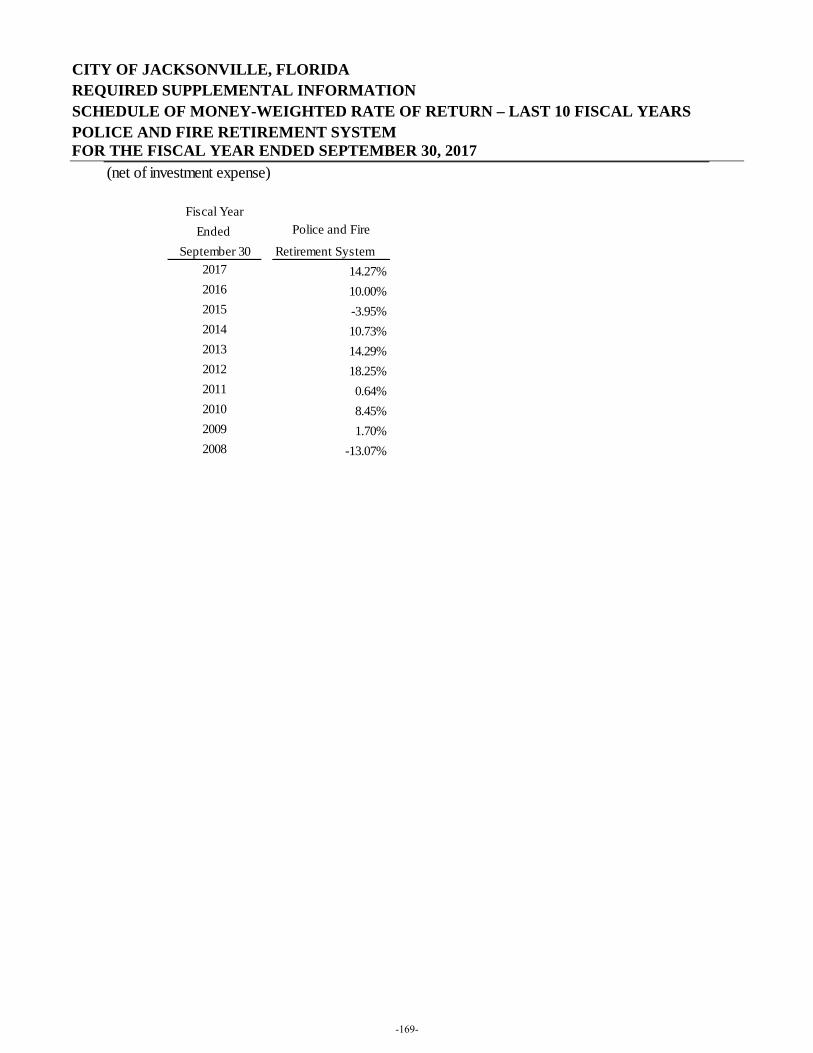
CITY OF JACKSONVILLE, FLORIDA REQUIRED SUPPLEMENTAL INFORMATION SCHEDULE OF MONEY-WEIGHTED RATE OF RETURN – LAST 10 FISCAL YEARS POLICE AND FIRE RETIREMENT SYSTEM FOR THE FISCAL YEAR ENDED SEPTEMBER 30, 2017
(net of investment expense)
Fiscal YearEnded Police and Fire
September 30 Retirement System2017 14.27%2016 10.00%2015 -3.95%2014 10.73%2013 14.29%2012 18.25%2011 0.64%2010 8.45%2009 1.70%2008 -13.07%
-169-
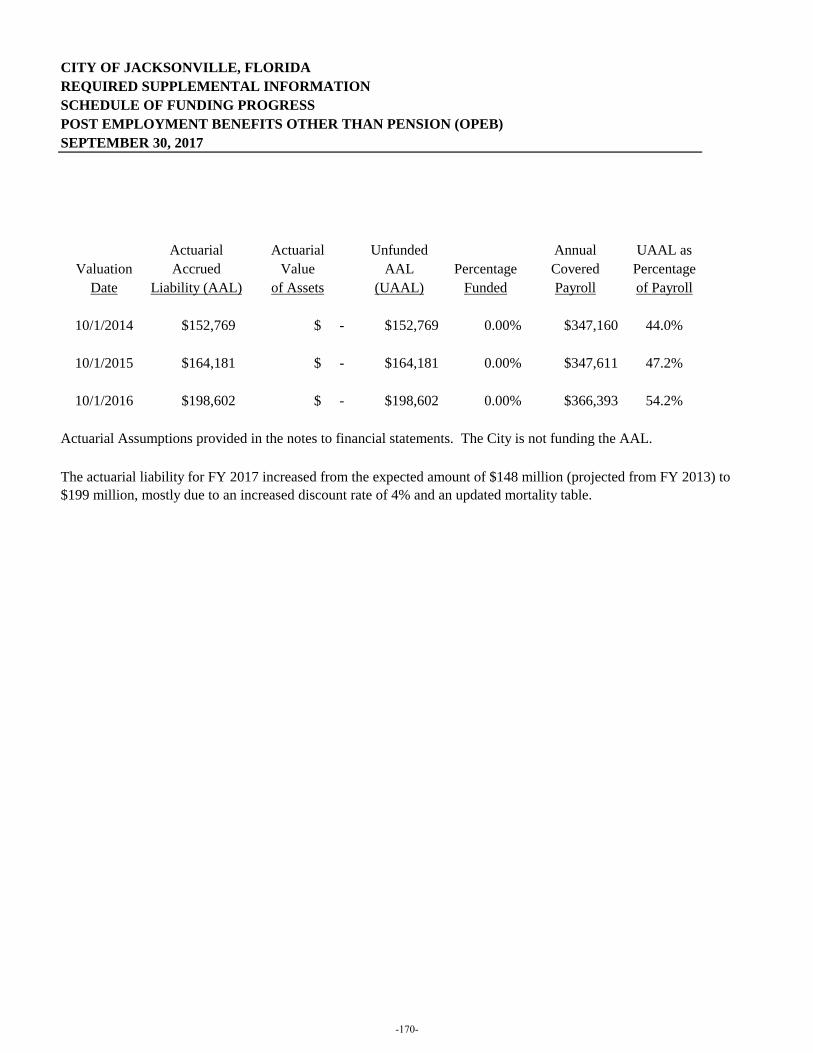
CITY OF JACKSONVILLE, FLORIDA
REQUIRED SUPPLEMENTAL INFORMATION
SCHEDULE OF FUNDING PROGRESS
POST EMPLOYMENT BENEFITS OTHER THAN PENSION (OPEB)
SEPTEMBER 30, 2017
Actuarial Actuarial Unfunded Annual UAAL as
Valuation Accrued Value AAL Percentage Covered Percentage
Date Liability (AAL) of Assets (UAAL) Funded Payroll of Payroll
10/1/2014 $152,769 $ - $152,769 0.00% $347,160 44.0%
10/1/2015 $164,181 $ - $164,181 0.00% $347,611 47.2%
10/1/2016 $198,602 $ - $198,602 0.00% $366,393 54.2%
Actuarial Assumptions provided in the notes to financial statements. The City is not funding the AAL.
The actuarial liability for FY 2017 increased from the expected amount of $148 million (projected from FY 2013) to
$199 million, mostly due to an increased discount rate of 4% and an updated mortality table.
-170-
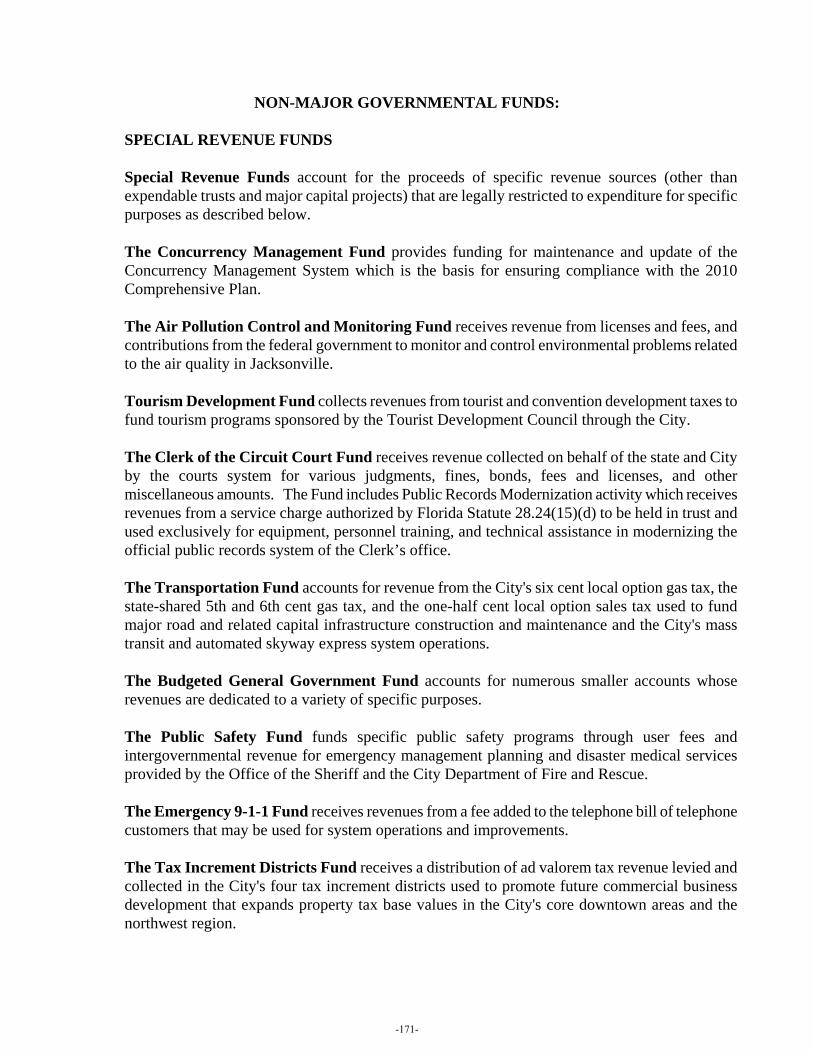
NON-MAJOR GOVERNMENTAL FUNDS: SPECIAL REVENUE FUNDS
Special Revenue Funds account for the proceeds of specific revenue sources (other than expendable trusts and major capital projects) that are legally restricted to expenditure for specific purposes as described below. The Concurrency Management Fund provides funding for maintenance and update of the Concurrency Management System which is the basis for ensuring compliance with the 2010 Comprehensive Plan. The Air Pollution Control and Monitoring Fund receives revenue from licenses and fees, and contributions from the federal government to monitor and control environmental problems related to the air quality in Jacksonville.
Tourism Development Fund collects revenues from tourist and convention development taxes to fund tourism programs sponsored by the Tourist Development Council through the City.
The Clerk of the Circuit Court Fund receives revenue collected on behalf of the state and City by the courts system for various judgments, fines, bonds, fees and licenses, and other miscellaneous amounts. The Fund includes Public Records Modernization activity which receives revenues from a service charge authorized by Florida Statute 28.24(15)(d) to be held in trust and used exclusively for equipment, personnel training, and technical assistance in modernizing the official public records system of the Clerk’s office. The Transportation Fund accounts for revenue from the City's six cent local option gas tax, the state-shared 5th and 6th cent gas tax, and the one-half cent local option sales tax used to fund major road and related capital infrastructure construction and maintenance and the City's mass transit and automated skyway express system operations.
The Budgeted General Government Fund accounts for numerous smaller accounts whose revenues are dedicated to a variety of specific purposes.
The Public Safety Fund funds specific public safety programs through user fees and intergovernmental revenue for emergency management planning and disaster medical services provided by the Office of the Sheriff and the City Department of Fire and Rescue.
The Emergency 9-1-1 Fund receives revenues from a fee added to the telephone bill of telephone customers that may be used for system operations and improvements.
The Tax Increment Districts Fund receives a distribution of ad valorem tax revenue levied and collected in the City's four tax increment districts used to promote future commercial business development that expands property tax base values in the City's core downtown areas and the northwest region.
-171-

The Jacksonville Children's Commission Fund receives City funds, and various grants, to serve as the community coalition for children. The autonomous board has the ongoing responsibility of improving the lives of Jacksonville's children by serving as the central focus for the evaluation, planning and distribution of funds for children's services that are consistent with City programs and goals.
The Community Development Block Grant Fund receives monies from the federal government in the form of community development block grants made available to specific targeted areas of Jacksonville to assist in rehabilitation and revitalization in support of the area's future economic growth and stability.
The Job Training Partnership Act Grant Fund accounts for direct federal assistance to the Private Industry Council of Jacksonville in providing employment and training services to the economically disadvantaged and displaced citizens of Jacksonville through cooperative efforts with local private sector businesses.
The Maintenance, Parks and Recreation Fund receives revenues from user fees and charges from parks and recreation facilities that are dedicated to parks maintenance and improvements, and acquisition of new recreational facilities.
The Other Federal, State and Local Grants Fund records all other miscellaneous grants administered by the City from federal, state and local sources not specifically accounted for by other funds covering diverse programs such as: day care, adult homemaker, beach erosion, base conversion and redevelopment, economic capital development, aids treatment care, senior services and nutrition, crime prevention and drug abuse, teenage pregnancy and childhood development, foster grandparents, and waste tire disposal.
The Better Jacksonville Plan Trust Fund receives revenue from the half-cent infrastructure sales tax. All monies placed into this trust are appropriated for Debt Service requirements and contributions to the Better Jacksonville Capital Projects Fund. Housing and Neighborhoods was designated as the housing agency for Affordable Housing, State Housing Initiative Partnership funds, and all other matters related to housing, with the exception of those matters which fall within the responsibility of the Jacksonville Housing Authority.
-172-
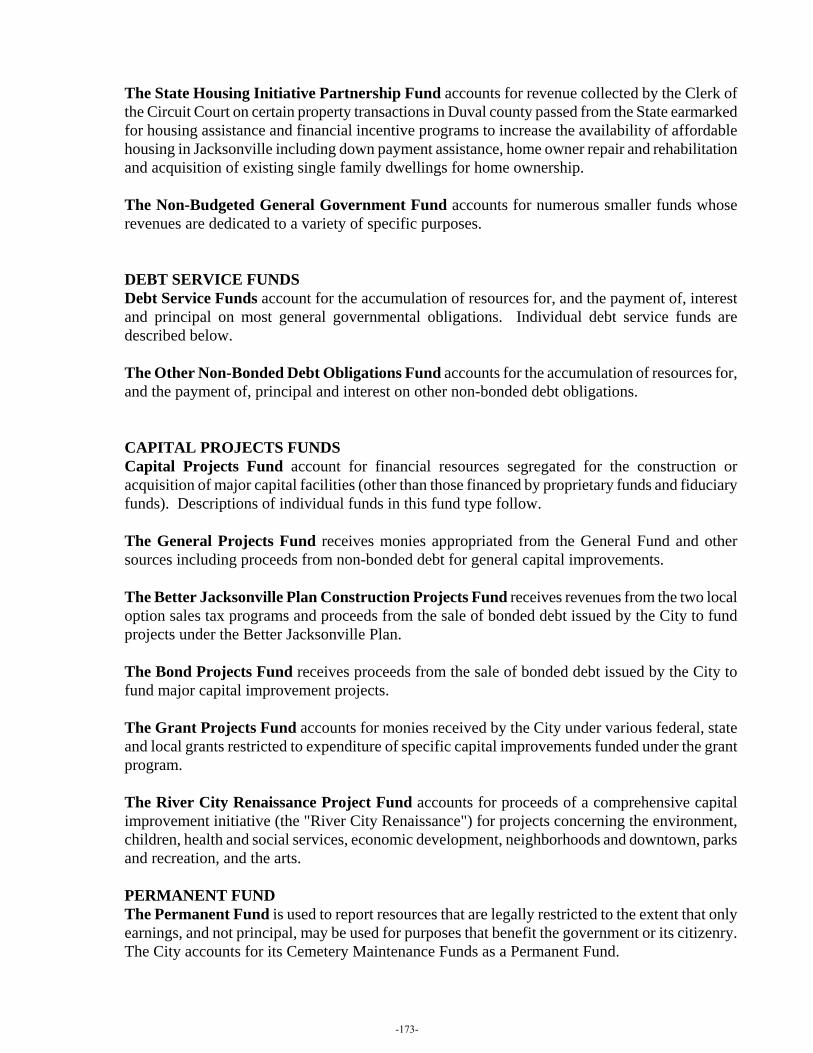
The State Housing Initiative Partnership Fund accounts for revenue collected by the Clerk of the Circuit Court on certain property transactions in Duval county passed from the State earmarked for housing assistance and financial incentive programs to increase the availability of affordable housing in Jacksonville including down payment assistance, home owner repair and rehabilitation and acquisition of existing single family dwellings for home ownership. The Non-Budgeted General Government Fund accounts for numerous smaller funds whose revenues are dedicated to a variety of specific purposes. DEBT SERVICE FUNDS Debt Service Funds account for the accumulation of resources for, and the payment of, interest and principal on most general governmental obligations. Individual debt service funds are described below.
The Other Non-Bonded Debt Obligations Fund accounts for the accumulation of resources for, and the payment of, principal and interest on other non-bonded debt obligations.
CAPITAL PROJECTS FUNDS Capital Projects Fund account for financial resources segregated for the construction or acquisition of major capital facilities (other than those financed by proprietary funds and fiduciary funds). Descriptions of individual funds in this fund type follow. The General Projects Fund receives monies appropriated from the General Fund and other sources including proceeds from non-bonded debt for general capital improvements. The Better Jacksonville Plan Construction Projects Fund receives revenues from the two local option sales tax programs and proceeds from the sale of bonded debt issued by the City to fund projects under the Better Jacksonville Plan.
The Bond Projects Fund receives proceeds from the sale of bonded debt issued by the City to fund major capital improvement projects.
The Grant Projects Fund accounts for monies received by the City under various federal, state and local grants restricted to expenditure of specific capital improvements funded under the grant program.
The River City Renaissance Project Fund accounts for proceeds of a comprehensive capital improvement initiative (the "River City Renaissance") for projects concerning the environment, children, health and social services, economic development, neighborhoods and downtown, parks and recreation, and the arts. PERMANENT FUND The Permanent Fund is used to report resources that are legally restricted to the extent that only earnings, and not principal, may be used for purposes that benefit the government or its citizenry. The City accounts for its Cemetery Maintenance Funds as a Permanent Fund.
-173-
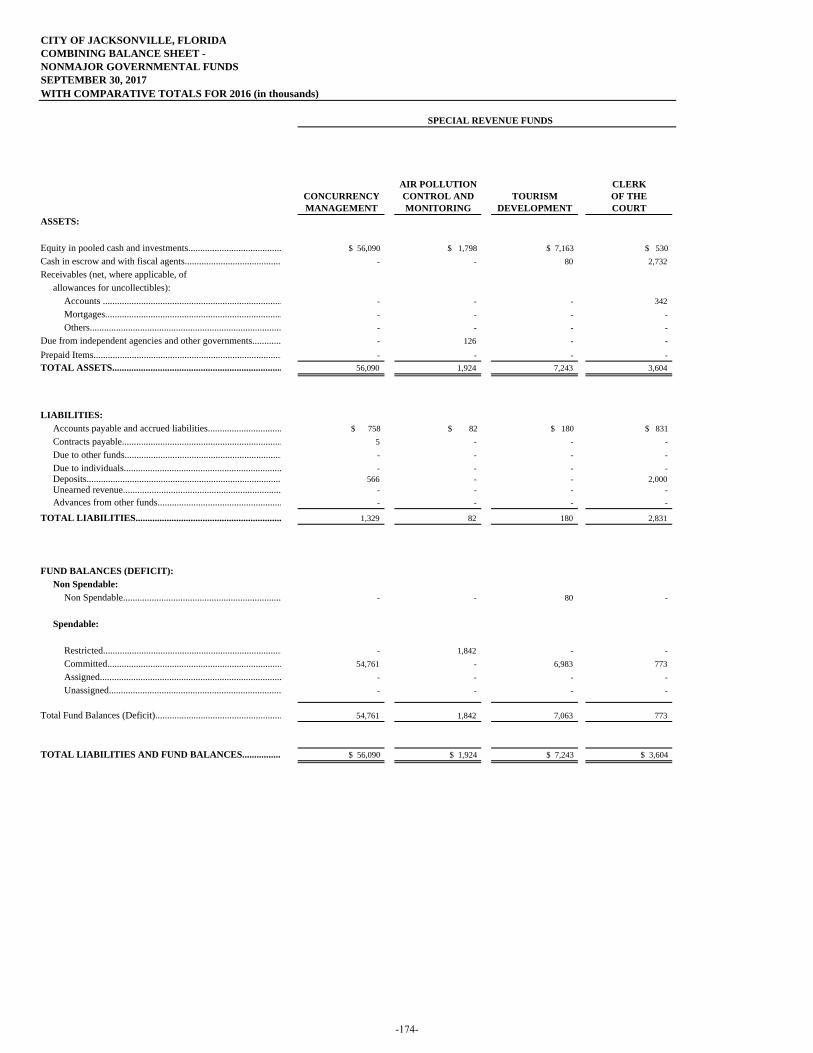
CITY OF JACKSONVILLE, FLORIDACOMBINING BALANCE SHEET - NONMAJOR GOVERNMENTAL FUNDSSEPTEMBER 30, 2017WITH COMPARATIVE TOTALS FOR 2016 (in thousands)
SPECIAL REVENUE FUNDS
AIR POLLUTION CLERKCONCURRENCY CONTROL AND TOURISM OF THEMANAGEMENT MONITORING DEVELOPMENT COURT
ASSETS:
Equity in pooled cash and investments....................................... $ 56,090 $ 1,798 $ 7,163 $ 530 Cash in escrow and with fiscal agents......................................... - - 80 2,732 Receivables (net, where applicable, of
allowances for uncollectibles):Accounts ........................................................................... - - - 342 Mortgages.......................................................................... - - - - Others................................................................................ - - - -
Due from independent agencies and other governments............ - 126 - -
Prepaid Items............................................................................... - - - - TOTAL ASSETS....................................................................... 56,090 1,924 7,243 3,604
LIABILITIES:Accounts payable and accrued liabilities............................... $ 758 $ 82 $ 180 $ 831 Contracts payable................................................................... 5 - - - Due to other funds.................................................................. - - - - Due to individuals.................................................................. - - - - Deposits.................................................................................. 566 - - 2,000 Unearned revenue.................................................................. - - - - Advances from other funds.................................................... - - - -
TOTAL LIABILITIES............................................................. 1,329 82 180 2,831
FUND BALANCES (DEFICIT):Non Spendable:
Non Spendable.................................................................. - - 80 -
Spendable:
Restricted........................................................................... - 1,842 - - Committed......................................................................... 54,761 - 6,983 773 Assigned............................................................................ - - - - Unassigned........................................................................ - - - -
Total Fund Balances (Deficit)..................................................... 54,761 1,842 7,063 773
TOTAL LIABILITIES AND FUND BALANCES................. $ 56,090 $ 1,924 $ 7,243 $ 3,604
$ 0 $ 0 $ 0 $ 0
-174-
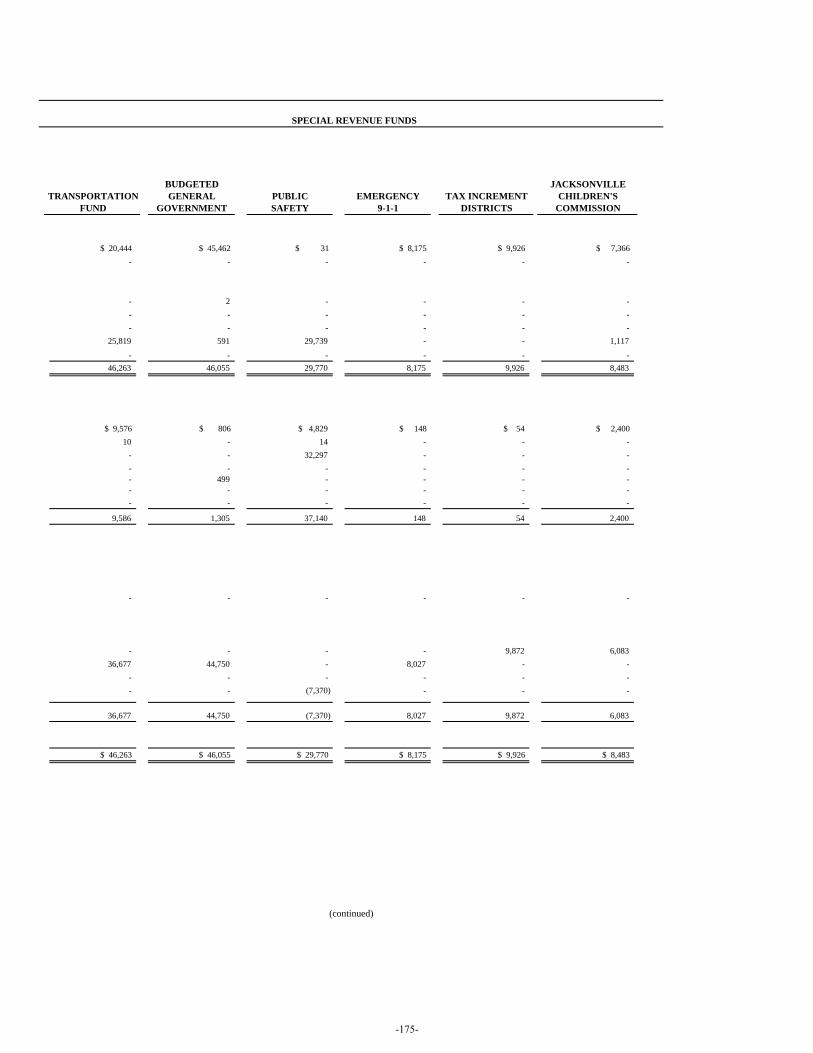
mayes
SPECIAL REVENUE FUNDS
BUDGETED JACKSONVILLETRANSPORTATION GENERAL PUBLIC EMERGENCY TAX INCREMENT CHILDREN'S
FUND GOVERNMENT SAFETY 9-1-1 DISTRICTS COMMISSION
$ 20,444 $ 45,462 $ 31 $ 8,175 $ 9,926 $ 7,366
- - - - - -
- 2 - - - - - - - - - - - - - - - -
25,819 591 29,739 - - 1,117
- - - - - - 46,263 46,055 29,770 8,175 9,926 8,483
$ 9,576 $ 806 $ 4,829 $ 148 $ 54 $ 2,400 10 - 14 - - -
- - 32,297 - - - - - - - - - - 499 - - - - - - - - - - - - - - - -
9,586 1,305 37,140 148 54 2,400
- - - - - -
- - - - 9,872 6,083 36,677 44,750 - 8,027 - -
- - - - - - - - (7,370) - - -
36,677 44,750 (7,370) 8,027 9,872 6,083
$ 46,263 $ 46,055 $ 29,770 $ 8,175 $ 9,926 $ 8,483
$ 0 $ 0 $ 0 $ 0
(continued)
-175-
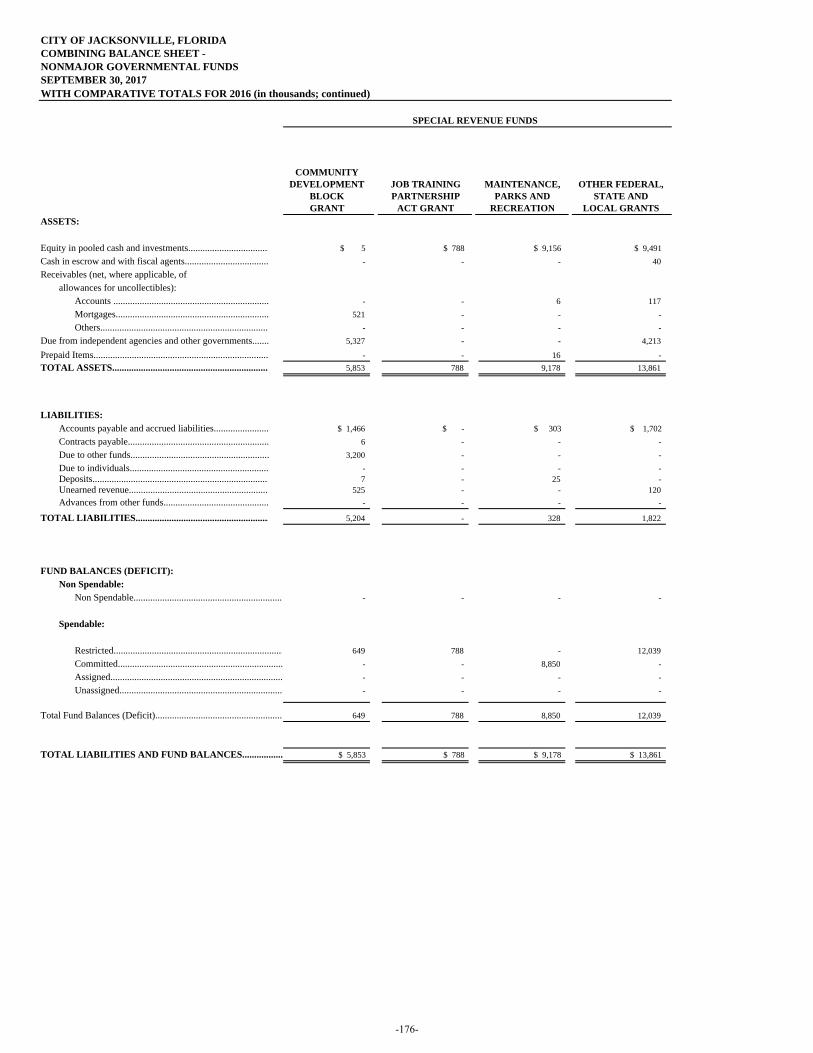
CITY OF JACKSONVILLE, FLORIDACOMBINING BALANCE SHEET - NONMAJOR GOVERNMENTAL FUNDSSEPTEMBER 30, 2017WITH COMPARATIVE TOTALS FOR 2016 (in thousands; continued)
COMMUNITYDEVELOPMENT JOB TRAINING MAINTENANCE, OTHER FEDERAL,
BLOCK PARTNERSHIP PARKS AND STATE ANDGRANT ACT GRANT RECREATION LOCAL GRANTS
ASSETS:
Equity in pooled cash and investments.................................. $ 5 $ 788 $ 9,156 $ 9,491 Cash in escrow and with fiscal agents................................... - - - 40 Receivables (net, where applicable, of
allowances for uncollectibles):Accounts ................................................................. - - 6 117 Mortgages................................................................ 521 - - - Others....................................................................... - - - -
Due from independent agencies and other governments....... 5,327 - - 4,213
Prepaid Items......................................................................... - - 16 - TOTAL ASSETS.................................................................. 5,853 788 9,178 13,861
LIABILITIES:Accounts payable and accrued liabilities....................... $ 1,466 $ - $ 303 $ 1,702 Contracts payable........................................................... 6 - - - Due to other funds.......................................................... 3,200 - - - Due to individuals.......................................................... - - - - Deposits.......................................................................... 7 - 25 - Unearned revenue........................................................... 525 - - 120 Advances from other funds............................................ - - - -
TOTAL LIABILITIES........................................................ 5,204 - 328 1,822
FUND BALANCES (DEFICIT):Non Spendable:
Non Spendable............................................................... - - - -
Spendable:
Restricted....................................................................... 649 788 - 12,039 Committed..................................................................... - - 8,850 - Assigned........................................................................ - - - - Unassigned.................................................................... - - - -
Total Fund Balances (Deficit)..................................................... 649 788 8,850 12,039
TOTAL LIABILITIES AND FUND BALANCES................. $ 5,853 $ 788 $ 9,178 $ 13,861
$ 0 $ 0 $ 0 $ 0
SPECIAL REVENUE FUNDS
-176-
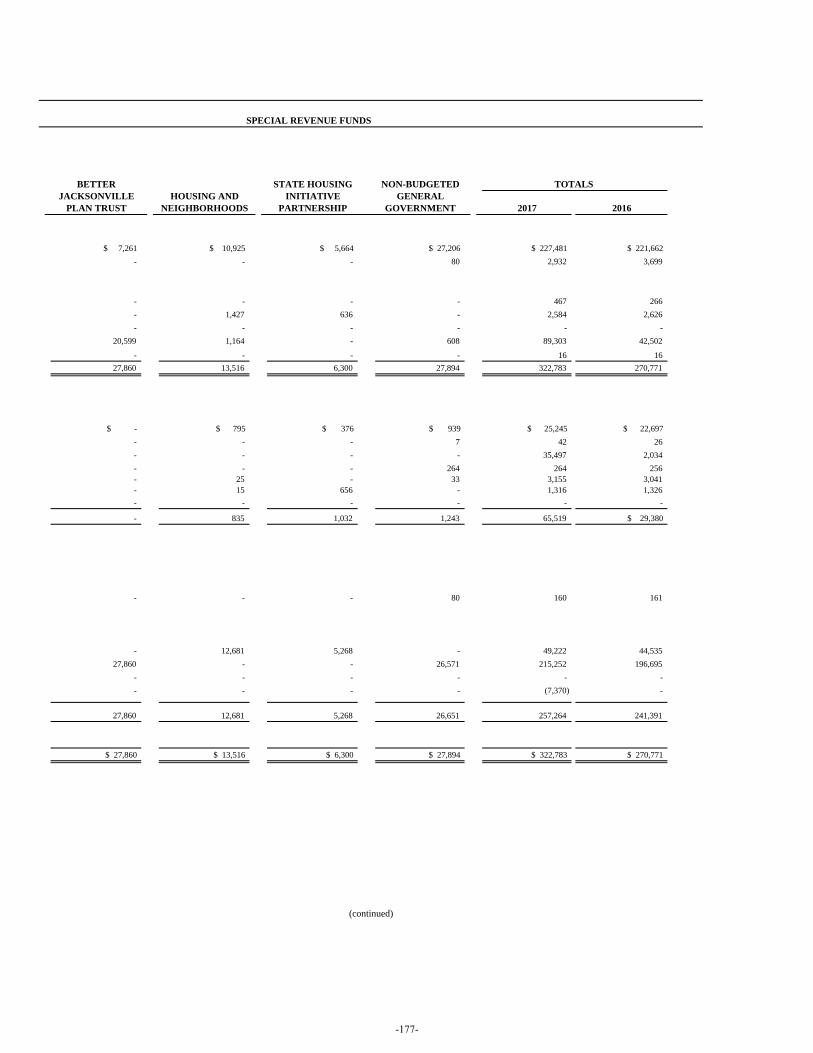
BETTER STATE HOUSING NON-BUDGETED TOTALSJACKSONVILLE HOUSING AND INITIATIVE GENERAL
PLAN TRUST NEIGHBORHOODS PARTNERSHIP GOVERNMENT 2017 2016
$ 7,261 $ 10,925 $ 5,664 $ 27,206 $ 227,481 $ 221,662 - - - 80 2,932 3,699
- - - - 467 266 - 1,427 636 - 2,584 2,626 - - - - - -
20,599 1,164 - 608 89,303 42,502
- - - - 16 16 27,860 13,516 6,300 27,894 322,783 270,771
$ - $ 795 $ 376 $ 939 $ 25,245 $ 22,697 - - - 7 42 26 - - - - 35,497 2,034 - - - 264 264 256 - 25 - 33 3,155 3,041 - 15 656 - 1,316 1,326 - - - - - -
- 835 1,032 1,243 65,519 $ 29,380
- - - 80 160 161
- 12,681 5,268 - 49,222 44,535 27,860 - - 26,571 215,252 196,695
- - - - - - - - - - (7,370) -
27,860 12,681 5,268 26,651 257,264 241,391
$ 27,860 $ 13,516 $ 6,300 $ 27,894 $ 322,783 $ 270,771
$ 0 $ 0 $ 0 $ 0 $ 0 ## #
SPECIAL REVENUE FUNDS
(continued)
-177-
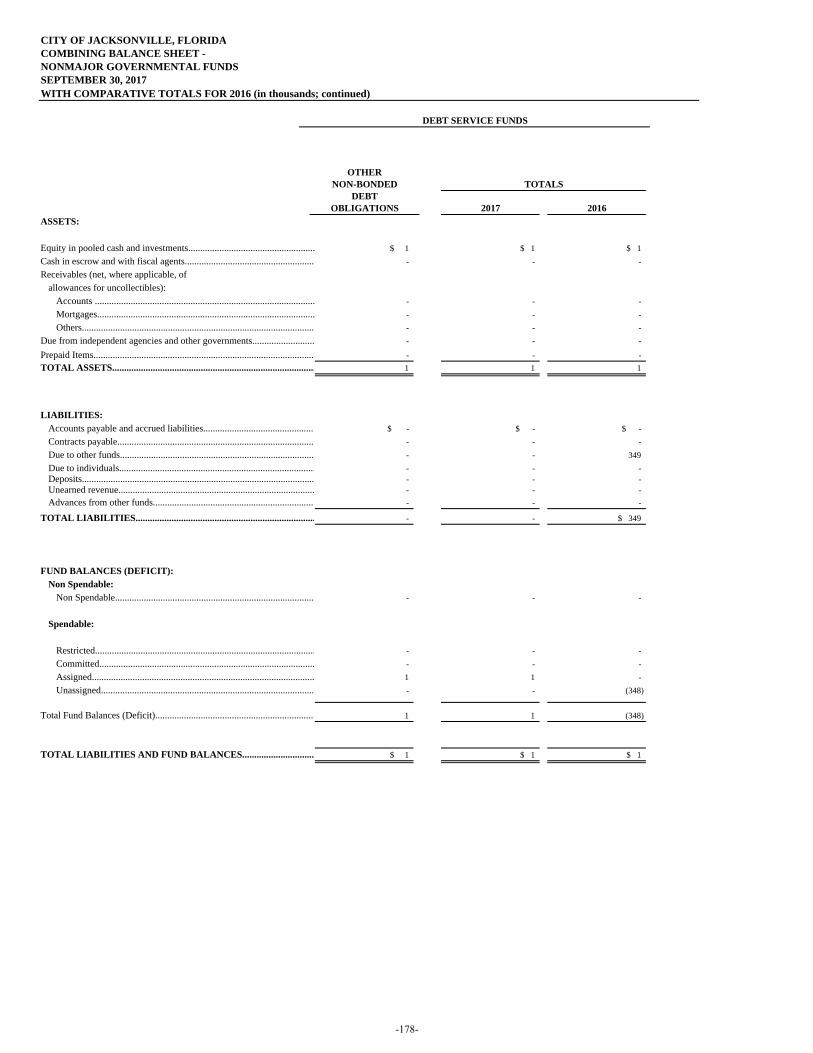
CITY OF JACKSONVILLE, FLORIDACOMBINING BALANCE SHEET - NONMAJOR GOVERNMENTAL FUNDSSEPTEMBER 30, 2017WITH COMPARATIVE TOTALS FOR 2016 (in thousands; continued)
OTHERNON-BONDED
DEBT OBLIGATIONS 2017 2016
ASSETS:
Equity in pooled cash and investments..................................................... $ 1 $ 1 $ 1Cash in escrow and with fiscal agents...................................................... - - - Receivables (net, where applicable, of
allowances for uncollectibles):Accounts ............................................................................................ - - - Mortgages........................................................................................... - - - Others................................................................................................. - - -
Due from independent agencies and other governments.......................... - - -
Prepaid Items............................................................................................. - - - TOTAL ASSETS..................................................................................... 1 1 1
LIABILITIES:Accounts payable and accrued liabilities............................................... $ - $ - $ -Contracts payable................................................................................... - - - Due to other funds................................................................................. - - 349 Due to individuals.................................................................................. - - - Deposits................................................................................................. - - - Unearned revenue.................................................................................. - - - Advances from other funds.................................................................... - - -
TOTAL LIABILITIES........................................................................... - - $ 349
FUND BALANCES (DEFICIT):Non Spendable:
Non Spendable.................................................................................... - - -
Spendable:
Restricted............................................................................................ - - - Committed.......................................................................................... - - - Assigned............................................................................................. 1 1 - Unassigned......................................................................................... - - (348)
Total Fund Balances (Deficit)................................................................... 1 1 (348)
TOTAL LIABILITIES AND FUND BALANCES.............................. $ 1 $ 1 $ 1
# ## $ 0 # $ 0 # $ 0 $ 0 $ 0 $ 0
DEBT SERVICE FUNDS
TOTALS
-178-
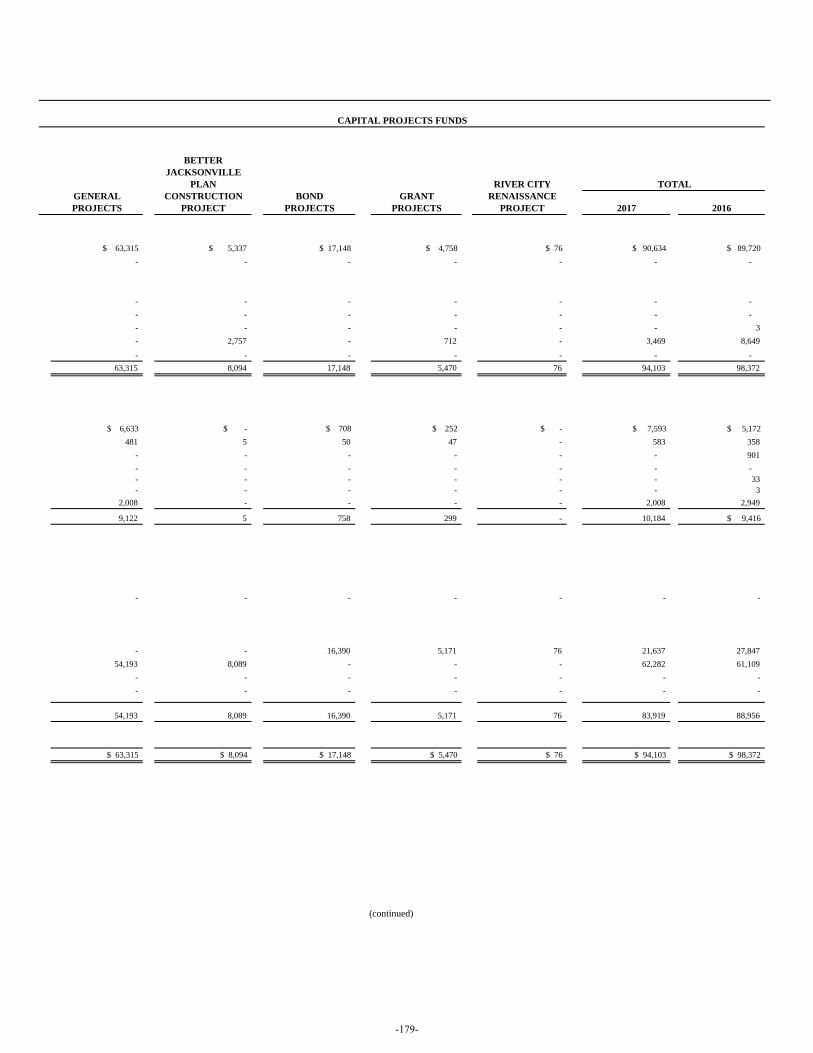
BETTERJACKSONVILLE
PLAN RIVER CITY TOTALGENERAL CONSTRUCTION BOND GRANT RENAISSANCEPROJECTS PROJECT PROJECTS PROJECTS PROJECT 2017 2016
$ 63,315 $ 5,337 $ 17,148 $ 4,758 $ 76 $ 90,634 $ 89,720 - - - - - - -
- - - - - - - - - - - - - - - - - - - - 3 - 2,757 - 712 - 3,469 8,649
- - - - - - - 63,315 8,094 17,148 5,470 76 94,103 98,372
$ 6,633 $ - $ 708 $ 252 $ - $ 7,593 $ 5,172 481 5 50 47 - 583 358
- - - - - - 901 - - - - - - - - - - - - - 33 - - - - - - 3
2,008 - - - - 2,008 2,949
9,122 5 758 299 - 10,184 $ 9,416
- - - - - - -
- - 16,390 5,171 76 21,637 27,847 54,193 8,089 - - - 62,282 61,109
- - - - - - - - - - - - - -
54,193 8,089 16,390 5,171 76 83,919 88,956
$ 63,315 $ 8,094 $ 17,148 $ 5,470 $ 76 $ 94,103 $ 98,372
# $ 0 $ 0 $ 0 $ 0 $ 0 $ 0 $ 0
CAPITAL PROJECTS FUNDS
(continued)
-179-
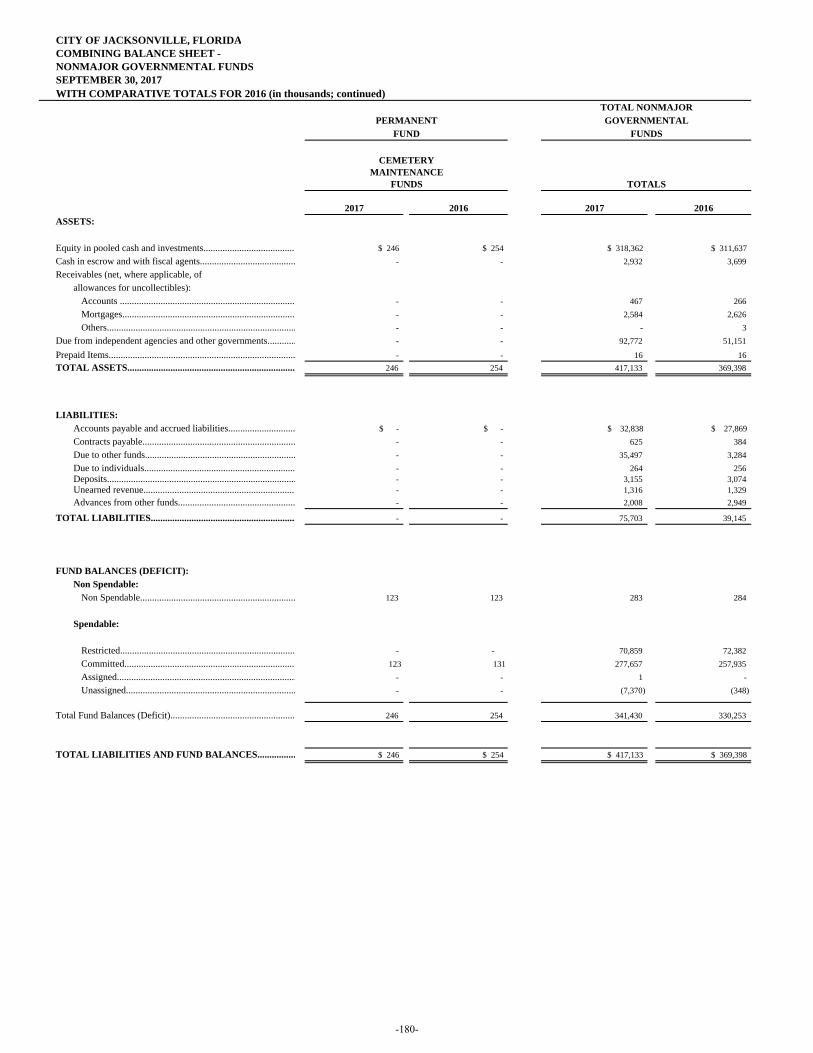
CITY OF JACKSONVILLE, FLORIDACOMBINING BALANCE SHEET - NONMAJOR GOVERNMENTAL FUNDSSEPTEMBER 30, 2017WITH COMPARATIVE TOTALS FOR 2016 (in thousands; continued)
PERMANENTFUND
CEMETERYMAINTENANCE
FUNDS
2017 2016 2017 2016ASSETS:
Equity in pooled cash and investments...................................... $ 246 $ 254 $ 318,362 $ 311,637 Cash in escrow and with fiscal agents........................................ - - 2,932 3,699 Receivables (net, where applicable, of
allowances for uncollectibles): Accounts ......................................................................... - - 467 266 Mortgages........................................................................ - - 2,584 2,626 Others............................................................................... - - - 3
Due from independent agencies and other governments............ - - 92,772 51,151
Prepaid Items.............................................................................. - - 16 16 TOTAL ASSETS...................................................................... 246 254 417,133 369,398
LIABILITIES:Accounts payable and accrued liabilities............................ $ - $ - $ 32,838 $ 27,869 Contracts payable................................................................ - - 625 384 Due to other funds............................................................... - - 35,497 3,284 Due to individuals............................................................... - - 264 256 Deposits............................................................................... - - 3,155 3,074 Unearned revenue................................................................ - - 1,316 1,329 Advances from other funds................................................. - - 2,008 2,949
TOTAL LIABILITIES............................................................. - - 75,703 39,145
FUND BALANCES (DEFICIT):Non Spendable:
Non Spendable................................................................. 123 123 283 284
Spendable:
Restricted......................................................................... - - 70,859 72,382 Committed....................................................................... 123 131 277,657 257,935 Assigned........................................................................... - - 1 - Unassigned....................................................................... - - (7,370) (348)
Total Fund Balances (Deficit).................................................... 246 254 341,430 330,253
TOTAL LIABILITIES AND FUND BALANCES................ $ 246 $ 254 $ 417,133 $ 369,398
$ 0 ## # $ 0 $ 0 $ 0
TOTAL NONMAJORGOVERNMENTAL
FUNDS
TOTALS
-180-

(This page is intentionally left blank.)
-181-
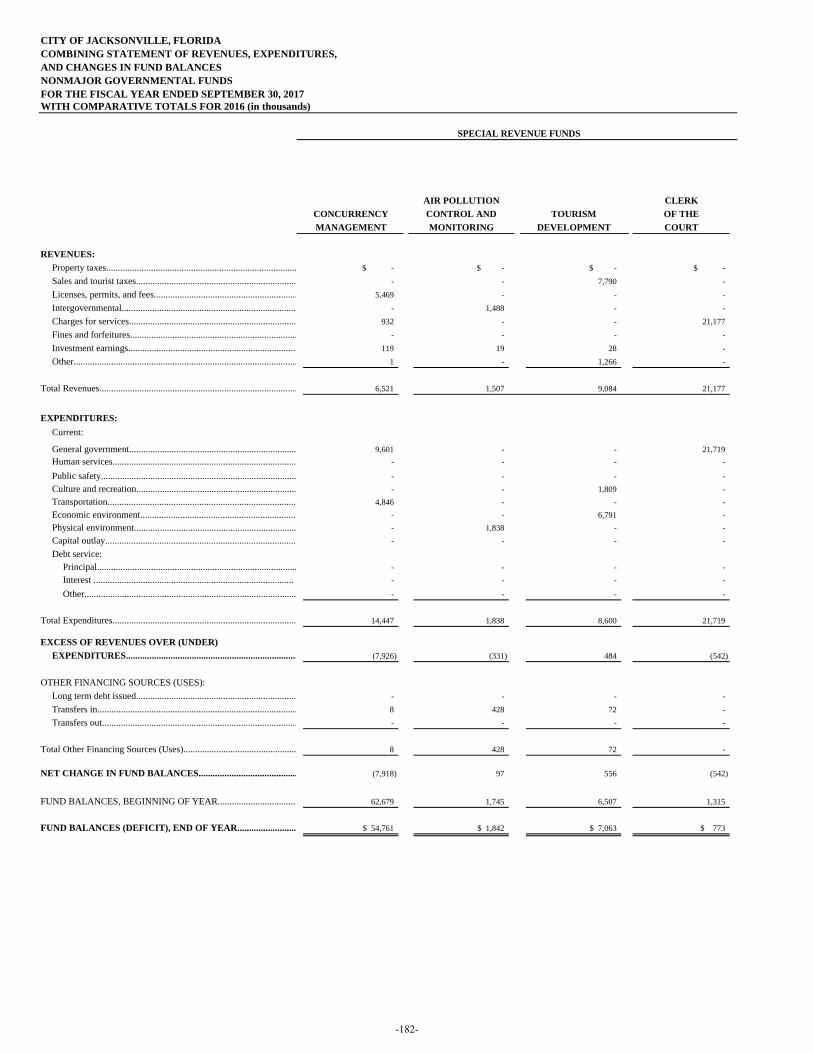
CITY OF JACKSONVILLE, FLORIDACOMBINING STATEMENT OF REVENUES, EXPENDITURES, AND CHANGES IN FUND BALANCESNONMAJOR GOVERNMENTAL FUNDSFOR THE FISCAL YEAR ENDED SEPTEMBER 30, 2017WITH COMPARATIVE TOTALS FOR 2016 (in thousands)
SPECIAL REVENUE FUNDS
AIR POLLUTION CLERKCONCURRENCY CONTROL AND TOURISM OF THEMANAGEMENT MONITORING DEVELOPMENT COURT
REVENUES:Property taxes................................................................................. $ - $ - $ - $ -Sales and tourist taxes.................................................................... - - 7,790 - Licenses, permits, and fees............................................................. 5,469 - - - Intergovernmental.......................................................................... - 1,488 - - Charges for services....................................................................... 932 - - 21,177 Fines and forfeitures....................................................................... - - - - Investment earnings........................................................................ 119 19 28 - Other............................................................................................... 1 - 1,266 -
Total Revenues.................................................................................... 6,521 1,507 9,084 21,177
EXPENDITURES:Current:
General government....................................................................... 9,601 - - 21,719 Human services.............................................................................. - - - -
Public safety................................................................................... - - - - Culture and recreation.................................................................... - - 1,809 - Transportation................................................................................ 4,846 - - - Economic environment................................................................... - - 6,791 - Physical environment..................................................................... - 1,838 - - Capital outlay................................................................................. - - - - Debt service:
Principal..................................................................................... - - - - Interest ..................................................................................... - - - -
Other.......................................................................................... - - - -
Total Expenditures.............................................................................. 14,447 1,838 8,600 21,719
EXCESS OF REVENUES OVER (UNDER)EXPENDITURES......................................................................... (7,926) (331) 484 (542)
OTHER FINANCING SOURCES (USES):Long term debt issued.................................................................... - - - - Transfers in..................................................................................... 8 428 72 - Transfers out................................................................................... - - - -
Total Other Financing Sources (Uses)................................................ 8 428 72 -
NET CHANGE IN FUND BALANCES.......................................... (7,918) 97 556 (542)
FUND BALANCES, BEGINNING OF YEAR.................................. 62,679 1,745 6,507 1,315
FUND BALANCES (DEFICIT), END OF YEAR......................... $ 54,761 $ 1,842 $ 7,063 $ 773
-182-
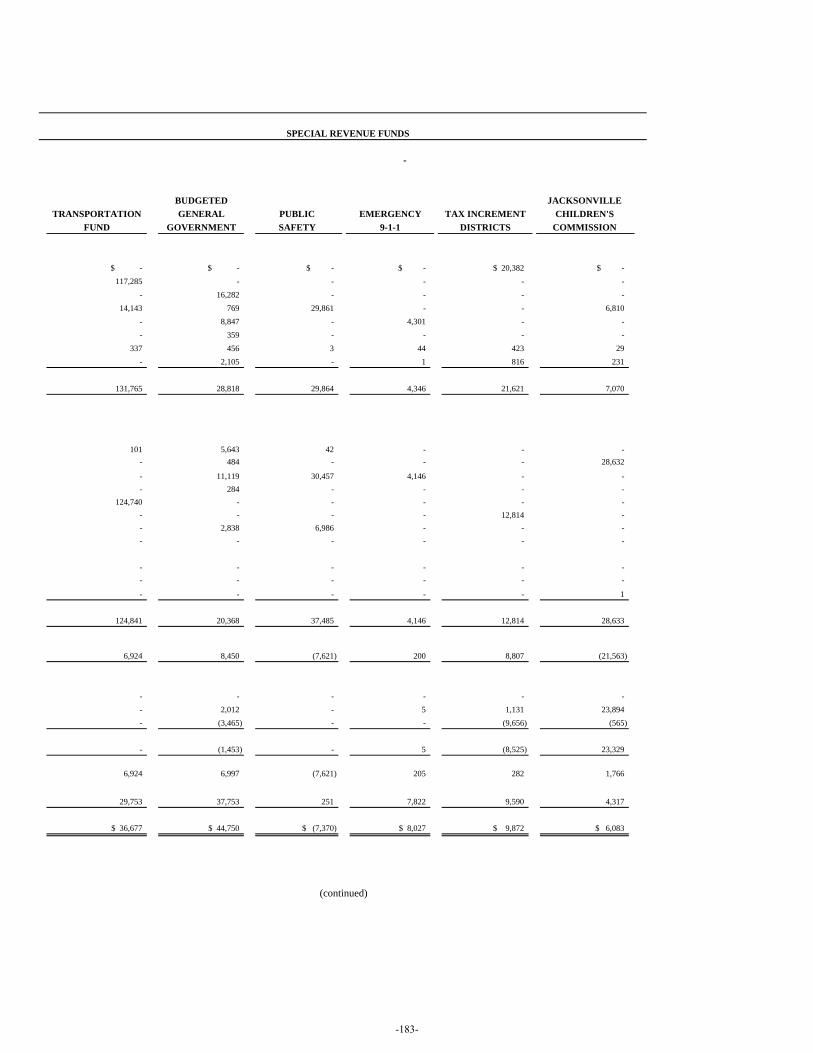
SPECIAL REVENUE FUNDS
-
BUDGETED JACKSONVILLETRANSPORTATION GENERAL PUBLIC EMERGENCY TAX INCREMENT CHILDREN'S
FUND GOVERNMENT SAFETY 9-1-1 DISTRICTS COMMISSION
$ - $ - $ - $ - $ 20,382 $ -
117,285 - - - - - - 16,282 - - - -
14,143 769 29,861 - - 6,810 - 8,847 - 4,301 - - - 359 - - - -
337 456 3 44 423 29 - 2,105 - 1 816 231
131,765 28,818 29,864 4,346 21,621 7,070
101 5,643 42 - - - - 484 - - - 28,632
- 11,119 30,457 4,146 - - - 284 - - - -
124,740 - - - - - - - - - 12,814 - - 2,838 6,986 - - - - - - - - -
- - - - - - - - - - - -
- - - - - 1
124,841 20,368 37,485 4,146 12,814 28,633
6,924 8,450 (7,621) 200 8,807 (21,563)
- - - - - - - 2,012 - 5 1,131 23,894 - (3,465) - - (9,656) (565)
- (1,453) - 5 (8,525) 23,329
6,924 6,997 (7,621) 205 282 1,766
29,753 37,753 251 7,822 9,590 4,317
$ 36,677 $ 44,750 $ (7,370) $ 8,027 $ 9,872 $ 6,083
(continued)
-183-
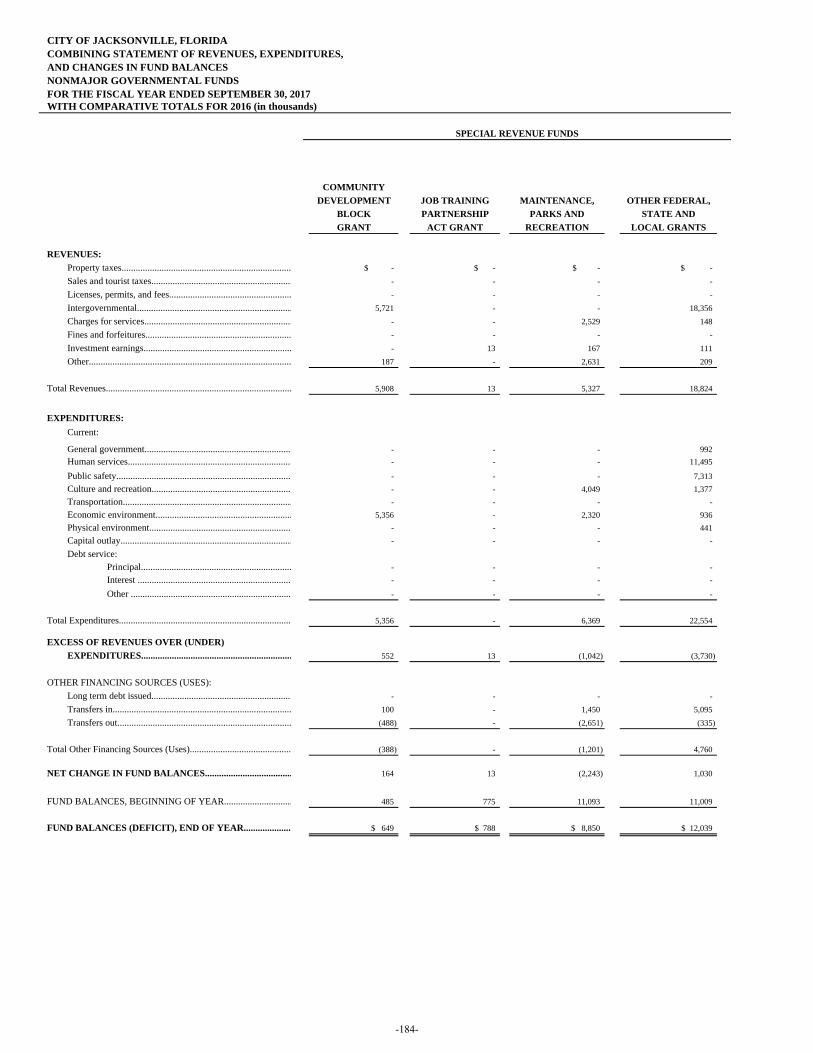
CITY OF JACKSONVILLE, FLORIDACOMBINING STATEMENT OF REVENUES, EXPENDITURES, AND CHANGES IN FUND BALANCESNONMAJOR GOVERNMENTAL FUNDSFOR THE FISCAL YEAR ENDED SEPTEMBER 30, 2017WITH COMPARATIVE TOTALS FOR 2016 (in thousands)
COMMUNITYDEVELOPMENT JOB TRAINING MAINTENANCE, OTHER FEDERAL,
BLOCK PARTNERSHIP PARKS AND STATE ANDGRANT ACT GRANT RECREATION LOCAL GRANTS
REVENUES:Property taxes........................................................................ $ - $ - $ - $ -Sales and tourist taxes............................................................ - - - - Licenses, permits, and fees.................................................... - - - - Intergovernmental.................................................................. 5,721 - - 18,356 Charges for services............................................................... - - 2,529 148 Fines and forfeitures.............................................................. - - - - Investment earnings............................................................... - 13 167 111 Other...................................................................................... 187 - 2,631 209
Total Revenues............................................................................... 5,908 13 5,327 18,824
EXPENDITURES:
Current:
General government............................................................... - - - 992 Human services...................................................................... - - - 11,495
Public safety.......................................................................... - - - 7,313 Culture and recreation............................................................ - - 4,049 1,377 Transportation........................................................................ - - - - Economic environment.......................................................... 5,356 - 2,320 936 Physical environment............................................................ - - - 441 Capital outlay......................................................................... - - - - Debt service:
Principal................................................................ - - - - Interest ................................................................. - - - -
Other .................................................................... - - - -
Total Expenditures......................................................................... 5,356 - 6,369 22,554
EXCESS OF REVENUES OVER (UNDER) EXPENDITURES................................................................ 552 13 (1,042) (3,730)
OTHER FINANCING SOURCES (USES):
Long term debt issued............................................................ - - - - Transfers in............................................................................ 100 - 1,450 5,095 Transfers out.......................................................................... (488) - (2,651) (335)
Total Other Financing Sources (Uses)........................................... (388) - (1,201) 4,760
NET CHANGE IN FUND BALANCES..................................... 164 13 (2,243) 1,030
FUND BALANCES, BEGINNING OF YEAR............................. 485 775 11,093 11,009
FUND BALANCES (DEFICIT), END OF YEAR.................... $ 649 $ 788 $ 8,850 $ 12,039
SPECIAL REVENUE FUNDS
-184-
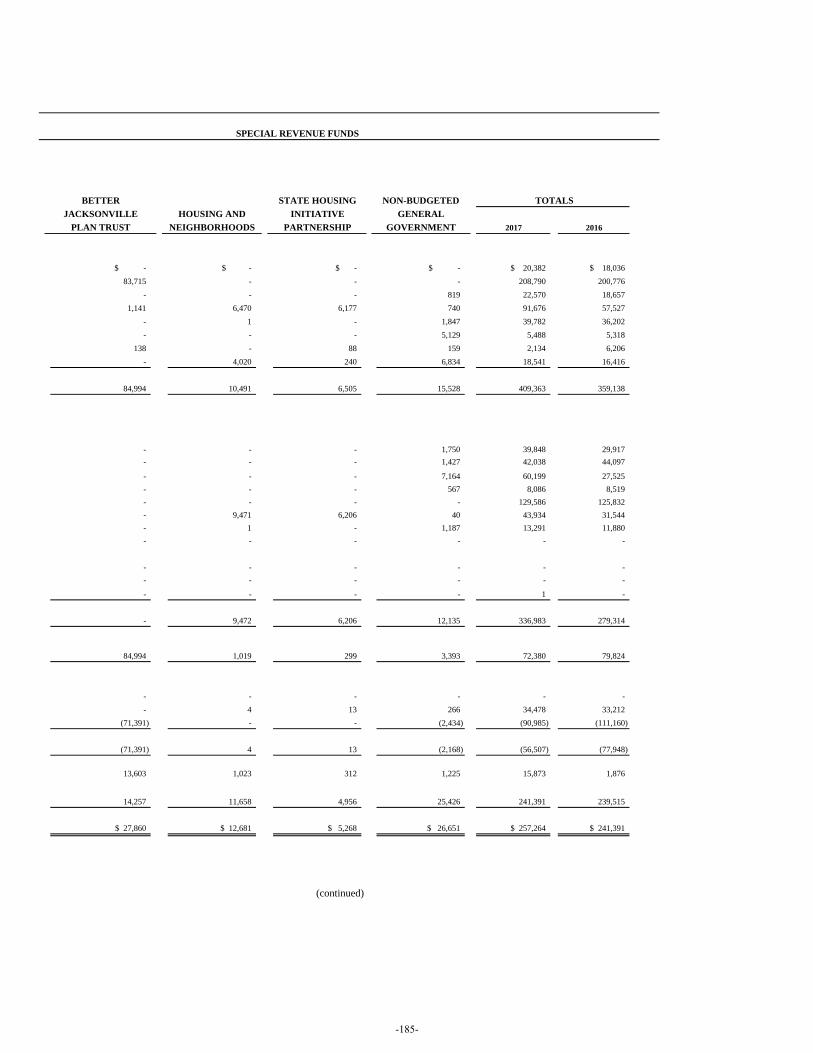
BETTER STATE HOUSING NON-BUDGETED TOTALSJACKSONVILLE HOUSING AND INITIATIVE GENERAL
PLAN TRUST NEIGHBORHOODS PARTNERSHIP GOVERNMENT 2017 2016
$ - $ - $ - $ - $ 20,382 $ 18,03683,715 - - - 208,790 200,776
- - - 819 22,570 18,657 1,141 6,470 6,177 740 91,676 57,527
- 1 - 1,847 39,782 36,202 - - - 5,129 5,488 5,318
138 - 88 159 2,134 6,206 - 4,020 240 6,834 18,541 16,416
84,994 10,491 6,505 15,528 409,363 359,138
- - - 1,750 39,848 29,917 - - - 1,427 42,038 44,097
- - - 7,164 60,199 27,525 - - - 567 8,086 8,519 - - - - 129,586 125,832 - 9,471 6,206 40 43,934 31,544 - 1 - 1,187 13,291 11,880 - - - - - -
- - - - - - - - - - - -
- - - - 1 -
- 9,472 6,206 12,135 336,983 279,314
84,994 1,019 299 3,393 72,380 79,824
- - - - - - - 4 13 266 34,478 33,212
(71,391) - - (2,434) (90,985) (111,160)
(71,391) 4 13 (2,168) (56,507) (77,948)
13,603 1,023 312 1,225 15,873 1,876
14,257 11,658 4,956 25,426 241,391 239,515
$ 27,860 $ 12,681 $ 5,268 $ 26,651 $ 257,264 $ 241,391
SPECIAL REVENUE FUNDS
(continued)
-185-
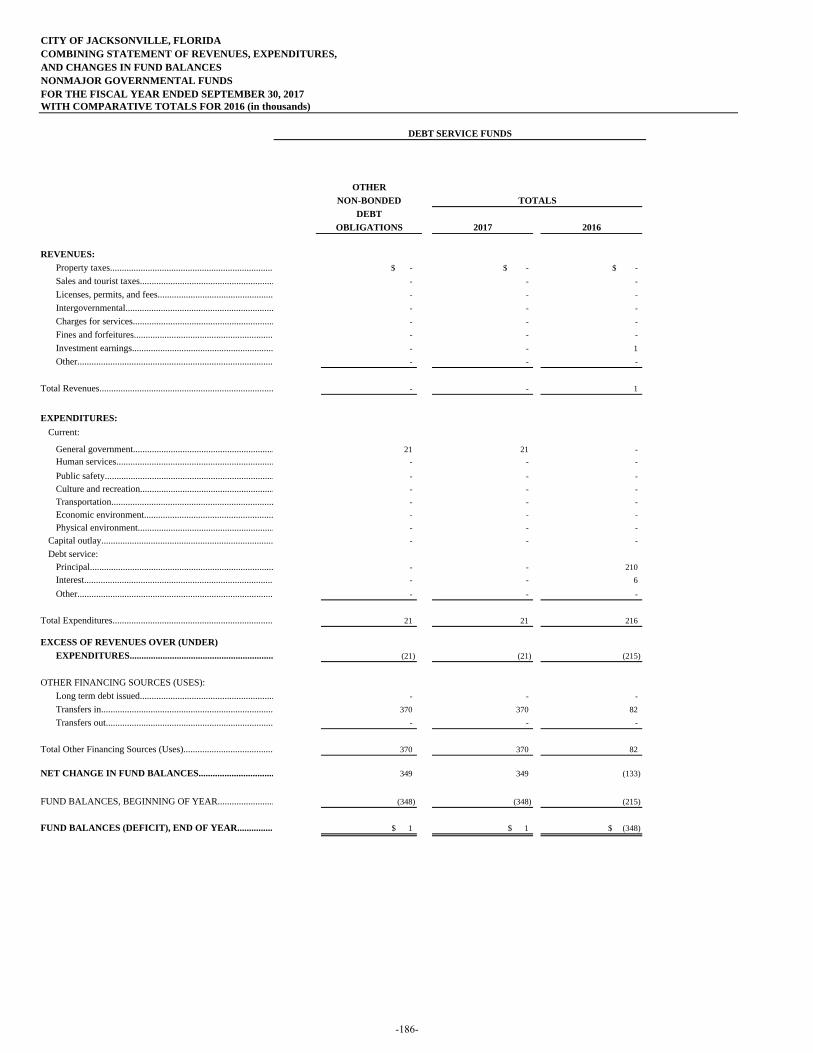
CITY OF JACKSONVILLE, FLORIDACOMBINING STATEMENT OF REVENUES, EXPENDITURES, AND CHANGES IN FUND BALANCESNONMAJOR GOVERNMENTAL FUNDSFOR THE FISCAL YEAR ENDED SEPTEMBER 30, 2017WITH COMPARATIVE TOTALS FOR 2016 (in thousands)
OTHERNON-BONDED
DEBTOBLIGATIONS 2017 2016
REVENUES:Property taxes...................................................................... $ - $ - $ -Sales and tourist taxes......................................................... - - - Licenses, permits, and fees................................................. - - - Intergovernmental............................................................... - - - Charges for services............................................................ - - - Fines and forfeitures........................................................... - - - Investment earnings............................................................ - - 1 Other................................................................................... - - -
Total Revenues.......................................................................... - - 1
EXPENDITURES:Current:
General government............................................................ 21 21 - Human services................................................................... - - -
Public safety........................................................................ - - - Culture and recreation......................................................... - - - Transportation..................................................................... - - - Economic environment....................................................... - - - Physical environment.......................................................... - - -
Capital outlay......................................................................... - - - Debt service:
Principal.............................................................................. - - 210 Interest................................................................................. - - 6
Other................................................................................... - - -
Total Expenditures..................................................................... 21 21 216
EXCESS OF REVENUES OVER (UNDER)EXPENDITURES............................................................. (21) (21) (215)
OTHER FINANCING SOURCES (USES):Long term debt issued......................................................... - - - Transfers in......................................................................... 370 370 82 Transfers out....................................................................... - - -
Total Other Financing Sources (Uses)...................................... 370 370 82
NET CHANGE IN FUND BALANCES................................ 349 349 (133)
FUND BALANCES, BEGINNING OF YEAR........................ (348) (348) (215)
FUND BALANCES (DEFICIT), END OF YEAR................ $ 1 $ 1 $ (348)
DEBT SERVICE FUNDS
TOTALS
-186-
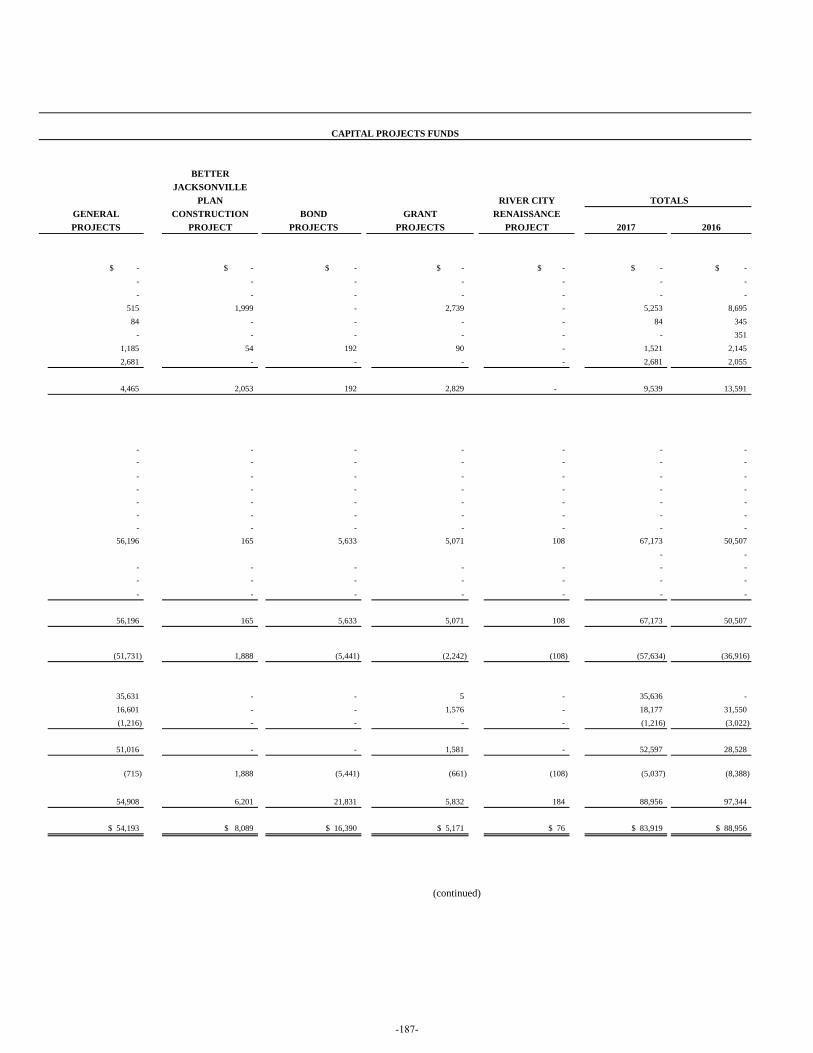
BETTERJACKSONVILLE
PLAN RIVER CITY TOTALSGENERAL CONSTRUCTION BOND GRANT RENAISSANCE PROJECTS PROJECT PROJECTS PROJECTS PROJECT 2017 2016
$ - $ - $ - $ - $ - $ - $ -- - - - - - - - - - - - - -
515 1,999 - 2,739 - 5,253 8,695 84 - - - - 84 345
- - - - - - 351 1,185 54 192 90 - 1,521 2,145 2,681 - - - - 2,681 2,055
4,465 2,053 192 2,829 - 9,539 13,591
- - - - - - - - - - - - - -
- - - - - - - - - - - - - - - - - - - - - - - - - - - - - - - - - - -
56,196 165 5,633 5,071 108 67,173 50,507 - -
- - - - - - - - - - - - - -
- - - - - - -
56,196 165 5,633 5,071 108 67,173 50,507
(51,731) 1,888 (5,441) (2,242) (108) (57,634) (36,916)
35,631 - - 5 - 35,636 - 16,601 - - 1,576 - 18,177 31,550 (1,216) - - - - (1,216) (3,022)
51,016 - - 1,581 - 52,597 28,528
(715) 1,888 (5,441) (661) (108) (5,037) (8,388)
54,908 6,201 21,831 5,832 184 88,956 97,344
$ 54,193 $ 8,089 $ 16,390 $ 5,171 $ 76 $ 83,919 $ 88,956
CAPITAL PROJECTS FUNDS
(continued)
-187-
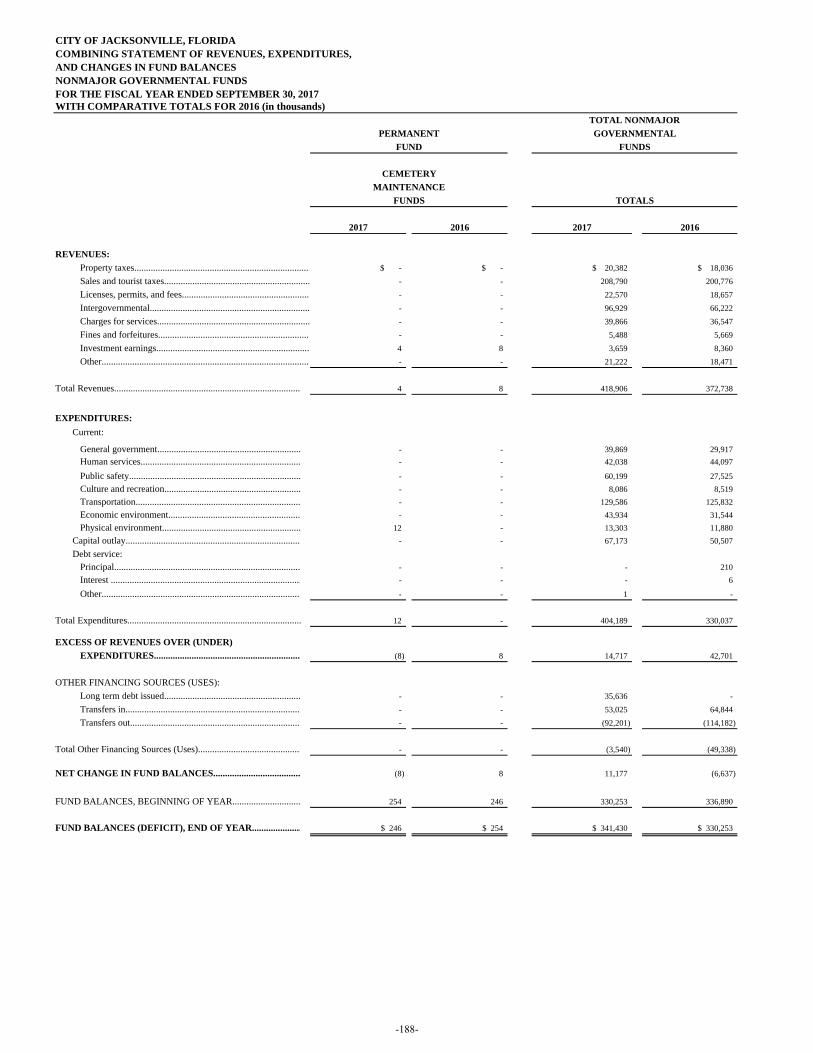
CITY OF JACKSONVILLE, FLORIDACOMBINING STATEMENT OF REVENUES, EXPENDITURES, AND CHANGES IN FUND BALANCESNONMAJOR GOVERNMENTAL FUNDSFOR THE FISCAL YEAR ENDED SEPTEMBER 30, 2017WITH COMPARATIVE TOTALS FOR 2016 (in thousands)
PERMANENTFUND
CEMETERYMAINTENANCE
FUNDS
2017 2016 2017 2016
REVENUES:Property taxes........................................................................... $ - $ - $ 20,382 $ 18,036Sales and tourist taxes.............................................................. - - 208,790 200,776 Licenses, permits, and fees....................................................... - - 22,570 18,657 Intergovernmental.................................................................... - - 96,929 66,222 Charges for services................................................................. - - 39,866 36,547 Fines and forfeitures................................................................. - - 5,488 5,669 Investment earnings................................................................. 4 8 3,659 8,360 Other......................................................................................... - - 21,222 18,471
Total Revenues............................................................................... 4 8 418,906 372,738
EXPENDITURES:Current:
General government............................................................. - - 39,869 29,917 Human services.................................................................... - - 42,038 44,097
Public safety......................................................................... - - 60,199 27,525 Culture and recreation.......................................................... - - 8,086 8,519 Transportation...................................................................... - - 129,586 125,832 Economic environment........................................................ - - 43,934 31,544 Physical environment........................................................... 12 - 13,303 11,880
Capital outlay........................................................................... - - 67,173 50,507 Debt service:
Principal............................................................................... - - - 210 Interest ................................................................................. - - - 6
Other..................................................................................... - - 1 -
Total Expenditures.......................................................................... 12 - 404,189 330,037
EXCESS OF REVENUES OVER (UNDER)EXPENDITURES............................................................... (8) 8 14,717 42,701
OTHER FINANCING SOURCES (USES):Long term debt issued.......................................................... - - 35,636 - Transfers in........................................................................... - - 53,025 64,844 Transfers out......................................................................... - - (92,201) (114,182)
Total Other Financing Sources (Uses)............................................ - - (3,540) (49,338)
NET CHANGE IN FUND BALANCES..................................... (8) 8 11,177 (6,637)
FUND BALANCES, BEGINNING OF YEAR............................. 254 246 330,253 336,890
FUND BALANCES (DEFICIT), END OF YEAR..................... $ 246 $ 254 $ 341,430 $ 330,253
TOTAL NONMAJORGOVERNMENTAL
FUNDS
TOTALS
-188-

(This page is intentionally left blank.)
-189-
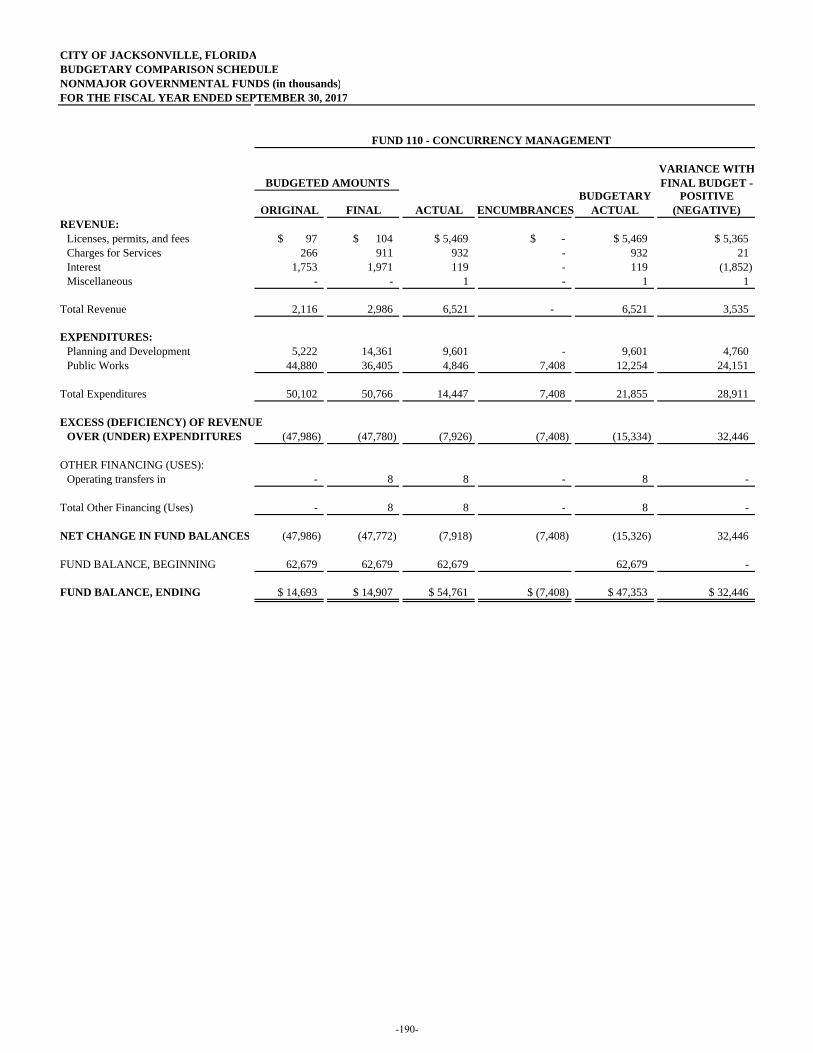
CITY OF JACKSONVILLE, FLORIDABUDGETARY COMPARISON SCHEDULENONMAJOR GOVERNMENTAL FUNDS (in thousands)FOR THE FISCAL YEAR ENDED SEPTEMBER 30, 2017
VARIANCE WITHFINAL BUDGET -
BUDGETARY POSITIVEORIGINAL FINAL ACTUAL ENCUMBRANCES ACTUAL (NEGATIVE)
REVENUE:Licenses, permits, and fees $ 97 $ 104 $ 5,469 $ - $ 5,469 $ 5,365Charges for Services 266 911 932 - 932 21 Interest 1,753 1,971 119 - 119 (1,852) Miscellaneous - - 1 - 1 1
Total Revenue 2,116 2,986 6,521 - 6,521 3,535
EXPENDITURES:Planning and Development 5,222 14,361 9,601 - 9,601 4,760 Public Works 44,880 36,405 4,846 7,408 12,254 24,151
Total Expenditures 50,102 50,766 14,447 7,408 21,855 28,911
EXCESS (DEFICIENCY) OF REVENUEOVER (UNDER) EXPENDITURES (47,986) (47,780) (7,926) (7,408) (15,334) 32,446
OTHER FINANCING (USES):Operating transfers in - 8 8 - 8 -
Total Other Financing (Uses) - 8 8 - 8 -
NET CHANGE IN FUND BALANCES (47,986) (47,772) (7,918) (7,408) (15,326) 32,446
FUND BALANCE, BEGINNING 62,679 62,679 62,679 62,679 -
FUND BALANCE, ENDING $ 14,693 $ 14,907 $ 54,761 $ (7,408) $ 47,353 $ 32,446
BUDGETED AMOUNTS
FUND 110 - CONCURRENCY MANAGEMENT
-190-
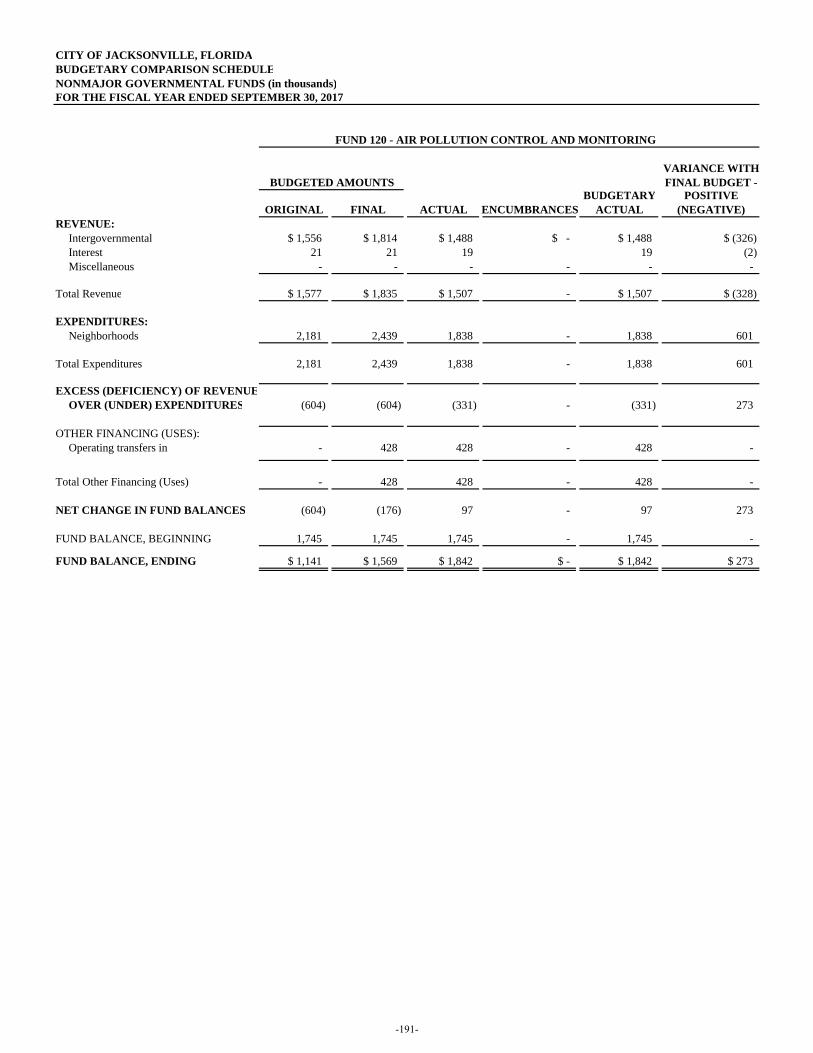
CITY OF JACKSONVILLE, FLORIDABUDGETARY COMPARISON SCHEDULENONMAJOR GOVERNMENTAL FUNDS (in thousands)FOR THE FISCAL YEAR ENDED SEPTEMBER 30, 2017
VARIANCE WITHFINAL BUDGET -
BUDGETARY POSITIVEORIGINAL FINAL ACTUAL ENCUMBRANCES ACTUAL (NEGATIVE)
REVENUE:Intergovernmental $ 1,556 $ 1,814 $ 1,488 $ - $ 1,488 $ (326)Interest 21 21 19 19 (2) Miscellaneous - - - - - -
Total Revenue $ 1,577 $ 1,835 $ 1,507 - $ 1,507 $ (328)
EXPENDITURES:Neighborhoods 2,181 2,439 1,838 - 1,838 601
Total Expenditures 2,181 2,439 1,838 - 1,838 601
EXCESS (DEFICIENCY) OF REVENUEOVER (UNDER) EXPENDITURES (604) (604) (331) - (331) 273
OTHER FINANCING (USES):Operating transfers in - 428 428 - 428 - Operating transfers out
Total Other Financing (Uses) - 428 428 - 428 -
NET CHANGE IN FUND BALANCES (604) (176) 97 - 97 273
FUND BALANCE, BEGINNING 1,745 1,745 1,745 - 1,745 -
FUND BALANCE, ENDING $ 1,141 $ 1,569 $ 1,842 $ - $ 1,842 $ 273
BUDGETED AMOUNTS
FUND 120 - AIR POLLUTION CONTROL AND MONITORING
-191-
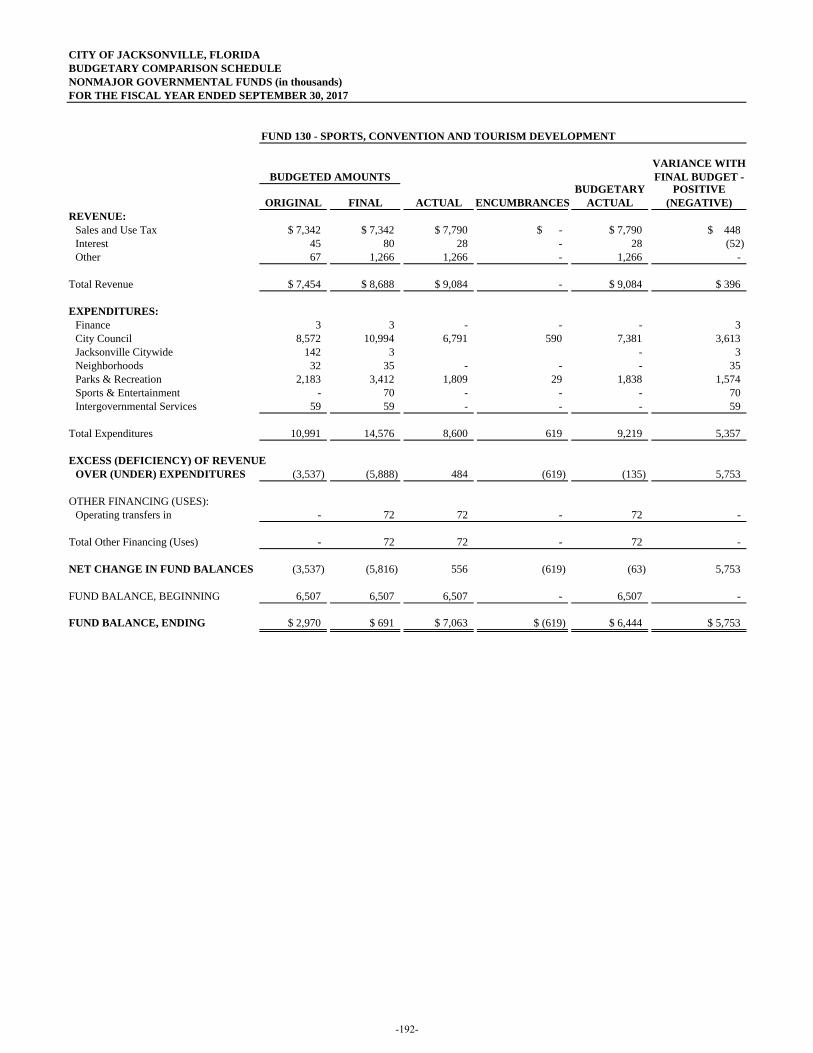
CITY OF JACKSONVILLE, FLORIDABUDGETARY COMPARISON SCHEDULENONMAJOR GOVERNMENTAL FUNDS (in thousands)FOR THE FISCAL YEAR ENDED SEPTEMBER 30, 2017
FUND 130 - SPORTS, CONVENTION AND TOURISM DEVELOPMENT
VARIANCE WITHFINAL BUDGET -
BUDGETARY POSITIVEORIGINAL FINAL ACTUAL ENCUMBRANCES ACTUAL (NEGATIVE)
REVENUE:Sales and Use Tax $ 7,342 $ 7,342 $ 7,790 $ - $ 7,790 $ 448Interest 45 80 28 - 28 (52) Other 67 1,266 1,266 - 1,266 -
Total Revenue $ 7,454 $ 8,688 $ 9,084 - $ 9,084 $ 396
EXPENDITURES:Finance 3 3 - - - 3 City Council 8,572 10,994 6,791 590 7,381 3,613 Jacksonville Citywide 142 3 - 3 Neighborhoods 32 35 - - - 35 Parks & Recreation 2,183 3,412 1,809 29 1,838 1,574 Sports & Entertainment - 70 - - - 70 Intergovernmental Services 59 59 - - - 59
Total Expenditures 10,991 14,576 8,600 619 9,219 5,357
EXCESS (DEFICIENCY) OF REVENUEOVER (UNDER) EXPENDITURES (3,537) (5,888) 484 (619) (135) 5,753
OTHER FINANCING (USES):Operating transfers in - 72 72 - 72 -
Total Other Financing (Uses) - 72 72 - 72 -
NET CHANGE IN FUND BALANCES (3,537) (5,816) 556 (619) (63) 5,753
FUND BALANCE, BEGINNING 6,507 6,507 6,507 - 6,507 -
FUND BALANCE, ENDING $ 2,970 $ 691 $ 7,063 $ (619) $ 6,444 $ 5,753
BUDGETED AMOUNTS
-192-
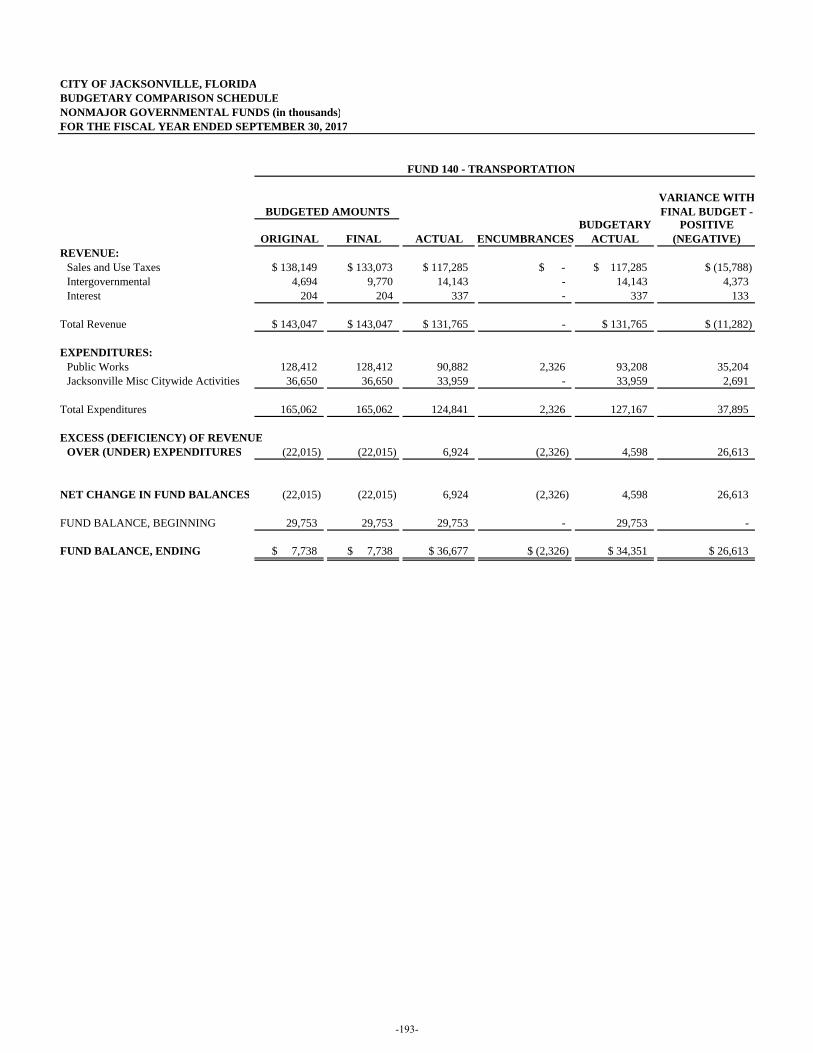
CITY OF JACKSONVILLE, FLORIDABUDGETARY COMPARISON SCHEDULENONMAJOR GOVERNMENTAL FUNDS (in thousands)FOR THE FISCAL YEAR ENDED SEPTEMBER 30, 2017
VARIANCE WITHFINAL BUDGET -
BUDGETARY POSITIVEORIGINAL FINAL ACTUAL ENCUMBRANCES ACTUAL (NEGATIVE)
REVENUE:Sales and Use Taxes $ 138,149 $ 133,073 $ 117,285 $ - $ 117,285 $ (15,788)Intergovernmental 4,694 9,770 14,143 - 14,143 4,373 Interest 204 204 337 - 337 133
Total Revenue $ 143,047 $ 143,047 $ 131,765 - $ 131,765 $ (11,282)
EXPENDITURES:Public Works 128,412 128,412 90,882 2,326 93,208 35,204 Jacksonville Misc Citywide Activities 36,650 36,650 33,959 - 33,959 2,691
Total Expenditures 165,062 165,062 124,841 2,326 127,167 37,895
EXCESS (DEFICIENCY) OF REVENUEOVER (UNDER) EXPENDITURES (22,015) (22,015) 6,924 (2,326) 4,598 26,613
NET CHANGE IN FUND BALANCES (22,015) (22,015) 6,924 (2,326) 4,598 26,613
FUND BALANCE, BEGINNING 29,753 29,753 29,753 - 29,753 -
FUND BALANCE, ENDING $ 7,738 $ 7,738 $ 36,677 $ (2,326) $ 34,351 $ 26,613
BUDGETED AMOUNTS
FUND 140 - TRANSPORTATION
-193-
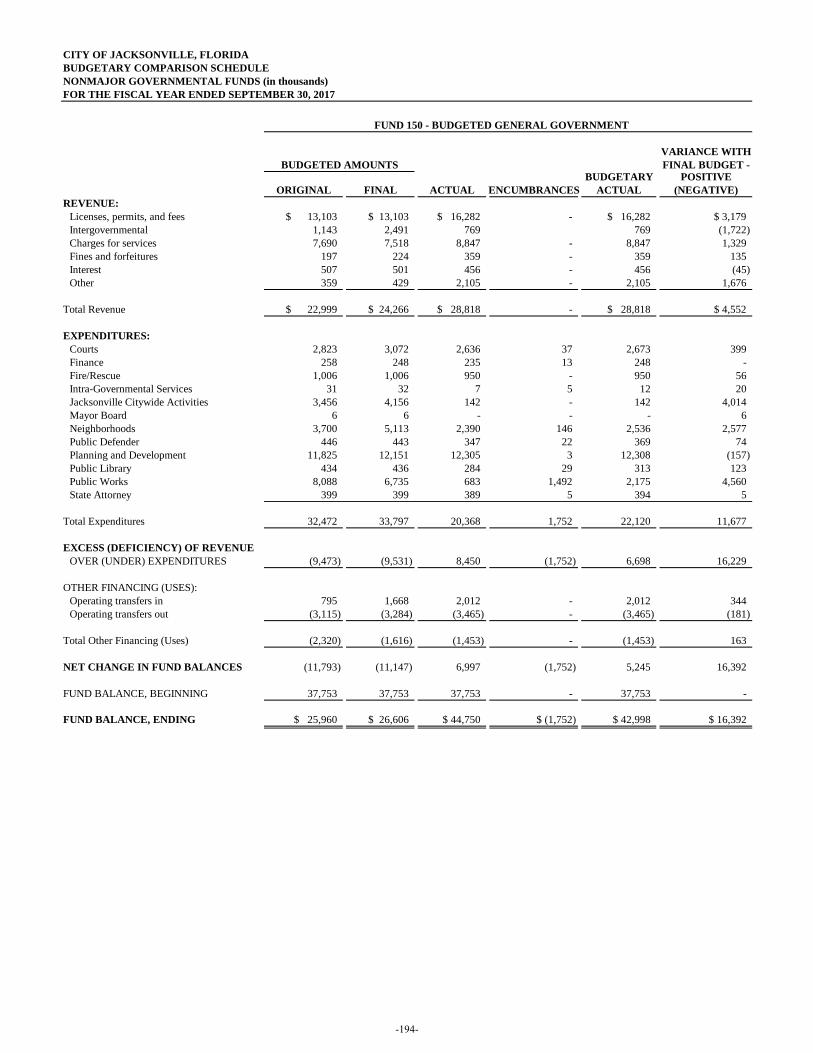
CITY OF JACKSONVILLE, FLORIDABUDGETARY COMPARISON SCHEDULENONMAJOR GOVERNMENTAL FUNDS (in thousands)FOR THE FISCAL YEAR ENDED SEPTEMBER 30, 2017
VARIANCE WITHFINAL BUDGET -
BUDGETARY POSITIVEORIGINAL FINAL ACTUAL ENCUMBRANCES ACTUAL (NEGATIVE)
REVENUE:Licenses, permits, and fees $ 13,103 $ 13,103 $ 16,282 - $ 16,282 $ 3,179Intergovernmental 1,143 2,491 769 769 (1,722) Charges for services 7,690 7,518 8,847 - 8,847 1,329 Fines and forfeitures 197 224 359 - 359 135 Interest 507 501 456 - 456 (45) Other 359 429 2,105 - 2,105 1,676
Total Revenue $ 22,999 $ 24,266 $ 28,818 - $ 28,818 $ 4,552
EXPENDITURES:Courts 2,823 3,072 2,636 37 2,673 399 Finance 258 248 235 13 248 - Fire/Rescue 1,006 1,006 950 - 950 56 Intra-Governmental Services 31 32 7 5 12 20 Jacksonville Citywide Activities 3,456 4,156 142 - 142 4,014 Mayor Board 6 6 - - - 6 Neighborhoods 3,700 5,113 2,390 146 2,536 2,577 Public Defender 446 443 347 22 369 74 Planning and Development 11,825 12,151 12,305 3 12,308 (157) Public Library 434 436 284 29 313 123 Public Works 8,088 6,735 683 1,492 2,175 4,560 State Attorney 399 399 389 5 394 5
Total Expenditures 32,472 33,797 20,368 1,752 22,120 11,677
EXCESS (DEFICIENCY) OF REVENUE OVER (UNDER) EXPENDITURES (9,473) (9,531) 8,450 (1,752) 6,698 16,229
OTHER FINANCING (USES):Operating transfers in 795 1,668 2,012 - 2,012 344 Operating transfers out (3,115) (3,284) (3,465) - (3,465) (181)
Total Other Financing (Uses) (2,320) (1,616) (1,453) - (1,453) 163
NET CHANGE IN FUND BALANCES (11,793) (11,147) 6,997 (1,752) 5,245 16,392
FUND BALANCE, BEGINNING 37,753 37,753 37,753 - 37,753 -
FUND BALANCE, ENDING $ 25,960 $ 26,606 $ 44,750 $ (1,752) $ 42,998 $ 16,392
BUDGETED AMOUNTS
FUND 150 - BUDGETED GENERAL GOVERNMENT
-194-
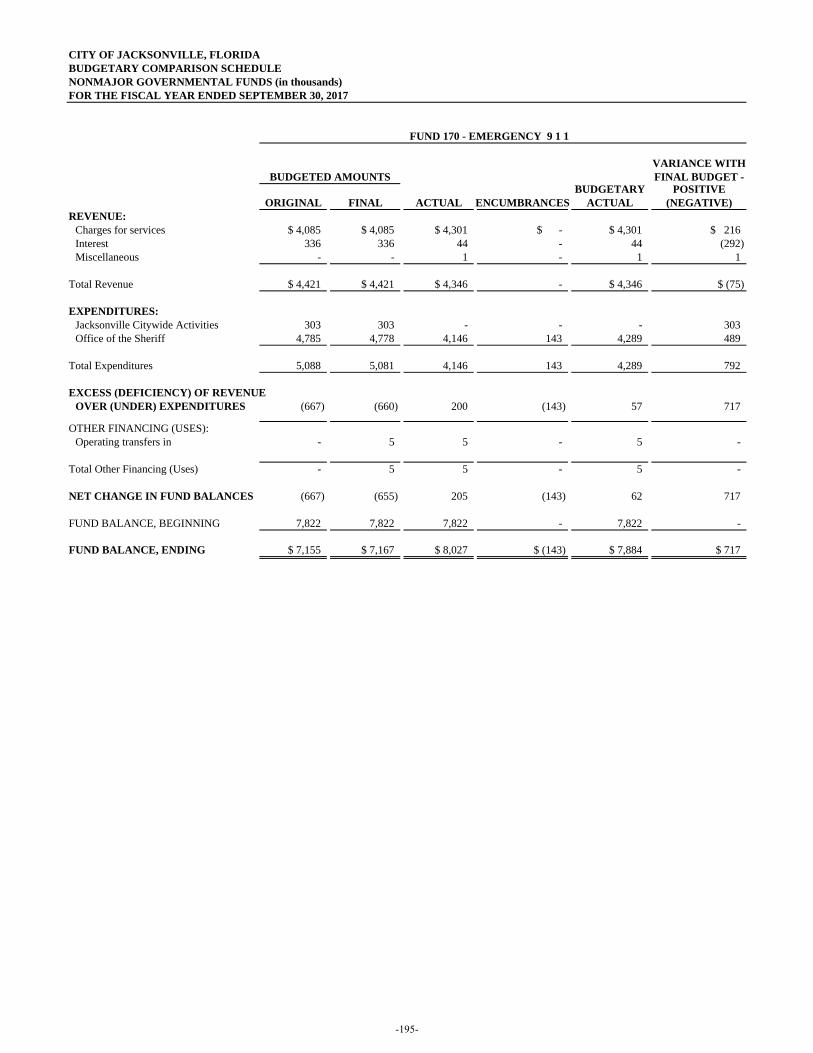
CITY OF JACKSONVILLE, FLORIDABUDGETARY COMPARISON SCHEDULENONMAJOR GOVERNMENTAL FUNDS (in thousands)FOR THE FISCAL YEAR ENDED SEPTEMBER 30, 2017
VARIANCE WITHFINAL BUDGET -
BUDGETARY POSITIVEORIGINAL FINAL ACTUAL ENCUMBRANCES ACTUAL (NEGATIVE)
REVENUE:Charges for services $ 4,085 $ 4,085 $ 4,301 $ - $ 4,301 $ 216Interest 336 336 44 - 44 (292) Miscellaneous - - 1 - 1 1
Total Revenue $ 4,421 $ 4,421 $ 4,346 - $ 4,346 $ (75)
EXPENDITURES:Jacksonville Citywide Activities 303 303 - - - 303 Office of the Sheriff 4,785 4,778 4,146 143 4,289 489
Total Expenditures 5,088 5,081 4,146 143 4,289 792
EXCESS (DEFICIENCY) OF REVENUEOVER (UNDER) EXPENDITURES (667) (660) 200 (143) 57 717
OTHER FINANCING (USES):Operating transfers in - 5 5 - 5 -
Total Other Financing (Uses) - 5 5 - 5 -
NET CHANGE IN FUND BALANCES (667) (655) 205 (143) 62 717
FUND BALANCE, BEGINNING 7,822 7,822 7,822 - 7,822 -
FUND BALANCE, ENDING $ 7,155 $ 7,167 $ 8,027 $ (143) $ 7,884 $ 717
BUDGETED AMOUNTS
FUND 170 - EMERGENCY 9 1 1
-195-
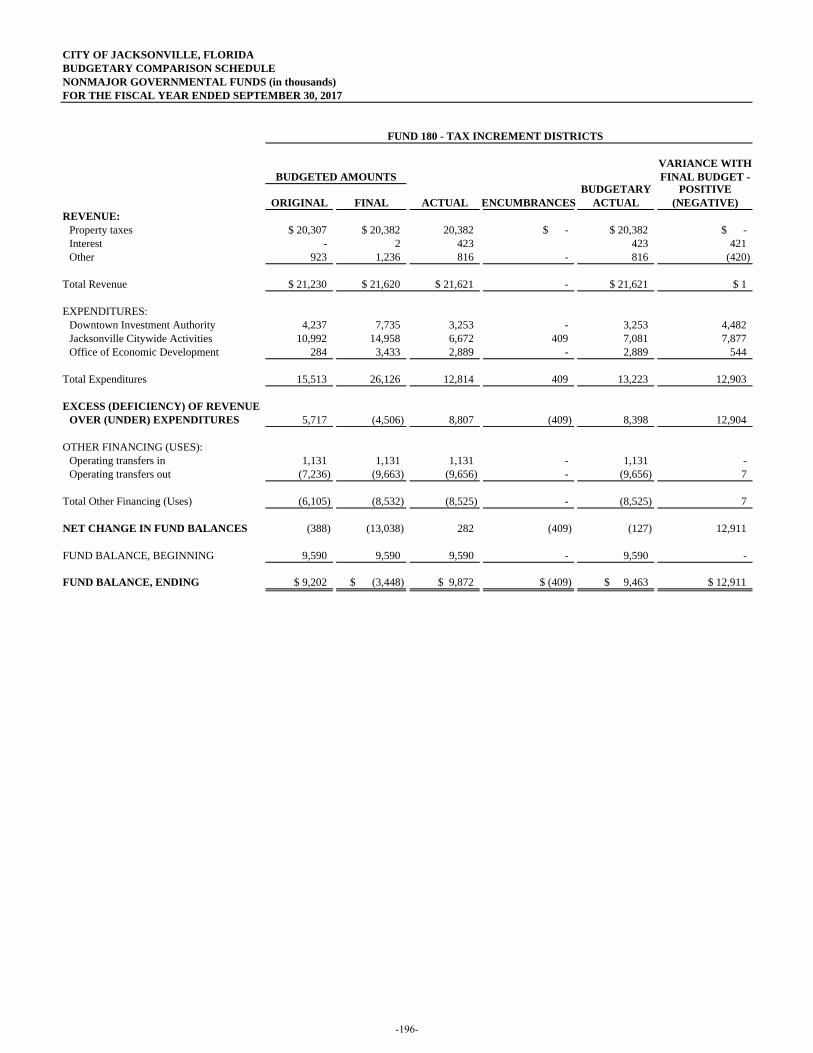
CITY OF JACKSONVILLE, FLORIDABUDGETARY COMPARISON SCHEDULENONMAJOR GOVERNMENTAL FUNDS (in thousands)FOR THE FISCAL YEAR ENDED SEPTEMBER 30, 2017
VARIANCE WITHFINAL BUDGET -
BUDGETARY POSITIVEORIGINAL FINAL ACTUAL ENCUMBRANCES ACTUAL (NEGATIVE)
REVENUE:Property taxes $ 20,307 $ 20,382 20,382 $ - $ 20,382 $ -Interest - 2 423 423 421 Other 923 1,236 816 - 816 (420)
Total Revenue $ 21,230 $ 21,620 $ 21,621 - $ 21,621 $ 1
EXPENDITURES:Downtown Investment Authority 4,237 7,735 3,253 - 3,253 4,482 Jacksonville Citywide Activities 10,992 14,958 6,672 409 7,081 7,877 Office of Economic Development 284 3,433 2,889 - 2,889 544
Total Expenditures 15,513 26,126 12,814 409 13,223 12,903
EXCESS (DEFICIENCY) OF REVENUEOVER (UNDER) EXPENDITURES 5,717 (4,506) 8,807 (409) 8,398 12,904
OTHER FINANCING (USES):Operating transfers in 1,131 1,131 1,131 - 1,131 - Operating transfers out (7,236) (9,663) (9,656) - (9,656) 7
Total Other Financing (Uses) (6,105) (8,532) (8,525) - (8,525) 7
NET CHANGE IN FUND BALANCES (388) (13,038) 282 (409) (127) 12,911
FUND BALANCE, BEGINNING 9,590 9,590 9,590 - 9,590 -
FUND BALANCE, ENDING $ 9,202 $ (3,448) $ 9,872 $ (409) $ 9,463 $ 12,911
BUDGETED AMOUNTS
FUND 180 - TAX INCREMENT DISTRICTS
-196-
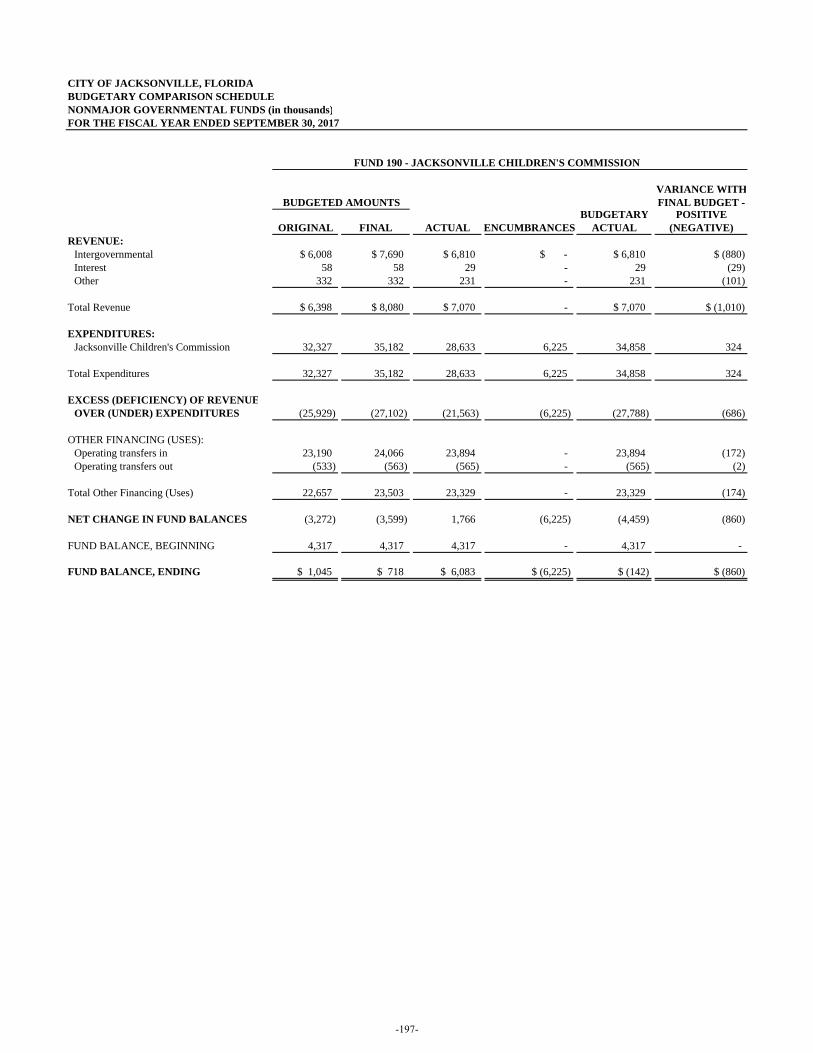
CITY OF JACKSONVILLE, FLORIDABUDGETARY COMPARISON SCHEDULENONMAJOR GOVERNMENTAL FUNDS (in thousands)FOR THE FISCAL YEAR ENDED SEPTEMBER 30, 2017
VARIANCE WITHFINAL BUDGET -
BUDGETARY POSITIVEORIGINAL FINAL ACTUAL ENCUMBRANCES ACTUAL (NEGATIVE)
REVENUE:Intergovernmental $ 6,008 $ 7,690 $ 6,810 $ - $ 6,810 $ (880)Interest 58 58 29 - 29 (29) Other 332 332 231 - 231 (101)
Total Revenue $ 6,398 $ 8,080 $ 7,070 - $ 7,070 $ (1,010)
EXPENDITURES: Jacksonville Children's Commission 32,327 35,182 28,633 6,225 34,858 324
Total Expenditures 32,327 35,182 28,633 6,225 34,858 324
EXCESS (DEFICIENCY) OF REVENUEOVER (UNDER) EXPENDITURES (25,929) (27,102) (21,563) (6,225) (27,788) (686)
OTHER FINANCING (USES):Operating transfers in 23,190 24,066 23,894 - 23,894 (172) Operating transfers out (533) (563) (565) - (565) (2)
Total Other Financing (Uses) 22,657 23,503 23,329 - 23,329 (174)
NET CHANGE IN FUND BALANCES (3,272) (3,599) 1,766 (6,225) (4,459) (860)
FUND BALANCE, BEGINNING 4,317 4,317 4,317 - 4,317 -
FUND BALANCE, ENDING $ 1,045 $ 718 $ 6,083 $ (6,225) $ (142) $ (860)
BUDGETED AMOUNTS
FUND 190 - JACKSONVILLE CHILDREN'S COMMISSION
-197-

(This page is intentionally left blank.)
-198-
NON-MAJOR ENTERPRISE FUNDS:
Enterprise Funds account for operations that are financed and operated in a manner similar to private business enterprises and where the costs of providing goods or services to the general public are recovered primarily through user charges; or where the City has decided that determination of net income is appropriate for capital maintenance, public policy, management control, accountability or other purposes. Individual non-major enterprise funds are described below. The Public Parking System Fund accounts for the City's on-street, off-street, and parking garage facility operations, including revenue collection and enforcement. The Motor Vehicle Inspection Fund accounts for the operations of the City's motor vehicle inspection stations. The Mayport Ferry Fund - account for the operations associated with the St. Johns River (Mayport) Ferry service. The EverBank Field Fund accounts for events held at the stadium including National Football League and college football games, concerts and other activities. The Veterans Memorial Arena Fund accounts for events held at the arena including concerts, college basketball games, and other entertainment events such as the circus, ice skating, gymnastics, professional wrestling and motor sports.
The Baseball Stadium Fund accounts for events held at the stadium including professional minor league and college baseball games. Times Union Center for the Performing Arts (Performing Arts) Fund - accounts for events held at the center such as the symphony, FCCJ performing arts series, dance recitals and concerts. The Prime Osborn Convention Center (Convention Center) Fund accounts for events held at the center such as gate and trade shows, banquets, meetings and other. The Equestrian Center Fund accounts for events held at the center including horse shows and competitions, rodeos and concerts. The Sports Complex Capital Fund accounts for maintenance and upkeep for municipal stadium, baseball stadium, and arena. The Ritz Theater Fund accounts for the operations of the Ritz Theater and Museum public entertainment facilities.
-199-
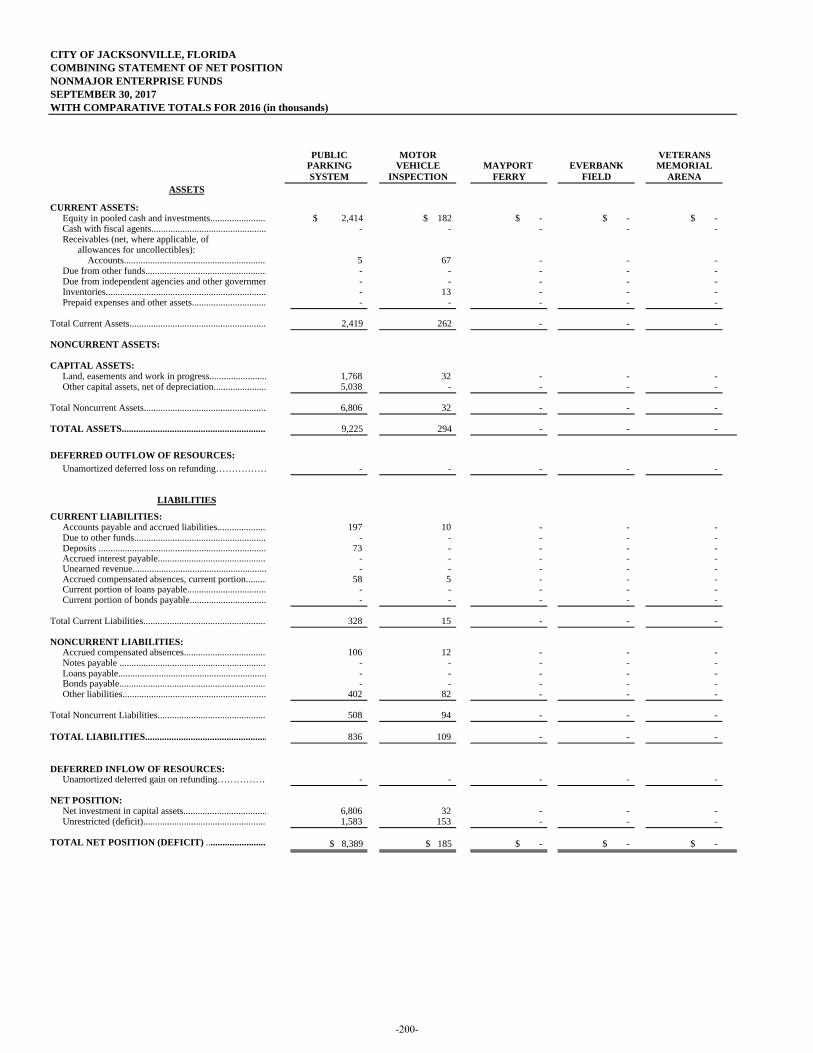
CITY OF JACKSONVILLE, FLORIDACOMBINING STATEMENT OF NET POSITIONNONMAJOR ENTERPRISE FUNDSSEPTEMBER 30, 2017 WITH COMPARATIVE TOTALS FOR 2016 (in thousands)
PUBLIC MOTOR VETERANSPARKING VEHICLE MAYPORT EVERBANK MEMORIALSYSTEM INSPECTION FERRY FIELD ARENA
ASSETS
CURRENT ASSETS: Equity in pooled cash and investments........................ $ 2,414 $ 182 $ - $ - $ -Cash with fiscal agents................................................ - - - - - Receivables (net, where applicable, of
allowances for uncollectibles): Accounts............................................................ 5 67 - - -
Due from other funds................................................... - - - - - Due from independent agencies and other governmen - - - - - Inventories................................................................... - 13 - - - Prepaid expenses and other assets............................... - - - - -
Total Current Assets......................................................... 2,419 262 - - -
NONCURRENT ASSETS:
CAPITAL ASSETS: Land, easements and work in progress........................ 1,768 32 - - - Other capital assets, net of depreciation...................... 5,038 - - - -
Total Noncurrent Assets................................................... 6,806 32 - - -
TOTAL ASSETS............................................................. 9,225 294 - - -
DEFERRED OUTFLOW OF RESOURCES:Unamortized deferred loss on refunding……………… - - - - -
LIABILITIES
CURRENT LIABILITIES:Accounts payable and accrued liabilities..................... 197 10 - - - Due to other funds....................................................... - - - - - Deposits ...................................................................... 73 - - - - Accrued interest payable.............................................. - - - - - Unearned revenue........................................................ - - - - - Accrued compensated absences, current portion......... 58 5 - - - Current portion of loans payable................................. - - - - - Current portion of bonds payable................................ - - - - -
Total Current Liabilities.................................................... 328 15 - - -
NONCURRENT LIABILITIES:
Accrued compensated absences................................... 106 12 - - - Notes payable .............................................................. - - - - - Loans payable.............................................................. - - - - - Bonds payable.............................................................. - - - - - Other liabilities............................................................ 402 82 - - -
Total Noncurrent Liabilities.............................................. 508 94 - - -
TOTAL LIABILITIES................................................... 836 109 - - -
DEFERRED INFLOW OF RESOURCES:Unamortized deferred gain on refunding……………… - - - - -
NET POSITION: Net investment in capital assets................................... 6,806 32 - - - Unrestricted (deficit).................................................... 1,583 153 - - -
TOTAL NET POSITION (DEFICIT) .......................... $ 8,389 $ 185 $ - $ - $ -
-200-
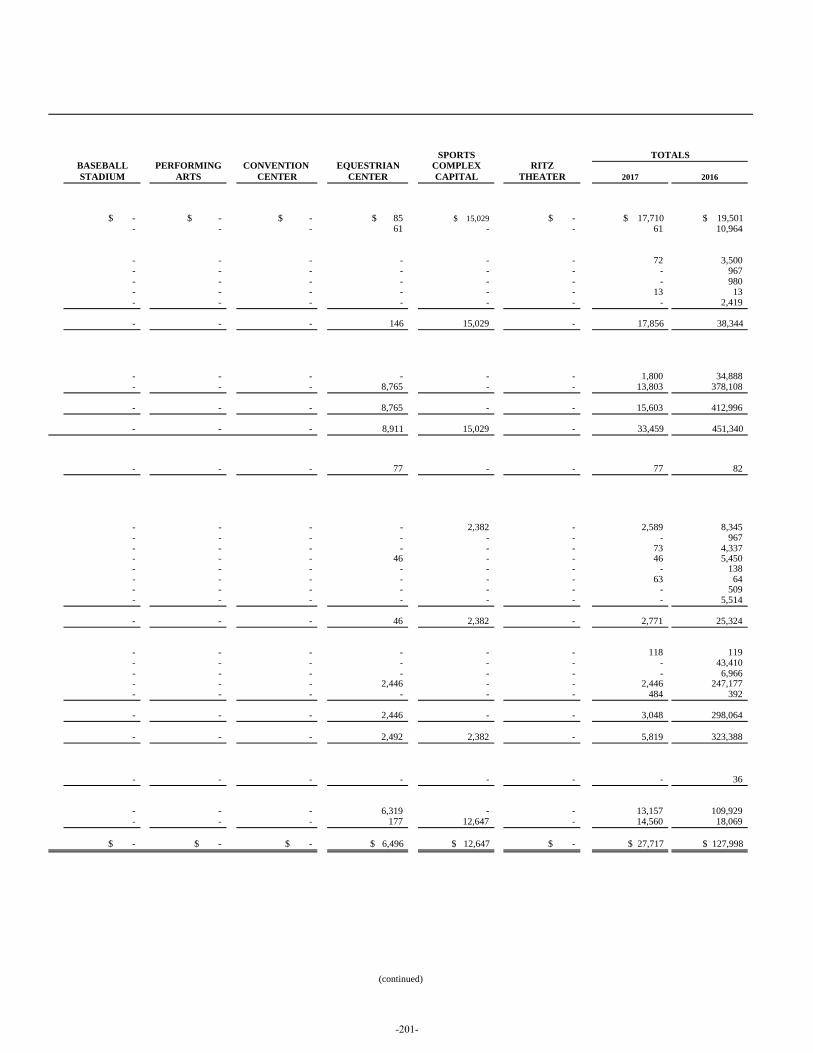
SPORTS TOTALS
BASEBALL PERFORMING CONVENTION EQUESTRIAN COMPLEX RITZSTADIUM ARTS CENTER CENTER CAPITAL THEATER 2017 2016
$ - $ - $ - $ 85 $ 15,029 $ - $ 17,710 $ 19,501 - - - 61 - - 61 10,964
- - - - - - 72 3,500 - - - - - - - 967 - - - - - - - 980 - - - - - - 13 13 - - - - - - - 2,419
- - - 146 15,029 - 17,856 38,344
- - - - - - 1,800 34,888 - - - 8,765 - - 13,803 378,108
- - - 8,765 - - 15,603 412,996
- - - 8,911 15,029 - 33,459 451,340
- - - 77 - - 77 82
- - - - 2,382 - 2,589 8,345 - - - - - - - 967 - - - - - - 73 4,337 - - - 46 - - 46 5,450 - - - - - - - 138 - - - - - - 63 64 - - - - - - - 509 - - - - - - - 5,514
- - - 46 2,382 - 2,771 25,324
- - - - - - 118 119 - - - - - - - 43,410 - - - - - - - 6,966 - - - 2,446 - - 2,446 247,177 - - - - - - 484 392
- - - 2,446 - - 3,048 298,064
- - - 2,492 2,382 - 5,819 323,388
- - - - - - - 36
- - - 6,319 - - 13,157 109,929 - - - 177 12,647 - 14,560 18,069
$ - $ - $ - $ 6,496 $ 12,647 $ - $ 27,717 $ 127,998
(continued)
-201-
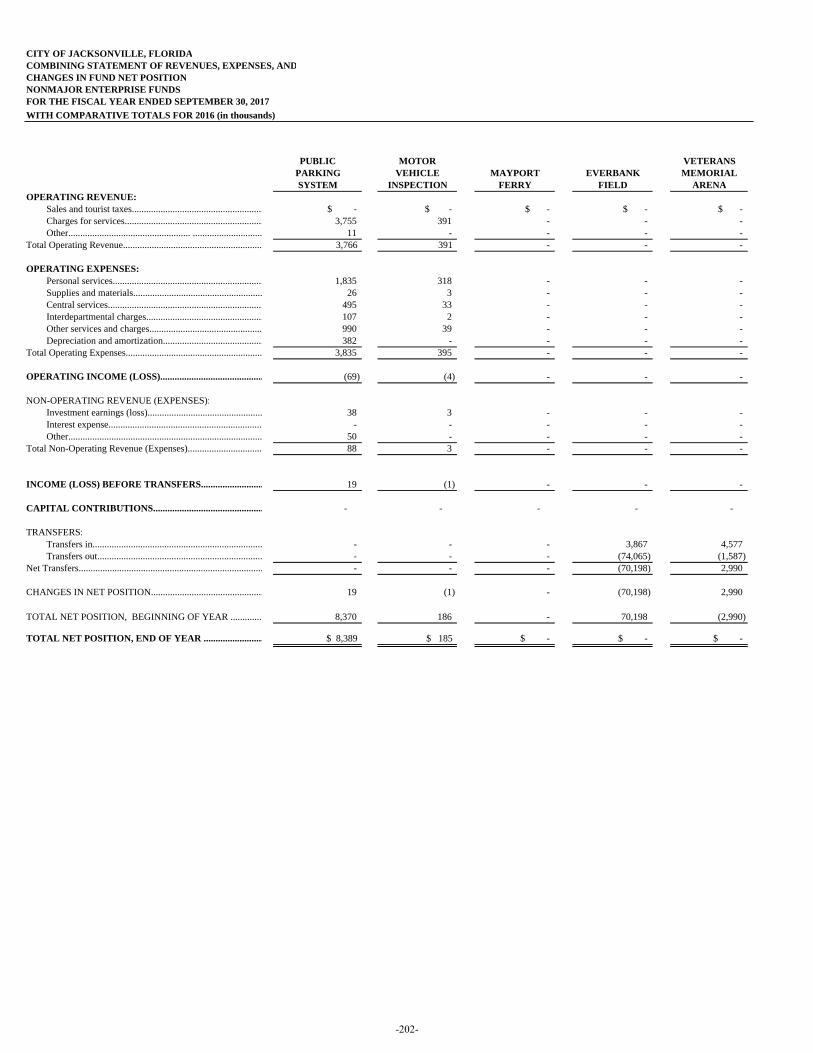
CITY OF JACKSONVILLE, FLORIDACOMBINING STATEMENT OF REVENUES, EXPENSES, ANDCHANGES IN FUND NET POSITIONNONMAJOR ENTERPRISE FUNDSFOR THE FISCAL YEAR ENDED SEPTEMBER 30, 2017WITH COMPARATIVE TOTALS FOR 2016 (in thousands)
PUBLIC MOTOR VETERANSPARKING VEHICLE MAYPORT EVERBANK MEMORIALSYSTEM INSPECTION FERRY FIELD ARENA
OPERATING REVENUE:Sales and tourist taxes....................................................... $ - $ - $ - $ - $ -Charges for services.......................................................... 3,755 391 - - - Other................................................... ............................. 11 - - - -
Total Operating Revenue.......................................................... 3,766 391 - - -
OPERATING EXPENSES: Personal services............................................................... 1,835 318 - - - Supplies and materials...................................................... 26 3 - - - Central services................................................................. 495 33 - - - Interdepartmental charges................................................. 107 2 - - - Other services and charges............................................... 990 39 - - - Depreciation and amortization.......................................... 382 - - - -
Total Operating Expenses......................................................... 3,835 395 - - -
OPERATING INCOME (LOSS)........................................... (69) (4) - - -
NON-OPERATING REVENUE (EXPENSES): Investment earnings (loss)................................................ 38 3 - - - Interest expense................................................................ - - - - - Other................................................................................. 50 - - - -
Total Non-Operating Revenue (Expenses)............................... 88 3 - - -
INCOME (LOSS) BEFORE TRANSFERS.......................... 19 (1) - - -
CAPITAL CONTRIBUTIONS.............................................. - - - - -
TRANSFERS:Transfers in....................................................................... - - - 3,867 4,577 Transfers out..................................................................... - - - (74,065) (1,587)
Net Transfers............................................................................. - - - (70,198) 2,990
CHANGES IN NET POSITION............................................... 19 (1) - (70,198) 2,990
TOTAL NET POSITION, BEGINNING OF YEAR ............. 8,370 186 - 70,198 (2,990)
TOTAL NET POSITION, END OF YEAR ......................... $ 8,389 $ 185 $ - $ - $ -
-202-
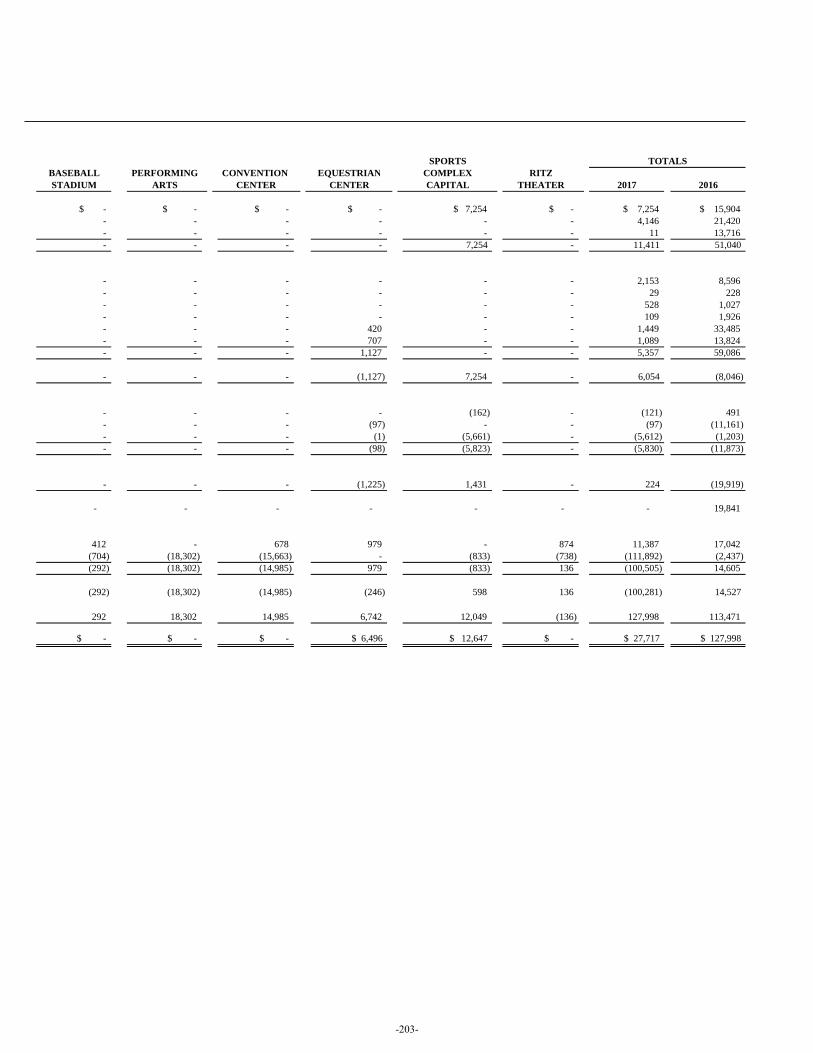
SPORTS TOTALS
BASEBALL PERFORMING CONVENTION EQUESTRIAN COMPLEX RITZSTADIUM ARTS CENTER CENTER CAPITAL THEATER 2017 2016
$ - $ - $ - $ - $ 7,254 $ - $ 7,254 $ 15,904- - - - - - 4,146 21,420 - - - - - - 11 13,716 - - - - 7,254 - 11,411 51,040
- - - - - - 2,153 8,596 - - - - - - 29 228 - - - - - - 528 1,027 - - - - - - 109 1,926 - - - 420 - - 1,449 33,485 - - - 707 - - 1,089 13,824 - - - 1,127 - - 5,357 59,086
- - - (1,127) 7,254 - 6,054 (8,046)
- - - - (162) - (121) 491 - - - (97) - - (97) (11,161) - - - (1) (5,661) - (5,612) (1,203) - - - (98) (5,823) - (5,830) (11,873)
- - - (1,225) 1,431 - 224 (19,919)
- - - - - - - 19,841
412 - 678 979 - 874 11,387 17,042 (704) (18,302) (15,663) - (833) (738) (111,892) (2,437) (292) (18,302) (14,985) 979 (833) 136 (100,505) 14,605
(292) (18,302) (14,985) (246) 598 136 (100,281) 14,527
292 18,302 14,985 6,742 12,049 (136) 127,998 113,471
$ - $ - $ - $ 6,496 $ 12,647 $ - $ 27,717 $ 127,998
-203-
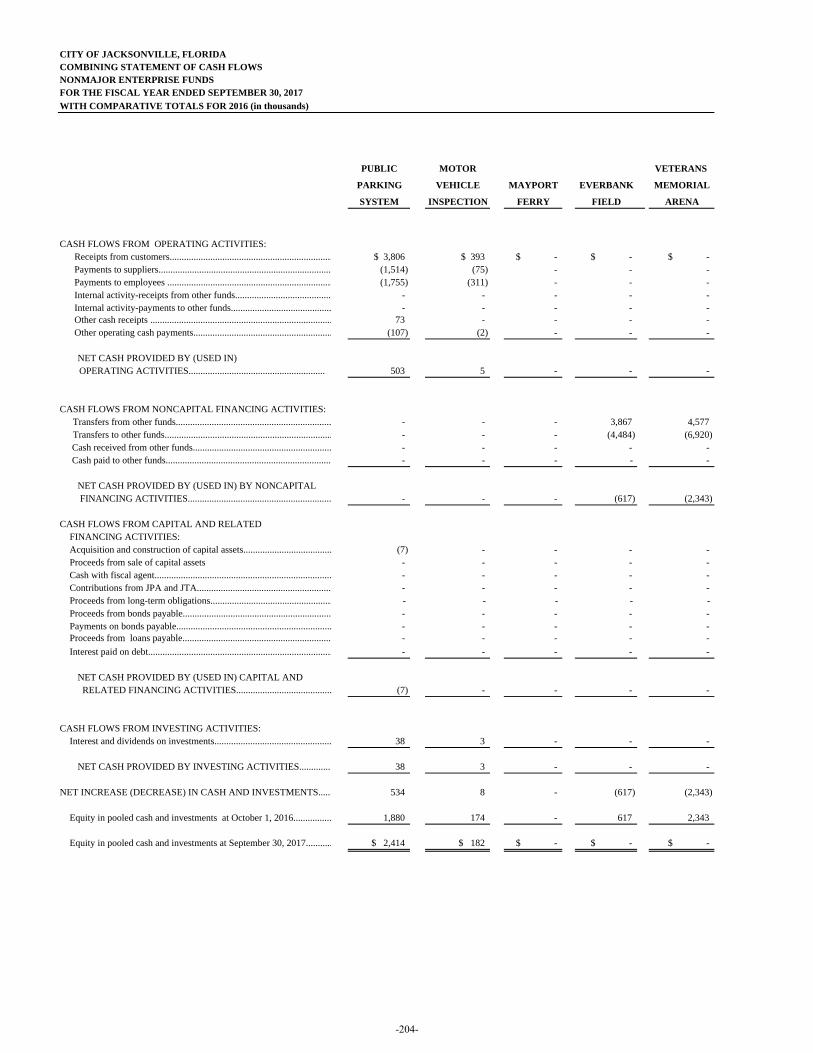
CITY OF JACKSONVILLE, FLORIDACOMBINING STATEMENT OF CASH FLOWS NONMAJOR ENTERPRISE FUNDSFOR THE FISCAL YEAR ENDED SEPTEMBER 30, 2017WITH COMPARATIVE TOTALS FOR 2016 (in thousands)
PUBLIC MOTOR VETERANS
PARKING VEHICLE MAYPORT EVERBANK MEMORIAL
SYSTEM INSPECTION FERRY FIELD ARENA
CASH FLOWS FROM OPERATING ACTIVITIES: Receipts from customers.................................................................... $ 3,806 $ 393 $ - $ - $ - Payments to suppliers........................................................................ (1,514) (75) - - - Payments to employees ..................................................................... (1,755) (311) - - - Internal activity-receipts from other funds........................................ - - - - - Internal activity-payments to other funds.......................................... - - - - - Other cash receipts ............................................................................ 73 - - - - Other operating cash payments.......................................................... (107) (2) - - -
NET CASH PROVIDED BY (USED IN) OPERATING ACTIVITIES......................................................... 503 5 - - -
CASH FLOWS FROM NONCAPITAL FINANCING ACTIVITIES: Transfers from other funds................................................................. - - - 3,867 4,577 Transfers to other funds...................................................................... - - - (4,484) (6,920)
Cash received from other funds.......................................................... - - - - - Cash paid to other funds..................................................................... - - - - -
NET CASH PROVIDED BY (USED IN) BY NONCAPITAL FINANCING ACTIVITIES............................................................ - - - (617) (2,343)
CASH FLOWS FROM CAPITAL AND RELATED
FINANCING ACTIVITIES:Acquisition and construction of capital assets..................................... (7) - - - - Proceeds from sale of capital assets - - - - - Cash with fiscal agent.......................................................................... - - - - - Contributions from JPA and JTA........................................................ - - - - - Proceeds from long-term obligations................................................... - - - - - Proceeds from bonds payable.............................................................. - - - - - Payments on bonds payable................................................................. - - - - - Proceeds from loans payable.............................................................. - - - - - Interest paid on debt............................................................................. - - - - -
NET CASH PROVIDED BY (USED IN) CAPITAL AND RELATED FINANCING ACTIVITIES........................................ (7) - - - -
CASH FLOWS FROM INVESTING ACTIVITIES: Interest and dividends on investments................................................. 38 3 - - -
NET CASH PROVIDED BY INVESTING ACTIVITIES.............. 38 3 - - -
NET INCREASE (DECREASE) IN CASH AND INVESTMENTS...... 534 8 - (617) (2,343)
Equity in pooled cash and investments at October 1, 2016................ 1,880 174 - 617 2,343
Equity in pooled cash and investments at September 30, 2017........... $ 2,414 $ 182 $ - $ - $ -
-204-
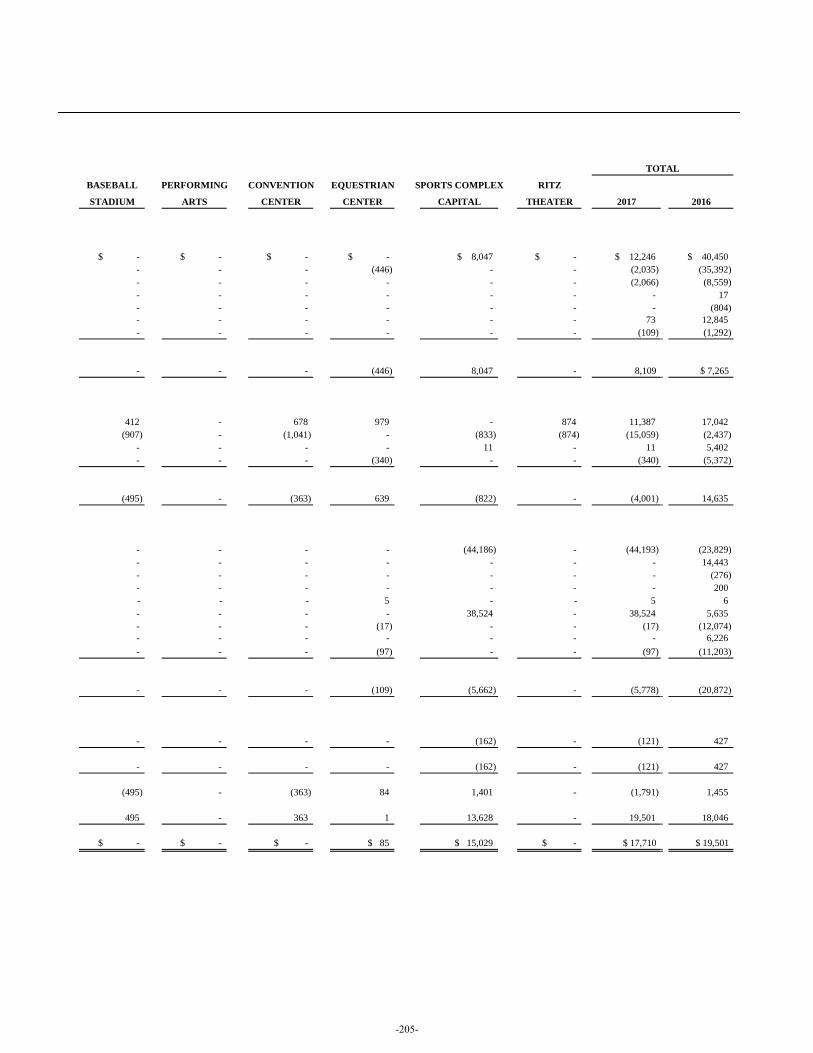
TOTAL
BASEBALL PERFORMING CONVENTION EQUESTRIAN SPORTS COMPLEX RITZ
STADIUM ARTS CENTER CENTER CAPITAL THEATER 2017 2016
$ - $ - $ - $ - $ 8,047 $ - $ 12,246 $ 40,450- - - (446) - - (2,035) (35,392) - - - - - - (2,066) (8,559) - - - - - - - 17 - - - - - - - (804) - - - - - - 73 12,845 - - - - - - (109) (1,292)
- - - (446) 8,047 - 8,109 $ 7,265
412 - 678 979 - 874 11,387 17,042 (907) - (1,041) - (833) (874) (15,059) (2,437)
- - - - 11 - 11 5,402 - - - (340) - - (340) (5,372)
(495) - (363) 639 (822) - (4,001) 14,635
- - - - (44,186) - (44,193) (23,829) - - - - - - - 14,443 - - - - - - - (276) - - - - - - - 200 - - - 5 - - 5 6 - - - - 38,524 - 38,524 5,635 - - - (17) - - (17) (12,074) - - - - - - - 6,226 - - - (97) - - (97) (11,203)
- - - (109) (5,662) - (5,778) (20,872)
- - - - (162) - (121) 427
- - - - (162) - (121) 427
(495) - (363) 84 1,401 - (1,791) 1,455
495 - 363 1 13,628 - 19,501 18,046
$ - $ - $ - $ 85 $ 15,029 $ - $ 17,710 $ 19,501
-205-
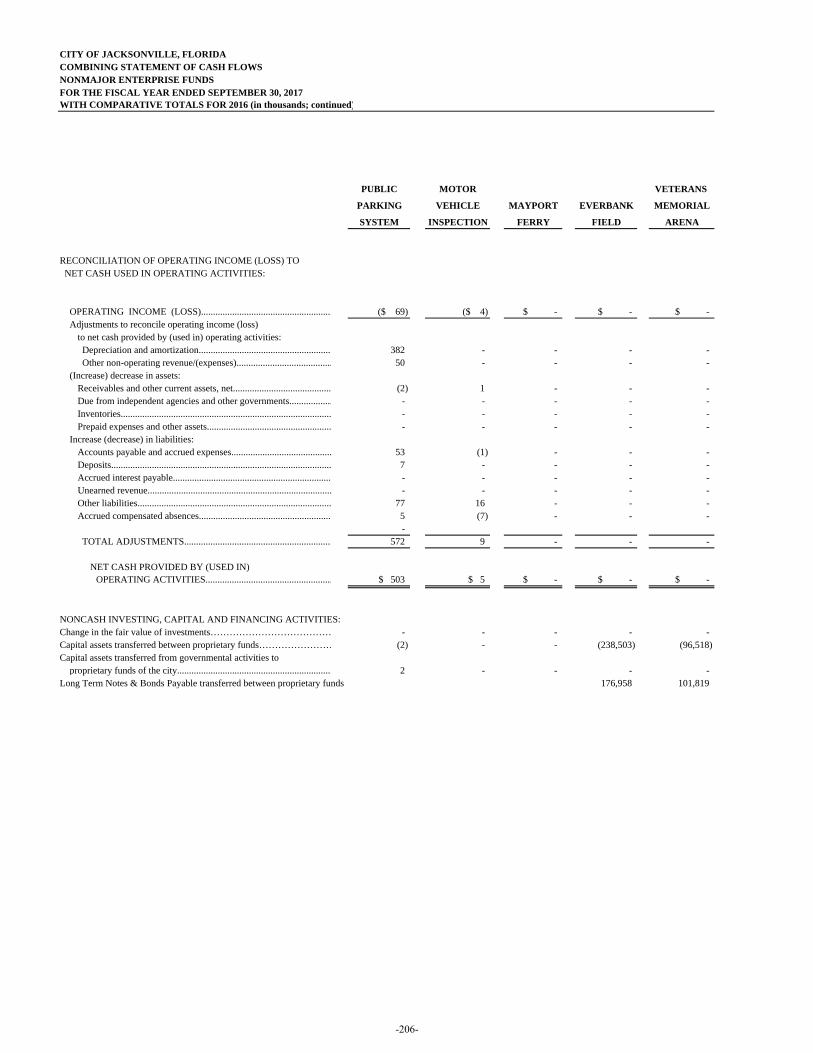
CITY OF JACKSONVILLE, FLORIDA COMBINING STATEMENT OF CASH FLOWS NONMAJOR ENTERPRISE FUNDS FOR THE FISCAL YEAR ENDED SEPTEMBER 30, 2017WITH COMPARATIVE TOTALS FOR 2016 (in thousands; continued)
PUBLIC MOTOR VETERANS
PARKING VEHICLE MAYPORT EVERBANK MEMORIAL
SYSTEM INSPECTION FERRY FIELD ARENA
RECONCILIATION OF OPERATING INCOME (LOSS) TO NET CASH USED IN OPERATING ACTIVITIES:
OPERATING INCOME (LOSS)....................................................... ($ 69) ($ 4) $ - $ - $ -Adjustments to reconcile operating income (loss)
to net cash provided by (used in) operating activities:Depreciation and amortization........................................................ 382 - - - - Other non-operating revenue/(expenses)........................................ 50 - - - -
(Increase) decrease in assets:Receivables and other current assets, net......................................... (2) 1 - - - Due from independent agencies and other governments.................. - - - - - Inventories........................................................................................ - - - - - Prepaid expenses and other assets.................................................... - - - - -
Increase (decrease) in liabilities:Accounts payable and accrued expenses.......................................... 53 (1) - - - Deposits............................................................................................ 7 - - - - Accrued interest payable.................................................................. - - - - - Unearned revenue............................................................................. - - - - - Other liabilities................................................................................. 77 16 - - - Accrued compensated absences........................................................ 5 (7) - - -
- TOTAL ADJUSTMENTS.............................................................. 572 9 - - -
NET CASH PROVIDED BY (USED IN)OPERATING ACTIVITIES..................................................... $ 503 $ 5 $ - $ - $ -
NONCASH INVESTING, CAPITAL AND FINANCING ACTIVITIES:Change in the fair value of investments………………………………… - - - - - Capital assets transferred between proprietary funds…………………… (2) - - (238,503) (96,518) Capital assets transferred from governmental activities to
proprietary funds of the city................................................................. 2 - - - - Long Term Notes & Bonds Payable transferred between proprietary funds 176,958 101,819
-206-
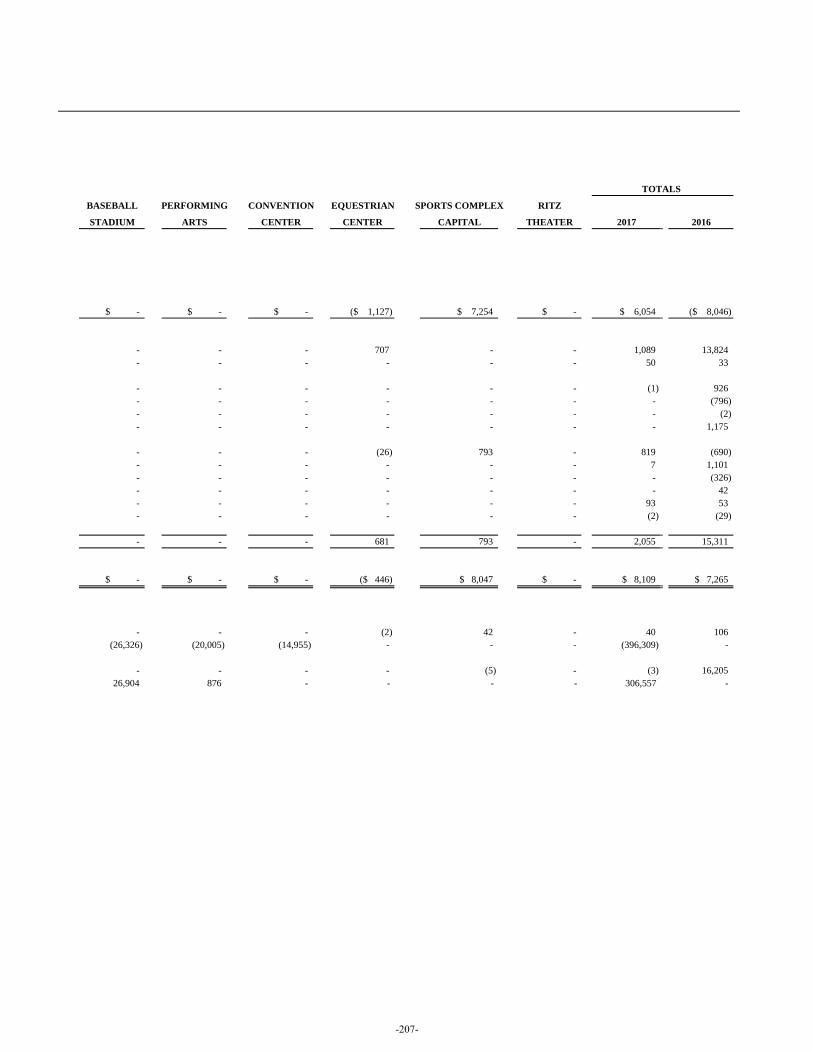
TOTALS
BASEBALL PERFORMING CONVENTION EQUESTRIAN SPORTS COMPLEX RITZ
STADIUM ARTS CENTER CENTER CAPITAL THEATER 2017 2016
$ - $ - $ - ($ 1,127) $ 7,254 $ - $ 6,054 ($ 8,046)
- - - 707 - - 1,089 13,824 - - - - - - 50 33
- - - - - - (1) 926 - - - - - - - (796) - - - - - - - (2) - - - - - - - 1,175
- - - (26) 793 - 819 (690) - - - - - - 7 1,101 - - - - - - - (326) - - - - - - - 42 - - - - - - 93 53 - - - - - - (2) (29)
- - - 681 793 - 2,055 15,311
$ - $ - $ - ($ 446) $ 8,047 $ - $ 8,109 $ 7,265
- - - (2) 42 - 40 106 (26,326) (20,005) (14,955) - - - (396,309) -
- - - - (5) - (3) 16,205 26,904 876 - - - - 306,557 -
-207-

(This page is intentionally left blank.)
-208-
INTERNAL SERVICE FUNDS
Internal Service Funds account for the financing of goods and services provided by one City department or agency to other City departments or agencies on a cost-reimbursement basis. Descriptions of individual funds in this category are presented below.
The Fleet Management Fund accounts for the operation of the City's fleet of police cars, fire and rescue vehicles, public works and public utilities trucks, and many other types of on- and off-road automotive equipment.
The Copy Center Fund accounts for the operation of the centralized copy center, mail and messenger service functions for City agencies. The Information Technologies Fund accounts for centralized information management and computer services that includes data processing, central telephone and network communications, and other voice/data electronic media services.
The Public Works Fund accounts for the cost of operation, maintenance, utilities and security of public buildings.
The Legal Fund accounts for centralized legal services to all City departments and agencies through the Office of General Counsel.
The Self-Insurance Fund accounts for centralized risk management and safety and loss prevention services to all City departments that are self-insured for workers' compensation, public, and general and vehicle liability.
The Group Health Fund accounts for employee health and life insurance premiums and manages third party health care contracts to all City employees.
The Insured Programs Fund accounts for providing all forms of property and casualty, commercial liability and other types of coverage to City departments. The Debt Management Fund accounts for commercial paper issued for short intermediate life assets such as personal computers, vehicles, application software, equipment, etc.
-209-
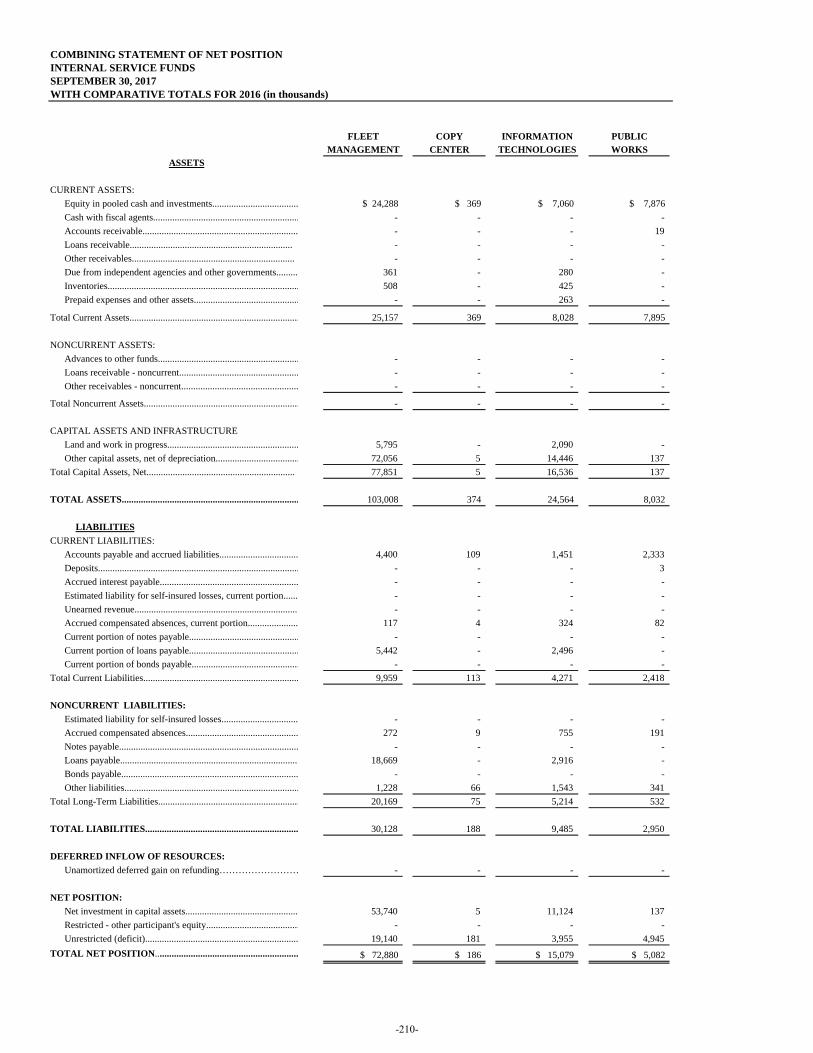
COMBINING STATEMENT OF NET POSITIONINTERNAL SERVICE FUNDSSEPTEMBER 30, 2017WITH COMPARATIVE TOTALS FOR 2016 (in thousands)
FLEET COPY INFORMATION PUBLICMANAGEMENT CENTER TECHNOLOGIES WORKS
ASSETS
CURRENT ASSETS:Equity in pooled cash and investments.................................... $ 24,288 $ 369 $ 7,060 $ 7,876 Cash with fiscal agents............................................................. - - - - Accounts receivable................................................................. - - - 19 Loans receivable.................................................................... - - - - Other receivables.................................................................... - - - - Due from independent agencies and other governments......... 361 - 280 - Inventories................................................................................ 508 - 425 - Prepaid expenses and other assets............................................ - - 263 -
Total Current Assets....................................................................... 25,157 369 8,028 7,895
NONCURRENT ASSETS:Advances to other funds........................................................... - - - - Loans receivable - noncurrent.................................................. - - - - Other receivables - noncurrent................................................. - - - -
Total Noncurrent Assets................................................................. - - - -
CAPITAL ASSETS AND INFRASTRUCTURE Land and work in progress....................................................... 5,795 - 2,090 - Other capital assets, net of depreciation................................... 72,056 5 14,446 137
Total Capital Assets, Net.............................................................. 77,851 5 16,536 137
TOTAL ASSETS.......................................................................... 103,008 374 24,564 8,032
LIABILITIESCURRENT LIABILITIES:
Accounts payable and accrued liabilities................................. 4,400 109 1,451 2,333 Deposits.................................................................................... - - - 3 Accrued interest payable.......................................................... - - - - Estimated liability for self-insured losses, current portion...... - - - - Unearned revenue.................................................................... - - - - Accrued compensated absences, current portion..................... 117 4 324 82 Current portion of notes payable.............................................. - - - - Current portion of loans payable.............................................. 5,442 - 2,496 - Current portion of bonds payable............................................. - - - -
Total Current Liabilities................................................................. 9,959 113 4,271 2,418
NONCURRENT LIABILITIES: Estimated liability for self-insured losses................................ - - - - Accrued compensated absences............................................... 272 9 755 191 Notes payable........................................................................... - - - - Loans payable.......................................................................... 18,669 - 2,916 - Bonds payable.......................................................................... - - - - Other liabilities......................................................................... 1,228 66 1,543 341
Total Long-Term Liabilities........................................................... 20,169 75 5,214 532
TOTAL LIABILITIES................................................................ 30,128 188 9,485 2,950
DEFERRED INFLOW OF RESOURCES: Unamortized deferred gain on refunding……………………… - - - -
NET POSITION: Net investment in capital assets............................................... 53,740 5 11,124 137 Restricted - other participant's equity....................................... - - - - Unrestricted (deficit)................................................................ 19,140 181 3,955 4,945
TOTAL NET POSITION............................................................ $ 72,880 $ 186 $ 15,079 $ 5,082
-210-
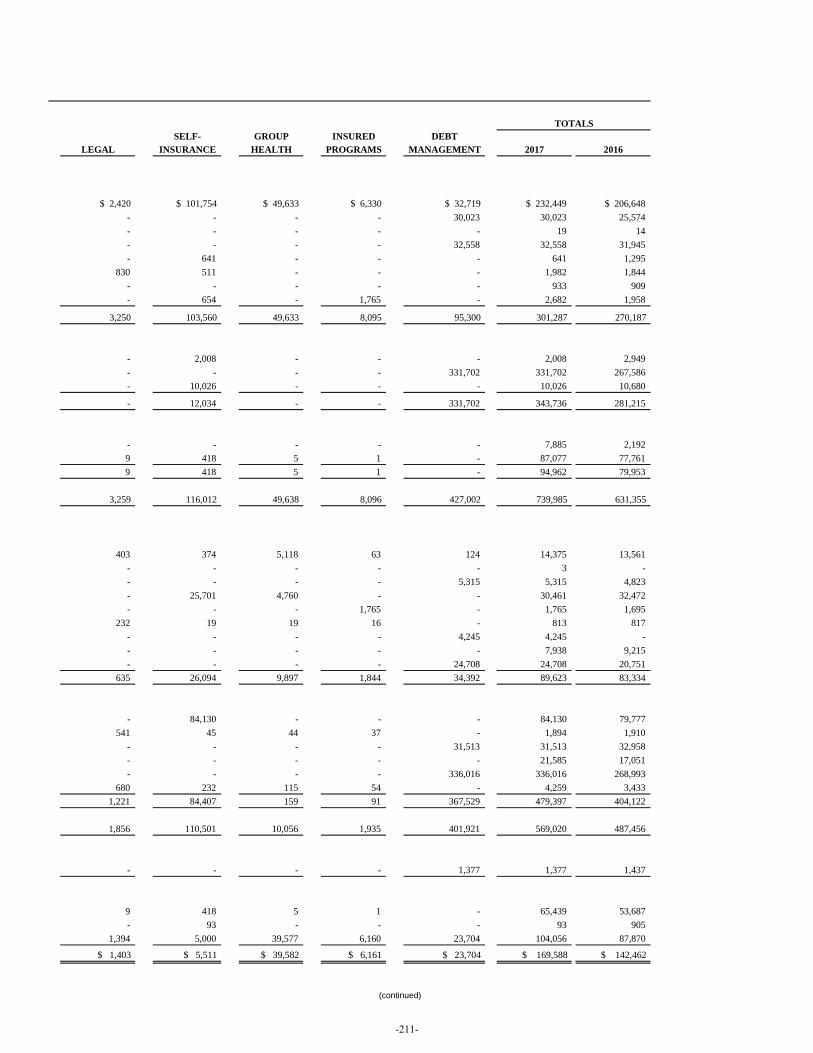
TOTALSSELF- GROUP INSURED DEBT
LEGAL INSURANCE HEALTH PROGRAMS MANAGEMENT 2017 2016
$ 2,420 $ 101,754 $ 49,633 $ 6,330 $ 32,719 $ 232,449 $ 206,648
- - - - 30,023 30,023 25,574 - - - - - 19 14 - - - - 32,558 32,558 31,945 - 641 - - - 641 1,295
830 511 - - - 1,982 1,844 - - - - - 933 909 - 654 - 1,765 - 2,682 1,958
3,250 103,560 49,633 8,095 95,300 301,287 270,187
- 2,008 - - - 2,008 2,949 - - - - 331,702 331,702 267,586 - 10,026 - - - 10,026 10,680
- 12,034 - - 331,702 343,736 281,215
- - - - - 7,885 2,192 9 418 5 1 - 87,077 77,761 9 418 5 1 - 94,962 79,953
3,259 116,012 49,638 8,096 427,002 739,985 631,355
403 374 5,118 63 124 14,375 13,561 - - - - - 3 - - - - - 5,315 5,315 4,823 - 25,701 4,760 - - 30,461 32,472 - - - 1,765 - 1,765 1,695
232 19 19 16 - 813 817 - - - - 4,245 4,245 - - - - - - 7,938 9,215 - - - - 24,708 24,708 20,751
635 26,094 9,897 1,844 34,392 89,623 83,334
- 84,130 - - - 84,130 79,777 541 45 44 37 - 1,894 1,910
- - - - 31,513 31,513 32,958 - - - - - 21,585 17,051 - - - - 336,016 336,016 268,993
680 232 115 54 - 4,259 3,433 1,221 84,407 159 91 367,529 479,397 404,122
1,856 110,501 10,056 1,935 401,921 569,020 487,456
- - - - 1,377 1,377 1,437
9 418 5 1 - 65,439 53,687 - 93 - - - 93 905
1,394 5,000 39,577 6,160 23,704 104,056 87,870
$ 1,403 $ 5,511 $ 39,582 $ 6,161 $ 23,704 $ 169,588 $ 142,462
(continued)
-211-
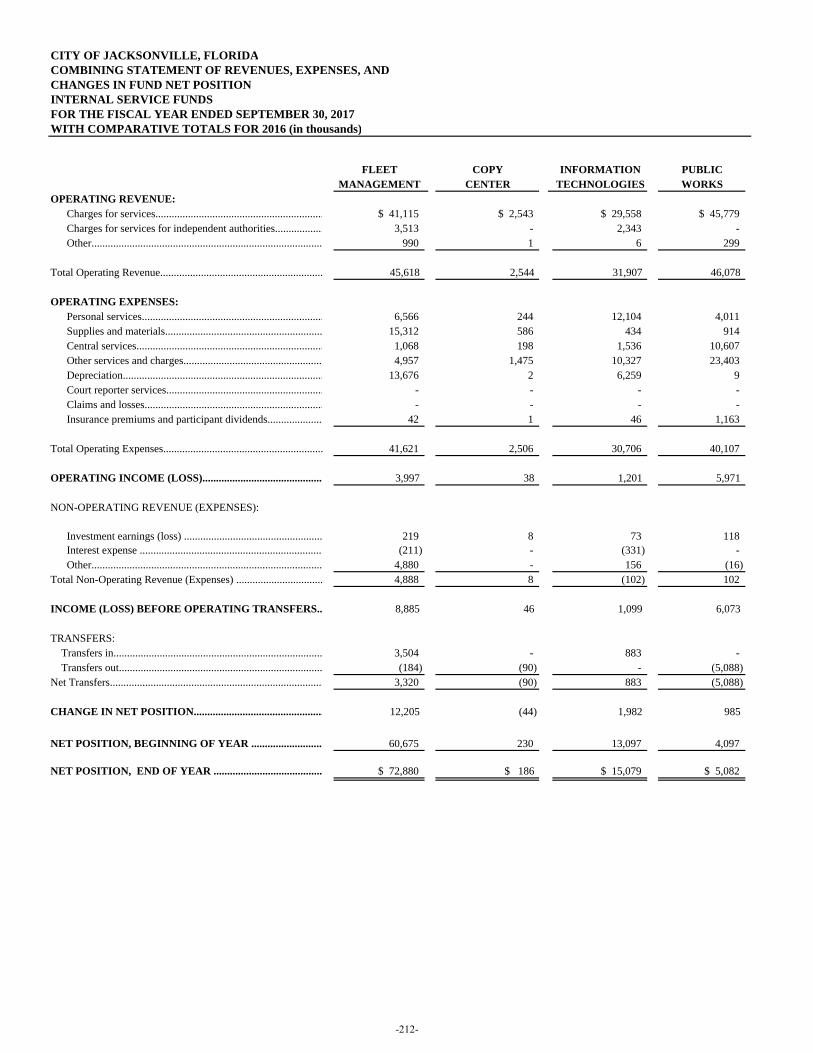
CITY OF JACKSONVILLE, FLORIDACOMBINING STATEMENT OF REVENUES, EXPENSES, ANDCHANGES IN FUND NET POSITIONINTERNAL SERVICE FUNDSFOR THE FISCAL YEAR ENDED SEPTEMBER 30, 2017WITH COMPARATIVE TOTALS FOR 2016 (in thousands)
FLEET COPY INFORMATION PUBLICMANAGEMENT CENTER TECHNOLOGIES WORKS
OPERATING REVENUE: Charges for services.............................................................. $ 41,115 $ 2,543 $ 29,558 $ 45,779 Charges for services for independent authorities.................. 3,513 - 2,343 - Other..................................................................................... 990 1 6 299
Total Operating Revenue............................................................ 45,618 2,544 31,907 46,078
OPERATING EXPENSES: Personal services................................................................... 6,566 244 12,104 4,011 Supplies and materials.......................................................... 15,312 586 434 914 Central services..................................................................... 1,068 198 1,536 10,607 Other services and charges.................................................... 4,957 1,475 10,327 23,403 Depreciation.......................................................................... 13,676 2 6,259 9 Court reporter services.......................................................... - - - - Claims and losses.................................................................. - - - - Insurance premiums and participant dividends..................... 42 1 46 1,163
Total Operating Expenses........................................................... 41,621 2,506 30,706 40,107
OPERATING INCOME (LOSS)............................................. 3,997 38 1,201 5,971
NON-OPERATING REVENUE (EXPENSES):
Investment earnings (loss) ................................................... 219 8 73 118 Interest expense .................................................................... (211) - (331) - Other..................................................................................... 4,880 - 156 (16) Total Non-Operating Revenue (Expenses) ................................ 4,888 8 (102) 102
INCOME (LOSS) BEFORE OPERATING TRANSFERS.. 8,885 46 1,099 6,073
TRANSFERS: Transfers in............................................................................. 3,504 - 883 - Transfers out........................................................................... (184) (90) - (5,088) Net Transfers............................................................................... 3,320 (90) 883 (5,088)
CHANGE IN NET POSITION................................................ 12,205 (44) 1,982 985
NET POSITION, BEGINNING OF YEAR ........................... 60,675 230 13,097 4,097
NET POSITION, END OF YEAR ......................................... $ 72,880 $ 186 $ 15,079 $ 5,082
-212-
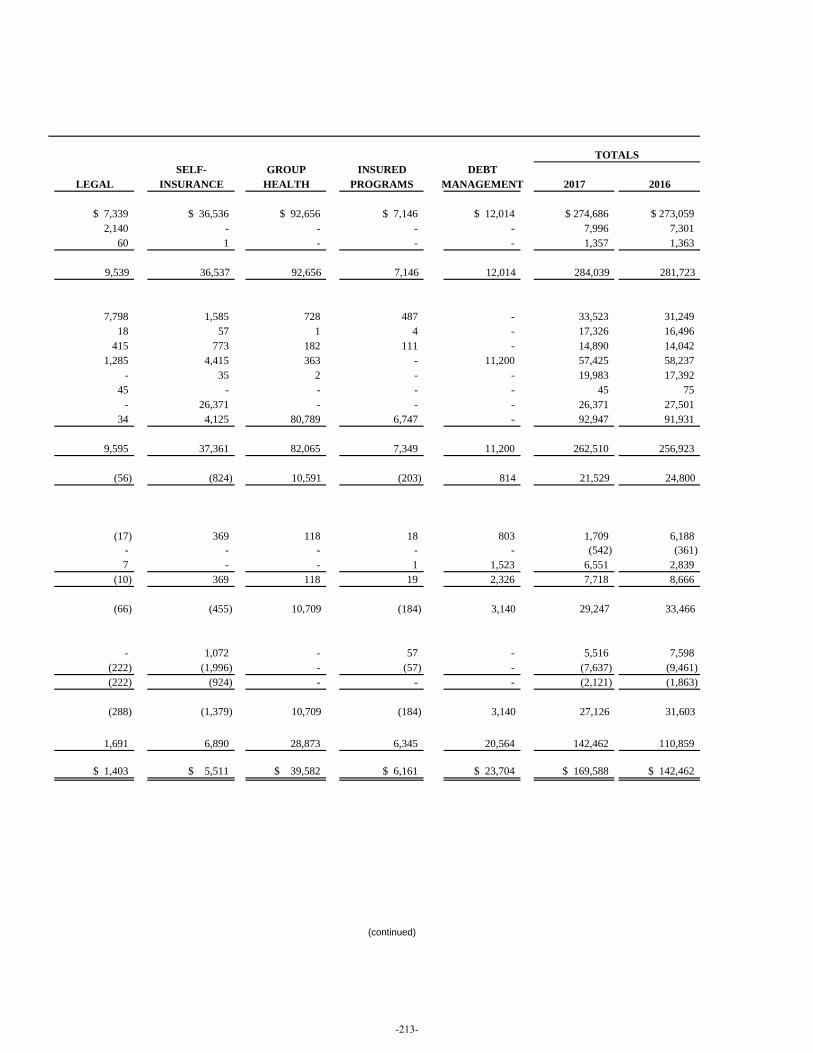
TOTALSSELF- GROUP INSURED DEBT
LEGAL INSURANCE HEALTH PROGRAMS MANAGEMENT 2017 2016
$ 7,339 $ 36,536 $ 92,656 $ 7,146 $ 12,014 $ 274,686 $ 273,0592,140 - - - - 7,996 7,301
60 1 - - - 1,357 1,363
9,539 36,537 92,656 7,146 12,014 284,039 281,723
7,798 1,585 728 487 - 33,523 31,249 18 57 1 4 - 17,326 16,496
415 773 182 111 - 14,890 14,042 1,285 4,415 363 - 11,200 57,425 58,237
- 35 2 - - 19,983 17,392 45 - - - - 45 75
- 26,371 - - - 26,371 27,501 34 4,125 80,789 6,747 - 92,947 91,931
9,595 37,361 82,065 7,349 11,200 262,510 256,923
(56) (824) 10,591 (203) 814 21,529 24,800
(17) 369 118 18 803 1,709 6,188 - - - - - (542) (361) 7 - - 1 1,523 6,551 2,839
(10) 369 118 19 2,326 7,718 8,666
(66) (455) 10,709 (184) 3,140 29,247 33,466
- 1,072 - 57 - 5,516 7,598 (222) (1,996) - (57) - (7,637) (9,461) (222) (924) - - - (2,121) (1,863)
(288) (1,379) 10,709 (184) 3,140 27,126 31,603
1,691 6,890 28,873 6,345 20,564 142,462 110,859
$ 1,403 $ 5,511 $ 39,582 $ 6,161 $ 23,704 $ 169,588 $ 142,462
(continued)
-213-
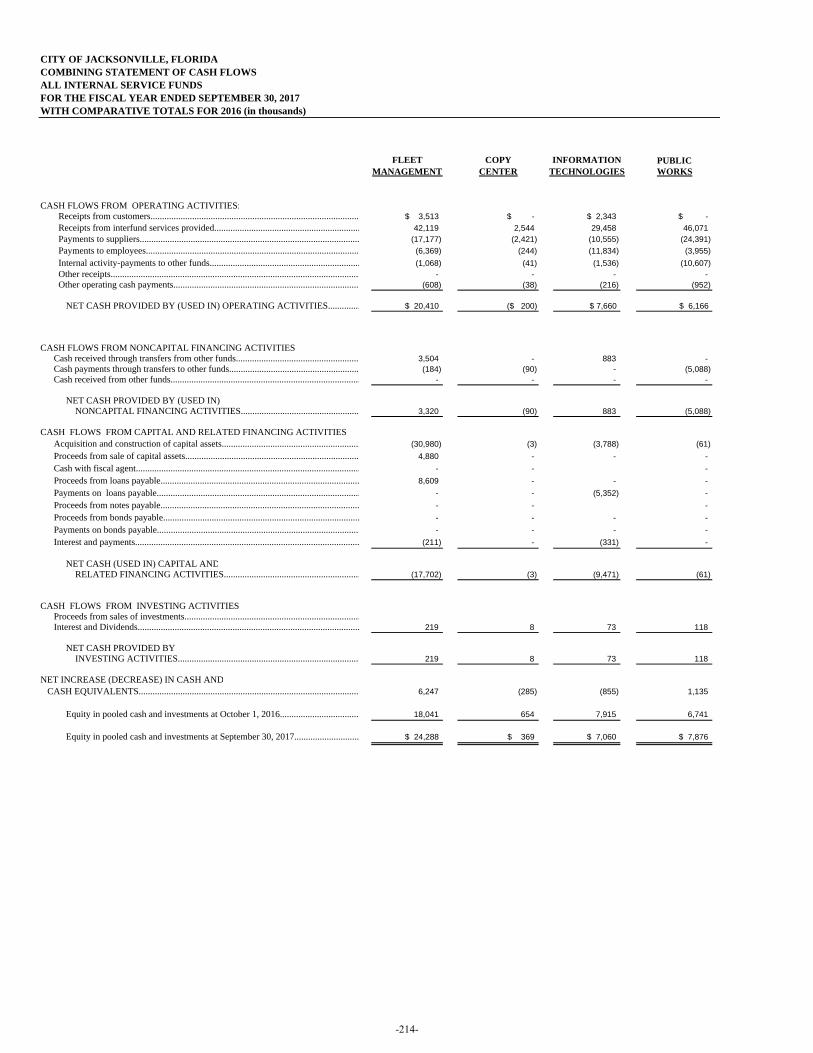
CITY OF JACKSONVILLE, FLORIDACOMBINING STATEMENT OF CASH FLOWS ALL INTERNAL SERVICE FUNDSFOR THE FISCAL YEAR ENDED SEPTEMBER 30, 2017WITH COMPARATIVE TOTALS FOR 2016 (in thousands)
FLEET COPY INFORMATION PUBLICMANAGEMENT CENTER TECHNOLOGIES WORKS
CASH FLOWS FROM OPERATING ACTIVITIES: Receipts from customers.......................................................................................... $ 3,513 $ - $ 2,343 $ - Receipts from interfund services provided............................................................... 42,119 2,544 29,458 46,071 Payments to suppliers............................................................................................... (17,177) (2,421) (10,555) (24,391) Payments to employees............................................................................................ (6,369) (244) (11,834) (3,955) Internal activity-payments to other funds................................................................. (1,068) (41) (1,536) (10,607) Other receipts............................................................................................................ - - - - Other operating cash payments................................................................................. (608) (38) (216) (952)
NNET CASH PROVIDED BY (USED IN) OPERATING ACTIVITIES.............. $ 20,410 ($ 200) $ 7,660 $ 6,166
CASH FLOWS FROM NONCAPITAL FINANCING ACTIVITIES Cash received through transfers from other funds...................................................... 3,504 - 883 - Cash payments through transfers to other funds........................................................ (184) (90) - (5,088) Cash received from other funds.................................................................................. - - - -
NET CASH PROVIDED BY (USED IN) NONCAPITAL FINANCING ACTIVITIES................................................... 3,320 (90) 883 (5,088)
CASH FLOWS FROM CAPITAL AND RELATED FINANCING ACTIVITIESAcquisition and construction of capital assets............................................................ (30,980) (3) (3,788) (61) Proceeds from sale of capital assets........................................................................... 4,880 - - - Cash with fiscal agent................................................................................................. - - - Proceeds from loans payable...................................................................................... 8,609 - - - Payments on loans payable........................................................................................ - - (5,352) - Proceeds from notes payable...................................................................................... - - - Proceeds from bonds payable..................................................................................... - - - - Payments on bonds payable........................................................................................ - - - - Interest and payments................................................................................................. (211) - (331) -
NET CASH (USED IN) CAPITAL AND RELATED FINANCING ACTIVITIES........................................................... (17,702) (3) (9,471) (61)
CASH FLOWS FROM INVESTING ACTIVITIES:Proceeds from sales of investments............................................................................ Interest and Dividends................................................................................................ 219 8 73 118
NET CASH PROVIDED BY INVESTING ACTIVITIES............................................................................... 219 8 73 118
NET INCREASE (DECREASE) IN CASH AND CASH EQUIVALENTS................................................................................................ 6,247 (285) (855) 1,135
Equity in pooled cash and investments at October 1, 2016................................... 18,041 654 7,915 6,741
Equity in pooled cash and investments at September 30, 2017............................ $ 24,288 $ 369 $ 7,060 $ 7,876
-214-
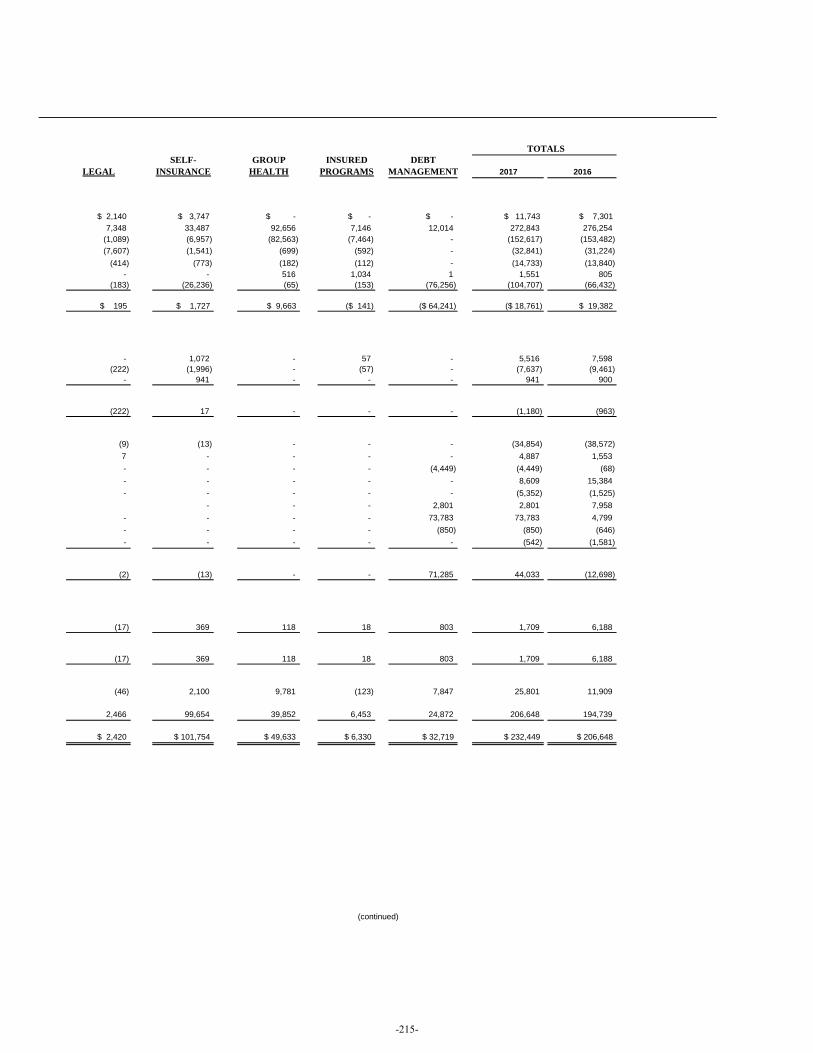
TOTALSSELF- GROUP INSURED DEBT
LEGAL INSURANCE HEALTH PROGRAMS MANAGEMENT 2017 2016
$ 2,140 $ 3,747 $ - $ - $ - $ 11,743 $ 7,301 7,348 33,487 92,656 7,146 12,014 272,843 276,254
(1,089) (6,957) (82,563) (7,464) - (152,617) (153,482) (7,607) (1,541) (699) (592) - (32,841) (31,224)
(414) (773) (182) (112) - (14,733) (13,840) - - 516 1,034 1 1,551 805
(183) (26,236) (65) (153) (76,256) (104,707) (66,432)
$ 195 $ 1,727 $ 9,663 ($ 141) ($ 64,241) ($ 18,761) $ 19,382
- 1,072 - 57 - 5,516 7,598 (222) (1,996) - (57) - (7,637) (9,461)
- 941 - - - 941 900
(222) 17 - - - (1,180) (963)
(9) (13) - - - (34,854) (38,572) 7 - - - - 4,887 1,553 - - - - (4,449) (4,449) (68) - - - - - 8,609 15,384 - - - - - (5,352) (1,525)
- - - 2,801 2,801 7,958 - - - - 73,783 73,783 4,799 - - - - (850) (850) (646) - - - - - (542) (1,581)
(2) (13) - - 71,285 44,033 (12,698)
(17) 369 118 18 803 1,709 6,188
(17) 369 118 18 803 1,709 6,188
(46) 2,100 9,781 (123) 7,847 25,801 11,909
2,466 99,654 39,852 6,453 24,872 206,648 194,739
$ 2,420 $ 101,754 $ 49,633 $ 6,330 $ 32,719 $ 232,449 $ 206,648
(continued)
-215-
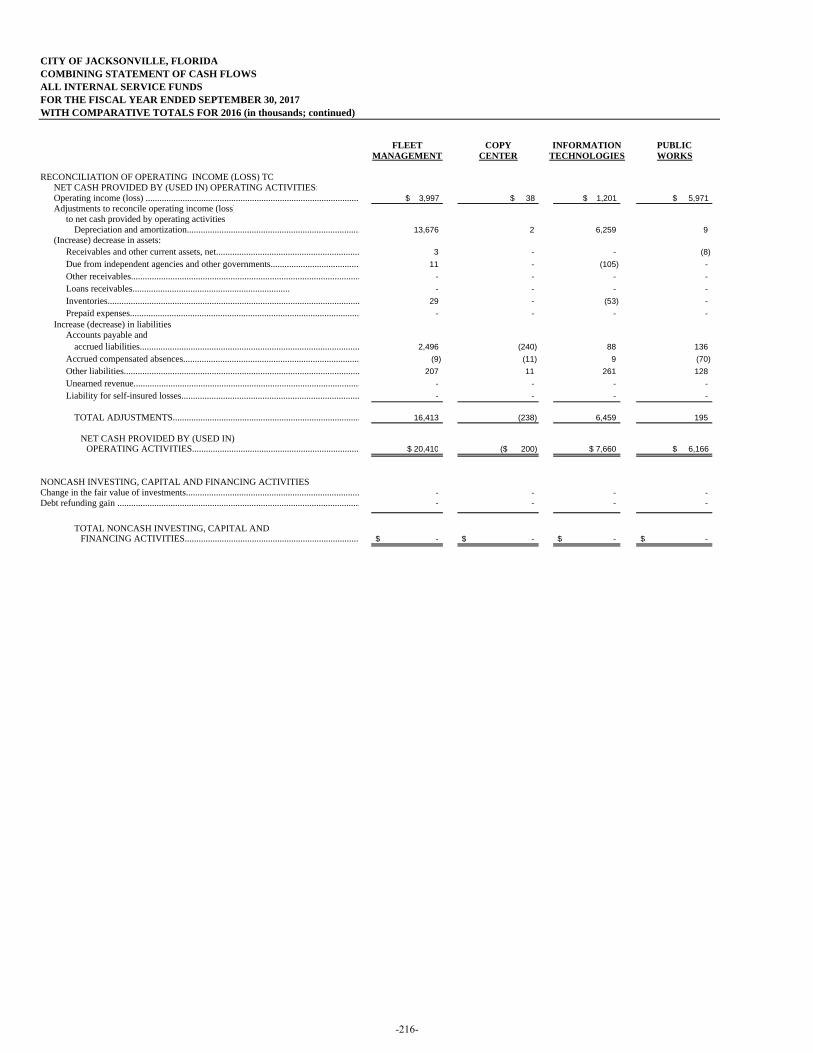
CITY OF JACKSONVILLE, FLORIDA COMBINING STATEMENT OF CASH FLOWS ALL INTERNAL SERVICE FUNDSFOR THE FISCAL YEAR ENDED SEPTEMBER 30, 2017WITH COMPARATIVE TOTALS FOR 2016 (in thousands; continued)
FLEET COPY INFORMATION PUBLICMANAGEMENT CENTER TECHNOLOGIES WORKS
RECONCILIATION OF OPERATING INCOME (LOSS) TO NET CASH PROVIDED BY (USED IN) OPERATING ACTIVITIES:Operating income (loss) ............................................................................................. $ 3,997 $ 38 $ 1,201 $ 5,971 Adjustments to reconcile operating income (loss)
to net cash provided by operating activities: Depreciation and amortization........................................................................... 13,676 2 6,259 9
(Increase) decrease in assets:Receivables and other current assets, net.............................................................. 3 - - (8) Due from independent agencies and other governments....................................... 11 - (105) - Other receivables................................................................................................... - - - - Loans receivables.................................................................... - - - - Inventories............................................................................................................. 29 - (53) - Prepaid expenses................................................................................................... - - - -
Increase (decrease) in liabilities:Accounts payable and
accrued liabilities............................................................................................... 2,496 (240) 88 136 Accrued compensated absences............................................................................ (9) (11) 9 (70) Other liabilities...................................................................................................... 207 11 261 128 Unearned revenue.................................................................................................. - - - - Liability for self-insured losses............................................................................. - - - -
TOTAL ADJUSTMENTS................................................................................. 16,413 (238) 6,459 195
NET CASH PROVIDED BY (USED IN) OPERATING ACTIVITIES........................................................................ $ 20,410 ($ 200) $ 7,660 $ 6,166
NONCASH INVESTING, CAPITAL AND FINANCING ACTIVITIES:Change in the fair value of investments........................................................................... - - - - Debt refunding gain ......................................................................................................... - - - - Change in capital lease obligations.......................................................................................
TOTAL NONCASH INVESTING, CAPITAL AND
FINANCING ACTIVITIES............................................................................ -$ -$ -$ -$
-216-
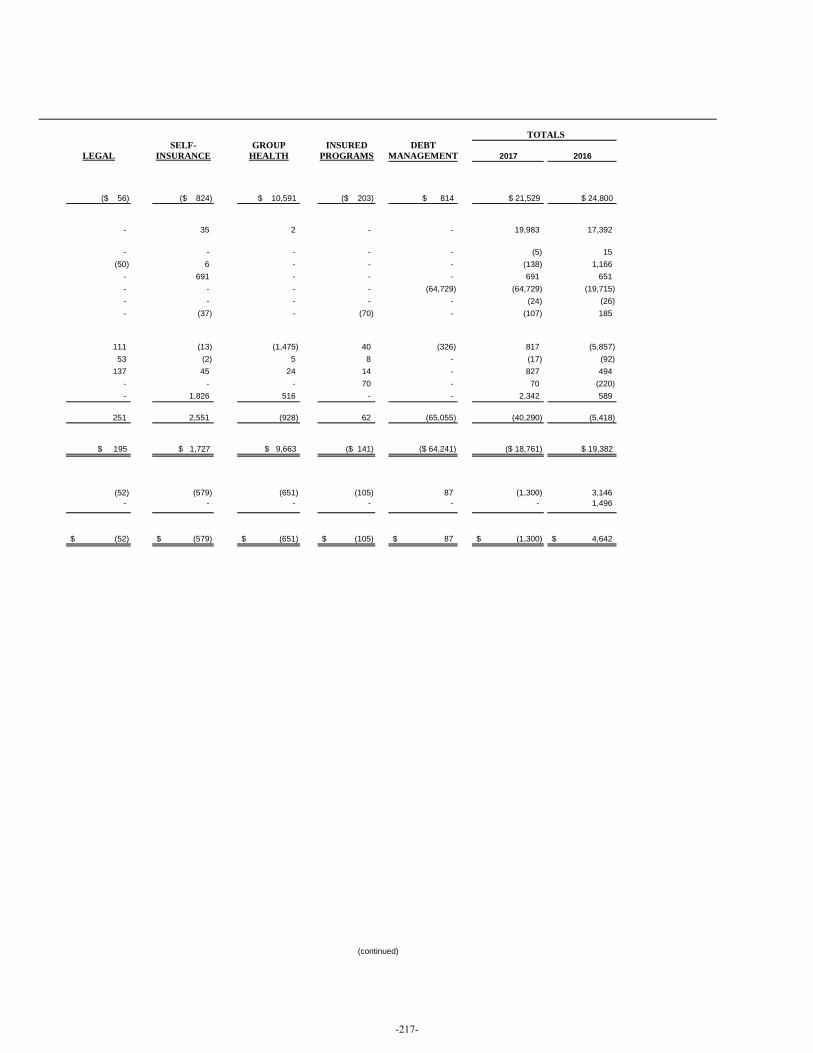
TOTALSSELF- GROUP INSURED DEBT
LEGAL INSURANCE HEALTH PROGRAMS MANAGEMENT 2017 2016
($ 56) ($ 824) $ 10,591 ($ 203) $ 814 $ 21,529 $ 24,800
- 35 2 - - 19,983 17,392
- - - - - (5) 15 (50) 6 - - - (138) 1,166
- 691 - - - 691 651 - - - - (64,729) (64,729) (19,715) - - - - - (24) (26) - (37) - (70) - (107) 185
111 (13) (1,475) 40 (326) 817 (5,857) 53 (2) 5 8 - (17) (92)
137 45 24 14 - 827 494 - - - 70 - 70 (220) - 1,826 516 - - 2,342 589
251 2,551 (928) 62 (65,055) (40,290) (5,418)
$ 195 $ 1,727 $ 9,663 ($ 141) ($ 64,241) ($ 18,761) $ 19,382
(52) (579) (651) (105) 87 (1,300) 3,146 - - - - - - 1,496
(52)$ (579)$ (651)$ (105)$ 87$ (1,300)$ 4,642$
(continued)
-217-

(This page is intentionally left blank.)
-218-
FIDUCIARY FUNDS Fiduciary Funds account for assets held by the City in a trustee capacity or as an agent for individuals, private organizations, other governmental units and/or other funds. Below are descriptions of the generic fund types within this category and specific funds within each fund type.
PENSION TRUST FUNDS are funds administered by independent boards for which the City performs a fiduciary role under a defined benefit, defined contribution and disability programs. The participant's retirement annuity is based on a statutory formula utilizing such factors as age, average salary, length of service and others. The City has two pension trust funds as described below.
The Jacksonville Retirement System Fund includes resources accumulated to pay present and future retirement annuities to eligible employees of the City except for sworn officers of the Office of the Sheriff and the firefighters in the Department of Fire and Rescue. The Police and Fire Pension Trust Fund accounts for a single employer, contributory defined benefit plan for City police officers and firefighters.
AGENCY FUNDS are funds which hold monies in an agency capacity for various government units, individuals or funds. Individual fund descriptions follow.
The Treasurer Fund is the clearing fund used to account for all cash received and disbursed on behalf of the City's payroll. The Tax Collector Fund accounts for assets and liabilities from the collection of all taxes, revenues and other cash amounts on behalf of the City and various of its agencies, authorities, organizations, individuals, and funds. Clerk of the Circuit Court accounts for assets and liabilities from revenues collected on behalf of the state and the city by the court system for various judgments, fines, bonds, fees and licenses and other miscellaneous amounts. Plat Deposits Fund accounts for the deposits placed with the City as collateral to insure the completion of improvements in the event of default by a developer or failure by the developer to complete improvements within the time specified by the ordinance approving the Final Plat. The Duval County School Readiness Coalition Fund accounts for the assets and liabilities from revenues collected on behalf of the Duval County School Readiness Coalition from the State, pursuant to Florida Statute 411.01, to provide comprehensive programs of readiness services to children. The Florida Retirement System Fund accounts for a multiple-employer, cost-sharing defined benefit plan for certain City employees who elected to remain with the State of Florida Retirement System.
The Office of the Sheriff accounts for deposits held in accordance with statutes for civil action, safeguarding of monetary evidence, and inmate funds.
-219-
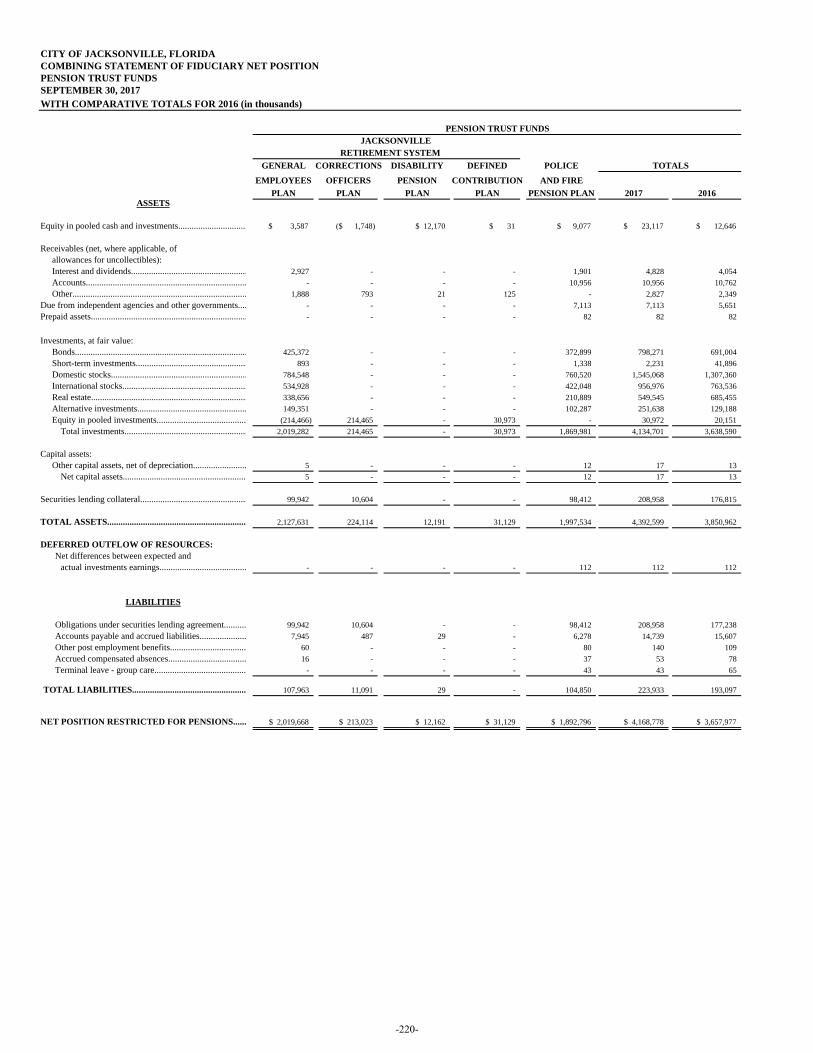
CITY OF JACKSONVILLE, FLORIDACOMBINING STATEMENT OF FIDUCIARY NET POSITION PENSION TRUST FUNDSSEPTEMBER 30, 2017WITH COMPARATIVE TOTALS FOR 2016 (in thousands)
GENERAL CORRECTIONS DISABILITY DEFINED POLICE TOTALS
EMPLOYEES OFFICERS PENSION CONTRIBUTION AND FIREPLAN PLAN PLAN PLAN PENSION PLAN 2017 2016
ASSETS
Equity in pooled cash and investments............................... $ 3,587 ($ 1,748) $ 12,170 $ 31 $ 9,077 $ 23,117 $ 12,646
Receivables (net, where applicable, ofallowances for uncollectibles):Interest and dividends.................................................... 2,927 - - - 1,901 4,828 4,054 Accounts........................................................................ - - - - 10,956 10,956 10,762 Other.............................................................................. 1,888 793 21 125 - 2,827 2,349
Due from independent agencies and other governments.... - - - - 7,113 7,113 5,651 Prepaid assets...................................................................... - - - - 82 82 82
Investments, at fair value:Bonds............................................................................. 425,372 - - - 372,899 798,271 691,004 Short-term investments.................................................. 893 - - - 1,338 2,231 41,896 Domestic stocks............................................................. 784,548 - - - 760,520 1,545,068 1,307,360 International stocks........................................................ 534,928 - - - 422,048 956,976 763,536 Real estate...................................................................... 338,656 - - - 210,889 549,545 685,455 Alternative investments................................................. 149,351 - - - 102,287 251,638 129,188 Equity in pooled investments........................................ (214,466) 214,465 - 30,973 - 30,972 20,151
Total investments....................................................... 2,019,282 214,465 - 30,973 1,869,981 4,134,701 3,638,590
Capital assets:Other capital assets, net of depreciation........................ 5 - - - 12 17 13
Net capital assets....................................................... 5 - - - 12 17 13
Securities lending collateral................................................ 99,942 10,604 - - 98,412 208,958 176,815
TOTAL ASSETS.............................................................. 2,127,631 224,114 12,191 31,129 1,997,534 4,392,599 3,850,962
DEFERRED OUTFLOW OF RESOURCES:Net differences between expected and
actual investments earnings....................................... - - - - 112 112 112
LIABILITIES
Obligations under securities lending agreement.......... 99,942 10,604 - - 98,412 208,958 177,238 Accounts payable and accrued liabilities..................... 7,945 487 29 - 6,278 14,739 15,607 Other post employment benefits.................................. 60 - - - 80 140 109 Accrued compensated absences................................... 16 - - - 37 53 78 Terminal leave - group care......................................... - - - - 43 43 65
TOTAL LIABILITIES................................................... 107,963 11,091 29 - 104,850 223,933 193,097
NET POSITION RESTRICTED FOR PENSIONS...... $ 2,019,668 $ 213,023 $ 12,162 $ 31,129 $ 1,892,796 $ 4,168,778 $ 3,657,977
PENSION TRUST FUNDS JACKSONVILLE
RETIREMENT SYSTEM
-220-
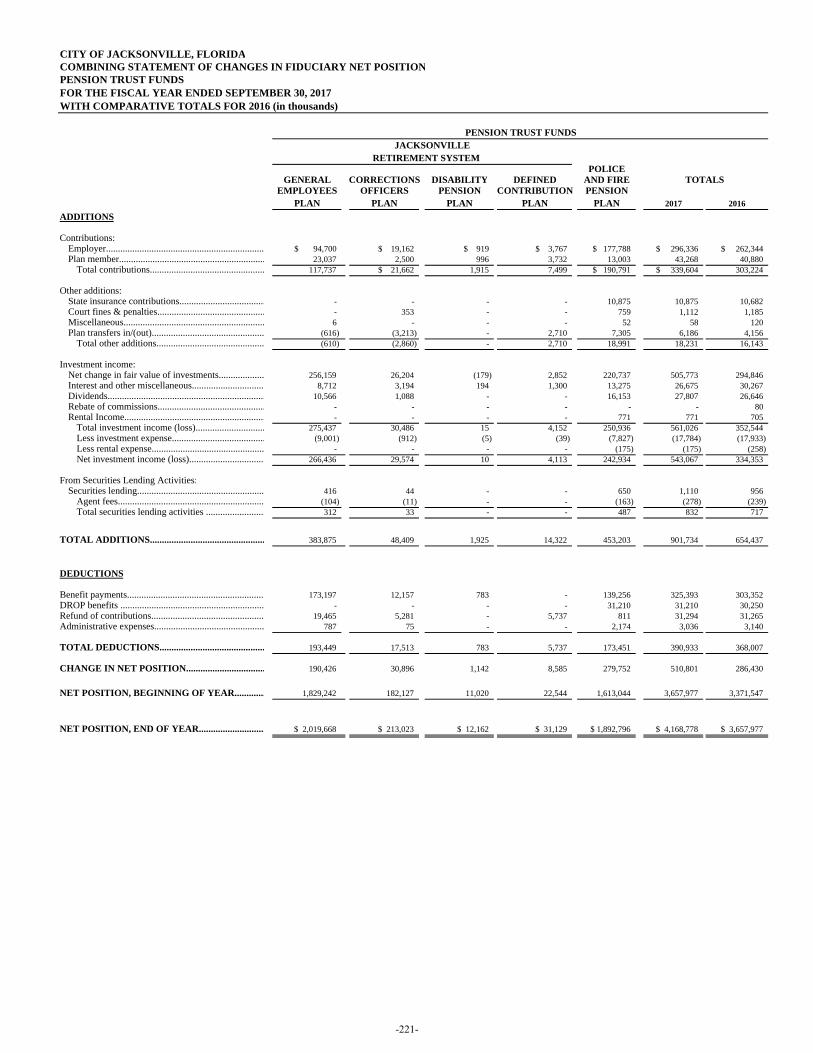
CITY OF JACKSONVILLE, FLORIDACOMBINING STATEMENT OF CHANGES IN FIDUCIARY NET POSITIONPENSION TRUST FUNDSFOR THE FISCAL YEAR ENDED SEPTEMBER 30, 2017WITH COMPARATIVE TOTALS FOR 2016 (in thousands)
POLICEGENERAL CORRECTIONS DISABILITY DEFINED AND FIRE TOTALS
EMPLOYEES OFFICERS PENSION CONTRIBUTION PENSIONPLAN PLAN PLAN PLAN PLAN 2017 2016
ADDITIONS
Contributions:Employer.................................................................. $ 94,700 $ 19,162 $ 919 $ 3,767 $ 177,788 $ 296,336 $ 262,344Plan member............................................................. 23,037 2,500 996 3,732 13,003 43,268 40,880
Total contributions................................................ 117,737 $ 21,662 1,915 7,499 $ 190,791 $ 339,604 303,224
Other additions: State insurance contributions.................................... - - - - 10,875 10,875 10,682 Court fines & penalties............................................. - 353 - - 759 1,112 1,185 Miscellaneous........................................................... 6 - - - 52 58 120 Plan transfers in/(out)............................................... (616) (3,213) - 2,710 7,305 6,186 4,156
Total other additions............................................. (610) (2,860) - 2,710 18,991 18,231 16,143
Investment income:Net change in fair value of investments................... 256,159 26,204 (179) 2,852 220,737 505,773 294,846 Interest and other miscellaneous.............................. 8,712 3,194 194 1,300 13,275 26,675 30,267 Dividends.................................................................. 10,566 1,088 - - 16,153 27,807 26,646 Rebate of commissions............................................. - - - - - - 80 Rental Income........................................................... - - - - 771 771 705
Total investment income (loss)............................. 275,437 30,486 15 4,152 250,936 561,026 352,544 Less investment expense....................................... (9,001) (912) (5) (39) (7,827) (17,784) (17,933) Less rental expense............................................... - - - - (175) (175) (258) Net investment income (loss)............................... 266,436 29,574 10 4,113 242,934 543,067 334,353
From Securities Lending Activities:Securities lending..................................................... 416 44 - - 650 1,110 956
Agent fees............................................................. (104) (11) - - (163) (278) (239) Total securities lending activities ........................ 312 33 - - 487 832 717
TOTAL ADDITIONS................................................ 383,875 48,409 1,925 14,322 453,203 901,734 654,437
DEDUCTIONS
Benefit payments......................................................... 173,197 12,157 783 - 139,256 325,393 303,352 DROP benefits ............................................................ - - - - 31,210 31,210 30,250 Refund of contributions............................................... 19,465 5,281 - 5,737 811 31,294 31,265 Administrative expenses.............................................. 787 75 - - 2,174 3,036 3,140
TOTAL DEDUCTIONS............................................ 193,449 17,513 783 5,737 173,451 390,933 368,007
CHANGE IN NET POSITION................................. 190,426 30,896 1,142 8,585 279,752 510,801 286,430
NET POSITION, BEGINNING OF YEAR............. 1,829,242 182,127 11,020 22,544 1,613,044 3,657,977 3,371,547
NET POSITION, END OF YEAR............................ $ 2,019,668 $ 213,023 $ 12,162 $ 31,129 $ 1,892,796 $ 4,168,778 $ 3,657,977
PENSION TRUST FUNDS
RETIREMENT SYSTEM JACKSONVILLE
-221-
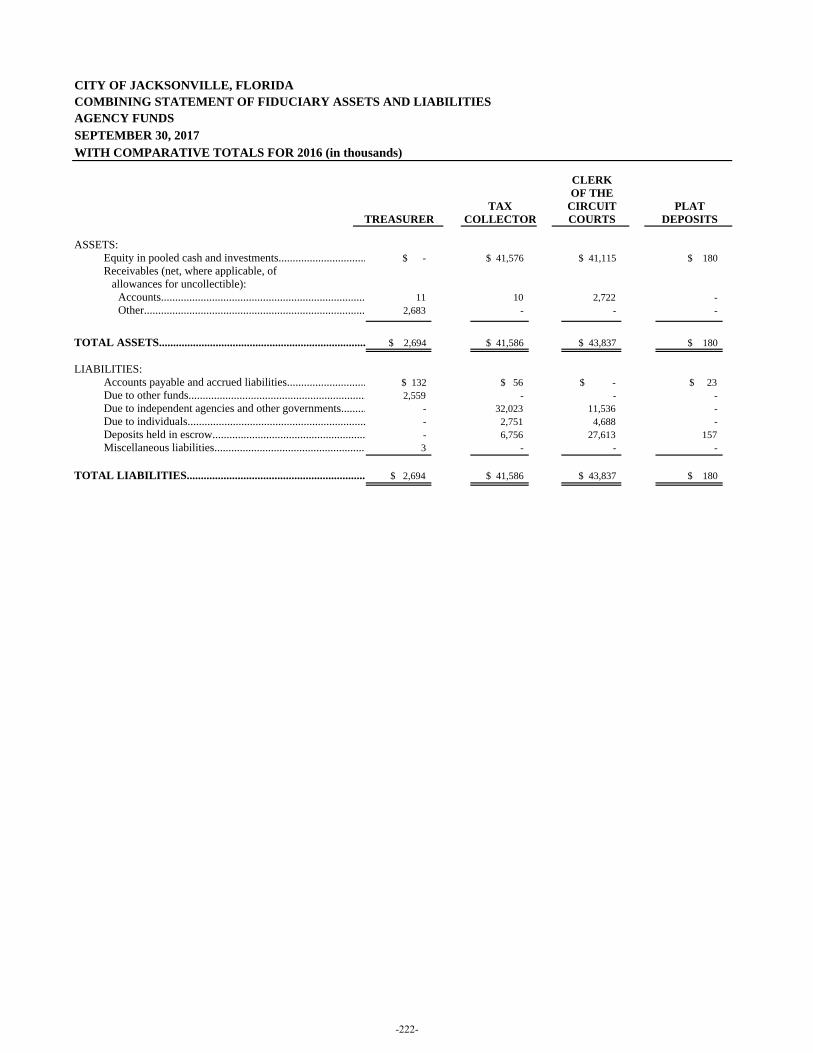
CITY OF JACKSONVILLE, FLORIDACOMBINING STATEMENT OF FIDUCIARY ASSETS AND LIABILITIESAGENCY FUNDSSEPTEMBER 30, 2017WITH COMPARATIVE TOTALS FOR 2016 (in thousands)
CLERKOF THE
TAX CIRCUIT PLATTREASURER COLLECTOR COURTS DEPOSITS
ASSETS:Equity in pooled cash and investments............................... $ - $ 41,576 $ 41,115 $ 180 Receivables (net, where applicable, of
allowances for uncollectible):Accounts........................................................................ 11 10 2,722 - Other.............................................................................. 2,683 - - -
TOTAL ASSETS......................................................................... $ 2,694 $ 41,586 $ 43,837 $ 180
LIABILITIES:Accounts payable and accrued liabilities............................ $ 132 $ 56 $ - $ 23Due to other funds............................................................... 2,559 - - - Due to independent agencies and other governments......... - 32,023 11,536 - Due to individuals............................................................... - 2,751 4,688 - Deposits held in escrow...................................................... - 6,756 27,613 157 Miscellaneous liabilities...................................................... 3 - - -
TOTAL LIABILITIES............................................................... $ 2,694 $ 41,586 $ 43,837 $ 180
-222-
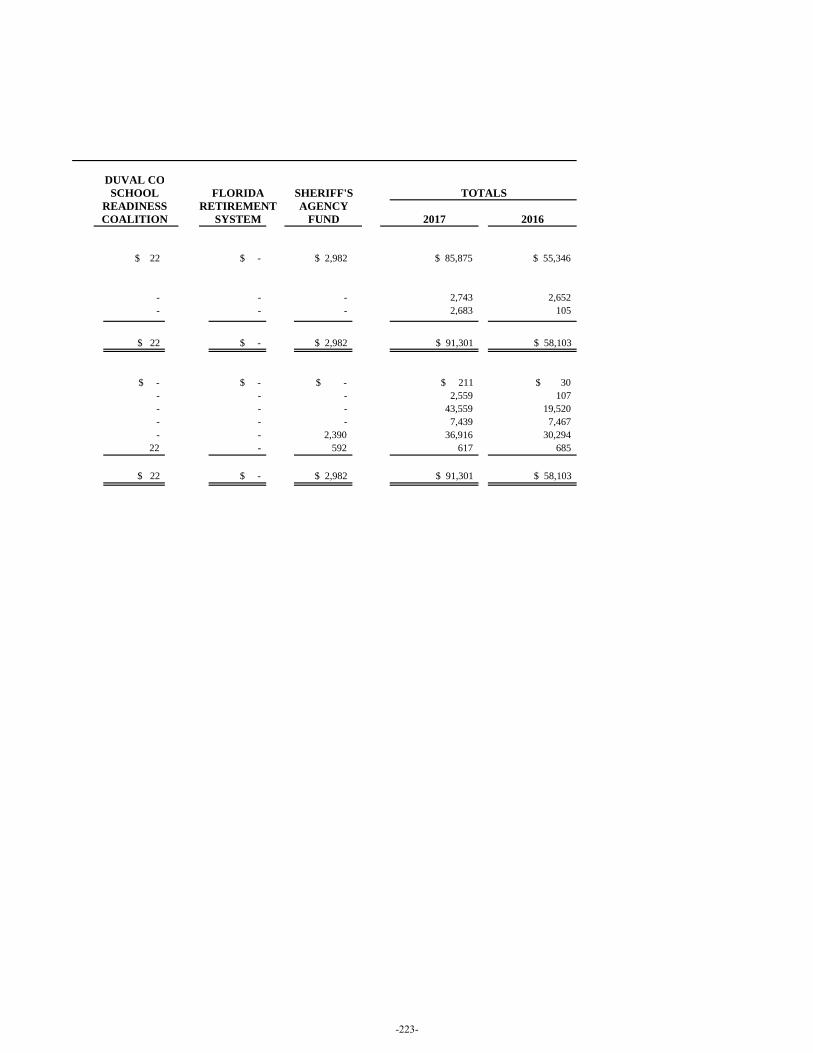
DUVAL COSCHOOL FLORIDA SHERIFF'S TOTALS
READINESS RETIREMENT AGENCYCOALITION SYSTEM FUND 2017 2016
$ 22 $ - $ 2,982 $ 85,875 $ 55,346
- - - 2,743 2,652 - - - 2,683 105
$ 22 $ - $ 2,982 $ 91,301 $ 58,103
$ - $ - $ - $ 211 $ 30- - - 2,559 107 - - - 43,559 19,520 - - - 7,439 7,467 - - 2,390 36,916 30,294
22 - 592 617 685
$ 22 $ - $ 2,982 $ 91,301 $ 58,103
-223-
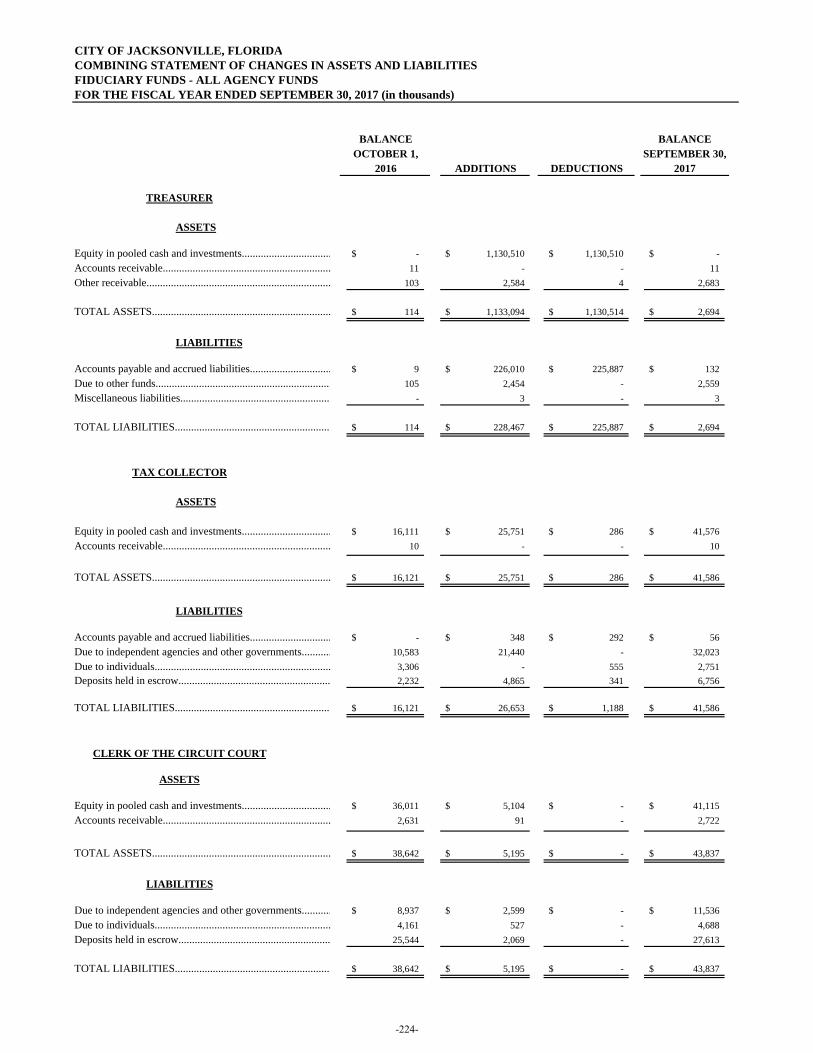
CITY OF JACKSONVILLE, FLORIDACOMBINING STATEMENT OF CHANGES IN ASSETS AND LIABILITIESFIDUCIARY FUNDS - ALL AGENCY FUNDS FOR THE FISCAL YEAR ENDED SEPTEMBER 30, 2017 (in thousands)
BALANCE BALANCEOCTOBER 1, SEPTEMBER 30,
2016 ADDITIONS DEDUCTIONS 2017
TREASURER
ASSETS
Equity in pooled cash and investments................................. -$ 1,130,510$ 1,130,510$ -$ Accounts receivable.............................................................. 11 - - 11Other receivable.................................................................... 103 2,584 4 2,683
TOTAL ASSETS.................................................................. 114$ 1,133,094$ 1,130,514$ 2,694$
LIABILITIES
Accounts payable and accrued liabilities.............................. 9$ 226,010$ 225,887$ 132$ Due to other funds................................................................. 105 2,454 - 2,559Miscellaneous liabilities........................................................ - 3 - 3
TOTAL LIABILITIES.......................................................... 114$ 228,467$ 225,887$ 2,694$
TAX COLLECTOR
ASSETS
Equity in pooled cash and investments................................. 16,111$ 25,751$ 286$ 41,576$ Accounts receivable.............................................................. 10 - - 10
TOTAL ASSETS.................................................................. 16,121$ 25,751$ 286$ 41,586$
LIABILITIES
Accounts payable and accrued liabilities.............................. -$ 348$ 292$ 56$ Due to independent agencies and other governments........... 10,583 21,440 - 32,023Due to individuals................................................................. 3,306 - 555 2,751Deposits held in escrow........................................................ 2,232 4,865 341 6,756
TOTAL LIABILITIES.......................................................... 16,121$ 26,653$ 1,188$ 41,586$
CLERK OF THE CIRCUIT COURT
ASSETS
Equity in pooled cash and investments................................. 36,011$ 5,104$ -$ 41,115$ Accounts receivable.............................................................. 2,631 91 - 2,722 Ot e ece vab e....................................................................
TOTAL ASSETS.................................................................. 38,642$ 5,195$ -$ 43,837$
LIABILITIES
Due to independent agencies and other governments........... 8,937$ 2,599$ -$ 11,536$ Due to individuals................................................................. 4,161 527 - 4,688 Deposits held in escrow........................................................ 25,544 2,069 - 27,613
TOTAL LIABILITIES.......................................................... 38,642$ 5,195$ -$ 43,837$
-224-
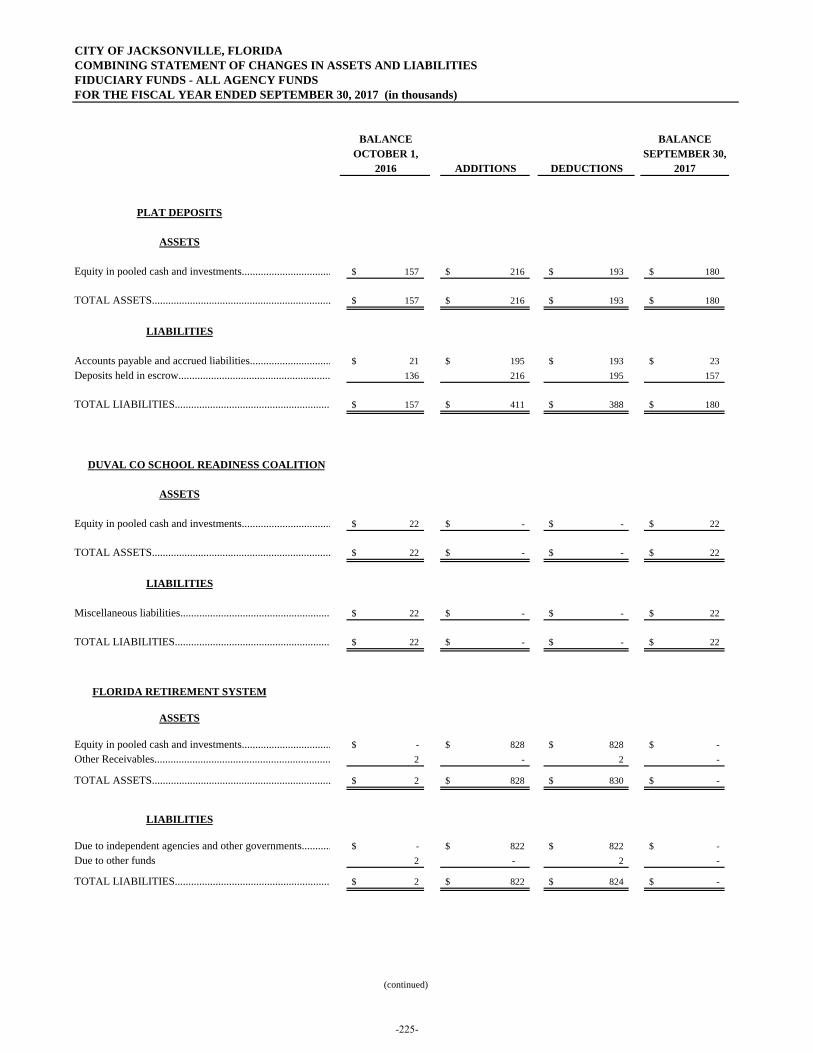
CITY OF JACKSONVILLE, FLORIDACOMBINING STATEMENT OF CHANGES IN ASSETS AND LIABILITIESFIDUCIARY FUNDS - ALL AGENCY FUNDSFOR THE FISCAL YEAR ENDED SEPTEMBER 30, 2017 (in thousands)
BALANCE BALANCEOCTOBER 1, SEPTEMBER 30,
2016 ADDITIONS DEDUCTIONS 2017
PLAT DEPOSITS
ASSETS
Equity in pooled cash and investments................................. 157$ 216$ 193$ 180$
TOTAL ASSETS.................................................................. 157$ 216$ 193$ 180$
LIABILITIES
Accounts payable and accrued liabilities.............................. 21$ 195$ 193$ 23$ Deposits held in escrow........................................................ 136 216 195 157
TOTAL LIABILITIES.......................................................... 157$ 411$ 388$ 180$
DUVAL CO SCHOOL READINESS COALITION
ASSETS
Equity in pooled cash and investments................................. 22$ -$ -$ 22$
TOTAL ASSETS.................................................................. 22$ -$ -$ 22$
LIABILITIES
Miscellaneous liabilities........................................................ 22$ -$ -$ 22$
TOTAL LIABILITIES.......................................................... 22$ -$ -$ 22$
FLORIDA RETIREMENT SYSTEM
ASSETS
Equity in pooled cash and investments................................. -$ 828$ 828$ -$ Other Receivables................................................................. 2 - 2 -
TOTAL ASSETS.................................................................. 2$ 828$ 830$ -$
LIABILITIES
Due to independent agencies and other governments........... -$ 822$ 822$ -$ Due to other funds 2 - 2 -
TOTAL LIABILITIES.......................................................... 2$ 822$ 824$ -$
(continued)
-225-
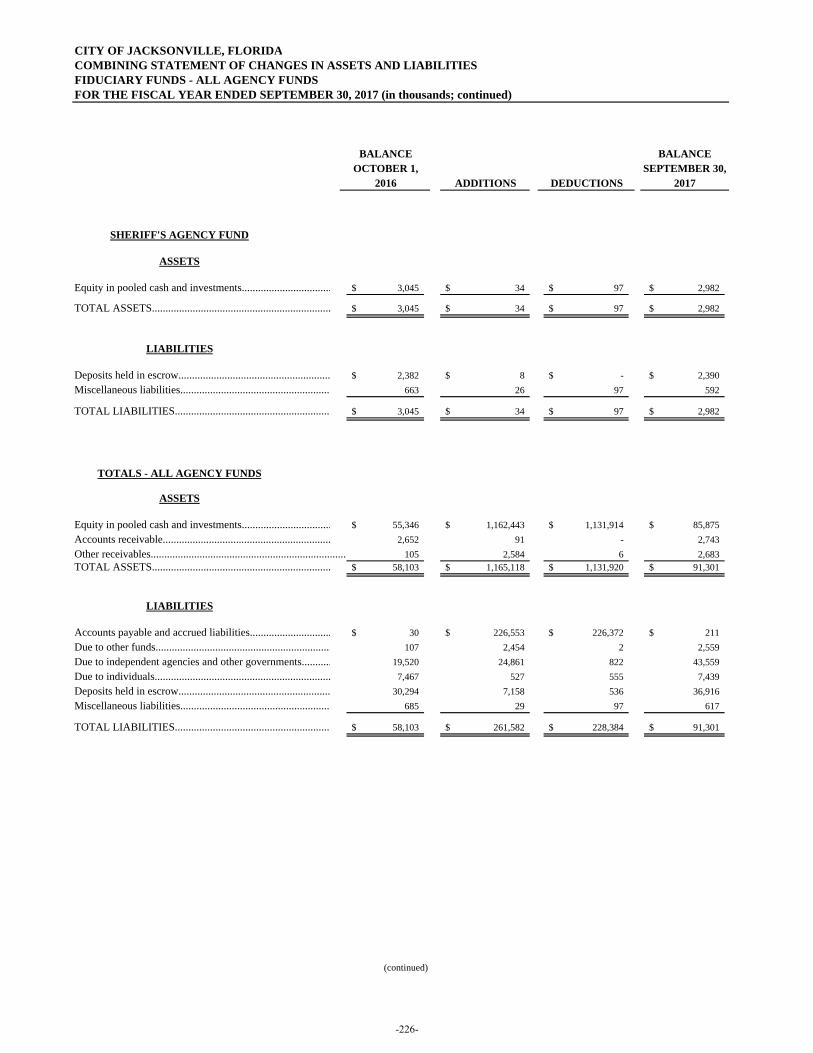
CITY OF JACKSONVILLE, FLORIDACOMBINING STATEMENT OF CHANGES IN ASSETS AND LIABILITIESFIDUCIARY FUNDS - ALL AGENCY FUNDS FOR THE FISCAL YEAR ENDED SEPTEMBER 30, 2017 (in thousands; continued)
BALANCE BALANCEOCTOBER 1, SEPTEMBER 30,
2016 ADDITIONS DEDUCTIONS 2017
SHERIFF'S AGENCY FUND
ASSETS
Equity in pooled cash and investments................................. 3,045$ 34$ 97$ 2,982$
TOTAL ASSETS.................................................................. 3,045$ 34$ 97$ 2,982$
LIABILITIES
Deposits held in escrow........................................................ 2,382$ 8$ -$ 2,390$ Miscellaneous liabilities........................................................ 663 26 97 592
TOTAL LIABILITIES.......................................................... 3,045$ 34$ 97$ 2,982$
TOTALS - ALL AGENCY FUNDS
ASSETS
Equity in pooled cash and investments................................. 55,346$ 1,162,443$ 1,131,914$ 85,875$ Accounts receivable.............................................................. 2,652 91 - 2,743Other receivables........................................................................ 105 2,584 6 2,683TOTAL ASSETS.................................................................. 58,103$ 1,165,118$ 1,131,920$ 91,301$
LIABILITIES
Accounts payable and accrued liabilities.............................. 30$ 226,553$ 226,372$ 211$ Due to other funds................................................................. 107 2,454 2 2,559 Due to independent agencies and other governments........... 19,520 24,861 822 43,559Due to individuals................................................................. 7,467 527 555 7,439Deposits held in escrow........................................................ 30,294 7,158 536 36,916Miscellaneous liabilities........................................................ 685 29 97 617
TOTAL LIABILITIES.......................................................... 58,103$ 261,582$ 228,384$ 91,301$
(continued)
-226-
COMPONENT UNITS Component Units are legally separate organizations for which the primary government is financially accountable. Financial accountability is defined as the appointment of a voting majority of the component unit's governing body with certain exceptions, and either (a) the ability to impose will by the primary government; or (b) the potential for the organization to provide financial benefits to, or impose financial burdens on the primary government. Financial accountability may also be determined if the component unit is fiscally dependent on the City and the potential financial benefit/burden relationship mentioned above exists. NON MAJOR COMPONENT UNIT:
The Jacksonville Housing Finance Authority provides money for loans and technical assistance for construction and rehabilitation of housing to alleviate a shortage of housing and capital for investment in housing in Jacksonville.
-227-
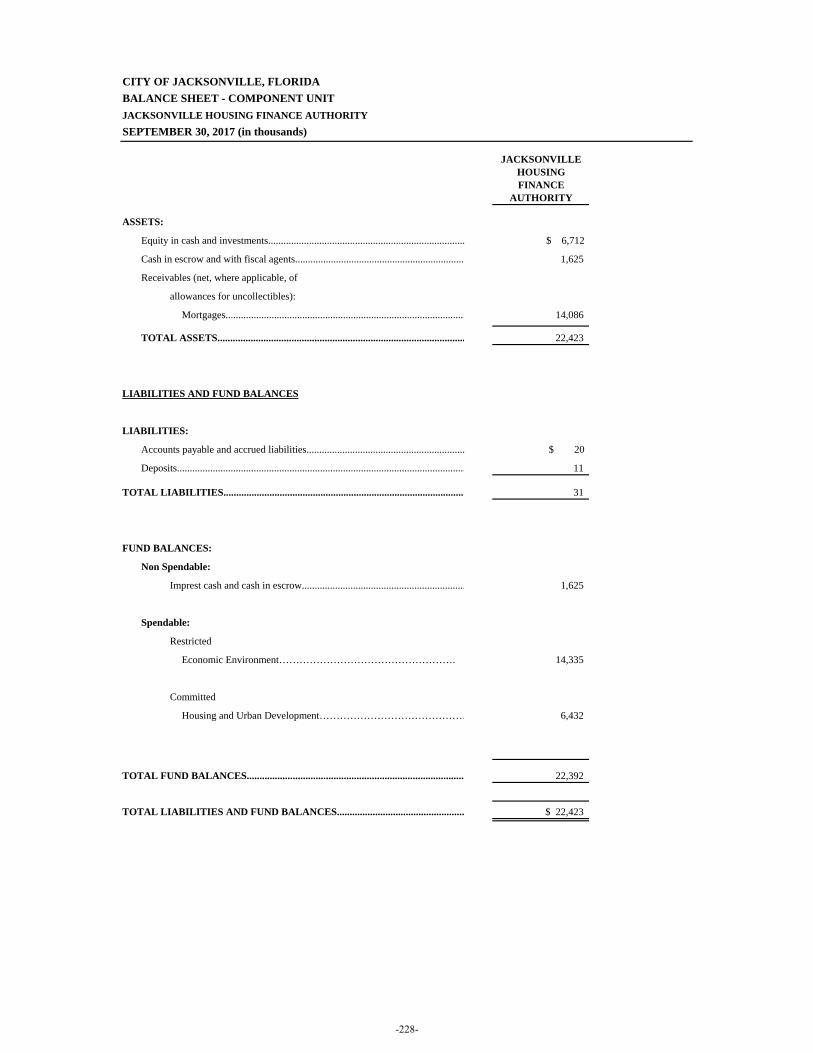
CITY OF JACKSONVILLE, FLORIDABALANCE SHEET - COMPONENT UNIT JACKSONVILLE HOUSING FINANCE AUTHORITYSEPTEMBER 30, 2017 (in thousands)
JACKSONVILLEHOUSINGFINANCE
AUTHORITY
ASSETS:
Equity in cash and investments............................................................................. $ 6,712
Cash in escrow and with fiscal agents.................................................................. 1,625
Receivables (net, where applicable, of
allowances for uncollectibles):
Mortgages.............................................................................................. 14,086
TOTAL ASSETS................................................................................................. 22,423
LIABILITIES AND FUND BALANCES
LIABILITIES:
Accounts payable and accrued liabilities.............................................................. $ 20
Deposits................................................................................................................. 11
TOTAL LIABILITIES............................................................................................... 31
FUND BALANCES:
Non Spendable:
Imprest cash and cash in escrow................................................................ 1,625
Spendable:
Restricted
Economic Environment……………………………………………. 14,335
Committed
Housing and Urban Development……………………………………… 6,432
TOTAL FUND BALANCES...................................................................................... 22,392
TOTAL LIABILITIES AND FUND BALANCES.................................................. $ 22,423
-228-
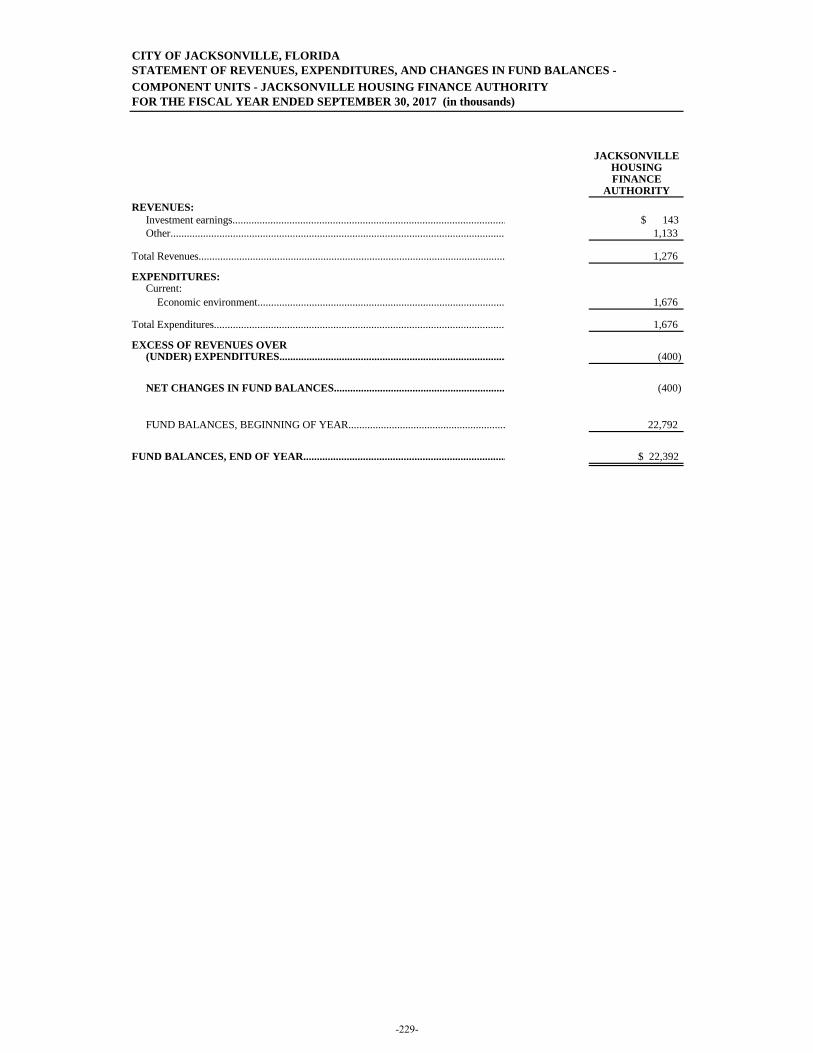
CITY OF JACKSONVILLE, FLORIDASTATEMENT OF REVENUES, EXPENDITURES, AND CHANGES IN FUND BALANCES - COMPONENT UNITS - JACKSONVILLE HOUSING FINANCE AUTHORITYFOR THE FISCAL YEAR ENDED SEPTEMBER 30, 2017 (in thousands)
JACKSONVILLEHOUSINGFINANCE
AUTHORITYREVENUES:
Investment earnings..................................................................................................... $ 143 Other............................................................................................................................ 1,133
Total Revenues................................................................................................................. 1,276
EXPENDITURES:Current:
Economic environment............................................................................................ 1,676
Total Expenditures............................................................................................................ 1,676
EXCESS OF REVENUES OVER(UNDER) EXPENDITURES.................................................................................... (400)
NET CHANGES IN FUND BALANCES................................................................ (400)
FUND BALANCES, BEGINNING OF YEAR.......................................................... 22,792
FUND BALANCES, END OF YEAR........................................................................... $ 22,392
-229-

(This page is intentionally left blank.)
-230-

SUPPLEMENTAL INFORMATION
The Supplemental Information provided herein contains schedules of long-term bonded indebtedness and debt service requirement detail, Self-Insurance Fund schedules detailing ten year trend information of general liability and workers compensation claims development, and General Fund balance sheet and statement of revenues expenditures and changes in fund balance schedules breaking out the General Service District, Emergency Reserve and other subfunds.
-231-
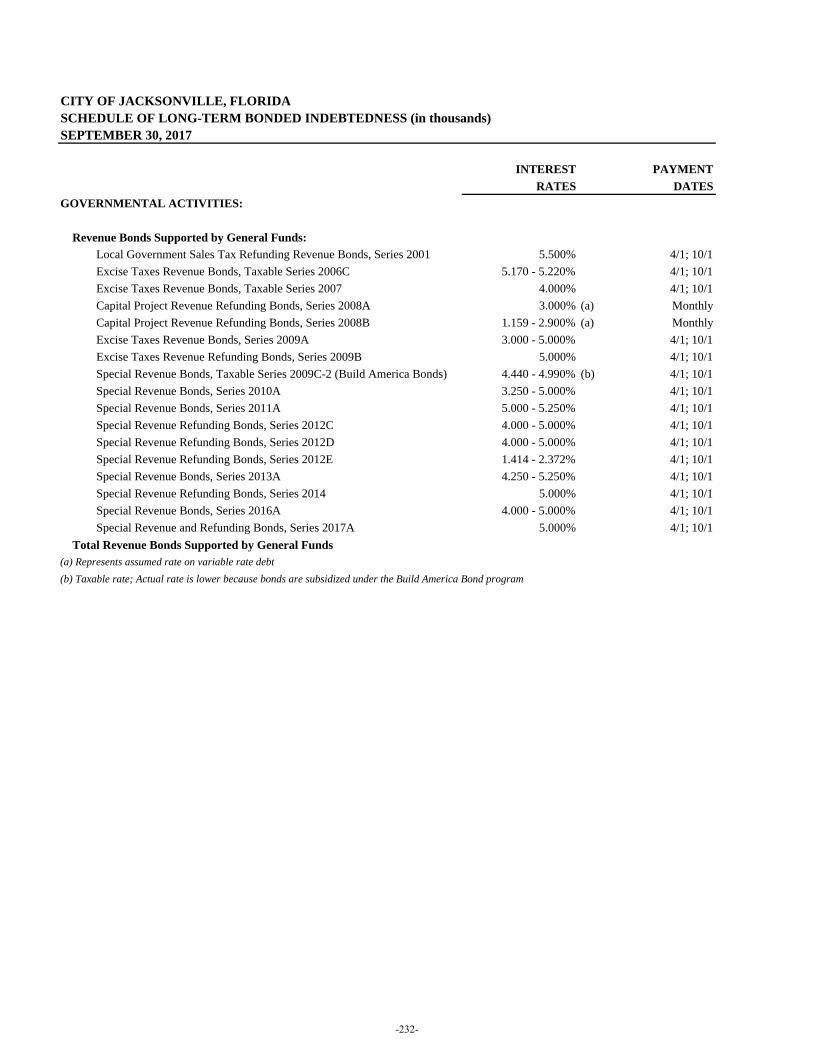
CITY OF JACKSONVILLE, FLORIDASCHEDULE OF LONG-TERM BONDED INDEBTEDNESS (in thousands)SEPTEMBER 30, 2017
INTEREST PAYMENTRATES DATES
GOVERNMENTAL ACTIVITIES:
Revenue Bonds Supported by General Funds:Local Government Sales Tax Refunding Revenue Bonds, Series 2001 5.500% 4/1; 10/1Excise Taxes Revenue Bonds, Taxable Series 2006C 5.170 - 5.220% 4/1; 10/1Excise Taxes Revenue Bonds, Taxable Series 2007 4.000% 4/1; 10/1Capital Project Revenue Refunding Bonds, Series 2008A 3.000% (a) MonthlyCapital Project Revenue Refunding Bonds, Series 2008B 1.159 - 2.900% (a) MonthlyExcise Taxes Revenue Bonds, Series 2009A 3.000 - 5.000% 4/1; 10/1Excise Taxes Revenue Refunding Bonds, Series 2009B 5.000% 4/1; 10/1Special Revenue Bonds, Taxable Series 2009C-2 (Build America Bonds) 4.440 - 4.990% (b) 4/1; 10/1Special Revenue Bonds, Series 2010A 3.250 - 5.000% 4/1; 10/1Special Revenue Bonds, Series 2011A 5.000 - 5.250% 4/1; 10/1Special Revenue Refunding Bonds, Series 2012C 4.000 - 5.000% 4/1; 10/1Special Revenue Refunding Bonds, Series 2012D 4.000 - 5.000% 4/1; 10/1Special Revenue Refunding Bonds, Series 2012E 1.414 - 2.372% 4/1; 10/1Special Revenue Bonds, Series 2013A 4.250 - 5.250% 4/1; 10/1Special Revenue Refunding Bonds, Series 2014 5.000% 4/1; 10/1Special Revenue Bonds, Series 2016A 4.000 - 5.000% 4/1; 10/1Special Revenue and Refunding Bonds, Series 2017A 5.000% 4/1; 10/1
Total Revenue Bonds Supported by General Funds(a) Represents assumed rate on variable rate debt(b) Taxable rate; Actual rate is lower because bonds are subsidized under the Build America Bond program
-232-
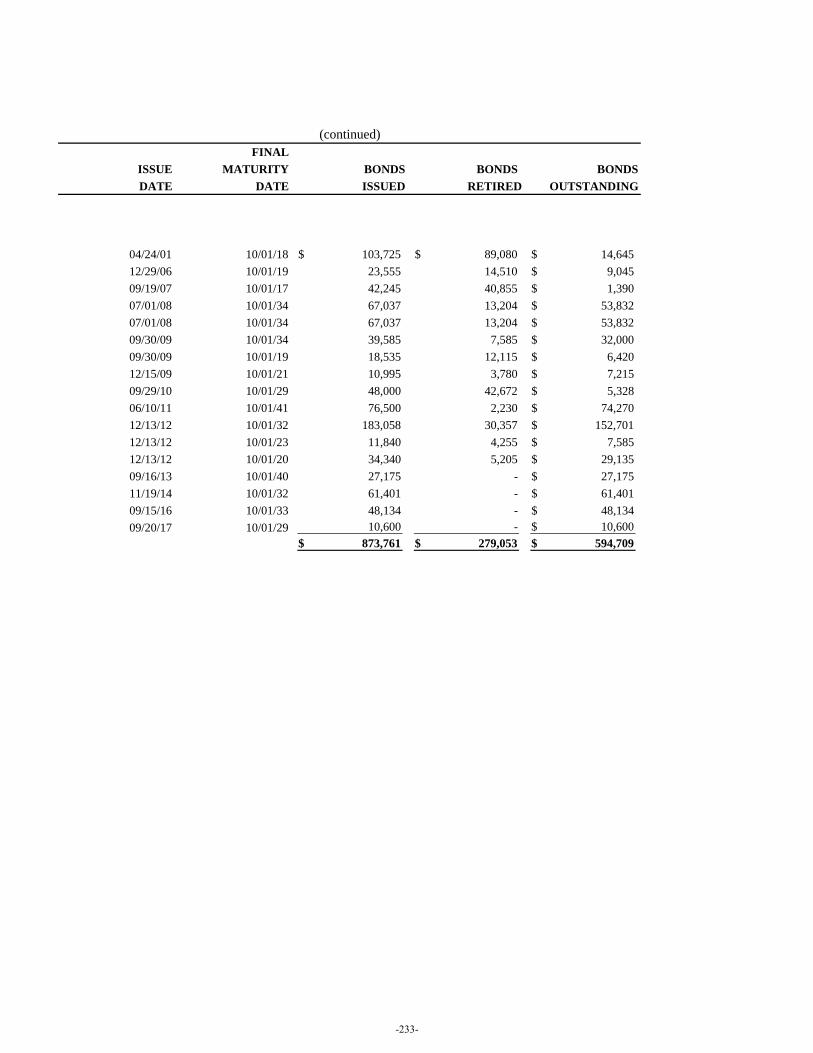
FINALISSUE MATURITY BONDS BONDS BONDSDATE DATE ISSUED RETIRED OUTSTANDING
04/24/01 10/01/18 103,725$ 89,080$ 14,645$ 12/29/06 10/01/19 23,555 14,510 9,045$ 09/19/07 10/01/17 42,245 40,855 1,390$ 07/01/08 10/01/34 67,037 13,204 53,832$ 07/01/08 10/01/34 67,037 13,204 53,832$ 09/30/09 10/01/34 39,585 7,585 32,000$ 09/30/09 10/01/19 18,535 12,115 6,420$ 12/15/09 10/01/21 10,995 3,780 7,215$ 09/29/10 10/01/29 48,000 42,672 5,328$ 06/10/11 10/01/41 76,500 2,230 74,270$ 12/13/12 10/01/32 183,058 30,357 152,701$ 12/13/12 10/01/23 11,840 4,255 7,585$ 12/13/12 10/01/20 34,340 5,205 29,135$ 09/16/13 10/01/40 27,175 - 27,175$ 11/19/14 10/01/32 61,401 - 61,401$ 09/15/16 10/01/33 48,134 - 48,134$ 09/20/17 10/01/29 10,600 - 10,600$
873,761$ 279,053$ 594,709$
(continued)
-233-
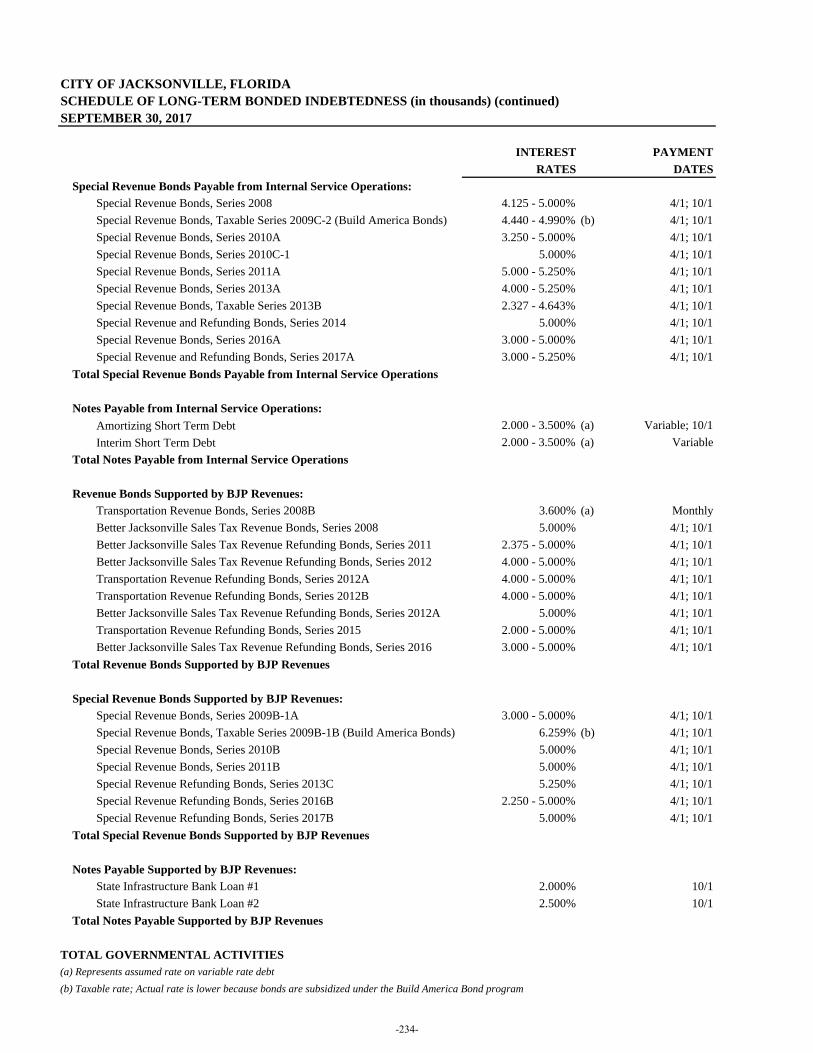
CITY OF JACKSONVILLE, FLORIDASCHEDULE OF LONG-TERM BONDED INDEBTEDNESS (in thousands) (continued)SEPTEMBER 30, 2017
INTEREST PAYMENTRATES DATES
Special Revenue Bonds Payable from Internal Service Operations:Special Revenue Bonds, Series 2008 4.125 - 5.000% 4/1; 10/1Special Revenue Bonds, Taxable Series 2009C-2 (Build America Bonds) 4.440 - 4.990% (b) 4/1; 10/1Special Revenue Bonds, Series 2010A 3.250 - 5.000% 4/1; 10/1Special Revenue Bonds, Series 2010C-1 5.000% 4/1; 10/1Special Revenue Bonds, Series 2011A 5.000 - 5.250% 4/1; 10/1Special Revenue Bonds, Series 2013A 4.000 - 5.250% 4/1; 10/1Special Revenue Bonds, Taxable Series 2013B 2.327 - 4.643% 4/1; 10/1Special Revenue and Refunding Bonds, Series 2014 5.000% 4/1; 10/1Special Revenue Bonds, Series 2016A 3.000 - 5.000% 4/1; 10/1Special Revenue and Refunding Bonds, Series 2017A 3.000 - 5.250% 4/1; 10/1
Total Special Revenue Bonds Payable from Internal Service Operations
Notes Payable from Internal Service Operations:Amortizing Short Term Debt 2.000 - 3.500% (a) Variable; 10/1Interim Short Term Debt 2.000 - 3.500% (a) Variable
Total Notes Payable from Internal Service Operations
Revenue Bonds Supported by BJP Revenues:Transportation Revenue Bonds, Series 2008B 3.600% (a) MonthlyBetter Jacksonville Sales Tax Revenue Bonds, Series 2008 5.000% 4/1; 10/1Better Jacksonville Sales Tax Revenue Refunding Bonds, Series 2011 2.375 - 5.000% 4/1; 10/1Better Jacksonville Sales Tax Revenue Refunding Bonds, Series 2012 4.000 - 5.000% 4/1; 10/1Transportation Revenue Refunding Bonds, Series 2012A 4.000 - 5.000% 4/1; 10/1Transportation Revenue Refunding Bonds, Series 2012B 4.000 - 5.000% 4/1; 10/1Better Jacksonville Sales Tax Revenue Refunding Bonds, Series 2012A 5.000% 4/1; 10/1Transportation Revenue Refunding Bonds, Series 2015 2.000 - 5.000% 4/1; 10/1Better Jacksonville Sales Tax Revenue Refunding Bonds, Series 2016 3.000 - 5.000% 4/1; 10/1
Total Revenue Bonds Supported by BJP Revenues
Special Revenue Bonds Supported by BJP Revenues:Special Revenue Bonds, Series 2009B-1A 3.000 - 5.000% 4/1; 10/1Special Revenue Bonds, Taxable Series 2009B-1B (Build America Bonds) 6.259% (b) 4/1; 10/1Special Revenue Bonds, Series 2010B 5.000% 4/1; 10/1Special Revenue Bonds, Series 2011B 5.000% 4/1; 10/1Special Revenue Refunding Bonds, Series 2013C 5.250% 4/1; 10/1Special Revenue Refunding Bonds, Series 2016B 2.250 - 5.000% 4/1; 10/1Special Revenue Refunding Bonds, Series 2017B 5.000% 4/1; 10/1
Total Special Revenue Bonds Supported by BJP Revenues
Notes Payable Supported by BJP Revenues:State Infrastructure Bank Loan #1 2.000% 10/1State Infrastructure Bank Loan #2 2.500% 10/1
Total Notes Payable Supported by BJP Revenues
TOTAL GOVERNMENTAL ACTIVITIES(a) Represents assumed rate on variable rate debt(b) Taxable rate; Actual rate is lower because bonds are subsidized under the Build America Bond program
-234-
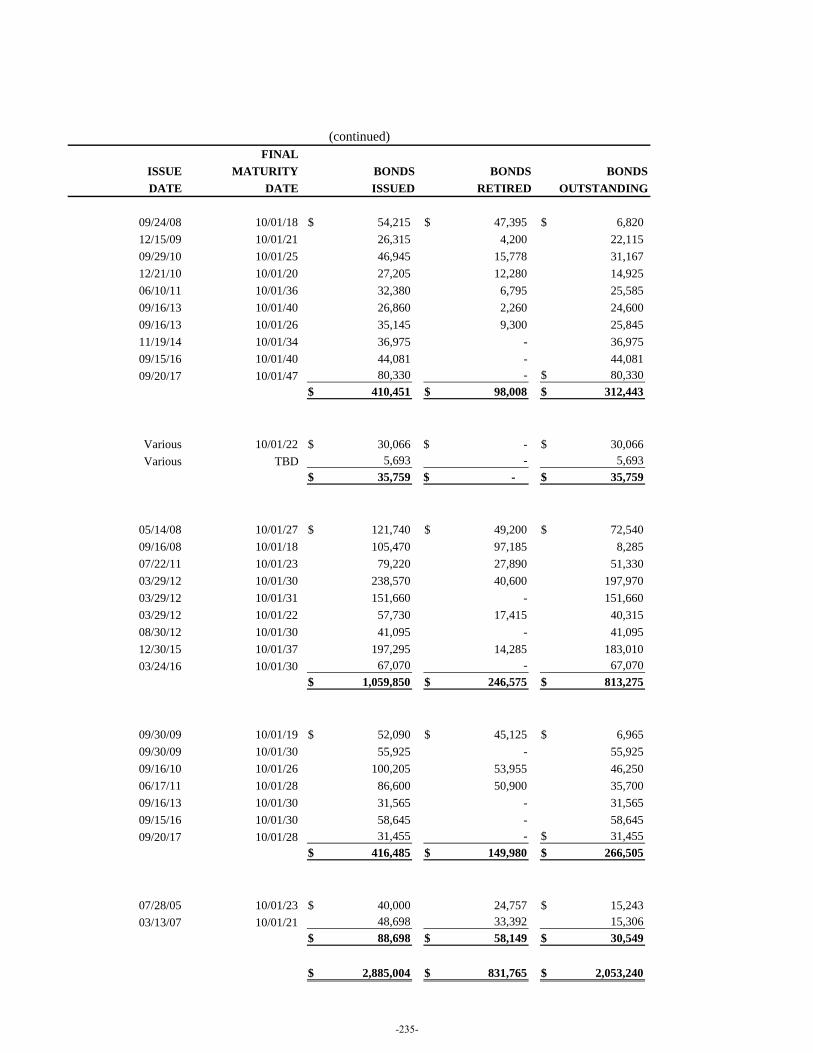
FINALISSUE MATURITY BONDS BONDS BONDSDATE DATE ISSUED RETIRED OUTSTANDING
09/24/08 10/01/18 54,215$ 47,395$ 6,820$ 12/15/09 10/01/21 26,315 4,200 22,115 09/29/10 10/01/25 46,945 15,778 31,167 12/21/10 10/01/20 27,205 12,280 14,925 06/10/11 10/01/36 32,380 6,795 25,585 09/16/13 10/01/40 26,860 2,260 24,600 09/16/13 10/01/26 35,145 9,300 25,845 11/19/14 10/01/34 36,975 - 36,975 09/15/16 10/01/40 44,081 - 44,081 09/20/17 10/01/47 80,330 - 80,330$
410,451$ 98,008$ 312,443$
Various 10/01/22 30,066$ -$ 30,066$ Various TBD 5,693 - 5,693
35,759$ -$ 35,759$
05/14/08 10/01/27 121,740$ 49,200$ 72,540$ 09/16/08 10/01/18 105,470 97,185 8,285 07/22/11 10/01/23 79,220 27,890 51,330 03/29/12 10/01/30 238,570 40,600 197,970 03/29/12 10/01/31 151,660 - 151,660 03/29/12 10/01/22 57,730 17,415 40,315 08/30/12 10/01/30 41,095 - 41,095 12/30/15 10/01/37 197,295 14,285 183,010 03/24/16 10/01/30 67,070 - 67,070
1,059,850$ 246,575$ 813,275$
09/30/09 10/01/19 52,090$ 45,125$ 6,965$ 09/30/09 10/01/30 55,925 - 55,925 09/16/10 10/01/26 100,205 53,955 46,250 06/17/11 10/01/28 86,600 50,900 35,700 09/16/13 10/01/30 31,565 - 31,565 09/15/16 10/01/30 58,645 - 58,645 09/20/17 10/01/28 31,455 - 31,455$
416,485$ 149,980$ 266,505$
07/28/05 10/01/23 40,000$ 24,757 15,243$ 03/13/07 10/01/21 48,698 33,392 15,306
88,698$ 58,149$ 30,549$
2,885,004$ 831,765$ 2,053,240$
(continued)
-235-
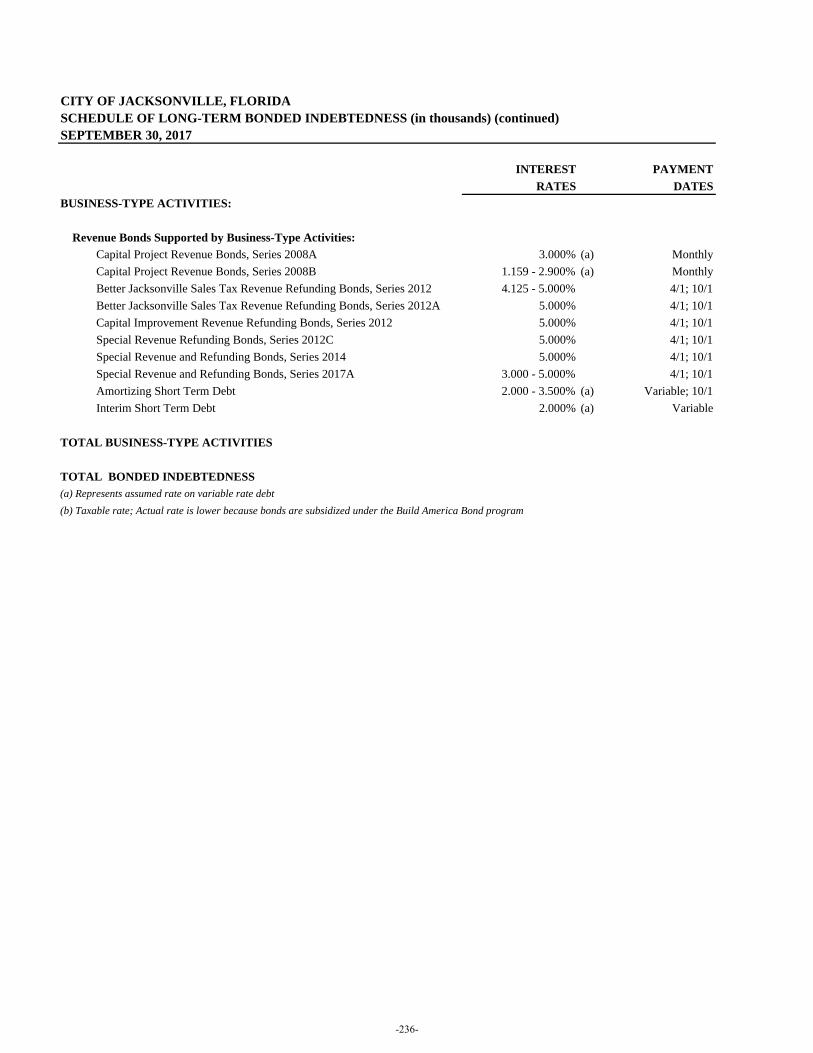
CITY OF JACKSONVILLE, FLORIDASCHEDULE OF LONG-TERM BONDED INDEBTEDNESS (in thousands) (continued)SEPTEMBER 30, 2017
INTEREST PAYMENTRATES DATES
BUSINESS-TYPE ACTIVITIES:
Revenue Bonds Supported by Business-Type Activities:Capital Project Revenue Bonds, Series 2008A 3.000% (a) MonthlyCapital Project Revenue Bonds, Series 2008B 1.159 - 2.900% (a) MonthlyBetter Jacksonville Sales Tax Revenue Refunding Bonds, Series 2012 4.125 - 5.000% 4/1; 10/1Better Jacksonville Sales Tax Revenue Refunding Bonds, Series 2012A 5.000% 4/1; 10/1Capital Improvement Revenue Refunding Bonds, Series 2012 5.000% 4/1; 10/1Special Revenue Refunding Bonds, Series 2012C 5.000% 4/1; 10/1Special Revenue and Refunding Bonds, Series 2014 5.000% 4/1; 10/1Special Revenue and Refunding Bonds, Series 2017A 3.000 - 5.000% 4/1; 10/1Amortizing Short Term Debt 2.000 - 3.500% (a) Variable; 10/1Interim Short Term Debt 2.000% (a) Variable
TOTAL BUSINESS-TYPE ACTIVITIES
TOTAL BONDED INDEBTEDNESS(a) Represents assumed rate on variable rate debt(b) Taxable rate; Actual rate is lower because bonds are subsidized under the Build America Bond program
-236-
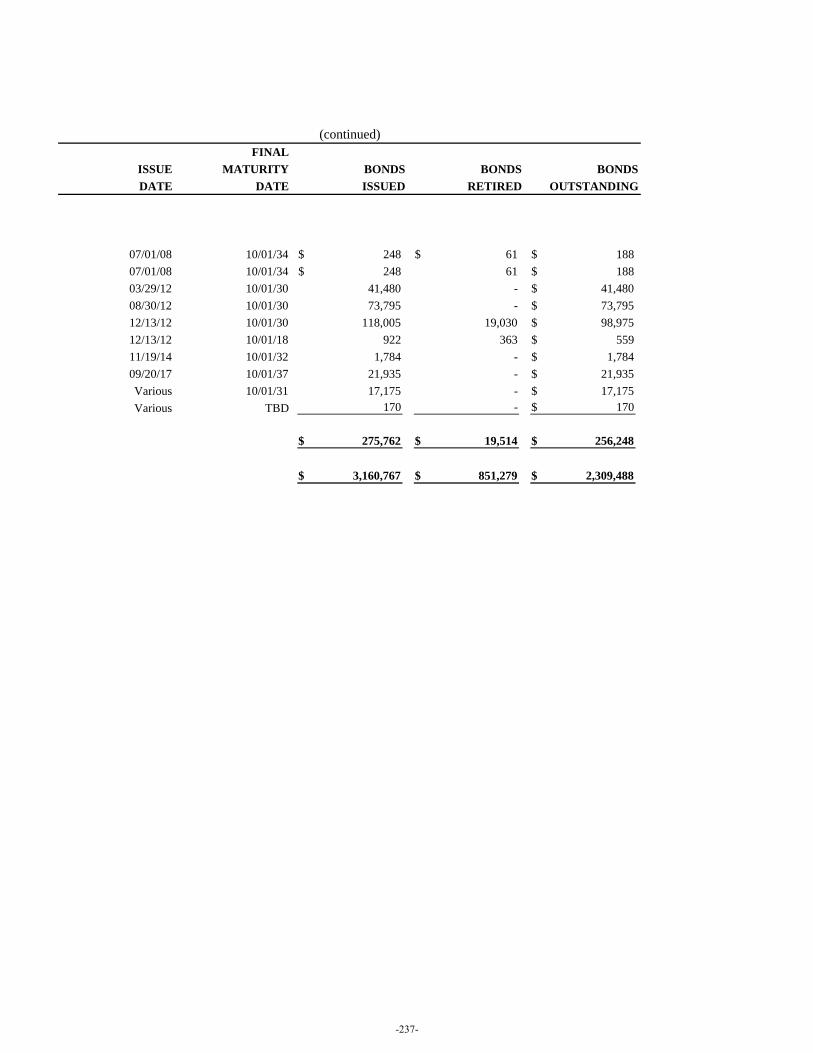
FINALISSUE MATURITY BONDS BONDS BONDSDATE DATE ISSUED RETIRED OUTSTANDING
07/01/08 10/01/34 248$ 61$ 188$ 07/01/08 10/01/34 248$ 61 188$ 03/29/12 10/01/30 41,480 - 41,480$ 08/30/12 10/01/30 73,795 - 73,795$ 12/13/12 10/01/30 118,005 19,030 98,975$ 12/13/12 10/01/18 922 363 559$ 11/19/14 10/01/32 1,784 - 1,784$ 09/20/17 10/01/37 21,935 - 21,935$ Various 10/01/31 17,175 - 17,175$ Various TBD 170 - 170$
275,762$ 19,514$ 256,248$
3,160,767$ 851,279$ 2,309,488$
(continued)
-237-
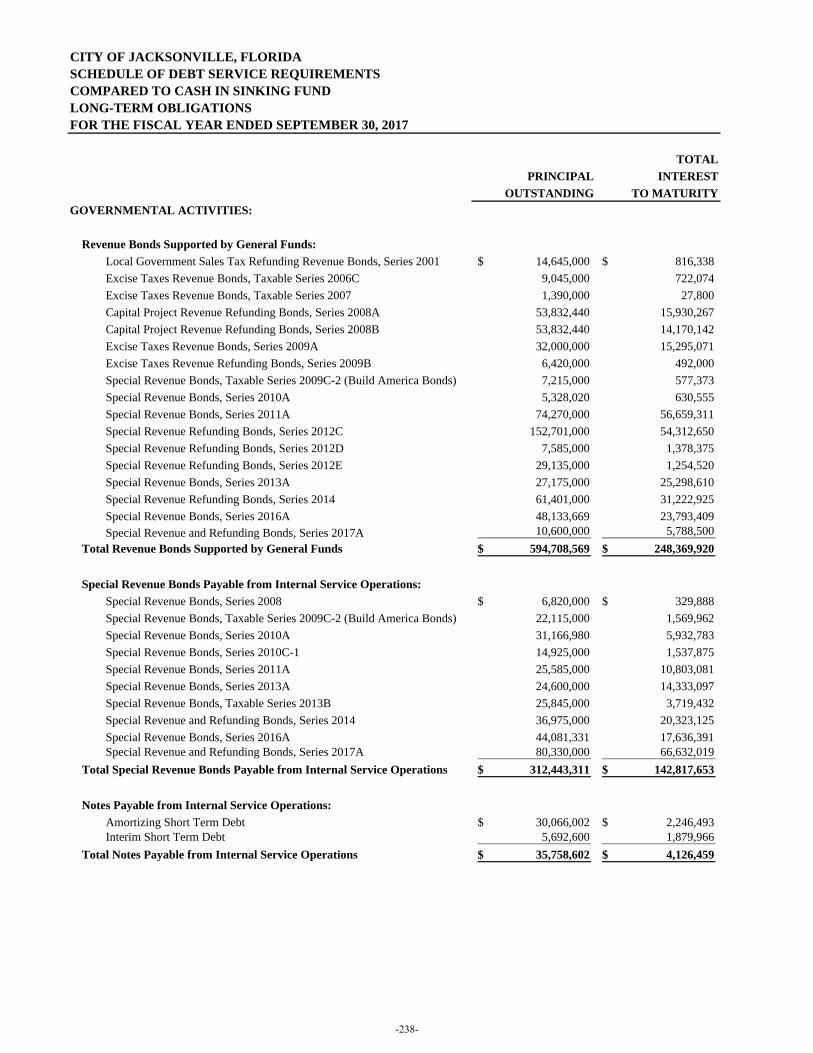
CITY OF JACKSONVILLE, FLORIDASCHEDULE OF DEBT SERVICE REQUIREMENTSCOMPARED TO CASH IN SINKING FUNDLONG-TERM OBLIGATIONSFOR THE FISCAL YEAR ENDED SEPTEMBER 30, 2017
TOTALPRINCIPAL INTEREST
OUTSTANDING TO MATURITYGOVERNMENTAL ACTIVITIES:
Revenue Bonds Supported by General Funds:Local Government Sales Tax Refunding Revenue Bonds, Series 2001 14,645,000$ 816,338$ Excise Taxes Revenue Bonds, Taxable Series 2006C 9,045,000 722,074 Excise Taxes Revenue Bonds, Taxable Series 2007 1,390,000 27,800 Capital Project Revenue Refunding Bonds, Series 2008A 53,832,440 15,930,267 Capital Project Revenue Refunding Bonds, Series 2008B 53,832,440 14,170,142 Excise Taxes Revenue Bonds, Series 2009A 32,000,000 15,295,071 Excise Taxes Revenue Refunding Bonds, Series 2009B 6,420,000 492,000 Special Revenue Bonds, Taxable Series 2009C-2 (Build America Bonds) 7,215,000 577,373 Special Revenue Bonds, Series 2010A 5,328,020 630,555 Special Revenue Bonds, Series 2011A 74,270,000 56,659,311 Special Revenue Refunding Bonds, Series 2012C 152,701,000 54,312,650 Special Revenue Refunding Bonds, Series 2012D 7,585,000 1,378,375 Special Revenue Refunding Bonds, Series 2012E 29,135,000 1,254,520 Special Revenue Bonds, Series 2013A 27,175,000 25,298,610 Special Revenue Refunding Bonds, Series 2014 61,401,000 31,222,925 Special Revenue Bonds, Series 2016A 48,133,669 23,793,409 Special Revenue and Refunding Bonds, Series 2017A 10,600,000 5,788,500
Total Revenue Bonds Supported by General Funds 594,708,569$ 248,369,920$
Special Revenue Bonds Payable from Internal Service Operations:Special Revenue Bonds, Series 2008 6,820,000$ 329,888$ Special Revenue Bonds, Taxable Series 2009C-2 (Build America Bonds) 22,115,000 1,569,962 Special Revenue Bonds, Series 2010A 31,166,980 5,932,783 Special Revenue Bonds, Series 2010C-1 14,925,000 1,537,875 Special Revenue Bonds, Series 2011A 25,585,000 10,803,081 Special Revenue Bonds, Series 2013A 24,600,000 14,333,097 Special Revenue Bonds, Taxable Series 2013B 25,845,000 3,719,432 Special Revenue and Refunding Bonds, Series 2014 36,975,000 20,323,125 Special Revenue Bonds, Series 2016A 44,081,331 17,636,391 Special Revenue and Refunding Bonds, Series 2017A 80,330,000 66,632,019
Total Special Revenue Bonds Payable from Internal Service Operations 312,443,311$ 142,817,653$
Notes Payable from Internal Service Operations:Amortizing Short Term Debt 30,066,002$ 2,246,493$ Interim Short Term Debt 5,692,600 1,879,966
Total Notes Payable from Internal Service Operations 35,758,602$ 4,126,459$
-238-
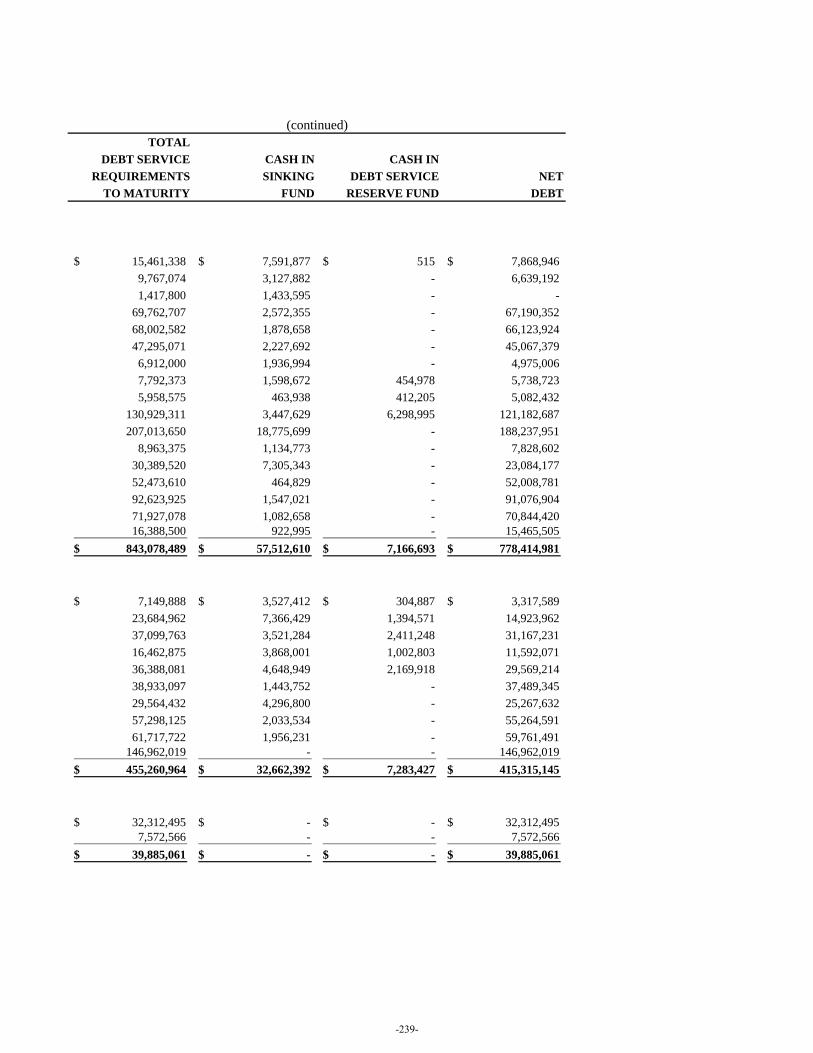
TOTALDEBT SERVICE CASH IN CASH IN
REQUIREMENTS SINKING DEBT SERVICE NETTO MATURITY FUND RESERVE FUND DEBT
15,461,338$ 7,591,877$ 515$ 7,868,946$ 9,767,074 3,127,882 - 6,639,192 1,417,800 1,433,595 - -
69,762,707 2,572,355 - 67,190,352 68,002,582 1,878,658 - 66,123,924 47,295,071 2,227,692 - 45,067,379 6,912,000 1,936,994 - 4,975,006 7,792,373 1,598,672 454,978 5,738,723 5,958,575 463,938 412,205 5,082,432
130,929,311 3,447,629 6,298,995 121,182,687 207,013,650 18,775,699 - 188,237,951
8,963,375 1,134,773 - 7,828,602 30,389,520 7,305,343 - 23,084,177 52,473,610 464,829 - 52,008,781 92,623,925 1,547,021 - 91,076,904 71,927,078 1,082,658 - 70,844,420 16,388,500 922,995 - 15,465,505
843,078,489$ 57,512,610$ 7,166,693$ 778,414,981$
7,149,888$ 3,527,412$ 304,887$ 3,317,589$ 23,684,962 7,366,429 1,394,571 14,923,962 37,099,763 3,521,284 2,411,248 31,167,231 16,462,875 3,868,001 1,002,803 11,592,071 36,388,081 4,648,949 2,169,918 29,569,214 38,933,097 1,443,752 - 37,489,345 29,564,432 4,296,800 - 25,267,632 57,298,125 2,033,534 - 55,264,591 61,717,722 1,956,231 - 59,761,491
146,962,019 - - 146,962,019 455,260,964$ 32,662,392$ 7,283,427$ 415,315,145$
32,312,495$ -$ -$ 32,312,495$ 7,572,566 - - 7,572,566
39,885,061$ -$ -$ 39,885,061$
(continued)
-239-
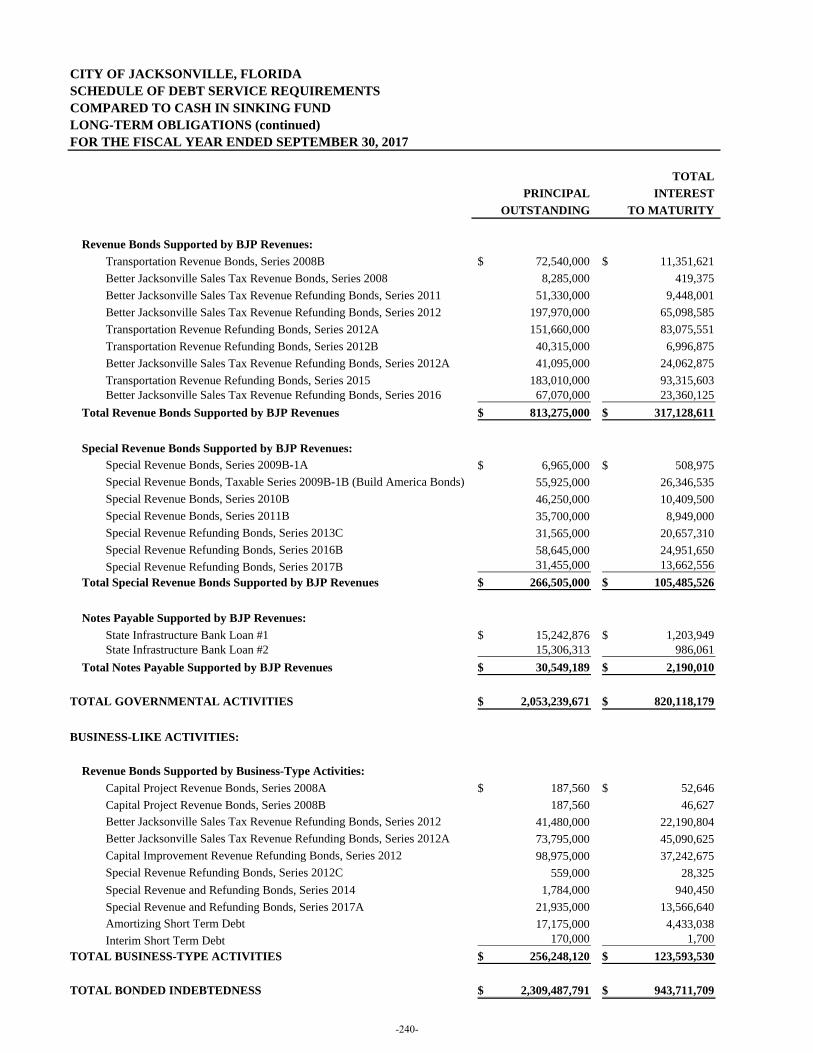
CITY OF JACKSONVILLE, FLORIDASCHEDULE OF DEBT SERVICE REQUIREMENTSCOMPARED TO CASH IN SINKING FUNDLONG-TERM OBLIGATIONS (continued)FOR THE FISCAL YEAR ENDED SEPTEMBER 30, 2017
TOTALPRINCIPAL INTEREST
OUTSTANDING TO MATURITY
Revenue Bonds Supported by BJP Revenues:Transportation Revenue Bonds, Series 2008B 72,540,000$ 11,351,621$ Better Jacksonville Sales Tax Revenue Bonds, Series 2008 8,285,000 419,375 Better Jacksonville Sales Tax Revenue Refunding Bonds, Series 2011 51,330,000 9,448,001 Better Jacksonville Sales Tax Revenue Refunding Bonds, Series 2012 197,970,000 65,098,585 Transportation Revenue Refunding Bonds, Series 2012A 151,660,000 83,075,551 Transportation Revenue Refunding Bonds, Series 2012B 40,315,000 6,996,875 Better Jacksonville Sales Tax Revenue Refunding Bonds, Series 2012A 41,095,000 24,062,875 Transportation Revenue Refunding Bonds, Series 2015 183,010,000 93,315,603 Better Jacksonville Sales Tax Revenue Refunding Bonds, Series 2016 67,070,000 23,360,125
Total Revenue Bonds Supported by BJP Revenues 813,275,000$ 317,128,611$
Special Revenue Bonds Supported by BJP Revenues:Special Revenue Bonds, Series 2009B-1A 6,965,000$ 508,975$ Special Revenue Bonds, Taxable Series 2009B-1B (Build America Bonds) 55,925,000 26,346,535 Special Revenue Bonds, Series 2010B 46,250,000 10,409,500 Special Revenue Bonds, Series 2011B 35,700,000 8,949,000 Special Revenue Refunding Bonds, Series 2013C 31,565,000 20,657,310 Special Revenue Refunding Bonds, Series 2016B 58,645,000 24,951,650 Special Revenue Refunding Bonds, Series 2017B 31,455,000 13,662,556
Total Special Revenue Bonds Supported by BJP Revenues 266,505,000$ 105,485,526$
Notes Payable Supported by BJP Revenues:State Infrastructure Bank Loan #1 15,242,876$ 1,203,949$ State Infrastructure Bank Loan #2 15,306,313 986,061
Total Notes Payable Supported by BJP Revenues 30,549,189$ 2,190,010$
TOTAL GOVERNMENTAL ACTIVITIES 2,053,239,671$ 820,118,179$
BUSINESS-LIKE ACTIVITIES:
Revenue Bonds Supported by Business-Type Activities:Capital Project Revenue Bonds, Series 2008A 187,560$ 52,646$ Capital Project Revenue Bonds, Series 2008B 187,560 46,627 Better Jacksonville Sales Tax Revenue Refunding Bonds, Series 2012 41,480,000 22,190,804 Better Jacksonville Sales Tax Revenue Refunding Bonds, Series 2012A 73,795,000 45,090,625 Capital Improvement Revenue Refunding Bonds, Series 2012 98,975,000 37,242,675 Special Revenue Refunding Bonds, Series 2012C 559,000 28,325 Special Revenue and Refunding Bonds, Series 2014 1,784,000 940,450 Special Revenue and Refunding Bonds, Series 2017A 21,935,000 13,566,640 Amortizing Short Term Debt 17,175,000 4,433,038 Interim Short Term Debt 170,000 1,700
TOTAL BUSINESS-TYPE ACTIVITIES 256,248,120$ 123,593,530$
TOTAL BONDED INDEBTEDNESS 2,309,487,791$ 943,711,709$
-240-
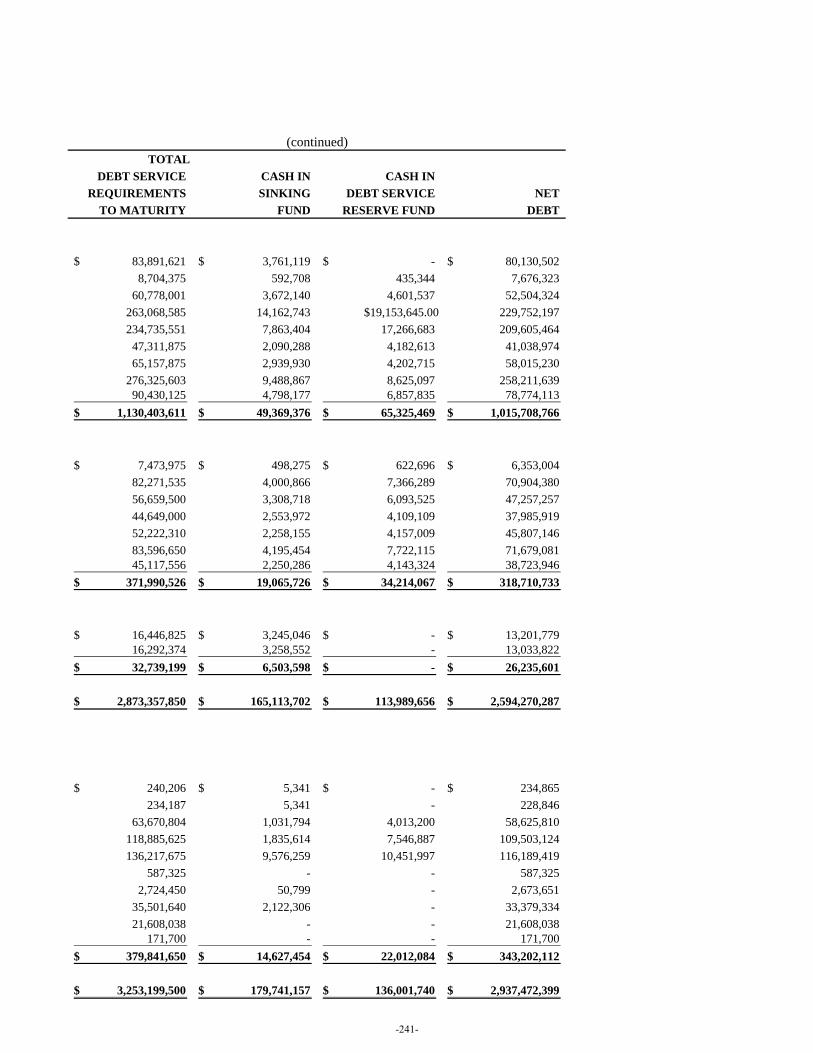
TOTALDEBT SERVICE CASH IN CASH IN
REQUIREMENTS SINKING DEBT SERVICE NETTO MATURITY FUND RESERVE FUND DEBT
83,891,621$ 3,761,119$ -$ 80,130,502$ 8,704,375 592,708 435,344 7,676,323
60,778,001 3,672,140 4,601,537 52,504,324 263,068,585 14,162,743 $19,153,645.00 229,752,197 234,735,551 7,863,404 17,266,683 209,605,464 47,311,875 2,090,288 4,182,613 41,038,974 65,157,875 2,939,930 4,202,715 58,015,230
276,325,603 9,488,867 8,625,097 258,211,639 90,430,125 4,798,177 6,857,835 78,774,113
1,130,403,611$ 49,369,376$ 65,325,469$ 1,015,708,766$
7,473,975$ 498,275$ 622,696$ 6,353,004$ 82,271,535 4,000,866 7,366,289 70,904,380 56,659,500 3,308,718 6,093,525 47,257,257 44,649,000 2,553,972 4,109,109 37,985,919 52,222,310 2,258,155 4,157,009 45,807,146 83,596,650 4,195,454 7,722,115 71,679,081 45,117,556 2,250,286 4,143,324 38,723,946
371,990,526$ 19,065,726$ 34,214,067$ 318,710,733$
16,446,825$ 3,245,046$ -$ 13,201,779$ 16,292,374 3,258,552 - 13,033,822 32,739,199$ 6,503,598$ -$ 26,235,601$
2,873,357,850$ 165,113,702$ 113,989,656$ 2,594,270,287$
240,206$ 5,341$ -$ 234,865$ 234,187 5,341 - 228,846
63,670,804 1,031,794 4,013,200 58,625,810 118,885,625 1,835,614 7,546,887 109,503,124 136,217,675 9,576,259 10,451,997 116,189,419
587,325 - - 587,325 2,724,450 50,799 - 2,673,651
35,501,640 2,122,306 - 33,379,334 21,608,038 - - 21,608,038
171,700 - - 171,700 379,841,650$ 14,627,454$ 22,012,084$ 343,202,112$
3,253,199,500$ 179,741,157$ 136,001,740$ 2,937,472,399$
(continued)
-241-
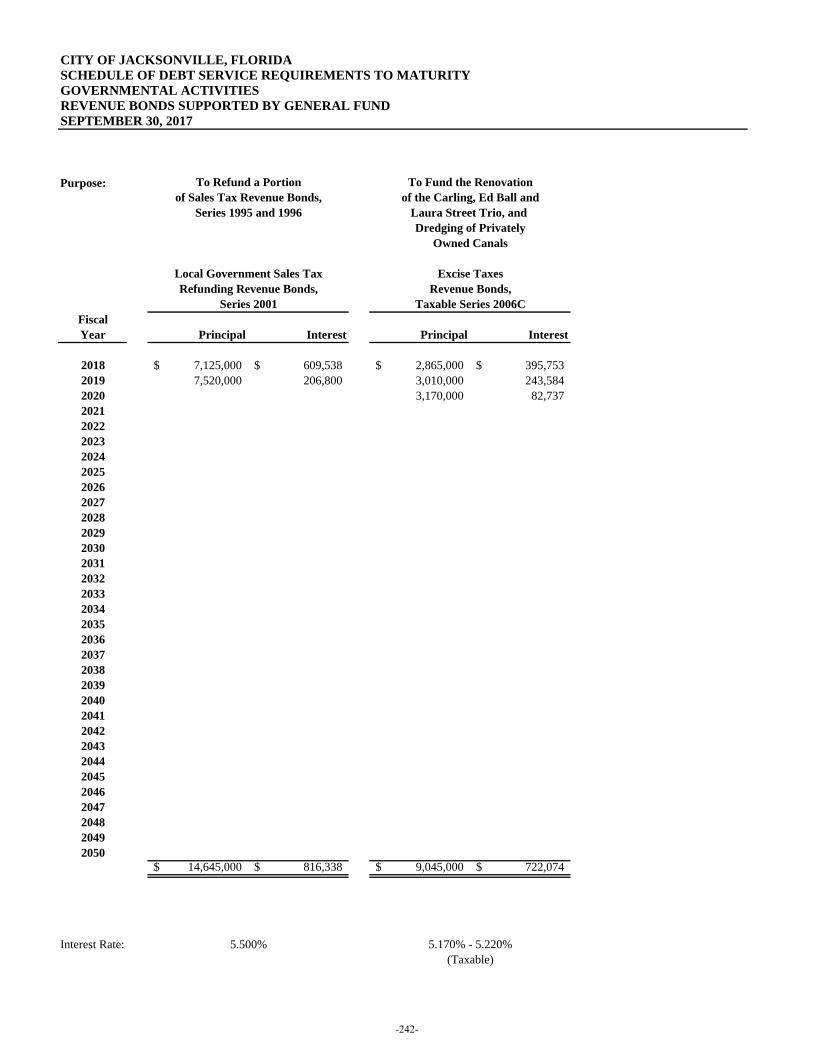
CITY OF JACKSONVILLE, FLORIDASCHEDULE OF DEBT SERVICE REQUIREMENTS TO MATURITYGOVERNMENTAL ACTIVITIESREVENUE BONDS SUPPORTED BY GENERAL FUNDSEPTEMBER 30, 2017
Purpose:
FiscalYear Principal Interest Principal Interest
2018 7,125,000$ 609,538$ 2,865,000$ 395,753$ 2019 7,520,000 206,800 3,010,000 243,584 2020 3,170,000 82,737 202120222023202420252026202720282029203020312032203320342035203620372038203920402041204220432044204520462047204820492050
14,645,000$ 816,338$ 9,045,000$ 722,074$
Interest Rate:
Series 1995 and 1996of Sales Tax Revenue Bonds,
To Refund a Portion
5.500%
To Fund the Renovationof the Carling, Ed Ball and
Laura Street Trio, and
Excise TaxesRevenue Bonds,
Taxable Series 2006C
5.170% - 5.220%
Dredging of PrivatelyOwned Canals
Local Government Sales TaxRefunding Revenue Bonds,
Series 2001
(Taxable)
-242-
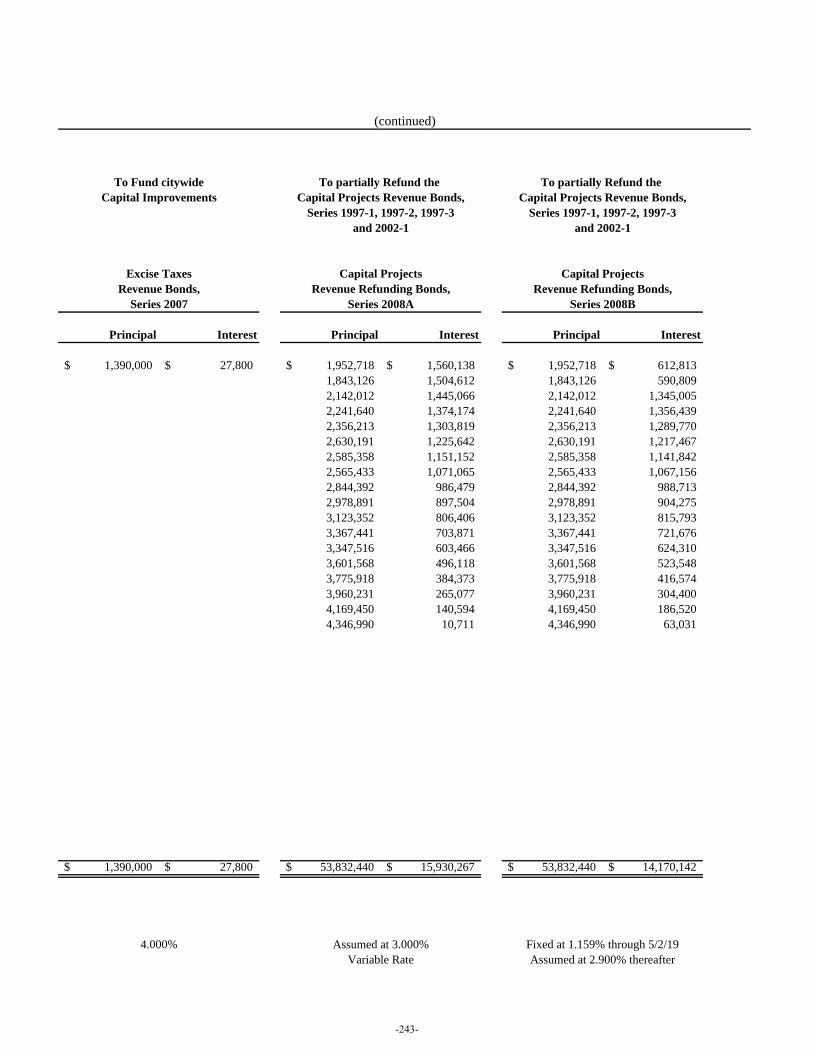
Principal Interest Principal Interest Principal Interest
1,390,000$ 27,800$ 1,952,718$ 1,560,138$ 1,952,718$ 612,813$ 1,843,126 1,504,612 1,843,126 590,809 2,142,012 1,445,066 2,142,012 1,345,005 2,241,640 1,374,174 2,241,640 1,356,439 2,356,213 1,303,819 2,356,213 1,289,770 2,630,191 1,225,642 2,630,191 1,217,467 2,585,358 1,151,152 2,585,358 1,141,842 2,565,433 1,071,065 2,565,433 1,067,156 2,844,392 986,479 2,844,392 988,713 2,978,891 897,504 2,978,891 904,275 3,123,352 806,406 3,123,352 815,793 3,367,441 703,871 3,367,441 721,676 3,347,516 603,466 3,347,516 624,310 3,601,568 496,118 3,601,568 523,548 3,775,918 384,373 3,775,918 416,574 3,960,231 265,077 3,960,231 304,400 4,169,450 140,594 4,169,450 186,520 4,346,990 10,711 4,346,990 63,031
1,390,000$ 27,800$ 53,832,440$ 15,930,267$ 53,832,440$ 14,170,142$
Series 2008A
Assumed at 3.000%
To partially Refund the Capital Projects Revenue Bonds,
Series 1997-1, 1997-2, 1997-3and 2002-1
Capital ProjectsRevenue Refunding Bonds,
Series 2008B
Fixed at 1.159% through 5/2/19
Excise TaxesRevenue Bonds,
Series 2007
4.000%Assumed at 2.900% thereafter
and 2002-1
To Fund citywideCapital Improvements
Variable Rate
To partially Refund the Capital Projects Revenue Bonds,
Series 1997-1, 1997-2, 1997-3
Capital ProjectsRevenue Refunding Bonds,
(continued)
-243-
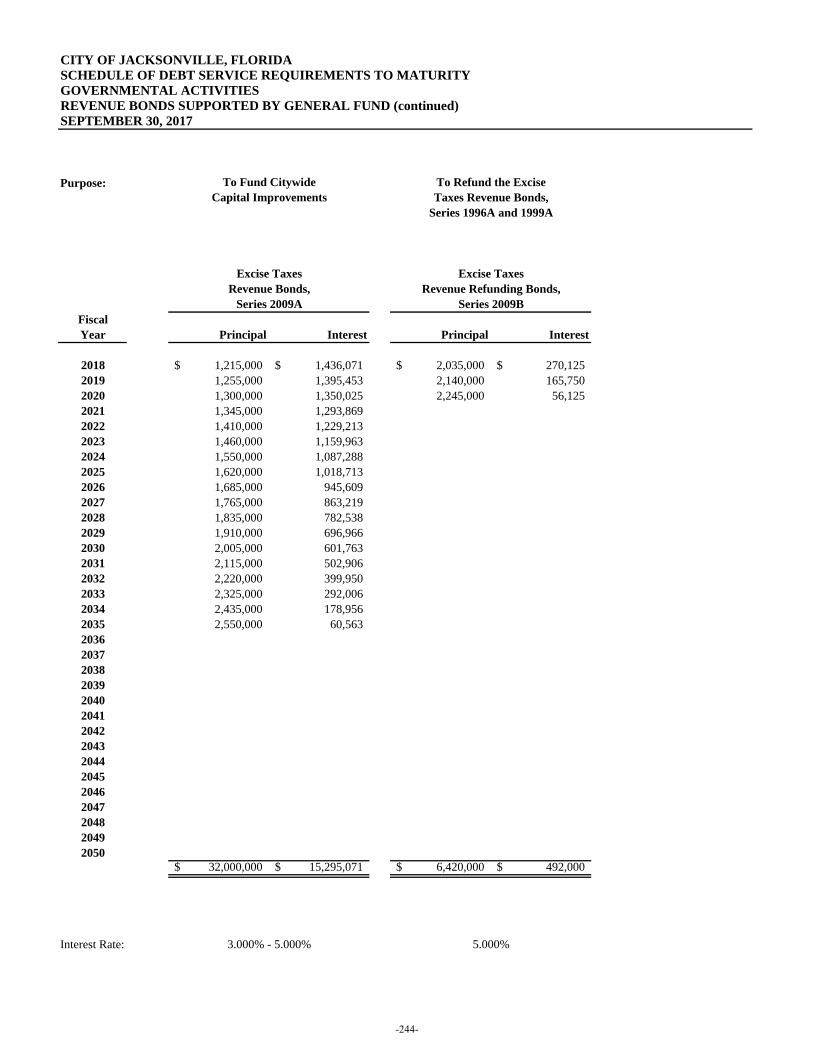
CITY OF JACKSONVILLE, FLORIDASCHEDULE OF DEBT SERVICE REQUIREMENTS TO MATURITYGOVERNMENTAL ACTIVITIESREVENUE BONDS SUPPORTED BY GENERAL FUND (continued)SEPTEMBER 30, 2017
Purpose:
FiscalYear Principal Interest Principal Interest
2018 1,215,000$ 1,436,071$ 2,035,000$ 270,125$ 2019 1,255,000 1,395,453 2,140,000 165,750 2020 1,300,000 1,350,025 2,245,000 56,125 2021 1,345,000 1,293,869 2022 1,410,000 1,229,213 2023 1,460,000 1,159,963 2024 1,550,000 1,087,288 2025 1,620,000 1,018,713 2026 1,685,000 945,609 2027 1,765,000 863,219 2028 1,835,000 782,538 2029 1,910,000 696,966 2030 2,005,000 601,763 2031 2,115,000 502,906 2032 2,220,000 399,950 2033 2,325,000 292,006 2034 2,435,000 178,956 2035 2,550,000 60,563 203620372038203920402041204220432044204520462047204820492050
32,000,000$ 15,295,071$ 6,420,000$ 492,000$
Interest Rate:
To Refund the ExciseTaxes Revenue Bonds,
Series 1996A and 1999A
Excise TaxesRevenue Refunding Bonds,
Series 2009B
To Fund CitywideCapital Improvements
3.000% - 5.000%
Excise TaxesRevenue Bonds,
Series 2009A
5.000%
-244-
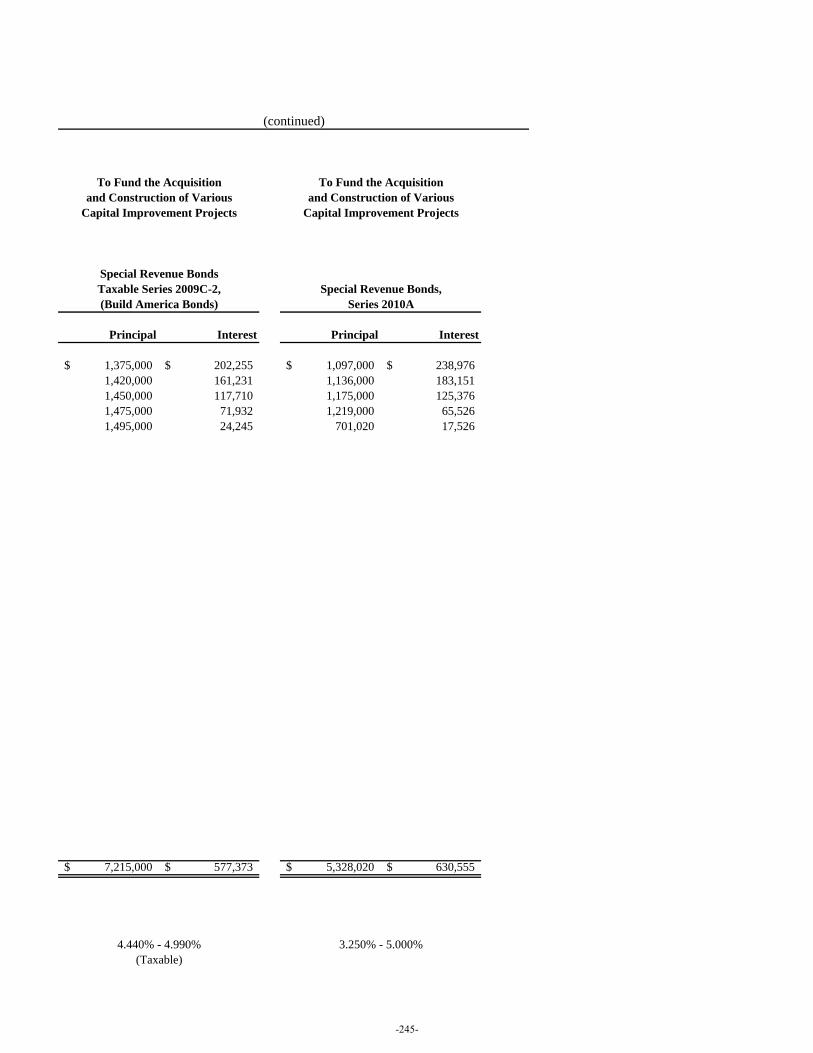
Principal Interest Principal Interest
1,375,000$ 202,255$ 1,097,000$ 238,976$ 1,420,000 161,231 1,136,000 183,151 1,450,000 117,710 1,175,000 125,376 1,475,000 71,932 1,219,000 65,526 1,495,000 24,245 701,020 17,526
7,215,000$ 577,373$ 5,328,020$ 630,555$
(continued)
To Fund the Acquisitionand Construction of Various
Special Revenue Bonds
Capital Improvement Projects
Taxable Series 2009C-2,(Build America Bonds)
4.440% - 4.990%
To Fund the Acquisitionand Construction of Various
Capital Improvement Projects
Special Revenue Bonds,Series 2010A
3.250% - 5.000%(Taxable)
-245-
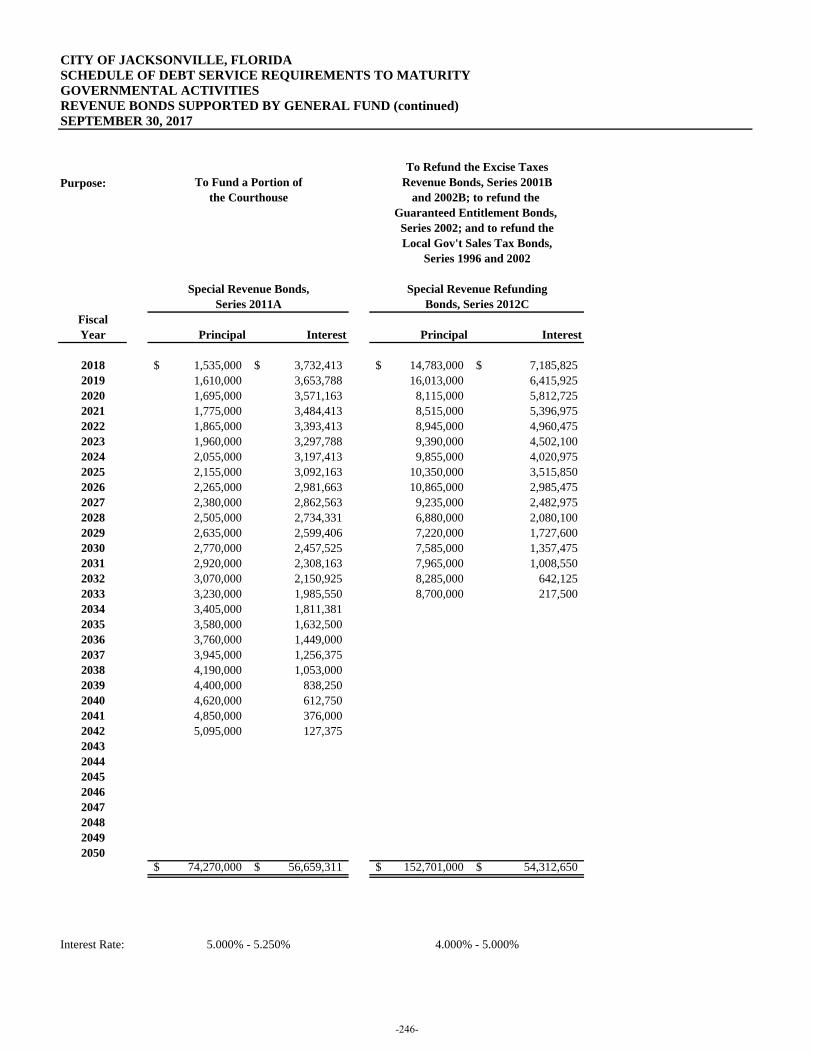
CITY OF JACKSONVILLE, FLORIDASCHEDULE OF DEBT SERVICE REQUIREMENTS TO MATURITYGOVERNMENTAL ACTIVITIESREVENUE BONDS SUPPORTED BY GENERAL FUND (continued)SEPTEMBER 30, 2017
Purpose:
FiscalYear Principal Interest Principal Interest
2018 1,535,000$ 3,732,413$ 14,783,000$ 7,185,825$ 2019 1,610,000 3,653,788 16,013,000 6,415,925 2020 1,695,000 3,571,163 8,115,000 5,812,725 2021 1,775,000 3,484,413 8,515,000 5,396,975 2022 1,865,000 3,393,413 8,945,000 4,960,475 2023 1,960,000 3,297,788 9,390,000 4,502,100 2024 2,055,000 3,197,413 9,855,000 4,020,975 2025 2,155,000 3,092,163 10,350,000 3,515,850 2026 2,265,000 2,981,663 10,865,000 2,985,475 2027 2,380,000 2,862,563 9,235,000 2,482,975 2028 2,505,000 2,734,331 6,880,000 2,080,100 2029 2,635,000 2,599,406 7,220,000 1,727,600 2030 2,770,000 2,457,525 7,585,000 1,357,475 2031 2,920,000 2,308,163 7,965,000 1,008,550 2032 3,070,000 2,150,925 8,285,000 642,125 2033 3,230,000 1,985,550 8,700,000 217,500 2034 3,405,000 1,811,381 2035 3,580,000 1,632,500 2036 3,760,000 1,449,000 2037 3,945,000 1,256,375 2038 4,190,000 1,053,000 2039 4,400,000 838,250 2040 4,620,000 612,750 2041 4,850,000 376,000 2042 5,095,000 127,375 20432044204520462047204820492050
74,270,000$ 56,659,311$ 152,701,000$ 54,312,650$
Interest Rate: 5.000% - 5.250%
To Fund a Portion ofthe Courthouse
Special Revenue Bonds,Series 2011A
4.000% - 5.000%
Guaranteed Entitlement Bonds, Series 2002; and to refund theLocal Gov't Sales Tax Bonds,
Revenue Bonds, Series 2001Band 2002B; to refund the
Special Revenue RefundingBonds, Series 2012C
To Refund the Excise Taxes
Series 1996 and 2002
-246-
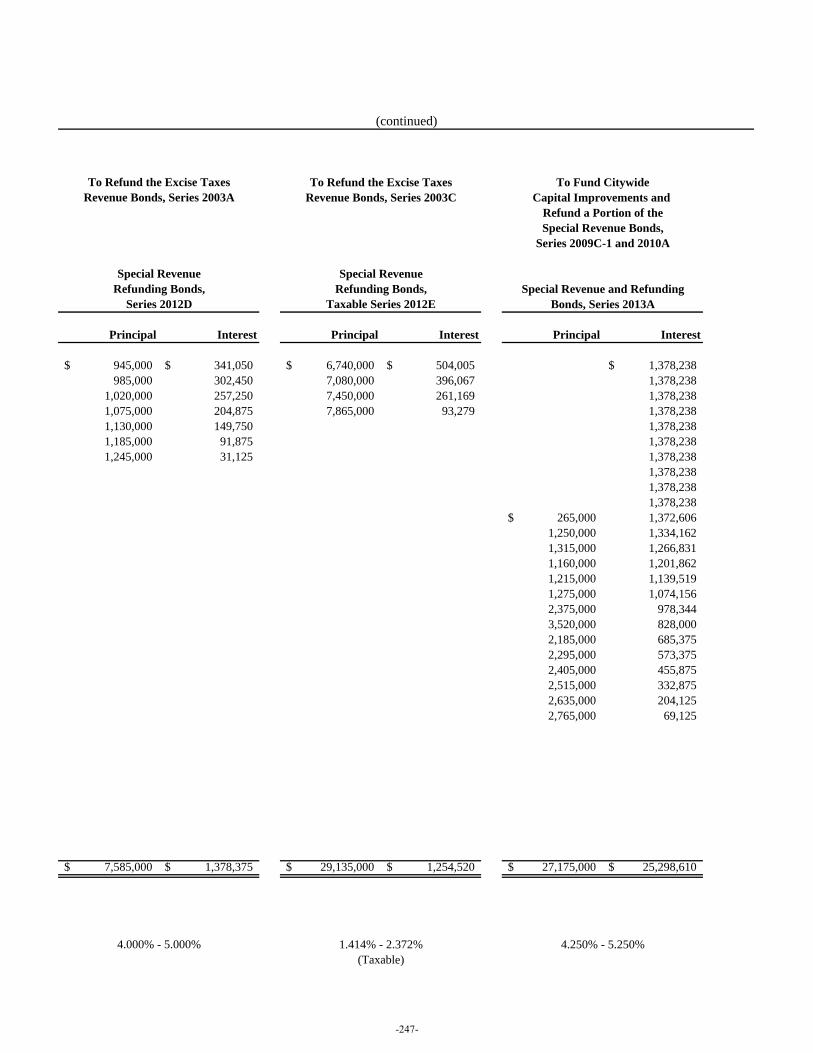
Principal Interest Principal Interest Principal Interest
945,000$ 341,050$ 6,740,000$ 504,005$ 1,378,238$ 985,000 302,450 7,080,000 396,067 1,378,238
1,020,000 257,250 7,450,000 261,169 1,378,238 1,075,000 204,875 7,865,000 93,279 1,378,238 1,130,000 149,750 1,378,238 1,185,000 91,875 1,378,238 1,245,000 31,125 1,378,238
1,378,238 1,378,238 1,378,238
265,000$ 1,372,606 1,250,000 1,334,162 1,315,000 1,266,831 1,160,000 1,201,862 1,215,000 1,139,519 1,275,000 1,074,156 2,375,000 978,344 3,520,000 828,000 2,185,000 685,375 2,295,000 573,375 2,405,000 455,875 2,515,000 332,875 2,635,000 204,125 2,765,000 69,125
7,585,000$ 1,378,375$ 29,135,000$ 1,254,520$ 27,175,000$ 25,298,610$
Refunding Bonds,Taxable Series 2012E
To Refund the Excise TaxesRevenue Bonds, Series 2003A
Special RevenueRefunding Bonds,
Series 2012D
4.000% - 5.000% 1.414% - 2.372%(Taxable)
Special Revenue and RefundingBonds, Series 2013A
4.250% - 5.250%
Special Revenue
(continued)
To Fund CitywideCapital Improvements and
Refund a Portion of theSpecial Revenue Bonds,
Series 2009C-1 and 2010A
To Refund the Excise TaxesRevenue Bonds, Series 2003C
-247-
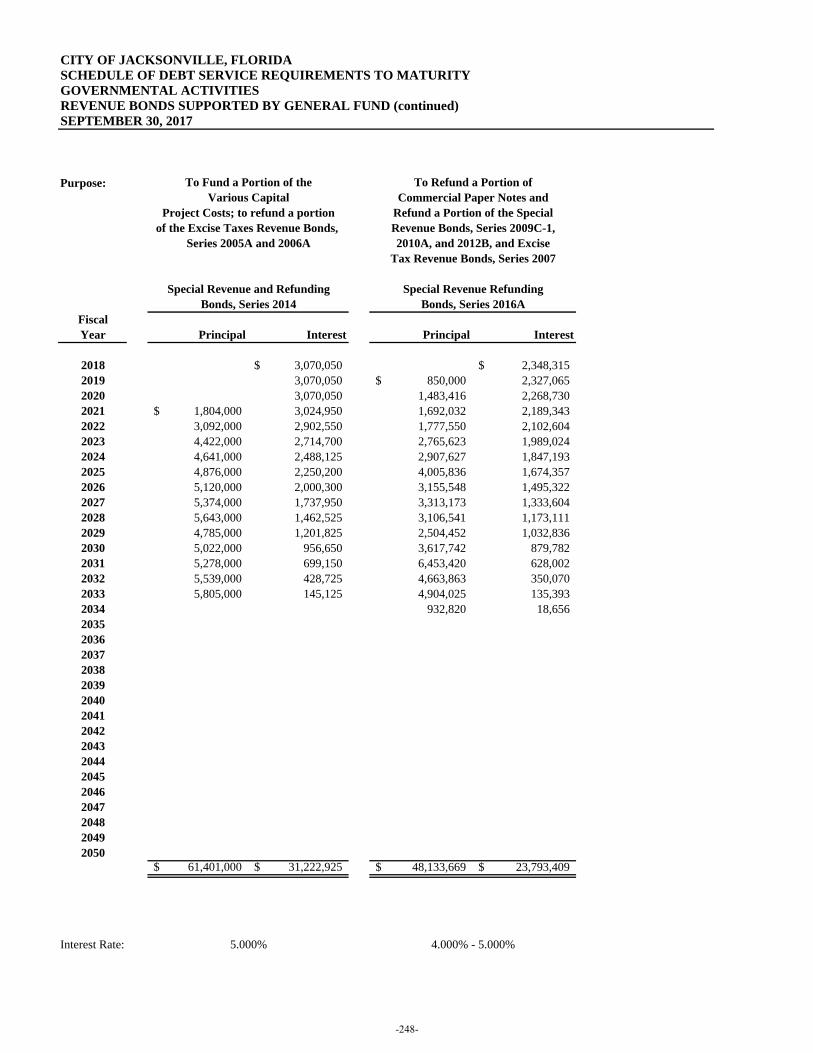
CITY OF JACKSONVILLE, FLORIDASCHEDULE OF DEBT SERVICE REQUIREMENTS TO MATURITYGOVERNMENTAL ACTIVITIESREVENUE BONDS SUPPORTED BY GENERAL FUND (continued)SEPTEMBER 30, 2017
Purpose:
FiscalYear Principal Interest Principal Interest
2018 3,070,050$ 2,348,315$ 2019 3,070,050 850,000$ 2,327,065 2020 3,070,050 1,483,416 2,268,730 2021 1,804,000$ 3,024,950 1,692,032 2,189,343 2022 3,092,000 2,902,550 1,777,550 2,102,604 2023 4,422,000 2,714,700 2,765,623 1,989,024 2024 4,641,000 2,488,125 2,907,627 1,847,193 2025 4,876,000 2,250,200 4,005,836 1,674,357 2026 5,120,000 2,000,300 3,155,548 1,495,322 2027 5,374,000 1,737,950 3,313,173 1,333,604 2028 5,643,000 1,462,525 3,106,541 1,173,111 2029 4,785,000 1,201,825 2,504,452 1,032,836 2030 5,022,000 956,650 3,617,742 879,782 2031 5,278,000 699,150 6,453,420 628,002 2032 5,539,000 428,725 4,663,863 350,070 2033 5,805,000 145,125 4,904,025 135,393 2034 932,820 18,656 2035203620372038203920402041204220432044204520462047204820492050
61,401,000$ 31,222,925$ 48,133,669$ 23,793,409$
Interest Rate:
Special Revenue RefundingBonds, Series 2016A
4.000% - 5.000%
Tax Revenue Bonds, Series 2007
5.000%
Special Revenue and RefundingBonds, Series 2014
of the Excise Taxes Revenue Bonds, Series 2005A and 2006A
To Refund a Portion ofCommercial Paper Notes and
Refund a Portion of the SpecialRevenue Bonds, Series 2009C-1,2010A, and 2012B, and Excise
To Fund a Portion of theVarious Capital
Project Costs; to refund a portion
-248-
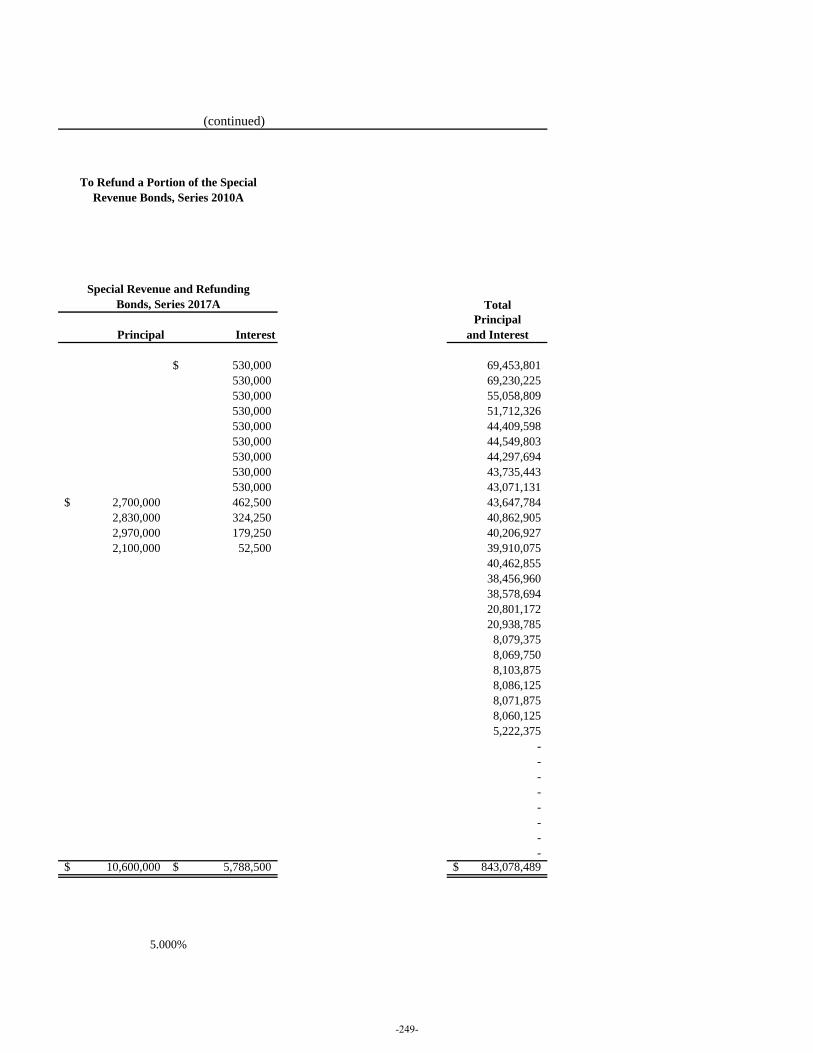
TotalPrincipal
Principal Interest and Interest
530,000$ 69,453,801 530,000 69,230,225 530,000 55,058,809 530,000 51,712,326 530,000 44,409,598 530,000 44,549,803 530,000 44,297,694 530,000 43,735,443 530,000 43,071,131
2,700,000$ 462,500 43,647,784 2,830,000 324,250 40,862,905 2,970,000 179,250 40,206,927 2,100,000 52,500 39,910,075
40,462,855 38,456,960 38,578,694 20,801,172 20,938,785 8,079,375 8,069,750 8,103,875 8,086,125 8,071,875 8,060,125 5,222,375
- - - - - - - -
10,600,000$ 5,788,500$ 843,078,489$
(continued)
To Refund a Portion of the SpecialRevenue Bonds, Series 2010A
Special Revenue and RefundingBonds, Series 2017A
5.000%
-249-
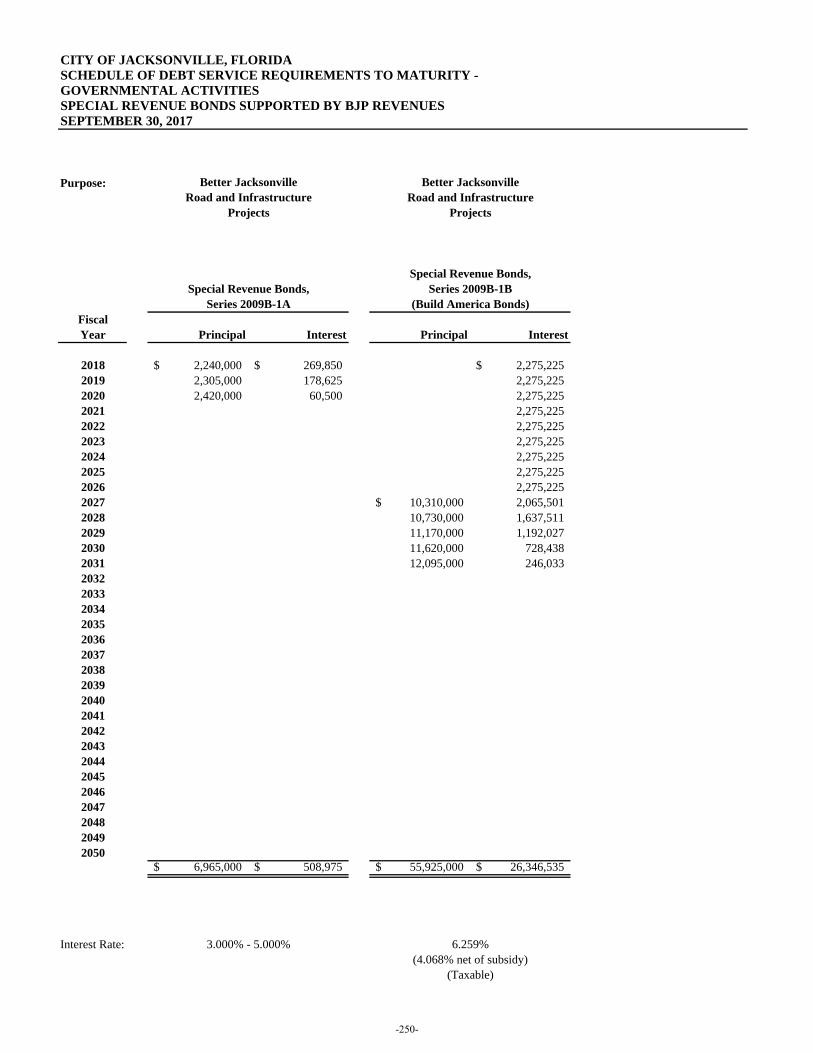
CITY OF JACKSONVILLE, FLORIDASCHEDULE OF DEBT SERVICE REQUIREMENTS TO MATURITY -GOVERNMENTAL ACTIVITIESSPECIAL REVENUE BONDS SUPPORTED BY BJP REVENUESSEPTEMBER 30, 2017
Purpose:
FiscalYear Principal Interest Principal Interest
2018 2,240,000$ 269,850$ 2,275,225$ 2019 2,305,000 178,625 2,275,225 2020 2,420,000 60,500 2,275,225 2021 2,275,225 2022 2,275,225 2023 2,275,225 2024 2,275,225 2025 2,275,225 2026 2,275,225 2027 10,310,000$ 2,065,501 2028 10,730,000 1,637,511 2029 11,170,000 1,192,027 2030 11,620,000 728,438 2031 12,095,000 246,033 2032203320342035203620372038203920402041204220432044204520462047204820492050
6,965,000$ 508,975$ 55,925,000$ 26,346,535$
Interest Rate:
Better JacksonvilleRoad and Infrastructure
Projects
Special Revenue Bonds,Series 2009B-1B
(Build America Bonds)
6.259%(4.068% net of subsidy)
(Taxable)
Better Jacksonville
3.000% - 5.000%
Road and InfrastructureProjects
Special Revenue Bonds,Series 2009B-1A
-250-
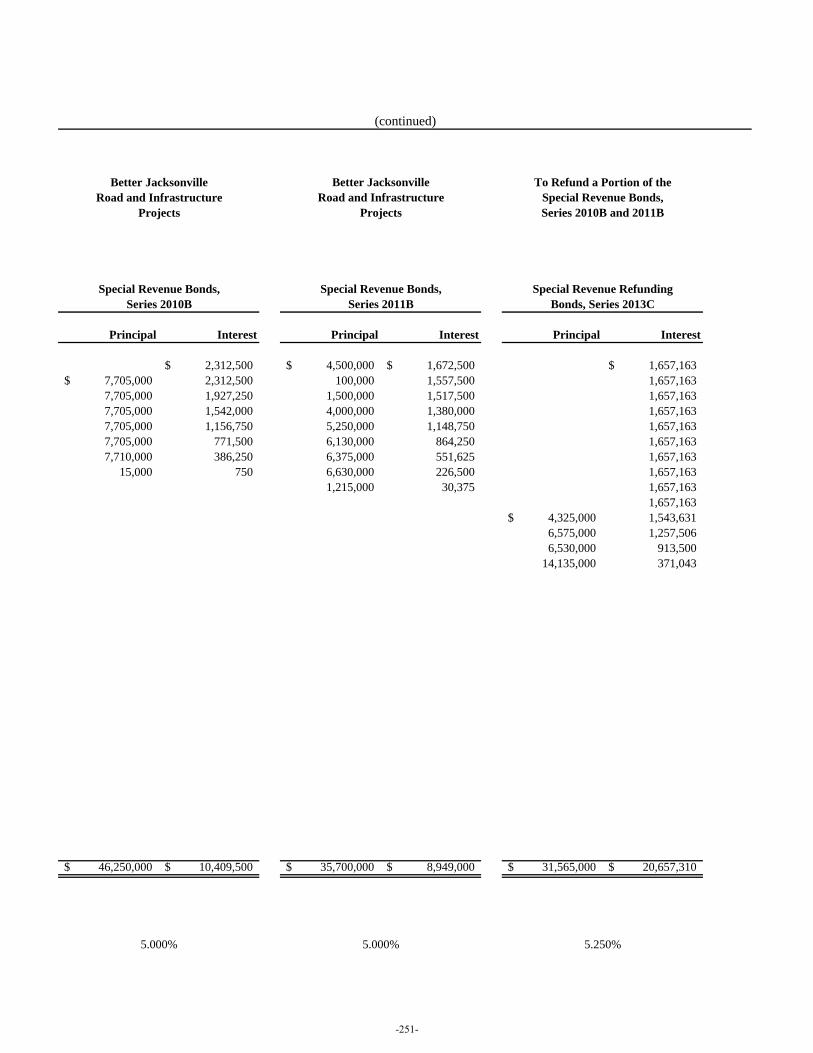
Principal Interest Principal Interest Principal Interest
2,312,500$ 4,500,000$ 1,672,500$ 1,657,163$ 7,705,000$ 2,312,500 100,000 1,557,500 1,657,163 7,705,000 1,927,250 1,500,000 1,517,500 1,657,163 7,705,000 1,542,000 4,000,000 1,380,000 1,657,163 7,705,000 1,156,750 5,250,000 1,148,750 1,657,163 7,705,000 771,500 6,130,000 864,250 1,657,163 7,710,000 386,250 6,375,000 551,625 1,657,163
15,000 750 6,630,000 226,500 1,657,163 1,215,000 30,375 1,657,163
1,657,163 4,325,000$ 1,543,631 6,575,000 1,257,506 6,530,000 913,500
14,135,000 371,043
46,250,000$ 10,409,500$ 35,700,000$ 8,949,000$ 31,565,000$ 20,657,310$
Special Revenue RefundingBonds, Series 2013C
5.250%
Special Revenue Bonds,Series 2010B and 2011B
5.000%
Better JacksonvilleRoad and Infrastructure
Projects
Special Revenue Bonds,Series 2011B
5.000%
(continued)
Better JacksonvilleRoad and Infrastructure
Projects
Special Revenue Bonds,Series 2010B
To Refund a Portion of the
-251-
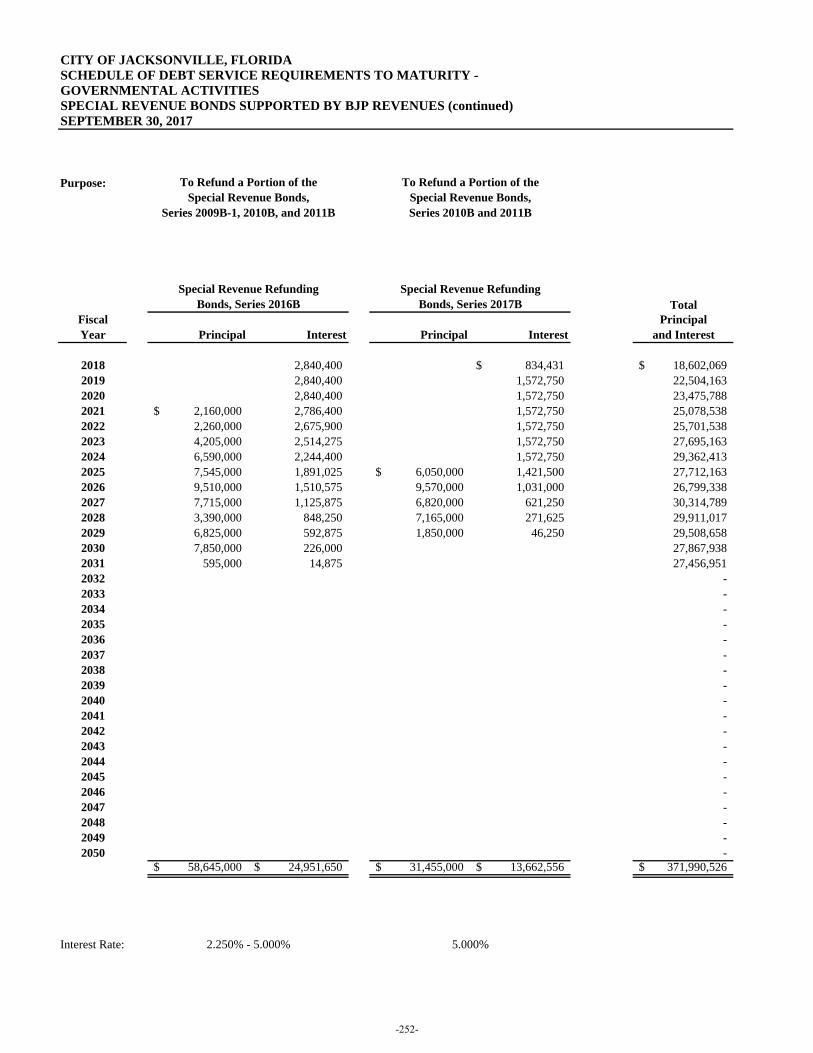
CITY OF JACKSONVILLE, FLORIDASCHEDULE OF DEBT SERVICE REQUIREMENTS TO MATURITY -GOVERNMENTAL ACTIVITIESSPECIAL REVENUE BONDS SUPPORTED BY BJP REVENUES (continued)SEPTEMBER 30, 2017
Purpose:
TotalFiscal PrincipalYear Principal Interest Principal Interest and Interest
2018 2,840,400 834,431$ 18,602,069$ 2019 2,840,400 1,572,750 22,504,163 2020 2,840,400 1,572,750 23,475,788 2021 2,160,000$ 2,786,400 1,572,750 25,078,538 2022 2,260,000 2,675,900 1,572,750 25,701,538 2023 4,205,000 2,514,275 1,572,750 27,695,163 2024 6,590,000 2,244,400 1,572,750 29,362,413 2025 7,545,000 1,891,025 6,050,000$ 1,421,500 27,712,163 2026 9,510,000 1,510,575 9,570,000 1,031,000 26,799,338 2027 7,715,000 1,125,875 6,820,000 621,250 30,314,789 2028 3,390,000 848,250 7,165,000 271,625 29,911,017 2029 6,825,000 592,875 1,850,000 46,250 29,508,658 2030 7,850,000 226,000 27,867,938 2031 595,000 14,875 27,456,951 2032 - 2033 - 2034 - 2035 - 2036 - 2037 - 2038 - 2039 - 2040 - 2041 - 2042 - 2043 - 2044 - 2045 - 2046 - 2047 - 2048 - 2049 - 2050 -
58,645,000$ 24,951,650$ 31,455,000$ 13,662,556$ 371,990,526$
Interest Rate: 5.000%
Special Revenue RefundingBonds, Series 2017B
To Refund a Portion of theSpecial Revenue Bonds,Series 2010B and 2011B
To Refund a Portion of theSpecial Revenue Bonds,
Series 2009B-1, 2010B, and 2011B
Special Revenue RefundingBonds, Series 2016B
2.250% - 5.000%
-252-

(This page is intentionally left blank.)
-253-
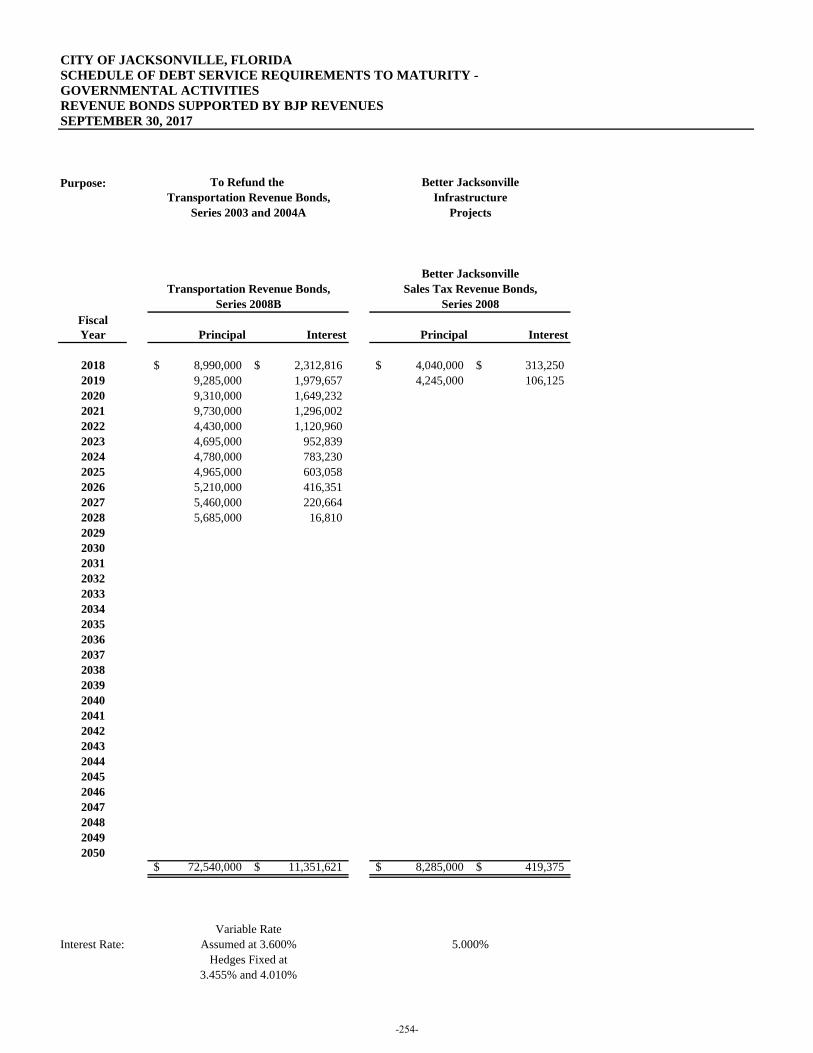
CITY OF JACKSONVILLE, FLORIDASCHEDULE OF DEBT SERVICE REQUIREMENTS TO MATURITY -GOVERNMENTAL ACTIVITIESREVENUE BONDS SUPPORTED BY BJP REVENUESSEPTEMBER 30, 2017
Purpose:
FiscalYear Principal Interest Principal Interest
2018 8,990,000$ 2,312,816$ 4,040,000$ 313,250$ 2019 9,285,000 1,979,657 4,245,000 106,125 2020 9,310,000 1,649,232 2021 9,730,000 1,296,002 2022 4,430,000 1,120,960 2023 4,695,000 952,839 2024 4,780,000 783,230 2025 4,965,000 603,058 2026 5,210,000 416,351 2027 5,460,000 220,664 2028 5,685,000 16,810 2029203020312032203320342035203620372038203920402041204220432044204520462047204820492050
72,540,000$ 11,351,621$ 8,285,000$ 419,375$
Interest Rate:Variable Rate
Assumed at 3.600%Hedges Fixed at
3.455% and 4.010%
Better JacksonvilleTo Refund the Transportation Revenue Bonds,
Series 2003 and 2004A
Transportation Revenue Bonds,Series 2008B
Better JacksonvilleSales Tax Revenue Bonds,
Series 2008
5.000%
InfrastructureProjects
-254-
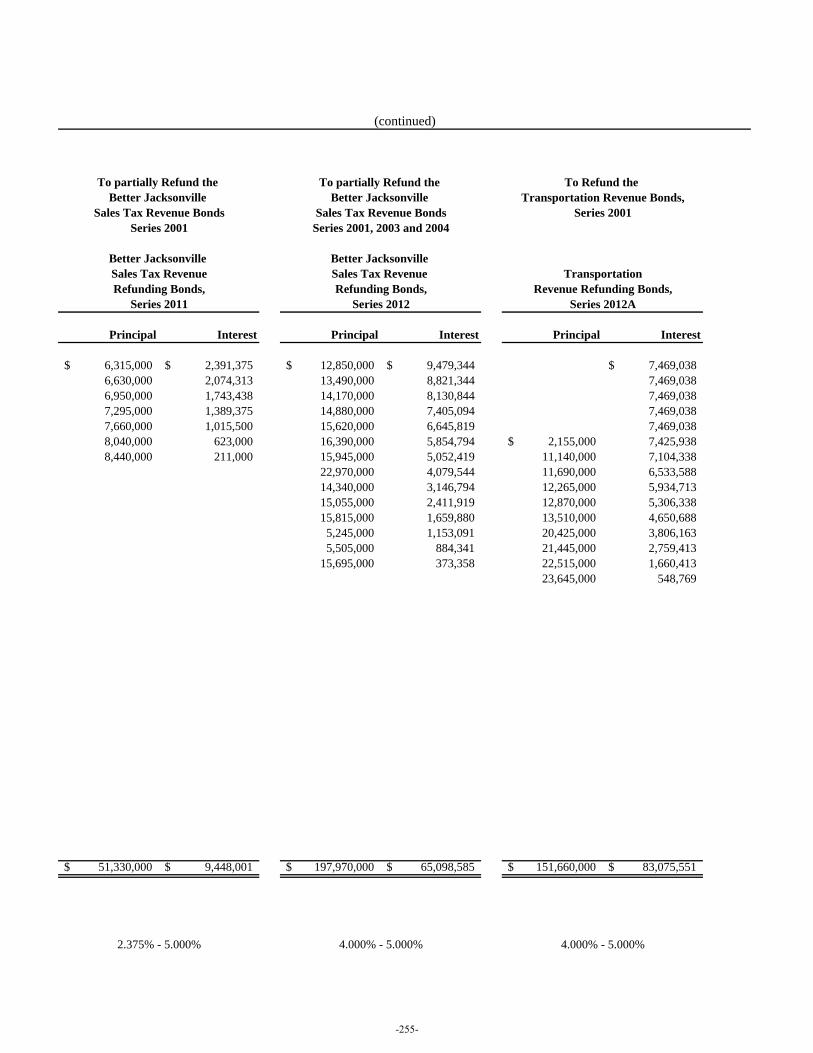
Principal Interest Principal Interest Principal Interest
6,315,000$ 2,391,375$ 12,850,000$ 9,479,344$ 7,469,038$ 6,630,000 2,074,313 13,490,000 8,821,344 7,469,038 6,950,000 1,743,438 14,170,000 8,130,844 7,469,038 7,295,000 1,389,375 14,880,000 7,405,094 7,469,038 7,660,000 1,015,500 15,620,000 6,645,819 7,469,038 8,040,000 623,000 16,390,000 5,854,794 2,155,000$ 7,425,938 8,440,000 211,000 15,945,000 5,052,419 11,140,000 7,104,338
22,970,000 4,079,544 11,690,000 6,533,588 14,340,000 3,146,794 12,265,000 5,934,713 15,055,000 2,411,919 12,870,000 5,306,338 15,815,000 1,659,880 13,510,000 4,650,688 5,245,000 1,153,091 20,425,000 3,806,163 5,505,000 884,341 21,445,000 2,759,413
15,695,000 373,358 22,515,000 1,660,413 23,645,000 548,769
51,330,000$ 9,448,001$ 197,970,000$ 65,098,585$ 151,660,000$ 83,075,551$
(continued)
TransportationRevenue Refunding Bonds,
2.375% - 5.000% 4.000% - 5.000%
Series 2001
Series 2012A
To Refund the Transportation Revenue Bonds,
Series 2001
To partially Refund the Better Jacksonville
Sales Tax Revenue BondsSeries 2001, 2003 and 2004
Better Jacksonville Sales Tax Revenue Refunding Bonds,
Series 2012
4.000% - 5.000%
Better Jacksonville Sales Tax RevenueRefunding Bonds,
Series 2011
To partially Refund the Better Jacksonville
Sales Tax Revenue Bonds
-255-
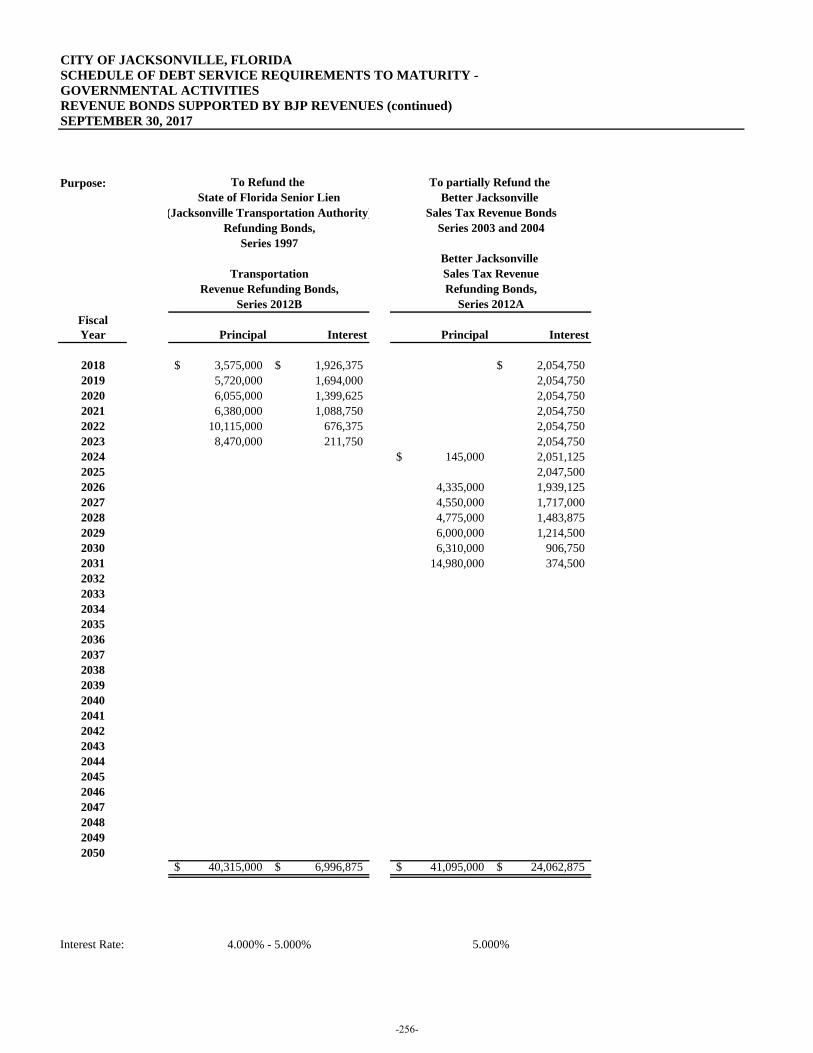
CITY OF JACKSONVILLE, FLORIDASCHEDULE OF DEBT SERVICE REQUIREMENTS TO MATURITY -GOVERNMENTAL ACTIVITIESREVENUE BONDS SUPPORTED BY BJP REVENUES (continued)SEPTEMBER 30, 2017
Purpose:
FiscalYear Principal Interest Principal Interest
2018 3,575,000$ 1,926,375$ 2,054,750$ 2019 5,720,000 1,694,000 2,054,750 2020 6,055,000 1,399,625 2,054,750 2021 6,380,000 1,088,750 2,054,750 2022 10,115,000 676,375 2,054,750 2023 8,470,000 211,750 2,054,750 2024 145,000$ 2,051,125 2025 2,047,500 2026 4,335,000 1,939,125 2027 4,550,000 1,717,000 2028 4,775,000 1,483,875 2029 6,000,000 1,214,500 2030 6,310,000 906,750 2031 14,980,000 374,500 2032203320342035203620372038203920402041204220432044204520462047204820492050
40,315,000$ 6,996,875$ 41,095,000$ 24,062,875$
Interest Rate: 5.000%
Better Jacksonville Sales Tax RevenueRefunding Bonds,
Series 2012A
To Refund the State of Florida Senior Lien
(Jacksonville Transportation Authority)Refunding Bonds,
Series 1997
TransportationRevenue Refunding Bonds,
Series 2012B
4.000% - 5.000%
To partially Refund the Better Jacksonville
Sales Tax Revenue BondsSeries 2003 and 2004
-256-
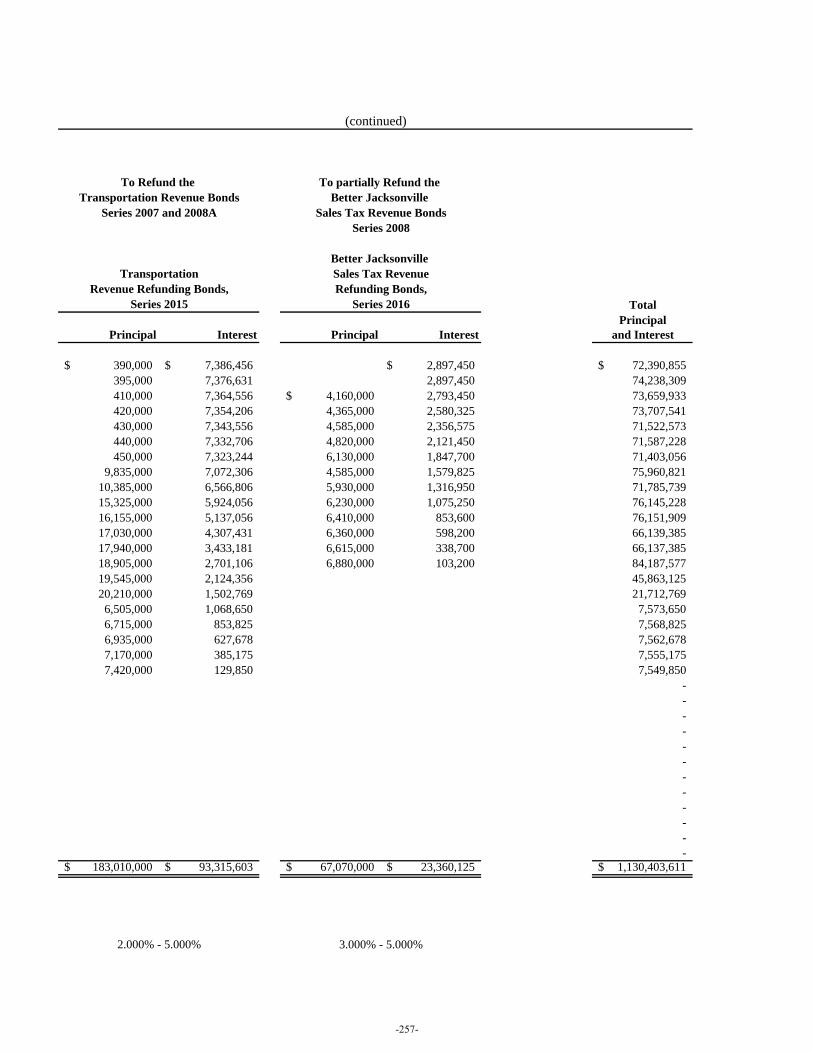
TotalPrincipal
Principal Interest Principal Interest and Interest
390,000$ 7,386,456$ 2,897,450$ 72,390,855$ 395,000 7,376,631 2,897,450 74,238,309 410,000 7,364,556 4,160,000$ 2,793,450 73,659,933 420,000 7,354,206 4,365,000 2,580,325 73,707,541 430,000 7,343,556 4,585,000 2,356,575 71,522,573 440,000 7,332,706 4,820,000 2,121,450 71,587,228 450,000 7,323,244 6,130,000 1,847,700 71,403,056
9,835,000 7,072,306 4,585,000 1,579,825 75,960,821 10,385,000 6,566,806 5,930,000 1,316,950 71,785,739 15,325,000 5,924,056 6,230,000 1,075,250 76,145,228 16,155,000 5,137,056 6,410,000 853,600 76,151,909 17,030,000 4,307,431 6,360,000 598,200 66,139,385 17,940,000 3,433,181 6,615,000 338,700 66,137,385 18,905,000 2,701,106 6,880,000 103,200 84,187,577 19,545,000 2,124,356 45,863,125 20,210,000 1,502,769 21,712,769 6,505,000 1,068,650 7,573,650 6,715,000 853,825 7,568,825 6,935,000 627,678 7,562,678 7,170,000 385,175 7,555,175 7,420,000 129,850 7,549,850
- - - - - - - - - - - -
183,010,000$ 93,315,603$ 67,070,000$ 23,360,125$ 1,130,403,611$
(continued)
3.000% - 5.000%
Better Jacksonville Sales Tax RevenueRefunding Bonds,
Series 2016
To partially Refund the Better Jacksonville
Sales Tax Revenue BondsSeries 2008
To Refund the Transportation Revenue Bonds
Series 2007 and 2008A
TransportationRevenue Refunding Bonds,
Series 2015
2.000% - 5.000%
-257-
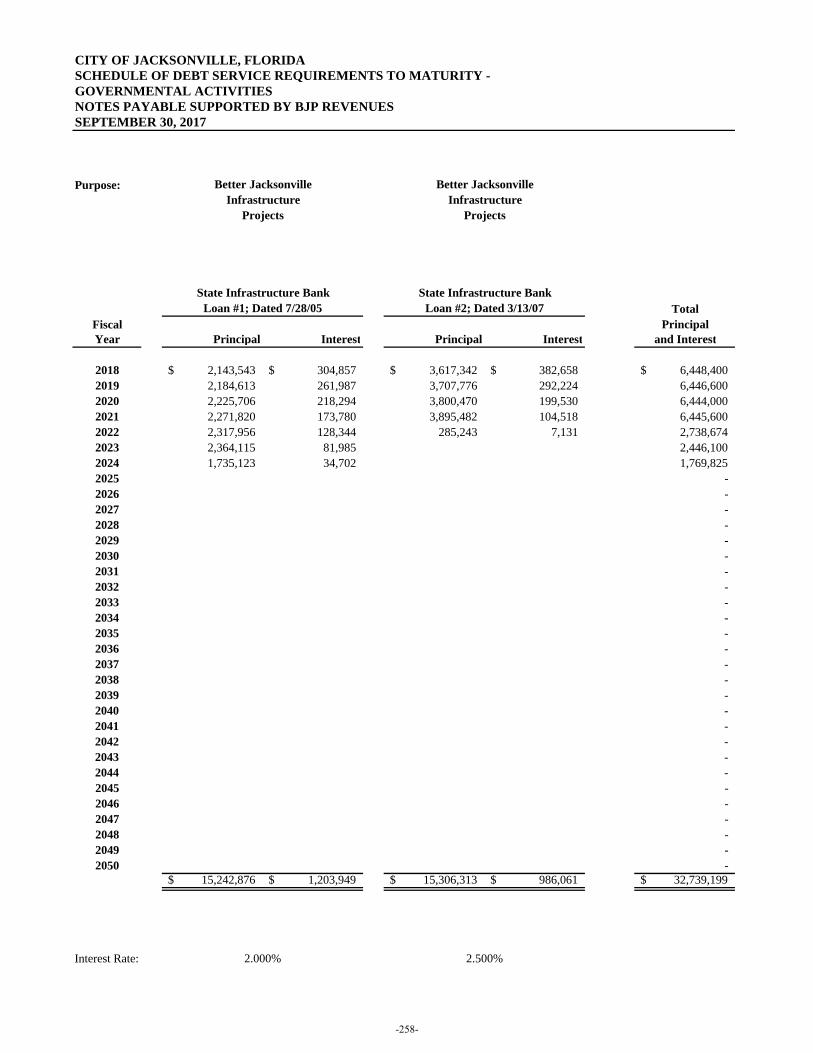
CITY OF JACKSONVILLE, FLORIDASCHEDULE OF DEBT SERVICE REQUIREMENTS TO MATURITY -GOVERNMENTAL ACTIVITIESNOTES PAYABLE SUPPORTED BY BJP REVENUESSEPTEMBER 30, 2017
Purpose:
TotalFiscal PrincipalYear Principal Interest Principal Interest and Interest
2018 2,143,543$ 304,857$ 3,617,342$ 382,658$ 6,448,400$ 2019 2,184,613 261,987 3,707,776 292,224 6,446,600 2020 2,225,706 218,294 3,800,470 199,530 6,444,000 2021 2,271,820 173,780 3,895,482 104,518 6,445,600 2022 2,317,956 128,344 285,243 7,131 2,738,674 2023 2,364,115 81,985 2,446,100 2024 1,735,123 34,702 1,769,825 2025 - 2026 - 2027 - 2028 - 2029 - 2030 - 2031 - 2032 - 2033 - 2034 - 2035 - 2036 - 2037 - 2038 - 2039 - 2040 - 2041 - 2042 - 2043 - 2044 - 2045 - 2046 - 2047 - 2048 - 2049 - 2050 -
15,242,876$ 1,203,949$ 15,306,313$ 986,061$ 32,739,199$
Interest Rate:
Better JacksonvilleInfrastructure
Projects
State Infrastructure BankLoan #1; Dated 7/28/05
Better JacksonvilleInfrastructure
Projects
State Infrastructure BankLoan #2; Dated 3/13/07
2.000% 2.500%
-258-

(This page is intentionally left blank.)
-259-
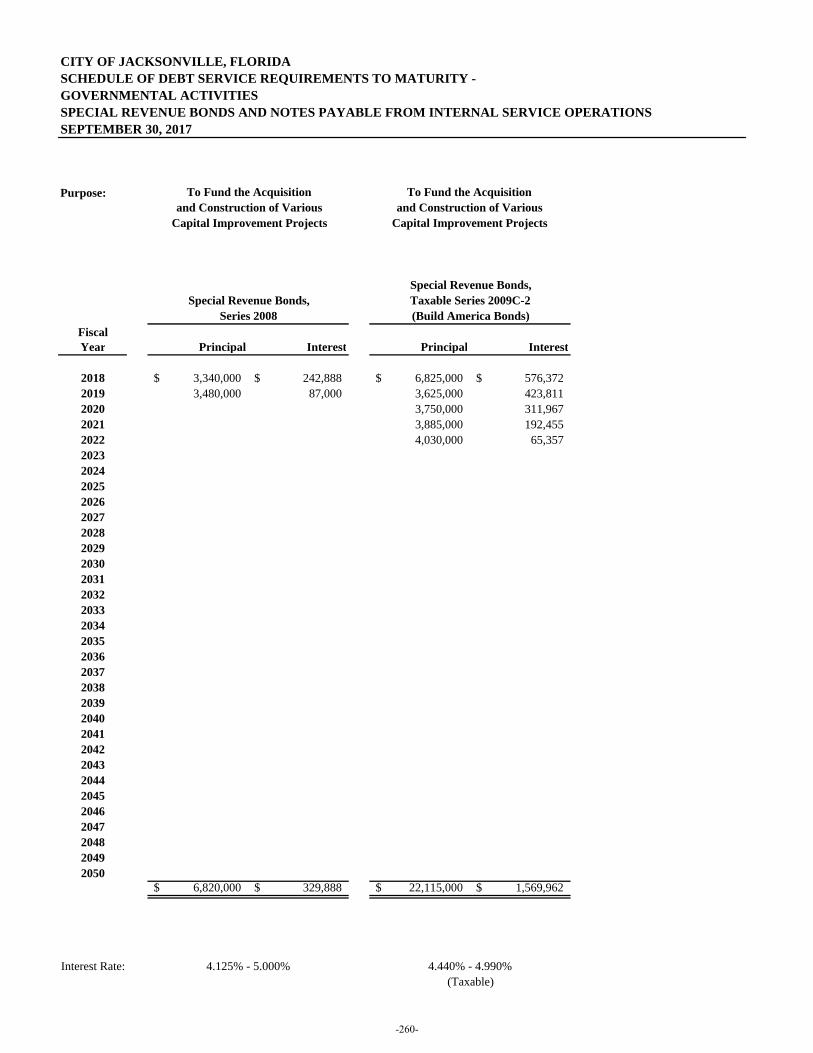
CITY OF JACKSONVILLE, FLORIDASCHEDULE OF DEBT SERVICE REQUIREMENTS TO MATURITY -GOVERNMENTAL ACTIVITIESSPECIAL REVENUE BONDS AND NOTES PAYABLE FROM INTERNAL SERVICE OPERATIONSSEPTEMBER 30, 2017
Purpose:
FiscalYear Principal Interest Principal Interest
2018 3,340,000$ 242,888$ 6,825,000$ 576,372$ 2019 3,480,000 87,000 3,625,000 423,811 2020 3,750,000 311,967 2021 3,885,000 192,455 2022 4,030,000 65,357 2023202420252026202720282029203020312032203320342035203620372038203920402041204220432044204520462047204820492050
6,820,000$ 329,888$ 22,115,000$ 1,569,962$
Interest Rate: 4.440% - 4.990%(Taxable)
Special Revenue Bonds,
Series 2008
4.125% - 5.000%
Special Revenue Bonds,
Capital Improvement Projects
To Fund the Acquisition and Construction of Various
To Fund the Acquisitionand Construction of Various
Capital Improvement Projects
Taxable Series 2009C-2(Build America Bonds)
-260-
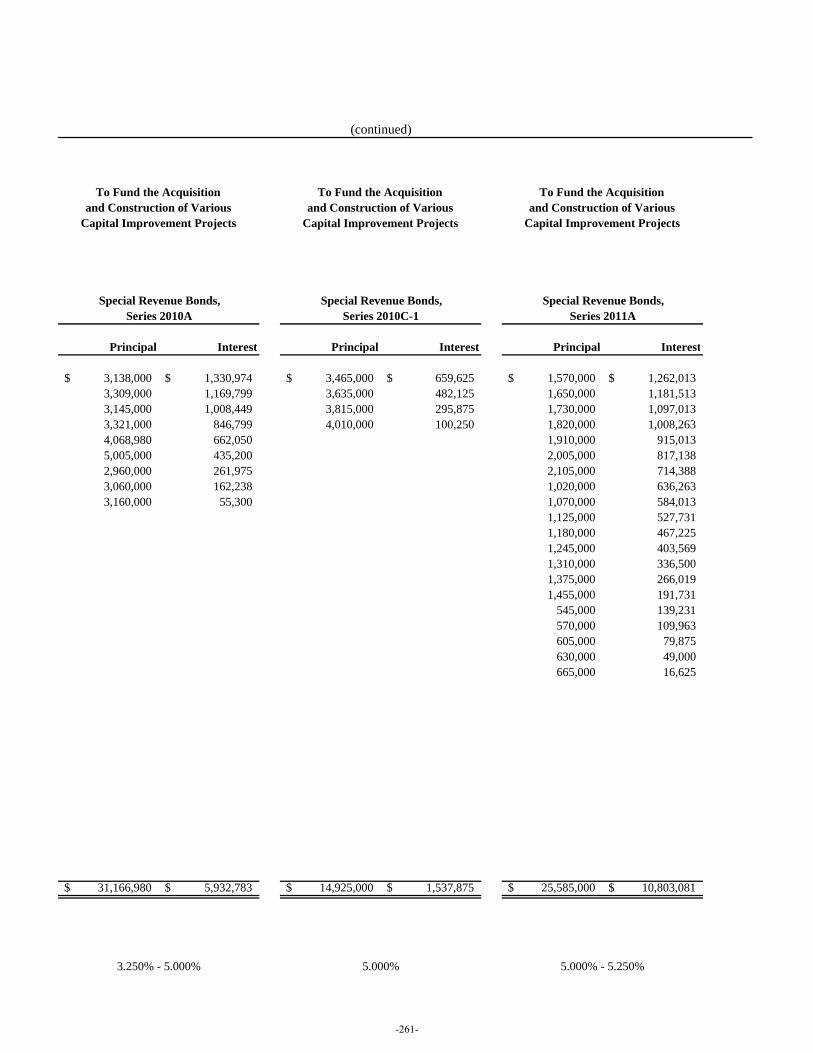
Principal Interest Principal Interest Principal Interest
3,138,000$ 1,330,974$ 3,465,000$ 659,625$ 1,570,000$ 1,262,013$ 3,309,000 1,169,799 3,635,000 482,125 1,650,000 1,181,513 3,145,000 1,008,449 3,815,000 295,875 1,730,000 1,097,013 3,321,000 846,799 4,010,000 100,250 1,820,000 1,008,263 4,068,980 662,050 1,910,000 915,013 5,005,000 435,200 2,005,000 817,138 2,960,000 261,975 2,105,000 714,388 3,060,000 162,238 1,020,000 636,263 3,160,000 55,300 1,070,000 584,013
1,125,000 527,731 1,180,000 467,225 1,245,000 403,569 1,310,000 336,500 1,375,000 266,019 1,455,000 191,731
545,000 139,231 570,000 109,963 605,000 79,875 630,000 49,000 665,000 16,625
31,166,980$ 5,932,783$ 14,925,000$ 1,537,875$ 25,585,000$ 10,803,081$
(continued)
Capital Improvement Projects
Special Revenue Bonds,Series 2010C-1
5.000% - 5.250%
Special Revenue Bonds,Series 2011ASeries 2010A
3.250% - 5.000% 5.000%
To Fund the Acquisition and Construction of Various
Capital Improvement Projects
Special Revenue Bonds,
To Fund the Acquisition and Construction of Various
To Fund the Acquisition and Construction of Various
Capital Improvement Projects
-261-
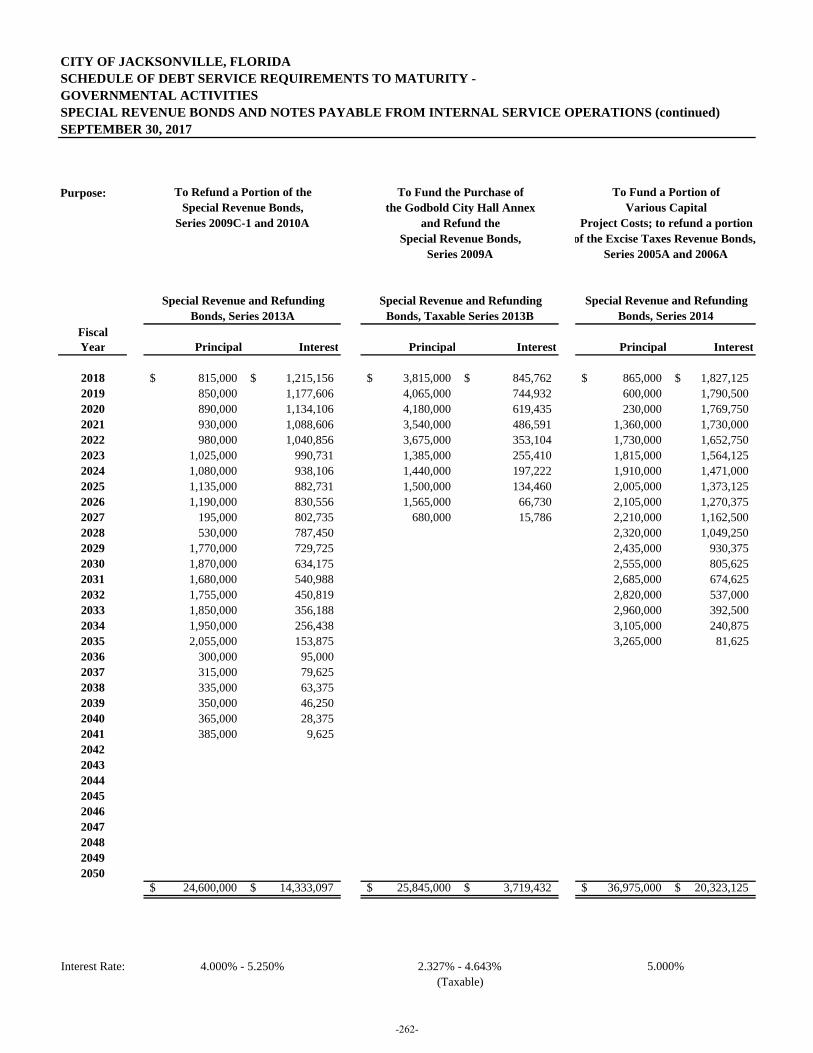
CITY OF JACKSONVILLE, FLORIDASCHEDULE OF DEBT SERVICE REQUIREMENTS TO MATURITY -GOVERNMENTAL ACTIVITIESSPECIAL REVENUE BONDS AND NOTES PAYABLE FROM INTERNAL SERVICE OPERATIONS (continued)SEPTEMBER 30, 2017
Purpose:
FiscalYear Principal Interest Principal Interest Principal Interest
2018 815,000$ 1,215,156$ 3,815,000$ 845,762$ 865,000$ 1,827,125$ 2019 850,000 1,177,606 4,065,000 744,932 600,000 1,790,500 2020 890,000 1,134,106 4,180,000 619,435 230,000 1,769,750 2021 930,000 1,088,606 3,540,000 486,591 1,360,000 1,730,000 2022 980,000 1,040,856 3,675,000 353,104 1,730,000 1,652,750 2023 1,025,000 990,731 1,385,000 255,410 1,815,000 1,564,125 2024 1,080,000 938,106 1,440,000 197,222 1,910,000 1,471,000 2025 1,135,000 882,731 1,500,000 134,460 2,005,000 1,373,125 2026 1,190,000 830,556 1,565,000 66,730 2,105,000 1,270,375 2027 195,000 802,735 680,000 15,786 2,210,000 1,162,500 2028 530,000 787,450 2,320,000 1,049,250 2029 1,770,000 729,725 2,435,000 930,375 2030 1,870,000 634,175 2,555,000 805,625 2031 1,680,000 540,988 2,685,000 674,625 2032 1,755,000 450,819 2,820,000 537,000 2033 1,850,000 356,188 2,960,000 392,500 2034 1,950,000 256,438 3,105,000 240,875 2035 2,055,000 153,875 3,265,000 81,625 2036 300,000 95,000 2037 315,000 79,625 2038 335,000 63,375 2039 350,000 46,250 2040 365,000 28,375 2041 385,000 9,625 204220432044204520462047204820492050
24,600,000$ 14,333,097$ 25,845,000$ 3,719,432$ 36,975,000$ 20,323,125$
Interest Rate:
To Refund a Portion of theSpecial Revenue Bonds,
Series 2009C-1 and 2010A
To Fund a Portion ofVarious Capital
Project Costs; to refund a portion
Special Revenue and RefundingBonds, Series 2014
5.000%
of the Excise Taxes Revenue Bonds,Series 2005A and 2006A
(Taxable)
Bonds, Series 2013A
4.000% - 5.250%
Special Revenue and Refunding
Special Revenue Bonds,Series 2009A
Special Revenue and RefundingBonds, Taxable Series 2013B
2.327% - 4.643%
To Fund the Purchase ofthe Godbold City Hall Annex
and Refund the
-262-
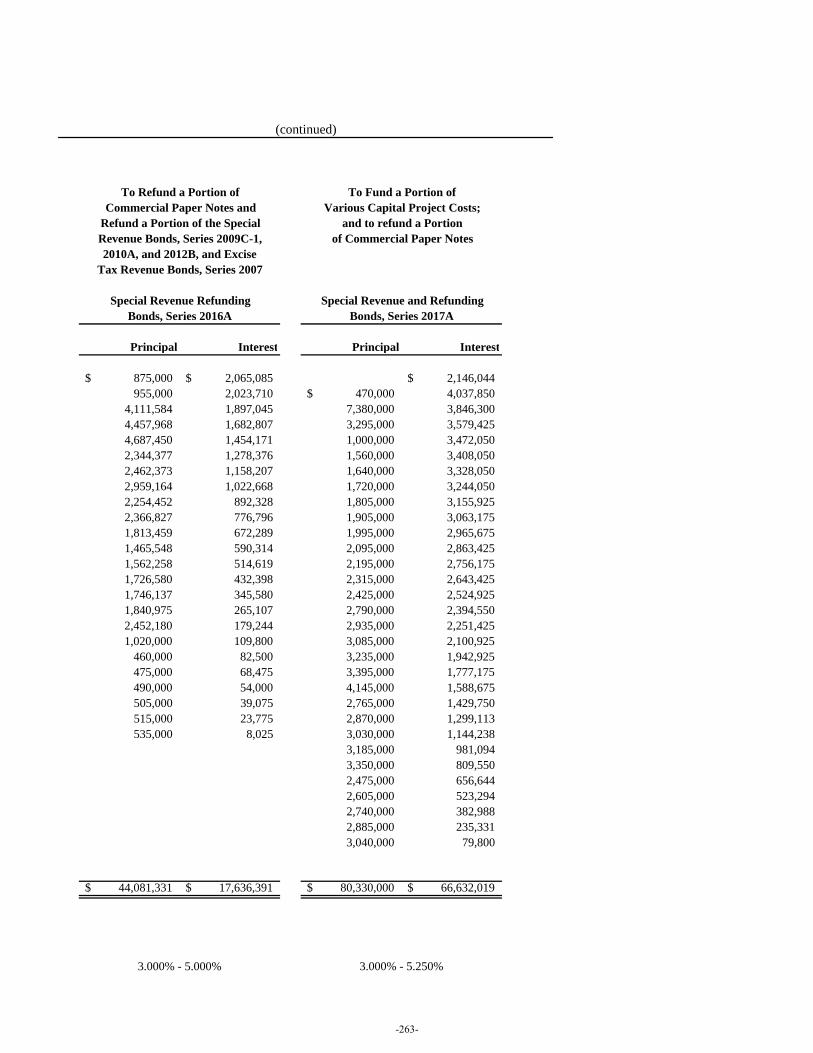
Principal Interest Principal Interest
875,000$ 2,065,085$ 2,146,044$ 955,000 2,023,710 470,000$ 4,037,850
4,111,584 1,897,045 7,380,000 3,846,300 4,457,968 1,682,807 3,295,000 3,579,425 4,687,450 1,454,171 1,000,000 3,472,050 2,344,377 1,278,376 1,560,000 3,408,050 2,462,373 1,158,207 1,640,000 3,328,050 2,959,164 1,022,668 1,720,000 3,244,050 2,254,452 892,328 1,805,000 3,155,925 2,366,827 776,796 1,905,000 3,063,175 1,813,459 672,289 1,995,000 2,965,675 1,465,548 590,314 2,095,000 2,863,425 1,562,258 514,619 2,195,000 2,756,175 1,726,580 432,398 2,315,000 2,643,425 1,746,137 345,580 2,425,000 2,524,925 1,840,975 265,107 2,790,000 2,394,550 2,452,180 179,244 2,935,000 2,251,425 1,020,000 109,800 3,085,000 2,100,925
460,000 82,500 3,235,000 1,942,925 475,000 68,475 3,395,000 1,777,175 490,000 54,000 4,145,000 1,588,675 505,000 39,075 2,765,000 1,429,750 515,000 23,775 2,870,000 1,299,113 535,000 8,025 3,030,000 1,144,238
3,185,000 981,094 3,350,000 809,550 2,475,000 656,644 2,605,000 523,294 2,740,000 382,988 2,885,000 235,331 3,040,000 79,800
44,081,331$ 17,636,391$ 80,330,000$ 66,632,019$
(continued)
Tax Revenue Bonds, Series 2007
Special Revenue RefundingBonds, Series 2016A
3.000% - 5.000%
To Refund a Portion ofCommercial Paper Notes and
Refund a Portion of the SpecialRevenue Bonds, Series 2009C-1,2010A, and 2012B, and Excise
To Fund a Portion ofVarious Capital Project Costs;
and to refund a Portion
Special Revenue and RefundingBonds, Series 2017A
3.000% - 5.250%
of Commercial Paper Notes
-263-
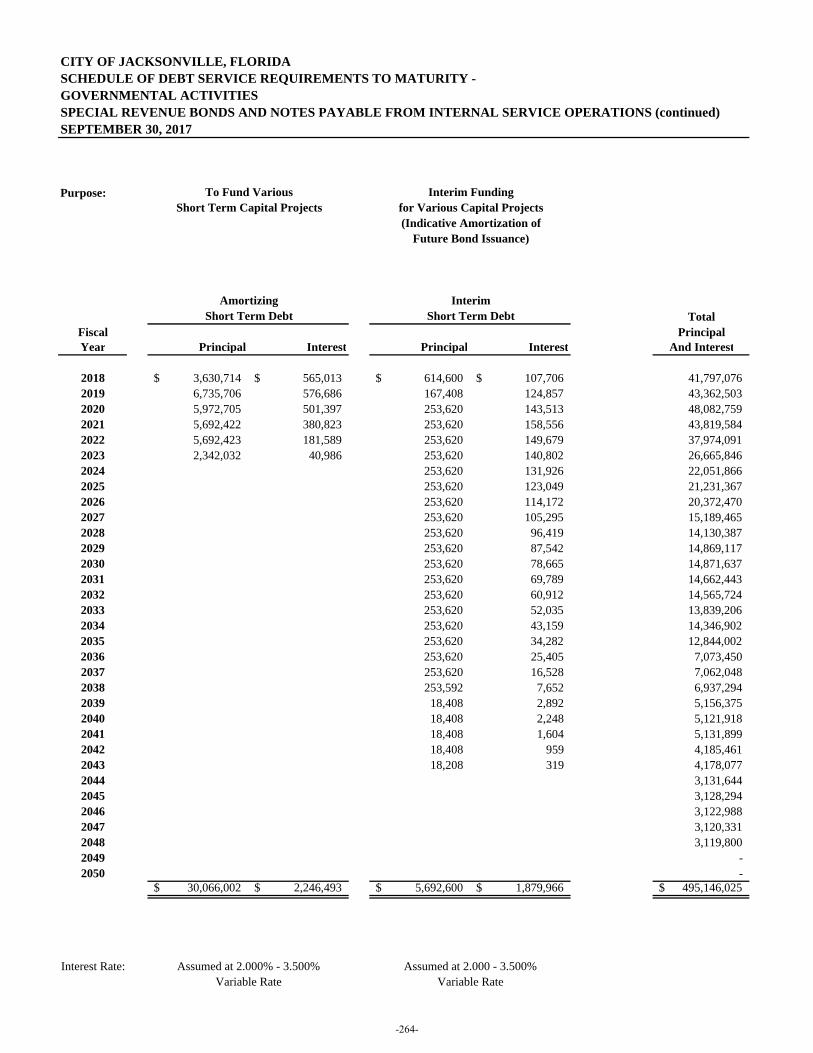
CITY OF JACKSONVILLE, FLORIDASCHEDULE OF DEBT SERVICE REQUIREMENTS TO MATURITY -GOVERNMENTAL ACTIVITIESSPECIAL REVENUE BONDS AND NOTES PAYABLE FROM INTERNAL SERVICE OPERATIONS (continued)SEPTEMBER 30, 2017
Purpose:
TotalFiscal PrincipalYear Principal Interest Principal Interest And Interest
2018 3,630,714$ 565,013$ 614,600$ 107,706$ 41,797,076 2019 6,735,706 576,686 167,408 124,857 43,362,503 2020 5,972,705 501,397 253,620 143,513 48,082,759 2021 5,692,422 380,823 253,620 158,556 43,819,584 2022 5,692,423 181,589 253,620 149,679 37,974,091 2023 2,342,032 40,986 253,620 140,802 26,665,846 2024 253,620 131,926 22,051,866 2025 253,620 123,049 21,231,367 2026 253,620 114,172 20,372,470 2027 253,620 105,295 15,189,465 2028 253,620 96,419 14,130,387 2029 253,620 87,542 14,869,117 2030 253,620 78,665 14,871,637 2031 253,620 69,789 14,662,443 2032 253,620 60,912 14,565,724 2033 253,620 52,035 13,839,206 2034 253,620 43,159 14,346,902 2035 253,620 34,282 12,844,002 2036 253,620 25,405 7,073,450 2037 253,620 16,528 7,062,048 2038 253,592 7,652 6,937,294 2039 18,408 2,892 5,156,375 2040 18,408 2,248 5,121,918 2041 18,408 1,604 5,131,899 2042 18,408 959 4,185,461 2043 18,208 319 4,178,077 2044 3,131,644 2045 3,128,294 2046 3,122,988 2047 3,120,331 2048 3,119,800 2049 - 2050 -
30,066,002$ 2,246,493$ 5,692,600$ 1,879,966$ 495,146,025$
Interest Rate:Variable Rate
Amortizing Interim
To Fund VariousShort Term Capital Projects
Short Term Debt
Assumed at 2.000% - 3.500%
Short Term Debt
Assumed at 2.000 - 3.500%Variable Rate
(Indicative Amortization ofFuture Bond Issuance)
Interim Fundingfor Various Capital Projects
-264-

(This page is intentionally left blank.)
-265-
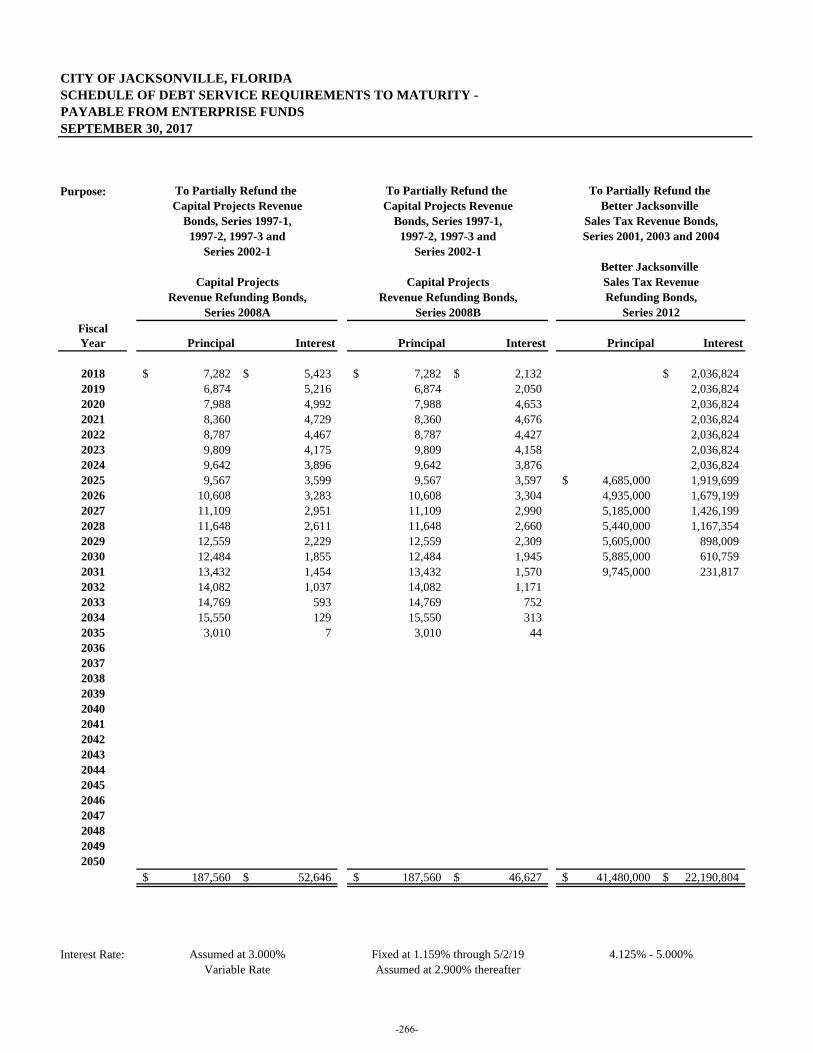
CITY OF JACKSONVILLE, FLORIDASCHEDULE OF DEBT SERVICE REQUIREMENTS TO MATURITY -PAYABLE FROM ENTERPRISE FUNDSSEPTEMBER 30, 2017
Purpose:
FiscalYear Principal Interest Principal Interest Principal Interest
2018 7,282$ 5,423$ 7,282$ 2,132$ 2,036,824$ 2019 6,874 5,216 6,874 2,050 2,036,824 2020 7,988 4,992 7,988 4,653 2,036,824 2021 8,360 4,729 8,360 4,676 2,036,824 2022 8,787 4,467 8,787 4,427 2,036,824 2023 9,809 4,175 9,809 4,158 2,036,824 2024 9,642 3,896 9,642 3,876 2,036,824 2025 9,567 3,599 9,567 3,597 4,685,000$ 1,919,699 2026 10,608 3,283 10,608 3,304 4,935,000 1,679,199 2027 11,109 2,951 11,109 2,990 5,185,000 1,426,199 2028 11,648 2,611 11,648 2,660 5,440,000 1,167,354 2029 12,559 2,229 12,559 2,309 5,605,000 898,009 2030 12,484 1,855 12,484 1,945 5,885,000 610,759 2031 13,432 1,454 13,432 1,570 9,745,000 231,817 2032 14,082 1,037 14,082 1,171 2033 14,769 593 14,769 752 2034 15,550 129 15,550 313 2035 3,010 7 3,010 44 203620372038203920402041204220432044204520462047204820492050
187,560$ 52,646$ 187,560$ 46,627$ 41,480,000$ 22,190,804$
Interest Rate:
1997-2, 1997-3 andSeries 2002-1
Capital ProjectsRevenue Refunding Bonds,
Series 2008B
Variable Rate
To Partially Refund the Capital Projects Revenue
Bonds, Series 1997-1,
To Partially Refund the Capital Projects Revenue
Bonds, Series 1997-1,1997-2, 1997-3 and
Series 2002-1
Capital ProjectsRevenue Refunding Bonds,
Series 2008A
Assumed at 3.000% Fixed at 1.159% through 5/2/19Assumed at 2.900% thereafter
Better Jacksonville Sales Tax RevenueRefunding Bonds,
Series 2012
4.125% - 5.000%
To Partially Refund the Better Jacksonville
Sales Tax Revenue Bonds,Series 2001, 2003 and 2004
-266-

DRAFT
(This page is intentionally left blank.)
-267-
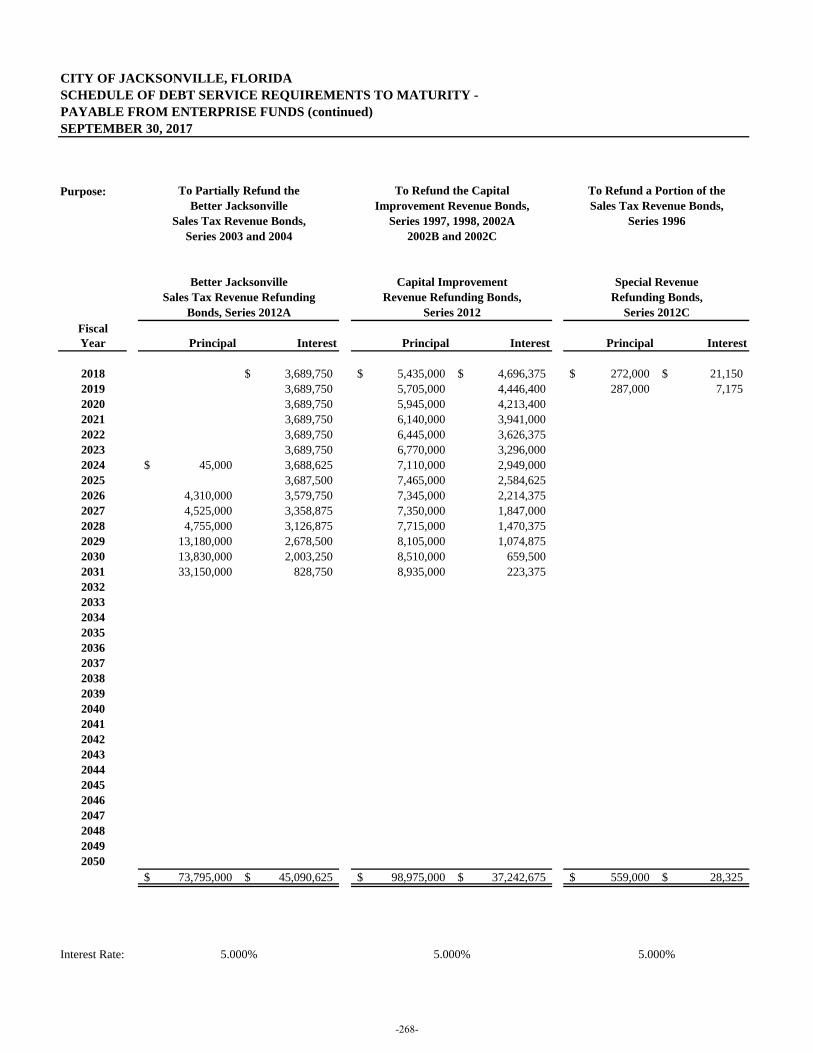
CITY OF JACKSONVILLE, FLORIDASCHEDULE OF DEBT SERVICE REQUIREMENTS TO MATURITY -PAYABLE FROM ENTERPRISE FUNDS (continued)SEPTEMBER 30, 2017
Purpose:
FiscalYear Principal Interest Principal Interest Principal Interest
2018 3,689,750$ 5,435,000$ 4,696,375$ 272,000$ 21,150$ 2019 3,689,750 5,705,000 4,446,400 287,000 7,175 2020 3,689,750 5,945,000 4,213,400 2021 3,689,750 6,140,000 3,941,000 2022 3,689,750 6,445,000 3,626,375 2023 3,689,750 6,770,000 3,296,000 2024 45,000$ 3,688,625 7,110,000 2,949,000 2025 3,687,500 7,465,000 2,584,625 2026 4,310,000 3,579,750 7,345,000 2,214,375 2027 4,525,000 3,358,875 7,350,000 1,847,000 2028 4,755,000 3,126,875 7,715,000 1,470,375 2029 13,180,000 2,678,500 8,105,000 1,074,875 2030 13,830,000 2,003,250 8,510,000 659,500 2031 33,150,000 828,750 8,935,000 223,375 2032203320342035203620372038203920402041204220432044204520462047204820492050
73,795,000$ 45,090,625$ 98,975,000$ 37,242,675$ 559,000$ 28,325$
Interest Rate:
Bonds, Series 2012A
5.000%
Improvement Revenue Bonds,Series 1997, 1998, 2002A
2002B and 2002C
To Partially Refund theBetter Jacksonville
Sales Tax Revenue Bonds,Series 2003 and 2004
Better JacksonvilleSales Tax Revenue Refunding
To Refund a Portion of theSales Tax Revenue Bonds,
Series 1996
Special RevenueRefunding Bonds,
Series 2012C
5.000%
Capital ImprovementRevenue Refunding Bonds,
Series 2012
5.000%
To Refund the Capital
-268-
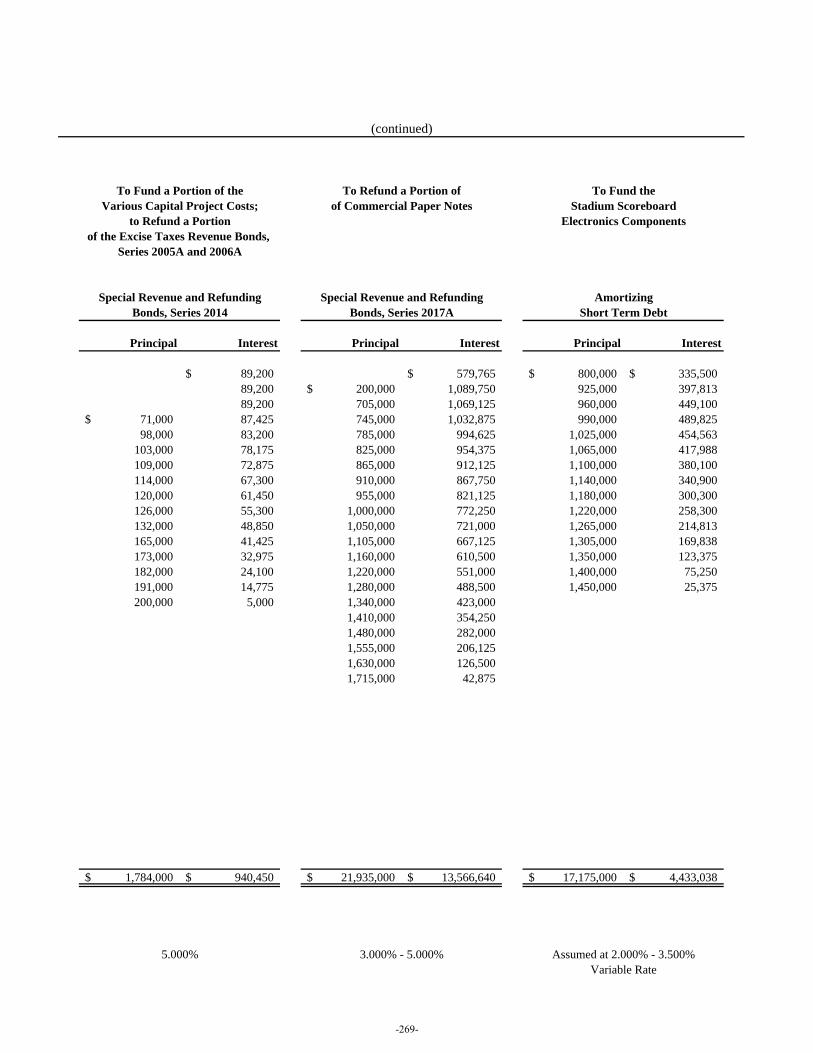
Principal Interest Principal Interest Principal Interest
89,200$ 579,765$ 800,000$ 335,500$ 89,200 200,000$ 1,089,750 925,000 397,813 89,200 705,000 1,069,125 960,000 449,100
71,000$ 87,425 745,000 1,032,875 990,000 489,825 98,000 83,200 785,000 994,625 1,025,000 454,563
103,000 78,175 825,000 954,375 1,065,000 417,988 109,000 72,875 865,000 912,125 1,100,000 380,100 114,000 67,300 910,000 867,750 1,140,000 340,900 120,000 61,450 955,000 821,125 1,180,000 300,300 126,000 55,300 1,000,000 772,250 1,220,000 258,300 132,000 48,850 1,050,000 721,000 1,265,000 214,813 165,000 41,425 1,105,000 667,125 1,305,000 169,838 173,000 32,975 1,160,000 610,500 1,350,000 123,375 182,000 24,100 1,220,000 551,000 1,400,000 75,250 191,000 14,775 1,280,000 488,500 1,450,000 25,375 200,000 5,000 1,340,000 423,000
1,410,000 354,250 1,480,000 282,000 1,555,000 206,125 1,630,000 126,500 1,715,000 42,875
1,784,000$ 940,450$ 21,935,000$ 13,566,640$ 17,175,000$ 4,433,038$
(continued)
of Commercial Paper Notes
Special Revenue and RefundingBonds, Series 2017A
3.000% - 5.000%
To Fund theStadium Scoreboard
Electronics Components
AmortizingShort Term Debt
Variable RateAssumed at 2.000% - 3.500%
Special Revenue and RefundingBonds, Series 2014
5.000%
To Fund a Portion of theVarious Capital Project Costs;
to Refund a Portionof the Excise Taxes Revenue Bonds,
Series 2005A and 2006A
To Refund a Portion of
-269-
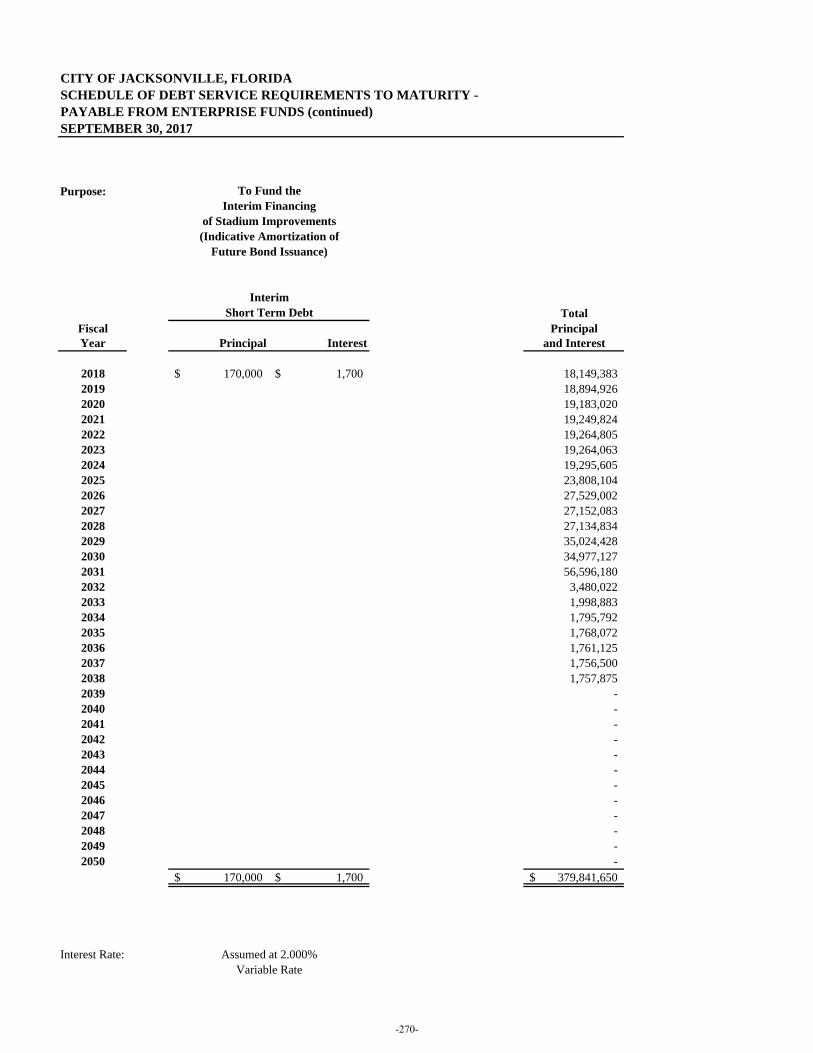
CITY OF JACKSONVILLE, FLORIDASCHEDULE OF DEBT SERVICE REQUIREMENTS TO MATURITY -PAYABLE FROM ENTERPRISE FUNDS (continued)SEPTEMBER 30, 2017
Purpose:
TotalFiscal PrincipalYear Principal Interest and Interest
2018 170,000$ 1,700$ 18,149,383 2019 18,894,926 2020 19,183,020 2021 19,249,824 2022 19,264,805 2023 19,264,063 2024 19,295,605 2025 23,808,104 2026 27,529,002 2027 27,152,083 2028 27,134,834 2029 35,024,428 2030 34,977,127 2031 56,596,180 2032 3,480,022 2033 1,998,883 2034 1,795,792 2035 1,768,072 2036 1,761,125 2037 1,756,500 2038 1,757,875 2039 - 2040 - 2041 - 2042 - 2043 - 2044 - 2045 - 2046 - 2047 - 2048 - 2049 - 2050 -
170,000$ 1,700$ 379,841,650$
Interest Rate:Variable Rate
InterimShort Term Debt
Assumed at 2.000%
To Fund theInterim Financing
of Stadium Improvements(Indicative Amortization of
Future Bond Issuance)
-270-

(This page is intentionally left blank.)
-271-
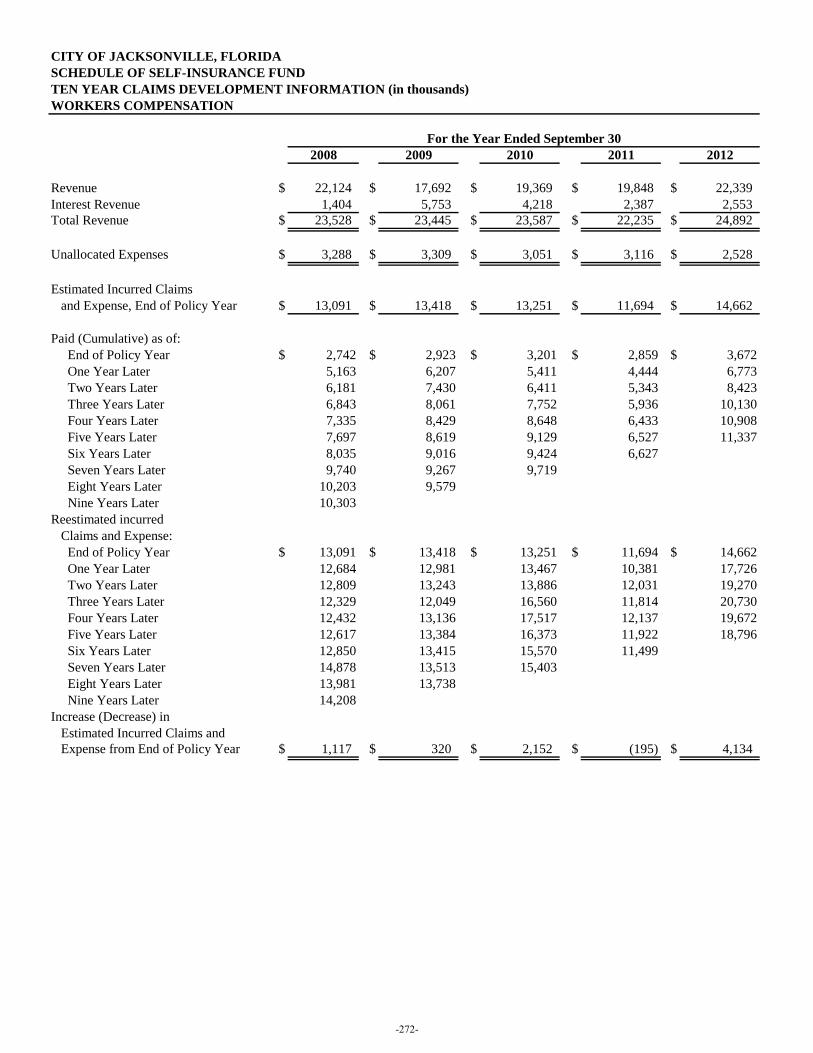
2008 2009 2010 2011 2012
Revenue $ 22,124 $ 17,692 $ 19,369 $ 19,848 $ 22,339
Interest Revenue 1,404 5,753 4,218 2,387 2,553
Total Revenue $ 23,528 $ 23,445 $ 23,587 $ 22,235 $ 24,892
Unallocated Expenses $ 3,288 $ 3,309 $ 3,051 $ 3,116 $ 2,528
Estimated Incurred Claims
and Expense, End of Policy Year $ 13,091 $ 13,418 $ 13,251 $ 11,694 $ 14,662
Paid (Cumulative) as of:
End of Policy Year $ 2,742 $ 2,923 $ 3,201 $ 2,859 $ 3,672
One Year Later 5,163 6,207 5,411 4,444 6,773
Two Years Later 6,181 7,430 6,411 5,343 8,423
Three Years Later 6,843 8,061 7,752 5,936 10,130
Four Years Later 7,335 8,429 8,648 6,433 10,908
Five Years Later 7,697 8,619 9,129 6,527 11,337
Six Years Later 8,035 9,016 9,424 6,627
Seven Years Later 9,740 9,267 9,719
Eight Years Later 10,203 9,579
Nine Years Later 10,303
Reestimated incurred
Claims and Expense:
End of Policy Year $ 13,091 $ 13,418 $ 13,251 $ 11,694 $ 14,662
One Year Later 12,684 12,981 13,467 10,381 17,726
Two Years Later 12,809 13,243 13,886 12,031 19,270
Three Years Later 12,329 12,049 16,560 11,814 20,730
Four Years Later 12,432 13,136 17,517 12,137 19,672
Five Years Later 12,617 13,384 16,373 11,922 18,796
Six Years Later 12,850 13,415 15,570 11,499
Seven Years Later 14,878 13,513 15,403
Eight Years Later 13,981 13,738
Nine Years Later 14,208
Increase (Decrease) in
Estimated Incurred Claims and
Expense from End of Policy Year $ 1,117 $ 320 $ 2,152 $ (195) $ 4,134
CITY OF JACKSONVILLE, FLORIDA
SCHEDULE OF SELF-INSURANCE FUND
For the Year Ended September 30
TEN YEAR CLAIMS DEVELOPMENT INFORMATION (in thousands)
WORKERS COMPENSATION
-272-
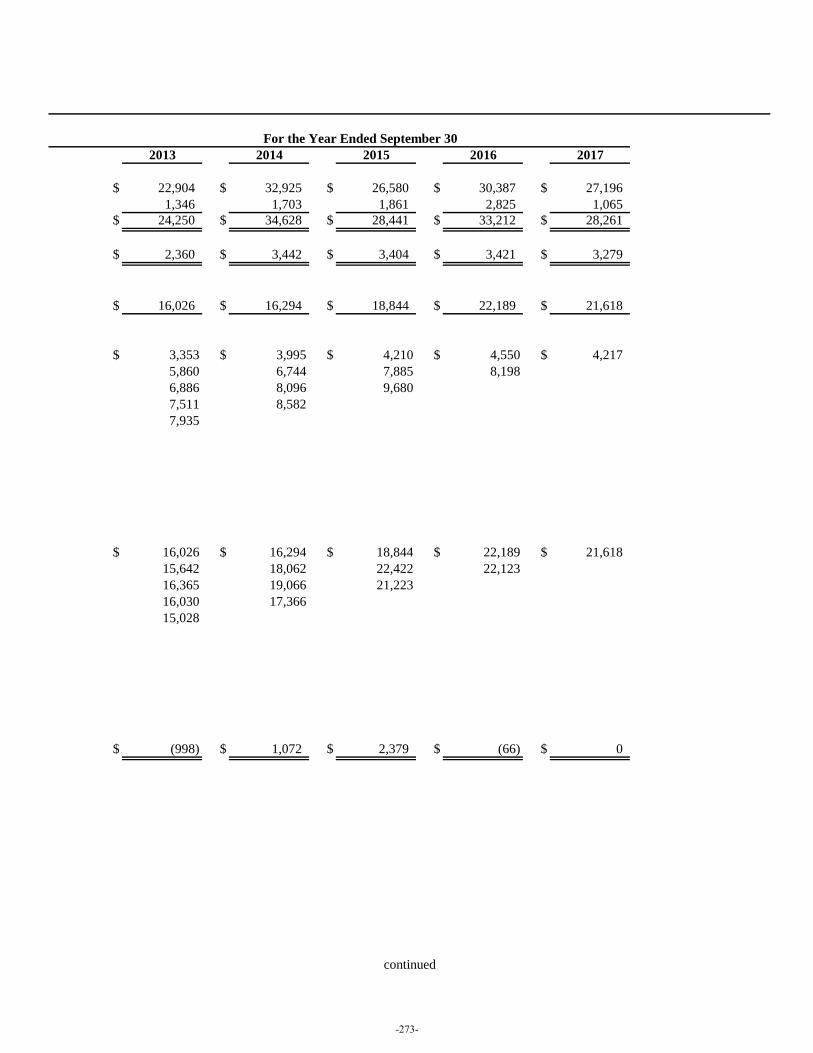
2013 2014 2015 2016 2017
$ 22,904 $ 32,925 $ 26,580 $ 30,387 $ 27,196
1,346 1,703 1,861 2,825 1,065
$ 24,250 $ 34,628 $ 28,441 $ 33,212 $ 28,261
$ 2,360 $ 3,442 $ 3,404 $ 3,421 $ 3,279
$ 16,026 $ 16,294 $ 18,844 $ 22,189 $ 21,618
$ 3,353 $ 3,995 $ 4,210 $ 4,550 $ 4,217
5,860 6,744 7,885 8,198
6,886 8,096 9,680
7,511 8,582
7,935
$ 16,026 $ 16,294 $ 18,844 $ 22,189 $ 21,618
15,642 18,062 22,422 22,123
16,365 19,066 21,223
16,030 17,366
15,028
$ (998) $ 1,072 $ 2,379 $ (66) $ 0
continued
For the Year Ended September 30
-273-
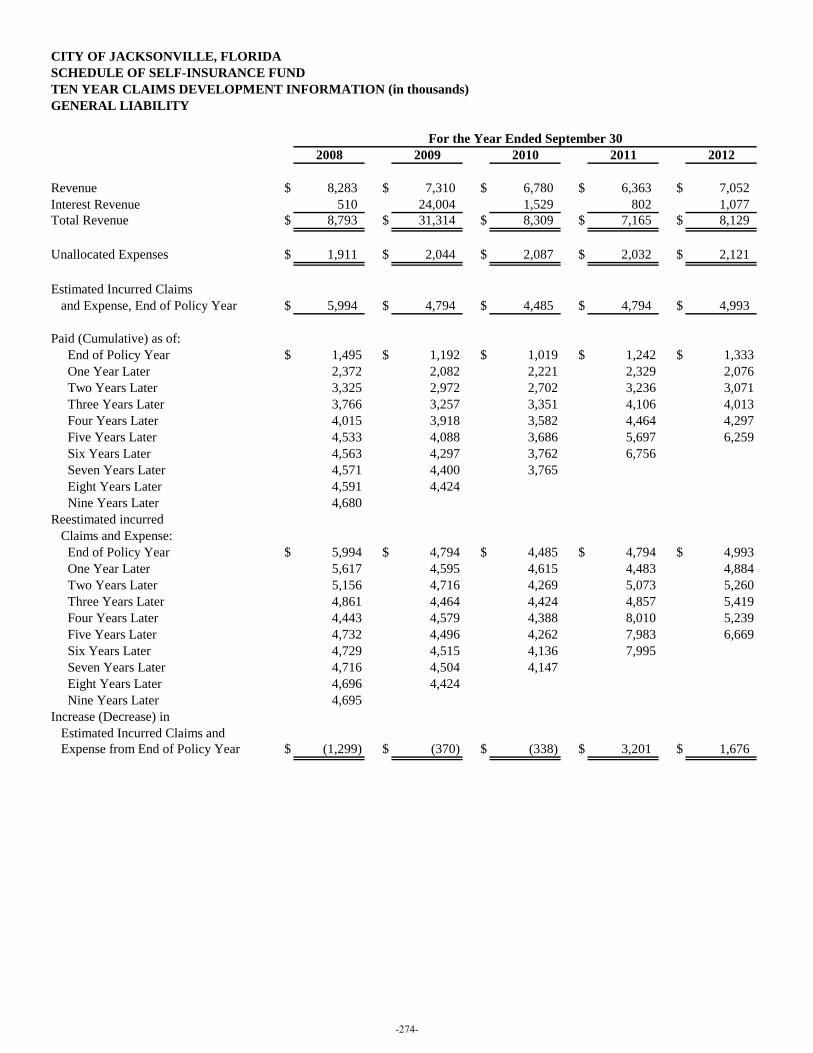
2008 2009 2010 2011 2012
Revenue $ 8,283 $ 7,310 $ 6,780 $ 6,363 $ 7,052
Interest Revenue 510 24,004 1,529 802 1,077
Total Revenue $ 8,793 $ 31,314 $ 8,309 $ 7,165 $ 8,129
Unallocated Expenses $ 1,911 $ 2,044 $ 2,087 $ 2,032 $ 2,121
Estimated Incurred Claims
and Expense, End of Policy Year $ 5,994 $ 4,794 $ 4,485 $ 4,794 $ 4,993
Paid (Cumulative) as of:
End of Policy Year $ 1,495 $ 1,192 $ 1,019 $ 1,242 $ 1,333
One Year Later 2,372 2,082 2,221 2,329 2,076
Two Years Later 3,325 2,972 2,702 3,236 3,071
Three Years Later 3,766 3,257 3,351 4,106 4,013
Four Years Later 4,015 3,918 3,582 4,464 4,297
Five Years Later 4,533 4,088 3,686 5,697 6,259
Six Years Later 4,563 4,297 3,762 6,756
Seven Years Later 4,571 4,400 3,765
Eight Years Later 4,591 4,424
Nine Years Later 4,680
Reestimated incurred
Claims and Expense:
End of Policy Year $ 5,994 $ 4,794 $ 4,485 $ 4,794 $ 4,993
One Year Later 5,617 4,595 4,615 4,483 4,884
Two Years Later 5,156 4,716 4,269 5,073 5,260
Three Years Later 4,861 4,464 4,424 4,857 5,419
Four Years Later 4,443 4,579 4,388 8,010 5,239
Five Years Later 4,732 4,496 4,262 7,983 6,669
Six Years Later 4,729 4,515 4,136 7,995
Seven Years Later 4,716 4,504 4,147
Eight Years Later 4,696 4,424
Nine Years Later 4,695
Increase (Decrease) in
Estimated Incurred Claims and
Expense from End of Policy Year $ (1,299) $ (370) $ (338) $ 3,201 $ 1,676
GENERAL LIABILITY
For the Year Ended September 30
CITY OF JACKSONVILLE, FLORIDA
SCHEDULE OF SELF-INSURANCE FUND
TEN YEAR CLAIMS DEVELOPMENT INFORMATION (in thousands)
-274-

2013 2014 2015 2016 2017
$ 8,129 $ 8,186 $ 10,494 $ 8,170 $ 9,341
648 644 594 857 376
$ 8,777 $ 8,830 $ 11,088 $ 9,027 $ 9,717
$ 2,109 $ 2,240 $ 2,301 $ 2,340 $ 2,469
$ 4,715 $ 5,126 $ 5,623 $ 5,827 $ 6,144
$ 1,126 $ 1,395 $ 1,372 $ 1,349 $ 1,227
2,025 3,084 3,119 2,458
3,311 4,066 4,089
4,349 5,044
4,768
$ 4,715 $ 5,126 $ 5,623 $ 5,827 $ 6,144
4,884 6,393 6,177 5,553
5,232 6,237 6,047
5,362 6,334
5,469
$ 754 $ 1,208 $ 424 $ (274) $ 0
continued
For the Year Ended September 30
-275-
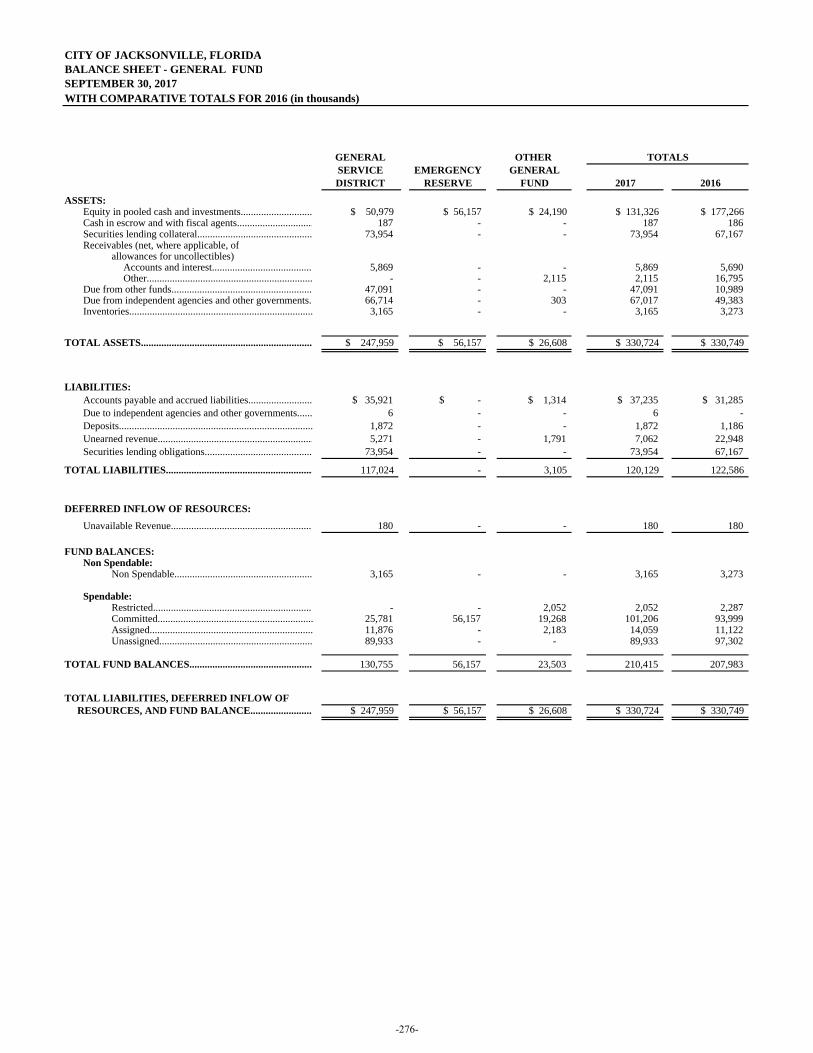
CITY OF JACKSONVILLE, FLORIDABALANCE SHEET - GENERAL FUNDSEPTEMBER 30, 2017WITH COMPARATIVE TOTALS FOR 2016 (in thousands)
GENERAL OTHER TOTALSSERVICE EMERGENCY GENERALDISTRICT RESERVE FUND 2017 2016
ASSETS:Equity in pooled cash and investments............................ $ 50,979 $ 56,157 $ 24,190 $ 131,326 $ 177,266 Cash in escrow and with fiscal agents.............................. 187 - - 187 186 Securities lending collateral............................................. 73,954 - - 73,954 67,167 Receivables (net, where applicable, of
allowances for uncollectibles): Accounts and interest........................................ 5,869 - - 5,869 5,690 Other................................................................. - - 2,115 2,115 16,795
Due from other funds........................................................ 47,091 - - 47,091 10,989 Due from independent agencies and other governments.. 66,714 - 303 67,017 49,383 Inventories........................................................................ 3,165 - - 3,165 3,273
TOTAL ASSETS.................................................................... $ 247,959 $ 56,157 $ 26,608 $ 330,724 $ 330,749
LIABILITIES:Accounts payable and accrued liabilities......................... $ 35,921 $ - $ 1,314 $ 37,235 $ 31,285Due to independent agencies and other governments...... 6 - - 6 - Deposits............................................................................ 1,872 - - 1,872 1,186 Unearned revenue............................................................. 5,271 - 1,791 7,062 22,948 Securities lending obligations........................................... 73,954 - - 73,954 67,167
TOTAL LIABILITIES.......................................................... 117,024 - 3,105 120,129 122,586
DEFERRED INFLOW OF RESOURCES:
Unavailable Revenue........................................................ 180 - - 180 180
FUND BALANCES: Non Spendable:
Non Spendable...................................................... 3,165 - - 3,165 3,273
Spendable: Restricted............................................................... - - 2,052 2,052 2,287 Committed............................................................. 25,781 56,157 19,268 101,206 93,999 Assigned................................................................ 11,876 - 2,183 14,059 11,122 Unassigned............................................................ 89,933 - - 89,933 97,302
TOTAL FUND BALANCES................................................. 130,755 56,157 23,503 210,415 207,983
TOTAL LIABILITIES, DEFERRED INFLOW OF RESOURCES, AND FUND BALANCE......................... $ 247,959 $ 56,157 $ 26,608 $ 330,724 $ 330,749
-276-
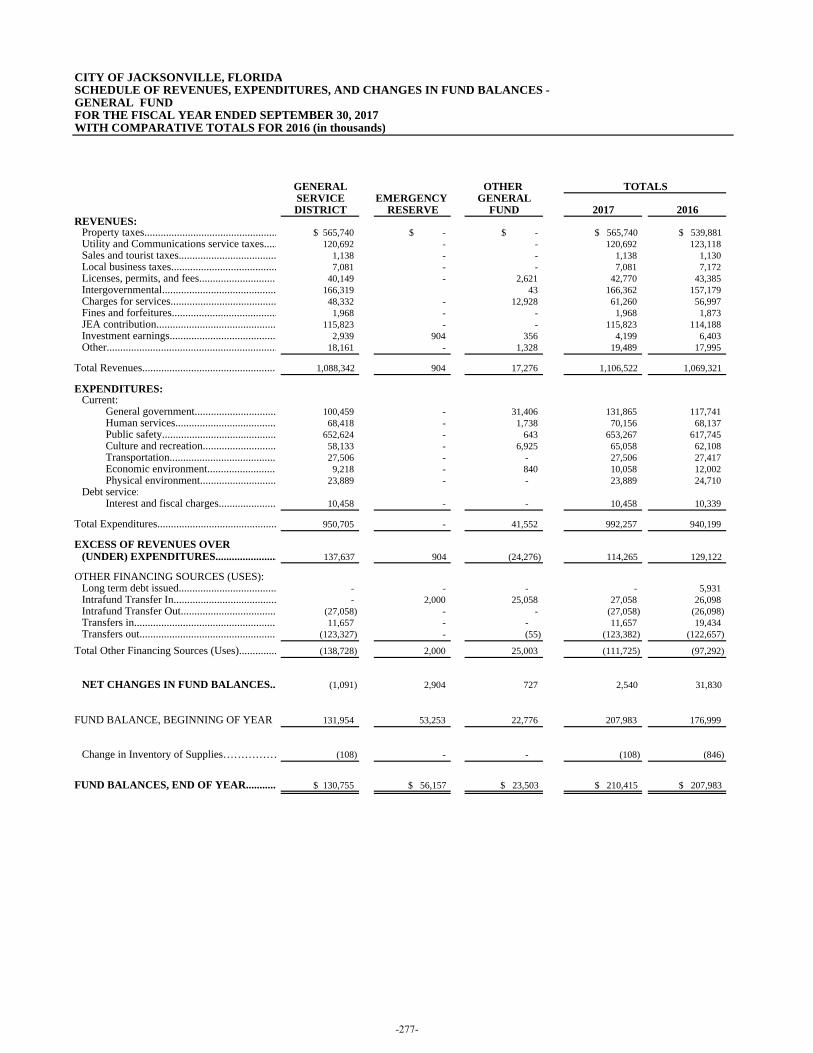
CITY OF JACKSONVILLE, FLORIDASCHEDULE OF REVENUES, EXPENDITURES, AND CHANGES IN FUND BALANCES - GENERAL FUNDFOR THE FISCAL YEAR ENDED SEPTEMBER 30, 2017WITH COMPARATIVE TOTALS FOR 2016 (in thousands)
GENERAL OTHER TOTALSSERVICE EMERGENCY GENERALDISTRICT RESERVE FUND 2017 2016
REVENUES:Property taxes................................................. $ 565,740 $ - $ - $ 565,740 $ 539,881 Utility and Communications service taxes..... 120,692 - - 120,692 123,118 Sales and tourist taxes.................................... 1,138 - - 1,138 1,130 Local business taxes....................................... 7,081 - - 7,081 7,172 Licenses, permits, and fees............................ 40,149 - 2,621 42,770 43,385 Intergovernmental.......................................... 166,319 43 166,362 157,179 Charges for services....................................... 48,332 - 12,928 61,260 56,997 Fines and forfeitures....................................... 1,968 - - 1,968 1,873 JEA contribution............................................ 115,823 - - 115,823 114,188 Investment earnings....................................... 2,939 904 356 4,199 6,403 Other............................................................... 18,161 - 1,328 19,489 17,995
Total Revenues................................................. 1,088,342 904 17,276 1,106,522 1,069,321
EXPENDITURES:
Current: General government.............................. 100,459 - 31,406 131,865 117,741 Human services..................................... 68,418 - 1,738 70,156 68,137 Public safety.......................................... 652,624 - 643 653,267 617,745 Culture and recreation........................... 58,133 - 6,925 65,058 62,108 Transportation....................................... 27,506 - - 27,506 27,417 Economic environment......................... 9,218 - 840 10,058 12,002 Physical environment............................ 23,889 - - 23,889 24,710
Debt service: Interest and fiscal charges..................... 10,458 - - 10,458 10,339
Total Expenditures............................................ 950,705 - 41,552 992,257 940,199
EXCESS OF REVENUES OVER (UNDER) EXPENDITURES....................... 137,637 904 (24,276) 114,265 129,122
OTHER FINANCING SOURCES (USES):
Long term debt issued.................................... - - - - 5,931 Intrafund Transfer In...................................... - 2,000 25,058 27,058 26,098 Intrafund Transfer Out................................... (27,058) - - (27,058) (26,098) Transfers in.................................................... 11,657 - - 11,657 19,434 Transfers out.................................................. (123,327) - (55) (123,382) (122,657)
Total Other Financing Sources (Uses).............. (138,728) 2,000 25,003 (111,725) (97,292)
NET CHANGES IN FUND BALANCES.. (1,091) 2,904 727 2,540 31,830
FUND BALANCE, BEGINNING OF YEAR 131,954 53,253 22,776 207,983 176,999
Prior Year Adjustments......................... - - - - - Change in Inventory of Supplies…………… (108) - - (108) (846)
FUND BALANCES, END OF YEAR........... $ 130,755 $ 56,157 $ 23,503 $ 210,415 $ 207,983
-277-

(This page is intentionally left blank.)
-278-
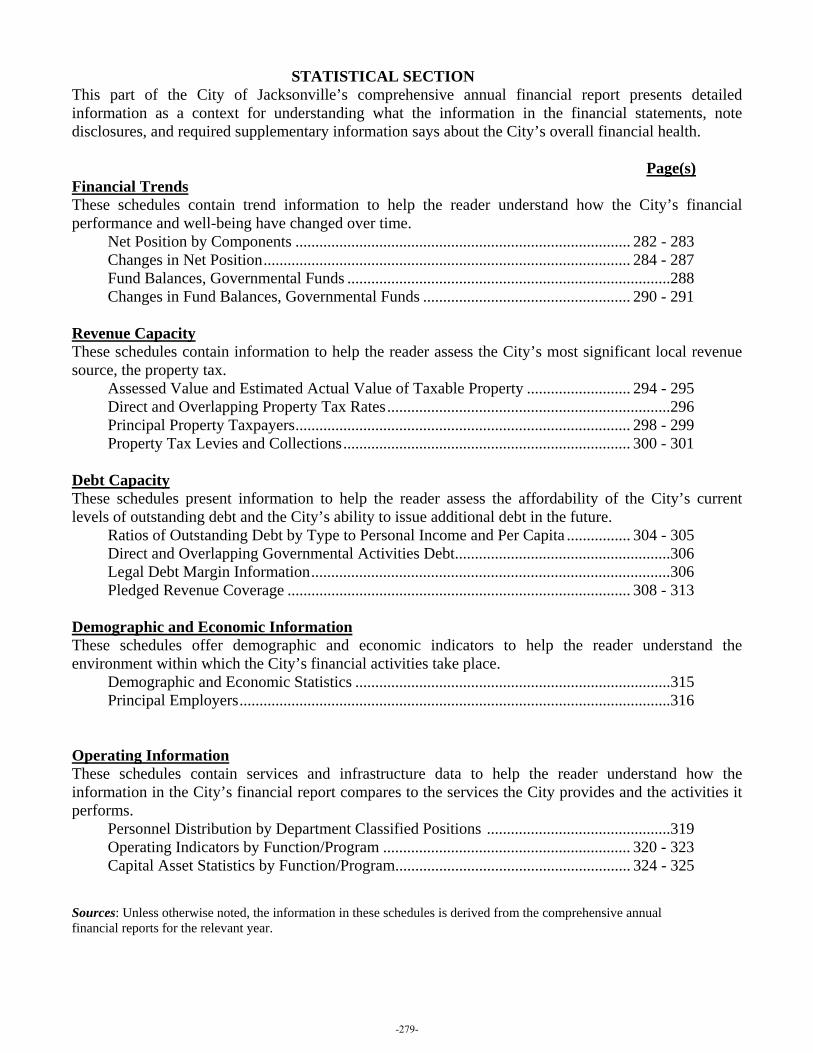
STATISTICAL SECTION This part of the City of Jacksonville’s comprehensive annual financial report presents detailed information as a context for understanding what the information in the financial statements, note disclosures, and required supplementary information says about the City’s overall financial health. Page(s) Financial Trends These schedules contain trend information to help the reader understand how the City’s financial performance and well-being have changed over time.
Net Position by Components .................................................................................... 282 - 283 Changes in Net Position ............................................................................................ 284 - 287 Fund Balances, Governmental Funds .................................................................................288 Changes in Fund Balances, Governmental Funds .................................................... 290 - 291
Revenue Capacity These schedules contain information to help the reader assess the City’s most significant local revenue source, the property tax.
Assessed Value and Estimated Actual Value of Taxable Property .......................... 294 - 295 Direct and Overlapping Property Tax Rates .......................................................................296 Principal Property Taxpayers .................................................................................... 298 - 299 Property Tax Levies and Collections ........................................................................ 300 - 301
Debt Capacity These schedules present information to help the reader assess the affordability of the City’s current levels of outstanding debt and the City’s ability to issue additional debt in the future.
Ratios of Outstanding Debt by Type to Personal Income and Per Capita ................ 304 - 305 Direct and Overlapping Governmental Activities Debt ......................................................306 Legal Debt Margin Information ..........................................................................................306 Pledged Revenue Coverage ...................................................................................... 308 - 313
Demographic and Economic Information These schedules offer demographic and economic indicators to help the reader understand the environment within which the City’s financial activities take place.
Demographic and Economic Statistics ...............................................................................315 Principal Employers ............................................................................................................316
Operating Information These schedules contain services and infrastructure data to help the reader understand how the information in the City’s financial report compares to the services the City provides and the activities it performs.
Personnel Distribution by Department Classified Positions ..............................................319 Operating Indicators by Function/Program .............................................................. 320 - 323 Capital Asset Statistics by Function/Program........................................................... 324 - 325
Sources: Unless otherwise noted, the information in these schedules is derived from the comprehensive annual financial reports for the relevant year.
-279-

DRAFT
(This page is intentionally left blank.)
-280-

STATISTICAL SECTION – FINANCIAL TRENDS
-281-
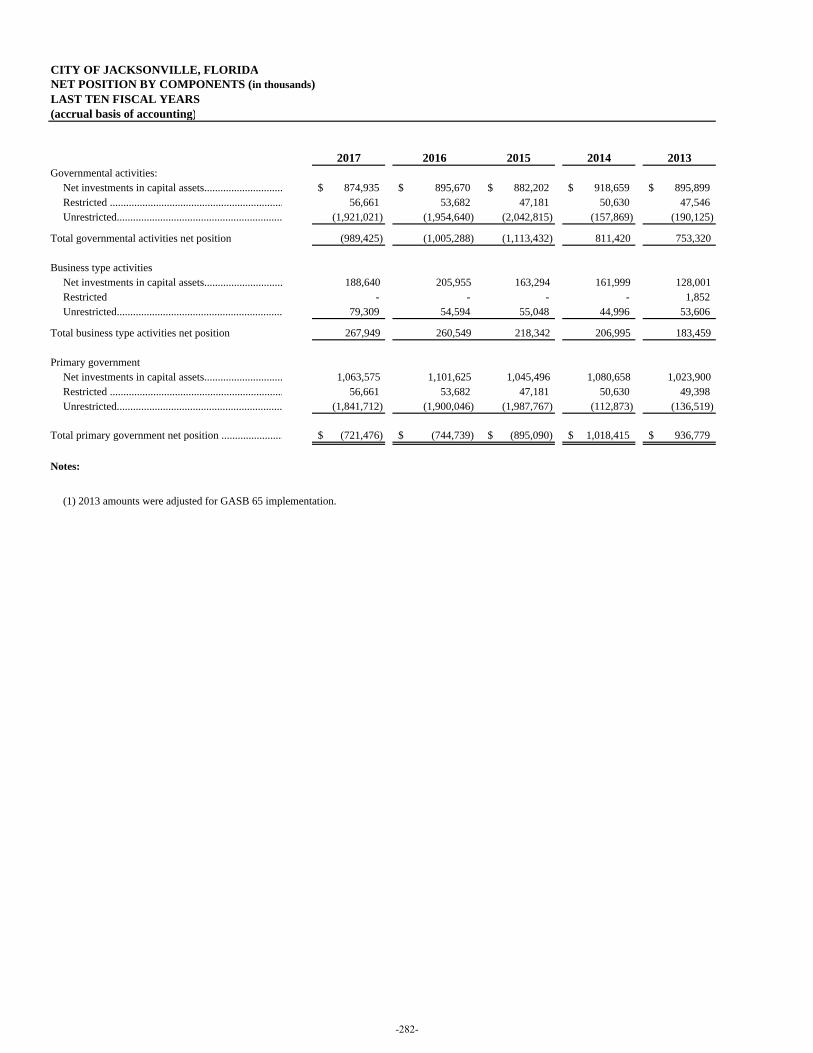
CITY OF JACKSONVILLE, FLORIDANET POSITION BY COMPONENTS (in thousands)LAST TEN FISCAL YEARS(accrual basis of accounting)
2017 2016 2015 2014 2013Governmental activities:
Net investments in capital assets............................. 874,935$ 895,670$ 882,202$ 918,659$ 895,899$ Restricted ................................................................ 56,661 53,682 47,181 50,630 47,546 Unrestricted............................................................. (1,921,021) (1,954,640) (2,042,815) (157,869) (190,125)
Total governmental activities net position (989,425) (1,005,288) (1,113,432) 811,420 753,320
Business type activitiesNet investments in capital assets............................. 188,640 205,955 163,294 161,999 128,001 Restricted - - - - 1,852 Unrestricted............................................................. 79,309 54,594 55,048 44,996 53,606
Total business type activities net position 267,949 260,549 218,342 206,995 183,459
Primary governmentNet investments in capital assets............................. 1,063,575 1,101,625 1,045,496 1,080,658 1,023,900 Restricted ................................................................ 56,661 53,682 47,181 50,630 49,398 Unrestricted............................................................. (1,841,712) (1,900,046) (1,987,767) (112,873) (136,519)
Total primary government net position ....................... (721,476)$ (744,739)$ (895,090)$ 1,018,415$ 936,779$
Notes:
(1) 2013 amounts were adjusted for GASB 65 implementation.
-282-
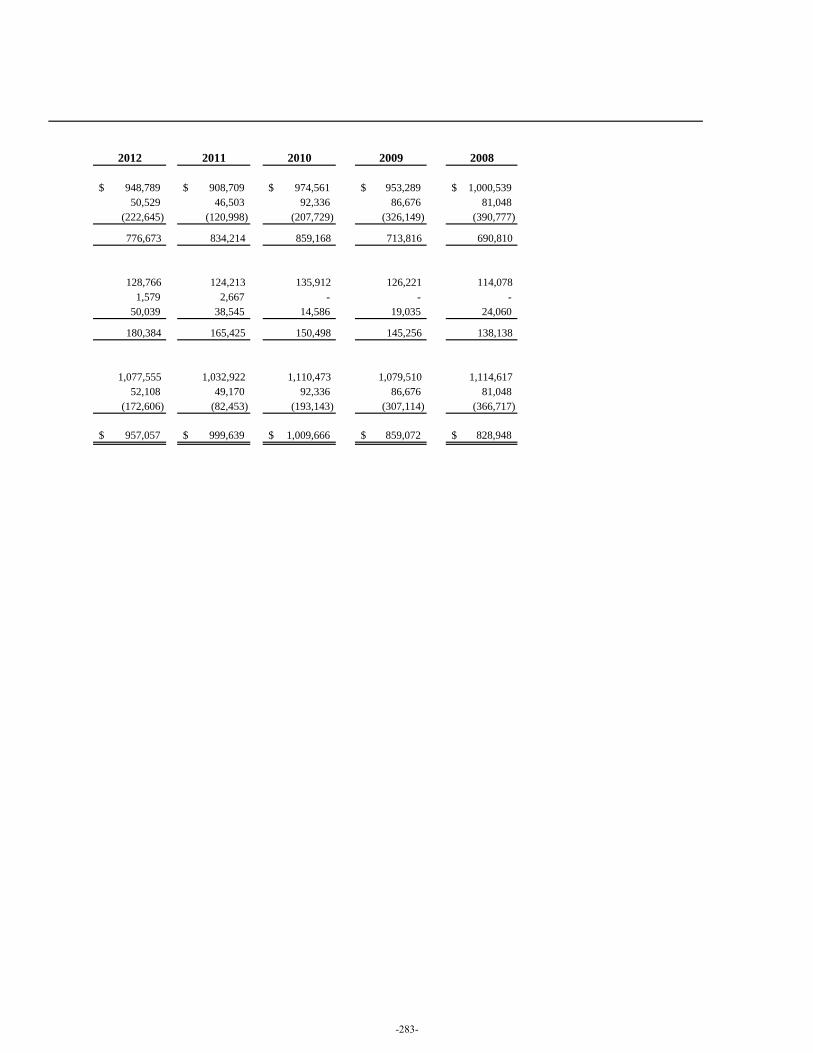
2012 2011 2010 2009 2008
948,789$ 908,709$ 974,561$ 953,289$ 1,000,539$ 50,529 46,503 92,336 86,676 81,048
(222,645) (120,998) (207,729) (326,149) (390,777)
776,673 834,214 859,168 713,816 690,810
128,766 124,213 135,912 126,221 114,078 1,579 2,667 - - -
50,039 38,545 14,586 19,035 24,060
180,384 165,425 150,498 145,256 138,138
1,077,555 1,032,922 1,110,473 1,079,510 1,114,617 52,108 49,170 92,336 86,676 81,048
(172,606) (82,453) (193,143) (307,114) (366,717)
957,057$ 999,639$ 1,009,666$ 859,072$ 828,948$
-283-
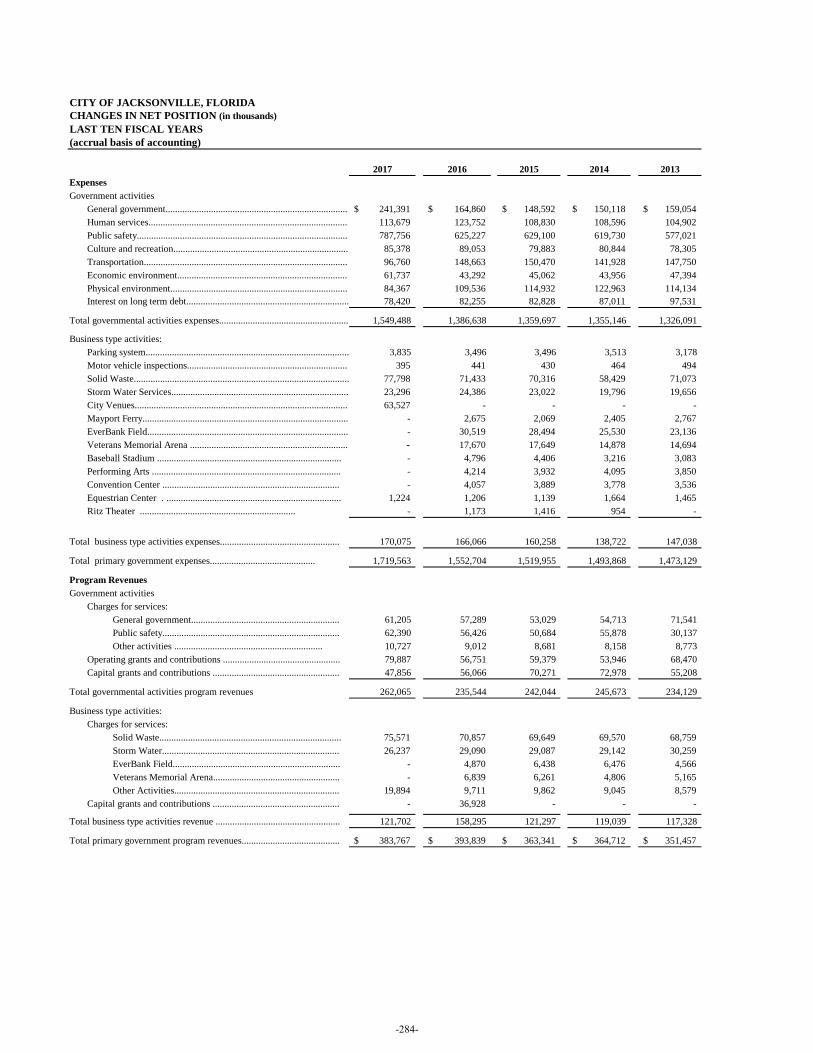
CITY OF JACKSONVILLE, FLORIDACHANGES IN NET POSITION (in thousands)LAST TEN FISCAL YEARS(accrual basis of accounting)
2017 2016 2015 2014 2013ExpensesGovernment activities
General government............................................................................. 241,391$ 164,860$ 148,592$ 150,118$ 159,054$ Human services.................................................................................... 113,679 123,752 108,830 108,596 104,902Public safety......................................................................................... 787,756 625,227 629,100 619,730 577,021Culture and recreation......................................................................... 85,378 89,053 79,883 80,844 78,305Transportation...................................................................................... 96,760 148,663 150,470 141,928 147,750Economic environment........................................................................ 61,737 43,292 45,062 43,956 47,394Physical environment........................................................................... 84,367 109,536 114,932 122,963 114,134Interest on long term debt.................................................................... 78,420 82,255 82,828 87,011 97,531
Total governmental activities expenses...................................................... 1,549,488 1,386,638 1,359,697 1,355,146 1,326,091 Business type activities:
Parking system..................................................................................... 3,835 3,496 3,496 3,513 3,178 Motor vehicle inspections.................................................................... 395 441 430 464 494Solid Waste.......................................................................................... 77,798 71,433 70,316 58,429 71,073Storm Water Services.......................................................................... 23,296 24,386 23,022 19,796 19,656City Venues.......................................................................................... 63,527 - - - - Mayport Ferry...................................................................................... - 2,675 2,069 2,405 2,767 EverBank Field.................................................................................... - 30,519 28,494 25,530 23,136Veterans Memorial Arena ................................................................... - 17,670 17,649 14,878 14,694Baseball Stadium ............................................................................. - 4,796 4,406 3,216 3,083Performing Arts ............................................................................... - 4,214 3,932 4,095 3,850Convention Center ........................................................................... - 4,057 3,889 3,778 3,536Equestrian Center . ......................................................................... 1,224 1,206 1,139 1,664 1,465Ritz Theater ................................................................. - 1,173 1,416 954 -
Total business type activities expenses................................................... 170,075 166,066 160,258 138,722 147,038 Total primary government expenses............................................ 1,719,563 1,552,704 1,519,955 1,493,868 1,473,129 Program Revenues Government activities
Charges for services: General government............................................................... 61,205 57,289 53,029 54,713 71,541 Public safety........................................................................... 62,390 56,426 50,684 55,878 30,137 Other activities .............................................................. 10,727 9,012 8,681 8,158 8,773
Operating grants and contributions ................................................. 79,887 56,751 59,379 53,946 68,470 Capital grants and contributions ...................................................... 47,856 56,066 70,271 72,978 55,208
Total governmental activities program revenues 262,065 235,544 242,044 245,673 234,129 Business type activities:
Charges for services: Solid Waste............................................................................ 75,571 70,857 69,649 69,570 68,759Storm Water........................................................................... 26,237 29,090 29,087 29,142 30,259EverBank Field...................................................................... - 4,870 6,438 6,476 4,566Veterans Memorial Arena...................................................... - 6,839 6,261 4,806 5,165Other Activities...................................................................... 19,894 9,711 9,862 9,045 8,579
Capital grants and contributions ...................................................... - 36,928 - - - Total business type activities revenue .................................................... 121,702 158,295 121,297 119,039 117,328
Total primary government program revenues.......................................... 383,767$ 393,839$ 363,341$ 364,712$ 351,457$
-284-
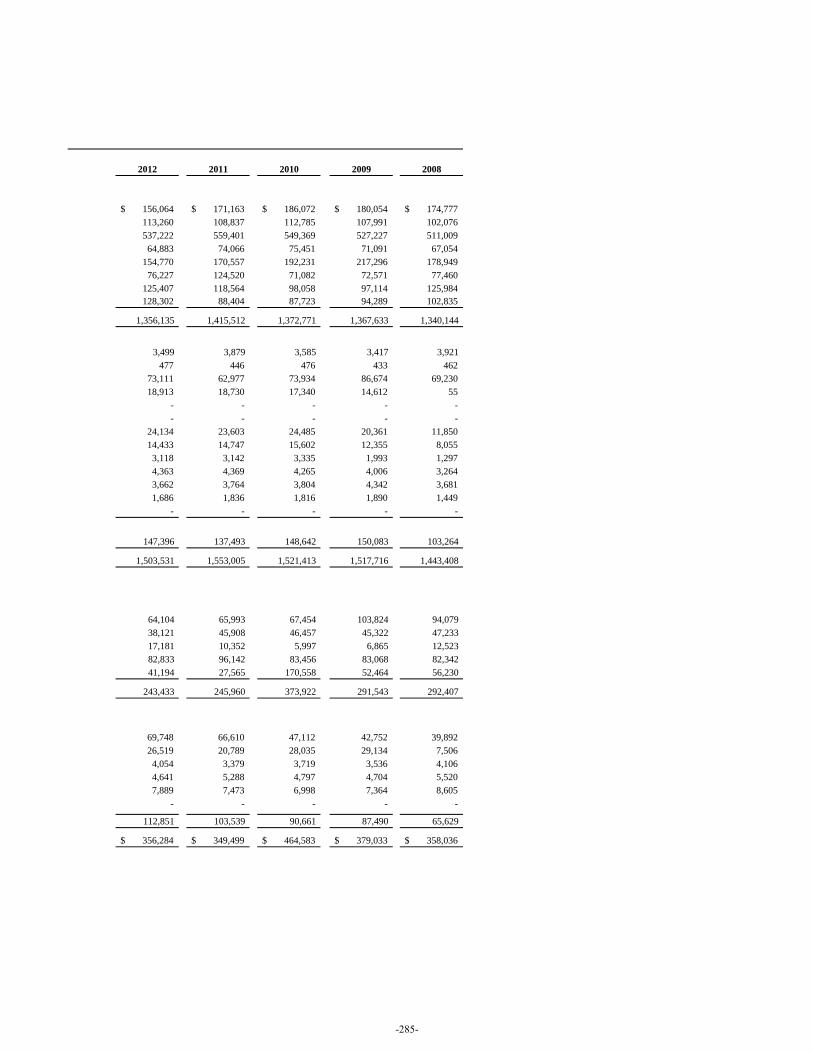
2012 2011 2010 2009 2008
156,064$ 171,163$ 186,072$ 180,054$ 174,777$ 113,260 108,837 112,785 107,991 102,076537,222 559,401 549,369 527,227 511,009
64,883 74,066 75,451 71,091 67,054154,770 170,557 192,231 217,296 178,949
76,227 124,520 71,082 72,571 77,460125,407 118,564 98,058 97,114 125,984128,302 88,404 87,723 94,289 102,835
1,356,135 1,415,512 1,372,771 1,367,633 1,340,144
3,499 3,879 3,585 3,417 3,921 477 446 476 433 462
73,111 62,977 73,934 86,674 69,23018,913 18,730 17,340 14,612 55
- - - - - - - - - -
24,134 23,603 24,485 20,361 11,85014,433 14,747 15,602 12,355 8,055
3,118 3,142 3,335 1,993 1,2974,363 4,369 4,265 4,006 3,2643,662 3,764 3,804 4,342 3,6811,686 1,836 1,816 1,890 1,449
- - - - -
147,396 137,493 148,642 150,083 103,264
1,503,531 1,553,005 1,521,413 1,517,716 1,443,408
64,104 65,993 67,454 103,824 94,079 38,121 45,908 46,457 45,322 47,233 17,181 10,352 5,997 6,865 12,523 82,833 96,142 83,456 83,068 82,342 41,194 27,565 170,558 52,464 56,230
243,433 245,960 373,922 291,543 292,407
69,748 66,610 47,112 42,752 39,89226,519 20,789 28,035 29,134 7,506
4,054 3,379 3,719 3,536 4,1064,641 5,288 4,797 4,704 5,5207,889 7,473 6,998 7,364 8,605
- - - - - 112,851 103,539 90,661 87,490 65,629
356,284$ 349,499$ 464,583$ 379,033$ 358,036$
-285-
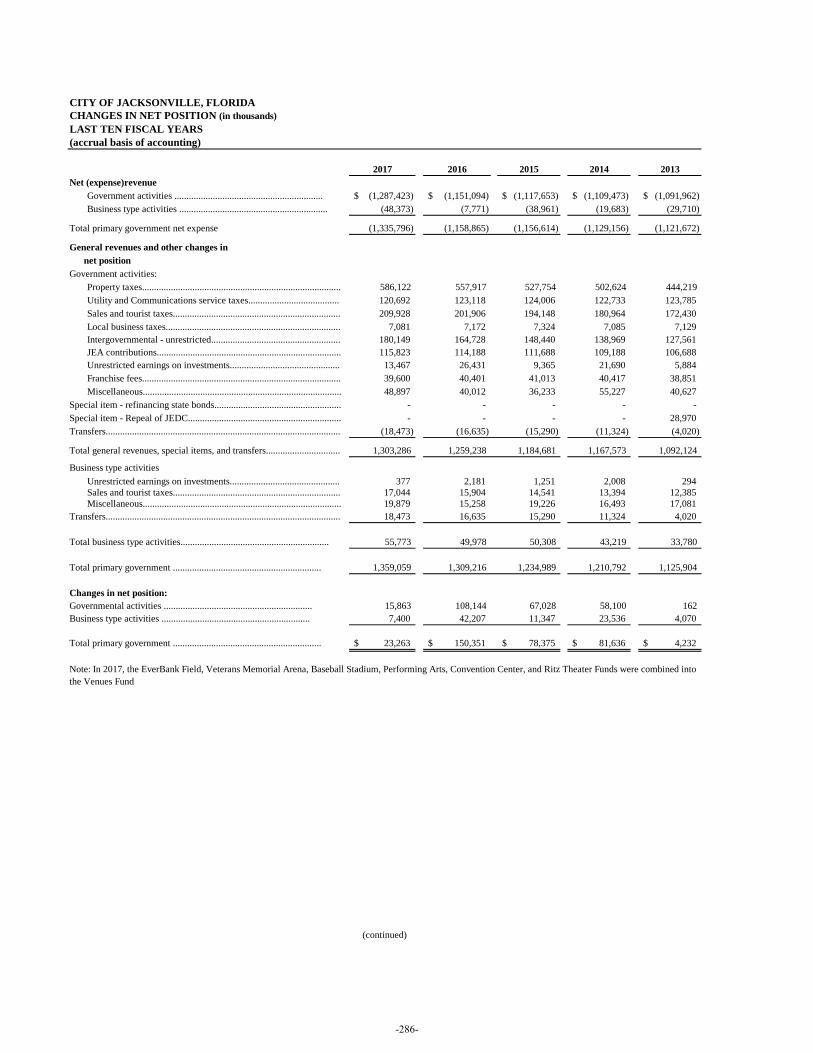
CITY OF JACKSONVILLE, FLORIDACHANGES IN NET POSITION (in thousands)LAST TEN FISCAL YEARS(accrual basis of accounting)
2017 2016 2015 2014 2013Net (expense)revenue
Government activities .............................................................. (1,287,423)$ (1,151,094)$ (1,117,653)$ (1,109,473)$ (1,091,962)$ Business type activities .............................................................. (48,373) (7,771) (38,961) (19,683) (29,710)
Total primary government net expense (1,335,796) (1,158,865) (1,156,614) (1,129,156) (1,121,672)
General revenues and other changes in net positionGovernment activities:
Property taxes................................................................................... 586,122 557,917 527,754 502,624 444,219 Utility and Communications service taxes....................................... 120,692 123,118 124,006 122,733 123,785Sales and tourist taxes...................................................................... 209,928 201,906 194,148 180,964 172,430Local business taxes......................................................................... 7,081 7,172 7,324 7,085 7,129Intergovernmental - unrestricted...................................................... 180,149 164,728 148,440 138,969 127,561 JEA contributions............................................................................. 115,823 114,188 111,688 109,188 106,688 Unrestricted earnings on investments............................................... 13,467 26,431 9,365 21,690 5,884 Franchise fees................................................................................... 39,600 40,401 41,013 40,417 38,851 Miscellaneous................................................................................... 48,897 40,012 36,233 55,227 40,627
Special item - refinancing state bonds..................................................... - - - - - Special item - Repeal of JEDC................................................................ - - - - 28,970 Transfers.................................................................................................. (18,473) (16,635) (15,290) (11,324) (4,020) Total general revenues, special items, and transfers............................... 1,303,286 1,259,238 1,184,681 1,167,573 1,092,124
Business type activities Unrestricted earnings on investments............................................... 377 2,181 1,251 2,008 294 Sales and tourist taxes...................................................................... 17,044 15,904 14,541 13,394 12,385Miscellaneous................................................................................... 19,879 15,258 19,226 16,493 17,081
Transfers.................................................................................................. 18,473 16,635 15,290 11,324 4,020
Total business type activities.............................................................. 55,773 49,978 50,308 43,219 33,780
Total primary government .............................................................. 1,359,059 1,309,216 1,234,989 1,210,792 1,125,904
Changes in net position: Governmental activities .............................................................. 15,863 108,144 67,028 58,100 162 Business type activities .............................................................. 7,400 42,207 11,347 23,536 4,070
Total primary government .............................................................. 23,263$ 150,351$ 78,375$ 81,636$ 4,232$
(continued)
Note: In 2017, the EverBank Field, Veterans Memorial Arena, Baseball Stadium, Performing Arts, Convention Center, and Ritz Theater Funds were combined into the Venues Fund
-286-
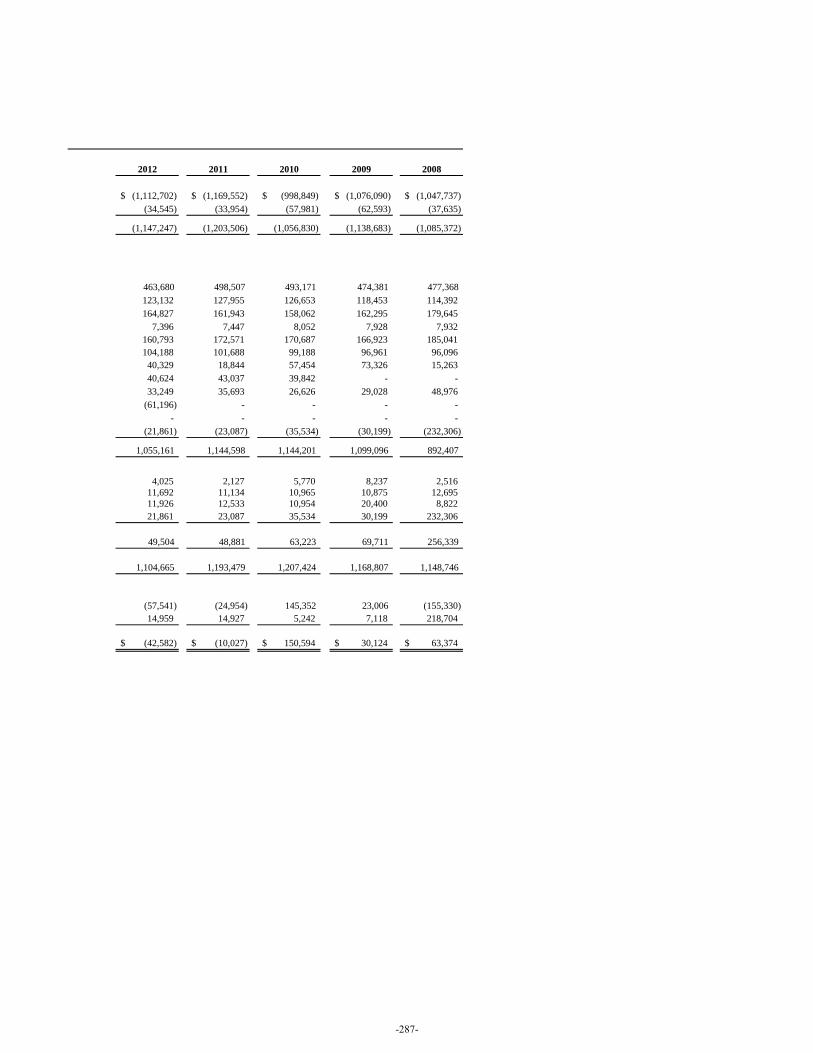
2012 2011 2010 2009 2008
(1,112,702)$ (1,169,552)$ (998,849)$ (1,076,090)$ (1,047,737)$ (34,545) (33,954) (57,981) (62,593) (37,635)
(1,147,247) (1,203,506) (1,056,830) (1,138,683) (1,085,372)
463,680 498,507 493,171 474,381 477,368 123,132 127,955 126,653 118,453 114,392164,827 161,943 158,062 162,295 179,645
7,396 7,447 8,052 7,928 7,932160,793 172,571 170,687 166,923 185,041 104,188 101,688 99,188 96,961 96,096
40,329 18,844 57,454 73,326 15,263 40,624 43,037 39,842 - - 33,249 35,693 26,626 29,028 48,976
(61,196) - - - - - - - - -
(21,861) (23,087) (35,534) (30,199) (232,306) 1,055,161 1,144,598 1,144,201 1,099,096 892,407
4,025 2,127 5,770 8,237 2,516
11,692 11,134 10,965 10,875 12,69511,926 12,533 10,954 20,400 8,82221,861 23,087 35,534 30,199 232,306
49,504 48,881 63,223 69,711 256,339
1,104,665 1,193,479 1,207,424 1,168,807 1,148,746
(57,541) (24,954) 145,352 23,006 (155,330)14,959 14,927 5,242 7,118 218,704
(42,582)$ (10,027)$ 150,594$ 30,124$ 63,374$
-287-
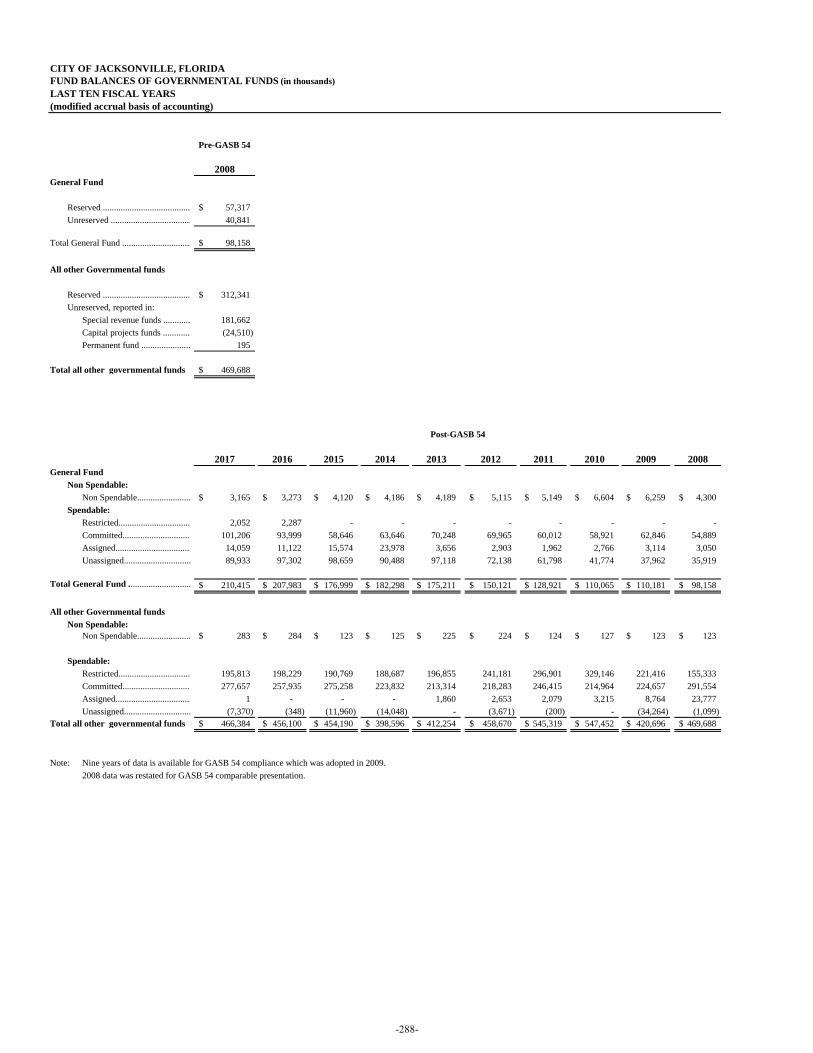
CITY OF JACKSONVILLE, FLORIDAFUND BALANCES OF GOVERNMENTAL FUNDS (in thousands)LAST TEN FISCAL YEARS(modified accrual basis of accounting)
Pre-GASB 54
2008 2007 2006General Fund
Reserved ....................................... 57,317$ 57,507$ 53,935$ Unreserved .................................... 40,841 26,476 23,974
Total General Fund ............................... 98,158$ 83,983$ 77,909$
All other Governmental funds
Reserved ....................................... 312,341$ 393,177$ 388,723$ Unreserved, reported in:
Special revenue funds ............ 181,662 185,307 176,468Capital projects funds ............. (24,510) (38,688) 17,731Permanent fund ...................... 195 194 188
Total all other governmental funds . 469,688$ 539,990$ 583,110$
2017 2016 2015 2014 2013 2012 2011 2010 2009 2008General Fund
Non Spendable:Non Spendable........................ 3,165$ 3,273$ 4,120$ 4,186$ 4,189$ 5,115$ 5,149$ 6,604$ 6,259$ 4,300$
Spendable:Restricted................................. 2,052 2,287 - - - - - - - - Committed............................... 101,206 93,999 58,646 63,646 70,248 69,965 60,012 58,921 62,846 54,889Assigned.................................. 14,059 11,122 15,574 23,978 3,656 2,903 1,962 2,766 3,114 3,050Unassigned.............................. 89,933 97,302 98,659 90,488 97,118 72,138 61,798 41,774 37,962 35,919
Total General Fund ............................ 210,415$ 207,983$ 176,999$ 182,298$ 175,211$ 150,121$ 128,921$ 110,065$ 110,181$ 98,158$
All other Governmental fundsNon Spendable:
Non Spendable........................ 283$ 284$ 123$ 125$ 225$ 224$ 124$ 127$ 123$ 123$
Spendable:Restricted................................. 195,813 198,229 190,769 188,687 196,855 241,181 296,901 329,146 221,416 155,333Committed............................... 277,657 257,935 275,258 223,832 213,314 218,283 246,415 214,964 224,657 291,554Assigned.................................. 1 - - - 1,860 2,653 2,079 3,215 8,764 23,777Unassigned.............................. (7,370) (348) (11,960) (14,048) - (3,671) (200) - (34,264) (1,099)
Total all other governmental funds . 466,384$ 456,100$ 454,190$ 398,596$ 412,254$ 458,670$ 545,319$ 547,452$ 420,696$ 469,688$
Note: Nine years of data is available for GASB 54 compliance which was adopted in 2009.2008 data was restated for GASB 54 comparable presentation.
Post-GASB 54
-288-

(This page is intentionally left blank.)
-289-
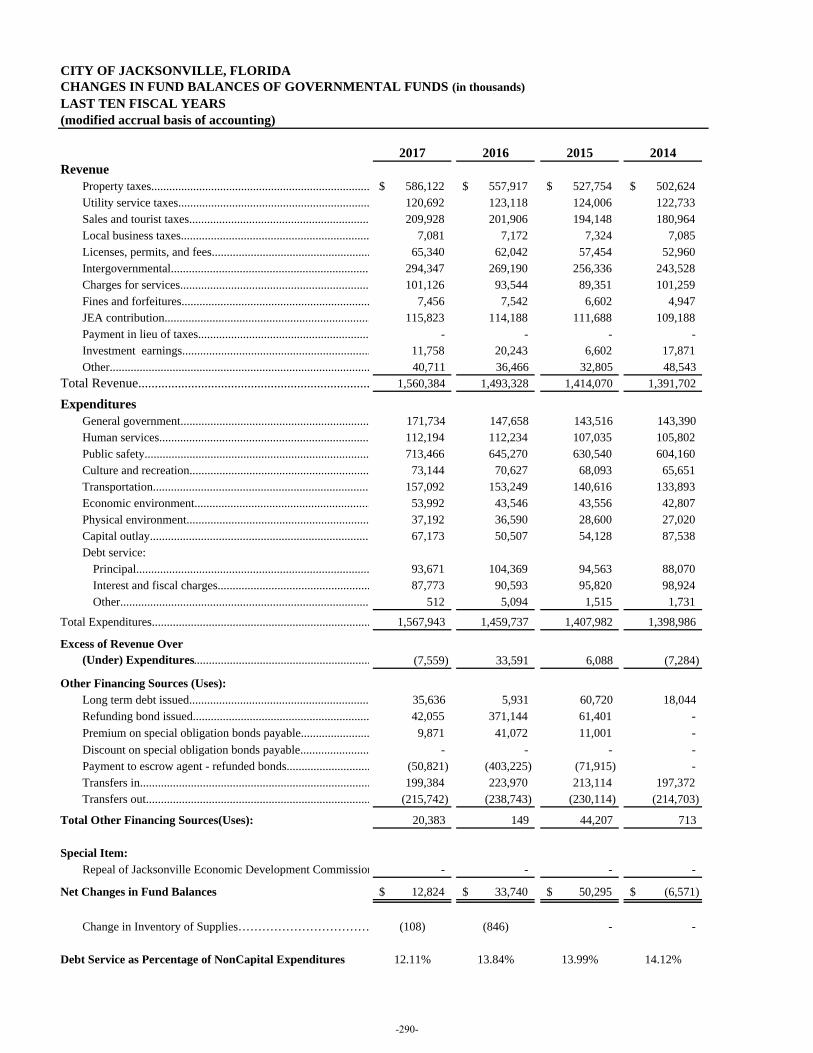
CITY OF JACKSONVILLE, FLORIDACHANGES IN FUND BALANCES OF GOVERNMENTAL FUNDS (in thousands)LAST TEN FISCAL YEARS(modified accrual basis of accounting)
2017 2016 2015 2014Revenue
Property taxes......................................................................... 586,122$ 557,917$ 527,754$ 502,624$ Utility service taxes................................................................ 120,692 123,118 124,006 122,733Sales and tourist taxes............................................................ 209,928 201,906 194,148 180,964Local business taxes............................................................... 7,081 7,172 7,324 7,085Licenses, permits, and fees..................................................... 65,340 62,042 57,454 52,960Intergovernmental.................................................................. 294,347 269,190 256,336 243,528Charges for services............................................................... 101,126 93,544 89,351 101,259Fines and forfeitures............................................................... 7,456 7,542 6,602 4,947JEA contribution..................................................................... 115,823 114,188 111,688 109,188Payment in lieu of taxes......................................................... - - - - Investment earnings............................................................... 11,758 20,243 6,602 17,871Other....................................................................................... 40,711 36,466 32,805 48,543
Total Revenue...................................................................... 1,560,384 1,493,328 1,414,070 1,391,702
Expenditures General government............................................................... 171,734 147,658 143,516 143,390 Human services...................................................................... 112,194 112,234 107,035 105,802Public safety........................................................................... 713,466 645,270 630,540 604,160Culture and recreation............................................................ 73,144 70,627 68,093 65,651Transportation........................................................................ 157,092 153,249 140,616 133,893Economic environment........................................................... 53,992 43,546 43,556 42,807Physical environment............................................................. 37,192 36,590 28,600 27,020Capital outlay......................................................................... 67,173 50,507 54,128 87,538Debt service:
Principal.............................................................................. 93,671 104,369 94,563 88,070Interest and fiscal charges................................................... 87,773 90,593 95,820 98,924Other................................................................................... 512 5,094 1,515 1,731
Total Expenditures......................................................................... 1,567,943 1,459,737 1,407,982 1,398,986 Excess of Revenue Over
(Under) Expenditures........................................................... (7,559) 33,591 6,088 (7,284) Other Financing Sources (Uses):
Long term debt issued............................................................ 35,636 5,931 60,720 18,044 Refunding bond issued........................................................... 42,055 371,144 61,401 - Premium on special obligation bonds payable....................... 9,871 41,072 11,001 - Discount on special obligation bonds payable....................... - - - - Payment to escrow agent - refunded bonds............................ (50,821) (403,225) (71,915) - Transfers in............................................................................. 199,384 223,970 213,114 197,372Transfers out........................................................................... (215,742) (238,743) (230,114) (214,703)
Total Other Financing Sources(Uses): 20,383 149 44,207 713
Special Item: Repeal of Jacksonville Economic Development Commission - - - -
Net Changes in Fund Balances 12,824$ 33,740$ 50,295$ (6,571)$
Change in Inventory of Supplies…………………………… (108) (846) - -
Debt Service as Percentage of NonCapital Expenditures 12.11% 13.84% 13.99% 14.12%
-290-
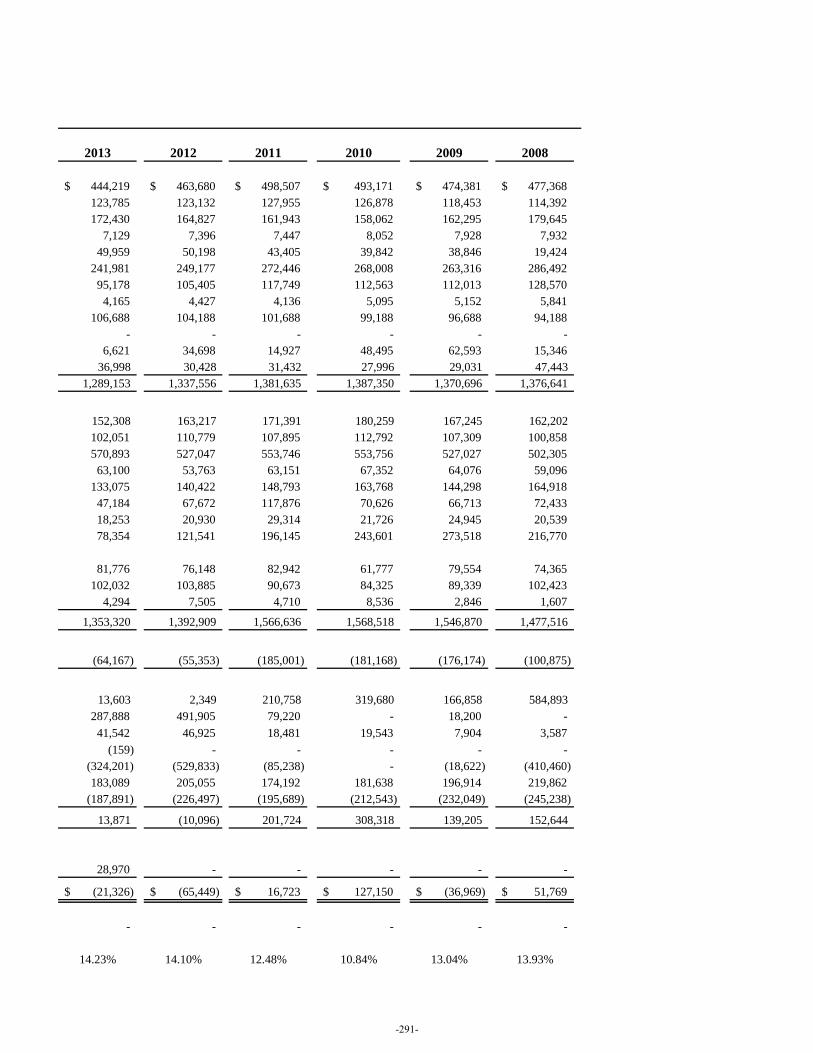
2013 2012 2011 2010 2009 2008
444,219$ 463,680$ 498,507$ 493,171$ 474,381$ 477,368$ 123,785 123,132 127,955 126,878 118,453 114,392172,430 164,827 161,943 158,062 162,295 179,645
7,129 7,396 7,447 8,052 7,928 7,93249,959 50,198 43,405 39,842 38,846 19,424
241,981 249,177 272,446 268,008 263,316 286,49295,178 105,405 117,749 112,563 112,013 128,570
4,165 4,427 4,136 5,095 5,152 5,841106,688 104,188 101,688 99,188 96,688 94,188
- - - - - - 6,621 34,698 14,927 48,495 62,593 15,346
36,998 30,428 31,432 27,996 29,031 47,443 1,289,153 1,337,556 1,381,635 1,387,350 1,370,696 1,376,641
152,308 163,217 171,391 180,259 167,245 162,202 102,051 110,779 107,895 112,792 107,309 100,858570,893 527,047 553,746 553,756 527,027 502,305
63,100 53,763 63,151 67,352 64,076 59,096133,075 140,422 148,793 163,768 144,298 164,918
47,184 67,672 117,876 70,626 66,713 72,43318,253 20,930 29,314 21,726 24,945 20,53978,354 121,541 196,145 243,601 273,518 216,770
81,776 76,148 82,942 61,777 79,554 74,365
102,032 103,885 90,673 84,325 89,339 102,4234,294 7,505 4,710 8,536 2,846 1,607
1,353,320 1,392,909 1,566,636 1,568,518 1,546,870 1,477,516
(64,167) (55,353) (185,001) (181,168) (176,174) (100,875)
13,603 2,349 210,758 319,680 166,858 584,893 287,888 491,905 79,220 - 18,200 -
41,542 46,925 18,481 19,543 7,904 3,587 (159) - - - - -
(324,201) (529,833) (85,238) - (18,622) (410,460) 183,089 205,055 174,192 181,638 196,914 219,862
(187,891) (226,497) (195,689) (212,543) (232,049) (245,238)
13,871 (10,096) 201,724 308,318 139,205 152,644
28,970 - - - - -
(21,326)$ (65,449)$ 16,723$ 127,150$ (36,969)$ 51,769$
- - - - - -
14.23% 14.10% 12.48% 10.84% 13.04% 13.93%
-291-

(This page is intentionally left blank.)
-292-

STATISTICAL SECTION – REVENUE CAPACITY
-293-
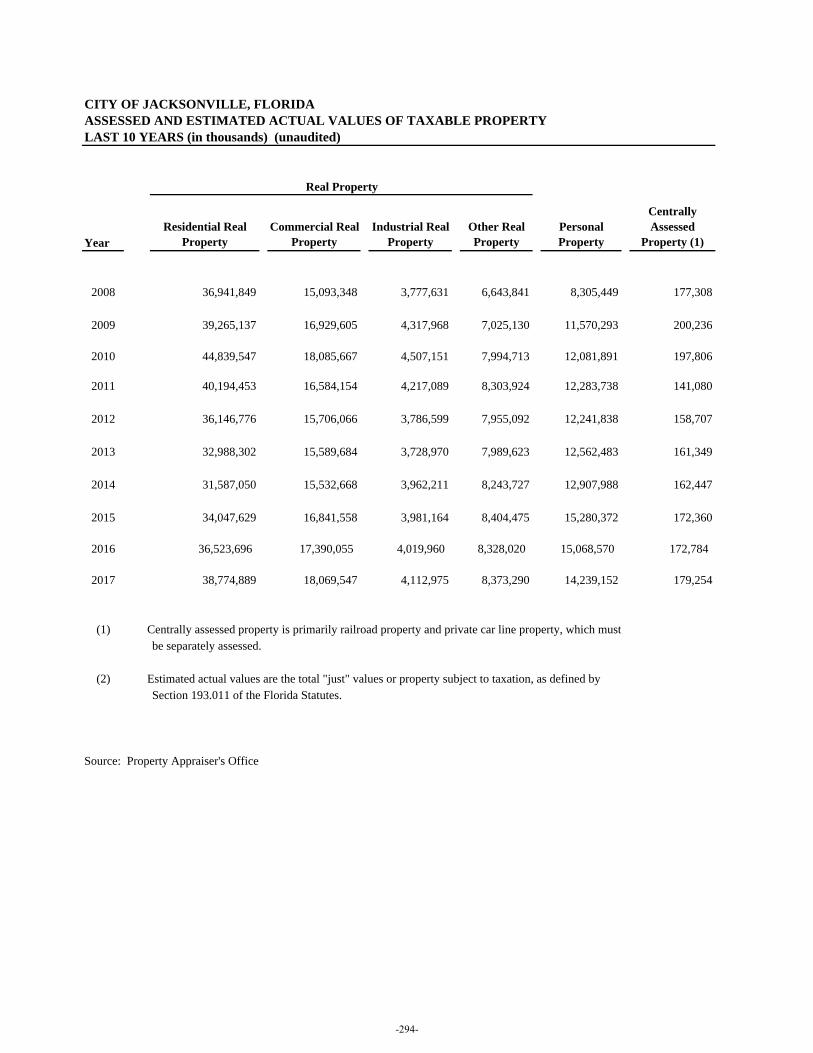
CITY OF JACKSONVILLE, FLORIDAASSESSED AND ESTIMATED ACTUAL VALUES OF TAXABLE PROPERTYLAST 10 YEARS (in thousands) (unaudited)
YearResidential Real
PropertyCommercial Real
PropertyIndustrial Real
Property Other Real Property
Personal Property
Centrally Assessed
Property (1)
2008 36,941,849 15,093,348 3,777,631 6,643,841 8,305,449 177,308
2009 39,265,137 16,929,605 4,317,968 7,025,130 11,570,293 200,236
2010 44,839,547 18,085,667 4,507,151 7,994,713 12,081,891 197,806
2011 40,194,453 16,584,154 4,217,089 8,303,924 12,283,738 141,080
2012 36,146,776 15,706,066 3,786,599 7,955,092 12,241,838 158,707
2013 32,988,302 15,589,684 3,728,970 7,989,623 12,562,483 161,349
2014 31,587,050 15,532,668 3,962,211 8,243,727 12,907,988 162,447
2015 34,047,629 16,841,558 3,981,164 8,404,475 15,280,372 172,360
2016 36,523,696 17,390,055 4,019,960 8,328,020 15,068,570 172,784
2017 38,774,889 18,069,547 4,112,975 8,373,290 14,239,152 179,254
(1) Centrally assessed property is primarily railroad property and private car line property, which must be separately assessed.
(2) Estimated actual values are the total "just" values or property subject to taxation, as defined by Section 193.011 of the Florida Statutes.
Source: Property Appraiser's Office
Real Property
-294-
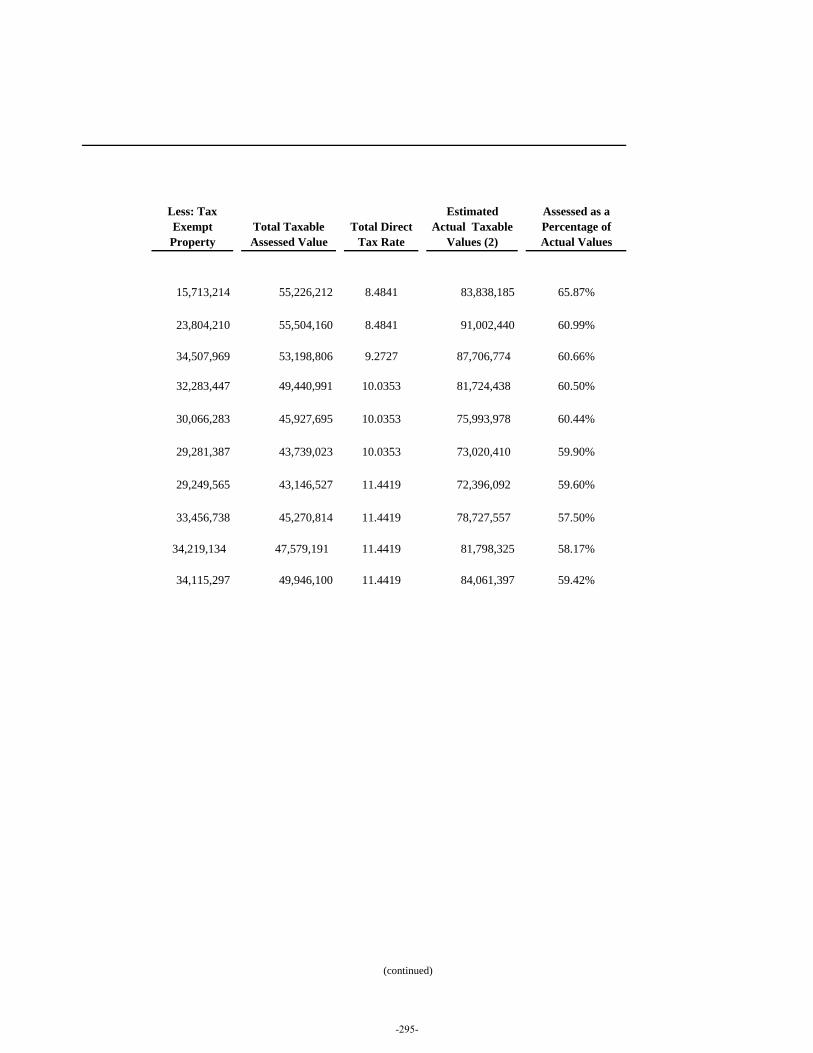
Less: Tax Exempt
PropertyTotal Taxable Assessed Value
Total Direct Tax Rate
Estimated Actual Taxable
Values (2)
Assessed as a Percentage of Actual Values
15,713,214 55,226,212 8.4841 83,838,185 65.87%
23,804,210 55,504,160 8.4841 91,002,440 60.99%
34,507,969 53,198,806 9.2727 87,706,774 60.66%
32,283,447 49,440,991 10.0353 81,724,438 60.50%
30,066,283 45,927,695 10.0353 75,993,978 60.44%
29,281,387 43,739,023 10.0353 73,020,410 59.90%
29,249,565 43,146,527 11.4419 72,396,092 59.60%
33,456,738 45,270,814 11.4419 78,727,557 57.50%
34,219,134 47,579,191 11.4419 81,798,325 58.17%
34,115,297 49,946,100 11.4419 84,061,397 59.42%
(continued)
-295-
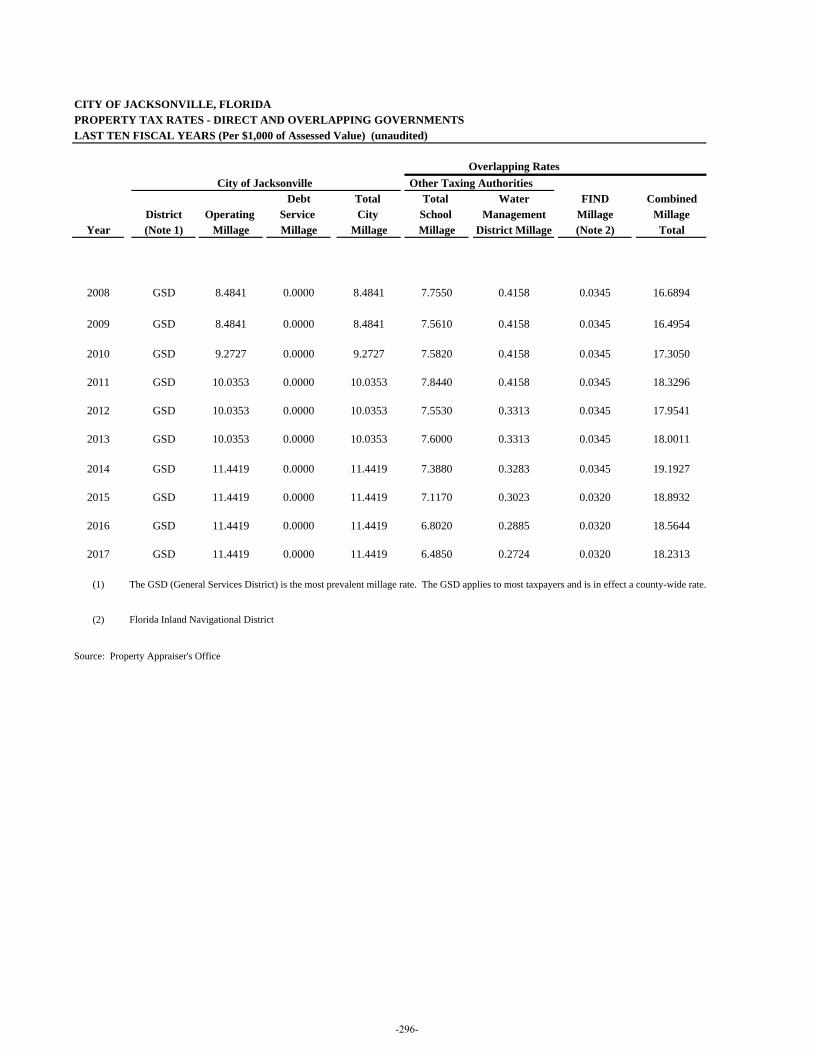
CITY OF JACKSONVILLE, FLORIDAPROPERTY TAX RATES - DIRECT AND OVERLAPPING GOVERNMENTSLAST TEN FISCAL YEARS (Per $1,000 of Assessed Value) (unaudited)
Overlapping RatesCity of Jacksonville Other Taxing Authorities
Debt Total Total Water FIND CombinedDistrict Operating Service City School Management Millage Millage
Year (Note 1) Millage Millage Millage Millage District Millage (Note 2) Total
2008 GSD 8.4841 0.0000 8.4841 7.7550 0.4158 0.0345 16.6894
2009 GSD 8.4841 0.0000 8.4841 7.5610 0.4158 0.0345 16.4954
2010 GSD 9.2727 0.0000 9.2727 7.5820 0.4158 0.0345 17.3050
2011 GSD 10.0353 0.0000 10.0353 7.8440 0.4158 0.0345 18.3296
2012 GSD 10.0353 0.0000 10.0353 7.5530 0.3313 0.0345 17.9541
2013 GSD 10.0353 0.0000 10.0353 7.6000 0.3313 0.0345 18.0011
2014 GSD 11.4419 0.0000 11.4419 7.3880 0.3283 0.0345 19.1927
2015 GSD 11.4419 0.0000 11.4419 7.1170 0.3023 0.0320 18.8932
2016 GSD 11.4419 0.0000 11.4419 6.8020 0.2885 0.0320 18.5644
2017 GSD 11.4419 0.0000 11.4419 6.4850 0.2724 0.0320 18.2313
(1) The GSD (General Services District) is the most prevalent millage rate. The GSD applies to most taxpayers and is in effect a county-wide rate.
(2) Florida Inland Navigational District
Source: Property Appraiser's Office
-296-

(This page is intentionally left blank.)
-297-
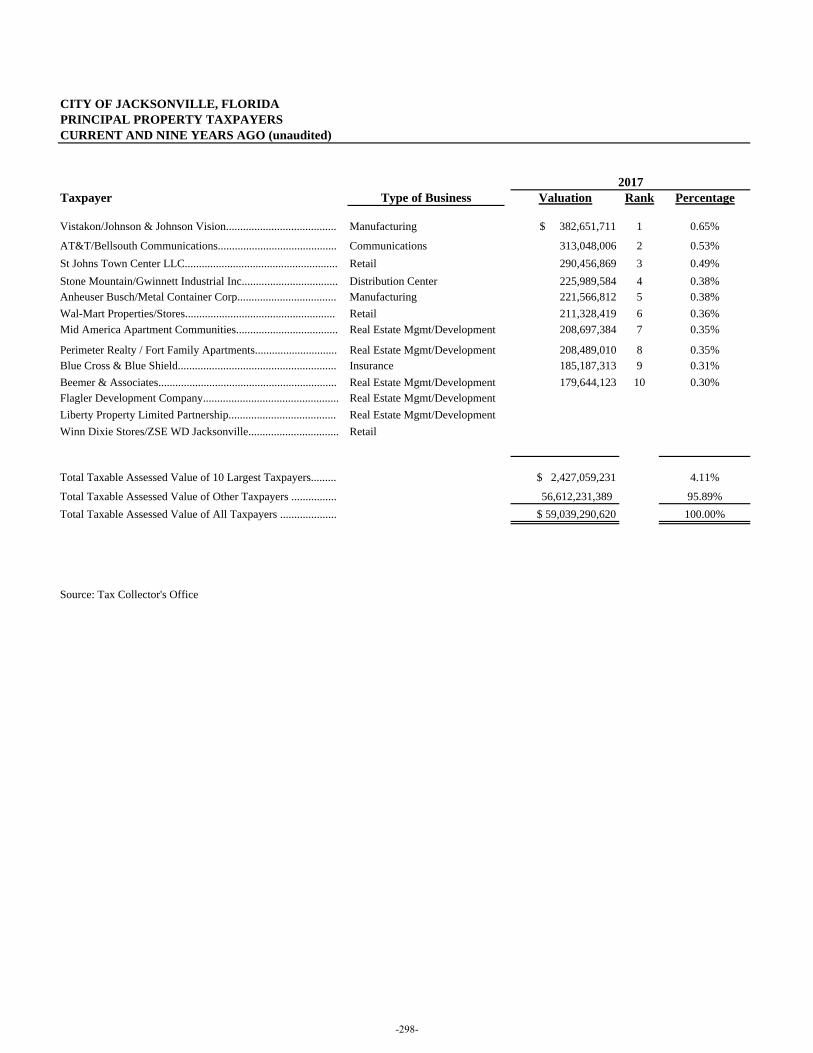
CITY OF JACKSONVILLE, FLORIDAPRINCIPAL PROPERTY TAXPAYERSCURRENT AND NINE YEARS AGO (unaudited)
Taxpayer Type of Business Valuation Rank Percentage
Vistakon/Johnson & Johnson Vision....................................... Manufacturing $ 382,651,711 1 0.65%
AT&T/Bellsouth Communications.......................................... Communications 313,048,006 2 0.53%St Johns Town Center LLC...................................................... Retail 290,456,869 3 0.49%Stone Mountain/Gwinnett Industrial Inc.................................. Distribution Center 225,989,584 4 0.38%Anheuser Busch/Metal Container Corp................................... Manufacturing 221,566,812 5 0.38%Wal-Mart Properties/Stores..................................................... Retail 211,328,419 6 0.36%Mid America Apartment Communities.................................... Real Estate Mgmt/Development 208,697,384 7 0.35%
Perimeter Realty / Fort Family Apartments............................. Real Estate Mgmt/Development 208,489,010 8 0.35%Blue Cross & Blue Shield........................................................ Insurance 185,187,313 9 0.31%Beemer & Associates............................................................... Real Estate Mgmt/Development 179,644,123 10 0.30%Flagler Development Company................................................ Real Estate Mgmt/DevelopmentLiberty Property Limited Partnership...................................... Real Estate Mgmt/DevelopmentWinn Dixie Stores/ZSE WD Jacksonville................................ Retail
Total Taxable Assessed Value of 10 Largest Taxpayers......... $ 2,427,059,231 4.11%
Total Taxable Assessed Value of Other Taxpayers ................ 56,612,231,389 95.89%Total Taxable Assessed Value of All Taxpayers .................... $ 59,039,290,620 100.00%
Note: Back in 2000 BellSouth and AT&T were separate companies. Since then AT&T bought out BellSouth to become one company. Source: Tax Collector's Office
2017
-298-
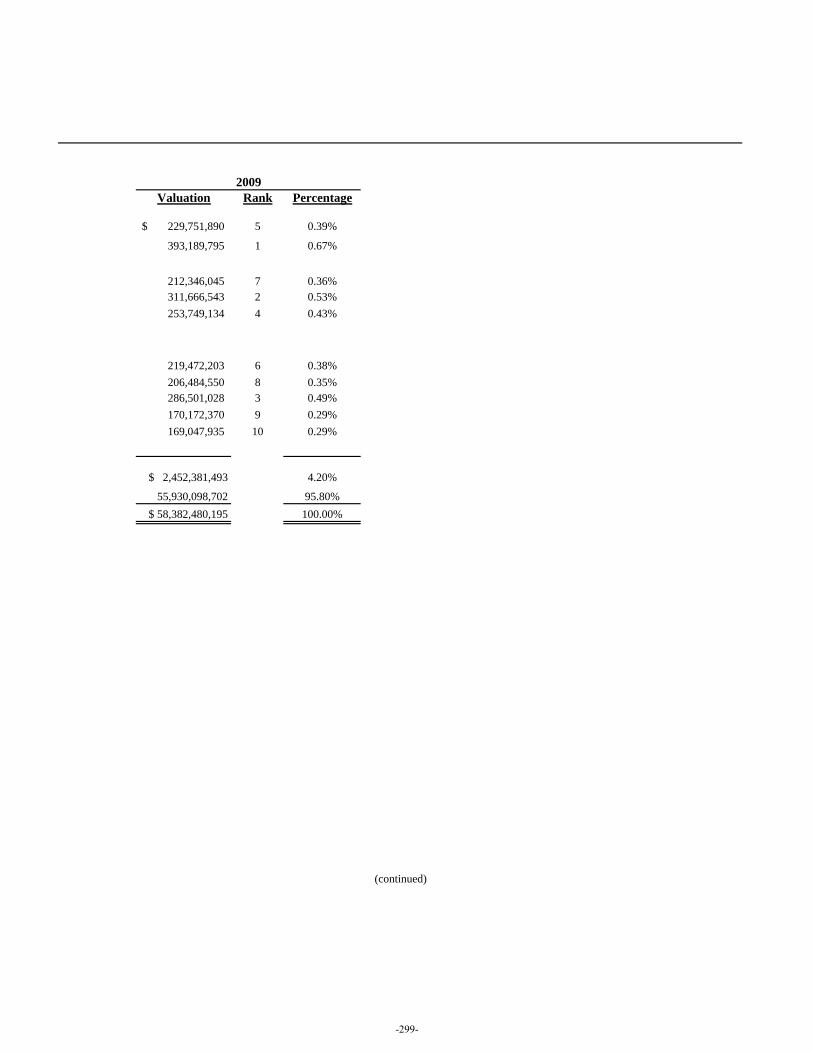
Valuation Rank Percentage
229,751,890$ 5 0.39%
393,189,795 1 0.67%
212,346,045 7 0.36%311,666,543 2 0.53%253,749,134 4 0.43%
219,472,203 6 0.38%206,484,550 8 0.35%286,501,028 3 0.49%170,172,370 9 0.29%169,047,935 10 0.29%
$ 2,452,381,493 4.20%
55,930,098,702 95.80%$ 58,382,480,195 100.00%
2009
(continued)
-299-
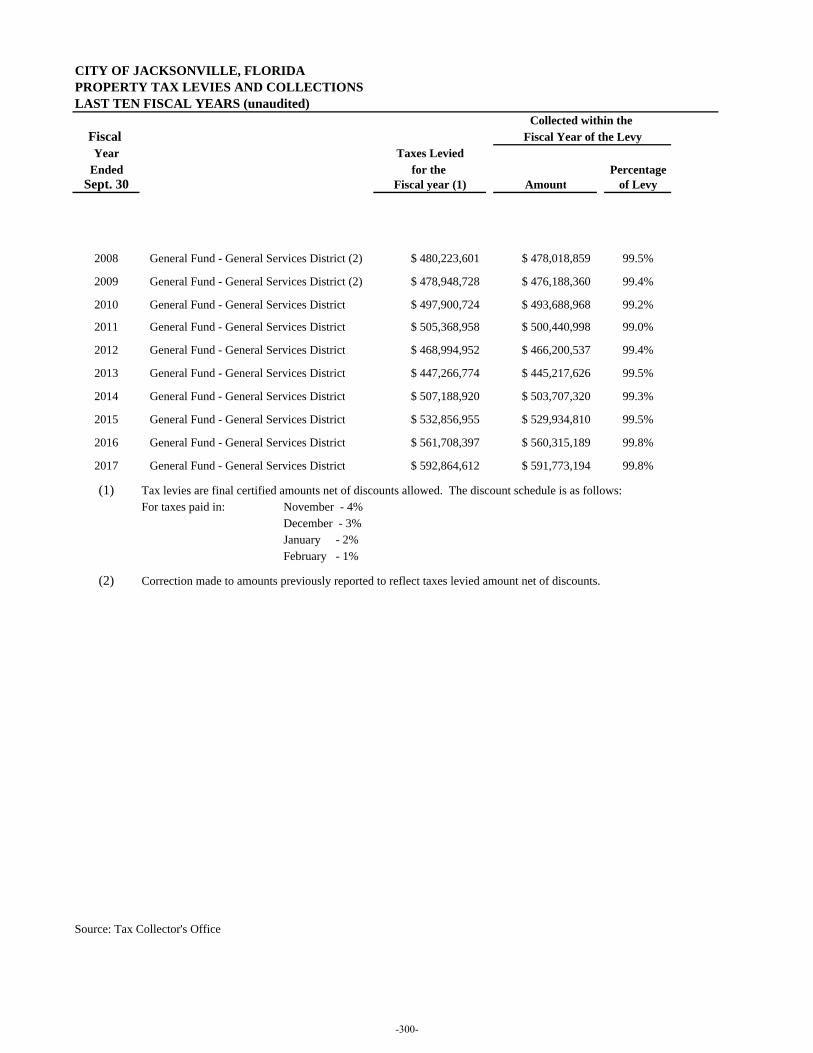
CITY OF JACKSONVILLE, FLORIDAPROPERTY TAX LEVIES AND COLLECTIONSLAST TEN FISCAL YEARS (unaudited)
Fiscal Year Taxes Levied
Ended for the PercentageSept. 30 Fiscal year (1) Amount of Levy
2008 General Fund - General Services District (2) $ 480,223,601 $ 478,018,859 99.5%
2009 General Fund - General Services District (2) $ 478,948,728 $ 476,188,360 99.4%
2010 General Fund - General Services District $ 497,900,724 $ 493,688,968 99.2%
2011 General Fund - General Services District $ 505,368,958 $ 500,440,998 99.0%
2012 General Fund - General Services District $ 468,994,952 $ 466,200,537 99.4%
2013 General Fund - General Services District $ 447,266,774 $ 445,217,626 99.5%
2014 General Fund - General Services District $ 507,188,920 $ 503,707,320 99.3%
2015 General Fund - General Services District $ 532,856,955 $ 529,934,810 99.5%
2016 General Fund - General Services District $ 561,708,397 $ 560,315,189 99.8%
2017 General Fund - General Services District $ 592,864,612 $ 591,773,194 99.8%
(1) Tax levies are final certified amounts net of discounts allowed. The discount schedule is as follows:For taxes paid in: November - 4%
December - 3%January - 2%February - 1%
(2) Correction made to amounts previously reported to reflect taxes levied amount net of discounts.
Source: Tax Collector's Office
Collected within the Fiscal Year of the Levy
-300-
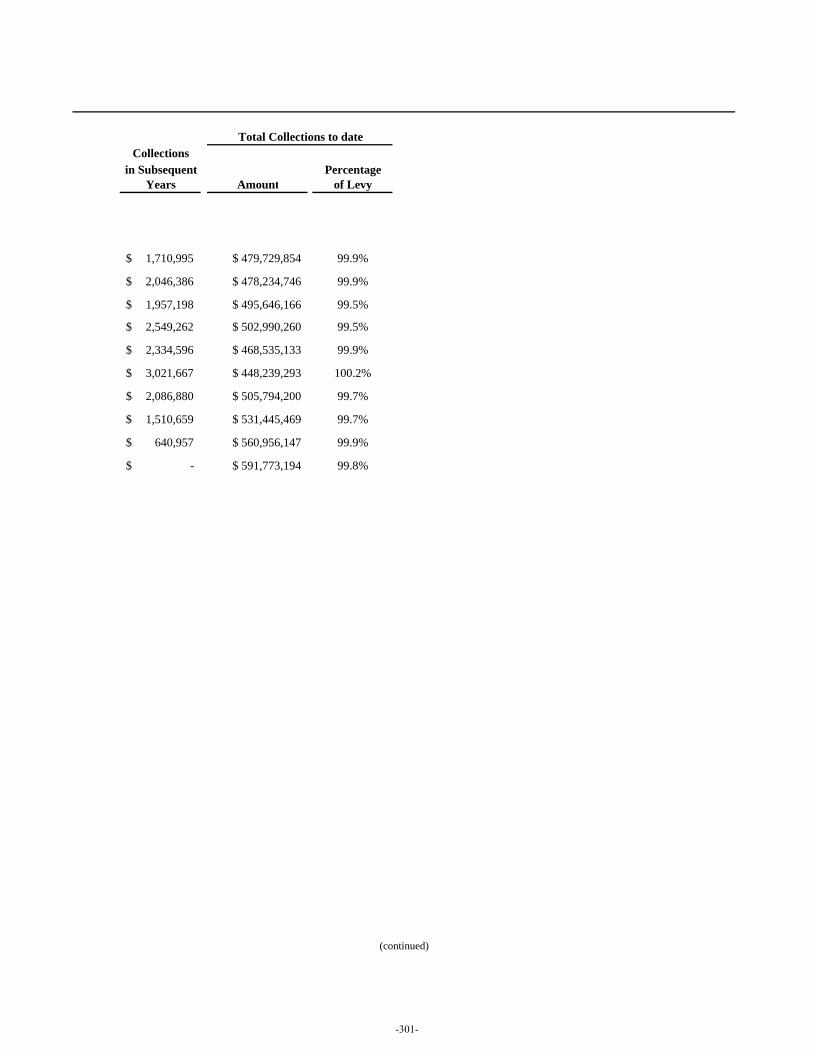
Collectionsin Subsequent Percentage
Years Amount of Levy
1,710,995$ $ 479,729,854 99.9%
2,046,386$ $ 478,234,746 99.9%
1,957,198$ $ 495,646,166 99.5%
2,549,262$ $ 502,990,260 99.5%
2,334,596$ $ 468,535,133 99.9%
3,021,667$ $ 448,239,293 100.2%
2,086,880$ $ 505,794,200 99.7%
1,510,659$ $ 531,445,469 99.7%
640,957$ $ 560,956,147 99.9%
-$ $ 591,773,194 99.8%
Total Collections to date
(continued)
-301-

(This page is intentionally left blank.)
-302-

STATISTICAL SECTION – DEBT CAPACITY
-303-
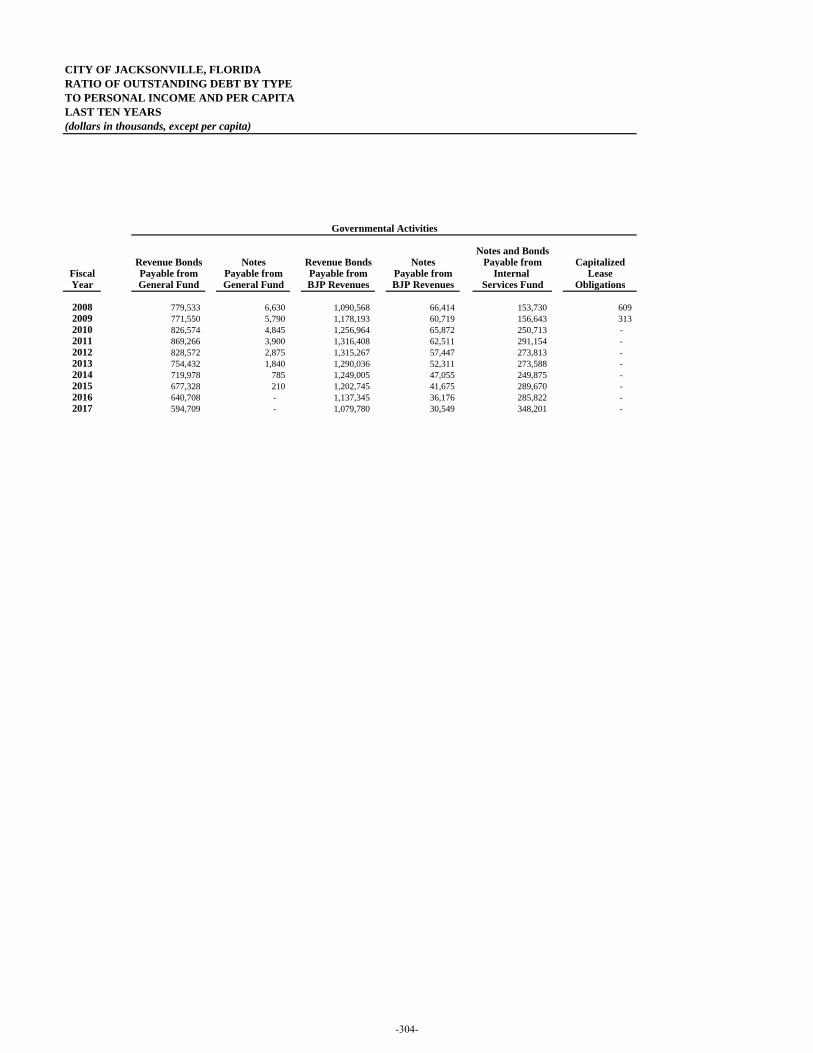
CITY OF JACKSONVILLE, FLORIDARATIO OF OUTSTANDING DEBT BY TYPETO PERSONAL INCOME AND PER CAPITALAST TEN YEARS(dollars in thousands, except per capita)
Notes and BondsRevenue Bonds Notes Revenue Bonds Notes Payable from Capitalized
Fiscal Payable from Payable from Payable from Payable from Internal LeaseYear General Fund General Fund BJP Revenues BJP Revenues Services Fund Obligations
2008 779,533 6,630 1,090,568 66,414 153,730 609 2009 771,550 5,790 1,178,193 60,719 156,643 313 2010 826,574 4,845 1,256,964 65,872 250,713 - 2011 869,266 3,900 1,316,408 62,511 291,154 - 2012 828,572 2,875 1,315,267 57,447 273,813 - 2013 754,432 1,840 1,290,036 52,311 273,588 - 2014 719,978 785 1,249,005 47,055 249,875 - 2015 677,328 210 1,202,745 41,675 289,670 - 2016 640,708 - 1,137,345 36,176 285,822 - 2017 594,709 - 1,079,780 30,549 348,201 -
Governmental Activities
-304-
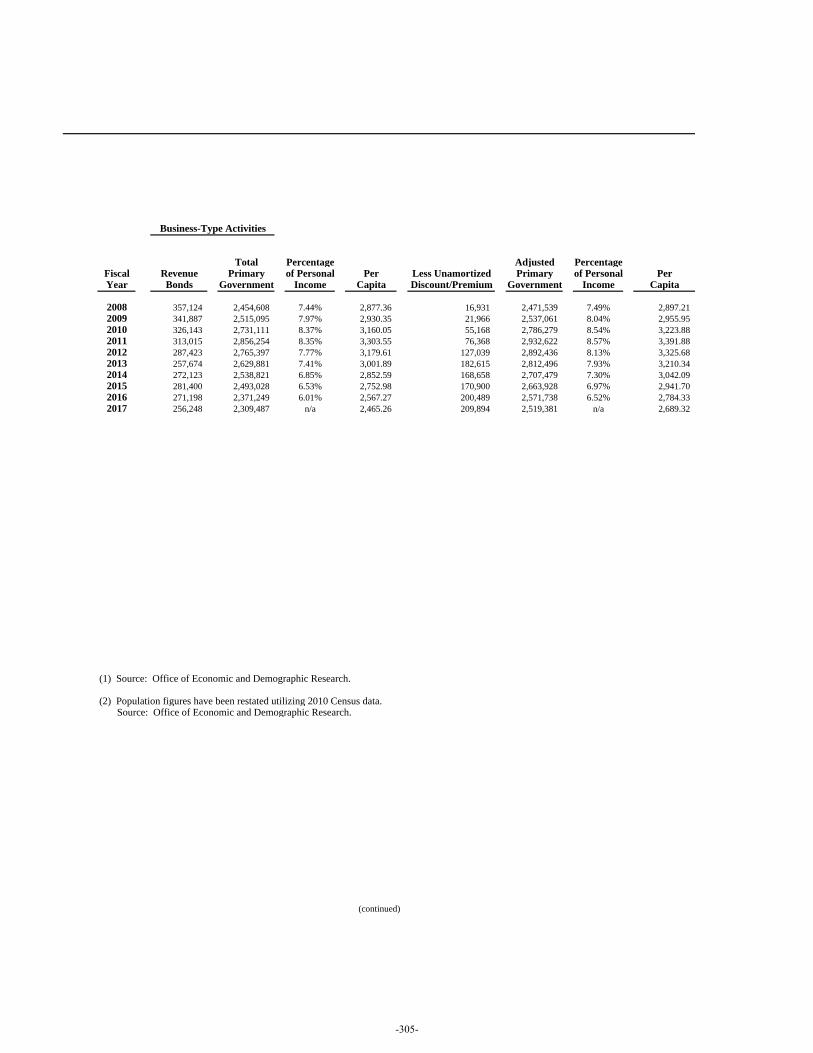
Business-Type Activities
Total Percentage Adjusted PercentageFiscal Revenue Primary of Personal Per Less Unamortized Primary of Personal PerYear Bonds Government Income Capita Discount/Premium Government Income Capita
2008 357,124 2,454,608 7.44% 2,877.36 16,931 2,471,539 7.49% 2,897.21 2009 341,887 2,515,095 7.97% 2,930.35 21,966 2,537,061 8.04% 2,955.95 2010 326,143 2,731,111 8.37% 3,160.05 55,168 2,786,279 8.54% 3,223.88 2011 313,015 2,856,254 8.35% 3,303.55 76,368 2,932,622 8.57% 3,391.88 2012 287,423 2,765,397 7.77% 3,179.61 127,039 2,892,436 8.13% 3,325.68 2013 257,674 2,629,881 7.41% 3,001.89 182,615 2,812,496 7.93% 3,210.34 2014 272,123 2,538,821 6.85% 2,852.59 168,658 2,707,479 7.30% 3,042.09 2015 281,400 2,493,028 6.53% 2,752.98 170,900 2,663,928 6.97% 2,941.70 2016 271,198 2,371,249 6.01% 2,567.27 200,489 2,571,738 6.52% 2,784.33 2017 256,248 2,309,487 n/a 2,465.26 209,894 2,519,381 n/a 2,689.32
(1) Source: Office of Economic and Demographic Research.
(2) Population figures have been restated utilizing 2010 Census data. Source: Office of Economic and Demographic Research.
(continued)
-305-
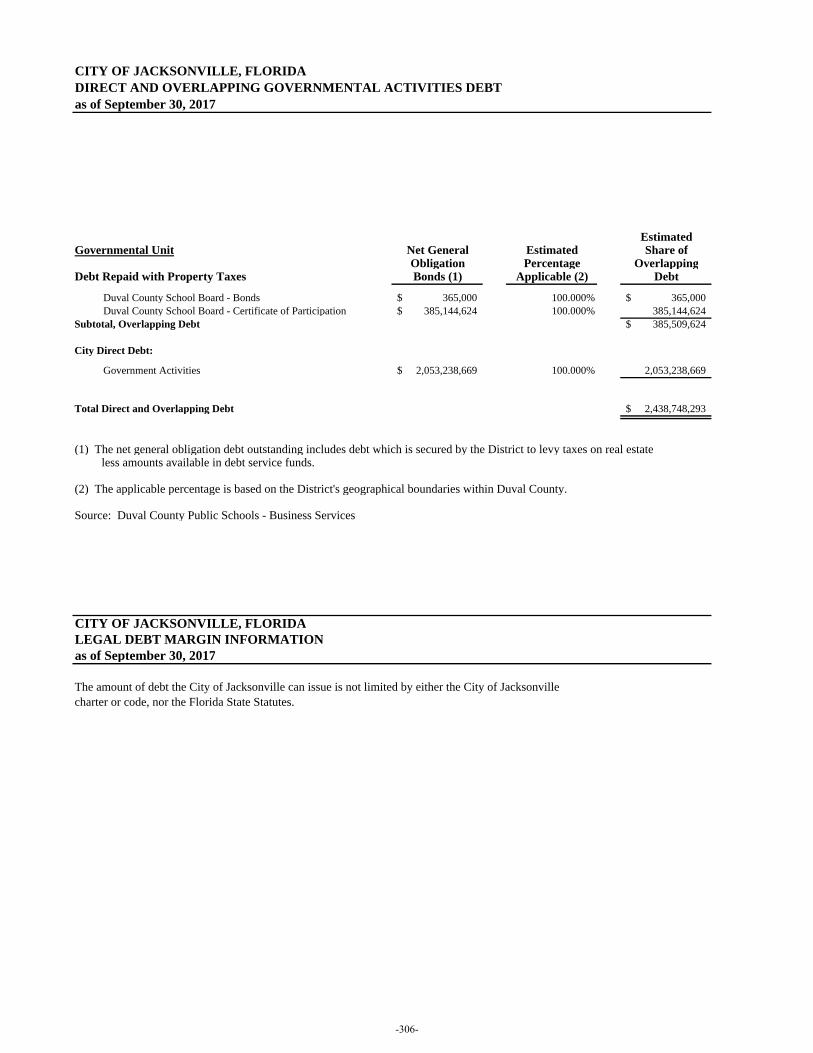
CITY OF JACKSONVILLE, FLORIDADIRECT AND OVERLAPPING GOVERNMENTAL ACTIVITIES DEBTas of September 30, 2017
EstimatedGovernmental Unit Net General Estimated Share of
Obligation Percentage OverlappingDebt Repaid with Property Taxes Bonds (1) Applicable (2) Debt
Duval County School Board - Bonds 365,000$ 100.000% 365,000$ Duval County School Board - Certificate of Participation 385,144,624$ 100.000% 385,144,624
Subtotal, Overlapping Debt 385,509,624$
City Direct Debt:
Government Activities 2,053,238,669$ 100.000% 2,053,238,669
Total Direct and Overlapping Debt 2,438,748,293$
(1) The net general obligation debt outstanding includes debt which is secured by the District to levy taxes on real estate less amounts available in debt service funds.
(2) The applicable percentage is based on the District's geographical boundaries within Duval County.
Source: Duval County Public Schools - Business Services
CITY OF JACKSONVILLE, FLORIDALEGAL DEBT MARGIN INFORMATIONas of September 30, 2017
The amount of debt the City of Jacksonville can issue is not limited by either the City of Jacksonville charter or code, nor the Florida State Statutes.
-306-

(This page is intentionally left blank.)
-307-
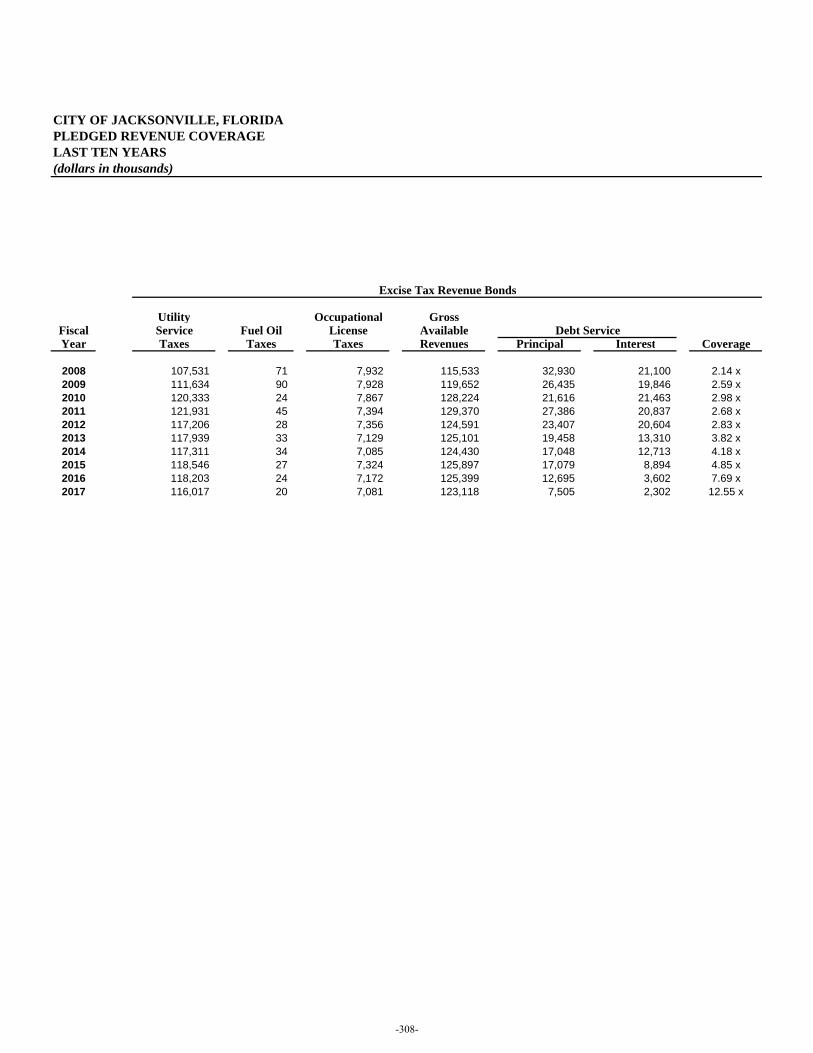
CITY OF JACKSONVILLE, FLORIDAPLEDGED REVENUE COVERAGELAST TEN YEARS(dollars in thousands)
Utility Occupational GrossFiscal Service Fuel Oil License AvailableYear Taxes Taxes Taxes Revenues Principal Interest Coverage
2008 107,531 71 7,932 115,533 32,930 21,100 2.14 x2009 111,634 90 7,928 119,652 26,435 19,846 2.59 x2010 120,333 24 7,867 128,224 21,616 21,463 2.98 x2011 121,931 45 7,394 129,370 27,386 20,837 2.68 x2012 117,206 28 7,356 124,591 23,407 20,604 2.83 x2013 117,939 33 7,129 125,101 19,458 13,310 3.82 x2014 117,311 34 7,085 124,430 17,048 12,713 4.18 x2015 118,546 27 7,324 125,897 17,079 8,894 4.85 x2016 118,203 24 7,172 125,399 12,695 3,602 7.69 x2017 116,017 20 7,081 123,118 7,505 2,302 12.55 x
Debt Service
Excise Tax Revenue Bonds
-308-
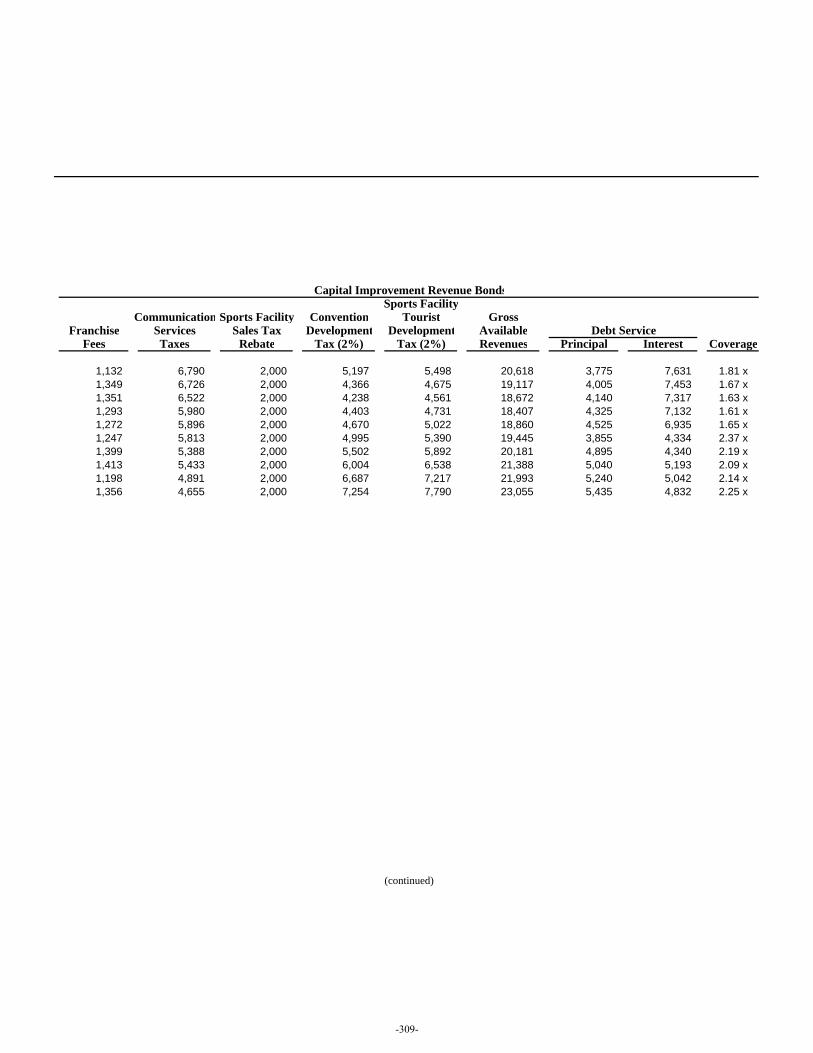
Sports FacilityCommunication Sports Facility Convention Tourist Gross
Franchise Services Sales Tax Development Development AvailableFees Taxes Rebate Tax (2%) Tax (2%) Revenues Principal Interest Coverage
1,132 6,790 2,000 5,197 5,498 20,618 3,775 7,631 1.81 x1,349 6,726 2,000 4,366 4,675 19,117 4,005 7,453 1.67 x1,351 6,522 2,000 4,238 4,561 18,672 4,140 7,317 1.63 x1,293 5,980 2,000 4,403 4,731 18,407 4,325 7,132 1.61 x1,272 5,896 2,000 4,670 5,022 18,860 4,525 6,935 1.65 x1,247 5,813 2,000 4,995 5,390 19,445 3,855 4,334 2.37 x1,399 5,388 2,000 5,502 5,892 20,181 4,895 4,340 2.19 x1,413 5,433 2,000 6,004 6,538 21,388 5,040 5,193 2.09 x1,198 4,891 2,000 6,687 7,217 21,993 5,240 5,042 2.14 x1,356 4,655 2,000 7,254 7,790 23,055 5,435 4,832 2.25 x
Capital Improvement Revenue Bonds
Debt Service
(continued)
-309-
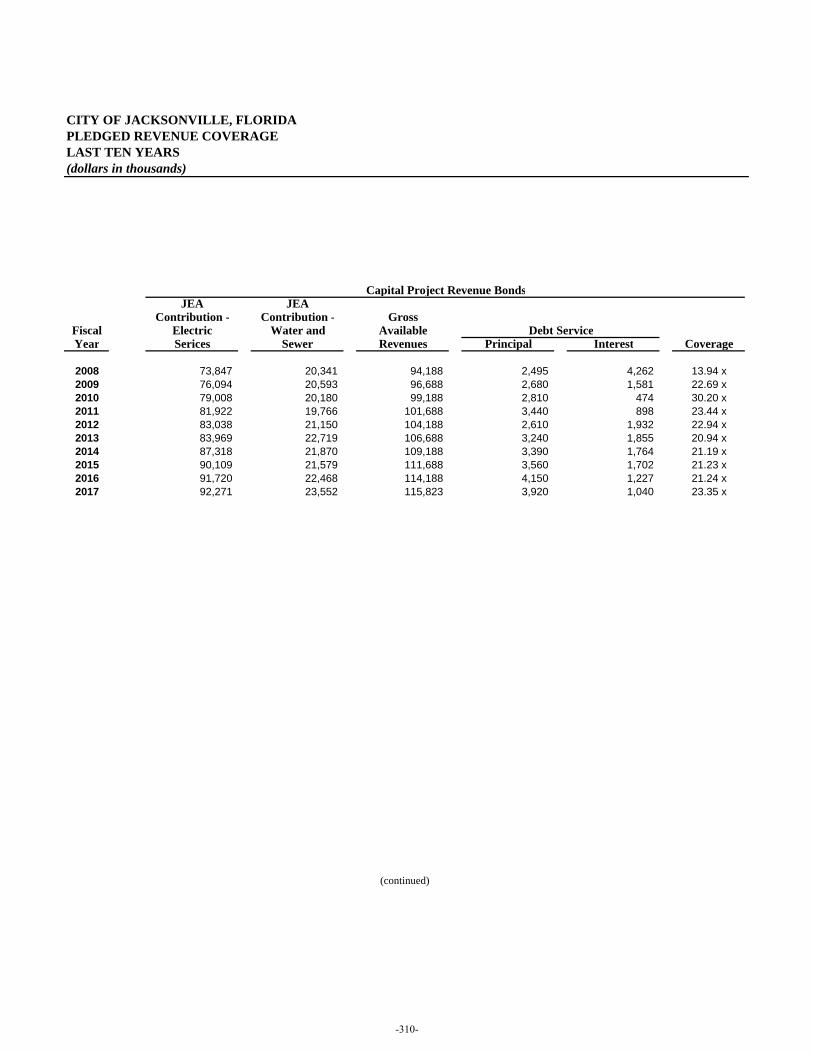
CITY OF JACKSONVILLE, FLORIDAPLEDGED REVENUE COVERAGELAST TEN YEARS(dollars in thousands)
JEA JEAContribution - Contribution - Gross
Fiscal Electric Water and AvailableYear Serices Sewer Revenues Principal Interest Coverage
2008 73,847 20,341 94,188 2,495 4,262 13.94 x2009 76,094 20,593 96,688 2,680 1,581 22.69 x2010 79,008 20,180 99,188 2,810 474 30.20 x2011 81,922 19,766 101,688 3,440 898 23.44 x2012 83,038 21,150 104,188 2,610 1,932 22.94 x2013 83,969 22,719 106,688 3,240 1,855 20.94 x2014 87,318 21,870 109,188 3,390 1,764 21.19 x2015 90,109 21,579 111,688 3,560 1,702 21.23 x2016 91,720 22,468 114,188 4,150 1,227 21.24 x2017 92,271 23,552 115,823 3,920 1,040 23.35 x
Debt Service
(continued)
Capital Project Revenue Bonds
-310-
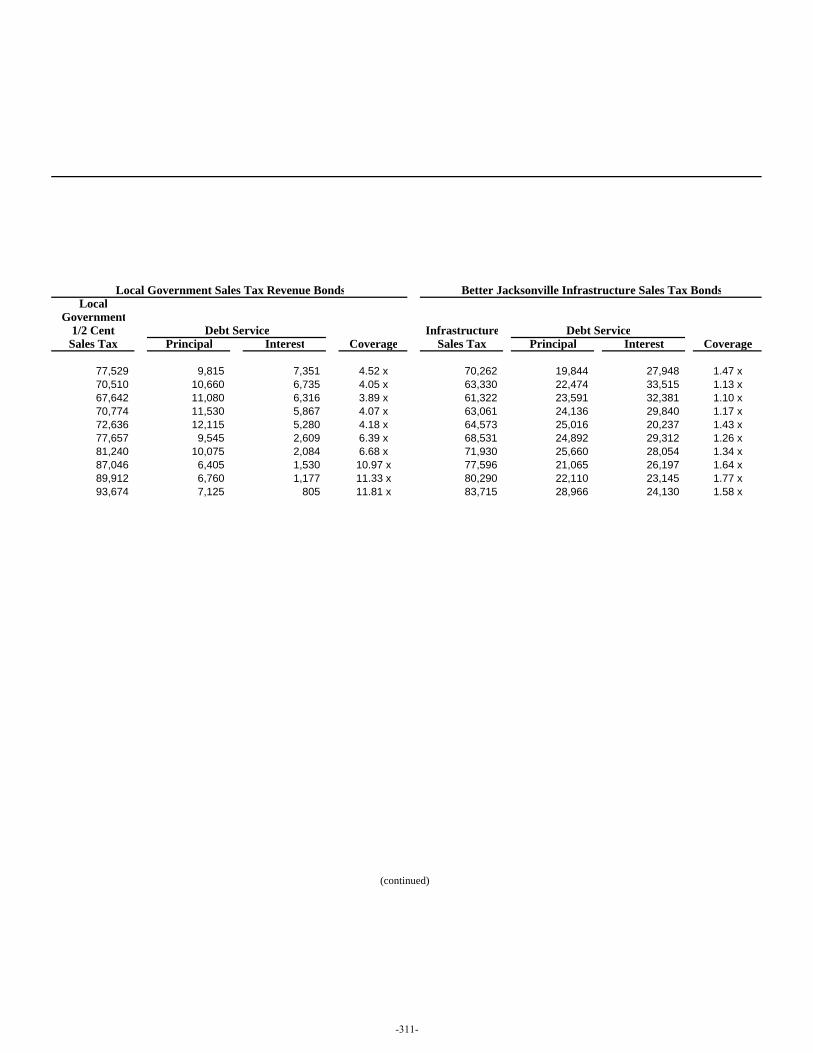
LocalGovernment
1/2 Cent InfrastructureSales Tax Principal Interest Coverage Sales Tax Principal Interest Coverage
77,529 9,815 7,351 4.52 x 70,262 19,844 27,948 1.47 x70,510 10,660 6,735 4.05 x 63,330 22,474 33,515 1.13 x67,642 11,080 6,316 3.89 x 61,322 23,591 32,381 1.10 x70,774 11,530 5,867 4.07 x 63,061 24,136 29,840 1.17 x72,636 12,115 5,280 4.18 x 64,573 25,016 20,237 1.43 x77,657 9,545 2,609 6.39 x 68,531 24,892 29,312 1.26 x81,240 10,075 2,084 6.68 x 71,930 25,660 28,054 1.34 x87,046 6,405 1,530 10.97 x 77,596 21,065 26,197 1.64 x89,912 6,760 1,177 11.33 x 80,290 22,110 23,145 1.77 x93,674 7,125 805 11.81 x 83,715 28,966 24,130 1.58 x
Better Jacksonville Infrastructure Sales Tax BondsLocal Government Sales Tax Revenue Bonds
(continued)
Debt Service Debt Service
-311-
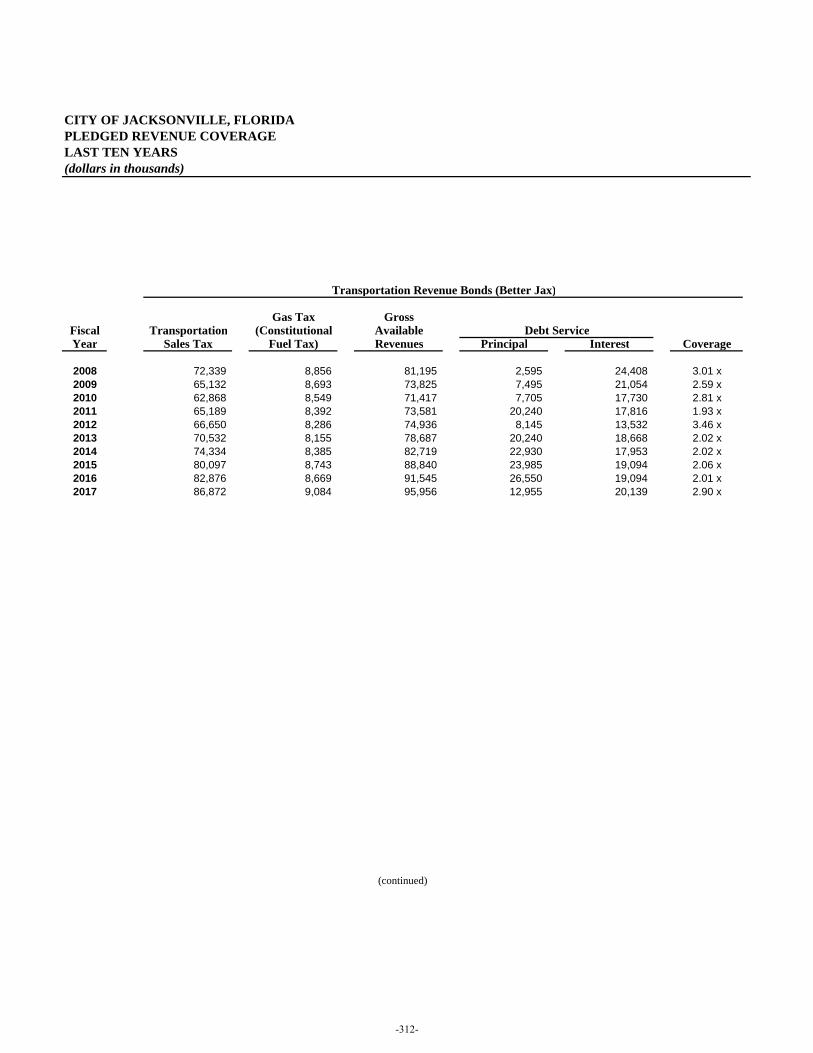
CITY OF JACKSONVILLE, FLORIDAPLEDGED REVENUE COVERAGELAST TEN YEARS(dollars in thousands)
Gas Tax GrossFiscal Transportation (Constitutional AvailableYear Sales Tax Fuel Tax) Revenues Principal Interest Coverage
2008 72,339 8,856 81,195 2,595 24,408 3.01 x2009 65,132 8,693 73,825 7,495 21,054 2.59 x2010 62,868 8,549 71,417 7,705 17,730 2.81 x2011 65,189 8,392 73,581 20,240 17,816 1.93 x2012 66,650 8,286 74,936 8,145 13,532 3.46 x2013 70,532 8,155 78,687 20,240 18,668 2.02 x2014 74,334 8,385 82,719 22,930 17,953 2.02 x2015 80,097 8,743 88,840 23,985 19,094 2.06 x2016 82,876 8,669 91,545 26,550 19,094 2.01 x2017 86,872 9,084 95,956 12,955 20,139 2.90 x
Transportation Revenue Bonds (Better Jax)
Debt Service
(continued)
-312-
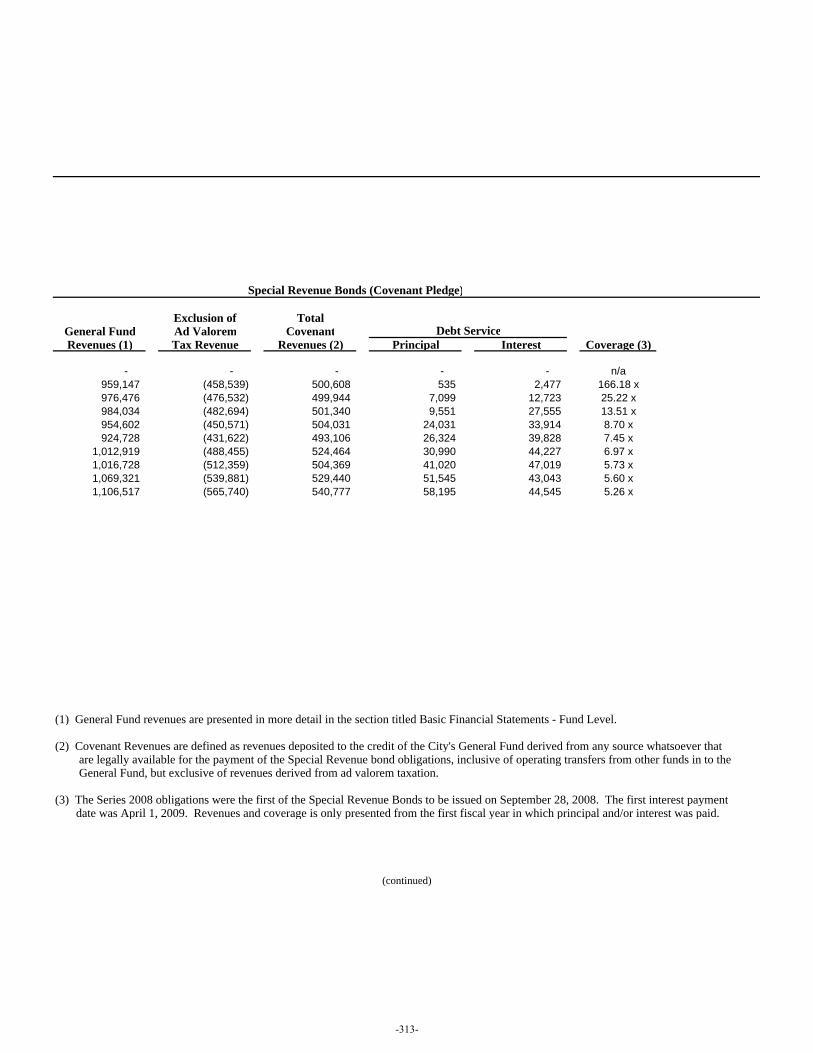
Exclusion of TotalGeneral Fund Ad Valorem CovenantRevenues (1) Tax Revenue Revenues (2) Principal Interest Coverage (3)
- - - - - n/a959,147 (458,539) 500,608 535 2,477 166.18 x976,476 (476,532) 499,944 7,099 12,723 25.22 x984,034 (482,694) 501,340 9,551 27,555 13.51 x954,602 (450,571) 504,031 24,031 33,914 8.70 x924,728 (431,622) 493,106 26,324 39,828 7.45 x
1,012,919 (488,455) 524,464 30,990 44,227 6.97 x1,016,728 (512,359) 504,369 41,020 47,019 5.73 x1,069,321 (539,881) 529,440 51,545 43,043 5.60 x1,106,517 (565,740) 540,777 58,195 44,545 5.26 x
(1) General Fund revenues are presented in more detail in the section titled Basic Financial Statements - Fund Level.
(2) Covenant Revenues are defined as revenues deposited to the credit of the City's General Fund derived from any source whatsoever that are legally available for the payment of the Special Revenue bond obligations, inclusive of operating transfers from other funds in to the General Fund, but exclusive of revenues derived from ad valorem taxation.
(3) The Series 2008 obligations were the first of the Special Revenue Bonds to be issued on September 28, 2008. The first interest payment date was April 1, 2009. Revenues and coverage is only presented from the first fiscal year in which principal and/or interest was paid.
(continued)
Special Revenue Bonds (Covenant Pledge)
Debt Service
-313-
STATISTICAL SECTION – DEMOGRAPHIC AND ECONOMIC INFORMATION
-314-
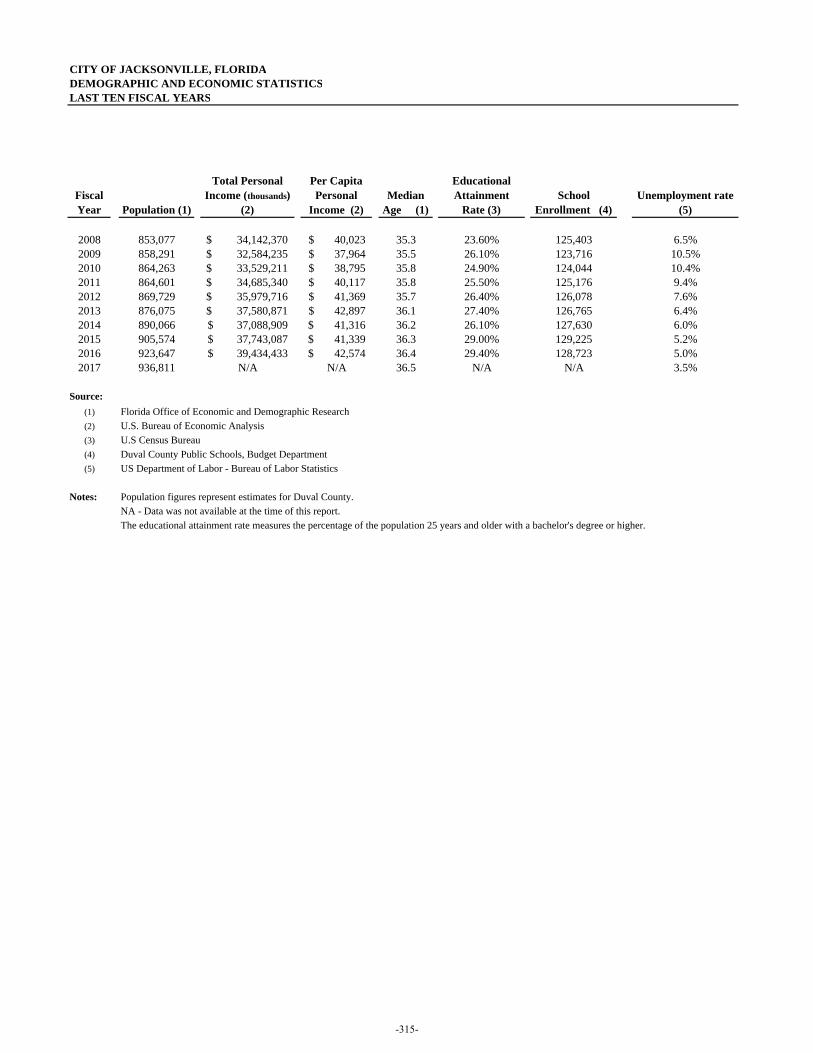
CITY OF JACKSONVILLE, FLORIDADEMOGRAPHIC AND ECONOMIC STATISTICSLAST TEN FISCAL YEARS
Fiscal Year Population (1)
Total Personal Income (thousands)
(2)
Per Capita Personal
Income (2) Median
Age (1)
Educational Attainment
Rate (3)School
Enrollment (4)Unemployment rate
(5)
2008 853,077 34,142,370$ 40,023$ 35.3 23.60% 125,403 6.5%2009 858,291 32,584,235$ 37,964$ 35.5 26.10% 123,716 10.5%2010 864,263 33,529,211$ 38,795$ 35.8 24.90% 124,044 10.4%2011 864,601 34,685,340$ 40,117$ 35.8 25.50% 125,176 9.4%2012 869,729 35,979,716$ 41,369$ 35.7 26.40% 126,078 7.6%2013 876,075 37,580,871$ 42,897$ 36.1 27.40% 126,765 6.4%2014 890,066 37,088,909$ 41,316$ 36.2 26.10% 127,630 6.0%2015 905,574 37,743,087$ 41,339$ 36.3 29.00% 129,225 5.2%2016 923,647 39,434,433$ 42,574$ 36.4 29.40% 128,723 5.0%2017 936,811 N/A N/A 36.5 N/A N/A 3.5%
Source: (1)(2)(3)(4) Duval County Public Schools, Budget Department(5)
Notes:
The educational attainment rate measures the percentage of the population 25 years and older with a bachelor's degree or higher.NA - Data was not available at the time of this report.
U.S. Bureau of Economic AnalysisFlorida Office of Economic and Demographic Research
US Department of Labor - Bureau of Labor Statistics
Population figures represent estimates for Duval County.
U.S Census Bureau
-315-
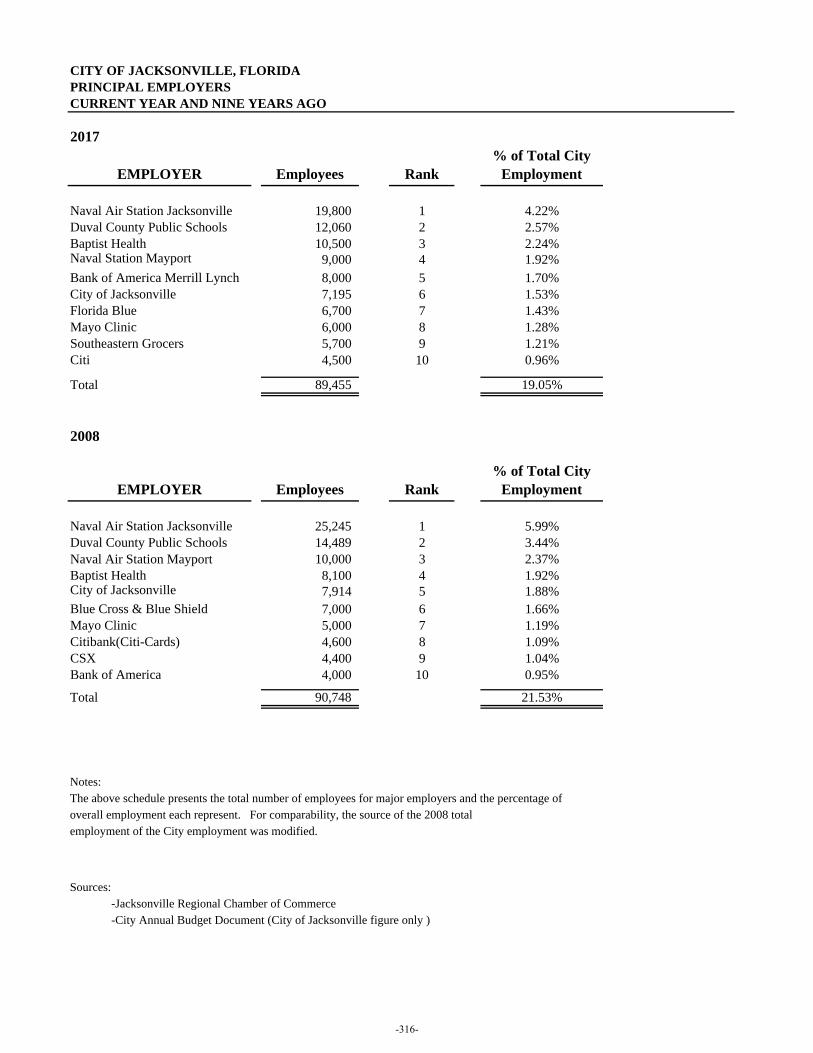
CITY OF JACKSONVILLE, FLORIDAPRINCIPAL EMPLOYERSCURRENT YEAR AND NINE YEARS AGO
2017
EMPLOYER Employees Rank% of Total City
Employment
Naval Air Station Jacksonville 19,800 1 4.22%Duval County Public Schools 12,060 2 2.57%Baptist Health 10,500 3 2.24%Naval Station Mayport 9,000 4 1.92%Bank of America Merrill Lynch 8,000 5 1.70%City of Jacksonville 7,195 6 1.53%Florida Blue 6,700 7 1.43%Mayo Clinic 6,000 8 1.28%Southeastern Grocers 5,700 9 1.21%Citi 4,500 10 0.96%
Total 89,455 19.05%
2008
EMPLOYER Employees Rank% of Total City
Employment
Naval Air Station Jacksonville 25,245 1 5.99%Duval County Public Schools 14,489 2 3.44%Naval Air Station Mayport 10,000 3 2.37%Baptist Health 8,100 4 1.92%City of Jacksonville 7,914 5 1.88%Blue Cross & Blue Shield 7,000 6 1.66%Mayo Clinic 5,000 7 1.19%Citibank(Citi-Cards) 4,600 8 1.09%CSX 4,400 9 1.04%Bank of America 4,000 10 0.95%
Total 90,748 21.53%
Notes:The above schedule presents the total number of employees for major employers and the percentage ofoverall employment each represent. For comparability, the source of the 2008 totalemployment of the City employment was modified.
Sources:-Jacksonville Regional Chamber of CommerceSources:-City Annual Budget Document (City of Jacksonville figure only )
Sources:
-316-

(This page is intentionally left blank.)
-317-

STATISTICAL SECTION – OPERATING INFORMATION
-318-
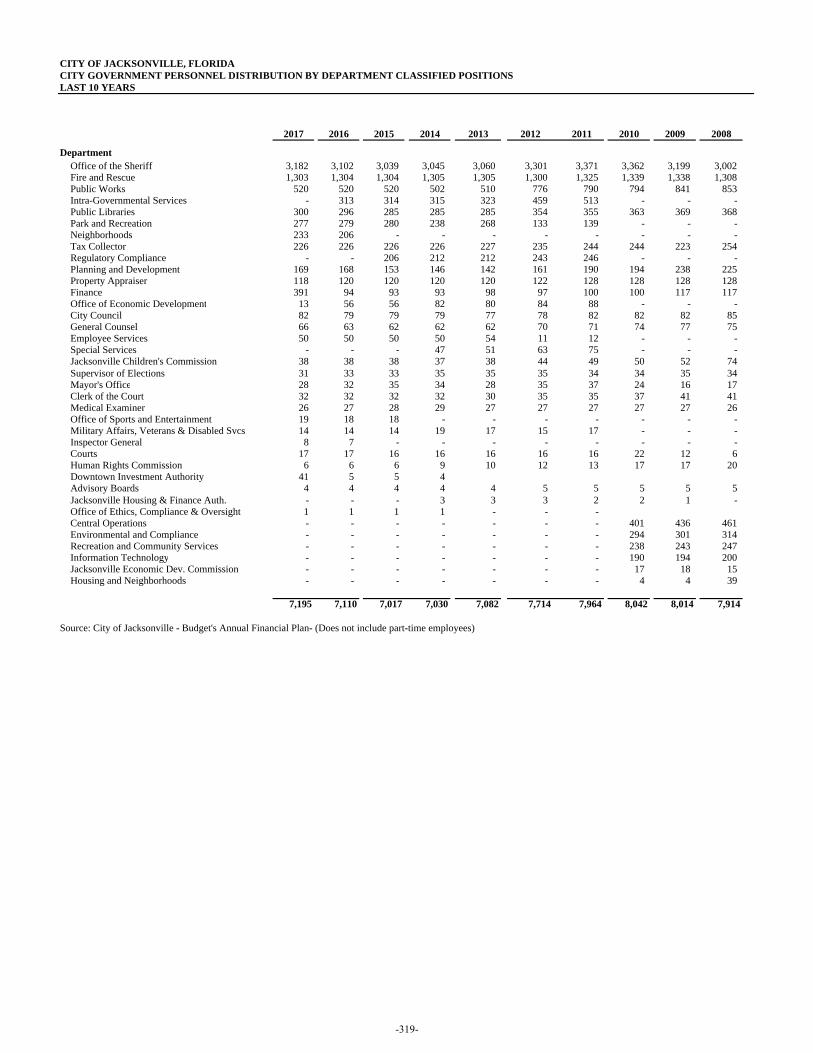
CITY OF JACKSONVILLE, FLORIDACITY GOVERNMENT PERSONNEL DISTRIBUTION BY DEPARTMENT CLASSIFIED POSITIONSLAST 10 YEARS
2017 2016 2015 2014 2013 2012 2011 2010 2009 2008
DepartmentOffice of the Sheriff 3,182 3,102 3,039 3,045 3,060 3,301 3,371 3,362 3,199 3,002 Fire and Rescue 1,303 1,304 1,304 1,305 1,305 1,300 1,325 1,339 1,338 1,308 Public Works 520 520 520 502 510 776 790 794 841 853 Intra-Governmental Services - 313 314 315 323 459 513 - - - Public Libraries 300 296 285 285 285 354 355 363 369 368 Park and Recreation 277 279 280 238 268 133 139 - - - Neighborhoods 233 206 - - - - - - - - Tax Collector 226 226 226 226 227 235 244 244 223 254 Regulatory Compliance - - 206 212 212 243 246 - - - Planning and Development 169 168 153 146 142 161 190 194 238 225 Property Appraiser 118 120 120 120 120 122 128 128 128 128 Finance 391 94 93 93 98 97 100 100 117 117 Office of Economic Development 13 56 56 82 80 84 88 - - - City Council 82 79 79 79 77 78 82 82 82 85 General Counsel 66 63 62 62 62 70 71 74 77 75 Employee Services 50 50 50 50 54 11 12 - - - Special Services - - - 47 51 63 75 - - - Jacksonville Children's Commission 38 38 38 37 38 44 49 50 52 74 Supervisor of Elections 31 33 33 35 35 35 34 34 35 34 Mayor's Office 28 32 35 34 28 35 37 24 16 17 Clerk of the Court 32 32 32 32 30 35 35 37 41 41 Medical Examiner 26 27 28 29 27 27 27 27 27 26 Office of Sports and Entertainment 19 18 18 - - - - - - - Military Affairs, Veterans & Disabled Svcs 14 14 14 19 17 15 17 - - - Inspector General 8 7 - - - - - - - - Courts 17 17 16 16 16 16 16 22 12 6 Human Rights Commission 6 6 6 9 10 12 13 17 17 20 Downtown Investment Authority 41 5 5 4 Advisory Boards 4 4 4 4 4 5 5 5 5 5 Jacksonville Housing & Finance Auth. - - - 3 3 3 2 2 1 - Office of Ethics, Compliance & Oversight 1 1 1 1 - - - Central Operations - - - - - - - 401 436 461 Environmental and Compliance - - - - - - - 294 301 314 Recreation and Community Services - - - - - - - 238 243 247 Information Technology - - - - - - - 190 194 200 Jacksonville Economic Dev. Commission - - - - - - - 17 18 15 Housing and Neighborhoods - - - - - - - 4 4 39
7,195 7,110 7,017 7,030 7,082 7,714 7,964 8,042 8,014 7,914
Source: City of Jacksonville - Budget's Annual Financial Plan- (Does not include part-time employees)
-319-
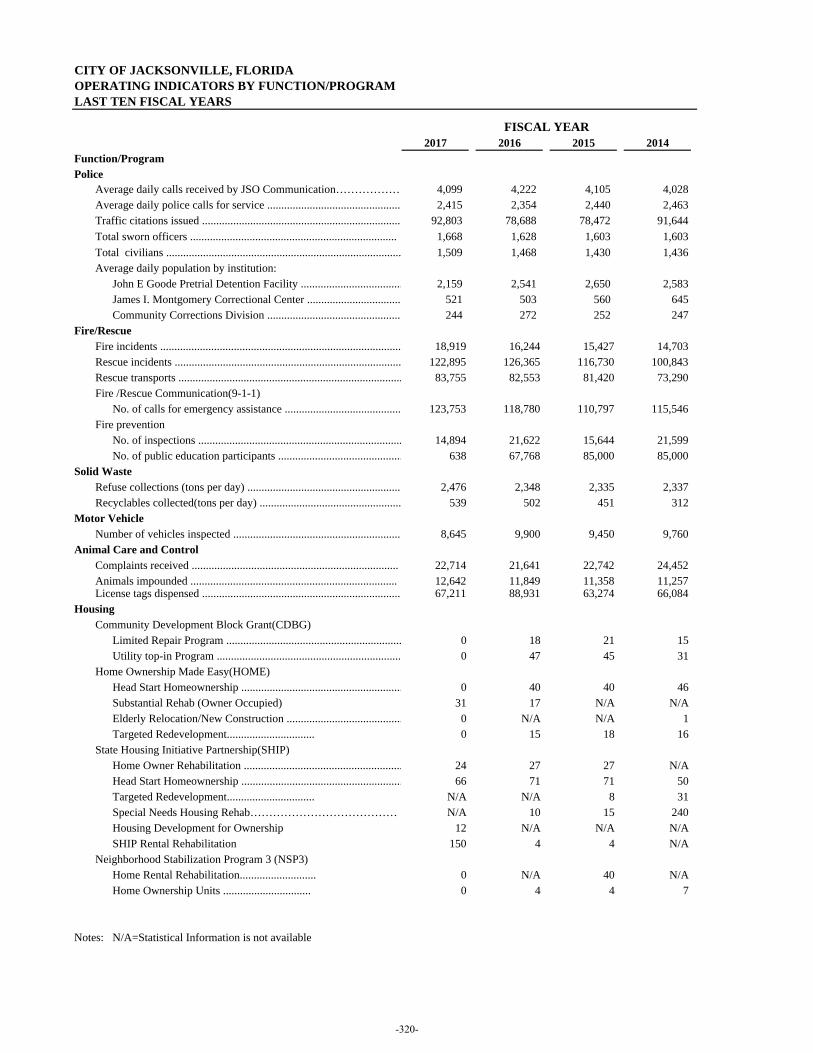
CITY OF JACKSONVILLE, FLORIDAOPERATING INDICATORS BY FUNCTION/PROGRAMLAST TEN FISCAL YEARS
2017 2016 2015 2014Function/ProgramPolice
Average daily calls received by JSO Communication……………… 4,099 4,222 4,105 4,028Average daily police calls for service ................................................ 2,415 2,354 2,440 2,463Traffic citations issued ....................................................................... 92,803 78,688 78,472 91,644Total sworn officers ......................................................................... 1,668 1,628 1,603 1,603Total civilians ................................................................................... 1,509 1,468 1,430 1,436Average daily population by institution:
John E Goode Pretrial Detention Facility .................................... 2,159 2,541 2,650 2,583James I. Montgomery Correctional Center ................................. 521 503 560 645Community Corrections Division ................................................ 244 272 252 247
Fire/Rescue Fire incidents ..................................................................................... 18,919 16,244 15,427 14,703Rescue incidents ................................................................................ 122,895 126,365 116,730 100,843Rescue transports ............................................................................... 83,755 82,553 81,420 73,290Fire /Rescue Communication(9-1-1) No. of calls for emergency assistance ......................................... 123,753 118,780 110,797 115,546Fire prevention
No. of inspections ........................................................................ 14,894 21,622 15,644 21,599No. of public education participants ............................................ 638 67,768 85,000 85,000
Solid Waste Refuse collections (tons per day) ....................................................... 2,476 2,348 2,335 2,337Recyclables collected(tons per day) .................................................. 539 502 451 312
Motor Vehicle Number of vehicles inspected ............................................................ 8,645 9,900 9,450 9,760
Complaints received ......................................................................... 22,714 21,641 22,742 24,452Animals impounded ......................................................................... 12,642 11,849 11,358 11,257License tags dispensed ....................................................................... 67,211 88,931 63,274 66,084
Community Development Block Grant(CDBG)Limited Repair Program .............................................................. 0 18 21 15Utility top-in Program ................................................................. 0 47 45 31
Home Ownership Made Easy(HOME) Head Start Homeownership ......................................................... 0 40 40 46Substantial Rehab (Owner Occupied) 31 17 N/A N/AElderly Relocation/New Construction ......................................... 0 N/A N/A 1Targeted Redevelopment............................... 0 15 18 16
State Housing Initiative Partnership(SHIP) Home Owner Rehabilitation ........................................................ 24 27 27 N/AHead Start Homeownership ......................................................... 66 71 71 50Targeted Redevelopment............................... N/A N/A 8 31Special Needs Housing Rehab………………………………… N/A 10 15 240Housing Development for Ownership 12 N/A N/A N/ASHIP Rental Rehabilitation 150 4 4 N/A
Neighborhood Stabilization Program 3 (NSP3) Home Rental Rehabilitation........................... 0 N/A 40 N/AHome Ownership Units ............................... 0 4 4 7
Notes: N/A=Statistical Information is not available
FISCAL YEAR
Housing
Animal Care and Control
-320-
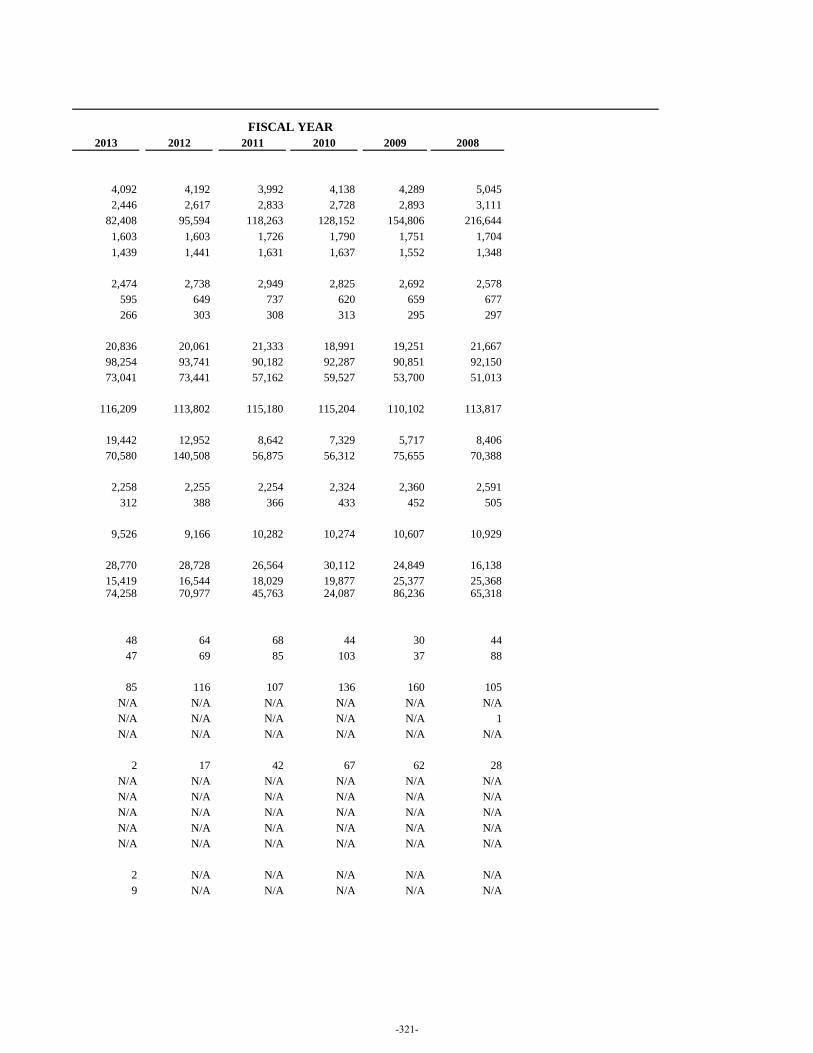
2013 2012 2011 2010 2009 2008
4,092 4,192 3,992 4,138 4,289 5,0452,446 2,617 2,833 2,728 2,893 3,111
82,408 95,594 118,263 128,152 154,806 216,6441,603 1,603 1,726 1,790 1,751 1,7041,439 1,441 1,631 1,637 1,552 1,348
2,474 2,738 2,949 2,825 2,692 2,578
595 649 737 620 659 677266 303 308 313 295 297
20,836 20,061 21,333 18,991 19,251 21,66798,254 93,741 90,182 92,287 90,851 92,15073,041 73,441 57,162 59,527 53,700 51,013
116,209 113,802 115,180 115,204 110,102 113,817
19,442 12,952 8,642 7,329 5,717 8,40670,580 140,508 56,875 56,312 75,655 70,388
2,258 2,255 2,254 2,324 2,360 2,591
312 388 366 433 452 505
9,526 9,166 10,282 10,274 10,607 10,929
28,770 28,728 26,564 30,112 24,849 16,13815,419 16,544 18,029 19,877 25,377 25,36874,258 70,977 45,763 24,087 86,236 65,318
48 64 68 44 30 4447 69 85 103 37 88
85 116 107 136 160 105
N/A N/A N/A N/A N/A N/AN/A N/A N/A N/A N/A 1N/A N/A N/A N/A N/A N/A
2 17 42 67 62 28N/A N/A N/A N/A N/A N/AN/A N/A N/A N/A N/A N/AN/A N/A N/A N/A N/A N/AN/A N/A N/A N/A N/A N/AN/A N/A N/A N/A N/A N/A
2 N/A N/A N/A N/A N/A9 N/A N/A N/A N/A N/A
FISCAL YEAR
-321-
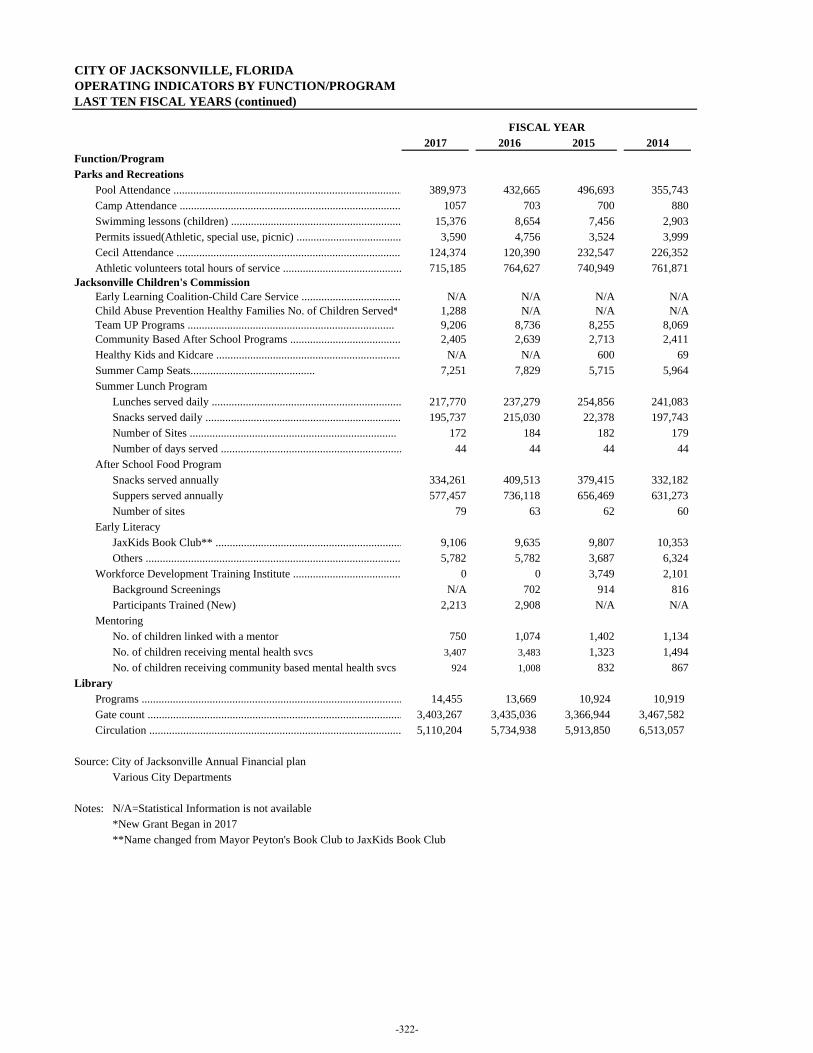
CITY OF JACKSONVILLE, FLORIDAOPERATING INDICATORS BY FUNCTION/PROGRAMLAST TEN FISCAL YEARS (continued)
2017 2016 2015 2014Function/ProgramParks and Recreations
Pool Attendance ................................................................................. 389,973 432,665 496,693 355,743Camp Attendance .............................................................................. 1057 703 700 880Swimming lessons (children) ............................................................ 15,376 8,654 7,456 2,903Permits issued(Athletic, special use, picnic) ..................................... 3,590 4,756 3,524 3,999Cecil Attendance ................................................................................ 124,374 120,390 232,547 226,352Athletic volunteers total hours of service .......................................... 715,185 764,627 740,949 761,871
Jacksonville Children's Commission Early Learning Coalition-Child Care Service ................................... N/A N/A N/A N/AChild Abuse Prevention Healthy Families No. of Children Served* 1,288 N/A N/A N/ATeam UP Programs ......................................................................... 9,206 8,736 8,255 8,069Community Based After School Programs ....................................... 2,405 2,639 2,713 2,411Healthy Kids and Kidcare .................................................................. N/A N/A 600 69Summer Camp Seats............................................ 7,251 7,829 5,715 5,964Summer Lunch Program
Lunches served daily ................................................................... 217,770 237,279 254,856 241,083Snacks served daily ..................................................................... 195,737 215,030 22,378 197,743Number of Sites ......................................................................... 172 184 182 179Number of days served ................................................................ 44 44 44 44
After School Food ProgramSnacks served annually 334,261 409,513 379,415 332,182Suppers served annually 577,457 736,118 656,469 631,273Number of sites 79 63 62 60
Early LiteracyJaxKids Book Club** .................................................................. 9,106 9,635 9,807 10,353Others .......................................................................................... 5,782 5,782 3,687 6,324
Workforce Development Training Institute ...................................... 0 0 3,749 2,101 Background Screenings N/A 702 914 816
Participants Trained (New) 2,213 2,908 N/A N/AMentoring
No. of children linked with a mentor 750 1,074 1,402 1,134No. of children receiving mental health svcs 3,407 3,483 1,323 1,494No. of children receiving community based mental health svcs 924 1,008 832 867
Programs ............................................................................................ 14,455 13,669 10,924 10,919Gate count .......................................................................................... 3,403,267 3,435,036 3,366,944 3,467,582Circulation ......................................................................................... 5,110,204 5,734,938 5,913,850 6,513,057
Source: City of Jacksonville Annual Financial planVarious City Departments
Notes: N/A=Statistical Information is not available*New Grant Began in 2017**Name changed from Mayor Peyton's Book Club to JaxKids Book Club
FISCAL YEAR
Library
-322-
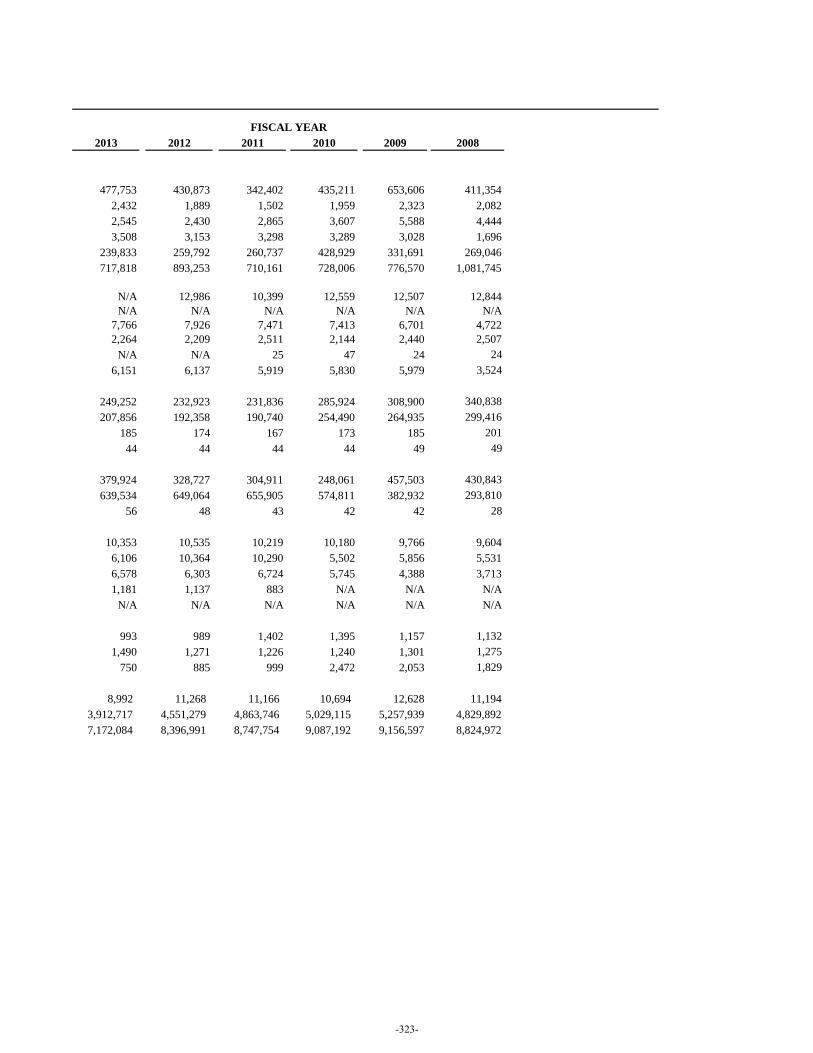
2013 2012 2011 2010 2009 2008
477,753 430,873 342,402 435,211 653,606 411,354
2,432 1,889 1,502 1,959 2,323 2,0822,545 2,430 2,865 3,607 5,588 4,4443,508 3,153 3,298 3,289 3,028 1,696
239,833 259,792 260,737 428,929 331,691 269,046717,818 893,253 710,161 728,006 776,570 1,081,745
N/A 12,986 10,399 12,559 12,507 12,844N/A N/A N/A N/A N/A N/A
7,766 7,926 7,471 7,413 6,701 4,7222,264 2,209 2,511 2,144 2,440 2,507
N/A N/A 25 47 24 246,151 6,137 5,919 5,830 5,979 3,524
249,252 232,923 231,836 285,924 308,900 340,838207,856 192,358 190,740 254,490 264,935 299,416
185 174 167 173 185 20144 44 44 44 49 49
379,924 328,727 304,911 248,061 457,503 430,843639,534 649,064 655,905 574,811 382,932 293,810
56 48 43 42 42 28
10,353 10,535 10,219 10,180 9,766 9,6046,106 10,364 10,290 5,502 5,856 5,5316,578 6,303 6,724 5,745 4,388 3,7131,181 1,137 883 N/A N/A N/A
N/A N/A N/A N/A N/A N/A
993 989 1,402 1,395 1,157 1,1321,490 1,271 1,226 1,240 1,301 1,275
750 885 999 2,472 2,053 1,829
8,992 11,268 11,166 10,694 12,628 11,1943,912,717 4,551,279 4,863,746 5,029,115 5,257,939 4,829,8927,172,084 8,396,991 8,747,754 9,087,192 9,156,597 8,824,972
FISCAL YEAR
-323-
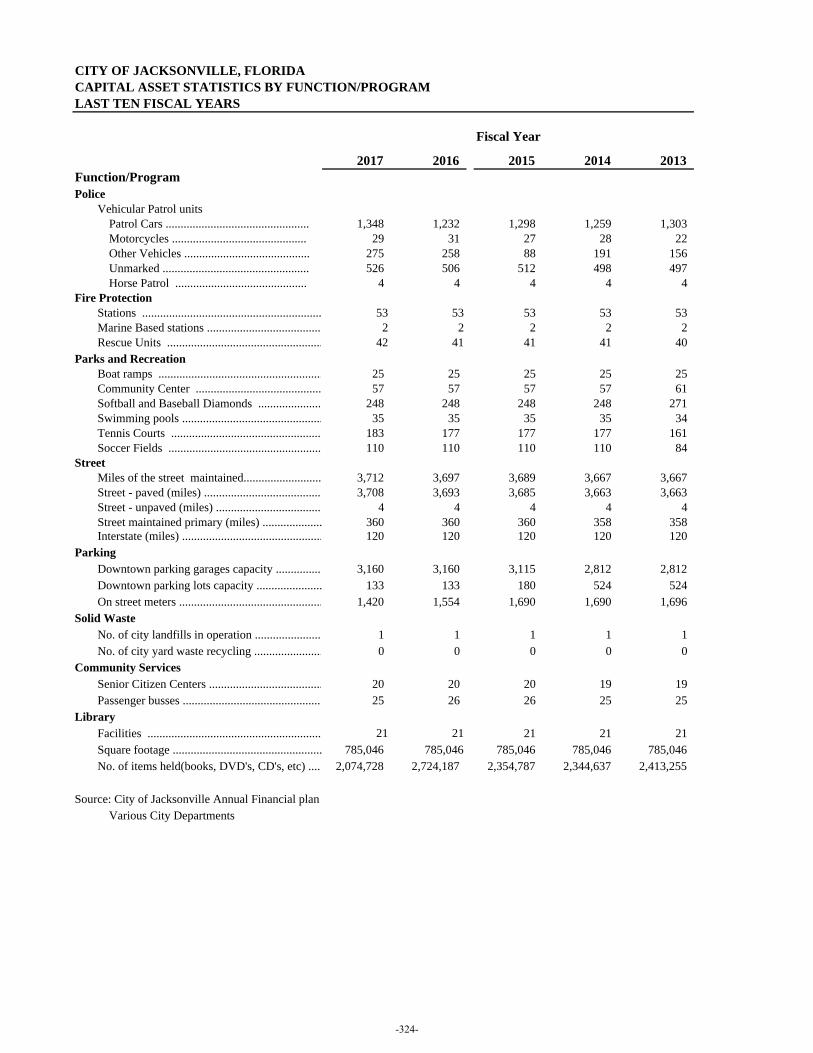
CITY OF JACKSONVILLE, FLORIDACAPITAL ASSET STATISTICS BY FUNCTION/PROGRAMLAST TEN FISCAL YEARS
2017 2016 2015 2014 2013Function/Program
Vehicular Patrol unitsPatrol Cars ................................................ 1,348 1,232 1,298 1,259 1,303Motorcycles ............................................. 29 31 27 28 22Other Vehicles .......................................... 275 258 88 191 156Unmarked ................................................. 526 506 512 498 497Horse Patrol ............................................ 4 4 4 4 4
Fire ProtectionStations ............................................................ 53 53 53 53 53Marine Based stations ...................................... 2 2 2 2 2Rescue Units .................................................... 42 41 41 41 40
Boat ramps ....................................................... 25 25 25 25 25Community Center .......................................... 57 57 57 57 61Softball and Baseball Diamonds ..................... 248 248 248 248 271Swimming pools ............................................... 35 35 35 35 34Tennis Courts .................................................. 183 177 177 177 161Soccer Fields ................................................... 110 110 110 110 84
Miles of the street maintained.......................... 3,712 3,697 3,689 3,667 3,667Street - paved (miles) ........................................ 3,708 3,693 3,685 3,663 3,663Street - unpaved (miles) .................................... 4 4 4 4 4Street maintained primary (miles) .................... 360 360 360 358 358Interstate (miles) ............................................... 120 120 120 120 120
Downtown parking garages capacity ................ 3,160 3,160 3,115 2,812 2,812Downtown parking lots capacity ...................... 133 133 180 524 524On street meters ................................................ 1,420 1,554 1,690 1,690 1,696
Solid WasteNo. of city landfills in operation ...................... 1 1 1 1 1No. of city yard waste recycling ....................... 0 0 0 0 0
Community ServicesSenior Citizen Centers ...................................... 20 20 20 19 19Passenger busses ............................................... 25 26 26 25 25
Facilities .......................................................... 21 21 21 21 21Square footage .................................................. 785,046 785,046 785,046 785,046 785,046No. of items held(books, DVD's, CD's, etc) ..... 2,074,728 2,724,187 2,354,787 2,344,637 2,413,255
Source: City of Jacksonville Annual Financial planVarious City Departments
Library
Parks and Recreation
Police
Parking
Street
Fiscal Year
-324-
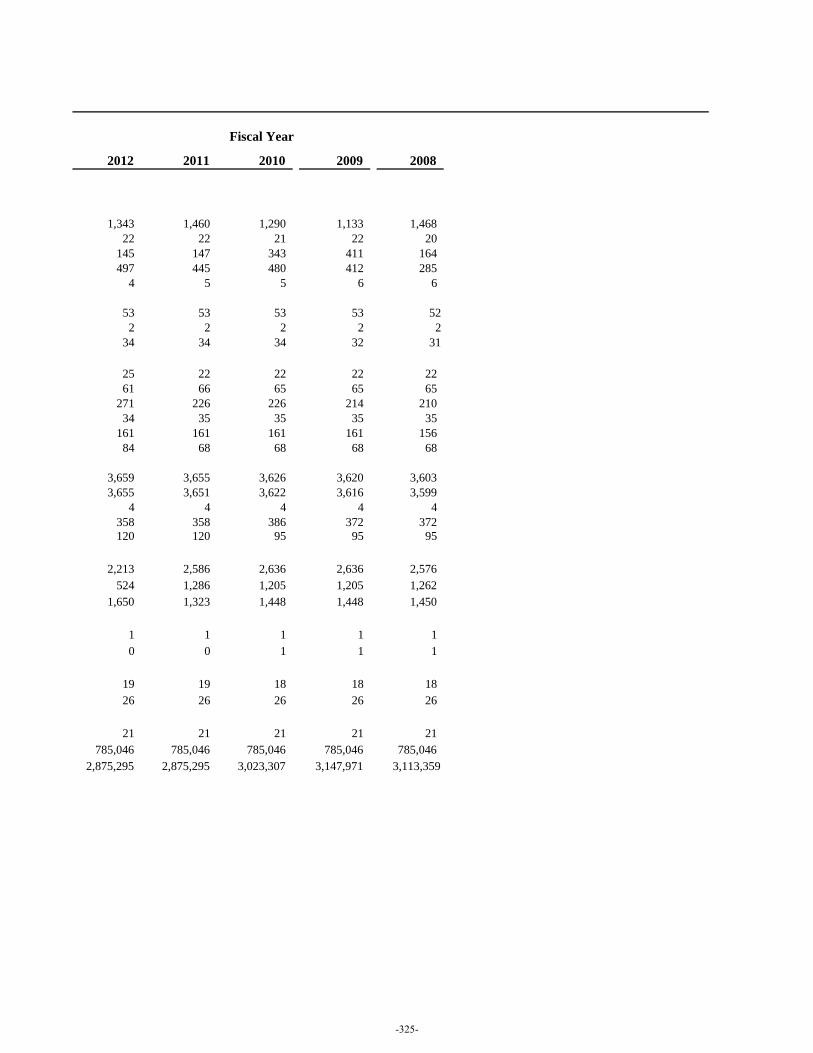
2012 2011 2010 2009 2008
1,343 1,460 1,290 1,133 1,46822 22 21 22 20
145 147 343 411 164497 445 480 412 285
4 5 5 6 6
53 53 53 53 522 2 2 2 2
34 34 34 32 31
25 22 22 22 2261 66 65 65 65
271 226 226 214 21034 35 35 35 35
161 161 161 161 15684 68 68 68 68
3,659 3,655 3,626 3,620 3,6033,655 3,651 3,622 3,616 3,599
4 4 4 4 4358 358 386 372 372120 120 95 95 95
2,213 2,586 2,636 2,636 2,576524 1,286 1,205 1,205 1,262
1,650 1,323 1,448 1,448 1,450
1 1 1 1 10 0 1 1 1
19 19 18 18 1826 26 26 26 26
21 21 21 21 21785,046 785,046 785,046 785,046 785,046
2,875,295 2,875,295 3,023,307 3,147,971 3,113,359
Fiscal Year
-325-

(This page is intentionally left blank.)
-326-

DEPARTMENT OF FINANCE117 W. DUVAL ST., SUITE 325 JACKSONVILLE, FL 32202
WWW.COJ.NET I (904) 630-CITY
ONE CITY. ONE JACKSONVILLE.