Embed Size (px)
Citation preview

City of Charlo esville, Virginia
Comprehensive Annual Financial Report
For the Fiscal Year Ended June 30, 2019
CITY OF CHARLOTTESVILLE, VIRGINIA
Comprehensive Annual Financial Report Fiscal Year Ended June 30, 2019
Prepared by Department of Finance

DEPARTMENT OF FINANCE
Christopher Cullinan
Bethany Birckhead
Nicholas Bonaffini
Michael DelBiondo
Deanna Guedj
Gail Hassmer
Glen Pack
Charles Philippin
Angela Seaman
Peggy Sprouse
Symia Tabron
Laurie Uszak
Morgan Waterman
CITY OF CHARLOTTESVILLE, VIRGINIA
COMPREHENSIVE ANNUAL FINANCIAL REPORT
FOR THE YEAR ENDED JUNE 30, 2019
TABLE OF CONTENTS Exhibit/Table Page
INTRODUCTORY SECTION
Letter of Transmittal 9
GFOA Certificate of Achievement for Excellence in Financial Reporting 16
List of Elected Officials 17
City Organizational Chart 18
FINANCIAL SECTION
Report of Independent Auditor 20
Management’s Discussion and Analysis 23
Government-wide Financial Statements:
Statement Net Position A 37
Statement of Activities B 38
Fund Financial Statements:
Balance Sheet – Governmental Funds C 40
Statement of Revenues, Expenditures and Changes in Fund Balances-Governmental Funds D 42
Statement of Net Position – Proprietary Funds E-1 44
Statement of Revenues, Expenses and Changes in Fund Net Position – Proprietary Funds E-2 45
Statement of Cash Flows E-3 46
Statement of Fiduciary Net Position – Fiduciary Funds F-1 47
Statement of Changes in Fiduciary Net Position – Fiduciary Funds F-2 48
Notes to the Financial Statements 49
Required Supplementary Information – Budgetary General and Special Revenue Funds
Note to Required Supplementary Information
Schedule of Revenues, Expenditures and Changes in Fund Balance – Budget and Actual
Budget Basis – General Fund G-1 99
Schedule of Revenues, Expenditures and Changes in Fund Balance – Budget and Actual
Budget Basis – Social Services Fund G-2 104
98
CITY OF CHARLOTTESVILLE, VIRGINIA
COMPREHENSIVE ANNUAL FINANCIAL REPORT
FOR THE YEAR ENDED JUNE 30, 2019
TABLE OF CONTENTS – Page 2 Exhibit/Table Page
Required Supplementary Information – Pension and Other Post Employment Benefit Plans
Schedule of Changes in the Net Pension Liability and Related Ratios- City Pension Plan H-1 105
Schedule of Pension Plan Contributions – City Pension Plan H-2 106
Schedule of Funding Progress – City Other Post Employment Benefit Plans H-3 107
Schedule of Changes City OPEB Liability and Related Ratios H-4 108
Required Supplementary Information – Charlottesville School Board – Component Unit - Pension and OPEB
Schedule of Changes in the Net Pension Liability and Related Ratios - VRS H-5 110
Schedule of Pension Plan Contributions – VRS H-6 111
Schedule of the School Board’s Proportionate Share of Net Pension Liability – VRS H-7 112
Schedule of Pension Plan Contributions – VRS H-8 113
Schedule of Funding Progress- Other Postemployment Benefit Plans H-9 114
Schedule of Changes in the Net OPEB Liability and Related Ratios H-10 115
Schedule of Employer Proportionate Share OPEB Plans H-11 116
SUPPLEMENTARY SECTION
Supplemental Schedules
Schedule of Revenues, Expenditures, and Changes in Fund Balance – Budget and Actual
Budget Basis - Capital Projects Fund I-1 118
Schedule of Revenues, Expenditures, and Changes in Fund Balance – Budget and Actual
Budget Basis – Debt Service Fund I-2 119
Pension Trust Funds – Retirement and Post-Retirement Benefit Funds -
Statement of Fiduciary Net Position I-3 120
Statement of Changes in Fiduciary Net Position I-4 122
Nonmajor Governmental Funds -
Combined Balance Sheet J 124
Combining Statement of Revenues, Expenditures and Changes in Fund Balances K 125
CITY OF CHARLOTTESVILLE, VIRGINIA
COMPREHENSIVE ANNUAL FINANCIAL REPORT
FOR THE YEAR ENDED JUNE 30, 2019
TABLE OF CONTENTS – Page 3 Exhibit/Table Page
Supplemental Schedules – Continued
Schedule of Revenues, Expenditures and Changes in Fund Balances
Budget and Actual – Community Development Block Grant Fund K-1 126
Budget and Actual - Grants Fund K-2 127
Budget and Actual – Human Services Fund K-3 128
Budget and Actual – VJCCCA Grant Fund K-4 129
Budget and Actual – Children’s Services Act Fund K-5 130
Budget and Actual – Transit Fund K-6 131
Internal Service Funds-
Combining Statement of Net Position L-1 133
Combining Statement of Revenues, Expenses and Changes in Fund Net Position L-2 134
Combining Statement of Cash Flows L-3 135
Charlottesville School Board – Discretely Presented Component Unit Financial Statements -
Statement of Net Position M-1 137
Statement of Activities M-2 138
Balance Sheet – Governmental Funds M-3 139
Statement of Revenues, Expenditures, and Changes in Fund Balances – Governmental Funds M-4 140
Statement of Net Position – Internal Service Fund M-5 141
Statement of Revenues, Expenses and Changes in Fund Net Position – Internal Service Fund M-6 142
Statement of Cash Flows – Internal Service Fund M-7 143
CITY OF CHARLOTTESVILLE, VIRGINIA
COMPREHENSIVE ANNUAL FINANCIAL REPORT
FOR THE YEAR ENDED JUNE 30, 2019
TABLE OF CONTENTS – Page 4 Exhibit/Table Page
STATISTICAL SECTION
Net Position by Component – Last Ten Years Table 1 146
Changes in Net Position – Last Ten Years Table 2 147
Fund Balances of Governmental Funds Table 3 149
Changes in Fund Balances of Governmental Funds – Last Ten Years Table 4 150
Tax Revenues by Source – Last Ten Years Table 5 151
Assessed and Estimated Market Value of Real Property – Last Ten Years Table 6 152
Direct Property Tax Rates – Last Ten Years Table 7 153
Principal Taxpayers Table 8 154
Property Tax Levies and Collections – Last Ten Years Table 9 155
Estimated Value of Tax-Exempt Real Property – Last Ten Years Table 10 156
Ratio of Net Bonded Governmental Debt to Assessed Value and Net Bonded Debt Per Capita Table 11 157
Ratio of Annual Debt Service Expenditures for General Bonded Debt to General
Governmental Expenditures and Transfers Table 12 158
Ratios of Outstanding Debt by Type – Last Ten Years Table 13 159
Computation of Legal Debt Margin – Last Ten Years Table 14 160
Property Values, Construction and Bank Deposits- Last Ten Years Table 15 161
Demographic Statistics – Last Ten Years Table 16 162
Principal Employers Table 17 163
Government Employees by Function Table 18 164
Operating Indicators by Function – Last Ten Years Table 19 165
Capital Asset Statistics by Function – Last Ten Years Table 20 166

INTRODUCTORY SECTION
CITY OF CHARLOTTESVILLE "To be one community filled with opportunity"
Office of the Director of Finance
P .0 . Box 911 · Charlottesville, Virginia 22902 Telephone 434-970-3200 · Fax 434-970-3232
November 30, 2019
Honorable Mayor and Members of the City Council City of Charlottesville, Virginia
Dear Council Members:
We are pleased to submit to you the comprehensive annual financial report (CAFR) of the
City of Charlottesville (the City) for the fiscal year ended June 30, 2019. The CAFR was prepared
in accordance with Section 11-96 of the City Code. The City's Finance Department prepared the
report and it was audited by the City' s independent auditors, Brown, Edwards, & Company, LLP.
Brown, Edwards' opinions are included in this report. All disclosures necessary to enable the
reader to gain an understanding of the City's financial activities have been included.
Management assumes full responsibility for the completeness and reliability of the
infonnation contained in this report, based upon a comprehensive framework of internal control
that it has established for this purpose. Because the cost of internal control should not exceed
anticipated benefits, the objective is to provide reasonable, rather than absolute, assurance that the
financial statements are free of material misstatements.
Generally accepted accounting principles (GAAP) requires management to provide a
na1Tative introduction, overview, and analysis to accompany the basic financial statements in the
form of Management' s Discussion and Analysis (MD&A). This letter of transmittal is designed
to complement the MD&A and should be read in conjunction with it.
As a recipient of funds from the Federal government, the City is required to undergo an
annual single audit in conformity with the provisions of Uniform Administrative Requirements,
Cost Principles, and Audit Requirements for Federal Awards ("Unifonn Guidance"). Infom1ation
related to this single audit, including the schedule of expenditures of federal awards, findings and
questioned costs, recommendations, and auditors' reports on the internal control structure and
compliance with applicable laws and regulations are contained in an appendix at the back of the
CAFR.
9
Honorable Mayor and Members of the City Council November 30, 2019
THE REPORTING ENTITY AND ITS SERVICES
The City is located in Central Virginia, approximately 100 miles southwest of Washington,
D.C. and 70 miles northwest of Richmond, Virginia. As the seat of both the City and Albemarle
County governments, Charlottesville serves as an economic, cultural and educational center in
Central Virginia. As the home of the University of Virginia, one of the most prestigious and
highly-regarded universities in the country, the City derives a number of benefits, both economic
and in the quality oflife, from being associated with this area.
The City provides a full range of services. These services include police and fire
protection, solid waste collection and disposal , education, parks, recreational and cultural
activities, street and highway maintenance and construction, health and welfare, and community
and economic development. [n addition to these general governmental activities, the City also
operates gas, water, wastewater, and sto1mwater systems as enterprise funds and maintains a
pension trust fund and a post-employment benefits fund for its employees.
The financial reporting entity includes all funds of the Primary Government (i.e. , the City),
as well as the component units for which the City is financially accountable. The City of
Charlottesville Public Schools (the School Board or Schools) and the Charlottesville Economic
Development Authority (CEDA) are included in the repoti as discretely presented component units
in separate columns in the government-wide financial statements to emphasize that they are legally
separate from the City and to differentiate their financial position and results of operations from
that of the City. Both of these component units are administered by separate boards. School Board
members are elected At Large and CEDA members are appointed by City Council. The
Charlottesville Redevelopment and Housing Authority (CRHA) is not included in the reporting
entity because the City is not financially accountable for the CRHA.
FINANCIAL CONDITION AND OUTLOOK
For Fiscal Year 2019 (completed June 30, 2019): The City finished in compliance with all
of its long-tenn financial policies including:
• Maintain a minimum General Fund balance ofat least 14% of General Fund budget. • Maintain a minimum Downturn Reserve Fund balance of no less than 3% of
General Fund budget. • Maintain sufficient working capital in the utilities funds (Water, Wastewater, Gas). • Stabilize all non-general funds by ensuring they have a positive fund balance. • Maintain a debt service to general fund total expenditure budget ratio of 8% or less.
10
Honorable Mayor and Members of the City Council November 30, 2019
• Transfer I-cent of the meals tax revenue to the Debt Service Fund to be used for debt service.
The City's positive financial results and sound financial policies were affinned again in
May 2019 when both Moody's Investor Services and Standard & Poor's evaluated the City and
awarded their top rating (Aaa and AAA, respectively) on the City's latest bond issue.
City management has been focused on the long-tem1 financial sustainability of the City's
retirement plan and Other Post-Employment Benefits (OPEB). As pa1i of its AAA-rated financial
management, the City has traditionally funded 100% of its required Actuarially Detennined
Contribution (ADC) for pension costs and OPEB and plans to do so in the future. The funded
status of the City' s pension plan has been 54.4%, 50.3%, 53.7%, 56.5% and 58.3% for fiscal years
2015, 2016, 2017, 2018 and 2019 respectively. The funded status of the City's OPEB plan has
been 40.5%, 39.9%, 43.0%, 47.4% and 56.5% for fiscal years 2015 , 2016, 2017, 2018 and 2019
respectively.
For Fiscal Year 2020 (beginning July 1, 2020): The fiscal year 2020 budget, with a
General Fund of $188.9 million (a 5.1 % increase over the fiscal year 2019 budget) focuses on high
quality services and infrastmcture while considering long-tenn sustainability and efficiencies. [n
January 2019, City Council identified five priority areas for the fiscal year 2020 budget: affordable
housing, race and equity, workforce development, economic development, and safety, security,
preparedness. Specific budget initiatives include:
• Affordable Housing - Capital investment of $10.6 million in fiscal year 2020 and over $32.8 million in the five-year capital program for several affordable housing initiatives including redevelopment of public housing sites, housing rehabilitation, and assisting the Charlottesville Redevelopment and Housing Authority (CRHA) with its redevelopment effo1is. Additional funds totaling $620,000 were budgeted for the Charlottesville Housing Affordability Program (CHAP).
• Race and Equity - The City Manager's Advisory Workgroup on Organizational Equity convened to review an internal equity assessment of City departments and created recommendations to the City Manager' s Office. Should these recommendations have budget impact, City Council will be provided with guidance on how and when these initiatives should be funded.
• Workforce Development and Economic Development - Continued investment in programs that support both of these priorities, including the Downtown Job Center, Growing Opportunities (GO) workforce development programs, job fairs and community events, and work done by staff to promote Charlottesville as a premier
11
Honorable Mayor and Members of the City Council November 30, 2019
location for business and collaborate with entrepreneurs and existing businesses seeking to grow here.
• Safety, Security, and Preparedness - Adds pos1t10ns to improve safety of City employees and facilities. A Centralized Safety Coordinator in Risk Management will be responsible for developing citywi_de safety programs and implementing associated training and ensuring compliance across the various work divisions and depmtment of the City. A Security Manager in the Police Department will serve the vital role of improving the City's security management profile and making the City's infrastructure more secure.
ECONOMIC CONDITION AND OUTLOOK
Over the past year, a number of key economic indicators continued to show positive
growth. City collected meals tax revenue increased by 3.66% in fiscal year 2019. Lodging tax
revenue increased by 9.85% in fiscal year 2019 while sales tax also incre_ased by 2.21 % over the
same period.
For tax year 2019, residential real estate assessments increased in value by 8.70%.
Commercial real property values increased for a seventh straight year in 2019, this time by 4.58%.
Combined existing residential and commercial property increased in value by 6.94%. The total
value of real property in the City, including new construction, increased by 8.48% in tax year
2019. In addition, the City's unemployment rate has stabilized from its high in 20 l 0 and, as of
September 2019, is at 2.5%. That rate is below the national unemployment rate of 3.5%, and equal
to the State' s rate of 2.7%. The unemployment rate for the Charlottesville MSA stood at 2.6%
during this same period.
The relative strength of the Charlottesville area is due in large pai1 to its central Virginia
location and the nature of the local economy which includes the University of Virginia. In addition,
Charlottesville is the commercial hub for a metropolitan area population of over 206,000. The
predominant economic sectors are healthcare, service related industries, leisure and hospitality,
and education. The City has also attracted companies specializing in business and financial
services, defense related businesses, infonnation technology, clean energy, biotechnology and
software development.
The University of Virginia and its Medical Center continue to be the area's largest
employer, providing over 18,000 jobs and making the City a regional center for quality education
and healthcare. The University has avoided layoffs to date and continues its plans to grow student
enrollment at a moderate rate over the next decade. The University also enjoys nationally ranked
men's and women's teams in many major sports, having recently won NCAA Championships in
12
Honorable Mayor and Members of the City Council November 30, 2019
men's basketball and men ' s lacrosse. The University's John Paul Jones Arena, which at 15,000
seats is the largest arena in the Commonwealth of Virginia, annually attracts over 500,000 visitors
from around the state to the area.
The City's downtown is a vibrant scene with both residential and commercial uses as a
result of public and private investment in new construction and renovation/ restoration projects.
The Downtown Mall is thriving, with an exciting combination of residential , retail , restaurants,
hotels, a cinema, music venues, as well as a number of office complexes and financial institutions,
all of which draw local residents and tourists to the area. The Citywide retail vacancy rate
continues to remain below average at 4.09% as of July 2019.
A growing number of companies are seeking to locate in the City. The 2019 Inc. 5000 list
includes a number of rapidly growing Charlottesville firms including WillowTree and
CoConstruct. The City continues to gain new private sector jobs, and has added over 2,000 net
new jobs in the past three years. This marks the eighth consecutive year in which employment has
increased in the City. The overall employment figures are now the highest in history with over
40,000 City-based jobs. At present, over 450,000 square feet of new class A commercial space is
under construction across four major projects in the downtown area. This boom represents the first
significant office space inventory added to the market in over a decade.
A1is and ente1iainment continue to draw large numbers of visitors to Charlottesville. The
Paramount Theater, a 1,200-seat multi-purpose auditorium, the Jefferson Theater, a 1,000 seat
concert venue, and the LiveArts performing center serve as year-around attractions. The three
season Sprint Pavilion has an annual attendance of over 100,000 patrons and the venue recently
completed another season featuring national caliber artists. The covered, 3,500-seat facility is
expected to play a key role in continuing to attract those seeking entertainment.
The City maintains controlling interest in over 1,500 off-street parking spaces downtown.
Every effort is made to keep parking available and affordable for residents, workers, and visitors
alike. In 2018, over 1,200,000 people used these parking facilities. While culTent parking supply
meets demand, the City is taking steps to better manage its existing resources and plan for future
growth with an additional facility.
The West Main Street corridor continues to see significant new private sector investment.
In 2018, 380 new hotels rooms opened on or near the colTidor including the Draftsman Hotel with
its 150-rooms, meeting facility and restaurant. The Standard, a 600 bed student oriented apartment
complex, opened in August 2018 joining the Lark on Main and The Flats at West Village, as major
housing projects completed in the past three years on the west end of the coITidor. Six Hundred
13
Honorable Mayor and Members of the City Counci l November 30, 2019
West Main, an 60-unit market rate apartment building and retail space opened in 2019 and the
Quirk Hotel, an 80-room art inspired boutique hotel is planning to open in early 2020. Also, the
City is moving forward with final plans for a $30 million dollar streetscape improvement project.
Nearby, the Preston Avenue corridor continues to represent an oppo1iunity for similar
development and changes are underway. [n addition to the recently completed Coca Cola building
and the King Lumber site, Dairy Central , a major mixed-use development is expected to open in
early 2020. This will be followed by phase 2 which includes the construction of 200 residential
apartment units. The City will continue to look for opportunities to collaborate with private
developers as redevelopment occurs along this corridor.
Continued capital investments throughout the City give us reason to be optimistic about
the future. In calendar year 2018, 575 commercial construction pennits were issued with an
investment value of $58,118,270. The City's proactive approach to welcoming investment
continues to prove effective with support from a zoning ordinance that encourages denser, mixed
use development to help provide opportunities to expand the tax base and encourage quality
commercial development. This activity provides a vibrant environment allowing us to continue to
improve our city and the services it can provide to citizens, in an orderly and financially
responsible maimer.
OTHER INFORMATION
Independent Audit: State law requires that the financial statements of the City be audited
annually by a certified public accounting finn selected by City Council. An audit of the financial
records of the City has been performed by the accounting finn of Brown, Edwards & Company,
LLP, for the year ended June 30, 2019. The audit was also designed to meet the requirements of
Unifonn Administrative Requirements, Cost Principles, and Audit Requirements for Federal
Awards ("Uniform Guidance") . The independent auditor's report on the government-wide
financial statements and the fund financial statements and required supplementary information is
included in the financial section of this repo1i.
Awards: The Government Finance Officers Association of the United States and Canada
(GFOA) awarded a Certificate of Achievement for Excellence in Financial Reporting to the City
for its Comprehensive Annual Financial Repo1i for the fiscal year ended June 30, 2018. This was
the thi1iy-ninth (39th) consecutive such award received by the City. In order to be awarded a
Certificate of Achievement, a governmental unit must publish an easily readable and efficiently
organized Comprehensive Annual Financial Repo1i that satisfies both generally accepted
14
Honorable Mayor and Members of the City Council November 30, 2019
accounting principles and applicable legal requirements. A Certificate of Achievement is valid for
a period of one year only. We believe that our cun-ent report continues to meet the Certificate of
Achievement program requirements, and we are submitting it to the GFOA to detennine its
eligibility for another certificate.
ACKNOWLEDGEMENTS
The preparation of this report on a timely basis could not have been accomplished without
the dedicated service of each member of the Finance Department, notably the Accounting staff.
In closing, we would like to thank the members of City Council for your continued interest
and support in planning and conducting the financial matters of the City in a responsible and
progressive manner.
Respectfully submitted,
Dr. Tarron Richardson
City Manager
Christopher V. Cullinan
Director of Finance
15
16
CITY OF CHARLOTTESVILLE, VIRGINIA
LIST OF ELECTED AND APPOINTED OFFICIALS
JUNE 30, 2019
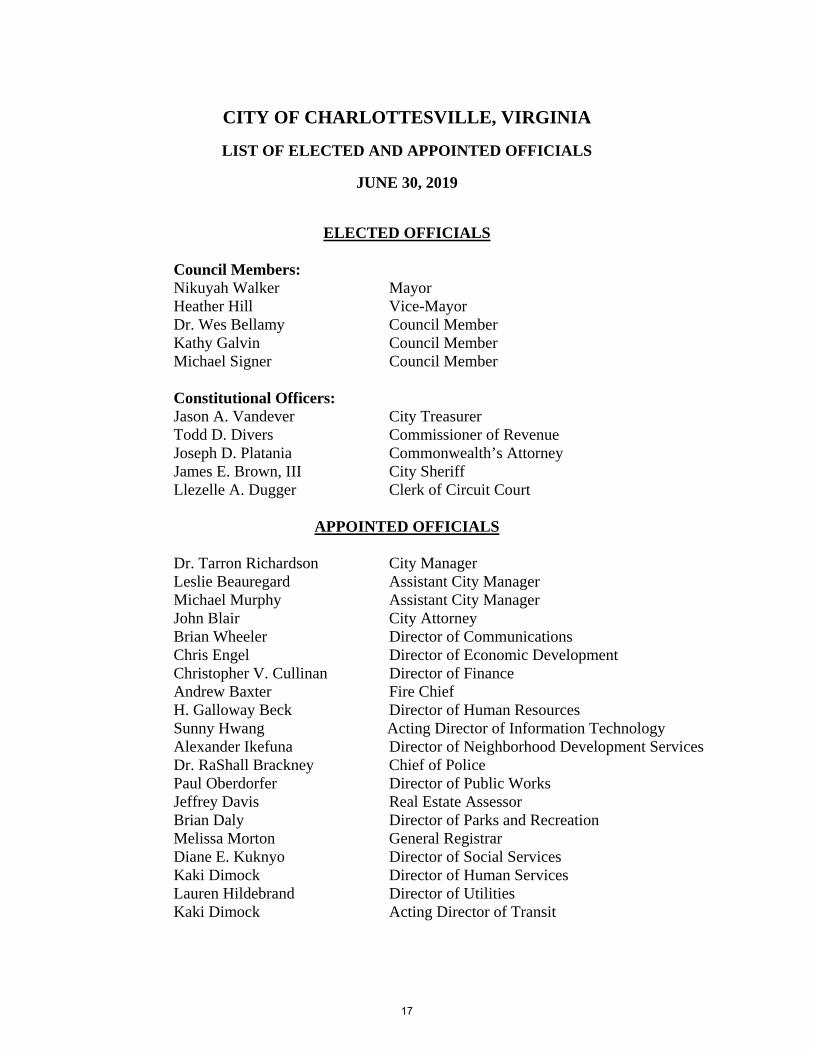
ELECTED OFFICIALS
Council Members: Nikuyah Walker MayorHeather Hill Vice-MayorDr. Wes Bellamy Council Member Kathy Galvin Council Member Michael Signer Council Member
Constitutional Officers: Jason A. Vandever City Treasurer Todd D. Divers Commissioner of Revenue Joseph D. Platania Commonwealth’s Attorney James E. Brown, III City Sheriff Llezelle A. Dugger Clerk of Circuit Court
APPOINTED OFFICIALS
Dr. Tarron Richardson City Manager Leslie Beauregard Assistant City Manager Michael Murphy Assistant City Manager John Blair City Attorney Brian Wheeler Director of Communications Chris Engel Director of Economic Development Christopher V. Cullinan Director of Finance Andrew Baxter Fire Chief H. Galloway Beck Director of Human Resources Sunny Hwang Acting Director of Information Technology Alexander Ikefuna Director of Neighborhood Development Services Dr. RaShall Brackney Chief of Police Paul Oberdorfer Director of Public Works Jeffrey Davis Real Estate Assessor Brian Daly Director of Parks and Recreation Melissa Morton General Registrar Diane E. Kuknyo Director of Social Services Kaki Dimock Director of Human Services Lauren Hildebrand Director of Utilities Kaki Dimock Acting Director of Transit
17
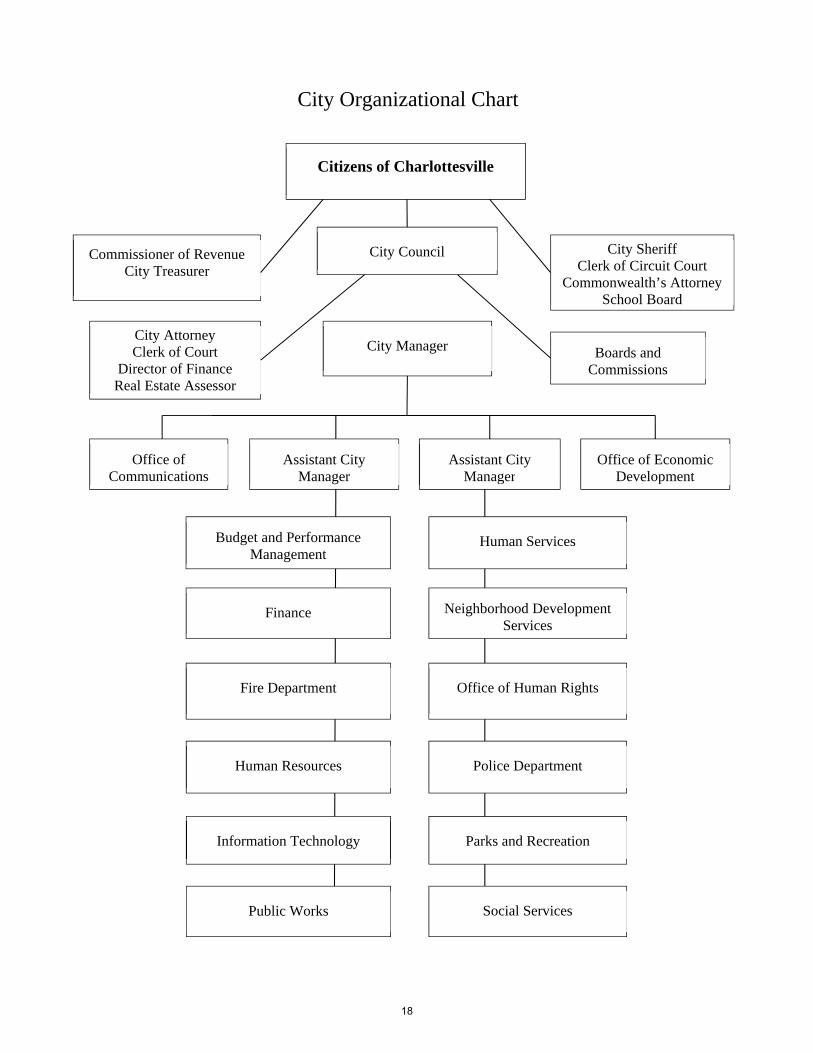
Citizens of Charlottesville
Commissioner of Revenue City Treasurer
City Council City Sheriff Clerk of Circuit Court
Commonwealth’s Attorney School Board
City Attorney Clerk of Court
Director of Finance Real Estate Assessor
Boards and Commissions
City Manager
Assistant City Manager
Assistant City Manager
Office of Economic Development
Budget and Performance Management
Finance
Fire Department
Human Resources
Information Technology
Public Works
Human Services
Neighborhood Development Services
Office of Human Rights
Police Department
Parks and Recreation
Social Services
Office of Communications
City Organizational Chart
18

FINANCIAL SECTION
Your Success is Our Focus
319 McClanahan Street, S.W. • Roanoke, Virginia 24014-7705 • 540-345-0936 • Fax: 540-342-6181 • www.BEcpas.com
INDEPENDENT AUDITOR’S REPORT
To the Honorable Members of the City CouncilCity of Charlottesville, Virginia
Report on the Financial Statements
We have audited the accompanying financial statements of the governmental activities, the business-type activities, the aggregate discretely presented component units, each major fund, and the aggregate remaining fund information of the City of Charlottesville, Virginia (the “City”) as of and for the year ended June 30, 2019 and the related notes to the financial statements, which collectively comprise the City’s basic financial statements as listed in the table of contents.
Management’s Responsibility for the Financial Statements
Management is responsible for the preparation and fair presentation of these financial statements in accordance with accounting principles generally accepted in the United States of America; this includesthe design, implementation, and maintenance of internal control relevant to the preparation and fairpresentation of financial statements that are free from material misstatement, whether due to fraud or error.
Auditor’s Responsibility
Our responsibility is to express opinions on these financial statements based on our audit. Weconducted our audit in accordance with auditing standards generally accepted in the United States ofAmerica; the standards applicable to financial audits contained in Government Auditing Standards, issued by the Comptroller General of the United States; the Specifications for Audits of Counties, Cities, and Towns, and the Specifications for Audits of Authorities, Boards, and Commissions issued by the Auditor of Public Accounts of the Commonwealth of Virginia. Those standards require that we plan and perform the audit to obtain reasonable assurance about whether the financial statements are free from material misstatement.
An audit involves performing procedures to obtain audit evidence about the amounts and disclosures in the financial statements. The procedures selected depend on the auditor’s judgment, including the assessment of the risks of material misstatement of the financial statements, whether due to fraud or error. In making those risk assessments, the auditor considers internal control relevant to the entity’s preparation and fair presentation of the financial statements in order to design audit procedures that are appropriate in the circumstances, but not for the purpose of expressing an opinion on the effectiveness of the entity’s internal control. Accordingly, we express no such opinion. An audit also includes evaluating the appropriateness of accounting policies used and the reasonableness of significantaccounting estimates made by management, as well as evaluating the overall presentation of the financial statements.
We believe that the audit evidence we have obtained is sufficient and appropriate to provide a basis for our audit opinions.
20
Opinions
In our opinion, the financial statements referred to above present fairly, in all material respects, the respective financial position of the governmental activities, the business-type activities, the aggregatediscretely presented component units, each major fund, and the aggregate remaining fund information ofthe City, as of June 30, 2019, and the respective changes in financial position and, where applicable, cash flows thereof for the year then ended in accordance with accounting principles generally accepted in the United States of America.
Other Matters
Required Supplementary Information
Accounting principles generally accepted in the United States of America require that the management’s discussion and analysis and the required supplementary information as listed in the table of contents be presented to supplement the basic financial statements. Such information, although not a part of the basic financial statements, is required by the Governmental Accounting Standards Board, who considers it to be an essential part of financial reporting for placing the basic financial statements in an appropriate operational, economic, or historical context. We have applied certain limited procedures to the required supplementary information in accordance with auditing standards generally accepted in the United States of America, which consisted of inquiries of management about the methods of preparing the information and comparing the information for consistency with management’s responses to ourinquiries, the basic financial statements, and other knowledge we obtained during our audit of the basicfinancial statements. We do not express an opinion or provide any assurance on the information because the limited procedures do not provide us with sufficient evidence to express an opinion or provide any assurance.
Other Information
Our audit was conducted for the purpose of forming opinions on the financial statements thatcollectively comprise the City’s basic financial statements. The introductory, supplementary information as listed in the table of contents, and statistical section, are presented for purposes of additional analysis and are not a required part of the basic financial statements.
The supplementary section is the responsibility of management and was derived from and relatesdirectly to the underlying accounting and other records used to prepare the basic financial statements. Such information has been subjected to the auditing procedures applied in the audit of the basic financial statements and certain additional procedures, including comparing and reconciling such information directly to the underlying accounting and other records used to prepare the basic financial statements or to the basic financial statements themselves, and other additional procedures in accordance with auditing standards generally accepted in the United States of America. In our opinion, the supplementary information as listed in the table of contents is fairly stated in all material respects in relation to the basic financial statements as a whole.
The introductory and statistical sections have not been subjected to the auditing procedures applied in the audit of the basic financial statements and, accordingly, we do not express an opinion or provide any assurance on them.
21
Other Reporting Required by Government Auditing Standards
In accordance with Government Auditing Standards, we have also issued our report datedNovember 22, 2019 on our consideration of the City’s internal control over financial reporting and onour tests of its compliance with certain provisions of laws, regulations, contracts, and grant agreements and other matters. The purpose of that report is to describe the scope of our testing of internal control over financial reporting and compliance and the results of that testing, and not to provide an opinion on internal control over financial reporting or on compliance. That report is an integral part of an audit performed in accordance with Government Auditing Standards in considering the City’s internal control over financial reporting and compliance.
CERTIFIED PUBLIC ACCOUNTANTS
Roanoke, VirginiaNovember 22, 2019
22
CITY OF CHARLOTTESVILLE, VIRGINIA
Management’s Discussion and Analysis Year Ended June 30, 2019
As management of the City of Charlottesville, Virginia, we offer readers this narrative overview and analysis of the financial activities of the City of Charlottesville, Virginia for the fiscal year ended June 30, 2019. Please read it in conjunction with the transmittal letter at the front of this report and the City’s financial statements, which follow this section. The intent of this discussion and analysis is to evaluate the City’s financial performance as a whole.
FINANCIAL HIGHLIGHTS
Government-wide
• The City's total net position, on a government-wide basis excluding component units, totaled $196.0million at June 30, 2019. Of this amount, $1.8 million is unrestricted.
• The City’s total net position increased by $10.8 million over the prior year. This increase is the sum ofa $6.6 million increase, as restated, for the governmental net position and a $4.3 million increase inbusiness-type net position.
Government Funds
• At June 30, 2019, the City’s governmental funds reported combined ending fund balances of $77.6million, an increase of $3.4 million over the prior year. Approximately 38.0 percent, or $33.5 million,of this amount is unassigned.
• The General Fund, on a current financial resource measurement focus and the modified accrual basisof accounting, reported revenues over budget of $1,653,647, primarily due to several of the tax revenues(real estate, personal property, business license, and lodging) performing better than expected. Theexpenditures and other financing sources (net) finished out the year under budget primarily due Citydepartments continued budget monitoring, which resulted in expenditures less than budget. Savingsresulted from vacancies, efficiencies and staff’s constant due diligence with city tax dollars.
• At the end of the fiscal year, unassigned fund balance for the General Fund was $33.5 million, or 17.1percent of total General Fund expenditures and net transfers.
Long-term Liabilities
• The City’s total long-term liabilities, consisting of general obligation bonds, compensated absences,pension, and OPEB obligations decreased by $268,039 during the current fiscal year.
23
OVERVIEW OF THE FINANCIAL STATEMENTS
This discussion and analysis is intended to serve as an introduction to the City of Charlottesville’s basic financial statements. The City’s basic financial statements comprise the following three components: • Government-wide financial statements, Exhibits A and B• Fund financial statements, Exhibits C,D, E, and F• Notes to the financial statements
This report contains other supplementary information in addition to the basic financial statements themselves.
The basic financial statements include two kinds of statements presenting different views of the City: • The first two statements are government-wide financial statements that provide both long-term and
short-term information about the City’s overall financial status.• The remaining statements are fund financial statements that focus on individual parts of the City’s
government, reporting the City’s operations in more detail than the government-wide statements.- Governmental fund statements tell how general government services such as public safety were
financed in the short term as well as what amounts remain for future spending. - Proprietary fund statements offer short- and long-term financial information about the
activities the government operates like businesses, such as the public utility systems (water, sewer, and gas) and the golf course.
- Fiduciary fund statements provide information about the financial relationship in which theCity acts solely as a trustee or agent for the benefit of others, to whom the resources in question belong, such as the City’s retirement and post-employment benefit plans.
The financial statements also include notes that explain some of the information in the financial statements and provide more detailed data. The statements are followed by a section of required supplementary information that further explains and supports the information in the financial statements. Figure A shows how the required parts of this Management’s Discussion and Analysis and the City’s basic financial statements are arranged and relate to one another.
24
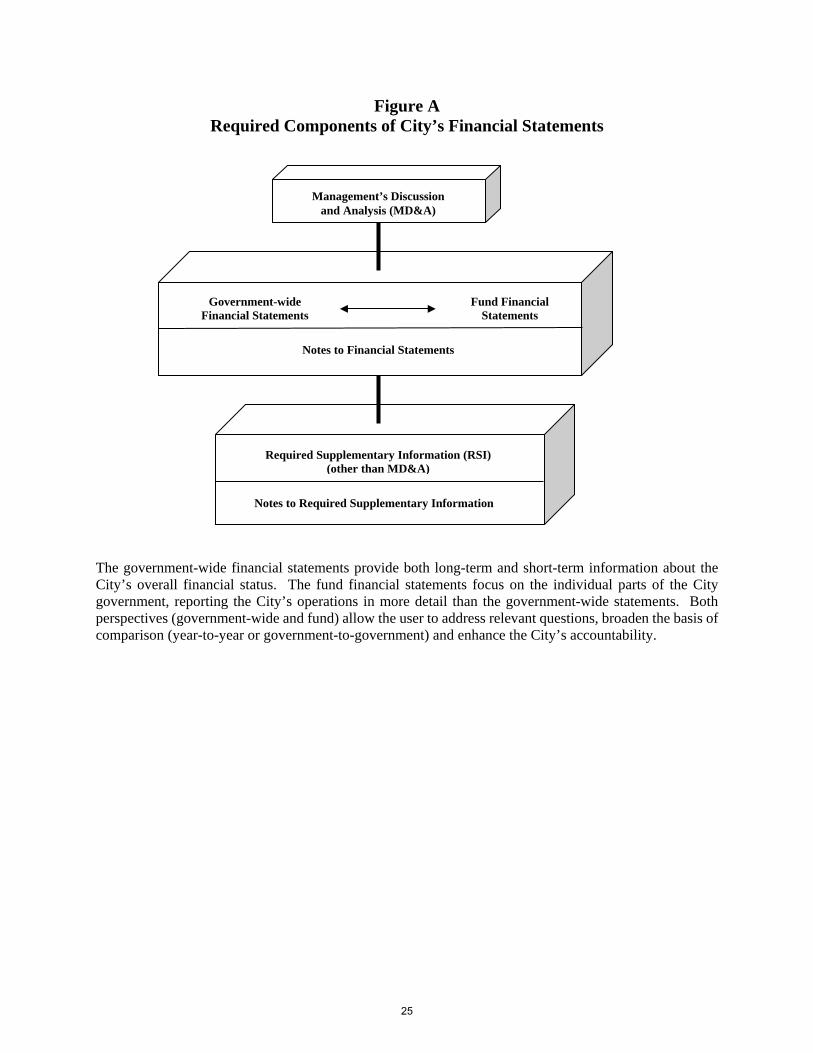
Figure A Required Components of City’s Financial Statements
The government-wide financial statements provide both long-term and short-term information about the City’s overall financial status. The fund financial statements focus on the individual parts of the City government, reporting the City’s operations in more detail than the government-wide statements. Both perspectives (government-wide and fund) allow the user to address relevant questions, broaden the basis of comparison (year-to-year or government-to-government) and enhance the City’s accountability.
Management’s Discussion and Analysis (MD&A)
Government-wide Financial Statements
Fund Financial Statements
Notes to Financial Statements
Required Supplementary Information (RSI) (other than MD&A)
Notes to Required Supplementary Information
25
GOVERNMENT-WIDE FINANCIAL STATEMENTS
The government-wide financial statements are designed to provide readers with a broad overview of the City’s finances, in a manner similar to a private-sector business.
The Statement of Net Position presents financial information on all of the City’s assets and liabilities, with the difference reported as net position. Over time, increases or decreases in net position may serve as a useful indicator of whether the financial position of the City is improving or deteriorating.
The Statement of Activities presents information showing how the City’s net position changed during the most recent fiscal year. All changes in net position are reported as soon as the underlying event giving rise to the change occurs, regardless of the timing of related cash flows. Thus, revenues and expenses are reported for some items that will only result in cash flows in future fiscal periods (e.g., uncollected taxes and earned but unused accrued vacation leave.)
The government-wide financial statements distinguish functions of the City that are principally supported by taxes and intergovernmental revenues (governmental activities) from other functions that are intended to recover all or a significant portion of their costs through user fees and charges (business-type activities).
In the Statement of Net Position and the Statement of Activities, the City is divided into three categories:
• Governmental activities – Most of the City’s basic services are included here, such as the activities ofthe police, fire, public works, social services, parks and recreation departments, and generaladministration. Property taxes and state and federal grants finance most of these activities.
• Business-type activities – The City charges fees to customers to cover the cost of certain services itprovides. The City’s water, sewer, and gas systems as well as the golf course are included here.
• Component units – The City includes two separate legal entities in its report – the City of CharlottesvilleEconomic Development Authority and the Charlottesville Public Schools. Although legally separate,these “component units” are important because the City is financially accountable for them andprovides operating funding.
FUND FINANCIAL STATEMENTS
A fund is a grouping of related accounts that is used to maintain control over resources that have been segregated for specific activities or objectives. The City, like other state and local governments, uses fund accounting to ensure and demonstrate compliance with finance-related legal requirements. All the funds of the City of Charlottesville, Virginia can be divided into three categories: governmental funds, proprietary funds, and fiduciary funds.
∗ Governmental Funds. Most of the City’s basic services are included in governmental funds, which focus on (1) how cash and other financial assets that can readily be converted to cash flow in and out and (2) the balances remaining at year-end that are available for spending. Consequently, the governmental fund statements provide a detailed short-term view that helps the reader determine whether there are more or fewer financial resources that can be spent in the near future to finance the City’s programs. Because this information does not encompass the long-term focus of the government-wide financial statements, additional information is provided on a subsequent page that explains the relationship (or differences) between the government-wide and fund financial statements.
∗ Proprietary Funds. Services for which the City charges customers a fee are generally reported in proprietary funds. Proprietary fund statements, like the government-wide financial statements, provide
26
both short-term and long-term financial information. The City’s enterprise funds (one type of proprietary fund) are the same as its business-type activities, with the exception of the Internal Service Funds’ allocation, but they provide more detail and additional information, such as a statement of cash flows. The City also uses internal service funds (another kind of proprietary fund) to report activities that provide supplies and services for the City’s other programs and activities – such as the Risk Management Fund and the Information Technology Fund.
∗ Fiduciary Funds. Fiduciary funds are used to report assets held in a trustee or agency capacity for others outside the government. The City maintains two pension trust funds for retirement and post-employment benefits. These activities are reported in a separate statement of fiduciary net assets. The City excludes this activity from its government-wide financial statements because the City cannot use these assets to finance its operations.
The Total Governmental Funds column requires reconciliation because of the different measurement focus from the government-wide statements (current financial resources versus total economic resources) which is reflected at the bottom of or following each statement. The flow of current financial resources will reflect bond proceeds and inter-fund transfers as other financing sources as well as capital expenditures and bond principal payments as expenditures. The reconciliation will eliminate these transactions and incorporate the capital assets and long-term obligations (bond and others) into the Governmental Activities column (in the government-wide statements).
NOTES TO THE FINANCIAL STATEMENTS
The notes provide additional information that is necessary to acquire a full understanding of the data provided in the government-wide and fund financial statements. The notes to the financial statements can be found following Exhibit F-2 at the end of the basic financial section of this report.
OTHER INFORMATION
In addition to the basic financial statements and accompanying notes, this report also presents required supplementary information and notes. General and Social Service major fund budget and actual reports are presented on a budgetary reporting basis as Exhibits G-1 and G-2. Progress in funding its obligations to provide pension and other post-employment benefits (OPEB) plans to its employees is provided as Exhibits H-1, H-2, H-3, H-4, and H-5.
The supplementary section has other major fund budget and actual reports presented on a budgetary reporting basis as Exhibits I-1 and I-2, as well as individual fiduciary statements in Exhibits I-3, and I-4. Non-major governmental funds are presented in Exhibits J, K, K-1, K2, K-3, K-4, K-5, and K-6. Proprietary fund statements are presented as Exhibits E-1, E-2, and E-3. Internal Service funds are presented as Exhibits L-1, L-2, and L-3.
Financial Statements for the Charlottesville School Board – Component unit are presented in Exhibits M-1, M-2, M-3, M-4, M-5, M-6 and M-7. Progress in funding School Board obligation to provide pension and other postemployment benefits (OPEB) plans to its employees is provided as Exhibits N-1, N-2, N-3, N-4, N-5, N-6, and N-7.
27
FINANCIAL ANALYSIS OF THE CITY AS A WHOLE
Statement of Net Position
The following table reflects the condensed Statement of Net Position:
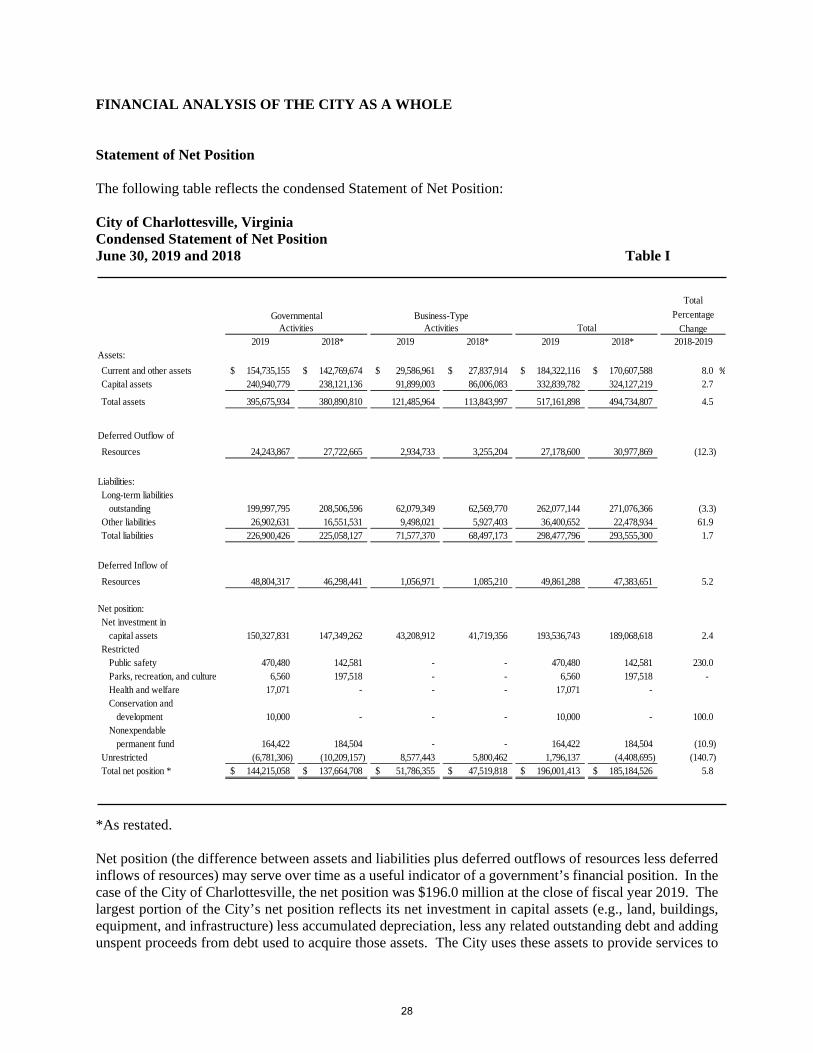
City of Charlottesville, Virginia Condensed Statement of Net Position June 30, 2019 and 2018 Table I
Total
Percentage
Change2019 2018* 2019 2018* 2019 2018*
Assets:
Current and other assets 154,735,155$ 142,769,674$ 29,586,961$ 27,837,914$ 184,322,116$ 170,607,588$ 8.0 %Capital assets 240,940,779 238,121,136 91,899,003 86,006,083 332,839,782 324,127,219 2.7
Total assets 395,675,934 380,890,810 121,485,964 113,843,997 517,161,898 494,734,807 4.5
Deferred Outflow of
Resources 24,243,867 27,722,665 2,934,733 3,255,204 27,178,600 30,977,869 (12.3)
Liabilities:Long-term liabilities
outstanding 199,997,795 208,506,596 62,079,349 62,569,770 262,077,144 271,076,366 (3.3) Other liabilities 26,902,631 16,551,531 9,498,021 5,927,403 36,400,652 22,478,934 61.9 Total liabilities 226,900,426 225,058,127 71,577,370 68,497,173 298,477,796 293,555,300 1.7
Deferred Inflow of
Resources 48,804,317 46,298,441 1,056,971 1,085,210 49,861,288 47,383,651 5.2
Net position:Net investment in capital assets 150,327,831 147,349,262 43,208,912 41,719,356 193,536,743 189,068,618 2.4 Restricted
Public safety 470,480 142,581 - - 470,480 142,581 230.0 Parks, recreation, and culture 6,560 197,518 - - 6,560 197,518 - Health and welfare 17,071 - - - 17,071 - Conservation and
development 10,000 - - - 10,000 - 100.0 Nonexpendable
permanent fund 164,422 184,504 - - 164,422 184,504 (10.9) Unrestricted (6,781,306) (10,209,157) 8,577,443 5,800,462 1,796,137 (4,408,695) (140.7) Total net position * 144,215,058$ 137,664,708$ 51,786,355$ 47,519,818$ 196,001,413$ 185,184,526$ 5.8
2018-2019
GovernmentalActivities
Business-TypeActivities Total
*As restated.
Net position (the difference between assets and liabilities plus deferred outflows of resources less deferred inflows of resources) may serve over time as a useful indicator of a government’s financial position. In the case of the City of Charlottesville, the net position was $196.0 million at the close of fiscal year 2019. The largest portion of the City’s net position reflects its net investment in capital assets (e.g., land, buildings, equipment, and infrastructure) less accumulated depreciation, less any related outstanding debt and adding unspent proceeds from debt used to acquire those assets. The City uses these assets to provide services to
28
its citizens and consequently, these assets are not available for future spending. The resources needed to repay the debt related to these capital assets must be provided from other sources.
Governmental Activities
The net position of the City’s governmental activities increased from $137.7 million to $144.2 million.
Business-type Activities
The City’s business-type activities net position increased by $4.3 million primarily due to a consistent increase in net position of all utility activities. Business-type activity resources are not to be used to make up for a net position deficit in the governmental activities. In general, the City can only use the unrestricted net position of business-type activities to finance the continued operations of its enterprise operations, which include the Water, Sewer, Stormwater, Gas and Meadowcreek Golf Course funds.
29
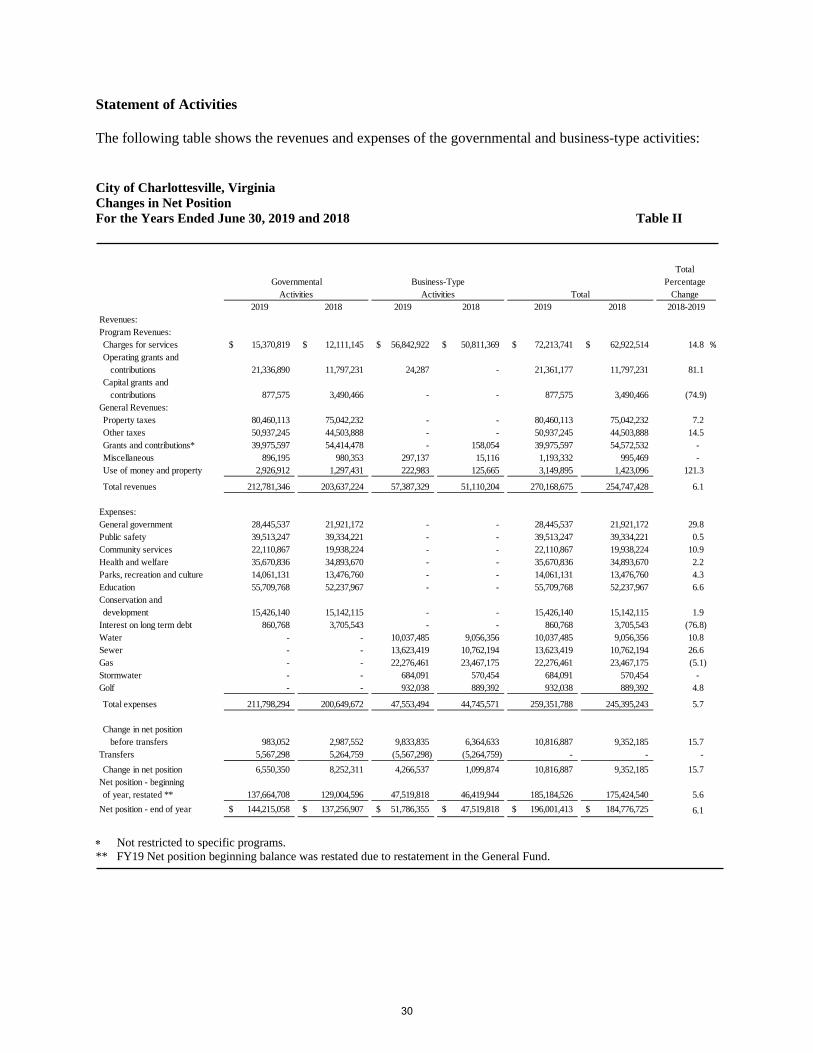
Statement of Activities
The following table shows the revenues and expenses of the governmental and business-type activities:
City of Charlottesville, Virginia Changes in Net Position For the Years Ended June 30, 2019 and 2018 Table II
TotalPercentage
Change2019 2018 2019 2018 2019 2018
Revenues:Program Revenues:Charges for services 15,370,819$ 12,111,145$ 56,842,922$ 50,811,369$ 72,213,741$ 62,922,514$ 14.8 %Operating grants and
contributions 21,336,890 11,797,231 24,287 - 21,361,177 11,797,231 81.1 Capital grants and
contributions 877,575 3,490,466 - - 877,575 3,490,466 (74.9) General Revenues:Property taxes 80,460,113 75,042,232 - - 80,460,113 75,042,232 7.2 Other taxes 50,937,245 44,503,888 - - 50,937,245 44,503,888 14.5 Grants and contributions* 39,975,597 54,414,478 - 158,054 39,975,597 54,572,532 - Miscellaneous 896,195 980,353 297,137 15,116 1,193,332 995,469 - Use of money and property 2,926,912 1,297,431 222,983 125,665 3,149,895 1,423,096 121.3
Total revenues 212,781,346 203,637,224 57,387,329 51,110,204 270,168,675 254,747,428 6.1
Expenses:General government 28,445,537 21,921,172 - - 28,445,537 21,921,172 29.8 Public safety 39,513,247 39,334,221 - - 39,513,247 39,334,221 0.5 Community services 22,110,867 19,938,224 - - 22,110,867 19,938,224 10.9 Health and welfare 35,670,836 34,893,670 - - 35,670,836 34,893,670 2.2 Parks, recreation and culture 14,061,131 13,476,760 - - 14,061,131 13,476,760 4.3 Education 55,709,768 52,237,967 - - 55,709,768 52,237,967 6.6 Conservation anddevelopment 15,426,140 15,142,115 - - 15,426,140 15,142,115 1.9
Interest on long term debt 860,768 3,705,543 - - 860,768 3,705,543 (76.8) Water - - 10,037,485 9,056,356 10,037,485 9,056,356 10.8 Sewer - - 13,623,419 10,762,194 13,623,419 10,762,194 26.6 Gas - - 22,276,461 23,467,175 22,276,461 23,467,175 (5.1) Stormwater - - 684,091 570,454 684,091 570,454 - Golf - - 932,038 889,392 932,038 889,392 4.8
Total expenses 211,798,294 200,649,672 47,553,494 44,745,571 259,351,788 245,395,243 5.7
Change in net positionbefore transfers 983,052 2,987,552 9,833,835 6,364,633 10,816,887 9,352,185 15.7
Transfers 5,567,298 5,264,759 (5,567,298) (5,264,759) - - -
Change in net position 6,550,350 8,252,311 4,266,537 1,099,874 10,816,887 9,352,185 15.7 Net position - beginningof year, restated ** 137,664,708 129,004,596 47,519,818 46,419,944 185,184,526 175,424,540 5.6
Net position - end of year 144,215,058$ 137,256,907$ 51,786,355$ 47,519,818$ 196,001,413$ 184,776,725$ 6.1
2018-2019
GovernmentalActivities
Business-TypeActivities Total
∗ Not restricted to specific programs. ** FY19 Net position beginning balance was restated due to restatement in the General Fund.
30
Governmental Activities
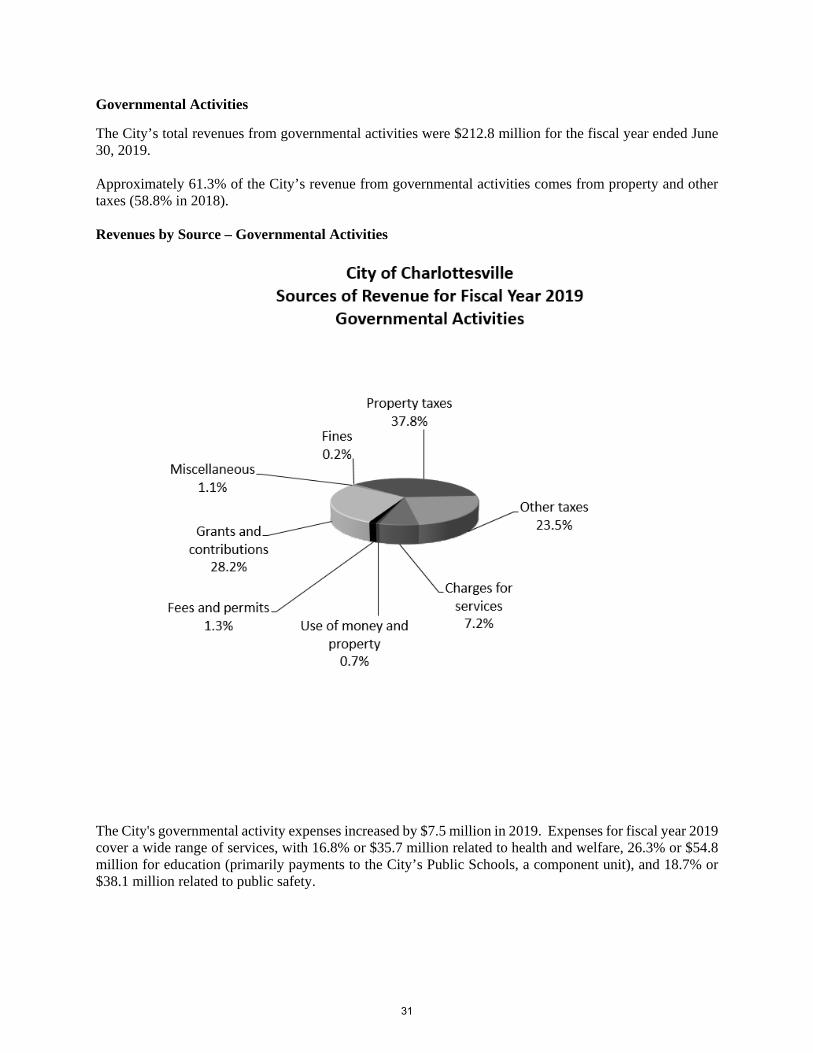
The City’s total revenues from governmental activities were $212.8 million for the fiscal year ended June 30, 2019.
Approximately 61.3% of the City’s revenue from governmental activities comes from property and other taxes (58.8% in 2018).
Revenues by Source – Governmental Activities
The City's governmental activity expenses increased by $7.5 million in 2019. Expenses for fiscal year 2019 cover a wide range of services, with 16.8% or $35.7 million related to health and welfare, 26.3% or $54.8 million for education (primarily payments to the City’s Public Schools, a component unit), and 18.7% or $38.1 million related to public safety.
31
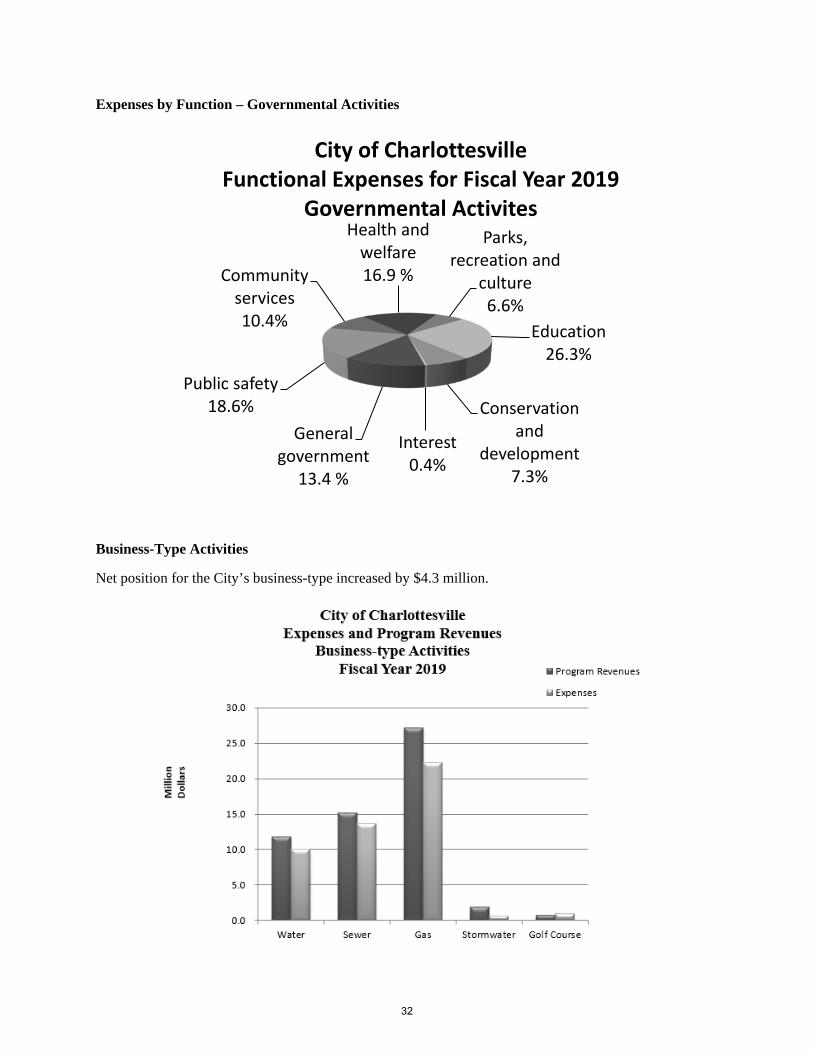
Expenses by Function – Governmental Activities
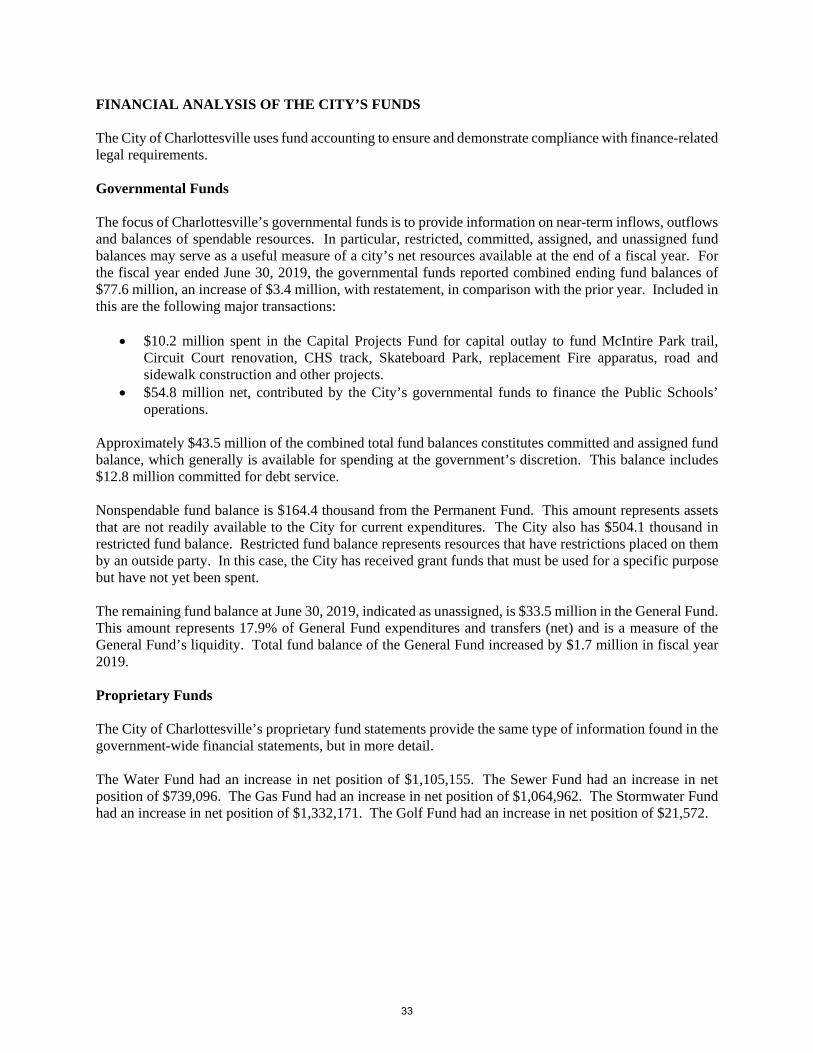
Business-Type Activities
Net position for the City’s business-type increased by $4.3 million.
General government
13.4 %
Public safety18.6%
Community services10.4%
Health and welfare16.9 %
Parks, recreation and
culture6.6%
Education26.3%
Conservation and
development7.3%
Interest0.4%
City of CharlottesvilleFunctional Expenses for Fiscal Year 2019
Governmental Activites
32
FINANCIAL ANALYSIS OF THE CITY’S FUNDS
The City of Charlottesville uses fund accounting to ensure and demonstrate compliance with finance-related legal requirements.
Governmental Funds
The focus of Charlottesville’s governmental funds is to provide information on near-term inflows, outflows and balances of spendable resources. In particular, restricted, committed, assigned, and unassigned fund balances may serve as a useful measure of a city’s net resources available at the end of a fiscal year. For the fiscal year ended June 30, 2019, the governmental funds reported combined ending fund balances of $77.6 million, an increase of $3.4 million, with restatement, in comparison with the prior year. Included in this are the following major transactions:
• $10.2 million spent in the Capital Projects Fund for capital outlay to fund McIntire Park trail,Circuit Court renovation, CHS track, Skateboard Park, replacement Fire apparatus, road andsidewalk construction and other projects.
• $54.8 million net, contributed by the City’s governmental funds to finance the Public Schools’operations.
Approximately $43.5 million of the combined total fund balances constitutes committed and assigned fund balance, which generally is available for spending at the government’s discretion. This balance includes $12.8 million committed for debt service.
Nonspendable fund balance is $164.4 thousand from the Permanent Fund. This amount represents assets that are not readily available to the City for current expenditures. The City also has $504.1 thousand in restricted fund balance. Restricted fund balance represents resources that have restrictions placed on them by an outside party. In this case, the City has received grant funds that must be used for a specific purpose but have not yet been spent.
The remaining fund balance at June 30, 2019, indicated as unassigned, is $33.5 million in the General Fund. This amount represents 17.9% of General Fund expenditures and transfers (net) and is a measure of the General Fund’s liquidity. Total fund balance of the General Fund increased by $1.7 million in fiscal year 2019.
Proprietary Funds
The City of Charlottesville’s proprietary fund statements provide the same type of information found in the government-wide financial statements, but in more detail.
The Water Fund had an increase in net position of $1,105,155. The Sewer Fund had an increase in net position of $739,096. The Gas Fund had an increase in net position of $1,064,962. The Stormwater Fund had an increase in net position of $1,332,171. The Golf Fund had an increase in net position of $21,572.
33
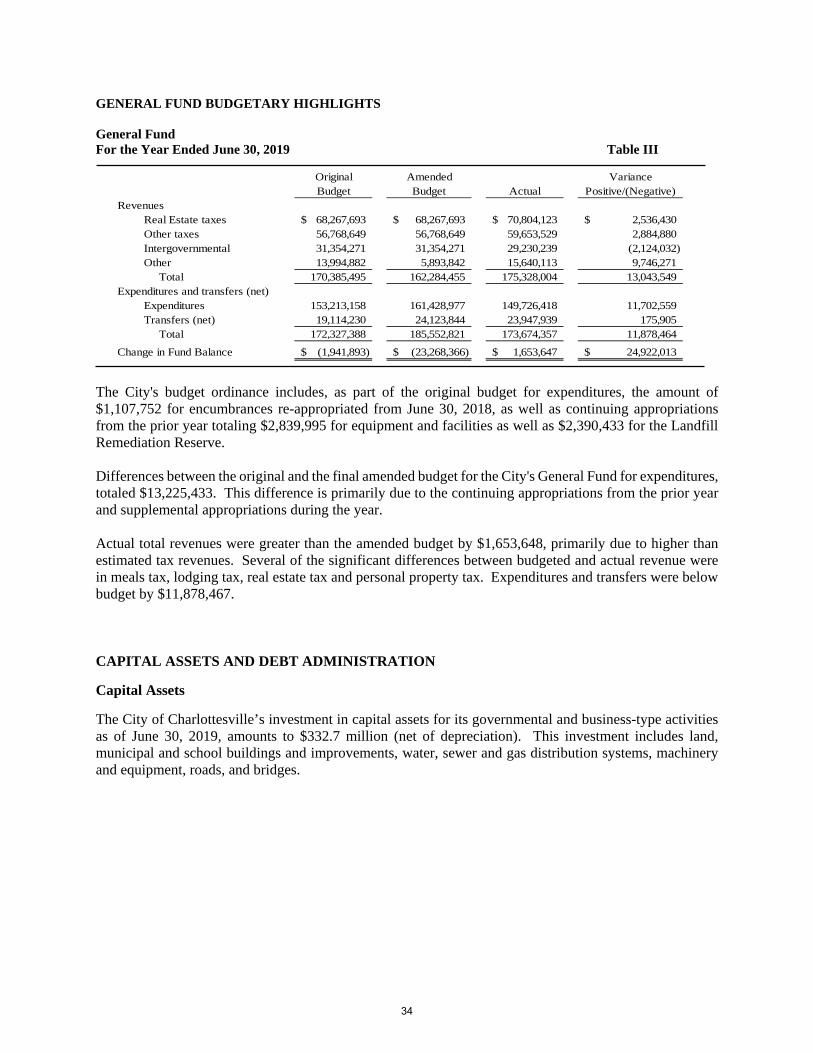
GENERAL FUND BUDGETARY HIGHLIGHTS
General Fund For the Year Ended June 30, 2019 Table III
Original Amended VarianceBudget Budget Actual Positive/(Negative)
RevenuesReal Estate taxes 68,267,693$ 68,267,693$ 70,804,123$ 2,536,430$ Other taxes 56,768,649 56,768,649 59,653,529 2,884,880 Intergovernmental 31,354,271 31,354,271 29,230,239 (2,124,032) Other 13,994,882 5,893,842 15,640,113 9,746,271
Total 170,385,495 162,284,455 175,328,004 13,043,549 Expenditures and transfers (net)
Expenditures 153,213,158 161,428,977 149,726,418 11,702,559 Transfers (net) 19,114,230 24,123,844 23,947,939 175,905
Total 172,327,388 185,552,821 173,674,357 11,878,464
Change in Fund Balance (1,941,893)$ (23,268,366)$ 1,653,647$ 24,922,013$
The City's budget ordinance includes, as part of the original budget for expenditures, the amount of $1,107,752 for encumbrances re-appropriated from June 30, 2018, as well as continuing appropriations from the prior year totaling $2,839,995 for equipment and facilities as well as $2,390,433 for the Landfill Remediation Reserve.
Differences between the original and the final amended budget for the City's General Fund for expenditures, totaled $13,225,433. This difference is primarily due to the continuing appropriations from the prior year and supplemental appropriations during the year.
Actual total revenues were greater than the amended budget by $1,653,648, primarily due to higher than estimated tax revenues. Several of the significant differences between budgeted and actual revenue were in meals tax, lodging tax, real estate tax and personal property tax. Expenditures and transfers were below budget by $11,878,467.
CAPITAL ASSETS AND DEBT ADMINISTRATION
Capital Assets
The City of Charlottesville’s investment in capital assets for its governmental and business-type activities as of June 30, 2019, amounts to $332.7 million (net of depreciation). This investment includes land, municipal and school buildings and improvements, water, sewer and gas distribution systems, machinery and equipment, roads, and bridges.
34
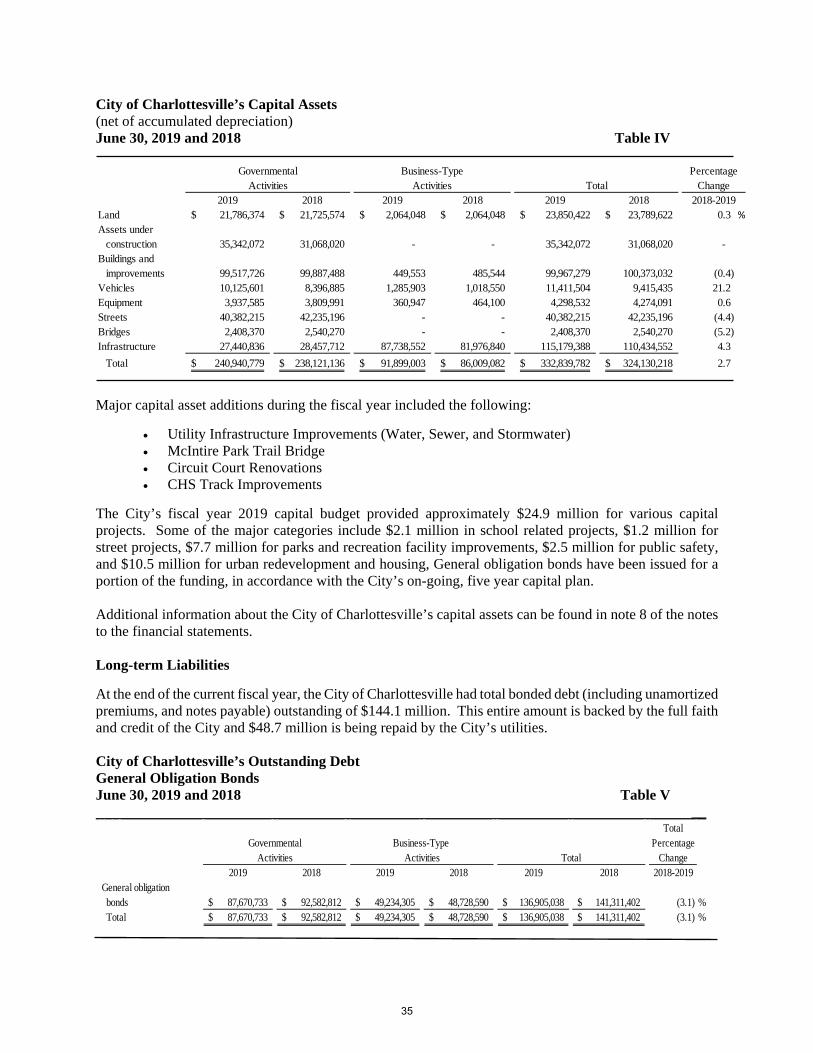
City of Charlottesville’s Capital Assets (net of accumulated depreciation) June 30, 2019 and 2018 Table IV
PercentageChange
2019 2018 2019 2018 2019 2018Land 21,786,374$ 21,725,574$ 2,064,048$ 2,064,048$ 23,850,422$ 23,789,622$ 0.3 %Assets under
construction 35,342,072 31,068,020 - - 35,342,072 31,068,020 - Buildings and
improvements 99,517,726 99,887,488 449,553 485,544 99,967,279 100,373,032 (0.4) Vehicles 10,125,601 8,396,885 1,285,903 1,018,550 11,411,504 9,415,435 21.2 Equipment 3,937,585 3,809,991 360,947 464,100 4,298,532 4,274,091 0.6 Streets 40,382,215 42,235,196 - - 40,382,215 42,235,196 (4.4) Bridges 2,408,370 2,540,270 - - 2,408,370 2,540,270 (5.2) Infrastructure 27,440,836 28,457,712 87,738,552 81,976,840 115,179,388 110,434,552 4.3
Total 240,940,779$ 238,121,136$ 91,899,003$ 86,009,082$ 332,839,782$ 324,130,218$ 2.7
2018-2019
GovernmentalActivities
Business-TypeActivities Total
Major capital asset additions during the fiscal year included the following:
• Utility Infrastructure Improvements (Water, Sewer, and Stormwater)
• McIntire Park Trail Bridge
• Circuit Court Renovations
• CHS Track Improvements
The City’s fiscal year 2019 capital budget provided approximately $24.9 million for various capital projects. Some of the major categories include $2.1 million in school related projects, $1.2 million for street projects, $7.7 million for parks and recreation facility improvements, $2.5 million for public safety, and $10.5 million for urban redevelopment and housing, General obligation bonds have been issued for a portion of the funding, in accordance with the City’s on-going, five year capital plan.
Additional information about the City of Charlottesville’s capital assets can be found in note 8 of the notes to the financial statements.
Long-term Liabilities
At the end of the current fiscal year, the City of Charlottesville had total bonded debt (including unamortized premiums, and notes payable) outstanding of $144.1 million. This entire amount is backed by the full faith and credit of the City and $48.7 million is being repaid by the City’s utilities.
City of Charlottesville’s Outstanding Debt General Obligation Bonds June 30, 2019 and 2018 Table V
__ Total
Governmental Business-Type PercentageActivities Activities Total Change
2019 2018 2019 2018 2019 2018 2018-2019General obligationbonds 87,670,733$ 92,582,812$ 49,234,305$ 48,728,590$ 136,905,038$ 141,311,402$ (3.1) %Total 87,670,733$ 92,582,812$ 49,234,305$ 48,728,590$ 136,905,038$ 141,311,402$ (3.1) %
35
Charlottesville’s total debt increased by $2.8 million during the fiscal year. On its most recent bond issue in May 2019, the City's bond rating was reaffirmed by Standard & Poor’s Corporation and Moody’s Investors Service, as AAA and Aaa, respectively.
State statutes limit the amount of general obligation debt a government entity may issue to 10 percent of its total assessed valuation of real property. The current debt limitation for the City of Charlottesville is $766 million. This is significantly more than the City’s current total outstanding debt.
Additional information on the City of Charlottesville’s long-term liabilities can be found in note 9 of the notes to the financial statements.
ECONOMIC FACTORS AND NEXT YEAR’S BUDGET AND RATES
• The City’s unemployment rate has stabilized from its high in 2010 and as of July 2019 is at 2.6%. Thiscompares favorably to the national unemployment rate of 3.7%, and the state’s rate of 2.9%.
• City labor force increased 0.99% from 25,758 in July 2018 to 26,014 in July 2019 based on currentVirginia Employment Commission statistics.
• The City has an estimated population of 49,281 according to the Weldon Cooper Center for PublicService.
These indicators were taken into account when adopting the General Fund budget for 2020. Amounts available for appropriation in the General Fund budget for 2020 are $192.8 million, an increase of 13.1% over the 2019 budget of $179.7 million.
CONTACTING THE CITY’S FINANCIAL MANAGEMENT
This financial report is designed to provide citizens, taxpayers, customers, investors, and creditors with a general overview of the City’s finances and to demonstrate the City’s accountability for the funds it receives. If you have questions about this report or need additional financial information, contact the Director of Finance, City of Charlottesville, 605 East Main Street, Charlottesville, Virginia 22902.
36
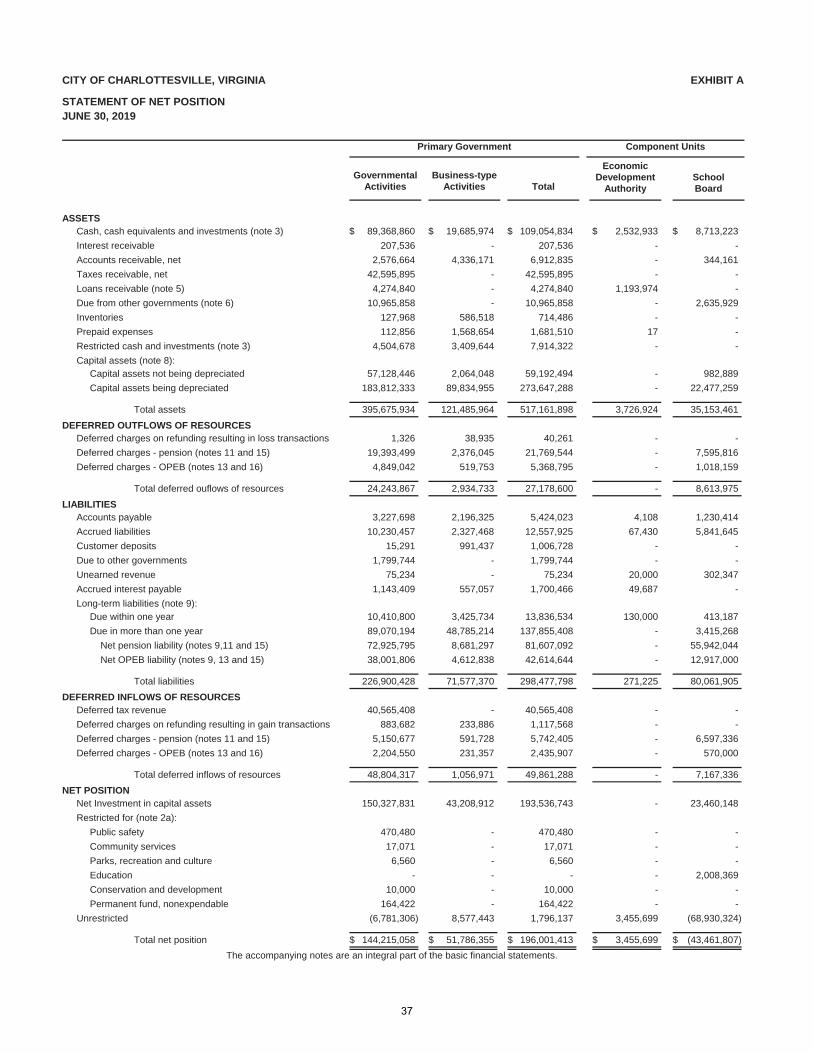
CITY OF CHARLOTTESVILLE, VIRGINIA
STATEMENT OF NET POSITIONJUNE 30, 2019
EXHIBIT A
Primary Government
GovernmentalActivities
Business-typeActivities Total
Component Units
EconomicDevelopment
AuthoritySchoolBoard
ASSETSCash, cash equivalents and investments (note 3) $ 89,368,860 $ 19,685,974 $ 109,054,834 $ 2,532,933 $ 8,713,223
Interest receivable 207,536 - 207,536 - -
Accounts receivable, net 2,576,664 4,336,171 6,912,835 - 344,161
Taxes receivable, net 42,595,895 - 42,595,895 - -
Loans receivable (note 5) 4,274,840 - 4,274,840 1,193,974 -
Due from other governments (note 6) 10,965,858 - 10,965,858 - 2,635,929
Inventories 127,968 586,518 714,486 - -
Prepaid expenses 112,856 1,568,654 1,681,510 17 -
Restricted cash and investments (note 3) 4,504,678 3,409,644 7,914,322 - -
Capital assets (note 8): Capital assets not being depreciated 57,128,446 2,064,048 59,192,494 - 982,889
Capital assets being depreciated 183,812,333 89,834,955 273,647,288 - 22,477,259
395,675,934Total assets 121,485,964 517,161,898 3,726,924 35,153,461
DEFERRED OUTFLOWS OF RESOURCESDeferred charges on refunding resulting in loss transactions 1,326 38,935 40,261 - -
Deferred charges - pension (notes 11 and 15) 19,393,499 2,376,045 21,769,544 - 7,595,816
Deferred charges - OPEB (notes 13 and 16) 4,849,042 519,753 5,368,795 - 1,018,159
24,243,867Total deferred ouflows of resources 2,934,733 27,178,600 - 8,613,975
LIABILITIESAccounts payable 3,227,698 2,196,325 5,424,023 4,108 1,230,414
Accrued liabilities 10,230,457 2,327,468 12,557,925 67,430 5,841,645
Customer deposits 15,291 991,437 1,006,728 - -
Due to other governments 1,799,744 - 1,799,744 - -
Unearned revenue 75,234 - 75,234 20,000 302,347
Accrued interest payable 1,143,409 557,057 1,700,466 49,687 -
Long-term liabilities (note 9): Due within one year 10,410,800 3,425,734 13,836,534 130,000 413,187
Due in more than one year 89,070,194 48,785,214 137,855,408 - 3,415,268
Net pension liability (notes 9,11 and 15) 72,925,795 8,681,297 81,607,092 - 55,942,044
Net OPEB liability (notes 9, 13 and 15) 38,001,806 4,612,838 42,614,644 - 12,917,000
226,900,428Total liabilities 71,577,370 298,477,798 271,225 80,061,905
DEFERRED INFLOWS OF RESOURCESDeferred tax revenue 40,565,408 - 40,565,408 - -
Deferred charges on refunding resulting in gain transactions 883,682 233,886 1,117,568 - -
Deferred charges - pension (notes 11 and 15) 5,150,677 591,728 5,742,405 - 6,597,336
Deferred charges - OPEB (notes 13 and 16) 2,204,550 231,357 2,435,907 - 570,000
48,804,317Total deferred inflows of resources 1,056,971 49,861,288 - 7,167,336
NET POSITIONNet Investment in capital assets 150,327,831 43,208,912 193,536,743 - 23,460,148
Restricted for (note 2a):
Public safety 470,480 - 470,480 - -
Community services 17,071 - 17,071 - -
Parks, recreation and culture 6,560 - 6,560 - -
Education - - - - 2,008,369
Conservation and development 10,000 - 10,000 - -
Permanent fund, nonexpendable 164,422 - 164,422 - -
Unrestricted )(6,781,306 8,577,443 1,796,137 3,455,699 )(68,930,324
$ 144,215,058Total net position $ 51,786,355 $ 196,001,413 $ 3,455,699 $ )(43,461,807
The accompanying notes are an integral part of the basic financial statements.
37
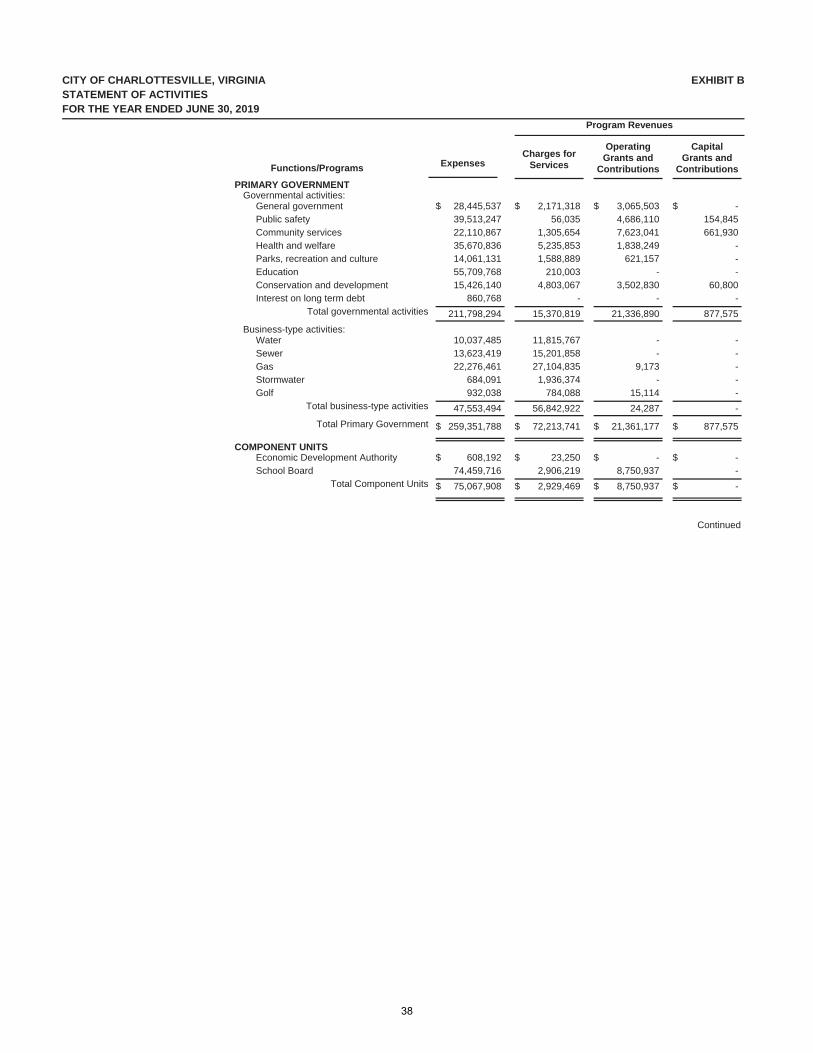
CITY OF CHARLOTTESVILLE, VIRGINIASTATEMENT OF ACTIVITIESFOR THE YEAR ENDED JUNE 30, 2019
EXHIBIT B
ExpensesCharges for
Services
OperatingGrants and
Contributions
CapitalGrants and
ContributionsFunctions/Programs
Program Revenues
PRIMARY GOVERNMENTGovernmental activities:
$ 28,445,537General government $ 2,171,318 $ 3,065,503 $ -39,513,247Public safety 56,035 4,686,110 154,84522,110,867Community services 1,305,654 7,623,041 661,93035,670,836Health and welfare 5,235,853 1,838,249 -14,061,131Parks, recreation and culture 1,588,889 621,157 -55,709,768Education 210,003 - -15,426,140Conservation and development 4,803,067 3,502,830 60,800
860,768Interest on long term debt - - -
211,798,294 15,370,819 21,336,890 877,575 Total governmental activities
Business-type activities: 10,037,485Water 11,815,767 - -13,623,419Sewer 15,201,858 - -22,276,461Gas 27,104,835 9,173 -
684,091Stormwater 1,936,374 - -932,038Golf 784,088 15,114 -
47,553,494 56,842,922 24,287 -Total business-type activities
$ 259,351,788 $ 72,213,741 $ 21,361,177 $ 877,575Total Primary Government
COMPONENT UNITS$ 608,192Economic Development Authority $ 23,250 $ - $ -
74,459,716School Board 2,906,219 8,750,937 -
$ 75,067,908 $ 2,929,469 $ 8,750,937 $ -Total Component Units
Continued
38
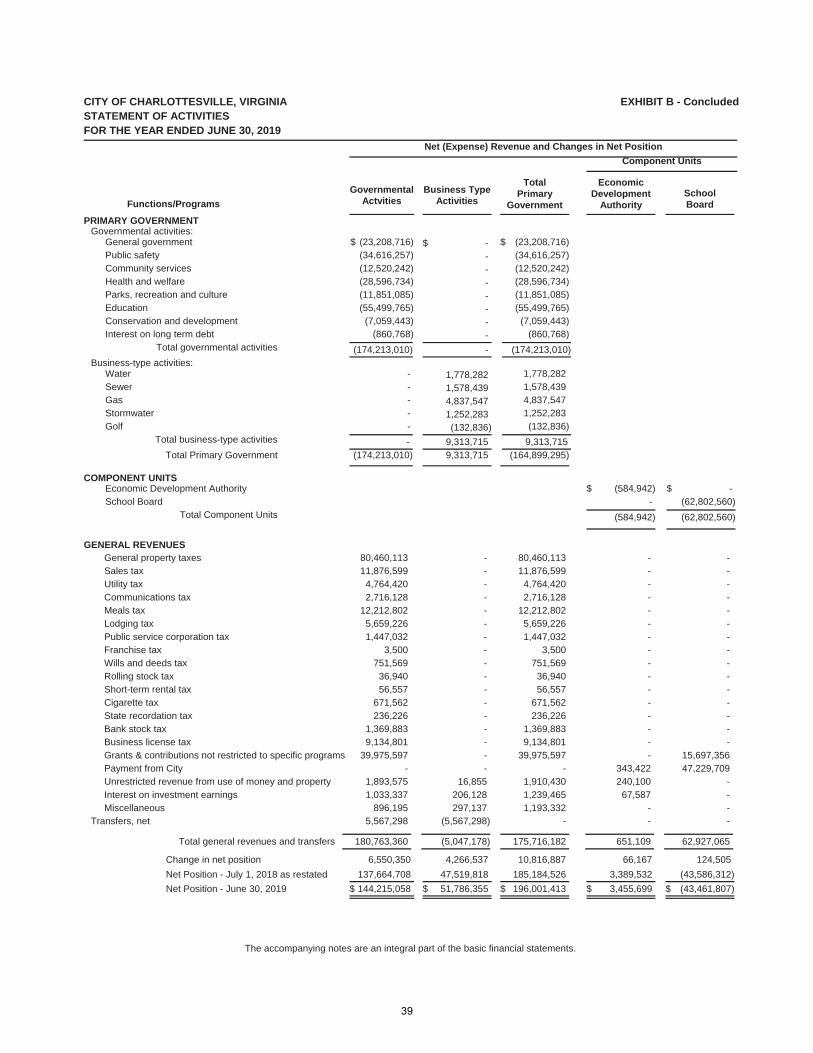
CITY OF CHARLOTTESVILLE, VIRGINIASTATEMENT OF ACTIVITIESFOR THE YEAR ENDED JUNE 30, 2019
EXHIBIT B - Concluded
Governmental Actvities
Business Type Activities
TotalPrimary
Government
EconomicDevelopment
AuthoritySchoolBoardFunctions/Programs
Net (Expense) Revenue and Changes in Net Position
Component Units
PRIMARY GOVERNMENTGovernmental activities:
General government $ )(23,208,716 $ - $ )(23,208,716Public safety )(34,616,257 - )(34,616,257Community services )(12,520,242 - )(12,520,242Health and welfare )(28,596,734 - )(28,596,734Parks, recreation and culture )(11,851,085 - )(11,851,085Education )(55,499,765 - )(55,499,765Conservation and development )(7,059,443 - )(7,059,443Interest on long term debt )(860,768 - )(860,768
)(174,213,010 - )(174,213,010 Total governmental activities
Business-type activities: Water - 1,778,282 1,778,282Sewer - 1,578,439 1,578,439Gas - 4,837,547 4,837,547Stormwater - 1,252,283 1,252,283Golf - )(132,836 )(132,836
- 9,313,715 9,313,715Total business-type activities
)(164,899,295Total Primary Government 9,313,715)(174,213,010
COMPONENT UNITSEconomic Development Authority $ )(584,942 $ -School Board - )(62,802,560
)(62,802,560Total Component Units )(584,942
GENERAL REVENUES80,460,113 80,460,113 - -- General property taxes11,876,599 11,876,599 - -- Sales tax
4,764,420 4,764,420 - -- Utility tax2,716,128 2,716,128 - -- Communications tax
12,212,802 12,212,802 - -- Meals tax5,659,226 5,659,226 - -- Lodging tax1,447,032 1,447,032 - -- Public service corporation tax
3,500 3,500 - -- Franchise tax751,569 751,569 - -- Wills and deeds tax
36,940 36,940 - -- Rolling stock tax56,557 56,557 - -- Short-term rental tax
671,562 671,562 - -- Cigarette tax236,226 236,226 - -- State recordation tax
1,369,883 1,369,883 - -- Bank stock tax9,134,801 9,134,801 - -- Business license tax
39,975,597 39,975,597 - 15,697,356- Grants & contributions not restricted to specific programs- - 343,422 47,229,709- Payment from City
1,893,575 1,910,430 240,100 -16,855 Unrestricted revenue from use of money and property1,033,337 1,239,465 67,587 -206,128 Interest on investment earnings
896,195 1,193,332 - -297,137 Miscellaneous5,567,298 - - -)(5,567,298Transfers, net
Total general revenues and transfers 180,763,360 )(5,047,178 175,716,182 651,109 62,927,065
Change in net position 6,550,350 4,266,537 10,816,887 66,167 124,505
Net Position - July 1, 2018 as restated 137,664,708 47,519,818 )(43,586,312185,184,526 3,389,532
$ 144,215,058 $ 51,786,355 $ 196,001,413 $ 3,455,699 $ )(43,461,807Net Position - June 30, 2019
The accompanying notes are an integral part of the basic financial statements.
39
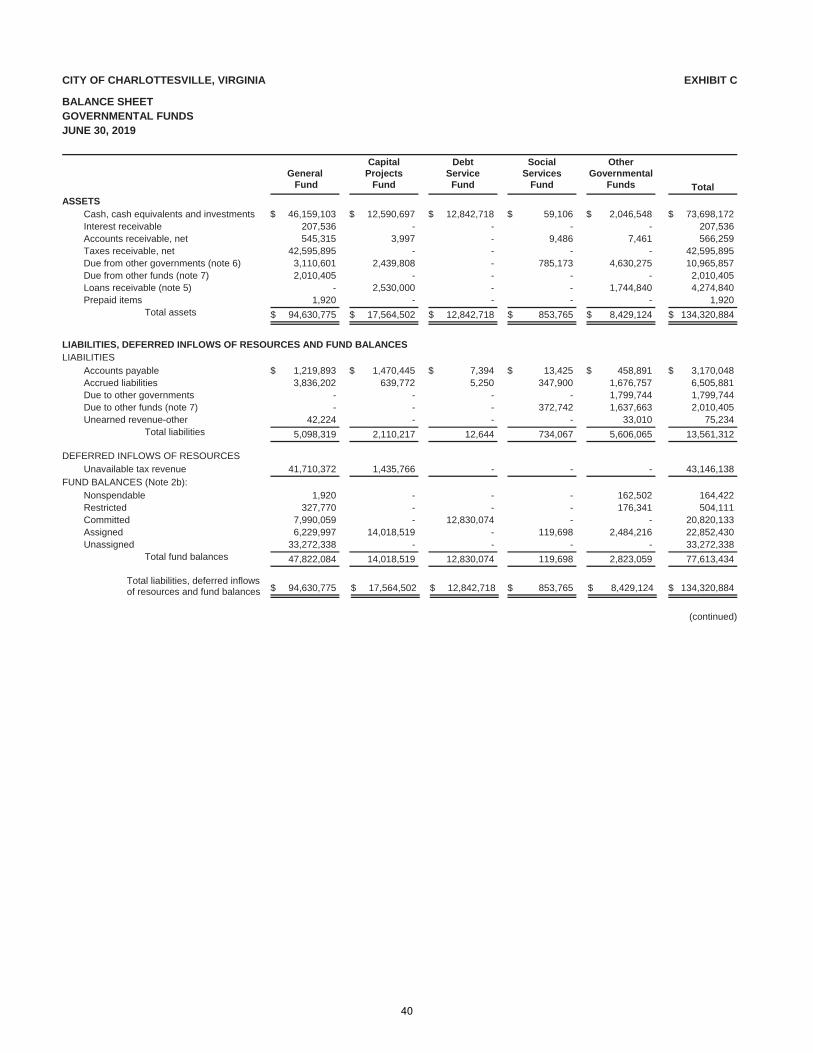
CITY OF CHARLOTTESVILLE, VIRGINIA
BALANCE SHEETGOVERNMENTAL FUNDSJUNE 30, 2019
EXHIBIT C
General Fund
CapitalProjects
Fund
DebtService
Fund
SocialServices
Fund
OtherGovernmental
Funds Total
ASSETSCash, cash equivalents and investments $ 46,159,103 $ 12,590,697 $ 12,842,718 $ 59,106 $ 2,046,548 $ 73,698,172Interest receivable 207,536 - - - - 207,536Accounts receivable, net 545,315 3,997 - 9,486 7,461 566,259Taxes receivable, net 42,595,895 - - - - 42,595,895Due from other governments (note 6) 3,110,601 2,439,808 - 785,173 4,630,275 10,965,857Due from other funds (note 7) 2,010,405 - - - - 2,010,405Loans receivable (note 5) - 2,530,000 - - 1,744,840 4,274,840Prepaid items 1,920 - - - - 1,920
$ 94,630,775Total assets $ 17,564,502 $ 12,842,718 $ 853,765 $ 8,429,124 $ 134,320,884
LIABILITIES, DEFERRED INFLOWS OF RESOURCES AND FUND BALANCESLIABILITIES
Accounts payable $ 1,219,893 $ 1,470,445 $ 7,394 $ 13,425 $ 458,891 $ 3,170,048Accrued liabilities 3,836,202 639,772 5,250 347,900 1,676,757 6,505,881Due to other governments - - - - 1,799,744 1,799,744Due to other funds (note 7) - - - 372,742 1,637,663 2,010,405Unearned revenue-other 42,224 - - - 33,010 75,234
5,098,319Total liabilities 2,110,217 12,644 734,067 5,606,065 13,561,312
DEFERRED INFLOWS OF RESOURCESUnavailable tax revenue 41,710,372 1,435,766 - - - 43,146,138
FUND BALANCES (Note 2b):Nonspendable 1,920 - - - 162,502 164,422Restricted 327,770 - - - 176,341 504,111Committed 7,990,059 - 12,830,074 - - 20,820,133Assigned 6,229,997 14,018,519 - 119,698 2,484,216 22,852,430Unassigned 33,272,338 - - - - 33,272,338
47,822,084Total fund balances 14,018,519 12,830,074 119,698 2,823,059 77,613,434
Total liabilities, deferred inflows of resources and fund balances $ 94,630,775 $ 17,564,502 $ 12,842,718 $ 853,765 $ 8,429,124 $ 134,320,884
(continued)
40
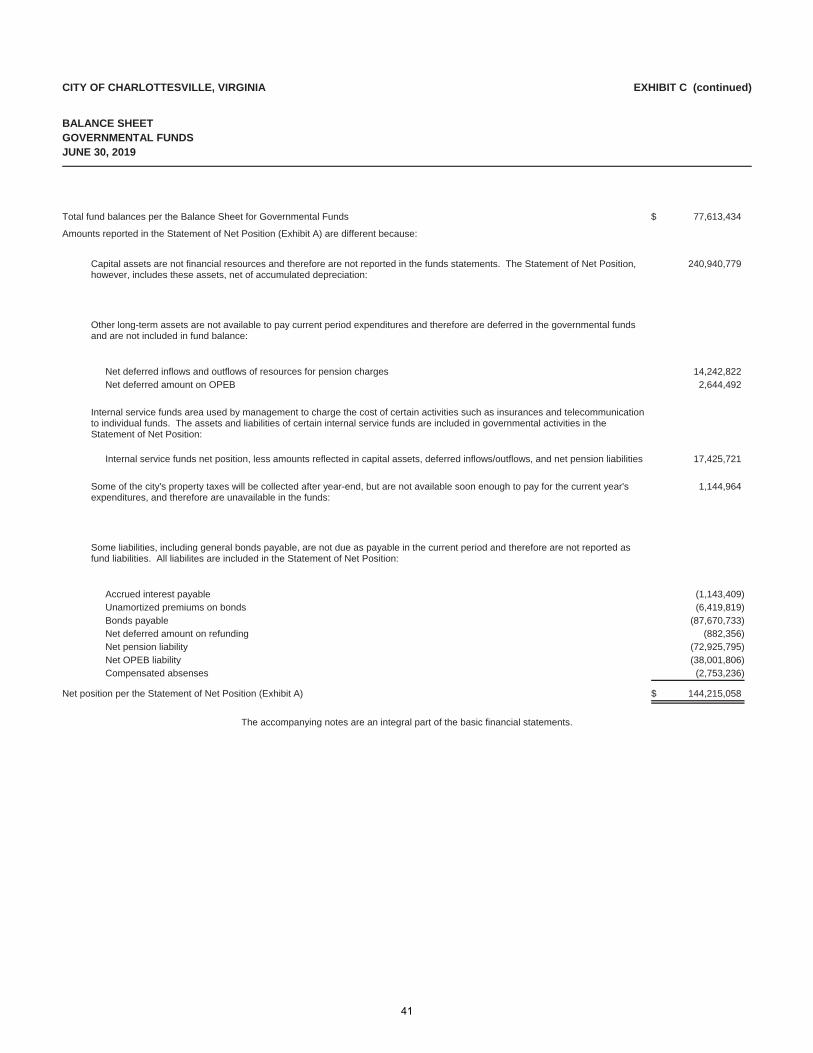
CITY OF CHARLOTTESVILLE, VIRGINIA
BALANCE SHEETGOVERNMENTAL FUNDS
EXHIBIT C (continued)
JUNE 30, 2019
Total fund balances per the Balance Sheet for Governmental Funds $ 77,613,434
Amounts reported in the Statement of Net Position (Exhibit A) are different because:
Capital assets are not financial resources and therefore are not reported in the funds statements. The Statement of Net Position,however, includes these assets, net of accumulated depreciation:
240,940,779
Other long-term assets are not available to pay current period expenditures and therefore are deferred in the governmental fundsand are not included in fund balance:
14,242,822Net deferred inflows and outflows of resources for pension charges2,644,492Net deferred amount on OPEB
Internal service funds area used by management to charge the cost of certain activities such as insurances and telecommunicationto individual funds. The assets and liabilities of certain internal service funds are included in governmental activities in theStatement of Net Position:
17,425,721Internal service funds net position, less amounts reflected in capital assets, deferred inflows/outflows, and net pension liabilities
Some of the city's property taxes will be collected after year-end, but are not available soon enough to pay for the current year'sexpenditures, and therefore are unavailable in the funds:
1,144,964
Some liabilities, including general bonds payable, are not due as payable in the current period and therefore are not reported asfund liabilities. All liabilites are included in the Statement of Net Position:
)(1,143,409Accrued interest payable)(6,419,819Unamortized premiums on bonds)(87,670,733Bonds payable)(882,356Net deferred amount on refunding)(72,925,795Net pension liability)(38,001,806Net OPEB liability)(2,753,236Compensated absenses
$ 144,215,058Net position per the Statement of Net Position (Exhibit A)
The accompanying notes are an integral part of the basic financial statements.
41
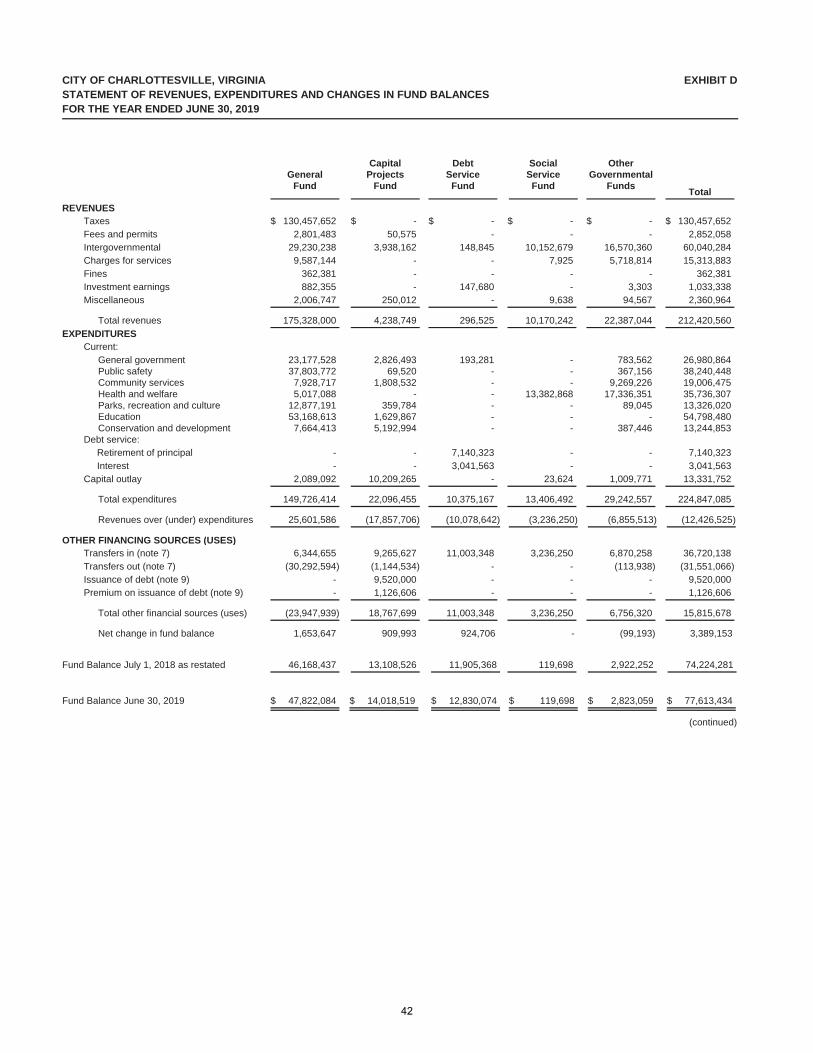
CITY OF CHARLOTTESVILLE, VIRGINIASTATEMENT OF REVENUES, EXPENDITURES AND CHANGES IN FUND BALANCESFOR THE YEAR ENDED JUNE 30, 2019
EXHIBIT D
General Fund
CapitalProjects
Fund
DebtService
Fund
SocialServiceFund
OtherGovernmental
FundsTotal
REVENUESTaxes $ 130,457,652 $ - $ - $ - $ - $ 130,457,652Fees and permits 2,801,483 50,575 - - - 2,852,058Intergovernmental 29,230,238 3,938,162 148,845 10,152,679 16,570,360 60,040,284Charges for services 9,587,144 - - 7,925 5,718,814 15,313,883Fines 362,381 - - - - 362,381Investment earnings 882,355 - 147,680 - 3,303 1,033,338Miscellaneous 2,006,747 250,012 - 9,638 94,567 2,360,964
175,328,000Total revenues 4,238,749 296,525 10,170,242 22,387,044 212,420,560
EXPENDITURESCurrent:
23,177,528 2,826,493 193,281 - 783,562 26,980,864General government37,803,772 69,520 - - 367,156 38,240,448Public safety
7,928,717 1,808,532 - - 9,269,226 19,006,475Community services5,017,088 - - 13,382,868 17,336,351 35,736,307Health and welfare
12,877,191 359,784 - - 89,045 13,326,020Parks, recreation and culture53,168,613 1,629,867 - - - 54,798,480Education
7,664,413 5,192,994 - - 387,446 13,244,853Conservation and developmentDebt service: Retirement of principal - - 7,140,323 - - 7,140,323 Interest - - 3,041,563 - - 3,041,563Capital outlay 2,089,092 10,209,265 - 23,624 1,009,771 13,331,752
149,726,414Total expenditures 22,096,455 10,375,167 13,406,492 29,242,557 224,847,085
Revenues over (under) expenditures 25,601,586 )(17,857,706 )(10,078,642 )(3,236,250 )(6,855,513 )(12,426,525
OTHER FINANCING SOURCES (USES)Transfers in (note 7) 6,344,655 9,265,627 11,003,348 3,236,250 6,870,258 36,720,138Transfers out (note 7) )(30,292,594 )(1,144,534 - - )(113,938 )(31,551,066Issuance of debt (note 9) - 9,520,000 - - - 9,520,000Premium on issuance of debt (note 9) - 1,126,606 - - - 1,126,606
)(23,947,939Total other financial sources (uses) 18,767,699 11,003,348 3,236,250 6,756,320 15,815,678
Net change in fund balance 1,653,647 909,993 924,706 - )(99,193 3,389,153
Fund Balance July 1, 2018 as restated 46,168,437 13,108,526 11,905,368 119,698 2,922,252 74,224,281
Fund Balance June 30, 2019 $ 47,822,084 $ 14,018,519 $ 12,830,074 $ 119,698 $ 2,823,059 $ 77,613,434
(continued)
42
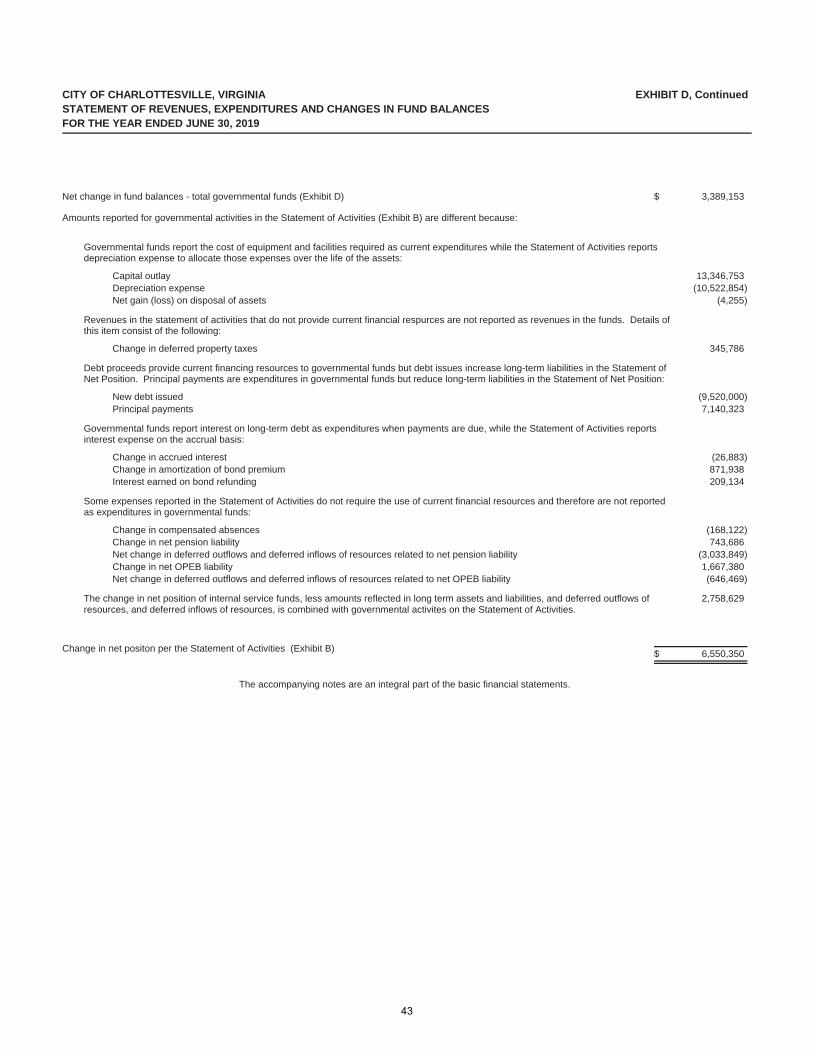
STATEMENT OF REVENUES, EXPENDITURES AND CHANGES IN FUND BALANCESCITY OF CHARLOTTESVILLE, VIRGINIA EXHIBIT D, Continued
FOR THE YEAR ENDED JUNE 30, 2019
Net change in fund balances - total governmental funds (Exhibit D) $ 3,389,153
Amounts reported for governmental activities in the Statement of Activities (Exhibit B) are different because:
Governmental funds report the cost of equipment and facilities required as current expenditures while the Statement of Activities reports depreciation expense to allocate those expenses over the life of the assets:
13,346,753Capital outlay)(10,522,854Depreciation expense)(4,255Net gain (loss) on disposal of assets
Revenues in the statement of activities that do not provide current financial respurces are not reported as revenues in the funds. Details of this item consist of the following:
345,786Change in deferred property taxes
Debt proceeds provide current financing resources to governmental funds but debt issues increase long-term liabilities in the Statement of Net Position. Principal payments are expenditures in governmental funds but reduce long-term liabilities in the Statement of Net Position:
)(9,520,000New debt issued7,140,323Principal payments
Governmental funds report interest on long-term debt as expenditures when payments are due, while the Statement of Activities reportsinterest expense on the accrual basis:
)(26,883Change in accrued interest871,938Change in amortization of bond premium209,134Interest earned on bond refunding
Some expenses reported in the Statement of Activities do not require the use of current financial resources and therefore are not reported as expenditures in governmental funds:
)(168,122Change in compensated absences743,686Change in net pension liability
)(3,033,849Net change in deferred outflows and deferred inflows of resources related to net pension liability1,667,380Change in net OPEB liability
)(646,469Net change in deferred outflows and deferred inflows of resources related to net OPEB liability
The change in net position of internal service funds, less amounts reflected in long term assets and liabilities, and deferred outflows of resources, and deferred inflows of resources, is combined with governmental activites on the Statement of Activities.
2,758,629
Change in net positon per the Statement of Activities (Exhibit B)$ 6,550,350
The accompanying notes are an integral part of the basic financial statements.
43
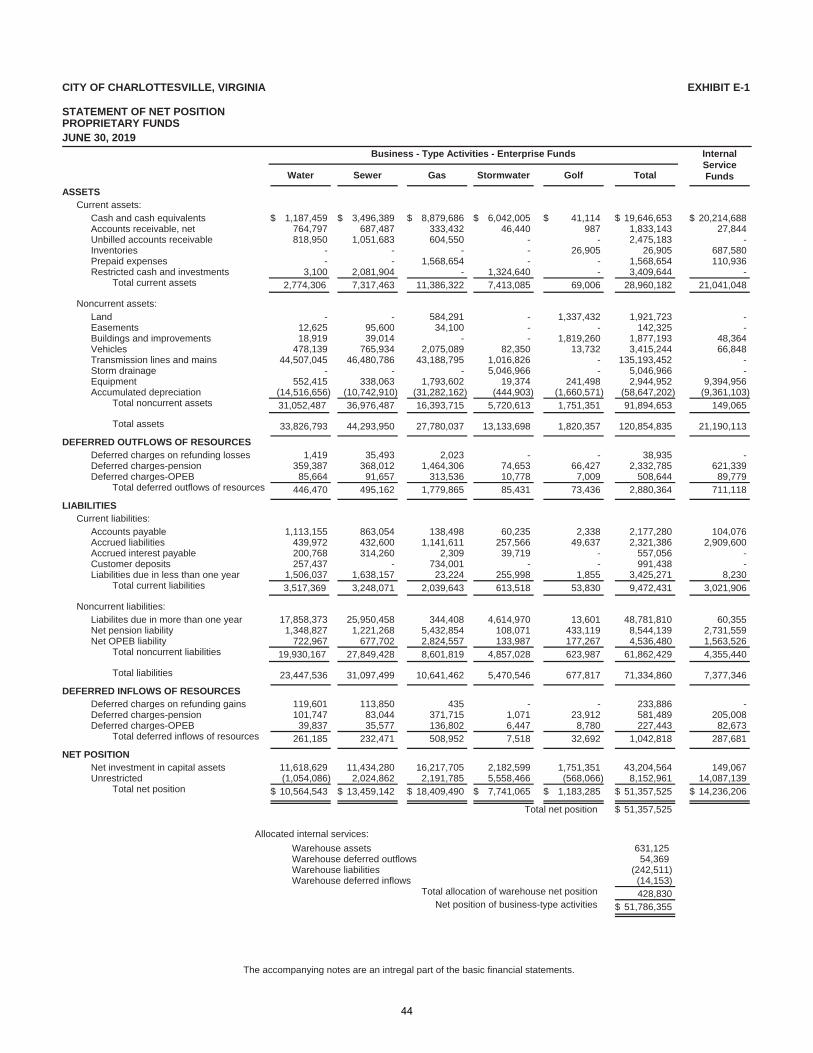
CITY OF CHARLOTTESVILLE, VIRGINIA
STATEMENT OF NET POSITION PROPRIETARY FUNDSJUNE 30, 2019
EXHIBIT E-1
Water Sewer Gas Stormwater Golf Total
InternalServiceFunds
Business - Type Activities - Enterprise Funds
ASSETSCurrent assets:
Cash and cash equivalents $ 1,187,459 $ 19,646,653$ 3,496,389 $ 8,879,686 $ 6,042,005 $ 41,114 $ 20,214,688Accounts receivable, net 764,797 1,833,143687,487 333,432 46,440 987 27,844Unbilled accounts receivable 818,950 2,475,1831,051,683 604,550 - - -Inventories - 26,905- - - 26,905 687,580Prepaid expenses - 1,568,654- 1,568,654 - - 110,936Restricted cash and investments 3,100 3,409,6442,081,904 - 1,324,640 - -
2,774,306Total current assets 28,960,1827,317,463 11,386,322 7,413,085 69,006 21,041,048
Noncurrent assets:Land - 1,921,723- 584,291 - 1,337,432 -Easements 12,625 142,32595,600 34,100 - - -Buildings and improvements 18,919 1,877,19339,014 - - 1,819,260 48,364Vehicles 478,139 3,415,244765,934 2,075,089 82,350 13,732 66,848Transmission lines and mains 44,507,045 135,193,45246,480,786 43,188,795 1,016,826 - -Storm drainage - 5,046,966- - 5,046,966 - -Equipment 552,415 2,944,952338,063 1,793,602 19,374 241,498 9,394,956Accumulated depreciation )(14,516,656 )(58,647,202)(10,742,910 )(31,282,162 )(444,903 )(1,660,571 )(9,361,103
31,052,487Total noncurrent assets 91,894,65336,976,487 16,393,715 5,720,613 1,751,351 149,065
33,826,793 120,854,835Total assets 44,293,950 27,780,037 13,133,698 21,190,1131,820,357
DEFERRED OUTFLOWS OF RESOURCESDeferred charges on refunding losses 1,419 38,93535,493 2,023 - - -Deferred charges-pension 359,387 2,332,785368,012 1,464,306 74,653 66,427 621,339Deferred charges-OPEB 85,664 508,64491,657 313,536 10,778 7,009 89,779
446,470 2,880,364Total deferred outflows of resources 495,162 1,779,865 85,431 711,11873,436
LIABILITIESCurrent liabilities:
Accounts payable 1,113,155 2,177,280863,054 138,498 60,235 2,338 104,076Accrued liabilities 439,972 2,321,386432,600 1,141,611 257,566 49,637 2,909,600Accrued interest payable 200,768 557,056314,260 2,309 39,719 - -Customer deposits 257,437 991,438- 734,001 - - -Liabilities due in less than one year 1,506,037 3,425,2711,638,157 23,224 255,998 1,855 8,230
3,517,369Total current liabilities 9,472,4313,248,071 2,039,643 613,518 53,830 3,021,906
Noncurrent liabilities:Liabilites due in more than one year 17,858,373 48,781,81025,950,458 344,408 4,614,970 13,601 60,355Net pension liability 1,348,827 8,544,1391,221,268 5,432,854 108,071 433,119 2,731,559Net OPEB liability 722,967 4,536,480677,702 2,824,557 133,987 177,267 1,563,526
19,930,167Total noncurrent liabilities 61,862,42927,849,428 8,601,819 4,857,028 623,987 4,355,440
23,447,536 71,334,860Total liabilities 31,097,499 10,641,462 5,470,546 7,377,346677,817
DEFERRED INFLOWS OF RESOURCESDeferred charges on refunding gains 119,601 233,886113,850 435 - - -Deferred charges-pension 101,747 581,48983,044 371,715 1,071 23,912 205,008Deferred charges-OPEB 39,837 227,44335,577 136,802 6,447 8,780 82,673
261,185 1,042,818Total deferred inflows of resources 232,471 508,952 7,518 287,68132,692
NET POSITIONNet investment in capital assets 11,618,629 43,204,56411,434,280 16,217,705 2,182,599 1,751,351 149,067Unrestricted )(1,054,086 8,152,9612,024,862 2,191,785 5,558,466 )(568,066 14,087,139
$ 10,564,543 $ 51,357,525Total net position $ 13,459,142 $ 18,409,490 $ 7,741,065 $ 14,236,206$ 1,183,285
Total net position $ 51,357,525
Allocated internal services:
Warehouse assets 631,125Warehouse deferred outflows 54,369Warehouse liabilities )(242,511Warehouse deferred inflows )(14,153
Total allocation of warehouse net position 428,830Net position of business-type activities $ 51,786,355
The accompanying notes are an intregal part of the basic financial statements.
44
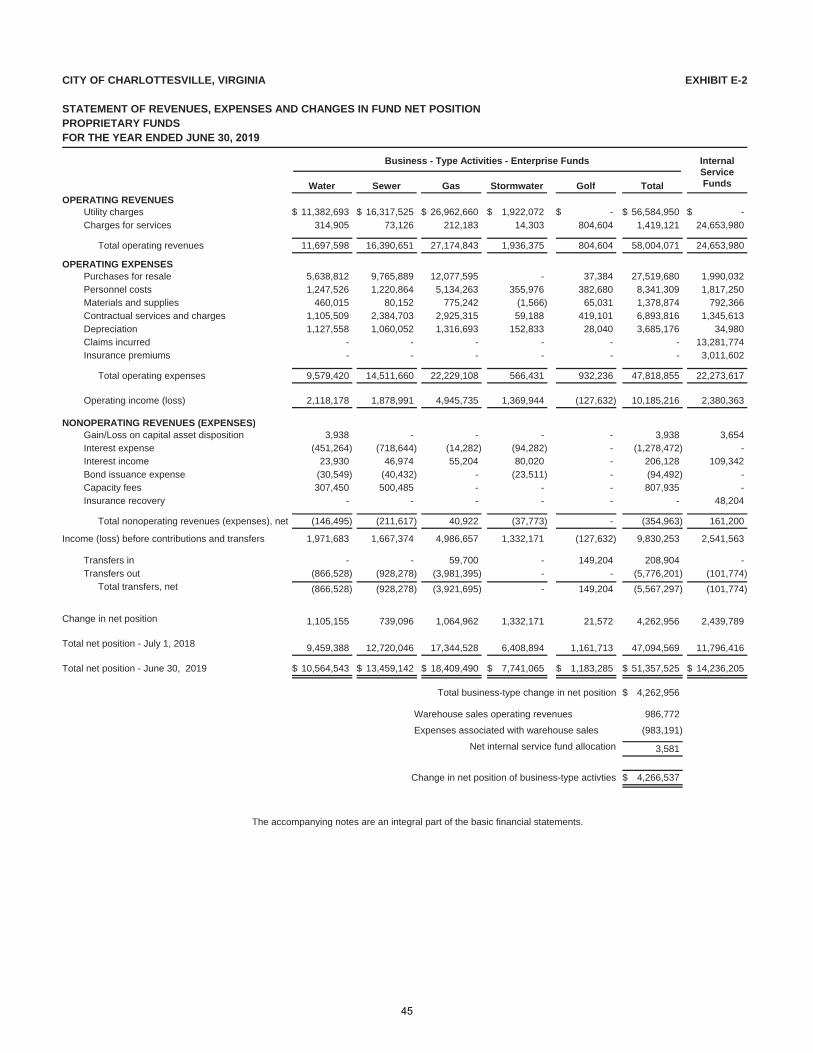
CITY OF CHARLOTTESVILLE, VIRGINIA
STATEMENT OF REVENUES, EXPENSES AND CHANGES IN FUND NET POSITION PROPRIETARY FUNDSFOR THE YEAR ENDED JUNE 30, 2019
EXHIBIT E-2
Water Sewer Gas Stormwater Golf Total
InternalServiceFunds
Business - Type Activities - Enterprise Funds
OPERATING REVENUESUtility charges $ 11,382,693 $ 16,317,525 $ 26,962,660 $ 1,922,072 $ - $ 56,584,950 $ -Charges for services 314,905 73,126 212,183 14,303 804,604 1,419,121 24,653,980
Total operating revenues 11,697,598 16,390,651 27,174,843 1,936,375 804,604 58,004,071 24,653,980
OPERATING EXPENSESPurchases for resale 5,638,812 9,765,889 12,077,595 - 37,384 27,519,680 1,990,032Personnel costs 1,247,526 1,220,864 5,134,263 355,976 382,680 8,341,309 1,817,250Materials and supplies 460,015 80,152 775,242 )(1,566 65,031 1,378,874 792,366Contractual services and charges 1,105,509 2,384,703 2,925,315 59,188 419,101 6,893,816 1,345,613Depreciation 1,127,558 1,060,052 1,316,693 152,833 28,040 3,685,176 34,980Claims incurred - - - - - - 13,281,774Insurance premiums - - - - - - 3,011,602
Total operating expenses 9,579,420 14,511,660 22,229,108 566,431 932,236 47,818,855 22,273,617
Operating income (loss) 2,118,178 1,878,991 4,945,735 1,369,944 )(127,632 10,185,216 2,380,363
NONOPERATING REVENUES (EXPENSES)Gain/Loss on capital asset disposition 3,938 - - - - 3,938 3,654Interest expense )(451,264 )(718,644 )(14,282 )(94,282 - )(1,278,472 -Interest income 23,930 46,974 55,204 80,020 - 206,128 109,342Bond issuance expense )(30,549 )(40,432 - )(23,511 - )(94,492 -Capacity fees 307,450 500,485 - - - 807,935 -Insurance recovery - - - - - - 48,204
Total nonoperating revenues (expenses), net )(146,495 )(211,617 40,922 )(37,773 - )(354,963 161,200
Income (loss) before contributions and transfers 1,971,683 1,667,374 1,332,1714,986,657 )(127,632 9,830,253 2,541,563
Transfers in - - 59,700 - 149,204 208,904 -Transfers out )(866,528 )(928,278 )(3,981,395 - - )(5,776,201 )(101,774
Total transfers, net )(928,278 - 149,204 )(5,567,297)(866,528 )(101,774)(3,921,695
Change in net position 1,105,155 739,096 1,064,962 1,332,171 21,572 4,262,956 2,439,789
Total net position - July 1, 2018 9,459,388 12,720,046 17,344,528 6,408,894 1,161,713 47,094,569 11,796,416
Total net position - June 30, 2019 $ 10,564,543 $ 13,459,142 $ 18,409,490 $ 7,741,065 $ 1,183,285 $ 51,357,525 $ 14,236,205
$ 4,262,956Total business-type change in net position
986,772Warehouse sales operating revenues
)(983,191Expenses associated with warehouse sales
3,581Net internal service fund allocation
$ 4,266,537Change in net position of business-type activties
The accompanying notes are an integral part of the basic financial statements.
45
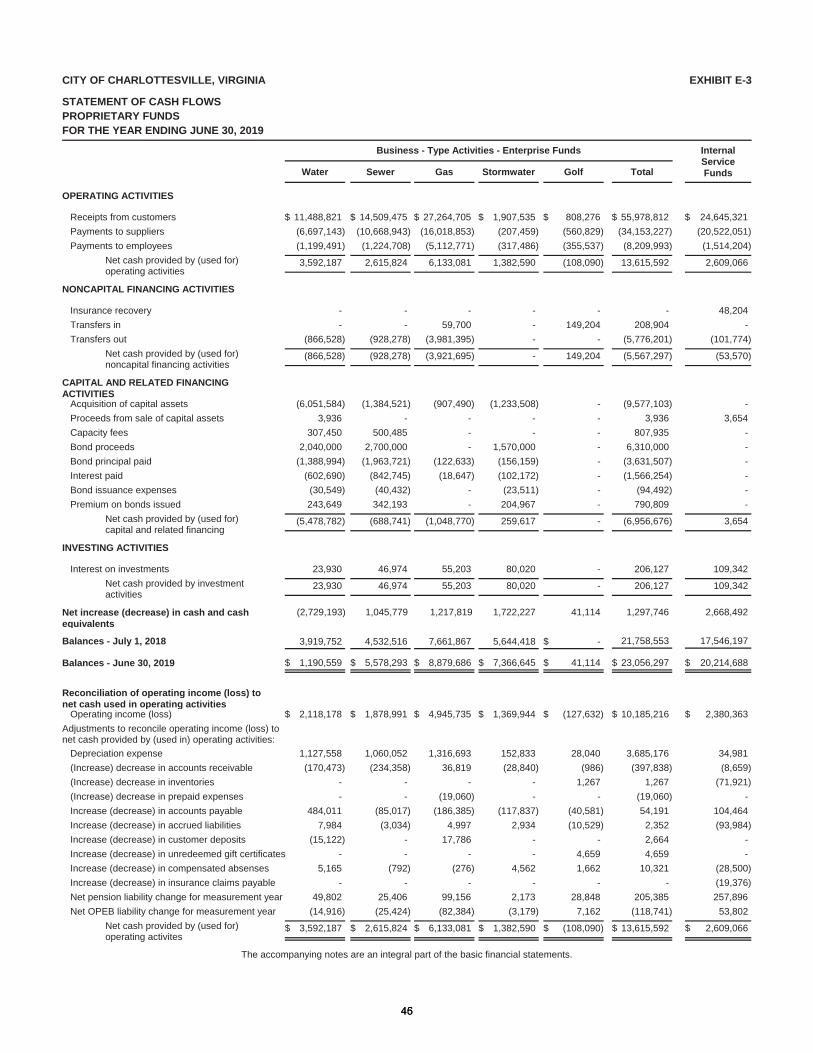
CITY OF CHARLOTTESVILLE, VIRGINIA
STATEMENT OF CASH FLOWSPROPRIETARY FUNDSFOR THE YEAR ENDING JUNE 30, 2019
EXHIBIT E-3
Water Sewer Gas Stormwater Golf Total
InternalServiceFunds
Business - Type Activities - Enterprise Funds
OPERATING ACTIVITIES
Receipts from customers $ 11,488,821 $ 14,509,475 $ 27,264,705 $ 1,907,535 $ 808,276 $ 55,978,812 $ 24,645,321
Payments to suppliers )(6,697,143 )(10,668,943 )(16,018,853 )(207,459 )(560,829 )(34,153,227 )(20,522,051
Payments to employees )(1,199,491 )(1,224,708 )(5,112,771 )(317,486 )(355,537 )(8,209,993 )(1,514,204
Net cash provided by (used for) operating activities
3,592,187 2,615,824 6,133,081 1,382,590 )(108,090 13,615,592 2,609,066
NONCAPITAL FINANCING ACTIVITIES
Insurance recovery - - - - - - 48,204
Transfers in - - 59,700 - 149,204 208,904 -
Transfers out )(866,528 )(928,278 )(3,981,395 - - )(5,776,201 )(101,774
Net cash provided by (used for) noncapital financing activities
)(866,528 )(928,278 )(3,921,695 - 149,204 )(5,567,297 )(53,570
CAPITAL AND RELATED FINANCING ACTIVITIES
Acquisition of capital assets )(6,051,584 )(1,384,521 )(907,490 )(1,233,508 - )(9,577,103 -
Proceeds from sale of capital assets 3,936 - - - - 3,936 3,654
Capacity fees 307,450 500,485 - - - 807,935 -
Bond proceeds 2,040,000 2,700,000 - 1,570,000 - 6,310,000 -
Bond principal paid )(1,388,994 )(1,963,721 )(122,633 )(156,159 - )(3,631,507 -
Interest paid )(602,690 )(842,745 )(18,647 )(102,172 - )(1,566,254 -
Bond issuance expenses )(30,549 )(40,432 - )(23,511 - )(94,492 -
Premium on bonds issued 243,649 342,193 - 204,967 - 790,809 -
Net cash provided by (used for) capital and related financing
)(5,478,782 )(688,741 )(1,048,770 259,617 - )(6,956,676 3,654
INVESTING ACTIVITIES
Interest on investments 23,930 46,974 55,203 80,020 - 206,127 109,342
Net cash provided by investment activities
23,930 46,974 55,203 80,020 - 206,127 109,342
Net increase (decrease) in cash and cash equivalents
)(2,729,193 1,045,779 1,217,819 1,722,227 41,114 1,297,746 2,668,492
Balances - July 1, 2018 3,919,752 4,532,516 7,661,867 5,644,418 $ - 21,758,553 17,546,197
Balances - June 30, 2019 $ 1,190,559 $ 5,578,293 $ 8,879,686 $ 7,366,645 $ 41,114 $ 23,056,297 $ 20,214,688
Reconciliation of operating income (loss) to net cash used in operating activities
Operating income (loss) $ 2,118,178 $ 1,878,991 $ 4,945,735 $ 1,369,944 $ )(127,632 $ 10,185,216 $ 2,380,363
Adjustments to reconcile operating income (loss) to net cash provided by (used in) operating activities:
Depreciation expense 1,127,558 1,060,052 1,316,693 152,833 28,040 3,685,176 34,981
(Increase) decrease in accounts receivable )(170,473 )(234,358 36,819 )(28,840 )(986 )(397,838 )(8,659
(Increase) decrease in inventories - - - - 1,267 1,267 )(71,921
(Increase) decrease in prepaid expenses - - )(19,060 - - )(19,060 -
Increase (decrease) in accounts payable 484,011 )(85,017 )(186,385 )(117,837 )(40,581 54,191 104,464
Increase (decrease) in accrued liabilities 7,984 )(3,034 4,997 2,934 )(10,529 2,352 )(93,984
Increase (decrease) in customer deposits )(15,122 - 17,786 - - 2,664 -
Increase (decrease) in unredeemed gift certificates - - - - 4,659 4,659 -
Increase (decrease) in compensated absenses 5,165 )(792 )(276 4,562 1,662 10,321 )(28,500
Increase (decrease) in insurance claims payable - - - - - - )(19,376
Net pension liability change for measurement year 49,802 25,406 99,156 2,173 28,848 205,385 257,896
Net OPEB liability change for measurement year )(14,916 )(25,424 )(82,384 )(3,179 7,162 )(118,741 53,802
Net cash provided by (used for) operating activites
$ 3,592,187 $ 2,615,824 $ 6,133,081 $ 1,382,590 $ )(108,090 $ 13,615,592 $ 2,609,066
The accompanying notes are an integral part of the basic financial statements.
4546
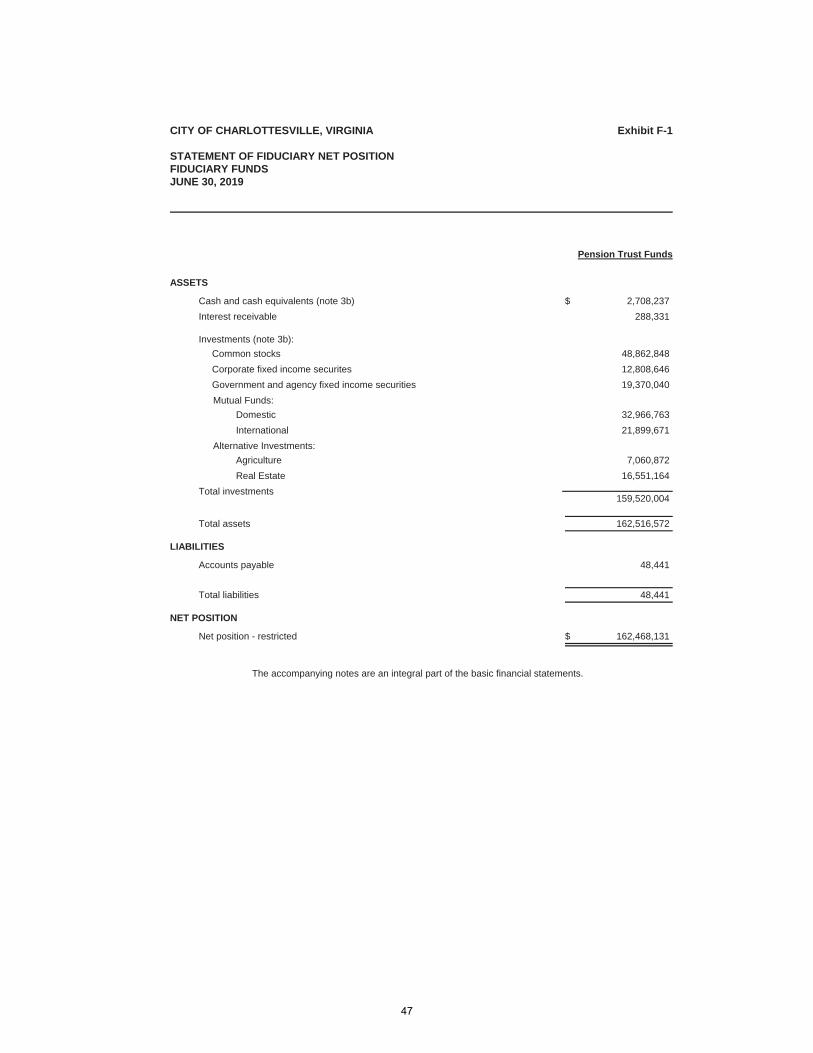
CITY OF CHARLOTTESVILLE, VIRGINIA
STATEMENT OF FIDUCIARY NET POSITIONFIDUCIARY FUNDSJUNE 30, 2019
Exhibit F-1
Pension Trust Funds
ASSETS
Cash and cash equivalents (note 3b) $ 2,708,237
Interest receivable 288,331
Investments (note 3b):
Common stocks 48,862,848
Corporate fixed income securites 12,808,646
Government and agency fixed income securities 19,370,040
Mutual Funds:
Domestic 32,966,763
International 21,899,671
Alternative Investments:
Agriculture 7,060,872
Real Estate 16,551,164
159,520,004Total investments
Total assets 162,516,572
LIABILITIES
Accounts payable 48,441
Total liabilities 48,441
NET POSITION
Net position - restricted $ 162,468,131
The accompanying notes are an integral part of the basic financial statements.
47
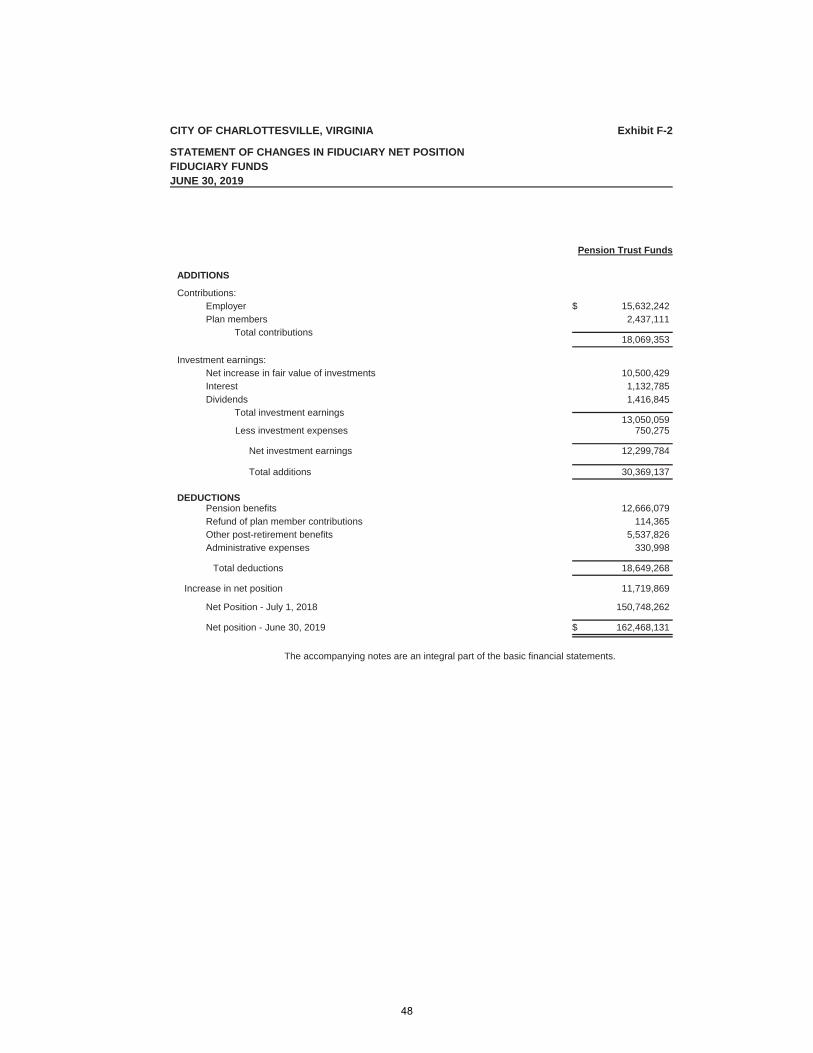
CITY OF CHARLOTTESVILLE, VIRGINIA
STATEMENT OF CHANGES IN FIDUCIARY NET POSITIONFIDUCIARY FUNDS
Exhibit F-2
JUNE 30, 2019
Pension Trust Funds
ADDITIONS
Contributions:$ 15,632,242Employer
2,437,111Plan membersTotal contributions
18,069,353
Investment earnings:10,500,429Net increase in fair value of investments
1,132,785Interest1,416,845Dividends
Total investment earnings13,050,059
750,275 Less investment expenses
Net investment earnings 12,299,784
Total additions 30,369,137
DEDUCTIONS12,666,079Pension benefits
114,365Refund of plan member contributions5,537,826Other post-retirement benefits
330,998Administrative expenses
Total deductions 18,649,268
Increase in net position 11,719,869
150,748,262Net Position - July 1, 2018
Net position - June 30, 2019 $ 162,468,131
The accompanying notes are an integral part of the basic financial statements.
48
CITY OF CHARLOTTESVILLE, VIRGINIA NOTES TO THE FINANCIAL STATEMENTS FOR THE YEAR ENDED JUNE 30, 2019
1. SUMMARY OF SIGNIFICANT ACCOUNTING POLICIES
(a) Description of government-wide financial statements
The government-wide financial statements (i.e., the statement of net position and the statement of activities) report information on all of the nonfiduciary activities of the primary government and its component units. All fiduciary activities are reported only in the fund financial statements. Governmental activities, which normally are supported by taxes, intergovernmental revenues, and other nonexchange transactions, are reported separately from business-type activities, which rely to a significant extent on fees and charges to external customers for support. Likewise, the primary government is reported separately from certain legally separated component units for which the primary government is financially accountable.
(b) Reporting entity
The City of Charlottesville, Virginia (the City) is a political subdivision of the Commonwealth of Virginia operating under the Council-Manager form of government. The Council consists of five members elected at large. The mayor is then selected among the Council members. The Council is responsible for appointing the City Manager. The City has taxing powers subject to statewide restrictions and tax limits. The accompanying financial statements include all activities of the City, such as general operations and support services for which the government is considered to be financially accountable. The component units discussed below are included in the City Reporting Entity because the City appoints a majority of the CEDA board members, approves the budgetary request of the School Board and provides a significant amount of funding for each of these entities.
Discretely presented component units. The component unit columns in the government-wide financial statements include the financial data of the City’s two component units. Each is presented in a separate column to emphasize that these units are legally separate from the City and each represents a functionally independent operation. These component units are fiscally dependent on the City and provide services primarily to the citizens of Charlottesville. A description of the discretely presented component units follows:
(i) School Board: The City provides education through its own school system administered by the CharlottesvilleSchool Board (the School Board). The School Board has been classified as a discretely presented componentunit in the financial reporting entity because it is legally separate but financially dependent. The City Counciladministers the School Board’s appropriation of funds at the category level, approves transfers betweencategories, and authorizes school debt. School Board members are elected. Financial statements of the SchoolBoard are included in a discretely presented component unit column and/or row of the government-widefinancial statements, as well as in the supplementary information section. The School Board does not issueseparate financial statements.
(ii) Economic Development Authority: The Charlottesville Economic Development Authority (the CEDA) wasestablished to promote industry and develop trade by inducing manufacturing, industrial, and commercialenterprises to locate or remain in the City. City Council appoints the seven board members of the CEDA. Bystatute, the CEDA has the power to cause the issuance of tax-exempt industrial revenue bonds to qualifyingenterprises wishing to utilize that form of financing. The City is involved in the day-to-day operations of theCEDA the determination of its operating budget and annual service fee rates. Financial statements of the CEDAare included in a discretely presented component unit column and/or row of the government-wide financialstatements. Complete audited financial statements of the CEDA can be obtained from the Office of EconomicDevelopment, City of Charlottesville, PO Box 911, Charlottesville, VA 22902 or Room B230 at City Hall.
49
(c) Basis of presentation – government-wide financial statements
While separate government-wide and fund financial statements are presented, they are inter-related. The governmental activities column incorporates data from governmental funds and internal service funds, while business-type activities incorporate data from the government’s enterprise funds. Separate financial statements are provided for governmental funds, proprietary funds, and fiduciary funds, even though the latter are excluded from the government-wide financial statements.
As a general rule, the effect of interfund activity has been eliminated from the government-wide financial statements. Exceptions to this general rule are payments in lieu of taxes where the amounts are reasonably equivalent in value to the interfund services provided and other charges between the government’s water, wastewater, and gas functions and various other functions of the government. Elimination of these charges would distort the direct costs and program revenue for the various functions concerned.
The Statement of Net Position is designed to display the financial position of the primary government (governmental and business-type activities) and its discretely presented component units. The City reports investment in capital assets net of depreciation, including infrastructure, in the Statement of Net Position. Depreciation expense, the cost of “using up” capital assets, is included in the Statement of Activities. Noncurrent liabilities including bonds, net pension liability, notes and loans payable are included, separated into due within one year and due in more than one year. The net position of the City is reported in three categories – 1) net investment in capital assets; 2) restricted; and 3) unrestricted.
The Statement of Activities reports expenses before revenues of the primary government (governmental and business-type activities) and its discretely presented component units. This order emphasizes that governments identify the service needs of citizens and then raise the resources needed to meet those needs. This presentation demonstrates the degree to which direct expenses of a clearly identifiable function or segment are reduced by program revenues associated with that function or segment. Program revenues include 1) charges to customers or applicants who purchase, use, or directly benefit from goods, services, or privileges provided by a given program and 2) grants and contributions that are restricted to meeting the operational or capital requirements of a program. All taxes and other items not included among program revenues, are reported instead as general revenues.
(d) Basis of presentation – fund financial statements
The fund financial statements provide information about the government’s funds, including its fiduciary funds. Separate statements for each fund category – governmental, proprietary, and fiduciary – are presented. The emphasis of fund financial statements is on major governmental and enterprise funds, each displayed in a separate column. All remaining governmental and enterprise funds are aggregated and reported as nonmajor funds. Major individual governmental and enterprise funds are reported as separate columns in the fund financial statements.
The City reports the following major governmental funds:
The General Fund is used to account for and report all of the financial resources except for those not accounted for and reported in another fund. It is the City’s primary operating fund. Revenues are derived primarily from property and other local taxes, state (including pass through of federal funds), federal distributions, licenses, permits, charges for services, fees, Albemarle County Revenue Sharing and other revenue sources. A significant portion of the General Fund’s revenue is transferred to other funds and the Charlottesville School Board, (a component unit), to finance operations.
The Capital Projects Fund is used to account for and report financial resources that are restricted, committed or assigned to expenditures for capital outlays, including the acquisition or construction of capital facilities and other capital assets. Revenues for this fund are obtained from bond issues, a transfer from the General Fund, federal and state highway funds, PEG fee revenue and contributions from Charlottesville School Board and other local governments for shared facilities.
The Debt Service Fund is used to account for and report all financial resources that are restricted, committed, or assigned to expenditures for principal and interest. Payments are made on long-term general obligation debt of governmental funds including bonds, notes and other evidence of indebtedness and the cost of issuance of debt issued by the City.
50
The Social Services Fund, which is a special revenue fund, accounts for the financial resources associated with the Charlottesville Department of Social Services (CDSS). Social Services provides state and federal income support, employment assistance and social work service programs to alleviate poverty and other social problems.
Proprietary funds, all of which are considered major funds, are used to account for and report on their activities using the flow of economic resources measurement focus and the accrual basis of accounting. Under this method, revenues are recorded when earned and expenses are recorded at the time liabilities are incurred. The purpose of a proprietary fund is to provide a service or product to the public or other governmental entities at a reasonable cost. The City reports the following enterprise funds as proprietary fund types:
The Water Fund accounts for the operations of the City’s water distribution system. The Sewer Fund accounts for the operations of the City’s wastewater collection system. The Gas Fund accounts for the operations of the City’s natural gas distribution system. The Stormwater Fund accounts for the operations of the City’s waterways. The Golf Course Fund accounts for the operations of the City’s 18-hole municipal golf course.
The Fiduciary Fund accounts for the activities for the two pension trust funds for retirement and postemployment benefits. The trust funds accumulate resources for pension payments and benefits for qualified city employees. Fiduciary funds cannot be used to finance the City’s operating programs and are not included in the government-wide financial statements.
Additionally, the City reports the following fund types:
Special Revenue Funds are nonmajor governmental funds used to account and report the proceeds of specific revenue sources that are restricted, committed or assigned to expenditures for specified purposes other than debt service or capital projects. The City has established special revenue funds to account for the Community Development Block Grant, Human Services Programs, Children’s Services Act (formerly Comprehensive Services Act), Virginia Juvenile Community Crime Control Act, Charlottesville Area Transit operations and various other grants to support projects undertaken. Cemetery perpetual care is included, which is a permanent fund.
Internal Service Funds are used to account for and report the financing of goods and services provided by one department primarily or solely to other departments of the City. Information Technology, Risk Management, Warehouse and Departmental Services are accounted for and reported as Internal Service Funds. In the government-wide Statement of Net Position, the assets and liabilities of these funds are allocated to both governmental and business-type activities, based on the predominate use of the fund’s services. Specifically, the assets and liabilities of the Warehouse Internal Service Fund are allocated completely to the City's Enterprise Funds based on predominate usage. The remaining Internal Service Fund balances are allocated to governmental activities. In the government-wide Statement of Activities, certain transactions are assigned directly to governmental activities and the remaining net income or loss is allocated to both governmental and business-type activities, based on actual charges for services.
During the course of operations the government has activity between funds for various purposes. Any residual balances outstanding at year end are reported as due from/to other funds. While these balances are reported in fund financial statements, certain eliminations are made in the preparation of the government-wide financial statements. Balances between the funds included in governmental activities (i.e., the governmental and internal service funds) are eliminated so that only the net amount is included in the governmental activities column. Similarly, balances between funds included in business-type activities (i.e., the enterprise funds) are eliminated so that only the net amount is included in the business-type activities column.
Further, certain activities occur during the year involving transfers of resources between funds. In fund financial statements these amounts are reported at gross amounts as transfers in/out. While reported in fund financial statements, certain eliminations are made in the preparation of the government-wide financial statements. Transfers between the funds included in governmental activities are eliminated so that only the net amount is included as transfers in the governmental column. Similarly, balances between the funds included in business-type activities are eliminated so that only the net amount is included as transfers in the business-type activities column.
51
(e) Measurement focus and basis of accounting
The accounting and financial reporting treatment is determined by the applicable measurement focus and basis of accounting. Measurement focus indicates the type of resources being measured such as current financial resources or economic resources. The basis of accounting indicates the timing of transactions or events for recognition in the financial statements.
The government-wide financial statements are reported using the economic resources measurement focus and the accrual basis of accounting. Revenues are recorded as earned and expenses are recorded when a liability is incurred, regardless of the timing of the related cash flows. Property taxes are recognized as revenues in the year for which they are levied. Grants and similar items are recognized as revenue as soon as all eligibility requirements imposed by the provider have been met.
In applying the susceptible to accrual concept to intergovernmental revenues, the legal and contractual requirements of the numerous individual programs are used as guidance. There are, however, essentially two types of intergovernmental revenues. In the first type, monies must be expended on the specific purpose or project before any amounts will be paid to the City; therefore, revenues are recognized based upon when the expenditures are recorded. In the second type, monies are virtually unrestricted as to time of expenditure and are usually revocable only for failure to comply with prescribed compliance requirements. These resources are reflected as revenues at the time of receipt or earlier if the accrual criteria are met.
The governmental fund financial statements are reported using the current financial resources measurement focus and the modified accrual basis of accounting. Revenues are recognized as soon as they are measurable and available. Revenues are considered to be available when they are collectible within the current period or soon enough thereafter to pay liabilities of the current period. For this purpose, the City considers revenues to be available if they are collected within 45 days of the end of the current fiscal period. Expenditures generally are recorded when a liability is incurred, as under accrual accounting. However, debt service expenditures, as well as expenditures related to compensated absences, and claims and judgments, are recorded only when payment is due. General capital asset acquisitions are reported as capital outlay in governmental funds. Issuance of long-term debt and acquisitions under capital leases are reported as other financing sources. A summary reconciliation of the difference between total fund balances as reflected on the governmental funds balance sheet and total net position for governmental activities as shown on the government-wide Statement of Net Position and the government-wide Statement of Activities is presented in a schedule accompanying the governmental fund Balance Sheet and the Statement of Revenues, Expenditures and Changes in Fund Balance, respectively. These differences stem from governmental statements using a different measurement focus than government-wide statements.
In the fund financial statements, financial transactions and accounts of the City are organized on the basis of funds, the operation of which are accounted for with a separate set of self-balancing accounts that comprise its assets, deferred inflows, liabilities, deferred inflows, fund balance, revenues and expenditures (or expenses for proprietary funds), as appropriate.
Property taxes, sales taxes, franchise taxes, licenses and interest associated with the current fiscal period are all considered to be susceptible to accrual and so have been recognized as revenues of the current fiscal period. In applying the susceptible to accrual concept to intergovernmental revenues, the legal and contractual requirements of the numerous individual programs are used as guidance. Entitlements are recorded as revenues when all eligibility requirements are met, including any time requirements, and the amount is received during the period or within the availability period for this revenue source (within 45 days of year-end). Expenditure-driven grants are recognized as revenue when the qualifying expenditures have been incurred and all other eligibility requirements have been met. All other revenue items are considered to be measurable and available only when cash is received by the City.
The proprietary and pension trust funds are reported using the economic resources measurement focus and the accrual basis of accounting.
52
(f) Cash, cash equivalents and investments
Cash and cash equivalents are considered to be cash on hand, demand deposits, money market mutual funds and certificates of deposit with original maturities of twelve months or less from date of acquisition. Investments are reported at fair value (generally based on quoted market prices) or the net asset value per share.
(g) Allowance for uncollectible accounts
The City calculates its allowances for uncollectible accounts using historical collection data and, in certain cases, specific account analysis. At June 30, 2019, the allowances approximated $1,098,223 in the General Fund, $1,134,616 in the Proprietary Funds ($229,623, $326,025, $25,866, and $553,102) for the Water, Sewer, Stormwater and Gas Funds, respectively, and $3,609,401 in the Capital Projects Fund.
(h) Inventory of supplies and prepaid items
Inventories are valued at cost using the weighted average method. Inventories consist of expendable materials and supplies held for future consumption. They are accounted for by the consumption method. Certain payments to vendors reflect costs applicable to future accounting periods and are recorded as prepaid items in government-wide financial statements.
(i) Capital assets
Capital assets, which include property, plant, equipment, and infrastructure assets (e.g., streets and bridges,) are reported in the applicable governmental or business-type activities columns in the government-wide financial statements. All infrastructures has been inventoried, valued and included in the basic financial statements. Capital assets are defined as assets with an initial, individual cost of $5,000 or more and an estimated useful life of at least two years. All capital assets are valued at historical cost or estimated historical cost if actual cost was not available. Donated capital assets are valued at their acquisition cost on the date donated.
The costs of normal maintenance and repairs that do not add to the value of the asset or materially extend assets lives are not capitalized. Major outlays for capital assets and improvements are capitalized as projects are constructed.
Capital assets of the primary government, as well as the component units, are depreciated using the straight-line method over the following estimated useful lives:
Assets Years
Building/building improvements 40-50 Streets and bridges 30-50
Infrastructure (storm structures and storm pipe) 50-75Utility transmission lines and mains 20-40Furniture and equipment 5-10
Vehicles 5-7
(j) Deferred outflows/inflow of resources
In addition to assets, the Statement of Net Positon will sometimes report a separate section for deferred outflows of resources. This separate financial statement element, deferred outflows of resources, represents a consumption of net position that applies to a future period(s) and so will not be recognized as an outflow of resources (expense/expenditures) until then.
In addition to liabilities, the Statement of Net Position will report a separate section for deferred inflows of resources. This separate financial statement element, deferred inflows of resources, represents an acquisition of net position that applies to a future period(s) and so will not be recognized as an inflow of resources (revenue) until that time.
Included as both an outflow and inflow are deferred charges on refunding reported in the government-wide Statement of Net Position. A deferred charge on refunding results from the difference in the carrying value of refunded debt and its reacquisition price. This amount is deferred and amortized over the shorter life of the refunded or refunding debt.
53
Unavailable tax revenues are included on both the Statement of Net Position and the Balance Sheet as deferred outflow of resources. General property taxes levies assessed each year as of January 1 on the estimated market value of property are due in equal semiannual payments due June 5 and December 5. The deferred tax revenues represent payments due on December 5.
Pension and OPEB plan changes for measurement date June 30, 2018 are presented on the Statement of Net Position. Actuarially determined deferred outflows of resources include changes in the expected and actual experience, along with changes in expected and actual investment earnings, change in proportion on beginning net pension liability, changes in proportions and difference between employer contribution and proportionate share of contributions, and changes in assumptions. Deferred inflows of resources consists of the current year’s amortization, actuarially determined changes in proportion on beginning net pension liability, and changes in proportion between employer contribution and proportionate share of contributions.
(k) Compensated absences
City employees are granted vacation and sick leave in varying amounts as services are provided. Employees may accumulate, subject to certain limitations, unused vacation and sick leave earned. Vacation leave can be accrued up to the amount earned in one year, plus an additional week. Upon retirement, termination or death, employees may be compensated for certain amounts of unused vacation leave earned at their then current rates of pay. All vacation pay is accrued when incurred in the government-wide and proprietary fund financial statements. In addition, unused sick leave becomes credited service for pension benefit calculations, for one-half of the accumulated amount, up to a maximum of two thousand hours.
School Board employees also earn vacation and sick leave as services are provided. At June 30, 2015, the methodology for calculating the unused sick leave payable at retirement changed from the assumption that employees would resign before retirement to the assumption that employees would stay until eligible for retirement.
Sick leave earned but not taken by City and School Board employees at June 30, 2019, was $13,628,793 and $14,134,066 respectively. Upon retirement, no cash payments are made for sick leave. Therefore, an accrued balance is not recorded in the financial statements.
(l) Risk management
The City is exposed to various risks of loss related to torts; errors and omissions; injuries to and illnesses of employees; theft of, damage to, and destruction of assets; and natural disasters. The City employs a variety of risk management techniques, including the purchase of commercial insurance, participation in insurance pools and self-insurance. All funds of the City participate in the risk program and make payments to the Risk Management Internal Service Fund in a manner that is appropriate in allocating the costs associated with the risk involved. Claims, including incurred but not reported (IBNR) claims, are recognized as expense when incurred. There have been no significant changes in coverage from the prior year, nor have settlements exceeded coverage in the past five fiscal years.
(m) Encumbrances
Encumbrances are used to control expenditure commitments for the year and to enhance cash management. Accounting for encumbrances is employed in all governmental funds. Encumbrances (e.g., purchase orders) outstanding at year end are reported as assigned fund balance and do not constitute expenditures or liabilities, but are obligations that will be paid in a following year.
(n) Pensions and other post-employment benefits (OPEB)
For purposes of measuring the net pension and OPEB liability, deferred outflows of resources and deferred inflows of resources related to pensions and OPEB, pension and OPEB expense, and information about the fiduciary net position of the City of Charlottesville Supplemental Retirement or Pension Plan and Virginia Retirement System (VRS) and additions to/deductions from those fiduciary net positions have been determined on the same basis as they are reported by the City Pension Plan and VRS. For this purpose, benefit payments (including refunds of employee contributions) are recognized when due and payable in accordance with the benefit terms. Investments are reported at fair value.
54
2. GOVERNMENT-WIDE AND FUND EQUITY
For government-wide, proprietary funds and fiduciary funds financial statements, equity is described as net position (total assets minus total liabilities) and is broken down into three components: (1) amount invested in capital assets, net of related debt, (2) restricted and (3) unrestricted net position. The City’s policy is to consider restricted net position to have been depleted before using any of the components of unrestricted net positions. For governmental funds, equity is described as fund balance (current assets minus current liabilities), which is broken down into nonspendable, restricted, committed, assigned and unassigned fund balance.
Net investment in capital assets consists of capital assets less accumulated depreciation and reduced by outstanding balances for bonds, notes and other debt that are attributed to the acquisition, construction, or permanent improvement of those assets. Unspent debt proceeds are excluded.
Restricted net position reflects net position whose use is not subject solely to the government’s own discretion.
Unrestricted net position consists of net position that does not meet the definition of the two preceding categories. Unrestricted net assets are often designated to indicate that management does not consider them available for general operations. Unrestricted net assets often have constraints on resources that are imposed by management, but can be modified or removed.
(a) Fund Balances:
City Council is the City’s highest level of decision making authority. City Council can modify or rescind a fund balance through adoption of an appropriation. Assigned fund balance contains purchase orders and amounts at year end that City Council intends to use for a specific purpose.
The City maintains a minimum fund balance in the General Fund, classified as unassigned fund balance. The minimum fund balance policy is found in the City’s adopted operating budget. Currently, the City is to maintain a minimum of 14% of the operating budget in fund balance plus a downturn reserve of no less than 3% of the General Fund operating budget. City Council may elect to maintain a higher unassigned fund balance to provide the City with sufficient working capital and a margin of safety to address emergencies and unexpected declines in revenue without borrowing.
For purposes of fund balance classification, expenditures are to be spent from restricted fund balance first, followed in-order by committed fund balance, assigned fund balance and lastly unassigned fund balance. The City Manager has the authority to deviate from this policy if it is in the best interest of the City.
Nonspendable - Represents amounts that cannot be spent because they are either (a) not in spendable form or (b)
legally or contractually required to be maintained intact.
Restricted - Represents amounts with constraints placed on the use of resources that are either (a) externally imposed by creditors, grantors, contributors, or laws or regulations of other governments or (b) imposed by law through constitutional provisions or enabling legislation.
Committed - Represents specific purposes in accordance with internal constraints imposed by formal action of the City’s highest level of decision-making, Charlottesville City Council. The formal action is an appropriation, which designates funds for particular usage, to the exclusion of all other uses. Once adopted, the appropriation can only be changed by City Council through similar action.
Assigned – Represents amounts that are constrained by City Council’s intent to use for specific purposes, but meet neither the restricted or committed forms of constraint. Amounts that are assigned are only temporary until City Council takes formal action with an appropriation.
Unassigned – Represents the residual category for the general fund only. It is also where negative fund balance for all other governmental funds would be reported.
55
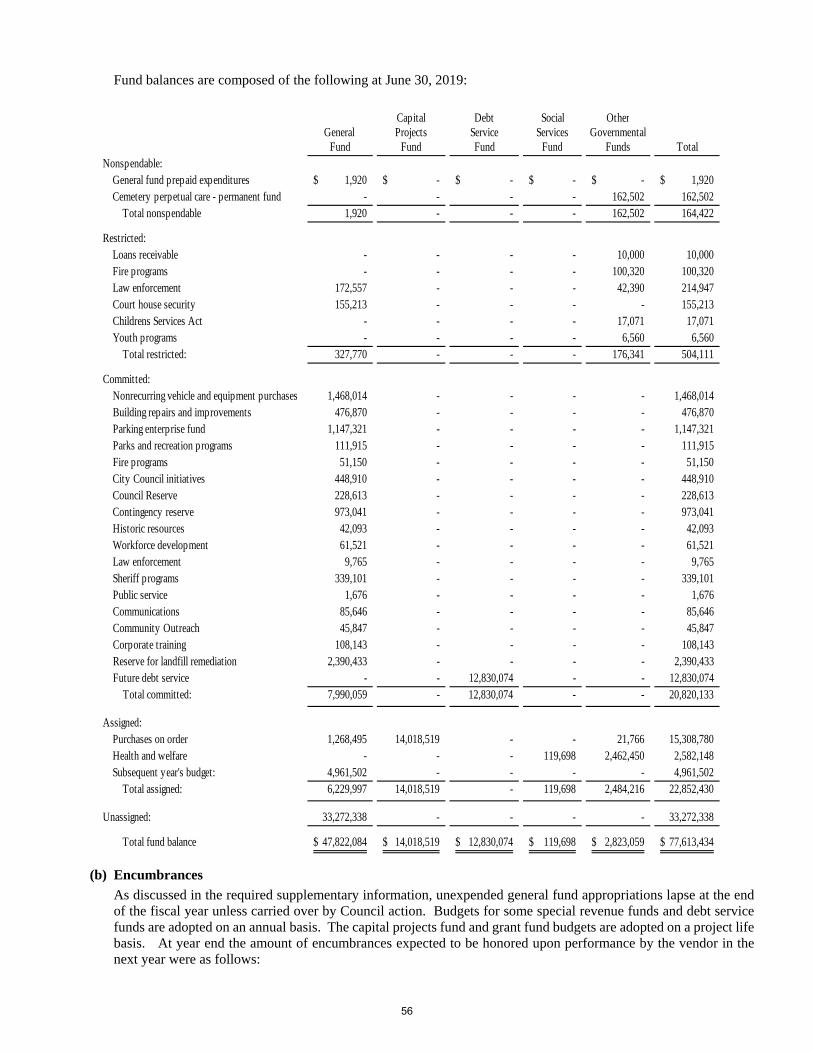
Fund balances are composed of the following at June 30, 2019:
Capital Debt Social OtherGeneral Projects Service Services Governmental
Fund Fund Fund Fund Funds TotalNonspendable:
General fund prepaid expenditures 1,920$ -$ -$ -$ -$ 1,920$ Cemetery perpetual care - permanent fund - - - - 162,502 162,502
Total nonspendable 1,920 - - - 162,502 164,422
Restricted:Loans receivable - - - - 10,000 10,000 Fire programs - - - - 100,320 100,320 Law enforcement 172,557 - - - 42,390 214,947 Court house security 155,213 - - - - 155,213 Childrens Services Act - - - - 17,071 17,071 Youth programs - - - - 6,560 6,560
Total restricted: 327,770 - - - 176,341 504,111
Committed:Nonrecurring vehicle and equipment purchases 1,468,014 - - - - 1,468,014 Building repairs and improvements 476,870 - - - - 476,870 Parking enterprise fund 1,147,321 - - - - 1,147,321 Parks and recreation programs 111,915 - - - - 111,915 Fire programs 51,150 - - - - 51,150 City Council initiatives 448,910 - - - - 448,910 Council Reserve 228,613 - - - - 228,613 Contingency reserve 973,041 - - - - 973,041 Historic resources 42,093 - - - - 42,093 Workforce development 61,521 - - - - 61,521 Law enforcement 9,765 - - - - 9,765 Sheriff programs 339,101 - - - - 339,101 Public service 1,676 - - - - 1,676 Communications 85,646 - - - - 85,646 Community Outreach 45,847 - - - - 45,847 Corporate training 108,143 - - - - 108,143 Reserve for landfill remediation 2,390,433 - - - - 2,390,433 Future debt service - - 12,830,074 - - 12,830,074
Total committed: 7,990,059 - 12,830,074 - - 20,820,133
Assigned:Purchases on order 1,268,495 14,018,519 - - 21,766 15,308,780 Health and welfare - - - 119,698 2,462,450 2,582,148 Subsequent year's budget: 4,961,502 - - - - 4,961,502
Total assigned: 6,229,997 14,018,519 - 119,698 2,484,216 22,852,430
Unassigned: 33,272,338 - - - - 33,272,338
Total fund balance 47,822,084$ 14,018,519$ 12,830,074$ 119,698$ 2,823,059$ 77,613,434$
(b) Encumbrances
As discussed in the required supplementary information, unexpended general fund appropriations lapse at the endof the fiscal year unless carried over by Council action. Budgets for some special revenue funds and debt servicefunds are adopted on an annual basis. The capital projects fund and grant fund budgets are adopted on a project lifebasis. At year end the amount of encumbrances expected to be honored upon performance by the vendor in thenext year were as follows:
56
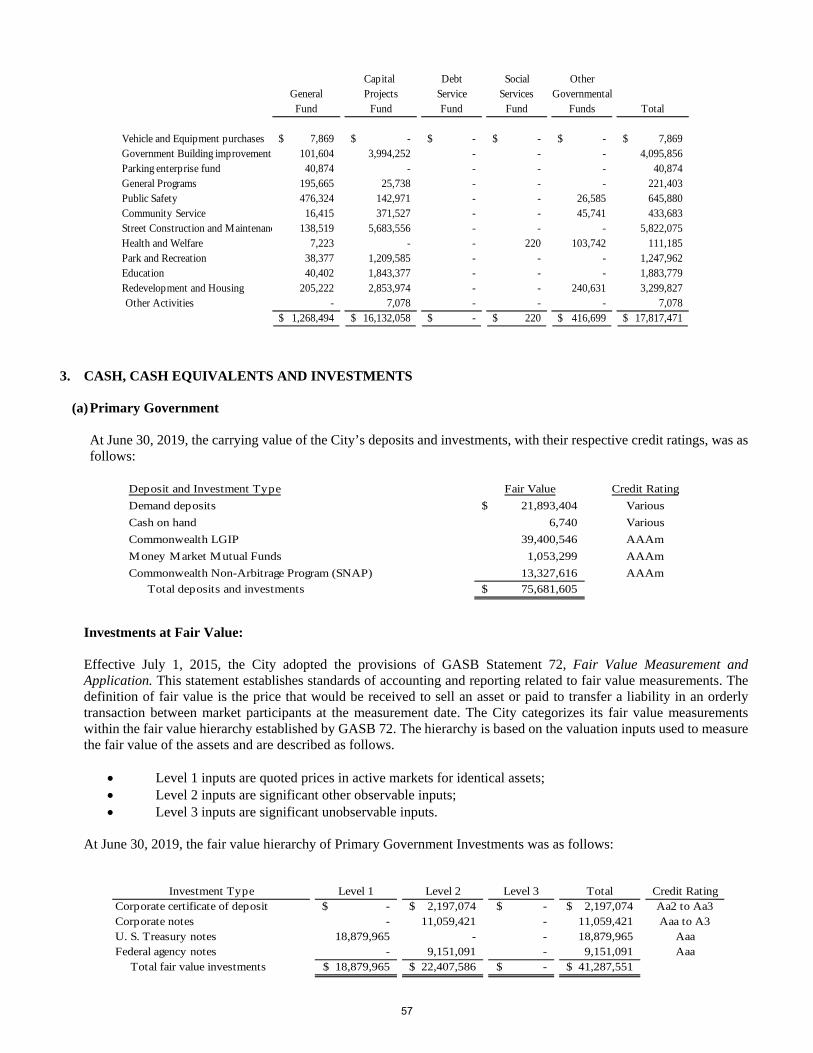
Capital Debt Social OtherGeneral Projects Service Services GovernmentalFund Fund Fund Fund Funds Total
Vehicle and Equipment purchases 7,869$ -$ -$ -$ -$ 7,869$ Government Building improvements 101,604 3,994,252 - - - 4,095,856 Parking enterprise fund 40,874 - - - - 40,874 General Programs 195,665 25,738 - - - 221,403 Public Safety 476,324 142,971 - - 26,585 645,880 Community Service 16,415 371,527 - - 45,741 433,683 Street Construction and Maintenanc 138,519 5,683,556 - - - 5,822,075 Health and Welfare 7,223 - - 220 103,742 111,185 Park and Recreation 38,377 1,209,585 - - - 1,247,962 Education 40,402 1,843,377 - - - 1,883,779 Redevelopment and Housing 205,222 2,853,974 - - 240,631 3,299,827 Other Activities - 7,078 - - - 7,078
1,268,494$ 16,132,058$ -$ 220$ 416,699$ 17,817,471$
3. CASH, CASH EQUIVALENTS AND INVESTMENTS
(a) Primary Government
At June 30, 2019, the carrying value of the City’s deposits and investments, with their respective credit ratings, was as follows:
Deposit and Investment Type Fair Value Credit Rating
Demand deposits 21,893,404$ Various
Cash on hand 6,740 Various
Commonwealth LGIP 39,400,546 AAAm
Money Market Mutual Funds 1,053,299 AAAm
Commonwealth Non-Arbitrage Program (SNAP) 13,327,616 AAAm
Total deposits and investments 75,681,605$
Investments at Fair Value:
Effective July 1, 2015, the City adopted the provisions of GASB Statement 72, Fair Value Measurement and Application. This statement establishes standards of accounting and reporting related to fair value measurements. The definition of fair value is the price that would be received to sell an asset or paid to transfer a liability in an orderly transaction between market participants at the measurement date. The City categorizes its fair value measurements within the fair value hierarchy established by GASB 72. The hierarchy is based on the valuation inputs used to measure the fair value of the assets and are described as follows.
Level 1 inputs are quoted prices in active markets for identical assets; Level 2 inputs are significant other observable inputs; Level 3 inputs are significant unobservable inputs.
At June 30, 2019, the fair value hierarchy of Primary Government Investments was as follows:
Investment Type Level 1 Level 2 Level 3 Total Credit RatingCorporate certificate of deposit -$ 2,197,074$ -$ 2,197,074$ Aa2 to Aa3Corporate notes - 11,059,421 - 11,059,421 Aaa to A3U. S. Treasury notes 18,879,965 - - 18,879,965 AaaFederal agency notes - 9,151,091 - 9,151,091 Aaa Total fair value investments 18,879,965$ 22,407,586$ -$ 41,287,551$
57
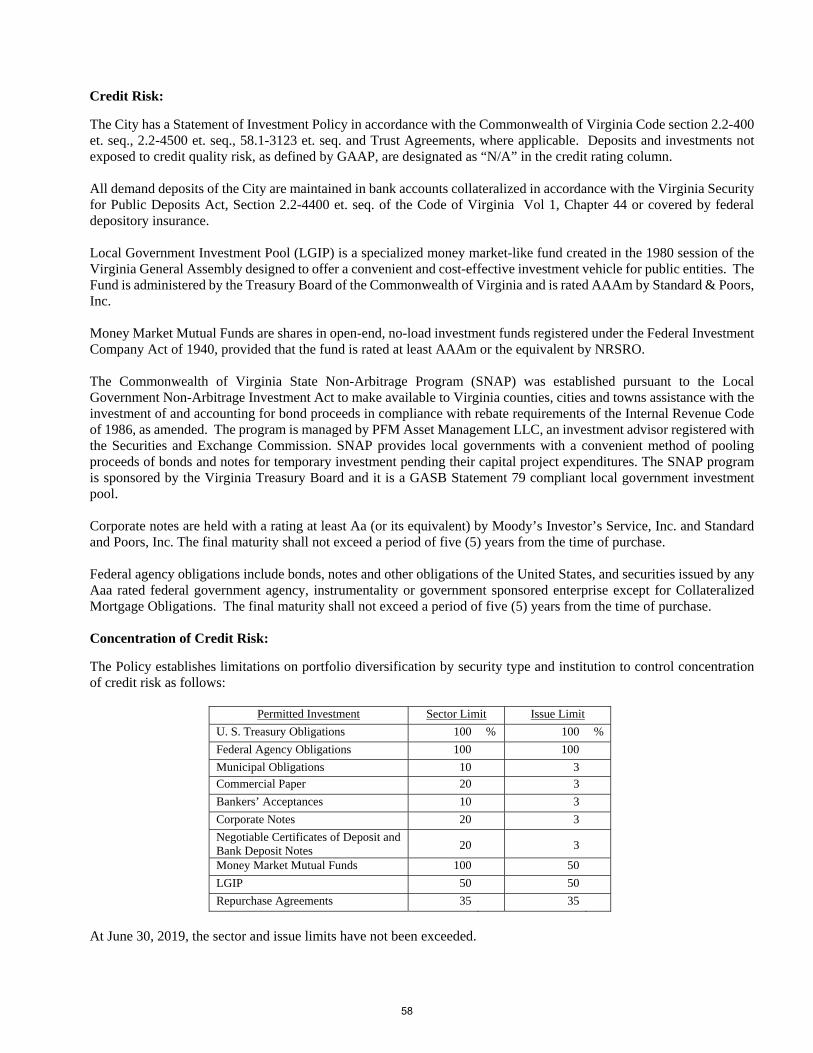
Credit Risk:
The City has a Statement of Investment Policy in accordance with the Commonwealth of Virginia Code section 2.2-400 et. seq., 2.2-4500 et. seq., 58.1-3123 et. seq. and Trust Agreements, where applicable. Deposits and investments not exposed to credit quality risk, as defined by GAAP, are designated as “N/A” in the credit rating column.
All demand deposits of the City are maintained in bank accounts collateralized in accordance with the Virginia Security for Public Deposits Act, Section 2.2-4400 et. seq. of the Code of Virginia Vol 1, Chapter 44 or covered by federal depository insurance.
Local Government Investment Pool (LGIP) is a specialized money market-like fund created in the 1980 session of the Virginia General Assembly designed to offer a convenient and cost-effective investment vehicle for public entities. The Fund is administered by the Treasury Board of the Commonwealth of Virginia and is rated AAAm by Standard & Poors, Inc.
Money Market Mutual Funds are shares in open-end, no-load investment funds registered under the Federal Investment Company Act of 1940, provided that the fund is rated at least AAAm or the equivalent by NRSRO.
The Commonwealth of Virginia State Non-Arbitrage Program (SNAP) was established pursuant to the Local Government Non-Arbitrage Investment Act to make available to Virginia counties, cities and towns assistance with the investment of and accounting for bond proceeds in compliance with rebate requirements of the Internal Revenue Code of 1986, as amended. The program is managed by PFM Asset Management LLC, an investment advisor registered with the Securities and Exchange Commission. SNAP provides local governments with a convenient method of pooling proceeds of bonds and notes for temporary investment pending their capital project expenditures. The SNAP program is sponsored by the Virginia Treasury Board and it is a GASB Statement 79 compliant local government investment pool.
Corporate notes are held with a rating at least Aa (or its equivalent) by Moody’s Investor’s Service, Inc. and Standard and Poors, Inc. The final maturity shall not exceed a period of five (5) years from the time of purchase.
Federal agency obligations include bonds, notes and other obligations of the United States, and securities issued by any Aaa rated federal government agency, instrumentality or government sponsored enterprise except for Collateralized Mortgage Obligations. The final maturity shall not exceed a period of five (5) years from the time of purchase.
Concentration of Credit Risk:
The Policy establishes limitations on portfolio diversification by security type and institution to control concentration of credit risk as follows:
Permitted Investment Sector Limit Issue Limit
U. S. Treasury Obligations 100 % 100 %
Federal Agency Obligations 100 100
Municipal Obligations 10 3
Commercial Paper 20 3
Bankers’ Acceptances 10 3
Corporate Notes 20 3
Negotiable Certificates of Deposit and Bank Deposit Notes 20 3
Money Market Mutual Funds 100 50
LGIP 50 50
Repurchase Agreements 35 35
At June 30, 2019, the sector and issue limits have not been exceeded.
58
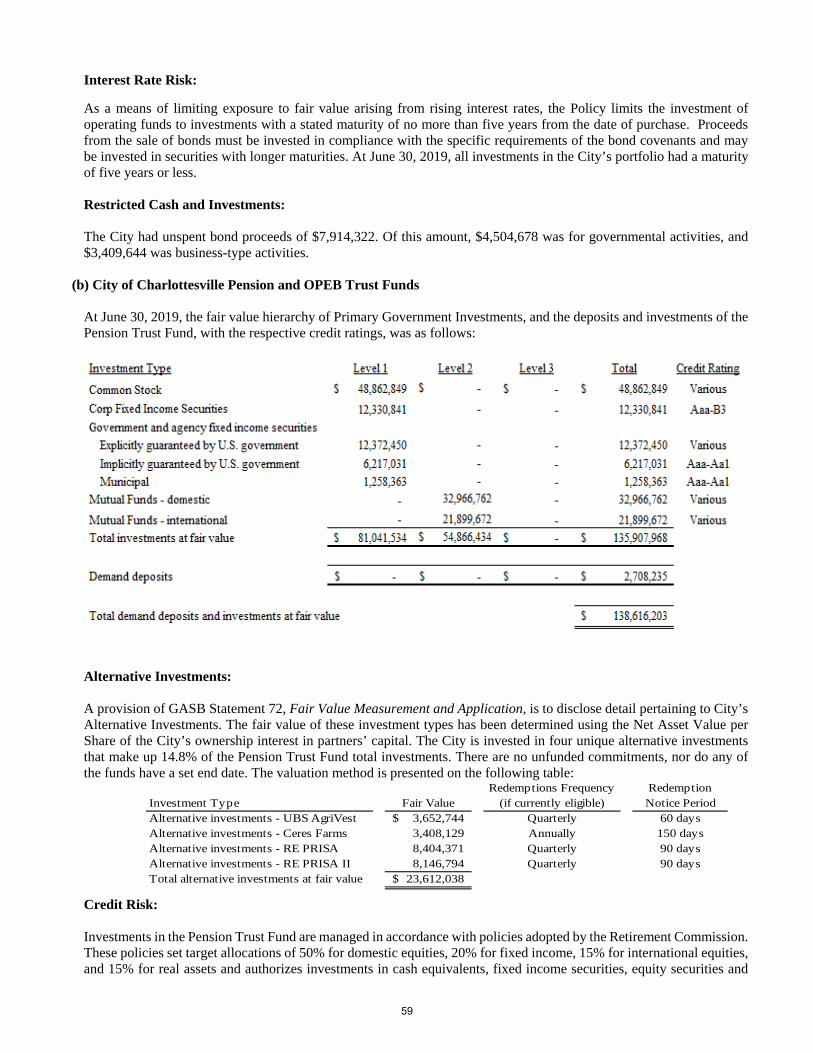
Interest Rate Risk:
As a means of limiting exposure to fair value arising from rising interest rates, the Policy limits the investment of operating funds to investments with a stated maturity of no more than five years from the date of purchase. Proceeds from the sale of bonds must be invested in compliance with the specific requirements of the bond covenants and may be invested in securities with longer maturities. At June 30, 2019, all investments in the City’s portfolio had a maturity of five years or less.
Restricted Cash and Investments:
The City had unspent bond proceeds of $7,914,322. Of this amount, $4,504,678 was for governmental activities, and $3,409,644 was business-type activities.
(b) City of Charlottesville Pension and OPEB Trust Funds
At June 30, 2019, the fair value hierarchy of Primary Government Investments, and the deposits and investments of the Pension Trust Fund, with the respective credit ratings, was as follows:
Alternative Investments:
A provision of GASB Statement 72, Fair Value Measurement and Application, is to disclose detail pertaining to City’s Alternative Investments. The fair value of these investment types has been determined using the Net Asset Value per Share of the City’s ownership interest in partners’ capital. The City is invested in four unique alternative investments that make up 14.8% of the Pension Trust Fund total investments. There are no unfunded commitments, nor do any of the funds have a set end date. The valuation method is presented on the following table:
Redemptions Frequency RedemptionInvestment Type Fair Value (if currently eligible) Notice PeriodAlternative investments - UBS AgriVest 3,652,744$ Quarterly 60 daysAlternative investments - Ceres Farms 3,408,129 Annually 150 daysAlternative investments - RE PRISA 8,404,371 Quarterly 90 daysAlternative investments - RE PRISA II 8,146,794 Quarterly 90 daysTotal alternative investments at fair value 23,612,038$
Credit Risk:
Investments in the Pension Trust Fund are managed in accordance with policies adopted by the Retirement Commission. These policies set target allocations of 50% for domestic equities, 20% for fixed income, 15% for international equities, and 15% for real assets and authorizes investments in cash equivalents, fixed income securities, equity securities and
59
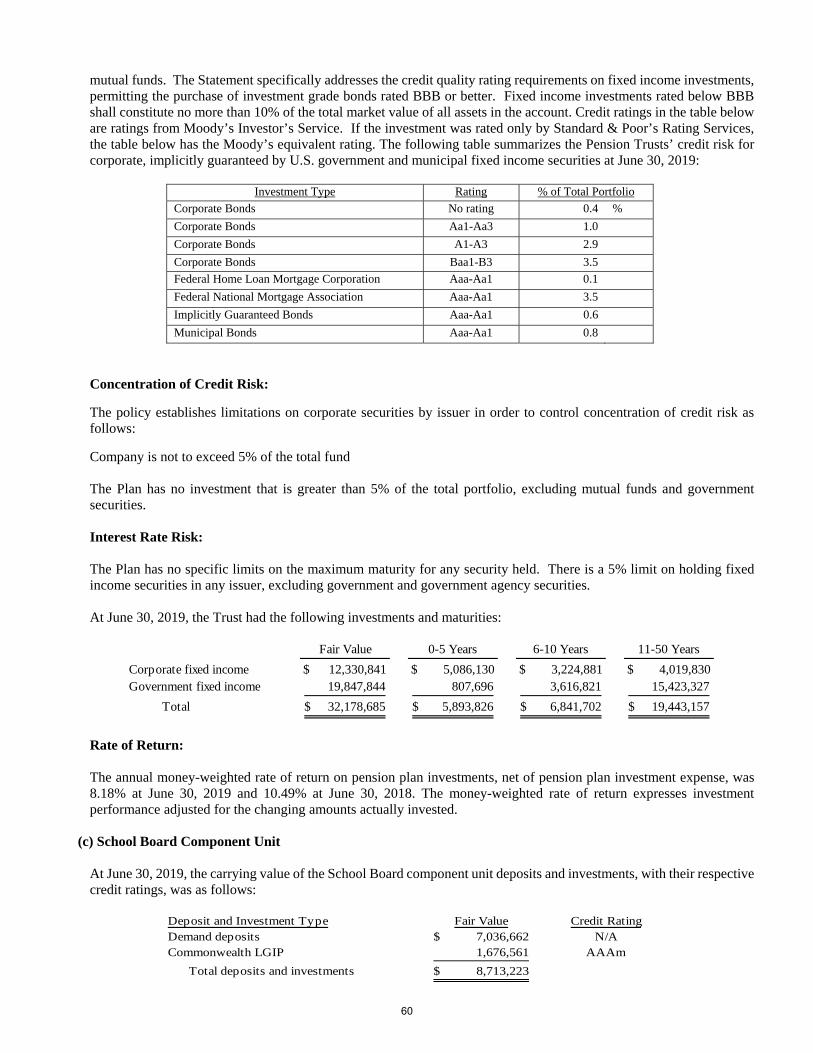
mutual funds. The Statement specifically addresses the credit quality rating requirements on fixed income investments, permitting the purchase of investment grade bonds rated BBB or better. Fixed income investments rated below BBB shall constitute no more than 10% of the total market value of all assets in the account. Credit ratings in the table below are ratings from Moody’s Investor’s Service. If the investment was rated only by Standard & Poor’s Rating Services, the table below has the Moody’s equivalent rating. The following table summarizes the Pension Trusts’ credit risk for corporate, implicitly guaranteed by U.S. government and municipal fixed income securities at June 30, 2019:
Investment Type Rating % of Total Portfolio
Corporate Bonds No rating 0.4 %
Corporate Bonds Aa1-Aa3 1.0
Corporate Bonds A1-A3 2.9
Corporate Bonds Baa1-B3 3.5
Federal Home Loan Mortgage Corporation Aaa-Aa1 0.1
Federal National Mortgage Association Aaa-Aa1 3.5
Implicitly Guaranteed Bonds Aaa-Aa1 0.6
Municipal Bonds Aaa-Aa1 0.8
Concentration of Credit Risk:
The policy establishes limitations on corporate securities by issuer in order to control concentration of credit risk as follows:
Company is not to exceed 5% of the total fund
The Plan has no investment that is greater than 5% of the total portfolio, excluding mutual funds and government securities.
Interest Rate Risk:
The Plan has no specific limits on the maximum maturity for any security held. There is a 5% limit on holding fixed income securities in any issuer, excluding government and government agency securities.
At June 30, 2019, the Trust had the following investments and maturities:
Fair Value 0-5 Years 6-10 Years 11-50 Years
Corporate fixed income $ 12,330,841 $ 5,086,130 $ 3,224,881 $ 4,019,830 Government fixed income 19,847,844 807,696 3,616,821 15,423,327
Total 32,178,685$ 5,893,826$ 6,841,702$ 19,443,157$
Rate of Return:
The annual money-weighted rate of return on pension plan investments, net of pension plan investment expense, was 8.18% at June 30, 2019 and 10.49% at June 30, 2018. The money-weighted rate of return expresses investment performance adjusted for the changing amounts actually invested.
(c) School Board Component Unit
At June 30, 2019, the carrying value of the School Board component unit deposits and investments, with their respectivecredit ratings, was as follows:
Deposit and Investment Type Fair Value Credit RatingDemand deposits 7,036,662$ N/ACommonwealth LGIP 1,676,561 AAAm
Total deposits and investments 8,713,223$
60
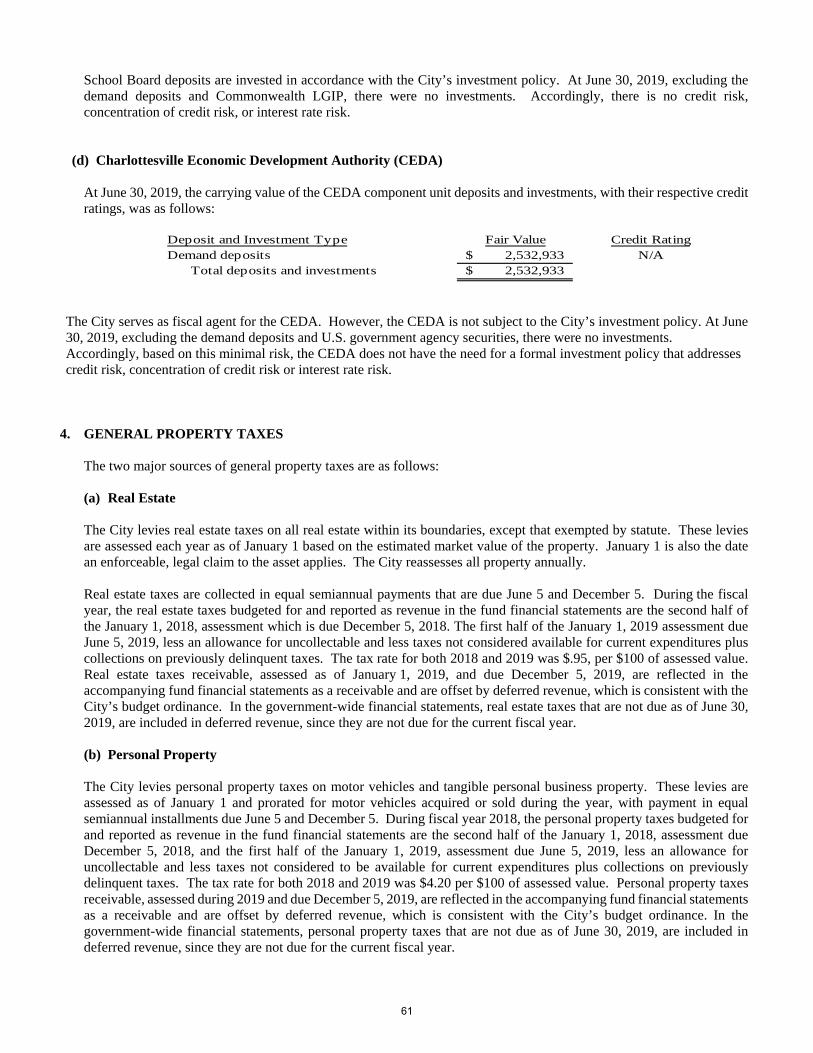
School Board deposits are invested in accordance with the City’s investment policy. At June 30, 2019, excluding the demand deposits and Commonwealth LGIP, there were no investments. Accordingly, there is no credit risk, concentration of credit risk, or interest rate risk.
(d) Charlottesville Economic Development Authority (CEDA)
At June 30, 2019, the carrying value of the CEDA component unit deposits and investments, with their respective credit ratings, was as follows:
The City serves as fiscal agent for the CEDA. However, the CEDA is not subject to the City’s investment policy. At June 30, 2019, excluding the demand deposits and U.S. government agency securities, there were no investments. Accordingly, based on this minimal risk, the CEDA does not have the need for a formal investment policy that addresses credit risk, concentration of credit risk or interest rate risk.
4. GENERAL PROPERTY TAXES
The two major sources of general property taxes are as follows:
(a) Real Estate
The City levies real estate taxes on all real estate within its boundaries, except that exempted by statute. These levies are assessed each year as of January 1 based on the estimated market value of the property. January 1 is also the date an enforceable, legal claim to the asset applies. The City reassesses all property annually.
Real estate taxes are collected in equal semiannual payments that are due June 5 and December 5. During the fiscal year, the real estate taxes budgeted for and reported as revenue in the fund financial statements are the second half of the January 1, 2018, assessment which is due December 5, 2018. The first half of the January 1, 2019 assessment due June 5, 2019, less an allowance for uncollectable and less taxes not considered available for current expenditures plus collections on previously delinquent taxes. The tax rate for both 2018 and 2019 was $.95, per $100 of assessed value. Real estate taxes receivable, assessed as of January 1, 2019, and due December 5, 2019, are reflected in the accompanying fund financial statements as a receivable and are offset by deferred revenue, which is consistent with the City’s budget ordinance. In the government-wide financial statements, real estate taxes that are not due as of June 30, 2019, are included in deferred revenue, since they are not due for the current fiscal year.
(b) Personal Property
The City levies personal property taxes on motor vehicles and tangible personal business property. These levies are assessed as of January 1 and prorated for motor vehicles acquired or sold during the year, with payment in equal semiannual installments due June 5 and December 5. During fiscal year 2018, the personal property taxes budgeted for and reported as revenue in the fund financial statements are the second half of the January 1, 2018, assessment due December 5, 2018, and the first half of the January 1, 2019, assessment due June 5, 2019, less an allowance for uncollectable and less taxes not considered to be available for current expenditures plus collections on previously delinquent taxes. The tax rate for both 2018 and 2019 was $4.20 per $100 of assessed value. Personal property taxes receivable, assessed during 2019 and due December 5, 2019, are reflected in the accompanying fund financial statements as a receivable and are offset by deferred revenue, which is consistent with the City’s budget ordinance. In the government-wide financial statements, personal property taxes that are not due as of June 30, 2019, are included in deferred revenue, since they are not due for the current fiscal year.
Deposit and Investment Type Fair Value Credit RatingDemand deposits 2,532,933$ N/A
Total deposits and investments 2,532,933$
61
In April 1998, the Virginia General Assembly passed S.B. 4005, the Personal Property Tax Relief Act of 1998, PPTRA. In its original form, PPTRA, in essence, was a vehicle-based entitlement. Beginning 2006, changes to PPTRA made by S.B. 5005 marked an end to this vehicle-based entitlement. S.B. 5005 establishes what amounts to a fixed, annual block grant to localities, the proceeds of which must be used to provide relief to the owners of qualifying vehicles. Localities determine how relief is to be distributed, within the guidelines established. Vehicles below $1,000 assessed value are given 100% relief.
5. LOANS RECEIVABLE
The Community Development Block Grant (CDBG) Special Revenue Fund has $17,051 in outstanding installment loans and $756,431 in deferred payment loans, which are secured by property liens. Both installment and deferred payment loans have terms from 5 to 30 years, bear an interest rate of three percent, and are payable upon sale, transfer or disposal of the property. These loans represent monies advanced to low-income qualified property owners under federally-funded housing renovation and rehabilitation projects and are fully offset on the balance sheet by an amount due to the federal government.
The Grants Special Revenue Fund has $971,358 in deferred payment loans, which are secured by property liens All loans represent federally-funded monies advanced to low-income qualified property owners under the HOME Investment Partnership. The terms are the same as the CDBG deferred payment loans found above and is fully offset on the balance sheet by an amount due to the federal government.
The Capital Projects has the following outstanding loans receivable:,
$850,000 to Piedmont Housing Alliance (PHA), which is a non-interest bearing loan due October 31, 2022, unless the property is sold before that date.
$130,000 in a non-interest bearing loan to the Charlottesville Economic Development Authority (CEDA) which is part of funding utilized by the Lewis & Clark Exploratory Center of Virginia, Inc., combined with grant funds from the Virginia Department of Transportation and funds from Albemarle County to construct the Lewis & Clark Exploratory Center, and improvements at Darden Towe Park, which is jointly owned by the City and the County. The loan is currently due but a request to forgive the loan was approved by the City Council contingent on Albemarle County doing the same. Albemarle County has not taken action on this request.
$1,550,000 to The Crossings at Fourth and Preston, LLC for the transfer of property at 401 4th Street, NW Charlottesville, to be operated as a Single Room Occupancy facility. The loan is for a period of 31 years, interest calculates at 4.3% per annum. The entire principle balance and any accrued, unpaid, interest are due June 30, 2042, or upon sale of the property.
$3,645,214 in deferred payment loans advanced to low-income property owners with terms similar to those of the CDBG and HOME grants described above, but funded by the City rather than federal funds. The loans are secured by property liens on the participating homeowners. Depending on the terms of each loan, a ratable portion of the loan balance is forgiven each month in which the participant owns the home. If the participant sells the home before the entire loan is forgiven, they are responsible for repayment of the remaining loan balance. Because this rarely happens, and therefore most loans are forgiven, an allowance for the full amount is recorded to offset the receivable.
The Charlottesville Economic Development Authority (CEDA) entered into a 20 year promissory note with the Charlottesville Pavilion in the amount of $2.4 million for construction cost of the Amphitheater in 2004, with periodic payments of principle and interest, at 3.70%, of $85,442. The note is secured by a first lien on all the assets of the Charlottesville Pavilion, its fixtures, and accounts receivable. In 2018, a modification of the promissory note was executed to re-advance $500,000 for the replacement of the roof of the Amphitheater, and extend the maturity date of the note to 2026. The balance of the note receivable was $1,063,974 at June 30, 2019. In 2013, CEDA also executed a $130,000 promissory note with the Lewis & Clark Exploratory Center for the construction of their learning center at Darden Towe Park.
62
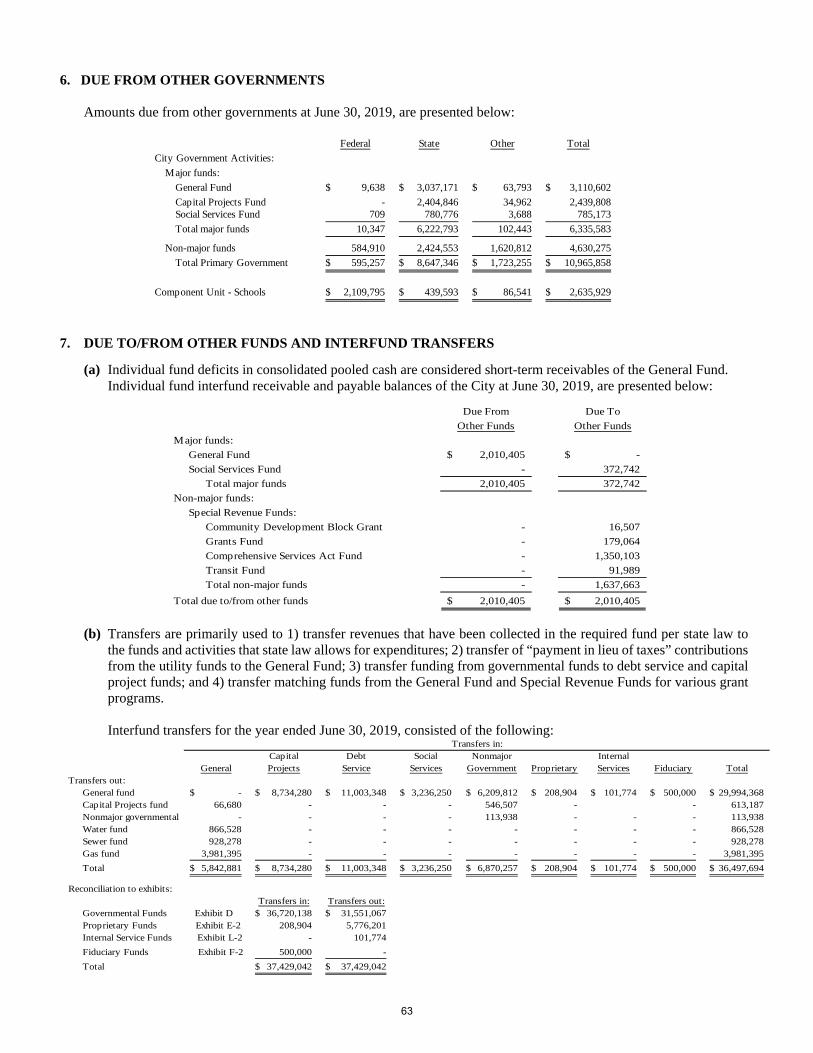
6. DUE FROM OTHER GOVERNMENTS
Amounts due from other governments at June 30, 2019, are presented below:
Federal State Other Total
City Government Activities:
Major funds:
General Fund 9,638$ 3,037,171$ 63,793$ 3,110,602$
Capital Projects Fund - 2,404,846 34,962 2,439,808 Social Services Fund 709 780,776 3,688 785,173
Total major funds 10,347 6,222,793 102,443 6,335,583
Non-major funds 584,910 2,424,553 1,620,812 4,630,275
Total Primary Government 595,257$ 8,647,346$ 1,723,255$ 10,965,858$
Component Unit - Schools 2,109,795$ 439,593$ 86,541$ 2,635,929$
7. DUE TO/FROM OTHER FUNDS AND INTERFUND TRANSFERS
(a) Individual fund deficits in consolidated pooled cash are considered short-term receivables of the General Fund. Individual fund interfund receivable and payable balances of the City at June 30, 2019, are presented below:
Due From Due To
Other Funds Other Funds
Major funds:
General Fund 2,010,405$ -$
Social Services Fund - 372,742
Total major funds 2,010,405 372,742
Non-major funds:
Special Revenue Funds:
Community Development Block Grant - 16,507
Grants Fund - 179,064
Comprehensive Services Act Fund - 1,350,103
Transit Fund - 91,989
Total non-major funds - 1,637,663
Total due to/from other funds 2,010,405$ 2,010,405$
(b) Transfers are primarily used to 1) transfer revenues that have been collected in the required fund per state law to the funds and activities that state law allows for expenditures; 2) transfer of “payment in lieu of taxes” contributions from the utility funds to the General Fund; 3) transfer funding from governmental funds to debt service and capital project funds; and 4) transfer matching funds from the General Fund and Special Revenue Funds for various grant programs.
Interfund transfers for the year ended June 30, 2019, consisted of the following:
Capital Debt Social Nonmajor InternalGeneral Projects Service Services Government Proprietary Services Fiduciary Total
Transfers out:General fund -$ 8,734,280$ 11,003,348$ 3,236,250$ 6,209,812$ 208,904$ 101,774$ 500,000$ 29,994,368$ Capital Projects fund 66,680 - - - 546,507 - - 613,187 Nonmajor governmental - - - - 113,938 - - - 113,938 Water fund 866,528 - - - - - - - 866,528 Sewer fund 928,278 - - - - - - - 928,278 Gas fund 3,981,395 - - - - - - - 3,981,395
Total 5,842,881$ 8,734,280$ 11,003,348$ 3,236,250$ 6,870,257$ 208,904$ 101,774$ 500,000$ 36,497,694$
Reconciliation to exhibits:Transfers in: Transfers out:
Governmental Funds Exhibit D 36,720,138$ 31,551,067$ Proprietary Funds Exhibit E-2 208,904 5,776,201 Internal Service Funds Exhibit L-2 - 101,774
Fiduciary Funds Exhibit F-2 500,000 -
Total 37,429,042$ 37,429,042$
Transfers in:
63
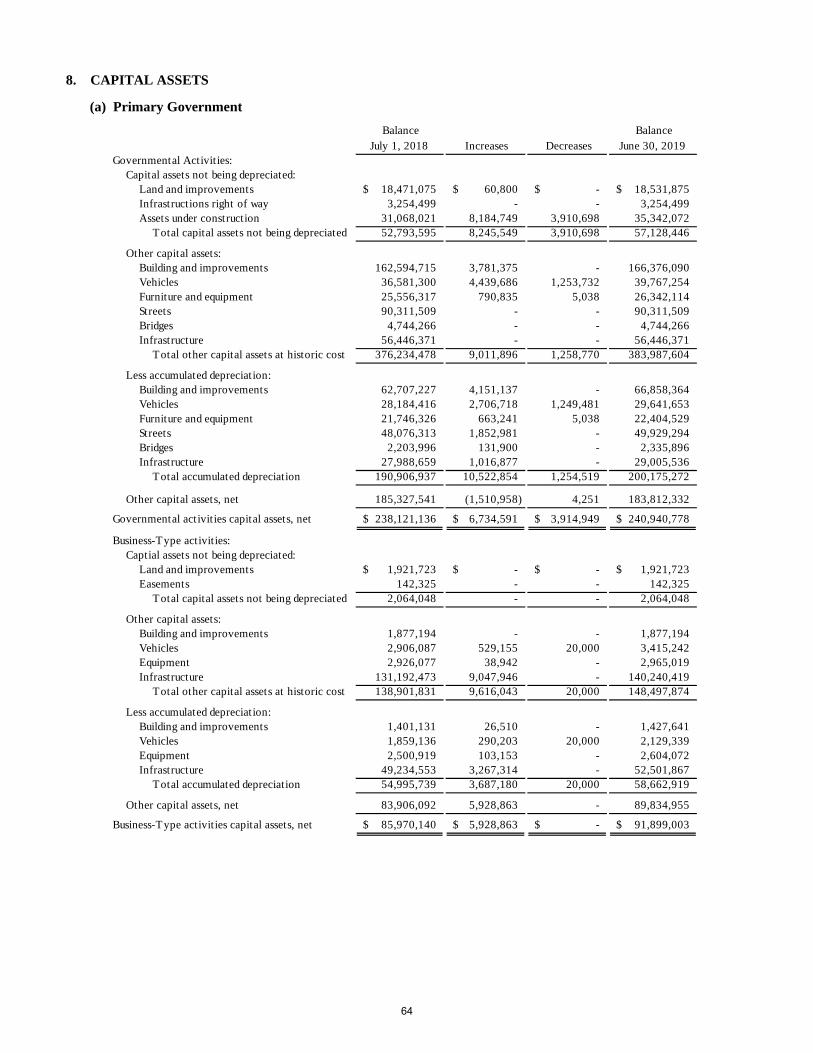
8. CAPITAL ASSETS
(a) Primary Government
Balance July 1, 2018 Increases Decreases
Balance June 30, 2019
Governmental Activities:Capital assets not being depreciated:
Land and improvements 18,471,075$ 60,800$ -$ 18,531,875$ Infrastructions right of way 3,254,499 - - 3,254,499 Assets under construction 31,068,021 8,184,749 3,910,698 35,342,072
Total capital assets not being depreciated 52,793,595 8,245,549 3,910,698 57,128,446
Other capital assets:Building and improvements 162,594,715 3,781,375 - 166,376,090 Vehicles 36,581,300 4,439,686 1,253,732 39,767,254 Furniture and equipment 25,556,317 790,835 5,038 26,342,114 Streets 90,311,509 - - 90,311,509 Bridges 4,744,266 - - 4,744,266 Infrastructure 56,446,371 - - 56,446,371
Total other capital assets at historic cost 376,234,478 9,011,896 1,258,770 383,987,604
Less accumulated depreciation:Building and improvements 62,707,227 4,151,137 - 66,858,364 Vehicles 28,184,416 2,706,718 1,249,481 29,641,653 Furniture and equipment 21,746,326 663,241 5,038 22,404,529 Streets 48,076,313 1,852,981 - 49,929,294 Bridges 2,203,996 131,900 - 2,335,896 Infrastructure 27,988,659 1,016,877 - 29,005,536
Total accumulated depreciation 190,906,937 10,522,854 1,254,519 200,175,272
Other capital assets, net 185,327,541 (1,510,958) 4,251 183,812,332
Governmental activities capital assets, net 238,121,136$ 6,734,591$ 3,914,949$ 240,940,778$
Business-Type activities:Captial assets not being depreciated:
Land and improvements 1,921,723$ -$ -$ 1,921,723$ Easements 142,325 - - 142,325
Total capital assets not being depreciated 2,064,048 - - 2,064,048
Other capital assets:Building and improvements 1,877,194 - - 1,877,194 Vehicles 2,906,087 529,155 20,000 3,415,242 Equipment 2,926,077 38,942 - 2,965,019 Infrastructure 131,192,473 9,047,946 - 140,240,419
Total other capital assets at historic cost 138,901,831 9,616,043 20,000 148,497,874
Less accumulated depreciation:Building and improvements 1,401,131 26,510 - 1,427,641 Vehicles 1,859,136 290,203 20,000 2,129,339 Equipment 2,500,919 103,153 - 2,604,072 Infrastructure 49,234,553 3,267,314 - 52,501,867
Total accumulated depreciation 54,995,739 3,687,180 20,000 58,662,919
Other capital assets, net 83,906,092 5,928,863 - 89,834,955
Business-Type activities capital assets, net 85,970,140$ 5,928,863$ -$ 91,899,003$
64
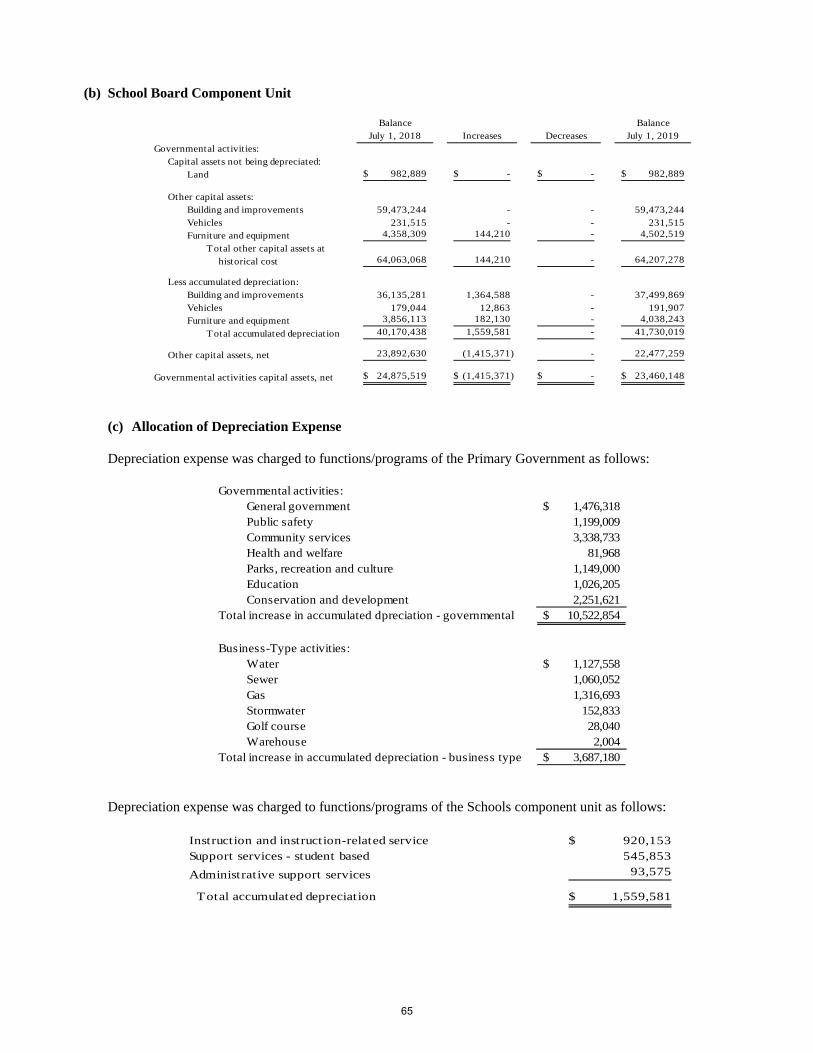
(b) School Board Component Unit
Balance Balance
July 1, 2018 Increases Decreases July 1, 2019Governmental activit ies:
Capital assets not being depreciated:Land 982,889$ -$ -$ 982,889$
Other capital assets:Building and improvements 59,473,244 - - 59,473,244 Vehicles 231,515 - - 231,515 Furniture and equipment 4,358,309 144,210 - 4,502,519
Total other capital assets athistorical cost 64,063,068 144,210 - 64,207,278
Less accumulated depreciation:Building and improvements 36,135,281 1,364,588 - 37,499,869 Vehicles 179,044 12,863 - 191,907 Furniture and equipment 3,856,113 182,130 - 4,038,243
Total accumulated depreciation 40,170,438 1,559,581 - 41,730,019
Other capital assets, net 23,892,630 (1,415,371) - 22,477,259
Governmental activit ies capital assets, net 24,875,519$ (1,415,371)$ -$ 23,460,148$
(c) Allocation of Depreciation Expense
Depreciation expense was charged to functions/programs of the Primary Government as follows:
Governmental activities:
General government 1,476,318$ Public safety 1,199,009 Community services 3,338,733 Health and welfare 81,968 Parks, recreation and culture 1,149,000 Education 1,026,205 Conservation and development 2,251,621
Total increase in accumulated dpreciation - governmental 10,522,854$
Business-Type activities:Water 1,127,558$ Sewer 1,060,052 Gas 1,316,693 Stormwater 152,833 Golf course 28,040 Warehouse 2,004
Total increase in accumulated depreciation - business type 3,687,180$
Depreciation expense was charged to functions/programs of the Schools component unit as follows:
Instruction and instruction-related service 920,153$ Support services - student based 545,853
Administrative support services 93,575
Total accumulated depreciation 1,559,581$
65
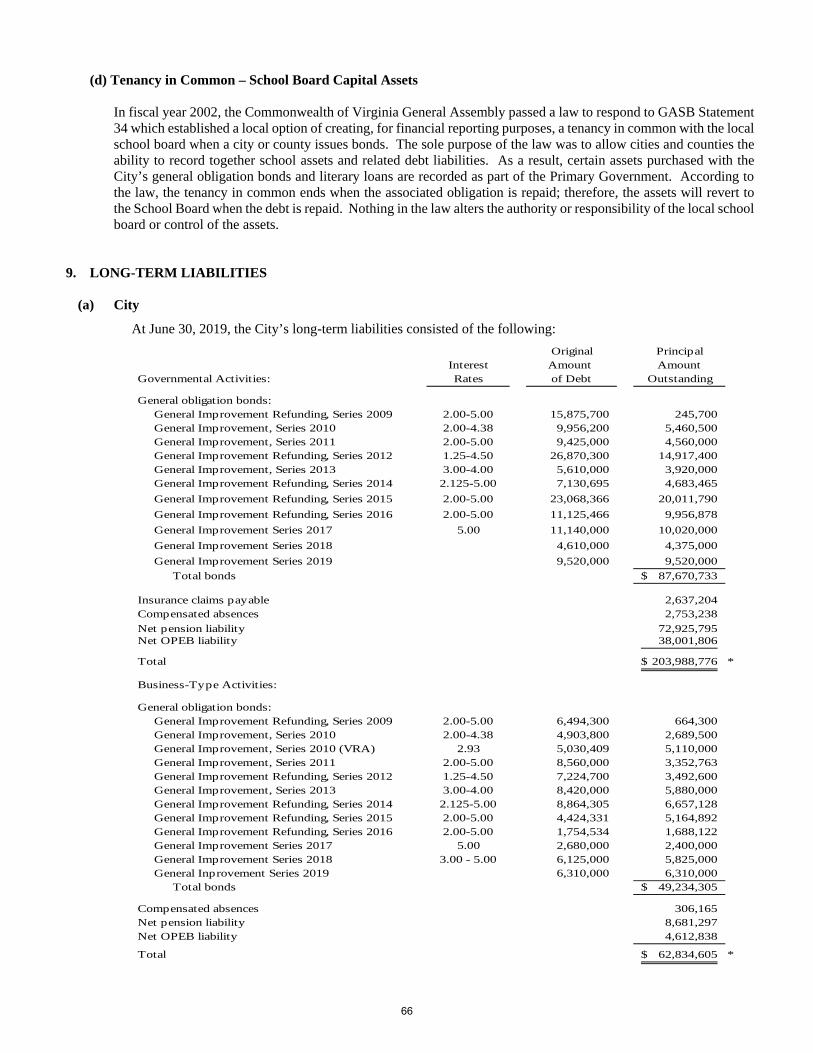
(d) Tenancy in Common – School Board Capital Assets
In fiscal year 2002, the Commonwealth of Virginia General Assembly passed a law to respond to GASB Statement 34 which established a local option of creating, for financial reporting purposes, a tenancy in common with the local school board when a city or county issues bonds. The sole purpose of the law was to allow cities and counties the ability to record together school assets and related debt liabilities. As a result, certain assets purchased with the City’s general obligation bonds and literary loans are recorded as part of the Primary Government. According to the law, the tenancy in common ends when the associated obligation is repaid; therefore, the assets will revert to the School Board when the debt is repaid. Nothing in the law alters the authority or responsibility of the local school board or control of the assets.
9. LONG-TERM LIABILITIES
(a) City
At June 30, 2019, the City’s long-term liabilities consisted of the following:
Original PrincipalInterest Amount Amount
Governmental Activities: Rates of Debt Outstanding
General obligation bonds: General Improvement Refunding, Series 2009 2.00-5.00 15,875,700 245,700 General Improvement, Series 2010 2.00-4.38 9,956,200 5,460,500 General Improvement, Series 2011 2.00-5.00 9,425,000 4,560,000 General Improvement Refunding, Series 2012 1.25-4.50 26,870,300 14,917,400 General Improvement, Series 2013 3.00-4.00 5,610,000 3,920,000 General Improvement Refunding, Series 2014 2.125-5.00 7,130,695 4,683,465
General Improvement Refunding, Series 2015 2.00-5.00 23,068,366 20,011,790
General Improvement Refunding, Series 2016 2.00-5.00 11,125,466 9,956,878
General Improvement Series 2017 5.00 11,140,000 10,020,000
General Improvement Series 2018 4,610,000 4,375,000
General Improvement Series 2019 9,520,000 9,520,000
Total bonds 87,670,733$
Insurance claims payable 2,637,204 Compensated absences 2,753,238
Net pension liability 72,925,795 Net OPEB liability 38,001,806
Total 203,988,776$ *
Business-Type Activities:
General obligation bonds:General Improvement Refunding, Series 2009 2.00-5.00 6,494,300 664,300 General Improvement, Series 2010 2.00-4.38 4,903,800 2,689,500 General Improvement, Series 2010 (VRA) 2.93 5,030,409 5,110,000 General Improvement, Series 2011 2.00-5.00 8,560,000 3,352,763 General Improvement Refunding, Series 2012 1.25-4.50 7,224,700 3,492,600 General Improvement, Series 2013 3.00-4.00 8,420,000 5,880,000 General Improvement Refunding, Series 2014 2.125-5.00 8,864,305 6,657,128 General Improvement Refunding, Series 2015 2.00-5.00 4,424,331 5,164,892 General Improvement Refunding, Series 2016 2.00-5.00 1,754,534 1,688,122 General Improvement Series 2017 5.00 2,680,000 2,400,000 General Improvement Series 2018 3.00 - 5.00 6,125,000 5,825,000 General Inprovement Series 2019 6,310,000 6,310,000
Total bonds 49,234,305$
Compensated absences 306,165 Net pension liability 8,681,297 Net OPEB liability 4,612,838
Total 62,834,605$ *
66
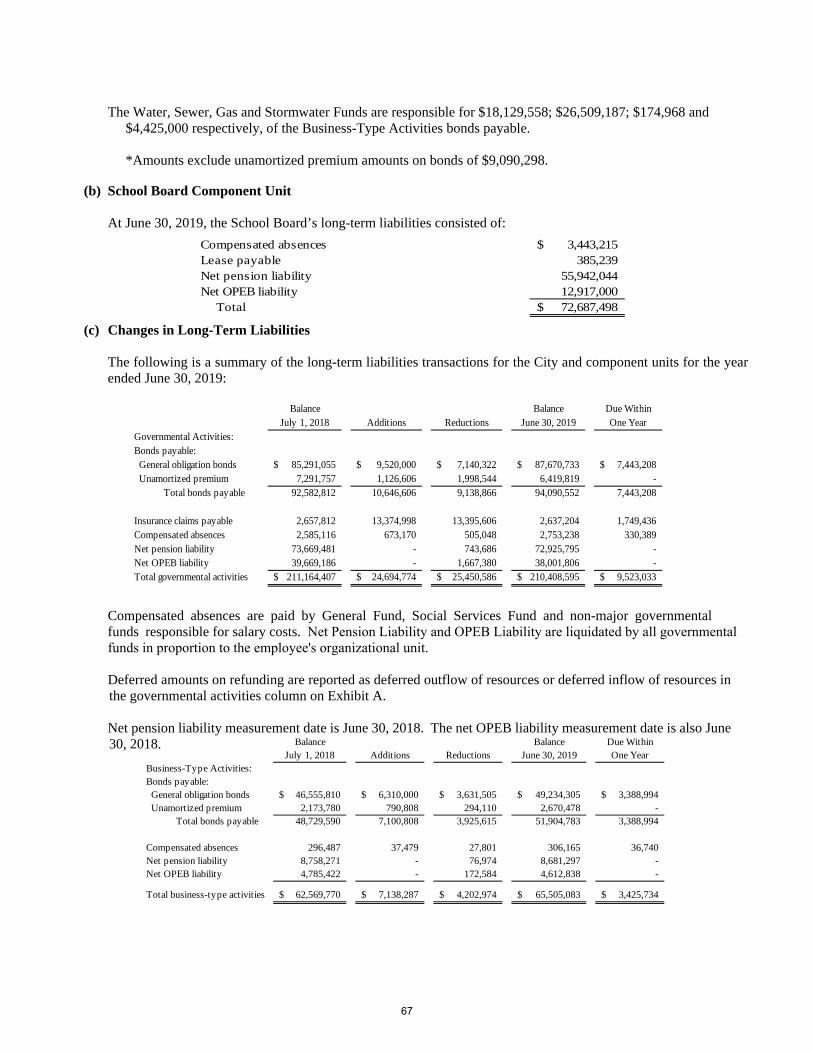
The Water, Sewer, Gas and Stormwater Funds are responsible for $18,129,558; $26,509,187; $174,968 and $4,425,000 respectively, of the Business-Type Activities bonds payable.
*Amounts exclude unamortized premium amounts on bonds of $9,090,298.
(b) School Board Component Unit
At June 30, 2019, the School Board’s long-term liabilities consisted of:
3,443,215$ 385,239
55,942,044
Compensated absences Lease payable Net pension liability Net OPEB liability 12,917,000 Total 72,687,498$
(c) Changes in Long-Term Liabilities
The following is a summary of the long-term liabilities transactions for the City and component units for the yearended June 30, 2019:
Balance Balance Due WithinJuly 1, 2018 Additions Reductions June 30, 2019 One Year
Governmental Activities:Bonds payable: General obligation bonds 85,291,055$ 9,520,000$ 7,140,322$ 87,670,733$ 7,443,208$ Unamortized premium 7,291,757 1,126,606 1,998,544 6,419,819 -
Total bonds payable 92,582,812 10,646,606 9,138,866 94,090,552 7,443,208
Insurance claims payable 2,657,812 13,374,998 13,395,606 2,637,204 1,749,436 Compensated absences 2,585,116 673,170 505,048 2,753,238 330,389 Net pension liability 73,669,481 - 743,686 72,925,795 - Net OPEB liability 39,669,186 - 1,667,380 38,001,806 - Total governmental activities 211,164,407$ 24,694,774$ 25,450,586$ 210,408,595$ 9,523,033$
Compensated absences are paid by General Fund, Social Services Fund and non-major governmental funds responsible for salary costs. Net Pension Liability and OPEB Liability are liquidated by all governmental funds in proportion to the employee's organizational unit.
Deferred amounts on refunding are reported as deferred outflow of resources or deferred inflow of resources in the governmental activities column on Exhibit A.
Net pension liability measurement date is June 30, 2018. The net OPEB liability measurement date is also June 30, 2018. Balance Balance Due Within
July 1, 2018 Additions Reductions June 30, 2019 One YearBusiness-Type Activities:Bonds payable: General obligation bonds 46,555,810$ 6,310,000$ 3,631,505$ 49,234,305$ 3,388,994$ Unamortized premium 2,173,780 790,808 294,110 2,670,478 -
Total bonds payable 48,729,590 7,100,808 3,925,615 51,904,783 3,388,994
Compensated absences 296,487 37,479 27,801 306,165 36,740 Net pension liability 8,758,271 - 76,974 8,681,297 - Net OPEB liability 4,785,422 - 172,584 4,612,838 -
Total business-type activities 62,569,770$ 7,138,287$ 4,202,974$ 65,505,083$ 3,425,734$
67
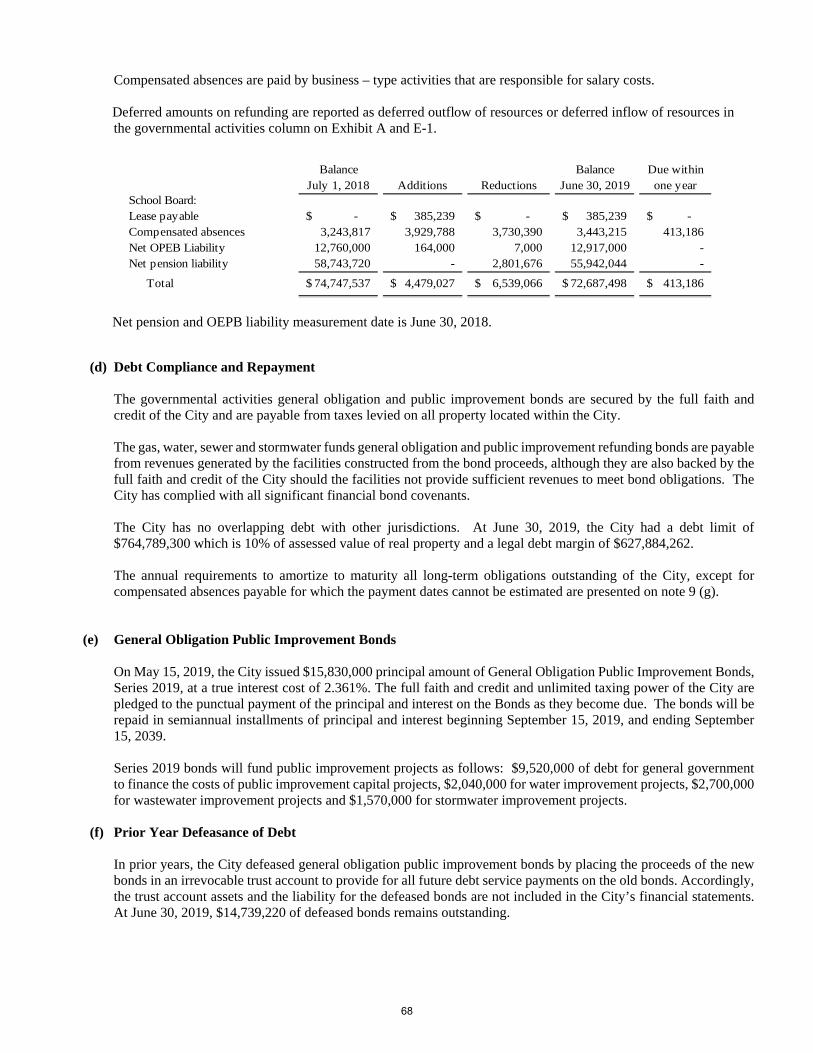
Compensated absences are paid by business – type activities that are responsible for salary costs.
Deferred amounts on refunding are reported as deferred outflow of resources or deferred inflow of resources in the governmental activities column on Exhibit A and E-1.
Balance Balance Due withinJuly 1, 2018 Additions Reductions June 30, 2019 one year
-$ 385,239$ -$ 385,239$ -$ 3,243,817 3,929,788 3,730,390 3,443,215 413,186
12,760,000 164,000 7,000 12,917,000 - 58,743,720 - 2,801,676 55,942,044 -
Total 74,747,537$ 4,479,027$ 6,539,066$ 72,687,498$ 413,186$
School Board:Lease payable Compensated absences Net OPEB Liability Net pension liability
Net pension and OEPB liability measurement date is June 30, 2018.
(d) Debt Compliance and Repayment
The governmental activities general obligation and public improvement bonds are secured by the full faith andcredit of the City and are payable from taxes levied on all property located within the City.
The gas, water, sewer and stormwater funds general obligation and public improvement refunding bonds are payablefrom revenues generated by the facilities constructed from the bond proceeds, although they are also backed by thefull faith and credit of the City should the facilities not provide sufficient revenues to meet bond obligations. TheCity has complied with all significant financial bond covenants.
The City has no overlapping debt with other jurisdictions. At June 30, 2019, the City had a debt limit of$764,789,300 which is 10% of assessed value of real property and a legal debt margin of $627,884,262.
The annual requirements to amortize to maturity all long-term obligations outstanding of the City, except forcompensated absences payable for which the payment dates cannot be estimated are presented on note 9 (g).
(e) General Obligation Public Improvement Bonds
On May 15, 2019, the City issued $15,830,000 principal amount of General Obligation Public Improvement Bonds,Series 2019, at a true interest cost of 2.361%. The full faith and credit and unlimited taxing power of the City arepledged to the punctual payment of the principal and interest on the Bonds as they become due. The bonds will berepaid in semiannual installments of principal and interest beginning September 15, 2019, and ending September15, 2039.
Series 2019 bonds will fund public improvement projects as follows: $9,520,000 of debt for general governmentto finance the costs of public improvement capital projects, $2,040,000 for water improvement projects, $2,700,000for wastewater improvement projects and $1,570,000 for stormwater improvement projects.
(f) Prior Year Defeasance of Debt
In prior years, the City defeased general obligation public improvement bonds by placing the proceeds of the newbonds in an irrevocable trust account to provide for all future debt service payments on the old bonds. Accordingly,the trust account assets and the liability for the defeased bonds are not included in the City’s financial statements.At June 30, 2019, $14,739,220 of defeased bonds remains outstanding.
68
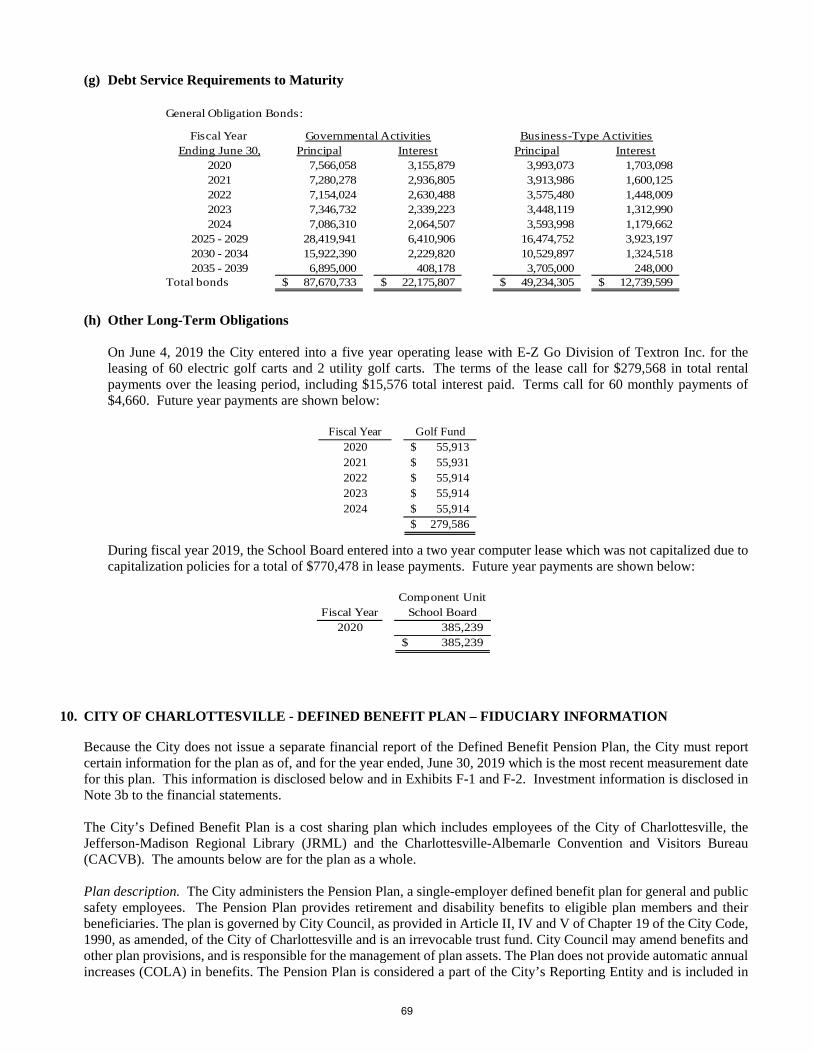
(g) Debt Service Requirements to Maturity
General Obligation Bonds:
Fiscal Year Ending June 30, Principal Interest Principal Interest
2020 7,566,058 3,155,879 3,993,073 1,703,098 2021 7,280,278 2,936,805 3,913,986 1,600,125 2022 7,154,024 2,630,488 3,575,480 1,448,009 2023 7,346,732 2,339,223 3,448,119 1,312,990 2024 7,086,310 2,064,507 3,593,998 1,179,662
2025 - 2029 28,419,941 6,410,906 16,474,752 3,923,197 2030 - 2034 15,922,390 2,229,820 10,529,897 1,324,518 2035 - 2039 6,895,000 408,178 3,705,000 248,000
Total bonds 87,670,733$ 22,175,807$ 49,234,305$ 12,739,599$
Governmental Activities Business-Type Activities
(h) Other Long-Term Obligations
On June 4, 2019 the City entered into a five year operating lease with E-Z Go Division of Textron Inc. for the leasing of 60 electric golf carts and 2 utility golf carts. The terms of the lease call for $279,568 in total rental payments over the leasing period, including $15,576 total interest paid. Terms call for 60 monthly payments of $4,660. Future year payments are shown below:
Fiscal Year Golf Fund
2020 55,913$ 2021 55,931$ 2022 55,914$ 2023 55,914$ 2024 55,914$
279,586$
During fiscal year 2019, the School Board entered into a two year computer lease which was not capitalized due to capitalization policies for a total of $770,478 in lease payments. Future year payments are shown below:
Component UnitFiscal Year School Board
2020 385,239 385,239$
10. CITY OF CHARLOTTESVILLE - DEFINED BENEFIT PLAN – FIDUCIARY INFORMATION
Because the City does not issue a separate financial report of the Defined Benefit Pension Plan, the City must report certain information for the plan as of, and for the year ended, June 30, 2019 which is the most recent measurement date for this plan. This information is disclosed below and in Exhibits F-1 and F-2. Investment information is disclosed in Note 3b to the financial statements.
The City’s Defined Benefit Plan is a cost sharing plan which includes employees of the City of Charlottesville, the Jefferson-Madison Regional Library (JRML) and the Charlottesville-Albemarle Convention and Visitors Bureau (CACVB). The amounts below are for the plan as a whole.
Plan description. The City administers the Pension Plan, a single-employer defined benefit plan for general and public safety employees. The Pension Plan provides retirement and disability benefits to eligible plan members and their beneficiaries. The plan is governed by City Council, as provided in Article II, IV and V of Chapter 19 of the City Code, 1990, as amended, of the City of Charlottesville and is an irrevocable trust fund. City Council may amend benefits and other plan provisions, and is responsible for the management of plan assets. The Plan does not provide automatic annual increases (COLA) in benefits. The Pension Plan is considered a part of the City’s Reporting Entity and is included in
69
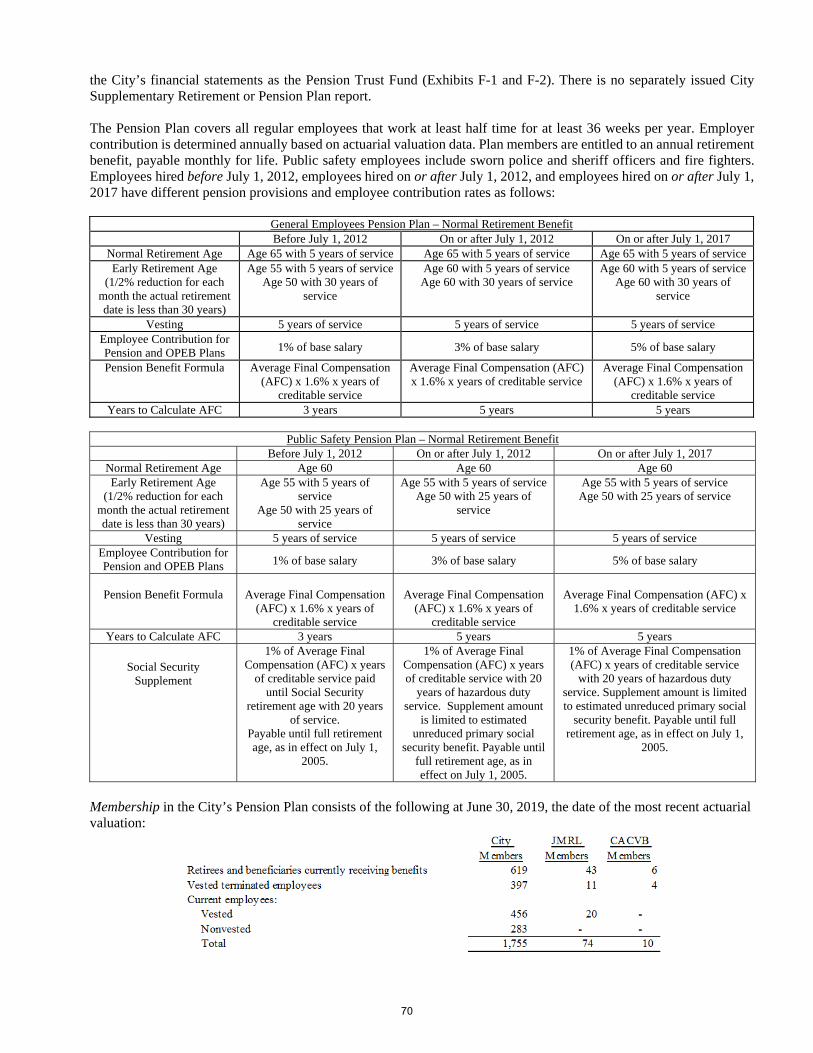
the City’s financial statements as the Pension Trust Fund (Exhibits F-1 and F-2). There is no separately issued City Supplementary Retirement or Pension Plan report.
The Pension Plan covers all regular employees that work at least half time for at least 36 weeks per year. Employer contribution is determined annually based on actuarial valuation data. Plan members are entitled to an annual retirement benefit, payable monthly for life. Public safety employees include sworn police and sheriff officers and fire fighters. Employees hired before July 1, 2012, employees hired on or after July 1, 2012, and employees hired on or after July 1, 2017 have different pension provisions and employee contribution rates as follows:
General Employees Pension Plan – Normal Retirement Benefit Before July 1, 2012 On or after July 1, 2012 On or after July 1, 2017
Normal Retirement Age Age 65 with 5 years of service Age 65 with 5 years of service Age 65 with 5 years of service Early Retirement Age
(1/2% reduction for each month the actual retirement date is less than 30 years)
Age 55 with 5 years of service Age 50 with 30 years of
service
Age 60 with 5 years of service Age 60 with 30 years of service
Age 60 with 5 years of service Age 60 with 30 years of
service
Vesting 5 years of service 5 years of service 5 years of service Employee Contribution for Pension and OPEB Plans 1% of base salary 3% of base salary 5% of base salary
Pension Benefit Formula Average Final Compensation (AFC) x 1.6% x years of
creditable service
Average Final Compensation (AFC) x 1.6% x years of creditable service
Average Final Compensation (AFC) x 1.6% x years of
creditable service Years to Calculate AFC 3 years 5 years 5 years
Public Safety Pension Plan – Normal Retirement Benefit
Before July 1, 2012 On or after July 1, 2012 On or after July 1, 2017 Normal Retirement Age Age 60 Age 60 Age 60 Early Retirement Age
(1/2% reduction for each month the actual retirement date is less than 30 years)
Age 55 with 5 years of service
Age 50 with 25 years of service
Age 55 with 5 years of service Age 50 with 25 years of
service
Age 55 with 5 years of service Age 50 with 25 years of service
Vesting 5 years of service 5 years of service 5 years of service Employee Contribution for Pension and OPEB Plans 1% of base salary 3% of base salary 5% of base salary
Pension Benefit Formula
Average Final Compensation
(AFC) x 1.6% x years of creditable service
Average Final Compensation
(AFC) x 1.6% x years of creditable service
Average Final Compensation (AFC) x
1.6% x years of creditable service
Years to Calculate AFC 3 years 5 years 5 years
Social Security Supplement
1% of Average Final Compensation (AFC) x years
of creditable service paid until Social Security
retirement age with 20 years of service.
Payable until full retirement age, as in effect on July 1,
2005.
1% of Average Final Compensation (AFC) x years of creditable service with 20
years of hazardous duty service. Supplement amount
is limited to estimated unreduced primary social
security benefit. Payable until full retirement age, as in effect on July 1, 2005.
1% of Average Final Compensation (AFC) x years of creditable service
with 20 years of hazardous duty service. Supplement amount is limited to estimated unreduced primary social
security benefit. Payable until full retirement age, as in effect on July 1,
2005.
Membership in the City’s Pension Plan consists of the following at June 30, 2019, the date of the most recent actuarial valuation:
70
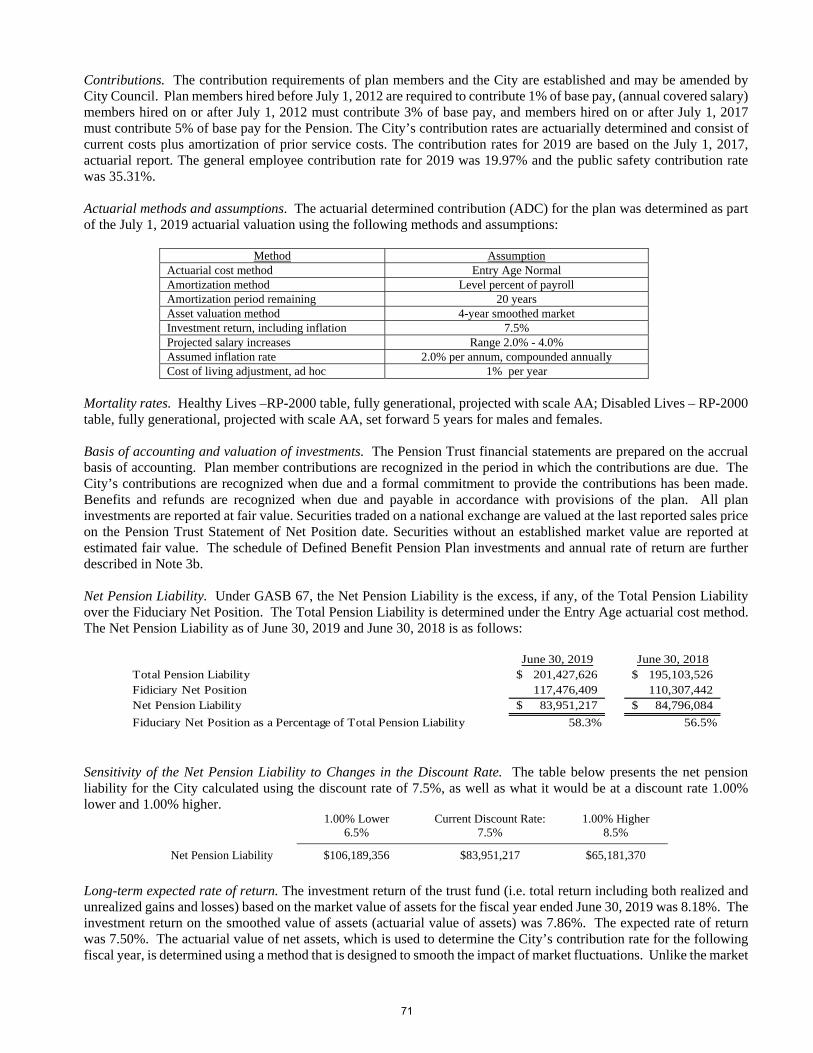
Contributions. The contribution requirements of plan members and the City are established and may be amended by City Council. Plan members hired before July 1, 2012 are required to contribute 1% of base pay, (annual covered salary) members hired on or after July 1, 2012 must contribute 3% of base pay, and members hired on or after July 1, 2017 must contribute 5% of base pay for the Pension. The City’s contribution rates are actuarially determined and consist of current costs plus amortization of prior service costs. The contribution rates for 2019 are based on the July 1, 2017, actuarial report. The general employee contribution rate for 2019 was 19.97% and the public safety contribution rate was 35.31%.
Actuarial methods and assumptions. The actuarial determined contribution (ADC) for the plan was determined as part of the July 1, 2019 actuarial valuation using the following methods and assumptions:
Method Assumption Actuarial cost method Entry Age Normal Amortization method Level percent of payroll Amortization period remaining 20 years Asset valuation method 4-year smoothed market Investment return, including inflation 7.5% Projected salary increases Range 2.0% - 4.0% Assumed inflation rate 2.0% per annum, compounded annually Cost of living adjustment, ad hoc 1% per year
Mortality rates. Healthy Lives –RP-2000 table, fully generational, projected with scale AA; Disabled Lives – RP-2000 table, fully generational, projected with scale AA, set forward 5 years for males and females.
Basis of accounting and valuation of investments. The Pension Trust financial statements are prepared on the accrual basis of accounting. Plan member contributions are recognized in the period in which the contributions are due. The City’s contributions are recognized when due and a formal commitment to provide the contributions has been made. Benefits and refunds are recognized when due and payable in accordance with provisions of the plan. All plan investments are reported at fair value. Securities traded on a national exchange are valued at the last reported sales price on the Pension Trust Statement of Net Position date. Securities without an established market value are reported at estimated fair value. The schedule of Defined Benefit Pension Plan investments and annual rate of return are further described in Note 3b.
Net Pension Liability. Under GASB 67, the Net Pension Liability is the excess, if any, of the Total Pension Liability over the Fiduciary Net Position. The Total Pension Liability is determined under the Entry Age actuarial cost method. The Net Pension Liability as of June 30, 2019 and June 30, 2018 is as follows:
June 30, 2019 June 30, 2018
Total Pension Liability 201,427,626$ 195,103,526$ Fidiciary Net Position 117,476,409 110,307,442 Net Pension Liability 83,951,217$ 84,796,084$
Fiduciary Net Position as a Percentage of Total Pension Liability 58.3% 56.5%
Sensitivity of the Net Pension Liability to Changes in the Discount Rate. The table below presents the net pension liability for the City calculated using the discount rate of 7.5%, as well as what it would be at a discount rate 1.00% lower and 1.00% higher.
1.00% Lower 6.5%
Current Discount Rate: 7.5%
1.00% Higher 8.5%
Net Pension Liability $106,189,356 $83,951,217 $65,181,370
Long-term expected rate of return. The investment return of the trust fund (i.e. total return including both realized and unrealized gains and losses) based on the market value of assets for the fiscal year ended June 30, 2019 was 8.18%. The investment return on the smoothed value of assets (actuarial value of assets) was 7.86%. The expected rate of return was 7.50%. The actuarial value of net assets, which is used to determine the City’s contribution rate for the following fiscal year, is determined using a method that is designed to smooth the impact of market fluctuations. Unlike the market
71
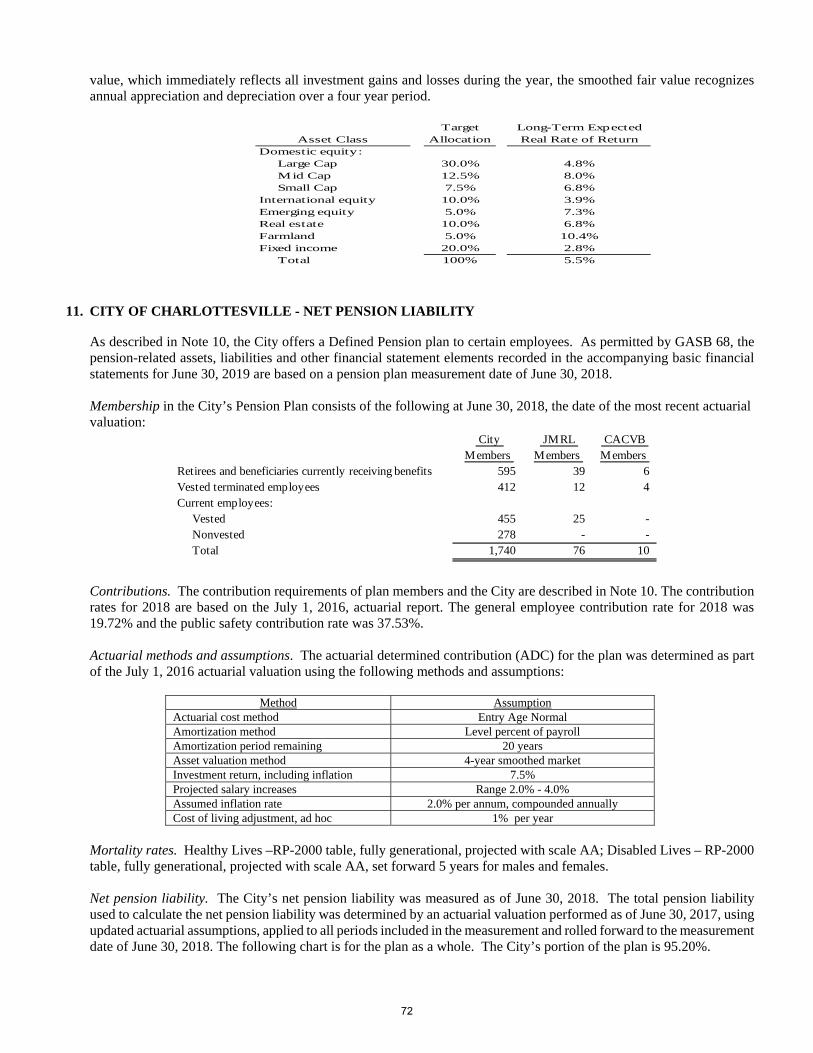
value, which immediately reflects all investment gains and losses during the year, the smoothed fair value recognizes annual appreciation and depreciation over a four year period.
11. CITY OF CHARLOTTESVILLE - NET PENSION LIABILITY
As described in Note 10, the City offers a Defined Pension plan to certain employees. As permitted by GASB 68, the pension-related assets, liabilities and other financial statement elements recorded in the accompanying basic financial statements for June 30, 2019 are based on a pension plan measurement date of June 30, 2018.
Membership in the City’s Pension Plan consists of the following at June 30, 2018, the date of the most recent actuarial valuation:
City Members
JMRL Members
CACVB Members
Retirees and beneficiaries currently receiving benefits 595 39 6 Vested terminated employees 412 12 4 Current employees: Vested 455 25 - Nonvested 278 - - Total 1,740 76 10
Contributions. The contribution requirements of plan members and the City are described in Note 10. The contribution rates for 2018 are based on the July 1, 2016, actuarial report. The general employee contribution rate for 2018 was 19.72% and the public safety contribution rate was 37.53%.
Actuarial methods and assumptions. The actuarial determined contribution (ADC) for the plan was determined as part of the July 1, 2016 actuarial valuation using the following methods and assumptions:
Method Assumption Actuarial cost method Entry Age Normal Amortization method Level percent of payroll Amortization period remaining 20 years Asset valuation method 4-year smoothed market Investment return, including inflation 7.5% Projected salary increases Range 2.0% - 4.0% Assumed inflation rate 2.0% per annum, compounded annually Cost of living adjustment, ad hoc 1% per year
Mortality rates. Healthy Lives –RP-2000 table, fully generational, projected with scale AA; Disabled Lives – RP-2000 table, fully generational, projected with scale AA, set forward 5 years for males and females.
Net pension liability. The City’s net pension liability was measured as of June 30, 2018. The total pension liability used to calculate the net pension liability was determined by an actuarial valuation performed as of June 30, 2017, using updated actuarial assumptions, applied to all periods included in the measurement and rolled forward to the measurement date of June 30, 2018. The following chart is for the plan as a whole. The City’s portion of the plan is 95.20%.
Target Long-Term ExpectedAsset Class Allocation Real Rate of Return
Domestic equity: Large Cap 30.0% 4.8% Mid Cap 12.5% 8.0% Small Cap 7.5% 6.8%International equity 10.0% 3.9%Emerging equity 5.0% 7.3%Real estate 10.0% 6.8%Farmland 5.0% 10.4%Fixed income 20.0% 2.8% Total 100% 5.5%
72
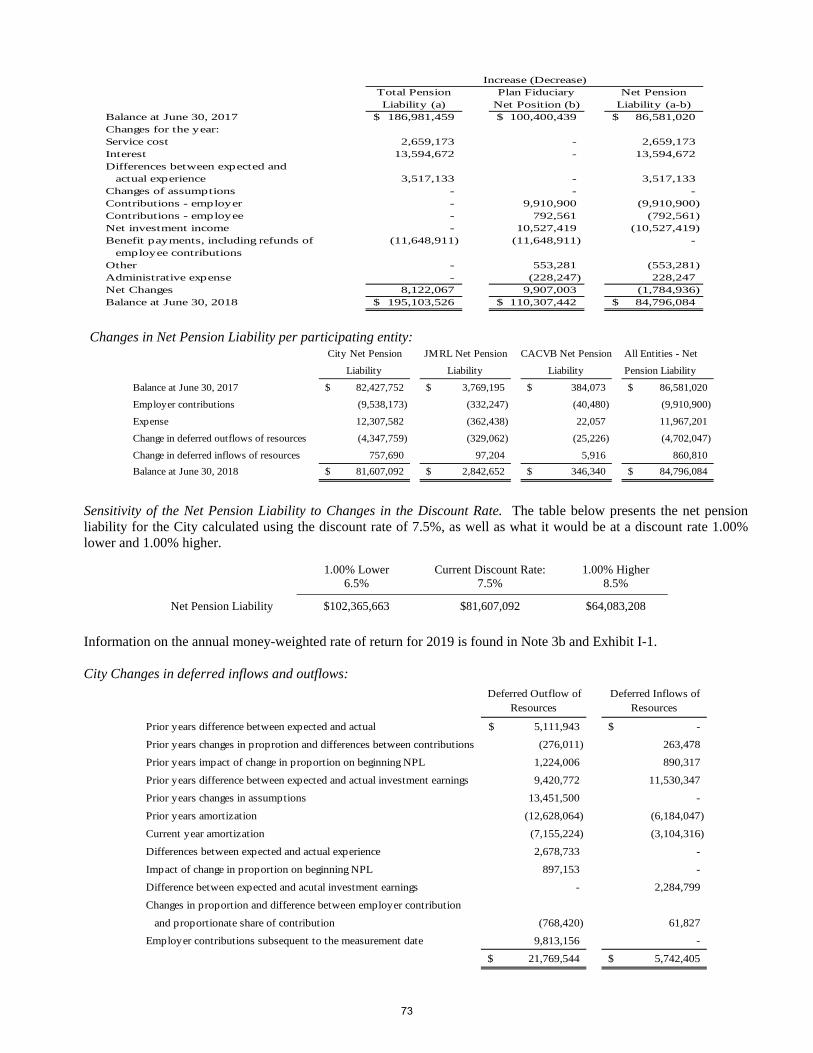
Changes in Net Pension Liability per participating entity: City Net Pension JMRL Net Pension CACVB Net Pension All Entities - Net
Liability Liability Liability Pension Liability
Balance at June 30, 2017 82,427,752$ 3,769,195$ 384,073$ 86,581,020$
Employer contributions (9,538,173) (332,247) (40,480) (9,910,900)
Expense 12,307,582 (362,438) 22,057 11,967,201
Change in deferred outflows of resources (4,347,759) (329,062) (25,226) (4,702,047)
Change in deferred inflows of resources 757,690 97,204 5,916 860,810
Balance at June 30, 2018 81,607,092$ 2,842,652$ 346,340$ 84,796,084$
Sensitivity of the Net Pension Liability to Changes in the Discount Rate. The table below presents the net pension liability for the City calculated using the discount rate of 7.5%, as well as what it would be at a discount rate 1.00% lower and 1.00% higher.
1.00% Lower
6.5% Current Discount Rate:
7.5% 1.00% Higher
8.5%
Net Pension Liability $102,365,663 $81,607,092 $64,083,208
Information on the annual money-weighted rate of return for 2019 is found in Note 3b and Exhibit I-1. City Changes in deferred inflows and outflows:
Deferred Outflow of Resources
Deferred Inflows of Resources
Prior years difference between expected and actual 5,111,943$ -$
Prior years changes in proprotion and differences between contributions (276,011) 263,478
Prior years impact of change in proportion on beginning NPL 1,224,006 890,317
Prior years difference between expected and actual investment earnings 9,420,772 11,530,347
Prior years changes in assumptions 13,451,500 -
Prior years amortization (12,628,064) (6,184,047)
Current year amortization (7,155,224) (3,104,316)
Differences between expected and actual experience 2,678,733 -
Impact of change in proportion on beginning NPL 897,153 -
Difference between expected and acutal investment earnings - 2,284,799
Changes in proportion and difference between employer contribution
and proportionate share of contribution (768,420) 61,827
Employer contributions subsequent to the measurement date 9,813,156 -
21,769,544$ 5,742,405$
Total Pension Plan Fiduciary Net PensionLiability (a) Net Position (b) Liability (a-b)
Balance at June 30, 2017 186,981,459$ 100,400,439$ 86,581,020$ Changes for the year:Service cost 2,659,173 - 2,659,173 Interest 13,594,672 - 13,594,672 Differences between expected and
actual experience 3,517,133 - 3,517,133 Changes of assumptions - - - Contributions - employer - 9,910,900 (9,910,900) Contributions - employee - 792,561 (792,561) Net investment income - 10,527,419 (10,527,419) Benefit payments, including refunds of (11,648,911) (11,648,911) -
employee contributionsOther - 553,281 (553,281) Administrative expense - (228,247) 228,247 Net Changes 8,122,067 9,907,003 (1,784,936) Balance at June 30, 2018 195,103,526$ 110,307,442$ 84,796,084$
Increase (Decrease)
73
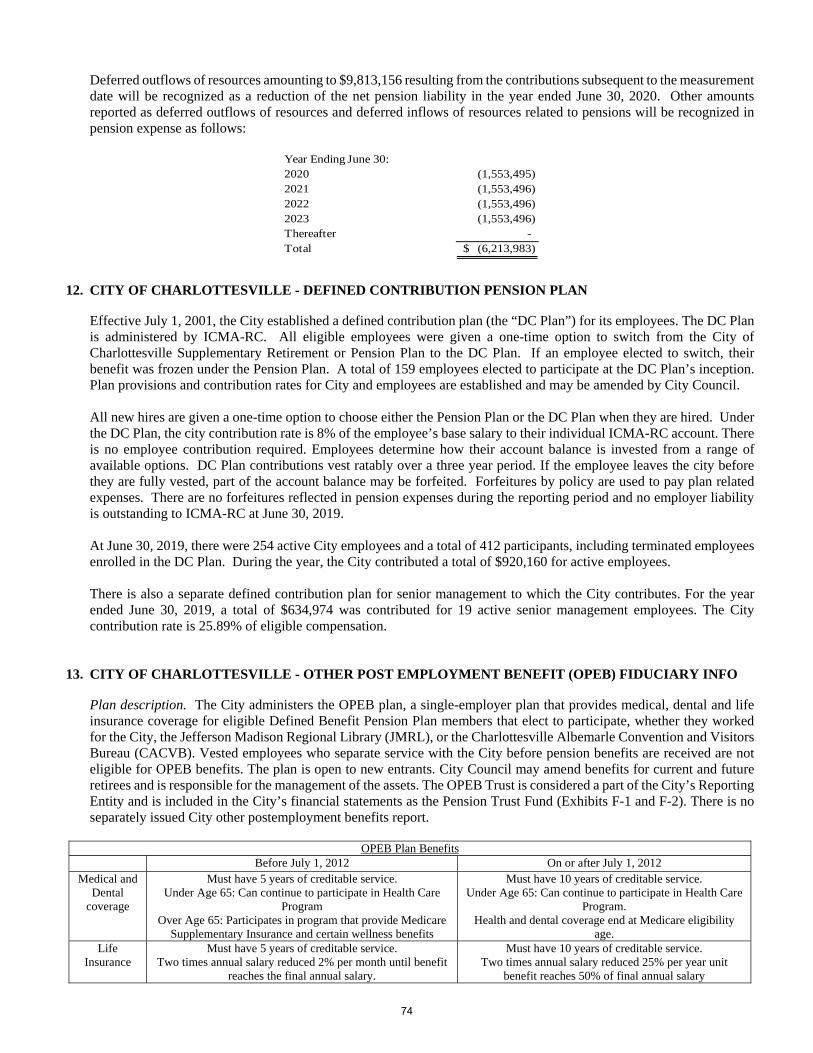
Deferred outflows of resources amounting to $9,813,156 resulting from the contributions subsequent to the measurement date will be recognized as a reduction of the net pension liability in the year ended June 30, 2020. Other amounts reported as deferred outflows of resources and deferred inflows of resources related to pensions will be recognized in pension expense as follows:
Year Ending June 30:2020 (1,553,495) 2021 (1,553,496) 2022 (1,553,496) 2023 (1,553,496) Thereafter - Total (6,213,983)$
12. CITY OF CHARLOTTESVILLE - DEFINED CONTRIBUTION PENSION PLAN
Effective July 1, 2001, the City established a defined contribution plan (the “DC Plan”) for its employees. The DC Plan is administered by ICMA-RC. All eligible employees were given a one-time option to switch from the City of Charlottesville Supplementary Retirement or Pension Plan to the DC Plan. If an employee elected to switch, their benefit was frozen under the Pension Plan. A total of 159 employees elected to participate at the DC Plan’s inception. Plan provisions and contribution rates for City and employees are established and may be amended by City Council.
All new hires are given a one-time option to choose either the Pension Plan or the DC Plan when they are hired. Under the DC Plan, the city contribution rate is 8% of the employee’s base salary to their individual ICMA-RC account. There is no employee contribution required. Employees determine how their account balance is invested from a range of available options. DC Plan contributions vest ratably over a three year period. If the employee leaves the city before they are fully vested, part of the account balance may be forfeited. Forfeitures by policy are used to pay plan related expenses. There are no forfeitures reflected in pension expenses during the reporting period and no employer liability is outstanding to ICMA-RC at June 30, 2019.
At June 30, 2019, there were 254 active City employees and a total of 412 participants, including terminated employees enrolled in the DC Plan. During the year, the City contributed a total of $920,160 for active employees. There is also a separate defined contribution plan for senior management to which the City contributes. For the year ended June 30, 2019, a total of $634,974 was contributed for 19 active senior management employees. The City contribution rate is 25.89% of eligible compensation.
13. CITY OF CHARLOTTESVILLE - OTHER POST EMPLOYMENT BENEFIT (OPEB) FIDUCIARY INFO
Plan description. The City administers the OPEB plan, a single-employer plan that provides medical, dental and life insurance coverage for eligible Defined Benefit Pension Plan members that elect to participate, whether they worked for the City, the Jefferson Madison Regional Library (JMRL), or the Charlottesville Albemarle Convention and Visitors Bureau (CACVB). Vested employees who separate service with the City before pension benefits are received are not eligible for OPEB benefits. The plan is open to new entrants. City Council may amend benefits for current and future retirees and is responsible for the management of the assets. The OPEB Trust is considered a part of the City’s Reporting Entity and is included in the City’s financial statements as the Pension Trust Fund (Exhibits F-1 and F-2). There is no separately issued City other postemployment benefits report.
OPEB Plan Benefits
Before July 1, 2012 On or after July 1, 2012 Medical and
Dental coverage
Must have 5 years of creditable service. Under Age 65: Can continue to participate in Health Care
Program Over Age 65: Participates in program that provide Medicare
Supplementary Insurance and certain wellness benefits
Must have 10 years of creditable service. Under Age 65: Can continue to participate in Health Care
Program. Health and dental coverage end at Medicare eligibility
age. Life
Insurance
Must have 5 years of creditable service. Two times annual salary reduced 2% per month until benefit
reaches the final annual salary.
Must have 10 years of creditable service. Two times annual salary reduced 25% per year unit
benefit reaches 50% of final annual salary
74
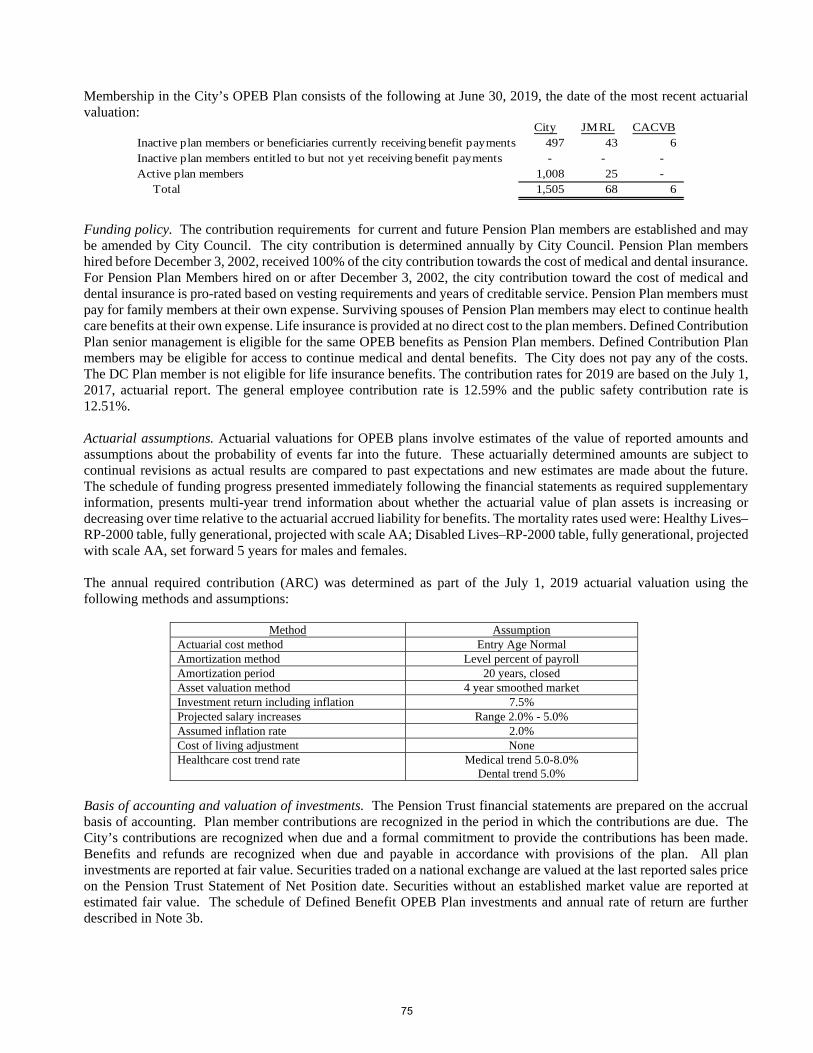
Membership in the City’s OPEB Plan consists of the following at June 30, 2019, the date of the most recent actuarial valuation:
City JMRL CACVBInactive plan members or beneficiaries currently receiving benefit payments 497 43 6 Inactive plan members entitled to but not yet receiving benefit payments - - - Active plan members 1,008 25 - Total 1,505 68 6
Funding policy. The contribution requirements for current and future Pension Plan members are established and may be amended by City Council. The city contribution is determined annually by City Council. Pension Plan members hired before December 3, 2002, received 100% of the city contribution towards the cost of medical and dental insurance. For Pension Plan Members hired on or after December 3, 2002, the city contribution toward the cost of medical and dental insurance is pro-rated based on vesting requirements and years of creditable service. Pension Plan members must pay for family members at their own expense. Surviving spouses of Pension Plan members may elect to continue health care benefits at their own expense. Life insurance is provided at no direct cost to the plan members. Defined Contribution Plan senior management is eligible for the same OPEB benefits as Pension Plan members. Defined Contribution Plan members may be eligible for access to continue medical and dental benefits. The City does not pay any of the costs. The DC Plan member is not eligible for life insurance benefits. The contribution rates for 2019 are based on the July 1, 2017, actuarial report. The general employee contribution rate is 12.59% and the public safety contribution rate is 12.51%.
Actuarial assumptions. Actuarial valuations for OPEB plans involve estimates of the value of reported amounts and assumptions about the probability of events far into the future. These actuarially determined amounts are subject to continual revisions as actual results are compared to past expectations and new estimates are made about the future. The schedule of funding progress presented immediately following the financial statements as required supplementary information, presents multi-year trend information about whether the actuarial value of plan assets is increasing or decreasing over time relative to the actuarial accrued liability for benefits. The mortality rates used were: Healthy Lives–RP-2000 table, fully generational, projected with scale AA; Disabled Lives–RP-2000 table, fully generational, projected with scale AA, set forward 5 years for males and females.
The annual required contribution (ARC) was determined as part of the July 1, 2019 actuarial valuation using the following methods and assumptions:
Method Assumption
Actuarial cost method Entry Age Normal Amortization method Level percent of payroll Amortization period 20 years, closed Asset valuation method 4 year smoothed market Investment return including inflation 7.5% Projected salary increases Range 2.0% - 5.0% Assumed inflation rate 2.0% Cost of living adjustment None Healthcare cost trend rate Medical trend 5.0-8.0%
Dental trend 5.0%
Basis of accounting and valuation of investments. The Pension Trust financial statements are prepared on the accrual basis of accounting. Plan member contributions are recognized in the period in which the contributions are due. The City’s contributions are recognized when due and a formal commitment to provide the contributions has been made. Benefits and refunds are recognized when due and payable in accordance with provisions of the plan. All plan investments are reported at fair value. Securities traded on a national exchange are valued at the last reported sales price on the Pension Trust Statement of Net Position date. Securities without an established market value are reported at estimated fair value. The schedule of Defined Benefit OPEB Plan investments and annual rate of return are further described in Note 3b.
75
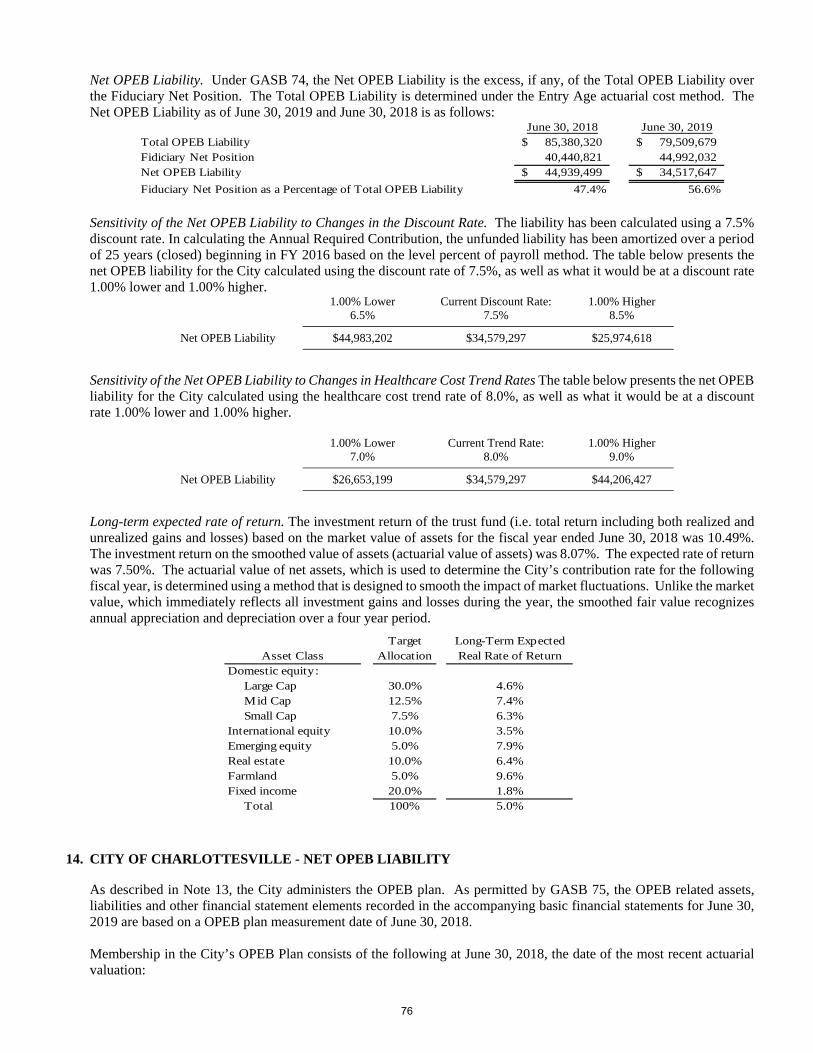
Net OPEB Liability. Under GASB 74, the Net OPEB Liability is the excess, if any, of the Total OPEB Liability over the Fiduciary Net Position. The Total OPEB Liability is determined under the Entry Age actuarial cost method. The Net OPEB Liability as of June 30, 2019 and June 30, 2018 is as follows:
June 30, 2018 June 30, 2019Total OPEB Liability 85,380,320$ 79,509,679$ Fidiciary Net Position 40,440,821 44,992,032 Net OPEB Liability 44,939,499$ 34,517,647$
Fiduciary Net Position as a Percentage of Total OPEB Liability 47.4% 56.6%
Sensitivity of the Net OPEB Liability to Changes in the Discount Rate. The liability has been calculated using a 7.5% discount rate. In calculating the Annual Required Contribution, the unfunded liability has been amortized over a period of 25 years (closed) beginning in FY 2016 based on the level percent of payroll method. The table below presents the net OPEB liability for the City calculated using the discount rate of 7.5%, as well as what it would be at a discount rate 1.00% lower and 1.00% higher.
1.00% Lower 6.5%
Current Discount Rate: 7.5%
1.00% Higher 8.5%
Net OPEB Liability $44,983,202 $34,579,297 $25,974,618
Sensitivity of the Net OPEB Liability to Changes in Healthcare Cost Trend Rates The table below presents the net OPEB liability for the City calculated using the healthcare cost trend rate of 8.0%, as well as what it would be at a discount rate 1.00% lower and 1.00% higher.
1.00% Lower
7.0% Current Trend Rate:
8.0% 1.00% Higher
9.0%
Net OPEB Liability $26,653,199 $34,579,297 $44,206,427
Long-term expected rate of return. The investment return of the trust fund (i.e. total return including both realized and unrealized gains and losses) based on the market value of assets for the fiscal year ended June 30, 2018 was 10.49%. The investment return on the smoothed value of assets (actuarial value of assets) was 8.07%. The expected rate of return was 7.50%. The actuarial value of net assets, which is used to determine the City’s contribution rate for the following fiscal year, is determined using a method that is designed to smooth the impact of market fluctuations. Unlike the market value, which immediately reflects all investment gains and losses during the year, the smoothed fair value recognizes annual appreciation and depreciation over a four year period.
14. CITY OF CHARLOTTESVILLE - NET OPEB LIABILITY
As described in Note 13, the City administers the OPEB plan. As permitted by GASB 75, the OPEB related assets, liabilities and other financial statement elements recorded in the accompanying basic financial statements for June 30, 2019 are based on a OPEB plan measurement date of June 30, 2018.
Membership in the City’s OPEB Plan consists of the following at June 30, 2018, the date of the most recent actuarial valuation:
Target Long-Term ExpectedAsset Class Allocation Real Rate of Return
Domestic equity: Large Cap 30.0% 4.6% Mid Cap 12.5% 7.4% Small Cap 7.5% 6.3%International equity 10.0% 3.5%Emerging equity 5.0% 7.9%Real estate 10.0% 6.4%Farmland 5.0% 9.6%Fixed income 20.0% 1.8% Total 100% 5.0%
76
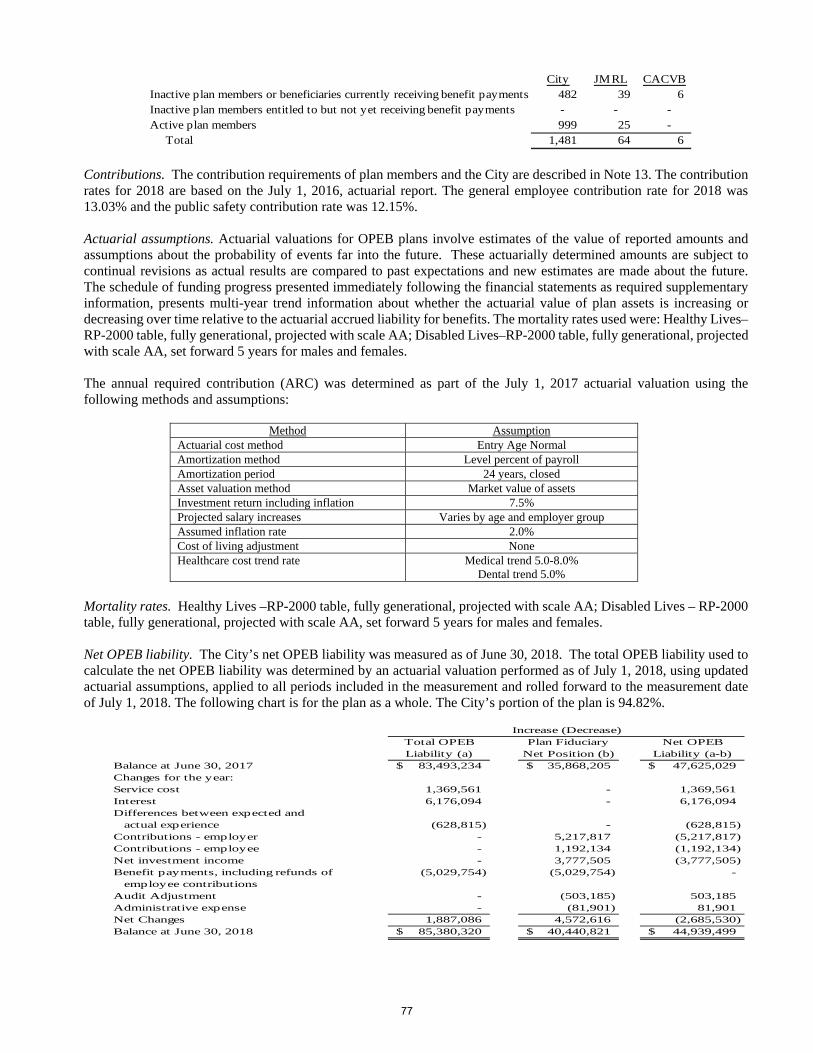
City JMRL CACVBInactive plan members or beneficiaries currently receiving benefit payments 482 39 6 Inactive plan members entitled to but not yet receiving benefit payments - - - Active plan members 999 25 - Total 1,481 64 6
Contributions. The contribution requirements of plan members and the City are described in Note 13. The contribution rates for 2018 are based on the July 1, 2016, actuarial report. The general employee contribution rate for 2018 was 13.03% and the public safety contribution rate was 12.15%.
Actuarial assumptions. Actuarial valuations for OPEB plans involve estimates of the value of reported amounts and assumptions about the probability of events far into the future. These actuarially determined amounts are subject to continual revisions as actual results are compared to past expectations and new estimates are made about the future. The schedule of funding progress presented immediately following the financial statements as required supplementary information, presents multi-year trend information about whether the actuarial value of plan assets is increasing or decreasing over time relative to the actuarial accrued liability for benefits. The mortality rates used were: Healthy Lives–RP-2000 table, fully generational, projected with scale AA; Disabled Lives–RP-2000 table, fully generational, projected with scale AA, set forward 5 years for males and females.
The annual required contribution (ARC) was determined as part of the July 1, 2017 actuarial valuation using the following methods and assumptions:
Method Assumption Actuarial cost method Entry Age Normal Amortization method Level percent of payroll Amortization period 24 years, closed Asset valuation method Market value of assets Investment return including inflation 7.5% Projected salary increases Varies by age and employer group Assumed inflation rate 2.0% Cost of living adjustment None Healthcare cost trend rate Medical trend 5.0-8.0%
Dental trend 5.0%
Mortality rates. Healthy Lives –RP-2000 table, fully generational, projected with scale AA; Disabled Lives – RP-2000 table, fully generational, projected with scale AA, set forward 5 years for males and females.
Net OPEB liability. The City’s net OPEB liability was measured as of June 30, 2018. The total OPEB liability used to calculate the net OPEB liability was determined by an actuarial valuation performed as of July 1, 2018, using updated actuarial assumptions, applied to all periods included in the measurement and rolled forward to the measurement date of July 1, 2018. The following chart is for the plan as a whole. The City’s portion of the plan is 94.82%.
Total OPEB Plan Fiduciary Net OPEBLiability (a) Net Position (b) Liability (a-b)
Balance at June 30, 2017 83,493,234$ 35,868,205$ 47,625,029$ Changes for the year:Service cost 1,369,561 - 1,369,561 Interest 6,176,094 - 6,176,094 Differences between expected and
actual experience (628,815) - (628,815) Contributions - employer - 5,217,817 (5,217,817) Contributions - employee - 1,192,134 (1,192,134) Net investment income - 3,777,505 (3,777,505) Benefit payments, including refunds of (5,029,754) (5,029,754) -
employee contributionsAudit Adjustment - (503,185) 503,185 Administrative expense - (81,901) 81,901 Net Changes 1,887,086 4,572,616 (2,685,530) Balance at June 30, 2018 85,380,320$ 40,440,821$ 44,939,499$
Increase (Decrease)
77
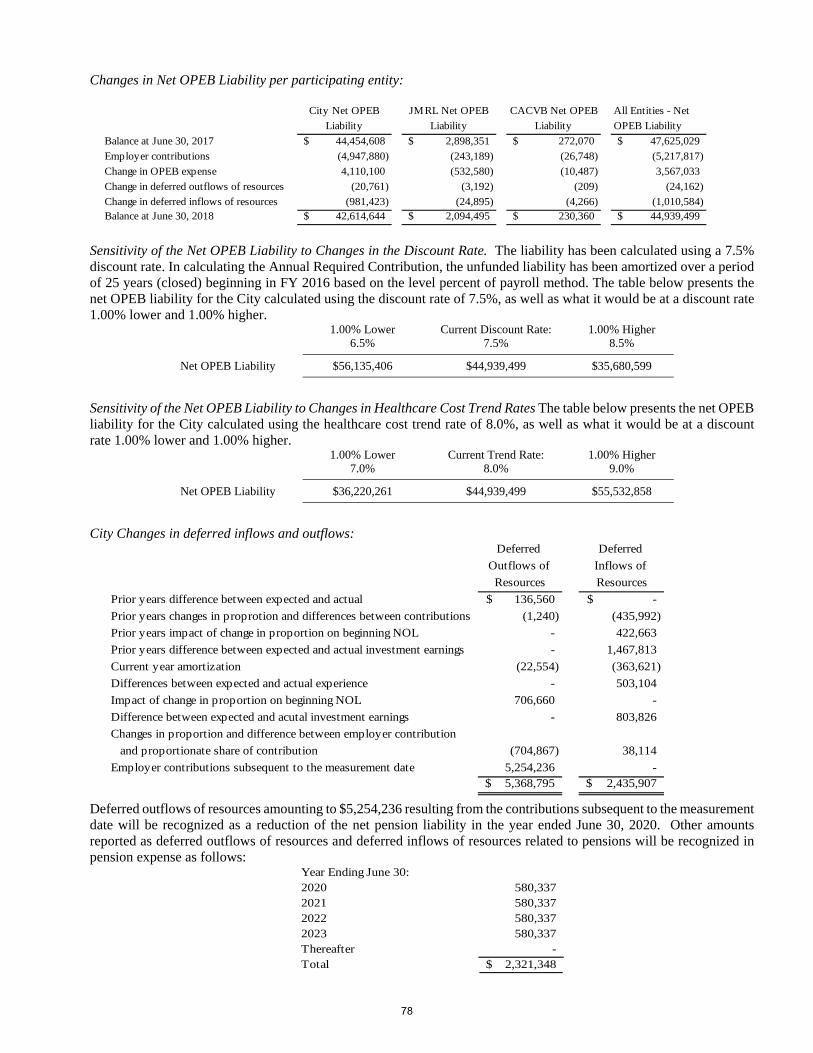
Changes in Net OPEB Liability per participating entity:
City Net OPEB JMRL Net OPEB CACVB Net OPEB All Entities - Net
Liability Liability Liability OPEB Liability
Balance at June 30, 2017 44,454,608$ 2,898,351$ 272,070$ 47,625,029$
Employer contributions (4,947,880) (243,189) (26,748) (5,217,817)
Change in OPEB expense 4,110,100 (532,580) (10,487) 3,567,033
Change in deferred outflows of resources (20,761) (3,192) (209) (24,162)
Change in deferred inflows of resources (981,423) (24,895) (4,266) (1,010,584) Balance at June 30, 2018 42,614,644$ 2,094,495$ 230,360$ 44,939,499$
Sensitivity of the Net OPEB Liability to Changes in the Discount Rate. The liability has been calculated using a 7.5% discount rate. In calculating the Annual Required Contribution, the unfunded liability has been amortized over a period of 25 years (closed) beginning in FY 2016 based on the level percent of payroll method. The table below presents the net OPEB liability for the City calculated using the discount rate of 7.5%, as well as what it would be at a discount rate 1.00% lower and 1.00% higher.
1.00% Lower 6.5%
Current Discount Rate: 7.5%
1.00% Higher 8.5%
Net OPEB Liability $56,135,406 $44,939,499 $35,680,599
Sensitivity of the Net OPEB Liability to Changes in Healthcare Cost Trend Rates The table below presents the net OPEB liability for the City calculated using the healthcare cost trend rate of 8.0%, as well as what it would be at a discount rate 1.00% lower and 1.00% higher.
1.00% Lower 7.0%
Current Trend Rate: 8.0%
1.00% Higher 9.0%
Net OPEB Liability $36,220,261 $44,939,499 $55,532,858
City Changes in deferred inflows and outflows: Deferred Deferred
Outflows of Inflows of
Resources Resources
Prior years difference between expected and actual 136,560$ -$
Prior years changes in proprotion and differences between contributions (1,240) (435,992)
Prior years impact of change in proportion on beginning NOL - 422,663
Prior years difference between expected and actual investment earnings - 1,467,813
Current year amortization (22,554) (363,621)
Differences between expected and actual experience - 503,104
Impact of change in proportion on beginning NOL 706,660 -
Difference between expected and acutal investment earnings - 803,826
Changes in proportion and difference between employer contribution
and proportionate share of contribution (704,867) 38,114
Employer contributions subsequent to the measurement date 5,254,236 - 5,368,795$ 2,435,907$
Deferred outflows of resources amounting to $5,254,236 resulting from the contributions subsequent to the measurement date will be recognized as a reduction of the net pension liability in the year ended June 30, 2020. Other amounts reported as deferred outflows of resources and deferred inflows of resources related to pensions will be recognized in pension expense as follows:
Year Ending June 30:2020 580,337 2021 580,337 2022 580,337 2023 580,337 Thereafter - Total 2,321,348$
78
15. PENSION OBLIGATIONS – SCHOOL BOARD
School Board Component Unit – Virginia Retirement System (VRS) Plan Description. The School Board contributes to the Virginia Retirement System (VRS), a group of qualified defined benefit retirement plans to provide pension benefits for all permanent full-time employees of the School Board. The VRS Plan for employees who are not teachers is an agent-multiple employer defined benefit plan and the VRS Plan for Teachers is a cost-sharing multiple employer defined benefit plan. Both Plans are administered by the Virginia Retirement System (the “System”). The VRS also provided Death and disability benefits. Title 51.1-145 of the Code of Virginia, as amended assigns the authority to establish and amend benefit provisions to the General Assembly of Virginia. School Board Teachers Cost Sharing Plan Description. All full-time, salaried permanent teachers are automatically enrolled in VRS upon employment. Benefits vest after five years of service credit, and are eligible to retire with an unreduced or reduced benefit when they meet the age and service requirements of the plan. Members can earn one month of service credit for each month they are employed and contributions are deposited into the VRS. Members are eligible to purchase prior public service, active duty military service, certain periods of leave and previously refunded VRS service as credit in their plan. Members become vested when they have at least 60 months of creditable service. Basic benefit is calculated based average final compensation, retirement multiplier, and total service credit at retirement. Plan 1 Description. The retirement benefit for teachers who became members before July 1, 2010 and were vested before January 1, 2013 is based on the average of the highest 36 months of compensation as a covered employee. The retirement multiplier for the creditable service purchased or granted before January 1, 2013 is 1.70%. Members must be 65 and have at least 5 years of creditable service, or age 50 with at least 30 years of creditable service to receive unreduced benefits. Early retirement age for Plan 1 member is 55 with at least 5 years of creditable service, or 50 with at least 10 years or creditable service. The Cost of Living Adjustment (the “COLA”) for Plan 1 members matches the first 3% of the Urban Consumers Consumer Price Index plus one half of any excess over 3% up to a maximum COLA of 5%. Plan 2 Description. The retirement benefit for teachers who became members after June 30, 2010, or their membership date is before July 1, 2010, and they were not vested as of January 1, 2013 is based on the average of the highest 60 months of compensation as a covered employee. The retirement multiplier for the creditable service purchased or granted after December 31, 2012 for Plan 2 members is 1.65%. The normal retirement age is Normal Social Security retirement age. Members must retire at the Normal Social Security Retirement Age with at least 5 years of creditable service or the sum of their age at retirement plus the years of creditable service equals 90 in order to receive an unreduced benefit. Early retirement age for Plan 2 members is 60 with at least 5 years of creditable service. The COLA for Plan 2 members matches the first 2% with a maximum COLA of 3%. Hybrid Plan Description. This plan combines features of a defined benefit plan and a defined contribution plan. The defined benefit is based on age, creditable service, and average final compensation. The defined contribution component depends on member and employer contributions made to the plan and the investment performance of those contributions. In addition to the monthly benefit payment from the defined benefit plan, members may receive distributions from the balance in the defined contributions account. Employees are eligible for this plan if either their membership date is on or after January 1, 2014, or they were members of Plan 1 or Plan 2 who elected to opt into the plan during election window from January 1-April 30, 2014. With the defined contribution component, a member is eligible to withdraw employer contributions, 50% after two years, 75% after three years, and 100% after four or more years, at which time they are vested and may withdraw all employer contributions. The retirement multiplier for the defined benefit is 1%. Contributions. Teachers and employers are required to contribute to the retirement plans as provided by Section 51.1-145 of the Code of Virginia, as amended. For Plans 1 and 2, teachers are required to contribute 5.0% of their compensation toward their retirement. Prior to July 1, 2012, all or part of the 5.0% teacher contribution may have been assumed by the employer. Beginning July 1, 2012, new teachers were required to pay the 5.0% member contribution. In addition, for existing teachers, employers were required to begin making the teacher pay the member contribution.
79
This could be phased in over a period of five years if the employer provided a salary increase equal to the amount of the increase in the teacher-paid member contribution. The Hybrid Plan contributions are mandatory and voluntary contributions made by the member and employer to both the defined benefit and defined contribution components. Mandatory contributions are based on a percentage of the employee’s creditable compensation and are required from both member and the employer. Members of this plan may choose to make voluntary contributions to the defined contributions component and the employer is required to match those voluntary contributions according to a specified percentage. The School Board’s contractually required rate for the year ended June 30, 2019 was 15.68% of covered teacher compensation. This rate was based on the actuarially determined rate from an actuarial valuation prepared as of June 30, 2017. The actuarial rate for the School Board plan was 15.68%. This actuarially determined rate, when combined with teacher contributions, was expected to finance the costs of the benefits earned by the employee during the year, with an additional amount to finance any unfunded accrued liability. Based on the provisions of Section 51.1-145 of the Code of Virginia, as amended, the contributions may be impacted as a result of funding provided to school divisions by the VA General Assembly. Contributions to the pension plan from the School Board were $6,344,268 and $6,355,218 for the years ended June 30, 2019 and 2018, respectively. Pension Liabilities, Pension expense, and Deferred Outflows and Deferred Inflows of Resources Related to Pensions At June 30, 2019, the School Board reported a liability of $56,399,000 for its proportionate share of the Net Pension Liability. The Net Pension Liability was measured as of June 30, 2018 and the total pension liability used to calculate the Net Pension Liability was determined by an actuarial valuation as of that date. The School Board’s proportion of the Net Pension Liability was based on the School Board’s actuarially determined employer contributions to the Plan for the year ended June 30, 2018 relative to the total of the actuarially determined employer contributions for all participating teachers. At June 30, 2018 the School Board’s proportion was .47959% as compared to .48042% at June 30, 2017. For the year ended June 30, 2019, the School Board recognized teacher pension expense of $3,476,000. Since there was a change in the proportionate share between measurement dates, a portion of the pension expense was related to the deferred amounts from changes in proportion and from differences between employer contributions and the proportionate share of the employer contributions. At June 30, 2019 the School Board reported deferred outflows and deferred inflows of resources related to teacher pensions from the following sources:
Deferred Outflows Deferred Inflowsof Resources of Resources
Net difference between projected and actual earnings onpension plan investments -$ 1,196,000$
Changes in proportion and differences between employer contributionsand proportionate share of contributions 696,000 431,000
Changes in assumptions 673,000 Net difference between expected and actual experience - 4,822,000 Employer contributions subsequent to the measurement date 6,158,803 - Total 7,527,803$ 6,449,000$ Deferred outflows of resources amounting to $6,158,803 related to teachers’ pensions resulting from employer contributions subsequent to the measurement date will be recognized as a reduction of the Net Pension Liability in the year ending June 30, 2020. Other amounts reported as deferred outflows and deferred inflows of resources related to teachers’ pensions will be recognized in pension expense as follows:
Year Ending June 30:2020 (638,059) 2021 (1,198,825) 2022 (2,367,716) 2023 (679,794) 2024 (195,606) Total (5,080,000)$
80
Actuarial assumptions. The total pension liability for the teachers’ pension was based on an actuarial valuation as of June 30, 2017, using the Entry Age Normal actuarial cost method and the following assumptions, applied to all periods included in the measurement and rolled forward to the measurement date of June 30, 2018:
Actuarial Cost Method Entry Age Normal
Investment Rate of Return 7.00%, net of pension plan investment expense, including inflation*
Inflation 2.5%
Projected Salary Increases 3.5 – 5.35%
* Administrative expenses as a percent of the market value of assets for the last experience study were found to be
approximately 0.06% of the market assets for all of the VRS plans. This would provide an assumed investment return rate for GAAP purposes of slightly more than the assumed 7.0%. However, since the difference was minimal, and a more conservative 7.0% investment return assumption provided a projected plan net position that exceeded the projected benefit payments, the long-term expected rate of return on investments was assumed to be 7.0% to simplify preparation of pension liabilities.
Mortality rates: Pre-Retirement – RP-2014 White Collar Employee Rates to age 80, White Collar Healthy Annuitant Rates at ages 81 and older projected with scale BB to 2020. Post-Retirement – RP-2014 White Collar Employee Rates to age 49, White Collar Healthy Annuitant Rates at ages 50 and older projected with scale BB to 2020; males 1% increase compounded from ages 70 to 90; females set back 3 years with 1.5% increase compounded from ages 65 to 70 and 2.0% increase compounded from ages 75 to 90. Post-Disablement – RP-2014 Disability Mortality Rates projected with scale BB to 2020; 115% of rates for males and females. The actuarial assumptions used in the June 30, 2017 valuation were based on the results of an actuarial experience study for the four-year period from July 1, 2012 through June 30, 2016. Changes to the actuarial assumptions as a result of the experience study are as follows:
Mortality Rates (Pre-retirement, post-retirement healthy, and disabled)
Updated to a more current mortality table – RP-2014 projected to 2020
Retirement Rates Lowered rates at older ages and changed final retirement from 70 to 75
Withdrawal Rates Adjusted rates to better fit experience at each year age and service through 9 years of service
Disability Scales Adjust rates to better match experience Salary Scale No change
Net Pension Liability The net pension liability (NPL) is calculated separately for each system and represents that particular system’s total pension liability determined in accordance with GASB Statement No. 67, less that system’s fiduciary net position. As of June 30, 2018, NPL amounts for the VRS Teacher Employee Retirement Plan is as follows (amounts expressed in thousands):
Teacher Employee Retirement Plan
Total Pension Liability 46,679,555$ Plan Fiduciary Net Position 34,919,563 Employer's Net Pension Liability (Asset) 11,759,992$
Plan Fiduciary Net Position as a Percentage of the Total Pension Liability 74.81%
Long-term Expected Rate of Return. The long term expected rate of return on pension plan investments was determined using a log-normal distribution analysis in which best-estimate ranges of expected future real rated of return (expected returns, net of pension System investment expenses and inflation) are developed for each major asset class. These ranges are combined to produce the long-term expected rate of return by weighting the expected future real rates of
81
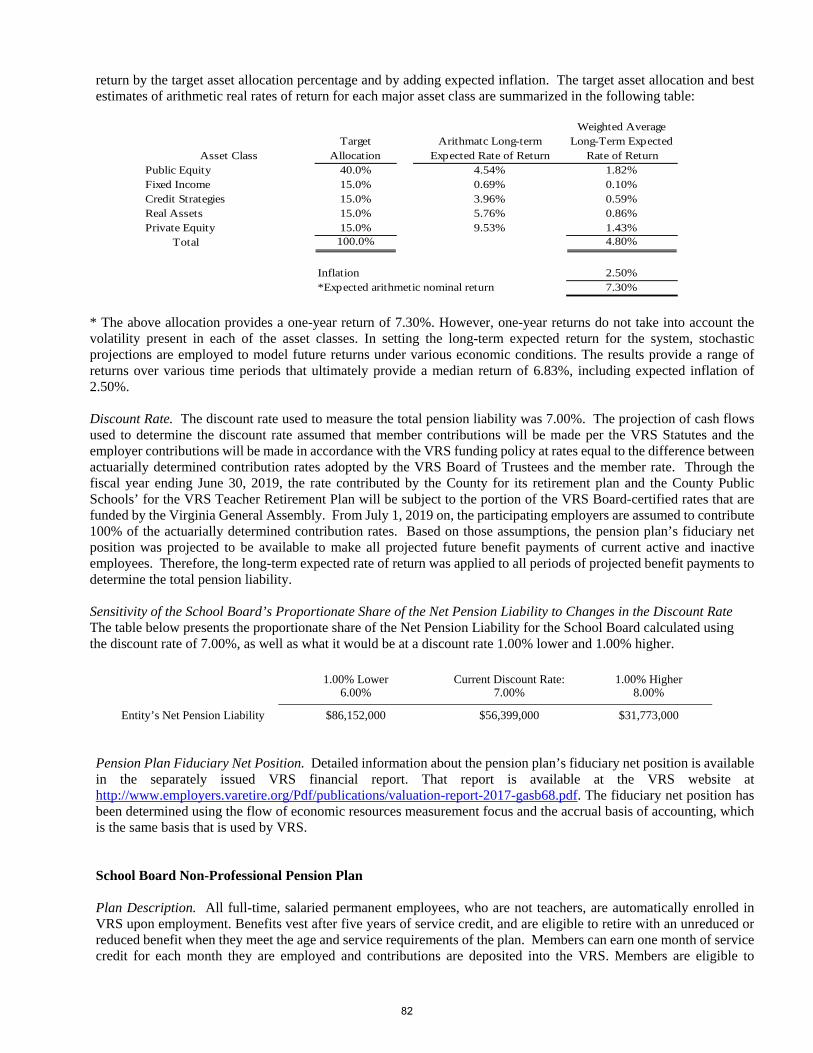
return by the target asset allocation percentage and by adding expected inflation. The target asset allocation and best estimates of arithmetic real rates of return for each major asset class are summarized in the following table:
Weighted AverageTarget Arithmatc Long-term Long-Term Expected
Allocation Expected Rate of Return Rate of ReturnPublic Equity 40.0% 4.54% 1.82%Fixed Income 15.0% 0.69% 0.10%Credit Strategies 15.0% 3.96% 0.59%Real Assets 15.0% 5.76% 0.86%Private Equity 15.0% 9.53% 1.43%
Total 100.0% 4.80%
Inflation 2.50%*Expected arithmetic nominal return 7.30%
Asset Class
* The above allocation provides a one-year return of 7.30%. However, one-year returns do not take into account the volatility present in each of the asset classes. In setting the long-term expected return for the system, stochastic projections are employed to model future returns under various economic conditions. The results provide a range of returns over various time periods that ultimately provide a median return of 6.83%, including expected inflation of 2.50%. Discount Rate. The discount rate used to measure the total pension liability was 7.00%. The projection of cash flows used to determine the discount rate assumed that member contributions will be made per the VRS Statutes and the employer contributions will be made in accordance with the VRS funding policy at rates equal to the difference between actuarially determined contribution rates adopted by the VRS Board of Trustees and the member rate. Through the fiscal year ending June 30, 2019, the rate contributed by the County for its retirement plan and the County Public Schools’ for the VRS Teacher Retirement Plan will be subject to the portion of the VRS Board-certified rates that are funded by the Virginia General Assembly. From July 1, 2019 on, the participating employers are assumed to contribute 100% of the actuarially determined contribution rates. Based on those assumptions, the pension plan’s fiduciary net position was projected to be available to make all projected future benefit payments of current active and inactive employees. Therefore, the long-term expected rate of return was applied to all periods of projected benefit payments to determine the total pension liability. Sensitivity of the School Board’s Proportionate Share of the Net Pension Liability to Changes in the Discount Rate The table below presents the proportionate share of the Net Pension Liability for the School Board calculated using the discount rate of 7.00%, as well as what it would be at a discount rate 1.00% lower and 1.00% higher.
1.00% Lower 6.00%
Current Discount Rate: 7.00%
1.00% Higher 8.00%
Entity’s Net Pension Liability $86,152,000 $56,399,000 $31,773,000
Pension Plan Fiduciary Net Position. Detailed information about the pension plan’s fiduciary net position is available in the separately issued VRS financial report. That report is available at the VRS website at http://www.employers.varetire.org/Pdf/publications/valuation-report-2017-gasb68.pdf. The fiduciary net position has been determined using the flow of economic resources measurement focus and the accrual basis of accounting, which is the same basis that is used by VRS. School Board Non-Professional Pension Plan Plan Description. All full-time, salaried permanent employees, who are not teachers, are automatically enrolled in VRS upon employment. Benefits vest after five years of service credit, and are eligible to retire with an unreduced or reduced benefit when they meet the age and service requirements of the plan. Members can earn one month of service credit for each month they are employed and contributions are deposited into the VRS. Members are eligible to
82
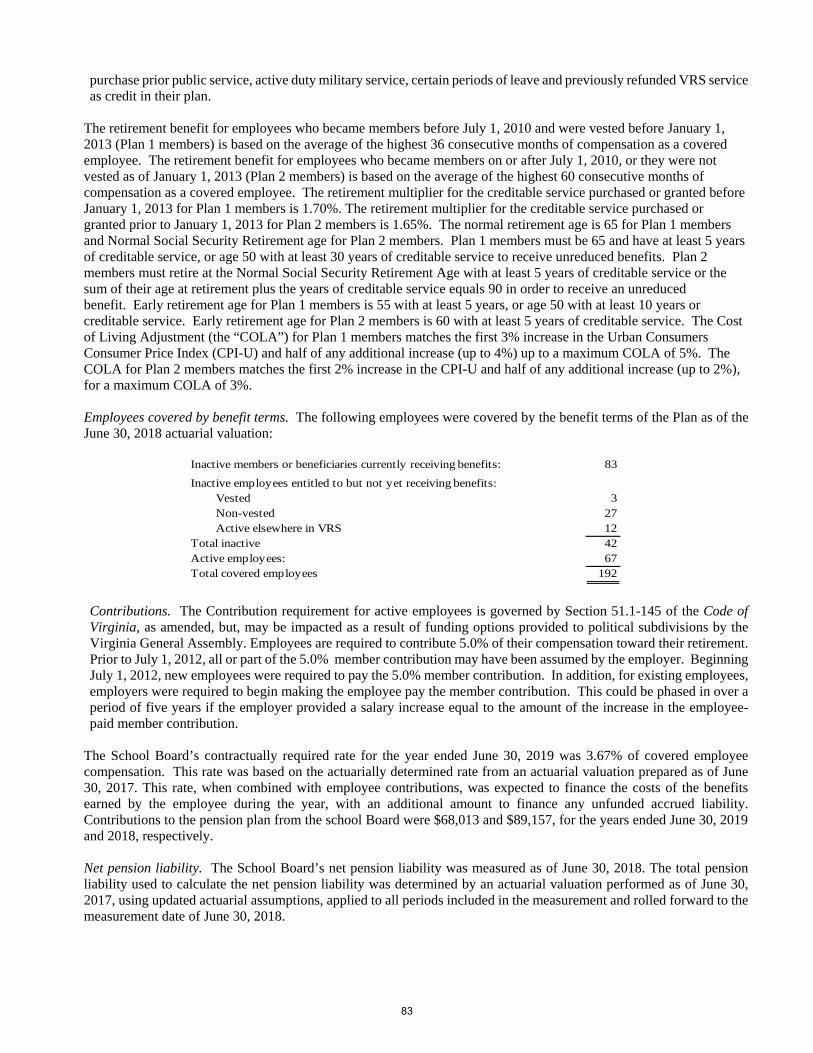
purchase prior public service, active duty military service, certain periods of leave and previously refunded VRS service as credit in their plan.
The retirement benefit for employees who became members before July 1, 2010 and were vested before January 1, 2013 (Plan 1 members) is based on the average of the highest 36 consecutive months of compensation as a covered employee. The retirement benefit for employees who became members on or after July 1, 2010, or they were not vested as of January 1, 2013 (Plan 2 members) is based on the average of the highest 60 consecutive months of compensation as a covered employee. The retirement multiplier for the creditable service purchased or granted before January 1, 2013 for Plan 1 members is 1.70%. The retirement multiplier for the creditable service purchased or granted prior to January 1, 2013 for Plan 2 members is 1.65%. The normal retirement age is 65 for Plan 1 members and Normal Social Security Retirement age for Plan 2 members. Plan 1 members must be 65 and have at least 5 years of creditable service, or age 50 with at least 30 years of creditable service to receive unreduced benefits. Plan 2 members must retire at the Normal Social Security Retirement Age with at least 5 years of creditable service or the sum of their age at retirement plus the years of creditable service equals 90 in order to receive an unreduced benefit. Early retirement age for Plan 1 members is 55 with at least 5 years, or age 50 with at least 10 years or creditable service. Early retirement age for Plan 2 members is 60 with at least 5 years of creditable service. The Cost of Living Adjustment (the “COLA”) for Plan 1 members matches the first 3% increase in the Urban Consumers Consumer Price Index (CPI-U) and half of any additional increase (up to 4%) up to a maximum COLA of 5%. The COLA for Plan 2 members matches the first 2% increase in the CPI-U and half of any additional increase (up to 2%), for a maximum COLA of 3%. Employees covered by benefit terms. The following employees were covered by the benefit terms of the Plan as of the June 30, 2018 actuarial valuation:
Inactive members or beneficiaries currently receiving benefits: 83
Inactive employees entitled to but not yet receiving benefits:Vested 3Non-vested 27Active elsewhere in VRS 12
Total inactive 42Active employees: 67Total covered employees 192
Contributions. The Contribution requirement for active employees is governed by Section 51.1-145 of the Code of Virginia, as amended, but, may be impacted as a result of funding options provided to political subdivisions by the Virginia General Assembly. Employees are required to contribute 5.0% of their compensation toward their retirement. Prior to July 1, 2012, all or part of the 5.0% member contribution may have been assumed by the employer. Beginning July 1, 2012, new employees were required to pay the 5.0% member contribution. In addition, for existing employees, employers were required to begin making the employee pay the member contribution. This could be phased in over a period of five years if the employer provided a salary increase equal to the amount of the increase in the employee-paid member contribution.
The School Board’s contractually required rate for the year ended June 30, 2019 was 3.67% of covered employee compensation. This rate was based on the actuarially determined rate from an actuarial valuation prepared as of June 30, 2017. This rate, when combined with employee contributions, was expected to finance the costs of the benefits earned by the employee during the year, with an additional amount to finance any unfunded accrued liability. Contributions to the pension plan from the school Board were $68,013 and $89,157, for the years ended June 30, 2019 and 2018, respectively. Net pension liability. The School Board’s net pension liability was measured as of June 30, 2018. The total pension liability used to calculate the net pension liability was determined by an actuarial valuation performed as of June 30, 2017, using updated actuarial assumptions, applied to all periods included in the measurement and rolled forward to the measurement date of June 30, 2018.
83
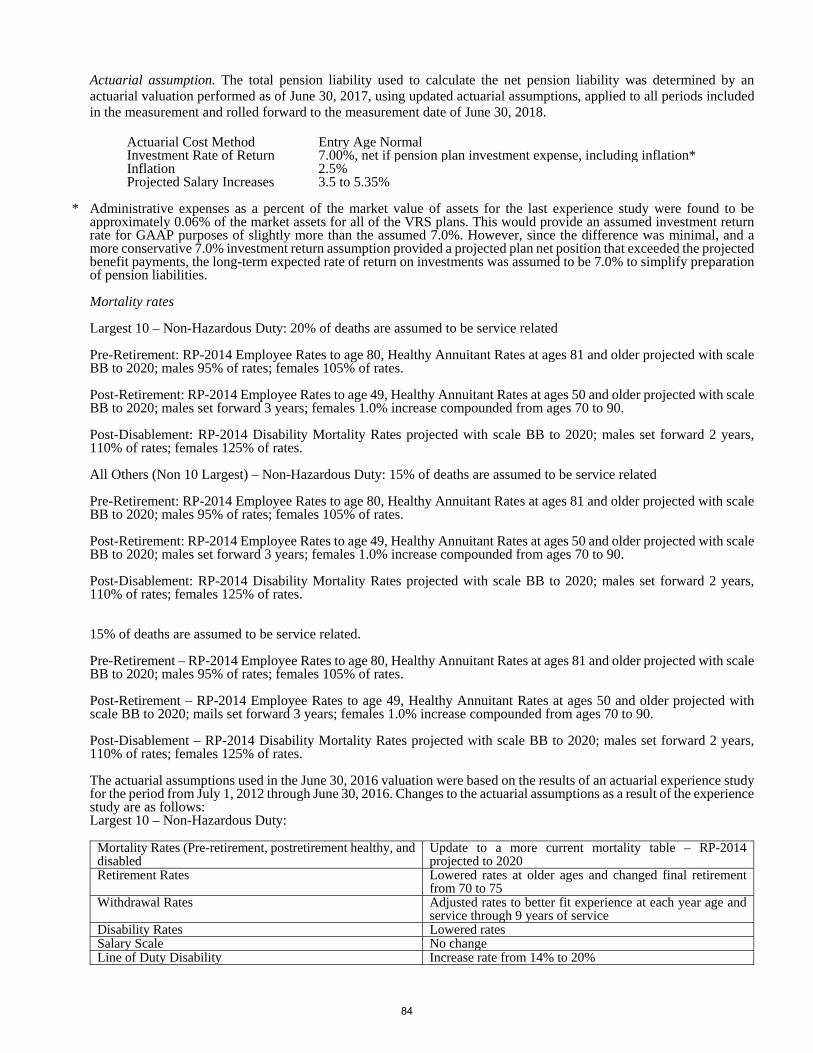
Actuarial assumption. The total pension liability used to calculate the net pension liability was determined by an actuarial valuation performed as of June 30, 2017, using updated actuarial assumptions, applied to all periods included in the measurement and rolled forward to the measurement date of June 30, 2018.
Actuarial Cost Method Entry Age Normal Investment Rate of Return 7.00%, net if pension plan investment expense, including inflation* Inflation 2.5%Projected Salary Increases 3.5 to 5.35%
* Administrative expenses as a percent of the market value of assets for the last experience study were found to beapproximately 0.06% of the market assets for all of the VRS plans. This would provide an assumed investment returnrate for GAAP purposes of slightly more than the assumed 7.0%. However, since the difference was minimal, and amore conservative 7.0% investment return assumption provided a projected plan net position that exceeded the projectedbenefit payments, the long-term expected rate of return on investments was assumed to be 7.0% to simplify preparationof pension liabilities.
Mortality rates
Largest 10 – Non-Hazardous Duty: 20% of deaths are assumed to be service related
Pre-Retirement: RP-2014 Employee Rates to age 80, Healthy Annuitant Rates at ages 81 and older projected with scaleBB to 2020; males 95% of rates; females 105% of rates.
Post-Retirement: RP-2014 Employee Rates to age 49, Healthy Annuitant Rates at ages 50 and older projected with scaleBB to 2020; males set forward 3 years; females 1.0% increase compounded from ages 70 to 90.
Post-Disablement: RP-2014 Disability Mortality Rates projected with scale BB to 2020; males set forward 2 years,110% of rates; females 125% of rates.
All Others (Non 10 Largest) – Non-Hazardous Duty: 15% of deaths are assumed to be service related
Pre-Retirement: RP-2014 Employee Rates to age 80, Healthy Annuitant Rates at ages 81 and older projected with scaleBB to 2020; males 95% of rates; females 105% of rates.
Post-Retirement: RP-2014 Employee Rates to age 49, Healthy Annuitant Rates at ages 50 and older projected with scaleBB to 2020; males set forward 3 years; females 1.0% increase compounded from ages 70 to 90.
Post-Disablement: RP-2014 Disability Mortality Rates projected with scale BB to 2020; males set forward 2 years,110% of rates; females 125% of rates.
15% of deaths are assumed to be service related.
Pre-Retirement – RP-2014 Employee Rates to age 80, Healthy Annuitant Rates at ages 81 and older projected with scaleBB to 2020; males 95% of rates; females 105% of rates.
Post-Retirement – RP-2014 Employee Rates to age 49, Healthy Annuitant Rates at ages 50 and older projected withscale BB to 2020; mails set forward 3 years; females 1.0% increase compounded from ages 70 to 90.
Post-Disablement – RP-2014 Disability Mortality Rates projected with scale BB to 2020; males set forward 2 years,110% of rates; females 125% of rates.
The actuarial assumptions used in the June 30, 2016 valuation were based on the results of an actuarial experience studyfor the period from July 1, 2012 through June 30, 2016. Changes to the actuarial assumptions as a result of the experiencestudy are as follows:Largest 10 – Non-Hazardous Duty:
Mortality Rates (Pre-retirement, postretirement healthy, and disabled
Update to a more current mortality table – RP-2014 projected to 2020
Retirement Rates Lowered rates at older ages and changed final retirement from 70 to 75
Withdrawal Rates Adjusted rates to better fit experience at each year age and service through 9 years of service
Disability Rates Lowered rates Salary Scale No change Line of Duty Disability Increase rate from 14% to 20%
84
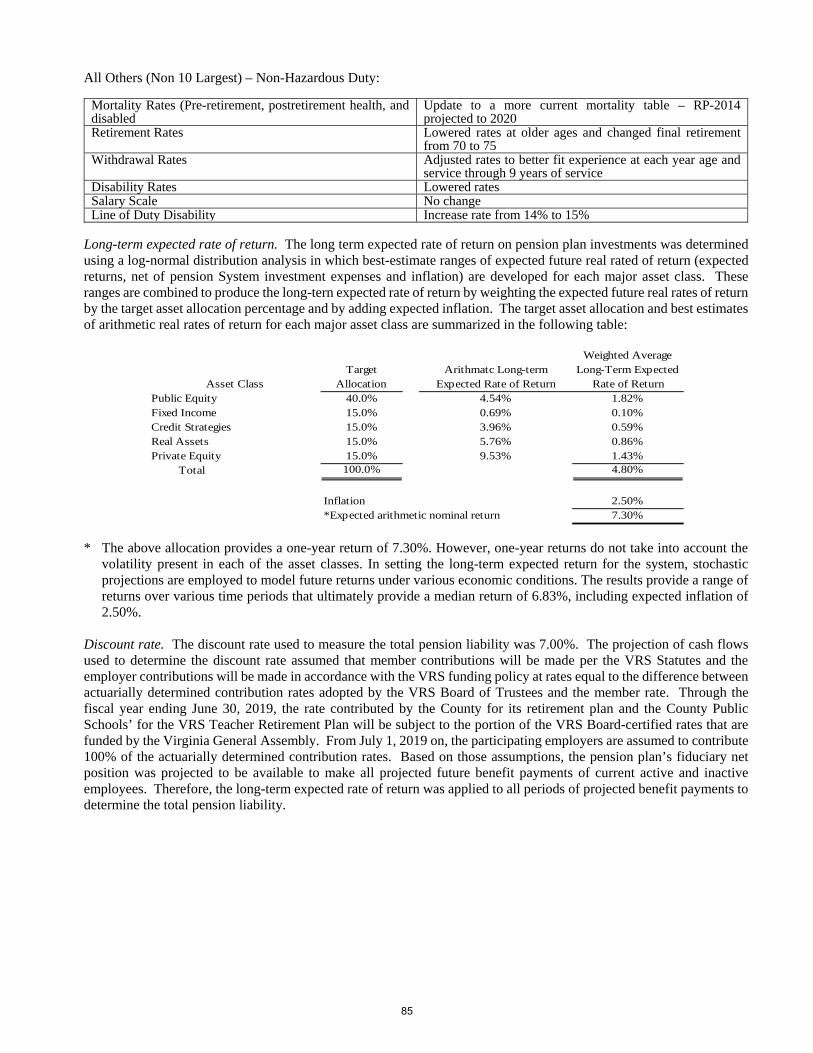
All Others (Non 10 Largest) – Non-Hazardous Duty:
Mortality Rates (Pre-retirement, postretirement health, and disabled
Update to a more current mortality table – RP-2014 projected to 2020
Retirement Rates Lowered rates at older ages and changed final retirement from 70 to 75
Withdrawal Rates Adjusted rates to better fit experience at each year age and service through 9 years of service
Disability Rates Lowered rates Salary Scale No change Line of Duty Disability Increase rate from 14% to 15%
Long-term expected rate of return. The long term expected rate of return on pension plan investments was determined using a log-normal distribution analysis in which best-estimate ranges of expected future real rated of return (expected returns, net of pension System investment expenses and inflation) are developed for each major asset class. These ranges are combined to produce the long-tern expected rate of return by weighting the expected future real rates of return by the target asset allocation percentage and by adding expected inflation. The target asset allocation and best estimates of arithmetic real rates of return for each major asset class are summarized in the following table:
Weighted AverageTarget Arithmatc Long-term Long-Term Expected
Allocation Expected Rate of Return Rate of ReturnPublic Equity 40.0% 4.54% 1.82%Fixed Income 15.0% 0.69% 0.10%Credit Strategies 15.0% 3.96% 0.59%Real Assets 15.0% 5.76% 0.86%Private Equity 15.0% 9.53% 1.43%
Total 100.0% 4.80%
Inflation 2.50%*Expected arithmetic nominal return 7.30%
Asset Class
* The above allocation provides a one-year return of 7.30%. However, one-year returns do not take into account the volatility present in each of the asset classes. In setting the long-term expected return for the system, stochastic projections are employed to model future returns under various economic conditions. The results provide a range of returns over various time periods that ultimately provide a median return of 6.83%, including expected inflation of 2.50%.
Discount rate. The discount rate used to measure the total pension liability was 7.00%. The projection of cash flows used to determine the discount rate assumed that member contributions will be made per the VRS Statutes and the employer contributions will be made in accordance with the VRS funding policy at rates equal to the difference between actuarially determined contribution rates adopted by the VRS Board of Trustees and the member rate. Through the fiscal year ending June 30, 2019, the rate contributed by the County for its retirement plan and the County Public Schools’ for the VRS Teacher Retirement Plan will be subject to the portion of the VRS Board-certified rates that are funded by the Virginia General Assembly. From July 1, 2019 on, the participating employers are assumed to contribute 100% of the actuarially determined contribution rates. Based on those assumptions, the pension plan’s fiduciary net position was projected to be available to make all projected future benefit payments of current active and inactive employees. Therefore, the long-term expected rate of return was applied to all periods of projected benefit payments to determine the total pension liability.
85
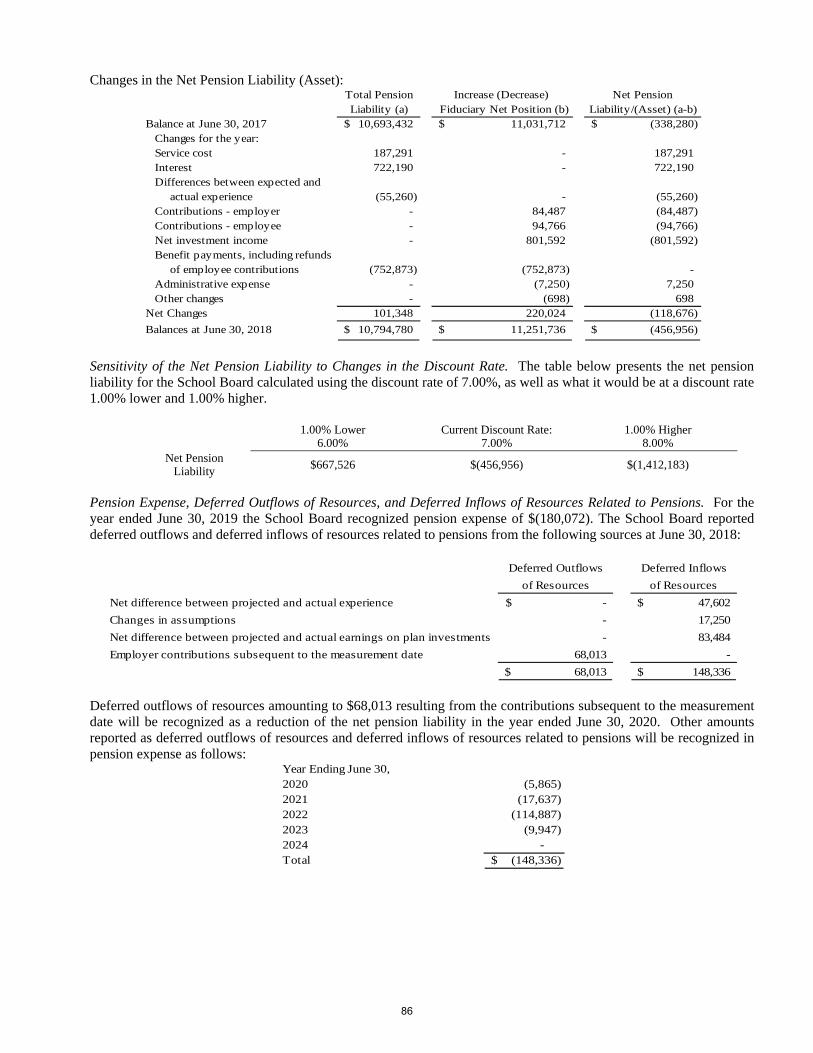
Changes in the Net Pension Liability (Asset): Total Pension Increase (Decrease) Net PensionLiability (a) Fiduciary Net Position (b) Liability/(Asset) (a-b)
Balance at June 30, 2017 10,693,432$ 11,031,712$ (338,280)$ Changes for the year: Service cost 187,291 - 187,291 Interest 722,190 - 722,190 Differences between expected and
actual experience (55,260) - (55,260) Contributions - employer - 84,487 (84,487) Contributions - employee - 94,766 (94,766) Net investment income - 801,592 (801,592) Benefit payments, including refunds
of employee contributions (752,873) (752,873) - Administrative expense - (7,250) 7,250 Other changes - (698) 698 Net Changes 101,348 220,024 (118,676)
Balances at June 30, 2018 10,794,780$ 11,251,736$ (456,956)$
Sensitivity of the Net Pension Liability to Changes in the Discount Rate. The table below presents the net pension liability for the School Board calculated using the discount rate of 7.00%, as well as what it would be at a discount rate 1.00% lower and 1.00% higher.
1.00% Lower 6.00%
Current Discount Rate: 7.00%
1.00% Higher 8.00%
Net Pension Liability $667,526 $(456,956) $(1,412,183)
Pension Expense, Deferred Outflows of Resources, and Deferred Inflows of Resources Related to Pensions. For the year ended June 30, 2019 the School Board recognized pension expense of $(180,072). The School Board reported deferred outflows and deferred inflows of resources related to pensions from the following sources at June 30, 2018:
Deferred Outflows Deferred Inflows
of Resources of Resources
Net difference between projected and actual experience -$ 47,602$
Changes in assumptions - 17,250
Net difference between projected and actual earnings on plan investments - 83,484
Employer contributions subsequent to the measurement date 68,013 -
68,013$ 148,336$
Deferred outflows of resources amounting to $68,013 resulting from the contributions subsequent to the measurement date will be recognized as a reduction of the net pension liability in the year ended June 30, 2020. Other amounts reported as deferred outflows of resources and deferred inflows of resources related to pensions will be recognized in pension expense as follows:
Year Ending June 30,2020 (5,865) 2021 (17,637) 2022 (114,887) 2023 (9,947) 2024 - Total (148,336)$
86
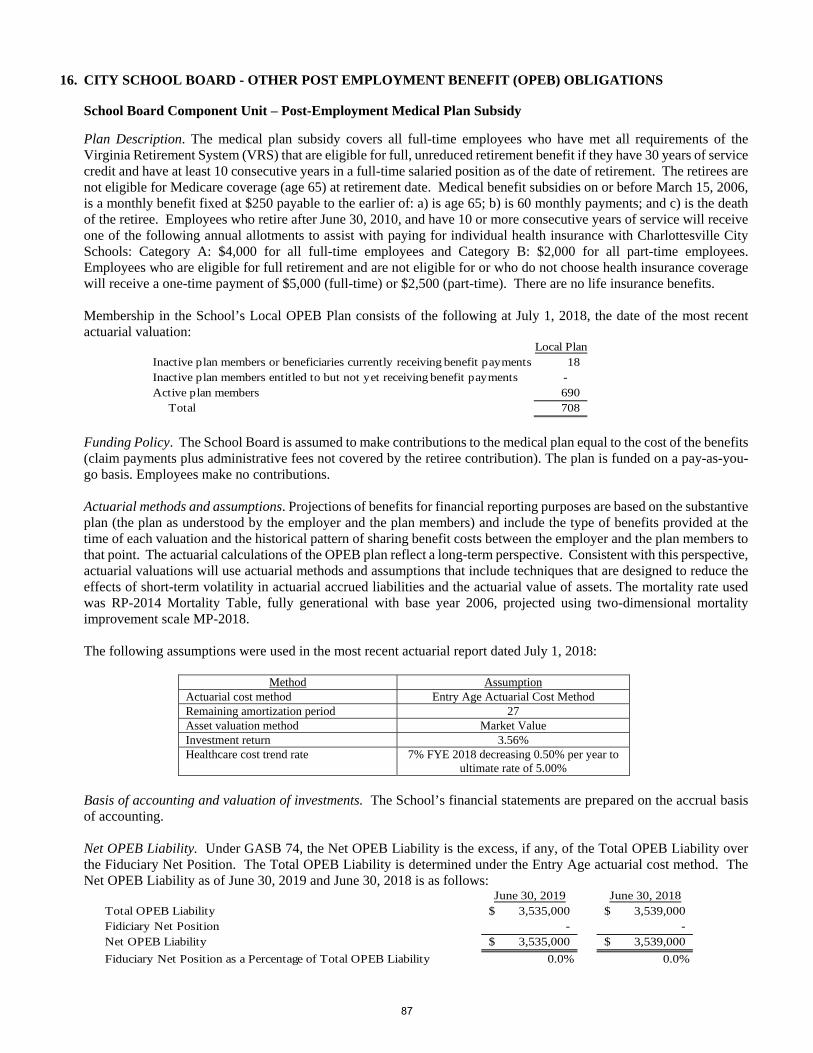
16. CITY SCHOOL BOARD - OTHER POST EMPLOYMENT BENEFIT (OPEB) OBLIGATIONS
School Board Component Unit – Post-Employment Medical Plan Subsidy
Plan Description. The medical plan subsidy covers all full-time employees who have met all requirements of the Virginia Retirement System (VRS) that are eligible for full, unreduced retirement benefit if they have 30 years of service credit and have at least 10 consecutive years in a full-time salaried position as of the date of retirement. The retirees are not eligible for Medicare coverage (age 65) at retirement date. Medical benefit subsidies on or before March 15, 2006, is a monthly benefit fixed at $250 payable to the earlier of: a) is age 65; b) is 60 monthly payments; and c) is the death of the retiree. Employees who retire after June 30, 2010, and have 10 or more consecutive years of service will receive one of the following annual allotments to assist with paying for individual health insurance with Charlottesville City Schools: Category A: $4,000 for all full-time employees and Category B: $2,000 for all part-time employees. Employees who are eligible for full retirement and are not eligible for or who do not choose health insurance coverage will receive a one-time payment of $5,000 (full-time) or $2,500 (part-time). There are no life insurance benefits.
Membership in the School’s Local OPEB Plan consists of the following at July 1, 2018, the date of the most recent actuarial valuation:
Local PlanInactive plan members or beneficiaries currently receiving benefit payments 18 Inactive plan members entitled to but not yet receiving benefit payments - Active plan members 690 Total 708
Funding Policy. The School Board is assumed to make contributions to the medical plan equal to the cost of the benefits (claim payments plus administrative fees not covered by the retiree contribution). The plan is funded on a pay-as-you-go basis. Employees make no contributions.
Actuarial methods and assumptions. Projections of benefits for financial reporting purposes are based on the substantive plan (the plan as understood by the employer and the plan members) and include the type of benefits provided at the time of each valuation and the historical pattern of sharing benefit costs between the employer and the plan members to that point. The actuarial calculations of the OPEB plan reflect a long-term perspective. Consistent with this perspective, actuarial valuations will use actuarial methods and assumptions that include techniques that are designed to reduce the effects of short-term volatility in actuarial accrued liabilities and the actuarial value of assets. The mortality rate used was RP-2014 Mortality Table, fully generational with base year 2006, projected using two-dimensional mortality improvement scale MP-2018.
The following assumptions were used in the most recent actuarial report dated July 1, 2018:
Method Assumption Actuarial cost method Entry Age Actuarial Cost Method Remaining amortization period 27 Asset valuation method Market Value Investment return 3.56% Healthcare cost trend rate 7% FYE 2018 decreasing 0.50% per year to
ultimate rate of 5.00%
Basis of accounting and valuation of investments. The School’s financial statements are prepared on the accrual basis of accounting.
Net OPEB Liability. Under GASB 74, the Net OPEB Liability is the excess, if any, of the Total OPEB Liability over the Fiduciary Net Position. The Total OPEB Liability is determined under the Entry Age actuarial cost method. The Net OPEB Liability as of June 30, 2019 and June 30, 2018 is as follows:
June 30, 2019 June 30, 2018Total OPEB Liability 3,535,000$ 3,539,000$ Fidiciary Net Position - - Net OPEB Liability 3,535,000$ 3,539,000$
Fiduciary Net Position as a Percentage of Total OPEB Liability 0.0% 0.0%
87
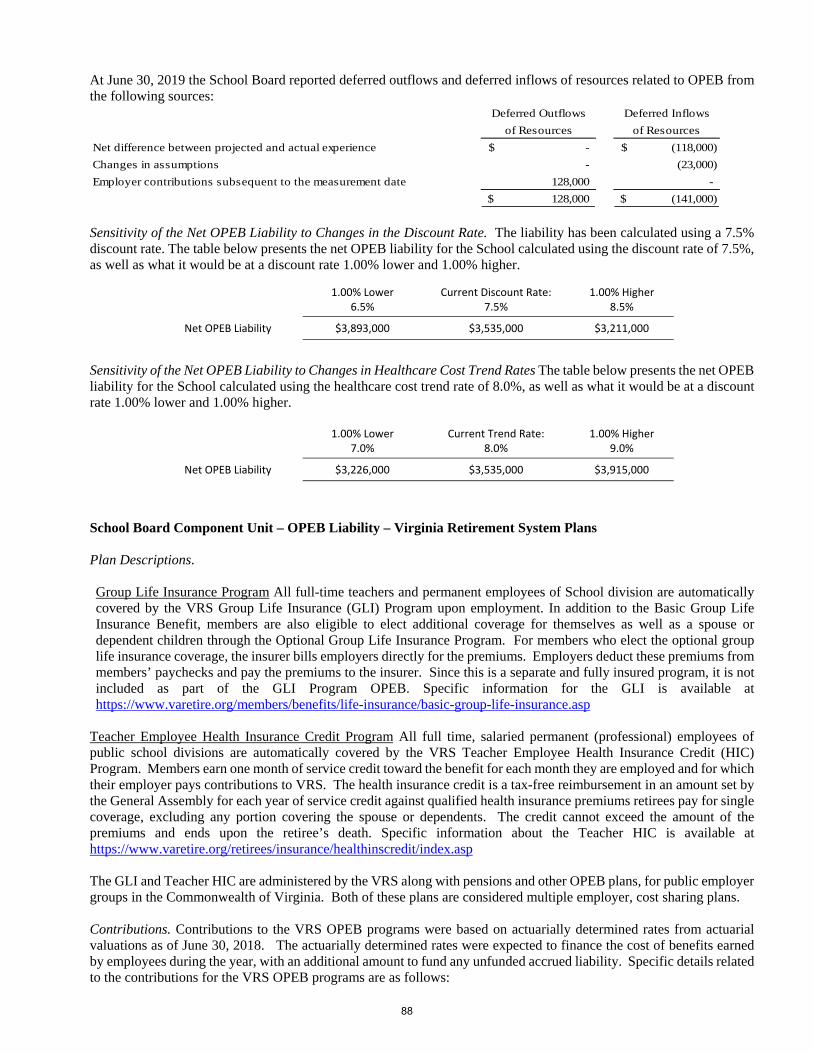
At June 30, 2019 the School Board reported deferred outflows and deferred inflows of resources related to OPEB from the following sources:
Deferred Outflows Deferred Inflows
of Resources of Resources
Net difference between projected and actual experience -$ (118,000)$
Changes in assumptions - (23,000)
Employer contributions subsequent to the measurement date 128,000 -
128,000$ (141,000)$ Sensitivity of the Net OPEB Liability to Changes in the Discount Rate. The liability has been calculated using a 7.5% discount rate. The table below presents the net OPEB liability for the School calculated using the discount rate of 7.5%, as well as what it would be at a discount rate 1.00% lower and 1.00% higher.
1.00% Lower
6.5% Current Discount Rate:
7.5% 1.00% Higher
8.5%
Net OPEB Liability $3,893,000 $3,535,000 $3,211,000
Sensitivity of the Net OPEB Liability to Changes in Healthcare Cost Trend Rates The table below presents the net OPEB liability for the School calculated using the healthcare cost trend rate of 8.0%, as well as what it would be at a discount rate 1.00% lower and 1.00% higher.
1.00% Lower 7.0%
Current Trend Rate: 8.0%
1.00% Higher 9.0%
Net OPEB Liability $3,226,000 $3,535,000 $3,915,000
School Board Component Unit – OPEB Liability – Virginia Retirement System Plans
Plan Descriptions.
Group Life Insurance Program All full-time teachers and permanent employees of School division are automatically covered by the VRS Group Life Insurance (GLI) Program upon employment. In addition to the Basic Group Life Insurance Benefit, members are also eligible to elect additional coverage for themselves as well as a spouse or dependent children through the Optional Group Life Insurance Program. For members who elect the optional group life insurance coverage, the insurer bills employers directly for the premiums. Employers deduct these premiums from members’ paychecks and pay the premiums to the insurer. Since this is a separate and fully insured program, it is not included as part of the GLI Program OPEB. Specific information for the GLI is available at https://www.varetire.org/members/benefits/life-insurance/basic-group-life-insurance.asp
Teacher Employee Health Insurance Credit Program All full time, salaried permanent (professional) employees of public school divisions are automatically covered by the VRS Teacher Employee Health Insurance Credit (HIC) Program. Members earn one month of service credit toward the benefit for each month they are employed and for which their employer pays contributions to VRS. The health insurance credit is a tax-free reimbursement in an amount set by the General Assembly for each year of service credit against qualified health insurance premiums retirees pay for single coverage, excluding any portion covering the spouse or dependents. The credit cannot exceed the amount of the premiums and ends upon the retiree’s death. Specific information about the Teacher HIC is available at https://www.varetire.org/retirees/insurance/healthinscredit/index.asp
The GLI and Teacher HIC are administered by the VRS along with pensions and other OPEB plans, for public employer groups in the Commonwealth of Virginia. Both of these plans are considered multiple employer, cost sharing plans.
Contributions. Contributions to the VRS OPEB programs were based on actuarially determined rates from actuarial valuations as of June 30, 2018. The actuarially determined rates were expected to finance the cost of benefits earned by employees during the year, with an additional amount to fund any unfunded accrued liability. Specific details related to the contributions for the VRS OPEB programs are as follows:
88
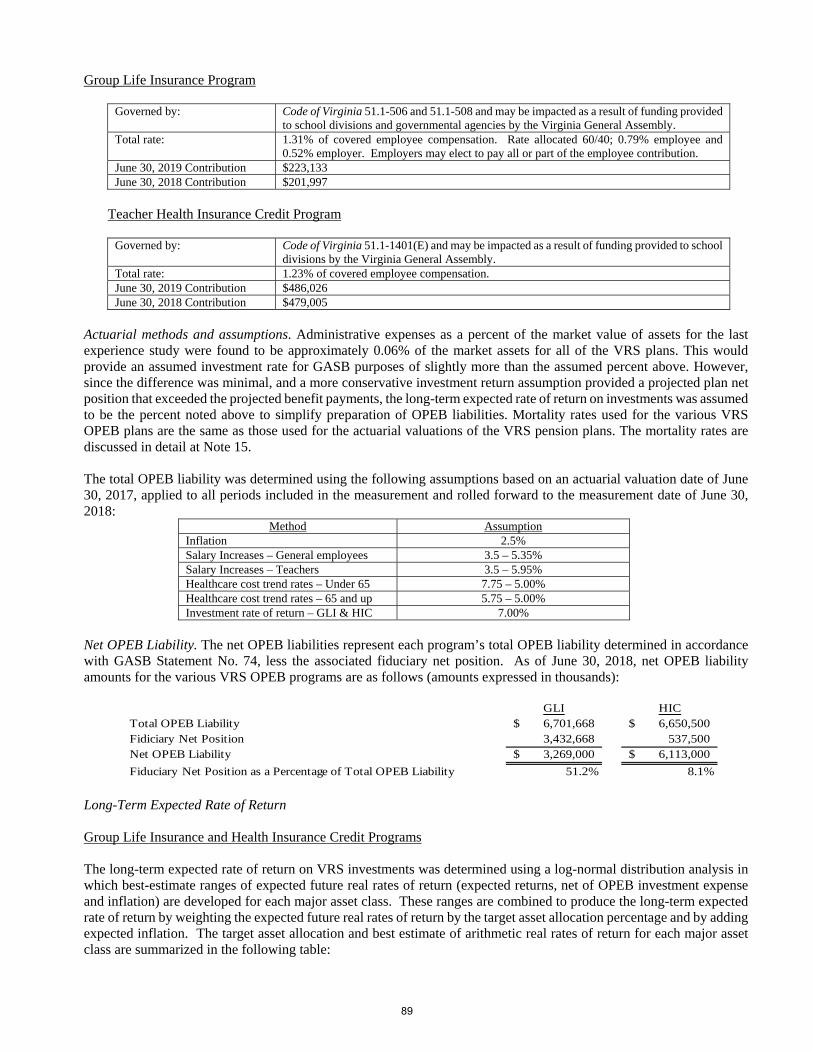
Group Life Insurance Program
Governed by: Code of Virginia 51.1-506 and 51.1-508 and may be impacted as a result of funding provided to school divisions and governmental agencies by the Virginia General Assembly.
Total rate: 1.31% of covered employee compensation. Rate allocated 60/40; 0.79% employee and 0.52% employer. Employers may elect to pay all or part of the employee contribution.
June 30, 2019 Contribution $223,133 June 30, 2018 Contribution $201,997
Teacher Health Insurance Credit Program
Governed by: Code of Virginia 51.1-1401(E) and may be impacted as a result of funding provided to school
divisions by the Virginia General Assembly. Total rate: 1.23% of covered employee compensation. June 30, 2019 Contribution $486,026 June 30, 2018 Contribution $479,005
Actuarial methods and assumptions. Administrative expenses as a percent of the market value of assets for the last experience study were found to be approximately 0.06% of the market assets for all of the VRS plans. This would provide an assumed investment rate for GASB purposes of slightly more than the assumed percent above. However, since the difference was minimal, and a more conservative investment return assumption provided a projected plan net position that exceeded the projected benefit payments, the long-term expected rate of return on investments was assumed to be the percent noted above to simplify preparation of OPEB liabilities. Mortality rates used for the various VRS OPEB plans are the same as those used for the actuarial valuations of the VRS pension plans. The mortality rates are discussed in detail at Note 15.
The total OPEB liability was determined using the following assumptions based on an actuarial valuation date of June 30, 2017, applied to all periods included in the measurement and rolled forward to the measurement date of June 30, 2018:
Method Assumption Inflation 2.5% Salary Increases – General employees 3.5 – 5.35% Salary Increases – Teachers 3.5 – 5.95% Healthcare cost trend rates – Under 65 7.75 – 5.00% Healthcare cost trend rates – 65 and up 5.75 – 5.00% Investment rate of return – GLI & HIC 7.00%
Net OPEB Liability. The net OPEB liabilities represent each program’s total OPEB liability determined in accordance with GASB Statement No. 74, less the associated fiduciary net position. As of June 30, 2018, net OPEB liability amounts for the various VRS OPEB programs are as follows (amounts expressed in thousands):
GLI HIC
Total OPEB Liability 6,701,668$ 6,650,500$ Fidiciary Net Position 3,432,668 537,500 Net OPEB Liability 3,269,000$ 6,113,000$
Fiduciary Net Position as a Percentage of Total OPEB Liability 51.2% 8.1%
Long-Term Expected Rate of Return
Group Life Insurance and Health Insurance Credit Programs
The long-term expected rate of return on VRS investments was determined using a log-normal distribution analysis in which best-estimate ranges of expected future real rates of return (expected returns, net of OPEB investment expense and inflation) are developed for each major asset class. These ranges are combined to produce the long-term expected rate of return by weighting the expected future real rates of return by the target asset allocation percentage and by adding expected inflation. The target asset allocation and best estimate of arithmetic real rates of return for each major asset class are summarized in the following table:
89
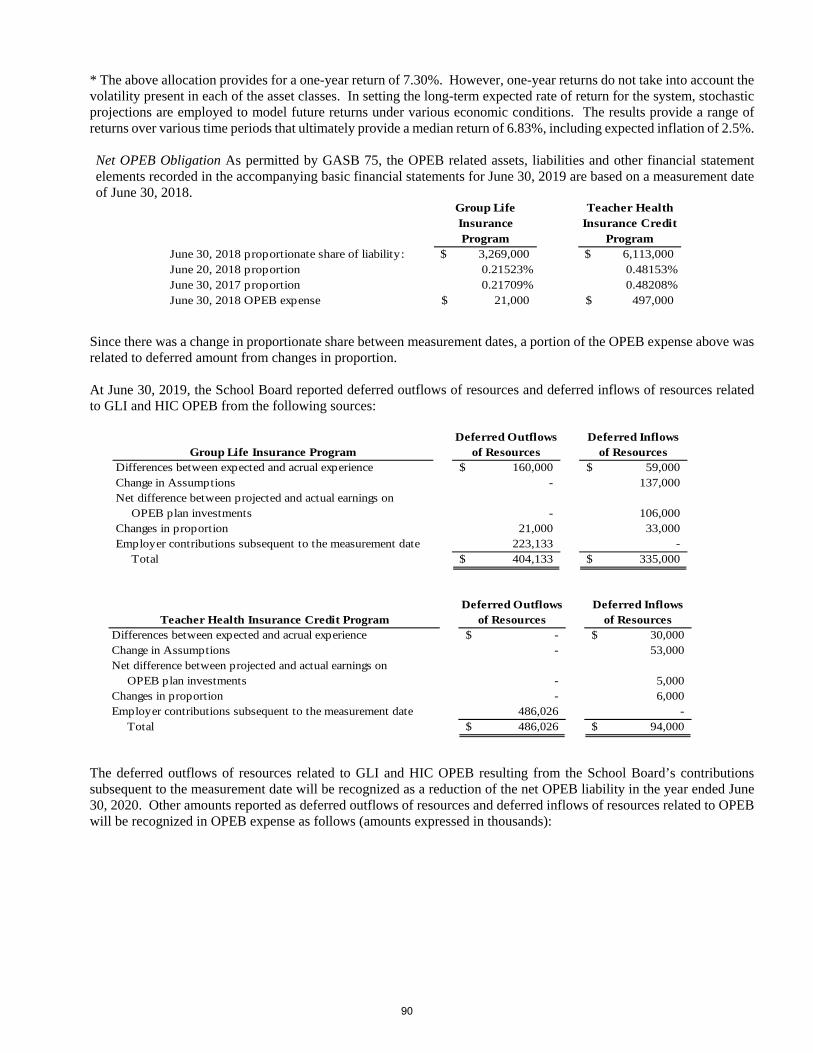
* The above allocation provides for a one-year return of 7.30%. However, one-year returns do not take into account the volatility present in each of the asset classes. In setting the long-term expected rate of return for the system, stochastic projections are employed to model future returns under various economic conditions. The results provide a range of returns over various time periods that ultimately provide a median return of 6.83%, including expected inflation of 2.5%.
Net OPEB Obligation As permitted by GASB 75, the OPEB related assets, liabilities and other financial statement elements recorded in the accompanying basic financial statements for June 30, 2019 are based on a measurement date of June 30, 2018.
Group Life Insurance Program
Teacher Health Insurance Credit
ProgramJune 30, 2018 proportionate share of liability: $ 3,269,000 $ 6,113,000 June 20, 2018 proportion 0.21523% 0.48153%June 30, 2017 proportion 0.21709% 0.48208%June 30, 2018 OPEB expense 21,000$ 497,000$
Since there was a change in proportionate share between measurement dates, a portion of the OPEB expense above was related to deferred amount from changes in proportion.
At June 30, 2019, the School Board reported deferred outflows of resources and deferred inflows of resources related to GLI and HIC OPEB from the following sources:
Deferred Outflows Deferred Inflows
Group Life Insurance Program of Resources of ResourcesDifferences between expected and acrual experience 160,000$ 59,000$ Change in Assumptions - 137,000 Net difference between projected and actual earnings on OPEB plan investments - 106,000 Changes in proportion 21,000 33,000 Employer contributions subsequent to the measurement date 223,133 - Total 404,133$ 335,000$
Deferred Outflows Deferred InflowsTeacher Health Insurance Credit Program of Resources of Resources
Differences between expected and acrual experience -$ 30,000$ Change in Assumptions - 53,000 Net difference between projected and actual earnings on OPEB plan investments - 5,000 Changes in proportion - 6,000 Employer contributions subsequent to the measurement date 486,026 - Total 486,026$ 94,000$
The deferred outflows of resources related to GLI and HIC OPEB resulting from the School Board’s contributions subsequent to the measurement date will be recognized as a reduction of the net OPEB liability in the year ended June 30, 2020. Other amounts reported as deferred outflows of resources and deferred inflows of resources related to OPEB will be recognized in OPEB expense as follows (amounts expressed in thousands):
90
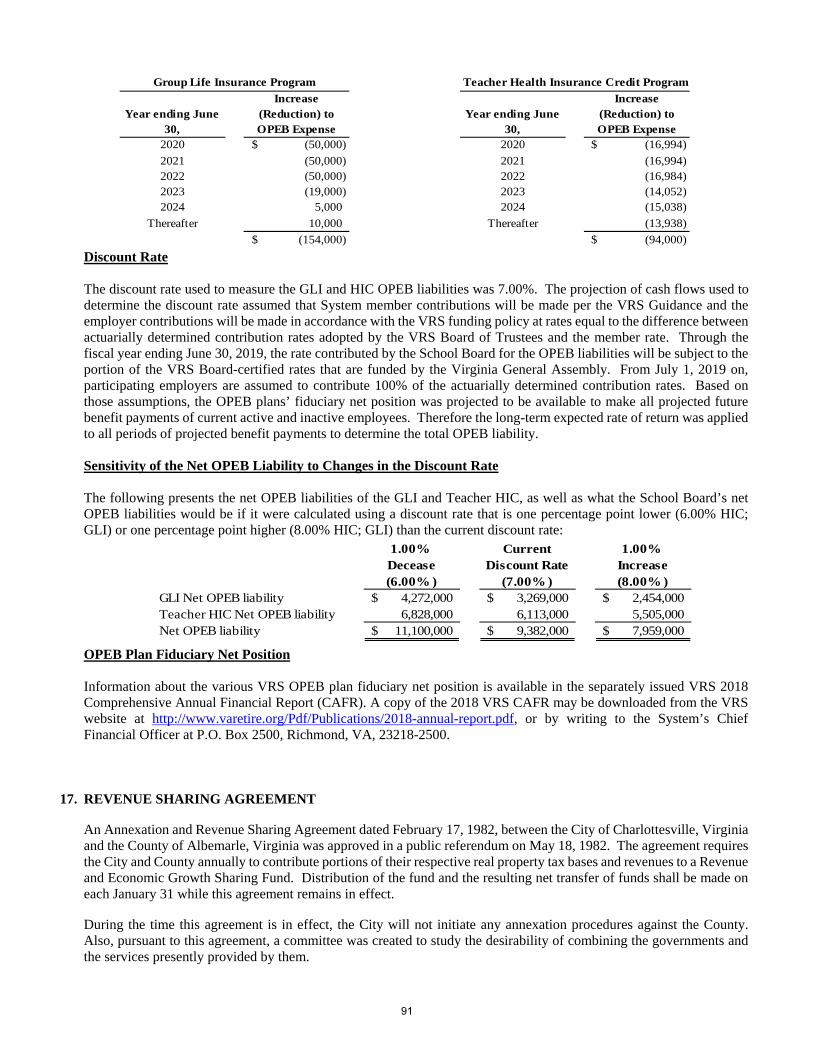
Year ending June 30,
Increase (Reduction) to OPEB Expense
Year ending June 30,
Increase (Reduction) to OPEB Expense
2020 (50,000)$ 2020 (16,994)$
2021 (50,000) 2021 (16,994) 2022 (50,000) 2022 (16,984) 2023 (19,000) 2023 (14,052) 2024 5,000 2024 (15,038)
Thereafter 10,000 Thereafter (13,938)
(154,000)$ (94,000)$
Group Life Insurance Program Teacher Health Insurance Credit Program
Discount Rate
The discount rate used to measure the GLI and HIC OPEB liabilities was 7.00%. The projection of cash flows used to determine the discount rate assumed that System member contributions will be made per the VRS Guidance and the employer contributions will be made in accordance with the VRS funding policy at rates equal to the difference between actuarially determined contribution rates adopted by the VRS Board of Trustees and the member rate. Through the fiscal year ending June 30, 2019, the rate contributed by the School Board for the OPEB liabilities will be subject to the portion of the VRS Board-certified rates that are funded by the Virginia General Assembly. From July 1, 2019 on, participating employers are assumed to contribute 100% of the actuarially determined contribution rates. Based on those assumptions, the OPEB plans’ fiduciary net position was projected to be available to make all projected future benefit payments of current active and inactive employees. Therefore the long-term expected rate of return was applied to all periods of projected benefit payments to determine the total OPEB liability.
Sensitivity of the Net OPEB Liability to Changes in the Discount Rate
The following presents the net OPEB liabilities of the GLI and Teacher HIC, as well as what the School Board’s net OPEB liabilities would be if it were calculated using a discount rate that is one percentage point lower (6.00% HIC; GLI) or one percentage point higher (8.00% HIC; GLI) than the current discount rate:
1.00% Decease (6.00% )
Current Discount Rate
(7.00% )
1.00% Increase (8.00% )
GLI Net OPEB liability 4,272,000$ 3,269,000$ 2,454,000$ Teacher HIC Net OPEB liability 6,828,000 6,113,000 5,505,000 Net OPEB liability 11,100,000$ 9,382,000$ 7,959,000$
OPEB Plan Fiduciary Net Position
Information about the various VRS OPEB plan fiduciary net position is available in the separately issued VRS 2018 Comprehensive Annual Financial Report (CAFR). A copy of the 2018 VRS CAFR may be downloaded from the VRS website at http://www.varetire.org/Pdf/Publications/2018-annual-report.pdf, or by writing to the System’s Chief Financial Officer at P.O. Box 2500, Richmond, VA, 23218-2500.
17. REVENUE SHARING AGREEMENT
An Annexation and Revenue Sharing Agreement dated February 17, 1982, between the City of Charlottesville, Virginia and the County of Albemarle, Virginia was approved in a public referendum on May 18, 1982. The agreement requires the City and County annually to contribute portions of their respective real property tax bases and revenues to a Revenue and Economic Growth Sharing Fund. Distribution of the fund and the resulting net transfer of funds shall be made on each January 31 while this agreement remains in effect.
During the time this agreement is in effect, the City will not initiate any annexation procedures against the County. Also, pursuant to this agreement, a committee was created to study the desirability of combining the governments and the services presently provided by them.
91
This agreement became effective July 1, 1982, and remains in effect until:
1. The City and County are consolidated into a single political subdivision, or
2. The concept for independent cities presently existing in Virginia is altered by State law in such a manner that real property in the City becomes a part of the County’s tax base, or
3. The City and County mutually agree to cancel or change the agreement.
During the fiscal year, the County paid $15,696,360 to the City as a result of this agreement, which is recorded in intergovernmental revenues.
18. JOINT VENTURES
(a) Rivanna Water and Sewer Authority
The City is a participant with the Albemarle County Service Authority (ACSA) in a joint venture to provide water and wastewater treatment services to City residents and residents in certain areas of Albemarle County. The Rivanna Water and Sewer Authority (RWSA) was created for that purpose. RWSA is governed by a seven-member board composed of City Manager, City Director of Public Works, a Charlottesville City Councilor, an Albemarle County Executive, an Albemarle County Supervisor, and the Executive Director of ACSA, as well as a seventh member who is appointed by concurrent action of the City and County. The City and ACSA have agreed to purchase water and wastewater treatment services for all their customers solely from RWSA, at rates established to cover the operating and debt costs of RWSA, until June 30, 2013. Beginning in November of 2015, RWSA began charging each locality a fixed monthly amount to cover the debt portion owed by each locality. For the year ended June 30, 2019, the City paid a total of $15,404,701 to RWSA. Complete, audited financial statements for RWSA can be obtained at their administrative offices at 200 Franklin Street, Charlottesville, Virginia 22902.
(b) Rivanna Solid Waste Authority
The City is a participant with Albemarle County in a joint venture to provide drop off recycling services at the McIntire Recycling Center on McIntire Rd. The City and County also entered into a Cost Sharing Agreement for purposes of paying any of the post-closure care and corrective action costs related to the old Ivy Landfill in the event the Rivanna Solid Waste Authority would not have the financial resources to pay such costs. Although the City entered into a Local Government Guarantee on behalf of the Rivanna Solid Waste Authority, the Virginia Department of Environmental Quality (DEQ) has no legal recourse against the City under this guarantee. The City’s percentage of these shared costs is 35.5% of the total. The City share of the local guarantee for the 2019 calendar year and for fiscal year 2019 is $1,959,914. Annual certificates must be filed every December 30th to DEQ. Complete, audited financial statements for RSWA can be obtained at their administrative offices at 200 Franklin Street, Charlottesville, Virginia 22902.
(c) Jefferson-Madison Regional Library
The City and several neighboring counties joined together to form a regional library system for the use of their respective residents. The Jefferson-Madison Regional Library (JMRL) is governed by an eleven-member board, four of whom are appointed by the City. The participating localities share the operating costs of JMRL on the basis of the prior year’s book circulation. The City contributed $1,941,399 to JMRL for the year ended June 30, 2019. Complete, audited financial statements for JMRL can be obtained at their administrative offices at 201 East Market Street, Charlottesville, Virginia 22902.
(d) Charlottesville – Albemarle Regional Jail
The City and Albemarle County share the costs of operating a regional jail. The Jail is governed by a seven-member board, three of whom are appointed by the City (with one member being ex-officio), three by the County, and one jointly appointed citizen. Under the terms of the operating agreement, either the City or the County can terminate the contract with sixty days’ notice. The City and County share the costs of operating the Jail (net of any reimbursements from the Federal, State and other local governments) on the ratio of City and County prisoner days of utilization for the prior
92
year. Any excesses or deficits are reimbursed after the end of each fiscal year. For the year ended June 30, 2019, the City’s share of the costs of the Jail was $4,952,622. Complete, audited financial statements for the Jail can be obtained at their administrative offices at Avon Street Extended, Charlottesville, Virginia 22902.
(e) Blue Ridge Juvenile Detention Center
The City, with Albemarle, Culpeper, Fluvanna and Greene Counties, share the cost of operating a regional Juvenile Detention Commission per an adopted agreement dated July 1, 1999, and amended July 2, 2007. Commission members are appointed by each participating locality, with not locality appointing a majority of Board members. Under the terms of the operating agreements, the participating governments share the costs of operations and capital based on their respective aggregate percentages of usage during the preceding three years on an annual basis. For the year ended June 30, 2019, the City’s share of the costs for the Blue Ridge Juvenile Detention Center (BRJDC) was $871,266. Complete, audited financial statements for the Center can be obtained at the County Office Building, 401 McIntire Road, Charlottesville, Virginia 22902.
(f) Emergency Communications Center
The City, Albemarle County and the University of Virginia jointly participate in operating a centralized dispatching facility for law enforcement and emergency services. The Emergency Communications Center (the Center) is governed by an eight-member board, three of whom are ex-officio members from the City. The Center operates under the terms of an agreement whereby any participant may discontinue its participation with one year’s written notice. The operating costs of the Center are shared by the three participants on the basis of population, numbers of calls for service and annual crime statistics. For the year ended June 30, 2019 the City’s share of the costs of the Center was $1,573,094. Complete, audited financial statements for the Center can be obtained at the County Office Building, 401 McIntire Road, Charlottesville, Virginia 22902.
(g) Charlottesville Albemarle Convention & Visitors Bureau
This is a regional program funded by the City, Albemarle County, Charlottesville Regional Chamber of Commerce and the University of Virginia and revenues generated by the Bureau. Its purpose is to promote tourism in the area. The Bureau is governed by a Management Committee composed of the City Manager, the County Executive, the President of the Charlottesville-Albemarle Chamber of Commerce and one ex-officio, non-voting member from the University of Virginia. The Chamber of Commerce contributes an amount based on its membership dues. The City and the County contributions are based on the year’s sales tax and lodging tax for each compared to total. For the year ended June 30, 2019, the City contributed $1,038,546 to the Bureau.
(h) Darden Towe Park
The City and County jointly own and operate a park, known as Darden Towe Park (the Park). The Park is governed by a supervisory committee, consisting of two ex-officio members each from the City and County. The operating costs of the Park are shared between the two based on the average of the populations of the two localities and the relative proportion of park usage by City and County residents. For the year ended June 30, 2019, the City’s share of the Park’s operating costs was $108,153. Complete, audited financial statements for the Park can be obtained at the County Office Building, 401 McIntire Road, Charlottesville, Virginia 22902.
19. RELATED ORGANIZATIONS
The City Council is responsible for making appointments for a variety of boards and commissions, some of which aregoverning boards for agencies that cooperate outside of the authority of city government. These boards include:
Belmont Bridge Steering Committee Board of Architectural Review Building Code Board of Appeals Charlottesville – Albemarle Airport Authority Charlottesville – Albemarle Airport Commission
Charlottesville – Albemarle Child Services Act Community Policy and Management Team Charlottesville Economic Development Authority Charlottesville Redevelopment and Housing Authority
93
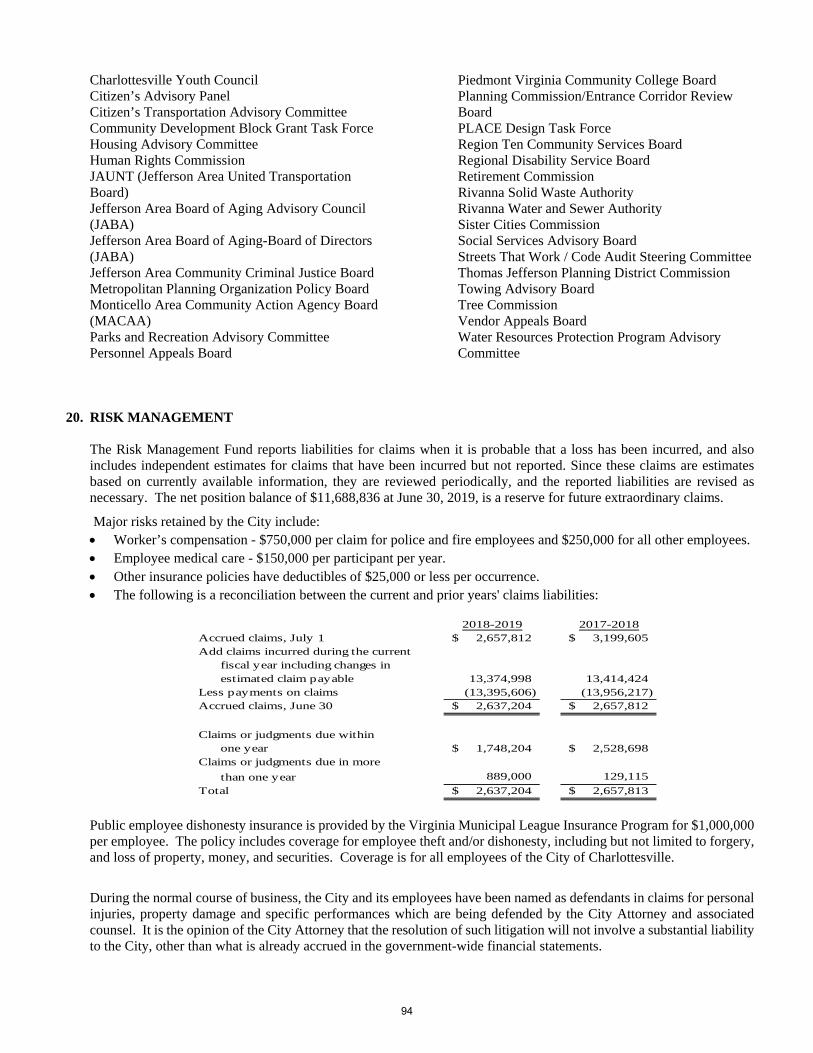
Charlottesville Youth Council Citizen’s Advisory Panel Citizen’s Transportation Advisory Committee Community Development Block Grant Task Force Housing Advisory Committee Human Rights Commission JAUNT (Jefferson Area United Transportation Board) Jefferson Area Board of Aging Advisory Council (JABA) Jefferson Area Board of Aging-Board of Directors (JABA) Jefferson Area Community Criminal Justice Board Metropolitan Planning Organization Policy Board Monticello Area Community Action Agency Board (MACAA) Parks and Recreation Advisory Committee Personnel Appeals Board
Piedmont Virginia Community College Board Planning Commission/Entrance Corridor Review Board PLACE Design Task Force Region Ten Community Services Board Regional Disability Service Board Retirement Commission Rivanna Solid Waste Authority Rivanna Water and Sewer Authority Sister Cities Commission Social Services Advisory Board Streets That Work / Code Audit Steering Committee Thomas Jefferson Planning District Commission Towing Advisory Board Tree Commission Vendor Appeals Board Water Resources Protection Program Advisory Committee
20. RISK MANAGEMENT
The Risk Management Fund reports liabilities for claims when it is probable that a loss has been incurred, and also includes independent estimates for claims that have been incurred but not reported. Since these claims are estimates based on currently available information, they are reviewed periodically, and the reported liabilities are revised as necessary. The net position balance of $11,688,836 at June 30, 2019, is a reserve for future extraordinary claims.
Major risks retained by the City include: Worker’s compensation - $750,000 per claim for police and fire employees and $250,000 for all other employees. Employee medical care - $150,000 per participant per year. Other insurance policies have deductibles of $25,000 or less per occurrence. The following is a reconciliation between the current and prior years' claims liabilities:
Public employee dishonesty insurance is provided by the Virginia Municipal League Insurance Program for $1,000,000 per employee. The policy includes coverage for employee theft and/or dishonesty, including but not limited to forgery, and loss of property, money, and securities. Coverage is for all employees of the City of Charlottesville.
During the normal course of business, the City and its employees have been named as defendants in claims for personal injuries, property damage and specific performances which are being defended by the City Attorney and associated counsel. It is the opinion of the City Attorney that the resolution of such litigation will not involve a substantial liability to the City, other than what is already accrued in the government-wide financial statements.
2018-2019 2017-2018Accrued claims, July 1 2,657,812$ 3,199,605$ Add claims incurred during the current
fiscal year including changes in estimated claim payable 13,374,998 13,414,424
Less payments on claims (13,395,606) (13,956,217) Accrued claims, June 30 2,637,204$ 2,657,812$
Claims or judgments due withinone year 1,748,204$ 2,528,698$
Claims or judgments due in more
than one year 889,000 129,115
Total 2,637,204$ 2,657,813$
94
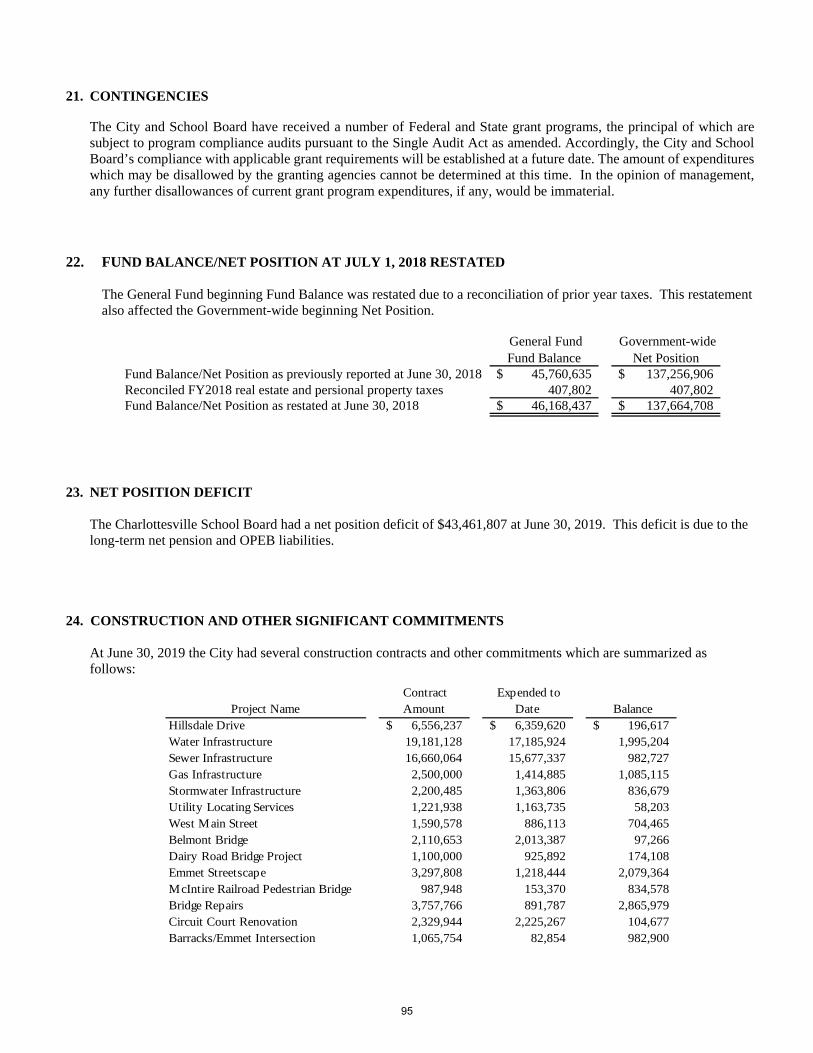
21. CONTINGENCIES
The City and School Board have received a number of Federal and State grant programs, the principal of which are subject to program compliance audits pursuant to the Single Audit Act as amended. Accordingly, the City and School Board’s compliance with applicable grant requirements will be established at a future date. The amount of expenditures which may be disallowed by the granting agencies cannot be determined at this time. In the opinion of management, any further disallowances of current grant program expenditures, if any, would be immaterial.
22. FUND BALANCE/NET POSITION AT JULY 1, 2018 RESTATED
The General Fund beginning Fund Balance was restated due to a reconciliation of prior year taxes. This restatement also affected the Government-wide beginning Net Position.
General Fund Fund Balance
Government-wide Net Position
Fund Balance/Net Position as previously reported at June 30, 2018 45,760,635$ 137,256,906$ Reconciled FY2018 real estate and persional property taxes 407,802 407,802 Fund Balance/Net Position as restated at June 30, 2018 46,168,437$ 137,664,708$
23. NET POSITION DEFICIT
The Charlottesville School Board had a net position deficit of $43,461,807 at June 30, 2019. This deficit is due to the long-term net pension and OPEB liabilities.
24. CONSTRUCTION AND OTHER SIGNIFICANT COMMITMENTS
At June 30, 2019 the City had several construction contracts and other commitments which are summarized as follows:
Project Name Contract Amount
Expended to Date Balance
Hillsdale Drive 6,556,237$ 6,359,620$ 196,617$ Water Infrastructure 19,181,128 17,185,924 1,995,204 Sewer Infrastructure 16,660,064 15,677,337 982,727 Gas Infrastructure 2,500,000 1,414,885 1,085,115 Stormwater Infrastructure 2,200,485 1,363,806 836,679 Utility Locating Services 1,221,938 1,163,735 58,203 West Main Street 1,590,578 886,113 704,465 Belmont Bridge 2,110,653 2,013,387 97,266 Dairy Road Bridge Project 1,100,000 925,892 174,108 Emmet Streetscape 3,297,808 1,218,444 2,079,364 McIntire Railroad Pedestrian Bridge 987,948 153,370 834,578 Bridge Repairs 3,757,766 891,787 2,865,979 Circuit Court Renovation 2,329,944 2,225,267 104,677 Barracks/Emmet Intersection 1,065,754 82,854 982,900
95
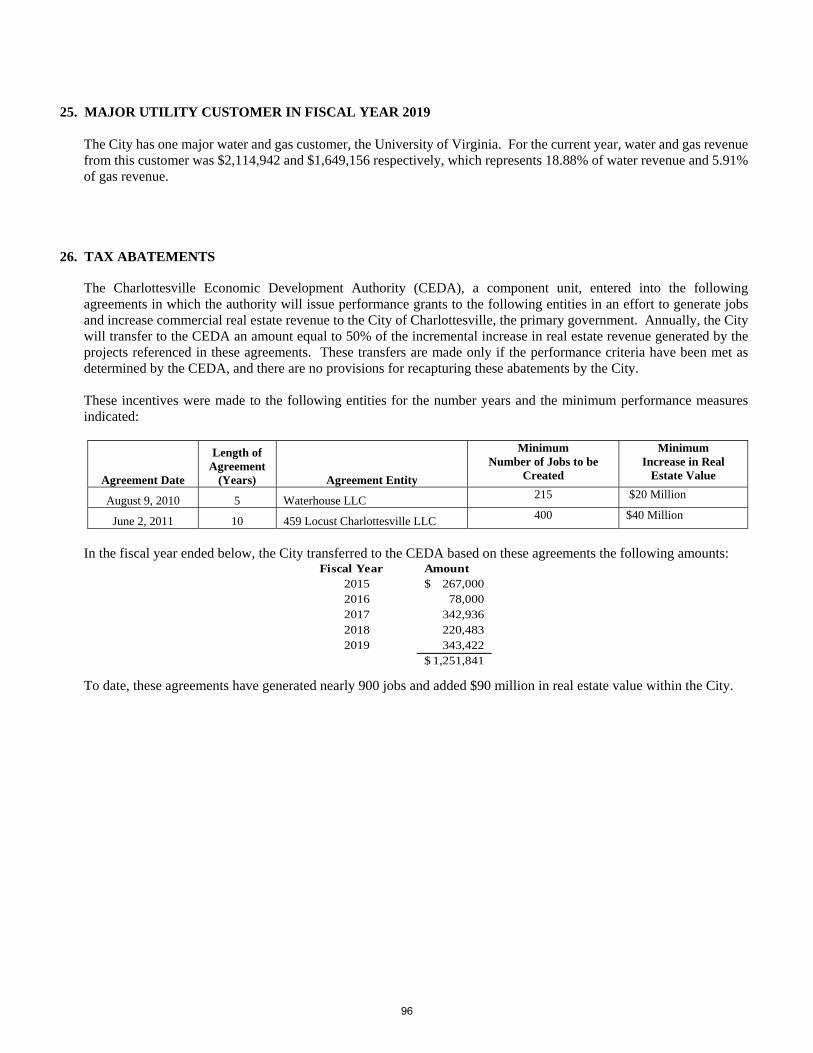
25. MAJOR UTILITY CUSTOMER IN FISCAL YEAR 2019
The City has one major water and gas customer, the University of Virginia. For the current year, water and gas revenuefrom this customer was $2,114,942 and $1,649,156 respectively, which represents 18.88% of water revenue and 5.91%of gas revenue.
26. TAX ABATEMENTS
The Charlottesville Economic Development Authority (CEDA), a component unit, entered into the followingagreements in which the authority will issue performance grants to the following entities in an effort to generate jobsand increase commercial real estate revenue to the City of Charlottesville, the primary government. Annually, the Citywill transfer to the CEDA an amount equal to 50% of the incremental increase in real estate revenue generated by theprojects referenced in these agreements. These transfers are made only if the performance criteria have been met asdetermined by the CEDA, and there are no provisions for recapturing these abatements by the City.
These incentives were made to the following entities for the number years and the minimum performance measuresindicated:
Agreement Date
Length of Agreement
(Years) Agreement Entity
Minimum Number of Jobs to be
Created
Minimum Increase in Real
Estate Value
August 9, 2010 5 Waterhouse LLC 215 $20 Million
June 2, 2011 10 459 Locust Charlottesville LLC 400 $40 Million
In the fiscal year ended below, the City transferred to the CEDA based on these agreements the following amounts: Fiscal Year Amount
2015 267,000$ 2016 78,000 2017 342,936 2018 220,483 2019 343,422
1,251,841$
To date, these agreements have generated nearly 900 jobs and added $90 million in real estate value within the City.
96

REQUIRED SUPPLEMENTARY INFORMATION
CITY OF CHARLOTTESVILLE, VIRGINIA
NOTE TO REQUIRED SUPPLEMENTARY INFORMATION FOR THE YEAR ENDED JUNE 30, 2019
1. BUDGETARY ACCOUNTING
Demonstrating compliance with the adopted budget is an important component of a government’s accountability to the public. Many citizens participate in the process of establishing the annual operating budgets of state and local governments, and have a keen interest in following the actual financial progress of their governments over the course of the year. The City and many other governments revise their original budgets over the course of the year for a variety of reasons. Accordingly, GAAP requires that governments include the original budget with the comparison of final budget and actual results.
The City’s budget process begins in December with the preparation of estimated revenue forecasts. Departmental budget requests are submitted to the City Manager in early January. By early March the Manager’s proposed budget is presented to City Council. A series of City Council work sessions and public hearings are held. The budget is formally adopted by April 15.
An annual operating budget is adopted for the General Fund and the Social Services Fund. Within the General Fund, budgets are legally adopted at the departmental level. The City Manager is authorized to transfer the budget for personnel cost (salaries and fringe benefits) between departments if necessary; however, any other revisions that alter the total expenditures of any department or agency must be approved by City Council. Unexpended appropriations lapse at the end of the fiscal year unless carried over by Council action.
The budgets are integrated into the accounting system and the budgetary data, as presented in the Required Supplementary Information for all major funds with annual budgets, compares the expenditures with the amended budgets. All budgets are presented on the modified accrual basis of accounting. Accordingly, the Budgetary Comparison Schedules for the General and Social Services Funds present actual expenditures in accordance with GAAP on a basis consistent with legally adopted budgets as amended. Original, final budget and actual revenues and expenditures, including encumbrances, for the General Fund and Social Services Fund are presented on Exhibits G -1 and G-2, respectively. Original budget amounts are the budgets originally adopted by City Council, plus any approved amounts carried over from the previous fiscal year. Final budgets are these amounts plus any adjustments, through additional appropriations or reductions.
98
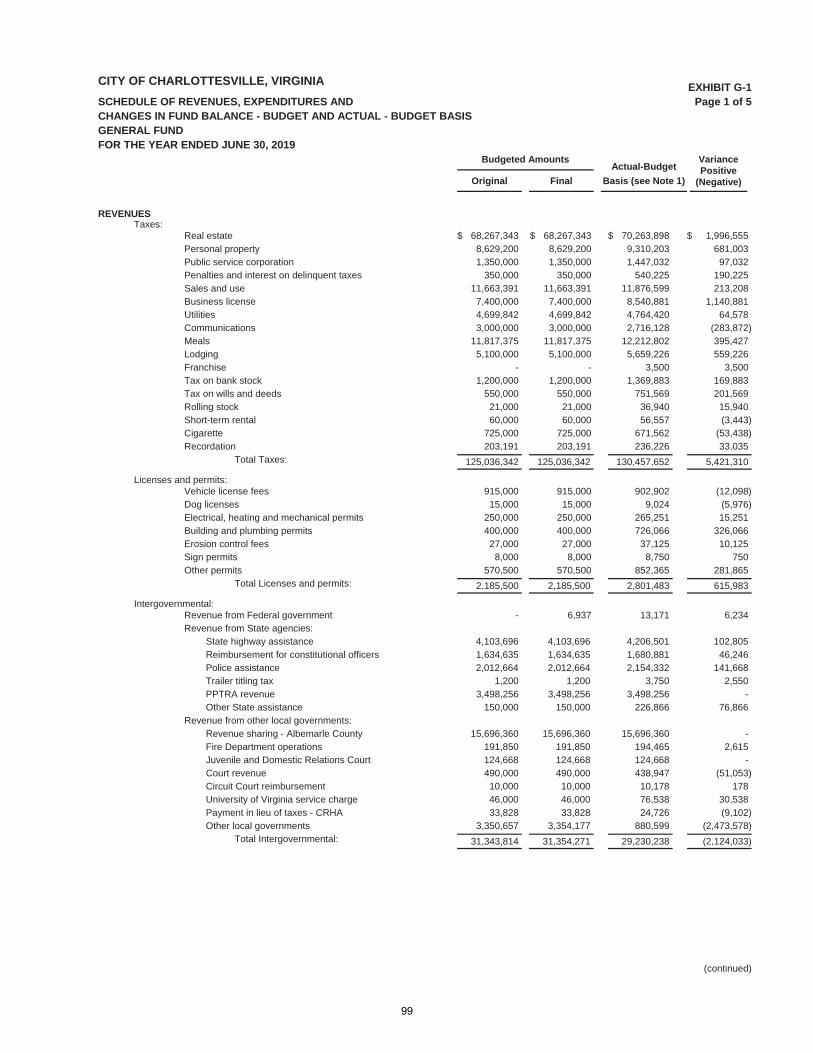
CITY OF CHARLOTTESVILLE, VIRGINIA
SCHEDULE OF REVENUES, EXPENDITURES AND CHANGES IN FUND BALANCE - BUDGET AND ACTUAL - BUDGET BASISGENERAL FUNDFOR THE YEAR ENDED JUNE 30, 2019
Page 1 of 5EXHIBIT G-1
Original
Budgeted Amounts
Final
Actual-Budget
Basis (see Note 1)
VariancePositive
(Negative)
REVENUESTaxes:
$ 68,267,343 $ 68,267,343 $ 70,263,898 $ 1,996,555Real estate8,629,200 8,629,200 9,310,203 681,003Personal property1,350,000 1,350,000 1,447,032 97,032Public service corporation
350,000 350,000 540,225 190,225Penalties and interest on delinquent taxes11,663,391 11,663,391 11,876,599 213,208Sales and use
7,400,000 7,400,000 8,540,881 1,140,881Business license4,699,842 4,699,842 4,764,420 64,578Utilities3,000,000 3,000,000 2,716,128 )(283,872Communications
11,817,375 11,817,375 12,212,802 395,427Meals5,100,000 5,100,000 5,659,226 559,226Lodging
- - 3,500 3,500Franchise1,200,000 1,200,000 1,369,883 169,883Tax on bank stock
550,000 550,000 751,569 201,569Tax on wills and deeds21,000 21,000 36,940 15,940Rolling stock60,000 60,000 56,557 )(3,443Short-term rental
725,000 725,000 671,562 )(53,438Cigarette203,191 203,191 236,226 33,035Recordation
125,036,342Total Taxes: 125,036,342 130,457,652 5,421,310
Licenses and permits:915,000 915,000 902,902 )(12,098Vehicle license fees
15,000 15,000 9,024 )(5,976Dog licenses250,000 250,000 265,251 15,251Electrical, heating and mechanical permits400,000 400,000 726,066 326,066Building and plumbing permits
27,000 27,000 37,125 10,125Erosion control fees8,000 8,000 8,750 750Sign permits
570,500 570,500 852,365 281,865Other permits
2,185,500Total Licenses and permits: 2,185,500 2,801,483 615,983
Intergovernmental:- 6,937 13,171 6,234Revenue from Federal government
Revenue from State agencies:State highway assistance 4,103,696 4,103,696 4,206,501 102,805Reimbursement for constitutional officers 1,634,635 1,634,635 1,680,881 46,246Police assistance 2,012,664 2,012,664 2,154,332 141,668Trailer titling tax 1,200 1,200 3,750 2,550PPTRA revenue 3,498,256 3,498,256 3,498,256 -Other State assistance 150,000 150,000 226,866 76,866
Revenue from other local governments:Revenue sharing - Albemarle County 15,696,360 15,696,360 15,696,360 -Fire Department operations 191,850 191,850 194,465 2,615Juvenile and Domestic Relations Court 124,668 124,668 124,668 -Court revenue 490,000 490,000 438,947 )(51,053Circuit Court reimbursement 10,000 10,000 10,178 178University of Virginia service charge 46,000 46,000 76,538 30,538Payment in lieu of taxes - CRHA 33,828 33,828 24,726 )(9,102Other local governments 3,350,657 3,354,177 880,599 )(2,473,578
31,343,814Total Intergovernmental: 31,354,271 29,230,238 )(2,124,033
(continued)
99
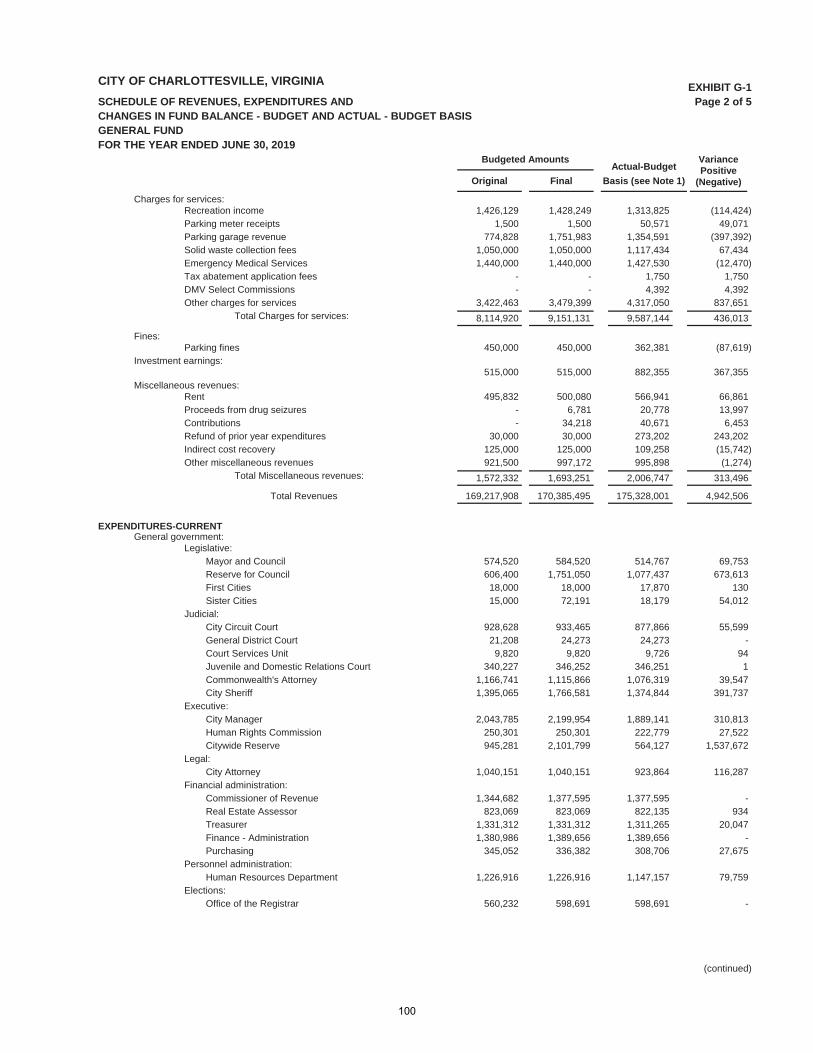
CITY OF CHARLOTTESVILLE, VIRGINIA
SCHEDULE OF REVENUES, EXPENDITURES AND CHANGES IN FUND BALANCE - BUDGET AND ACTUAL - BUDGET BASISGENERAL FUNDFOR THE YEAR ENDED JUNE 30, 2019
Page 2 of 5EXHIBIT G-1
Original
Budgeted Amounts
Final
Actual-Budget
Basis (see Note 1)
VariancePositive
(Negative)
Charges for services:1,426,129 1,428,249 1,313,825 )(114,424Recreation income
1,500 1,500 50,571 49,071Parking meter receipts774,828 1,751,983 1,354,591 )(397,392Parking garage revenue
1,050,000 1,050,000 1,117,434 67,434Solid waste collection fees1,440,000 1,440,000 1,427,530 )(12,470Emergency Medical Services
- - 1,750 1,750Tax abatement application fees- - 4,392 4,392DMV Select Commissions
3,422,463 3,479,399 4,317,050 837,651Other charges for services
8,114,920Total Charges for services: 9,151,131 9,587,144 436,013
Fines:450,000 450,000 362,381 )(87,619Parking fines
Investment earnings:515,000 515,000 882,355 367,355
Miscellaneous revenues:495,832 500,080 566,941 66,861Rent
- 6,781 20,778 13,997Proceeds from drug seizures- 34,218 40,671 6,453Contributions
30,000 30,000 273,202 243,202Refund of prior year expenditures125,000 125,000 109,258 )(15,742Indirect cost recovery921,500 997,172 995,898 )(1,274Other miscellaneous revenues
1,572,332Total Miscellaneous revenues: 1,693,251 2,006,747 313,496
169,217,908Total Revenues 170,385,495 175,328,001 4,942,506
EXPENDITURES-CURRENTGeneral government:
Legislative:Mayor and Council 574,520 584,520 514,767 69,753Reserve for Council 606,400 1,751,050 1,077,437 673,613First Cities 18,000 18,000 17,870 130Sister Cities 15,000 72,191 18,179 54,012
Judicial:City Circuit Court 928,628 933,465 877,866 55,599General District Court 21,208 24,273 24,273 -Court Services Unit 9,820 9,820 9,726 94Juvenile and Domestic Relations Court 340,227 346,252 346,251 1Commonwealth's Attorney 1,166,741 1,115,866 1,076,319 39,547City Sheriff 1,395,065 1,766,581 1,374,844 391,737
Executive:City Manager 2,043,785 2,199,954 1,889,141 310,813Human Rights Commission 250,301 250,301 222,779 27,522Citywide Reserve 945,281 2,101,799 564,127 1,537,672
Legal:City Attorney 1,040,151 1,040,151 923,864 116,287
Financial administration:Commissioner of Revenue 1,344,682 1,377,595 1,377,595 -Real Estate Assessor 823,069 823,069 822,135 934Treasurer 1,331,312 1,331,312 1,311,265 20,047Finance - Administration 1,380,986 1,389,656 1,389,656 -Purchasing 345,052 336,382 308,706 27,675
Personnel administration:Human Resources Department 1,226,916 1,226,916 1,147,157 79,759
Elections:Office of the Registrar 560,232 598,691 598,691 -
(continued)
100
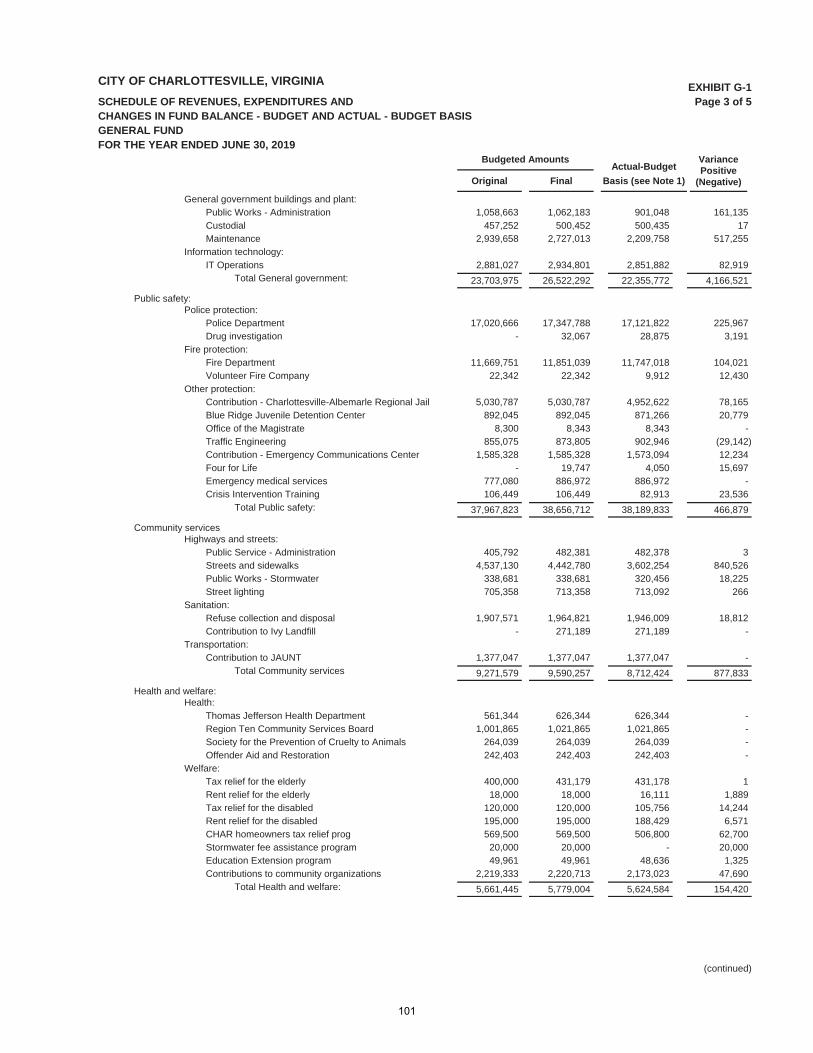
CITY OF CHARLOTTESVILLE, VIRGINIA
SCHEDULE OF REVENUES, EXPENDITURES AND CHANGES IN FUND BALANCE - BUDGET AND ACTUAL - BUDGET BASISGENERAL FUNDFOR THE YEAR ENDED JUNE 30, 2019
Page 3 of 5EXHIBIT G-1
Original
Budgeted Amounts
Final
Actual-Budget
Basis (see Note 1)
VariancePositive
(Negative)
General government buildings and plant:Public Works - Administration 1,058,663 1,062,183 901,048 161,135Custodial 457,252 500,452 500,435 17Maintenance 2,939,658 2,727,013 2,209,758 517,255
Information technology:IT Operations 2,881,027 2,934,801 2,851,882 82,919
23,703,975Total General government: 26,522,292 22,355,772 4,166,521
Public safety:Police protection:
Police Department 17,020,666 17,347,788 17,121,822 225,967Drug investigation - 32,067 28,875 3,191
Fire protection:Fire Department 11,669,751 11,851,039 11,747,018 104,021Volunteer Fire Company 22,342 22,342 9,912 12,430
Other protection:Contribution - Charlottesville-Albemarle Regional Jail 5,030,787 5,030,787 4,952,622 78,165Blue Ridge Juvenile Detention Center 892,045 892,045 871,266 20,779Office of the Magistrate 8,300 8,343 8,343 -Traffic Engineering 855,075 873,805 902,946 )(29,142Contribution - Emergency Communications Center 1,585,328 1,585,328 1,573,094 12,234Four for Life - 19,747 4,050 15,697Emergency medical services 777,080 886,972 886,972 -Crisis Intervention Training 106,449 106,449 82,913 23,536
37,967,823Total Public safety: 38,656,712 38,189,833 466,879
Community servicesHighways and streets:
Public Service - Administration 405,792 482,381 482,378 3Streets and sidewalks 4,537,130 4,442,780 3,602,254 840,526Public Works - Stormwater 338,681 338,681 320,456 18,225Street lighting 705,358 713,358 713,092 266
Sanitation:Refuse collection and disposal 1,907,571 1,964,821 1,946,009 18,812Contribution to Ivy Landfill - 271,189 271,189 -
Transportation:Contribution to JAUNT 1,377,047 1,377,047 1,377,047 -
9,271,579Total Community services 9,590,257 8,712,424 877,833
Health and welfare:Health:
Thomas Jefferson Health Department 561,344 626,344 626,344 -Region Ten Community Services Board 1,001,865 1,021,865 1,021,865 -Society for the Prevention of Cruelty to Animals 264,039 264,039 264,039 -Offender Aid and Restoration 242,403 242,403 242,403 -
Welfare:Tax relief for the elderly 400,000 431,179 431,178 1Rent relief for the elderly 18,000 18,000 16,111 1,889Tax relief for the disabled 120,000 120,000 105,756 14,244Rent relief for the disabled 195,000 195,000 188,429 6,571CHAR homeowners tax relief prog 569,500 569,500 506,800 62,700Stormwater fee assistance program 20,000 20,000 - 20,000Education Extension program 49,961 49,961 48,636 1,325Contributions to community organizations 2,219,333 2,220,713 2,173,023 47,690
5,661,445Total Health and welfare: 5,779,004 5,624,584 154,420
(continued)
101
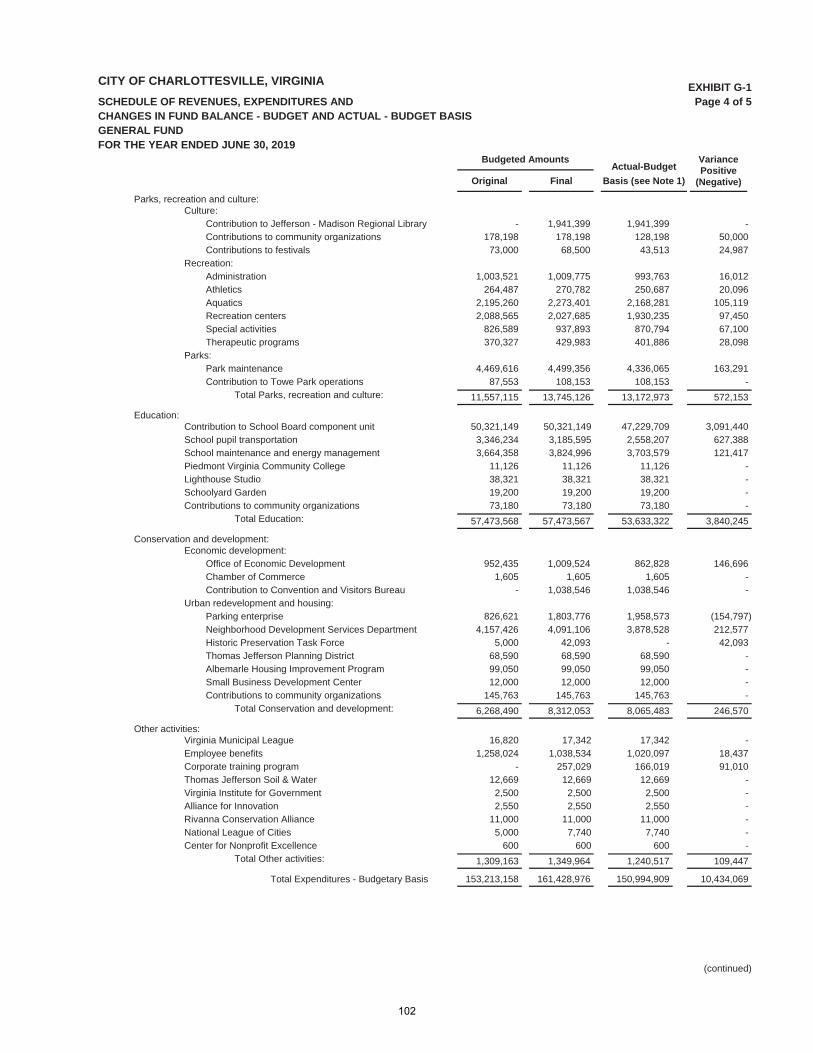
CITY OF CHARLOTTESVILLE, VIRGINIA
SCHEDULE OF REVENUES, EXPENDITURES AND CHANGES IN FUND BALANCE - BUDGET AND ACTUAL - BUDGET BASISGENERAL FUNDFOR THE YEAR ENDED JUNE 30, 2019
Page 4 of 5EXHIBIT G-1
Original
Budgeted Amounts
Final
Actual-Budget
Basis (see Note 1)
VariancePositive
(Negative)
Parks, recreation and culture:Culture:
Contribution to Jefferson - Madison Regional Library - 1,941,399 1,941,399 -Contributions to community organizations 178,198 178,198 128,198 50,000Contributions to festivals 73,000 68,500 43,513 24,987
Recreation:Administration 1,003,521 1,009,775 993,763 16,012Athletics 264,487 270,782 250,687 20,096Aquatics 2,195,260 2,273,401 2,168,281 105,119Recreation centers 2,088,565 2,027,685 1,930,235 97,450Special activities 826,589 937,893 870,794 67,100Therapeutic programs 370,327 429,983 401,886 28,098
Parks:Park maintenance 4,469,616 4,499,356 4,336,065 163,291Contribution to Towe Park operations 87,553 108,153 108,153 -
11,557,115Total Parks, recreation and culture: 13,745,126 13,172,973 572,153
Education:50,321,149 50,321,149 47,229,709 3,091,440Contribution to School Board component unit
3,346,234 3,185,595 2,558,207 627,388School pupil transportation3,664,358 3,824,996 3,703,579 121,417School maintenance and energy management
11,126 11,126 11,126 -Piedmont Virginia Community College38,321 38,321 38,321 -Lighthouse Studio19,200 19,200 19,200 -Schoolyard Garden73,180 73,180 73,180 -Contributions to community organizations
57,473,568Total Education: 57,473,567 53,633,322 3,840,245
Conservation and development:Economic development:
Office of Economic Development 952,435 1,009,524 862,828 146,696Chamber of Commerce 1,605 1,605 1,605 -Contribution to Convention and Visitors Bureau - 1,038,546 1,038,546 -
Urban redevelopment and housing:Parking enterprise 826,621 1,803,776 1,958,573 )(154,797Neighborhood Development Services Department 4,157,426 4,091,106 3,878,528 212,577Historic Preservation Task Force 5,000 42,093 - 42,093Thomas Jefferson Planning District 68,590 68,590 68,590 -Albemarle Housing Improvement Program 99,050 99,050 99,050 -Small Business Development Center 12,000 12,000 12,000 -Contributions to community organizations 145,763 145,763 145,763 -
6,268,490Total Conservation and development: 8,312,053 8,065,483 246,570
Other activities:16,820 17,342 17,342 -Virginia Municipal League
1,258,024 1,038,534 1,020,097 18,437Employee benefits- 257,029 166,019 91,010Corporate training program
12,669 12,669 12,669 -Thomas Jefferson Soil & Water2,500 2,500 2,500 -Virginia Institute for Government2,550 2,550 2,550 -Alliance for Innovation
11,000 11,000 11,000 -Rivanna Conservation Alliance5,000 7,740 7,740 -National League of Cities
600 600 600 -Center for Nonprofit Excellence
1,309,163Total Other activities: 1,349,964 1,240,517 109,447
153,213,158Total Expenditures - Budgetary Basis 161,428,976 150,994,909 10,434,069
(continued)
102
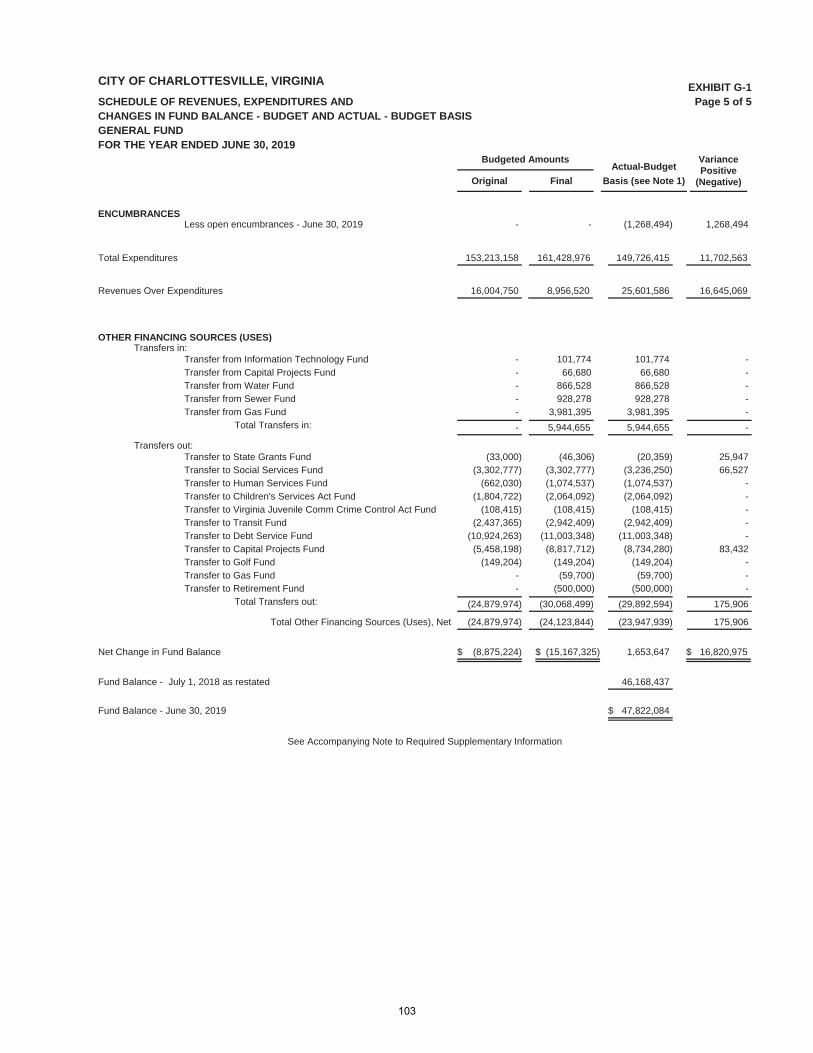
CITY OF CHARLOTTESVILLE, VIRGINIA
SCHEDULE OF REVENUES, EXPENDITURES AND CHANGES IN FUND BALANCE - BUDGET AND ACTUAL - BUDGET BASISGENERAL FUNDFOR THE YEAR ENDED JUNE 30, 2019
Page 5 of 5EXHIBIT G-1
Original
Budgeted Amounts
Final
Actual-Budget
Basis (see Note 1)
VariancePositive
(Negative)
ENCUMBRANCES- - )(1,268,494 1,268,494Less open encumbrances - June 30, 2019
Total Expenditures 153,213,158 161,428,976 149,726,415 11,702,563
Revenues Over Expenditures 16,004,750 8,956,520 25,601,586 16,645,069
OTHER FINANCING SOURCES (USES)Transfers in:
- 101,774 101,774 -Transfer from Information Technology Fund- 66,680 66,680 -Transfer from Capital Projects Fund- 866,528 866,528 -Transfer from Water Fund- 928,278 928,278 -Transfer from Sewer Fund- 3,981,395 3,981,395 -Transfer from Gas Fund
-Total Transfers in: 5,944,655 5,944,655 -
Transfers out:)(33,000 )(46,306 )(20,359 25,947Transfer to State Grants Fund)(3,302,777 )(3,302,777 )(3,236,250 66,527Transfer to Social Services Fund)(662,030 )(1,074,537 )(1,074,537 -Transfer to Human Services Fund)(1,804,722 )(2,064,092 )(2,064,092 -Transfer to Children's Services Act Fund)(108,415 )(108,415 )(108,415 -Transfer to Virginia Juvenile Comm Crime Control Act Fund)(2,437,365 )(2,942,409 )(2,942,409 -Transfer to Transit Fund)(10,924,263 )(11,003,348 )(11,003,348 -Transfer to Debt Service Fund)(5,458,198 )(8,817,712 )(8,734,280 83,432Transfer to Capital Projects Fund)(149,204 )(149,204 )(149,204 -Transfer to Golf Fund
- )(59,700 )(59,700 -Transfer to Gas Fund- )(500,000 )(500,000 -Transfer to Retirement Fund
)(24,879,974Total Transfers out: )(30,068,499 )(29,892,594 175,906
)(24,879,974Total Other Financing Sources (Uses), Net )(24,123,844 )(23,947,939 175,906
Net Change in Fund Balance $ )(8,875,224 $ )(15,167,325 1,653,647 $ 16,820,975
Fund Balance - July 1, 2018 as restated 46,168,437
Fund Balance - June 30, 2019 $ 47,822,084
See Accompanying Note to Required Supplementary Information
103
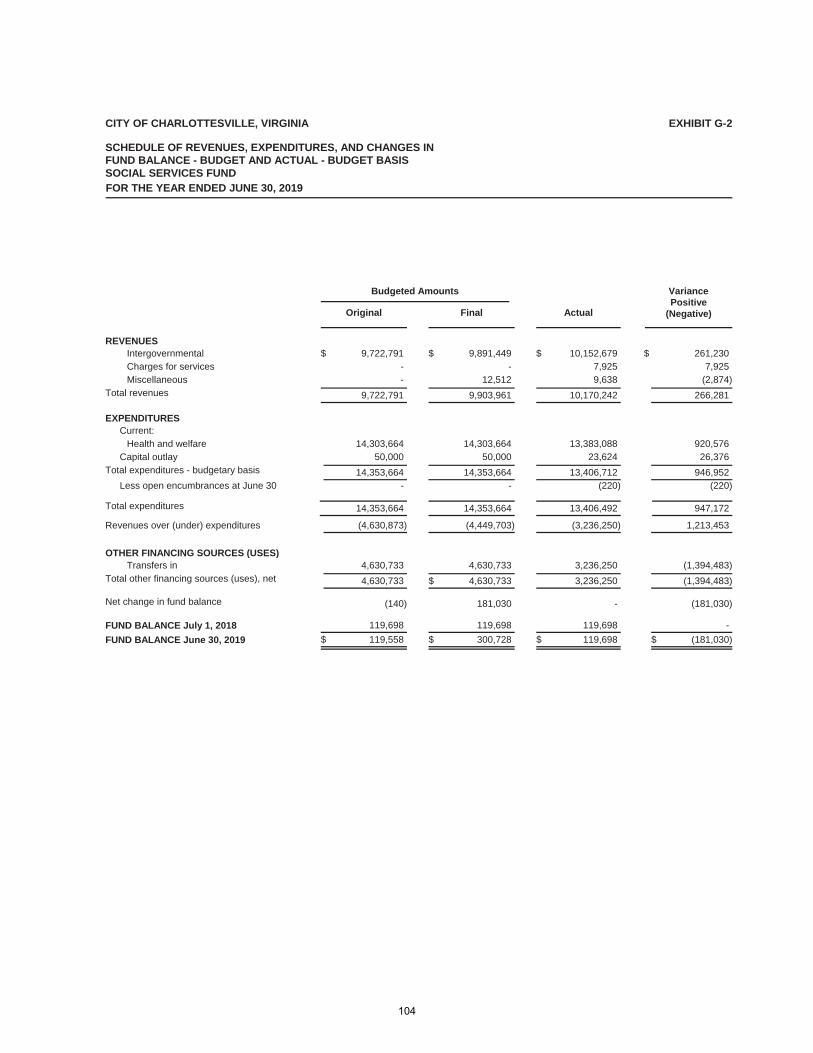
CITY OF CHARLOTTESVILLE, VIRGINIA
SCHEDULE OF REVENUES, EXPENDITURES, AND CHANGES IN FUND BALANCE - BUDGET AND ACTUAL - BUDGET BASISSOCIAL SERVICES FUND
EXHIBIT G-2
FOR THE YEAR ENDED JUNE 30, 2019
Original Final Actual
VariancePositive
(Negative)
Budgeted Amounts
REVENUESIntergovernmental $ 9,722,791 $ 9,891,449 $ 10,152,679 $ 261,230Charges for services - - 7,925 7,925Miscellaneous - 12,512 9,638 )(2,874
Total revenues 9,722,791 9,903,961 10,170,242 266,281
EXPENDITURESCurrent:
Health and welfare 14,303,664 14,303,664 13,383,088 920,576Capital outlay 50,000 50,000 23,624 26,376
Total expenditures - budgetary basis 14,353,664 14,353,664 13,406,712 946,952- - )(220)(220Less open encumbrances at June 30
Total expenditures 14,353,664 14,353,664 13,406,492 947,172
Revenues over (under) expenditures )(4,630,873 )(4,449,703 )(3,236,250 1,213,453
OTHER FINANCING SOURCES (USES)Transfers in 4,630,733 4,630,733 3,236,250 )(1,394,483
Total other financing sources (uses), net 4,630,733 $ 4,630,733 3,236,250 )(1,394,483
Net change in fund balance
FUND BALANCE July 1, 2018
FUND BALANCE June 30, 2019
)(140
119,698
$ 119,558
181,030
119,698
$ 300,728
-
119,698
$ 119,698
)(181,030
-
$ )(181,030
104
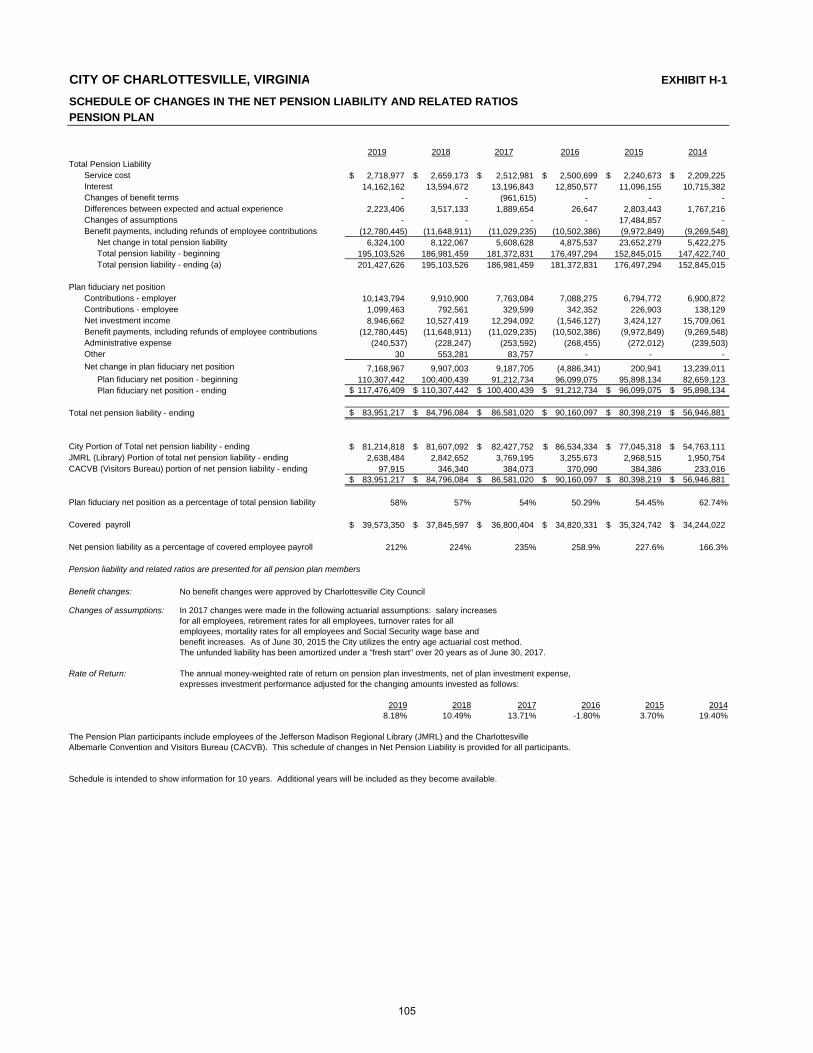
CITY OF CHARLOTTESVILLE, VIRGINIA
SCHEDULE OF CHANGES IN THE NET PENSION LIABILITY AND RELATED RATIOSPENSION PLAN
2019 2018 2017 2016 2015 2014
Total Pension LiabilityService cost 2,718,977$ 2,659,173$ 2,512,981$ 2,500,699$ 2,240,673$ 2,209,225$ Interest 14,162,162 13,594,672 13,196,843 12,850,577 11,096,155 10,715,382 Changes of benefit terms - - (961,615) - - - Differences between expected and actual experience 2,223,406 3,517,133 1,889,654 26,647 2,803,443 1,767,216 Changes of assumptions - - - - 17,484,857 - Benefit payments, including refunds of employee contributions (12,780,445) (11,648,911) (11,029,235) (10,502,386) (9,972,849) (9,269,548)
Net change in total pension liability 6,324,100 8,122,067 5,608,628 4,875,537 23,652,279 5,422,275 Total pension liability - beginning 195,103,526 186,981,459 181,372,831 176,497,294 152,845,015 147,422,740 Total pension liability - ending (a) 201,427,626 195,103,526 186,981,459 181,372,831 176,497,294 152,845,015
Plan fiduciary net positionContributions - employer 10,143,794 9,910,900 7,763,084 7,088,275 6,794,772 6,900,872 Contributions - employee 1,099,463 792,561 329,599 342,352 226,903 138,129 Net investment income 8,946,662 10,527,419 12,294,092 (1,546,127) 3,424,127 15,709,061 Benefit payments, including refunds of employee contributions (12,780,445) (11,648,911) (11,029,235) (10,502,386) (9,972,849) (9,269,548) Administrative expense (240,537) (228,247) (253,592) (268,455) (272,012) (239,503) Other 30 553,281 83,757 - - -
Net change in plan fiduciary net position 7,168,967 9,907,003 9,187,705 (4,886,341) 200,941 13,239,011 Plan fiduciary net position - beginning 110,307,442 100,400,439 91,212,734 96,099,075 95,898,134 82,659,123 Plan fiduciary net position - ending 117,476,409$ 110,307,442$ 100,400,439$ 91,212,734$ 96,099,075$ 95,898,134$
83,951,217$ 84,796,084$ 86,581,020$ 90,160,097$ 80,398,219$ 56,946,881$
81,214,818$ 81,607,092$ 82,427,752$ 86,534,334$ 77,045,318$ 54,763,111$ 2,638,484 2,842,652 3,769,195 3,255,673 2,968,515 1,950,754
97,915 346,340 384,073 370,090 384,386 233,01683,951,217$ 84,796,084$ 86,581,020$ 90,160,097$ 80,398,219$ 56,946,881$
58% 57% 54% 50.29% 54.45% 62.74%
Total net pension liability - ending
City Portion of Total net pension liability - endingJMRL (Library) Portion of total net pension liability - ending CACVB (Visitors Bureau) portion of net pension liability - ending
Plan fiduciary net position as a percentage of total pension liability
Covered payroll 39,573,350$ 37,845,597$ 36,800,404$ 34,820,331$ 35,324,742$ 34,244,022$
Net pension liability as a percentage of covered employee payroll 212% 224% 235% 258.9% 227.6% 166.3%
Pension liability and related ratios are presented for all pension plan members
Benefit changes: No benefit changes were approved by Charlottesville City Council
Changes of assumptions: In 2017 changes were made in the following actuarial assumptions: salary increasesfor all employees, retirement rates for all employees, turnover rates for all employees, mortality rates for all employees and Social Security wage base andbenefit increases. As of June 30, 2015 the City utilizes the entry age actuarial cost method.The unfunded liability has been amortized under a "fresh start" over 20 years as of June 30, 2017.
Rate of Return: The annual money-weighted rate of return on pension plan investments, net of plan investment expense,expresses investment performance adjusted for the changing amounts invested as follows:
2019 2018 2017 2016 2015 20148.18% 10.49% 13.71% -1.80% 3.70% 19.40%
The Pension Plan participants include employees of the Jefferson Madison Regional Library (JMRL) and the CharlottesvilleAlbemarle Convention and Visitors Bureau (CACVB). This schedule of changes in Net Pension Liability is provided for all participants.
Schedule is intended to show information for 10 years. Additional years will be included as they become available.
EXHIBIT H-1
105
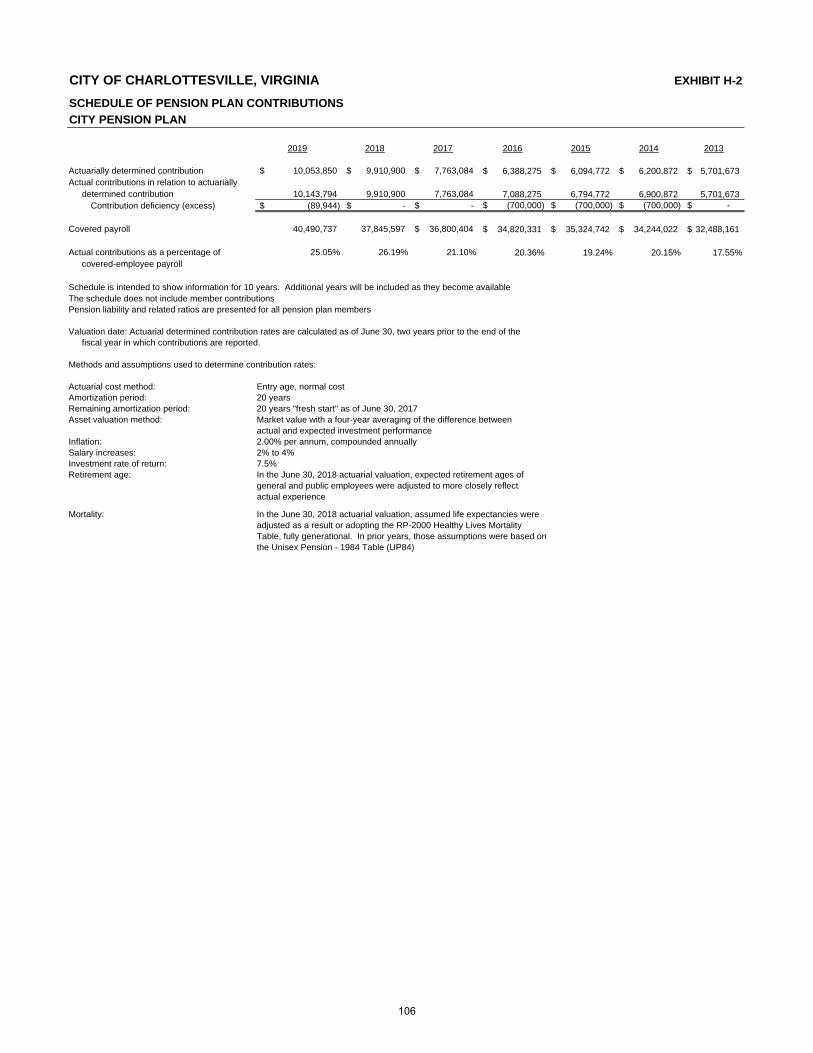
CITY OF CHARLOTTESVILLE, VIRGINIA EXHIBIT H-2
SCHEDULE OF PENSION PLAN CONTRIBUTIONS
CITY PENSION PLAN
2019 2018 2017 2016 2015 2014 2013
10,053,850$ 9,910,900$ 7,763,084$ 6,388,275$ 6,094,772$ 6,200,872$ 5,701,673$
10,143,794 9,910,900 7,763,084 7,088,275 6,794,772 6,900,872 5,701,673 (89,944)$ -$ -$ (700,000)$ (700,000)$ (700,000)$ -$
40,490,737 37,845,597 36,800,404$ 34,820,331$ 35,324,742$ 34,244,022$ 32,488,161$
Actuarially determined contributionActual contributions in relation to actuarially
determined contributionContribution deficiency (excess)
Covered payroll
Actual contributions as a percentage of 25.05% 26.19% 21.10% 20.36% 19.24% 20.15% 17.55%covered-employee payroll
Schedule is intended to show information for 10 years. Additional years will be included as they become availableThe schedule does not include member contributionsPension liability and related ratios are presented for all pension plan members
Valuation date: Actuarial determined contribution rates are calculated as of June 30, two years prior to the end of the fiscal year in which contributions are reported.
Methods and assumptions used to determine contribution rates:
Actuarial cost method: Entry age, normal costAmortization period: 20 yearsRemaining amortization period: 20 years "fresh start" as of June 30, 2017Asset valuation method: Market value with a four-year averaging of the difference between
actual and expected investment performanceInflation: 2.00% per annum, compounded annuallySalary increases: 2% to 4%Investment rate of return: 7.5%Retirement age: In the June 30, 2018 actuarial valuation, expected retirement ages of
general and public employees were adjusted to more closely reflectactual experience
Mortality: In the June 30, 2018 actuarial valuation, assumed life expectancies wereadjusted as a result or adopting the RP-2000 Healthy Lives Mortality Table, fully generational. In prior years, those assumptions were based onthe Unisex Pension - 1984 Table (UP84)
106
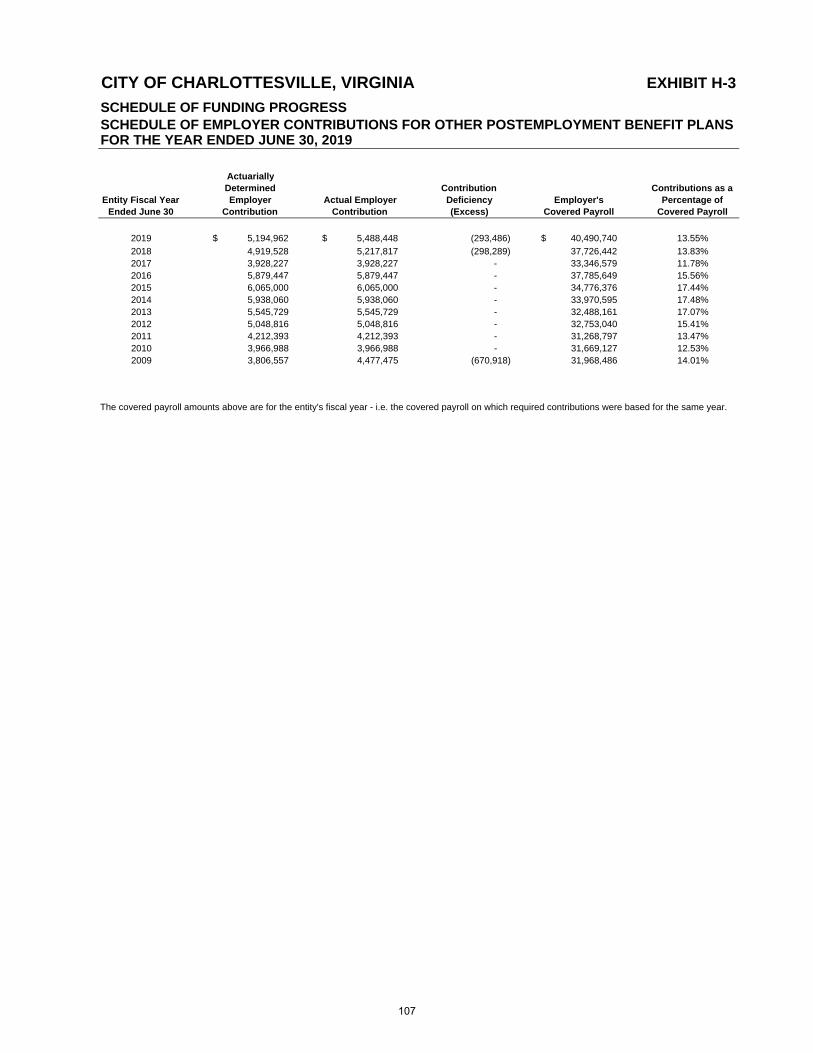
CITY OF CHARLOTTESVILLE, VIRGINIA EXHIBIT H-3
SCHEDULE OF FUNDING PROGRESSSCHEDULE OF EMPLOYER CONTRIBUTIONS FOR OTHER POSTEMPLOYMENT BENEFIT PLANSFOR THE YEAR ENDED JUNE 30, 2019
Entity Fiscal Year Ended June 30
Actuarially Determined Employer
ContributionActual Employer
Contribution
Contribution Deficiency (Excess)
Employer's Covered Payroll
Contributions as a Percentage of
Covered Payroll
2019 5,194,962$ 5,488,448$ (293,486) 40,490,740$ 13.55%
2018 4,919,528 5,217,817 (298,289) 37,726,442 13.83%2017 3,928,227 3,928,227 - 33,346,579 11.78%2016 5,879,447 5,879,447 - 37,785,649 15.56%2015 6,065,000 6,065,000 - 34,776,376 17.44%2014 5,938,060 5,938,060 - 33,970,595 17.48%2013 5,545,729 5,545,729 - 32,488,161 17.07%2012 5,048,816 5,048,816 - 32,753,040 15.41%2011 4,212,393 4,212,393 - 31,268,797 13.47%2010 3,966,988 3,966,988 - 31,669,127 12.53%2009 3,806,557 4,477,475 (670,918) 31,968,486 14.01%
The covered payroll amounts above are for the entity's fiscal year - i.e. the covered payroll on which required contributions were based for the same year.
107
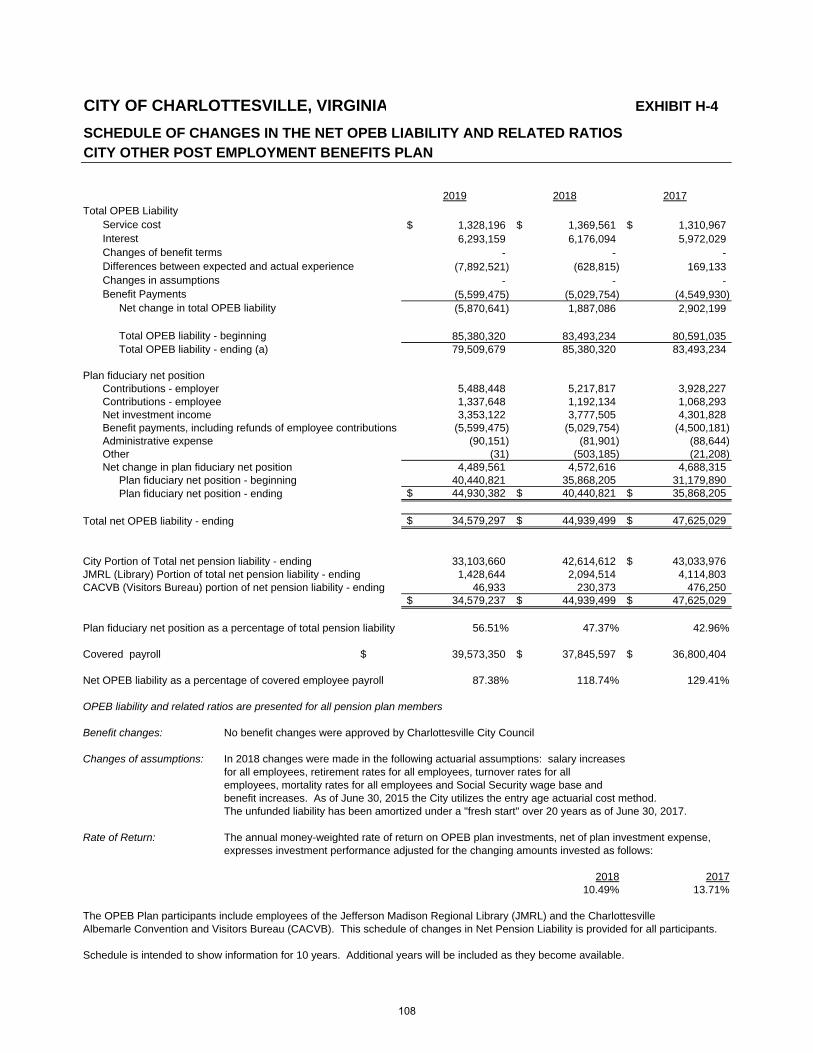
CITY OF CHARLOTTESVILLE, VIRGINIA EXHIBIT H-4
SCHEDULE OF CHANGES IN THE NET OPEB LIABILITY AND RELATED RATIOSCITY OTHER POST EMPLOYMENT BENEFITS PLAN
2019 2018 2017
Total OPEB LiabilityService cost 1,328,196$ 1,369,561$ 1,310,967$ Interest 6,293,159 6,176,094 5,972,029 Changes of benefit terms - - - Differences between expected and actual experience (7,892,521) (628,815) 169,133 Changes in assumptions - - - Benefit Payments (5,599,475) (5,029,754) (4,549,930)
Net change in total OPEB liability (5,870,641) 1,887,086 2,902,199
Total OPEB liability - beginning 85,380,320 83,493,234 80,591,035 Total OPEB liability - ending (a) 79,509,679 85,380,320 83,493,234
Plan fiduciary net positionContributions - employer 5,488,448 5,217,817 3,928,227 Contributions - employee 1,337,648 1,192,134 1,068,293 Net investment income 3,353,122 3,777,505 4,301,828 Benefit payments, including refunds of employee contributions (5,599,475) (5,029,754) (4,500,181) Administrative expense (90,151) (81,901) (88,644) Other (31) (503,185) (21,208) Net change in plan fiduciary net position 4,489,561 4,572,616 4,688,315
Plan fiduciary net position - beginning 40,440,821 35,868,205 31,179,890 Plan fiduciary net position - ending 44,930,382$ 40,440,821$ 35,868,205$
Total net OPEB liability - ending 34,579,297$ 44,939,499$ 47,625,029$
City Portion of Total net pension liability - ending 33,103,660 42,614,612 43,033,976$ JMRL (Library) Portion of total net pension liability - ending 1,428,644 2,094,514 4,114,803 CACVB (Visitors Bureau) portion of net pension liability - ending 46,933 230,373 476,250
34,579,237$ 44,939,499$ 47,625,029$
56.51% 47.37% 42.96%
39,573,350 37,845,597$ 36,800,404$
87.38% 118.74% 129.41%
Plan fiduciary net position as a percentage of total pension liability
Covered payroll $
Net OPEB liability as a percentage of covered employee payroll
OPEB liability and related ratios are presented for all pension plan members
Benefit changes: No benefit changes were approved by Charlottesville City Council
Changes of assumptions: In 2018 changes were made in the following actuarial assumptions: salary increasesfor all employees, retirement rates for all employees, turnover rates for all employees, mortality rates for all employees and Social Security wage base andbenefit increases. As of June 30, 2015 the City utilizes the entry age actuarial cost method.The unfunded liability has been amortized under a "fresh start" over 20 years as of June 30, 2017.
Rate of Return: The annual money-weighted rate of return on OPEB plan investments, net of plan investment expense,expresses investment performance adjusted for the changing amounts invested as follows:
2018 201710.49% 13.71%
The OPEB Plan participants include employees of the Jefferson Madison Regional Library (JMRL) and the CharlottesvilleAlbemarle Convention and Visitors Bureau (CACVB). This schedule of changes in Net Pension Liability is provided for all participants.
Schedule is intended to show information for 10 years. Additional years will be included as they become available.
108

CHARLOTTESVILLE SCHOOL BOARD COMPONENT UNIT
Required Supplementary Information
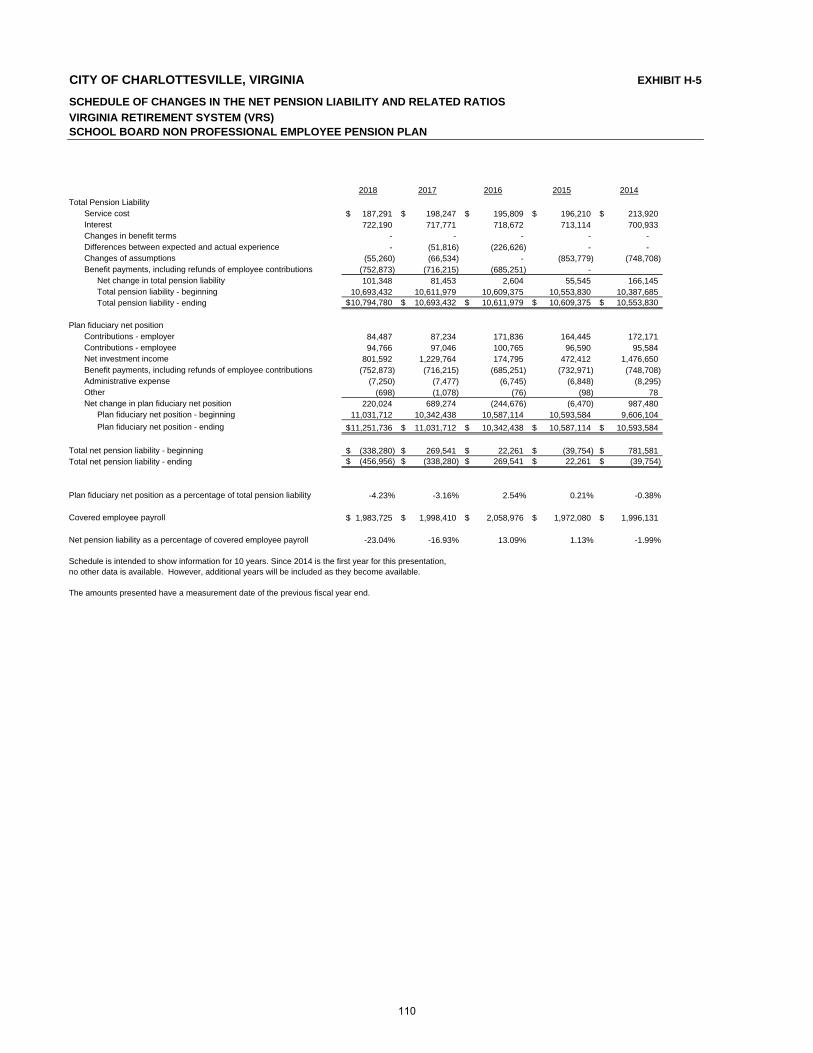
CITY OF CHARLOTTESVILLE, VIRGINIA EXHIBIT H-5
SCHEDULE OF CHANGES IN THE NET PENSION LIABILITY AND RELATED RATIOS
VIRGINIA RETIREMENT SYSTEM (VRS)SCHOOL BOARD NON PROFESSIONAL EMPLOYEE PENSION PLAN
2018 2017 2016 2015 2014
Total Pension LiabilityService cost 187,291$ 198,247$ 195,809$ 196,210$ 213,920$ Interest 722,190 717,771 718,672 713,114 700,933 Changes in benefit terms - - - - - Differences between expected and actual experience - (51,816) (226,626) - - Changes of assumptions (55,260) (66,534) - (853,779) (748,708) Benefit payments, including refunds of employee contributions (752,873) (716,215) (685,251) -
Net change in total pension liability 101,348 81,453 2,604 55,545 166,145 Total pension liability - beginning 10,693,432 10,611,979 10,609,375 10,553,830 10,387,685 Total pension liability - ending 10,794,780$ 10,693,432$ 10,611,979$ 10,609,375$ 10,553,830$
Plan fiduciary net positionContributions - employer 84,487 87,234 171,836 164,445 172,171Contributions - employee 94,766 97,046 100,765 96,590 95,584Net investment income 801,592 1,229,764 174,795 472,412 1,476,650Benefit payments, including refunds of employee contributions (752,873) (716,215) (685,251) (732,971) (748,708)Administrative expense (7,250) (7,477) (6,745) (6,848) (8,295)Other (698) (1,078) (76) (98) 78Net change in plan fiduciary net position 220,024 689,274 (244,676) (6,470) 987,480
Plan fiduciary net position - beginning 11,031,712 10,342,438 10,587,114 10,593,584 9,606,104
Plan fiduciary net position - ending 11,251,736$ 11,031,712$ 10,342,438$ 10,587,114$ 10,593,584$
Total net pension liability - beginning (338,280)$ 269,541$ 22,261$ (39,754)$ 781,581$ Total net pension liability - ending (456,956)$ (338,280)$ 269,541$ 22,261$ (39,754)$
Plan fiduciary net position as a percentage of total pension liability -4.23% -3.16% 2.54% 0.21% -0.38%
Covered employee payroll 1,983,725$ 1,998,410$ 2,058,976$ 1,972,080$ 1,996,131$
Net pension liability as a percentage of covered employee payroll -23.04% -16.93% 13.09% 1.13% -1.99%
Schedule is intended to show information for 10 years. Since 2014 is the first year for this presentation, no other data is available. However, additional years will be included as they become available.
The amounts presented have a measurement date of the previous fiscal year end.
110
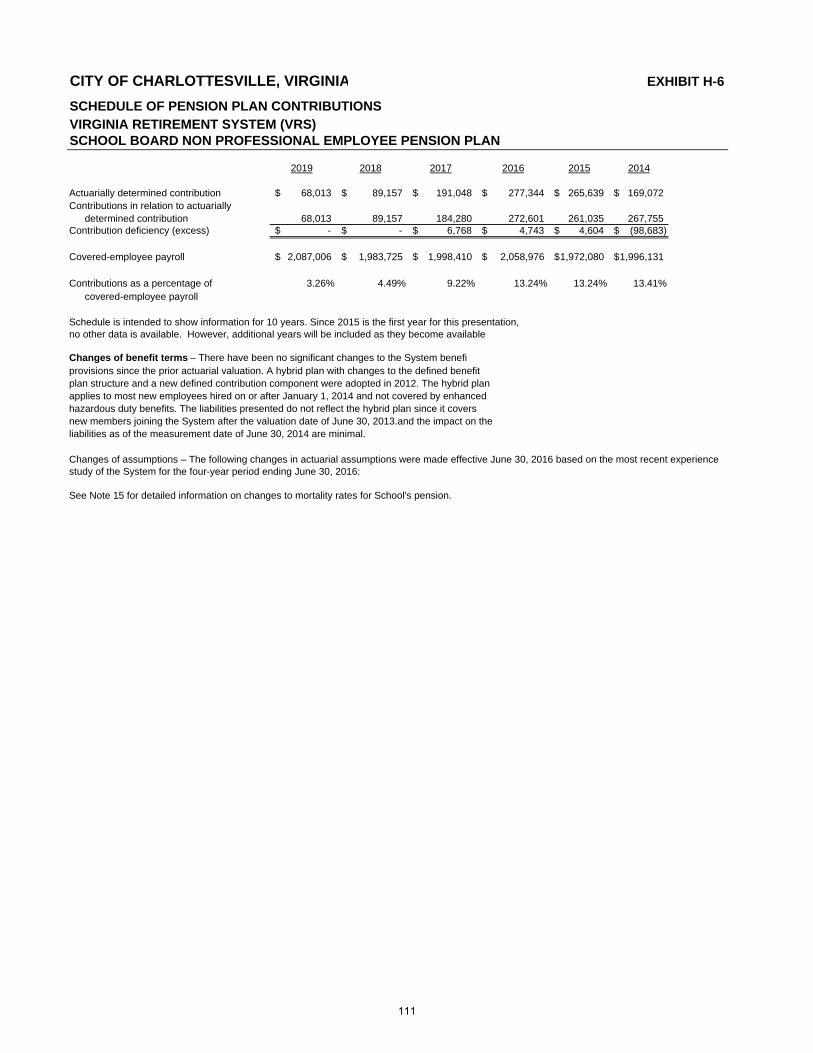
CITY OF CHARLOTTESVILLE, VIRGINIA EXHIBIT H-6
SCHEDULE OF PENSION PLAN CONTRIBUTIONSVIRGINIA RETIREMENT SYSTEM (VRS)SCHOOL BOARD NON PROFESSIONAL EMPLOYEE PENSION PLAN
2019 2018 2017 2016 2015 2014
Actuarially determined contribution 68,013$ 89,157$ 191,048$ 277,344$ 265,639$ 169,072$ Contributions in relation to actuarially
determined contribution 68,013 89,157 184,280 272,601 261,035 267,755 Contribution deficiency (excess) -$ -$ 6,768$ 4,743$ 4,604$ (98,683)$
Covered-employee payroll 2,087,006$ 1,983,725$ 1,998,410$ 2,058,976$ 1,972,080$ 1,996,131$
Contributions as a percentage of 3.26% 4.49% 9.22% 13.24% 13.24% 13.41%covered-employee payroll
Schedule is intended to show information for 10 years. Since 2015 is the first year for this presentation, no other data is available. However, additional years will be included as they become available
Changes of benefit terms – There have been no significant changes to the System benefiprovisions since the prior actuarial valuation. A hybrid plan with changes to the defined benefitplan structure and a new defined contribution component were adopted in 2012. The hybrid planapplies to most new employees hired on or after January 1, 2014 and not covered by enhancedhazardous duty benefits. The liabilities presented do not reflect the hybrid plan since it coversnew members joining the System after the valuation date of June 30, 2013.and the impact on theliabilities as of the measurement date of June 30, 2014 are minimal.
See Note 15 for detailed information on changes to mortality rates for School's pension.
Changes of assumptions – The following changes in actuarial assumptions were made effective June 30, 2016 based on the most recent experience study of the System for the four-year period ending June 30, 2016:
111
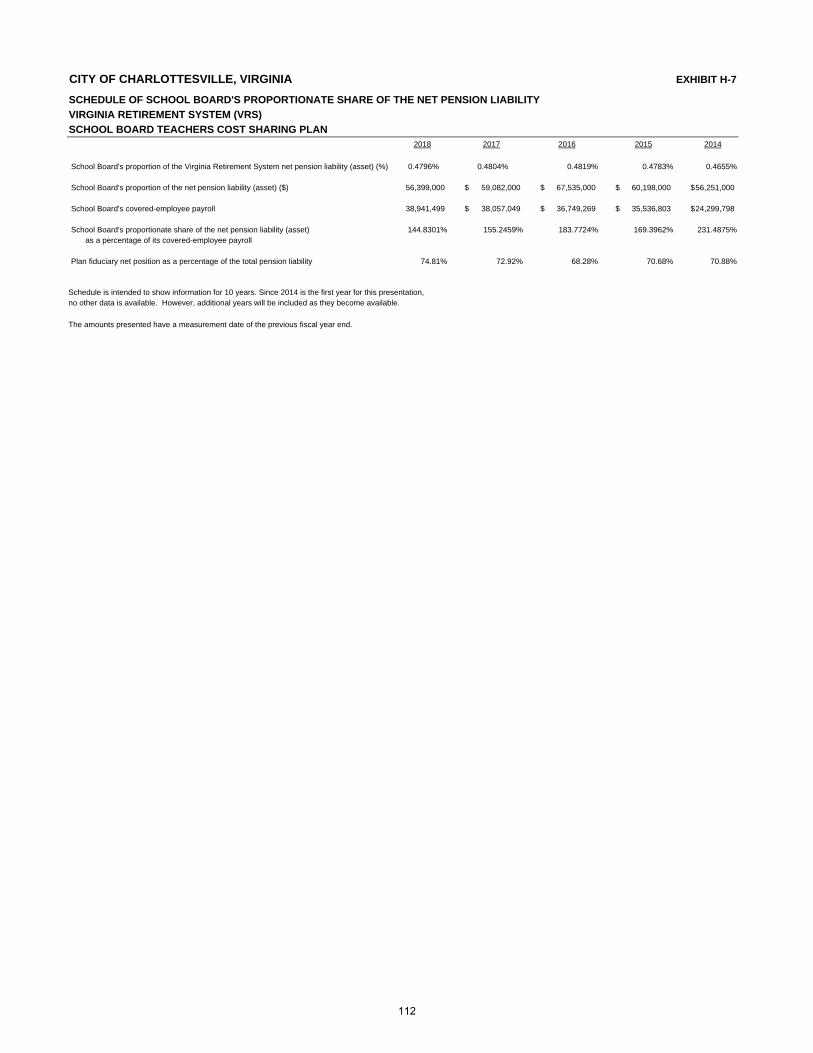
CITY OF CHARLOTTESVILLE, VIRGINIA EXHIBIT H-7
SCHEDULE OF SCHOOL BOARD'S PROPORTIONATE SHARE OF THE NET PENSION LIABILITY
VIRGINIA RETIREMENT SYSTEM (VRS)
SCHOOL BOARD TEACHERS COST SHARING PLAN2018 2017 2016 2015 2014
School Board's proportion of the Virginia Retirement System net pension liability (asset) (%) 0.4796% 0.4804% 0.4819% 0.4783% 0.4655%
School Board's proportion of the net pension liability (asset) ($) 56,399,000 59,082,000$ 67,535,000$ 60,198,000$ 56,251,000$
School Board's covered-employee payroll 38,941,499 38,057,049$ 36,749,269$ 35,536,803$ 24,299,798$
School Board's proportionate share of the net pension liability (asset) 144.8301% 155.2459% 183.7724% 169.3962% 231.4875%as a percentage of its covered-employee payroll
Plan fiduciary net position as a percentage of the total pension liability 74.81% 72.92% 68.28% 70.68% 70.88%
Schedule is intended to show information for 10 years. Since 2014 is the first year for this presentation, no other data is available. However, additional years will be included as they become available.
The amounts presented have a measurement date of the previous fiscal year end.
112
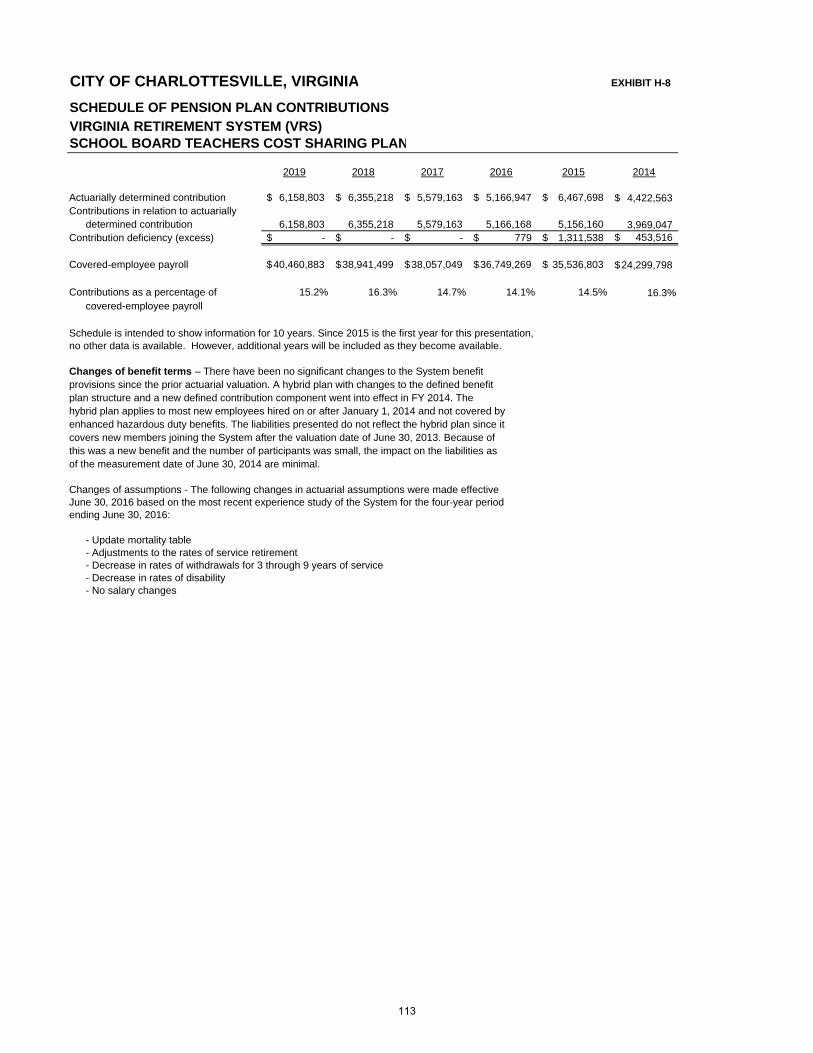
CITY OF CHARLOTTESVILLE, VIRGINIA EXHIBIT H-8
SCHEDULE OF PENSION PLAN CONTRIBUTIONSVIRGINIA RETIREMENT SYSTEM (VRS)SCHOOL BOARD TEACHERS COST SHARING PLAN
2019 2018 2017 2016 2015 2014
Actuarially determined contribution 6,158,803$ 6,355,218$ 5,579,163$ 5,166,947$ 6,467,698$ 4,422,563$ Contributions in relation to actuarially
determined contribution 6,158,803 6,355,218 5,579,163 5,166,168 5,156,160 3,969,047 Contribution deficiency (excess) -$ -$ -$ 779$ 1,311,538$ 453,516$
Covered-employee payroll 40,460,883$ 38,941,499$ 38,057,049$ 36,749,269$ 35,536,803$ 24,299,798$
Contributions as a percentage of 15.2% 16.3% 14.7% 14.1% 14.5% 16.3%covered-employee payroll
Schedule is intended to show information for 10 years. Since 2015 is the first year for this presentation, no other data is available. However, additional years will be included as they become available.
Changes of benefit terms – There have been no significant changes to the System benefitprovisions since the prior actuarial valuation. A hybrid plan with changes to the defined benefitplan structure and a new defined contribution component went into effect in FY 2014. Thehybrid plan applies to most new employees hired on or after January 1, 2014 and not covered byenhanced hazardous duty benefits. The liabilities presented do not reflect the hybrid plan since itcovers new members joining the System after the valuation date of June 30, 2013. Because ofthis was a new benefit and the number of participants was small, the impact on the liabilities asof the measurement date of June 30, 2014 are minimal.
Changes of assumptions - The following changes in actuarial assumptions were made effectiveJune 30, 2016 based on the most recent experience study of the System for the four-year periodending June 30, 2016:
- Update mortality table- Adjustments to the rates of service retirement- Decrease in rates of withdrawals for 3 through 9 years of service- Decrease in rates of disability- No salary changes
113
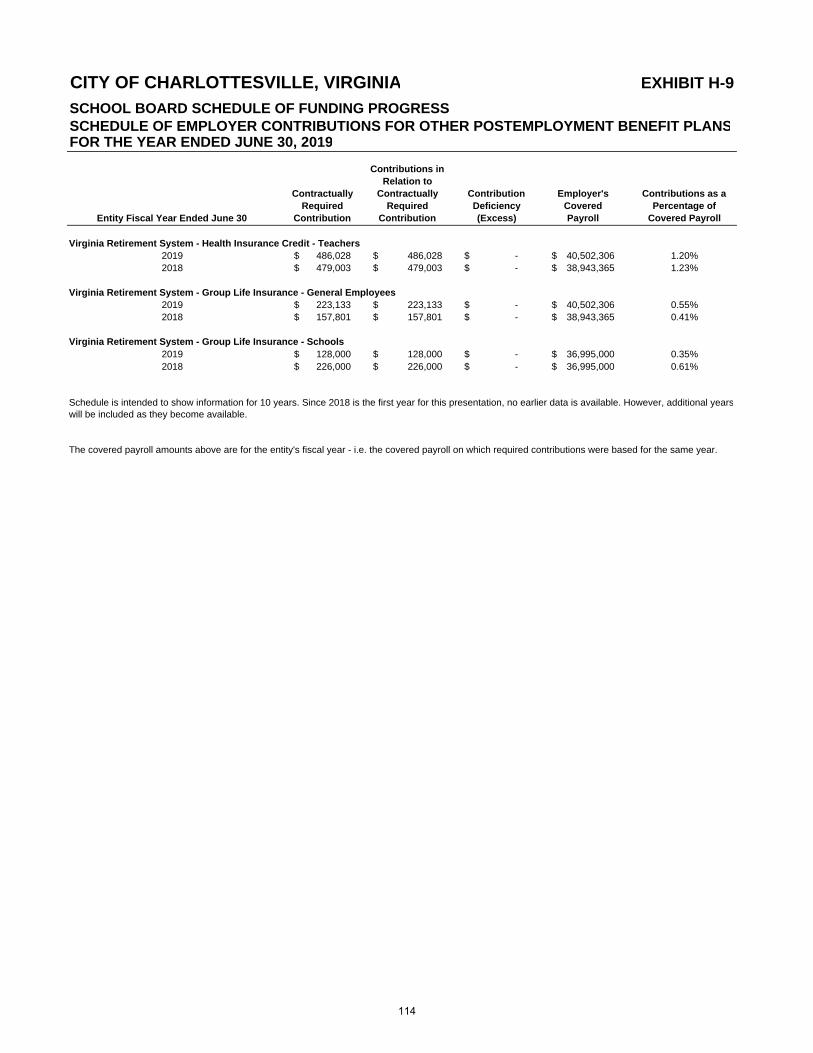
CITY OF CHARLOTTESVILLE, VIRGINIA
SCHOOL BOARD SCHEDULE OF FUNDING PROGRESSSCHEDULE OF EMPLOYER CONTRIBUTIONS FOR OTHER POSTEMPLOYMENT BENEFIT PLANSFOR THE YEAR ENDED JUNE 30, 2019
Entity Fiscal Year Ended June 30
Contractually Required
Contribution
Contributions in Relation to
Contractually Required
Contribution
Contribution Deficiency (Excess)
Employer's Covered Payroll
Contributions as a Percentage of
Covered Payroll
Virginia Retirement System - Health Insurance Credit - Teachers 2019 486,028$ 486,028$ -$ 40,502,306$ 1.20%2018 479,003$ 479,003$ -$ 38,943,365$ 1.23%
Virginia Retirement System - Group Life Insurance - General Employees 2019 223,133$ 223,133$ -$ 40,502,306$ 0.55%2018 157,801$ 157,801$ -$ 38,943,365$ 0.41%
Virginia Retirement System - Group Life Insurance - Schools2019 128,000$ 128,000$ -$ 36,995,000$ 0.35%2018 226,000$ 226,000$ -$ 36,995,000$ 0.61%
EXHIBIT H-9
Schedule is intended to show information for 10 years. Since 2018 is the first year for this presentation, no earlier data is available. However, additional yearswill be included as they become available.
The covered payroll amounts above are for the entity's fiscal year - i.e. the covered payroll on which required contributions were based for the same year.
114
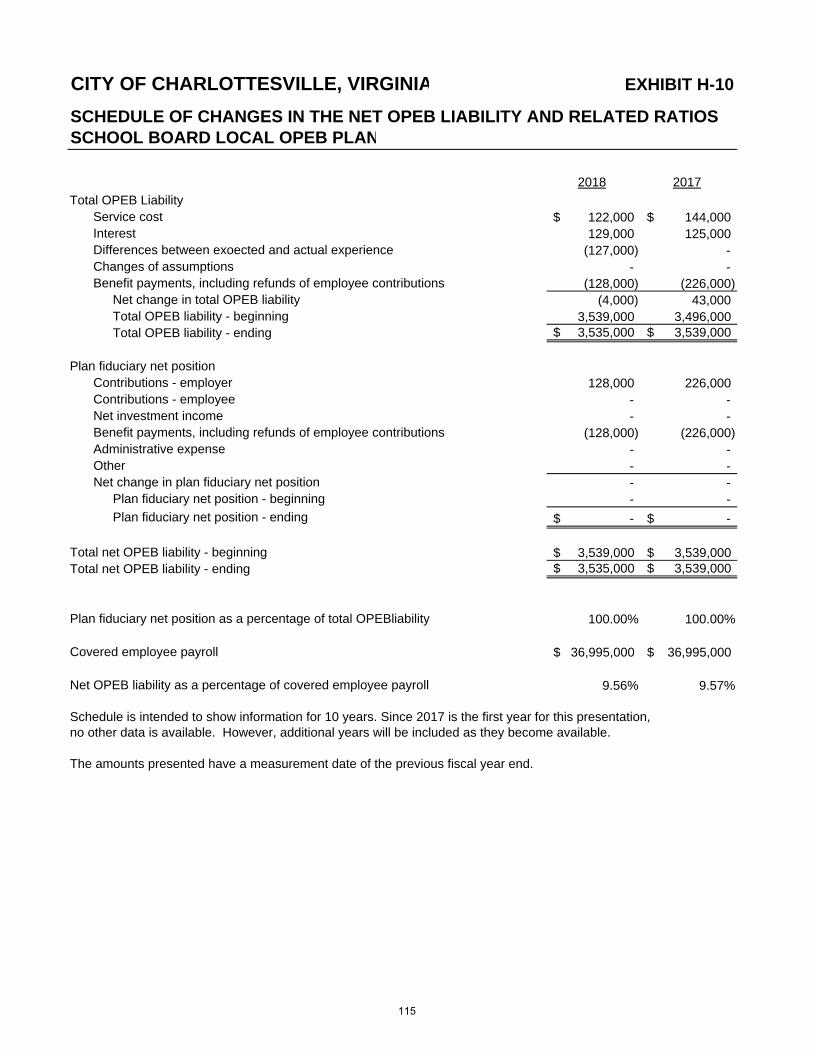
CITY OF CHARLOTTESVILLE, VIRGINIA EXHIBIT H-10
SCHEDULE OF CHANGES IN THE NET OPEB LIABILITY AND RELATED RATIOSSCHOOL BOARD LOCAL OPEB PLAN
2018 2017
Total OPEB LiabilityService cost 122,000$ 144,000$ Interest 129,000 125,000 Differences between exoected and actual experience (127,000) - Changes of assumptions - - Benefit payments, including refunds of employee contributions (128,000) (226,000)
Net change in total OPEB liability (4,000) 43,000 Total OPEB liability - beginning 3,539,000 3,496,000 Total OPEB liability - ending 3,535,000$ 3,539,000$
Plan fiduciary net positionContributions - employer 128,000 226,000 Contributions - employee - - Net investment income - - Benefit payments, including refunds of employee contributions (128,000) (226,000) Administrative expense - - Other - - Net change in plan fiduciary net position - -
Plan fiduciary net position - beginning - -
Plan fiduciary net position - ending -$ -$
Total net OPEB liability - beginning 3,539,000$ 3,539,000$ Total net OPEB liability - ending 3,535,000$ 3,539,000$
Plan fiduciary net position as a percentage of total OPEBliability 100.00% 100.00%
Covered employee payroll 36,995,000$ 36,995,000$
Net OPEB liability as a percentage of covered employee payroll 9.56% 9.57%
Schedule is intended to show information for 10 years. Since 2017 is the first year for this presentation, no other data is available. However, additional years will be included as they become available.
The amounts presented have a measurement date of the previous fiscal year end.
115
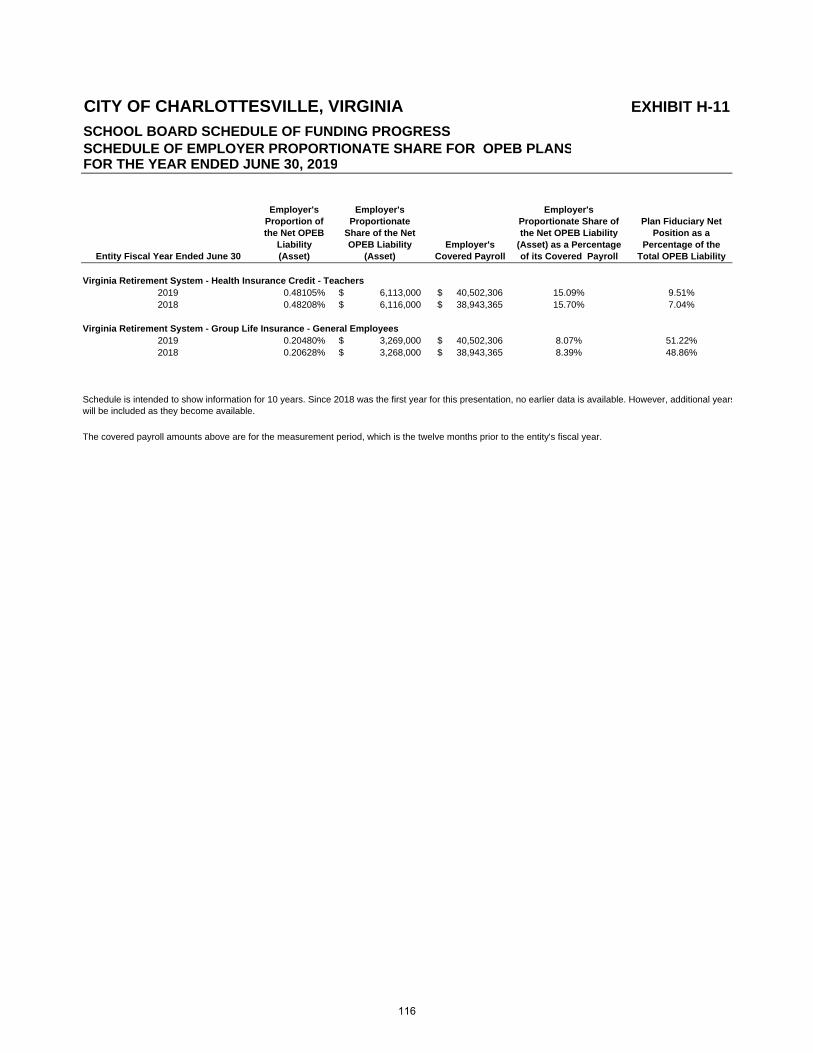
CITY OF CHARLOTTESVILLE, VIRGINIA
SCHOOL BOARD SCHEDULE OF FUNDING PROGRESSSCHEDULE OF EMPLOYER PROPORTIONATE SHARE FOR OPEB PLANSFOR THE YEAR ENDED JUNE 30, 2019
Entity Fiscal Year Ended June 30
Employer's Proportion of the Net OPEB
Liability (Asset)
Employer's Proportionate
Share of the Net OPEB Liability
(Asset)Employer's
Covered Payroll
Employer's Proportionate Share of the Net OPEB Liability
(Asset) as a Percentage of its Covered Payroll
Plan Fiduciary Net Position as a
Percentage of the Total OPEB Liability
Virginia Retirement System - Health Insurance Credit - Teachers 2019 0.48105% 6,113,000$ 40,502,306$ 15.09% 9.51%2018 0.48208% 6,116,000$ 38,943,365$ 15.70% 7.04%
Virginia Retirement System - Group Life Insurance - General Employees 2019 0.20480% 3,269,000$ 40,502,306$ 8.07% 51.22%2018 0.20628% 3,268,000$ 38,943,365$ 8.39% 48.86%
Schedule is intended to show information for 10 years. Since 2018 was the first year for this presentation, no earlier data is available. However, additional yearswill be included as they become available.
The covered payroll amounts above are for the measurement period, which is the twelve months prior to the entity's fiscal year.
EXHIBIT H-11
116

SUPPLEMENTARY SECTION
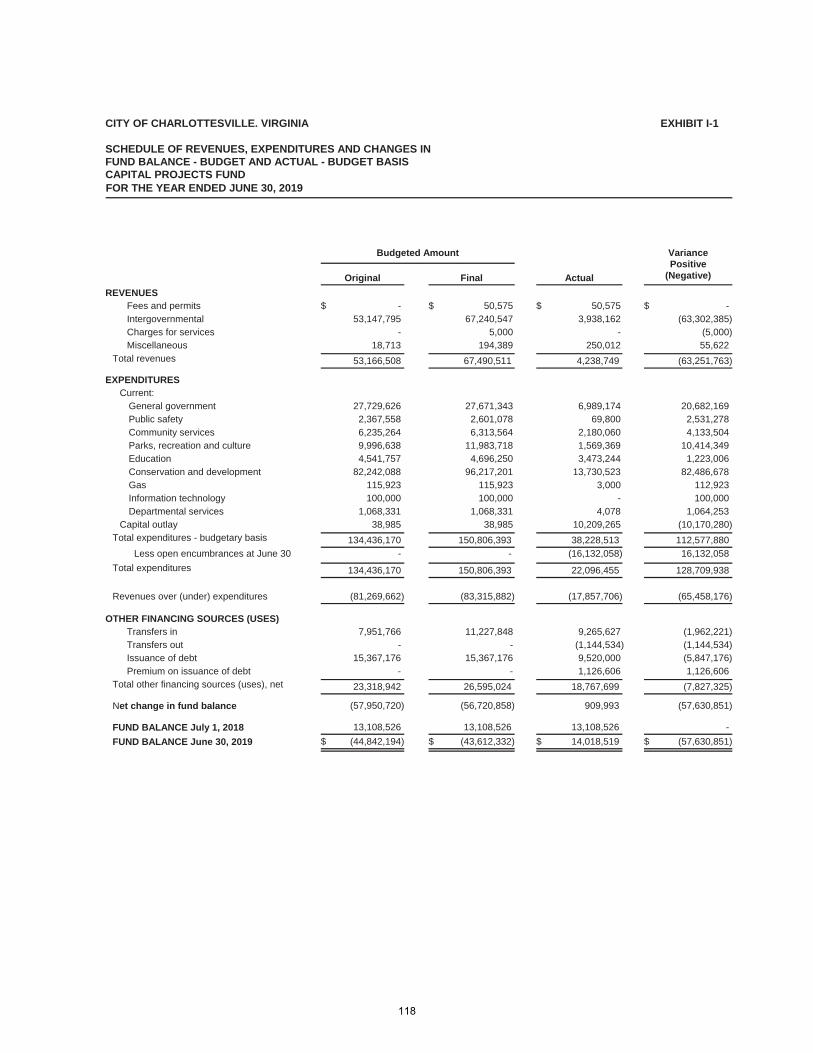
CITY OF CHARLOTTESVILLE. VIRGINIA
SCHEDULE OF REVENUES, EXPENDITURES AND CHANGES IN FUND BALANCE - BUDGET AND ACTUAL - BUDGET BASISCAPITAL PROJECTS FUND
EXHIBIT I-1
FOR THE YEAR ENDED JUNE 30, 2019
Original Final Actual
VariancePositive
(Negative)
Budgeted Amount
REVENUESFees and permits $ - $ 50,575 $ 50,575 $ -Intergovernmental 53,147,795 67,240,547 3,938,162 )(63,302,385Charges for services - 5,000 - )(5,000Miscellaneous 18,713 194,389 250,012 55,622
Total revenues 53,166,508 67,490,511 4,238,749 )(63,251,763
EXPENDITURESCurrent:
General government 27,729,626 27,671,343 6,989,174 20,682,169Public safety 2,367,558 2,601,078 69,800 2,531,278Community services 6,235,264 6,313,564 2,180,060 4,133,504Parks, recreation and culture 9,996,638 11,983,718 1,569,369 10,414,349Education 4,541,757 4,696,250 3,473,244 1,223,006Conservation and development 82,242,088 96,217,201 13,730,523 82,486,678Gas 115,923 115,923 3,000 112,923Information technology 100,000 100,000 - 100,000Departmental services 1,068,331 1,068,331 4,078 1,064,253
Capital outlay 38,985 38,985 10,209,265 )(10,170,280Total expenditures - budgetary basis 134,436,170 150,806,393 38,228,513 112,577,880
- - 16,132,058Less open encumbrances at June 30 )(16,132,058
Total expenditures 134,436,170 150,806,393 22,096,455 128,709,938
Revenues over (under) expenditures )(81,269,662 )(83,315,882 )(17,857,706 )(65,458,176
OTHER FINANCING SOURCES (USES)Transfers in 7,951,766 11,227,848 9,265,627 )(1,962,221Transfers out - - )(1,144,534 )(1,144,534Issuance of debt 15,367,176 15,367,176 9,520,000 )(5,847,176Premium on issuance of debt - - 1,126,606 1,126,606
Total other financing sources (uses), net 23,318,942 26,595,024 18,767,699 )(7,827,325
Net change in fund balance )(57,950,720 )(56,720,858 )(57,630,851909,993
FUND BALANCE July 1, 2018
FUND BALANCE June 30, 2019
13,108,526 13,108,526
$ )(44,842,194 $ )(43,612,332
13,108,526
$ 14,018,519
-
$ )(57,630,851
118
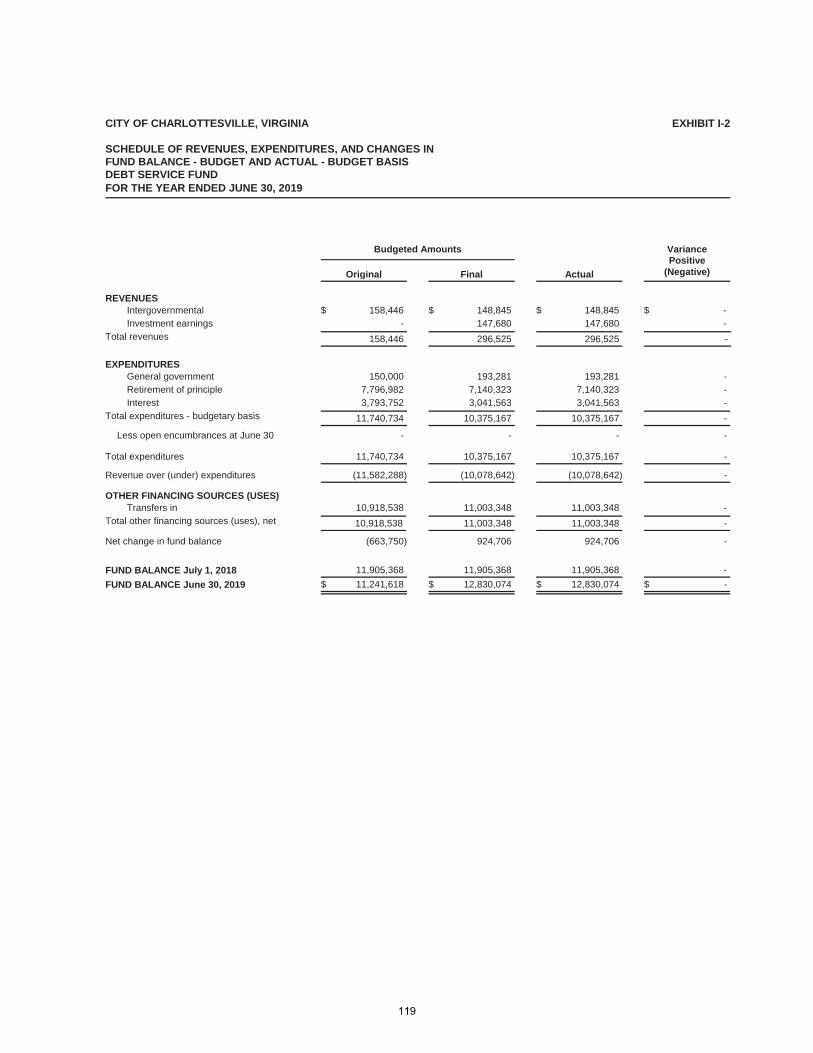
CITY OF CHARLOTTESVILLE, VIRGINIA
SCHEDULE OF REVENUES, EXPENDITURES, AND CHANGES IN FUND BALANCE - BUDGET AND ACTUAL - BUDGET BASISDEBT SERVICE FUND
EXHIBIT I-2
FOR THE YEAR ENDED JUNE 30, 2019
ActualOriginal Final
VariancePositive
(Negative)
Budgeted Amounts
REVENUESIntergovernmental $ 158,446 $ 148,845 $ 148,845 $ -Investment earnings - 147,680 147,680 -
Total revenues 158,446 296,525 296,525 -
EXPENDITURESGeneral government 150,000 193,281 193,281 -Retirement of principle 7,796,982 7,140,323 7,140,323 -Interest 3,793,752 3,041,563 3,041,563 -
Total expenditures - budgetary basis 11,740,734 10,375,167 10,375,167 -
Less open encumbrances at June 30 - - - -
Total expenditures 11,740,734 10,375,167 10,375,167 -
Revenue over (under) expenditures )(11,582,288 )(10,078,642 )(10,078,642 -
OTHER FINANCING SOURCES (USES)Transfers in 10,918,538 11,003,348 11,003,348 -
Total other financing sources (uses), net 10,918,538 11,003,348 11,003,348 -
Net change in fund balance )(663,750 924,706 924,706 -
FUND BALANCE July 1, 2018
FUND BALANCE June 30, 2019
11,905,368 11,905,368 11,905,368 -
$ 11,241,618 $ 12,830,074 $ 12,830,074 $ -
119

PENSION TRUST FUNDS
Pension trust funds are used to account for services provided to the retirees of the City of Charlottesville and its participating agencies. These funds account for retirement benefits of the defined benefit and defined contribution plans. Additionally, these funds account for other post-employment benefits for retirees.
Retirement Fund – to account for the costs of pensions paid to retirees, who meet eligibility requirements to receive such funds.
Post-Retirement Benefits Fund – to account for the costs of health care, dental and life insurance paid to eligible retirees.
120
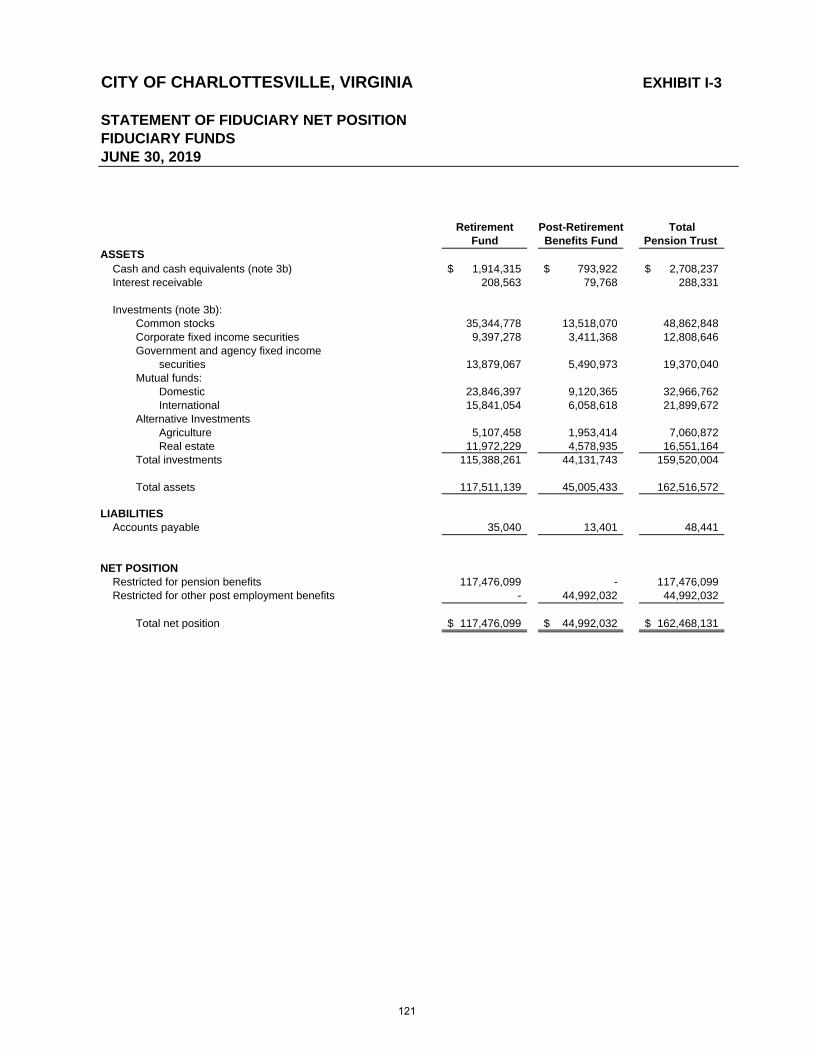
CITY OF CHARLOTTESVILLE, VIRGINIA EXHIBIT I-3
STATEMENT OF FIDUCIARY NET POSITIONFIDUCIARY FUNDS
Retirement Post-Retirement TotalFund Benefits Fund Pension Trust
ASSETSCash and cash equivalents (note 3b) 1,914,315$ 793,922$ 2,708,237$ Interest receivable 208,563 79,768 288,331
Investments (note 3b):Common stocks 35,344,778 13,518,070 48,862,848 Corporate fixed income securities 9,397,278 3,411,368 12,808,646 Government and agency fixed income
securities 13,879,067 5,490,973 19,370,040 Mutual funds:
Domestic 23,846,397 9,120,365 32,966,762 International 15,841,054 6,058,618 21,899,672
Alternative InvestmentsAgriculture 5,107,458 1,953,414 7,060,872 Real estate 11,972,229 4,578,935 16,551,164
Total investments 115,388,261 44,131,743 159,520,004
Total assets 117,511,139 45,005,433 162,516,572
LIABILITIESAccounts payable 35,040 13,401 48,441
NET POSITIONRestricted for pension benefits 117,476,099 - 117,476,099 Restricted for other post employment benefits - 44,992,032 44,992,032
Total net position 117,476,099$ 44,992,032$ 162,468,131$
JUNE 30, 2019
121
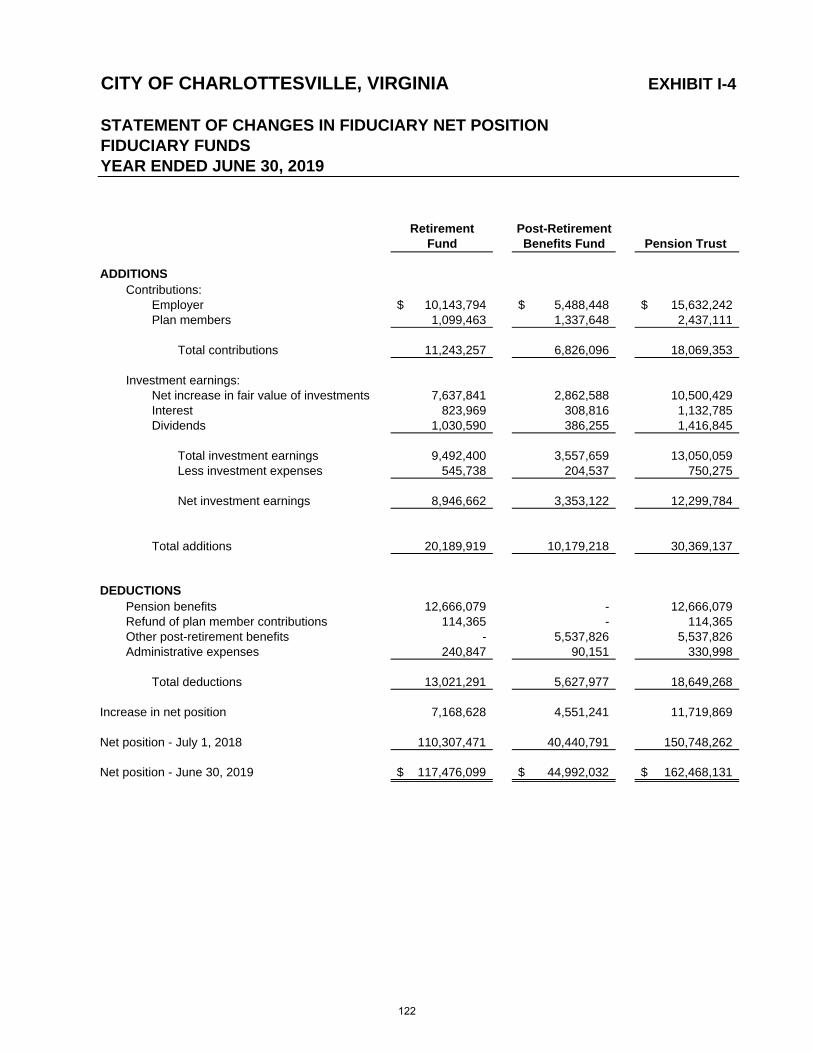
CITY OF CHARLOTTESVILLE, VIRGINIA EXHIBIT I-4
STATEMENT OF CHANGES IN FIDUCIARY NET POSITIONFIDUCIARY FUNDSYEAR ENDED JUNE 30, 2019
Retirement Post-RetirementFund Benefits Fund Pension Trust
ADDITIONSContributions:
Employer 10,143,794$ 5,488,448$ 15,632,242$ Plan members 1,099,463 1,337,648 2,437,111
Total contributions 11,243,257 6,826,096 18,069,353
Investment earnings:Net increase in fair value of investments 7,637,841 2,862,588 10,500,429 Interest 823,969 308,816 1,132,785 Dividends 1,030,590 386,255 1,416,845
Total investment earnings 9,492,400 3,557,659 13,050,059 Less investment expenses 545,738 204,537 750,275
Net investment earnings 8,946,662 3,353,122 12,299,784
Total additions 20,189,919 10,179,218 30,369,137
DEDUCTIONSPension benefits 12,666,079 - 12,666,079Refund of plan member contributions 114,365 - 114,365Other post-retirement benefits - 5,537,826 5,537,826 Administrative expenses 240,847 90,151 330,998
Total deductions 13,021,291 5,627,977 18,649,268
Increase in net position 7,168,628 4,551,241 11,719,869
Net position - July 1, 2018 110,307,471 40,440,791 150,748,262
Net position - June 30, 2019 117,476,099$ 44,992,032$ 162,468,131$
122
NONMAJOR GOVERNMENTAL FUNDS
SPECIAL REVENUE FUNDS
Special revenue funds are used to account for and report specific revenues that are legally restricted, committed, or assigned to expenditure for particular purposes other than debt service or capital projects. The City has established the following nonmajor special revenue funds:
Community Development Block Grant (CDBG) Fund – to account for funds provided by U. S. Housing and Urban Development (HUD) for low-income housing and assistance projects. Included are repayments of CDBG program loans that are re-programmed for the same purpose.
Grants Fund – to account for revenues and expenditures restricted for specific grants awarded to the City by federal and state government, or local public or private agencies that are not accounted for or reported in another fund.
Human Services Fund – to account for services which promote the healthy development and stability of at-risk youth and families, in addition to residential and community-based services which advocate for the needs of youth and their families, assist the local community in preventing juvenile delinquency and family disintegration, and promote the rehabilitation of youth. This fund was previously called Community Attention.
Virginia Juvenile Community Crime Control Act (VJCCCA) Fund – to account for grant funds provided by the Virginia Department of Juvenile Justice aimed to deter crime by providing immediate, effective punishment that emphasizes accountability of the juvenile offender for his/her actions as well as reduce the pattern of repeat offending. Albemarle County also participates in this grant.
Children’s Services Act (CSA) Fund – to account for the City’s portion of the activities of the multi-jurisdictional CSA Team, which provides high quality, child centered, family focused, services to high-risk youth and their families. This program was previously call Comprehensive Services Act.
Transit Fund – to account for the operations and capital purchases of Charlottesville Area Transit (CAT), which provides fixed-route public bus service to the City and urban portions of Albemarle County. The City contracts with JAUNT to provide required Americans with Disabilities Act (ADA) paratransit service that fixed-route buses are unable to accommodate. Federal pass-thru revenues and expenses of JAUNT are separately accounted for within the Transit Fund.
PERMANENT FUND
Permanent funds are restricted to the extent that only earnings, and not principal, may be used for the benefit of the government and its citizenry.
Cemetery Perpetual Care Permanent Fund – This fund is used to account for principal trust amounts received, and related interest income. The interest portion of the trust may be used to maintain the two (2) City owned cemeteries within City limits.
123
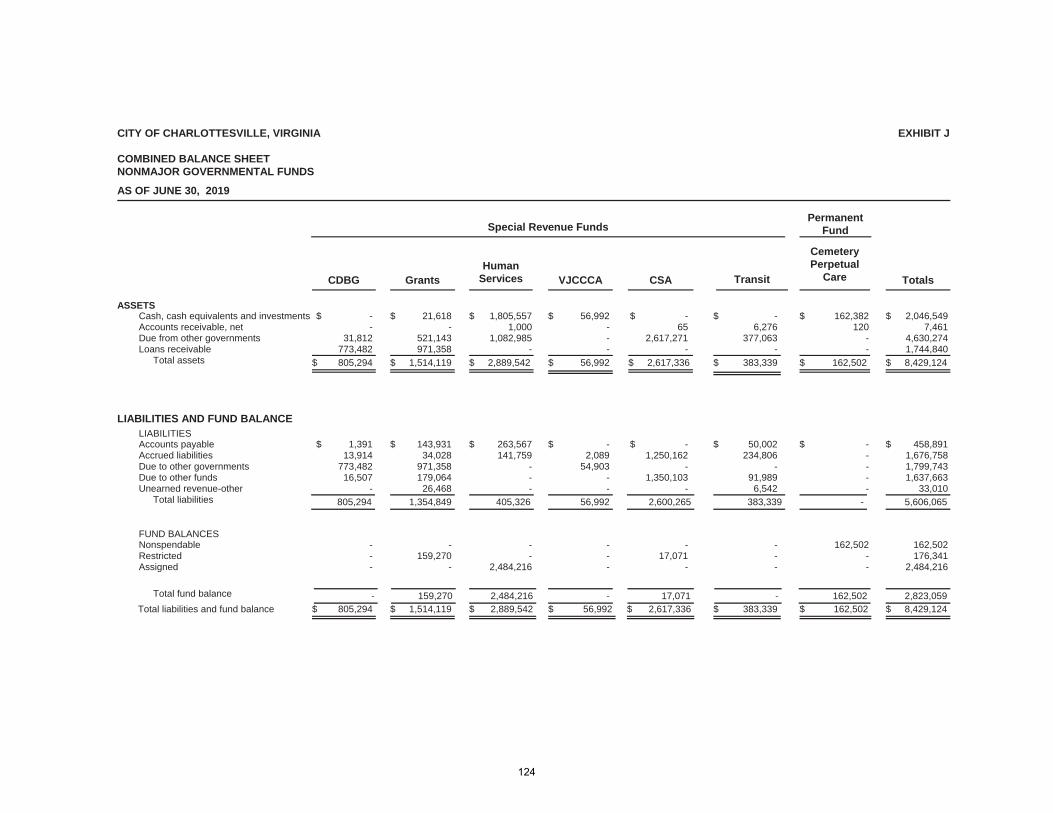
CITY OF CHARLOTTESVILLE, VIRGINIA
COMBINED BALANCE SHEETNONMAJOR GOVERNMENTAL FUNDS
AS OF JUNE 30, 2019
EXHIBIT J
CDBG
Special Revenue Funds
GrantsHuman
Services VJCCCA CSA Transit
Cemetery Perpetual
Care
Permanent Fund
Totals
ASSETS$ - $ 21,618 $ 1,805,557 $ 56,992 $ - $ - $ 162,382Cash, cash equivalents and investments $ 2,046,549
- - 1,000 - 65 6,276 120Accounts receivable, net 7,46131,812 521,143 1,082,985 - 2,617,271 377,063 -Due from other governments 4,630,274
773,482 971,358 - - - - -Loans receivable 1,744,840Total assets $ 805,294 $ 1,514,119 $ 2,889,542 $ 56,992 $ 2,617,336 $ 383,339 $ 162,502 $ 8,429,124
LIABILITIES AND FUND BALANCELIABILITIES
$ 1,391 $ 143,931 $ 263,567 $ - $ - $ 50,002 $ -Accounts payable $ 458,89113,914 34,028 141,759 2,089 1,250,162 234,806 -Accrued liabilities 1,676,758
773,482 971,358 - 54,903 - - -Due to other governments 1,799,74316,507 179,064 - - 1,350,103 91,989 -Due to other funds 1,637,663
- 26,468 - - - 6,542 -Unearned revenue-other 33,010
805,294 405,326 56,992 2,600,265 383,339 - 5,606,065Total liabilities 1,354,849
FUND BALANCES- - - - - - 162,502Nonspendable 162,502- 159,270 - - 17,071 - -Restricted 176,341- - 2,484,216 - - - -Assigned 2,484,216
Total fund balance - 159,270 2,484,216 - 17,071 - 162,502 2,823,059$ 805,294 $ 1,514,119 $ 56,992 $ 2,617,336 $ 383,339 $ 162,502Total liabilities and fund balance $ 2,889,542 $ 8,429,124
124
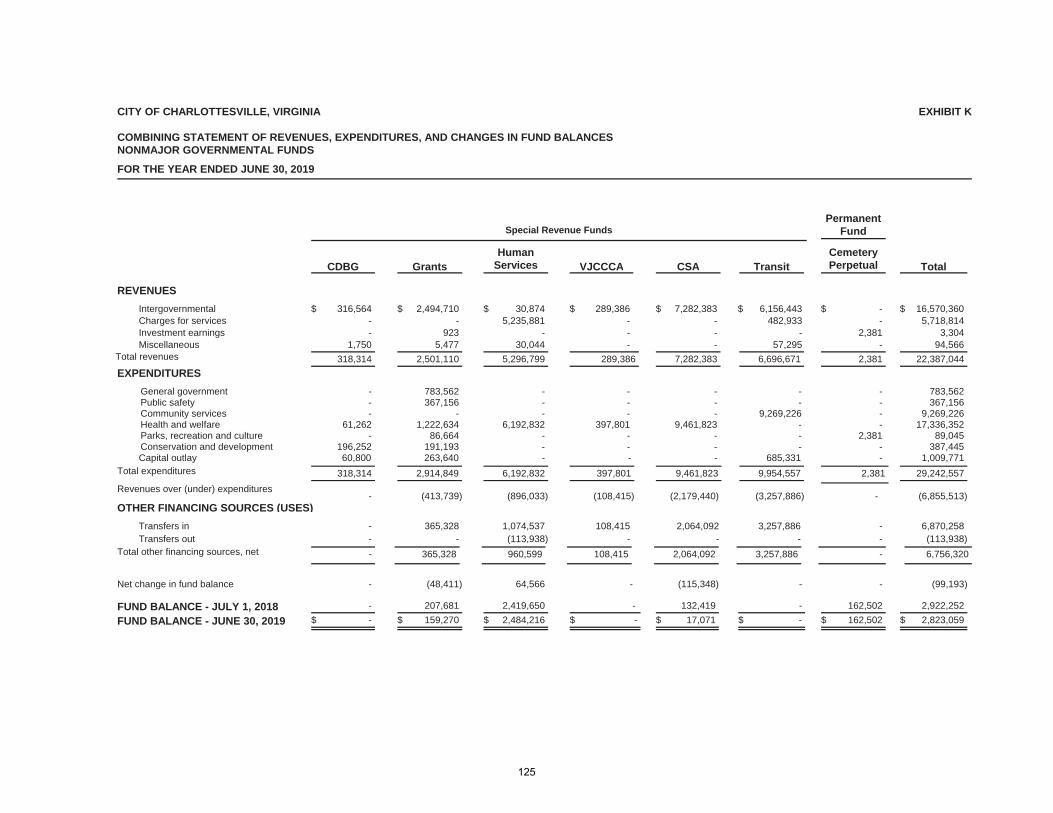
CITY OF CHARLOTTESVILLE, VIRGINIA
COMBINING STATEMENT OF REVENUES, EXPENDITURES, AND CHANGES IN FUND BALANCESNONMAJOR GOVERNMENTAL FUNDS
EXHIBIT K
FOR THE YEAR ENDED JUNE 30, 2019
Permanent Fund
CDBG Grants VJCCCA CSA TransitCemetery Perpetual Total
Special Revenue Funds
HumanServices
5 REVENUES
220 Intergovernmental $ 316,564 $ 2,494,710 $ 30,874 $ 289,386 $ 7,282,383 $ 6,156,443 $ - $ 16,570,360230 Charges for services - - 5,235,881 - - 482,933 - 5,718,814250 Investment earnings - 923 - - - - 2,381 3,304260 Miscellaneous 1,750 5,477 30,044 - - 57,295 - 94,566
Total revenues 5,296,799 289,3862,501,110318,314 7,282,383 6,696,671 2,381 22,387,0446 EXPENDITURES
101 General government - 783,562 - - - - - 783,562102 Public safety - 367,156 - - - - - 367,156103 Community services - - - - - 9,269,226 - 9,269,226104 Health and welfare 61,262 1,222,634 6,192,832 397,801 9,461,823 - - 17,336,352105 Parks, recreation and culture - 86,664 - - - - 2,381 89,045107 Conservation and development 196,252 191,193 - - - - - 387,445310 Capital outlay 685,331---263,64060,800 - 1,009,771
2,914,849318,314 6,192,832 397,801 9,461,823 9,954,557 2,381 29,242,557Total expenditures
- )(413,739 )(896,033 )(108,415 )(2,179,440 )(3,257,886 - )(6,855,513Revenues over (under) expenditures
7 OTHER FINANCING SOURCES (USES)
320 Transfers in - 365,328 1,074,537 108,415 2,064,092 3,257,886 - 6,870,258330 Transfers out - - )(113,938 - - - - )(113,938
- 365,328 960,599 108,415 2,064,092 3,257,886 - 6,756,320Total other financing sources, net
-
$ -
Net change in fund balance
FUND BALANCE - JULY 1, 2018FUND BALANCE - JUNE 30, 2019
207,681
$ 159,270
2,419,650
$ 2,484,216
-
$ -
- )(48,411 64,566 - )(115,348
132,419
$ 17,071
-
-
$ -
-
162,502
$ 162,502
)(99,193
2,922,252
$ 2,823,059
125
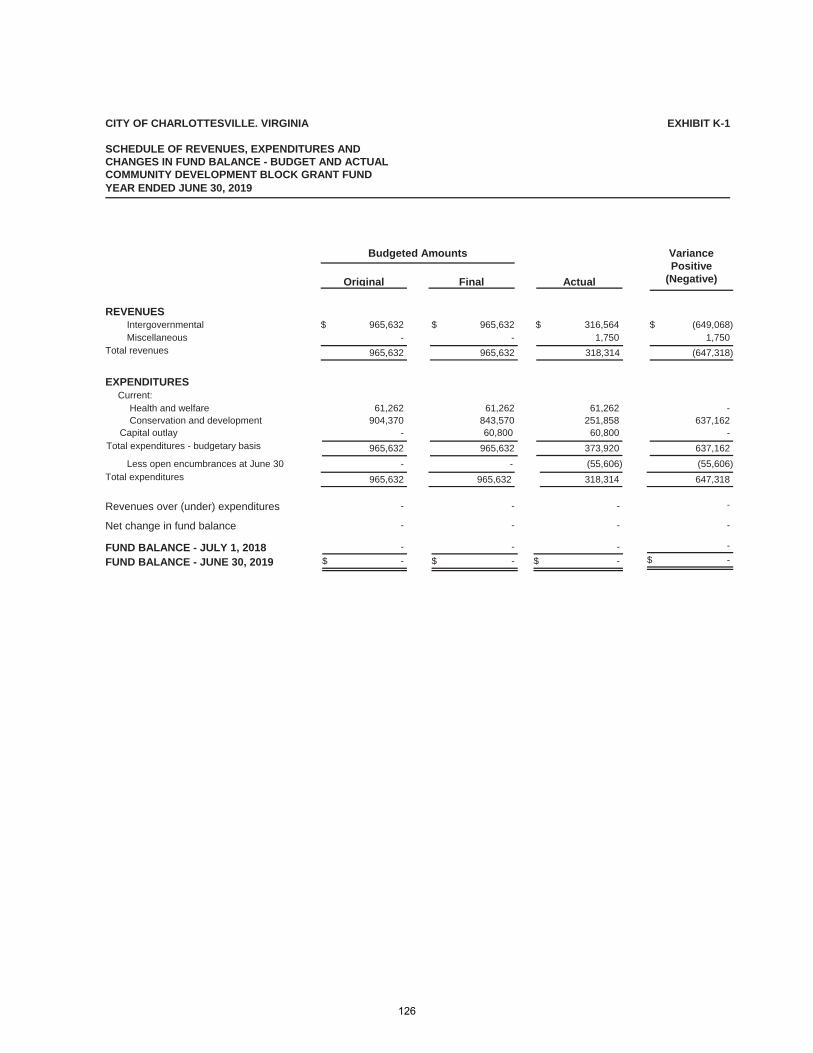
CITY OF CHARLOTTESVILLE. VIRGINIA
SCHEDULE OF REVENUES, EXPENDITURES AND CHANGES IN FUND BALANCE - BUDGET AND ACTUALCOMMUNITY DEVELOPMENT BLOCK GRANT FUNDYEAR ENDED JUNE 30, 2019
EXHIBIT K-1
Original Final Actual
Variance Positive
(Negative)
Budgeted Amounts
REVENUESIntergovernmental $ 965,632 $ 965,632 $ 316,564 $ )(649,068Miscellaneous - - 1,750 1,750
Total revenues 965,632 318,314 )(647,318965,632
EXPENDITURESCurrent:
Health and welfare 61,262 61,262 61,262 -Conservation and development 904,370 843,570 251,858 637,162
Capital outlay - 60,800 -60,800
965,632 965,632Total expenditures - budgetary basis 373,920 637,162
Less open encumbrances at June 30 )(55,606- - )(55,606
318,314965,632 965,632 647,318Total expenditures
- - - -Revenues over (under) expenditures
Net change in fund balance
FUND BALANCE - JULY 1, 2018FUND BALANCE - JUNE 30, 2019
- - - -
- - - -
$ - $ - $ - $ -
126
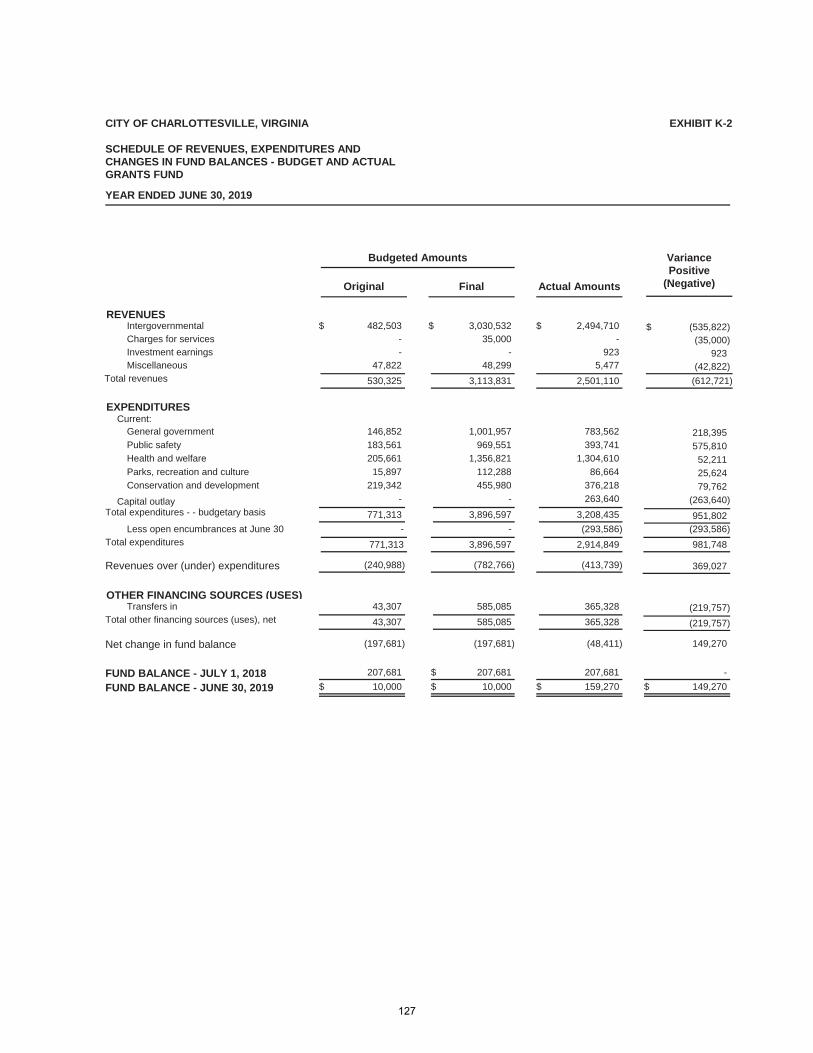
CITY OF CHARLOTTESVILLE, VIRGINIA
SCHEDULE OF REVENUES, EXPENDITURES ANDCHANGES IN FUND BALANCES - BUDGET AND ACTUALGRANTS FUND
YEAR ENDED JUNE 30, 2019
EXHIBIT K-2
Original Final Actual Amounts
Variance Positive
(Negative)
Budgeted Amounts
REVENUESIntergovernmental $ 482,503 $ 3,030,532 $ 2,494,710 $ )(535,822Charges for services - 35,000 - )(35,000Investment earnings - - 923 923Miscellaneous 47,822 48,299 5,477 )(42,822
Total revenues 530,325 3,113,831 2,501,110 )(612,721
EXPENDITURESCurrent:
General government 146,852 1,001,957 783,562 218,395Public safety 183,561 969,551 393,741 575,810Health and welfare 205,661 1,356,821 1,304,610 52,211Parks, recreation and culture 15,897 112,288 86,664 25,624Conservation and development 219,342 455,980 376,218 79,762
Capital outlay - - 263,640 )(263,640
951,8023,208,4353,896,597771,313Total expenditures - - budgetary basis
Less open encumbrances at June 30 )(293,586- - )(293,586Total expenditures 771,313 3,896,597 2,914,849 981,748
Revenues over (under) expenditures )(240,988 )(782,766 )(413,739 369,027
OTHER FINANCING SOURCES (USES)Transfers in 43,307 585,085 365,328 )(219,757
43,307 585,085 365,328 )(219,757Total other financing sources (uses), net
Net change in fund balance
FUND BALANCE - JULY 1, 2018FUND BALANCE - JUNE 30, 2019
)(197,681 )(197,681 )(48,411 149,270
207,681 $ 207,681 207,681 -
$ 10,000 $ 10,000 $ 159,270 $ 149,270
127
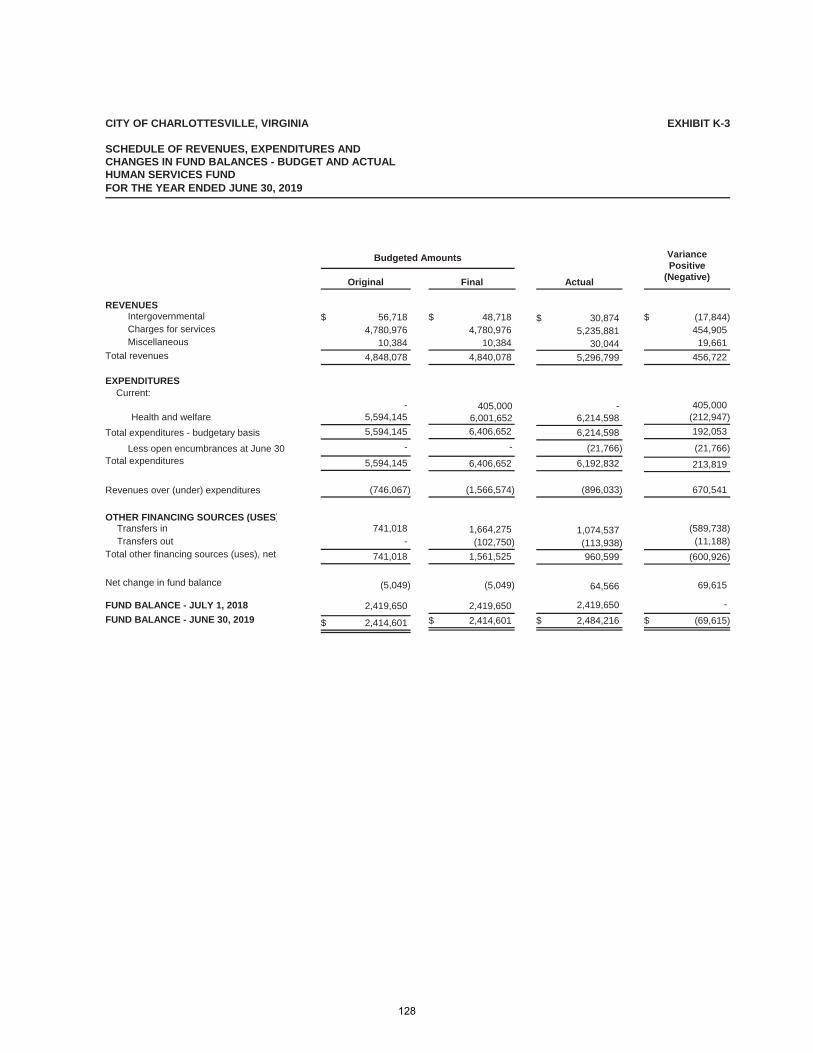
CITY OF CHARLOTTESVILLE, VIRGINIA
SCHEDULE OF REVENUES, EXPENDITURES ANDCHANGES IN FUND BALANCES - BUDGET AND ACTUALHUMAN SERVICES FUND
EXHIBIT K-3
FOR THE YEAR ENDED JUNE 30, 2019
Original Final Actual
VariancePositive
(Negative)
Budgeted Amounts
REVENUESIntergovernmental $ 56,718 $ 48,718 $ 30,874 $ )(17,844Charges for services 4,780,976 4,780,976 5,235,881 454,905Miscellaneous 10,384 10,384 30,044 19,661
Total revenues 4,848,078 4,840,078 5,296,799 456,722
EXPENDITURESCurrent:
- 405,000 - 405,000Health and welfare 5,594,145 6,001,652 6,214,598 )(212,947
Total expenditures - budgetary basis 5,594,145 6,406,652 6,214,598 192,053
Less open encumbrances at June 30 - - )(21,766 )(21,766Total expenditures 5,594,145 6,406,652 6,192,832 213,819
Revenues over (under) expenditures )(746,067 )(1,566,574 )(896,033 670,541
OTHER FINANCING SOURCES (USES)Transfers in 741,018 1,664,275 1,074,537 )(589,738Transfers out - )(102,750 )(113,938 )(11,188
Total other financing sources (uses), net 741,018 1,561,525 960,599 )(600,926
Net change in fund balance
FUND BALANCE - JULY 1, 2018
FUND BALANCE - JUNE 30, 2019
)(5,049 )(5,049 64,566 69,615
2,419,650 2,419,650 2,419,650 -
$ 2,414,601 $ 2,414,601 $ 2,484,216 $ )(69,615
128
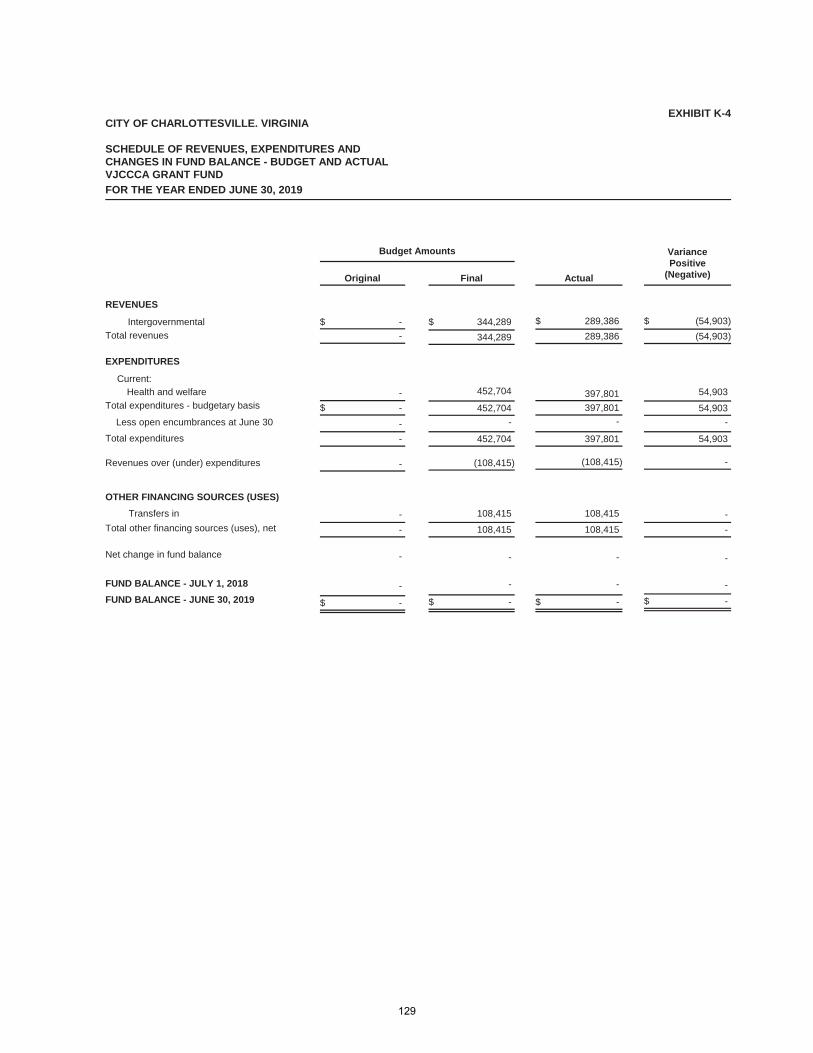
CITY OF CHARLOTTESVILLE. VIRGINIA
SCHEDULE OF REVENUES, EXPENDITURES AND CHANGES IN FUND BALANCE - BUDGET AND ACTUALVJCCCA GRANT FUND
EXHIBIT K-4
FOR THE YEAR ENDED JUNE 30, 2019
Original Final Actual
VariancePositive
(Negative)
Budget Amounts
REVENUES
Intergovernmental $ - $ 344,289 $ 289,386 $ )(54,903
Total revenues - 344,289 289,386 )(54,903
EXPENDITURES
Current:Health and welfare - 452,704 397,801 54,903
Total expenditures - budgetary basis $ - 452,704 397,801 54,903
Less open encumbrances at June 30 - - - -
Total expenditures - 452,704 397,801 54,903
Revenues over (under) expenditures - )(108,415 )(108,415 -
OTHER FINANCING SOURCES (USES)
Transfers in - 108,415 108,415 -
Total other financing sources (uses), net - 108,415 108,415 -
Net change in fund balance
FUND BALANCE - JULY 1, 2018
FUND BALANCE - JUNE 30, 2019
- - - -
- - - -
$ - $ - $ - $ -
129
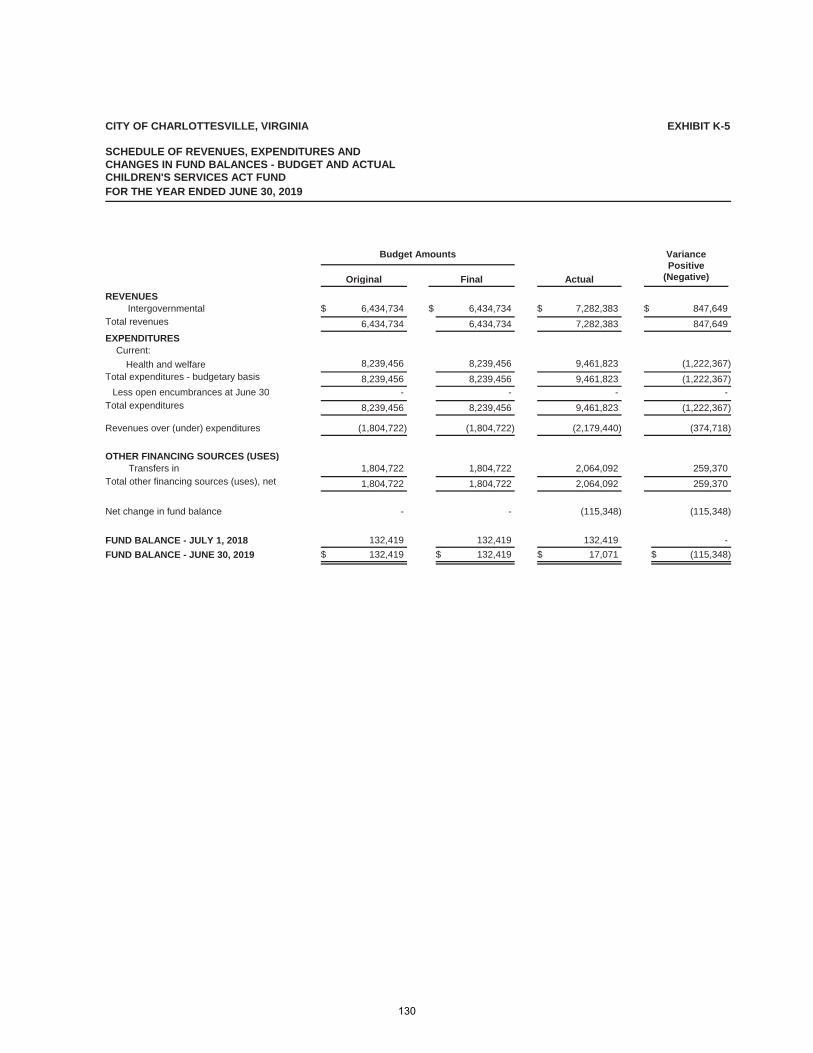
CITY OF CHARLOTTESVILLE, VIRGINIA
SCHEDULE OF REVENUES, EXPENDITURES ANDCHANGES IN FUND BALANCES - BUDGET AND ACTUALCHILDREN'S SERVICES ACT FUND
EXHIBIT K-5
FOR THE YEAR ENDED JUNE 30, 2019
Original Final Actual
VariancePositive
(Negative)
Budget Amounts
REVENUESIntergovernmental $ 6,434,734 $ 6,434,734 $ 7,282,383 $ 847,649
Total revenues 6,434,734 6,434,734 7,282,383 847,649
EXPENDITURESCurrent:
Health and welfare 8,239,456 8,239,456 9,461,823 )(1,222,367Total expenditures - budgetary basis 8,239,456 8,239,456 9,461,823 )(1,222,367
Less open encumbrances at June 30 - - - -Total expenditures 8,239,456 8,239,456 9,461,823 )(1,222,367
Revenues over (under) expenditures )(1,804,722 )(1,804,722 )(2,179,440 )(374,718
OTHER FINANCING SOURCES (USES)Transfers in 1,804,722 1,804,722 2,064,092 259,370
1,804,722 1,804,722 2,064,092 259,370Total other financing sources (uses), net
Net change in fund balance
FUND BALANCE - JULY 1, 2018
FUND BALANCE - JUNE 30, 2019
- - )(115,348 )(115,348
132,419 132,419 132,419 -
$ 132,419 $ 132,419 $ 17,071 $ )(115,348
130
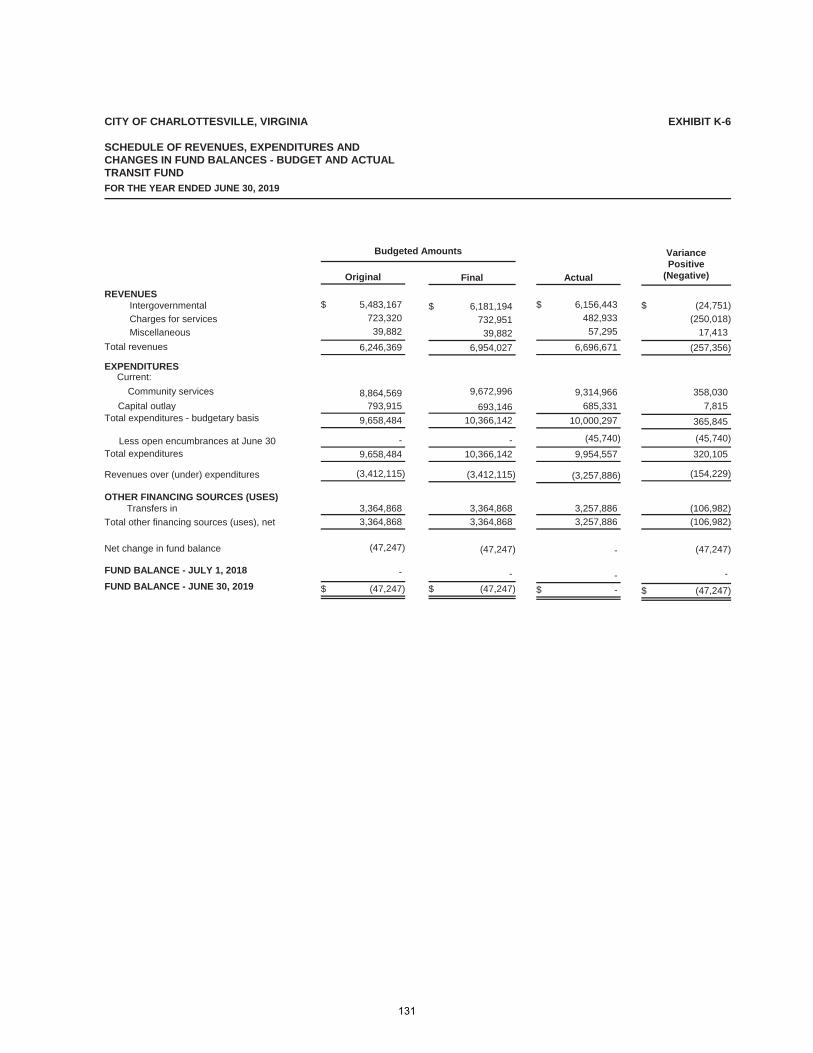
CITY OF CHARLOTTESVILLE, VIRGINIA
SCHEDULE OF REVENUES, EXPENDITURES ANDCHANGES IN FUND BALANCES - BUDGET AND ACTUALTRANSIT FUND
EXHIBIT K-6
FOR THE YEAR ENDED JUNE 30, 2019
Original Final Actual
VariancePositive
(Negative)
Budgeted Amounts
REVENUESIntergovernmental $ 5,483,167 $ 6,181,194 $ 6,156,443 $ )(24,751
Charges for services 723,320 732,951 482,933 )(250,018
Miscellaneous 39,882 39,882 57,295 17,413
Total revenues 6,246,369 6,954,027 6,696,671 )(257,356
EXPENDITURESCurrent:
Community services 8,864,569 9,672,996 9,314,966 358,030
Capital outlay 793,915 693,146 685,331 7,815Total expenditures - budgetary basis 9,658,484 10,366,142 10,000,297 365,845
Less open encumbrances at June 30 - - )(45,740 )(45,740
Total expenditures 9,658,484 10,366,142 9,954,557 320,105
Revenues over (under) expenditures )(3,412,115 )(3,412,115 )(3,257,886 )(154,229
OTHER FINANCING SOURCES (USES)Transfers in 3,364,868 3,364,868 3,257,886 )(106,982
Total other financing sources (uses), net 3,364,868 3,364,868 3,257,886 )(106,982
Net change in fund balance
FUND BALANCE - JULY 1, 2018
FUND BALANCE - JUNE 30, 2019
)(47,247 )(47,247 - )(47,247
- - - -
$ )(47,247 $ )(47,247 $ - $ )(47,247
131
INTERNAL SERVICE FUNDS
Internal service funds are used to account for services provided to other departments or agencies of the government, or to other governments, on a cost reimbursement basis.
Information Technology Fund – to account for the costs of operations of the City’s information technology department.
Departmental Services Fund – to account for the costs of operations of the City’s vehicle repair shop, fuel system, telephone system, and heating and air conditioning services.
Warehouse Fund – to account for the costs of operations of the City’s central warehouse.
Risk Management Fund – to account for the administration of the City’s programs for general liability, property and line of duty insurance coverage. To account for the administration of the City’s self-insurance programs for health care, worker’s compensation.
132
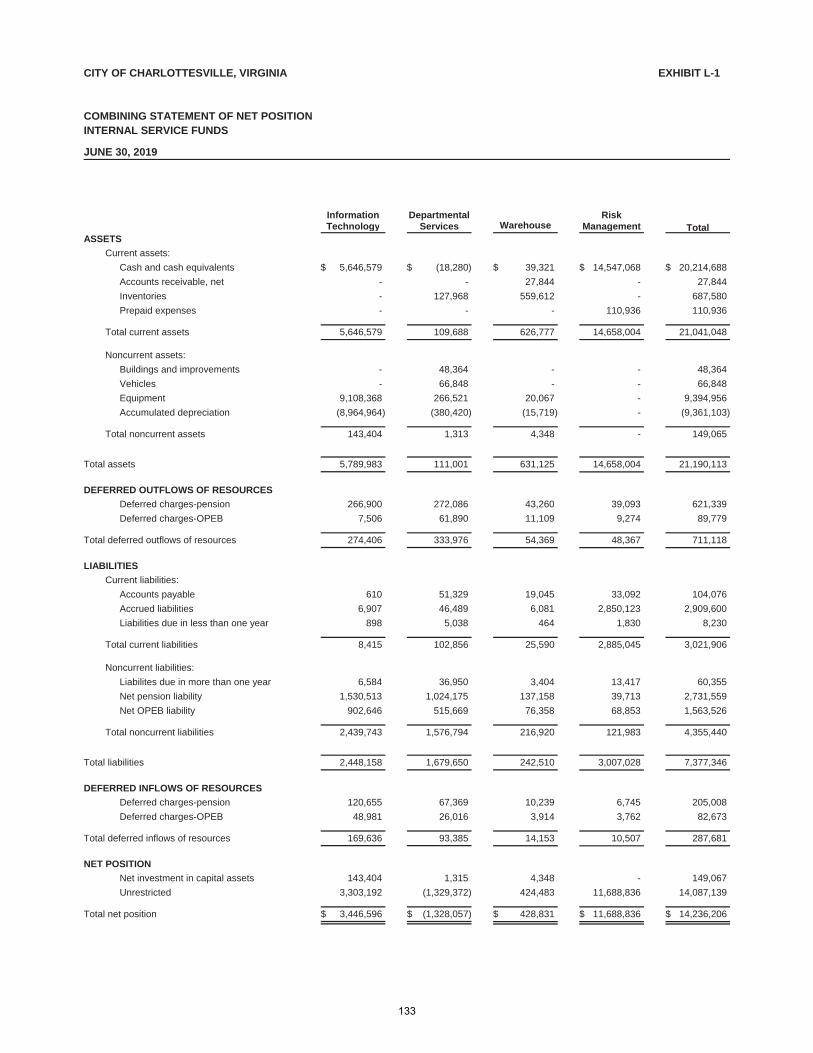
CITY OF CHARLOTTESVILLE, VIRGINIA
COMBINING STATEMENT OF NET POSITIONINTERNAL SERVICE FUNDS
EXHIBIT L-1
JUNE 30, 2019
InformationTechnology
DepartmentalServices Warehouse
RiskManagement Total
ASSETS
Current assets:
Cash and cash equivalents $ 5,646,579 $ )(18,280 $ 39,321 $ 14,547,068 $ 20,214,688
Accounts receivable, net - - 27,844 - 27,844
Inventories - 127,968 559,612 - 687,580
Prepaid expenses - - - 110,936 110,936
Total current assets 5,646,579 109,688 626,777 14,658,004 21,041,048
Noncurrent assets:
Buildings and improvements - 48,364 - - 48,364
Vehicles - 66,848 - - 66,848
Equipment 9,108,368 266,521 20,067 - 9,394,956
Accumulated depreciation )(8,964,964 )(380,420 )(15,719 - )(9,361,103
Total noncurrent assets 143,404 1,313 4,348 - 149,065
5,789,983Total assets 111,001 631,125 14,658,004 21,190,113
DEFERRED OUTFLOWS OF RESOURCES
Deferred charges-pension 266,900 272,086 43,260 39,093 621,339
Deferred charges-OPEB 7,506 61,890 11,109 9,274 89,779
274,406Total deferred outflows of resources 333,976 54,369 48,367 711,118
LIABILITIES
Current liabilities:
Accounts payable 610 51,329 19,045 33,092 104,076
Accrued liabilities 6,907 46,489 6,081 2,850,123 2,909,600
Liabilities due in less than one year 898 5,038 464 1,830 8,230
Total current liabilities 8,415 102,856 25,590 2,885,045 3,021,906
Noncurrent liabilities:
Liabilites due in more than one year 6,584 36,950 3,404 13,417 60,355
Net pension liability 1,530,513 1,024,175 137,158 39,713 2,731,559
Net OPEB liability 902,646 515,669 76,358 68,853 1,563,526
Total noncurrent liabilities 2,439,743 1,576,794 216,920 121,983 4,355,440
2,448,158Total liabilities 1,679,650 242,510 3,007,028 7,377,346
DEFERRED INFLOWS OF RESOURCES
Deferred charges-pension 120,655 67,369 10,239 6,745 205,008
Deferred charges-OPEB 48,981 26,016 3,914 3,762 82,673
169,636Total deferred inflows of resources 93,385 14,153 10,507 287,681
NET POSITION
Net investment in capital assets 143,404 1,315 4,348 - 149,067
Unrestricted 3,303,192 )(1,329,372 424,483 11,688,836 14,087,139
$ 3,446,596Total net position $ )(1,328,057 $ 428,831 $ 11,688,836 $ 14,236,206
133
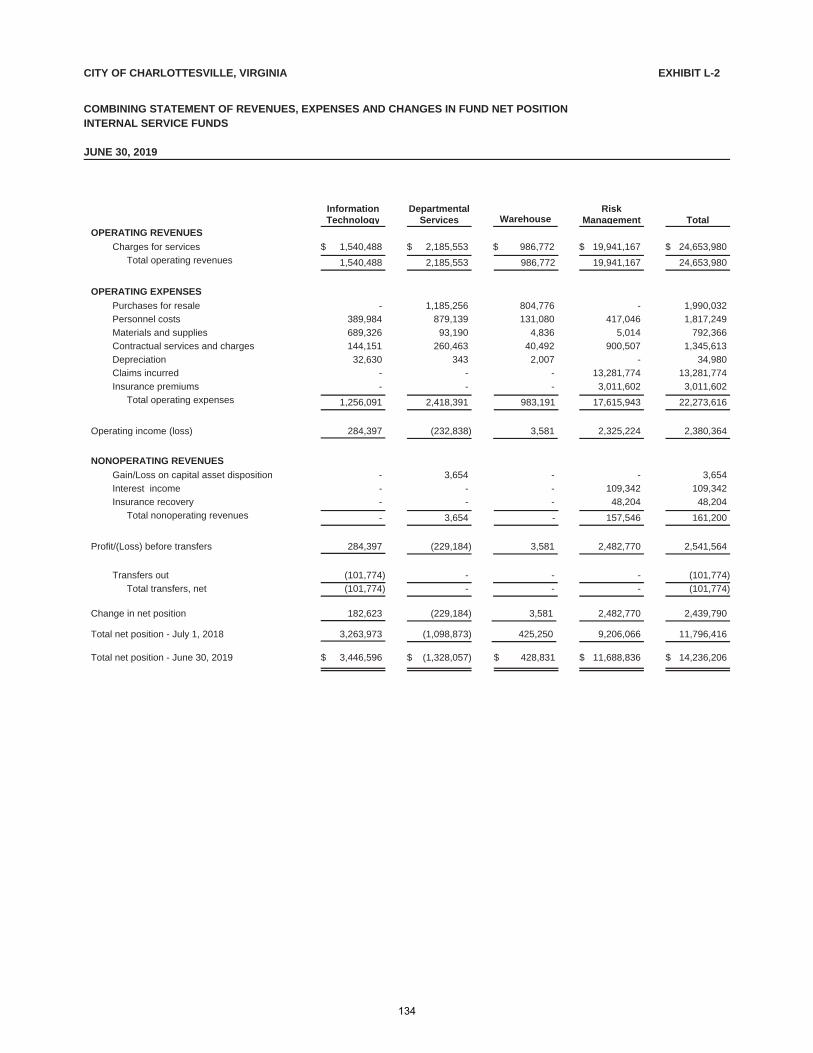
CITY OF CHARLOTTESVILLE, VIRGINIA
JUNE 30, 2019
INTERNAL SERVICE FUNDSCOMBINING STATEMENT OF REVENUES, EXPENSES AND CHANGES IN FUND NET POSITION
EXHIBIT L-2
InformationTechnology
DepartmentalServices Warehouse
RiskManagement Total
OPERATING REVENUES
Charges for services $ 1,540,488 $ 2,185,553 $ 986,772 $ 19,941,167 $ 24,653,980
Total operating revenues 1,540,488 986,772 19,941,167 24,653,9802,185,553
OPERATING EXPENSES
Purchases for resale - 1,185,256 804,776 - 1,990,032
Personnel costs 389,984 879,139 131,080 417,046 1,817,249
Materials and supplies 689,326 93,190 4,836 5,014 792,366
Contractual services and charges 144,151 260,463 40,492 900,507 1,345,613
Depreciation 32,630 343 2,007 - 34,980
Claims incurred - - - 13,281,774 13,281,774
Insurance premiums - - - 3,011,602 3,011,602
Total operating expenses 1,256,091 983,191 17,615,943 22,273,6162,418,391
284,397Operating income (loss) )(232,838 2,325,2243,581 2,380,364
NONOPERATING REVENUES
Gain/Loss on capital asset disposition - 3,654 - - 3,654
Interest income - - - 109,342 109,342
Insurance recovery - - - 48,204 48,204
Total nonoperating revenues - - 157,546 161,2003,654
Profit/(Loss) before transfers 284,397 )(229,184 3,581 2,482,770 2,541,564
Transfers out )(101,774 - - - )(101,774
Total transfers, net )(101,774 - - )(101,774-
Change in net position 182,623 )(229,184 3,581 2,482,770 2,439,790
3,263,973 )(1,098,873 425,250 9,206,066 11,796,416Total net position - July 1, 2018
$ 3,446,596 $ )(1,328,057 $ 428,831 $ 11,688,836 $ 14,236,206Total net position - June 30, 2019
134
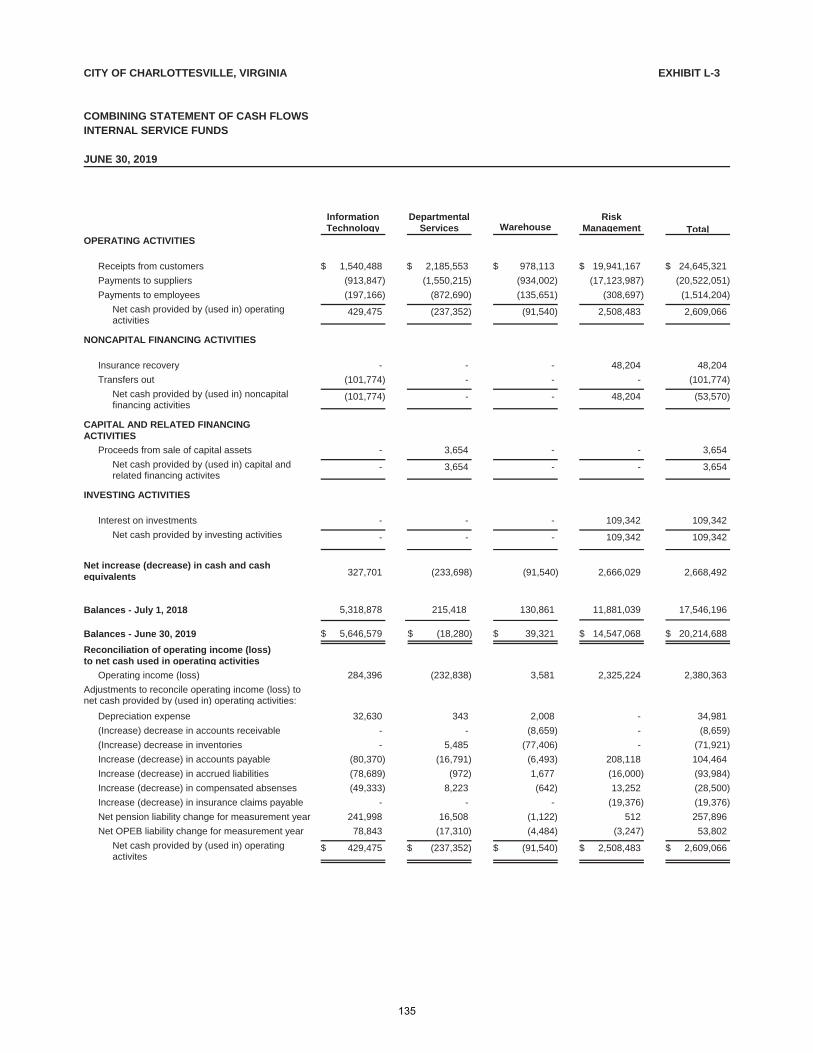
COMBINING STATEMENT OF CASH FLOWSINTERNAL SERVICE FUNDS
JUNE 30, 2019
EXHIBIT L-3CITY OF CHARLOTTESVILLE, VIRGINIA
InformationTechnology
DepartmentalServices Warehouse
RiskManagement Total
OPERATING ACTIVITIES
$ 1,540,488Receipts from customers $ 2,185,553 $ 978,113 $ 19,941,167 $ 24,645,321
)(913,847Payments to suppliers )(1,550,215 )(934,002 )(17,123,987 )(20,522,051
)(197,166Payments to employees )(872,690 )(135,651 )(308,697 )(1,514,204
Net cash provided by (used in) operating activities
429,475 )(237,352 )(91,540 2,508,483 2,609,066
NONCAPITAL FINANCING ACTIVITIES
-Insurance recovery - - 48,204 48,204
)(101,774Transfers out - - - )(101,774
Net cash provided by (used in) noncapital financing activities
)(101,774 - - 48,204 )(53,570
CAPITAL AND RELATED FINANCING ACTIVITIES
-Proceeds from sale of capital assets 3,654 - - 3,654
Net cash provided by (used in) capital and related financing activites
- 3,654 - - 3,654
INVESTING ACTIVITIES
-Interest on investments - - 109,342 109,342
Net cash provided by investing activities - - - 109,342 109,342
Net increase (decrease) in cash and cash equivalents 327,701 )(233,698 )(91,540 2,666,029 2,668,492
Balances - July 1, 2018 5,318,878 215,418 130,861 11,881,039 17,546,196
Balances - June 30, 2019 $ 5,646,579 $ )(18,280 $ 39,321 $ 14,547,068 $ 20,214,688
Reconciliation of operating income (loss) to net cash used in operating activities
284,396Operating income (loss) )(232,838 3,581 2,325,224 2,380,363
Adjustments to reconcile operating income (loss) to net cash provided by (used in) operating activities:
32,630Depreciation expense 343 2,008 - 34,981
-(Increase) decrease in accounts receivable - )(8,659 - )(8,659
-(Increase) decrease in inventories 5,485 )(77,406 - )(71,921
)(80,370Increase (decrease) in accounts payable )(16,791 )(6,493 208,118 104,464
)(78,689Increase (decrease) in accrued liabilities )(972 1,677 )(16,000 )(93,984
)(49,333Increase (decrease) in compensated absenses 8,223 )(642 13,252 )(28,500
-Increase (decrease) in insurance claims payable - - )(19,376 )(19,376
241,998Net pension liability change for measurement year 16,508 )(1,122 512 257,896
78,843Net OPEB liability change for measurement year )(17,310 )(4,484 )(3,247 53,802
Net cash provided by (used in) operating activites
$ 429,475 $ )(237,352 $ )(91,540 $ 2,508,483 $ 2,609,066
135

CHARLOTTESVILLE SCHOOL BOARD COMPONENT UNIT
Financial Statements
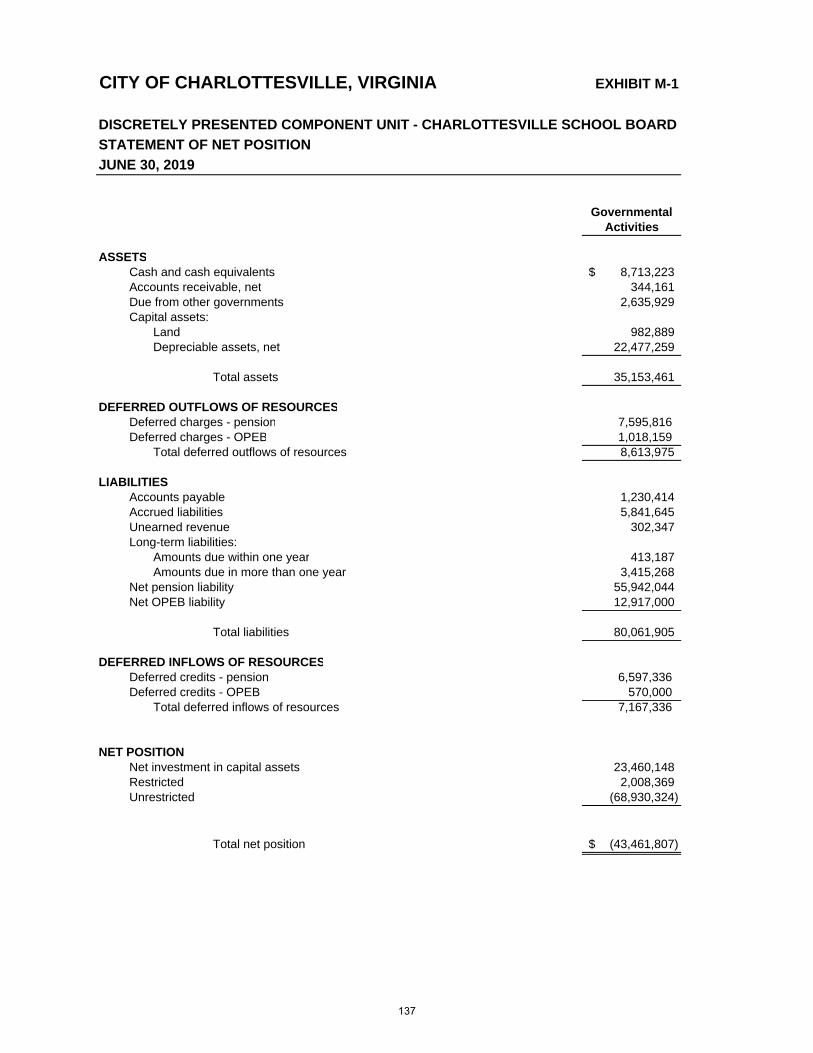
CITY OF CHARLOTTESVILLE, VIRGINIA EXHIBIT M-1
DISCRETELY PRESENTED COMPONENT UNIT - CHARLOTTESVILLE SCHOOL BOARD
STATEMENT OF NET POSITION
GovernmentalActivities
ASSETSCash and cash equivalents 8,713,223$ Accounts receivable, net 344,161 Due from other governments 2,635,929 Capital assets:
Land 982,889 Depreciable assets, net 22,477,259
Total assets 35,153,461
DEFERRED OUTFLOWS OF RESOURCESDeferred charges - pension 7,595,816 Deferred charges - OPEB 1,018,159
Total deferred outflows of resources 8,613,975
LIABILITIESAccounts payable 1,230,414 Accrued liabilities 5,841,645
302,347 Long-term liabilities:
Amounts due within one year 413,187 Amounts due in more than one year 3,415,268
Net pension liability 55,942,044 Net OPEB liability 12,917,000
Total liabilities 80,061,905
DEFERRED INFLOWS OF RESOURCESDeferred credits - pension 6,597,336 Deferred credits - OPEB 570,000
Total deferred inflows of resources 7,167,336
NET POSITIONNet investment in capital assets 23,460,148 Restricted 2,008,369 Unrestricted (68,930,324)
Total net position (43,461,807)$
JUNE 30, 2019
Unearned revenue
137
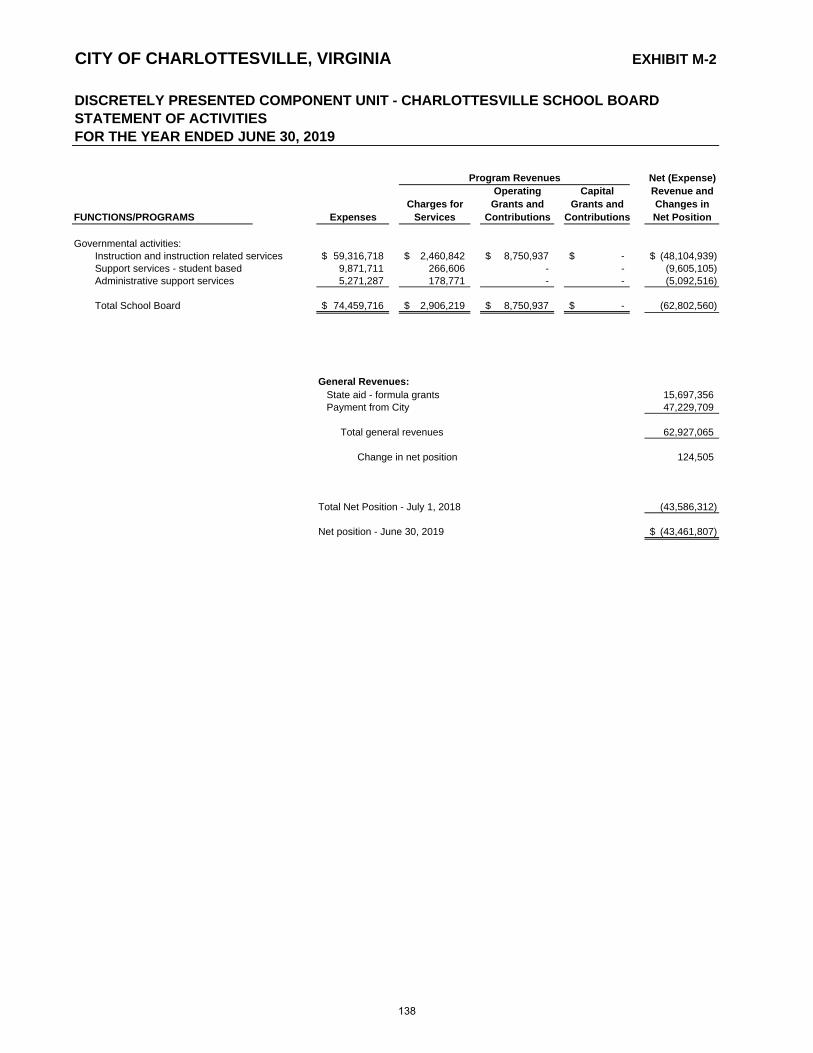
EXHIBIT M-2
DISCRETELY PRESENTED COMPONENT UNIT - CHARLOTTESVILLE SCHOOL BOARDSTATEMENT OF ACTIVITIES FOR THE YEAR ENDED JUNE 30, 2019
Operating Capital Revenue andCharges for Grants and Grants and Changes in
FUNCTIONS/PROGRAMS Expenses Services Contributions Contributions Net Position
Governmental activities:Instruction and instruction related services 59,316,718$ 2,460,842$ 8,750,937$ -$ (48,104,939)$ Support services - student based 9,871,711 266,606 - - (9,605,105) Administrative support services 5,271,287 178,771 - - (5,092,516)
Total School Board 74,459,716$ 2,906,219$ 8,750,937$ -$ (62,802,560)
General Revenues: State aid - formula grants 15,697,356 Payment from City 47,229,709
Total general revenues 62,927,065
Change in net position 124,505
Total Net Position - July 1, 2018 (43,586,312)
Net position - June 30, 2019 (43,461,807)$
Program Revenues
CITY OF CHARLOTTESVILLE, VIRGINIA
Net (Expense)
138
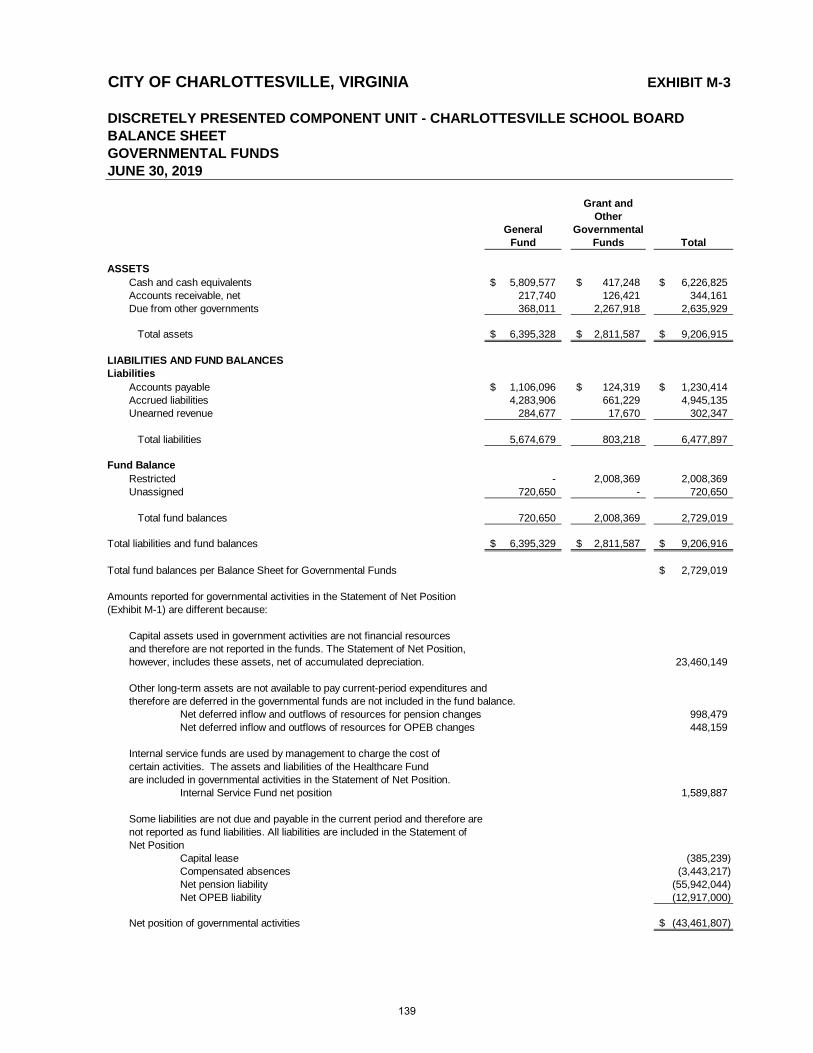
CITY OF CHARLOTTESVILLE, VIRGINIA EXHIBIT M-3
DISCRETELY PRESENTED COMPONENT UNIT - CHARLOTTESVILLE SCHOOL BOARDBALANCE SHEETGOVERNMENTAL FUNDS
Grant andOther
General GovernmentalFund Funds Total
ASSETSCash and cash equivalents 5,809,577$ 417,248$ 6,226,825$ Accounts receivable, net 217,740 126,421 344,161 Due from other governments 368,011 2,267,918 2,635,929
Total assets 6,395,328$ 2,811,587$ 9,206,915$
LiabilitiesAccounts payable 1,106,096$ 124,319$ 1,230,414$ Accrued liabilities 4,283,906 661,229 4,945,135 Unearned revenue 284,677 17,670 302,347
Total liabilities 5,674,679 803,218 6,477,897
Restricted - 2,008,369 2,008,369 Unassigned 720,650 - 720,650
Total fund balances 720,650 2,008,369 2,729,019
6,395,329$ 2,811,587$ 9,206,916$
Total fund balances per Balance Sheet for Governmental Funds 2,729,019$
Amounts reported for governmental activities in the Statement of Net Position(Exhibit M-1) are different because:
Capital assets used in government activities are not financial resourcesand therefore are not reported in the funds. The Statement of Net Position,however, includes these assets, net of accumulated depreciation. 23,460,149
Other long-term assets are not available to pay current-period expenditures andtherefore are deferred in the governmental funds are not included in the fund balance.
Net deferred inflow and outflows of resources for pension changes 998,479 Net deferred inflow and outflows of resources for OPEB changes 448,159
Internal service funds are used by management to charge the cost ofcertain activities. The assets and liabilities of the Healthcare Fundare included in governmental activities in the Statement of Net Position.
Internal Service Fund net position 1,589,887
Some liabilities are not due and payable in the current period and therefore are not reported as fund liabilities. All liabilities are included in the Statement ofNet Position
Capital lease (385,239) Compensated absences (3,443,217) Net pension liability (55,942,044) Net OPEB liability (12,917,000)
(43,461,807)$
JUNE 30, 2019
LIABILITIES AND FUND BALANCES
Total liabilities and fund balances
Net position of governmental activities
Fund Balance
139
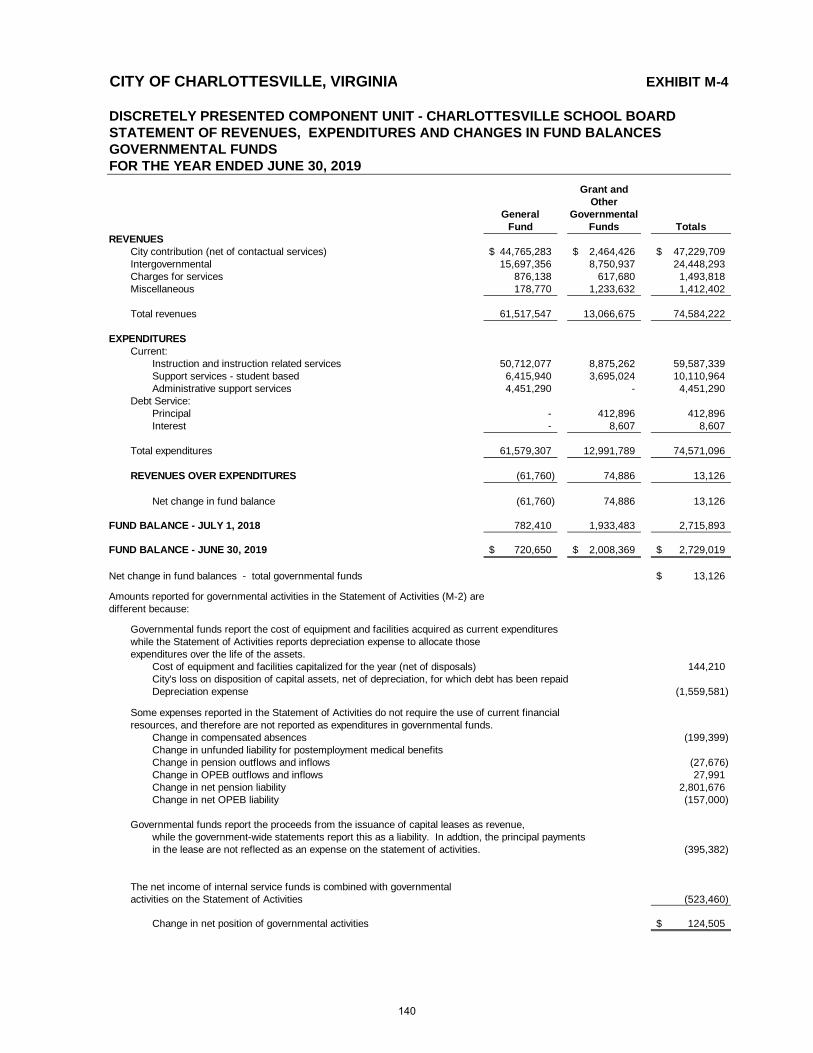
CITY OF CHARLOTTESVILLE, VIRGINIA EXHIBIT M-4
DISCRETELY PRESENTED COMPONENT UNIT - CHARLOTTESVILLE SCHOOL BOARDSTATEMENT OF REVENUES, EXPENDITURES AND CHANGES IN FUND BALANCESGOVERNMENTAL FUNDSFOR THE YEAR ENDED JUNE 30, 2019
Grant andOther
General GovernmentalFund Funds Totals
REVENUES44,765,283$ 2,464,426$ 47,229,709$
Intergovernmental 15,697,356 8,750,937 24,448,293 876,138 617,680 1,493,818 178,770 1,233,632 1,412,402
Total revenues 61,517,547 13,066,675 74,584,222
EXPENDITURESCurrent:
50,712,077 8,875,262 59,587,339 6,415,940 3,695,024 10,110,964 4,451,290 - 4,451,290
Debt Service:Principal - 412,896 412,896 Interest - 8,607 8,607
61,579,307 12,991,789 74,571,096
REVENUES OVER EXPENDITURES (61,760) 74,886 13,126
Net change in fund balance (61,760) 74,886 13,126
FUND BALANCE - JULY 1, 2018 782,410 1,933,483 2,715,893
720,650$ 2,008,369$ 2,729,019$
Net change in fund balances - total governmental funds 13,126$
Amounts reported for governmental activities in the Statement of Activities (M-2) aredifferent because:
Governmental funds report the cost of equipment and facilities acquired as current expenditureswhile the Statement of Activities reports depreciation expense to allocate those expenditures over the life of the assets.
Cost of equipment and facilities capitalized for the year (net of disposals) 144,210 City's loss on disposition of capital assets, net of depreciation, for which debt has been repaidDepreciation expense (1,559,581)
Some expenses reported in the Statement of Activities do not require the use of current financial resources, and therefore are not reported as expenditures in governmental funds.
Change in compensated absences (199,399) Change in unfunded liability for postemployment medical benefitsChange in pension outflows and inflows (27,676) Change in OPEB outflows and inflows 27,991 Change in net pension liability 2,801,676 Change in net OPEB liability (157,000)
Governmental funds report the proceeds from the issuance of capital leases as revenue,while the government-wide statements report this as a liability. In addtion, the principal paymentsin the lease are not reflected as an expense on the statement of activities. (395,382)
The net income of internal service funds is combined with governmentalactivities on the Statement of Activities (523,460)
124,505$ Change in net position of governmental activities
FUND BALANCE - JUNE 30, 2019
Administrative support services
Total expenditures
City contribution (net of contactual services)
Charges for servicesMiscellaneous
Instruction and instruction related servicesSupport services - student based
140
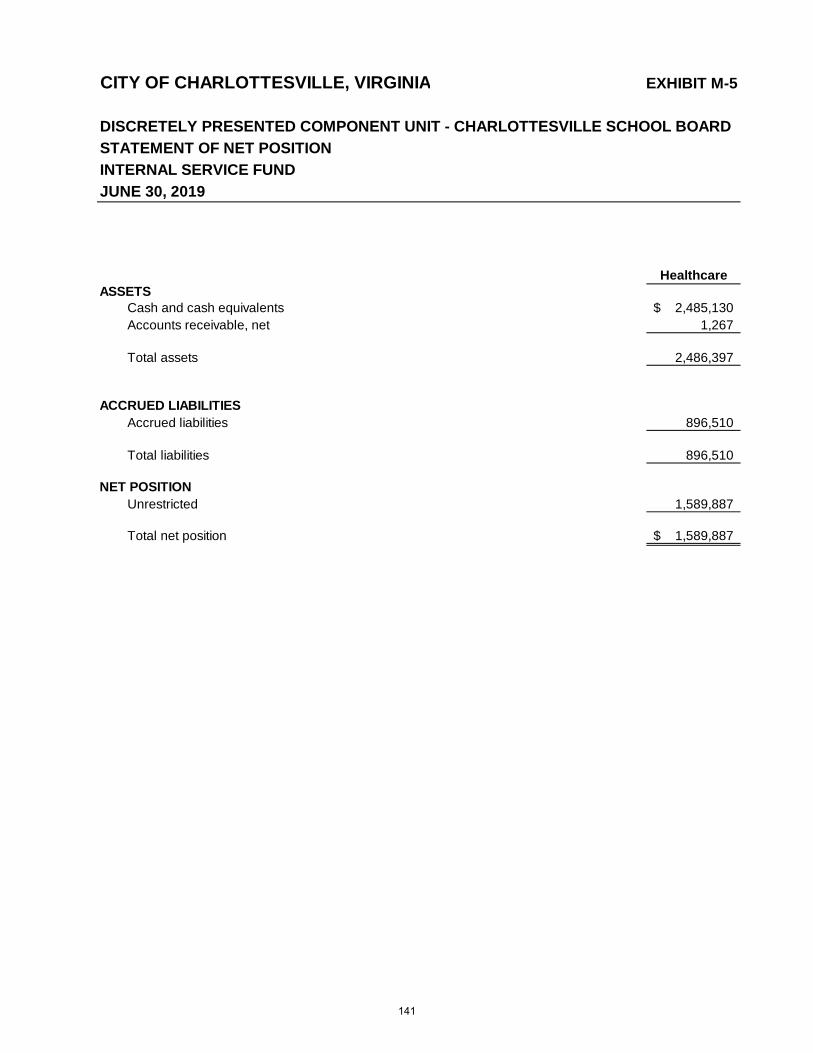
CITY OF CHARLOTTESVILLE, VIRGINIA EXHIBIT M-5
DISCRETELY PRESENTED COMPONENT UNIT - CHARLOTTESVILLE SCHOOL BOARD
STATEMENT OF NET POSITION
JUNE 30, 2019
HealthcareASSETS
Cash and cash equivalents 2,485,130$ Accounts receivable, net 1,267
Total assets 2,486,397
ACCRUED LIABILITIESAccrued liabilities 896,510
Total liabilities 896,510
NET POSITIONUnrestricted 1,589,887
Total net position 1,589,887$
INTERNAL SERVICE FUND
141
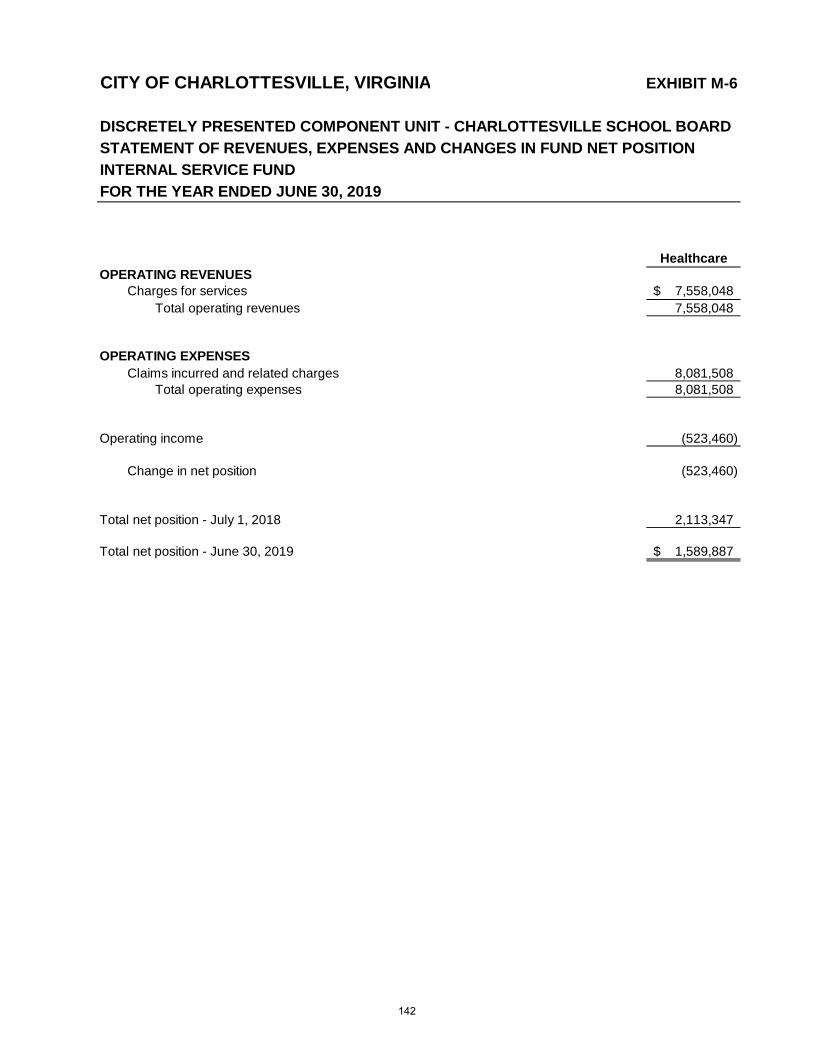
CITY OF CHARLOTTESVILLE, VIRGINIA EXHIBIT M-6
DISCRETELY PRESENTED COMPONENT UNIT - CHARLOTTESVILLE SCHOOL BOARD
STATEMENT OF REVENUES, EXPENSES AND CHANGES IN FUND NET POSITION
FOR THE YEAR ENDED JUNE 30, 2019
Healthcare
Charges for services 7,558,048$ Total operating revenues 7,558,048
Claims incurred and related charges 8,081,508 Total operating expenses 8,081,508
Operating income (523,460)
Change in net position (523,460)
Total net position - July 1, 2018 2,113,347
Total net position - June 30, 2019 1,589,887$
INTERNAL SERVICE FUND
OPERATING EXPENSES
OPERATING REVENUES
142
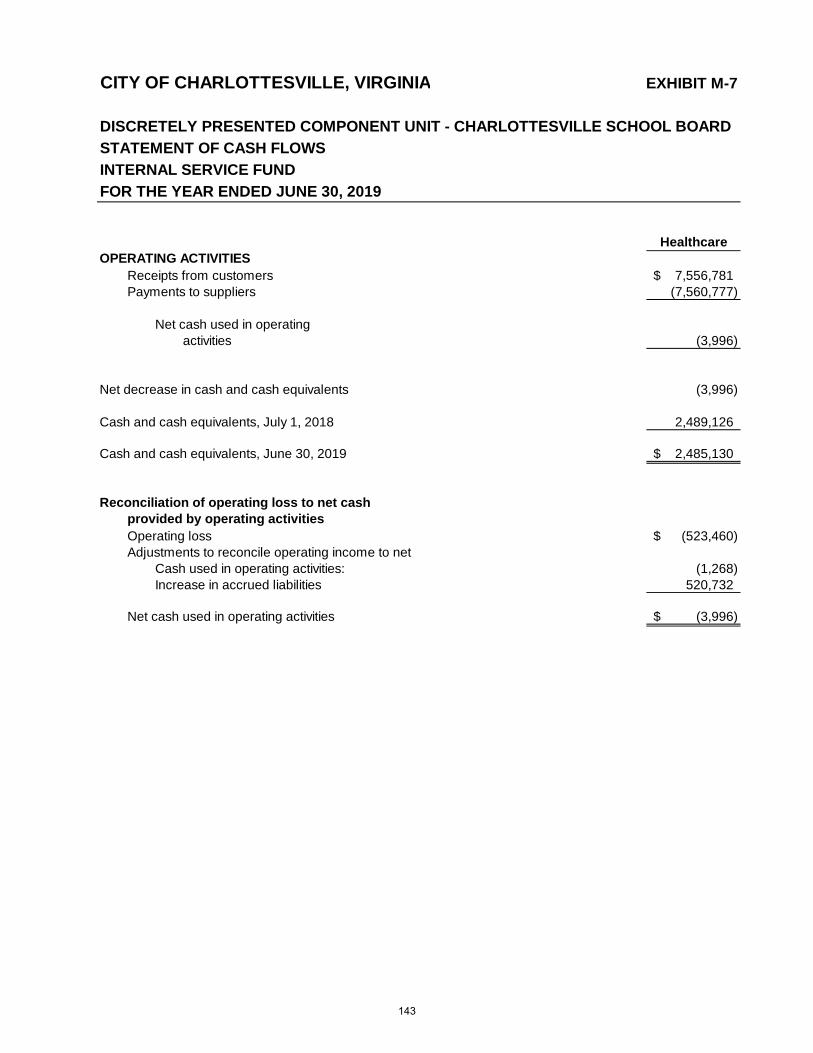
CITY OF CHARLOTTESVILLE, VIRGINIA EXHIBIT M-7
DISCRETELY PRESENTED COMPONENT UNIT - CHARLOTTESVILLE SCHOOL BOARD
STATEMENT OF CASH FLOWS
FOR THE YEAR ENDED JUNE 30, 2019
Healthcare
Receipts from customers 7,556,781$ Payments to suppliers (7,560,777)
Net cash used in operatingactivities (3,996)
Net decrease in cash and cash equivalents (3,996)
Cash and cash equivalents, July 1, 2018 2,489,126
Cash and cash equivalents, June 30, 2019 2,485,130$
Reconciliation of operating loss to net cashprovided by operating activitiesOperating loss (523,460)$ Adjustments to reconcile operating income to net
Cash used in operating activities: (1,268)Increase in accrued liabilities 520,732
(3,996)$
OPERATING ACTIVITIES
Net cash used in operating activities
INTERNAL SERVICE FUND
143
STATISTICAL SECTION
STATISTICAL SECTION
This section of the City of Charlottesville’s comprehensive annual financial report presents detailed information as a context for understanding what the information in the financial statements, note disclosures, and required supplementary information says about the City of Charlottesville’s overall financial health.
Contents
Financial Trends Tables 1 - 4 These schedules show comparative information about how the City’s financial
performance has changed over time.
Revenue Capacity Tables 5 - 10 These schedules show the City’s significant local revenue sources and how they
have changed over time.
Debt Capacity Tables 11 - 14 These schedules demonstrate the affordability of the City’s outstanding debt along
with the City’s ability to issue additional debt in the future.
Economic and Demographic Information Tables 15 - 17 These schedules show the some of the economic and demographic trends that
affect the financial health of the City.
Operating Information Tables 18 - 20 These schedules contain service and infrastructure data to show some of the
services the City provides and the activities it performs.
Sources: Unless otherwise noted, the information in this section is derived from the City’s Comprehensive Annual Financial Reports for the relevant year.
145
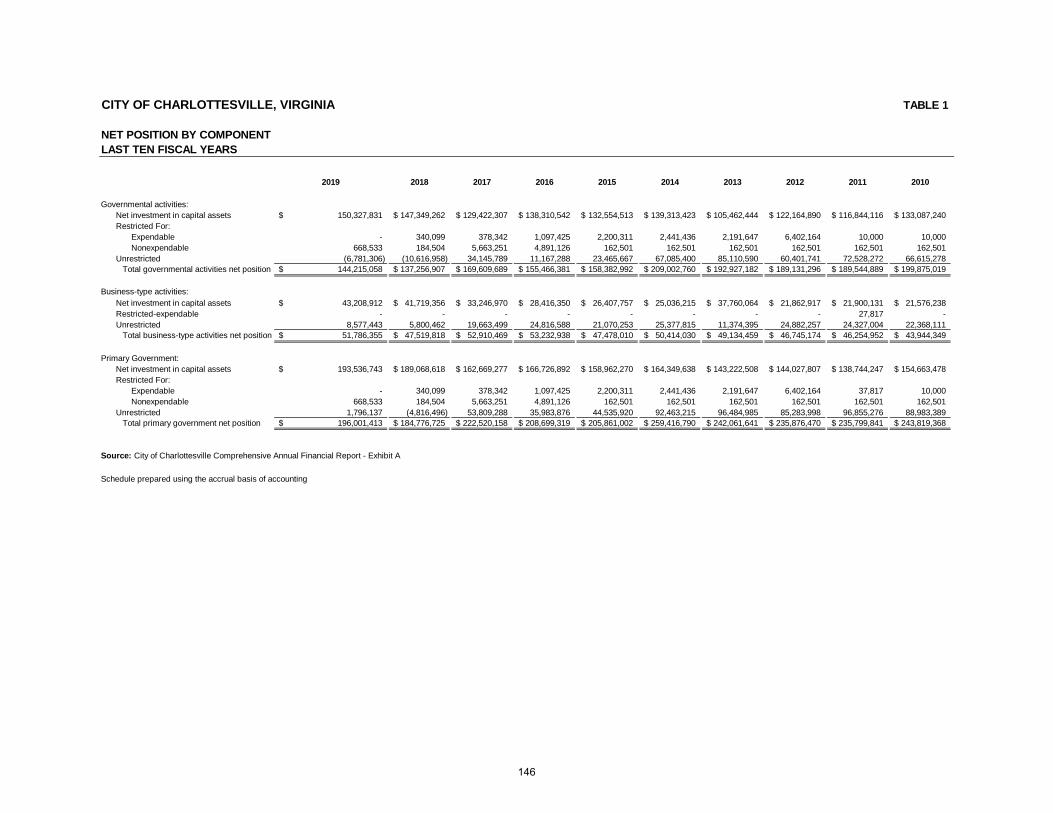
CITY OF CHARLOTTESVILLE, VIRGINIA TABLE 1
NET POSITION BY COMPONENTLAST TEN FISCAL YEARS
2019 2018 2017 2016 2015 2014 2013 2012 2011 2010
Governmental activities:Net investment in capital assets 150,327,831$ 147,349,262$ 129,422,307$ 138,310,542$ 132,554,513$ 139,313,423$ 105,462,444$ 122,164,890$ 116,844,116$ 133,087,240$ Restricted For:
Expendable - 340,099 378,342 1,097,425 2,200,311 2,441,436 2,191,647 6,402,164 10,000 10,000 Nonexpendable 668,533 184,504 5,663,251 4,891,126 162,501 162,501 162,501 162,501 162,501 162,501
Unrestricted (6,781,306) (10,616,958) 34,145,789 11,167,288 23,465,667 67,085,400 85,110,590 60,401,741 72,528,272 66,615,278 Total governmental activities net position 144,215,058$ 137,256,907$ 169,609,689$ 155,466,381$ 158,382,992$ 209,002,760$ 192,927,182$ 189,131,296$ 189,544,889$ 199,875,019$
Net investment in capital assets 43,208,912$ 41,719,356$ 33,246,970$ 28,416,350$ 26,407,757$ 25,036,215$ 37,760,064$ 21,862,917$ 21,900,131$ 21,576,238$ Restricted-expendable - - - - - - - - 27,817 -Unrestricted 8,577,443 5,800,462 19,663,499 24,816,588 21,070,253 25,377,815 11,374,395 24,882,257 24,327,004 22,368,111 Total business-type activities net position 51,786,355$ 47,519,818$ 52,910,469$ 53,232,938$ 47,478,010$ 50,414,030$ 49,134,459$ 46,745,174$ 46,254,952$ 43,944,349$
Primary Government:Net investment in capital assets 193,536,743$ 189,068,618$ 162,669,277$ 166,726,892$ 158,962,270$ 164,349,638$ 143,222,508$ 144,027,807$ 138,744,247$ 154,663,478$ Restricted For:
Expendable - 340,099 378,342 1,097,425 2,200,311 2,441,436 2,191,647 6,402,164 37,817 10,000 Nonexpendable 668,533 184,504 5,663,251 4,891,126 162,501 162,501 162,501 162,501 162,501 162,501
Unrestricted 1,796,137 (4,816,496) 53,809,288 35,983,876 44,535,920 92,463,215 96,484,985 85,283,998 96,855,276 88,983,389 Total primary government net position 196,001,413$ 184,776,725$ 222,520,158$ 208,699,319$ 205,861,002$ 259,416,790$ 242,061,641$ 235,876,470$ 235,799,841$ 243,819,368$
Schedule prepared using the accrual basis of accounting
Business-type activities:
Source: City of Charlottesville Comprehensive Annual Financial Report - Exhibit A
146
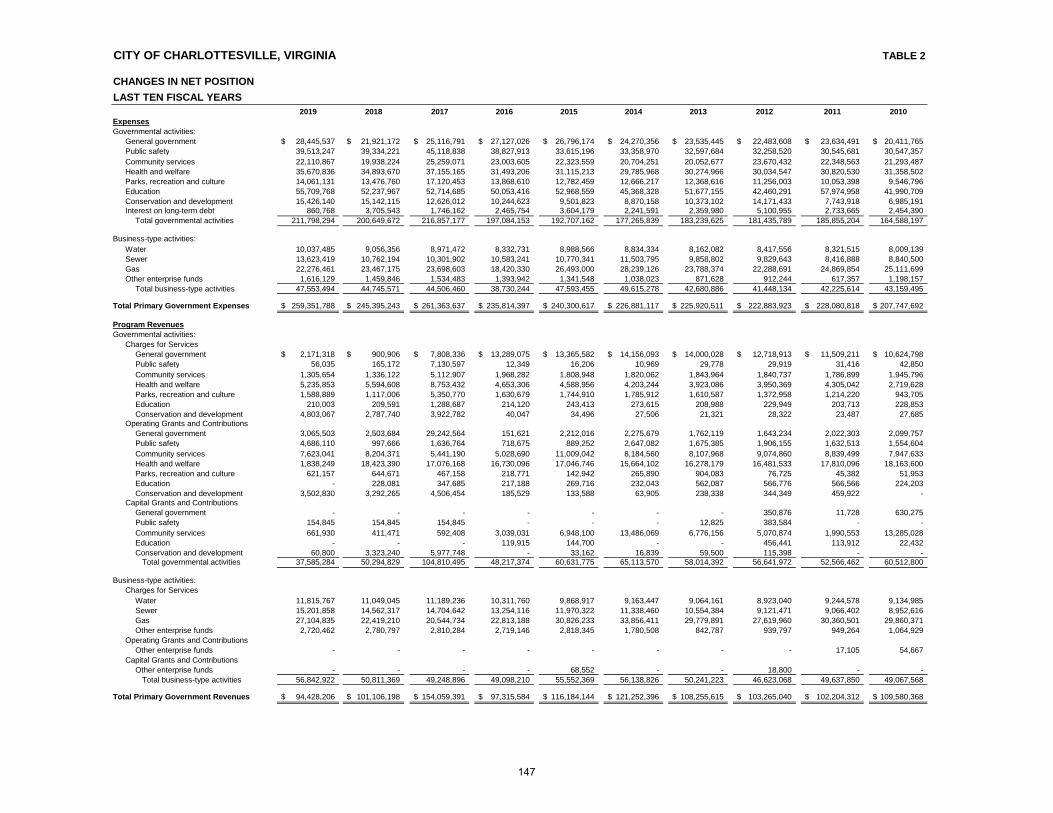
CITY OF CHARLOTTESVILLE, VIRGINIA TABLE 2
CHANGES IN NET POSITION
LAST TEN FISCAL YEARS2019 2018 2017 2016 2015 2014 2013 2012 2011 2010
Expenses
General government 28,445,537$ 21,921,172$ 25,116,791$ 27,127,026$ 26,796,174$ 24,270,356$ 23,535,445$ 22,483,608$ 23,634,491$ 20,411,765$ Public safety 39,513,247 39,334,221 45,118,838 38,827,913 33,615,196 33,358,970 32,597,684 32,258,520 30,545,681 30,547,357 Community services 22,110,867 19,938,224 25,259,071 23,003,605 22,323,559 20,704,251 20,052,677 23,670,432 22,348,563 21,293,487 Health and welfare 35,670,836 34,893,670 37,155,165 31,493,206 31,115,213 29,785,968 30,274,966 30,034,547 30,820,530 31,358,502 Parks, recreation and culture 14,061,131 13,476,760 17,120,453 13,868,610 12,782,459 12,666,217 12,368,616 11,256,003 10,053,398 9,546,796 Education 55,709,768 52,237,967 52,714,685 50,053,416 52,968,559 45,368,328 51,677,155 42,460,291 57,974,958 41,990,709 Conservation and development 15,426,140 15,142,115 12,626,012 10,244,623 9,501,823 8,870,158 10,373,102 14,171,433 7,743,918 6,985,191 Interest on long-term debt 860,768 3,705,543 1,746,162 2,465,754 3,604,179 2,241,591 2,359,980 5,100,955 2,733,665 2,454,390
Total governmental activities 211,798,294 200,649,672 216,857,177 197,084,153 192,707,162 177,265,839 183,239,625 181,435,789 185,855,204 164,588,197
Water 10,037,485 9,056,356 8,971,472 8,332,731 8,988,566 8,834,334 8,162,082 8,417,556 8,321,515 8,009,139 Sewer 13,623,419 10,762,194 10,301,902 10,583,241 10,770,341 11,503,795 9,858,802 9,829,643 8,416,888 8,840,500 Gas 22,276,461 23,467,175 23,698,603 18,420,330 26,493,000 28,239,126 23,788,374 22,288,691 24,869,854 25,111,699 Other enterprise funds 1,616,129 1,459,846 1,534,483 1,393,942 1,341,548 1,038,023 871,628 912,244 617,357 1,198,157
Total business-type activities 47,553,494 44,745,571 44,506,460 38,730,244 47,593,455 49,615,278 42,680,886 41,448,134 42,225,614 43,159,495
Total Primary Government Expenses 259,351,788$ 245,395,243$ 261,363,637$ 235,814,397$ 240,300,617$ 226,881,117$ 225,920,511$ 222,883,923$ 228,080,818$ 207,747,692$
Program Revenues
Charges for ServicesGeneral government 2,171,318$ 900,906$ 7,808,336$ 13,289,075$ 13,365,582$ 14,156,093$ 14,000,028$ 12,718,913$ 11,509,211$ 10,624,798$ Public safety 56,035 165,172 7,130,597 12,349 16,206 10,969 29,778 29,919 31,416 42,850 Community services 1,305,654 1,336,122 5,112,907 1,968,282 1,808,948 1,820,062 1,843,964 1,840,737 1,786,899 1,945,796 Health and welfare 5,235,853 5,594,608 8,753,432 4,653,306 4,588,956 4,203,244 3,923,086 3,950,369 4,305,042 2,719,628 Parks, recreation and culture 1,588,889 1,117,006 5,350,770 1,630,679 1,744,910 1,785,912 1,610,587 1,372,958 1,214,220 943,705 Education 210,003 209,591 1,288,687 214,120 243,413 273,615 208,988 229,949 203,713 228,853 Conservation and development 4,803,067 2,787,740 3,922,782 40,047 34,496 27,506 21,321 28,322 23,487 27,685
Operating Grants and ContributionsGeneral government 3,065,503 2,503,684 29,242,564 151,621 2,212,016 2,275,679 1,762,119 1,643,234 2,022,303 2,099,757 Public safety 4,686,110 997,666 1,636,764 718,675 889,252 2,647,082 1,675,385 1,906,155 1,632,513 1,554,604 Community services 7,623,041 8,204,371 5,441,190 5,028,690 11,009,042 8,184,560 8,107,968 9,074,860 8,839,499 7,947,633 Health and welfare 1,838,249 18,423,390 17,076,168 16,730,096 17,046,746 15,664,102 16,278,179 16,481,533 17,810,096 18,163,600 Parks, recreation and culture 621,157 644,671 467,158 218,771 142,942 265,890 904,083 76,725 45,382 51,953 Education - 228,081 347,685 217,188 269,716 232,043 562,087 566,776 566,566 224,203 Conservation and development 3,502,830 3,292,265 4,506,454 185,529 133,588 63,905 238,338 344,349 459,922 -
Capital Grants and ContributionsGeneral government - - - - - - - 350,876 11,728 630,275 Public safety 154,845 154,845 154,845 - - - 12,825 383,584 - - Community services 661,930 411,471 592,408 3,039,031 6,948,100 13,486,069 6,776,156 5,070,874 1,990,553 13,285,028 Education - - - 119,915 144,700 - - 456,441 113,912 22,432 Conservation and development 60,800 3,323,240 5,977,748 - 33,162 16,839 59,500 115,398 - - Total governmental activities 37,585,284 50,294,829 104,810,495 48,217,374 60,631,775 65,113,570 58,014,392 56,641,972 52,566,462 60,512,800
Charges for ServicesWater 11,815,767 11,049,045 11,189,236 10,311,760 9,868,917 9,163,447 9,064,161 8,923,040 9,244,578 9,134,985 Sewer 15,201,858 14,562,317 14,704,642 13,254,116 11,970,322 11,338,460 10,554,384 9,121,471 9,066,402 8,952,616 Gas 27,104,835 22,419,210 20,544,734 22,813,188 30,826,233 33,856,411 29,779,891 27,619,960 30,360,501 29,860,371 Other enterprise funds 2,720,462 2,780,797 2,810,284 2,719,146 2,818,345 1,780,508 842,787 939,797 949,264 1,064,929
Operating Grants and ContributionsOther enterprise funds - - - - - - - - 17,105 54,667
Capital Grants and ContributionsOther enterprise funds - - - - 68,552 - - 18,800 - - Total business-type activities 56,842,922 50,811,369 49,248,896 49,098,210 55,552,369 56,138,826 50,241,223 46,623,068 49,637,850 49,067,568
Total Primary Government Revenues 94,428,206$ 101,106,198$ 154,059,391$ 97,315,584$ 116,184,144$ 121,252,396$ 108,255,615$ 103,265,040$ 102,204,312$ 109,580,368$
Governmental activities:
Business-type activities:
Governmental activities:
Business-type activities:
147
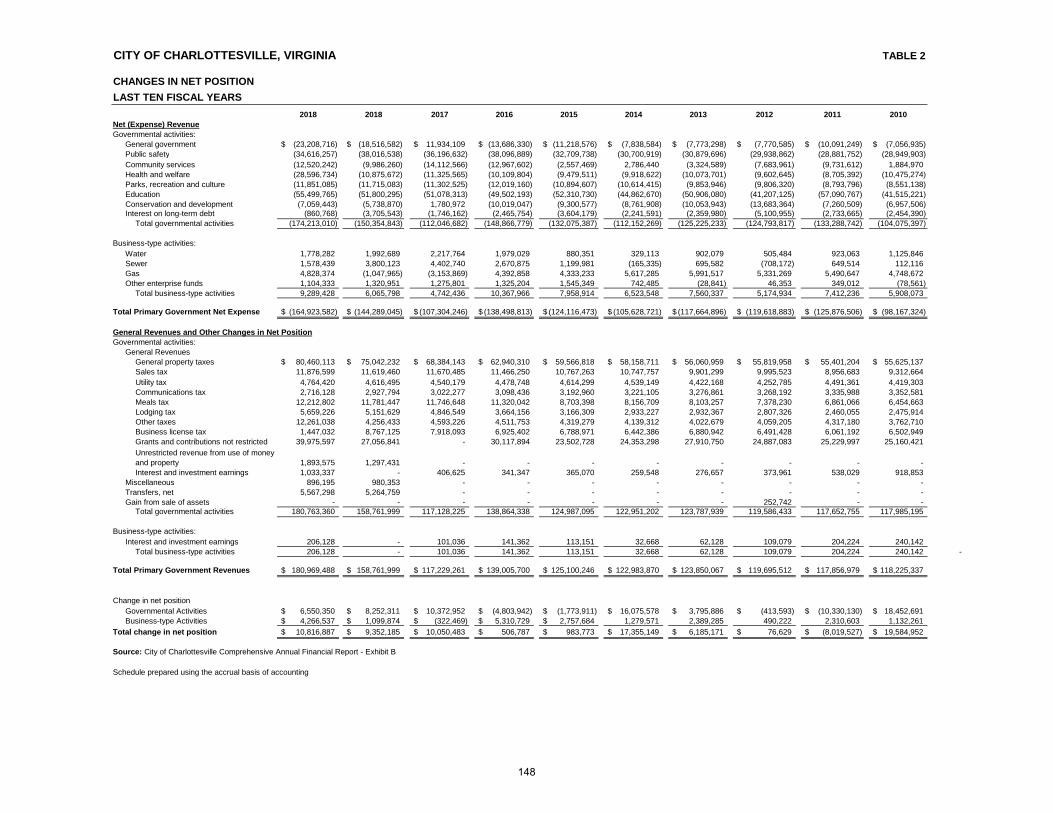
CITY OF CHARLOTTESVILLE, VIRGINIA TABLE 2
CHANGES IN NET POSITION
LAST TEN FISCAL YEARS
2018 2018 2017 2016 2015 2014 2013 2012 2011 2010Net (Expense) Revenue
General government (23,208,716)$ (18,516,582)$ 11,934,109$ (13,686,330)$ (11,218,576)$ (7,838,584)$ (7,773,298)$ (7,770,585)$ (10,091,249)$ (7,056,935)$ Public safety (34,616,257) (38,016,538) (36,196,632) (38,096,889) (32,709,738) (30,700,919) (30,879,696) (29,938,862) (28,881,752) (28,949,903) Community services (12,520,242) (9,986,260) (14,112,566) (12,967,602) (2,557,469) 2,786,440 (3,324,589) (7,683,961) (9,731,612) 1,884,970 Health and welfare (28,596,734) (10,875,672) (11,325,565) (10,109,804) (9,479,511) (9,918,622) (10,073,701) (9,602,645) (8,705,392) (10,475,274) Parks, recreation and culture (11,851,085) (11,715,083) (11,302,525) (12,019,160) (10,894,607) (10,614,415) (9,853,946) (9,806,320) (8,793,796) (8,551,138) Education (55,499,765) (51,800,295) (51,078,313) (49,502,193) (52,310,730) (44,862,670) (50,906,080) (41,207,125) (57,090,767) (41,515,221) Conservation and development (7,059,443) (5,738,870) 1,780,972 (10,019,047) (9,300,577) (8,761,908) (10,053,943) (13,683,364) (7,260,509) (6,957,506) Interest on long-term debt (860,768) (3,705,543) (1,746,162) (2,465,754) (3,604,179) (2,241,591) (2,359,980) (5,100,955) (2,733,665) (2,454,390)
Total governmental activities (174,213,010) (150,354,843) (112,046,682) (148,866,779) (132,075,387) (112,152,269) (125,225,233) (124,793,817) (133,288,742) (104,075,397)
Water 1,778,282 1,992,689 2,217,764 1,979,029 880,351 329,113 902,079 505,484 923,063 1,125,846 Sewer 1,578,439 3,800,123 4,402,740 2,670,875 1,199,981 (165,335) 695,582 (708,172) 649,514 112,116 Gas 4,828,374 (1,047,965) (3,153,869) 4,392,858 4,333,233 5,617,285 5,991,517 5,331,269 5,490,647 4,748,672 Other enterprise funds 1,104,333 1,320,951 1,275,801 1,325,204 1,545,349 742,485 (28,841) 46,353 349,012 (78,561)
Total business-type activities 9,289,428 6,065,798 4,742,436 10,367,966 7,958,914 6,523,548 7,560,337 5,174,934 7,412,236 5,908,073
Total Primary Government Net Expense (164,923,582)$ (144,289,045)$ (107,304,246)$ (138,498,813)$ (124,116,473)$ (105,628,721)$ (117,664,896)$ (119,618,883)$ (125,876,506)$ (98,167,324)$
General Revenues and Other Changes in Net Position
General RevenuesGeneral property taxes 80,460,113$ 75,042,232$ 68,384,143$ 62,940,310$ 59,566,818$ 58,158,711$ 56,060,959$ 55,819,958$ 55,401,204$ 55,625,137$
11,876,599 11,619,460 11,670,485 11,466,250 10,767,263 10,747,757 9,901,299 9,995,523 8,956,683 9,312,664 Utility tax 4,764,420 4,616,495 4,540,179 4,478,748 4,614,299 4,539,149 4,422,168 4,252,785 4,491,361 4,419,303 Communications tax 2,716,128 2,927,794 3,022,277 3,098,436 3,192,960 3,221,105 3,276,861 3,268,192 3,335,988 3,352,581 Meals tax 12,212,802 11,781,447 11,746,648 11,320,042 8,703,398 8,156,709 8,103,257 7,378,230 6,861,066 6,454,663 Lodging tax 5,659,226 5,151,629 4,846,549 3,664,156 3,166,309 2,933,227 2,932,367 2,807,326 2,460,055 2,475,914 Other taxes 12,261,038 4,256,433 4,593,226 4,511,753 4,319,279 4,139,312 4,022,679 4,059,205 4,317,180 3,762,710 Business license tax 1,447,032 8,767,125 7,918,093 6,925,402 6,788,971 6,442,386 6,880,942 6,491,428 6,061,192 6,502,949
39,975,597 27,056,841 - 30,117,894 23,502,728 24,353,298 27,910,750 24,887,083 25,229,997 25,160,421
1,893,575 1,297,431 - - - - - - - - Interest and investment earnings 1,033,337 - 406,625 341,347 365,070 259,548 276,657 373,961 538,029 918,853
Miscellaneous 896,195 980,353 - - - - - - - - Transfers, net 5,567,298 5,264,759 - - - - - - - - Gain from sale of assets - - - - - - - 252,742 - -
Total governmental activities 180,763,360 158,761,999 117,128,225 138,864,338 124,987,095 122,951,202 123,787,939 119,586,433 117,652,755 117,985,195
Interest and investment earnings 206,128 - 101,036 141,362 113,151 32,668 62,128 109,079 204,224 240,142 Total business-type activities 206,128 - 101,036 141,362 113,151 32,668 62,128 109,079 204,224 240,142 -
Total Primary Government Revenues 180,969,488$ 158,761,999$ 117,229,261$ 139,005,700$ 125,100,246$ 122,983,870$ 123,850,067$ 119,695,512$ 117,856,979$ 118,225,337$
Change in net positionGovernmental Activities 6,550,350$ 8,252,311$ 10,372,952$ (4,803,942)$ (1,773,911)$ 16,075,578$ 3,795,886$ (413,593)$ (10,330,130)$ 18,452,691$ Business-type Activities 4,266,537$ 1,099,874$ (322,469)$ 5,310,729$ 2,757,684$ 1,279,571 2,389,285 490,222 2,310,603 1,132,261
Total change in net position 10,816,887$ 9,352,185$ 10,050,483$ 506,787$ 983,773$ 17,355,149$ 6,185,171$ 76,629$ (8,019,527)$ 19,584,952$
Source: City of Charlottesville Comprehensive Annual Financial Report - Exhibit B
Schedule prepared using the accrual basis of accounting
Grants and contributions not restricted
Governmental activities:
Business-type activities:
Governmental activities:
Business-type activities:
Sales tax
Unrestricted revenue from use of money and property
148
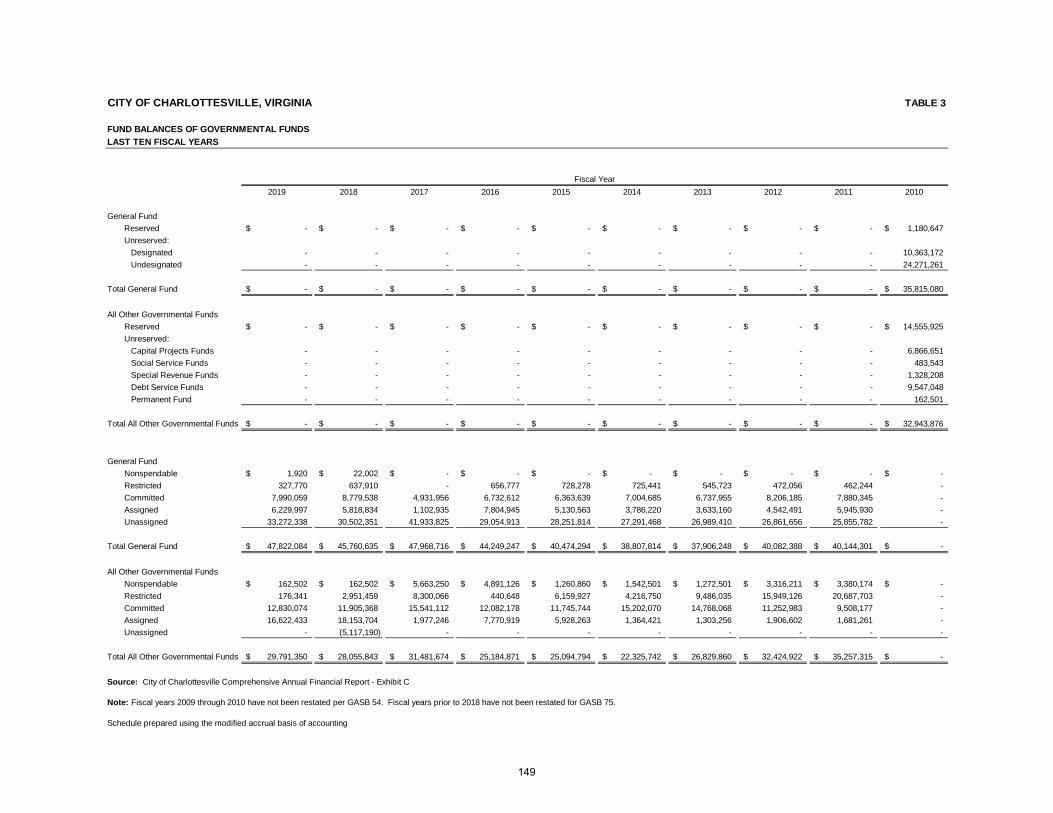
CITY OF CHARLOTTESVILLE, VIRGINIA TABLE 3
FUND BALANCES OF GOVERNMENTAL FUNDS
LAST TEN FISCAL YEARS
2019 2018 2017 2016 2015 2014 2013 2012 2011 2010
General Fund
Reserved -$ -$ -$ -$ -$ -$ -$ -$ -$ 1,180,647$
Unreserved:
Designated - - - - - - - - - 10,363,172
Undesignated - - - - - - - - - 24,271,261
Total General Fund -$ -$ -$ -$ -$ -$ -$ -$ -$ 35,815,080$
All Other Governmental Funds
Reserved -$ -$ -$ -$ -$ -$ -$ -$ -$ 14,555,925$
Unreserved:
Capital Projects Funds - - - - - - - - - 6,866,651
Social Service Funds - - - - - - - - - 483,543
Special Revenue Funds - - - - - - - - - 1,328,208
Debt Service Funds - - - - - - - - - 9,547,048
Permanent Fund - - - - - - - - - 162,501
Total All Other Governmental Funds -$ -$ -$ -$ -$ -$ -$ -$ -$ 32,943,876$
General Fund
Nonspendable 1,920$ 22,002$ -$ -$ -$ -$ -$ -$ -$ -$
Restricted 327,770 637,910 - 656,777 728,278 725,441 545,723 472,056 462,244 -
Committed 7,990,059 8,779,538 4,931,956 6,732,612 6,363,639 7,004,685 6,737,955 8,206,185 7,880,345 -
Assigned 6,229,997 5,818,834 1,102,935 7,804,945 5,130,563 3,786,220 3,633,160 4,542,491 5,945,930 -
Unassigned 33,272,338 30,502,351 41,933,825 29,054,913 28,251,814 27,291,468 26,989,410 26,861,656 25,855,782 -
Total General Fund 47,822,084$ 45,760,635$ 47,968,716$ 44,249,247$ 40,474,294$ 38,807,814$ 37,906,248$ 40,082,388$ 40,144,301$ -$
All Other Governmental Funds
Nonspendable 162,502$ 162,502$ 5,663,250$ 4,891,126$ 1,260,860$ 1,542,501$ 1,272,501$ 3,316,211$ 3,380,174$ -$
Restricted 176,341 2,951,459 8,300,066 440,648 6,159,927 4,216,750 9,486,035 15,949,126 20,687,703 -
Committed 12,830,074 11,905,368 15,541,112 12,082,178 11,745,744 15,202,070 14,768,068 11,252,983 9,508,177 -
Assigned 16,622,433 18,153,704 1,977,246 7,770,919 5,928,263 1,364,421 1,303,256 1,906,602 1,681,261 -
Unassigned - (5,117,190) - - - - - - - -
Total All Other Governmental Funds 29,791,350$ 28,055,843$ 31,481,674$ 25,184,871$ 25,094,794$ 22,325,742$ 26,829,860$ 32,424,922$ 35,257,315$ -$
Source: City of Charlottesville Comprehensive Annual Financial Report - Exhibit C
Note: Fiscal years 2009 through 2010 have not been restated per GASB 54. Fiscal years prior to 2018 have not been restated for GASB 75.
Schedule prepared using the modified accrual basis of accounting
Fiscal Year
149
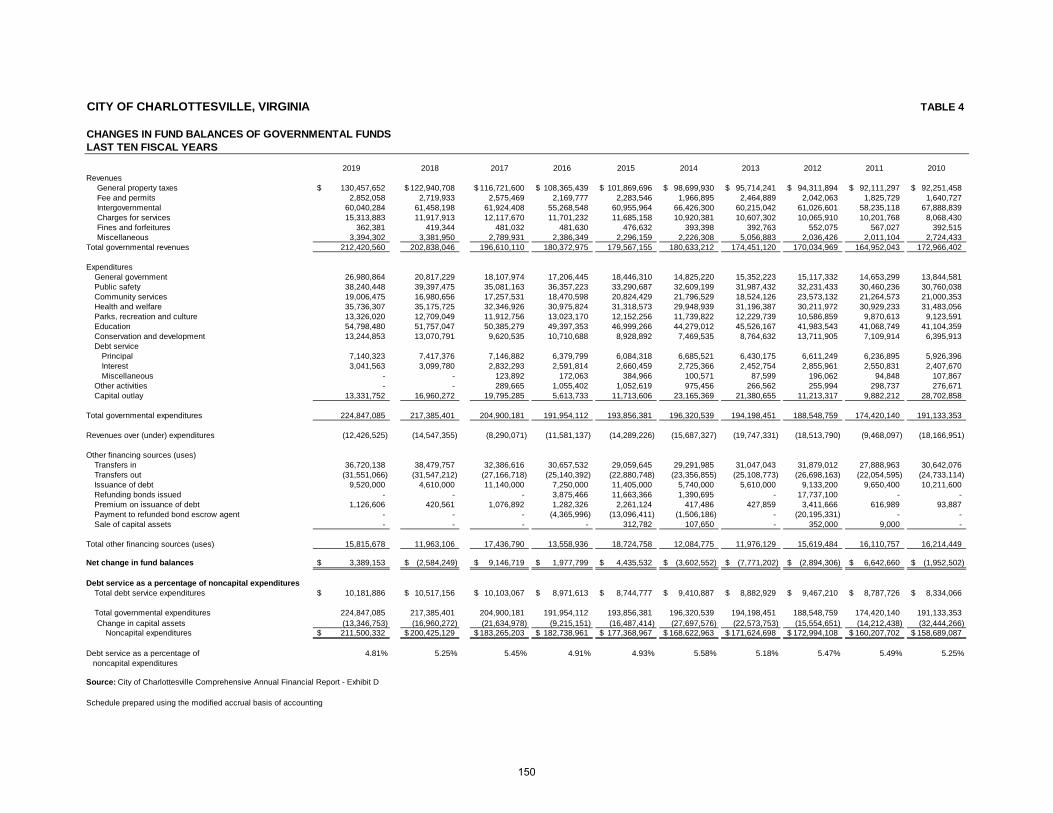
CITY OF CHARLOTTESVILLE, VIRGINIA TABLE 4
2019 2018 2017 2016 2015 2014 2013 2012 2011 2010Revenues
General property taxes 130,457,652$ 122,940,708$ 116,721,600$ 108,365,439$ 101,869,696$ 98,699,930$ 95,714,241$ 94,311,894$ 92,111,297$ 92,251,458$ Fee and permits 2,852,058 2,719,933 2,575,469 2,169,777 2,283,546 1,966,895 2,464,889 2,042,063 1,825,729 1,640,727 Intergovernmental 60,040,284 61,458,198 61,924,408 55,268,548 60,955,964 66,426,300 60,215,042 61,026,601 58,235,118 67,888,839 Charges for services 15,313,883 11,917,913 12,117,670 11,701,232 11,685,158 10,920,381 10,607,302 10,065,910 10,201,768 8,068,430 Fines and forfeitures 362,381 419,344 481,032 481,630 476,632 393,398 392,763 552,075 567,027 392,515 Miscellaneous 3,394,302 3,381,950 2,789,931 2,386,349 2,296,159 2,226,308 5,056,883 2,036,426 2,011,104 2,724,433
Total governmental revenues 212,420,560 202,838,046 196,610,110 180,372,975 179,567,155 180,633,212 174,451,120 170,034,969 164,952,043 172,966,402
ExpendituresGeneral government 26,980,864 20,817,229 18,107,974 17,206,445 18,446,310 14,825,220 15,352,223 15,117,332 14,653,299 13,844,581 Public safety 38,240,448 39,397,475 35,081,163 36,357,223 33,290,687 32,609,199 31,987,432 32,231,433 30,460,236 30,760,038 Community services 19,006,475 16,980,656 17,257,531 18,470,598 20,824,429 21,796,529 18,524,126 23,573,132 21,264,573 21,000,353 Health and welfare 35,736,307 35,175,725 32,346,926 30,975,824 31,318,573 29,948,939 31,196,387 30,211,972 30,929,233 31,483,056 Parks, recreation and culture 13,326,020 12,709,049 11,912,756 13,023,170 12,152,256 11,739,822 12,229,739 10,586,859 9,870,613 9,123,591 Education 54,798,480 51,757,047 50,385,279 49,397,353 46,999,266 44,279,012 45,526,167 41,983,543 41,068,749 41,104,359 Conservation and development 13,244,853 13,070,791 9,620,535 10,710,688 8,928,892 7,469,535 8,764,632 13,711,905 7,109,914 6,395,913 Debt service
Principal 7,140,323 7,417,376 7,146,882 6,379,799 6,084,318 6,685,521 6,430,175 6,611,249 6,236,895 5,926,396 Interest 3,041,563 3,099,780 2,832,293 2,591,814 2,660,459 2,725,366 2,452,754 2,855,961 2,550,831 2,407,670 Miscellaneous - - 123,892 172,063 384,966 100,571 87,599 196,062 94,848 107,867
Other activities - - 289,665 1,055,402 1,052,619 975,456 266,562 255,994 298,737 276,671 Capital outlay 13,331,752 16,960,272 19,795,285 5,613,733 11,713,606 23,165,369 21,380,655 11,213,317 9,882,212 28,702,858
Total governmental expenditures 224,847,085 217,385,401 204,900,181 191,954,112 193,856,381 196,320,539 194,198,451 188,548,759 174,420,140 191,133,353
Revenues over (under) expenditures (12,426,525) (14,547,355) (8,290,071) (11,581,137) (14,289,226) (15,687,327) (19,747,331) (18,513,790) (9,468,097) (18,166,951)
Other financing sources (uses)Transfers in 36,720,138 38,479,757 32,386,616 30,657,532 29,059,645 29,291,985 31,047,043 31,879,012 27,888,963 30,642,076 Transfers out (31,551,066) (31,547,212) (27,166,718) (25,140,392) (22,880,748) (23,356,855) (25,108,773) (26,698,163) (22,054,595) (24,733,114) Issuance of debt 9,520,000 4,610,000 11,140,000 7,250,000 11,405,000 5,740,000 5,610,000 9,133,200 9,650,400 10,211,600 Refunding bonds issued - - - 3,875,466 11,663,366 1,390,695 - 17,737,100 - - Premium on issuance of debt 1,126,606 420,561 1,076,892 1,282,326 2,261,124 417,486 427,859 3,411,666 616,989 93,887 Payment to refunded bond escrow agent - - - (4,365,996) (13,096,411) (1,506,186) - (20,195,331) - - Sale of capital assets - - - - 312,782 107,650 - 352,000 9,000 -
Total other financing sources (uses) 15,815,678 11,963,106 17,436,790 13,558,936 18,724,758 12,084,775 11,976,129 15,619,484 16,110,757 16,214,449
Net change in fund balances 3,389,153$ (2,584,249)$ 9,146,719$ 1,977,799$ 4,435,532$ (3,602,552)$ (7,771,202)$ (2,894,306)$ 6,642,660$ (1,952,502)$
Debt service as a percentage of noncapital expendituresTotal debt service expenditures 10,181,886$ 10,517,156$ 10,103,067$ 8,971,613$ 8,744,777$ 9,410,887$ 8,882,929$ 9,467,210$ 8,787,726$ 8,334,066$
Total governmental expenditures 224,847,085 217,385,401 204,900,181 191,954,112 193,856,381 196,320,539 194,198,451 188,548,759 174,420,140 191,133,353 Change in capital assets (13,346,753) (16,960,272) (21,634,978) (9,215,151) (16,487,414) (27,697,576) (22,573,753) (15,554,651) (14,212,438) (32,444,266)
Noncapital expenditures 211,500,332$ 200,425,129$ 183,265,203$ 182,738,961$ 177,368,967$ 168,622,963$ 171,624,698$ 172,994,108$ 160,207,702$ 158,689,087$
Debt service as a percentage of 4.81% 5.25% 5.45% 4.91% 4.93% 5.58% 5.18% 5.47% 5.49% 5.25% noncapital expenditures
Source: City of Charlottesville Comprehensive Annual Financial Report - Exhibit D
Schedule prepared using the modified accrual basis of accounting
CHANGES IN FUND BALANCES OF GOVERNMENTAL FUNDS LAST TEN FISCAL YEARS
150
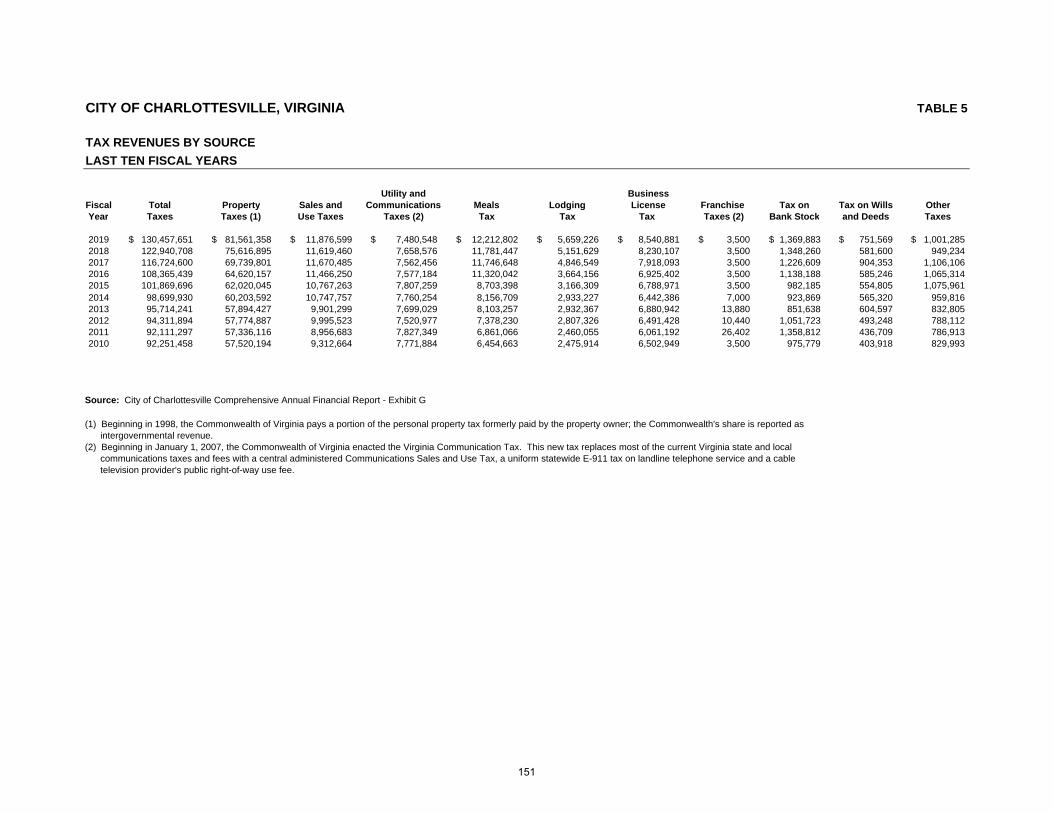
CITY OF CHARLOTTESVILLE, VIRGINIA TABLE 5
TAX REVENUES BY SOURCE
LAST TEN FISCAL YEARS
Utility and BusinessFiscal Total Property Sales and Communications Meals Lodging License Franchise Tax on Tax on Wills OtherYear Taxes Taxes (1) Use Taxes Taxes (2) Tax Tax Tax Taxes (2) Bank Stock and Deeds Taxes
2019 130,457,651$ 81,561,358$ 11,876,599$ 7,480,548$ 12,212,802$ 5,659,226$ 8,540,881$ 3,500$ 1,369,883$ 751,569$ 1,001,285$ 2018 122,940,708 75,616,895 11,619,460 7,658,576 11,781,447 5,151,629 8,230,107 3,500 1,348,260 581,600 949,234 2017 116,724,600 69,739,801 11,670,485 7,562,456 11,746,648 4,846,549 7,918,093 3,500 1,226,609 904,353 1,106,106 2016 108,365,439 64,620,157 11,466,250 7,577,184 11,320,042 3,664,156 6,925,402 3,500 1,138,188 585,246 1,065,314 2015 101,869,696 62,020,045 10,767,263 7,807,259 8,703,398 3,166,309 6,788,971 3,500 982,185 554,805 1,075,961 2014 98,699,930 60,203,592 10,747,757 7,760,254 8,156,709 2,933,227 6,442,386 7,000 923,869 565,320 959,816 2013 95,714,241 57,894,427 9,901,299 7,699,029 8,103,257 2,932,367 6,880,942 13,880 851,638 604,597 832,805 2012 94,311,894 57,774,887 9,995,523 7,520,977 7,378,230 2,807,326 6,491,428 10,440 1,051,723 493,248 788,112 2011 92,111,297 57,336,116 8,956,683 7,827,349 6,861,066 2,460,055 6,061,192 26,402 1,358,812 436,709 786,913 2010 92,251,458 57,520,194 9,312,664 7,771,884 6,454,663 2,475,914 6,502,949 3,500 975,779 403,918 829,993
Source: City of Charlottesville Comprehensive Annual Financial Report - Exhibit G
intergovernmental revenue.
communications taxes and fees with a central administered Communications Sales and Use Tax, a uniform statewide E-911 tax on landline telephone service and a cable television provider's public right-of-way use fee.
(1) Beginning in 1998, the Commonwealth of Virginia pays a portion of the personal property tax formerly paid by the property owner; the Commonwealth's share is reported as
(2) Beginning in January 1, 2007, the Commonwealth of Virginia enacted the Virginia Communication Tax. This new tax replaces most of the current Virginia state and local
151
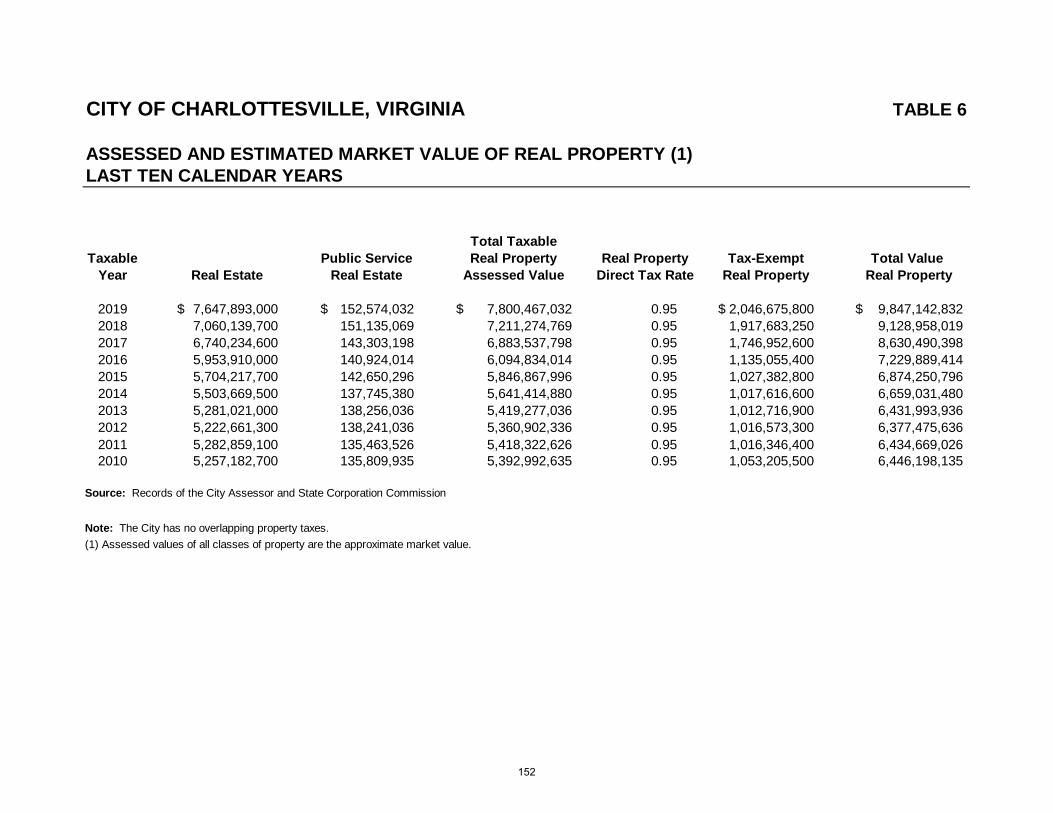
CITY OF CHARLOTTESVILLE, VIRGINIA TABLE 6
ASSESSED AND ESTIMATED MARKET VALUE OF REAL PROPERTY (1)LAST TEN CALENDAR YEARS
Total TaxableTaxable Public Service Real Property Real Property Tax-Exempt Total Value
Year Real Estate Real Estate Assessed Value Direct Tax Rate Real Property Real Property
2019 7,647,893,000$ 152,574,032$ 7,800,467,032$ 0.95 2,046,675,800$ 9,847,142,832$ 2018 7,060,139,700 151,135,069 7,211,274,769 0.95 1,917,683,250 9,128,958,019 2017 6,740,234,600 143,303,198 6,883,537,798 0.95 1,746,952,600 8,630,490,398 2016 5,953,910,000 140,924,014 6,094,834,014 0.95 1,135,055,400 7,229,889,414 2015 5,704,217,700 142,650,296 5,846,867,996 0.95 1,027,382,800 6,874,250,796 2014 5,503,669,500 137,745,380 5,641,414,880 0.95 1,017,616,600 6,659,031,480 2013 5,281,021,000 138,256,036 5,419,277,036 0.95 1,012,716,900 6,431,993,936 2012 5,222,661,300 138,241,036 5,360,902,336 0.95 1,016,573,300 6,377,475,636 2011 5,282,859,100 135,463,526 5,418,322,626 0.95 1,016,346,400 6,434,669,026 2010 5,257,182,700 135,809,935 5,392,992,635 0.95 1,053,205,500 6,446,198,135
Source: Records of the City Assessor and State Corporation Commission
Note: The City has no overlapping property taxes.
(1) Assessed values of all classes of property are the approximate market value.
152
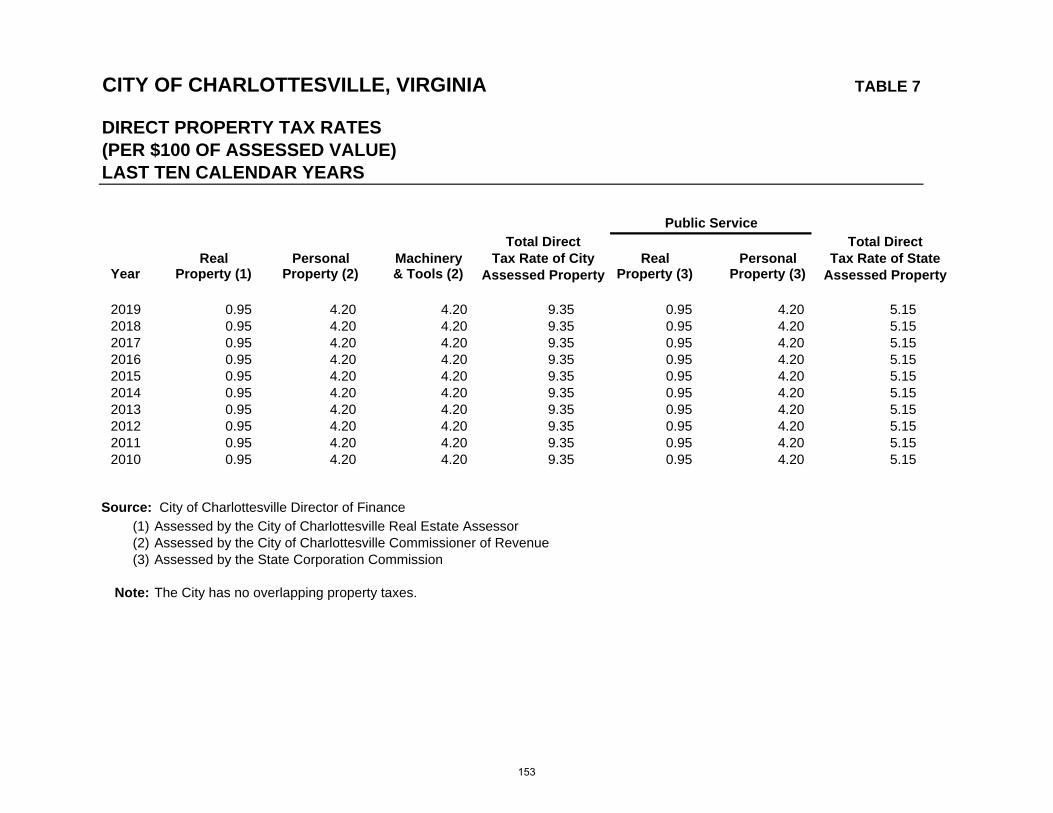
CITY OF CHARLOTTESVILLE, VIRGINIA TABLE 7
DIRECT PROPERTY TAX RATES(PER $100 OF ASSESSED VALUE)LAST TEN CALENDAR YEARS
Total Direct Total DirectReal Personal Machinery Tax Rate of City Real Personal Tax Rate of State
Year Property (1) Property (2) & Tools (2) Assessed Property Property (3) Property (3) Assessed Property
2019 0.95 4.20 4.20 9.35 0.95 4.20 5.15 2018 0.95 4.20 4.20 9.35 0.95 4.20 5.15 2017 0.95 4.20 4.20 9.35 0.95 4.20 5.15 2016 0.95 4.20 4.20 9.35 0.95 4.20 5.15 2015 0.95 4.20 4.20 9.35 0.95 4.20 5.15 2014 0.95 4.20 4.20 9.35 0.95 4.20 5.15 2013 0.95 4.20 4.20 9.35 0.95 4.20 5.15 2012 0.95 4.20 4.20 9.35 0.95 4.20 5.15 2011 0.95 4.20 4.20 9.35 0.95 4.20 5.15 2010 0.95 4.20 4.20 9.35 0.95 4.20 5.15
Source: City of Charlottesville Director of Finance(1) Assessed by the City of Charlottesville Real Estate Assessor(2) Assessed by the City of Charlottesville Commissioner of Revenue(3) Assessed by the State Corporation Commission
Note: The City has no overlapping property taxes.
Public Service
153
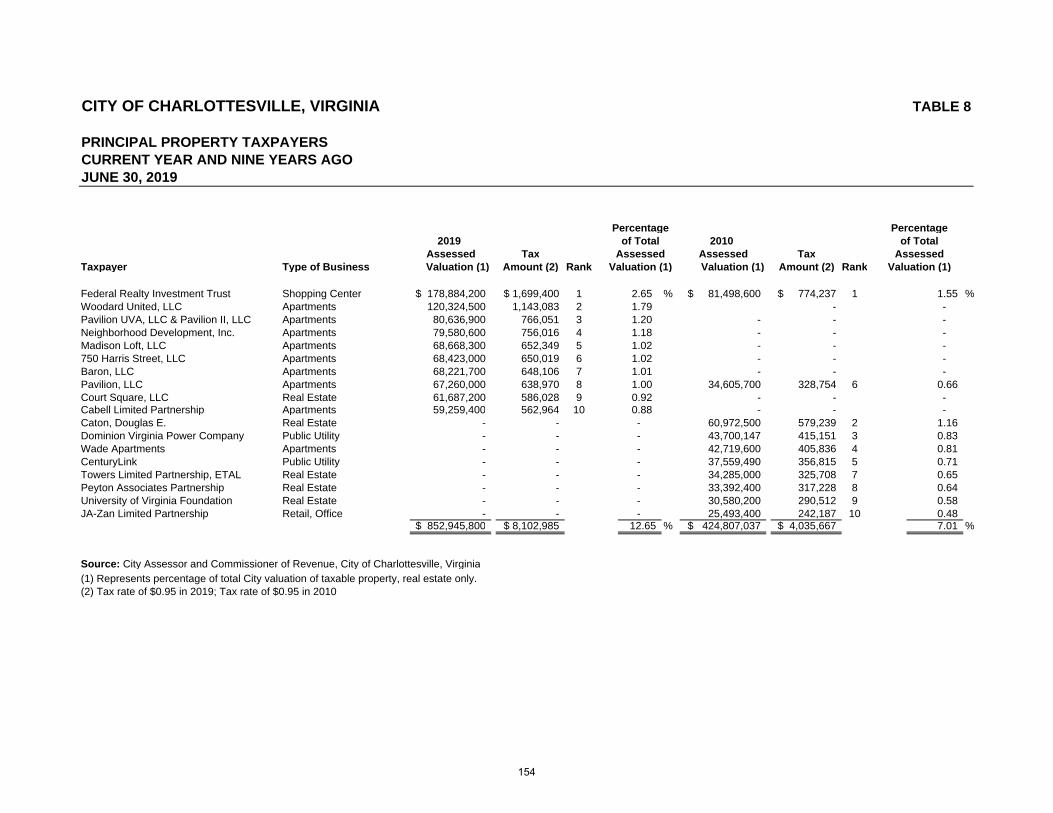
CITY OF CHARLOTTESVILLE, VIRGINIA
PRINCIPAL PROPERTY TAXPAYERSCURRENT YEAR AND NINE YEARS AGOJUNE 30, 2019
2019 2010Assessed Tax Assessed Tax
Taxpayer Type of Business Valuation (1) Amount (2) Rank Valuation (1) Amount (2) Rank
Federal Realty Investment Trust Shopping Center 178,884,200$ 1,699,400$ 1 2.65 % 81,498,600$ 774,237$ 1 1.55 %Woodard United, LLC Apartments 120,324,500 1,143,083 2 1.79 - - Pavilion UVA, LLC & Pavilion II, LLC Apartments 80,636,900 766,051 3 1.20 - - - Neighborhood Development, Inc. Apartments 79,580,600 756,016 4 1.18 - - - Madison Loft, LLC Apartments 68,668,300 652,349 5 1.02 - - - 750 Harris Street, LLC Apartments 68,423,000 650,019 6 1.02 - - - Baron, LLC Apartments 68,221,700 648,106 7 1.01 - - - Pavilion, LLC Apartments 67,260,000 638,970 8 1.00 34,605,700 328,754 6 0.66 Court Square, LLC Real Estate 61,687,200 586,028 9 0.92 - - - Cabell Limited Partnership Apartments 59,259,400 562,964 10 0.88 - - - Caton, Douglas E. Real Estate - - - 60,972,500 579,239 2 1.16 Dominion Virginia Power Company Public Utility - - - 43,700,147 415,151 3 0.83 Wade Apartments Apartments - - - 42,719,600 405,836 4 0.81 CenturyLink Public Utility - - - 37,559,490 356,815 5 0.71 Towers Limited Partnership, ETAL Real Estate - - - 34,285,000 325,708 7 0.65 Peyton Associates Partnership Real Estate - - - 33,392,400 317,228 8 0.64 University of Virginia Foundation Real Estate - - - 30,580,200 290,512 9 0.58 JA-Zan Limited Partnership Retail, Office - - - 25,493,400 242,187 10 0.48
852,945,800$ 8,102,985$ % 424,807,037$ 4,035,667$ 7.01 %
Source: City Assessor and Commissioner of Revenue, City of Charlottesville, Virginia(1) Represents percentage of total City valuation of taxable property, real estate only.(2) Tax rate of $0.95 in 2019; Tax rate of $0.95 in 2010
12.65
TABLE 8
Percentage Percentageof Total
Valuation (1)
of TotalAssessedAssessed
Valuation (1)
154
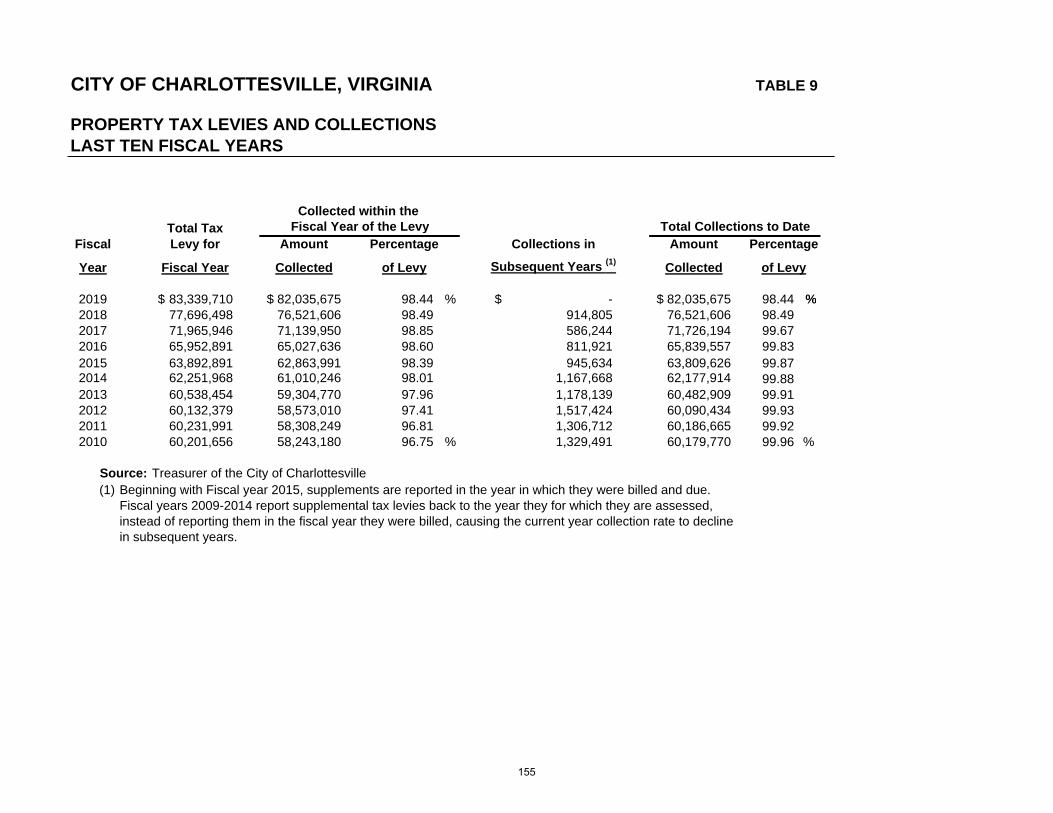
TABLE 9
PROPERTY TAX LEVIES AND COLLECTIONSLAST TEN FISCAL YEARS
Total TaxFiscal Levy for Amount Percentage Collections in Amount
Year Fiscal Year Collected of Levy Subsequent Years (1)Collected
2019 83,339,710$ 82,035,675$ 98.44 % -$ 82,035,675$ 98.44 %2018 77,696,498 76,521,606 98.49 914,805 76,521,606 98.49 2017 71,965,946 71,139,950 98.85 586,244 71,726,194 99.67 2016 65,952,891 65,027,636 98.60 811,921 65,839,557 99.83 2015 63,892,891 62,863,991 98.39 945,634 63,809,626 99.87 2014 62,251,968 61,010,246 98.01 1,167,668 62,177,914 99.88 2013 60,538,454 59,304,770 97.96 1,178,139 60,482,909 99.91 2012 60,132,379 58,573,010 97.41 1,517,424 60,090,434 99.93 2011 60,231,991 58,308,249 96.81 1,306,712 60,186,665 99.92 2010 60,201,656 58,243,180 96.75 % 1,329,491 60,179,770 99.96 %
Source: Treasurer of the City of Charlottesville(1) Beginning with Fiscal year 2015, supplements are reported in the year in which they were billed and due.
Fiscal years 2009-2014 report supplemental tax levies back to the year they for which they are assessed, instead of reporting them in the fiscal year they were billed, causing the current year collection rate to declinein subsequent years.
of Levy
Total Collections to DateCollected within the
Fiscal Year of the Levy
CITY OF CHARLOTTESVILLE, VIRGINIA
Percentage
155
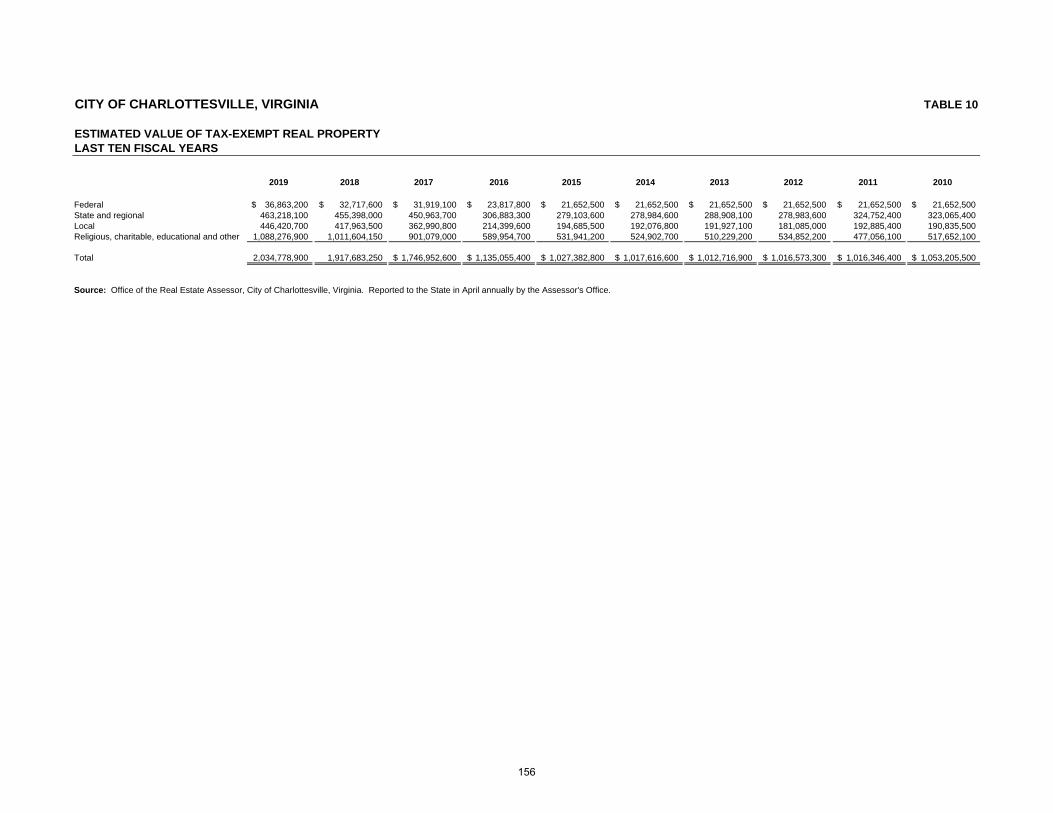
CITY OF CHARLOTTESVILLE, VIRGINIA TABLE 10
ESTIMATED VALUE OF TAX-EXEMPT REAL PROPERTYLAST TEN FISCAL YEARS
2019 2018 2017 2016 2015 2014 2013 2012 2011 2010
Federal 36,863,200$ 32,717,600$ 31,919,100$ 23,817,800$ 21,652,500$ 21,652,500$ 21,652,500$ 21,652,500$ 21,652,500$ 21,652,500$ State and regional 463,218,100 455,398,000 450,963,700 306,883,300 279,103,600 278,984,600 288,908,100 278,983,600 324,752,400 323,065,400 Local 446,420,700 417,963,500 362,990,800 214,399,600 194,685,500 192,076,800 191,927,100 181,085,000 192,885,400 190,835,500 Religious, charitable, educational and other 1,088,276,900 1,011,604,150 901,079,000 589,954,700 531,941,200 524,902,700 510,229,200 534,852,200 477,056,100 517,652,100
Total 2,034,778,900 1,917,683,250 1,746,952,600$ 1,135,055,400$ 1,027,382,800$ 1,017,616,600$ 1,012,716,900$ 1,016,573,300$ 1,016,346,400$ 1,053,205,500$
Source: Office of the Real Estate Assessor, City of Charlottesville, Virginia. Reported to the State in April annually by the Assessor's Office.
156
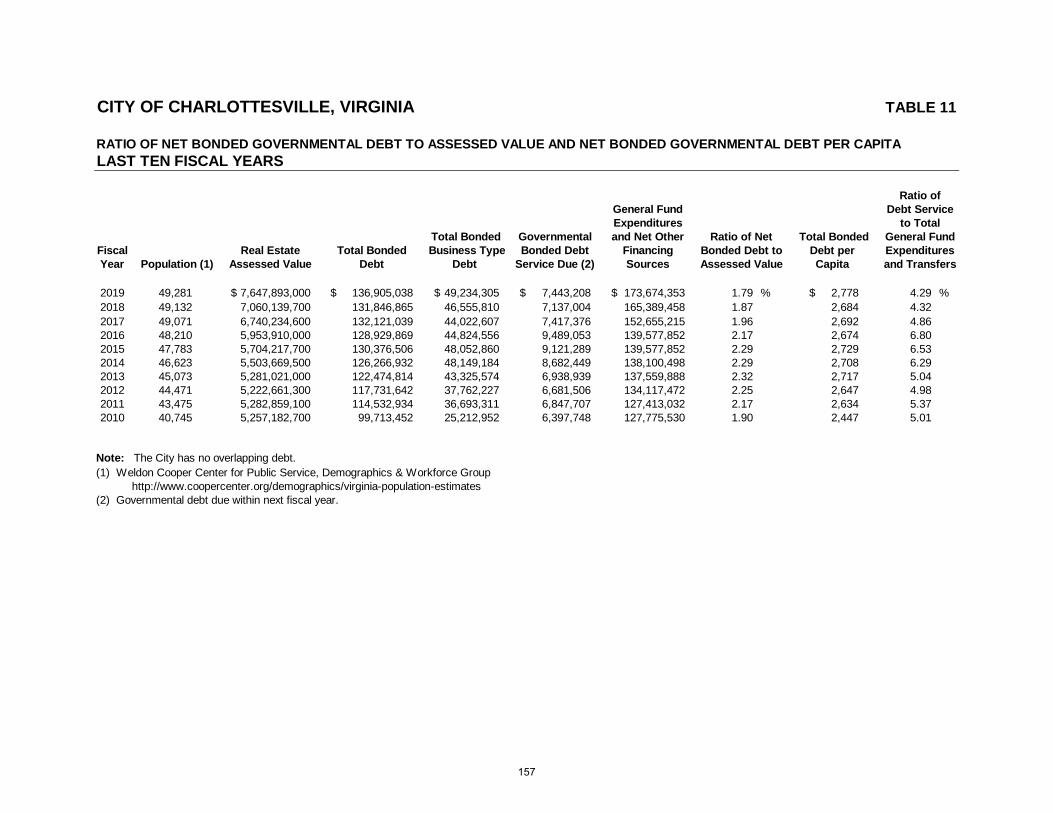
CITY OF CHARLOTTESVILLE, VIRGINIA TABLE 11
RATIO OF NET BONDED GOVERNMENTAL DEBT TO ASSESSED VALUE AND NET BONDED GOVERNMENTAL DEBT PER CAPITALAST TEN FISCAL YEARS
General FundExpenditures
Total Bonded Governmental and Net OtherFiscal Real Estate Total Bonded Business Type Bonded Debt FinancingYear Population (1) Assessed Value Debt Debt Service Due (2) Sources
2019 49,281 7,647,893,000$ 136,905,038$ 49,234,305$ 7,443,208$ 173,674,353$ 1.79 % 2,778$ 4.29 %2018 49,132 7,060,139,700 131,846,865 46,555,810 7,137,004 165,389,458 1.87 2,684 4.32 2017 49,071 6,740,234,600 132,121,039 44,022,607 7,417,376 152,655,215 1.96 2,692 4.86 2016 48,210 5,953,910,000 128,929,869 44,824,556 9,489,053 139,577,852 2.17 2,674 6.80 2015 47,783 5,704,217,700 130,376,506 48,052,860 9,121,289 139,577,852 2.29 2,729 6.53 2014 46,623 5,503,669,500 126,266,932 48,149,184 8,682,449 138,100,498 2.29 2,708 6.29 2013 45,073 5,281,021,000 122,474,814 43,325,574 6,938,939 137,559,888 2.32 2,717 5.04 2012 44,471 5,222,661,300 117,731,642 37,762,227 6,681,506 134,117,472 2.25 2,647 4.98 2011 43,475 5,282,859,100 114,532,934 36,693,311 6,847,707 127,413,032 2.17 2,634 5.37 2010 40,745 5,257,182,700 99,713,452 25,212,952 6,397,748 127,775,530 1.90 2,447 5.01
Note: The City has no overlapping debt.(1) Weldon Cooper Center for Public Service, Demographics & Workforce Group
http://www.coopercenter.org/demographics/virginia-population-estimates(2) Governmental debt due within next fiscal year.
Ratio of Net Total Bonded General Fund
Ratio ofDebt Service
to Total
and TransfersBonded Debt to Debt per ExpendituresAssessed Value Capita
157
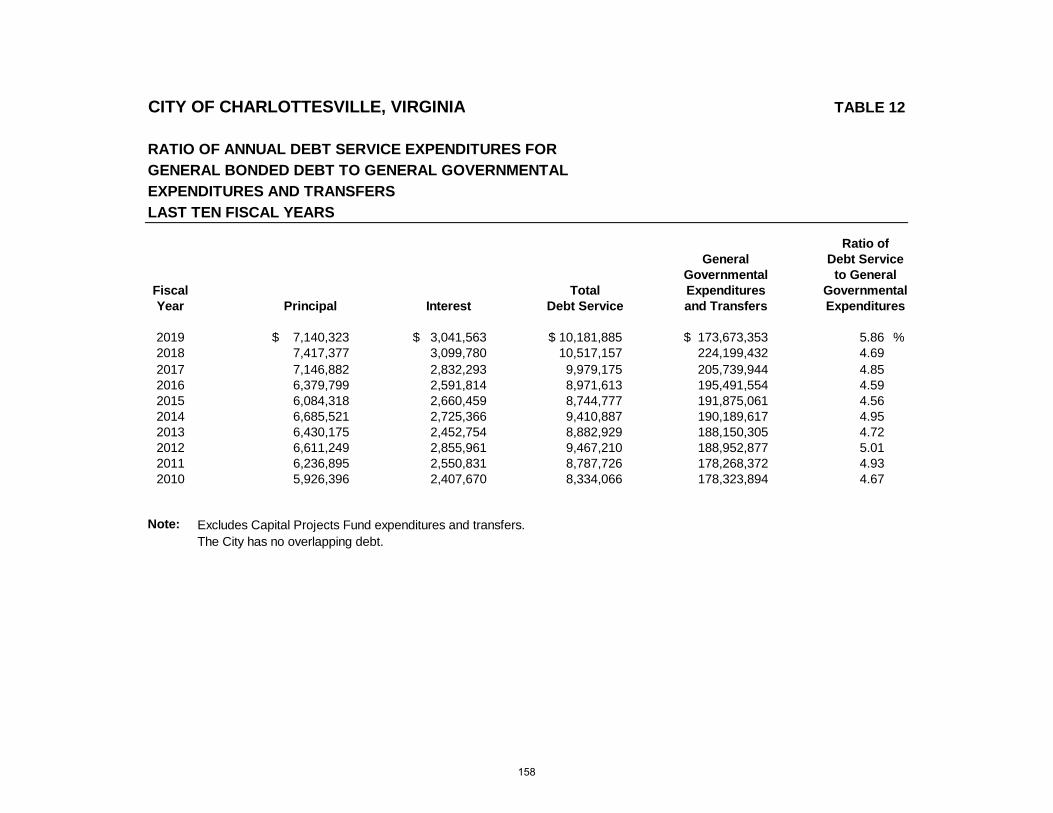
CITY OF CHARLOTTESVILLE, VIRGINIA
RATIO OF ANNUAL DEBT SERVICE EXPENDITURES FOR
GENERAL BONDED DEBT TO GENERAL GOVERNMENTAL
EXPENDITURES AND TRANSFERS
LAST TEN FISCAL YEARS
GeneralGovernmental
Fiscal Total ExpendituresYear Principal Interest Debt Service and Transfers
2019 7,140,323$ 3,041,563$ 10,181,885$ 173,673,353$ 5.86 %2018 7,417,377 3,099,780 10,517,157 224,199,432 4.69 2017 7,146,882 2,832,293 9,979,175 205,739,944 4.85 2016 6,379,799 2,591,814 8,971,613 195,491,554 4.59 2015 6,084,318 2,660,459 8,744,777 191,875,061 4.56 2014 6,685,521 2,725,366 9,410,887 190,189,617 4.95 2013 6,430,175 2,452,754 8,882,929 188,150,305 4.72 2012 6,611,249 2,855,961 9,467,210 188,952,877 5.01 2011 6,236,895 2,550,831 8,787,726 178,268,372 4.93 2010 5,926,396 2,407,670 8,334,066 178,323,894 4.67
Note: Excludes Capital Projects Fund expenditures and transfers.The City has no overlapping debt.
Expenditures
TABLE 12
Ratio ofDebt Service
to GeneralGovernmental
158
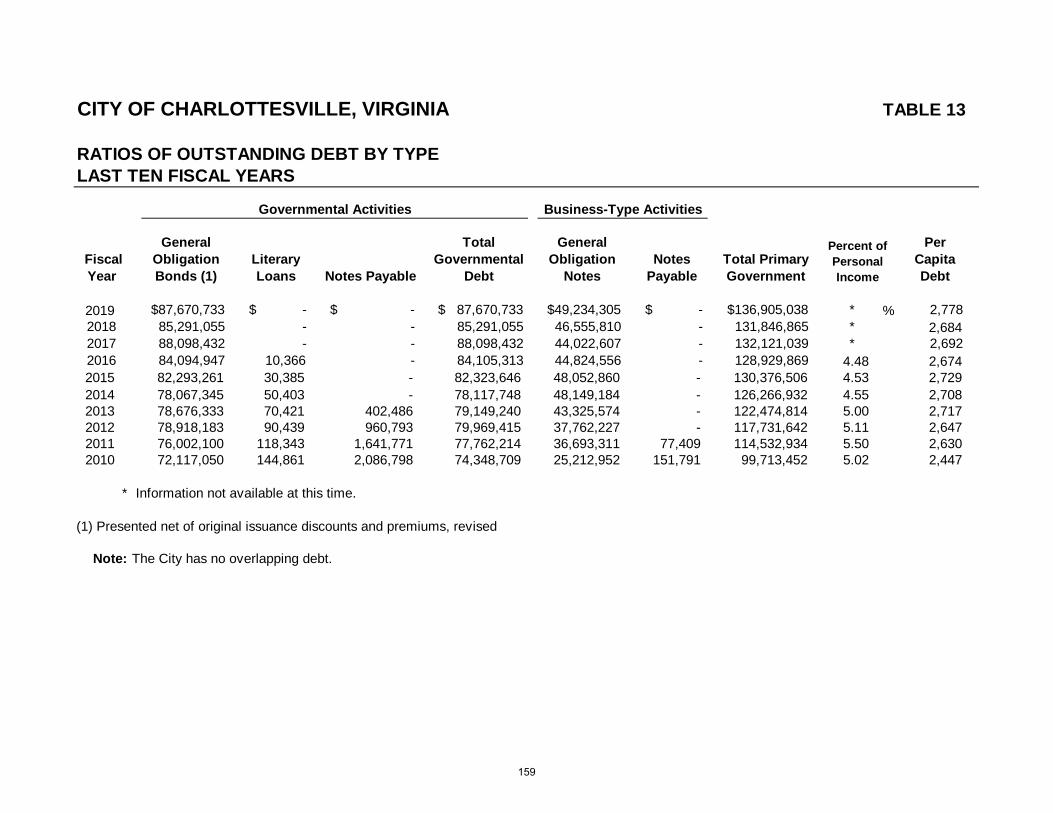
CITY OF CHARLOTTESVILLE, VIRGINIA TABLE 13
RATIOS OF OUTSTANDING DEBT BY TYPELAST TEN FISCAL YEARS
Fiscal Year
General Obligation Bonds (1)
Literary Loans Notes Payable
Total Governmental
Debt
General Obligation
NotesNotes
PayableTotal Primary Government
Per Capita Debt
2019 $87,670,733 $ - $ - $ 87,670,733 $49,234,305 $ - $136,905,038 * % 2,778 2018 85,291,055 - - 85,291,055 46,555,810 - 131,846,865 * 2,684 2017 88,098,432 - - 88,098,432 44,022,607 - 132,121,039 * 2,692 2016 84,094,947 10,366 - 84,105,313 44,824,556 - 128,929,869 4.48 2,674 2015 82,293,261 30,385 - 82,323,646 48,052,860 - 130,376,506 4.53 2,729 2014 78,067,345 50,403 - 78,117,748 48,149,184 - 126,266,932 4.55 2,7082013 78,676,333 70,421 402,486 79,149,240 43,325,574 - 122,474,814 5.00 2,7172012 78,918,183 90,439 960,793 79,969,415 37,762,227 - 117,731,642 5.11 2,6472011 76,002,100 118,343 1,641,771 77,762,214 36,693,311 77,409 114,532,934 5.50 2,6302010 72,117,050 144,861 2,086,798 74,348,709 25,212,952 151,791 99,713,452 5.02 2,447
* Information not available at this time.
(1) Presented net of original issuance discounts and premiums, revised
Note: The City has no overlapping debt.
Governmental Activities Business-Type Activities
Percent of Personal Income
159
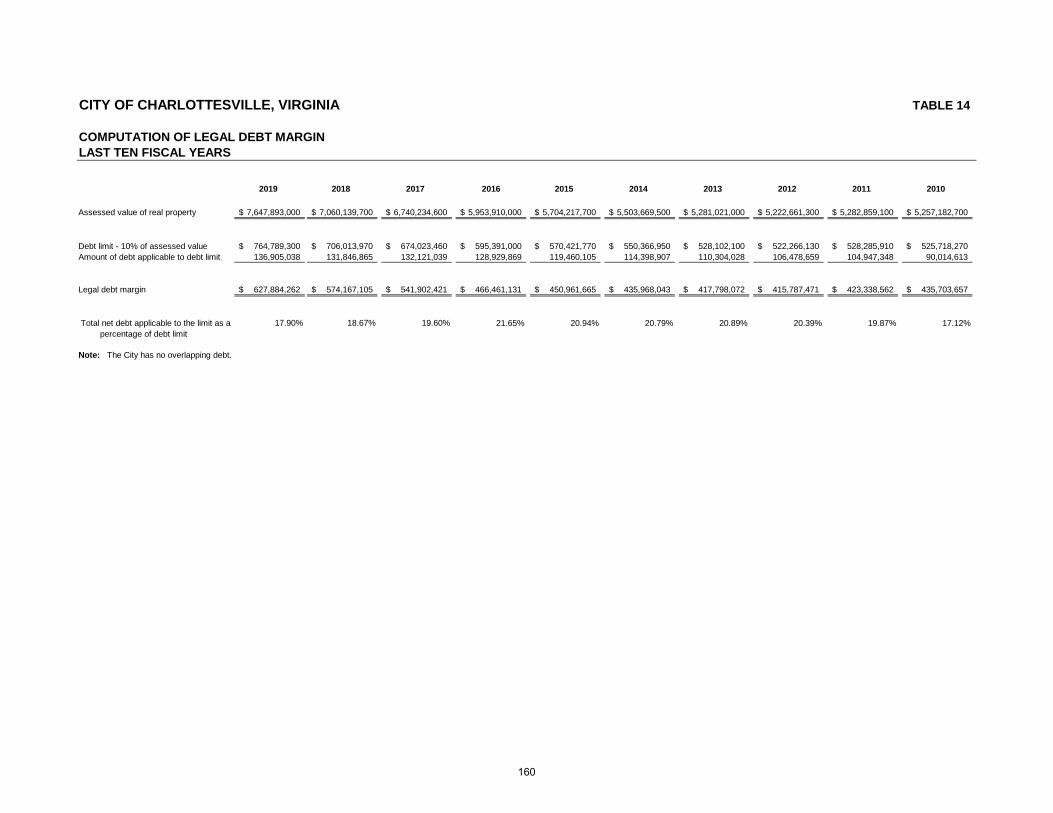
CITY OF CHARLOTTESVILLE, VIRGINIA TABLE 14
COMPUTATION OF LEGAL DEBT MARGINLAST TEN FISCAL YEARS
2019 2018 2017 2016 2015 2014 2013 2012 2011 2010
Assessed value of real property 7,647,893,000$ 7,060,139,700$ 6,740,234,600$ 5,953,910,000$ 5,704,217,700$ 5,503,669,500$ 5,281,021,000$ 5,222,661,300$ 5,282,859,100$ 5,257,182,700$
Debt limit - 10% of assessed value 764,789,300$ 706,013,970$ 674,023,460$ 595,391,000$ 570,421,770$ 550,366,950$ 528,102,100$ 522,266,130$ 528,285,910$ 525,718,270$ Amount of debt applicable to debt limit 136,905,038 131,846,865 132,121,039 128,929,869 119,460,105 114,398,907 110,304,028 106,478,659 104,947,348 90,014,613
Legal debt margin 627,884,262$ 574,167,105$ 541,902,421$ 466,461,131$ 450,961,665$ 435,968,043$ 417,798,072$ 415,787,471$ 423,338,562$ 435,703,657$
17.90% 18.67% 19.60% 21.65% 20.94% 20.79% 20.89% 20.39% 19.87% 17.12%percentage of debt limit
Note: The City has no overlapping debt.
Total net debt applicable to the limit as a
160
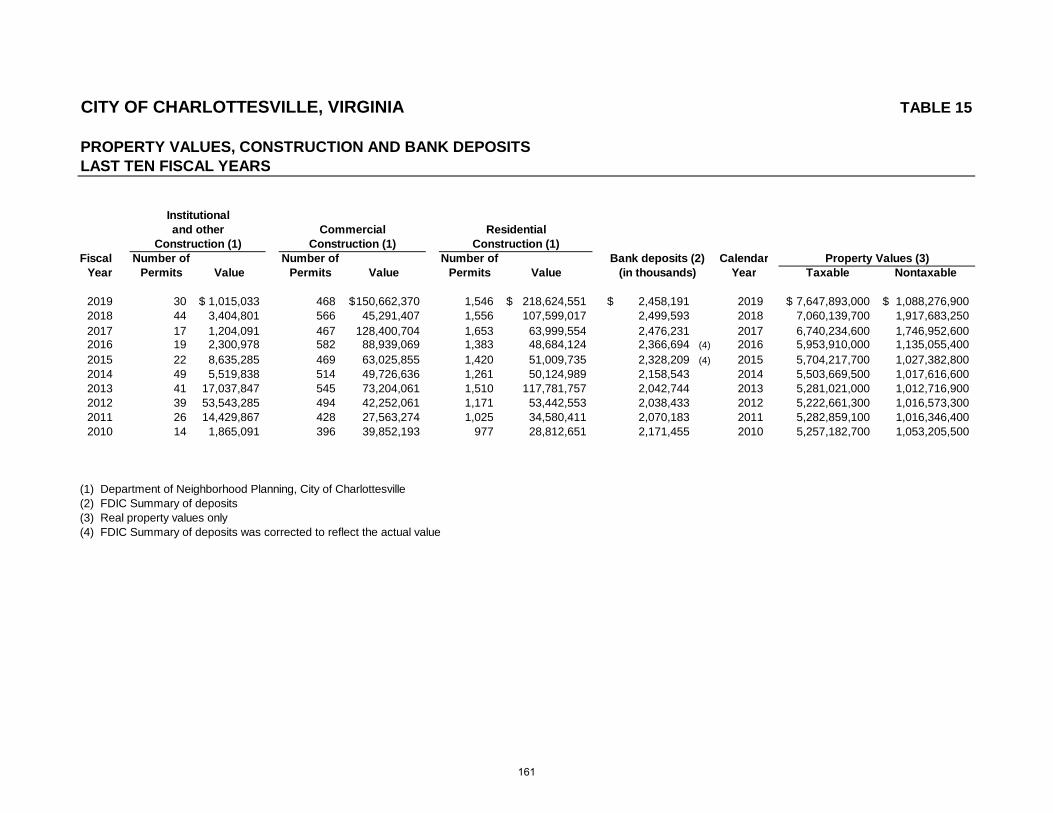
CITY OF CHARLOTTESVILLE, VIRGINIA TABLE 15
PROPERTY VALUES, CONSTRUCTION AND BANK DEPOSITSLAST TEN FISCAL YEARS
Fiscal Number of Number of Number of CalendarYear Permits Value Permits Value Permits Value Year Taxable Nontaxable
2019 30 1,015,033$ 468 150,662,370$ 1,546 218,624,551$ 2,458,191$ 2019 7,647,893,000$ 1,088,276,900$ 2018 44 3,404,801 566 45,291,407 1,556 107,599,017 2,499,593 2018 7,060,139,700 1,917,683,250 2017 17 1,204,091 467 128,400,704 1,653 63,999,554 2,476,231 2017 6,740,234,600 1,746,952,600 2016 19 2,300,978 582 88,939,069 1,383 48,684,124 2,366,694 (4) 2016 5,953,910,000 1,135,055,400 2015 22 8,635,285 469 63,025,855 1,420 51,009,735 2,328,209 (4) 2015 5,704,217,700 1,027,382,800 2014 49 5,519,838 514 49,726,636 1,261 50,124,989 2,158,543 2014 5,503,669,500 1,017,616,600 2013 41 17,037,847 545 73,204,061 1,510 117,781,757 2,042,744 2013 5,281,021,000 1,012,716,900 2012 39 53,543,285 494 42,252,061 1,171 53,442,553 2,038,433 2012 5,222,661,300 1,016,573,300 2011 26 14,429,867 428 27,563,274 1,025 34,580,411 2,070,183 2011 5,282,859,100 1,016,346,400 2010 14 1,865,091 396 39,852,193 977 28,812,651 2,171,455 2010 5,257,182,700 1,053,205,500
(1) Department of Neighborhood Planning, City of Charlottesville (2) FDIC Summary of deposits(3) Real property values only(4) FDIC Summary of deposits was corrected to reflect the actual value
Property Values (3)
Institutionaland other Commercial Residential
(in thousands)
Construction (1) Construction (1) Construction (1)Bank deposits (2)
161
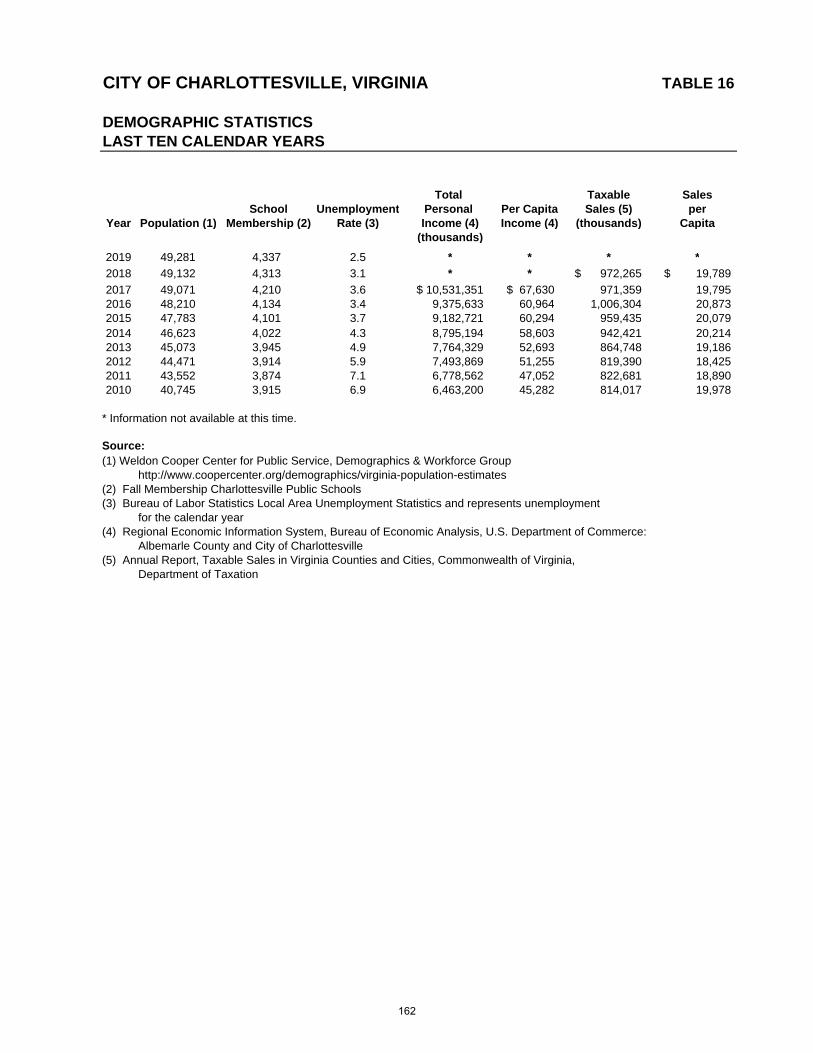
CITY OF CHARLOTTESVILLE, VIRGINIA TABLE 16
DEMOGRAPHIC STATISTICSLAST TEN CALENDAR YEARS
Total Taxable SalesSchool Unemployment Personal Per Capita Sales (5) per
Year Population (1) Membership (2) Rate (3) Income (4) Income (4) (thousands) Capita(thousands)
2019 49,281 4,337 2.5 * * * *
2018 49,132 4,313 3.1 * * 972,265$ 19,789$
2017 49,071 4,210 3.6 10,531,351$ 67,630$ 971,359 19,795 2016 48,210 4,134 3.4 9,375,633 60,964 1,006,304 20,873 2015 47,783 4,101 3.7 9,182,721 60,294 959,435 20,079 2014 46,623 4,022 4.3 8,795,194 58,603 942,421 20,214 2013 45,073 3,945 4.9 7,764,329 52,693 864,748 19,186 2012 44,471 3,914 5.9 7,493,869 51,255 819,390 18,425 2011 43,552 3,874 7.1 6,778,562 47,052 822,681 18,890 2010 40,745 3,915 6.9 6,463,200 45,282 814,017 19,978
* Information not available at this time.
Source:(1) Weldon Cooper Center for Public Service, Demographics & Workforce Group
http://www.coopercenter.org/demographics/virginia-population-estimates(2) Fall Membership Charlottesville Public Schools(3) Bureau of Labor Statistics Local Area Unemployment Statistics and represents unemployment
for the calendar year(4) Regional Economic Information System, Bureau of Economic Analysis, U.S. Department of Commerce:
Albemarle County and City of Charlottesville(5) Annual Report, Taxable Sales in Virginia Counties and Cities, Commonwealth of Virginia,
Department of Taxation
162
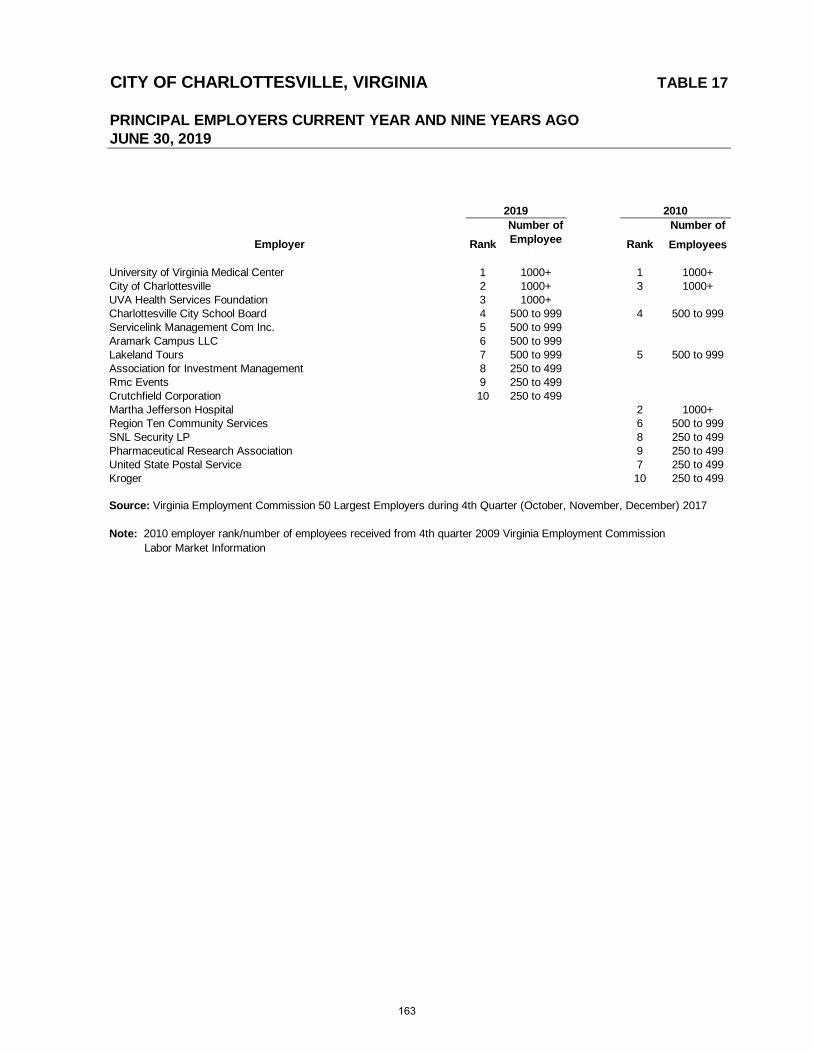
CITY OF CHARLOTTESVILLE, VIRGINIA TABLE 17
PRINCIPAL EMPLOYERS CURRENT YEAR AND NINE YEARS AGOJUNE 30, 2019
Employer Rank
Number of Employee
sRank
Number of
Employees
University of Virginia Medical Center 1 1000+ 1 1000+City of Charlottesville 2 1000+ 3 1000+UVA Health Services Foundation 3 1000+Charlottesville City School Board 4 500 to 999 4 500 to 999Servicelink Management Com Inc. 5 500 to 999Aramark Campus LLC 6 500 to 999Lakeland Tours 7 500 to 999 5 500 to 999Association for Investment Management 8 250 to 499Rmc Events 9 250 to 499Crutchfield Corporation 10 250 to 499Martha Jefferson Hospital 2 1000+Region Ten Community Services 6 500 to 999SNL Security LP 8 250 to 499Pharmaceutical Research Association 9 250 to 499United State Postal Service 7 250 to 499Kroger 10 250 to 499
Source: Virginia Employment Commission 50 Largest Employers during 4th Quarter (October, November, December) 2017
Note: 2010 employer rank/number of employees received from 4th quarter 2009 Virginia Employment Commission Labor Market Information
2019 2010
163
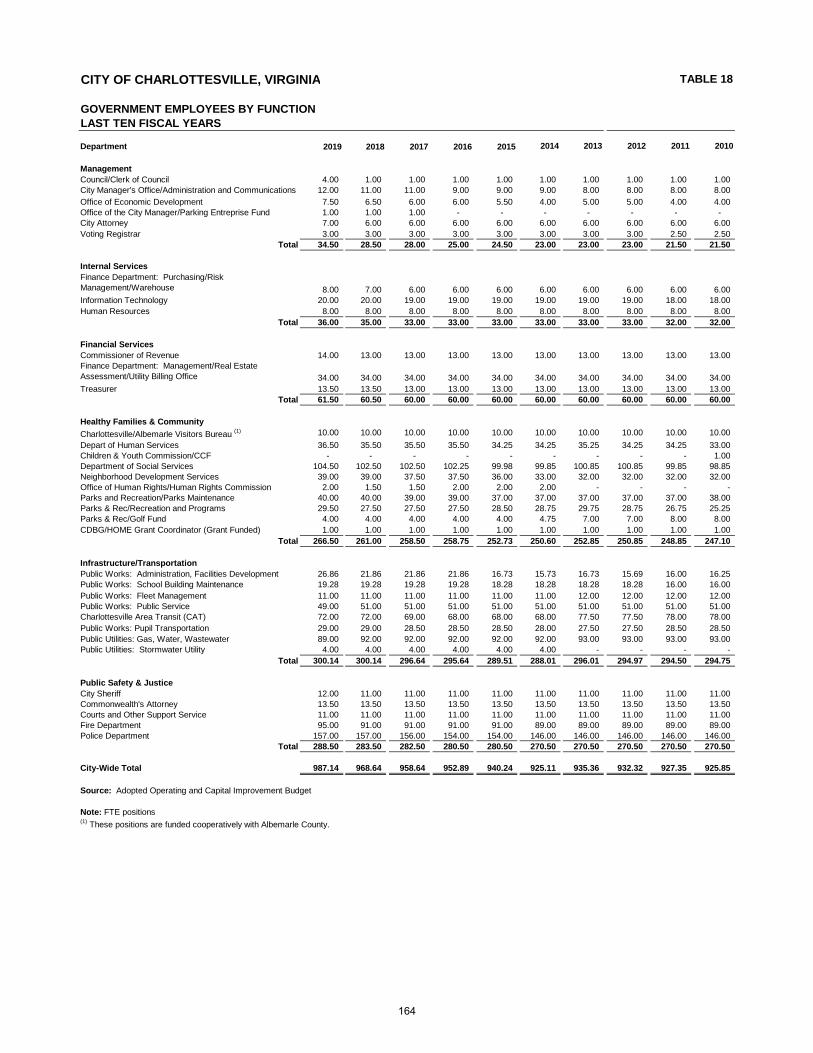
CITY OF CHARLOTTESVILLE, VIRGINIA
GOVERNMENT EMPLOYEES BY FUNCTIONLAST TEN FISCAL YEARS
Department 2019 2018 2017 2016 2015 2014 2013 2012 2011 2010
ManagementCouncil/Clerk of Council 4.00 1.00 1.00 1.00 1.00 1.00 1.00 1.00 1.00 1.00 City Manager's Office/Administration and Communications 12.00 11.00 11.00 9.00 9.00 9.00 8.00 8.00 8.00 8.00
Office of Economic Development 7.50 6.50 6.00 6.00 5.50 4.00 5.00 5.00 4.00 4.00 Office of the City Manager/Parking Entreprise Fund 1.00 1.00 1.00 - - - - - - - City Attorney 7.00 6.00 6.00 6.00 6.00 6.00 6.00 6.00 6.00 6.00 Voting Registrar 3.00 3.00 3.00 3.00 3.00 3.00 3.00 3.00 2.50 2.50
Total 34.50 28.50 28.00 25.00 24.50 23.00 23.00 23.00 21.50 21.50
Internal ServicesFinance Department: Purchasing/Risk Management/Warehouse 8.00 7.00 6.00 6.00 6.00 6.00 6.00 6.00 6.00 6.00 Information Technology 20.00 20.00 19.00 19.00 19.00 19.00 19.00 19.00 18.00 18.00 Human Resources 8.00 8.00 8.00 8.00 8.00 8.00 8.00 8.00 8.00 8.00
Total 36.00 35.00 33.00 33.00 33.00 33.00 33.00 33.00 32.00 32.00
Financial ServicesCommissioner of Revenue 14.00 13.00 13.00 13.00 13.00 13.00 13.00 13.00 13.00 13.00 Finance Department: Management/Real Estate Assessment/Utility Billing Office 34.00 34.00 34.00 34.00 34.00 34.00 34.00 34.00 34.00 34.00 Treasurer 13.50 13.50 13.00 13.00 13.00 13.00 13.00 13.00 13.00 13.00
Total 61.50 60.50 60.00 60.00 60.00 60.00 60.00 60.00 60.00 60.00
Healthy Families & Community
Charlottesville/Albemarle Visitors Bureau (1) 10.00 10.00 10.00 10.00 10.00 10.00 10.00 10.00 10.00 10.00
Depart of Human Services 36.50 35.50 35.50 35.50 34.25 34.25 35.25 34.25 34.25 33.00 Children & Youth Commission/CCF - - - - - - - - - 1.00 Department of Social Services 104.50 102.50 102.50 102.25 99.98 99.85 100.85 100.85 99.85 98.85 Neighborhood Development Services 39.00 39.00 37.50 37.50 36.00 33.00 32.00 32.00 32.00 32.00 Office of Human Rights/Human Rights Commission 2.00 1.50 1.50 2.00 2.00 2.00 - - - -Parks and Recreation/Parks Maintenance 40.00 40.00 39.00 39.00 37.00 37.00 37.00 37.00 37.00 38.00 Parks & Rec/Recreation and Programs 29.50 27.50 27.50 27.50 28.50 28.75 29.75 28.75 26.75 25.25 Parks & Rec/Golf Fund 4.00 4.00 4.00 4.00 4.00 4.75 7.00 7.00 8.00 8.00 CDBG/HOME Grant Coordinator (Grant Funded) 1.00 1.00 1.00 1.00 1.00 1.00 1.00 1.00 1.00 1.00
Total 266.50 261.00 258.50 258.75 252.73 250.60 252.85 250.85 248.85 247.10
Infrastructure/TransportationPublic Works: Administration, Facilities Development 26.86 21.86 21.86 21.86 16.73 15.73 16.73 15.69 16.00 16.25 Public Works: School Building Maintenance 19.28 19.28 19.28 19.28 18.28 18.28 18.28 18.28 16.00 16.00 Public Works: Fleet Management 11.00 11.00 11.00 11.00 11.00 11.00 12.00 12.00 12.00 12.00 Public Works: Public Service 49.00 51.00 51.00 51.00 51.00 51.00 51.00 51.00 51.00 51.00 Charlottesville Area Transit (CAT) 72.00 72.00 69.00 68.00 68.00 68.00 77.50 77.50 78.00 78.00 Public Works: Pupil Transportation 29.00 29.00 28.50 28.50 28.50 28.00 27.50 27.50 28.50 28.50 Public Utilities: Gas, Water, Wastewater 89.00 92.00 92.00 92.00 92.00 92.00 93.00 93.00 93.00 93.00 Public Utilities: Stormwater Utility 4.00 4.00 4.00 4.00 4.00 4.00 - - - -
Total 300.14 300.14 296.64 295.64 289.51 288.01 296.01 294.97 294.50 294.75
Public Safety & JusticeCity Sheriff 12.00 11.00 11.00 11.00 11.00 11.00 11.00 11.00 11.00 11.00 Commonwealth's Attorney 13.50 13.50 13.50 13.50 13.50 13.50 13.50 13.50 13.50 13.50 Courts and Other Support Service 11.00 11.00 11.00 11.00 11.00 11.00 11.00 11.00 11.00 11.00 Fire Department 95.00 91.00 91.00 91.00 91.00 89.00 89.00 89.00 89.00 89.00 Police Department 157.00 157.00 156.00 154.00 154.00 146.00 146.00 146.00 146.00 146.00
Total 288.50 283.50 282.50 280.50 280.50 270.50 270.50 270.50 270.50 270.50
City-Wide Total 987.14 968.64 958.64 952.89 940.24 925.11 935.36 932.32 927.35 925.85
Source: Adopted Operating and Capital Improvement Budget
Note: FTE positions(1) These positions are funded cooperatively with Albemarle County.
TABLE 18
164
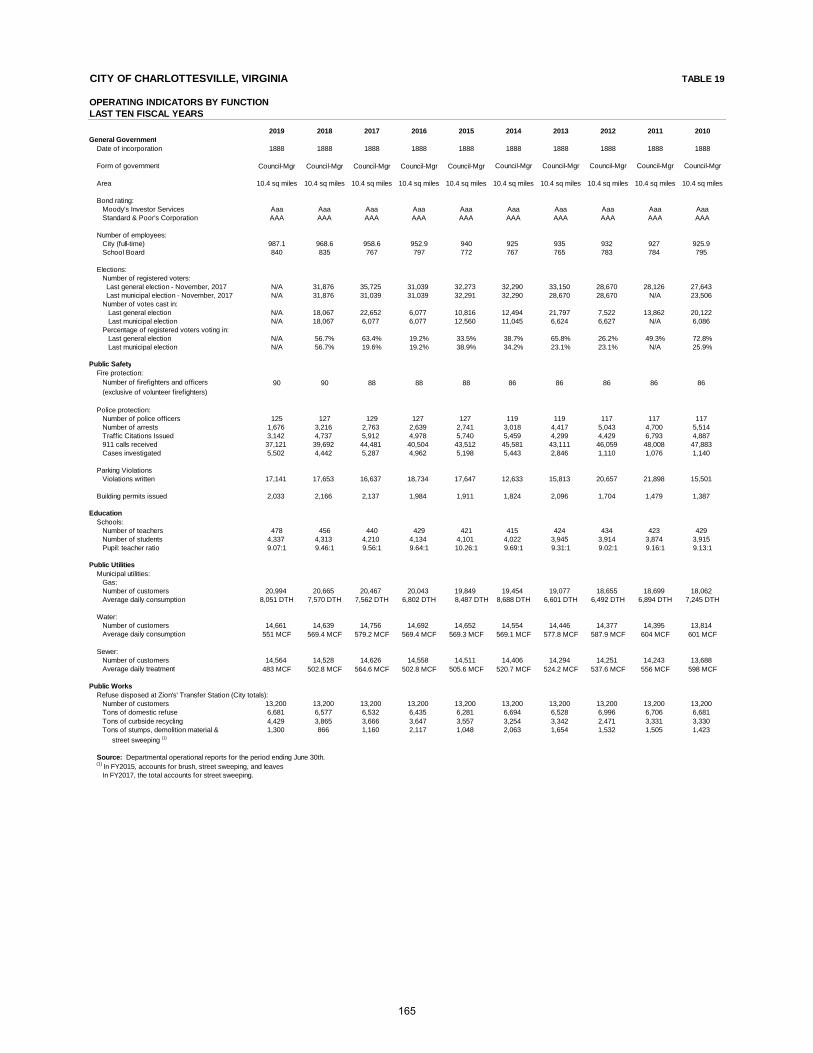
CITY OF CHARLOTTESVILLE, VIRGINIA TABLE 19
OPERATING INDICATORS BY FUNCTIONLAST TEN FISCAL YEARS
2019 2018 2017 2016 2015 2014 2013 2012 2011 2010General Government
Date of incorporation 1888 1888 1888 1888 1888 1888 1888 1888 1888 1888
Form of government Council-Mgr Council-Mgr Council-Mgr Council-Mgr Council-Mgr Council-Mgr Council-Mgr Council-Mgr Council-Mgr Council-Mgr
Area 10.4 sq miles 10.4 sq miles 10.4 sq miles 10.4 sq miles 10.4 sq miles 10.4 sq miles 10.4 sq miles 10.4 sq miles 10.4 sq miles 10.4 sq miles
Bond rating: Moody's Investor Services Aaa Aaa Aaa Aaa Aaa Aaa Aaa Aaa Aaa Aaa Standard & Poor's Corporation AAA AAA AAA AAA AAA AAA AAA AAA AAA AAA
Number of employees: City (full-time) 987.1 968.6 958.6 952.9 940 925 935 932 927 925.9 School Board 840 835 767 797 772 767 765 783 784 795
Elections: Number of registered voters: Last general election - November, 2017 N/A 31,876 35,725 31,039 32,273 32,290 33,150 28,670 28,126 27,643 Last municipal election - November, 2017 N/A 31,876 31,039 31,039 32,291 32,290 28,670 28,670 N/A 23,506 Number of votes cast in: Last general election N/A 18,067 22,652 6,077 10,816 12,494 21,797 7,522 13,862 20,122 Last municipal election N/A 18,067 6,077 6,077 12,560 11,045 6,624 6,627 N/A 6,086 Percentage of registered voters voting in: Last general election N/A 56.7% 63.4% 19.2% 33.5% 38.7% 65.8% 26.2% 49.3% 72.8% Last municipal election N/A 56.7% 19.6% 19.2% 38.9% 34.2% 23.1% 23.1% N/A 25.9%
Public SafetyFire protection: Number of firefighters and officers 90 90 88 88 88 86 86 86 86 86 (exclusive of volunteer firefighters)
Police protection: Number of police officers 125 127 129 127 127 119 119 117 117 117 Number of arrests 1,676 3,216 2,763 2,639 2,741 3,018 4,417 5,043 4,700 5,514 Traffic Citations Issued 3,142 4,737 5,912 4,978 5,740 5,459 4,299 4,429 6,793 4,887 911 calls received 37,121 39,692 44,481 40,504 43,512 45,581 43,111 46,059 48,008 47,883 Cases investigated 5,502 4,442 5,287 4,962 5,198 5,443 2,846 1,110 1,076 1,140
Parking Violations Violations written 17,141 17,653 16,637 18,734 17,647 12,633 15,813 20,657 21,898 15,501
Building permits issued 2,033 2,166 2,137 1,984 1,911 1,824 2,096 1,704 1,479 1,387
EducationSchools: Number of teachers 478 456 440 429 421 415 424 434 423 429 Number of students 4,337 4,313 4,210 4,134 4,101 4,022 3,945 3,914 3,874 3,915 Pupil: teacher ratio 9.07:1 9.46:1 9.56:1 9.64:1 10.26:1 9.69:1 9.31:1 9.02:1 9.16:1 9.13:1
Public UtilitiesMunicipal utilities: Gas: Number of customers 20,994 20,665 20,467 20,043 19,849 19,454 19,077 18,655 18,699 18,062 Average daily consumption 8,051 DTH 7,570 DTH 7,562 DTH 6,802 DTH 8,487 DTH 8,688 DTH 6,601 DTH 6,492 DTH 6,894 DTH 7,245 DTH
Water: Number of customers 14,661 14,639 14,756 14,692 14,652 14,554 14,446 14,377 14,395 13,814 Average daily consumption 551 MCF 569.4 MCF 579.2 MCF 569.4 MCF 569.3 MCF 569.1 MCF 577.8 MCF 587.9 MCF 604 MCF 601 MCF
Sewer: Number of customers 14,564 14,528 14,626 14,558 14,511 14,406 14,294 14,251 14,243 13,688 Average daily treatment 483 MCF 502.8 MCF 564.6 MCF 502.8 MCF 505.6 MCF 520.7 MCF 524.2 MCF 537.6 MCF 556 MCF 598 MCF
Public WorksRefuse disposed at Zion's' Transfer Station (City totals): Number of customers 13,200 13,200 13,200 13,200 13,200 13,200 13,200 13,200 13,200 13,200 Tons of domestic refuse 6,681 6,577 6,532 6,435 6,281 6,694 6,528 6,996 6,706 6,681 Tons of curbside recycling 4,429 3,865 3,666 3,647 3,557 3,254 3,342 2,471 3,331 3,330
1,300 866 1,160 2,117 1,048 2,063 1,654 1,532 1,505 1,423
Source: Departmental operational reports for the period ending June 30th. (1) In FY2015, accounts for brush, street sweeping, and leaves In FY2017, the total accounts for street sweeping.
Tons of stumps, demolition material &
street sweeping (1)
165
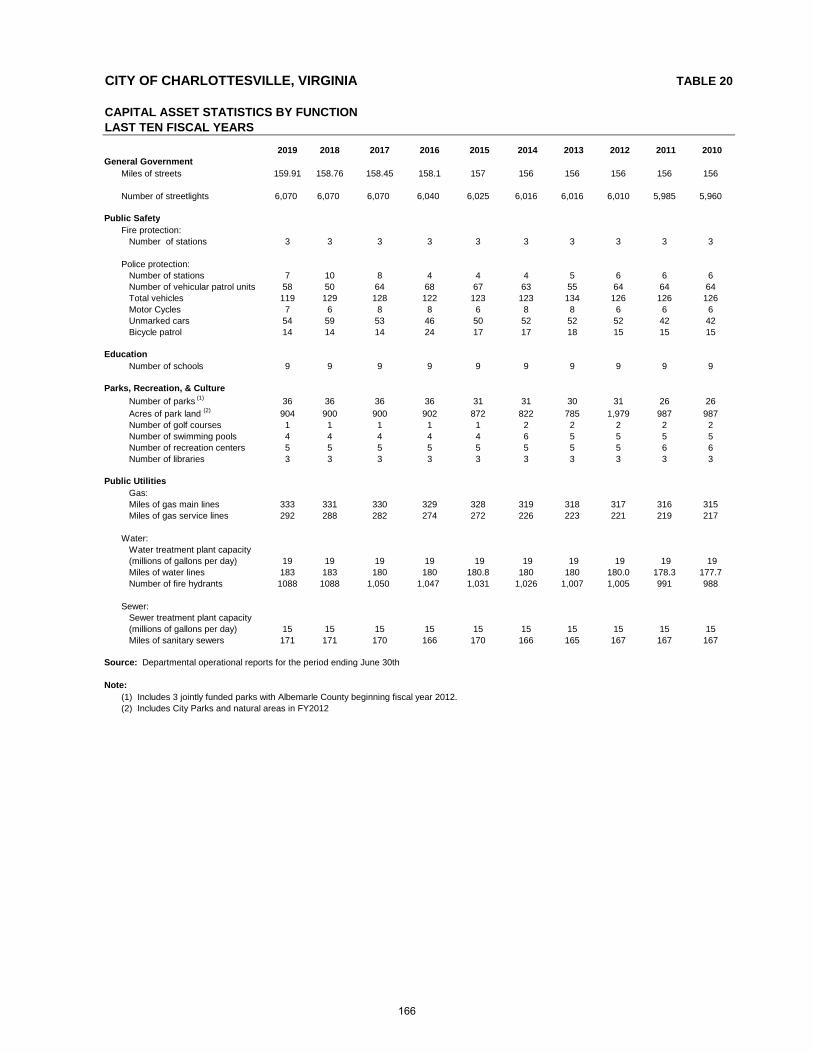
CITY OF CHARLOTTESVILLE, VIRGINIA
CAPITAL ASSET STATISTICS BY FUNCTIONLAST TEN FISCAL YEARS
2019 2018 2017 2016 2015 2014 2013 2012 2011 2010General Government
Miles of streets 159.91 158.76 158.45 158.1 157 156 156 156 156 156
Number of streetlights 6,070 6,070 6,070 6,040 6,025 6,016 6,016 6,010 5,985 5,960
Public SafetyFire protection: Number of stations 3 3 3 3 3 3 3 3 3 3
Police protection: Number of stations 7 10 8 4 4 4 5 6 6 6 Number of vehicular patrol units 58 50 64 68 67 63 55 64 64 64 Total vehicles 119 129 128 122 123 123 134 126 126 126 Motor Cycles 7 6 8 8 6 8 8 6 6 6 Unmarked cars 54 59 53 46 50 52 52 52 42 42 Bicycle patrol 14 14 14 24 17 17 18 15 15 15
Education Number of schools 9 9 9 9 9 9 9 9 9 9
Parks, Recreation, & Culture
Number of parks (1) 36 36 36 36 31 31 30 31 26 26 Acres of park land (2) 904 900 900 902 872 822 785 1,979 987 987 Number of golf courses 1 1 1 1 1 2 2 2 2 2 Number of swimming pools 4 4 4 4 4 6 5 5 5 5 Number of recreation centers 5 5 5 5 5 5 5 5 6 6 Number of libraries 3 3 3 3 3 3 3 3 3 3
Public Utilities Gas: Miles of gas main lines 333 331 330 329 328 319 318 317 316 315 Miles of gas service lines 292 288 282 274 272 226 223 221 219 217
Water: Water treatment plant capacity (millions of gallons per day) 19 19 19 19 19 19 19 19 19 19 Miles of water lines 183 183 180 180 180.8 180 180 180.0 178.3 177.7 Number of fire hydrants 1088 1088 1,050 1,047 1,031 1,026 1,007 1,005 991 988
Sewer: Sewer treatment plant capacity (millions of gallons per day) 15 15 15 15 15 15 15 15 15 15 Miles of sanitary sewers 171 171 170 166 170 166 165 167 167 167
Note:(1) Includes 3 jointly funded parks with Albemarle County beginning fiscal year 2012.(2) Includes City Parks and natural areas in FY2012
Source: Departmental operational reports for the period ending June 30th
TABLE 20
166
SINGLE AUDIT REPORT
For the Year Ended June 30, 2019
CITY OF CHARLOTTESVILLE, VIRGINIA
TABLE OF CONTENTS
Independent Auditor’s Report on Internal Control over Financial Reporting and on Complianceand Other Matters Based on an Audit of Financial Statements Performed in Accordance
with Government Auditing Standards ....................................................................................................3
Independent Auditor’s Report on Compliance for Each Major Program and on Internal Control Over Compliance Required by the Uniform Guidance .................................................................... 5
Schedule of Expenditures of Federal Awards ..................................................................................................8
Notes to the Schedule of Expenditures of Federal Awards............................................................................10
Summary of Compliance Matters ........................................................................................................................ 12
Schedule of Findings and Questioned Costs ....................................................................................................... 13
Summary Schedule of Prior Audit Findings ....................................................................................................... 16
3Your Success is Our Focus
319 McClanahan Street, S.W. • Roanoke, Virginia 24014-7705 • 540-345-0936 • Fax: 540-342-6181 • www.BEcpas.com
INDEPENDENT AUDITOR’S REPORT ON INTERNAL CONTROL OVER FINANCIAL REPORTING AND ON COMPLIANCE AND OTHER MATTERS BASED ON AN AUDIT
OF FINANCIAL STATEMENTS PERFORMED IN ACCORDANCE WITHGOVERNMENT AUDITING STANDARDS
To the Honorable Members of the City Council City of Charlottesville, Virginia
We have audited, in accordance with the auditing standards generally accepted in the United States of America; the standards applicable to financial audits contained in Government Auditing Standards, issued by the Comptroller General of the United States; the Specifications for Audits of Counties, Cities, and Towns, and the Specifications for Audits of Authorities, Boards, and Commissions, issued by the Auditor of Public Accounts of the Commonwealth of Virginia, the financial statements, the governmental activities, the business-type activities, the aggregate discretely presented component units, each major fund, and the aggregate remaining fund information of the City of Charlottesville, Virginia (the “City”), as of and for the year ended June 30, 2019 and the related notes to the financial statements which collectively comprise the City’s basic financial statements, and have issued our report thereon dated, November 22, 2019.
Internal Control over Financial Reporting
In planning and performing our audit of the financial statements, we considered the City’s internal control over financial reporting (internal control) to determine the audit procedures that are appropriate in the circumstances for the purpose of expressing our opinions on the financial statements, but not for the purpose of expressing an opinion on the effectiveness of the City’s internal control. Accordingly, we do not express an opinion on the effectiveness of the City’s internal control.
A deficiency in internal control exists when the design or operation of a control does not allow management or employees, in the normal course of performing their assigned functions, to prevent, or detect and correct, misstatements on a timely basis. A material weakness is a deficiency, or a combination of deficiencies, in internal control, such that there is a reasonable possibility that a material misstatement of the entity’s financial statements will not be prevented, or detected and corrected on a timely basis. A significant deficiency is a deficiency, or a combination of deficiencies, in internal control that is less severe than a material weakness, yet important enough to merit attention by those charged with governance.
Our consideration of internal control was for the limited purpose described in the first paragraph of this section and was not designed to identify all deficiencies in internal control that might be material weaknesses or significant deficiencies may exist that were not identified. Given these limitations, during our audit we did not identify any deficiencies in internal control that we consider to be material weaknesses. However, material weaknesses may exist that have not been identified.
4
Compliance and Other Matters
As part of obtaining reasonable assurance about whether the City’s financial statements are free frommaterial misstatement, we performed tests of its compliance with certain provisions of laws, regulations, contracts, and grant agreements, noncompliance with which could have a direct and material effect on the determination of financial statement amounts. However, providing an opinion on compliance with those provisions was not an objective of our audit and, accordingly, we do not express such an opinion. The results of our tests disclosed instances of noncompliance that are required to be reported under Government Auditing Standards and which are described at Items 2019-002, 2018-001, 2018-002, and 2018-003 in the accompanying schedule of findings and questioned costs.
City of Charlottesville’s Response to Findings
The City’s responses to the findings identified in our audit are described in the accompanying schedule of findings and questioned costs. The City’s responses were not subjected to the auditing procedures applied in the audit of the financial statements and, accordingly, we express no opinion on them.
Purpose of this Report
The purpose of this report is solely to describe the scope of our testing of internal control and compliance and the results of that testing, and not to provide an opinion on the effectiveness of the entity’s internal control or on compliance. This report is an integral part of an audit performed in accordance with Government Auditing Standards in considering the City’s internal control and compliance. Accordingly, this communication is not suitable for any other purpose.
CERTIFIED PUBLIC ACCOUNTANTS
Roanoke, VirginiaNovember 22, 2019
5Your Success is Our Focus
319 McClanahan Street, S.W. • Roanoke, Virginia 24014-7705 • 540-345-0936 • Fax: 540-342-6181 • www.BEcpas.com
INDEPENDENT AUDITOR’S REPORT ON COMPLIANCE FOR EACH MAJOR PROGRAM AND ON INTERNAL CONTROL OVER
COMPLIANCE REQUIRED BY THE UNIFORM GUIDANCE
To the Honorable Members of the City Council Charlottesville, Virginia
Report on Compliance for Each Major Federal Program
We have audited the City of Charlottesville, Virginia’s (the “City’s”) compliance with the types of compliance requirements described in the OMB Compliance Supplement that could have a direct and material effect on the City’s major federal programs for the year ended June 30, 2019. The City’s major federal programs are identified in the summary of auditor’s results section of the accompanying schedule of findings and questioned costs.
Management’s Responsibility
Management is responsible for compliance with federal statutes, regulations, and the terms and conditions of its federal awards applicable to its federal programs.
Auditor’s Responsibility
Our responsibility is to express an opinion on compliance for each of the City’s major federal programs based on our audit of the types of compliance requirements referred to above. We conducted our audit of compliance in accordance with auditing standards generally accepted in the United States of America; the standards applicable to financial audits contained in Government Auditing Standards, issued by the Comptroller General of the United States; and the audit requirements of Title 2 U.S. Code of Federal Regulations Part 200, Uniform Administrative Requirements, Cost Principles, and Audit Requirements for Federal Awards (Uniform Guidance). Those standards and the Uniform Guidance require that we plan and perform the audit to obtain reasonable assurance about whether noncompliance with the types of compliance requirements referred to above that could have a direct and material effect on a major federal program occurred. An audit includes examining, on a test basis, evidence about the City’s compliance with those requirements and performing such other procedures as we considered necessary in the circumstances.
We believe that our audit provides a reasonable basis for our opinion on compliance for each major federal program. However, our audit does not provide a legal determination of the City’s compliance.
(Continued)6
Report on Compliance for Each Major Federal Program (Continued)
Opinion on Each Major Federal Program
In our opinion, the City complied, in all material respects, with the types of compliance requirements referred to above that could have a direct and material effect on each of its major federal programs for the year ended June 30, 2019.
Other Matters
The results of our auditing procedures disclosed an instance of noncompliance that is required to be reported in accordance with the Uniform Guidance and which is described in the accompanying schedule of findings and questioned costs as item 2019-001. Our opinion on each major federal program is not modified with respect to this matter.
The City’s response to the findings identified in our audit is described in the accompanying schedule of findings and questioned costs. The City’s response was not subjected to the auditing procedures applied in the audit of the financial statements and, accordingly, we express no opinion the response.
Report on Internal Control over Compliance
Management of the City is responsible for establishing and maintaining effective internal control over compliance with the types of compliance requirements referred to above. In planning and performing our audit of compliance, we considered the City’s internal control over compliance with the types of requirements that could have a direct and material effect on each major federal program to determine the auditing procedures that are appropriate in the circumstances for the purpose of expressing an opinion on compliance for each major federal program and to test and report on internal control over compliance in accordance with the Uniform Guidance, but not for the purpose of expressing an opinion on the effectiveness of internal control over compliance. Accordingly, we do not express an opinion on the effectiveness of the City’s internal control over compliance.
A deficiency in internal control over compliance exists when the design or operation of a control over compliance does not allow management or employees, in the normal course of performing their assigned functions, to prevent, or detect and correct, noncompliance with a type of compliance requirement of a federal program on a timely basis. A material weakness in internal control over compliance is a deficiency, or a combination of deficiencies, in internal control over compliance, such that there is a reasonable possibility that material noncompliance with a type of compliance requirement of a federal program will not be prevented, or detected and corrected, on a timely basis. A significant deficiency in internal control over compliance is a deficiency, or a combination of deficiencies, in internal control over compliance with a type of compliance requirement of a federal program that is less severe than a material weakness in internal control over compliance, yet important enough to merit attention by those charged with governance.
Our consideration of internal control over compliance was for the limited purpose described in the firstparagraph of this section, and was not designed to identify all deficiencies in internal control over compliance that might be material weaknesses or significant deficiencies. We did not identify any deficiencies in internal control over compliance that we consider to be material weaknesses. However, material weaknesses may exist that have not been identified.
(Continued)7
Report on Schedule of Expenditures of Federal Awards Required by the Uniform Guidance
We have audited the financial statements of the governmental activities, the business-type activities, the aggregate discretely presented component units, each major fund, and the aggregate remaining fund information of the City, as of and for the year ended June 30, 2019, and the related notes to the financial statements, which collectively comprise the City’s basic financial statements. We issued our report thereon dated November 22, 2019, which contained unmodified opinions on those financial statements. Our audit was conducted for the purpose of forming opinions on the financial statements that collectively comprise the basic financial statements. The accompanying schedule of expenditures of federal awards is presented for purposes of additional analysis as required by the Uniform Guidance and is not a required part of the basic financial statements. Such information is the responsibility of management and was derived from and relates directly to the underlying accounting and other records used to prepare the basic financial statements. The information has been subjected to the auditing procedures applied in the audit of the financial statements and certain additional procedures, including comparing and reconciling such information directly to the underlying accounting and other records used to prepare the basic financial statements or to the basic financial statements themselves, and other additional procedures in accordance with auditing standards generally accepted in the United States of America. In our opinion, the schedule of expenditures of federal awards is fairly stated in all material respects in relation to the basic financial statements as a whole.
The purpose of this report on internal control over compliance is solely to describe the scope of our testing of internal control over compliance and the results of that testing based on the requirements of the Uniform Guidance. Accordingly, this report is not suitable for any other purpose.
CERTIFIED PUBLIC ACCOUNTANTS
Roanoke, VirginiaNovember 22, 2019
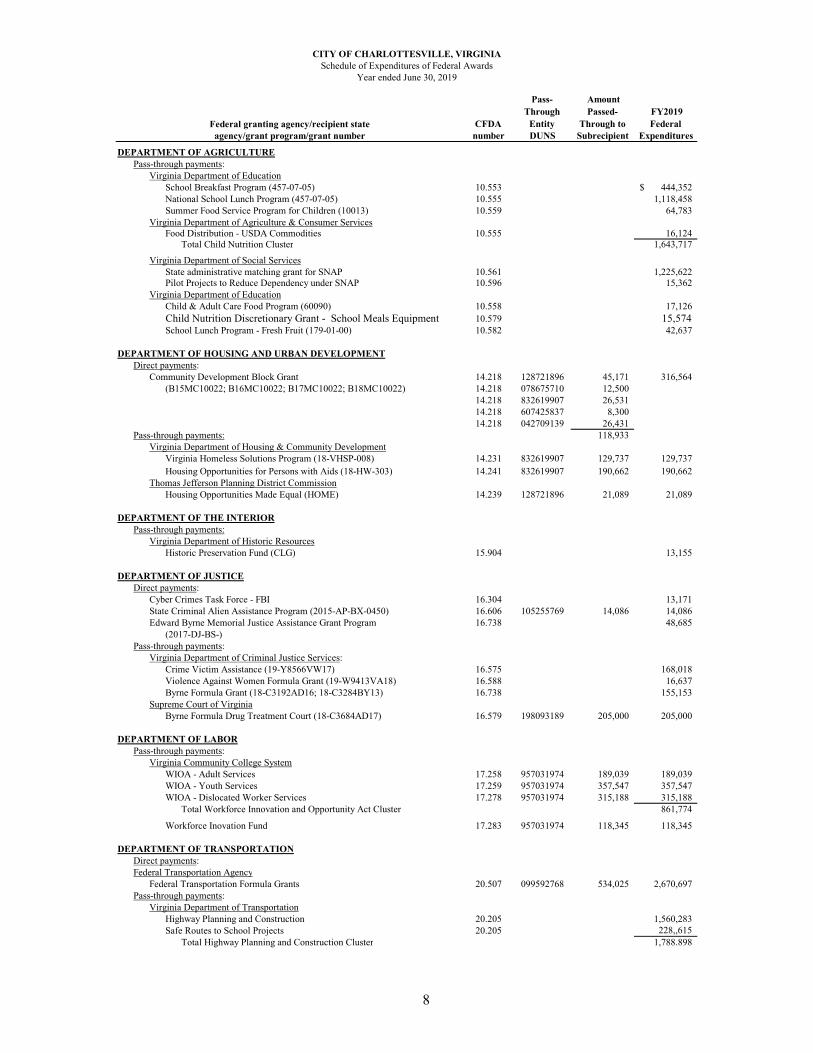
CFDA
Pass-Through
Entity
Amount Passed-
Through to FY2019 Federal
number DUNS Subrecipient Expenditures
DEPARTMENT OF AGRICULTUREPass-through payments:
Virginia Department of EducationSchool Breakfast Program (457-07-05) 10.553 444,352$ National School Lunch Program (457-07-05) 10.555 1,118,458 Summer Food Service Program for Children (10013) 10.559 64,783
Virginia Department of Agriculture & Consumer ServicesFood Distribution - USDA Commodities 10.555 16,124
Total Child Nutrition Cluster 1,643,717
Virginia Department of Social ServicesState administrative matching grant for SNAP 10.561 1,225,622 Pilot Projects to Reduce Dependency under SNAP 10.596 15,362
Virginia Department of EducationChild & Adult Care Food Program (60090) 10.558 17,126 Child Nutrition Discretionary Grant - School Meals Equipment 10.579 15,574 School Lunch Program - Fresh Fruit (179-01-00) 10.582 42,637
DEPARTMENT OF HOUSING AND URBAN DEVELOPMENTDirect payments:
Community Development Block Grant 14.218 128721896 45,171 316,564 (B15MC10022; B16MC10022; B17MC10022; B18MC10022) 14.218 078675710 12,500
14.218 832619907 26,531 14.218 607425837 8,300 14.218 042709139 26,431
Pass-through payments: 118,933 Virginia Department of Housing & Community Development
Virginia Homeless Solutions Program (18-VHSP-008) 14.231 832619907 129,737 129,737 Housing Opportunities for Persons with Aids (18-HW-303) 14.241 832619907 190,662 190,662
Thomas Jefferson Planning District CommissionHousing Opportunities Made Equal (HOME) 14.239 128721896 21,089 21,089
DEPARTMENT OF THE INTERIORPass-through payments:
Virginia Department of Historic ResourcesHistoric Preservation Fund (CLG) 15.904 13,155
DEPARTMENT OF JUSTICEDirect payments:
Cyber Crimes Task Force - FBI 16.304 13,171 State Criminal Alien Assistance Program (2015-AP-BX-0450) 16.606 105255769 14,086 14,086 Edward Byrne Memorial Justice Assistance Grant Program 16.738 48,685
(2017-DJ-BS-)Pass-through payments:
Virginia Department of Criminal Justice Services:Crime Victim Assistance (19-Y8566VW17) 16.575 168,018 Violence Against Women Formula Grant (19-W9413VA18) 16.588 16,637 Byrne Formula Grant (18-C3192AD16; 18-C3284BY13) 16.738 155,153
Supreme Court of VirginiaByrne Formula Drug Treatment Court (18-C3684AD17) 16.579 198093189 205,000 205,000
DEPARTMENT OF LABORPass-through payments:
Virginia Community College SystemWIOA - Adult Services 17.258 957031974 189,039 189,039 WIOA - Youth Services 17.259 957031974 357,547 357,547 WIOA - Dislocated Worker Services 17.278 957031974 315,188 315,188
Total Workforce Innovation and Opportunity Act Cluster 861,774
Workforce Inovation Fund 17.283 957031974 118,345 118,345
DEPARTMENT OF TRANSPORTATIONDirect payments:Federal Transportation Agency
Federal Transportation Formula Grants 20.507 099592768 534,025 2,670,697 Pass-through payments:
Virginia Department of TransportationHighway Planning and Construction 20.205 1,560,283Safe Routes to School Projects 20.205 228,,615
Total Highway Planning and Construction Cluster 1,788.898
Federal granting agency/recipient stateagency/grant program/grant number
CITY OF CHARLOTTESVILLE, VIRGINIASchedule of Expenditures of Federal Awards
Year ended June 30, 2019
8
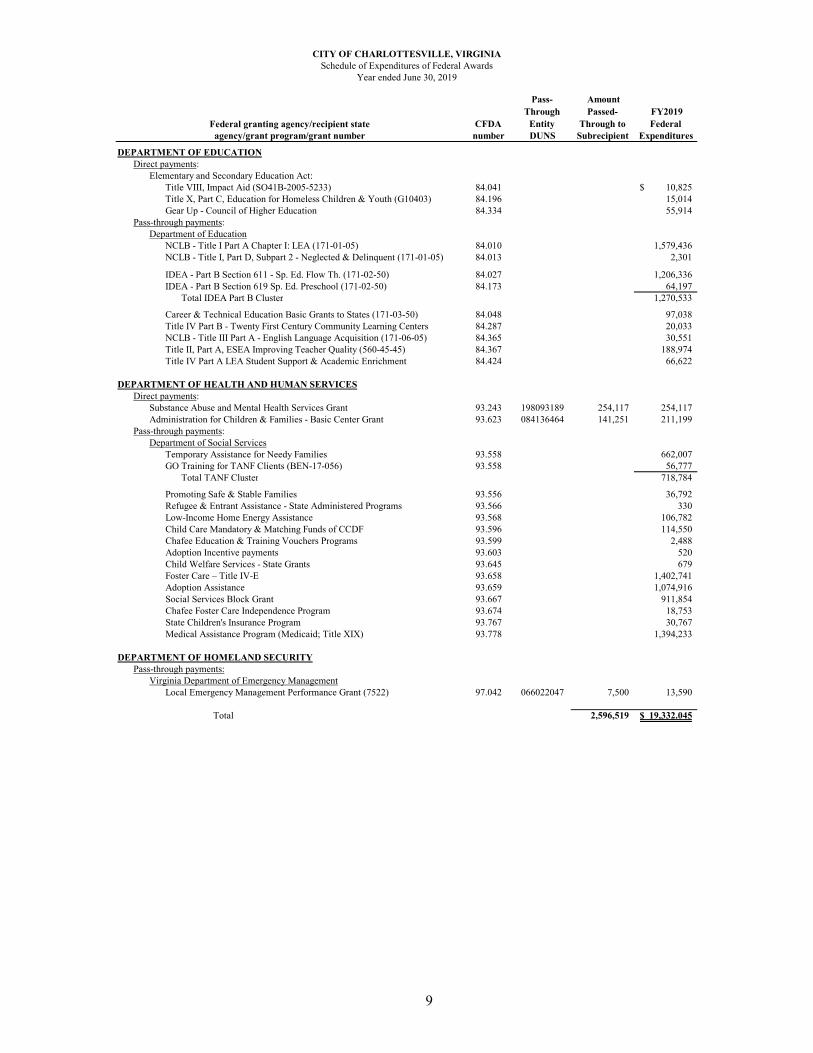
CFDA
Pass-Through
Entity
Amount Passed-
Through to FY2019 Federal
number DUNS Subrecipient ExpendituresFederal granting agency/recipient state
agency/grant program/grant number
CITY OF CHARLOTTESVILLE, VIRGINIASchedule of Expenditures of Federal Awards
Year ended June 30, 2019
DEPARTMENT OF EDUCATIONDirect payments:
Elementary and Secondary Education Act:Title VIII, Impact Aid (SO41B-2005-5233) 84.041 10,825$ Title X, Part C, Education for Homeless Children & Youth (G10403) 84.196 15,014 Gear Up - Council of Higher Education 84.334 55,914
Pass-through payments:Department of Education
NCLB - Title I Part A Chapter I: LEA (171-01-05) 84.010 1,579,436 NCLB - Title I, Part D, Subpart 2 - Neglected & Delinquent (171-01-05) 84.013 2,301
IDEA - Part B Section 611 - Sp. Ed. Flow Th. (171-02-50) 84.027 1,206,336 IDEA - Part B Section 619 Sp. Ed. Preschool (171-02-50) 84.173 64,197
Total IDEA Part B Cluster 1,270,533
Career & Technical Education Basic Grants to States (171-03-50) 84.048 97,038 Title IV Part B - Twenty First Century Community Learning Centers 84.287 20,033 NCLB - Title III Part A - English Language Acquisition (171-06-05) 84.365 30,551 Title II, Part A, ESEA Improving Teacher Quality (560-45-45) 84.367 188,974 Title IV Part A LEA Student Support & Academic Enrichment 84.424 66,622
DEPARTMENT OF HEALTH AND HUMAN SERVICESDirect payments:
Substance Abuse and Mental Health Services Grant 93.243 198093189 254,117 254,117 Administration for Children & Families - Basic Center Grant 93.623 084136464 141,251 211,199
Pass-through payments:Department of Social Services
Temporary Assistance for Needy Families 93.558 662,007 GO Training for TANF Clients (BEN-17-056) 93.558 56,777
Total TANF Cluster 718,784
Promoting Safe & Stable Families 93.556 36,792 Refugee & Entrant Assistance - State Administered Programs 93.566 330Low-Income Home Energy Assistance 93.568 106,782 Child Care Mandatory & Matching Funds of CCDF 93.596 114,550 Chafee Education & Training Vouchers Programs 93.599 2,488 Adoption Incentive payments 93.603 520Child Welfare Services - State Grants 93.645 679Foster Care – Title IV-E 93.658 1,402,741 Adoption Assistance 93.659 1,074,916 Social Services Block Grant 93.667 911,854 Chafee Foster Care Independence Program 93.674 18,753 State Children's Insurance Program 93.767 30,767 Medical Assistance Program (Medicaid; Title XIX) 93.778 1,394,233
DEPARTMENT OF HOMELAND SECURITYPass-through payments:
Virginia Department of Emergency ManagementLocal Emergency Management Performance Grant (7522) 97.042 066022047 7,500 13,590
Total 2,596,519 $ 19,332.045
9
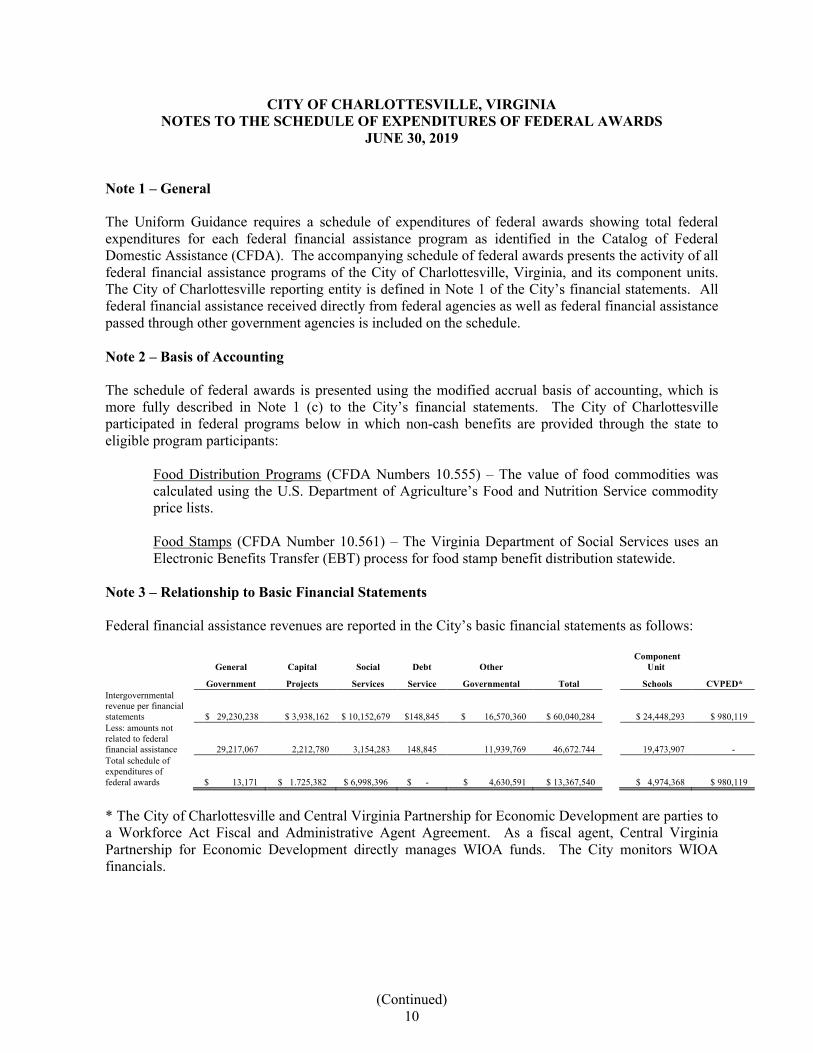
(Continued)10
CITY OF CHARLOTTESVILLE, VIRGINIANOTES TO THE SCHEDULE OF EXPENDITURES OF FEDERAL AWARDS
JUNE 30, 2019
Note 1 – General
The Uniform Guidance requires a schedule of expenditures of federal awards showing total federal expenditures for each federal financial assistance program as identified in the Catalog of Federal Domestic Assistance (CFDA). The accompanying schedule of federal awards presents the activity of all federal financial assistance programs of the City of Charlottesville, Virginia, and its component units. The City of Charlottesville reporting entity is defined in Note 1 of the City’s financial statements. All federal financial assistance received directly from federal agencies as well as federal financial assistance passed through other government agencies is included on the schedule.
Note 2 – Basis of Accounting
The schedule of federal awards is presented using the modified accrual basis of accounting, which is more fully described in Note 1 (c) to the City’s financial statements. The City of Charlottesville participated in federal programs below in which non-cash benefits are provided through the state to eligible program participants:
Food Distribution Programs (CFDA Numbers 10.555) – The value of food commodities was calculated using the U.S. Department of Agriculture’s Food and Nutrition Service commodity price lists.
Food Stamps (CFDA Number 10.561) – The Virginia Department of Social Services uses an Electronic Benefits Transfer (EBT) process for food stamp benefit distribution statewide.
Note 3 – Relationship to Basic Financial Statements
Federal financial assistance revenues are reported in the City’s basic financial statements as follows:
General Capital Social Debt Other Component
Unit
Government Projects Services Service Governmental Total Schools CVPED* Intergovernmental revenue per financial statements $ 29,230,238 $ 3,938,162 $ 10,152,679 $148,845 $ 16,570,360 $ 60,040,284 $ 24,448,293 $ 980,119Less: amounts not related to federal financial assistance 29,217,067 2,212,780 3,154,283 148,845 11,939,769 46,672.744 19,473,907 -Total schedule of expenditures of federal awards $ 13,171 $ 1.725,382 $ 6,998,396 $ - $ 4,630,591 $ 13,367,540 $ 4,974,368 $ 980,119
* The City of Charlottesville and Central Virginia Partnership for Economic Development are parties toa Workforce Act Fiscal and Administrative Agent Agreement. As a fiscal agent, Central VirginiaPartnership for Economic Development directly manages WIOA funds. The City monitors WIOAfinancials.
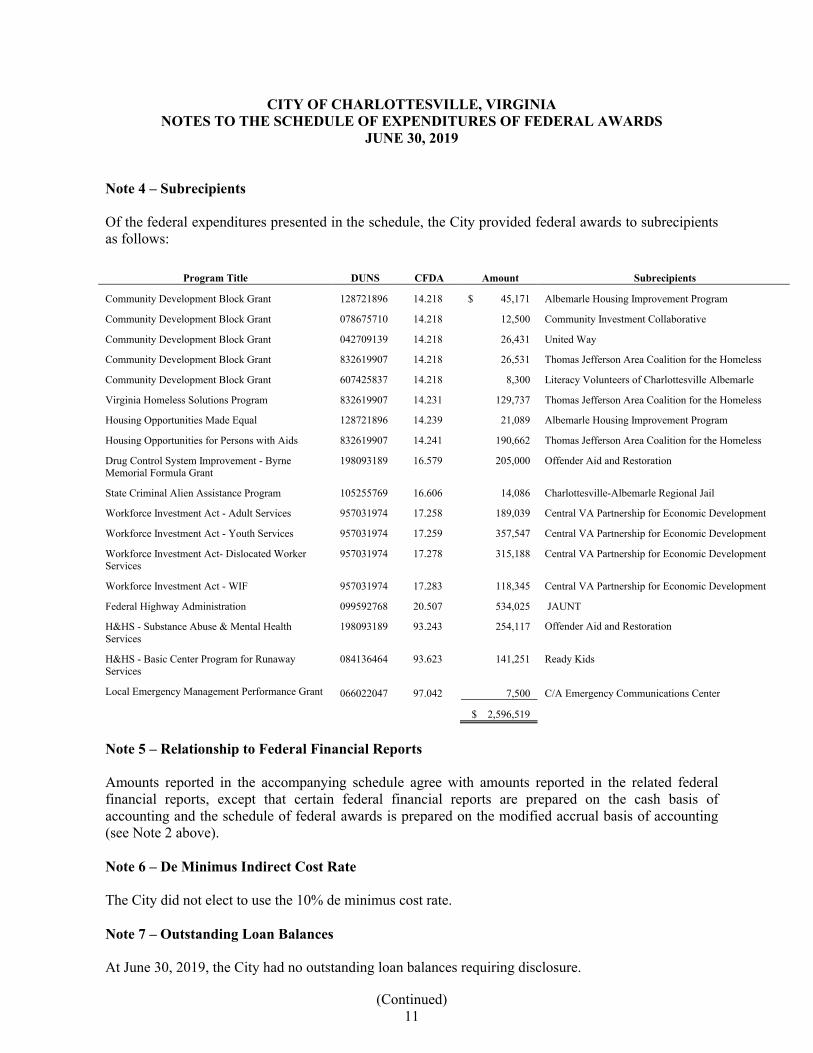
(Continued)11
CITY OF CHARLOTTESVILLE, VIRGINIANOTES TO THE SCHEDULE OF EXPENDITURES OF FEDERAL AWARDS
JUNE 30, 2019
Note 4 – Subrecipients
Of the federal expenditures presented in the schedule, the City provided federal awards to subrecipients as follows:
Program Title DUNS CFDA Amount Subrecipients
Community Development Block Grant 128721896 14.218 $ 45,171 Albemarle Housing Improvement Program
Community Development Block Grant 078675710 14.218 12,500 Community Investment Collaborative
Community Development Block Grant 042709139 14.218 26,431 United Way
Community Development Block Grant 832619907 14.218 26,531 Thomas Jefferson Area Coalition for the Homeless
Community Development Block Grant 607425837 14.218 8,300 Literacy Volunteers of Charlottesville Albemarle
Virginia Homeless Solutions Program 832619907 14.231 129,737 Thomas Jefferson Area Coalition for the Homeless
Housing Opportunities Made Equal 128721896 14.239 21,089 Albemarle Housing Improvement Program
Housing Opportunities for Persons with Aids 832619907 14.241 190,662 Thomas Jefferson Area Coalition for the Homeless
Drug Control System Improvement - Byrne Memorial Formula Grant
198093189 16.579 205,000 Offender Aid and Restoration
State Criminal Alien Assistance Program 105255769 16.606 14,086 Charlottesville-Albemarle Regional Jail
Workforce Investment Act - Adult Services 957031974 17.258 189,039 Central VA Partnership for Economic Development
Workforce Investment Act - Youth Services 957031974 17.259 357,547 Central VA Partnership for Economic Development
Workforce Investment Act- Dislocated Worker Services
957031974 17.278 315,188 Central VA Partnership for Economic Development
Workforce Investment Act - WIF 957031974 17.283 118,345 Central VA Partnership for Economic Development
Federal Highway Administration 099592768 20.507 534,025 JAUNT
H&HS - Substance Abuse & Mental Health Services
198093189 93.243 254,117 Offender Aid and Restoration
H&HS - Basic Center Program for Runaway Services
084136464 93.623 141,251 Ready Kids
Local Emergency Management Performance Grant 066022047 97.042 7,500 C/A Emergency Communications Center
$ 2,596,519
Note 5 – Relationship to Federal Financial Reports
Amounts reported in the accompanying schedule agree with amounts reported in the related federal financial reports, except that certain federal financial reports are prepared on the cash basis of accounting and the schedule of federal awards is prepared on the modified accrual basis of accounting (see Note 2 above).
Note 6 – De Minimus Indirect Cost Rate
The City did not elect to use the 10% de minimus cost rate.
Note 7 – Outstanding Loan Balances
At June 30, 2019, the City had no outstanding loan balances requiring disclosure.
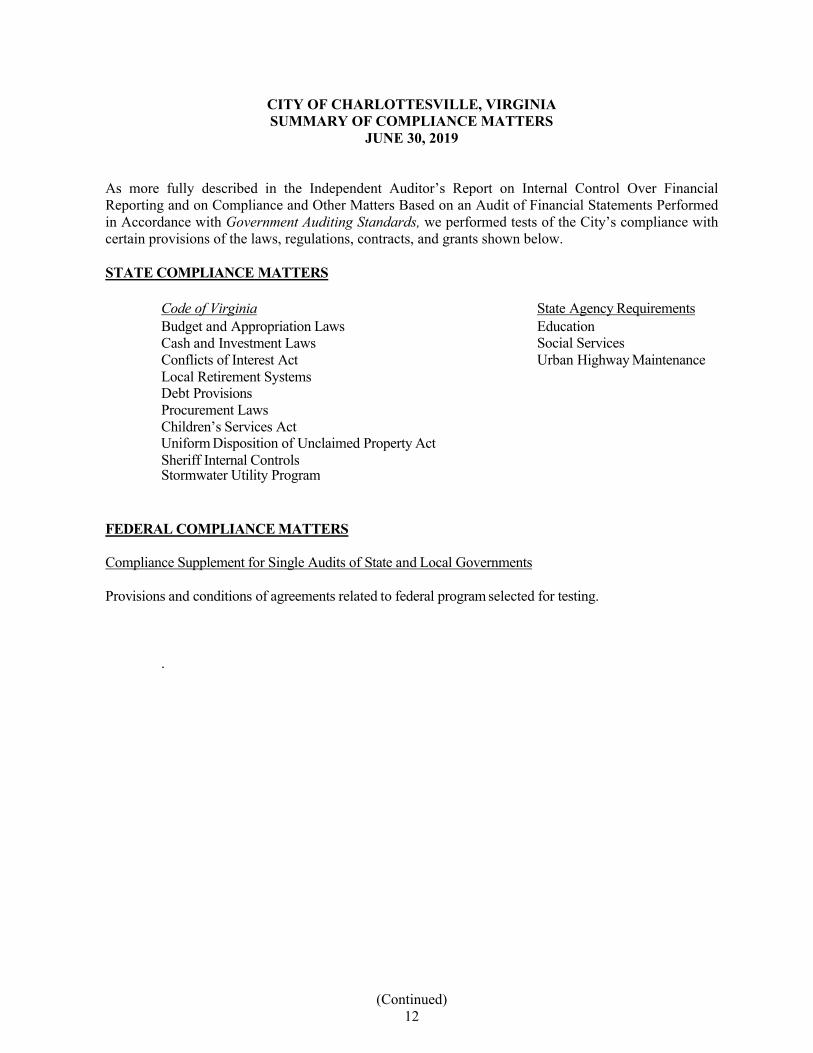
(Continued)12
CITY OF CHARLOTTESVILLE, VIRGINIASUMMARY OF COMPLIANCE MATTERS
JUNE 30, 2019
As more fully described in the Independent Auditor’s Report on Internal Control Over Financial Reporting and on Compliance and Other Matters Based on an Audit of Financial Statements Performed in Accordance with Government Auditing Standards, we performed tests of the City’s compliance with certain provisions of the laws, regulations, contracts, and grants shown below.
STATE COMPLIANCE MATTERS
Code of Virginia State Agency RequirementsBudget and Appropriation LawsCash and Investment LawsConflicts of Interest Act
EducationSocial ServicesUrban Highway Maintenance
Local Retirement SystemsDebt ProvisionsProcurement LawsChildren’s Services ActUniform Disposition of Unclaimed Property ActSheriff Internal ControlsStormwater Utility Program
FEDERAL COMPLIANCE MATTERS
Compliance Supplement for Single Audits of State and Local Governments
Provisions and conditions of agreements related to federal program selected for testing.
.
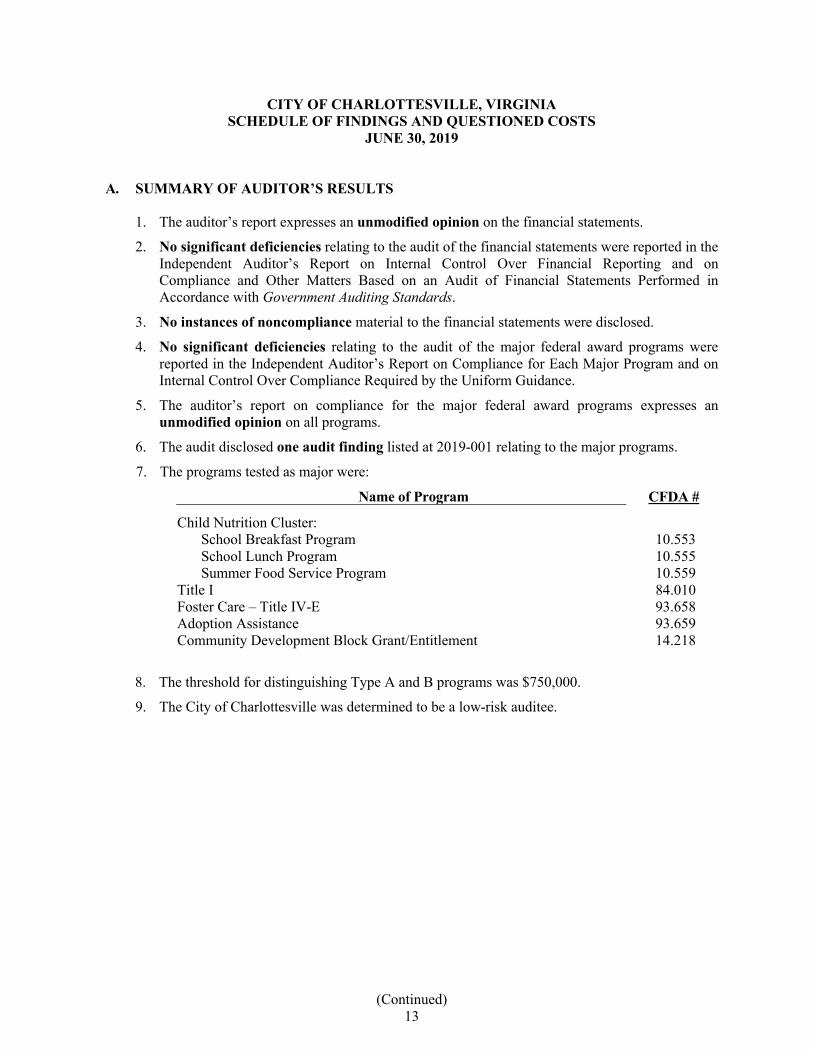
(Continued)13
CITY OF CHARLOTTESVILLE, VIRGINIASCHEDULE OF FINDINGS AND QUESTIONED COSTS
JUNE 30, 2019
A. SUMMARY OF AUDITOR’S RESULTS
1. The auditor’s report expresses an unmodified opinion on the financial statements.
2. No significant deficiencies relating to the audit of the financial statements were reported in the Independent Auditor’s Report on Internal Control Over Financial Reporting and onCompliance and Other Matters Based on an Audit of Financial Statements Performed in Accordance with Government Auditing Standards.
3. No instances of noncompliance material to the financial statements were disclosed.
4. No significant deficiencies relating to the audit of the major federal award programs werereported in the Independent Auditor’s Report on Compliance for Each Major Program and on Internal Control Over Compliance Required by the Uniform Guidance.
5. The auditor’s report on compliance for the major federal award programs expresses an unmodified opinion on all programs.
6. The audit disclosed one audit finding listed at 2019-001 relating to the major programs.
7. The programs tested as major were:
Name of Program CFDA #
Child Nutrition Cluster:School Breakfast ProgramSchool Lunch ProgramSummer Food Service Program
10.55310.55510.559
Title I 84.010Foster Care – Title IV-E 93.658Adoption Assistance 93.659Community Development Block Grant/Entitlement 14.218
8. The threshold for distinguishing Type A and B programs was $750,000.
9. The City of Charlottesville was determined to be a low-risk auditee.
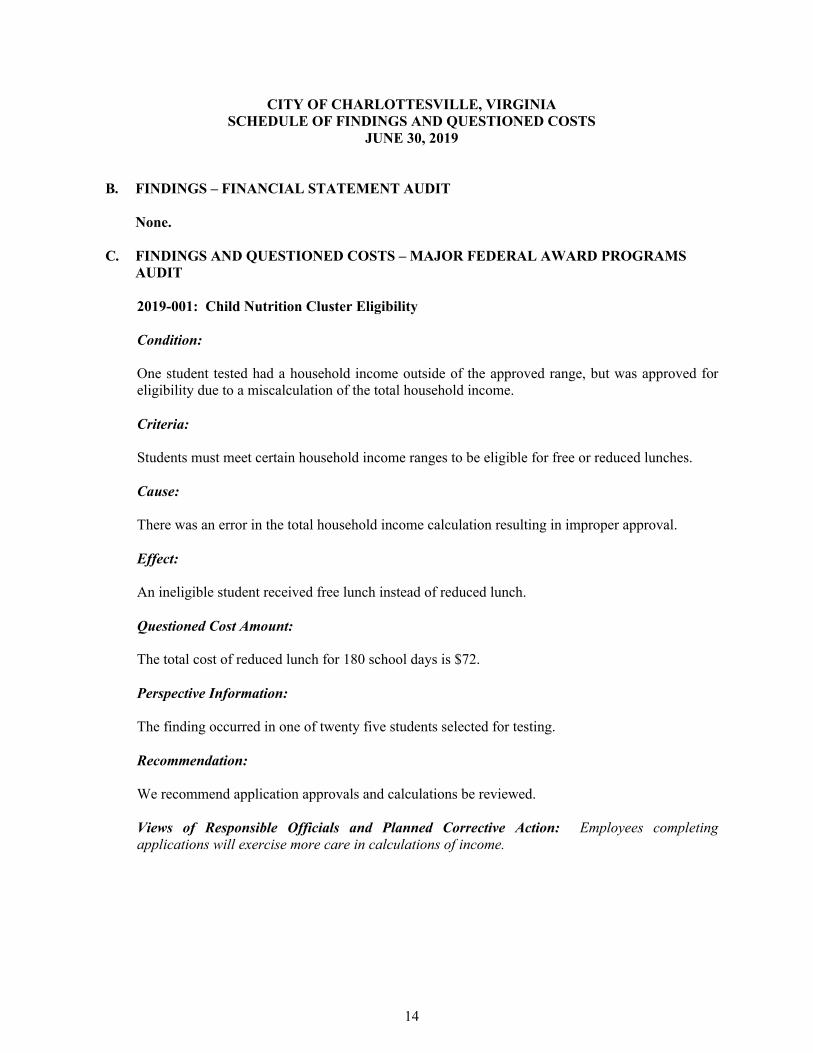
14
CITY OF CHARLOTTESVILLE, VIRGINIASCHEDULE OF FINDINGS AND QUESTIONED COSTS
JUNE 30, 2019
B. FINDINGS – FINANCIAL STATEMENT AUDIT
None.
C. FINDINGS AND QUESTIONED COSTS – MAJOR FEDERAL AWARD PROGRAMSAUDIT
2019-001: Child Nutrition Cluster Eligibility
Condition:
One student tested had a household income outside of the approved range, but was approved for eligibility due to a miscalculation of the total household income.
Criteria:
Students must meet certain household income ranges to be eligible for free or reduced lunches.
Cause:
There was an error in the total household income calculation resulting in improper approval.
Effect:
An ineligible student received free lunch instead of reduced lunch.
Questioned Cost Amount:
The total cost of reduced lunch for 180 school days is $72.
Perspective Information:
The finding occurred in one of twenty five students selected for testing.
Recommendation:
We recommend application approvals and calculations be reviewed.
Views of Responsible Officials and Planned Corrective Action: Employees completing applications will exercise more care in calculations of income.
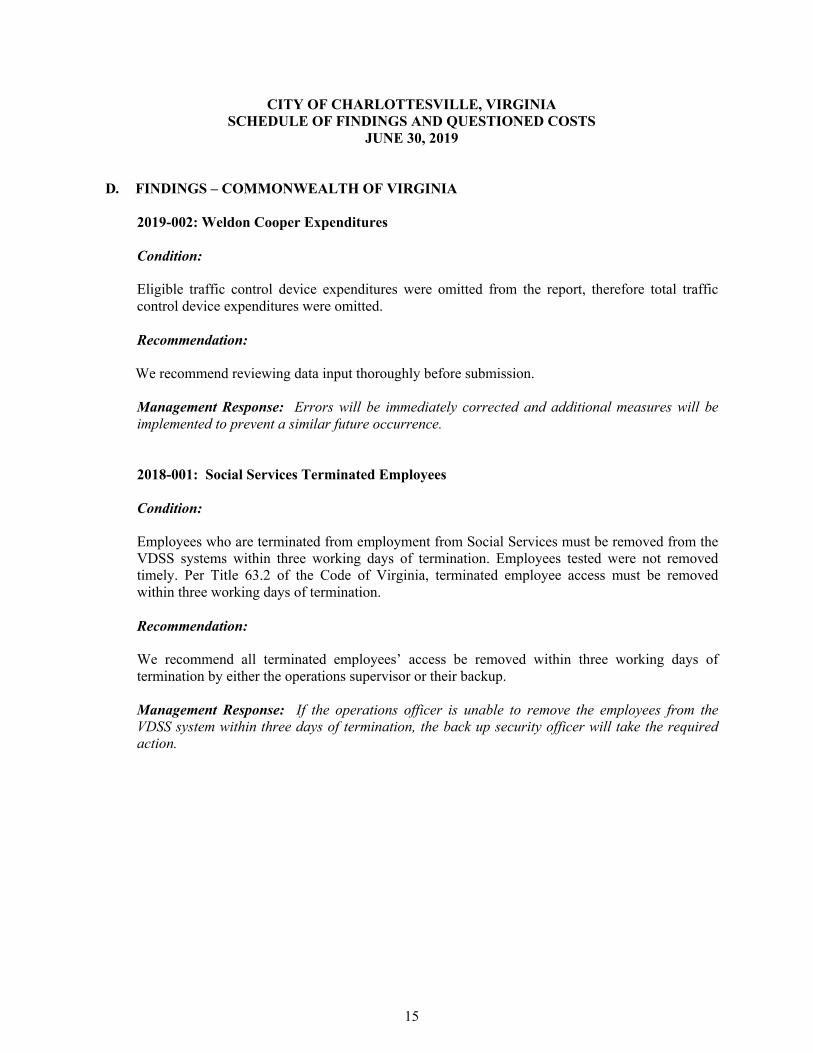
15
CITY OF CHARLOTTESVILLE, VIRGINIASCHEDULE OF FINDINGS AND QUESTIONED COSTS
JUNE 30, 2019
D. FINDINGS – COMMONWEALTH OF VIRGINIA
2019-002: Weldon Cooper Expenditures
Condition:
Eligible traffic control device expenditures were omitted from the report, therefore total traffic control device expenditures were omitted.
Recommendation:
We recommend reviewing data input thoroughly before submission.
Management Response: Errors will be immediately corrected and additional measures will be implemented to prevent a similar future occurrence.
2018-001: Social Services Terminated Employees
Condition:
Employees who are terminated from employment from Social Services must be removed from the VDSS systems within three working days of termination. Employees tested were not removed timely. Per Title 63.2 of the Code of Virginia, terminated employee access must be removed within three working days of termination.
Recommendation:
We recommend all terminated employees’ access be removed within three working days of termination by either the operations supervisor or their backup.
Management Response: If the operations officer is unable to remove the employees from the VDSS system within three days of termination, the back up security officer will take the required action.
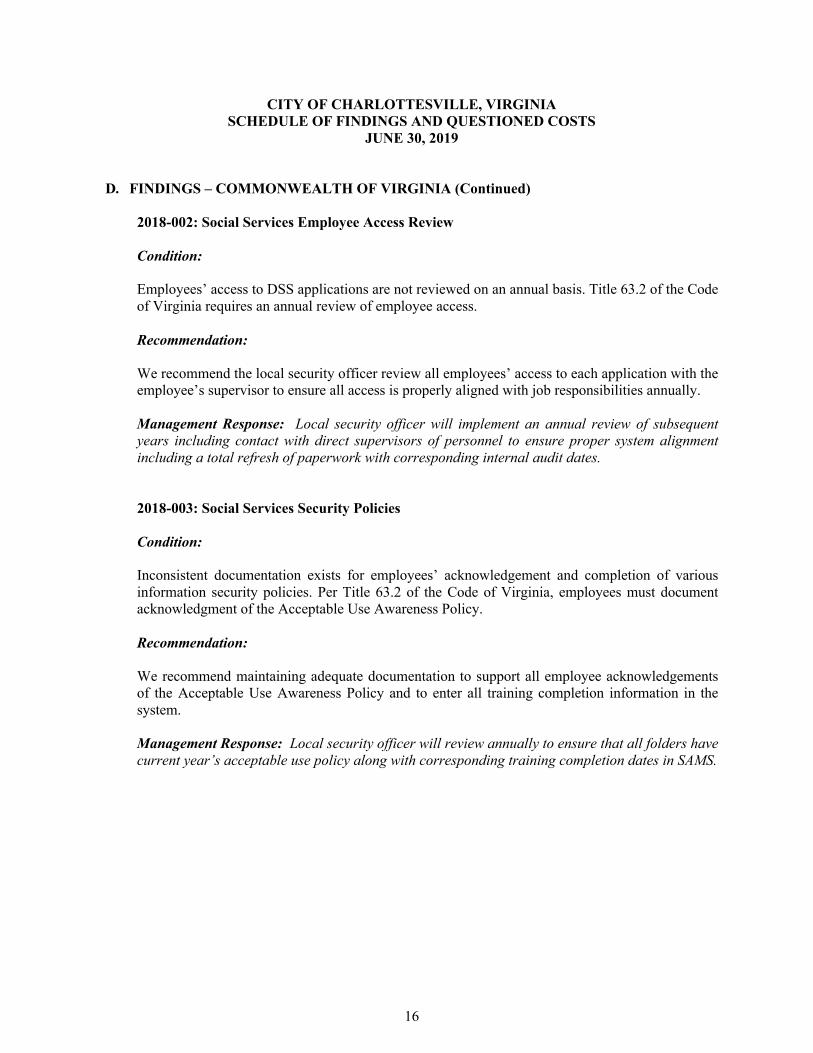
16
CITY OF CHARLOTTESVILLE, VIRGINIASCHEDULE OF FINDINGS AND QUESTIONED COSTS
JUNE 30, 2019
D. FINDINGS – COMMONWEALTH OF VIRGINIA (Continued)
2018-002: Social Services Employee Access Review
Condition:
Employees’ access to DSS applications are not reviewed on an annual basis. Title 63.2 of the Code of Virginia requires an annual review of employee access.
Recommendation:
We recommend the local security officer review all employees’ access to each application with the employee’s supervisor to ensure all access is properly aligned with job responsibilities annually.
Management Response: Local security officer will implement an annual review of subsequent years including contact with direct supervisors of personnel to ensure proper system alignmentincluding a total refresh of paperwork with corresponding internal audit dates.
2018-003: Social Services Security Policies
Condition:
Inconsistent documentation exists for employees’ acknowledgement and completion of various information security policies. Per Title 63.2 of the Code of Virginia, employees must document acknowledgment of the Acceptable Use Awareness Policy.
Recommendation:
We recommend maintaining adequate documentation to support all employee acknowledgements of the Acceptable Use Awareness Policy and to enter all training completion information in the system.
Management Response: Local security officer will review annually to ensure that all folders have current year’s acceptable use policy along with corresponding training completion dates in SAMS.
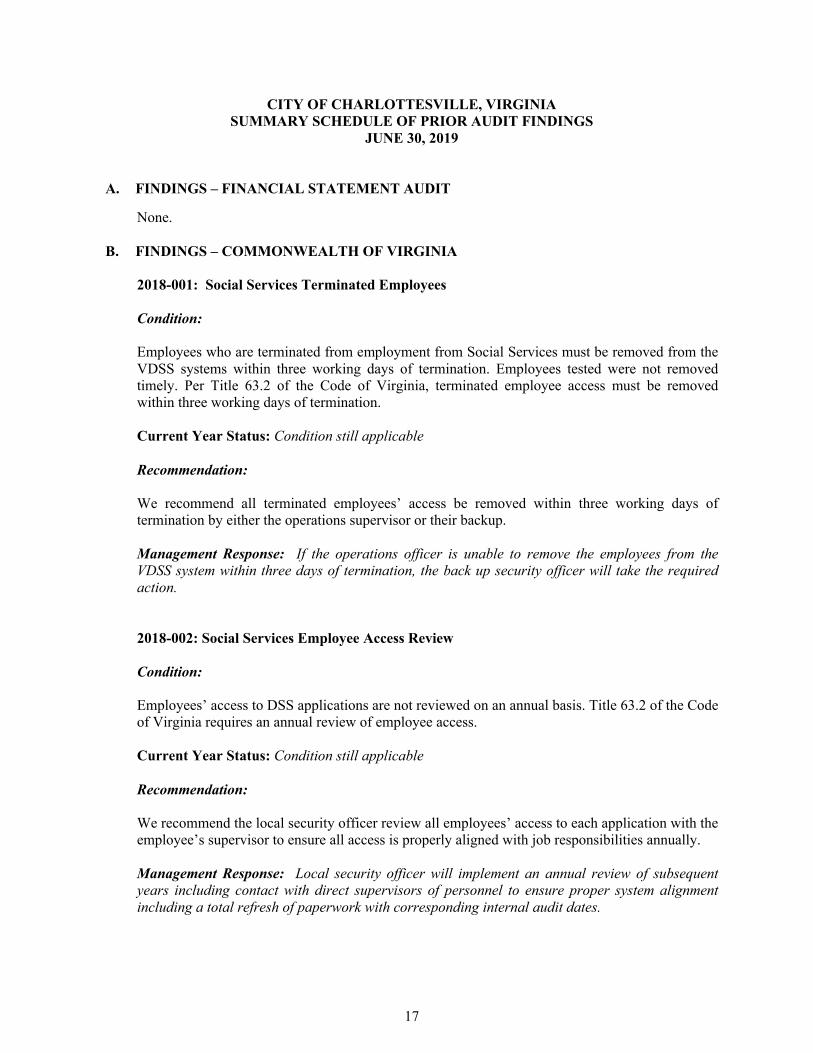
17
CITY OF CHARLOTTESVILLE, VIRGINIASUMMARY SCHEDULE OF PRIOR AUDIT FINDINGS
JUNE 30, 2019
A. FINDINGS – FINANCIAL STATEMENT AUDIT
None.
B. FINDINGS – COMMONWEALTH OF VIRGINIA
2018-001: Social Services Terminated Employees
Condition:
Employees who are terminated from employment from Social Services must be removed from the VDSS systems within three working days of termination. Employees tested were not removed timely. Per Title 63.2 of the Code of Virginia, terminated employee access must be removed within three working days of termination.
Current Year Status: Condition still applicable
Recommendation:
We recommend all terminated employees’ access be removed within three working days of termination by either the operations supervisor or their backup.
Management Response: If the operations officer is unable to remove the employees from the VDSS system within three days of termination, the back up security officer will take the required action.
2018-002: Social Services Employee Access Review
Condition:
Employees’ access to DSS applications are not reviewed on an annual basis. Title 63.2 of the Code of Virginia requires an annual review of employee access.
Current Year Status: Condition still applicable
Recommendation:
We recommend the local security officer review all employees’ access to each application with the employee’s supervisor to ensure all access is properly aligned with job responsibilities annually.
Management Response: Local security officer will implement an annual review of subsequent years including contact with direct supervisors of personnel to ensure proper system alignment including a total refresh of paperwork with corresponding internal audit dates.
18
CITY OF CHARLOTTESVILLE, VIRGINIASUMMARY SCHEDULE OF PRIOR AUDIT FINDINGS
JUNE 30, 2019
B. FINDINGS – COMMONWEALTH OF VIRGINIA (Continued)
2018-003: Social Services Security Policies
Condition:
Inconsistent documentation exists for employees’ acknowledgement and completion of various information security policies. Per Title 63.2 of the Code of Virginia, employees must document acknowledgment of the Acceptable Use Awareness Policy.
Current Year Status: Condition still applicable
Recommendation:
We recommend maintaining adequate documentation to support all employee acknowledgements of the Acceptable Use Awareness Policy and to enter all training completion information in the system.
Management Response: Local security officer will review annually to ensure that all folders have current year’s acceptable use policy along with corresponding training completion dates in SAMS.
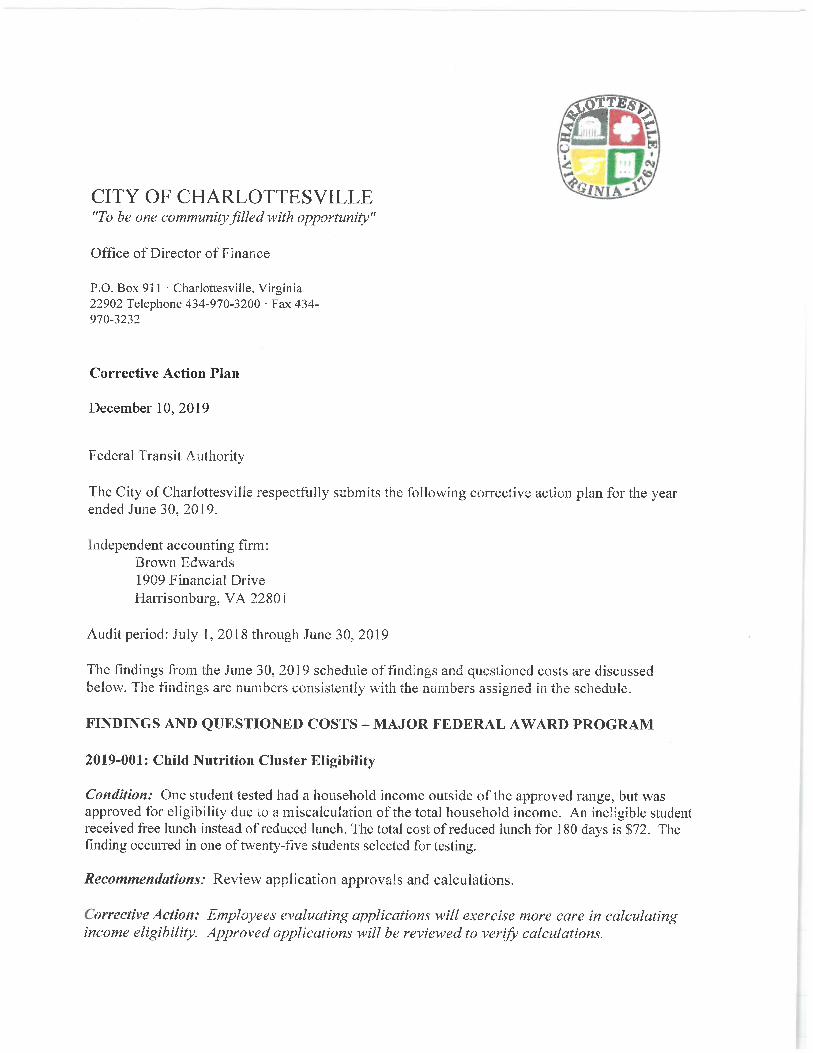
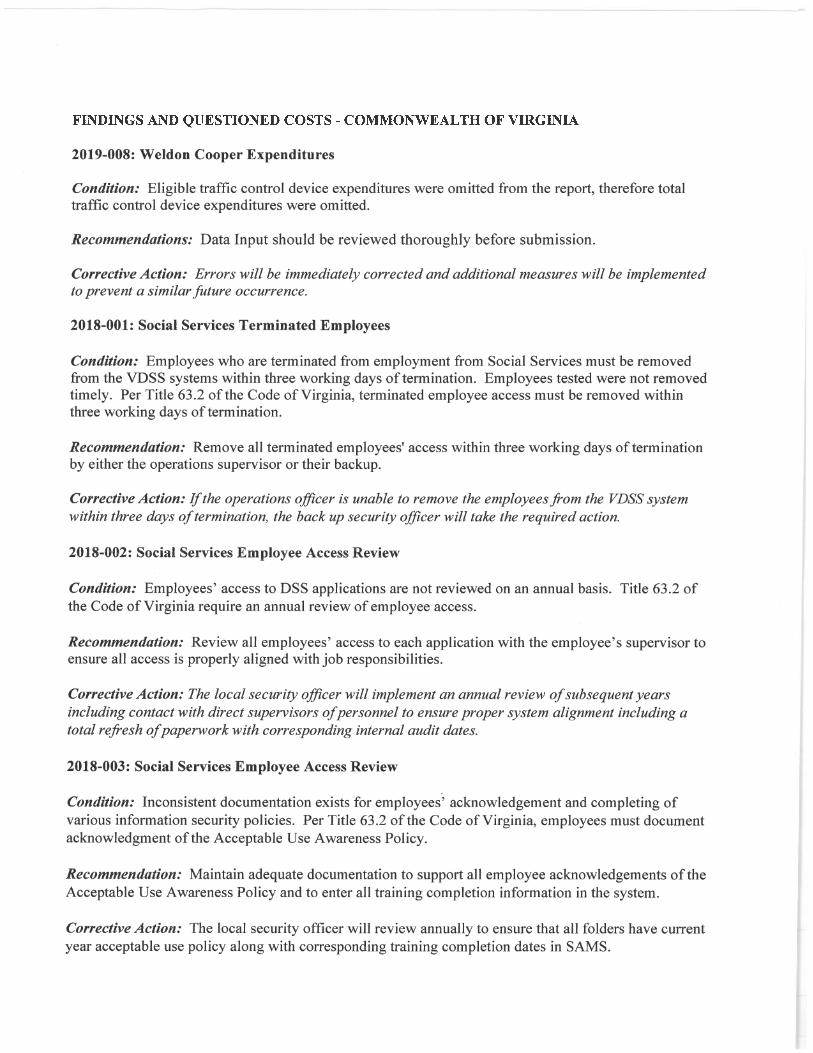

City of Charlottesville, Virginia 605 East Market Street
P O Box 911 Charlottesville, Virginia 22902
(434) – 970 – 3200 www.charlottesville.org/finance