Embed Size (px)
Citation preview
ANNUAL COMPREHENSIVEFINANCIAL REPORT
FOR THE YEAR ENDED JUNE 30, 2021
CITY OF MALIBU
CITY OF MALIBU, CALIFORNIA
ANNUAL COMPREHENSIVE FINANCIAL REPORT
FOR THE YEAR ENDED JUNE 30, 2021
Prepared by: City of Malibu
Management and Administrative Services Department Lisa Soghor, Assistant City Manager
CITY OF MALIBU, CALIFORNIA ANNUAL COMPREHENSIVE FINANCIAL REPORT
For the Fiscal Year Ended June 30, 2021
TABLE OF CONTENTS
INTRODUCTORY SECTION Letter of Transmittal ............................................................................................................ i City Officials ...................................................................................................................... iv Awards .................................................................................................................................v Organization Chart ............................................................................................................. vi FINANCIAL SECTION Independent Auditors’ Report ..............................................................................................1 Management’s Discussion and Analysis .............................................................................7 BASIC FINANCIAL STATEMENTS:
Statement of Net Position ......................................................................................21 Statement of Activities ...........................................................................................22 Balance Sheet – Governmental Funds ...................................................................23 Reconciliation of the Balance Sheet of Governmental Funds ...............................24 Statement of Revenues, Expenditures and Changes in Fund Balances – Governmental Funds .......................................................25 Reconciliation of the Statement of Revenues, Expenditures and Changes in Fund Balances to the Statement of Activities – Governmental Funds ...................................................................................26 Statement of Fund Net Position – Proprietary Funds ............................................27 Statement of Revenues, Expenses and Changes in Fund Net Position – Proprietary Funds .....................................................28 Statement of Cash Flows – Proprietary Funds .......................................................29 Statement of Fiduciary Net Position ......................................................................30 Statement of Changes in Fiduciary Net Position ...................................................31 Notes to the Financial Statements ..........................................................................32
REQUIRED SUPPLEMENTARY INFORMATION Schedule of Proportionate Share of the Net Pension Liability ..........................................67 Schedule of Contributions - Defined Benefit Pension Plan ...............................................68 Schedule of Changes in the Net OPEB (Asset)/Liability and Related Ratios ...................69 Schedule of Contributions – OPEB Plan ...........................................................................70 Schedule of Revenues, Expenditures and Changes in Fund Balances -
Budget and Actual & Next Year’s Budget - General Fund ...................................71 Schedule of Revenues, Expenditures and Changes in Fund Balances -
Budget and Actual – Grants Special Revenue Fund ..............................................72 Note to Required Supplementary Information ...................................................................73
CITY OF MALIBU, CALIFORNIA ANNUAL COMPREHENSIVE FINANCIAL REPORT
For the Fiscal Year Ended June 30, 2021
TABLE OF CONTENTS
SUPPLEMENTARY INFORMATION Individual Fund Financial Statements and Schedules: Governmental Funds:
Combining Balance Sheet – Non-major Governmental Funds .............................75 Combining Statement of Revenues, Expenditures and
Changes in Fund Balances – Non-major Governmental Funds .......................78 Schedule of Revenues, Expenditures and Changes in Fund Balances -
Budget and Actual – Individual Non-major Governmental Funds .................81 Enterprise Fund: Schedule of Revenues, Expenses and Changes in Fund Net Position - Budget Actual (Budgetary Basis) – Commercial Real Estate Rental ..........................99 Schedule of Revenues, Expenses and Changes in Fund Net Position - Budget Actual (Budgetary Basis) – Wastewater Treatment ......................................100
Fiduciary Funds: Combining Statement of Fiduciary Net Position .................................................101 Combining Statement of Changes in Fiduciary Net Position ..............................102
STATISTICAL SECTION (UNAUDITED) Statistical Section Index Net Position by Component .............................................................................................104 Changes in Net Position ...................................................................................................106 Fund Balances of Governmental Funds ...........................................................................108 Changes in Fund Balances of Governmental Funds ........................................................110 Assessed Value of Taxable Property ...............................................................................112 Direct and Overlapping Property Tax Rates ....................................................................113 Principal Property Tax Payers .........................................................................................114 Property Tax Levies and Collections ...............................................................................115 Ratio of Outstanding Debt by Type .................................................................................116 Direct and Overlapping Governmental Activity Debt .....................................................117 Legal Debt Margin Information .......................................................................................118 Demographic and Economic Statistics ............................................................................119 Full-Time Equivalent Government Employees by Function/Program ............................120 Indicators of Demand or Level of Services .....................................................................121 Capital Asset Statistics by Function/Program..................................................................122

INTRODUCTORY SECTION
The Introductory Section of the Annual Comprehensive Financial Report provides general information of the City of Malibu, California’s structure and its personnel, as well as information useful in assessing the City’s financial condition. This section includes the following:
• Letter of Transmittal
• List of City Officials
• Government Finance Officers Association Certificate ofAchievement for Excellence in Financial Reporting
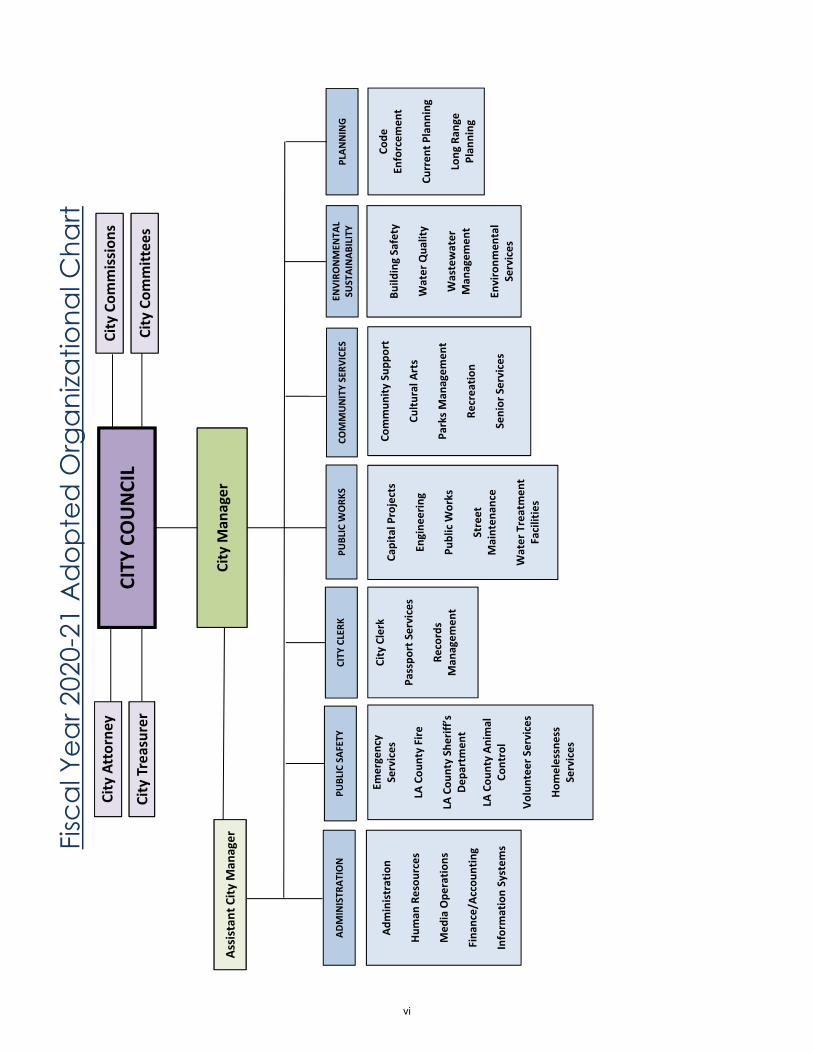
• City’s Organizational Chart

City of Malibu
23825 Stuart Ranch Road, Malibu, California 90265-4861 (310) 456-2489 fax (310) 456-3356 www.malibucity.org
December 28, 2021 Honorable Mayor and City Council City of Malibu, California The Annual Comprehensive Financial Report (ACFR) of the City of Malibu for the fiscal year ending June 30, 2021 is hereby submitted. Responsibility for the accuracy of the presented data and the completeness and fairness of the presentation, including all disclosures, rests with the City. To the best of our knowledge and belief, the information presented is accurate in all material aspects and is reported in a manner designed to present fairly the financial position and results of operations of the various funds of the City of Malibu. All disclosures necessary to enable the reader to gain an understanding of the City’s financial activities have been included. The financial statements are prepared in accordance with Generally Accepted Accounting Principles (GAAP) as promulgated by the Governmental Accounting Standards Board (GASB). This report consists of management’s representations concerning the finances of the City of Malibu, California. Consequently, management assumes full responsibility for the completeness and reliability of all the information presented in this report. To provide a reasonable basis for making these representations, management of the City has established a comprehensive internal control framework that is designed both to protect the City’s assets from loss, theft or misuse and to compile sufficient reliable information for the preparation of the City’s financial statements in conformity with GAAP. Because the cost of internal controls should not outweigh their benefits, the City’s comprehensive framework of internal controls has been designed to provide reasonable rather than absolute assurance that the financial statements will be free from material misstatement. As management we attest that, to the best of our knowledge and belief, this financial report is complete and reliable in all material aspects. The City’s financial statements have been audited by Lance, Soll & Lunghard LLP, a public accounting firm fully licensed and qualified to perform audits of state and local governments within the State of California. The independent audit involved examining, on a test basis, evidence supporting the amounts and disclosures in the financial statements; assessing the accounting principles used and significant estimates made by management; and evaluating the overall financial statement presentation. The independent auditors concluded, based upon the audit, that there was reasonable basis for rendering an unmodified opinion that the City of Malibu, California’s financial statements for the fiscal year ended June 30, 2021 are fairly presented in conformity with GAAP. GAAP requires that management provide a narrative introduction, overview and analysis to accompany the basic financial statements in the form of Management’s Discussion and Analysis (MD&A). This letter of transmittal is designed to complement the MD&A and should be read in conjunction with it. Malibu’s MD&A can be found immediately following the report of the independent auditors in the financial section of the ACFR.
i
Profile of the City of Malibu The City of Malibu was incorporated as a general law city on March 28, 1991 and operates under the council/manager form of government. Located in northwest Los Angeles County, the City encompasses over 20 square miles along the Pacific Ocean. Malibu has a population of approximately 13,000 residents, but with its miles of public beaches, more than 15 million people visit the City each year. The City provides a full range of services, some of which are contracted through outside agencies and/or firms. These services include law enforcement, highways and roads, recreation areas, planning and zoning, building and environmental safety, emergency preparedness and general administrative services. The City of Malibu has a rich and diverse history. Originally settled by the Chumash Indians, they named the stretch of beach at the mouth of the Malibu Creek “Humaliwo” or “the surf sounds loudly”. In 1802, Jose Tapia established a ranch in the area. Passed on through generations, it was eventually sold in 1891 to Fredrick Rindge. Seeking an ideal country home for his family, the private domain was guarded fiercely. Rindge’s widow, May, fought off an effort to route the Southern Pacific Railroad through Malibu by establishing her own private railroad. Later, the State of California succeeded in obtaining a right-of-way to build Pacific Coast Highway through the property. A final court battle in the late 1920s forced Rindge to begin leasing and then selling the property at the mouth of Malibu Creek. As most of the purchasers were movie stars, the area became known as the Malibu Movie Colony. Today, Malibu is a predominantly rural residential community that has become a haven for those seeking to escape the urban life of Los Angeles. Its small commercial sectors consist of many quaint shops and restaurants that welcome locals and visitors alike. Programs and exhibits offered by the Los Angeles County Public Library, Pepperdine University and the Weisman Museum of Art provide culturally enriching experiences. Factors Affecting Financial Condition Malibu’s local economy is unique in that it is significantly impacted by climate. In the warm weather months, millions come to Malibu to enjoy the beautiful beaches. During the winter months, rain and pounding surf can flood roads and create landslides, making travel through the City difficult. Since its incorporation in 1991, Malibu has been plagued with disasters, including floods, multiple fires and an earthquake, creating a significant drain on the City’s finances. For this reason, the City maintains a substantial reserve in its General Fund. The Woolsey Fire, which erupted on November 8, 2018 and reached Malibu on November 9, was the largest fire in Los Angeles County history and the most disastrous event ever in Malibu. In one week, the fire burned almost 100,000 acres throughout the Santa Monica Mountains area and destroyed approximately 480 structures in Malibu. The City remains actively engaged in facilitating the recovery and rebuilding of residential homes and city infrastructure which is anticipated to take several years. New economic challenges presented themselves in 2020 and continued in 2021. The Safer at Home orders first issued by the State of California and the County of Los Angeles in March 2020 in response to the COVID-19 pandemic have affected businesses locally and world-wide. In Fiscal Year 2020-2021, City revenues recovered more quickly than originally predicted, including those related to sales tax, transient occupancy tax and utility users tax as well as permits and licenses. City staff continues to carefully monitor the ongoing economic effects of the COVID-19 pandemic. The City’s largest revenue source is property tax, which continues to be stable due to a strong residential real estate market and steady valuation despite the effects of the Woolsey Fire and the COVID-19 pandemic. Additionally, Malibu relies heavily on grant funding for many of the capital projects it undertakes and has been successful in securing millions of dollars over the years from various agencies.
ii
Other Information Budgetary Controls. The City of Malibu maintains a budget control system to ensure compliance with the spending limits incorporated in the annual operating budget adopted by the City Council. Activities of the general fund and special revenue funds are included in the annual appropriated budget. Project-length financial plans are adopted for the capital project funds. Budgetary control is maintained at the fund level for administrative and operating expenditures and at the project level for capital improvements. Only the City Council has the authority to increase total appropriations within any fund, subject to the appropriations limitations established by State law. The City also maintains an encumbrance accounting system as one technique of accomplishing budgetary control. Long-Term Financial Planning. The City prepares and adopts its budget on an annual basis. Each budget, however, considers future years’ spending needs and revenue availability. Capital projects are budgeted using a multi-year planning approach and other major expenditures are evaluated and budgeted based on expectations of revenues and expenditures in future fiscal years. The City maintains a strong General Fund reserve. As of June 30, 2021, the City had approximately $58.0 million in total General Fund reserves, which allows for flexibility in budget projections, and also provides the City with funding in the event of an unexpected fiscal emergency in future years. In Fiscal Year 2020-21, the City Council set aside $6.5 million in a General Fund Designated Reserve for Fiscal Year 2021-22 Operating Expenditures. Of the remaining amount, the unassigned General Fund reserve is $38.8 million or 98% of Fiscal Year 2021-22 General Fund operating expenditures and exceeds the City’s goal of maintaining a minimum of 50% of the fund’s operating expenses. Awards and Acknowledgements The Government Finance Officers Association of the United States and Canada (GFOA) awarded a Certificate of Achievement for Excellence in Financial Reporting to the City of Malibu for its ACFR for the fiscal year ended June 30, 2020. In order to be awarded a Certificate of Achievement, the City must publish an easily readable and efficiently organized ACFR. This report must satisfy both generally accepted accounting principles and applicable legal requirements.
The Certificate of Achievement from the GFOA is valid for a period of one year. City staff believes that this current Annual Comprehensive Financial Report continues to meet the Certificate of Achievement Program’s requirements and will submit it to the GFOA to determine its eligibility for another certificate. The preparation of this report could not have been accomplished without the efficient and dedicated services of the Management and Administrative Services Department staff. Special acknowledgment is given to Renée Neermann, Julie Matsumoto, and the staff of Lance, Soll, & Lunghard LLP, the City’s independent auditors. I would also like to thank the City Manager, Mayor and members of the City Council for their support in planning and conducting the operations of the City in a responsible and progressive manner.
Respectfully submitted, Lisa Soghor Assistant City Manager
iii
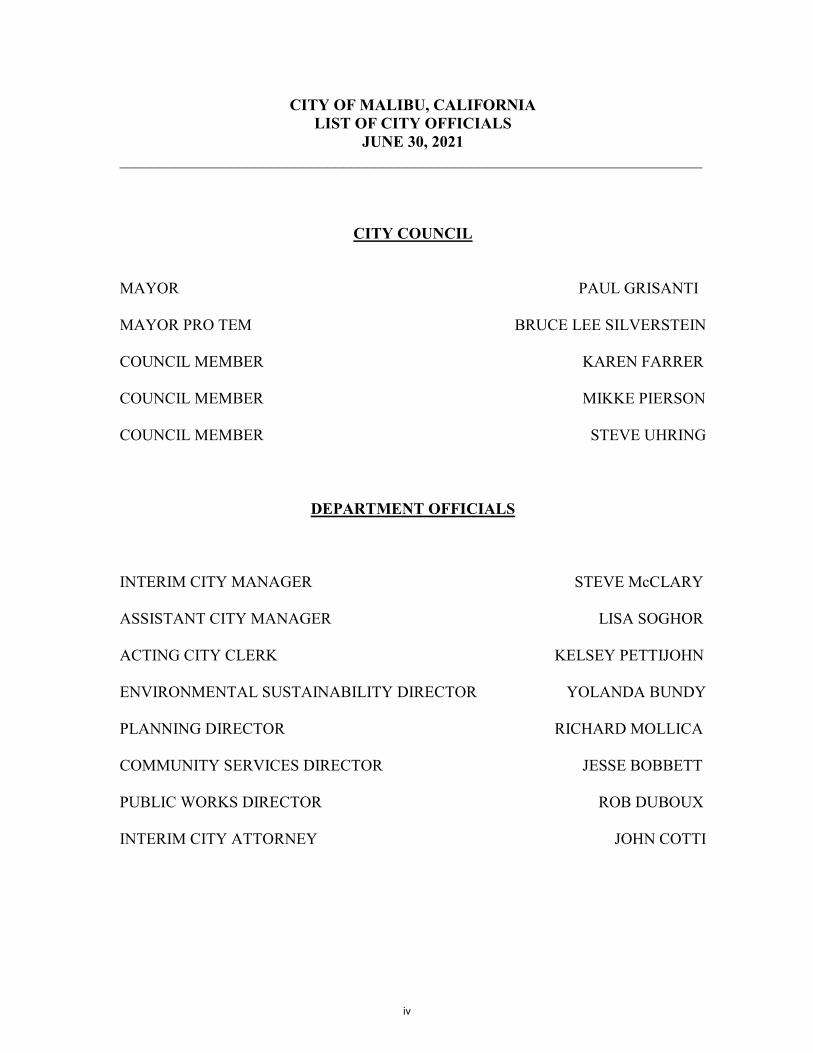
CITY OF MALIBU, CALIFORNIA LIST OF CITY OFFICIALS
JUNE 30, 2021 _________________________________________________________________________
CITY COUNCIL
MAYOR PAUL GRISANTI MAYOR PRO TEM BRUCE LEE SILVERSTEIN COUNCIL MEMBER KAREN FARRER COUNCIL MEMBER MIKKE PIERSON COUNCIL MEMBER STEVE UHRING
DEPARTMENT OFFICIALS INTERIM CITY MANAGER STEVE McCLARY ASSISTANT CITY MANAGER LISA SOGHOR ACTING CITY CLERK KELSEY PETTIJOHN ENVIRONMENTAL SUSTAINABILITY DIRECTOR YOLANDA BUNDY PLANNING DIRECTOR RICHARD MOLLICA COMMUNITY SERVICES DIRECTOR JESSE BOBBETT PUBLIC WORKS DIRECTOR ROB DUBOUX INTERIM CITY ATTORNEY JOHN COTTI
iv
Government Finance Officers Association
Certificate of Achievementfor Excellence
in Financial Reporting
Presented to
City of MalibuCalifornia
For its Comprehensive AnnualFinancial Report
For the Fiscal Year Ended
June 30, 2020
Executive Director/CEO
v
CITY
COUNCIL
City
Treasurer
City
Attorney
Capital P
rojects
Engine
ering
Public W
orks
Street
Mainten
ance
Water Treatmen
t Facilities
Commun
ity Sup
port
Cultu
ral A
rts
Parks Man
agem
ent
Recreatio
n
Senior Services
Build
ing Safety
Water Qua
lity
Wastewater
Man
agem
ent
Environm
ental
Services
Code
En
forcem
ent
Curren
tPlann
ing
Long
Rang
e Plan
ning
Administration
Hum
an Resou
rces
Med
ia Ope
ratio
ns
Fina
nce/Ac
coun
ting
Inform
ation System
sFisc
al Y
ear 2
020-
21 A
dop
ted
Org
aniza
tiona
l Cha
rt
ADMINISTR
ATION
PUBLIC W
ORK
SCO
MMUNITY SERV
ICES
ENVIRO
NMEN
TAL
SUSTAINAB
ILITY
PLAN
NING
City
Commission
s
City
Committees
PUBLIC
SAFETY
City Clerk
Passpo
rt Services
Records
Man
agem
ent
City
Man
ager
CITY
CLER
K
Emergency
Services
LA Cou
nty Fire
LA Cou
nty Sheriff’s
Dep
artm
ent
LA Cou
nty An
imal
Control
Volunteer S
ervices
Hom
elessness
Services
Assistan
t City
Man
ager
vi
FINANCIAL SECTION
The Financial Section of the Annual Comprehensive Financial Report contains the following: • Independent Auditor’s Report • Required Supplementary Information – Management Discussion
and Analysis (MD&A)

INDEPENDENT AUDITORS’ REPORT
To the Honorable Mayor and Members of the City Council City of Malibu, California Report on the Financial Statements Opinions We have audited the accompanying financial statements of the governmental activities, the business-type activities, each major fund, and the aggregate remaining fund information of the City of Malibu, California, (the City) as of and for the year ended June 30, 2021, and the related notes to the financial statements, which collectively comprise the City’s basic financial statements as listed in the table of contents. In our opinion, the financial statements referred to above present fairly, in all material respects, the respective financial position of the governmental activities, the business-type activities, each major fund, and the aggregate remaining fund information of the City as of June 30, 2021, and the respective changes in financial position and, where applicable, cash flows thereof for the year then ended in accordance with accounting principles generally accepted in the United States of America. Basis for Opinions We conducted our audit in accordance with auditing standards generally accepted in the United States of America (GAAS) and the standards applicable to financial audits contained in Government Auditing Standards, issued by the Comptroller General of the United States. Our
responsibilities under those standards are further described in the Auditor’s Responsibilities for the Audit of the Financial Statements section of our report. We are required to be independent of the City and to meet our other ethical responsibilities, in accordance with the relevant ethical requirements relating to our audits. We believe that the audit evidence we have obtained is sufficient and appropriate to provide a basis for our audit opinion. Responsibilities of Management for the Financial Statements Management is responsible for the preparation and fair presentation of these financial statements in accordance with accounting principles generally accepted in the United States of America; and for the design, implementation, and maintenance of internal control relevant to the preparation and fair presentation of financial statements that are free from material misstatement, whether due to fraud or error. In preparing the financial statements, management is required to evaluate whether there are conditions or events, considered in the aggregate, that raise substantial doubt about the City’s ability to continue as a going concern for twelve months beyond the date of the financial statements.
203 N. Brea Blvd., Suite 203 Brea, CA 92821 Lance, Soll & Lunghard, LLP Phone: 714.672.0022

To the Honorable Mayor and Members of the City Council City of Malibu, California Auditor’s Responsibilities for the Audit of the Financial Statements Our objectives are to obtain reasonable assurance about whether the financial statements as a whole are free from material misstatement, whether due to fraud or error, and to issue an auditor’s report that includes our opinion. Reasonable assurance is a high level of assurance but is not absolute assurance and therefore is not a guarantee that an audit conducted in accordance with the GAAS and Governmental Auditing Standards will always detect a material misstatement when it exists. The risk of not detecting a material
misstatement resulting from fraud is higher than for one resulting from error, as fraud may involve collusion, forgery, intentional omissions, misrepresentations, or the override of internal control. Misstatements are considered material if, there is a substantial likelihood that, individually or in the aggregate, they would influence the judgment made by a reasonable user based on the financial statements. In performing an audit in accordance with GAAS and Government Auditing Standards, we:
• Exercise professional judgment and maintain professional skepticism throughout the audit.
• Identify and assess the risks of material misstatement of the financial statements, whether due to fraud or error, and design and perform audit procedures responsive to those risks. Such procedures include examining, on a test basis, evidence regarding the amounts and disclosures in the financial statements.
• Obtain an understanding of internal control relevant to the audit in order to design audit procedures that are appropriate in the circumstances, but not for the purpose of expressing an opinion on the effectiveness of the City’s internal control. Accordingly, no such opinion is expressed.
• Evaluate the appropriateness of accounting policies used and the reasonableness of significant accounting estimates made by management, as well as evaluate the overall presentation of the financial statements.
• Conclude whether, in our judgment, there are conditions or events, considered in the aggregate, that raise substantial doubt about the City’s ability to continue as a going concern for a reasonable period of time.
We are required to communicate with those charged with governance regarding, among other matters, the planned scope and timing of the audit, significant audit findings, and certain internal control-related matters that we identified during the audit. Other Reporting Responsibilities Required Supplementary Information Accounting principles generally accepted in the United States of America require that the management’s discussion and analysis; the budgetary comparison schedules for the General Fund and Grants special revenue fund; and the required pension and other post-employment benefits schedules as listed in the table of contents be presented to supplement the basic financial statements. Such information is the responsibility of management and, although not a part of the basic financial statements, is required by the Governmental Accounting Standards Board, who considers it to be an essential part of financial reporting for placing the basic financial statements in an appropriate operational, economic, or historical context. We have applied certain limited procedures to the required supplementary information in accordance with auditing standards generally accepted in the United States of America, which consisted of inquiries of management about the methods of preparing the information and comparing the information for consistency with management’s responses to our inquiries, the basic financial statements, and other knowledge we obtained during our audit of the basic financial statements. We do not express an opinion or provide any assurance on the information because the limited procedures do not provide us with sufficient evidence to express an opinion or provide any assurance.

To the Honorable Mayor and Members of the City Council City of Malibu, California Supplementary Information Our audit was conducted for the purpose of forming opinions on the financial statements that collectively comprise the City’s basic financial statements. The combining and individual fund financial statements and schedules (supplementary information) are presented for purposes of additional analysis and are not a required part of the basic financial statements. Such information is the responsibility of management and was derived from and relates directly to the underlying accounting and other records used to prepare the financial statements. The information has been subjected to the auditing procedures applied in the audit of the basic financial statements and certain additional procedures, including comparing and reconciling such information directly to the underlying accounting and other records used to prepare the basic financial statements or to the basic financial statements themselves, and other additional procedures in accordance with auditing standards generally accepted in the United States of America. In our opinion, the supplementary information is fairly stated, in all material respects in relation to the basic financial statements as a whole. Other Information Management is responsible for the other information included in the annual report. The other information comprises the introductory section and statistical section of the Annual Comprehensive Financial Report but does not include the basic financial statements and our auditor’s report thereon. Our opinions on the financial statements does not cover the other information, and we do not express an opinion or any form of assurance thereon. In connection with our audit of the financial statements, our responsibility is to read the other information and consider whether a material inconsistency exists between the other information and the financial statements, or the other information otherwise appears to be materially misstated. If, based on the work performed, we conclude that an uncorrected material misstatement of the other information exists, we are required to describe it in our report. Other Reporting Required by Government Auditing Standards In accordance with Government Auditing Standards, we have also issued our report dated
December 28, 2021, on our consideration of the City’s internal control over financial reporting and on our tests of its compliance with certain provisions of laws, regulations, contracts, and grant agreements and other matters. The purpose of that report is solely to describe the scope of our testing of internal control over financial reporting and compliance and the results of that testing, and not to provide an opinion on the effectiveness of the City’s internal control over financial reporting or on compliance. That report is an integral part of an audit performed in accordance with Government Auditing Standards in considering the City’s
internal control over financial reporting and compliance.
Brea, California December 28, 2021

CITY OF MALIBU, CALIFORNIA MANAGEMENT’S DISCUSSION AND ANALYSIS
JUNE 30, 2021
As management of the City of Malibu, we offer readers of the City of Malibu’s financial statements this narrative overview and analysis of the financial activities for the fiscal year ended June 30, 2021. We encourage readers to consider the information presented here in conjunction with additional information that we have furnished in our letter of transmittal, which can be found in the introductory section of this report. Financial Highlights
Government-wide Statements:
Assets and deferred outflows of resources exceed liabilities and deferred inflows
of resources at the close of the year ended June 30, 2021 by $209.7 million (net position). Of this amount, $54.4 million (unrestricted net position) may be used to meet the government’s ongoing obligations to citizens and creditors.
The City’s total net position increased by $2.7 million as a result of revenues exceeding expenses.
Fund Level Statements:
As of June 30, 2021, the City’s governmental funds reported a combined ending fund balance of $59.6 million, an increase of $7.5 million over the prior year. Of this amount, $36.9 million is available for spending at the government’s discretion (unassigned fund balance).
As of June 30, 2021, the General Fund reported an ending fund balance of $58.0 million, an increase of $8.3 million over the prior year. Of this amount, $38.8 million is available for spending at the government’s discretion (unassigned fund balance).
As of June 30, 2021, the City’s proprietary funds reported a combined ending net position of $78.0 million, a decrease of $10.6 million from the prior year. Of this amount, $3.7 million is available for spending at the government’s discretion (unrestricted net position).
Overview of the Financial Statements
This discussion and analysis is required supplementary information and serves as an introduction to the City’s basic financial statements which are comprised of three components: 1) government-wide financial statements, 2) fund financial statements, and 3) notes to the financial statements. Other required supplementary information (RSI) follows the notes to the financial statements. This report also contains other supplementary information in addition to the basic financial statements and RSI. Government-wide financial statements. The government-wide financial statements are designed to provide readers with a broad overview of the City’s finances, in a manner similar to a private-sector business.
The statement of net position presents information on all of the City’s assets and deferred outflows of resources as well as on liabilities and deferred inflows of resources. The amount by which assets and deferred outflows of resources exceed liabilities and deferred inflows of resources is reported as net position. Over time, increases or decreases in net position may serve as a useful indicator of whether the financial position of the City of Malibu is improving or deteriorating.
7
CITY OF MALIBU, CALIFORNIA MANAGEMENT’S DISCUSSION AND ANALYSIS (Continued) June 30, 2021
The statement of activities presents information showing how the government’s net position changed during the most recent fiscal year. All changes in net position are reported as soon as the underlying event occurs, regardless of the timing of related cash flows. Thus, revenues and expenses are reported in this statement for some items that will only result in cash flows in future fiscal periods (e.g. uncollected grants and earned but unused vacation leave). Both of the government-wide financial statements distinguish functions of the City that are principally supported by taxes and intergovernmental revenues (governmental activities) from other functions that are intended to recover all or a significant portion of their costs through user fees and charges (business-type activities). The governmental activities of the City include legislative and advisory, general government, public safety, community development, community services, and public works. Business-type activities are comprised of commercial real estate rental properties and wastewater services. The government-wide financial statements are in this report’s financial section immediately following the Management’s Discussion and Analysis (MD&A). Fund financial statements. A fund is a grouping of related accounts that is used to maintain control over resources that have been segregated for specific activities or objectives. The City of Malibu, like other state and local governments, uses fund accounting to ensure and demonstrate compliance with finance-related legal requirements. All of the funds of the City can be divided into three categories: governmental funds, enterprise funds, and fiduciary funds. Governmental funds. Governmental funds are used to account for essentially the same functions reported as governmental activities in the government-wide financial statements. However, unlike the government-wide financial statements, governmental fund financial statements focus on near-term inflows and outflows of spendable resources, as well as on balances of spendable resources available at the end of the fiscal year. Such information may be useful in evaluating a government’s near-term financing requirements. Fund balance is categorized into a hierarchy of five classifications: non-spendable, restricted, committed, assigned, and unassigned. These categories facilitate analysis and understanding of the City’s commitment of financial resources. Because the focus of governmental funds is narrower than that of the government-wide financial statements, it is useful to compare the information presented for governmental funds with similar information presented for governmental activities in the government-wide financial statements. By doing so, readers may better understand the long-term impact of the government’s near-term financing decisions. Both the governmental fund balance sheet and governmental fund statement of revenues, expenditures, and changes in fund balances provide a reconciliation to facilitate this comparison between governmental funds and governmental activities. The City of Malibu maintains several individual governmental funds. Information is presented separately in the governmental fund balance sheet and in the governmental fund statement of revenues, expenditures, and changes in fund balances for the General Fund, the Grants Fund, and the Capital Improvements Fund, all of which are considered to be major funds. Data from all other governmental funds is combined into a single, aggregated presentation. Individual fund data for each of these non-major governmental funds is provided as supplementary information elsewhere in this report.
8
CITY OF MALIBU, CALIFORNIA MANAGEMENT’S DISCUSSION AND ANALYSIS (Continued) June 30, 2021
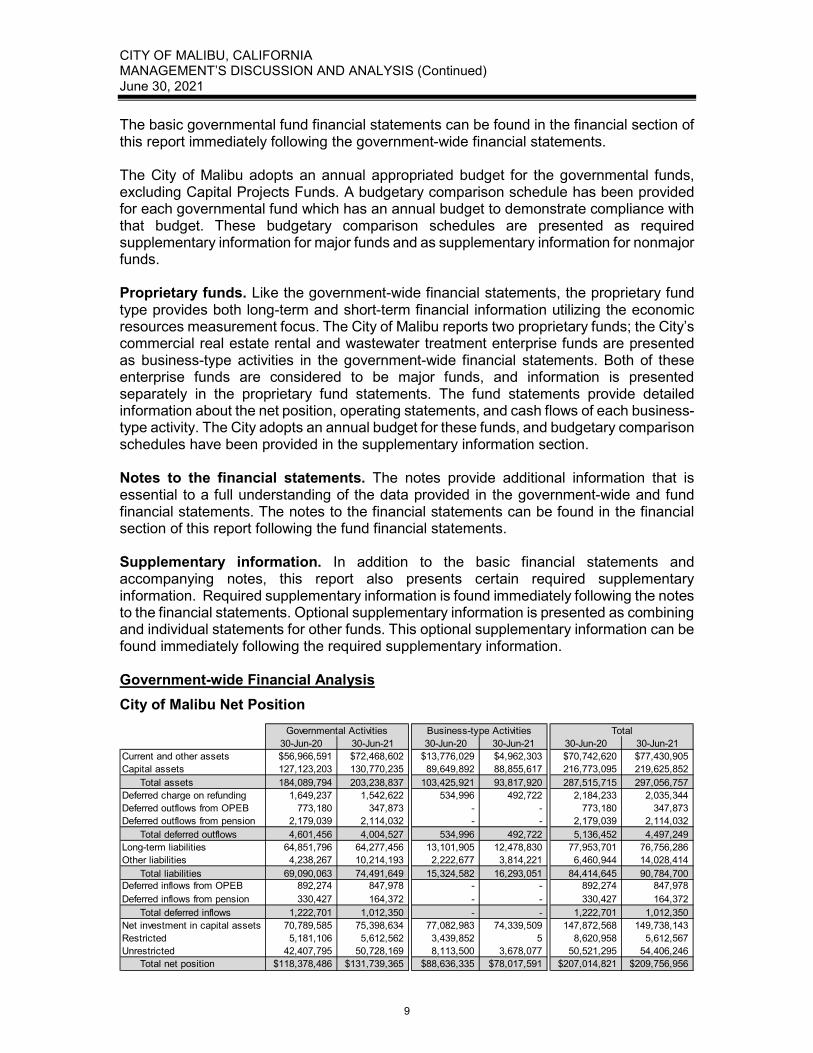
The basic governmental fund financial statements can be found in the financial section of this report immediately following the government-wide financial statements. The City of Malibu adopts an annual appropriated budget for the governmental funds, excluding Capital Projects Funds. A budgetary comparison schedule has been provided for each governmental fund which has an annual budget to demonstrate compliance with that budget. These budgetary comparison schedules are presented as required supplementary information for major funds and as supplementary information for nonmajor funds. Proprietary funds. Like the government-wide financial statements, the proprietary fund type provides both long-term and short-term financial information utilizing the economic resources measurement focus. The City of Malibu reports two proprietary funds; the City’s commercial real estate rental and wastewater treatment enterprise funds are presented as business-type activities in the government-wide financial statements. Both of these enterprise funds are considered to be major funds, and information is presented separately in the proprietary fund statements. The fund statements provide detailed information about the net position, operating statements, and cash flows of each business-type activity. The City adopts an annual budget for these funds, and budgetary comparison schedules have been provided in the supplementary information section. Notes to the financial statements. The notes provide additional information that is essential to a full understanding of the data provided in the government-wide and fund financial statements. The notes to the financial statements can be found in the financial section of this report following the fund financial statements. Supplementary information. In addition to the basic financial statements and accompanying notes, this report also presents certain required supplementary information. Required supplementary information is found immediately following the notes to the financial statements. Optional supplementary information is presented as combining and individual statements for other funds. This optional supplementary information can be found immediately following the required supplementary information. Government-wide Financial Analysis City of Malibu Net Position
30-Jun-20 30-Jun-21 30-Jun-20 30-Jun-21 30-Jun-20 30-Jun-21Current and other assets 56,966,591$ 72,468,602$ 13,776,029$ 4,962,303$ 70,742,620$ 77,430,905$ Capital assets 127,123,203 130,770,235 89,649,892 88,855,617 216,773,095 219,625,852
Total assets 184,089,794 203,238,837 103,425,921 93,817,920 287,515,715 297,056,757 Deferred charge on refunding 1,649,237 1,542,622 534,996 492,722 2,184,233 2,035,344 Deferred outflows from OPEB 773,180 347,873 - - 773,180 347,873 Deferred outflows from pension 2,179,039 2,114,032 - - 2,179,039 2,114,032
Total deferred outflows 4,601,456 4,004,527 534,996 492,722 5,136,452 4,497,249 Long-term liabilities 64,851,796 64,277,456 13,101,905 12,478,830 77,953,701 76,756,286 Other liabilities 4,238,267 10,214,193 2,222,677 3,814,221 6,460,944 14,028,414
Total liabilities 69,090,063 74,491,649 15,324,582 16,293,051 84,414,645 90,784,700 Deferred inflows from OPEB 892,274 847,978 - - 892,274 847,978 Deferred inflows from pension 330,427 164,372 - - 330,427 164,372
Total deferred inflows 1,222,701 1,012,350 - - 1,222,701 1,012,350 Net investment in capital assets 70,789,585 75,398,634 77,082,983 74,339,509 147,872,568 149,738,143 Restricted 5,181,106 5,612,562 3,439,852 5 8,620,958 5,612,567 Unrestricted 42,407,795 50,728,169 8,113,500 3,678,077 50,521,295 54,406,246
Total net position 118,378,486$ 131,739,365$ 88,636,335$ 78,017,591$ 207,014,821$ 209,756,956$
Governmental Activities Business-type Activities Total
9
CITY OF MALIBU, CALIFORNIA MANAGEMENT’S DISCUSSION AND ANALYSIS (Continued) June 30, 2021
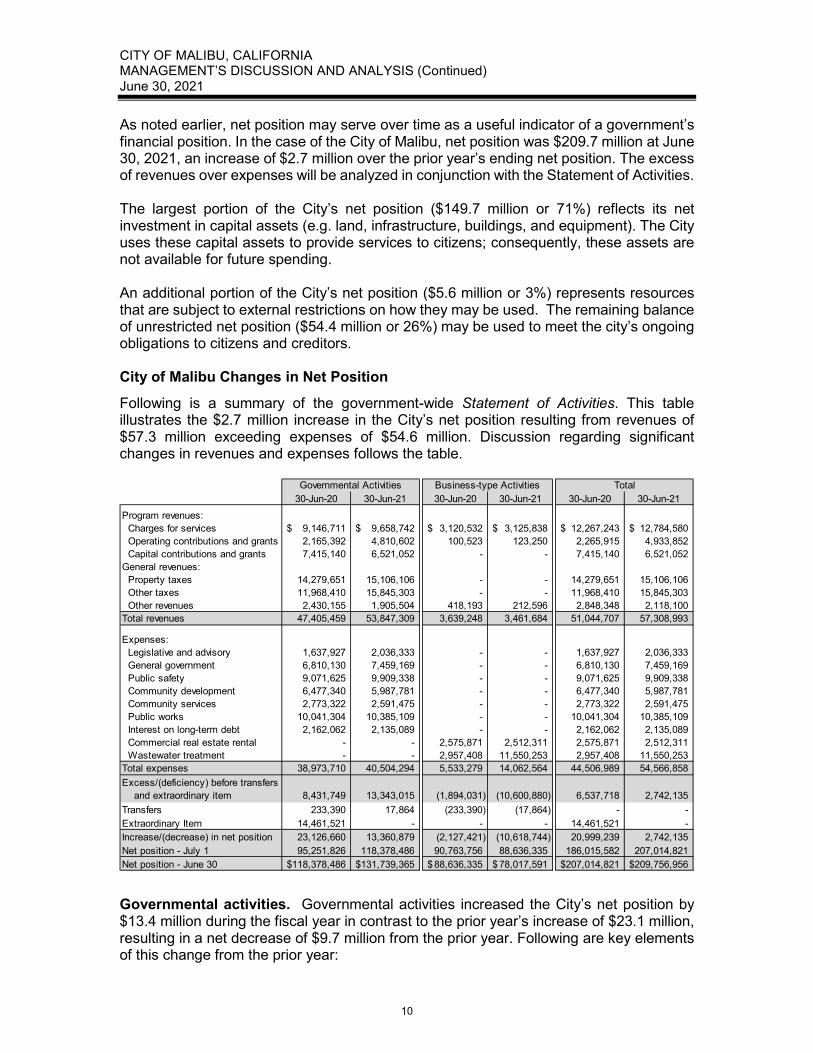
As noted earlier, net position may serve over time as a useful indicator of a government’s financial position. In the case of the City of Malibu, net position was $209.7 million at June 30, 2021, an increase of $2.7 million over the prior year’s ending net position. The excess of revenues over expenses will be analyzed in conjunction with the Statement of Activities. The largest portion of the City’s net position ($149.7 million or 71%) reflects its net investment in capital assets (e.g. land, infrastructure, buildings, and equipment). The City uses these capital assets to provide services to citizens; consequently, these assets are not available for future spending. An additional portion of the City’s net position ($5.6 million or 3%) represents resources that are subject to external restrictions on how they may be used. The remaining balance of unrestricted net position ($54.4 million or 26%) may be used to meet the city’s ongoing obligations to citizens and creditors. City of Malibu Changes in Net Position Following is a summary of the government-wide Statement of Activities. This table illustrates the $2.7 million increase in the City’s net position resulting from revenues of $57.3 million exceeding expenses of $54.6 million. Discussion regarding significant changes in revenues and expenses follows the table.
Governmental activities. Governmental activities increased the City’s net position by $13.4 million during the fiscal year in contrast to the prior year’s increase of $23.1 million, resulting in a net decrease of $9.7 million from the prior year. Following are key elements of this change from the prior year:
30-Jun-20 30-Jun-21 30-Jun-20 30-Jun-21 30-Jun-20 30-Jun-21Program revenues: Charges for services 9,146,711$ 9,658,742$ 3,120,532$ 3,125,838$ 12,267,243$ 12,784,580$ Operating contributions and grants 2,165,392 4,810,602 100,523 123,250 2,265,915 4,933,852 Capital contributions and grants 7,415,140 6,521,052 - - 7,415,140 6,521,052 General revenues: Property taxes 14,279,651 15,106,106 - - 14,279,651 15,106,106 Other taxes 11,968,410 15,845,303 - - 11,968,410 15,845,303 Other revenues 2,430,155 1,905,504 418,193 212,596 2,848,348 2,118,100 Total revenues 47,405,459 53,847,309 3,639,248 3,461,684 51,044,707 57,308,993
Expenses: Legislative and advisory 1,637,927 2,036,333 - - 1,637,927 2,036,333 General government 6,810,130 7,459,169 - - 6,810,130 7,459,169 Public safety 9,071,625 9,909,338 - - 9,071,625 9,909,338 Community development 6,477,340 5,987,781 - - 6,477,340 5,987,781 Community services 2,773,322 2,591,475 - - 2,773,322 2,591,475 Public works 10,041,304 10,385,109 - - 10,041,304 10,385,109 Interest on long-term debt 2,162,062 2,135,089 - - 2,162,062 2,135,089 Commercial real estate rental - - 2,575,871 2,512,311 2,575,871 2,512,311 Wastewater treatment - - 2,957,408 11,550,253 2,957,408 11,550,253 Total expenses 38,973,710 40,504,294 5,533,279 14,062,564 44,506,989 54,566,858 Excess/(deficiency) before transfers and extraordinary item 8,431,749 13,343,015 (1,894,031) (10,600,880) 6,537,718 2,742,135 Transfers 233,390 17,864 (233,390) (17,864) - - Extraordinary Item 14,461,521 - - - 14,461,521 - Increase/(decrease) in net position 23,126,660 13,360,879 (2,127,421) (10,618,744) 20,999,239 2,742,135 Net position - July 1 95,251,826 118,378,486 90,763,756 88,636,335 186,015,582 207,014,821 Net position - June 30 118,378,486$ 131,739,365$ 88,636,335$ 78,017,591$ 207,014,821$ 209,756,956$
Governmental Activities Business-type Activities Total
10
CITY OF MALIBU, CALIFORNIA MANAGEMENT’S DISCUSSION AND ANALYSIS (Continued) June 30, 2021
During the prior year, the City reported an extraordinary gain for net one-time settlements of $14.5 million, net of a $1.4 million permanent loss to capital assets. The settlements were due to claims filed by the City as a result of the prior year Woolsey Fire and subsequent storms.
During the current year, revenues increased by $6.4 million. The most significant
changes were as follows:
• Operating grants increased by $2.6 million. The City recorded $2.0 million in disaster recovery non-capital grants that were for COVID-related activities and administrative activities from the fire and storm disasters. In addition, the city recorded $0.2 million in CARES Act funding for pandemic-related recovery activities and $0.4 million in grants and contributions for environmental activities related to the clean water program.
• Capital grants decreased by $0.9 million. In the prior year, the City recorded $1.2 million of disaster recovery grants for damages sustained during the Woolsey Fire and subsequent storms, $1.0 million in capital construction grants, and $5.1 million in capital assets donated mainly from developers. In the current year, the City recorded $1.0 million of disaster recovery grants for Woolsey Fire and storm damages and $5.4 million in capital construction grants.
• Other tax revenues increased by a total of $3.9 million due to increased revenues
from transient occupancy taxes of $2.9 million resulting from increased enforcement of private rental transient occupancy taxes and an increase to the transient occupancy tax rate for the last half of the year. In addition property transfer taxes increased by $1.0 million.
• Property taxes increased by $0.8 million due to higher assessed values. Expenses increased by $1.5 million, a 4% increase over the prior year. Due to the
COVID-19 pandemic, the City shifted costs among departments in order to continue providing the highest level of service to the community. The most significant changes were as follows:
• Legislative costs increased by $0.4 million due to increased litigation and
investigation costs as well as for work related to the school district separation or unification process.
• General government costs increased by $0.7 million mainly due to annual pension and OPEB adjustments resulting from updated actuarial valuations. Additionally, costs are higher in the City Manager division as a result of employee turnover.
• Public safety costs increased by $0.8 million due to paying higher contracted fees
for Los Angeles County Sheriff services, performing increased homeless support services specifically for homeless encampment clean-up, and installing fire Beacon Boxes throughout specific neighborhoods and along Pacific Coast Highway.
• Public works costs increased by $0.3 million over the prior year. The City has made
a strong commitment to rebuilding from the Woolsey Fire. The majority of the
11
CITY OF MALIBU, CALIFORNIA MANAGEMENT’S DISCUSSION AND ANALYSIS (Continued) June 30, 2021
increased public works costs are attributable to the rebuilding and recovery efforts, such as increased costs for consultants, debris removal, and infrastructure repair. In addition, the City has continued with essential capital projects that are not related to the recovery effort that are in the City’s capital improvements plan.
• Community development costs decreased by $0.5 million mainly due to reducing professional services used for Woolsey Fire rebuild activities. This reduction is offset somewhat by increased professional services required for the mandated update to the clean water program. A portion of the clean water program costs are funded by contributions from Los Angeles County.
• Community services expenses decreased by $0.2 million as a result of fewer
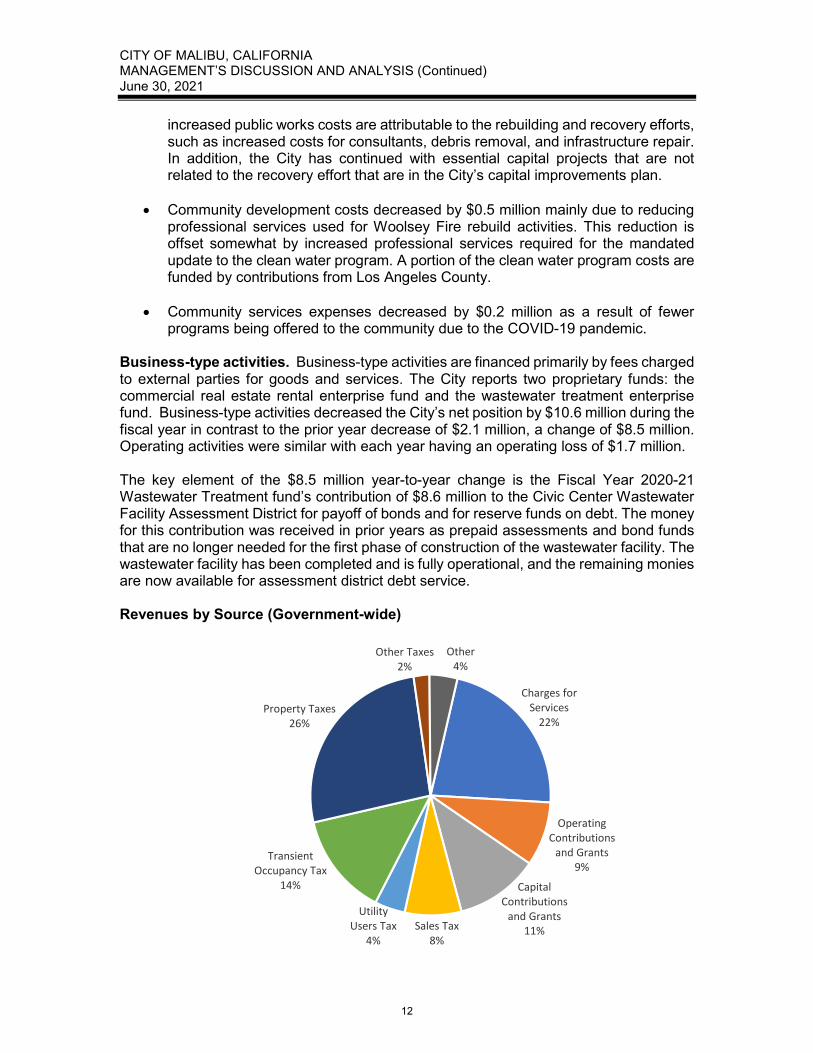
programs being offered to the community due to the COVID-19 pandemic. Business-type activities. Business-type activities are financed primarily by fees charged to external parties for goods and services. The City reports two proprietary funds: the commercial real estate rental enterprise fund and the wastewater treatment enterprise fund. Business-type activities decreased the City’s net position by $10.6 million during the fiscal year in contrast to the prior year decrease of $2.1 million, a change of $8.5 million. Operating activities were similar with each year having an operating loss of $1.7 million. The key element of the $8.5 million year-to-year change is the Fiscal Year 2020-21 Wastewater Treatment fund’s contribution of $8.6 million to the Civic Center Wastewater Facility Assessment District for payoff of bonds and for reserve funds on debt. The money for this contribution was received in prior years as prepaid assessments and bond funds that are no longer needed for the first phase of construction of the wastewater facility. The wastewater facility has been completed and is fully operational, and the remaining monies are now available for assessment district debt service. Revenues by Source (Government-wide)
Charges for Services
22%
Operating Contributions
and Grants9%
Capital Contributions
and Grants11%Sales Tax
8%
UtilityUsers Tax
4%
Transient Occupancy Tax
14%
Property Taxes26%
Other Taxes2%
Other4%
12
CITY OF MALIBU, CALIFORNIA MANAGEMENT’S DISCUSSION AND ANALYSIS (Continued) June 30, 2021
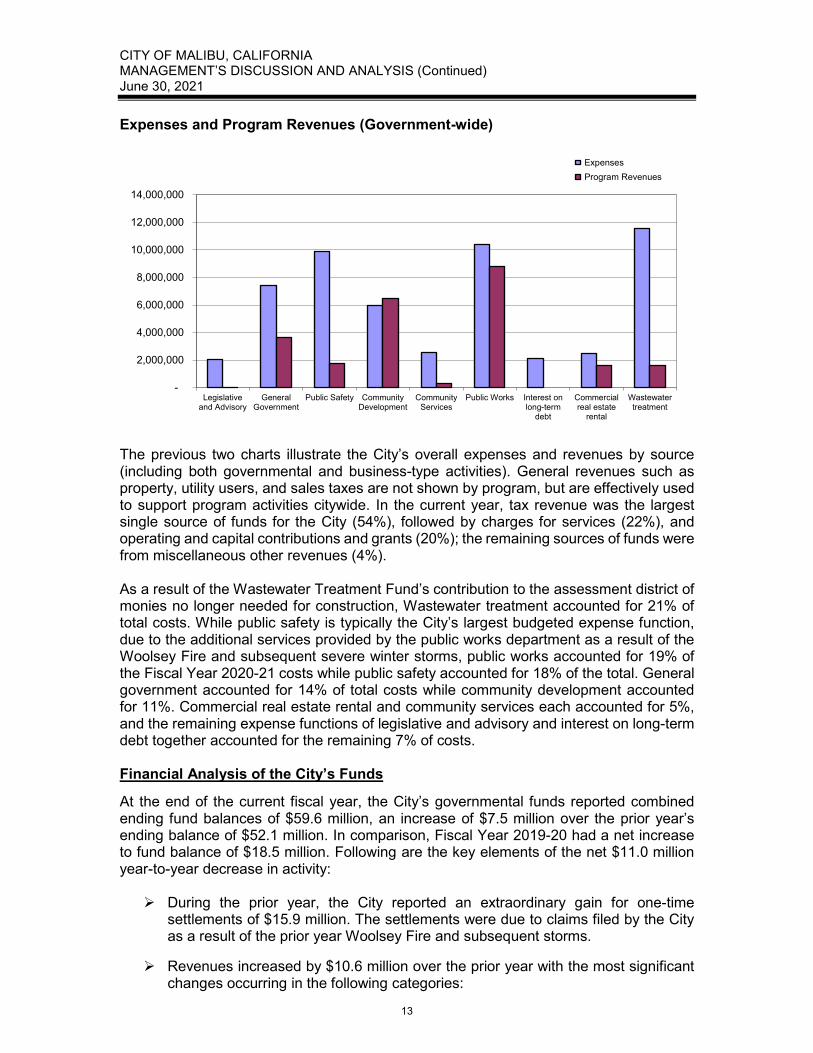
Expenses and Program Revenues (Government-wide)
The previous two charts illustrate the City’s overall expenses and revenues by source (including both governmental and business-type activities). General revenues such as property, utility users, and sales taxes are not shown by program, but are effectively used to support program activities citywide. In the current year, tax revenue was the largest single source of funds for the City (54%), followed by charges for services (22%), and operating and capital contributions and grants (20%); the remaining sources of funds were from miscellaneous other revenues (4%). As a result of the Wastewater Treatment Fund’s contribution to the assessment district of monies no longer needed for construction, Wastewater treatment accounted for 21% of total costs. While public safety is typically the City’s largest budgeted expense function, due to the additional services provided by the public works department as a result of the Woolsey Fire and subsequent severe winter storms, public works accounted for 19% of the Fiscal Year 2020-21 costs while public safety accounted for 18% of the total. General government accounted for 14% of total costs while community development accounted for 11%. Commercial real estate rental and community services each accounted for 5%, and the remaining expense functions of legislative and advisory and interest on long-term debt together accounted for the remaining 7% of costs. Financial Analysis of the City’s Funds At the end of the current fiscal year, the City’s governmental funds reported combined ending fund balances of $59.6 million, an increase of $7.5 million over the prior year’s ending balance of $52.1 million. In comparison, Fiscal Year 2019-20 had a net increase to fund balance of $18.5 million. Following are the key elements of the net $11.0 million year-to-year decrease in activity: During the prior year, the City reported an extraordinary gain for one-time
settlements of $15.9 million. The settlements were due to claims filed by the City as a result of the prior year Woolsey Fire and subsequent storms.
Revenues increased by $10.6 million over the prior year with the most significant
changes occurring in the following categories:
-
2,000,000
4,000,000
6,000,000
8,000,000
10,000,000
12,000,000
14,000,000
Legislativeand Advisory
GeneralGovernment
Public Safety CommunityDevelopment
CommunityServices
Public Works Interest onlong-term
debt
Commercialreal estate
rental
Wastewatertreatment
Expenses Program Revenues
13
CITY OF MALIBU, CALIFORNIA MANAGEMENT’S DISCUSSION AND ANALYSIS (Continued) June 30, 2021
• Taxes increased by $5.7 million. Property taxes increased by $0.8 million from higher assessed values; transient occupancy taxes increased by $2.9 million resulting from increased enforcement of private rental transient occupancy taxes and an increase to the transient occupancy tax rate for the last half of the year; sales taxes increased by $0.5 million; and property transfer taxes increased by $1.0 million. Utility users tax, franchise fees, and parking taxes all had smaller increases and combine to account for the remaining increase.
• Intergovernmental revenues increased by $5.9 million. The components of this
increase are from different amounts of grants and similar types of intergovernmental funding. In the current year, the City recorded $1.6 million in disaster recovery grants, $5.0 million for capital improvement projects, $0.6 million in contributions for environmental activities related to the clean water program, $0.2 million from CARES Act funding for the COVID-19 pandemic recovery, and $0.4 million from the new Los Angeles County Measure W funding. In contrast, in the prior year, the City recorded $0.6 million in disaster recovery grants, $1.0 million in grant for capital improvement projects, and $0.3 million for contributions for environmental activities.
• Interest income decreased by $1.1 million as a result of 1) lower interest rates
throughout the year and 2) rising interest rates late in the fiscal year, resulting in a drop in fair value as of June 30; this decreased the value of unrealized gains, which in turn substantially reduced investment income for the year.
Expenditures increased by $5.5 million in the following categories:
• Small changes in legislative and advisory, community development, and
community services categories totaling a combined decrease of $0.3 million.
• General government costs increased by $0.5 million. Costs are higher in the City Manager division as a result of employee turnover. In addition, higher insurance and CalPERS rates resulted in higher general government costs.
• Public safety costs increased by $0.8 million due to paying higher contracted
fees for Los Angeles County Sheriff services, performing increased homeless support services specifically for homeless encampment clean-up, and installing fire Beacon Boxes throughout specific neighborhoods and along Pacific Coast Highway.
• Public works costs decreased by $0.7 million from the prior year. The prior year
had higher costs for consultants, debris removal, and non-capital infrastructure repair resulting from the Woolsey Fire.
• Capital outlay increased by $5.2 million over the prior year. The City has made
a strong commitment to rebuilding from the Woolsey Fire. The majority of the increased capital outlay costs are attributable to the rebuilding and recovery efforts. In addition, in the current year the City has continued with essential capital projects that are not related to the recovery effort that are in the City’s capital improvements plan.
Other financing sources and uses decreased by $0.2 million from lower transfers
from the enterprise funds.
14

CITY OF MALIBU, CALIFORNIA MANAGEMENT’S DISCUSSION AND ANALYSIS (Continued) June 30, 2021
The governmental funds’ combined ending fund balance totals $59.6 million. Approximately 62% ($36.9 million) of this amount constitutes unassigned fund balance which is available for spending at the City’s discretion. The remainder of the combined ending fund balances is non-spendable, restricted, committed or assigned to indicate that it is not available for new spending because it has already been designated as: 1) Non-spendable for prepaid items and long-term receivables ($0.6 million), 2) Restricted for special revenue funds, debt service, and other specific purposes ($3.4 million), 3) Committed for capital improvement projects, city facilities, and water quality improvements ($2.2 million), 4) Assigned for vehicle and technology replacement, working capital, next year’s operations, and fire rebuilding efforts ($16.5 million). General Fund. The General Fund is the chief operating fund of the City of Malibu and comprises approximately 84% of the governmental expenditures of the City. At the end of the current fiscal year, the unassigned fund balance of the General Fund was $38.8 million while the total fund balance was $58.0 million. The City Council assigned $6.5 million of the General Fund’s fund balance for Fiscal Year 2021-22 operating expenditures. As a measure of the General Fund’s liquidity, it may be useful to compare unassigned fund balance to total fund expenditures. The General Fund’s unassigned fund balance represents 104% of the General Fund’s Fiscal Year 2020-21 expenditures. The General Fund’s fund balance increased in Fiscal Year 2020-21 by $8.3 million, while the prior year’s fund balance increased by $17.3 million. Because the General Fund comprises such a large part of the overall governmental revenues and expenditures of the City, many of the reasons for this $9.0 million year-to-year change in the General Fund are similar to the reasons previously explained as changes in the overall governmental funds. During the prior year, the City reported an extraordinary gain for one-time
settlements of $15.9 million. The settlements were due to claims filed by the City as a result of the prior year Woolsey Fire and subsequent storms.
Revenues increased by $6.2 million with the most significant changes occurring in
the following categories:
• Taxes increased by $5.7 million. Property taxes increased by $0.8 million from higher assessed values; transient occupancy taxes increased by $2.9 million resulting from increased enforcement of private rental transient occupancy taxes and an increase to the transient occupancy tax rate for the last half of the year; sales taxes increased by $0.5 million; and property transfer taxes increased by $1.0 million. Utility users tax, franchise fees, and parking taxes all had smaller increases and combine to account for the remaining increase.
• Intergovernmental revenues increased by $1.5 million. The components of this
increase are from different amounts of grants and similar types of intergovernmental funding. In the current year, the City recorded $1.6 million in disaster recovery grants, $0.6 million in contributions for environmental activities related to the clean water program, and $0.2 million from CARES Act funding for the COVID-19 pandemic recovery. In contrast, in the prior year the City recorded $0.6 million in disaster recovery grants and $0.3 million for contributions for environmental activities.
15
CITY OF MALIBU, CALIFORNIA MANAGEMENT’S DISCUSSION AND ANALYSIS (Continued) June 30, 2021
• Interest income decreased by $1.1 million as a result of 1) lower interest rates throughout the year and 2) rising interest rates late in Fiscal Year 2020-21, resulting in a drop in fair value as of June 30; this decreased the value of unrealized gains, which in turn substantially reduced investment income for the year.
Expenditures increased by $0.9 million in the following categories:
• Small changes in legislative and advisory, community development, and
community services categories totaling a combined decrease of $0.2 million.
• General government costs increased by $0.5 million. Costs are higher in the City Manager division as a result of employee turnover. In addition, higher insurance and CalPERS rates have resulted in higher general government costs.
• Public safety costs increased by $0.8 million due to paying higher contracted
fees for Los Angeles County Sheriff services, performing increased homeless support services specifically for homeless encampment clean-up, and installing fire Beacon Boxes throughout specific neighborhoods and along Pacific Coast Highway.
• Public works costs decreased by $0.8 million from the prior year. The prior year
had higher costs for consultants, debris removal, and non-capital infrastructure repair resulting from the Woolsey Fire.
• Capital outlay increased by $0.6 million over the prior year. The City has made
a strong commitment to rebuilding from the Woolsey Fire. The majority of the increased capital outlay costs are attributable to the rebuilding and recovery efforts.
Other financing sources and uses increased by $1.65 million due to higher
transfers from other funds in the current year.
Grants Special Revenue Fund. This fund is used to account for grants received from other governmental agencies. The majority of funds received are transferred to the Capital Improvements Fund for capital project funding. The deficit fund balance at fiscal year-end is expected to be eliminated with grant revenue. Capital Improvements Capital Projects Fund. This fund is used to account for the acquisition, construction, and repair of major facilities and is fully funded by monies transferred from other funds. Commercial Real Estate Rental Enterprise Fund. This fund is used to account for the commercial real estate rental activity. All revenues and expenses are for the commercial real estate rental program. Activity does not vary much from year to year as the properties have long-term rental leases. Additional information on the rental leases can be found in the Operating Leases–City as Lessor Note (Note 6) of the notes to the financial statements.
16
CITY OF MALIBU, CALIFORNIA MANAGEMENT’S DISCUSSION AND ANALYSIS (Continued) June 30, 2021
Wastewater Treatment Enterprise Fund. This fund is used to account for the construction and operation of a wastewater treatment facility. Phase One of the construction was completed in early Fiscal Year 2018-19, and customers in the civic center area are connected to the new facility. The City is currently designing Phase Two of the facility. Operating activities are stable with both the current and prior year having a net operating loss of $1.3 million. In Fiscal Year 2020-21, the Wastewater Treatment fund contributed $8.6 million to the Civic Center Wastewater Facility Assessment District for payoff of bonds and for reserve funds on debt. The money for this contribution was received in prior years as prepaid assessments and bond funds that are no longer needed for the first phase of construction of the wastewater facility. The wastewater facility has been completed and is fully operational, and the remaining monies are now available for assessment district debt service. Budgetary Highlights In preparing its budgets, the City attempts to estimate its revenues using realistic but conservative methods so as to budget its expenditure appropriations and activities in a prudent manner. As a result, the City Council adopts budget adjustments throughout the fiscal year to reflect both changed priorities and availability of additional revenues to allow for expansion of existing programs. During the year, the City Council amended the originally adopted budget to re-appropriate prior year approved projects and expenditures in addition to increasing appropriations for various items as identified in the Notes to Required Supplementary Information. The majority of the year’s budget adjustments were related to adjusting expenditures for reappropriations and to adjusting expenditures and revenues for revised estimates as the City began to come out of the State and County COVID-19 pandemic restrictions. General Fund. The General Fund had a $13.4 million positive net budget variance for revenues and expenditures when comparing actual amounts to the final budget for the current fiscal year. This amount reflects a positive variance of $9.9 million in revenues and $3.5 million in expenditures. The positive revenue variance resulted from actual revenues exceeding the budget for all categories except intergovernmental and use of money and property. The largest variance of $8.5 million is attributed to tax revenues. The positive expenditure variance resulted from expenditures coming in under the final budget in all categories except for debt service interest. The largest variance was $1.9 million in capital outlay. Capital Asset and Debt Administration Capital assets. The City’s capital assets for governmental and business type activities as of June 30, 2021, total $219.6 million (net of accumulated depreciation), a net increase of $2.9 million. The capital assets include land, intangible assets, roadways, buildings, leasehold improvements, storm drains, vehicles, computer equipment, furniture, other equipment, and construction in progress. Capital asset additions totaled $6.9 million, net deletions were zero and depreciation expense totaled $4.0 million.
17
CITY OF MALIBU, CALIFORNIA MANAGEMENT’S DISCUSSION AND ANALYSIS (Continued) June 30, 2021
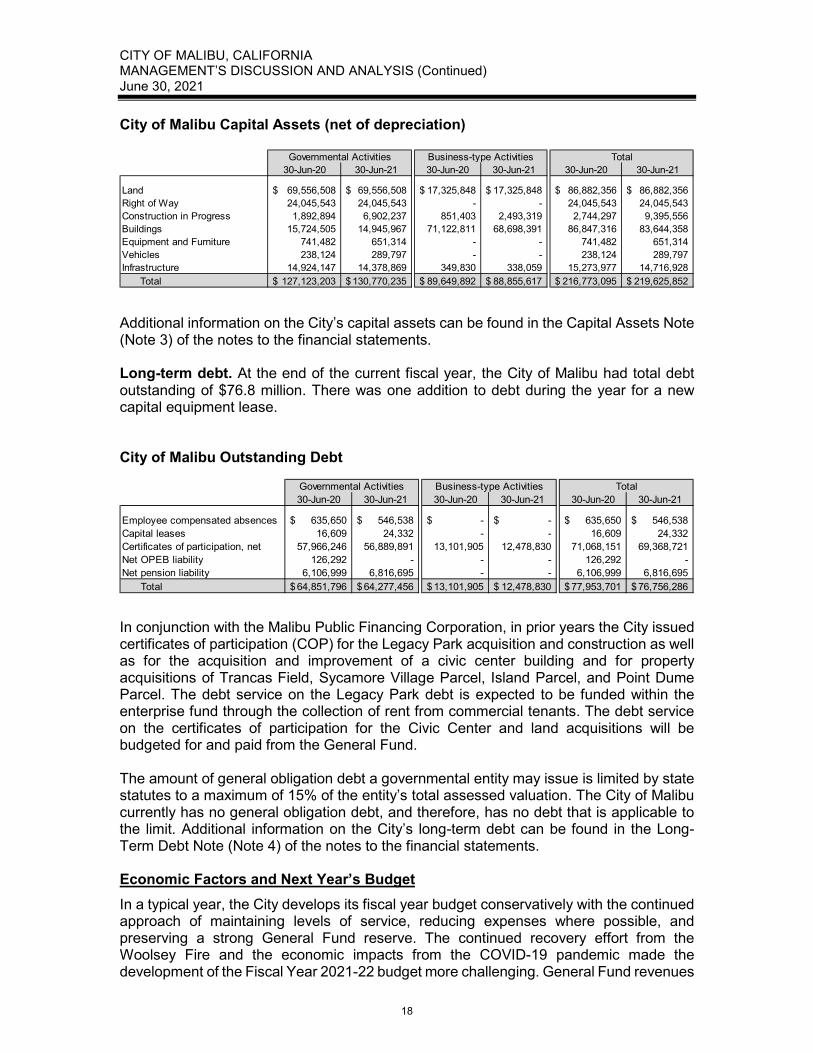
City of Malibu Capital Assets (net of depreciation)
Additional information on the City’s capital assets can be found in the Capital Assets Note (Note 3) of the notes to the financial statements. Long-term debt. At the end of the current fiscal year, the City of Malibu had total debt outstanding of $76.8 million. There was one addition to debt during the year for a new capital equipment lease. City of Malibu Outstanding Debt
In conjunction with the Malibu Public Financing Corporation, in prior years the City issued certificates of participation (COP) for the Legacy Park acquisition and construction as well as for the acquisition and improvement of a civic center building and for property acquisitions of Trancas Field, Sycamore Village Parcel, Island Parcel, and Point Dume Parcel. The debt service on the Legacy Park debt is expected to be funded within the enterprise fund through the collection of rent from commercial tenants. The debt service on the certificates of participation for the Civic Center and land acquisitions will be budgeted for and paid from the General Fund. The amount of general obligation debt a governmental entity may issue is limited by state statutes to a maximum of 15% of the entity’s total assessed valuation. The City of Malibu currently has no general obligation debt, and therefore, has no debt that is applicable to the limit. Additional information on the City’s long-term debt can be found in the Long-Term Debt Note (Note 4) of the notes to the financial statements. Economic Factors and Next Year’s Budget In a typical year, the City develops its fiscal year budget conservatively with the continued approach of maintaining levels of service, reducing expenses where possible, and preserving a strong General Fund reserve. The continued recovery effort from the Woolsey Fire and the economic impacts from the COVID-19 pandemic made the development of the Fiscal Year 2021-22 budget more challenging. General Fund revenues
30-Jun-20 30-Jun-21 30-Jun-20 30-Jun-21 30-Jun-20 30-Jun-21
Land 69,556,508$ 69,556,508$ 17,325,848$ 17,325,848$ 86,882,356$ 86,882,356$ Right of Way 24,045,543 24,045,543 - - 24,045,543 24,045,543 Construction in Progress 1,892,894 6,902,237 851,403 2,493,319 2,744,297 9,395,556 Buildings 15,724,505 14,945,967 71,122,811 68,698,391 86,847,316 83,644,358 Equipment and Furniture 741,482 651,314 - - 741,482 651,314 Vehicles 238,124 289,797 - - 238,124 289,797 Infrastructure 14,924,147 14,378,869 349,830 338,059 15,273,977 14,716,928
Total 127,123,203$ 130,770,235$ 89,649,892$ 88,855,617$ 216,773,095$ 219,625,852$
Governmental Activities Business-type Activities Total
30-Jun-20 30-Jun-21 30-Jun-20 30-Jun-21 30-Jun-20 30-Jun-21
Employee compensated absences 635,650$ 546,538$ -$ -$ 635,650$ 546,538$ Capital leases 16,609 24,332 - - 16,609 24,332 Certificates of participation, net 57,966,246 56,889,891 13,101,905 12,478,830 71,068,151 69,368,721 Net OPEB liability 126,292 - - - 126,292 - Net pension liability 6,106,999 6,816,695 - - 6,106,999 6,816,695
Total 64,851,796$ 64,277,456$ 13,101,905$ 12,478,830$ 77,953,701$ 76,756,286$
Business-type Activities TotalGovernmental Activities
18
CITY OF MALIBU, CALIFORNIA MANAGEMENT’S DISCUSSION AND ANALYSIS (Continued) June 30, 2021
are predicted to be less than General Fund operating expenditures. To offset this expected decline in revenues, the City Council set aside a $6.5 million General Fund Designated Reserve for Fiscal Year 2021-22 operating expenditures from higher than predicted revenues in Fiscal Year 2020-21. The City Council adopted a resolution further extending the waiving of permit fees through December 30, 2023 for all like-for-like and like-for-like plus 10% of Woolsey Fire rebuilds for properties that were primary residences at the time of the fire. The City continues to use extra consultant resources to expedite the permitting process for these destroyed homes. The Fiscal Year 2021-22 budget presents a prudent financial plan, with total budgeted revenues of $84.9 million and total budgeted appropriations of $91.5 million. City staff continues to carefully monitor the ongoing effects of the COVID-19 pandemic and will bring any necessary budget changes to the City Council. General Fund Revenues. As the State and County continue to ease the restrictions put in place due to the COVID-19 pandemic, the City’s General Fund revenues for Fiscal Year 2021-22 are budgeted to increase conservatively over the prior year. Property tax remains steady and provides over 40% of the General Fund Revenue. Other taxes including transient occupancy tax and sales tax are budgeted to increase by a combined amount of $2.1 million over the prior year’s budget. Additionally, revenues from Licenses and Permits and revenue from Service Charges are projected to increase by $861,000 combined. The City also received the first $1.4 million payment from the American Rescue Plan Act. Overall General Fund revenues are budgeted at $38.7 million. General Fund Expenditures. The City’s General Fund expenditures for Fiscal Year 2021-22 are budgeted to be $40.5 million. Using the ARPA funds, 7.5 positions were added to restore pre-pandemic staffing levels. Funding was also maintained for critical budget items including debt service, property insurance, law enforcement services, and professional services for mandated activities. Capital Improvements. The City has adopted an ambitious multi-year capital improvement program with the next fiscal year’s costs totaling $36.72 million. The City has minimized the use of General Fund dollars for these projects. Major projects budgeted for Fiscal Year 2021-22 include: $16.5 million for Civic Center Water Treatment Facility – Phase Two $4.3 million for PCH Median Improvements $9.8 million for PCH Signal Synchronization System $3.9 million for improvements to Westward Beach Road
The City also plans to continue capital improvement projects related to restoration of City infrastructure damaged in the Woolsey Fire and the subsequent severe winter storms. FEMA and CalOES will reimburse the City for much of the cost of these projects, but costs will be drawn against the General Fund until reimbursement is received. The City’s required match for these projects will come from the SCE Woolsey Fire settlement funds. Additional funding was received from California JPIA, the City’s insurance policy, for repairs at Trancas Canyon Park and the Broad Beach biofiltration system. The major projects planned for Fiscal Year 2021-22 include:
19
CITY OF MALIBU, CALIFORNIA MANAGEMENT’S DISCUSSION AND ANALYSIS (Continued) June 30, 2021
$608,000 for Latigo Canyon Road and Retaining Wall $831,000 for Park Restoration at Trancas Park $539,000 for Broad Beach Water Quality Improvements $400,000 for Outdoor Warning Sirens - Design $500,000 for Malibu Park Stormdrain Improvements
General Fund Reserve. The City Council remains committed to maintaining a strong unassigned General Fund reserve to provide a buffer against unforeseen expenditures. This ongoing commitment allowed the City to put additional resources in place quickly in the aftermath of the Woolsey Fire and to maintain services during the ongoing COVID-19 pandemic. Requests for Information This financial report is designed to provide a general overview of the financial position of the City of Malibu for all those with an interest in the government’s finances. Questions concerning any of the information provided in this report or requests for additional financial information should be addressed to the Management and Administration Department, 23825 Stuart Ranch Road, Malibu, California 90265.
20
BASIC FINANCIAL STATEMENTS
The City’s basic financial statements, including the accompanying notes, constitute the core of the ACFR’s financial section. The Basic Financial Statements include the following: • Government-wide Financial Statements • Fund Financial Statements • Notes to Basic Financial Statements
Major funds reported in the Basic Financial Statements are defined in note 1 of the notes to the Basic Financial Statements.

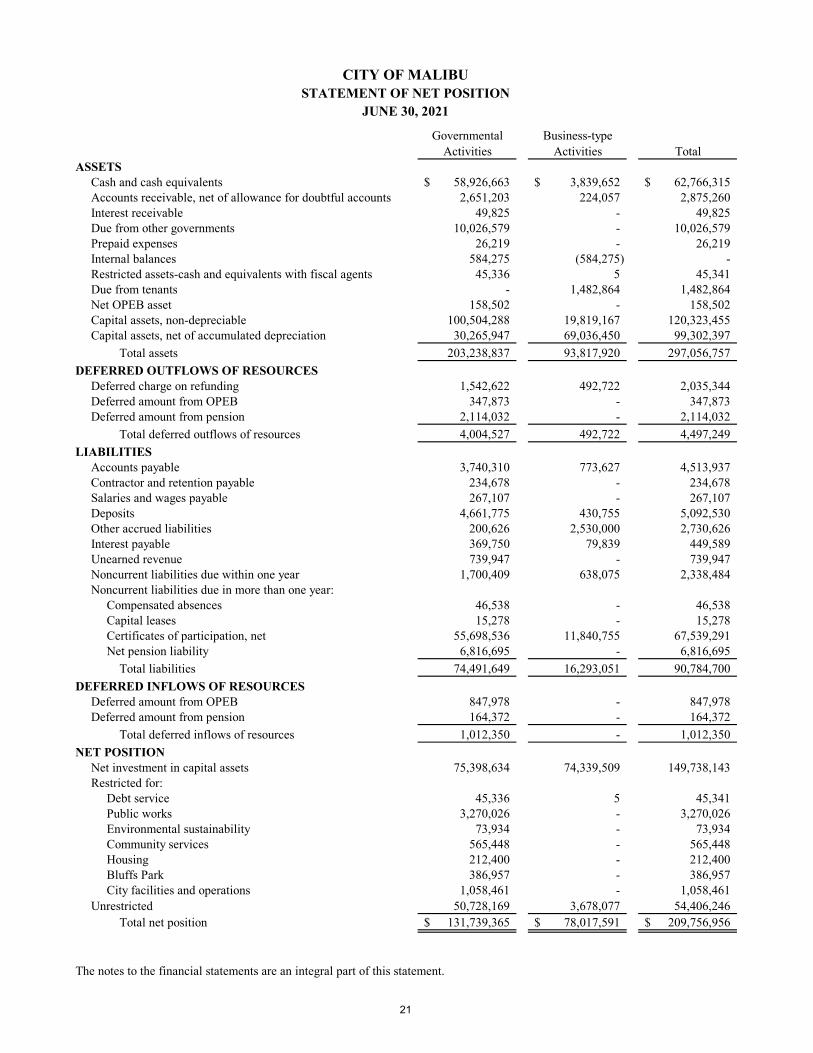
CITY OF MALIBUSTATEMENT OF NET POSITION
JUNE 30, 2021
Governmental Business-typeActivities Activities Total
ASSETSCash and cash equivalents 58,926,663$ 3,839,652$ 62,766,315$ Accounts receivable, net of allowance for doubtful accounts 2,651,203 224,057 2,875,260 Interest receivable 49,825 - 49,825 Due from other governments 10,026,579 - 10,026,579 Prepaid expenses 26,219 - 26,219 Internal balances 584,275 (584,275) - Restricted assets-cash and equivalents with fiscal agents 45,336 5 45,341 Due from tenants - 1,482,864 1,482,864 Net OPEB asset 158,502 - 158,502 Capital assets, non-depreciable 100,504,288 19,819,167 120,323,455 Capital assets, net of accumulated depreciation 30,265,947 69,036,450 99,302,397
Total assets 203,238,837 93,817,920 297,056,757 DEFERRED OUTFLOWS OF RESOURCES
Deferred charge on refunding 1,542,622 492,722 2,035,344 Deferred amount from OPEB 347,873 - 347,873 Deferred amount from pension 2,114,032 - 2,114,032
Total deferred outflows of resources 4,004,527 492,722 4,497,249 LIABILITIES
Accounts payable 3,740,310 773,627 4,513,937 Contractor and retention payable 234,678 - 234,678 Salaries and wages payable 267,107 - 267,107 Deposits 4,661,775 430,755 5,092,530 Other accrued liabilities 200,626 2,530,000 2,730,626 Interest payable 369,750 79,839 449,589 Unearned revenue 739,947 - 739,947 Noncurrent liabilities due within one year 1,700,409 638,075 2,338,484 Noncurrent liabilities due in more than one year:
Compensated absences 46,538 - 46,538 Capital leases 15,278 - 15,278 Certificates of participation, net 55,698,536 11,840,755 67,539,291 Net pension liability 6,816,695 - 6,816,695 Total liabilities 74,491,649 16,293,051 90,784,700
DEFERRED INFLOWS OF RESOURCESDeferred amount from OPEB 847,978 - 847,978 Deferred amount from pension 164,372 - 164,372
Total deferred inflows of resources 1,012,350 - 1,012,350 NET POSITION
Net investment in capital assets 75,398,634 74,339,509 149,738,143 Restricted for:
Debt service 45,336 5 45,341 Public works 3,270,026 - 3,270,026 Environmental sustainability 73,934 - 73,934 Community services 565,448 - 565,448 Housing 212,400 - 212,400 Bluffs Park 386,957 - 386,957 City facilities and operations 1,058,461 - 1,058,461
Unrestricted 50,728,169 3,678,077 54,406,246 Total net position 131,739,365$ 78,017,591$ 209,756,956$
The notes to the financial statements are an integral part of this statement.
21
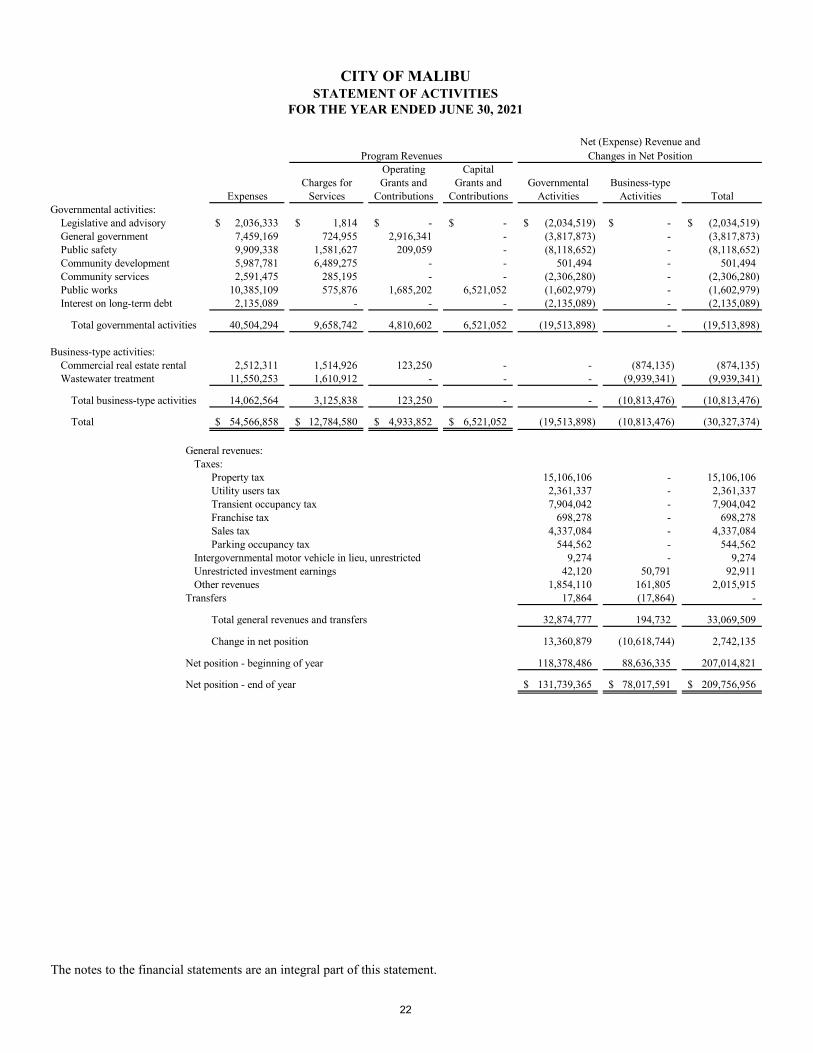
CITY OF MALIBUSTATEMENT OF ACTIVITIES
FOR THE YEAR ENDED JUNE 30, 2021
Operating CapitalCharges for Grants and Grants and Governmental Business-type
Expenses Services Contributions Contributions Activities Activities TotalGovernmental activities:
Legislative and advisory 2,036,333$ 1,814$ -$ -$ (2,034,519)$ -$ (2,034,519)$ General government 7,459,169 724,955 2,916,341 - (3,817,873) - (3,817,873) Public safety 9,909,338 1,581,627 209,059 - (8,118,652) - (8,118,652) Community development 5,987,781 6,489,275 - - 501,494 - 501,494 Community services 2,591,475 285,195 - - (2,306,280) - (2,306,280) Public works 10,385,109 575,876 1,685,202 6,521,052 (1,602,979) - (1,602,979) Interest on long-term debt 2,135,089 - - - (2,135,089) - (2,135,089)
Total governmental activities 40,504,294 9,658,742 4,810,602 6,521,052 (19,513,898) - (19,513,898)
Business-type activities:Commercial real estate rental 2,512,311 1,514,926 123,250 - - (874,135) (874,135) Wastewater treatment 11,550,253 1,610,912 - - - (9,939,341) (9,939,341)
Total business-type activities 14,062,564 3,125,838 123,250 - - (10,813,476) (10,813,476)
Total 54,566,858$ 12,784,580$ 4,933,852$ 6,521,052$ (19,513,898) (10,813,476) (30,327,374)
General revenues:Taxes:
Property tax 15,106,106 - 15,106,106 Utility users tax 2,361,337 - 2,361,337 Transient occupancy tax 7,904,042 - 7,904,042 Franchise tax 698,278 - 698,278 Sales tax 4,337,084 - 4,337,084 Parking occupancy tax 544,562 - 544,562
Intergovernmental motor vehicle in lieu, unrestricted 9,274 - 9,274 Unrestricted investment earnings 42,120 50,791 92,911 Other revenues 1,854,110 161,805 2,015,915
Transfers 17,864 (17,864) -
Total general revenues and transfers 32,874,777 194,732 33,069,509
Change in net position 13,360,879 (10,618,744) 2,742,135
Net position - beginning of year 118,378,486 88,636,335 207,014,821
Net position - end of year 131,739,365$ 78,017,591$ 209,756,956$
The notes to the financial statements are an integral part of this statement.
Program RevenuesNet (Expense) Revenue and
Changes in Net Position
22
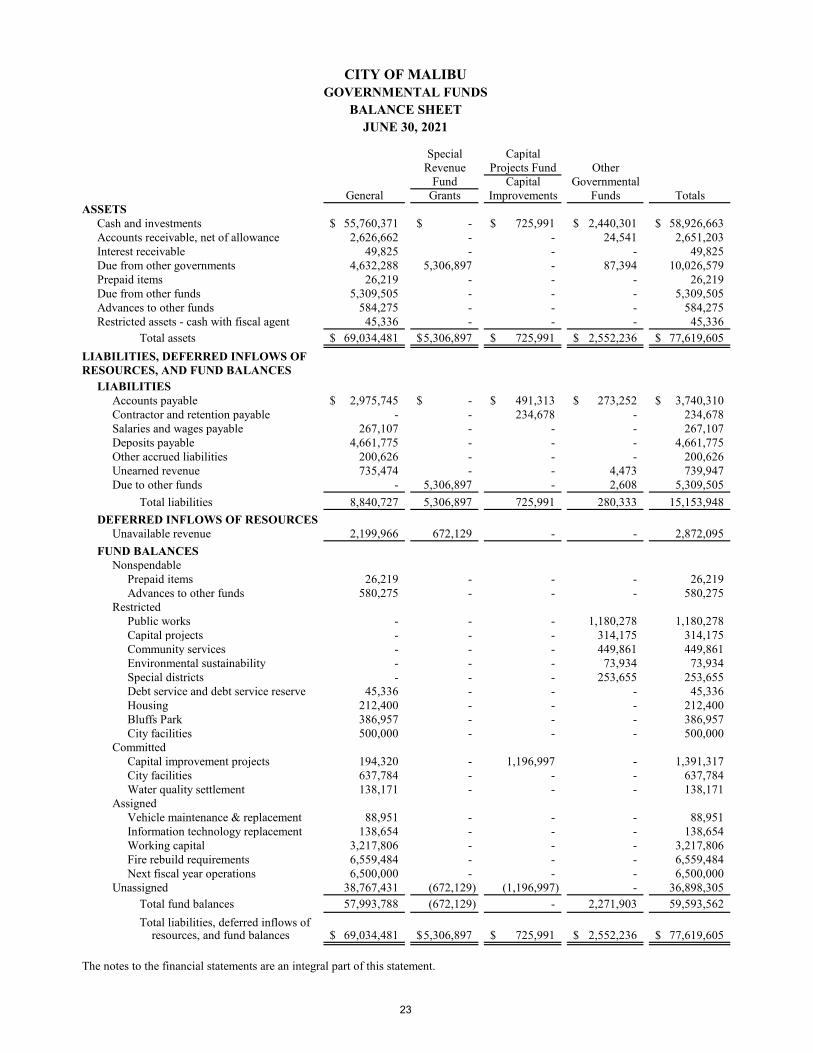
CITY OF MALIBUGOVERNMENTAL FUNDS
BALANCE SHEETJUNE 30, 2021
Special CapitalRevenue Projects Fund Other
Fund Capital GovernmentalGeneral Grants Improvements Funds Totals
ASSETSCash and investments 55,760,371$ -$ 725,991$ 2,440,301$ 58,926,663$ Accounts receivable, net of allowance 2,626,662 - - 24,541 2,651,203 Interest receivable 49,825 - - - 49,825 Due from other governments 4,632,288 5,306,897 - 87,394 10,026,579 Prepaid items 26,219 - - - 26,219 Due from other funds 5,309,505 - - - 5,309,505 Advances to other funds 584,275 - - - 584,275 Restricted assets - cash with fiscal agent 45,336 - - - 45,336
Total assets 69,034,481$ 5,306,897$ 725,991$ 2,552,236$ 77,619,605$ LIABILITIES, DEFERRED INFLOWS OFRESOURCES, AND FUND BALANCES
LIABILITIESAccounts payable 2,975,745$ -$ 491,313$ 273,252$ 3,740,310$ Contractor and retention payable - - 234,678 - 234,678 Salaries and wages payable 267,107 - - - 267,107 Deposits payable 4,661,775 - - - 4,661,775 Other accrued liabilities 200,626 - - - 200,626 Unearned revenue 735,474 - - 4,473 739,947 Due to other funds - 5,306,897 - 2,608 5,309,505
Total liabilities 8,840,727 5,306,897 725,991 280,333 15,153,948 DEFERRED INFLOWS OF RESOURCES
Unavailable revenue 2,199,966 672,129 - - 2,872,095 FUND BALANCES
NonspendablePrepaid items 26,219 - - - 26,219 Advances to other funds 580,275 - - - 580,275
RestrictedPublic works - - - 1,180,278 1,180,278 Capital projects - - - 314,175 314,175 Community services - - - 449,861 449,861 Environmental sustainability - - - 73,934 73,934 Special districts - - - 253,655 253,655 Debt service and debt service reserve 45,336 - - - 45,336 Housing 212,400 - - - 212,400 Bluffs Park 386,957 - - - 386,957 City facilities 500,000 - - - 500,000
CommittedCapital improvement projects 194,320 - 1,196,997 - 1,391,317 City facilities 637,784 - - - 637,784 Water quality settlement 138,171 - - - 138,171
AssignedVehicle maintenance & replacement 88,951 - - - 88,951 Information technology replacement 138,654 - - - 138,654 Working capital 3,217,806 - - - 3,217,806 Fire rebuild requirements 6,559,484 - - - 6,559,484 Next fiscal year operations 6,500,000 - - - 6,500,000
Unassigned 38,767,431 (672,129) (1,196,997) - 36,898,305 Total fund balances 57,993,788 (672,129) - 2,271,903 59,593,562 Total liabilities, deferred inflows of resources, and fund balances 69,034,481$ 5,306,897$ 725,991$ 2,552,236$ 77,619,605$
The notes to the financial statements are an integral part of this statement.
23
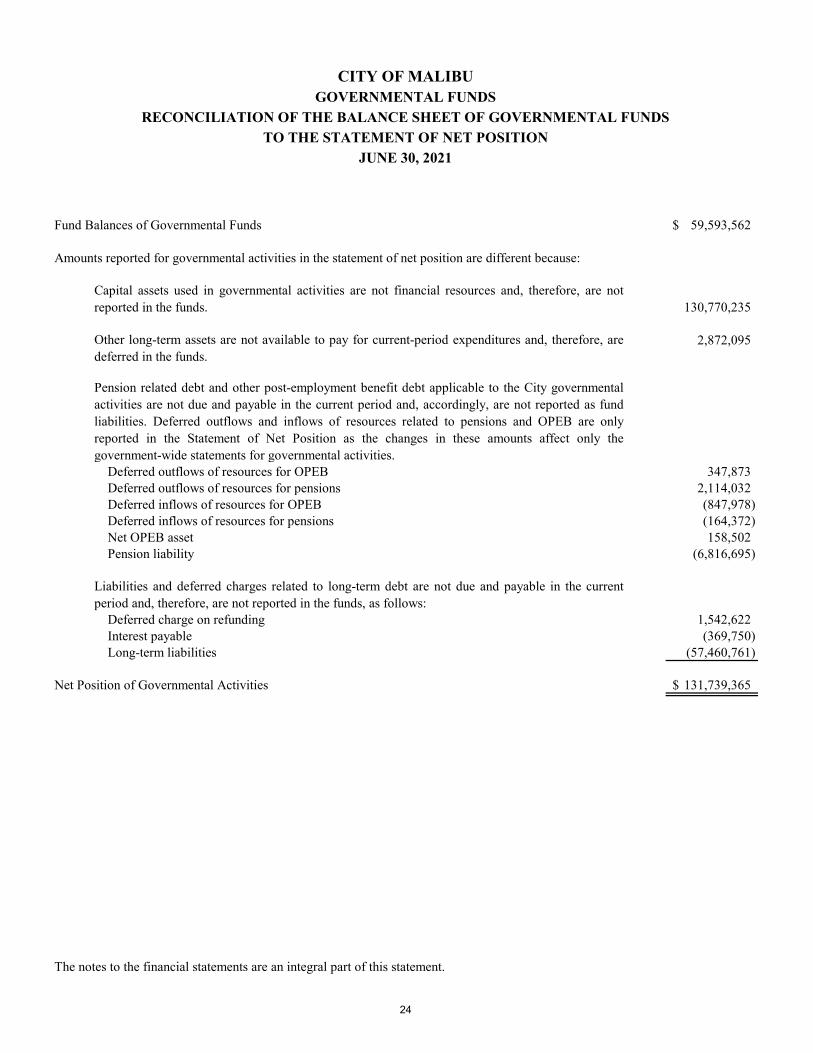
CITY OF MALIBUGOVERNMENTAL FUNDS
RECONCILIATION OF THE BALANCE SHEET OF GOVERNMENTAL FUNDSTO THE STATEMENT OF NET POSITION
JUNE 30, 2021
Fund Balances of Governmental Funds 59,593,562$
Amounts reported for governmental activities in the statement of net position are different because:
130,770,235
2,872,095
Pension related debt and other post-employment benefit debt applicable to the City governmentalactivities are not due and payable in the current period and, accordingly, are not reported as fundliabilities. Deferred outflows and inflows of resources related to pensions and OPEB are onlyreported in the Statement of Net Position as the changes in these amounts affect only thegovernment-wide statements for governmental activities. Deferred outflows of resources for OPEB 347,873 Deferred outflows of resources for pensions 2,114,032 Deferred inflows of resources for OPEB (847,978) Deferred inflows of resources for pensions (164,372) Net OPEB asset 158,502 Pension liability (6,816,695)
Deferred charge on refunding 1,542,622 Interest payable (369,750) Long-term liabilities (57,460,761)
Net Position of Governmental Activities 131,739,365$
The notes to the financial statements are an integral part of this statement.
Capital assets used in governmental activities are not financial resources and, therefore, are notreported in the funds.
Other long-term assets are not available to pay for current-period expenditures and, therefore, aredeferred in the funds.
Liabilities and deferred charges related to long-term debt are not due and payable in the currentperiod and, therefore, are not reported in the funds, as follows:
24
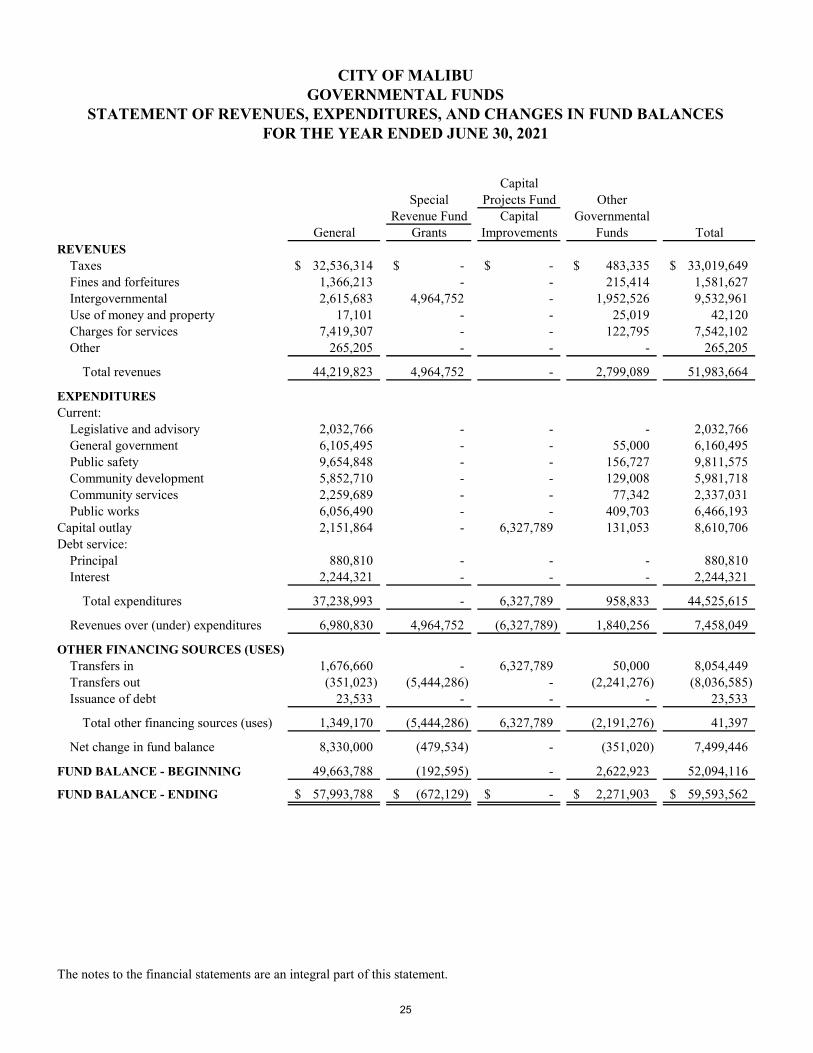
CITY OF MALIBUGOVERNMENTAL FUNDS
STATEMENT OF REVENUES, EXPENDITURES, AND CHANGES IN FUND BALANCESFOR THE YEAR ENDED JUNE 30, 2021
CapitalSpecial Projects Fund Other
Revenue Fund Capital GovernmentalGeneral Grants Improvements Funds Total
REVENUESTaxes 32,536,314$ -$ -$ 483,335$ 33,019,649$ Fines and forfeitures 1,366,213 - - 215,414 1,581,627 Intergovernmental 2,615,683 4,964,752 - 1,952,526 9,532,961 Use of money and property 17,101 - - 25,019 42,120 Charges for services 7,419,307 - - 122,795 7,542,102 Other 265,205 - - - 265,205
Total revenues 44,219,823 4,964,752 - 2,799,089 51,983,664
EXPENDITURESCurrent:
Legislative and advisory 2,032,766 - - - 2,032,766 General government 6,105,495 - - 55,000 6,160,495 Public safety 9,654,848 - - 156,727 9,811,575 Community development 5,852,710 - - 129,008 5,981,718 Community services 2,259,689 - - 77,342 2,337,031 Public works 6,056,490 - - 409,703 6,466,193
Capital outlay 2,151,864 - 6,327,789 131,053 8,610,706 Debt service:
Principal 880,810 - - - 880,810 Interest 2,244,321 - - - 2,244,321
Total expenditures 37,238,993 - 6,327,789 958,833 44,525,615
Revenues over (under) expenditures 6,980,830 4,964,752 (6,327,789) 1,840,256 7,458,049
OTHER FINANCING SOURCES (USES)Transfers in 1,676,660 - 6,327,789 50,000 8,054,449 Transfers out (351,023) (5,444,286) - (2,241,276) (8,036,585) Issuance of debt 23,533 - - - 23,533
Total other financing sources (uses) 1,349,170 (5,444,286) 6,327,789 (2,191,276) 41,397
Net change in fund balance 8,330,000 (479,534) - (351,020) 7,499,446
FUND BALANCE - BEGINNING 49,663,788 (192,595) - 2,622,923 52,094,116
FUND BALANCE - ENDING 57,993,788$ (672,129)$ -$ 2,271,903$ 59,593,562$
The notes to the financial statements are an integral part of this statement.
25
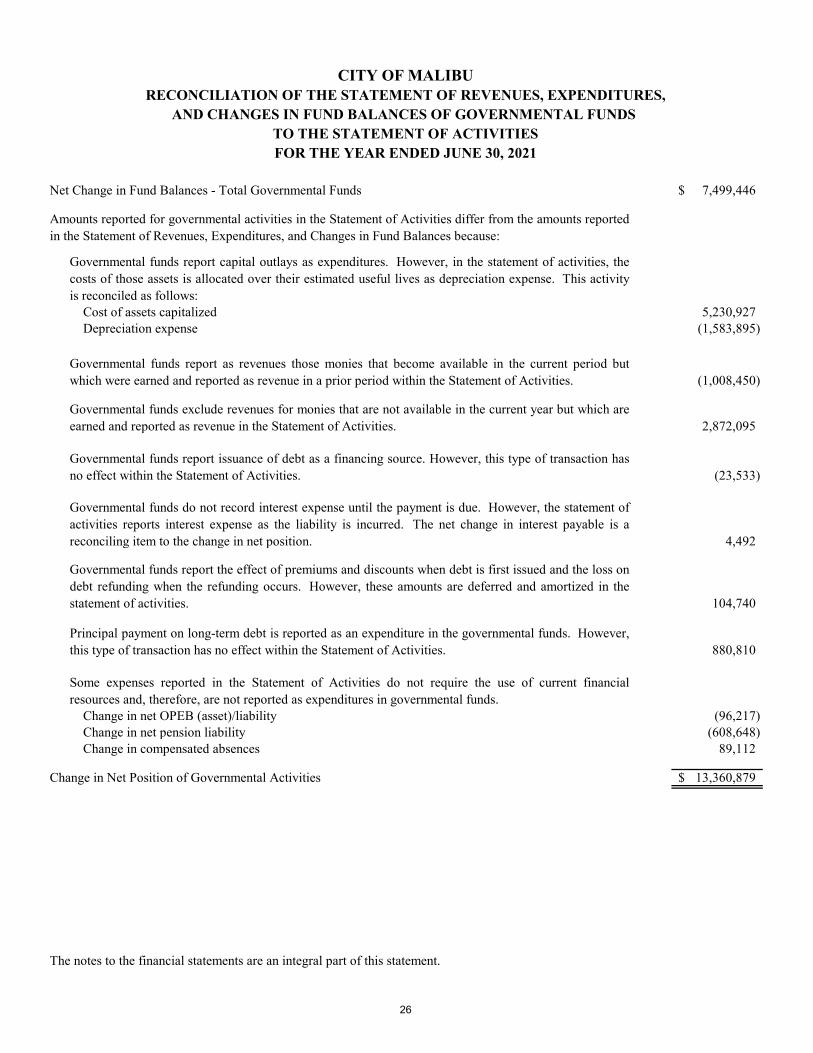
CITY OF MALIBURECONCILIATION OF THE STATEMENT OF REVENUES, EXPENDITURES,
AND CHANGES IN FUND BALANCES OF GOVERNMENTAL FUNDS TO THE STATEMENT OF ACTIVITIESFOR THE YEAR ENDED JUNE 30, 2021
Net Change in Fund Balances - Total Governmental Funds 7,499,446$
Cost of assets capitalized 5,230,927 Depreciation expense (1,583,895)
Governmental funds report as revenues those monies that become available in the current period butwhich were earned and reported as revenue in a prior period within the Statement of Activities. (1,008,450)
Governmental funds exclude revenues for monies that are not available in the current year but which areearned and reported as revenue in the Statement of Activities. 2,872,095
Governmental funds report issuance of debt as a financing source. However, this type of transaction hasno effect within the Statement of Activities. (23,533)
Governmental funds do not record interest expense until the payment is due. However, the statement ofactivities reports interest expense as the liability is incurred. The net change in interest payable is areconciling item to the change in net position. 4,492
Governmental funds report the effect of premiums and discounts when debt is first issued and the loss ondebt refunding when the refunding occurs. However, these amounts are deferred and amortized in thestatement of activities. 104,740
Principal payment on long-term debt is reported as an expenditure in the governmental funds. However,this type of transaction has no effect within the Statement of Activities. 880,810
Some expenses reported in the Statement of Activities do not require the use of current financialresources and, therefore, are not reported as expenditures in governmental funds. Change in net OPEB (asset)/liability (96,217) Change in net pension liability (608,648) Change in compensated absences 89,112
Change in Net Position of Governmental Activities 13,360,879$
The notes to the financial statements are an integral part of this statement.
Amounts reported for governmental activities in the Statement of Activities differ from the amounts reportedin the Statement of Revenues, Expenditures, and Changes in Fund Balances because:
Governmental funds report capital outlays as expenditures. However, in the statement of activities, thecosts of those assets is allocated over their estimated useful lives as depreciation expense. This activityis reconciled as follows:
26
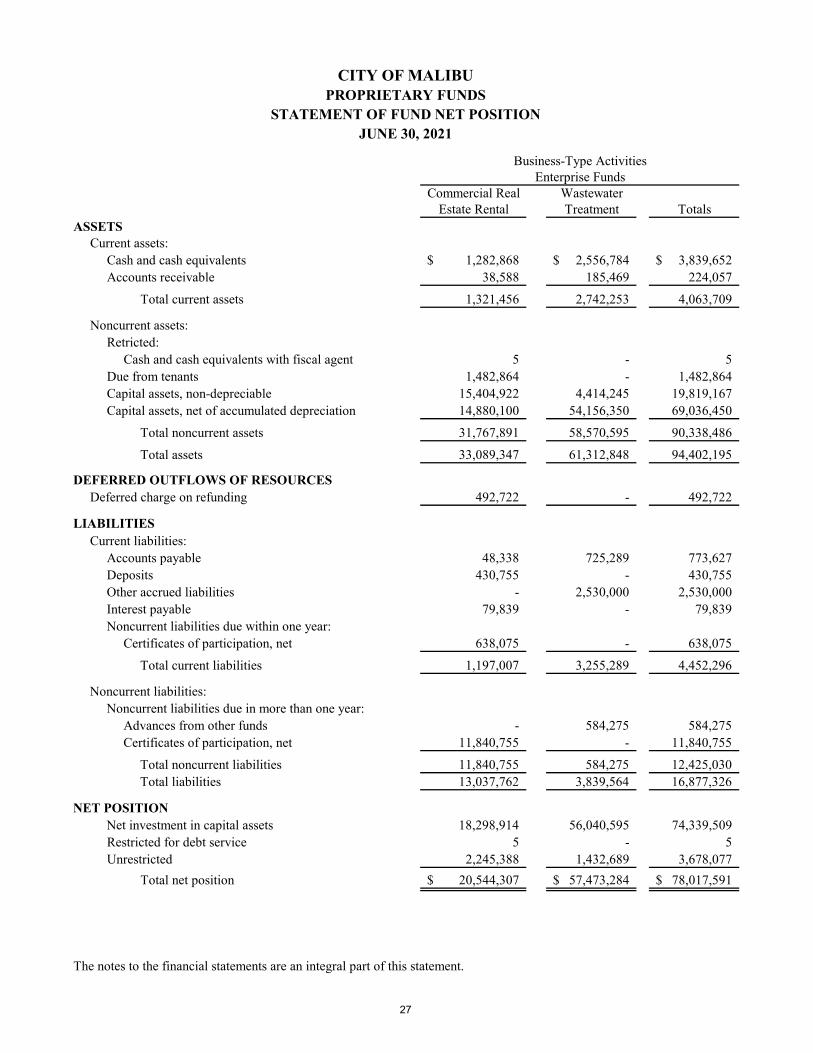
CITY OF MALIBUPROPRIETARY FUNDS
STATEMENT OF FUND NET POSITIONJUNE 30, 2021
Business-Type ActivitiesEnterprise Funds
Commercial Real WastewaterEstate Rental Treatment Totals
ASSETSCurrent assets:
Cash and cash equivalents 1,282,868$ 2,556,784$ 3,839,652$ Accounts receivable 38,588 185,469 224,057
Total current assets 1,321,456 2,742,253 4,063,709
Noncurrent assets:Retricted:
Cash and cash equivalents with fiscal agent 5 - 5 Due from tenants 1,482,864 - 1,482,864 Capital assets, non-depreciable 15,404,922 4,414,245 19,819,167 Capital assets, net of accumulated depreciation 14,880,100 54,156,350 69,036,450
Total noncurrent assets 31,767,891 58,570,595 90,338,486
Total assets 33,089,347 61,312,848 94,402,195
DEFERRED OUTFLOWS OF RESOURCESDeferred charge on refunding 492,722 - 492,722
LIABILITIESCurrent liabilities:
Accounts payable 48,338 725,289 773,627 Deposits 430,755 - 430,755 Other accrued liabilities - 2,530,000 2,530,000 Interest payable 79,839 - 79,839 Noncurrent liabilities due within one year:
Certificates of participation, net 638,075 - 638,075
Total current liabilities 1,197,007 3,255,289 4,452,296
Noncurrent liabilities:Noncurrent liabilities due in more than one year:
Advances from other funds - 584,275 584,275 Certificates of participation, net 11,840,755 - 11,840,755
Total noncurrent liabilities 11,840,755 584,275 12,425,030 Total liabilities 13,037,762 3,839,564 16,877,326
NET POSITIONNet investment in capital assets 18,298,914 56,040,595 74,339,509 Restricted for debt service 5 - 5 Unrestricted 2,245,388 1,432,689 3,678,077
Total net position 20,544,307$ 57,473,284$ 78,017,591$
The notes to the financial statements are an integral part of this statement.
27
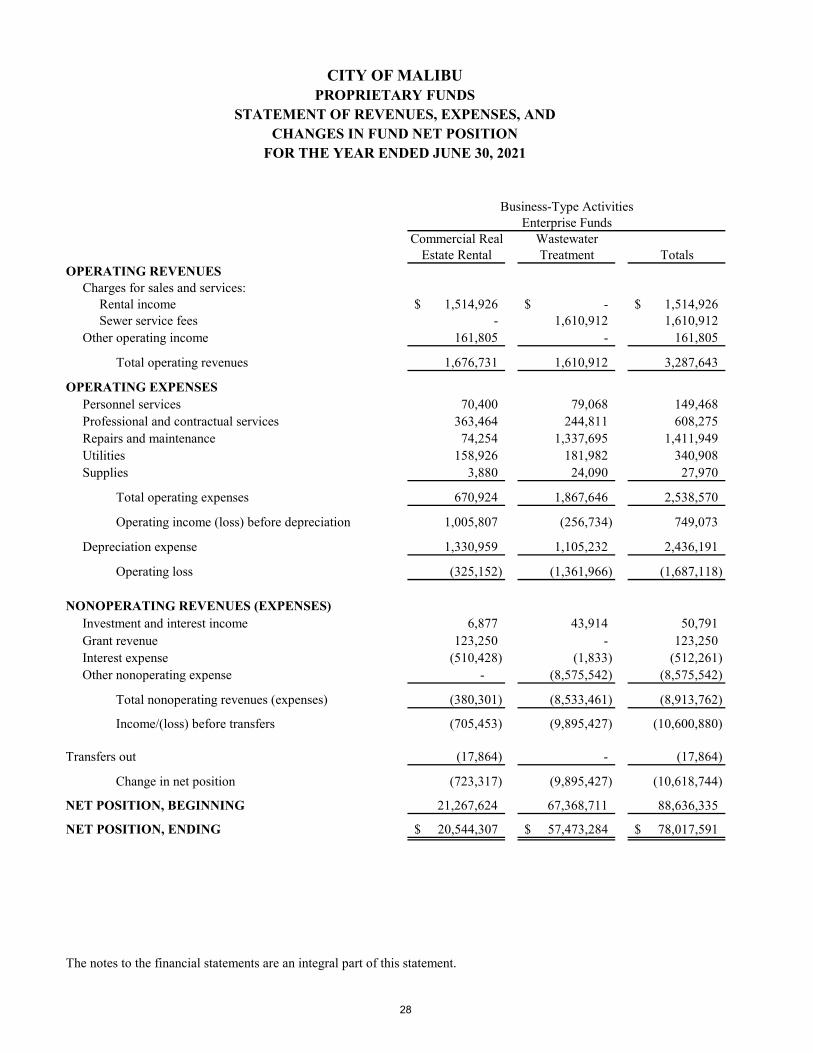
CITY OF MALIBUPROPRIETARY FUNDS
STATEMENT OF REVENUES, EXPENSES, ANDCHANGES IN FUND NET POSITION
FOR THE YEAR ENDED JUNE 30, 2021
Business-Type ActivitiesEnterprise Funds
Commercial Real WastewaterEstate Rental Treatment Totals
OPERATING REVENUESCharges for sales and services:
Rental income 1,514,926$ -$ 1,514,926$ Sewer service fees - 1,610,912 1,610,912
Other operating income 161,805 - 161,805
Total operating revenues 1,676,731 1,610,912 3,287,643
OPERATING EXPENSESPersonnel services 70,400 79,068 149,468 Professional and contractual services 363,464 244,811 608,275 Repairs and maintenance 74,254 1,337,695 1,411,949 Utilities 158,926 181,982 340,908 Supplies 3,880 24,090 27,970
Total operating expenses 670,924 1,867,646 2,538,570
Operating income (loss) before depreciation 1,005,807 (256,734) 749,073
Depreciation expense 1,330,959 1,105,232 2,436,191
Operating loss (325,152) (1,361,966) (1,687,118)
NONOPERATING REVENUES (EXPENSES)Investment and interest income 6,877 43,914 50,791 Grant revenue 123,250 - 123,250 Interest expense (510,428) (1,833) (512,261) Other nonoperating expense - (8,575,542) (8,575,542)
Total nonoperating revenues (expenses) (380,301) (8,533,461) (8,913,762)
Income/(loss) before transfers (705,453) (9,895,427) (10,600,880)
Transfers out (17,864) - (17,864)
Change in net position (723,317) (9,895,427) (10,618,744)
NET POSITION, BEGINNING 21,267,624 67,368,711 88,636,335
NET POSITION, ENDING 20,544,307$ 57,473,284$ 78,017,591$
The notes to the financial statements are an integral part of this statement.
28
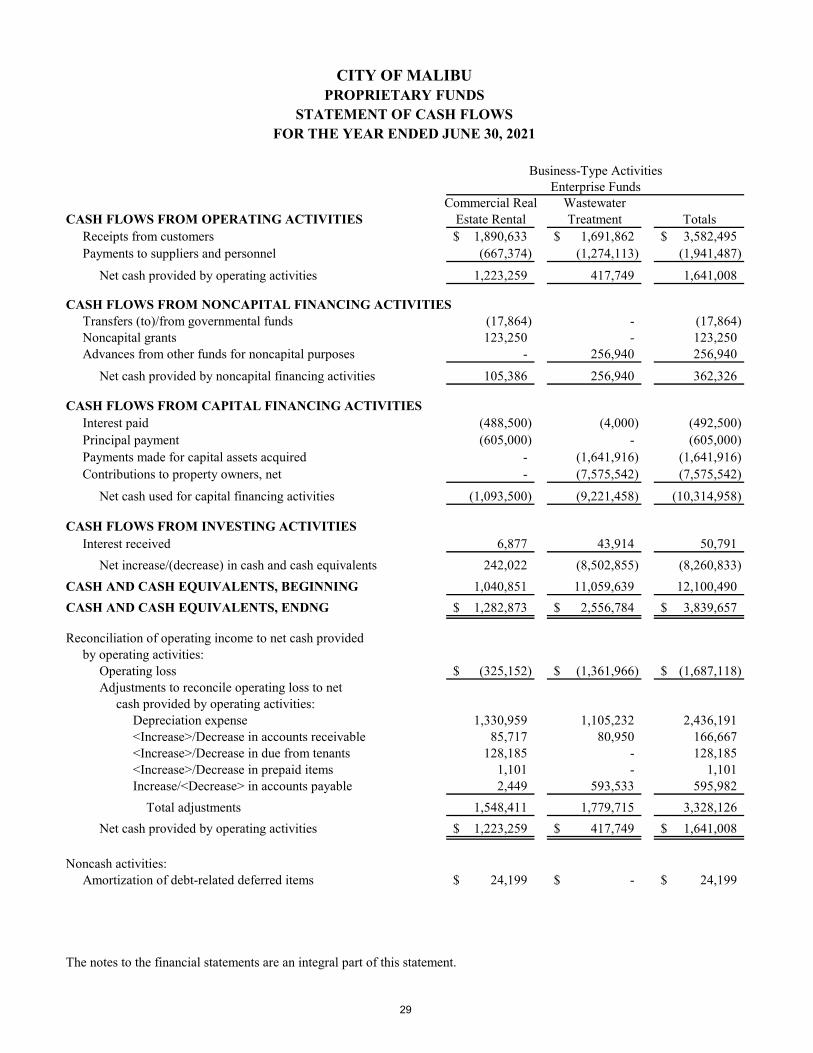
CITY OF MALIBUPROPRIETARY FUNDS
STATEMENT OF CASH FLOWSFOR THE YEAR ENDED JUNE 30, 2021
Business-Type ActivitiesEnterprise Funds
Commercial Real WastewaterCASH FLOWS FROM OPERATING ACTIVITIES Estate Rental Treatment Totals
Receipts from customers 1,890,633$ 1,691,862$ 3,582,495$ Payments to suppliers and personnel (667,374) (1,274,113) (1,941,487)
Net cash provided by operating activities 1,223,259 417,749 1,641,008
CASH FLOWS FROM NONCAPITAL FINANCING ACTIVITIESTransfers (to)/from governmental funds (17,864) - (17,864) Noncapital grants 123,250 - 123,250 Advances from other funds for noncapital purposes - 256,940 256,940
Net cash provided by noncapital financing activities 105,386 256,940 362,326
CASH FLOWS FROM CAPITAL FINANCING ACTIVITIESInterest paid (488,500) (4,000) (492,500) Principal payment (605,000) - (605,000) Payments made for capital assets acquired - (1,641,916) (1,641,916) Contributions to property owners, net - (7,575,542) (7,575,542)
Net cash used for capital financing activities (1,093,500) (9,221,458) (10,314,958)
CASH FLOWS FROM INVESTING ACTIVITIESInterest received 6,877 43,914 50,791
Net increase/(decrease) in cash and cash equivalents 242,022 (8,502,855) (8,260,833) CASH AND CASH EQUIVALENTS, BEGINNING 1,040,851 11,059,639 12,100,490 CASH AND CASH EQUIVALENTS, ENDNG 1,282,873$ 2,556,784$ 3,839,657$
Reconciliation of operating income to net cash providedby operating activities:
Operating loss (325,152)$ (1,361,966)$ (1,687,118)$ Adjustments to reconcile operating loss to net
cash provided by operating activities:Depreciation expense 1,330,959 1,105,232 2,436,191 <Increase>/Decrease in accounts receivable 85,717 80,950 166,667 <Increase>/Decrease in due from tenants 128,185 - 128,185 <Increase>/Decrease in prepaid items 1,101 - 1,101 Increase/<Decrease> in accounts payable 2,449 593,533 595,982 Total adjustments 1,548,411 1,779,715 3,328,126
Net cash provided by operating activities 1,223,259$ 417,749$ 1,641,008$
Noncash activities:Amortization of debt-related deferred items 24,199$ -$ 24,199$
The notes to the financial statements are an integral part of this statement.
29
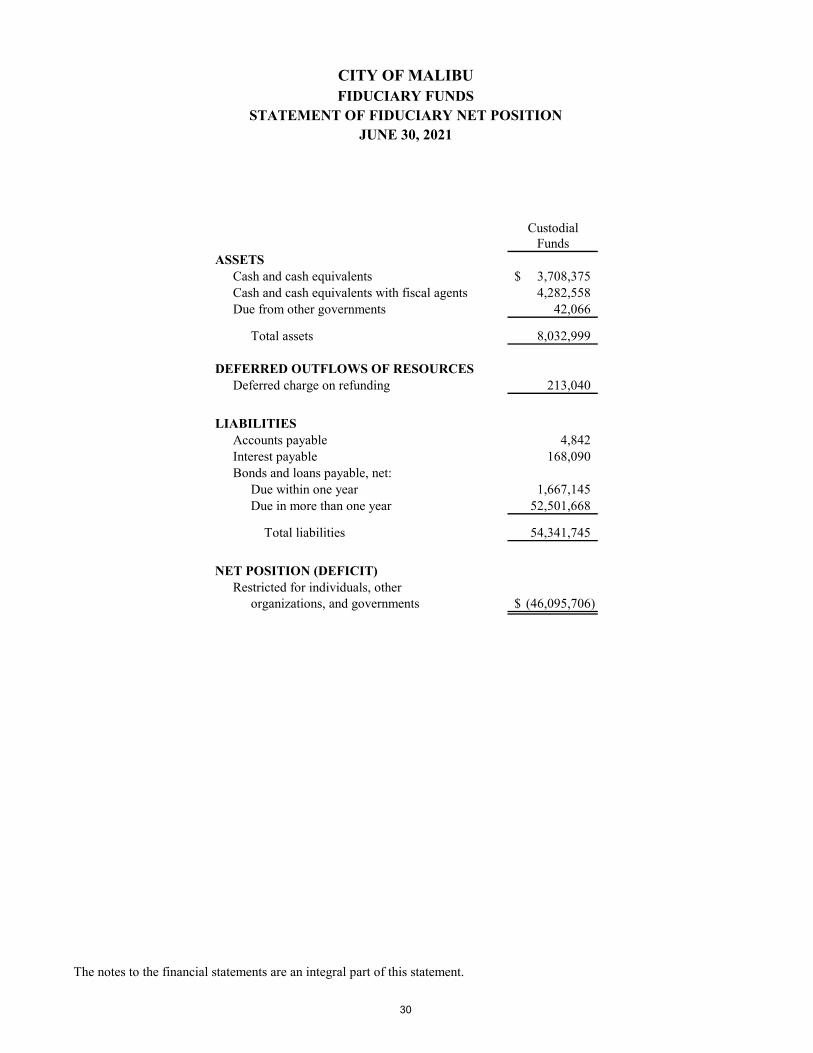
CITY OF MALIBUFIDUCIARY FUNDS
STATEMENT OF FIDUCIARY NET POSITIONJUNE 30, 2021
CustodialFunds
ASSETSCash and cash equivalents 3,708,375$ Cash and cash equivalents with fiscal agents 4,282,558 Due from other governments 42,066
Total assets 8,032,999
DEFERRED OUTFLOWS OF RESOURCESDeferred charge on refunding 213,040
LIABILITIESAccounts payable 4,842 Interest payable 168,090 Bonds and loans payable, net:
Due within one year 1,667,145 Due in more than one year 52,501,668
Total liabilities 54,341,745
NET POSITION (DEFICIT)Restricted for individuals, other
organizations, and governments (46,095,706)$
The notes to the financial statements are an integral part of this statement.
30
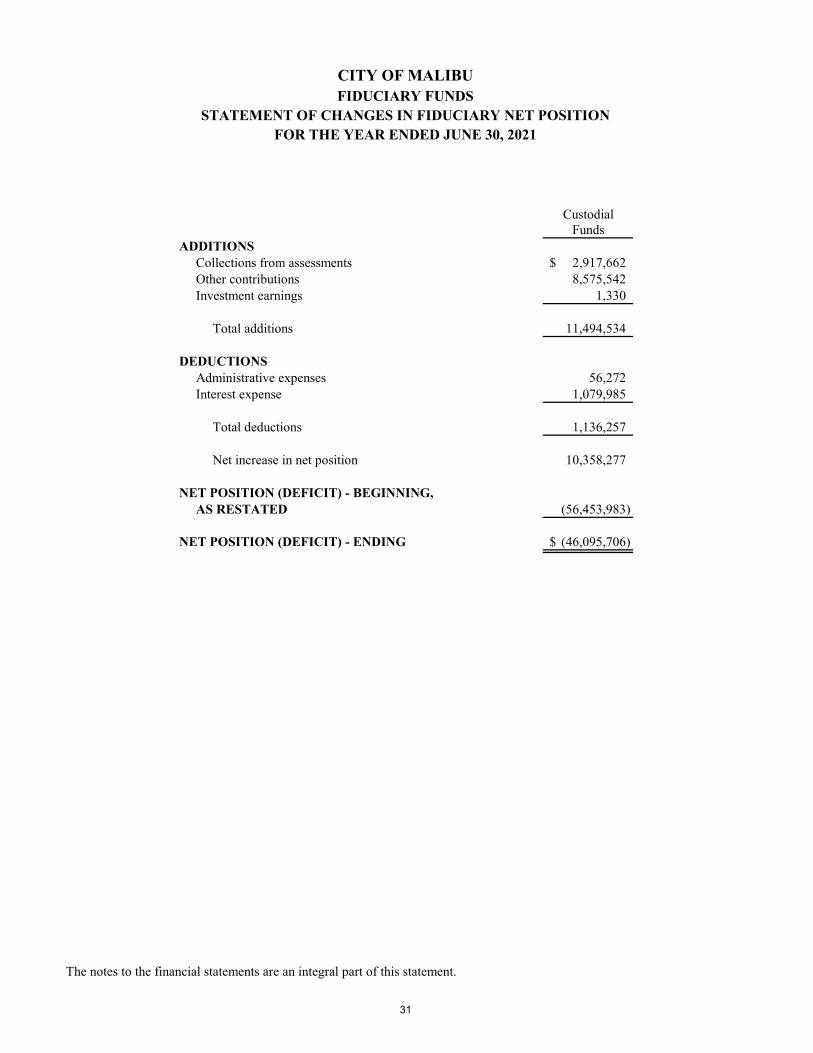
CITY OF MALIBUFIDUCIARY FUNDS
STATEMENT OF CHANGES IN FIDUCIARY NET POSITIONFOR THE YEAR ENDED JUNE 30, 2021
CustodialFunds
ADDITIONSCollections from assessments 2,917,662$ Other contributions 8,575,542 Investment earnings 1,330
Total additions 11,494,534
DEDUCTIONSAdministrative expenses 56,272 Interest expense 1,079,985
Total deductions 1,136,257
Net increase in net position 10,358,277
NET POSITION (DEFICIT) - BEGINNING,AS RESTATED (56,453,983)
NET POSITION (DEFICIT) - ENDING (46,095,706)$
The notes to the financial statements are an integral part of this statement.
31
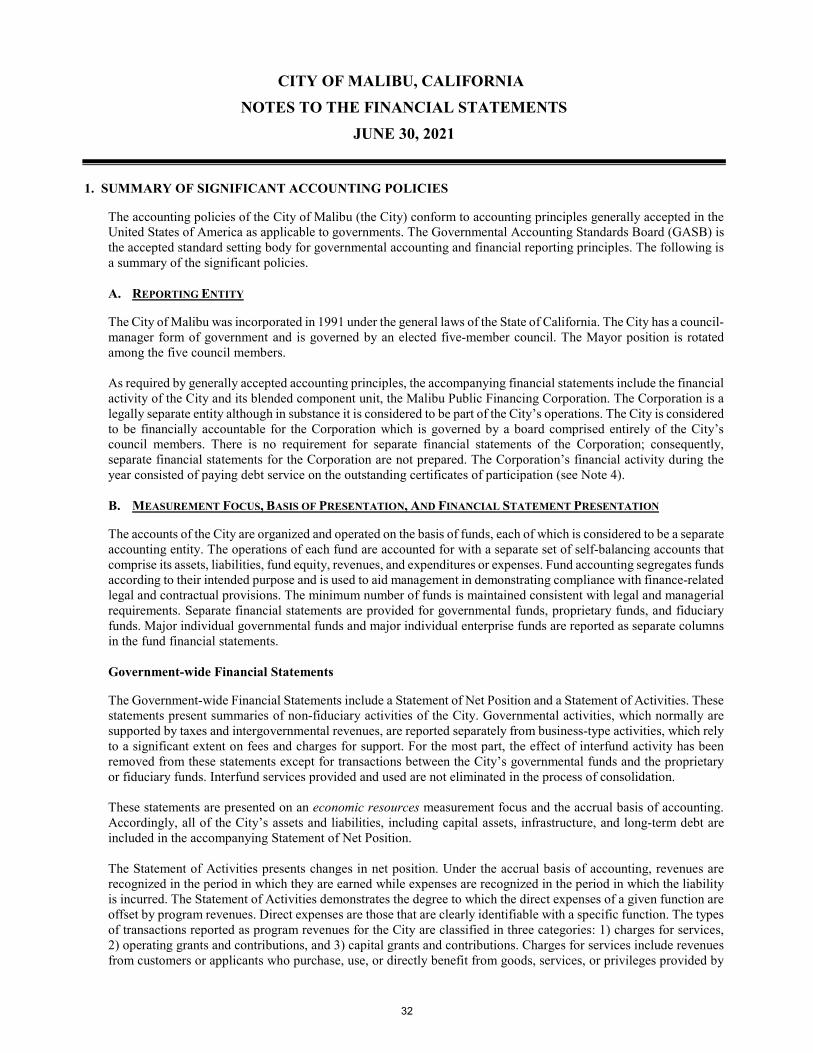
CITY OF MALIBU, CALIFORNIA NOTES TO THE FINANCIAL STATEMENTS
JUNE 30, 2021
1. SUMMARY OF SIGNIFICANT ACCOUNTING POLICIES
The accounting policies of the City of Malibu (the City) conform to accounting principles generally accepted in the United States of America as applicable to governments. The Governmental Accounting Standards Board (GASB) is the accepted standard setting body for governmental accounting and financial reporting principles. The following is a summary of the significant policies.
A. REPORTING ENTITY
The City of Malibu was incorporated in 1991 under the general laws of the State of California. The City has a council-manager form of government and is governed by an elected five-member council. The Mayor position is rotated among the five council members.
As required by generally accepted accounting principles, the accompanying financial statements include the financial activity of the City and its blended component unit, the Malibu Public Financing Corporation. The Corporation is a legally separate entity although in substance it is considered to be part of the City’s operations. The City is considered to be financially accountable for the Corporation which is governed by a board comprised entirely of the City’s council members. There is no requirement for separate financial statements of the Corporation; consequently, separate financial statements for the Corporation are not prepared. The Corporation’s financial activity during the year consisted of paying debt service on the outstanding certificates of participation (see Note 4).
B. MEASUREMENT FOCUS, BASIS OF PRESENTATION, AND FINANCIAL STATEMENT PRESENTATION
The accounts of the City are organized and operated on the basis of funds, each of which is considered to be a separate accounting entity. The operations of each fund are accounted for with a separate set of self-balancing accounts that comprise its assets, liabilities, fund equity, revenues, and expenditures or expenses. Fund accounting segregates funds according to their intended purpose and is used to aid management in demonstrating compliance with finance-related legal and contractual provisions. The minimum number of funds is maintained consistent with legal and managerial requirements. Separate financial statements are provided for governmental funds, proprietary funds, and fiduciary funds. Major individual governmental funds and major individual enterprise funds are reported as separate columns in the fund financial statements.
Government-wide Financial Statements
The Government-wide Financial Statements include a Statement of Net Position and a Statement of Activities. These statements present summaries of non-fiduciary activities of the City. Governmental activities, which normally are supported by taxes and intergovernmental revenues, are reported separately from business-type activities, which rely to a significant extent on fees and charges for support. For the most part, the effect of interfund activity has been removed from these statements except for transactions between the City’s governmental funds and the proprietary or fiduciary funds. Interfund services provided and used are not eliminated in the process of consolidation.
These statements are presented on an economic resources measurement focus and the accrual basis of accounting. Accordingly, all of the City’s assets and liabilities, including capital assets, infrastructure, and long-term debt are included in the accompanying Statement of Net Position.
The Statement of Activities presents changes in net position. Under the accrual basis of accounting, revenues are recognized in the period in which they are earned while expenses are recognized in the period in which the liability is incurred. The Statement of Activities demonstrates the degree to which the direct expenses of a given function are offset by program revenues. Direct expenses are those that are clearly identifiable with a specific function. The types of transactions reported as program revenues for the City are classified in three categories: 1) charges for services, 2) operating grants and contributions, and 3) capital grants and contributions. Charges for services include revenues from customers or applicants who purchase, use, or directly benefit from goods, services, or privileges provided by
32
CITY OF MALIBU, CALIFORNIA NOTES TO THE FINANCIAL STATEMENTS (Continued) June 30, 2021
a given function. Grants and contributions include revenues restricted to meeting the operational or capital requirements of a particular function. Taxes and other items not properly included among program revenues are reported instead as general revenues.
Governmental Fund Financial Statements
Governmental Fund Financial Statements include a Balance Sheet and a Statement of Revenues, Expenditures, and Changes in Fund Balances for all major governmental funds and aggregated non-major funds. An accompanying schedule is presented to reconcile and explain the difference in fund balance as presented in these statements to the net position as presented in the Government-wide Financial Statements.
All governmental funds are accounted for on a spending or current financial resources measurement focus and the modified accrual basis of accounting. Accordingly, only current assets and current liabilities are included on the Balance Sheet. The Statement of Revenues, Expenditures, and Changes in Fund Balances present increases (revenues and other financing sources) and decreases (expenditures and other financing uses) in net current assets. Under the modified accrual basis of accounting, revenues are recognized in the accounting period in which they become both measurable and available to finance expenditures of the current period. Accordingly, revenues are recorded when received in cash, except that revenues subject to accrual are recognized when due. The primary sources susceptible to accrual are property tax, sales tax, transient occupancy tax, investment income, and grant revenues. Generally, revenues are subject to accrual if anticipated to be received within 180 days after year-end. The exception to this general rule is that property taxes are subject to accrual if received within 60 days after year-end.
Expenditures are generally recognized under the modified accrual basis of accounting when the related fund liability is incurred. An exception to this general rule is principal and interest on general long-term debt which is recognized when due.
Proprietary Fund Financial Statements
Proprietary Fund Financial Statements include a Statement of Net Position, a Statement of Revenues, Expenses, and Changes in Fund Net Position, and a Statement of Cash Flows. The City has two Proprietary Funds which are accounted for using the economic resources measurement focus and the accrual basis of accounting. Revenues are recorded when earned and expenses are recorded when a liability is incurred, regardless of the timing of related cash flows. Grants and similar items are recognized as revenue as soon as all eligibility requirements imposed by the provider have been met.
Fiduciary Fund Financial Statements
Fiduciary Fund Financial Statements include a Statement of Fiduciary Net Position and a Statement of Changes in Fiduciary Net Position. The City’s Fiduciary Funds consist of three Custodial Funds which are accounted for using the accrual basis of accounting. Revenues are recorded when earned and expenses are recorded when a liability is incurred, regardless of the timing of related cash flows. The Custodial Funds account for monies held by the City as an agent for property owners with special assessments.
Fund Classifications
The City reports the following major governmental funds:
The General Fund is the City’s primary operating fund. It accounts for all financial resources of the City, except those required to be accounted for in another fund. The Grants Special Revenue Fund is used to account for projects funded by various grants received from other government agencies. The majority of funds received are transferred to the Capital Improvement Capital Projects Fund to finance the related capital project expenditures. The amount of activity in this fund varies from year to year, and this fund is consistently reported as a major governmental fund. The deficit fund balance is expected to be relieved by the receipt of grant monies.
33
CITY OF MALIBU, CALIFORNIA NOTES TO THE FINANCIAL STATEMENTS (Continued) June 30, 2021
The Capital Improvements Capital Projects Fund is used to account for financial resources to be used for the acquisition, construction, or repair of major facilities. The amount of activity in this fund varies from year to year, and this fund is consistently reported as a major governmental fund.
The City reports two proprietary funds, both of which are reported as major proprietary funds. The Commercial Real Estate Rental Fund accounts for the capital assets being leased to commercial customers (see Note 6). The lease revenue is used to pay the debt service requirements of the long-term liabilities of the fund (see Note 4). The Wastewater Treatment Fund accounts for the capital assets and the related activity for processing wastewater. This fund also accounts for the construction of an expansion to the Civic Center Wastewater Treatment Facility.
C. STEWARDSHIP, COMPLIANCE, AND ACCOUNTABILITY
The legal level of budgetary control is at the fund level for governmental funds. The City does not present annual budget information on the Capital Projects Fund since the City approves project-length budgets. These project-length budgets authorize total expenditures over the duration of a construction project rather than year-by-year budgeting. For the year ended June 30, 2021, there were no major governmental funds with expenditures which exceeded appropriations. The following nonmajor funds had expenditures which exceeded appropriations. The Brulte Bill Grant Fund had grant revenues which were equal to the fund’s total expenditures and the Calle del Barco LMD Fund had sufficient resources to cover the budget overage.
D. PROPERTY TAX REVENUES
Property taxes are levied, based on the assessed values determined by the Los Angeles County Assessor (the County) as of March 1st and become a lien on the real property at July 1st. Secured taxes are due annually in two installments on November 1st and February 1st, and become delinquent on December 10th and April 10th, respectively. Unsecured taxes are due annually on July 1st and become delinquent on August 31st. The lien date for secured and unsecured property taxes is March 1st of the preceding Fiscal Year. The total property tax levy is recognized as revenue to the extent that it results in current available resources. Current available resources are those property tax amounts received within 60 days past year-end.
California law limits ad valorem taxes on real property to 1% of value plus taxes necessary to pay indebtedness approved by the voters. Annual increases are limited to the cost of living, not to exceed 2% each year. Property may also be reassessed to full market value after a sale, transfer of ownership, or completion of new construction. The State is prohibited from imposing new ad valorem, sales or transactions taxes on real property. Local government may impose special taxes (except on real property) with the approval of two-thirds of the qualified electors voting in a general or special election.
E. INVESTMENTS AND INTEREST INCOME ON INVESTMENTS
Investments are reported at fair value, which represents the price that would be received to sell an asset or paid to transfer a liability in an orderly transaction between market participants at the measurement date. Cash and investments of the City are managed on a pooled basis, and investment income from the pool is allocated quarterly to certain funds based on the average cash balances in relation to total cash balances. Investment income includes interest earnings, changes in fair value, and any gains or losses realized upon the liquidation or sale of investments. All investment income is recognized as revenue in the operating statement. All pooled investments are controlled by an investment policy that is adopted by the City Council and further controlled by State legislation.
Expendituresin Excess of
Non-Major Funds: BudgetSpecial Revenue Funds:
Brulte Bill Grant 6,727$ Calle del Barco LMD 23,043
34
CITY OF MALIBU, CALIFORNIA NOTES TO THE FINANCIAL STATEMENTS (Continued) June 30, 2021
F. CAPITAL ASSETS
Capital assets, which include land, intangible assets, buildings, leasehold improvements, equipment and furniture, vehicles, and infrastructure, are reported in the applicable governmental or business-type activities columns of the Government-wide Financial Statements. Non-infrastructure capital assets are defined by the City as individual assets with an initial, individual cost of more than $3,000 and an expected useful life of three years or more. Infrastructure capital assets are defined by the City as long-lived capital assets with an initial cost of more than $50,000 that are stationary and can be preserved for at least 35 years (such as streets, storm drains, bridges, etc.). The City has capitalized all infrastructure assets, including those acquired prior to 1980.
All purchased capital assets are valued at cost where historical cost records are available and at an estimated historical cost where no historical records exist. Donated capital assets, donated works of art and similar items, and capital assets received in a service concession arrangement are reported at acquisition value at the date of acquisition. Capital leases are capitalized in accordance with generally accepted accounting principles.
The costs of normal maintenance and repairs that do not add to the value of the asset or materially extend asset lives are not capitalized. Major outlays for capital assets and improvements are capitalized as construction in progress as projects are constructed. Using the convention of no depreciation expense in the year of acquisition, depreciation is recorded on a straight-line basis over the useful life of the assets as follows:
Buildings & Improvements 5-45 years Furniture, Machinery, & Office Equipment 3-15 years Vehicles 5-10 years Walkways and ramps 45 years Street network 35 years Storm drain network 60 years Bridges 65 years G. COMPENSATED ABSENCES PAYABLE
Compensated absences include accrued vacation and sick leave that are available to employees in future years either in time off or in cash (upon leaving the employ of the City). The City accounts for compensated absences in accordance with GASB Code Section C60 whereby a liability for compensated absences is reported in governmental funds only if the liability has matured, such as would occur as a result of employee resignations and retirements. The general fund has been used in prior years to liquidate the compensated absences liability; the City expects to continue using the general fund to liquidate the compensated absences liability.
H. RESTRICTED ASSETS
Certain assets are classified as restricted because their use is limited by applicable debt covenants. Specifically, the assets are restricted for principal and interest payments due on long-term debt, are maintained by a trustee as a reserve requirement for debt, or are restricted for payments on projects for which the debt was issued. Other assets may be classified as restricted when monies are held by a fiscal agent to pay contract retentions on certain projects.
I. FLOW ASSUMPTIONS OF RESTRICTED AND UNRESTRICTED RESOURCES
When both restricted and unrestricted resources are available for use, it is the City’s policy to use restricted resources first, then to use unrestricted resources as they are needed. See this note’s sections (O) and (P) for additional flow assumption information.
Balance Balance Due Within Long-TermJuly 1, 2020 Additions Deletions June 30, 2021 One Year Amount
Governmental Activities:Compensated absences 635,650$ 571,361$ (660,473)$ 546,538$ (500,000)$ 46,538$
35
CITY OF MALIBU, CALIFORNIA NOTES TO THE FINANCIAL STATEMENTS (Continued) June 30, 2021
J. PREPAID ITEMS
The City uses the consumption method to account for prepaid items; payments to vendors which reflect costs applicable to future accounting periods are recorded as prepaid items in both the government-wide and fund financial statements.
K. DEFERRED OUTFLOWS/INFLOWS OF RESOURCES
In addition to assets and liabilities, the Statement of Net Position and the Governmental Funds’ Balance Sheet will sometimes report separate sections for deferred outflows of resources and for deferred inflows of resources. The separate financial statement element of deferred outflows of resources represents a consumption of net position/fund balance that applies to a future period(s) which will not be recognized as an outflow of resources (expense/expenditure) until that time. The City has items that qualify for reporting in this category: the deferred charge on refunding of long-term liabilities and components of the calculations for the net pension and OPEB liabilities. The separate financial statement element of deferred inflows of resources represents an acquisition of net position/fund balance that applies to a future period(s) which will not be recognized as an inflow of resources (revenue) until that time. The City has items that qualify for reporting in this category: unavailable revenue and components of the calculations for the net pension and OPEB liabilities. Unavailable revenue exists only under the modified accrual basis of accounting and, accordingly, is reported only in the governmental funds’ balance sheet. The governmental funds typically report unavailable revenues for grant receipts which have been earned but which are not received within the City’s defined availability period; these amounts are deferred and recognized as an inflow of resources in the period that the amounts become available.
L. CASH EQUIVALENTS
For purposes of the statement of cash flows, cash equivalents are defined as short-term, highly liquid investments that are both 1) readily convertible to known amounts of cash or so near their maturity that they present an insignificant risk of a change in value and 2) have an original maturity date of three months or less. Cash equivalents represent the proprietary and fiduciary funds’ share in the City’s cash and investment pool.
M. OPERATING AND NON-OPERATING REVENUES AND EXPENSES – PROPRIETARY FUNDS
Operating revenues and expenses result from activities related to renting commercial real estate to customers in the Commercial Real Estate Rental enterprise fund and from activities relating to the collection, treatment, and disposal of wastewater in the Wastewater Treatment enterprise fund. All revenues and expenses which do not relate to these activities and which are not capital in nature are reported as non-operating revenues and expenses.
N. CONTRACTUAL COMMITMENTS
Encumbrances represent commitments related to unperformed contracts for goods or services, such as with purchase orders. While all operating appropriations and encumbrances lapse at year-end, valid outstanding encumbrances are re-appropriated and become part of the subsequent year’s budget. The City approves project-length budgets for capital projects, and unexpended capital improvement appropriations are carried forward until the project is complete. At June 30, 2021, the significant commitments, including continuing capital projects within enterprise funds, are as follows:
Major Enterprise Fund:Commercial Real Estate Rental 219,528$ Wastewater Treatment 1,117,681
Major Governmental Funds:General Fund 3,217,806 Capital Improvements Capital Projects Fund 1,196,997
Nonmajor Governmental Funds 198,799
36
CITY OF MALIBU, CALIFORNIA NOTES TO THE FINANCIAL STATEMENTS (Continued) June 30, 2021
O. FUND BALANCE
In the governmental fund financial statements, fund balance is made up of the following categories:
Nonspendable fund balance typically includes inventories, prepaid items, and other similar items that must be maintained intact pursuant to legal or contractual requirements.
Restricted fund balance includes amounts that can be spent only for specific purposes imposed by creditors, grantors, contributors, or laws or regulations of other governments or through enabling legislation. Committed fund balance includes amounts that can be used only for the specific purposes determined by a resolution (formal action) of the City Council. The City Council has the authority to establish, modify, or rescind a fund balance commitment.
Assigned fund balance is comprised of amounts designated by the City Council for specific purposes which do not meet the criteria to be classified as restricted or committed. In accordance with the City’s fund balance policy, the City Council may assign a designee, the City Manager, to make assignments of fund balance.
Unassigned fund balance is the residual classification that includes all spendable amounts not contained in other categories. The General Fund is the only fund that may report a positive unassigned fund balance. In all other governmental funds, when expenditures exceed the amounts available, it may be necessary to report a negative unassigned fund balance in that fund.
When expenditures are incurred for purposes for which both restricted and unrestricted (committed, assigned, or unassigned) fund balances are available, the City’s policy is to consider restricted fund balance to have been depleted before using any components of unrestricted fund balance. Further, when expenditures are incurred for purposes for which committed, assigned, or unassigned fund balances are available, the City’s policy is to first deplete committed fund balance, then assigned fund balance, and finally unassigned fund balance.
P. NET POSITION
In the government-wide, proprietary, and fiduciary fund financial statements, net position is classified in the following categories:
Net Investment in Capital Assets: This category represents all capital assets, unspent debt proceeds, and required reserves, less accumulated depreciation and the outstanding principal of capital-related debt. The City’s capital assets do not represent a financial resource and, consequently, are not readily available for funding current obligations. Restricted Net Position: This category represents external restrictions imposed by creditors, grantors, contributors, or laws or regulations of other governments and restrictions imposed by law through constitutional provisions or enabling legislation. Unrestricted Net Position: This category represents the net position that is not restricted for any purpose.
When an expense is incurred for purposes for which both restricted and unrestricted resources are available, the City’s policy is to consider restricted net position to have been depleted before applying unrestricted net position. Q. PENSIONS
For purposes of measuring the net pension liability and deferred outflows/inflows of resources related to pensions and pension expense, information about the fiduciary net position of the City’s California Public Employees’ Retirement System (CalPERS) Plans (Plans) and additions to/deductions from the Plans’ fiduciary net position have been determined on the same basis as they are reported by CalPERS. For this purpose, benefit payments (including refunds of employee contributions) are recognized when due and payable in accordance with the benefit terms. Investments are reported at fair value. The net pension liability is recorded solely within Governmental Activities, and the liability is being liquidated by the General Fund.
37
CITY OF MALIBU, CALIFORNIA NOTES TO THE FINANCIAL STATEMENTS (Continued) June 30, 2021
R. OTHER POST-EMPLOYMENT BENEFITS (OEPB)
For purposes of measuring the net OPEB (asset)/liability and deferred outflows/inflows of resources related to OPEB and OPEB expense, information about the fiduciary net position of the City’s OPEB Plan (the assets of which are held by CalPERS as part of the California Employer’s Retiree Benefit Trust Program (CERBT)), and additions to/deductions from the OPEB Plans’ fiduciary net position have been determined on the same basis as they are reported by the Plan. For this purpose, benefit payments are recognized when currently due and payable in accordance with the benefit terms. Investments are reported at fair value. The OPEB (asset)/liability is recorded solely within Governmental Activities, and any liability will be liquidated by the General Fund. S. CHANGES IN ACCOUNTING PRINCIPLES AND NEW GASB PRONOUNCEMENTS The City implemented GASB Statement No. 84, Fiduciary Activities during Fiscal Year 2020-21. The requirements of this Statement enhance consistency and comparability by (1) establishing specific criteria for identifying activities that should be reported as fiduciary activities and (2) clarifying whether and how business-type activities should report their fiduciary activities. Greater consistency and comparability enhance the value provided by the information reported in financial statements for assessing government accountability and stewardship. The change in accounting principle resulted in a prior period adjustment in the amount of ($56,453,983) for the Custodial Funds and $($225,079) for the previously reported Pension Trust Funds in the Statement of Changes in Fiduciary Net Position. Note 15 has additional information on the prior period adjustment. In addition, the previously reported Special Deposits Agency Fund no longer meets the criteria for being reported as a Fiduciary Fund. The City early adopted GASB Statement No. 98, the Annual Comprehensive Financial Report, which establishes the term annual comprehensive financial report and its acronym ACFR. The new term and acronym replace instances of comprehensive annual financial report and its acronym in generally accepted accounting principles for state and local governments. This statement was developed in response to concerns raised by stakeholders that the common pronunciation of the acronym for comprehensive annual financial report sounds like a profoundly objectionable racial slur. This Statement’s introduction of the new term is founded on a commitment to promoting inclusiveness.
2. CASH AND INVESTMENTS
The City maintains a cash and investment pool which is available for use by all funds, and all funds participate in the pool. Interest income earned on pooled cash and investments is allocated quarterly to the various funds based on month-end cash balances. Cash and investments consisted of the following at year end:
At June 30, 2021, the pooled demand deposit bank balance was $14,318,398. The amount shown for pooled demand deposits is the amount after outstanding checks are subtracted and deposits in transit are added.
Pooled Deposits & Investments:Demand Deposits 14,245,330$ Investments 52,228,270
Cash and Investments with Fiscal Agents:Investments 4,327,899
Petty Cash 1,090 Total Cash and Investments 70,802,589$
38
CITY OF MALIBU, CALIFORNIA NOTES TO THE FINANCIAL STATEMENTS (Continued) June 30, 2021
Cash and investments are reported in the basic financial statements as follows:
INVESTMENTS AUTHORIZED BY THE CALIFORNIA GOVERNMENT CODE & MALIBU’S INVESTMENT POLICY
The following table identifies the investment types that are authorized by the California Government Code and the City’s investment policy for pooled investments. The table also identifies certain provisions of either the California Government Code or the City’s investment policy (whichever is more restrictive) that address interest rate risk, credit risk, and concentration of credit risk. A separate table addresses investments of debt proceeds that are held by fiscal agents.
INVESTMENTS AUTHORIZED BY DEBT AGREEMENTS The investment of debt proceeds held by fiscal agents is governed by provisions of the debt agreements rather than the general provisions of the California Government Code or the City’s investment policy. The following table identifies the investment types that are authorized for investments held by the City’s fiscal agent. Unless indicated otherwise, the trust agreement does not specify a maximum maturity, a maximum percentage of the portfolio, nor a maximum investment in a single issuer. The table also identifies certain provisions of these debt agreements that address interest rate risk, credit risk, and concentration of credit risk.
Governmental Funds:Unrestricted 58,926,663$ Restricted 45,336
Proprietary Funds:Unrestricted 3,839,652 Restricted 5
Fiduciary Funds:Cash and cash equivalents 3,708,375 Cash and cash equivalents with fiscal agents 4,282,558 Total Cash and Investments 70,802,589$
Authorized Maximumby Malibu's Maximum Investment
Investment Type - Authorized by the Investment Maximum Percentage in a SingleCalifornia Government Code Policy Maturity (1) of Portfolio (1) Issuer (1)
Local Agency Bonds Yes 5 years None NoneU.S. Treasury Obligations Yes 5 years None NoneCalifornia State Treasury Obligations No 5 years None NoneU.S. Agency Securities Yes 5 years None NoneBanker's Acceptances Yes 180 days 20% (2) 10% (2)
Commercial Paper Yes 270 days 15% (2) 5% (2)
Negotiable Certificates of Deposit Yes 5 years 30% NoneRepurchase Agreements Yes 1 year None NoneReverse Repurchase Agreements No 92 days 20% of base value NoneSupranationals No 5 years 30% NoneCorporate Medium-Term Notes No 5 years 30% NoneMutual Funds No N/A 20% 10%Money Market Mutual Funds Yes N/A 20% NoneMortgage Pass-Through Securities/CMO No 5 years 20% NoneCounty Investment Pools Yes N/A None NoneLocal Agency Investment Fund (LAIF) Yes N/A None None
Notes:(1) Restrictions are in accordance with the California Government Code unless indicated otherwise.(2) The restriction is in accordance with the City's Investment Policy which is more restrictive than the California Government Code.
39
CITY OF MALIBU, CALIFORNIA NOTES TO THE FINANCIAL STATEMENTS (Continued) June 30, 2021
INTEREST RATE RISK Interest rate risk is the risk that changes in market interest rates will adversely affect the fair value of an investment. Generally, the longer an investment has before maturity, the greater the sensitivity of its fair value to changes in market interest rates. One of the ways the City manages its exposure to interest rate risk is by purchasing a combination of short-term and long-term investments and by timing cash flows from maturities so that a portion of the portfolio is maturing or coming close to maturity evenly over time as necessary to provide cash flow and liquidity for operations. The City monitors the interest rate risk inherent in its investments, including those held by fiscal agents, by using specific identification of the investments.
Certificates of 2016 AD 2010 ADParticipation Limited 2008 CFD LimitedSeries 2015, Obligation Special Obligation
Investment Type - Authorized by Trust Agreements 2016 & 2018 Bonds Tax Bonds BondsLocal Agency Bonds Allowed (4) Allowed AllowedU.S. Treasury Obligations Allowed Allowed Allowed AllowedCalifornia State Treasury Obligations Allowed Not Allowed Allowed Not AllowedU.S. Agency Securities Allowed Allowed Allowed AllowedBanker's Acceptances (1) Allowed (4) Allowed AllowedCommercial Paper (2) Allowed Allowed Allowed AllowedRepurchase Agreements Allowed Allowed Not Allowed AllowedMoney Market Mutual Funds Allowed Allowed Allowed AllowedLocal Agency Investment Fund (LAIF) Allowed Allowed Allowed AllowedInvestment agreements Allowed Allowed Allowed AllowedCertificates of deposit (3) Allowed Allowed Not Allowed AllowedCounty of Los Angeles Pooled Investment Fund Not Allowed Allowed Not Allowed Allowed
(1) Maximum maturity allowed is 360 days.
(3) Maximum maturity allowed is 1 year.(2) Maximum maturity allowed is 270 days except the 2010 & 2016 AD Limited Obligation Bonds which is 180
(4) Not specifically stated as being allowed, but this investment is allowed as it is in accordance with the City's investment policy.
40
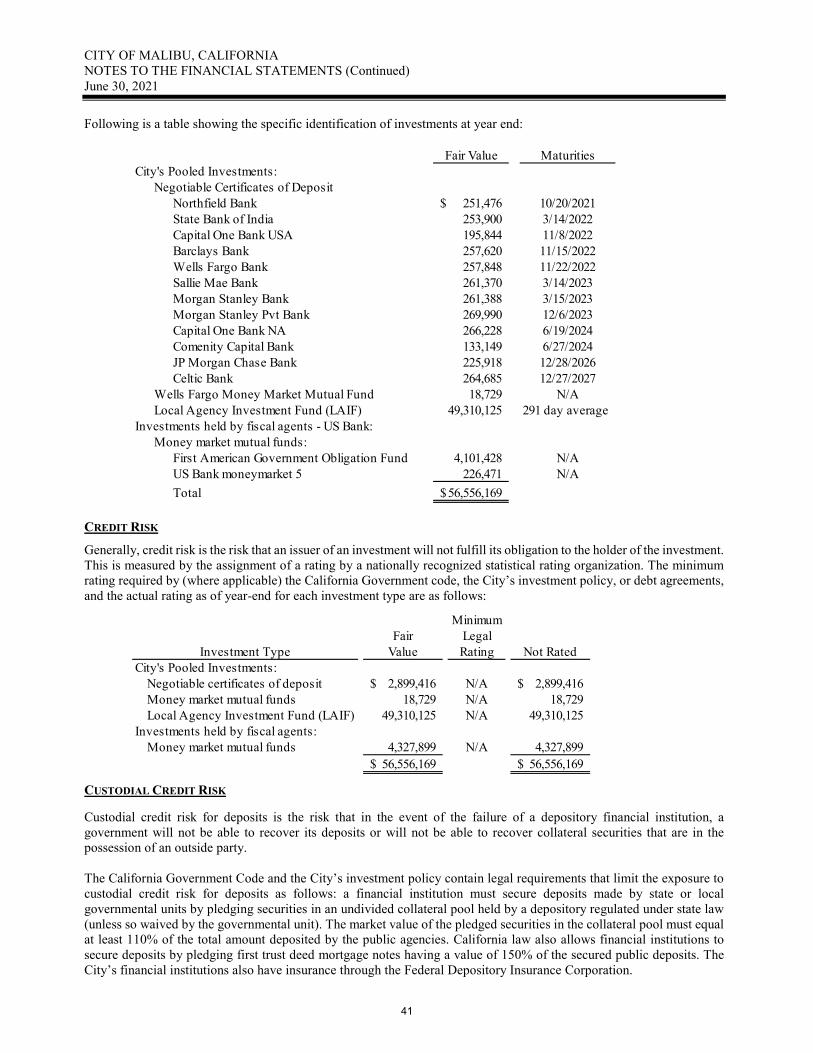
CITY OF MALIBU, CALIFORNIA NOTES TO THE FINANCIAL STATEMENTS (Continued) June 30, 2021
Following is a table showing the specific identification of investments at year end:
CREDIT RISK Generally, credit risk is the risk that an issuer of an investment will not fulfill its obligation to the holder of the investment. This is measured by the assignment of a rating by a nationally recognized statistical rating organization. The minimum rating required by (where applicable) the California Government code, the City’s investment policy, or debt agreements, and the actual rating as of year-end for each investment type are as follows:
CUSTODIAL CREDIT RISK Custodial credit risk for deposits is the risk that in the event of the failure of a depository financial institution, a government will not be able to recover its deposits or will not be able to recover collateral securities that are in the possession of an outside party. The California Government Code and the City’s investment policy contain legal requirements that limit the exposure to custodial credit risk for deposits as follows: a financial institution must secure deposits made by state or local governmental units by pledging securities in an undivided collateral pool held by a depository regulated under state law (unless so waived by the governmental unit). The market value of the pledged securities in the collateral pool must equal at least 110% of the total amount deposited by the public agencies. California law also allows financial institutions to secure deposits by pledging first trust deed mortgage notes having a value of 150% of the secured public deposits. The City’s financial institutions also have insurance through the Federal Depository Insurance Corporation.
Fair Value MaturitiesCity's Pooled Investments:
Negotiable Certificates of DepositNorthfield Bank 251,476$ 10/20/2021State Bank of India 253,900 3/14/2022Capital One Bank USA 195,844 11/8/2022Barclays Bank 257,620 11/15/2022Wells Fargo Bank 257,848 11/22/2022Sallie Mae Bank 261,370 3/14/2023Morgan Stanley Bank 261,388 3/15/2023Morgan Stanley Pvt Bank 269,990 12/6/2023Capital One Bank NA 266,228 6/19/2024Comenity Capital Bank 133,149 6/27/2024JP Morgan Chase Bank 225,918 12/28/2026Celtic Bank 264,685 12/27/2027
Wells Fargo Money Market Mutual Fund 18,729 N/ALocal Agency Investment Fund (LAIF) 49,310,125 291 day average
Investments held by fiscal agents - US Bank:Money market mutual funds:
First American Government Obligation Fund 4,101,428 N/AUS Bank moneymarket 5 226,471 N/ATotal 56,556,169$
MinimumFair Legal
Investment Type Value Rating Not RatedCity's Pooled Investments:
Negotiable certificates of deposit 2,899,416$ N/A 2,899,416$ Money market mutual funds 18,729 N/A 18,729 Local Agency Investment Fund (LAIF) 49,310,125 N/A 49,310,125
Investments held by fiscal agents:Money market mutual funds 4,327,899 N/A 4,327,899
56,556,169$ 56,556,169$
41
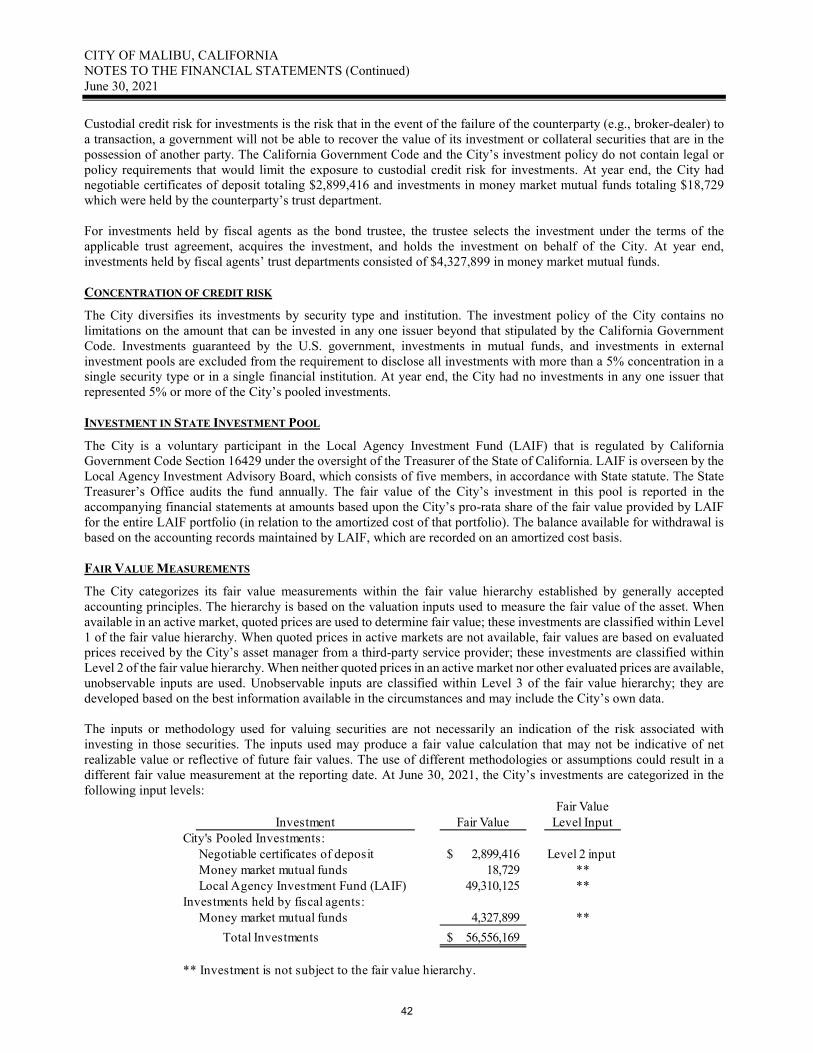
CITY OF MALIBU, CALIFORNIA NOTES TO THE FINANCIAL STATEMENTS (Continued) June 30, 2021
Custodial credit risk for investments is the risk that in the event of the failure of the counterparty (e.g., broker-dealer) to a transaction, a government will not be able to recover the value of its investment or collateral securities that are in the possession of another party. The California Government Code and the City’s investment policy do not contain legal or policy requirements that would limit the exposure to custodial credit risk for investments. At year end, the City had negotiable certificates of deposit totaling $2,899,416 and investments in money market mutual funds totaling $18,729 which were held by the counterparty’s trust department. For investments held by fiscal agents as the bond trustee, the trustee selects the investment under the terms of the applicable trust agreement, acquires the investment, and holds the investment on behalf of the City. At year end, investments held by fiscal agents’ trust departments consisted of $4,327,899 in money market mutual funds. CONCENTRATION OF CREDIT RISK The City diversifies its investments by security type and institution. The investment policy of the City contains no limitations on the amount that can be invested in any one issuer beyond that stipulated by the California Government Code. Investments guaranteed by the U.S. government, investments in mutual funds, and investments in external investment pools are excluded from the requirement to disclose all investments with more than a 5% concentration in a single security type or in a single financial institution. At year end, the City had no investments in any one issuer that represented 5% or more of the City’s pooled investments. INVESTMENT IN STATE INVESTMENT POOL The City is a voluntary participant in the Local Agency Investment Fund (LAIF) that is regulated by California Government Code Section 16429 under the oversight of the Treasurer of the State of California. LAIF is overseen by the Local Agency Investment Advisory Board, which consists of five members, in accordance with State statute. The State Treasurer’s Office audits the fund annually. The fair value of the City’s investment in this pool is reported in the accompanying financial statements at amounts based upon the City’s pro-rata share of the fair value provided by LAIF for the entire LAIF portfolio (in relation to the amortized cost of that portfolio). The balance available for withdrawal is based on the accounting records maintained by LAIF, which are recorded on an amortized cost basis. FAIR VALUE MEASUREMENTS The City categorizes its fair value measurements within the fair value hierarchy established by generally accepted accounting principles. The hierarchy is based on the valuation inputs used to measure the fair value of the asset. When available in an active market, quoted prices are used to determine fair value; these investments are classified within Level 1 of the fair value hierarchy. When quoted prices in active markets are not available, fair values are based on evaluated prices received by the City’s asset manager from a third-party service provider; these investments are classified within Level 2 of the fair value hierarchy. When neither quoted prices in an active market nor other evaluated prices are available, unobservable inputs are used. Unobservable inputs are classified within Level 3 of the fair value hierarchy; they are developed based on the best information available in the circumstances and may include the City’s own data. The inputs or methodology used for valuing securities are not necessarily an indication of the risk associated with investing in those securities. The inputs used may produce a fair value calculation that may not be indicative of net realizable value or reflective of future fair values. The use of different methodologies or assumptions could result in a different fair value measurement at the reporting date. At June 30, 2021, the City’s investments are categorized in the following input levels:
Fair ValueInvestment Fair Value Level Input
City's Pooled Investments:Negotiable certificates of deposit 2,899,416$ Level 2 inputMoney market mutual funds 18,729 **Local Agency Investment Fund (LAIF) 49,310,125 **
Investments held by fiscal agents:Money market mutual funds 4,327,899 ** Total Investments 56,556,169$
** Investment is not subject to the fair value hierarchy.
42
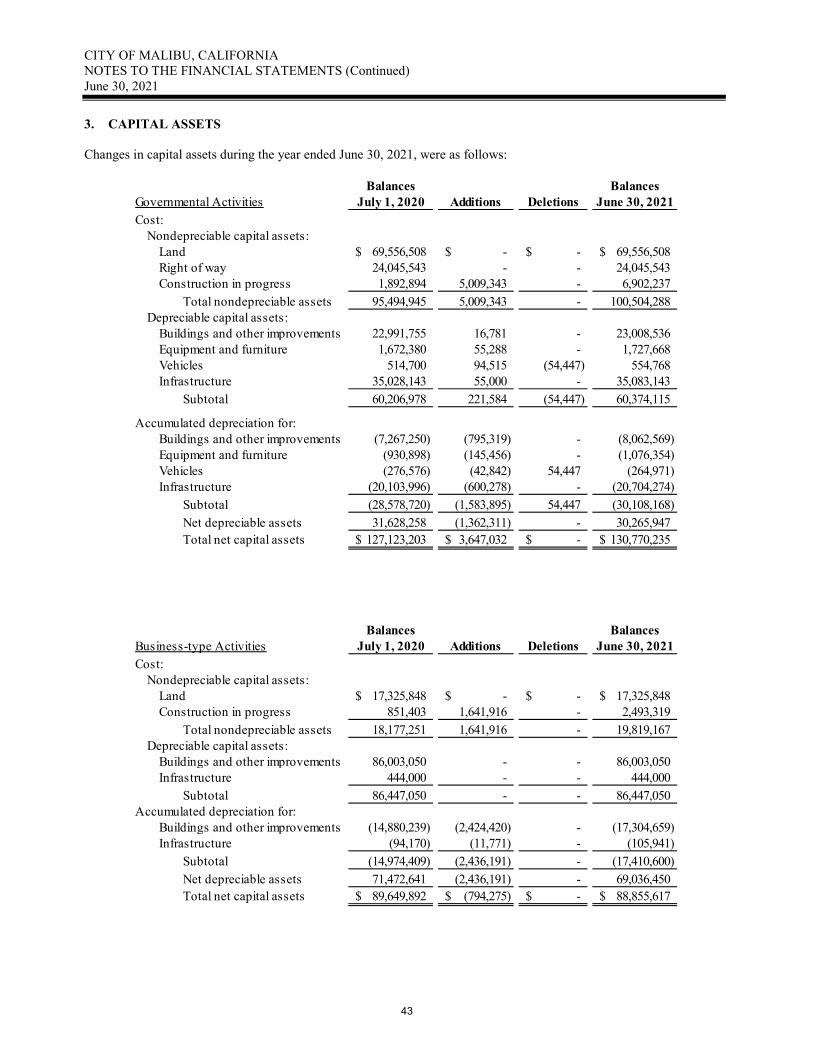
CITY OF MALIBU, CALIFORNIA NOTES TO THE FINANCIAL STATEMENTS (Continued) June 30, 2021
3. CAPITAL ASSETS Changes in capital assets during the year ended June 30, 2021, were as follows:
Balances BalancesGovernmental Activities July 1, 2020 Additions Deletions June 30, 2021Cost:
Nondepreciable capital assets:Land 69,556,508$ -$ -$ 69,556,508$ Right of way 24,045,543 - - 24,045,543 Construction in progress 1,892,894 5,009,343 - 6,902,237
Total nondepreciable assets 95,494,945 5,009,343 - 100,504,288 Depreciable capital assets:
Buildings and other improvements 22,991,755 16,781 - 23,008,536 Equipment and furniture 1,672,380 55,288 - 1,727,668 Vehicles 514,700 94,515 (54,447) 554,768 Infrastructure 35,028,143 55,000 - 35,083,143
Subtotal 60,206,978 221,584 (54,447) 60,374,115
Accumulated depreciation for:Buildings and other improvements (7,267,250) (795,319) - (8,062,569) Equipment and furniture (930,898) (145,456) - (1,076,354) Vehicles (276,576) (42,842) 54,447 (264,971) Infrastructure (20,103,996) (600,278) - (20,704,274)
Subtotal (28,578,720) (1,583,895) 54,447 (30,108,168) Net depreciable assets 31,628,258 (1,362,311) - 30,265,947 Total net capital assets 127,123,203$ 3,647,032$ -$ 130,770,235$
Balances BalancesBusiness-type Activities July 1, 2020 Additions Deletions June 30, 2021Cost:
Nondepreciable capital assets:Land 17,325,848$ -$ -$ 17,325,848$ Construction in progress 851,403 1,641,916 - 2,493,319
Total nondepreciable assets 18,177,251 1,641,916 - 19,819,167 Depreciable capital assets:
Buildings and other improvements 86,003,050 - - 86,003,050 Infrastructure 444,000 - - 444,000
Subtotal 86,447,050 - - 86,447,050 Accumulated depreciation for:
Buildings and other improvements (14,880,239) (2,424,420) - (17,304,659) Infrastructure (94,170) (11,771) - (105,941)
Subtotal (14,974,409) (2,436,191) - (17,410,600) Net depreciable assets 71,472,641 (2,436,191) - 69,036,450 Total net capital assets 89,649,892$ (794,275)$ -$ 88,855,617$
43
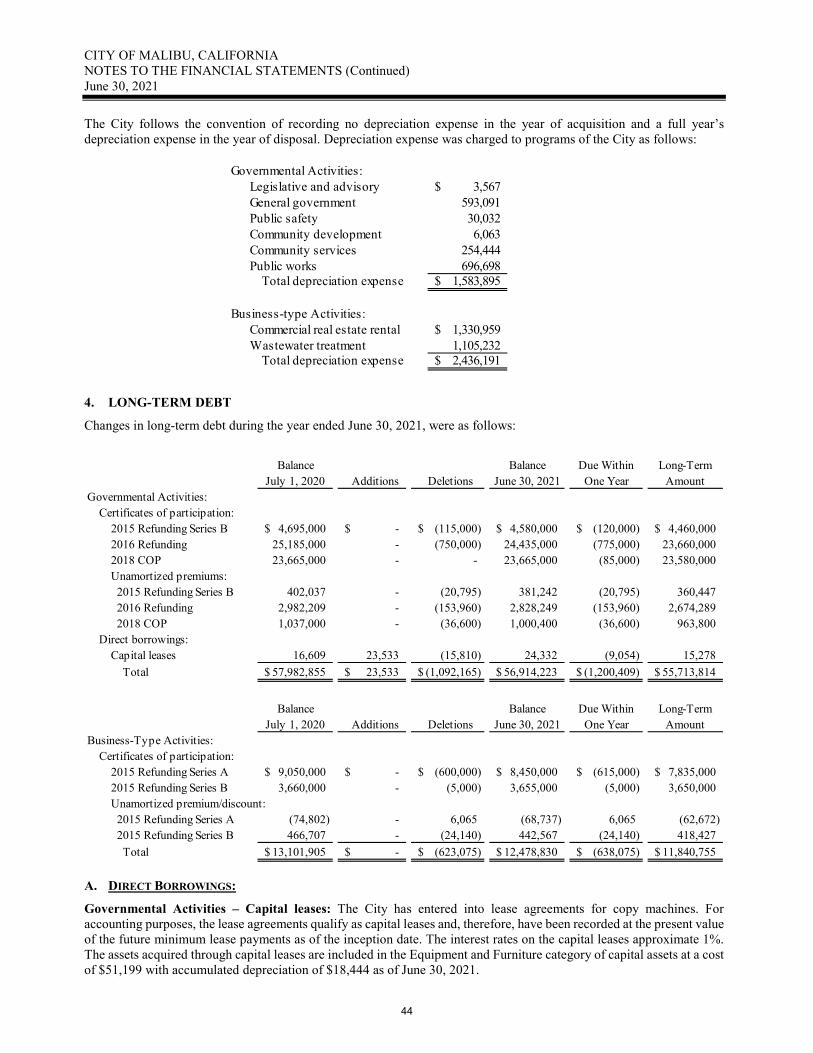
CITY OF MALIBU, CALIFORNIA NOTES TO THE FINANCIAL STATEMENTS (Continued) June 30, 2021
The City follows the convention of recording no depreciation expense in the year of acquisition and a full year’s depreciation expense in the year of disposal. Depreciation expense was charged to programs of the City as follows:
4. LONG-TERM DEBT Changes in long-term debt during the year ended June 30, 2021, were as follows:
A. DIRECT BORROWINGS: Governmental Activities – Capital leases: The City has entered into lease agreements for copy machines. For accounting purposes, the lease agreements qualify as capital leases and, therefore, have been recorded at the present value of the future minimum lease payments as of the inception date. The interest rates on the capital leases approximate 1%. The assets acquired through capital leases are included in the Equipment and Furniture category of capital assets at a cost of $51,199 with accumulated depreciation of $18,444 as of June 30, 2021.
Governmental Activities:Legislative and advisory 3,567$ General government 593,091 Public safety 30,032 Community development 6,063 Community services 254,444 Public works 696,698 Total depreciation expense 1,583,895$
Business-type Activities:Commercial real estate rental 1,330,959$ Wastewater treatment 1,105,232 Total depreciation expense 2,436,191$
Balance Balance Due Within Long-TermJuly 1, 2020 Additions Deletions June 30, 2021 One Year Amount
Governmental Activities:Certificates of participation:
2015 Refunding Series B 4,695,000$ -$ (115,000)$ 4,580,000$ (120,000)$ 4,460,000$ 2016 Refunding 25,185,000 - (750,000) 24,435,000 (775,000) 23,660,000 2018 COP 23,665,000 - - 23,665,000 (85,000) 23,580,000 Unamortized premiums: 2015 Refunding Series B 402,037 - (20,795) 381,242 (20,795) 360,447 2016 Refunding 2,982,209 - (153,960) 2,828,249 (153,960) 2,674,289 2018 COP 1,037,000 - (36,600) 1,000,400 (36,600) 963,800
Direct borrowings:Capital leases 16,609 23,533 (15,810) 24,332 (9,054) 15,278 Total 57,982,855$ 23,533$ (1,092,165)$ 56,914,223$ (1,200,409)$ 55,713,814$
Balance Balance Due Within Long-TermJuly 1, 2020 Additions Deletions June 30, 2021 One Year Amount
Business-Type Activities:Certificates of participation:
2015 Refunding Series A 9,050,000$ -$ (600,000)$ 8,450,000$ (615,000)$ 7,835,000$ 2015 Refunding Series B 3,660,000 - (5,000) 3,655,000 (5,000) 3,650,000 Unamortized premium/discount: 2015 Refunding Series A (74,802) - 6,065 (68,737) 6,065 (62,672) 2015 Refunding Series B 466,707 - (24,140) 442,567 (24,140) 418,427 Total 13,101,905$ -$ (623,075)$ 12,478,830$ (638,075)$ 11,840,755$
44
CITY OF MALIBU, CALIFORNIA NOTES TO THE FINANCIAL STATEMENTS (Continued) June 30, 2021
The payments due on these leases are as follows:
B. CERTIFICATES OF PARTICIPATION 2015 Refunding Series B (Governmental Activities and Business-Type Activities) In May 2015, the City issued $8,895,000 of tax-exempt refunding certificates of participation to refund 1) the 2006B outstanding certificates of participation (business-type activities used to finance a portion of the Legacy Park acquisition for the Commercial Real Estate Rental Enterprise Fund) in the amount of $4,130,000 and 2) the 2010C outstanding certificates of participation (governmental activities used to finance a portion of the City Hall renovations) in the amount of $5,890,000. The 2015 certificates were issued at a premium of $1,099,028 which is being amortized on a straight-line basis to interest expense through the year 2039. Both refunded series were paid in full by June 30, 2016, and there are no certificates outstanding. The refunding of the 2006B Series resulted in a difference between the reacquisition price of the 2006B Series and the net carrying amount of the applicable portion of the 2015B Series of $107,412. This difference is reported as a deferred outflow of resources (business-type activities) and is being amortized on a straight-line basis to interest expense through July 1, 2036. At year-end, the unamortized amount was $77,795. The refunding of the 2010C Series resulted in a difference between the reacquisition price of the 2010C Series and the net carrying amount of the applicable portion of the 2015B Series of $93,572. This difference is reported as a deferred outflow of resources (governmental activities) and is being amortized on a straight-line basis to interest expense through July 1, 2039. At year-end, the unamortized amount was $69,892. Each certificate of participation represents a direct and proportionate interest in the semi-annual interest payments and annual principal payments due on the certificates. Installment payments for the issues are payable from any source of lawfully available funds of the City. There are no assets pledged as collateral for the debt, no required reserve, and no unused lines of credit. There are no finance-related consequences related to significant events of default or termination, and there are no acceleration clauses. The interest rate on the certificates is fixed and ranges from 2.000% to 5.000%. Semi-annual interest payments are due on November 1 and May 1 beginning on November 1, 2015. Annual principal payments are due on November 1 in years 2015 through 2039. 2015 Refunding Series A (Business-Type Activities) In May 2015, the City issued $11,940,000 of taxable refunding certificates of participation to refund the 2006A outstanding certificates of participation in the amount of $10,795,000. The 2006A certificates were issued to finance a portion of the acquisition of Legacy Park for the Commercial Real Estate Rental Enterprise Fund. The certificates were issued at a discount of $105,881 which is being amortized on a straight-line basis to interest expense through the year 2033. The refunding resulted in a difference between the reacquisition price of the 2006A Series and the net carrying amount of the 2015A Series of $644,222. This difference is reported as a deferred outflow of resources and is being amortized on a straight-line basis to interest expense through July 1, 2032. At year-end, the unamortized amount was $414,927. The refunded series has been paid in full and there are no certificates outstanding. Each certificate of participation represents a direct and proportionate interest in the semi-annual interest payments and annual principal payments due on the certificates. Installment payments for the issues are payable from any source of lawfully available funds of the City. There are no assets pledged as collateral for the debt, no required reserve, and no
YearEnding
June 30, Amount2022 9,054$ 2023 7,862 2024 7,416
Totals 24,332$
45
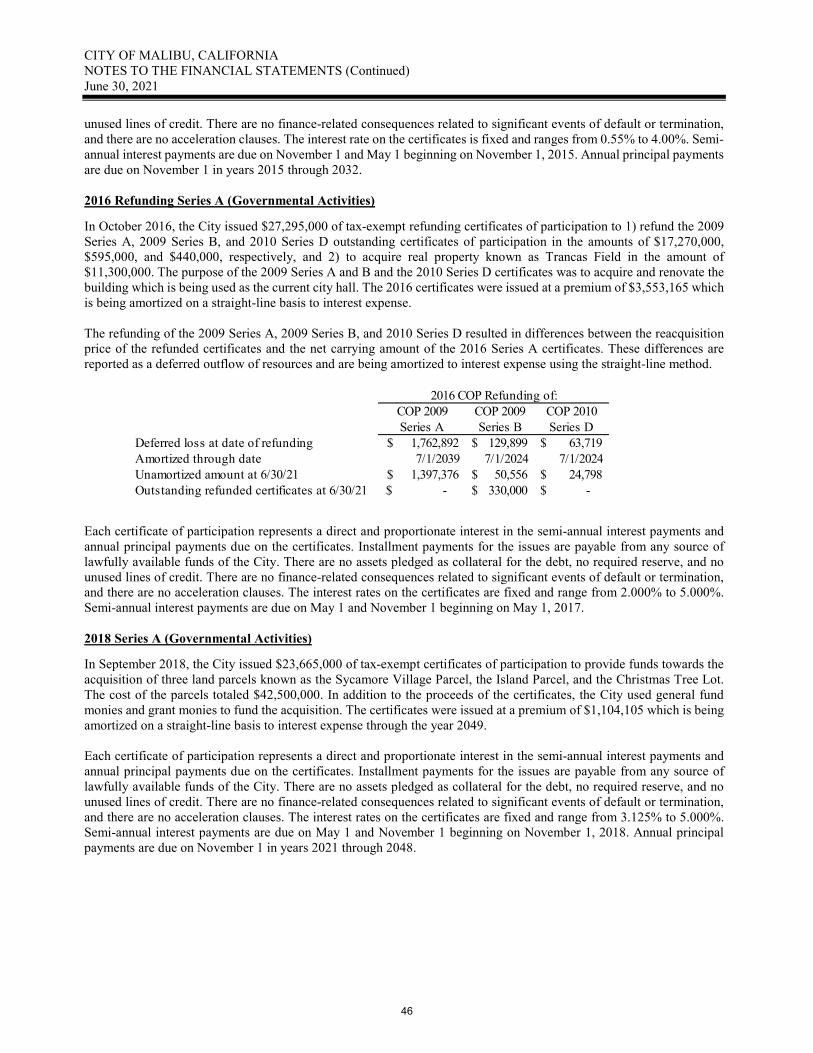
CITY OF MALIBU, CALIFORNIA NOTES TO THE FINANCIAL STATEMENTS (Continued) June 30, 2021
unused lines of credit. There are no finance-related consequences related to significant events of default or termination, and there are no acceleration clauses. The interest rate on the certificates is fixed and ranges from 0.55% to 4.00%. Semi-annual interest payments are due on November 1 and May 1 beginning on November 1, 2015. Annual principal payments are due on November 1 in years 2015 through 2032. 2016 Refunding Series A (Governmental Activities) In October 2016, the City issued $27,295,000 of tax-exempt refunding certificates of participation to 1) refund the 2009 Series A, 2009 Series B, and 2010 Series D outstanding certificates of participation in the amounts of $17,270,000, $595,000, and $440,000, respectively, and 2) to acquire real property known as Trancas Field in the amount of $11,300,000. The purpose of the 2009 Series A and B and the 2010 Series D certificates was to acquire and renovate the building which is being used as the current city hall. The 2016 certificates were issued at a premium of $3,553,165 which is being amortized on a straight-line basis to interest expense. The refunding of the 2009 Series A, 2009 Series B, and 2010 Series D resulted in differences between the reacquisition price of the refunded certificates and the net carrying amount of the 2016 Series A certificates. These differences are reported as a deferred outflow of resources and are being amortized to interest expense using the straight-line method.
Each certificate of participation represents a direct and proportionate interest in the semi-annual interest payments and annual principal payments due on the certificates. Installment payments for the issues are payable from any source of lawfully available funds of the City. There are no assets pledged as collateral for the debt, no required reserve, and no unused lines of credit. There are no finance-related consequences related to significant events of default or termination, and there are no acceleration clauses. The interest rates on the certificates are fixed and range from 2.000% to 5.000%. Semi-annual interest payments are due on May 1 and November 1 beginning on May 1, 2017. 2018 Series A (Governmental Activities) In September 2018, the City issued $23,665,000 of tax-exempt certificates of participation to provide funds towards the acquisition of three land parcels known as the Sycamore Village Parcel, the Island Parcel, and the Christmas Tree Lot. The cost of the parcels totaled $42,500,000. In addition to the proceeds of the certificates, the City used general fund monies and grant monies to fund the acquisition. The certificates were issued at a premium of $1,104,105 which is being amortized on a straight-line basis to interest expense through the year 2049. Each certificate of participation represents a direct and proportionate interest in the semi-annual interest payments and annual principal payments due on the certificates. Installment payments for the issues are payable from any source of lawfully available funds of the City. There are no assets pledged as collateral for the debt, no required reserve, and no unused lines of credit. There are no finance-related consequences related to significant events of default or termination, and there are no acceleration clauses. The interest rates on the certificates are fixed and range from 3.125% to 5.000%. Semi-annual interest payments are due on May 1 and November 1 beginning on November 1, 2018. Annual principal payments are due on November 1 in years 2021 through 2048.
COP 2009 COP 2009 COP 2010Series A Series B Series D
Deferred loss at date of refunding 1,762,892$ 129,899$ 63,719$ Amortized through date 7/1/2039 7/1/2024 7/1/2024 Unamortized amount at 6/30/21 1,397,376$ 50,556$ 24,798$ Outstanding refunded certificates at 6/30/21 -$ 330,000$ -$
2016 COP Refunding of:
46
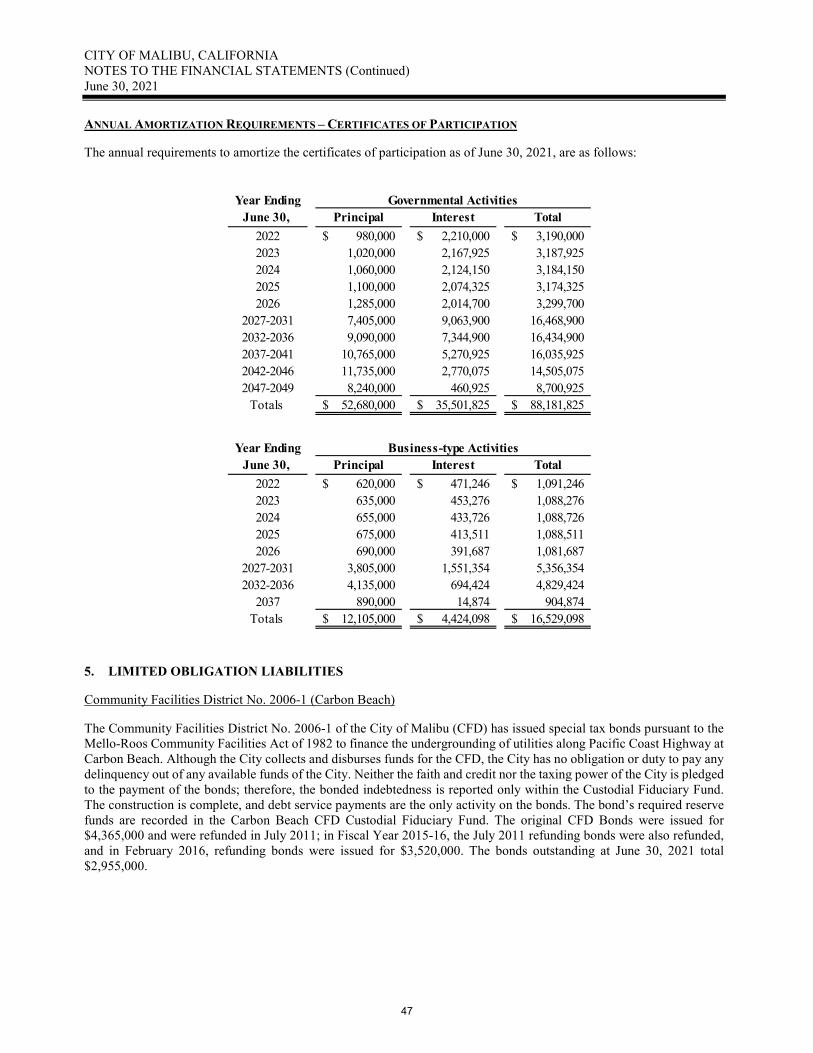
CITY OF MALIBU, CALIFORNIA NOTES TO THE FINANCIAL STATEMENTS (Continued) June 30, 2021
ANNUAL AMORTIZATION REQUIREMENTS – CERTIFICATES OF PARTICIPATION The annual requirements to amortize the certificates of participation as of June 30, 2021, are as follows:
5. LIMITED OBLIGATION LIABILITIES Community Facilities District No. 2006-1 (Carbon Beach) The Community Facilities District No. 2006-1 of the City of Malibu (CFD) has issued special tax bonds pursuant to the Mello-Roos Community Facilities Act of 1982 to finance the undergrounding of utilities along Pacific Coast Highway at Carbon Beach. Although the City collects and disburses funds for the CFD, the City has no obligation or duty to pay any delinquency out of any available funds of the City. Neither the faith and credit nor the taxing power of the City is pledged to the payment of the bonds; therefore, the bonded indebtedness is reported only within the Custodial Fiduciary Fund. The construction is complete, and debt service payments are the only activity on the bonds. The bond’s required reserve funds are recorded in the Carbon Beach CFD Custodial Fiduciary Fund. The original CFD Bonds were issued for $4,365,000 and were refunded in July 2011; in Fiscal Year 2015-16, the July 2011 refunding bonds were also refunded, and in February 2016, refunding bonds were issued for $3,520,000. The bonds outstanding at June 30, 2021 total $2,955,000.
Year EndingJune 30, Principal Interest Total
2022 980,000$ 2,210,000$ 3,190,000$ 2023 1,020,000 2,167,925 3,187,925 2024 1,060,000 2,124,150 3,184,150 2025 1,100,000 2,074,325 3,174,325 2026 1,285,000 2,014,700 3,299,700
2027-2031 7,405,000 9,063,900 16,468,900 2032-2036 9,090,000 7,344,900 16,434,900 2037-2041 10,765,000 5,270,925 16,035,925 2042-2046 11,735,000 2,770,075 14,505,075 2047-2049 8,240,000 460,925 8,700,925
Totals 52,680,000$ 35,501,825$ 88,181,825$
Governmental Activities
Year EndingJune 30, Principal Interest Total
2022 620,000$ 471,246$ 1,091,246$ 2023 635,000 453,276 1,088,276 2024 655,000 433,726 1,088,726 2025 675,000 413,511 1,088,511 2026 690,000 391,687 1,081,687
2027-2031 3,805,000 1,551,354 5,356,354 2032-2036 4,135,000 694,424 4,829,424
2037 890,000 14,874 904,874 Totals 12,105,000$ 4,424,098$ 16,529,098$
Business-type Activities
47
CITY OF MALIBU, CALIFORNIA NOTES TO THE FINANCIAL STATEMENTS (Continued) June 30, 2021
Assessment District No. 2010-1 (Broad Beach) The City of Malibu Broad Beach Road Underground Utilities Assessment District 2010-1 (AD) has issued limited obligation improvement bonds pursuant to the Improvement Bond Act of 1915 to finance the undergrounding of utilities in a portion of Broad Beach Road. Although the City collects and disburses funds for the AD, the City has no obligation or duty to pay any delinquency out of any available funds of the City. Neither the faith and credit nor the taxing power of the City is pledged to the payment of the bonds; therefore, the bonded indebtedness is reported only within the Custodial Fiduciary Fund. The construction is complete, and debt service payments are the only activity on the bonds. The bond’s required reserve funds are recorded in the Broad Beach AD Custodial Fiduciary Fund. The AD Bonds were originally issued for $2,238,285; bonds outstanding at June 30, 2021 total $1,575,000. Assessment District No. 2015-1 (Civic Center Wastewater Treatment Facility)
A. Bonds: The Assessment District No. 2015-1 of the City of Malibu (AD) has issued limited obligation improvement bonds pursuant to the Improvement Bond Act of 1915 to finance a portion of the costs to construct a wastewater treatment plant serving the City’s civic center. Although the City collects and disburses funds for the AD, the City has no obligation or duty to pay any delinquency out of any available funds of the City. Neither the faith and credit nor the taxing power of the City is pledged to the payment of the bonds; therefore, the bonded indebtedness is reported only within the Custodial Fiduciary Fund. The construction is complete, and debt service payments are the only activity on the bonds. The bond’s required reserve funds are recorded in the Civic Center Wastewater Treatment Facility AD Custodial Fiduciary Fund. The AD bonds were issued for $6,295,000 in May 2016; bonds outstanding at June 30, 2021 total $3,870,000.
B. State Revolving Fund Loan: The Assessment District No. 2015-1 has obtained long-term financing through the State of California’s Revolving Fund Loan program. The loan proceeds were used to finance a portion of the costs to construct a wastewater treatment plant serving the City’s civic center. Although the City collects and disburses funds for the Assessment District, the City has no obligation or duty to pay any delinquency out of any available funds of the City. Neither the faith and credit nor the taxing power of the City is pledged to the payment of the loans; therefore, the bonded indebtedness is reported only within the Custodial Fiduciary Fund. The construction is complete, and debt service payments are the only activity on the loan. The loan’s required reserve funds are recorded in the Civic Center Wastewater Treatment Facility AD Custodial Fiduciary Fund. The loan amount outstanding at June 30, 2021 totals $45,850,476.
6. OPERATING LEASES – CITY AS LESSOR
The City’s Commercial Real Estate Rental Enterprise Fund owns three commercial properties at the Legacy Park site; one of the properties is divided into two leasable spaces. As of June 30, 2021, the City has four non-cancelable tenant leases on the properties.
Office/Retail Building: This property is comprised of two spaces available to be leased. The property is valued at $1,141,105 for the land and $2,924,082 for the building. Due to accumulated depreciation, the building has a net book value of $731,022 at June 30, 2021.
1) A lease was signed on January 6, 2010, for a ten-year period with an option to extend for one, ten-year period,
and it was amended on June 9, 2010 for 3,356 square feet of the total 4,501 square feet of this building. To avoid expiration in January 2020, the lease was amended on August 26, 2019. The amended lease commenced on September 1, 2019 for a five-year term, with options to extend the lease for two additional terms of five years each. The rent increases annually on September 1 by 2% during the first five-year term and by 3% during any option periods exercised. The monthly lease payment was $15,366 for July 1, 2020 through August 31, 2020 and $15,674 during the remainder of the year. There are no contingent rental payments on this lease.
2) A lease was signed on May 14, 2012 for 1,145 square feet of the total 4,501 square feet of this building. The
lease was effective on January 14, 2013 for a ten-year period with an option to extend for one, ten-year period. Due to economic concerns related to the global pandemic, the lease was amended effective January 2020 to reduce the scheduled monthly lease payment by $1,000 for January 1, 2020 through June 30, 2021. As a result, the minimum monthly lease payment was $3,034 for January 1, 2020 through December 31, 2020 and $3,156 for January 1, 2021 through June 30, 2021. The monthly lease payment will revert to the original contract amount
48
CITY OF MALIBU, CALIFORNIA NOTES TO THE FINANCIAL STATEMENTS (Continued) June 30, 2021
of $4,156 on July 1, 2021 through December 31, 2021. The monthly rate increases by 3% on January 1 of each year for the remainder of the lease term. There are no contingent rental payments on this lease.
Animal Hospital: The City assumed the existing lease upon purchase of the Legacy park site in 2006; an extension to the lease was executed on April 10, 2013 which extends the lease through January 1, 2025. The monthly lease payment increases by 2% on each January 1 during the lease term, and there are no contingent rental payments on this lease. During Fiscal Year 2020-21, the minimum monthly lease payment was $24,382 through December 2020 and $24,869 during the remainder of the year with an annual rent reduction of $25,000. This leased property is valued at $855,829 for the land and $2,303,900 for the building and its improvements. Due to accumulated depreciation, the building has a net book value of $1,155,202 as of June 30, 2021.
Lumber Yard: The City executed a master lease agreement for the property in 2008 with the lease commencing on March 1, 2008 and continuing through March 1, 2046 with an option to extend to 2062. The minimum monthly lease payments from March 1, 2018 through March 1, 2023 are $84,984. The lease had a fixed amount increase on March 1, 2018 and will increase by a fixed amount every five years thereafter. Additionally, the City receives a percentage rental income based on a formula by which the City receives 30% of the tenant’s income collected annually past $2.2 million. In Fiscal Year 2020-21, the tenant’s income collected did not reach the minimum milestone, and the City received no payments from the tenant’s percentage income formula. This leased property is valued at $3,138,040 for the land and $14,588,211 for the building. Due to accumulated depreciation, the building has a net book value of $5,835,284 as of June 30, 2021.
At year-end, the future minimum lease payments due to the City are as follows:
7. RETIREMENT BENEFITS A. DEFINED BENEFIT PLAN PLAN DESCRIPTION AND ELIGIBILITY The City of Malibu’s defined benefit pension plan is part of the Miscellaneous Risk Pool of the Public Agency portion of the California Public Employees Retirement System (CalPERS), a cost-sharing multiple-employer defined benefit plan, which acts as a common investment and administrative agent for participating public employers within the State of California. All qualified permanent and probationary employees are eligible to participate in one of the City’s Plans. The City has a two-tiered plan depending on an employee’s entry date into the plan.
• Tier A is for employees who enter the plan prior to January 1, 2013, and provides 2% of final average compensation per year of service at age 55. The final average compensation is based on the final twelve months of compensation.
• Tier B is for employees who enter the plan on or after January 1, 2013, and provides 2% of final average compensation per year of service at age 62. The final average compensation is based on the final three years of compensation. This plan is in accordance with the Public Employees’ Pension Reform Act (PEPRA).
Year Ending June 30, Total 2022 1,555,065$ 2023 1,573,977 2024 1,558,342 2025 1,421,239 2026 1,281,527 2027-2031 6,738,318 2032-2036 6,687,734 2037-2041 6,158,588 2042-2046 6,032,664 Total 33,007,454$
49
CITY OF MALIBU, CALIFORNIA NOTES TO THE FINANCIAL STATEMENTS (Continued) June 30, 2021
Benefit provisions under the Plans are established by State statute and City resolution. CalPERS issues publicly available reports that include a full description of the pension plans regarding benefit provisions, assumptions, and membership information that can be found on the CalPERS website at www.calpers.ca.gov. For the information included in this report, the following timeframes are used:
BENEFITS PROVIDED CalPERS provides service retirement and disability benefits, annual cost of living adjustments, and death benefits to plan members, who must be public employees and beneficiaries. Benefits are based on years of credited service, equal to one year of full-time employment. Members with five years of total service are eligible to retire at age 50 to 62 with statutorily reduced benefits. All members are eligible for non-industrial disability benefits after five years of service. The death benefit is one of the following: the Basic Death Benefit, the 1957 Survivor Benefit, or the Optional Settlement 2W Death Benefit. The cost of living adjustments for each plan are applied as specified by the Public Employees’ Retirement Law. The Plans’ provisions and benefits in effect for the plan year ended June 30, 2021, are summarized as follows:
CONTRIBUTIONS Section 20814(c) of the California Public Employees’ Retirement Law requires that the employer contribution rates for all public employers be determined on an annual basis by the actuary and shall be effective on the July 1 following notice of a change in the rate. The total plan contributions are determined through CalPERS’ annual actuarial valuation process. The actuarially determined rate is the estimated amount necessary to finance the costs of benefits earned by employees during the year, with an additional amount to finance any unfunded accrued liability. The City is required to contribute the difference between the actuarially determined rate and the contribution rate of employees. The City’s contribution rates may change if plan contracts are amended. Payments made by the employer to satisfy contribution requirements that are identified by the pension plan terms as plan member contributions requirements are classified as plan member contributions. During the year, the employer contributions recognized as a reduction to the net pension liability totaled $1,043,190.
Actuarial Valuation Date for Pension Liability: June 30, 2019Measurement Date: June 30, 2020Measurement Period: July 1, 2019 through June 30, 2020
Miscellaneous Risk PoolTier I Tier II - PEPRA
Prior to On or AfterHire date January 1, 2013* January 1, 2013Benefit formula 2% at 55 2% at 62Benefit vesting schedule 5 years of service 5 years of serviceBenefit payments monthly for life monthly for lifeRetirement age 50 - 63 52-67Monthly benefits, as a % of eligible compensation 1.426% to 2.418% 1.0% to 2.5%Required employee contribution rates 7% 6.50%Required employer contribution rates: Normal cost rate 11.746% 7.874% Payment of unfunded liability $414,042 $8,960
* Closed to new entrants
50
CITY OF MALIBU, CALIFORNIA NOTES TO THE FINANCIAL STATEMENTS (Continued) June 30, 2021
PENSION LIABILITIES, PENSION EXPENSES, & DEFERRED OUTFLOWS/INFLOWS OF PENSION-RELATED RESOURCES As of June 30, 2021, the City reported net pension liabilities totaling $6,816,695. The City’s net pension liability is measured as the proportionate share of the net pension liability measured as of June 30, 2020. The total pension liability used to calculate the net pension liability was determined by an actuarial valuation as of June 30, 2019, rolled forward to June 30, 2020 using standard update procedures. The City’s proportionate share of the net pension liability was based on a projection of the City’s long-term share of contributions to the pension plans relative to the projected contributions of all participating employers, actuarially determined. The City’s proportionate share of the net pension liability as of June 30, 2020 and 2019 was as follows:
For the year ended June 30, 2021, the City recognized pension expense of $1,729,199. At June 30, 2021, the City reported deferred outflows of resources and deferred inflows of resources related to pensions from the following sources:
The $1,120,551 deferred outflow of resources related to the contributions made subsequent to the measurement date will be recognized as a reduction of the net pension liability in the year ending June 30, 2022. Other amounts reported as deferred inflows and outflows of resources related to pensions will be recognized as a component of pension expense as follows:
MiscellaneousRisk Pool
Proportion - June 30, 2019 0.05960%Proportion - June 30, 2020 0.06265%Change - Increase (Decrease) 0.00305%
Deferred DeferredOutflows of Inflows ofResources Resources
Pension contributions subsequent to measurement date 1,120,551$ -$ Differences between actual and expected experience 351,284 - Change in assumptions - (48,619) Net differences between projected and actual earnings on plan investments 202,501 - Change in employer's proportion 439,696 - Differences between the employer's contributions and the employer's proportionate share of contributions - (115,753) Total 2,114,032$ (164,372)$
Fiscal Year Amount2021-22 246,427$ 2022-23 290,369 2023-24 195,188 2024-25 97,125 Totals 829,109$
51
CITY OF MALIBU, CALIFORNIA NOTES TO THE FINANCIAL STATEMENTS (Continued) June 30, 2021
ACTUARIAL METHODS AND ASSUMPTIONS The collective total pension liability for the June 30, 2020 measurement period was determined by an actuarial calculation as of June 30, 2019, with update procedures used to roll forward the total pension liability to June 30, 2020. The June 30, 2020 total pension liability was based on the following actuarial methods and assumptions:
All other actuarial assumptions used in the June 30, 2019 valuation were based on the results of an actuarial experience study for the period from 1997 to 2015, including updates to salary increase, mortality, and retirement rates. The Experience Study report can be obtained at the CalPERS website under Forms and Publications. DISCOUNT RATE The discount rate used to measure the total pension liability was 7.15% for each plan. The projection of cash flows used to determine the discount rate assumed that contributions from plan members will be made at statutorily required rates, actuarially determined. Based on those assumptions, the plans’ fiduciary net position was projected to be available to make all projected future benefit payments of current plan members. Therefore, the long-term expected rate of return on plan investments was applied to all periods of projected benefit payments to determine the total pension liability. LONG-TERM EXPECTED RATE OF RETURN The long-term expected rate of return on pension plan investments was determined using a building-block method in which expected future real rates of return (expected returns, net of pension plan investment expense and inflation) are developed for each major asset class. In determining the long-term expected rate of return, CalPERS took into account both short-term and long-term market return expectations as well as the expected pension fund cash flows. Using historical returns of all the funds’ asset classes, expected compound (geometric) returns were calculated over the short-term (first 10 years) and the long-term (11+ years) using a building-block approach. Using the expected nominal returns for both short-term and long-term, the present value of benefits was calculated for each fund. The expected rate of return was set by calculating the rounded single equivalent expected return that arrived at the same present value of benefits for cash flows as the one calculated using both short-term and long-term returns. The expected rate of return was then set equivalent to the single equivalent rate calculated above and adjusted to account for assumed administrative expenses.
Miscellaneous Risk PoolValuation date June 30, 2019Measurement date June 30, 2020Actuarial cost method Entry-Age Normal Cost MethodActuarial assumptions:
Discount rate 7.15%Inflation 2.50%Salary increases (1)Mortality rate table (2)Post retirement benefit increases (3)
Notes(1) Varies by entry age and service(2)
(3) The lesser of contract COLA or 2.5% until purchasing power protection allowance floor on purchasing power applies, 2.5% thereafter.
The mortality table used was developed based on CalPERS-specific data. The probabilities of mortality are based on the 2017 CalPERS Experience Study for the period from 1997 to 2015. Pre-retirement and post-retirement mortality rates include 15 years of projected mortality improvement using 90% of Scale MP-2016 published by the Society of Actuaries. For more details on this table, refer to the CalPERS Experience Study and Review of Actuarial Assumptions report from December 2017 that is available on the CalPERS website.
52
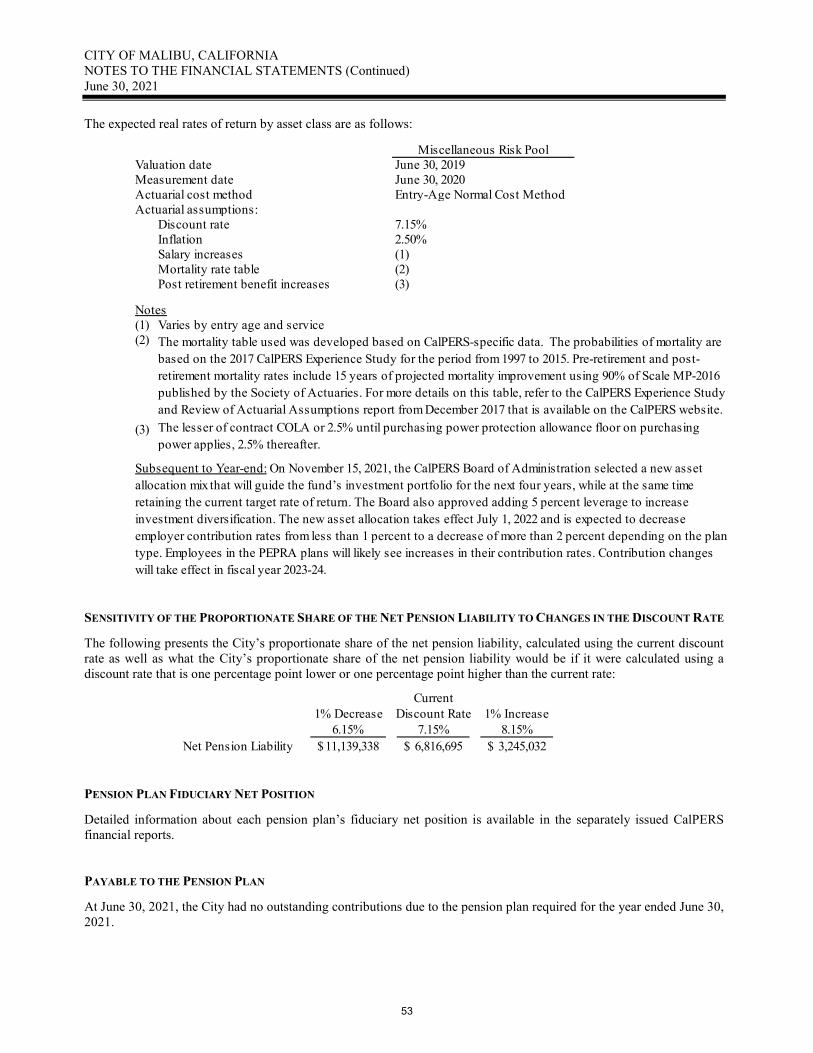
CITY OF MALIBU, CALIFORNIA NOTES TO THE FINANCIAL STATEMENTS (Continued) June 30, 2021
The expected real rates of return by asset class are as follows:
SENSITIVITY OF THE PROPORTIONATE SHARE OF THE NET PENSION LIABILITY TO CHANGES IN THE DISCOUNT RATE The following presents the City’s proportionate share of the net pension liability, calculated using the current discount rate as well as what the City’s proportionate share of the net pension liability would be if it were calculated using a discount rate that is one percentage point lower or one percentage point higher than the current rate:
PENSION PLAN FIDUCIARY NET POSITION Detailed information about each pension plan’s fiduciary net position is available in the separately issued CalPERS financial reports. PAYABLE TO THE PENSION PLAN At June 30, 2021, the City had no outstanding contributions due to the pension plan required for the year ended June 30, 2021.
Miscellaneous Risk PoolValuation date June 30, 2019Measurement date June 30, 2020Actuarial cost method Entry-Age Normal Cost MethodActuarial assumptions:
Discount rate 7.15%Inflation 2.50%Salary increases (1)Mortality rate table (2)Post retirement benefit increases (3)
Notes(1) Varies by entry age and service(2)
(3)
The mortality table used was developed based on CalPERS-specific data. The probabilities of mortality are based on the 2017 CalPERS Experience Study for the period from 1997 to 2015. Pre-retirement and post-retirement mortality rates include 15 years of projected mortality improvement using 90% of Scale MP-2016 published by the Society of Actuaries. For more details on this table, refer to the CalPERS Experience Study and Review of Actuarial Assumptions report from December 2017 that is available on the CalPERS website.The lesser of contract COLA or 2.5% until purchasing power protection allowance floor on purchasing power applies, 2.5% thereafter.
Subsequent to Year-end: On November 15, 2021, the CalPERS Board of Administration selected a new asset allocation mix that will guide the fund’s investment portfolio for the next four years, while at the same time retaining the current target rate of return. The Board also approved adding 5 percent leverage to increase investment diversification. The new asset allocation takes effect July 1, 2022 and is expected to decrease employer contribution rates from less than 1 percent to a decrease of more than 2 percent depending on the plan type. Employees in the PEPRA plans will likely see increases in their contribution rates. Contribution changes will take effect in fiscal year 2023-24.
Current1% Decrease Discount Rate 1% Increase
6.15% 7.15% 8.15%Net Pension Liability 11,139,338$ 6,816,695$ 3,245,032$
53
CITY OF MALIBU, CALIFORNIA NOTES TO THE FINANCIAL STATEMENTS (Continued) June 30, 2021
B. DEFINED CONTRIBUTION PLANS The City has established four defined contribution plans with each plan being for a specific group of employees. None of the plans meet the requirements of GASB Statement No. 84 for inclusion as a fiduciary activity in the City’s financial statements. Plan assets are held for the exclusive benefit of the plan participants and their beneficiaries and are not available to the creditors of the City. In a defined contribution pension plan, benefits depend solely on amounts contributed to the plan plus investment earnings. For each of the City’s plans:
• The plan was established by City Resolution and may be amended by the City Council. • Contributions by the City are funded by the General Fund. • All City and employee contributions are immediately deposited into an employee’s individual account. • Contributions and any interest earned immediately vest in full to the employee. • No separate financial statements are available. • Plan investments are reported at fair value and are based on quoted market prices.
1. City Manager Plan: In March 2004, the City entered into a defined contribution pension plan with ICMA
Retirement Corporation (ICMA) for benefits at retirement for the City Manager. This plan is a deferred compensation plan created in accordance with Internal Revenue Code Section 401(a). The plan requires the City to contribute six percent of the City Manager’s salary; the City Manager is not allowed to make contributions. Terminated employees are not allowed to participate in the plan; all vested assets of terminated employees are removed and are under the control of the terminated employee. During Fiscal Year 2020-21, the City contributed $12,875 on behalf of the City Manager, based on a salary of $214,583 for the covered period. There was one covered employee during the year.
2. Department Head Plan: In March 2004, the City entered into a defined contribution pension plan with ICMA for benefits at retirement for the City’s Department Heads. This plan is a deferred compensation plan created in accordance with Internal Revenue Code Section 401(a). The plan requires the City to contribute $3,000 annually (or a proportional amount based on the covered time period) on behalf of each member; members are not allowed to make contributions. Terminated employees are not allowed to participate in the plan; all vested assets of terminated employees are removed and are under the control of the terminated employee. During Fiscal Year 2020-21, the City contributed a total of $16,729 on behalf of the covered employees. There were seven covered employees during the year.
3. Full-Time Employee Plan: In July 2006, the City entered into a defined contribution pension plan with ICMA for all of its full-time employees. This plan is a deferred compensation plan created in accordance with Internal Revenue Code Section 457. All full-time employees are eligible to participate from the date of employment. In this defined contribution plan, the City is required to match an employee’s contributions up to $50 per pay period. By agreement with the bargaining units, the City’s $50 contribution per pay period was suspended from September 2020 through June 2021 and will resume again in Fiscal Year 2021-22. While the City Manager and Department Heads may contribute to this plan, the City does not match their contributions. During the year ended June 30, 2021, there were 76 employees participating in the plan. The City made employer contributions of $15,450, and employees contributed $320,842.
4. Part-Time Employee Plan: In January 2007, the City entered into a defined contribution pension plan with Public Agency Retirement System (PARS) for benefits at retirement for all of its part-time employees. This is an alternative retirement system for those not covered by a CalPERS retirement plan. The plan was established by City Resolution and may be amended by the City Council. All part-time employees are eligible to participate from the date of employment. Federal legislation requires contributions of at least 7.5% to a retirement plan. Plan members are required to contribute 6.2% of their salaries, and the City is required to contribute 1.3% of the members’ salaries. For the year ended June 30, 2021, the City’s covered payroll was $254,653 for the 56 employees participating in the plan. The City made employer contributions of $3,310, and employees contributed $15,789.
54
CITY OF MALIBU, CALIFORNIA NOTES TO THE FINANCIAL STATEMENTS (Continued) June 30, 2021
8. OTHER POST-EMPLOYMENT BENEFITS PLAN DESCRIPTION The City provides post-employment benefits to retired employees in the form of a contribution toward their medical premiums under the CalPERS health plan, which provides medical insurance benefits to eligible retirees in accordance with various labor agreements. Employees are eligible for retiree health benefits if they retire directly from the City under CalPERS (see Note 7A) and are enrolled in a CalPERS retiree health plan. The City participates in the California Employer’s Retiree Benefit Trust Program (CERBT). CERBT is administered by CalPERS and is an agent multiple-employer plan. The minimum required retiree contributions are established by CalPERS. Copies of the CalPERS’ annual financial report may be obtained from the CalPERS Executive Office, 400 P Street, Sacramento, CA 95814. For this report, the following timeframes are used related to the OPEB Plan:
ELIGIBILITY As of the measurement date of June 30, 2020, the following current and former employees were covered by the benefit terms under the plan:
CONTRIBUTIONS The benefit provisions and contribution requirements of plan members and the City are established and may be amended through agreements and memorandums of understanding between the City, its employees, and unions representing the City’s employees. Administrative costs of the OPEB plan are financed through investment earnings. The contribution required to be made under City Council and labor agreements is based on a pay-as-you-go basis (i.e., as medical insurance premiums become due). For the measurement period ending June 30, 2020, the City recognized contributions of $773,180 as a reduction to the net OPEB liability. The contributions consisted of $725,000 paid to the CERBT Trust, $540 of administrative costs, and $47,640 for the estimated implied subsidy. The City’s contributions are funded by the General Fund. NET OPEB ASSET The total OPEB liability used to calculate the net OPEB asset was determined by an actuarial valuation dated June 30, 2019, with standard update procedures applied to roll forward the valuation to the measurement date of June 30, 2020. Following is a summary of the principal assumptions and methods used to determine the total OPEB liability.
Actuarial Valuation Date for OPEB Liability: June 30, 2019Measurement Date: June 30, 2020Measurement Period: July 1, 2019 through June 30, 2020
Inactive employees currently receiving benefit payments 24 Inactive employees entitled to but not yet receiving benefit payments 10Active employees 86 Total 120
55
CITY OF MALIBU, CALIFORNIA NOTES TO THE FINANCIAL STATEMENTS (Continued) June 30, 2021
ACTUARIAL ASSUMPTIONS The total OPEB liability in the June 30 2019 actuarial valuation was determined using the following actuarial assumptions, applied to all periods included in the measurement, unless otherwise specified:
The long-term expected rate of return is an estimate and is presented as geometric means developed over a 20-year period. The long-term expected real rates of return for each major asset class included in the OPEB plan’s target asset allocation, as of the June 30, 2020 measurement date, are summarized below:
DISCOUNT RATE The discount rate used to measure the total OPEB liability was 6.75 percent. The projection of cash flows used to determine the discount rate expected City contributions to keep sufficient plan assets to pay all benefits from the trust. Based on those assumptions, the OPEB plan’s fiduciary net position was projected to be available to make all projected OPEB payments for current active and inactive employees and beneficiaries. Therefore, the long-term expected rate of return on the CERBT Trust investments was applied to all periods of the projected benefit payments to determine the total OPEB liability.
OPEB PlanValuation date June 30, 2019Measurement date June 30, 2020Actuarial cost method Entry age normal, level percentage of payrollActuarial assumptions:
Discount rate 6.75%Long-term Expected Rate of Return on InvestmentsInflation 2.75%Healthcare trend rates Non-Medicare: 7.25% for 2021, decreasing to an
ultimate rate of 4.0% in 2076 and later yearsMedicare: 6.3% for 2021, decreasing to an ultimate rate of 4.0% in 2076 and later years
Mortality, Retirement, Disability and Termination CalPERS 1997-2015 experience studyMortality improvement Mortality projected fully generational with Scale MP-2019Salary increases Aggregate: 3%
Merit: CalPERS 1997-2015 experience study
6.75%
Target Long-TermAllocation Expected
CERBT Real RateAsset Class Strategy 1 of ReturnGlobal equity 59.00% 4.82%Fixed income 25.00% 1.47%TIPS 5.00% 1.29%Commodities 3.00% 0.84%REITS 8.00% 3.76% Total 100.00%
56
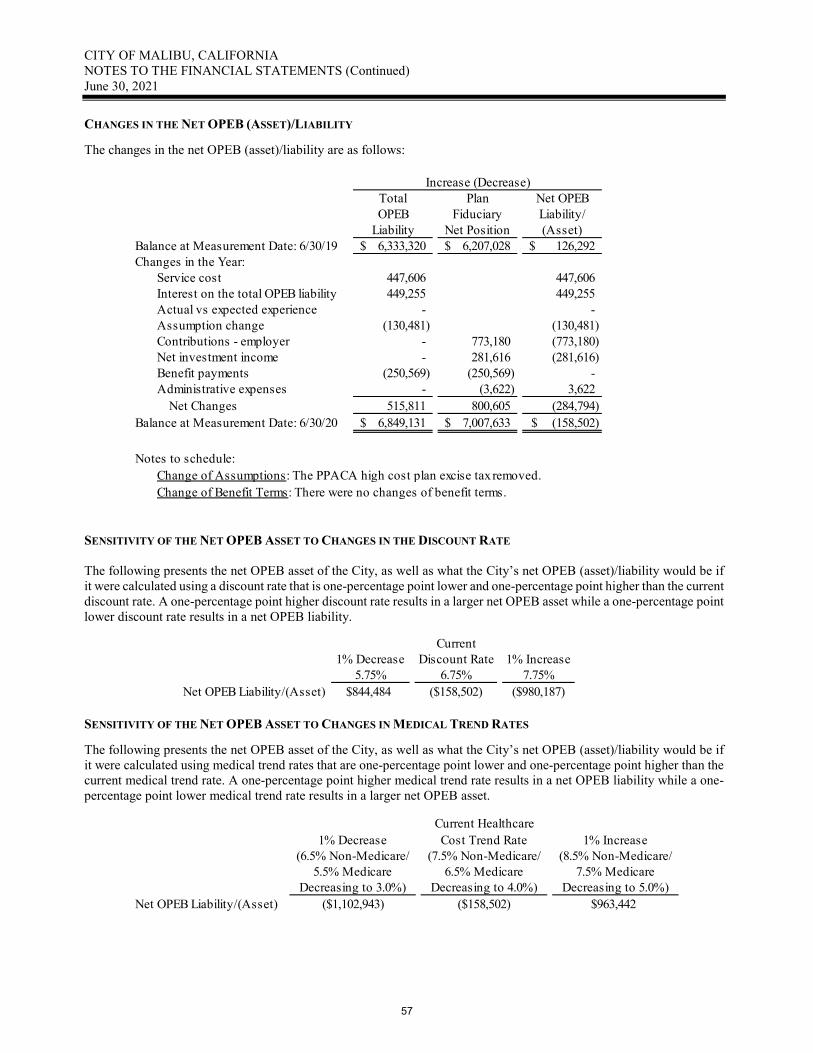
CITY OF MALIBU, CALIFORNIA NOTES TO THE FINANCIAL STATEMENTS (Continued) June 30, 2021
CHANGES IN THE NET OPEB (ASSET)/LIABILITY The changes in the net OPEB (asset)/liability are as follows:
SENSITIVITY OF THE NET OPEB ASSET TO CHANGES IN THE DISCOUNT RATE The following presents the net OPEB asset of the City, as well as what the City’s net OPEB (asset)/liability would be if it were calculated using a discount rate that is one-percentage point lower and one-percentage point higher than the current discount rate. A one-percentage point higher discount rate results in a larger net OPEB asset while a one-percentage point lower discount rate results in a net OPEB liability.
SENSITIVITY OF THE NET OPEB ASSET TO CHANGES IN MEDICAL TREND RATES The following presents the net OPEB asset of the City, as well as what the City’s net OPEB (asset)/liability would be if it were calculated using medical trend rates that are one-percentage point lower and one-percentage point higher than the current medical trend rate. A one-percentage point higher medical trend rate results in a net OPEB liability while a one-percentage point lower medical trend rate results in a larger net OPEB asset.
Total Plan Net OPEBOPEB Fiduciary Liability/
Liability Net Position (Asset)Balance at Measurement Date: 6/30/19 6,333,320$ 6,207,028$ 126,292$ Changes in the Year:
Service cost 447,606 447,606 Interest on the total OPEB liability 449,255 449,255 Actual vs expected experience - - Assumption change (130,481) (130,481) Contributions - employer - 773,180 (773,180) Net investment income - 281,616 (281,616) Benefit payments (250,569) (250,569) - Administrative expenses - (3,622) 3,622 Net Changes 515,811 800,605 (284,794)
Balance at Measurement Date: 6/30/20 6,849,131$ 7,007,633$ (158,502)$
Notes to schedule:
Change of Benefit Terms: There were no changes of benefit terms.
Increase (Decrease)
Change of Assumptions: The PPACA high cost plan excise tax removed.
Current1% Decrease Discount Rate 1% Increase
5.75% 6.75% 7.75%Net OPEB Liability/(Asset) $844,484 ($158,502) ($980,187)
Current Healthcare1% Decrease Cost Trend Rate 1% Increase
(6.5% Non-Medicare/ (7.5% Non-Medicare/ (8.5% Non-Medicare/5.5% Medicare 6.5% Medicare 7.5% Medicare
Decreasing to 3.0%) Decreasing to 4.0%) Decreasing to 5.0%)Net OPEB Liability/(Asset) ($1,102,943) ($158,502) $963,442
57
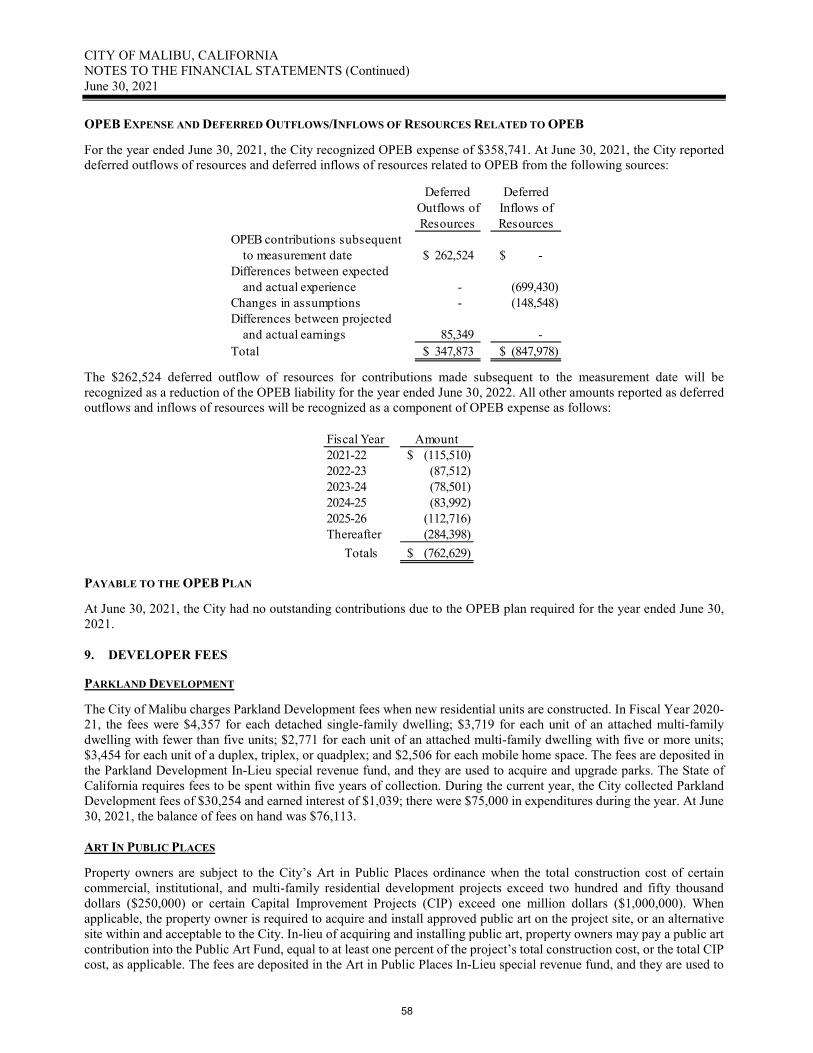
CITY OF MALIBU, CALIFORNIA NOTES TO THE FINANCIAL STATEMENTS (Continued) June 30, 2021
OPEB EXPENSE AND DEFERRED OUTFLOWS/INFLOWS OF RESOURCES RELATED TO OPEB For the year ended June 30, 2021, the City recognized OPEB expense of $358,741. At June 30, 2021, the City reported deferred outflows of resources and deferred inflows of resources related to OPEB from the following sources:
The $262,524 deferred outflow of resources for contributions made subsequent to the measurement date will be recognized as a reduction of the OPEB liability for the year ended June 30, 2022. All other amounts reported as deferred outflows and inflows of resources will be recognized as a component of OPEB expense as follows:
PAYABLE TO THE OPEB PLAN At June 30, 2021, the City had no outstanding contributions due to the OPEB plan required for the year ended June 30, 2021. 9. DEVELOPER FEES PARKLAND DEVELOPMENT The City of Malibu charges Parkland Development fees when new residential units are constructed. In Fiscal Year 2020-21, the fees were $4,357 for each detached single-family dwelling; $3,719 for each unit of an attached multi-family dwelling with fewer than five units; $2,771 for each unit of an attached multi-family dwelling with five or more units; $3,454 for each unit of a duplex, triplex, or quadplex; and $2,506 for each mobile home space. The fees are deposited in the Parkland Development In-Lieu special revenue fund, and they are used to acquire and upgrade parks. The State of California requires fees to be spent within five years of collection. During the current year, the City collected Parkland Development fees of $30,254 and earned interest of $1,039; there were $75,000 in expenditures during the year. At June 30, 2021, the balance of fees on hand was $76,113. ART IN PUBLIC PLACES Property owners are subject to the City’s Art in Public Places ordinance when the total construction cost of certain commercial, institutional, and multi-family residential development projects exceed two hundred and fifty thousand dollars ($250,000) or certain Capital Improvement Projects (CIP) exceed one million dollars ($1,000,000). When applicable, the property owner is required to acquire and install approved public art on the project site, or an alternative site within and acceptable to the City. In-lieu of acquiring and installing public art, property owners may pay a public art contribution into the Public Art Fund, equal to at least one percent of the project’s total construction cost, or the total CIP cost, as applicable. The fees are deposited in the Art in Public Places In-Lieu special revenue fund, and they are used to
Deferred DeferredOutflows of Inflows ofResources Resources
OPEB contributions subsequent to measurement date 262,524$ -$ Differences between expected and actual experience - (699,430) Changes in assumptions - (148,548) Differences between projected and actual earnings 85,349 - Total 347,873$ (847,978)$
Fiscal Year Amount2021-22 (115,510)$ 2022-23 (87,512) 2023-24 (78,501) 2024-25 (83,992) 2025-26 (112,716) Thereafter (284,398) Totals (762,629)$
58
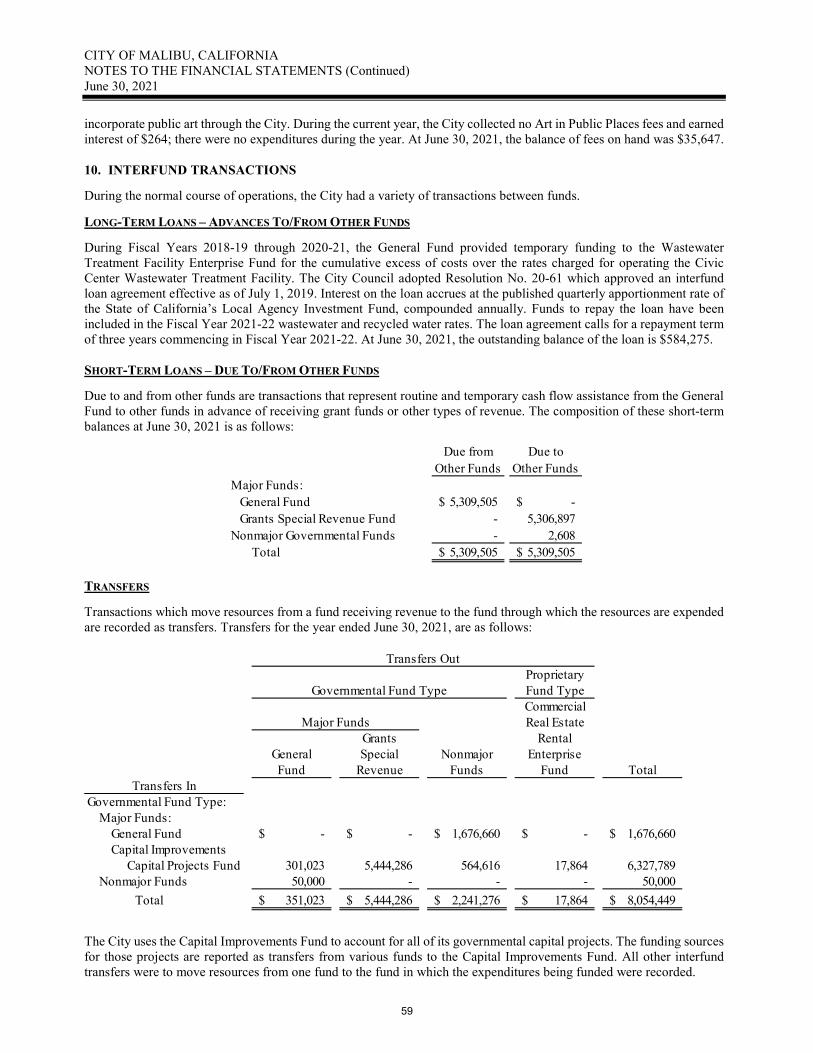
CITY OF MALIBU, CALIFORNIA NOTES TO THE FINANCIAL STATEMENTS (Continued) June 30, 2021
incorporate public art through the City. During the current year, the City collected no Art in Public Places fees and earned interest of $264; there were no expenditures during the year. At June 30, 2021, the balance of fees on hand was $35,647. 10. INTERFUND TRANSACTIONS During the normal course of operations, the City had a variety of transactions between funds. LONG-TERM LOANS – ADVANCES TO/FROM OTHER FUNDS During Fiscal Years 2018-19 through 2020-21, the General Fund provided temporary funding to the Wastewater Treatment Facility Enterprise Fund for the cumulative excess of costs over the rates charged for operating the Civic Center Wastewater Treatment Facility. The City Council adopted Resolution No. 20-61 which approved an interfund loan agreement effective as of July 1, 2019. Interest on the loan accrues at the published quarterly apportionment rate of the State of California’s Local Agency Investment Fund, compounded annually. Funds to repay the loan have been included in the Fiscal Year 2021-22 wastewater and recycled water rates. The loan agreement calls for a repayment term of three years commencing in Fiscal Year 2021-22. At June 30, 2021, the outstanding balance of the loan is $584,275. SHORT-TERM LOANS – DUE TO/FROM OTHER FUNDS Due to and from other funds are transactions that represent routine and temporary cash flow assistance from the General Fund to other funds in advance of receiving grant funds or other types of revenue. The composition of these short-term balances at June 30, 2021 is as follows:
TRANSFERS Transactions which move resources from a fund receiving revenue to the fund through which the resources are expended are recorded as transfers. Transfers for the year ended June 30, 2021, are as follows:
The City uses the Capital Improvements Fund to account for all of its governmental capital projects. The funding sources for those projects are reported as transfers from various funds to the Capital Improvements Fund. All other interfund transfers were to move resources from one fund to the fund in which the expenditures being funded were recorded.
Due from Due toOther Funds Other Funds
Major Funds: General Fund 5,309,505$ -$ Grants Special Revenue Fund - 5,306,897 Nonmajor Governmental Funds - 2,608 Total 5,309,505$ 5,309,505$
Transfers OutProprietaryFund TypeCommercialReal Estate
Grants RentalGeneral Special Nonmajor EnterpriseFund Revenue Funds Fund Total
Governmental Fund Type:Major Funds:
General Fund -$ -$ 1,676,660$ -$ 1,676,660$ Capital Improvements Capital Projects Fund 301,023 5,444,286 564,616 17,864 6,327,789
Nonmajor Funds 50,000 - - - 50,000 Total 351,023$ 5,444,286$ 2,241,276$ 17,864$ 8,054,449$
Major Funds
Governmental Fund Type
Transfers In
59
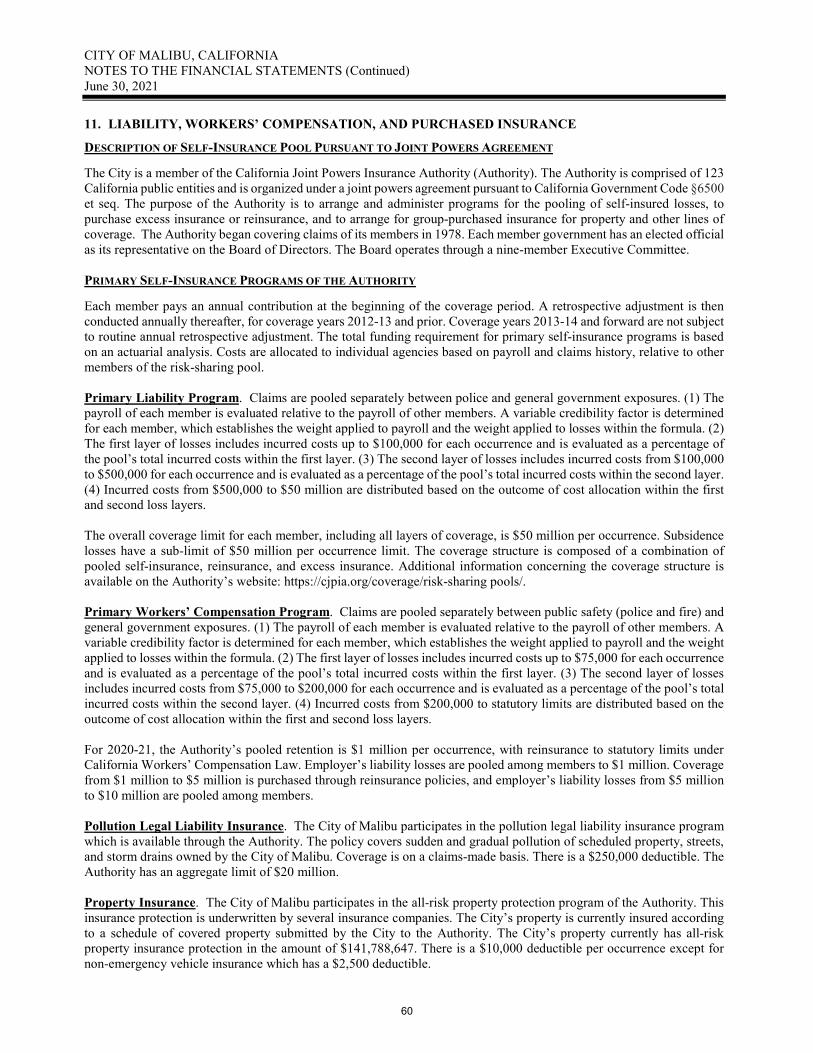
CITY OF MALIBU, CALIFORNIA NOTES TO THE FINANCIAL STATEMENTS (Continued) June 30, 2021
11. LIABILITY, WORKERS’ COMPENSATION, AND PURCHASED INSURANCE DESCRIPTION OF SELF-INSURANCE POOL PURSUANT TO JOINT POWERS AGREEMENT
The City is a member of the California Joint Powers Insurance Authority (Authority). The Authority is comprised of 123 California public entities and is organized under a joint powers agreement pursuant to California Government Code §6500 et seq. The purpose of the Authority is to arrange and administer programs for the pooling of self-insured losses, to purchase excess insurance or reinsurance, and to arrange for group-purchased insurance for property and other lines of coverage. The Authority began covering claims of its members in 1978. Each member government has an elected official as its representative on the Board of Directors. The Board operates through a nine-member Executive Committee. PRIMARY SELF-INSURANCE PROGRAMS OF THE AUTHORITY
Each member pays an annual contribution at the beginning of the coverage period. A retrospective adjustment is then conducted annually thereafter, for coverage years 2012-13 and prior. Coverage years 2013-14 and forward are not subject to routine annual retrospective adjustment. The total funding requirement for primary self-insurance programs is based on an actuarial analysis. Costs are allocated to individual agencies based on payroll and claims history, relative to other members of the risk-sharing pool. Primary Liability Program. Claims are pooled separately between police and general government exposures. (1) The payroll of each member is evaluated relative to the payroll of other members. A variable credibility factor is determined for each member, which establishes the weight applied to payroll and the weight applied to losses within the formula. (2) The first layer of losses includes incurred costs up to $100,000 for each occurrence and is evaluated as a percentage of the pool’s total incurred costs within the first layer. (3) The second layer of losses includes incurred costs from $100,000 to $500,000 for each occurrence and is evaluated as a percentage of the pool’s total incurred costs within the second layer. (4) Incurred costs from $500,000 to $50 million are distributed based on the outcome of cost allocation within the first and second loss layers. The overall coverage limit for each member, including all layers of coverage, is $50 million per occurrence. Subsidence losses have a sub-limit of $50 million per occurrence limit. The coverage structure is composed of a combination of pooled self-insurance, reinsurance, and excess insurance. Additional information concerning the coverage structure is available on the Authority’s website: https://cjpia.org/coverage/risk-sharing pools/. Primary Workers’ Compensation Program. Claims are pooled separately between public safety (police and fire) and general government exposures. (1) The payroll of each member is evaluated relative to the payroll of other members. A variable credibility factor is determined for each member, which establishes the weight applied to payroll and the weight applied to losses within the formula. (2) The first layer of losses includes incurred costs up to $75,000 for each occurrence and is evaluated as a percentage of the pool’s total incurred costs within the first layer. (3) The second layer of losses includes incurred costs from $75,000 to $200,000 for each occurrence and is evaluated as a percentage of the pool’s total incurred costs within the second layer. (4) Incurred costs from $200,000 to statutory limits are distributed based on the outcome of cost allocation within the first and second loss layers. For 2020-21, the Authority’s pooled retention is $1 million per occurrence, with reinsurance to statutory limits under California Workers’ Compensation Law. Employer’s liability losses are pooled among members to $1 million. Coverage from $1 million to $5 million is purchased through reinsurance policies, and employer’s liability losses from $5 million to $10 million are pooled among members. Pollution Legal Liability Insurance. The City of Malibu participates in the pollution legal liability insurance program which is available through the Authority. The policy covers sudden and gradual pollution of scheduled property, streets, and storm drains owned by the City of Malibu. Coverage is on a claims-made basis. There is a $250,000 deductible. The Authority has an aggregate limit of $20 million. Property Insurance. The City of Malibu participates in the all-risk property protection program of the Authority. This insurance protection is underwritten by several insurance companies. The City’s property is currently insured according to a schedule of covered property submitted by the City to the Authority. The City’s property currently has all-risk property insurance protection in the amount of $141,788,647. There is a $10,000 deductible per occurrence except for non-emergency vehicle insurance which has a $2,500 deductible.
60
CITY OF MALIBU, CALIFORNIA NOTES TO THE FINANCIAL STATEMENTS (Continued) June 30, 2021
Earthquake and Flood Insurance. The City of Malibu purchases earthquake and flood insurance on a portion of its property. The earthquake insurance is part of the property protection insurance program of the Authority. The City’s property currently has earthquake protection in the amount of $87,425,443. There is a deductible of 5% per unit of value with a minimum deductible of $100,000. Crime Insurance. The City purchases crime insurance coverage in the amount of $1 million with a $2,500 deductible. The fidelity coverage is provided through the Authority. Special Event Tenant User Liability Insurance. The City further protects against liability damages by requiring tenant users of certain property to purchase low-cost tenant user liability insurance for certain activities on City property. The insurance premium is paid by the tenant user and is paid to the City according to a schedule. The City then pays for the insurance. The insurance is facilitated by the Authority. ADEQUACY OF PROTECTION
During the past three Fiscal Years, none of the above programs of protection experienced settlements or judgments that exceeded pooled or insured coverage. There were no significant reductions in pooled or insured liability coverage in Fiscal Year 2020-21.
12. COMMITMENTS AND CONTINGENCIES
A. The City is involved in various legal proceedings. At this time, the City is unable to determine the effect that these cases may have on the financial condition of the City.
B. The City has received State and Federal funds for specific purposes that are subject to review by the grantor agencies. Although such audits could generate expenditure disallowances under the terms of the grants, the City is unable to determine the effect this may have on the financial condition of the City at this time.
On March 8, 2021, the City Council adopted Resolution No. 21-08 approving the allocation of $18,602,848 in Community Development Block Grant Disaster Recovery (CDBG-DR) funding for Multifamily Housing. The City’s administrative costs to run the program are eligible CDBG-DR expenses; however, if the City does not deliver an affordable housing unit, the administrative costs would not be eligible for reimbursement.
C. The City is prone to natural disasters. The City is aware of the potential for disaster and attempts to maintain an
adequate fund balance in the General Fund to cover the cost of these disasters. Based on the history, there remains a potential for a call on future revenues and existing fund balances.
D. On November 9, 2018, the Woolsey Fire burned the western portion of the City of Malibu. Approximately 480
private structures were damaged or destroyed. The City remains committed to helping the residents rebuild and recover and has retained additional consultant services to aid that effort. The City anticipates that this higher level of service will continue to be necessary for the next several years. The City adopted Resolution No. 19-30 on June 24, 2019, which waived permit fees for all like-for-like and like-for-like plus 10% of Woolsey Fire rebuilds for Fiscal Year 2019-20. Council established that fee waivers will only apply to properties that were primary residences at the time of the Woolsey Fire. On June 22, 2020, Council adopted Resolution No. 20-32 extending the refund deadline for the Woolsey Fire fee waivers. On March 22, 2021, Council adopted Resolution No. 21-10 further extending the fee waiver deadlines. At fiscal year-end, some eligible permittees had yet to request a refund of fees paid; a liability has been recorded for the estimated fees eligible to be refunded as of June 30, 2021.
E. On January 30, 2020, the World Health Organization (WHO) announced a global health emergency because of an outbreak of a new strain of coronavirus (the COVID-19 outbreak) and the risks that it posed to the international community as the virus spread globally beyond its point of origin. In March 2020, the WHO classified the COVID-19 outbreak as a pandemic based on the rapid increase in exposure globally.
On March 19, 2020, Governor Newsom issued Executive Order N-33-20 ordering all residents of California to stay home except as needed to maintain the operations of critical infrastructure sectors. The County of Los Angeles issued a Health Officer Order and a series of revisions that mirrored and expanded the Governor’s Executive Order. Since
61
CITY OF MALIBU, CALIFORNIA NOTES TO THE FINANCIAL STATEMENTS (Continued) June 30, 2021
that time, City staff has been carefully monitoring the impacts on the economy and the City’s revenue considering the changing regulations put in place to deal with the COVID-19 pandemic. Original estimates anticipated that the pandemic would dampen the City’s revenues for the next several years. By the end of Fiscal Year 2020-21, most revenue sources had recovered. City staff remains conservative in projections for revenues in Fiscal Year 2021-22.
In March 2021, President Biden signed the American Rescue Plan Act (ARPA) to provide funding to cities, towns, and villages to respond and recover from the COVID-19 pandemic. The City was awarded $2.8 million in ARPA funds. The City plans to use the funds to hire 7.5 full-time equivalent staff positions, returning the City to its pre-pandemic staffing levels. The City could use ARPA funds for this purpose for the next three fiscal years, which would total approximately $2.27 million. The City also plans to use the funds for the acquisition and implementation of budget and land management software to streamline City processes and provide for the robust continuation of City services through future disasters.
13. CAPITAL PROJECTS IN PROGRESS ANNUAL STREET OVERLAY The project includes asphalt ready hot mix overlay and slurry seal at various locations that have been identified for this year’s annual street maintenance. The following areas were included for maintenance: Malibu Crest Drive, Harbor Vista Drive, Malibu Knolls Road, DeVille Way, John Tyler Drive, Malibu Country Drive, Plover Way, Blue Dane Lane, Vantage Point Terrace, Forest Gate Circle, Skyline View Drive, Laurel Ridge Drive, Colony View Circle, Coast View Drive, Carbon Mesa Road, and Bayberry Lane. Additionally, speed humps were installed on Dume Drive and Fernhill from Grayfox to Cliffside. The work was completed in July and August of Fiscal Year 2020-21. The streets for the Fiscal Year 2021-22 Annual Street Overlay were selected in the spring of 2021. CIVIC CENTER WASTEWATER TREATMENT FACILITY PHASE TWO The Civic Center Wastewater Treatment Facility Phase One was completed in Fiscal Year 2018-19. The project consisted of constructing a new wastewater and recycled water treatment facility. The new wastewater treatment facility has the capacity to treat up to 190,000 gallons of wastewater per day and also has flexibility to expand the treatment capacity for Phases Two and Three. The recycled water system was constructed to supply recycled water to customers within the Civic Center area. Design of Phase Two of the project is underway, and an assessment district engineer has been retained. The work includes preparing a coastal development permit, construction plans, project specifications, and cost estimates for the design to expand the existing Civic Center Wastewater Treatment Facility. The work also includes the design of a new wastewater collection system for Phase Two property owners, an additional injection well, and the expansion of the recycled water system. It is anticipated that the project will begin construction in 2022. PACIFIC COAST HIGHWAY (PCH) MEDIAN IMPROVEMENT PROJECT This project will promote traffic safety along PCH by channelizing the highway, regulating turn movements, widening shoulders, and improving traffic operations. The project includes the rehabilitation of the existing raised medians and asphalt and concrete shoulder joints along PCH from the intersection of Webb Way to the intersection of Puerco Canyon Road. The PCH Median Improvement Project is funded by Los Angeles County Measure R administered by the Los Angeles County Metropolitan Transportation Authority. In Fiscal Year 2017-18, the City began the project study report/project development support (PSR/PDS) and began the preliminary approval and environmental design phase in Fiscal Year 2018-19. This project is currently in the design phase and is scheduled to begin construction in Fiscal Year 2021-22. CIVIC CENTER WAY ROADWAY IMPROVEMENTS PROJECT This project improves safety and operations along Civic Center Way from the intersection of Webb Way to the intersection of Malibu Canyon Road. The project includes widening both sides of the roadway, improving vertical and horizontal sight distances, installing sidewalks, improving the cross slopes of the roadway, modification of traffic signals, and creating opportunities for stormwater treatments and landscape beautification elements. The Civic Center Way Roadway Improvements Project is funded by Los Angeles County Metropolitan Transportation Authority Measure R. Construction was completed in Fiscal Year 2020-21.
62
CITY OF MALIBU, CALIFORNIA NOTES TO THE FINANCIAL STATEMENTS (Continued) June 30, 2021
PACIFIC COAST HIGHWAY (PCH) SIGNAL SYNCHRONIZATION SYSTEM This project was identified by the PCH Safety Study to improve safety along the Malibu highway corridor. The project will install communication between the existing traffic signals on PCH from Topanga Canyon Road to John Tyler Drive and connect the signals back to Caltrans’ Traffic Management Center. The project will interconnect the signals and allow Caltrans to control and operate the signals and the signal system remotely. The City awarded a contract for design in Fiscal Year 2016-17. The project is currently in the design phase and construction is anticipated to begin in Fiscal Year 2021-22. CIVIC CENTER STORMWATER DIVERSION STRUCTURE This project consists of stormdrain improvements in the Civic Center area. The improvements will promote the flow and circulation of stormwater into Legacy Park. The design will address the backwater flooding within the Civic Center Way Culvert (Storm Drain Bl 9302) occurring from the Malibu Cove area. This project has been designed, and the City anticipates that construction will be completed in Fiscal Year 2021-22. MARIE CANYON GREEN STREETS This project includes the installation of various filtration devices to remove or kill bacteria in stormwater. The project is intended to reduce the City’s Total Maximum Daily Loads (TMDLs) from stormwater to comply with the City’s Municipal Separate Storm Sewer System Discharge Permit with the Regional Water Quality Control Board. The project is in design and is anticipated to be completed in Fiscal Year 2021-22. STORMDRAIN TRASH SCREENS This project includes the installation of trash screens at the City’s stormdrain inlets to prevent debris from entering the stormdrain system and to comply with the City’s Total Maximum Daily Loads (TMDLs) requirements. Final design, permitting, public bidding, and construction were completed in Fiscal Year 2020-21. CITY HALL ROOF This project removed and replaced the existing roofing system. The improvements included the removal and replacement of plywood sheathing, glass, window frames, gaskets, and seals and the installation of a new fully adhered PVC membrane roofing system including a fire-retardant roof covering, insulation, and other accessories. The project was completed in Fiscal Year 2020-21. WESTWARD BEACH ROAD IMPROVEMENTS This project includes modifications to Westward Beach Road starting at Birdview Avenue and running approximately 1,100 feet west. The project includes a 12’ wide combination sidewalk and bicycle path, and a bicycle connection from PCH to Westward Beach. A new concrete sand barrier will be placed between the beach and the proposed parking area to prevent sand from depositing on the new sidewalk and parking area. Design of this project was completed in Fiscal Year 2020-21, and construction is anticipated to begin in Fiscal Year 2021-22. ELECTRIC VEHICLE CHARGING STATIONS This project will upgrade the existing electric vehicle charging stations on Civic Center Way and install additional stations on Civic Center Way and at Bluffs Park. The stations on Civic Center Way were upgraded in Fiscal Year 2020-21. The project to install additional stations remains on hold to accommodate other budget priorities resulting from the Woolsey Fire and the COVID-19 pandemic. TEMPORARY SKATE PARK During Fiscal Year 2019-20, City Council approved the use of the Crummer/Case property adjacent to Malibu Bluffs Park as the location for a temporary skate park. The project consists of constructing a new asphalt surface, fencing, parking and above-ground skate park elements. The project was completed in July 2020.
63
CITY OF MALIBU, CALIFORNIA NOTES TO THE FINANCIAL STATEMENTS (Continued) June 30, 2021
PERMANENT SKATE PARK This project consists of designing and constructing a permanent 12,500 square-foot, in-ground concrete skate park on the Crummer/Case property adjacent to Malibu Bluffs Park. The project includes parking and additional site amenities such as trash cans, benches, tables, and restrooms. Design began in Fiscal Year 2020-21. BLUFFS PARK WORKOUT STATION This project consists of the installation of a small workout station in the current zip line area at Malibu Bluffs Park. The project includes a new poured in place safety surfacing and signage demonstrating the proper use of the equipment. The project is funded through the City’s Proposition A Park Funds. The project was completed in Fiscal Year 2020-21. BLUFFS PARK SHADE STRUCTURE This project consists of the installation of four single-post shade structures at Malibu Bluffs Park. Two of the shade structures will be located at the Michael Landon Center Playground, and the other two will be located at the baseball field picnic area. The project will be funded through the City’s Proposition A Park Funds. The project will be constructed in Fiscal Year 2021-22. VEHICLE PROTECTION DEVICES Malibu Municipal Code Section 17.48.070 requires vehicle impact protection devices to be installed for all parking spaces located adjacent to any outdoor pedestrian seating area. There are two locations withing the City’s right-of-way that would require a vehicle impact protection device. The first location is on Cross Creek Road directly in front of the Taverna Tony restaurant entrance. The second location is at the Malibu Coast Animal Hospital. This project will be constructed in Fiscal Year 2021-22. PROJECTS COMPLETED IN FISCAL YEAR 2020-21 The City has several single and multi-year projects which were completed during Fiscal Year 2020-21, including Civic Center Way Improvements and Stormdrain Trash Screen Improvements.
14. DISASTER RECOVERY CAPITAL PROJECTS IN PROGRESS
Multiple rehabilitation and repair projects became necessary as a result of the Woolsey Fire and the subsequent severe storms that followed it in 2019. These projects are funded by a variety of sources including the Federal Emergency Management Agency (FEMA), California Office of Emergency Services (CalOES), and the settlements received from Southern California Edison and CJPIA. CITYWIDE GUARDRAIL REPLACEMENT This project consists of replacing all damaged guardrails throughout the City caused by the Woolsey Fire on Encinal Canyon Road, Birdview Avenue, Wildlife Road, Corral Canyon Road, and Kanan Dume Road. The design, permitting, bidding and construction of this project was coordinated with the County since it has similar projects in the area. Construction was completed in Fiscal Year 2020-21 with final project close-out in Fiscal Year 2021-22.
CLOVER HEIGHTS STORM DRAIN IMPROVEMENTS This project consists of the design and construction to improve permanent drainage from Harvester Road to Clover Heights Avenue. The City will manage the design, permitting, bidding, and construction phase of the project. Design will begin in Fiscal Year 2021-22.
LATIGO CANYON ROADWAY/RETAINING WALL IMPROVEMENTS This project consists of repairing the roadway and existing timber retaining walls on Latigo Canyon Road that were damaged from the Woolsey Fire. The City will manage the design, permitting, bidding, and construction phase of the project. Preliminary design commenced in Fiscal Year 2020-21.
64
CITY OF MALIBU, CALIFORNIA NOTES TO THE FINANCIAL STATEMENTS (Continued) June 30, 2021
TRANCAS CANYON PARK IMPROVEMENTS This project consists of repairing the damaged planting and irrigation system that was destroyed by the Woolsey Fire. The project also includes the repair of the septic system equipment in Trancas Canyon Park. The City will manage the design, permitting, bidding, and construction phase of the project. Design commenced in Fiscal Year 2020-21.
TRANCAS CANYON PARK SLOPE IMPROVEMENTS The project consists of repairing the existing slope east of Trancas Canyon Park. The Woolsey Fire damaged the slope causing stability issues from soil and rock erosion and damaged concrete benching. The City will manage the design, permitting, bidding, and construction phase of the project. Design commenced in Fiscal Year 2020-21.
BIRDVIEW AVENUE IMPROVEMENTS This project consists of repairing the roadway embankments on Birdview Avenue which were eroded from the severe storm event. The City will manage the design, permitting, bidding, and construction phase of the project. Design will begin in Fiscal Year 2021-22. BROAD BEACH ROAD WATER QUALITY IMPROVEMENTS The City owns several hundred feet (+800') of permeable pavers, landscaping and underground biofiltration devices located on Broad Beach Road. During the 2019 storm events, these items were damaged by silts, mud, and debris. These devices were installed in Fiscal Year 2015-16 as part of a Clean Water Grant from the State. This project consists of repairing the permeable pavers, replacement of media material in the biofilters and replacing damaged landscaping. The City will begin construction in Fiscal Year 2021-22. ENCINAL CANYON ROAD DRAINAGE IMPROVEMENTS This project is located on Encinal Canyon Road where minor erosion areas were discovered after the severe storm events. This project will consist of repairing the minor erosion areas and improving the drainage. Design will commence in Fiscal Year 2021-22.
CHARMLEE PARK PERMANENT WORK Charmlee Park sustained substantial damage during the Woolsey Fire, so staff has coordinated with FEMA to address the repairs. There was damage to the buildings and picnic areas and trails will need to be repaired. Trail work was completed in the summer of 2020. Restoration of picnic areas will occur in Fiscal Year 2021-22. OUTDOOR WARNING SIRENS A consultant was hired to develop a plan that includes the location of individual sirens, power and infrastructure requirements, and siren sound range. The City received a Hazard Mitigation Grant from FEMA for design, construction documents and environmental review. Design will begin in Fiscal Year 2021-22.
MALIBU PARK STORM DRAIN IMPROVEMENTS Multiple storm drains throughout the Malibu Park area and on Birdview Avenue have sustained substantial damages. These damages are due to the rain and associated mud and debris caused by the lack of vegetation in the aftermath of the Woolsey Fire. These damages occurred during the 2019 rainy season that brought heavy debris and localized flooding from the surrounding burned areas. The drainage structures, slopes and roadways will be repaired within the identified project locations. Construction will be completed in Fiscal Year 2021-22. MALIBU ROAD SLOPE REPAIRS The existing slope adjacent to the beach access stairs at 24712 Malibu Road has eroded and caused damage to Malibu Road. This project will repair the existing slope and repair the pavement on Malibu Road. This project is anticipated to be completed in Fiscal year 2022-23.
65
CITY OF MALIBU, CALIFORNIA NOTES TO THE FINANCIAL STATEMENTS (Continued) June 30, 2021
15. RESTATEMENT
The City implemented GASB Statement No. 84, Fiduciary Activities during Fiscal Year 2020-21. This change in accounting principle resulted in a prior period adjustment to restate net position in the Fiduciary Funds as follows:
16. SUBSEQUENT EVENTS
SHORT-TERM RENTALS HOME SHARING ORDINANCE
On November 23, 2020, Council adopted Ordinance No. 472 to regulate the short-term rental of residential property citywide commonly referred to as the “Hosted Short-Term Rental Ordinance.” Among other requirements, the ordinance requires that the host be onsite during the rental of single-family residences and condominium units and limits the number of multifamily units that can be rented on a short-term basis to 40% up to 2 units maximum per parcel. In order for the Hosted Short-Term Rental Ordinance to go into effect, the corresponding Local Coastal Program Amendment (LCPA) must be certified by the California Coastal Commission (CCC). Once it is certified, the Hosted Short-Term Rental Ordinance will supersede the Enforcement Ordinance. On September 8, 2021, the CCC granted themselves a one-year extension to address the ordinance. The City received $5.4 million in revenue from Transient Occupancy Tax from short-term rentals in Fiscal Year 2020-21. The impact to this General Fund revenue source from the Hosted Ordinance is expected to be significant but cannot be determined with certainty at this time. WOOLSEY FIRE FEE WAIVER PROGRAM
On November 8, 2021, Council adopted Resolution No. 21-62 extending Woolsey Fire fee waiver deadlines through December 30, 2023. The City has waived approximately $5.04 million in fees associated with Woolsey Fire rebuilding of primary residences by June 30, 2021. At this time, the City is unable to predict how many more homeowners will request fee waivers.
Fiduciary FundsPension Custodial
Trust Funds FundsNet position as originally presented at 6/30/20 225,079$ -$ Implementation of GASB 84 for Fiduciary Funds: Record Custodial Funds (Note 1) (56,453,983) Eliminate Pension Trust Funds (Note 2) (225,079) Net position as restated at 7/1/20 -$ (56,453,983)$
Note 1: These funds were previously reported as Agency Fiduciary Funds with assets equal to liabilities. GASB 84 eliminates Agency Funds and instead records funds which meet certain criteria as Custodial Funds using the accrual basis.
Note 2: The previously reported Pension Trust Funds no longer meet the definition of a Pension Trust Fund.
66
SUPPLEMENTARY INFORMATION Required Supplementary Information (RSI) is information that, although not part of the basic financial statements, is required by Governmental Accounting Standards Board and is considered to be an essential part of financial reporting. This information consists of additional data associated with the City’s defined benefit pension plan and OPEB plan, the related net pension and OPEB liabilities, and budget to actual schedules for the General and major special revenue funds. Supplementary Information provides information on each individual fund that is not already provided in the basic financial statements. This section includes information on non-major governmental funds, budget to actual schedules for the Commercial Real Estate Rental and Wastewater Treatment enterprise funds, and combining schedules for fiduciary funds. Following are descriptions of the non-major special revenue funds that are included in this section.
• STATE GAS TAX - To account for monies received from the state gas tax allocations, which are required to be spent on construction, improvement and maintenance of public streets and infrastructure.
• TRAFFIC SAFETY - To account for revenues collected from traffic violations
that the City has identified for use on traffic safety-related expenditures including traffic control and street maintenance not included in the Gas Tax Fund.
• PROPOSITION A - To account for revenues and expenditures associated with the
½ cent sales tax approved by taxpayers as Proposition A in 1980. These funds may only be expended for transportation-related services as approved by the Los Angeles County Metropolitan Transportation Authority (MTA).
• PROPOSITION C - To account for revenues and expenditures associated with the
½ cent sales tax approved by taxpayers as Proposition C in 1990. These funds may only be expended for transportation-related services as approved by the MTA.
• MEASURE R - To account for revenues and expenditures associated with the ½ cent sales tax approved by taxpayers as Measure R in 2008. These funds may only be expended for transportation-related services as approved by the MTA.
• AIR QUALITY MANAGEMENT - To account for monies received from the
South Coast Air Quality Management District which are used for generating alternative transportation programs to reduce the problem of poor air quality in Southern California.
• SOLID WASTE MANAGEMENT SURCHARGE - This fund accounts for monies received from fees generated by solid waste collections in the City. Funds are to be used for implementing the solid waste management process as defined in the Source Reduction and Recycling Element.
• PARKLAND DEVELOPMENT IN-LIEU - The City collects fees from
developers, as a condition of approval, to be used for parkland and recreation facilities and programs.
• QUIMBY ACT PARKLAND DEDICATION - Similar to the Parkland
Development funds, the City collects fees from the development of subdivisions. Funds are restricted to acquisition of parkland and/or construction of facilities for recreation purposes.
• BRULTE BILL GRANT - The City receives funding from the State of California
as a supplemental grant for law enforcement. Malibu uses these funds for a variety of programs provided by the Sheriff’s Department.
• MEASURE M – To account for revenues and expenditures associated with the ½ percent sales tax approved by taxpayers as Los Angeles County Measure M in 2016. These funds may only be expended for transportation-related projects as approved by MTA.
• ROAD MAINTENANCE AND REHABILITATION (RMRA) – To account for revenues and expenditures associated with the increased fuel taxes and vehicles registration fees established by Senate Bill 1 Road Repair and Accountability Act of 2017 signed by the Governor. These funds may only be expended for transportation-related projects as approved by California Transportation Commission.
• ART IN PUBLIC PLACES IN-LIEU – The City collects fees from developers as a condition of approval, to incorporate public art throughout the City.
• COMMUNITY DEVELOPMENT BLOCK GRANT - To account for monies
received and expended by the City as a participant in the Federal Community Development Block Grant Program.
• MEASURE W – To account for revenues and expenditures associated with the parcel tax of 2.5¢ per square foot of impermeable area approved by taxpayers as Los Angeles County Measure W in 2018. These funds may only be expended for projects which promote the safe, clean water program by increasing local water supply, improving water quality, and protecting public health.
• BIG ROCK MESA/MALIBU ROAD/CALLE DEL BARCO LMDs - To
account for special assessments on property within district boundaries for the restricted purpose of providing landslide maintenance services.
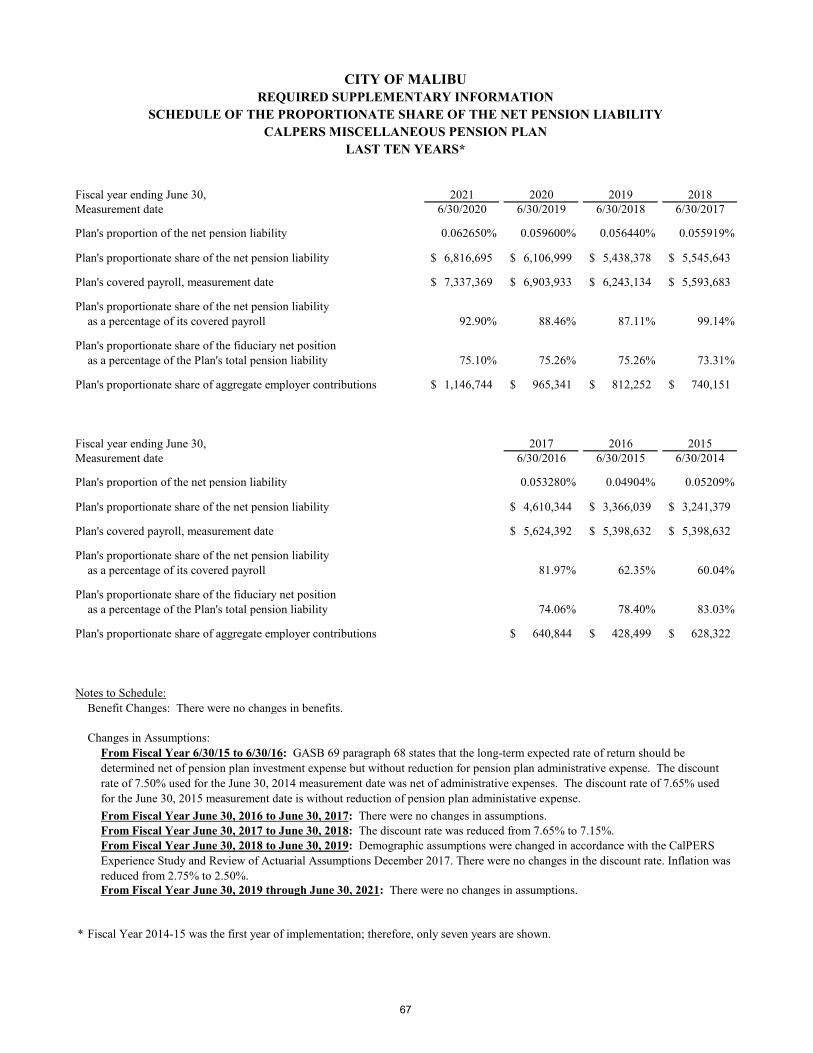
CITY OF MALIBUREQUIRED SUPPLEMENTARY INFORMATION
SCHEDULE OF THE PROPORTIONATE SHARE OF THE NET PENSION LIABILITYCALPERS MISCELLANEOUS PENSION PLAN
LAST TEN YEARS*
Fiscal year ending June 30, 2021 2020 2019 2018Measurement date 6/30/2020 6/30/2019 6/30/2018 6/30/2017
Plan's proportion of the net pension liability 0.062650% 0.059600% 0.056440% 0.055919%
Plan's proportionate share of the net pension liability 6,816,695$ 6,106,999$ 5,438,378$ 5,545,643$
Plan's covered payroll, measurement date 7,337,369$ 6,903,933$ 6,243,134$ 5,593,683$
Plan's proportionate share of the net pension liabilityas a percentage of its covered payroll 92.90% 88.46% 87.11% 99.14%
Plan's proportionate share of the fiduciary net positionas a percentage of the Plan's total pension liability 75.10% 75.26% 75.26% 73.31%
Plan's proportionate share of aggregate employer contributions 1,146,744$ 965,341$ 812,252$ 740,151$
Fiscal year ending June 30, 2017 2016 2015Measurement date 6/30/2016 6/30/2015 6/30/2014
Plan's proportion of the net pension liability 0.053280% 0.04904% 0.05209%
Plan's proportionate share of the net pension liability 4,610,344$ 3,366,039$ 3,241,379$
Plan's covered payroll, measurement date 5,624,392$ 5,398,632$ 5,398,632$
Plan's proportionate share of the net pension liabilityas a percentage of its covered payroll 81.97% 62.35% 60.04%
Plan's proportionate share of the fiduciary net positionas a percentage of the Plan's total pension liability 74.06% 78.40% 83.03%
Plan's proportionate share of aggregate employer contributions 640,844$ 428,499$ 628,322$
Notes to Schedule:Benefit Changes: There were no changes in benefits.
Changes in Assumptions:
From Fiscal Year June 30, 2016 to June 30, 2017: There were no changes in assumptions.From Fiscal Year June 30, 2017 to June 30, 2018: The discount rate was reduced from 7.65% to 7.15%.
From Fiscal Year June 30, 2019 through June 30, 2021: There were no changes in assumptions.
* Fiscal Year 2014-15 was the first year of implementation; therefore, only seven years are shown.
From Fiscal Year 6/30/15 to 6/30/16: GASB 69 paragraph 68 states that the long-term expected rate of return should be determined net of pension plan investment expense but without reduction for pension plan administrative expense. The discount rate of 7.50% used for the June 30, 2014 measurement date was net of administrative expenses. The discount rate of 7.65% used for the June 30, 2015 measurement date is without reduction of pension plan administative expense.
From Fiscal Year June 30, 2018 to June 30, 2019: Demographic assumptions were changed in accordance with the CalPERS Experience Study and Review of Actuarial Assumptions December 2017. There were no changes in the discount rate. Inflation was reduced from 2.75% to 2.50%.
67
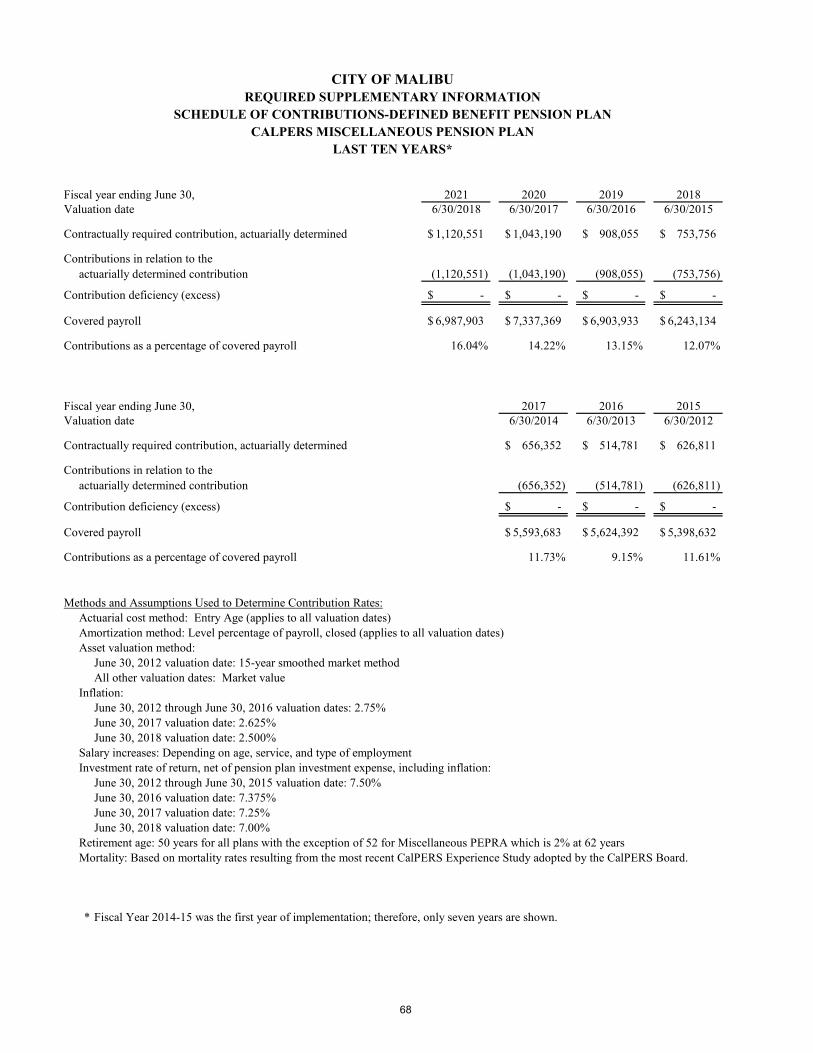
CITY OF MALIBUREQUIRED SUPPLEMENTARY INFORMATION
SCHEDULE OF CONTRIBUTIONS-DEFINED BENEFIT PENSION PLANCALPERS MISCELLANEOUS PENSION PLAN
LAST TEN YEARS*
Fiscal year ending June 30, 2021 2020 2019 2018Valuation date 6/30/2018 6/30/2017 6/30/2016 6/30/2015
Contractually required contribution, actuarially determined 1,120,551$ 1,043,190$ 908,055$ 753,756$
Contributions in relation to theactuarially determined contribution (1,120,551) (1,043,190) (908,055) (753,756)
Contribution deficiency (excess) -$ -$ -$ -$
Covered payroll 6,987,903$ 7,337,369$ 6,903,933$ 6,243,134$
Contributions as a percentage of covered payroll 16.04% 14.22% 13.15% 12.07%
Fiscal year ending June 30, 2017 2016 2015Valuation date 6/30/2014 6/30/2013 6/30/2012
Contractually required contribution, actuarially determined 656,352$ 514,781$ 626,811$
Contributions in relation to theactuarially determined contribution (656,352) (514,781) (626,811)
Contribution deficiency (excess) -$ -$ -$
Covered payroll 5,593,683$ 5,624,392$ 5,398,632$
Contributions as a percentage of covered payroll 11.73% 9.15% 11.61%
Methods and Assumptions Used to Determine Contribution Rates:Actuarial cost method: Entry Age (applies to all valuation dates)Amortization method: Level percentage of payroll, closed (applies to all valuation dates)Asset valuation method:
June 30, 2012 valuation date: 15-year smoothed market methodAll other valuation dates: Market value
Inflation:June 30, 2012 through June 30, 2016 valuation dates: 2.75%June 30, 2017 valuation date: 2.625%June 30, 2018 valuation date: 2.500%
Salary increases: Depending on age, service, and type of employmentInvestment rate of return, net of pension plan investment expense, including inflation:
June 30, 2012 through June 30, 2015 valuation date: 7.50%June 30, 2016 valuation date: 7.375%June 30, 2017 valuation date: 7.25%June 30, 2018 valuation date: 7.00%
Retirement age: 50 years for all plans with the exception of 52 for Miscellaneous PEPRA which is 2% at 62 yearsMortality: Based on mortality rates resulting from the most recent CalPERS Experience Study adopted by the CalPERS Board.
* Fiscal Year 2014-15 was the first year of implementation; therefore, only seven years are shown.
68
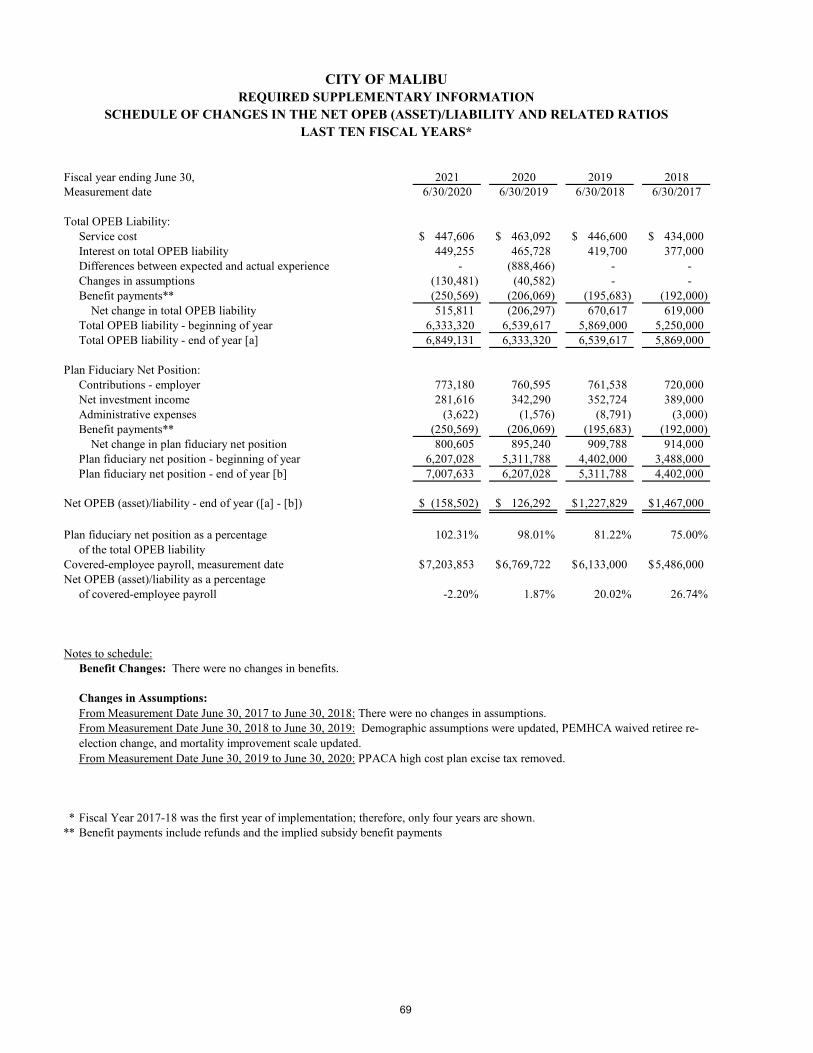
CITY OF MALIBUREQUIRED SUPPLEMENTARY INFORMATION
SCHEDULE OF CHANGES IN THE NET OPEB (ASSET)/LIABILITY AND RELATED RATIOSLAST TEN FISCAL YEARS*
Fiscal year ending June 30, 2021 2020 2019 2018Measurement date 6/30/2020 6/30/2019 6/30/2018 6/30/2017
Total OPEB Liability:Service cost 447,606$ 463,092$ 446,600$ 434,000$ Interest on total OPEB liability 449,255 465,728 419,700 377,000 Differences between expected and actual experience - (888,466) - - Changes in assumptions (130,481) (40,582) - - Benefit payments** (250,569) (206,069) (195,683) (192,000) Net change in total OPEB liability 515,811 (206,297) 670,617 619,000 Total OPEB liability - beginning of year 6,333,320 6,539,617 5,869,000 5,250,000 Total OPEB liability - end of year [a] 6,849,131 6,333,320 6,539,617 5,869,000
Plan Fiduciary Net Position:Contributions - employer 773,180 760,595 761,538 720,000 Net investment income 281,616 342,290 352,724 389,000 Administrative expenses (3,622) (1,576) (8,791) (3,000) Benefit payments** (250,569) (206,069) (195,683) (192,000) Net change in plan fiduciary net position 800,605 895,240 909,788 914,000 Plan fiduciary net position - beginning of year 6,207,028 5,311,788 4,402,000 3,488,000 Plan fiduciary net position - end of year [b] 7,007,633 6,207,028 5,311,788 4,402,000
Net OPEB (asset)/liability - end of year ([a] - [b]) (158,502)$ 126,292$ 1,227,829$ 1,467,000$
Plan fiduciary net position as a percentage 102.31% 98.01% 81.22% 75.00%of the total OPEB liability
Covered-employee payroll, measurement date 7,203,853$ 6,769,722$ 6,133,000$ 5,486,000$ Net OPEB (asset)/liability as a percentage
of covered-employee payroll -2.20% 1.87% 20.02% 26.74%
Notes to schedule:Benefit Changes: There were no changes in benefits.
Changes in Assumptions:From Measurement Date June 30, 2017 to June 30, 2018: There were no changes in assumptions.
From Measurement Date June 30, 2019 to June 30, 2020: PPACA high cost plan excise tax removed.
* Fiscal Year 2017-18 was the first year of implementation; therefore, only four years are shown.** Benefit payments include refunds and the implied subsidy benefit payments
From Measurement Date June 30, 2018 to June 30, 2019: Demographic assumptions were updated, PEMHCA waived retiree re-election change, and mortality improvement scale updated.
69
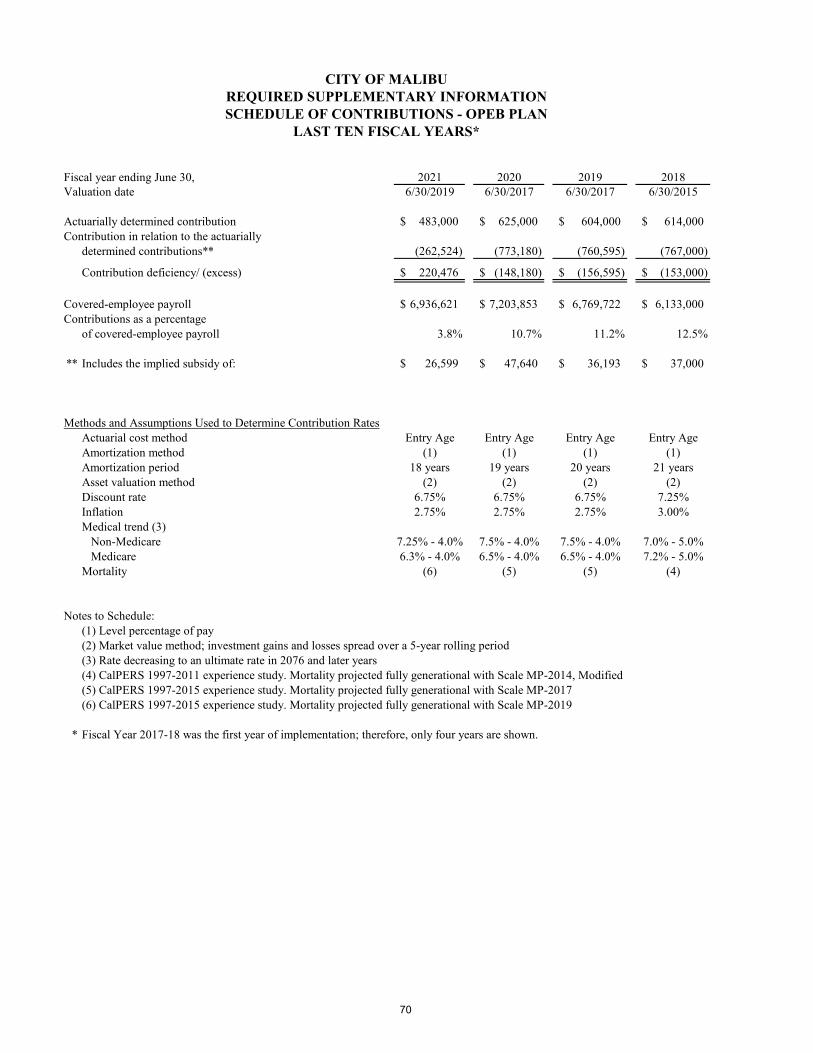
CITY OF MALIBUREQUIRED SUPPLEMENTARY INFORMATIONSCHEDULE OF CONTRIBUTIONS - OPEB PLAN
LAST TEN FISCAL YEARS*
Fiscal year ending June 30, 2021 2020 2019 2018Valuation date 6/30/2019 6/30/2017 6/30/2017 6/30/2015
Actuarially determined contribution 483,000$ 625,000$ 604,000$ 614,000$ Contribution in relation to the actuarially
determined contributions** (262,524) (773,180) (760,595) (767,000)
Contribution deficiency/ (excess) 220,476$ (148,180)$ (156,595)$ (153,000)$
Covered-employee payroll 6,936,621$ 7,203,853$ 6,769,722$ 6,133,000$ Contributions as a percentage
of covered-employee payroll 3.8% 10.7% 11.2% 12.5%
** Includes the implied subsidy of: 26,599$ 47,640$ 36,193$ 37,000$
Methods and Assumptions Used to Determine Contribution RatesActuarial cost method Entry Age Entry Age Entry Age Entry AgeAmortization method (1) (1) (1) (1)Amortization period 18 years 19 years 20 years 21 yearsAsset valuation method (2) (2) (2) (2)Discount rate 6.75% 6.75% 6.75% 7.25%Inflation 2.75% 2.75% 2.75% 3.00%Medical trend (3) Non-Medicare 7.25% - 4.0% 7.5% - 4.0% 7.5% - 4.0% 7.0% - 5.0% Medicare 6.3% - 4.0% 6.5% - 4.0% 6.5% - 4.0% 7.2% - 5.0%Mortality (6) (5) (5) (4)
Notes to Schedule:(1) Level percentage of pay(2) Market value method; investment gains and losses spread over a 5-year rolling period(3) Rate decreasing to an ultimate rate in 2076 and later years(4) CalPERS 1997-2011 experience study. Mortality projected fully generational with Scale MP-2014, Modified(5) CalPERS 1997-2015 experience study. Mortality projected fully generational with Scale MP-2017(6) CalPERS 1997-2015 experience study. Mortality projected fully generational with Scale MP-2019
* Fiscal Year 2017-18 was the first year of implementation; therefore, only four years are shown.
70
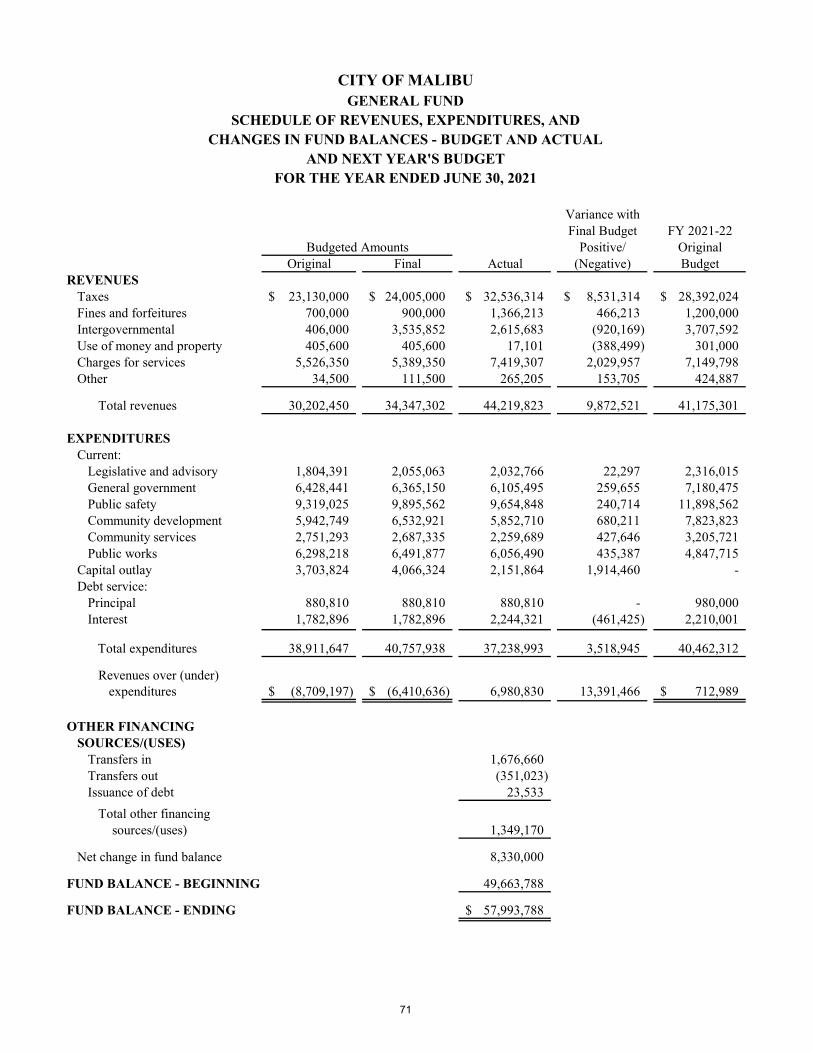
CITY OF MALIBUGENERAL FUND
SCHEDULE OF REVENUES, EXPENDITURES, ANDCHANGES IN FUND BALANCES - BUDGET AND ACTUAL
AND NEXT YEAR'S BUDGETFOR THE YEAR ENDED JUNE 30, 2021
Variance withFinal Budget FY 2021-22
Budgeted Amounts Positive/ OriginalOriginal Final Actual (Negative) Budget
REVENUESTaxes 23,130,000$ 24,005,000$ 32,536,314$ 8,531,314$ 28,392,024$ Fines and forfeitures 700,000 900,000 1,366,213 466,213 1,200,000 Intergovernmental 406,000 3,535,852 2,615,683 (920,169) 3,707,592 Use of money and property 405,600 405,600 17,101 (388,499) 301,000 Charges for services 5,526,350 5,389,350 7,419,307 2,029,957 7,149,798 Other 34,500 111,500 265,205 153,705 424,887
Total revenues 30,202,450 34,347,302 44,219,823 9,872,521 41,175,301
EXPENDITURESCurrent:
Legislative and advisory 1,804,391 2,055,063 2,032,766 22,297 2,316,015 General government 6,428,441 6,365,150 6,105,495 259,655 7,180,475 Public safety 9,319,025 9,895,562 9,654,848 240,714 11,898,562 Community development 5,942,749 6,532,921 5,852,710 680,211 7,823,823 Community services 2,751,293 2,687,335 2,259,689 427,646 3,205,721 Public works 6,298,218 6,491,877 6,056,490 435,387 4,847,715
Capital outlay 3,703,824 4,066,324 2,151,864 1,914,460 - Debt service:
Principal 880,810 880,810 880,810 - 980,000 Interest 1,782,896 1,782,896 2,244,321 (461,425) 2,210,001
Total expenditures 38,911,647 40,757,938 37,238,993 3,518,945 40,462,312
Revenues over (under)expenditures (8,709,197)$ (6,410,636)$ 6,980,830 13,391,466 712,989$
OTHER FINANCINGSOURCES/(USES)
Transfers in 1,676,660 Transfers out (351,023) Issuance of debt 23,533
Total other financing sources/(uses) 1,349,170
Net change in fund balance 8,330,000
FUND BALANCE - BEGINNING 49,663,788
FUND BALANCE - ENDING 57,993,788$
71
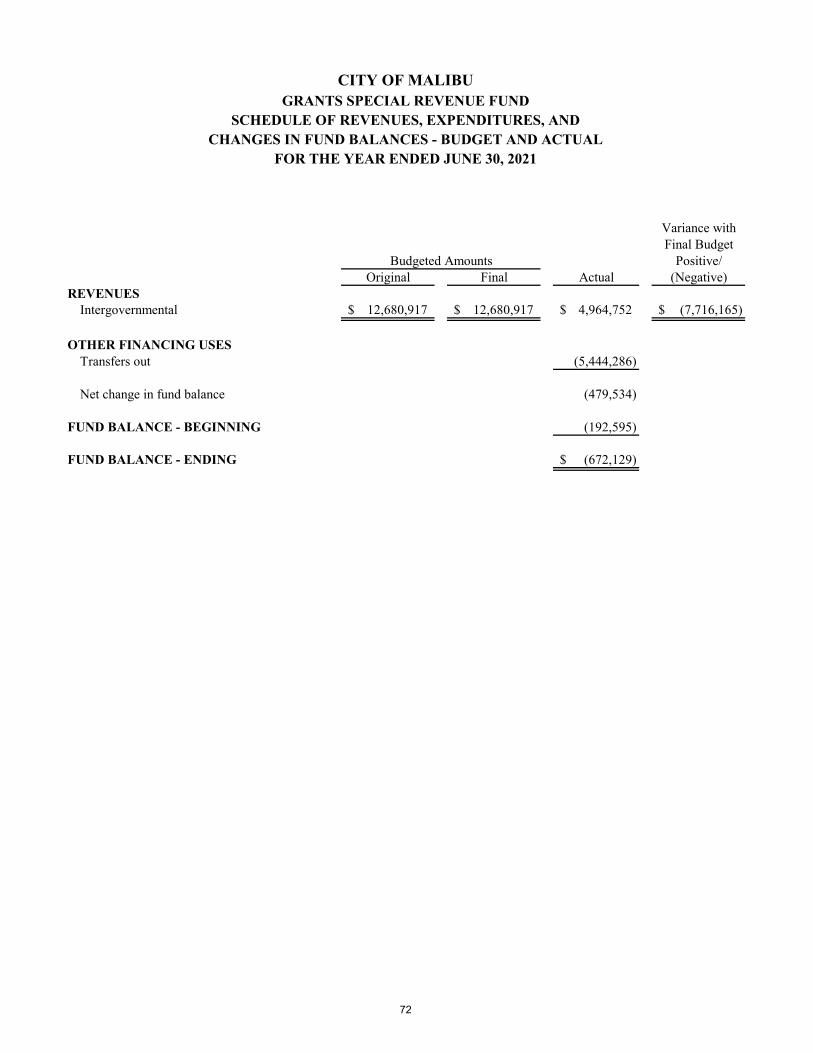
CITY OF MALIBUGRANTS SPECIAL REVENUE FUND
SCHEDULE OF REVENUES, EXPENDITURES, ANDCHANGES IN FUND BALANCES - BUDGET AND ACTUAL
FOR THE YEAR ENDED JUNE 30, 2021
Variance withFinal Budget
Budgeted Amounts Positive/Original Final Actual (Negative)
REVENUESIntergovernmental 12,680,917$ 12,680,917$ 4,964,752$ (7,716,165)$
OTHER FINANCING USESTransfers out (5,444,286)
Net change in fund balance (479,534)
FUND BALANCE - BEGINNING (192,595)
FUND BALANCE - ENDING (672,129)$
72
CITY OF MALIBU, CALIFORNIA NOTE TO REQUIRED SUPPLEMENTARY INFORMATION
JUNE 30, 2021
1. BUDGETS AND BUDGETARY PRINCIPLES
General Budget Policies
The City Manager submits a proposed budget to the City Council by May 15th of each year. The City Council holds public hearings, modifies the City Manager’s recommendations, and adopts a final budget by resolution prior to June 30th of each year. The City Manager is authorized to transfer budgeted amounts between line items within a fund. Any revisions or transfers that alter the total appropriations of any fund must be approved by the City Council. Supplemental appropriations may be adopted by the City Council during the year.
Budgets are adopted on a basis consistent with generally accepted accounting principles and are used as a management control device. Annual appropriated budgets are adopted for the General Fund and generally for all Special Revenue funds.
The City maintains budgetary controls to ensure compliance with legal provisions embodied in the appropriated budget approved by the City Council. The annual budget indicates appropriations by fund, and the legal level of budgetary control (the level at which expenditures cannot legally exceed the appropriated amount) for the operating budget is within a fund.
Continuing Appropriations
Unexpended annual appropriations lapse at the end of the fiscal year; encumbered appropriations are re-budgeted in the next fiscal year. Unexpended capital improvement appropriations are carried forward until the improvements or programs are complete.
Budgetary Basis of Accounting
Budgets are adopted on a basis consistent with generally accepted accounting principles. Budgeted amounts presented are as originally adopted and as further amended by the City Council. Revenues with significant adjustments were for increased estimates for property transfer taxes and transient occupancy taxes from private rentals and additional intergovernmental revenues for disaster-relief grants, COVID relief, and participation in a joint enhanced water management program.
Supplemental appropriations were required and approved by the City Council for the General Fund which increased the originally adopted budget of $38,911,647 to $40,757,938. The majority of the budget amendments were for carryover appropriations from the prior year, participation in the joint enhanced water management program, and additional public safety costs for increased patrols, emergency services printing and equipment, and for homeless outreach programs.
73

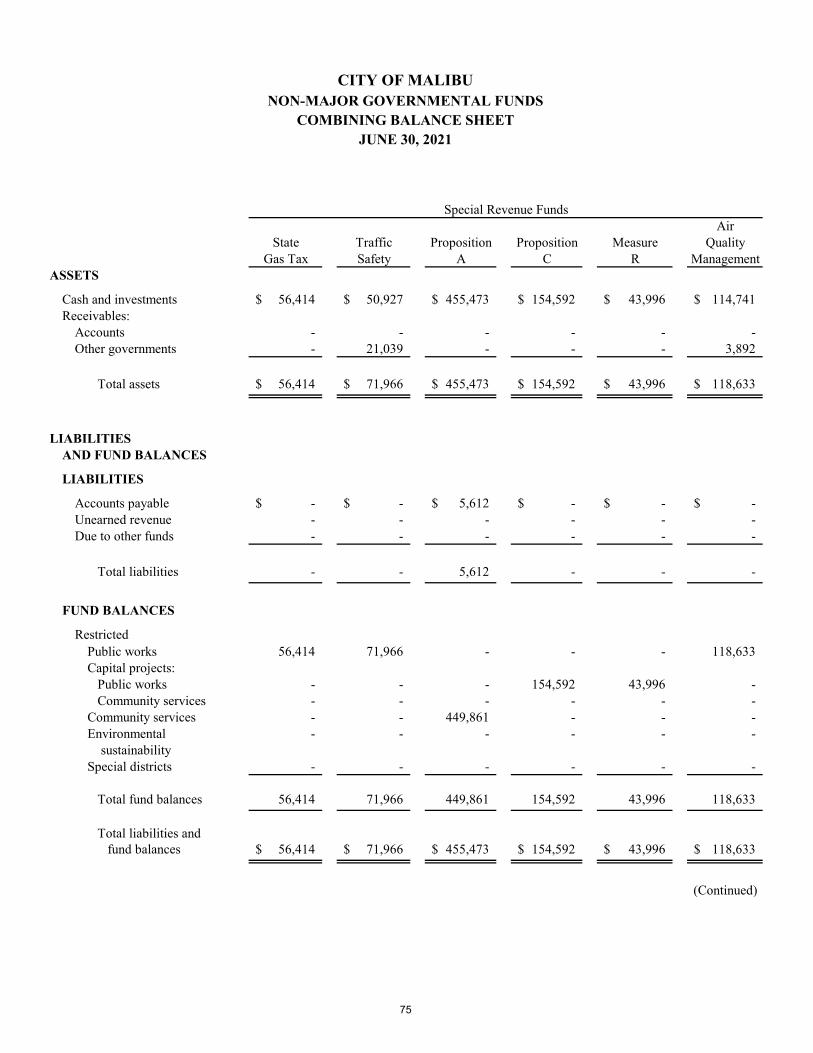
CITY OF MALIBUNON-MAJOR GOVERNMENTAL FUNDS
COMBINING BALANCE SHEETJUNE 30, 2021
Special Revenue FundsAir
State Traffic Proposition Proposition Measure QualityGas Tax Safety A C R Management
ASSETS
Cash and investments 56,414$ 50,927$ 455,473$ 154,592$ 43,996$ 114,741$ Receivables:
Accounts - - - - - - Other governments - 21,039 - - - 3,892
Total assets 56,414$ 71,966$ 455,473$ 154,592$ 43,996$ 118,633$
LIABILITIESAND FUND BALANCES
LIABILITIES
Accounts payable -$ -$ 5,612$ -$ -$ -$ Unearned revenue - - - - - - Due to other funds - - - - - -
Total liabilities - - 5,612 - - -
FUND BALANCES
RestrictedPublic works 56,414 71,966 - - - 118,633 Capital projects: Public works - - - 154,592 43,996 - Community services - - - - - - Community services - - 449,861 - - - Environmental - - - - - - sustainabilitySpecial districts - - - - - -
Total fund balances 56,414 71,966 449,861 154,592 43,996 118,633
Total liabilities and fund balances 56,414$ 71,966$ 455,473$ 154,592$ 43,996$ 118,633$
(Continued)
75
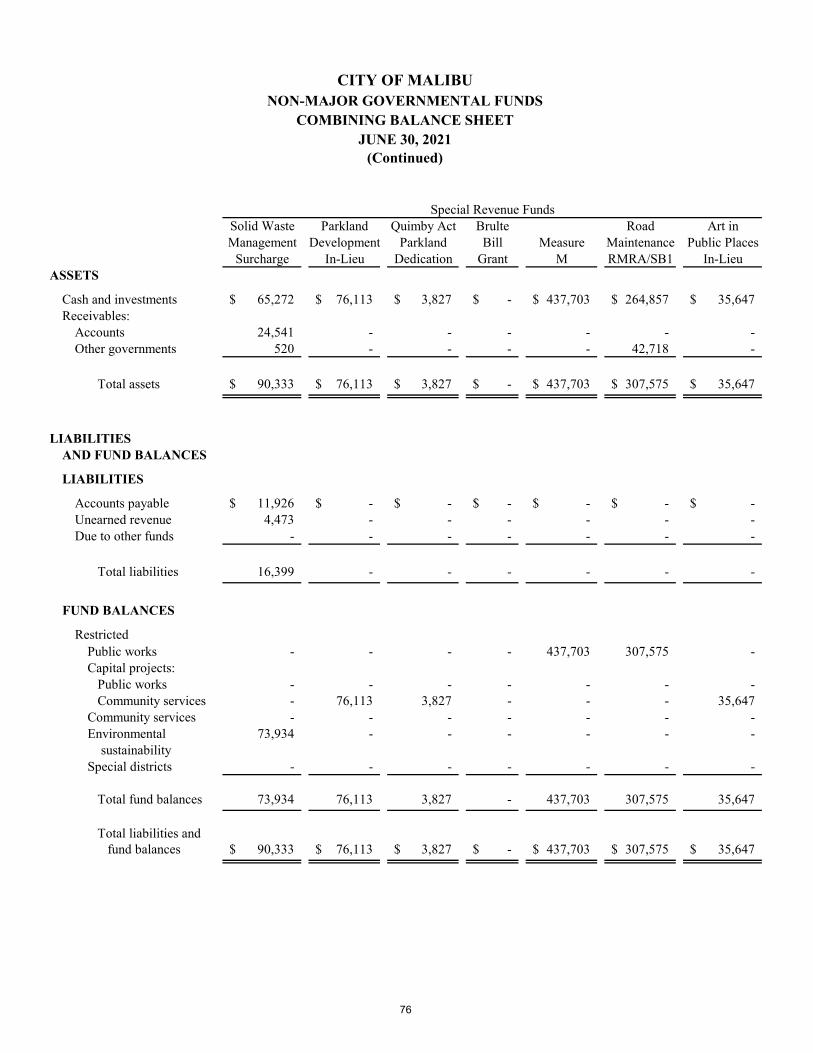
CITY OF MALIBUNON-MAJOR GOVERNMENTAL FUNDS
COMBINING BALANCE SHEETJUNE 30, 2021
(Continued)
Special Revenue FundsSolid Waste Parkland Quimby Act Brulte Road Art inManagement Development Parkland Bill Measure Maintenance Public Places
Surcharge In-Lieu Dedication Grant M RMRA/SB1 In-LieuASSETS
Cash and investments 65,272$ 76,113$ 3,827$ -$ 437,703$ 264,857$ 35,647$ Receivables:
Accounts 24,541 - - - - - - Other governments 520 - - - - 42,718 -
Total assets 90,333$ 76,113$ 3,827$ -$ 437,703$ 307,575$ 35,647$
LIABILITIESAND FUND BALANCES
LIABILITIES
Accounts payable 11,926$ -$ -$ -$ -$ -$ -$ Unearned revenue 4,473 - - - - - - Due to other funds - - - - - - -
Total liabilities 16,399 - - - - - -
FUND BALANCES
RestrictedPublic works - - - - 437,703 307,575 - Capital projects: Public works - - - - - - - Community services - 76,113 3,827 - - - 35,647 Community services - - - - - - - Environmental 73,934 - - - - - - sustainabilitySpecial districts - - - - - - -
Total fund balances 73,934 76,113 3,827 - 437,703 307,575 35,647
Total liabilities and fund balances 90,333$ 76,113$ 3,827$ -$ 437,703$ 307,575$ 35,647$
76
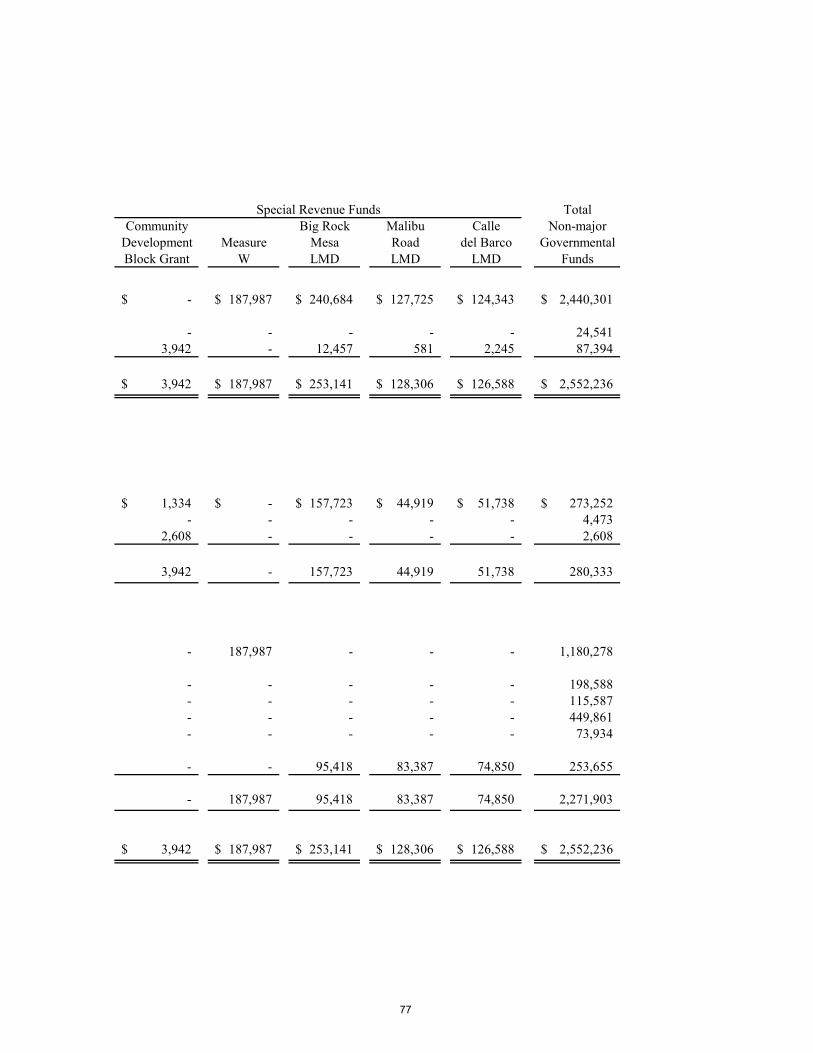
Special Revenue Funds TotalCommunity Big Rock Malibu Calle Non-major
Development Measure Mesa Road del Barco GovernmentalBlock Grant W LMD LMD LMD Funds
-$ 187,987$ 240,684$ 127,725$ 124,343$ 2,440,301$
- - - - - 24,541 3,942 - 12,457 581 2,245 87,394
3,942$ 187,987$ 253,141$ 128,306$ 126,588$ 2,552,236$
1,334$ -$ 157,723$ 44,919$ 51,738$ 273,252$ - - - - - 4,473
2,608 - - - - 2,608
3,942 - 157,723 44,919 51,738 280,333
- 187,987 - - - 1,180,278
- - - - - 198,588 - - - - - 115,587 - - - - - 449,861 - - - - - 73,934
- - 95,418 83,387 74,850 253,655
- 187,987 95,418 83,387 74,850 2,271,903
3,942$ 187,987$ 253,141$ 128,306$ 126,588$ 2,552,236$
77
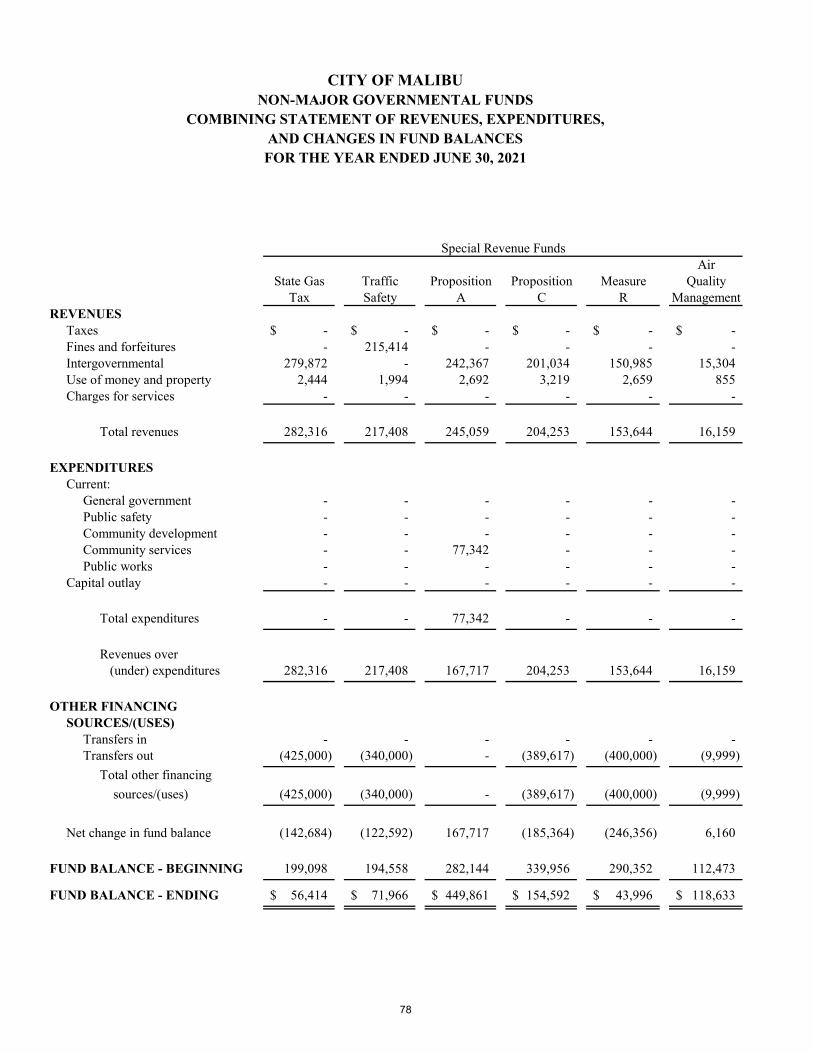
CITY OF MALIBUNON-MAJOR GOVERNMENTAL FUNDS
COMBINING STATEMENT OF REVENUES, EXPENDITURES,AND CHANGES IN FUND BALANCESFOR THE YEAR ENDED JUNE 30, 2021
Special Revenue FundsAir
State Gas Traffic Proposition Proposition Measure QualityTax Safety A C R Management
REVENUESTaxes -$ -$ -$ -$ -$ -$ Fines and forfeitures - 215,414 - - - - Intergovernmental 279,872 - 242,367 201,034 150,985 15,304 Use of money and property 2,444 1,994 2,692 3,219 2,659 855 Charges for services - - - - - -
Total revenues 282,316 217,408 245,059 204,253 153,644 16,159
EXPENDITURESCurrent:
General government - - - - - - Public safety - - - - - - Community development - - - - - - Community services - - 77,342 - - - Public works - - - - - -
Capital outlay - - - - - -
Total expenditures - - 77,342 - - -
Revenues over (under) expenditures 282,316 217,408 167,717 204,253 153,644 16,159
OTHER FINANCINGSOURCES/(USES)
Transfers in - - - - - - Transfers out (425,000) (340,000) - (389,617) (400,000) (9,999)
Total other financing sources/(uses) (425,000) (340,000) - (389,617) (400,000) (9,999)
Net change in fund balance (142,684) (122,592) 167,717 (185,364) (246,356) 6,160
FUND BALANCE - BEGINNING 199,098 194,558 282,144 339,956 290,352 112,473
FUND BALANCE - ENDING 56,414$ 71,966$ 449,861$ 154,592$ 43,996$ 118,633$
78
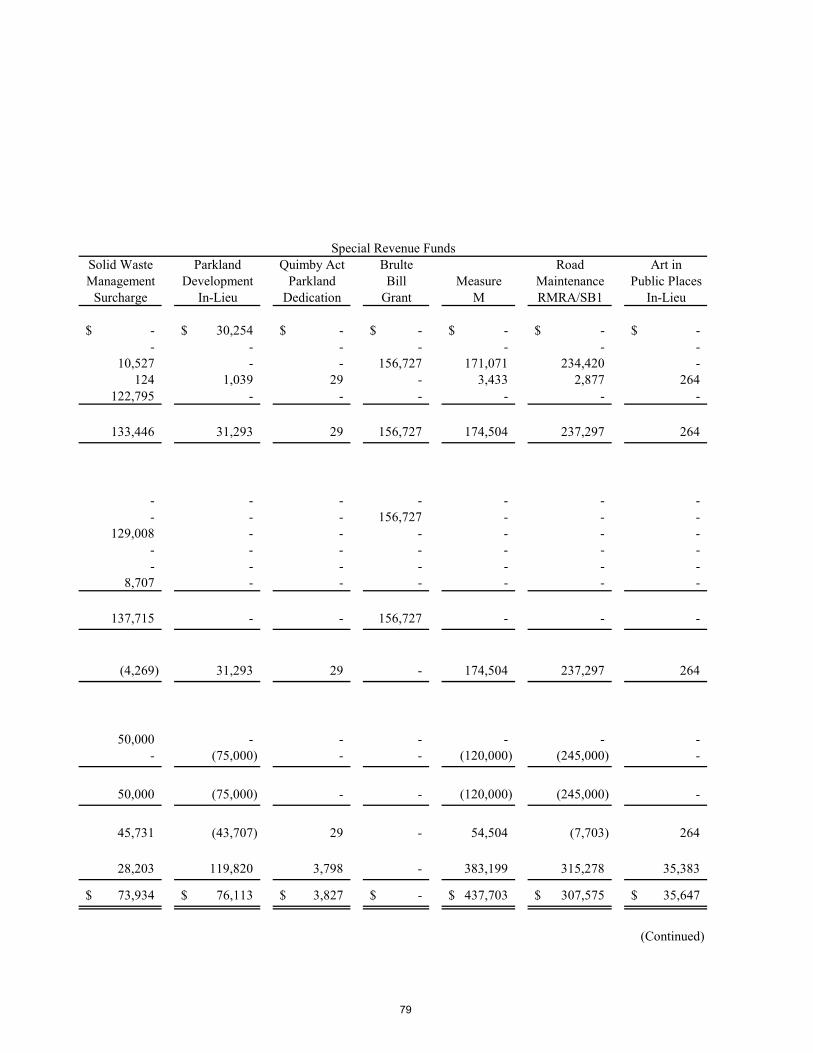
Special Revenue FundsSolid Waste Parkland Quimby Act Brulte Road Art inManagement Development Parkland Bill Measure Maintenance Public Places
Surcharge In-Lieu Dedication Grant M RMRA/SB1 In-Lieu
-$ 30,254$ -$ -$ -$ -$ -$ - - - - - - -
10,527 - - 156,727 171,071 234,420 - 124 1,039 29 - 3,433 2,877 264
122,795 - - - - - -
133,446 31,293 29 156,727 174,504 237,297 264
- - - - - - - - - - 156,727 - - -
129,008 - - - - - - - - - - - - - - - - - - - -
8,707 - - - - - -
137,715 - - 156,727 - - -
(4,269) 31,293 29 - 174,504 237,297 264
50,000 - - - - - - - (75,000) - - (120,000) (245,000) -
50,000 (75,000) - - (120,000) (245,000) -
45,731 (43,707) 29 - 54,504 (7,703) 264
28,203 119,820 3,798 - 383,199 315,278 35,383
73,934$ 76,113$ 3,827$ -$ 437,703$ 307,575$ 35,647$
(Continued)
79
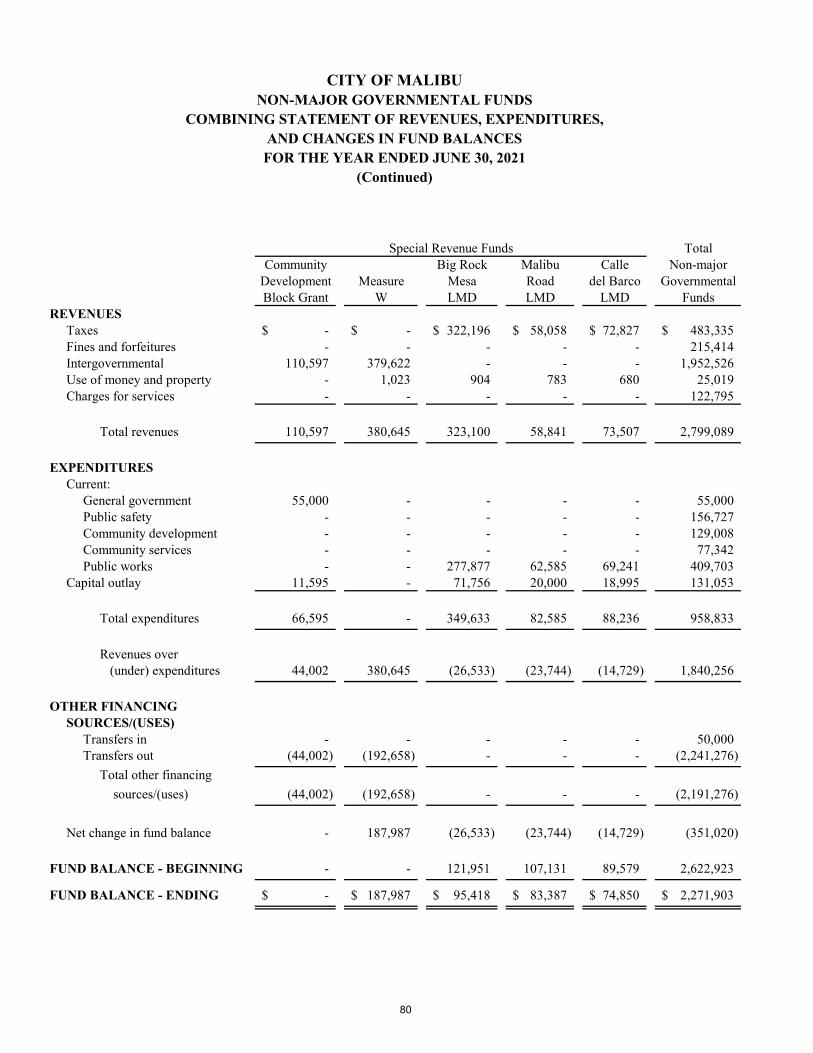
CITY OF MALIBUNON-MAJOR GOVERNMENTAL FUNDS
COMBINING STATEMENT OF REVENUES, EXPENDITURES,AND CHANGES IN FUND BALANCESFOR THE YEAR ENDED JUNE 30, 2021
(Continued)
Special Revenue Funds TotalCommunity Big Rock Malibu Calle Non-major
Development Measure Mesa Road del Barco GovernmentalBlock Grant W LMD LMD LMD Funds
REVENUESTaxes -$ -$ 322,196$ 58,058$ 72,827$ 483,335$ Fines and forfeitures - - - - - 215,414 Intergovernmental 110,597 379,622 - - - 1,952,526 Use of money and property - 1,023 904 783 680 25,019 Charges for services - - - - - 122,795
Total revenues 110,597 380,645 323,100 58,841 73,507 2,799,089
EXPENDITURESCurrent:
General government 55,000 - - - - 55,000 Public safety - - - - - 156,727 Community development - - - - - 129,008 Community services - - - - - 77,342 Public works - - 277,877 62,585 69,241 409,703
Capital outlay 11,595 - 71,756 20,000 18,995 131,053
Total expenditures 66,595 - 349,633 82,585 88,236 958,833
Revenues over (under) expenditures 44,002 380,645 (26,533) (23,744) (14,729) 1,840,256
OTHER FINANCINGSOURCES/(USES)
Transfers in - - - - - 50,000 Transfers out (44,002) (192,658) - - - (2,241,276)
Total other financing sources/(uses) (44,002) (192,658) - - - (2,191,276)
Net change in fund balance - 187,987 (26,533) (23,744) (14,729) (351,020)
FUND BALANCE - BEGINNING - - 121,951 107,131 89,579 2,622,923
FUND BALANCE - ENDING -$ 187,987$ 95,418$ 83,387$ 74,850$ 2,271,903$
80
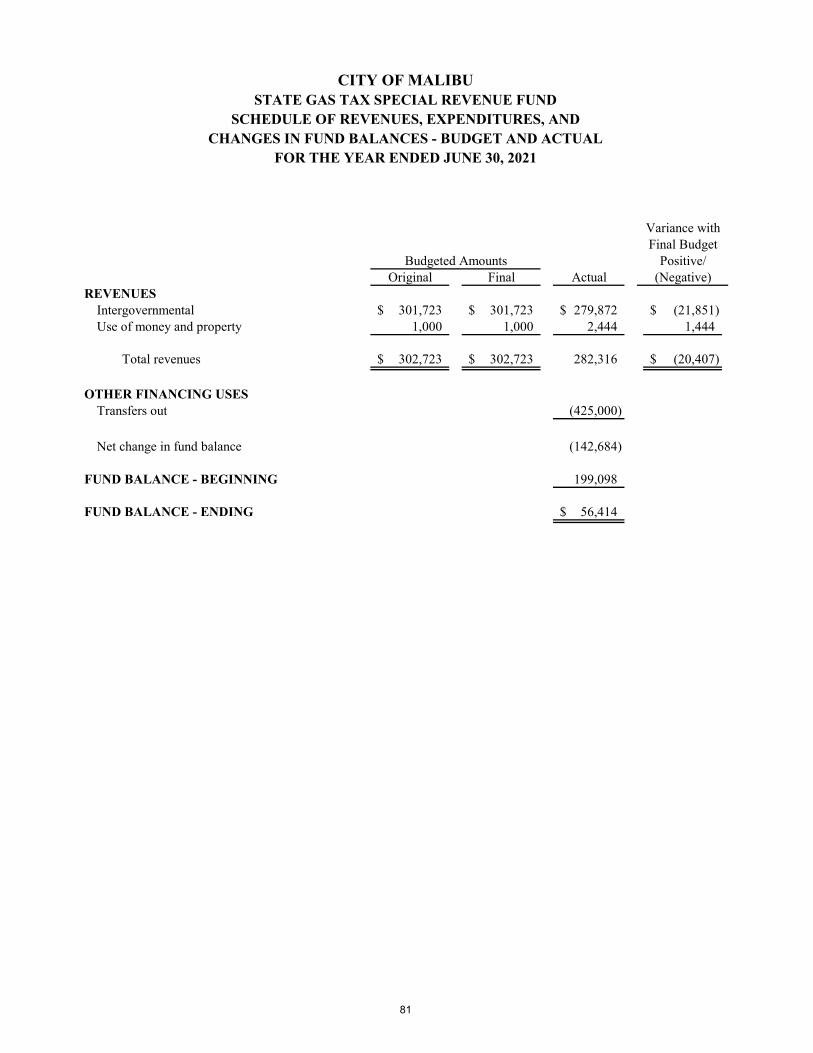
CITY OF MALIBUSTATE GAS TAX SPECIAL REVENUE FUND
SCHEDULE OF REVENUES, EXPENDITURES, ANDCHANGES IN FUND BALANCES - BUDGET AND ACTUAL
FOR THE YEAR ENDED JUNE 30, 2021
Budgeted AmountsOriginal Final Actual
REVENUESIntergovernmental 301,723$ 301,723$ 279,872$ (21,851)$ Use of money and property 1,000 1,000 2,444 1,444
Total revenues 302,723$ 302,723$ 282,316 (20,407)$
OTHER FINANCING USESTransfers out (425,000)
Net change in fund balance (142,684)
FUND BALANCE - BEGINNING 199,098
FUND BALANCE - ENDING 56,414$
Final BudgetPositive/
(Negative)
Variance with
81
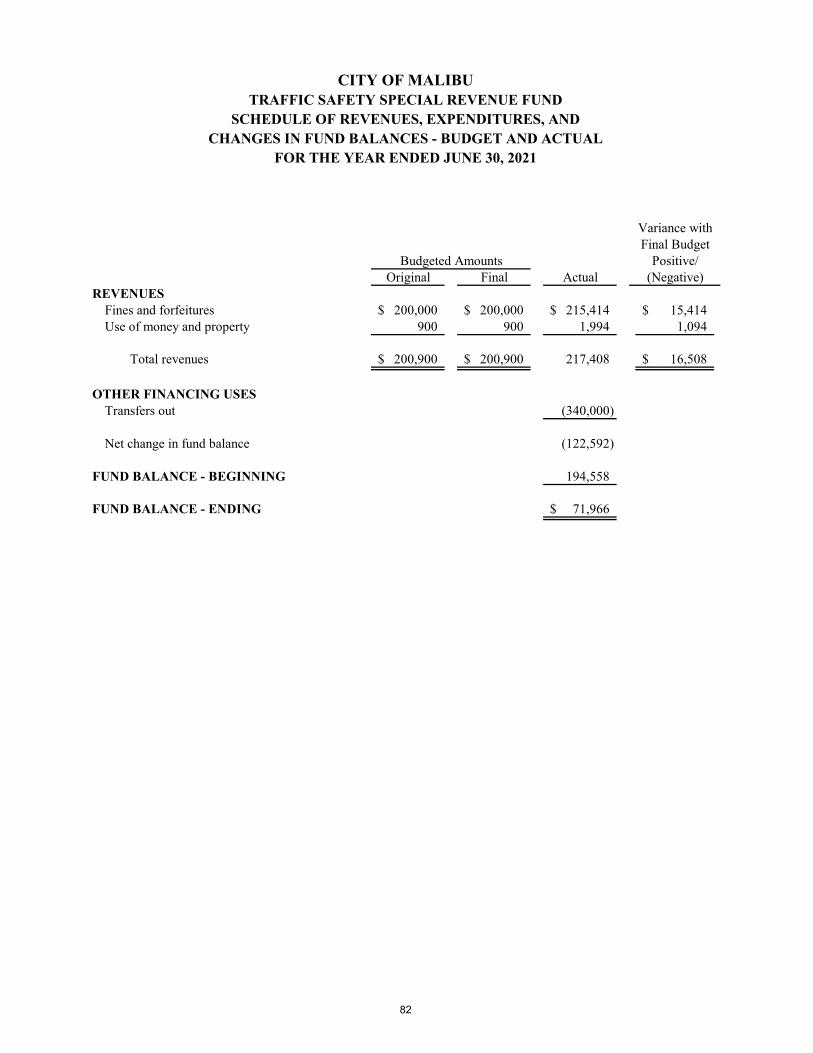
CITY OF MALIBUTRAFFIC SAFETY SPECIAL REVENUE FUND
SCHEDULE OF REVENUES, EXPENDITURES, ANDCHANGES IN FUND BALANCES - BUDGET AND ACTUAL
FOR THE YEAR ENDED JUNE 30, 2021
Budgeted AmountsOriginal Final Actual
REVENUESFines and forfeitures 200,000$ 200,000$ 215,414$ 15,414$ Use of money and property 900 900 1,994 1,094
Total revenues 200,900$ 200,900$ 217,408 16,508$
OTHER FINANCING USESTransfers out (340,000)
Net change in fund balance (122,592)
FUND BALANCE - BEGINNING 194,558
FUND BALANCE - ENDING 71,966$
Final BudgetPositive/
(Negative)
Variance with
82
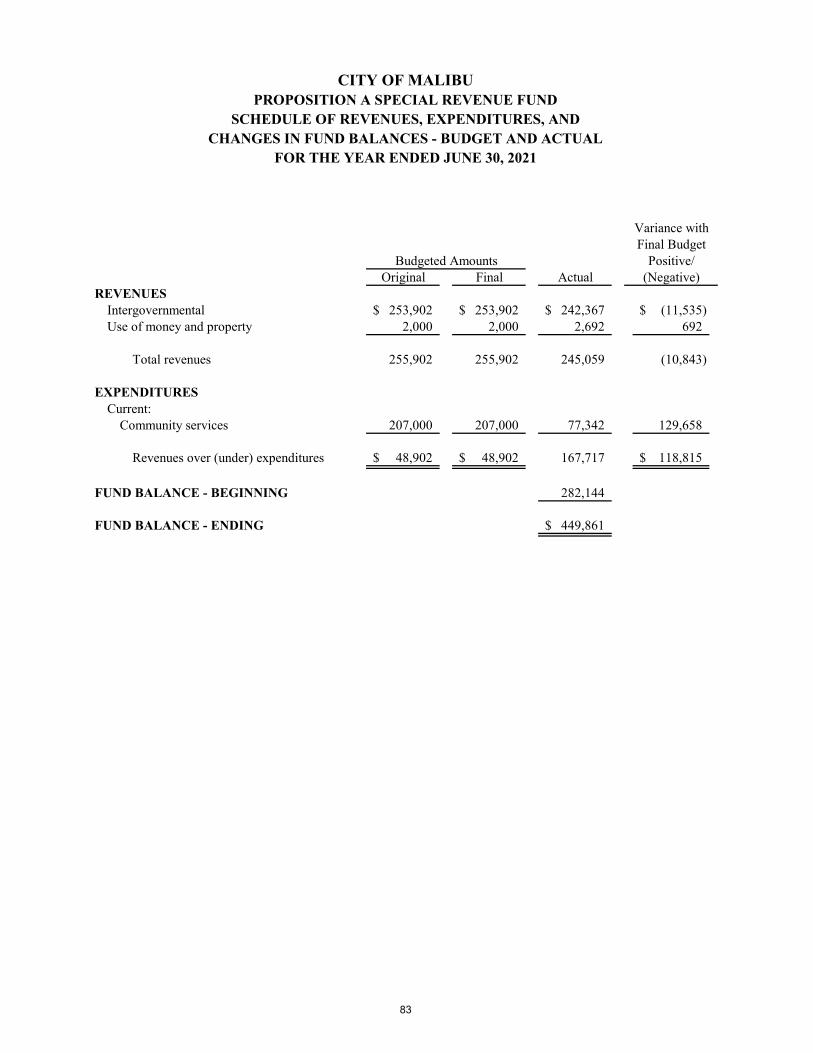
CITY OF MALIBUPROPOSITION A SPECIAL REVENUE FUND
SCHEDULE OF REVENUES, EXPENDITURES, ANDCHANGES IN FUND BALANCES - BUDGET AND ACTUAL
FOR THE YEAR ENDED JUNE 30, 2021
Budgeted AmountsOriginal Final Actual
REVENUESIntergovernmental 253,902$ 253,902$ 242,367$ (11,535)$ Use of money and property 2,000 2,000 2,692 692
Total revenues 255,902 255,902 245,059 (10,843)
EXPENDITURESCurrent:
Community services 207,000 207,000 77,342 129,658
Revenues over (under) expenditures 48,902$ 48,902$ 167,717 118,815$
FUND BALANCE - BEGINNING 282,144
FUND BALANCE - ENDING 449,861$
Final BudgetPositive/
(Negative)
Variance with
83
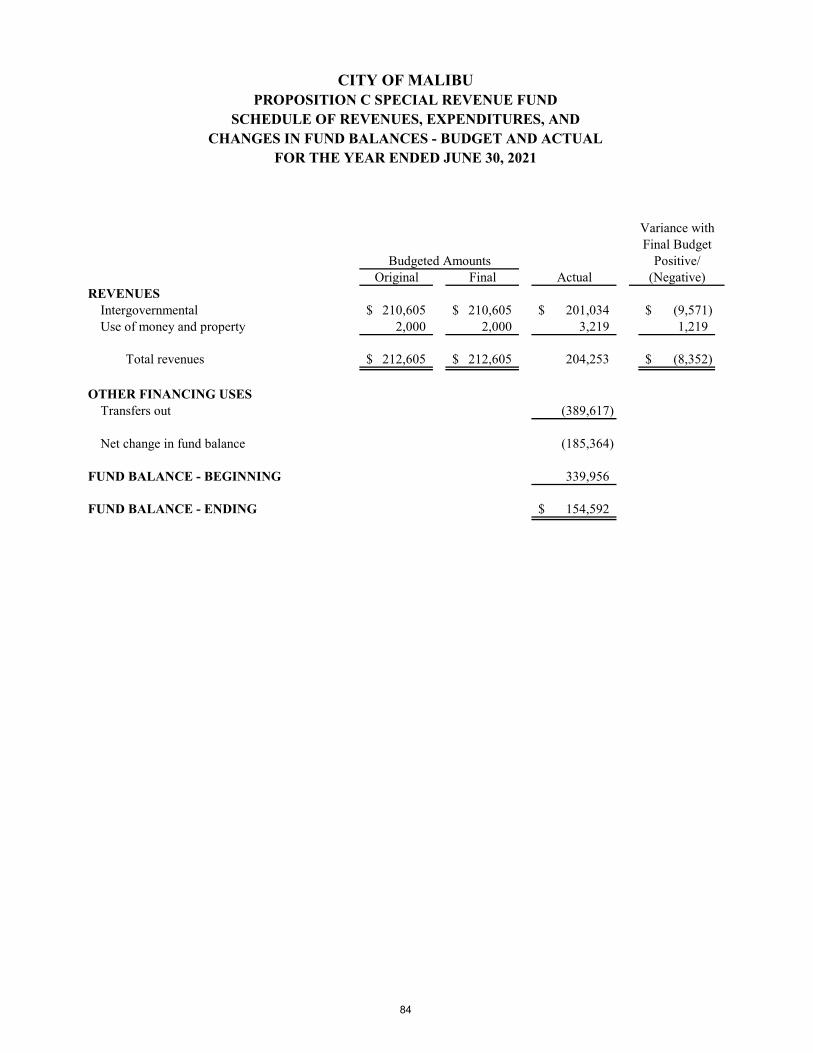
CITY OF MALIBUPROPOSITION C SPECIAL REVENUE FUND
SCHEDULE OF REVENUES, EXPENDITURES, ANDCHANGES IN FUND BALANCES - BUDGET AND ACTUAL
FOR THE YEAR ENDED JUNE 30, 2021
Budgeted AmountsOriginal Final Actual
REVENUESIntergovernmental 210,605$ 210,605$ 201,034$ (9,571)$ Use of money and property 2,000 2,000 3,219 1,219
Total revenues 212,605$ 212,605$ 204,253 (8,352)$
OTHER FINANCING USESTransfers out (389,617)
Net change in fund balance (185,364)
FUND BALANCE - BEGINNING 339,956
FUND BALANCE - ENDING 154,592$
Final BudgetPositive/
(Negative)
Variance with
84

CITY OF MALIBUMEASURE R SPECIAL REVENUE FUND
SCHEDULE OF REVENUES, EXPENDITURES, ANDCHANGES IN FUND BALANCES - BUDGET AND ACTUAL
FOR THE YEAR ENDED JUNE 30, 2021
Budgeted AmountsOriginal Final Actual
REVENUESIntergovernmental 157,970$ 157,970$ 150,985$ (6,985)$ Use of money and property 2,000 2,000 2,659 659
Total revenues 159,970$ 159,970$ 153,644 (6,326)$
OTHER FINANCING USESTransfers out (400,000)
Net change in fund balance (246,356)
FUND BALANCE - BEGINNING 290,352
FUND BALANCE - ENDING 43,996$
Final BudgetPositive/
(Negative)
Variance with
85
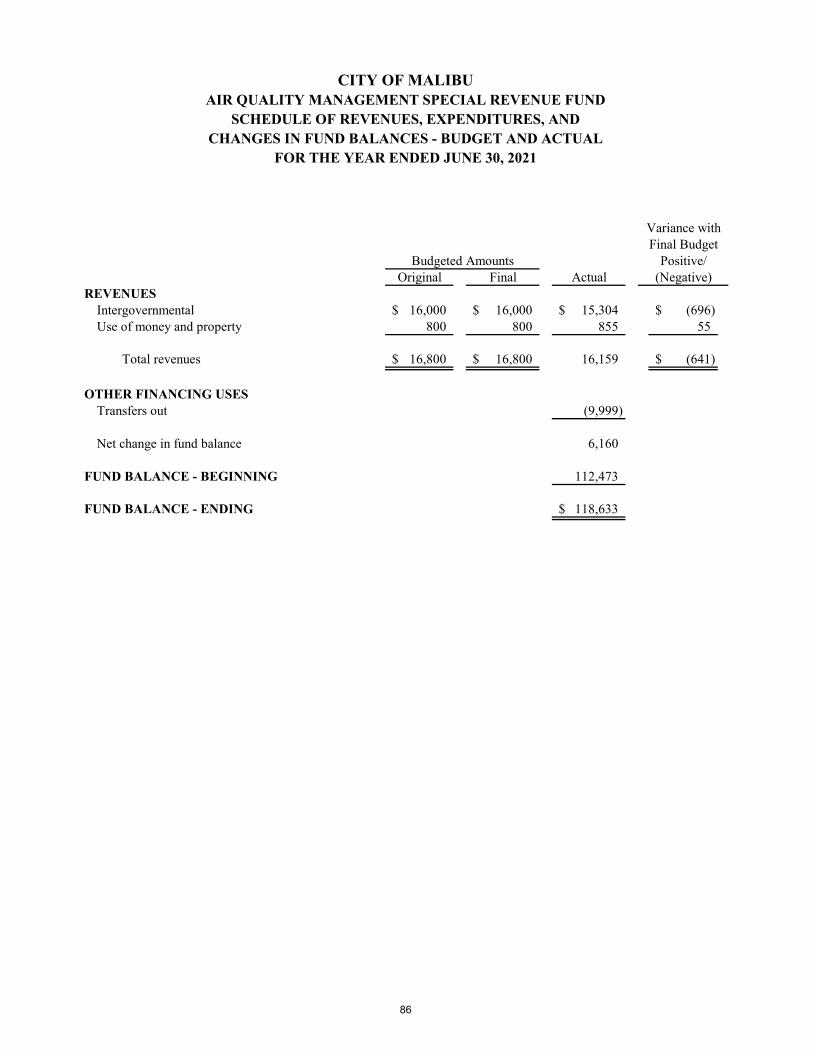
CITY OF MALIBUAIR QUALITY MANAGEMENT SPECIAL REVENUE FUND
SCHEDULE OF REVENUES, EXPENDITURES, ANDCHANGES IN FUND BALANCES - BUDGET AND ACTUAL
FOR THE YEAR ENDED JUNE 30, 2021
Budgeted AmountsOriginal Final Actual
REVENUESIntergovernmental 16,000$ 16,000$ 15,304$ (696)$ Use of money and property 800 800 855 55
Total revenues 16,800$ 16,800$ 16,159 (641)$
OTHER FINANCING USESTransfers out (9,999)
Net change in fund balance 6,160
FUND BALANCE - BEGINNING 112,473
FUND BALANCE - ENDING 118,633$
Final BudgetPositive/
(Negative)
Variance with
86
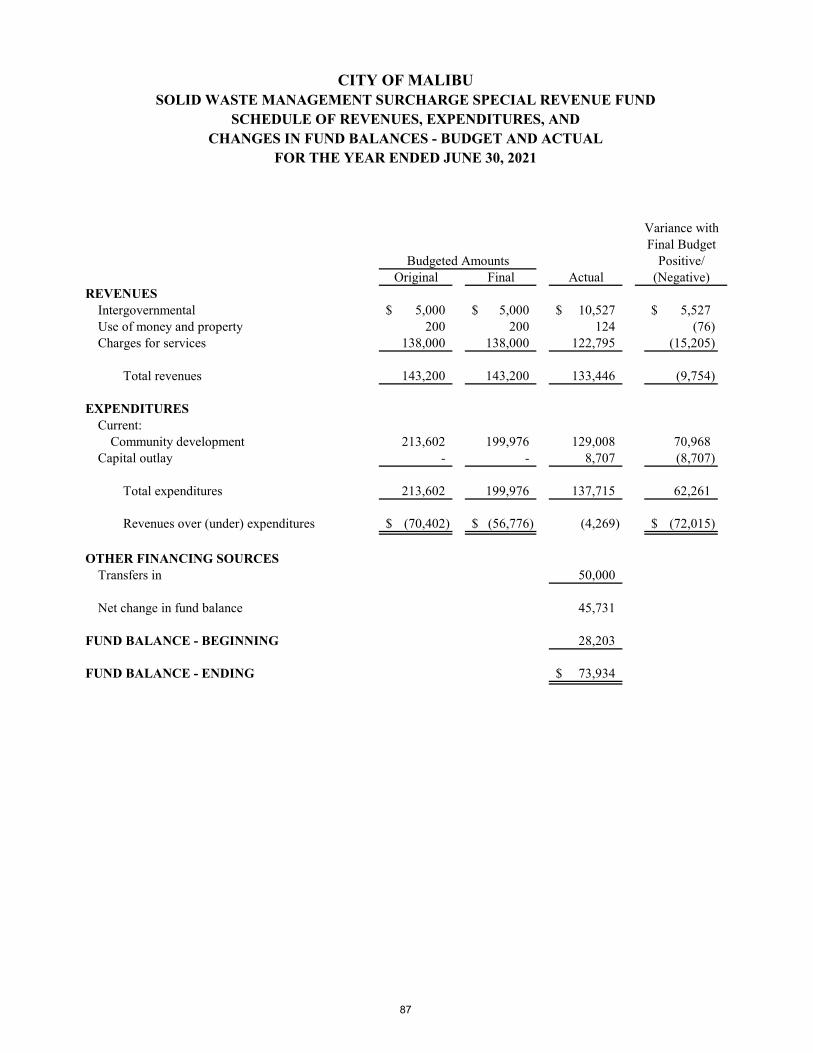
CITY OF MALIBUSOLID WASTE MANAGEMENT SURCHARGE SPECIAL REVENUE FUND
SCHEDULE OF REVENUES, EXPENDITURES, ANDCHANGES IN FUND BALANCES - BUDGET AND ACTUAL
FOR THE YEAR ENDED JUNE 30, 2021
Budgeted AmountsOriginal Final Actual
REVENUESIntergovernmental 5,000$ 5,000$ 10,527$ 5,527$ Use of money and property 200 200 124 (76) Charges for services 138,000 138,000 122,795 (15,205)
Total revenues 143,200 143,200 133,446 (9,754)
EXPENDITURESCurrent:
Community development 213,602 199,976 129,008 70,968 Capital outlay - - 8,707 (8,707)
Total expenditures 213,602 199,976 137,715 62,261
Revenues over (under) expenditures (70,402)$ (56,776)$ (4,269) (72,015)$
OTHER FINANCING SOURCESTransfers in 50,000
Net change in fund balance 45,731
FUND BALANCE - BEGINNING 28,203
FUND BALANCE - ENDING 73,934$
Final BudgetPositive/
(Negative)
Variance with
87
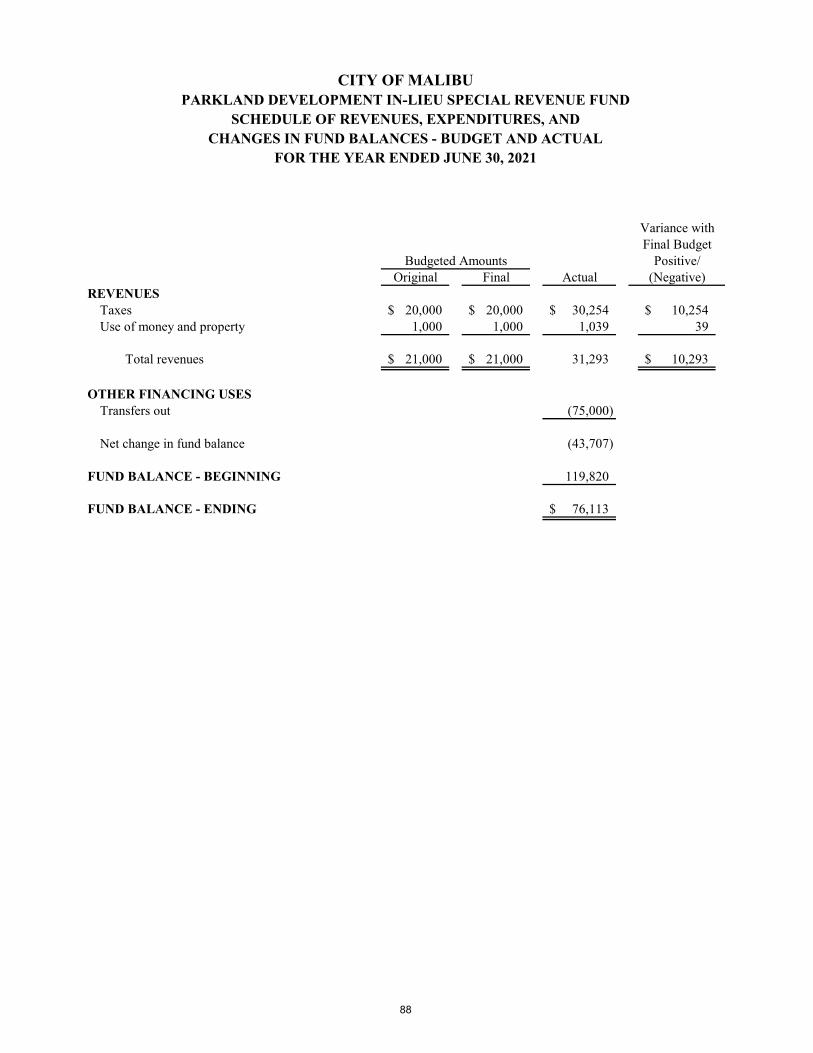
CITY OF MALIBUPARKLAND DEVELOPMENT IN-LIEU SPECIAL REVENUE FUND
SCHEDULE OF REVENUES, EXPENDITURES, ANDCHANGES IN FUND BALANCES - BUDGET AND ACTUAL
FOR THE YEAR ENDED JUNE 30, 2021
Budgeted AmountsOriginal Final Actual
REVENUESTaxes 20,000$ 20,000$ 30,254$ 10,254$ Use of money and property 1,000 1,000 1,039 39
Total revenues 21,000$ 21,000$ 31,293 10,293$
OTHER FINANCING USESTransfers out (75,000)
Net change in fund balance (43,707)
FUND BALANCE - BEGINNING 119,820
FUND BALANCE - ENDING 76,113$
Final BudgetPositive/
(Negative)
Variance with
88
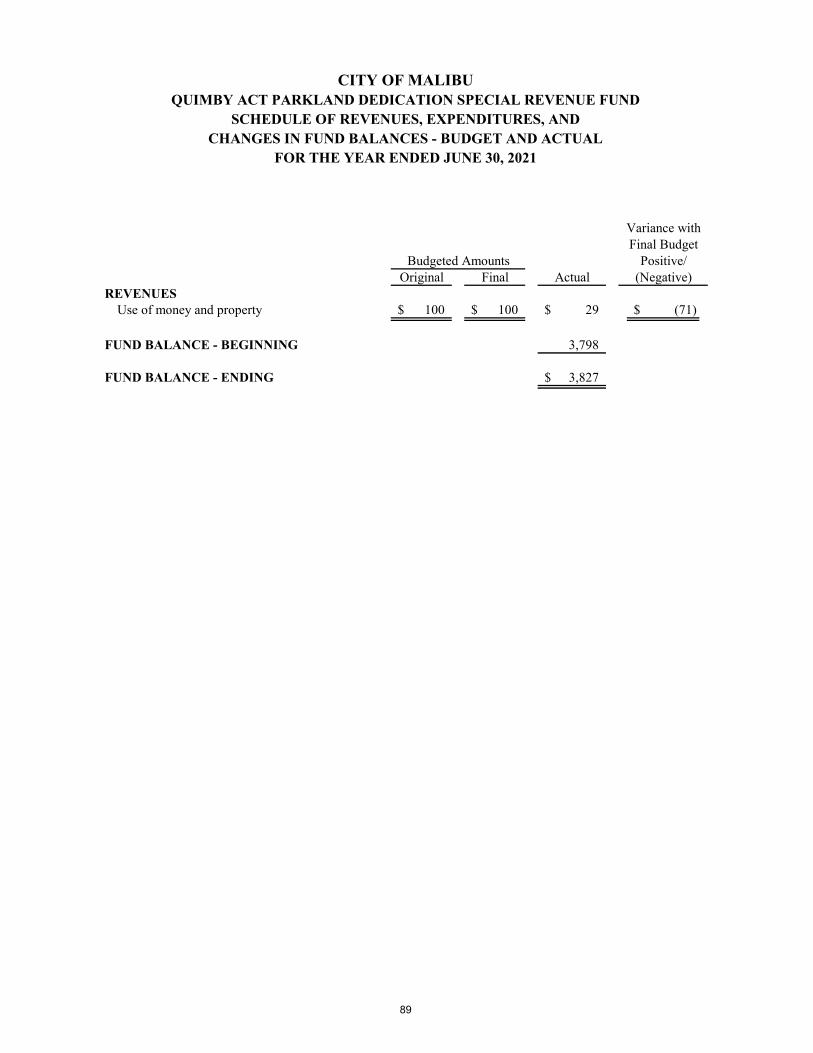
CITY OF MALIBUQUIMBY ACT PARKLAND DEDICATION SPECIAL REVENUE FUND
SCHEDULE OF REVENUES, EXPENDITURES, ANDCHANGES IN FUND BALANCES - BUDGET AND ACTUAL
FOR THE YEAR ENDED JUNE 30, 2021
Budgeted AmountsOriginal Final Actual
REVENUESUse of money and property 100$ 100$ 29$ (71)$
FUND BALANCE - BEGINNING 3,798
FUND BALANCE - ENDING 3,827$
Final BudgetPositive/
(Negative)
Variance with
89
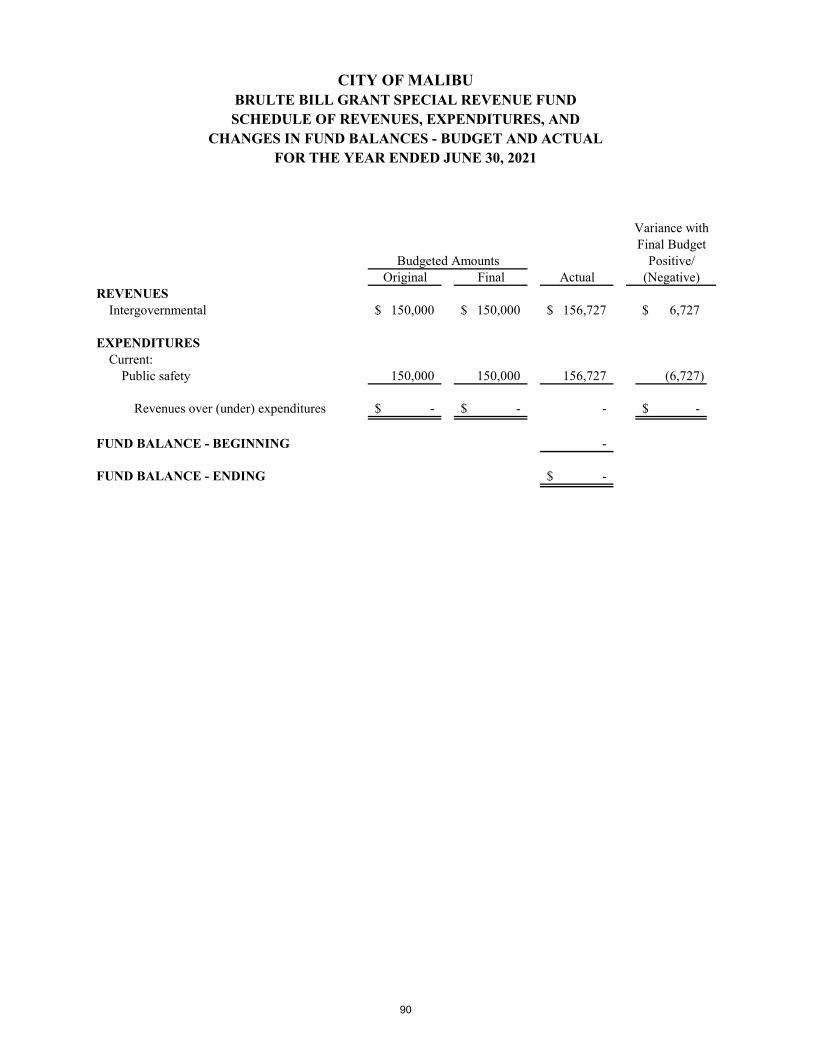
CITY OF MALIBUBRULTE BILL GRANT SPECIAL REVENUE FUNDSCHEDULE OF REVENUES, EXPENDITURES, AND
CHANGES IN FUND BALANCES - BUDGET AND ACTUALFOR THE YEAR ENDED JUNE 30, 2021
Budgeted AmountsOriginal Final Actual
REVENUESIntergovernmental 150,000$ 150,000$ 156,727$ 6,727$
EXPENDITURESCurrent:
Public safety 150,000 150,000 156,727 (6,727)
Revenues over (under) expenditures -$ -$ - -$
FUND BALANCE - BEGINNING -
FUND BALANCE - ENDING -$
Final BudgetPositive/
(Negative)
Variance with
90
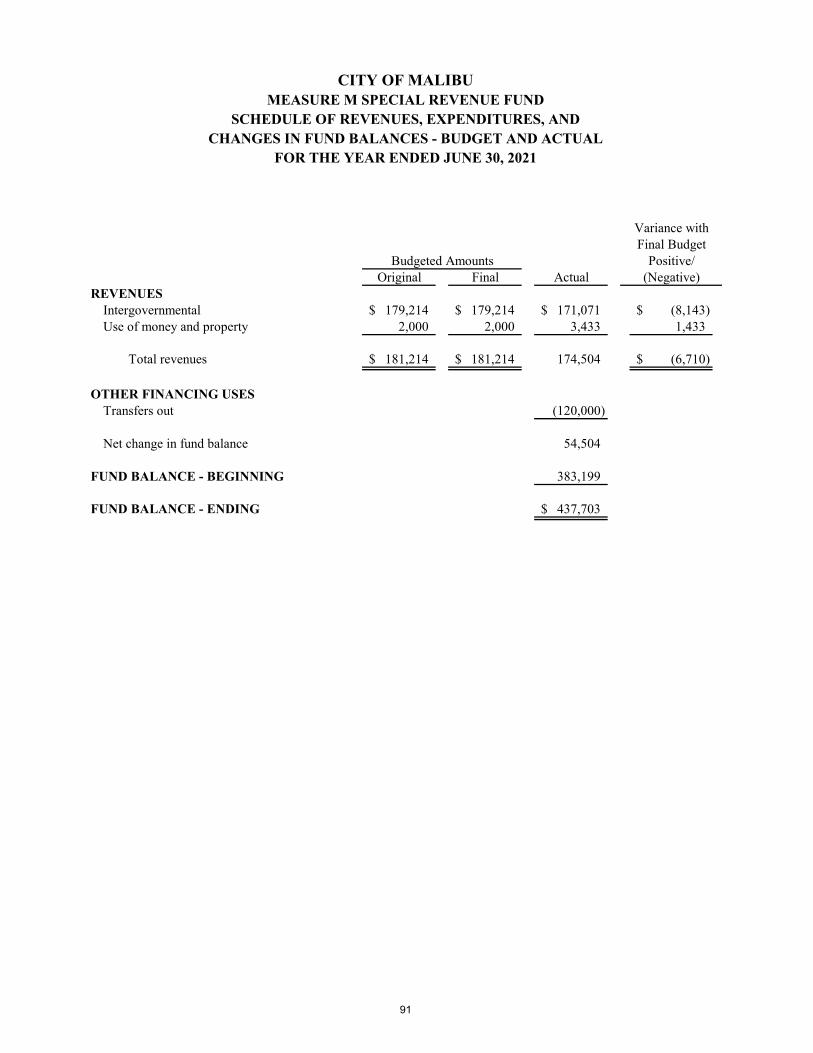
CITY OF MALIBUMEASURE M SPECIAL REVENUE FUND
SCHEDULE OF REVENUES, EXPENDITURES, ANDCHANGES IN FUND BALANCES - BUDGET AND ACTUAL
FOR THE YEAR ENDED JUNE 30, 2021
Budgeted AmountsOriginal Final Actual
REVENUESIntergovernmental 179,214$ 179,214$ 171,071$ (8,143)$ Use of money and property 2,000 2,000 3,433 1,433
Total revenues 181,214$ 181,214$ 174,504 (6,710)$
OTHER FINANCING USESTransfers out (120,000)
Net change in fund balance 54,504
FUND BALANCE - BEGINNING 383,199
FUND BALANCE - ENDING 437,703$
Variance withFinal Budget
Positive/(Negative)
91
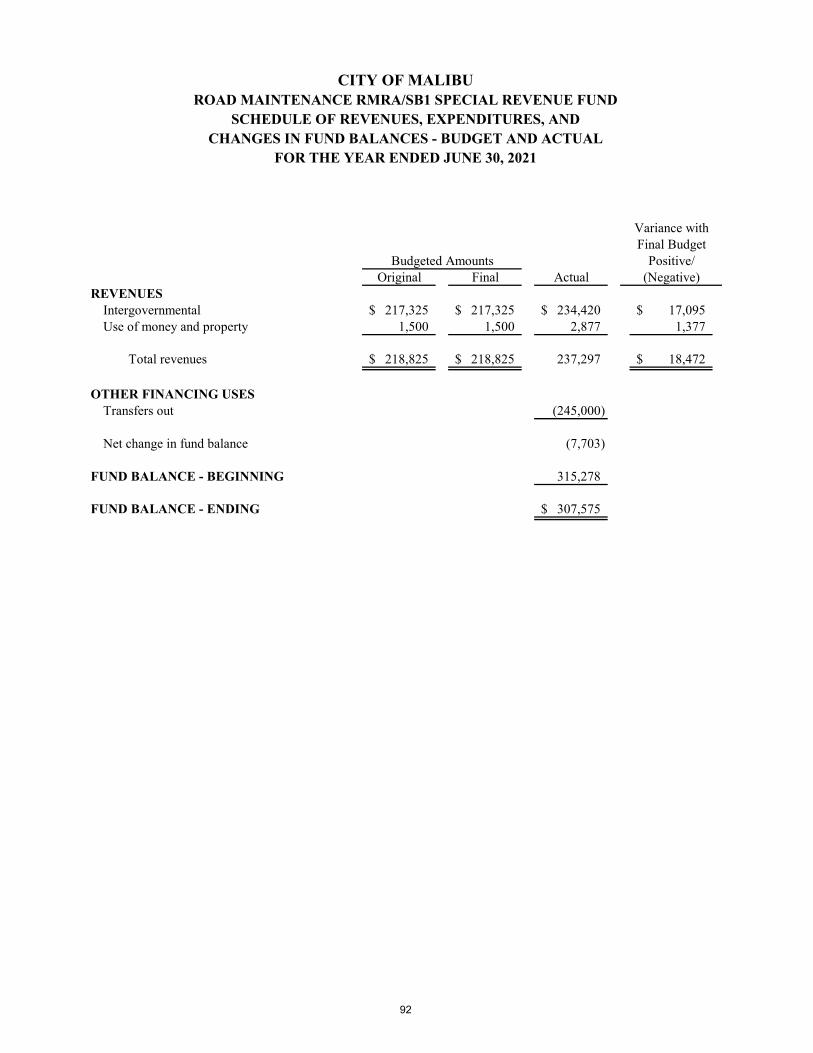
CITY OF MALIBUROAD MAINTENANCE RMRA/SB1 SPECIAL REVENUE FUND
SCHEDULE OF REVENUES, EXPENDITURES, ANDCHANGES IN FUND BALANCES - BUDGET AND ACTUAL
FOR THE YEAR ENDED JUNE 30, 2021
Budgeted AmountsOriginal Final Actual
REVENUESIntergovernmental 217,325$ 217,325$ 234,420$ 17,095$ Use of money and property 1,500 1,500 2,877 1,377
Total revenues 218,825$ 218,825$ 237,297 18,472$
OTHER FINANCING USESTransfers out (245,000)
Net change in fund balance (7,703)
FUND BALANCE - BEGINNING 315,278
FUND BALANCE - ENDING 307,575$
Variance withFinal Budget
Positive/(Negative)
92
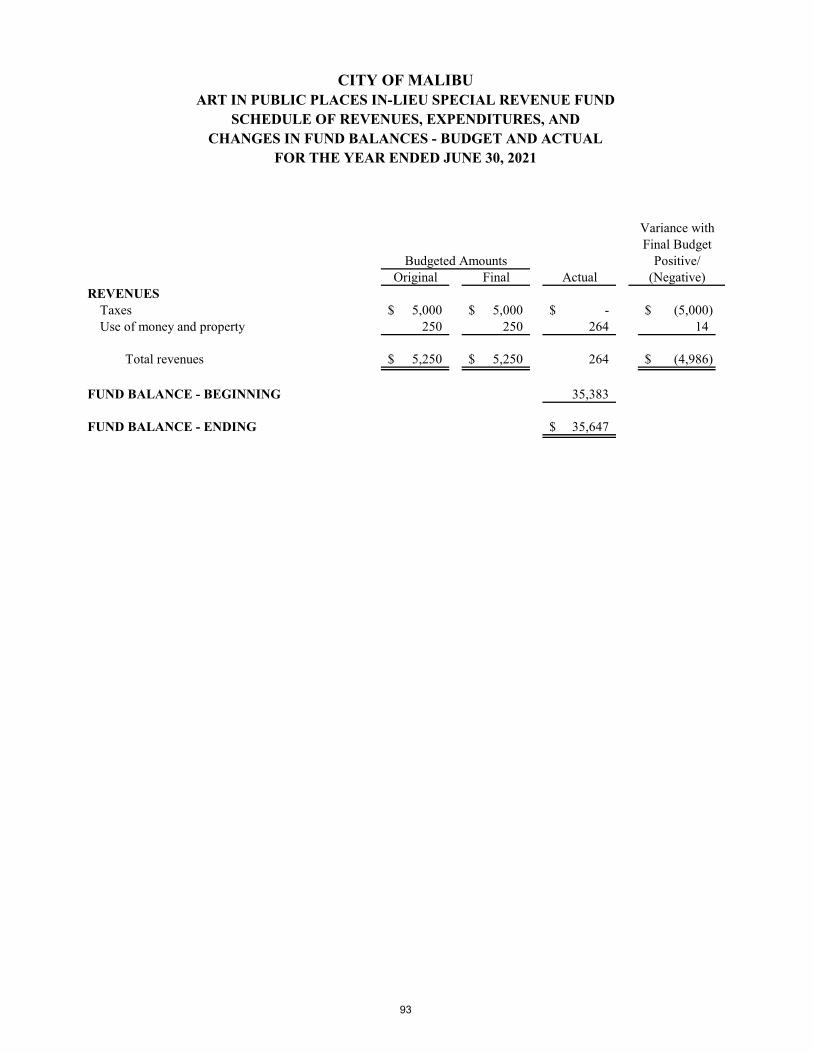
CITY OF MALIBUART IN PUBLIC PLACES IN-LIEU SPECIAL REVENUE FUND
SCHEDULE OF REVENUES, EXPENDITURES, ANDCHANGES IN FUND BALANCES - BUDGET AND ACTUAL
FOR THE YEAR ENDED JUNE 30, 2021
Budgeted AmountsOriginal Final Actual
REVENUESTaxes 5,000$ 5,000$ -$ (5,000)$ Use of money and property 250 250 264 14
Total revenues 5,250$ 5,250$ 264 (4,986)$
FUND BALANCE - BEGINNING 35,383
FUND BALANCE - ENDING 35,647$
Variance withFinal Budget
Positive/(Negative)
93
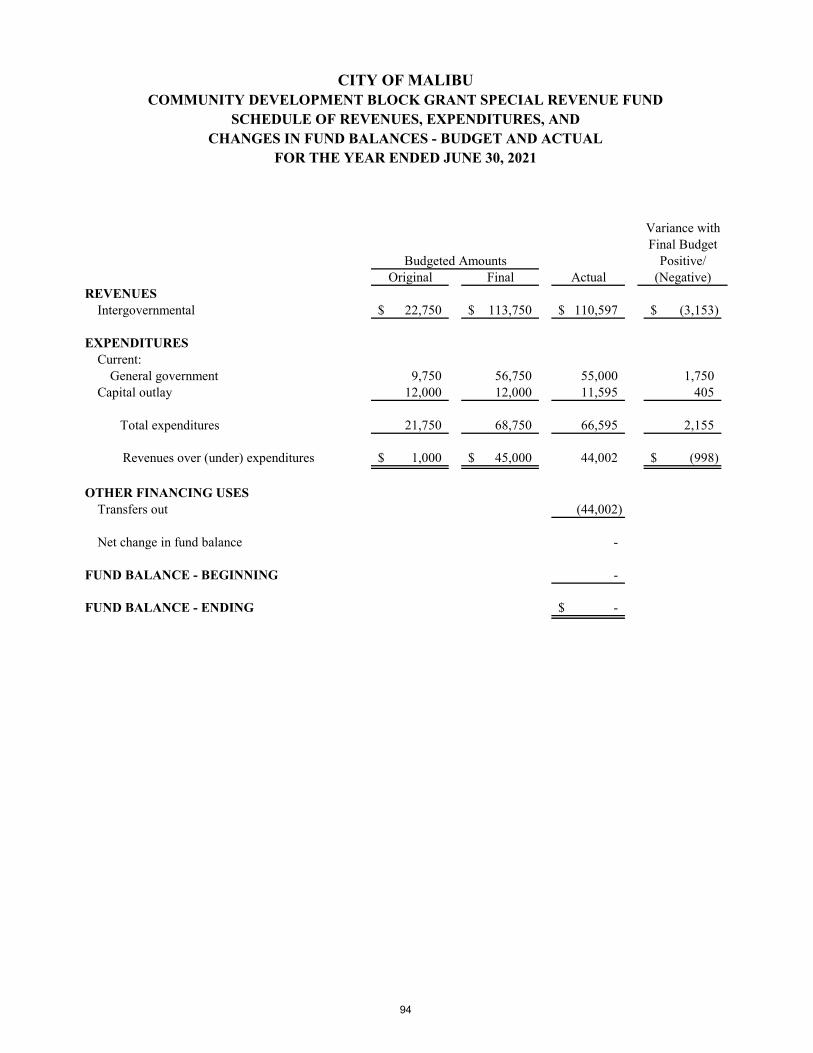
CITY OF MALIBUCOMMUNITY DEVELOPMENT BLOCK GRANT SPECIAL REVENUE FUND
SCHEDULE OF REVENUES, EXPENDITURES, ANDCHANGES IN FUND BALANCES - BUDGET AND ACTUAL
FOR THE YEAR ENDED JUNE 30, 2021
Budgeted AmountsOriginal Final Actual
REVENUESIntergovernmental 22,750$ 113,750$ 110,597$ (3,153)$
EXPENDITURESCurrent:
General government 9,750 56,750 55,000 1,750 Capital outlay 12,000 12,000 11,595 405
Total expenditures 21,750 68,750 66,595 2,155
Revenues over (under) expenditures 1,000$ 45,000$ 44,002 (998)$
OTHER FINANCING USESTransfers out (44,002)
Net change in fund balance -
FUND BALANCE - BEGINNING -
FUND BALANCE - ENDING -$
Final BudgetPositive/
(Negative)
Variance with
94

CITY OF MALIBUMEASURE W SPECIAL REVENUE FUND
SCHEDULE OF REVENUES, EXPENDITURES, ANDCHANGES IN FUND BALANCES - BUDGET AND ACTUAL
FOR THE YEAR ENDED JUNE 30, 2021
Budgeted AmountsOriginal Final Actual
REVENUESIntergovernmental 390,000$ 390,000$ 379,622$ (10,378)$ Use of money and property 100 100 1,023 923
Total revenues 390,100$ 390,100$ 380,645 (9,455)$
OTHER FINANCING USESTransfers out (192,658)
Net change in fund balance 187,987
FUND BALANCE - BEGINNING -
FUND BALANCE - ENDING 187,987$
Variance withFinal Budget
Positive/(Negative)
95
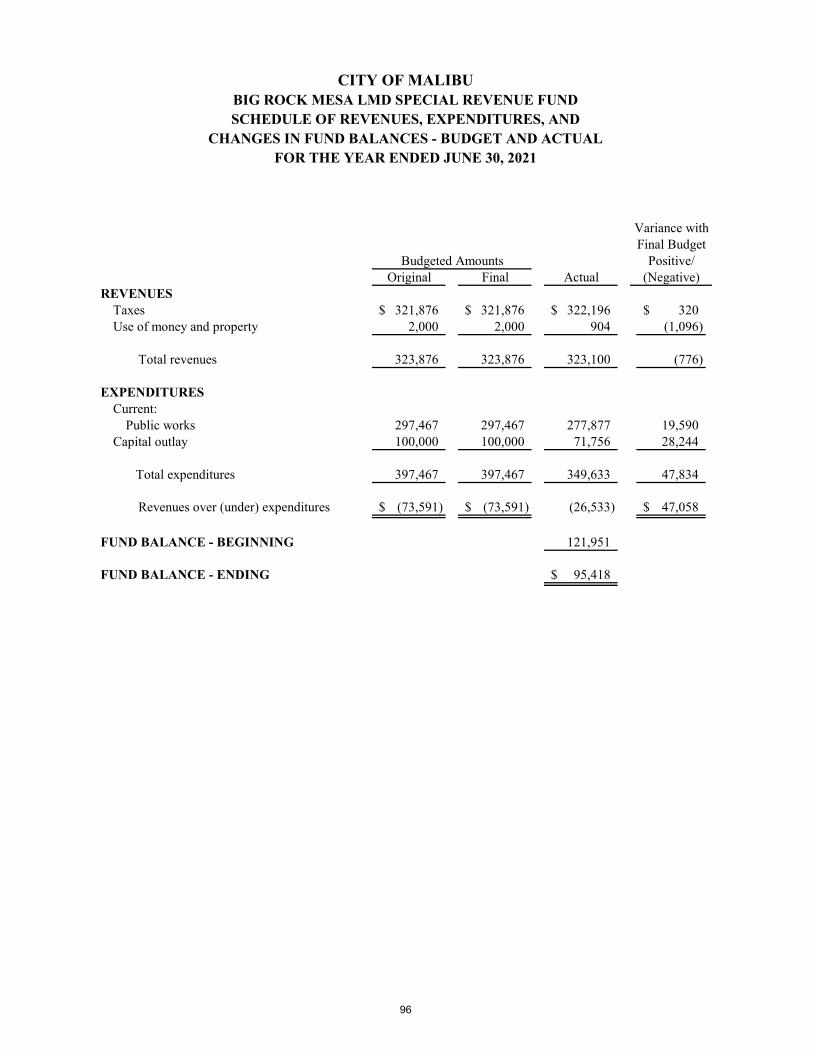
CITY OF MALIBUBIG ROCK MESA LMD SPECIAL REVENUE FUNDSCHEDULE OF REVENUES, EXPENDITURES, AND
CHANGES IN FUND BALANCES - BUDGET AND ACTUALFOR THE YEAR ENDED JUNE 30, 2021
Budgeted AmountsOriginal Final Actual
REVENUESTaxes 321,876$ 321,876$ 322,196$ 320$ Use of money and property 2,000 2,000 904 (1,096)
Total revenues 323,876 323,876 323,100 (776)
EXPENDITURESCurrent:
Public works 297,467 297,467 277,877 19,590 Capital outlay 100,000 100,000 71,756 28,244
Total expenditures 397,467 397,467 349,633 47,834
Revenues over (under) expenditures (73,591)$ (73,591)$ (26,533) 47,058$
FUND BALANCE - BEGINNING 121,951
FUND BALANCE - ENDING 95,418$
Final BudgetPositive/
(Negative)
Variance with
96
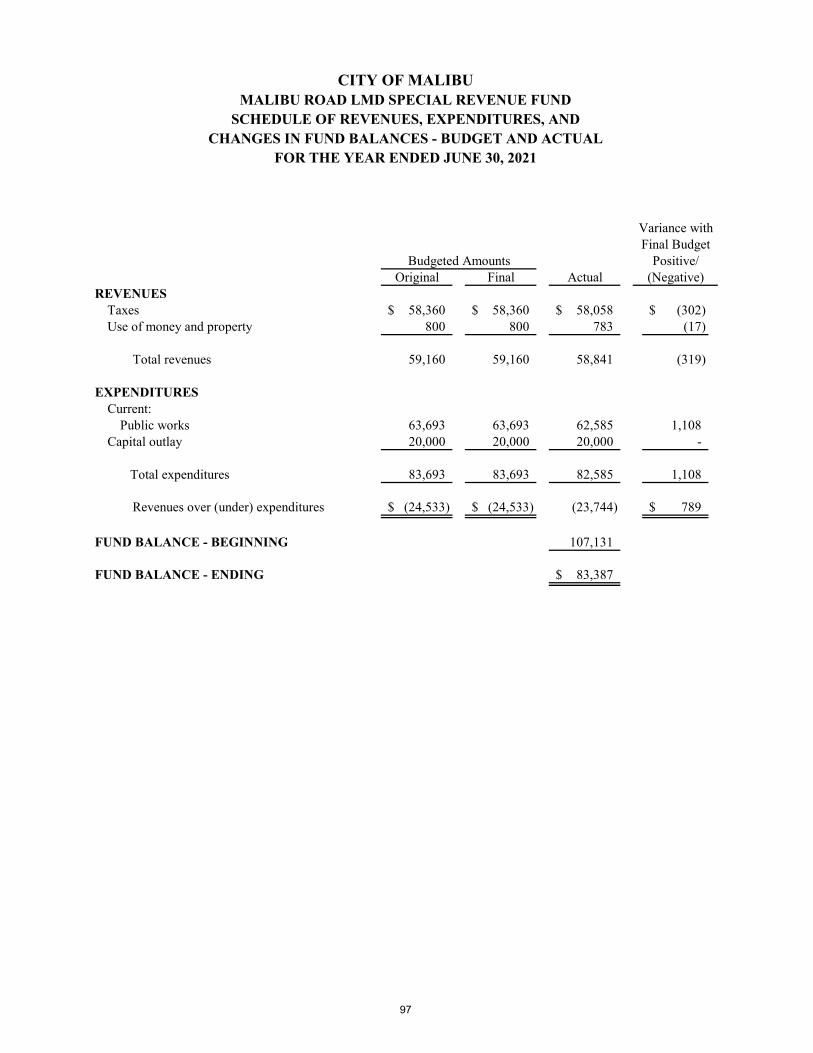
CITY OF MALIBUMALIBU ROAD LMD SPECIAL REVENUE FUND
SCHEDULE OF REVENUES, EXPENDITURES, ANDCHANGES IN FUND BALANCES - BUDGET AND ACTUAL
FOR THE YEAR ENDED JUNE 30, 2021
Budgeted AmountsOriginal Final Actual
REVENUESTaxes 58,360$ 58,360$ 58,058$ (302)$ Use of money and property 800 800 783 (17)
Total revenues 59,160 59,160 58,841 (319)
EXPENDITURESCurrent:
Public works 63,693 63,693 62,585 1,108 Capital outlay 20,000 20,000 20,000 -
Total expenditures 83,693 83,693 82,585 1,108
Revenues over (under) expenditures (24,533)$ (24,533)$ (23,744) 789$
FUND BALANCE - BEGINNING 107,131
FUND BALANCE - ENDING 83,387$
Final BudgetPositive/
(Negative)
Variance with
97
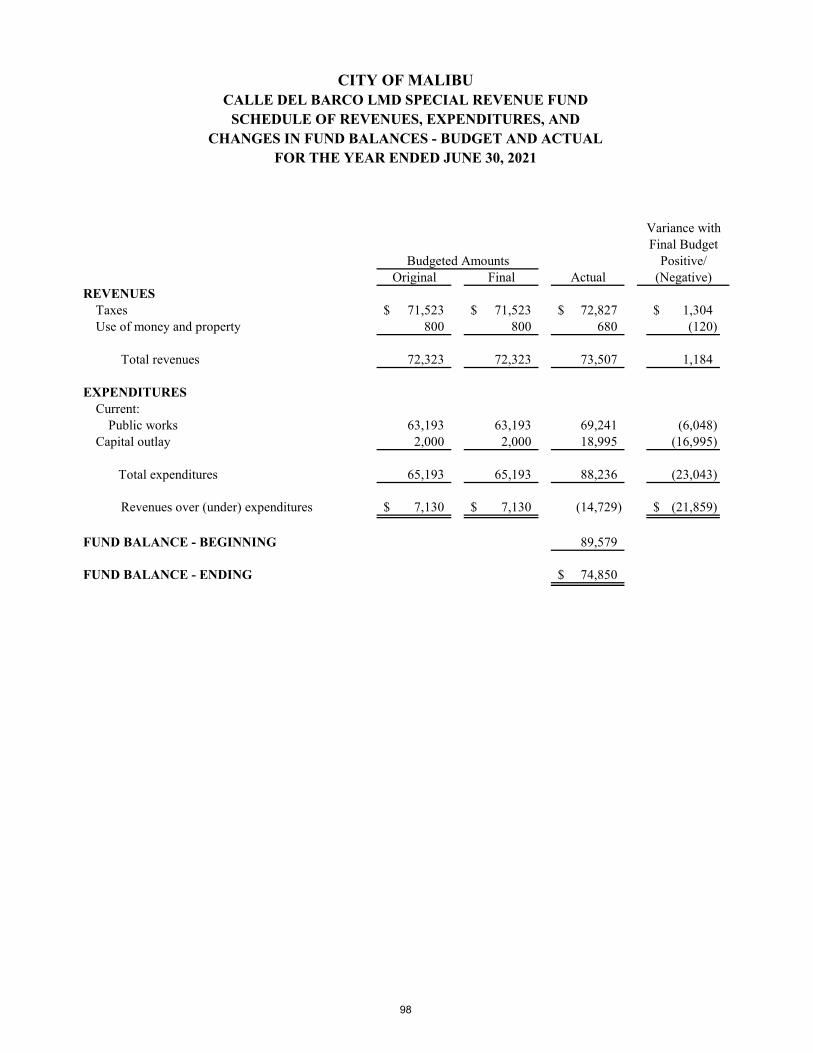
CITY OF MALIBUCALLE DEL BARCO LMD SPECIAL REVENUE FUND
SCHEDULE OF REVENUES, EXPENDITURES, ANDCHANGES IN FUND BALANCES - BUDGET AND ACTUAL
FOR THE YEAR ENDED JUNE 30, 2021
Budgeted AmountsOriginal Final Actual
REVENUESTaxes 71,523$ 71,523$ 72,827$ 1,304$ Use of money and property 800 800 680 (120)
Total revenues 72,323 72,323 73,507 1,184
EXPENDITURESCurrent:
Public works 63,193 63,193 69,241 (6,048) Capital outlay 2,000 2,000 18,995 (16,995)
Total expenditures 65,193 65,193 88,236 (23,043)
Revenues over (under) expenditures 7,130$ 7,130$ (14,729) (21,859)$
FUND BALANCE - BEGINNING 89,579
FUND BALANCE - ENDING 74,850$
Final BudgetPositive/
(Negative)
Variance with
98
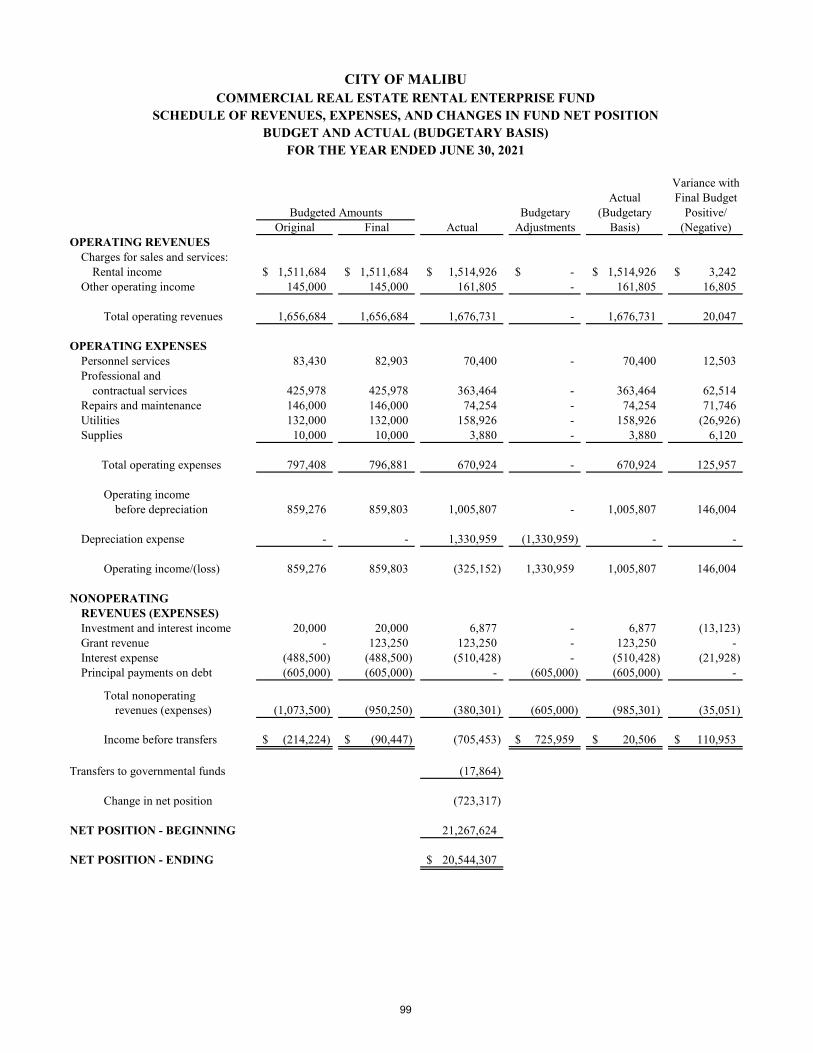
CITY OF MALIBUCOMMERCIAL REAL ESTATE RENTAL ENTERPRISE FUND
SCHEDULE OF REVENUES, EXPENSES, AND CHANGES IN FUND NET POSITIONBUDGET AND ACTUAL (BUDGETARY BASIS)
FOR THE YEAR ENDED JUNE 30, 2021
Variance withActual Final Budget
Budgeted Amounts Budgetary (Budgetary Positive/Original Final Actual Adjustments Basis) (Negative)
OPERATING REVENUESCharges for sales and services:
Rental income 1,511,684$ 1,511,684$ 1,514,926$ -$ 1,514,926$ 3,242$ Other operating income 145,000 145,000 161,805 - 161,805 16,805
Total operating revenues 1,656,684 1,656,684 1,676,731 - 1,676,731 20,047
OPERATING EXPENSESPersonnel services 83,430 82,903 70,400 - 70,400 12,503 Professional and
contractual services 425,978 425,978 363,464 - 363,464 62,514 Repairs and maintenance 146,000 146,000 74,254 - 74,254 71,746 Utilities 132,000 132,000 158,926 - 158,926 (26,926) Supplies 10,000 10,000 3,880 - 3,880 6,120
Total operating expenses 797,408 796,881 670,924 - 670,924 125,957
Operating incomebefore depreciation 859,276 859,803 1,005,807 - 1,005,807 146,004
Depreciation expense - - 1,330,959 (1,330,959) - -
Operating income/(loss) 859,276 859,803 (325,152) 1,330,959 1,005,807 146,004
NONOPERATINGREVENUES (EXPENSES)Investment and interest income 20,000 20,000 6,877 - 6,877 (13,123) Grant revenue - 123,250 123,250 - 123,250 - Interest expense (488,500) (488,500) (510,428) - (510,428) (21,928) Principal payments on debt (605,000) (605,000) - (605,000) (605,000) -
Total nonoperatingrevenues (expenses) (1,073,500) (950,250) (380,301) (605,000) (985,301) (35,051)
Income before transfers (214,224)$ (90,447)$ (705,453) 725,959$ 20,506$ 110,953$
Transfers to governmental funds (17,864)
Change in net position (723,317)
NET POSITION - BEGINNING 21,267,624
NET POSITION - ENDING 20,544,307$
99
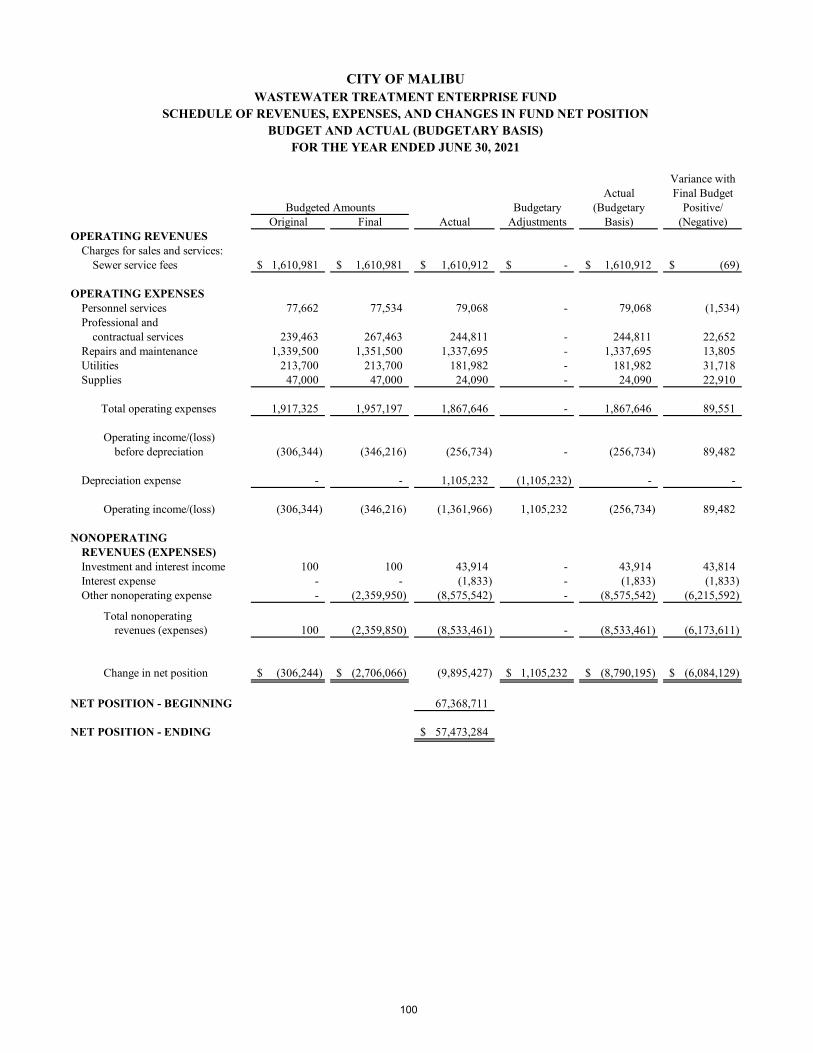
CITY OF MALIBUWASTEWATER TREATMENT ENTERPRISE FUND
SCHEDULE OF REVENUES, EXPENSES, AND CHANGES IN FUND NET POSITIONBUDGET AND ACTUAL (BUDGETARY BASIS)
FOR THE YEAR ENDED JUNE 30, 2021
Variance withActual Final Budget
Budgeted Amounts Budgetary (Budgetary Positive/Original Final Actual Adjustments Basis) (Negative)
OPERATING REVENUESCharges for sales and services:
Sewer service fees 1,610,981$ 1,610,981$ 1,610,912$ -$ 1,610,912$ (69)$
OPERATING EXPENSESPersonnel services 77,662 77,534 79,068 - 79,068 (1,534) Professional and
contractual services 239,463 267,463 244,811 - 244,811 22,652 Repairs and maintenance 1,339,500 1,351,500 1,337,695 - 1,337,695 13,805 Utilities 213,700 213,700 181,982 - 181,982 31,718 Supplies 47,000 47,000 24,090 - 24,090 22,910
Total operating expenses 1,917,325 1,957,197 1,867,646 - 1,867,646 89,551
Operating income/(loss)before depreciation (306,344) (346,216) (256,734) - (256,734) 89,482
Depreciation expense - - 1,105,232 (1,105,232) - -
Operating income/(loss) (306,344) (346,216) (1,361,966) 1,105,232 (256,734) 89,482
NONOPERATINGREVENUES (EXPENSES)Investment and interest income 100 100 43,914 - 43,914 43,814 Interest expense - - (1,833) - (1,833) (1,833) Other nonoperating expense - (2,359,950) (8,575,542) - (8,575,542) (6,215,592)
Total nonoperatingrevenues (expenses) 100 (2,359,850) (8,533,461) - (8,533,461) (6,173,611)
Change in net position (306,244)$ (2,706,066)$ (9,895,427) 1,105,232$ (8,790,195)$ (6,084,129)$
NET POSITION - BEGINNING 67,368,711
NET POSITION - ENDING 57,473,284$
100
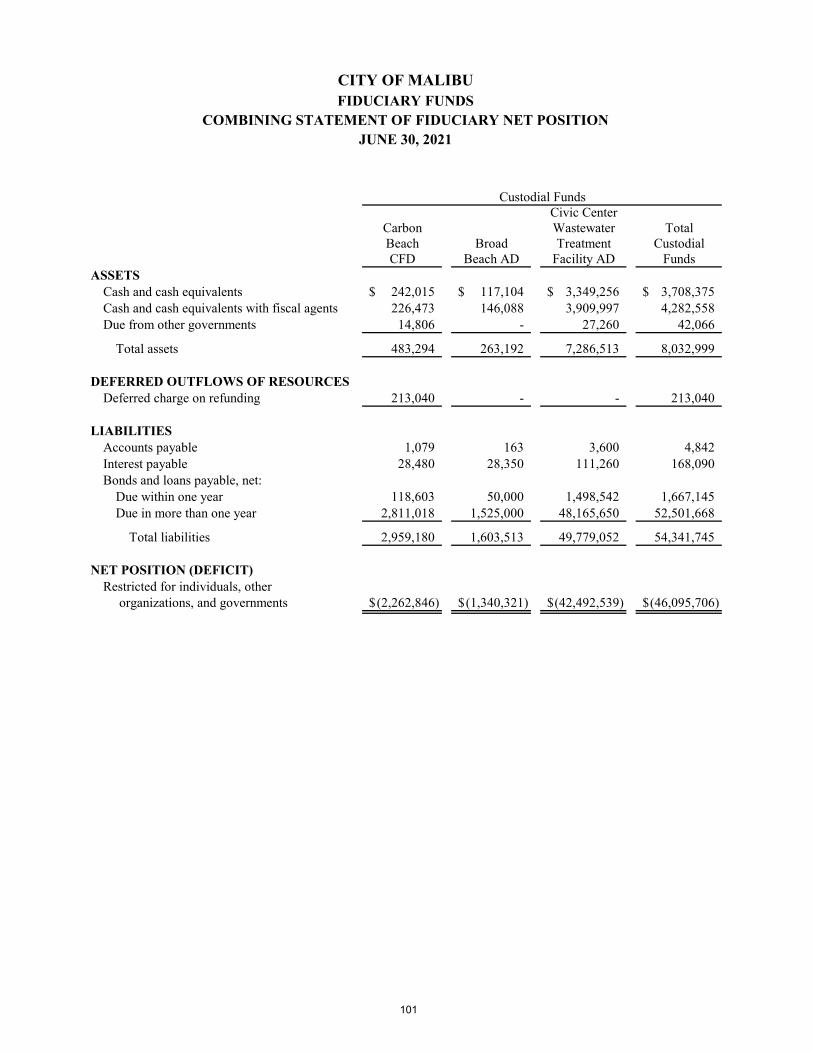
CITY OF MALIBUFIDUCIARY FUNDS
COMBINING STATEMENT OF FIDUCIARY NET POSITIONJUNE 30, 2021
Custodial FundsCivic Center
Carbon Wastewater TotalBeach Broad Treatment CustodialCFD Beach AD Facility AD Funds
ASSETSCash and cash equivalents 242,015$ 117,104$ 3,349,256$ 3,708,375$ Cash and cash equivalents with fiscal agents 226,473 146,088 3,909,997 4,282,558 Due from other governments 14,806 - 27,260 42,066
Total assets 483,294 263,192 7,286,513 8,032,999
DEFERRED OUTFLOWS OF RESOURCESDeferred charge on refunding 213,040 - - 213,040
LIABILITIESAccounts payable 1,079 163 3,600 4,842 Interest payable 28,480 28,350 111,260 168,090 Bonds and loans payable, net:
Due within one year 118,603 50,000 1,498,542 1,667,145 Due in more than one year 2,811,018 1,525,000 48,165,650 52,501,668
Total liabilities 2,959,180 1,603,513 49,779,052 54,341,745
NET POSITION (DEFICIT)Restricted for individuals, other
organizations, and governments (2,262,846)$ (1,340,321)$ (42,492,539)$ (46,095,706)$
101
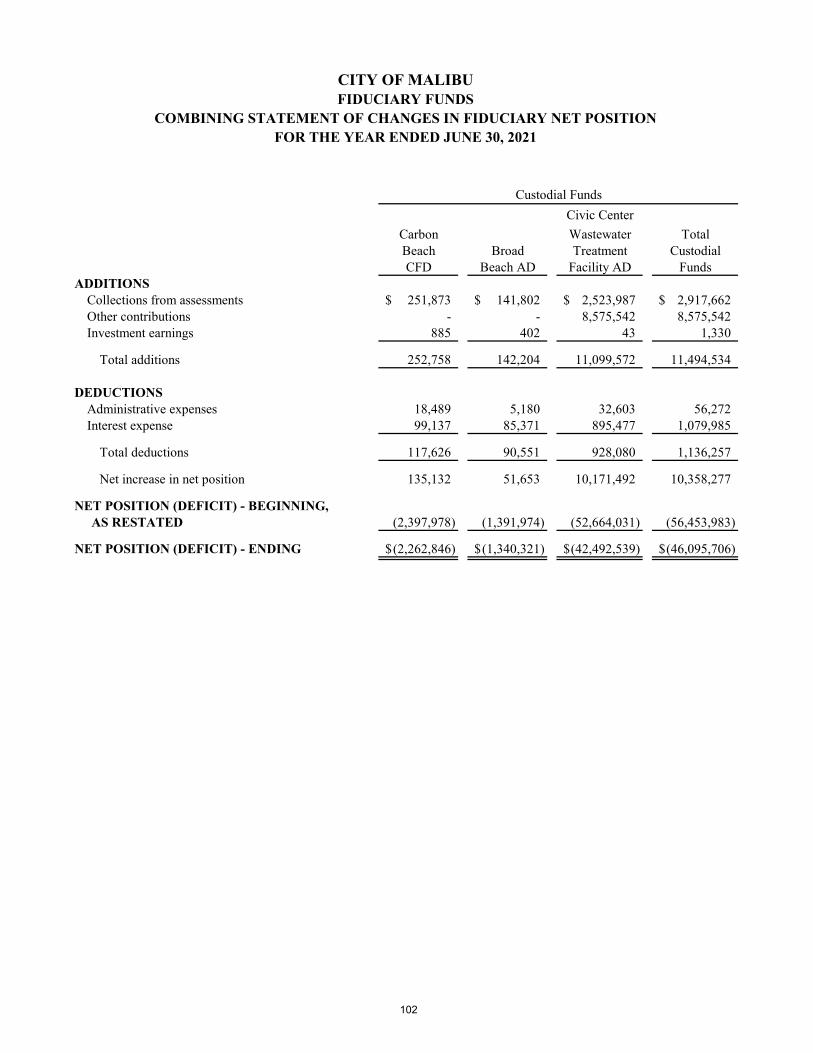
CITY OF MALIBUFIDUCIARY FUNDS
COMBINING STATEMENT OF CHANGES IN FIDUCIARY NET POSITIONFOR THE YEAR ENDED JUNE 30, 2021
Custodial FundsCivic Center
Carbon Wastewater TotalBeach Broad Treatment CustodialCFD Beach AD Facility AD Funds
ADDITIONSCollections from assessments 251,873$ 141,802$ 2,523,987$ 2,917,662$ Other contributions - - 8,575,542 8,575,542 Investment earnings 885 402 43 1,330
Total additions 252,758 142,204 11,099,572 11,494,534
DEDUCTIONSAdministrative expenses 18,489 5,180 32,603 56,272 Interest expense 99,137 85,371 895,477 1,079,985
Total deductions 117,626 90,551 928,080 1,136,257
Net increase in net position 135,132 51,653 10,171,492 10,358,277
NET POSITION (DEFICIT) - BEGINNING,AS RESTATED (2,397,978) (1,391,974) (52,664,031) (56,453,983)
NET POSITION (DEFICIT) - ENDING (2,262,846)$ (1,340,321)$ (42,492,539)$ (46,095,706)$
102
STATISTICAL SECTION (UNAUDITED)
This part of the City of Malibu’s Annual Comprehensive Financial Report presents detailed information as a context for understanding what the information says about the government’s overall financial health. Contents Financial Trends These schedules contain trend information to help the reader understand how the
City’s financial performance and well-being have changed over time. Revenue Capacity
These schedules contain information to help the reader assess the City’s most significant local revenue source - property tax.
Debt Capacity These schedules present information to help the reader assess the affordability of the City’s current levels of outstanding debt and the City’s ability to issue additional debt in the future.
Demographic and Economic Information These schedules offer demographic and economic indicators to help the reader understand the environment within which the City’s financial activities take place. Data on the largest employers in the City is not currently available.
Operating Information These schedules contain service and infrastructure data to help the reader understand how the information in the City’s financial report relates to the services the City provides and the activities it performs.
Sources: Unless otherwise noted, the information in these schedules is derived from the Annual Comprehensive Financial Reports for the relevant year.


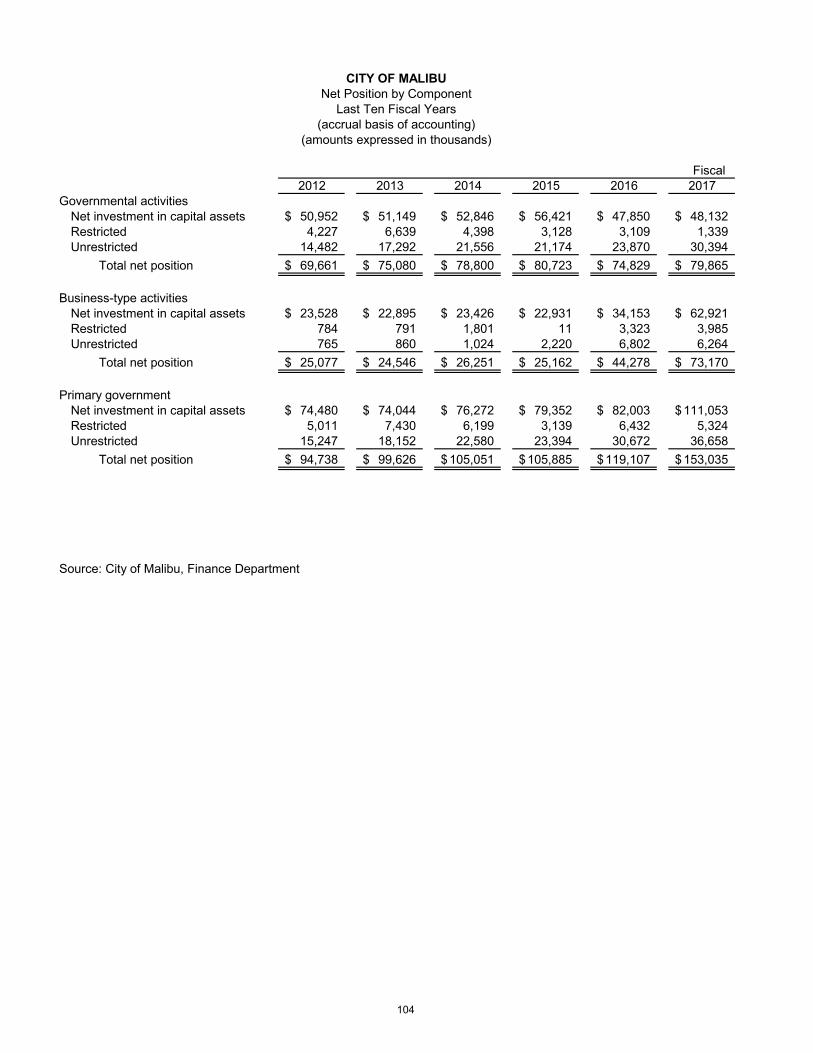
CITY OF MALIBUNet Position by Component
Last Ten Fiscal Years(accrual basis of accounting)
(amounts expressed in thousands)
Fiscal 2012 2013 2014 2015 2016 2017
Governmental activitiesNet investment in capital assets 50,952$ 51,149$ 52,846$ 56,421$ 47,850$ 48,132$ Restricted 4,227 6,639 4,398 3,128 3,109 1,339 Unrestricted 14,482 17,292 21,556 21,174 23,870 30,394 Total net position 69,661$ 75,080$ 78,800$ 80,723$ 74,829$ 79,865$
Business-type activitiesNet investment in capital assets 23,528$ 22,895$ 23,426$ 22,931$ 34,153$ 62,921$ Restricted 784 791 1,801 11 3,323 3,985 Unrestricted 765 860 1,024 2,220 6,802 6,264 Total net position 25,077$ 24,546$ 26,251$ 25,162$ 44,278$ 73,170$
Primary governmentNet investment in capital assets 74,480$ 74,044$ 76,272$ 79,352$ 82,003$ 111,053$ Restricted 5,011 7,430 6,199 3,139 6,432 5,324 Unrestricted 15,247 18,152 22,580 23,394 30,672 36,658 Total net position 94,738$ 99,626$ 105,051$ 105,885$ 119,107$ 153,035$
Source: City of Malibu, Finance Department
104
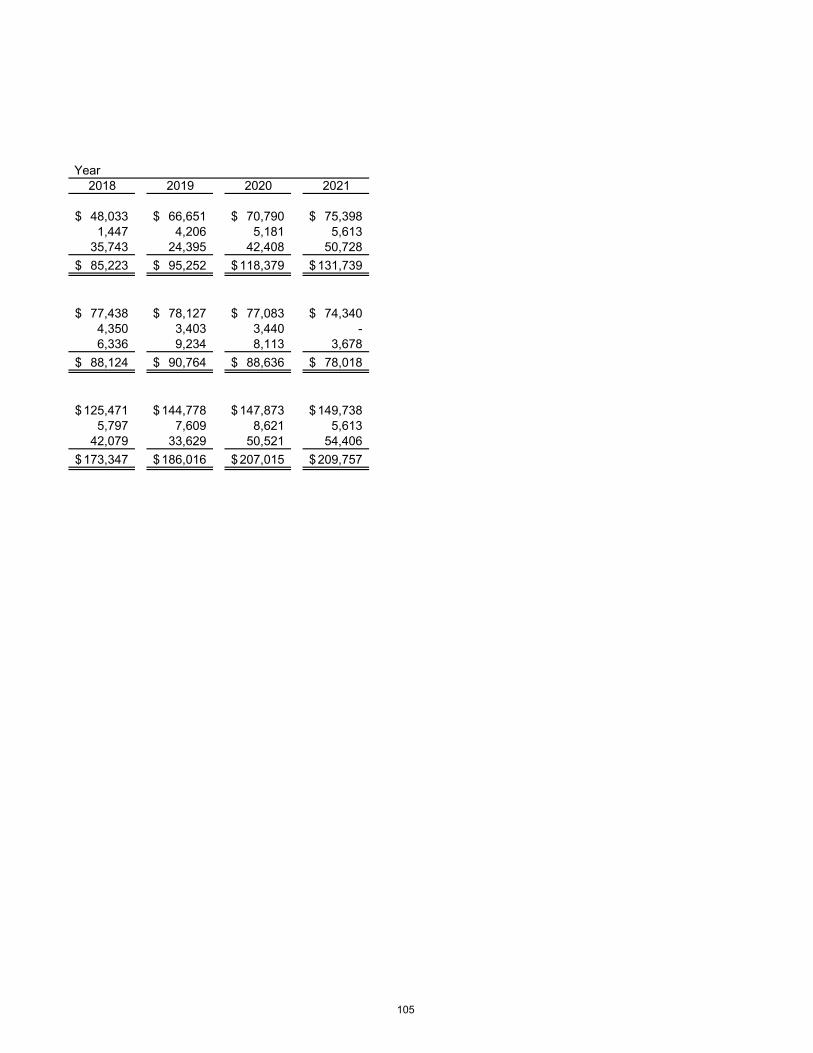
Year2018 2019 2020 2021
48,033$ 66,651$ 70,790$ 75,398$ 1,447 4,206 5,181 5,613
35,743 24,395 42,408 50,728 85,223$ 95,252$ 118,379$ 131,739$
77,438$ 78,127$ 77,083$ 74,340$ 4,350 3,403 3,440 - 6,336 9,234 8,113 3,678
88,124$ 90,764$ 88,636$ 78,018$
125,471$ 144,778$ 147,873$ 149,738$ 5,797 7,609 8,621 5,613
42,079 33,629 50,521 54,406 173,347$ 186,016$ 207,015$ 209,757$
105
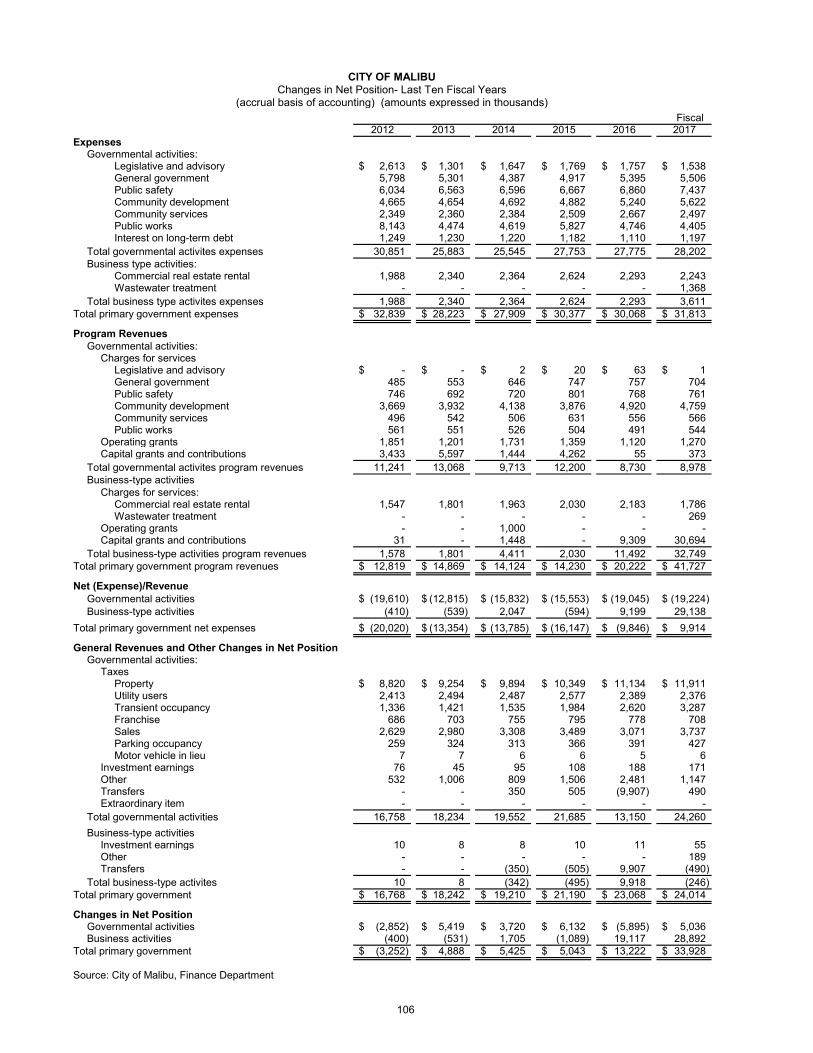
CITY OF MALIBUChanges in Net Position- Last Ten Fiscal Years
(accrual basis of accounting) (amounts expressed in thousands)Fiscal
2012 2013 2014 2015 2016 2017Expenses
Governmental activities:Legislative and advisory 2,613$ 1,301$ 1,647$ 1,769$ 1,757$ 1,538$ General government 5,798 5,301 4,387 4,917 5,395 5,506 Public safety 6,034 6,563 6,596 6,667 6,860 7,437 Community development 4,665 4,654 4,692 4,882 5,240 5,622 Community services 2,349 2,360 2,384 2,509 2,667 2,497 Public works 8,143 4,474 4,619 5,827 4,746 4,405 Interest on long-term debt 1,249 1,230 1,220 1,182 1,110 1,197
Total governmental activites expenses 30,851 25,883 25,545 27,753 27,775 28,202 Business type activities:
Commercial real estate rental 1,988 2,340 2,364 2,624 2,293 2,243 Wastewater treatment - - - - - 1,368
Total business type activites expenses 1,988 2,340 2,364 2,624 2,293 3,611 Total primary government expenses 32,839$ 28,223$ 27,909$ 30,377$ 30,068$ 31,813$
Program RevenuesGovernmental activities:
Charges for servicesLegislative and advisory -$ -$ 2$ 20$ 63$ 1$ General government 485 553 646 747 757 704 Public safety 746 692 720 801 768 761 Community development 3,669 3,932 4,138 3,876 4,920 4,759 Community services 496 542 506 631 556 566 Public works 561 551 526 504 491 544
Operating grants 1,851 1,201 1,731 1,359 1,120 1,270 Capital grants and contributions 3,433 5,597 1,444 4,262 55 373
Total governmental activites program revenues 11,241 13,068 9,713 12,200 8,730 8,978 Business-type activities
Charges for services:Commercial real estate rental 1,547 1,801 1,963 2,030 2,183 1,786 Wastewater treatment - - - - - 269
Operating grants - - 1,000 - - - Capital grants and contributions 31 - 1,448 - 9,309 30,694
Total business-type activities program revenues 1,578 1,801 4,411 2,030 11,492 32,749 Total primary government program revenues 12,819$ 14,869$ 14,124$ 14,230$ 20,222$ 41,727$
Net (Expense)/RevenueGovernmental activities (19,610)$ (12,815)$ (15,832)$ (15,553)$ (19,045)$ (19,224)$ Business-type activities (410) (539) 2,047 (594) 9,199 29,138
Total primary government net expenses (20,020)$ (13,354)$ (13,785)$ (16,147)$ (9,846)$ 9,914$
General Revenues and Other Changes in Net PositionGovernmental activities:
TaxesProperty 8,820$ 9,254$ 9,894$ 10,349$ 11,134$ 11,911$ Utility users 2,413 2,494 2,487 2,577 2,389 2,376 Transient occupancy 1,336 1,421 1,535 1,984 2,620 3,287 Franchise 686 703 755 795 778 708 Sales 2,629 2,980 3,308 3,489 3,071 3,737 Parking occupancy 259 324 313 366 391 427 Motor vehicle in lieu 7 7 6 6 5 6
Investment earnings 76 45 95 108 188 171 Other 532 1,006 809 1,506 2,481 1,147 Transfers - - 350 505 (9,907) 490 Extraordinary item - - - - - -
Total governmental activities 16,758 18,234 19,552 21,685 13,150 24,260 Business-type activities
Investment earnings 10 8 8 10 11 55 Other - - - - - 189 Transfers - - (350) (505) 9,907 (490)
Total business-type activites 10 8 (342) (495) 9,918 (246) Total primary government 16,768$ 18,242$ 19,210$ 21,190$ 23,068$ 24,014$
Changes in Net PositionGovernmental activities (2,852)$ 5,419$ 3,720$ 6,132$ (5,895)$ 5,036$ Business activities (400) (531) 1,705 (1,089) 19,117 28,892
Total primary government (3,252)$ 4,888$ 5,425$ 5,043$ 13,222$ 33,928$
Source: City of Malibu, Finance Department
106
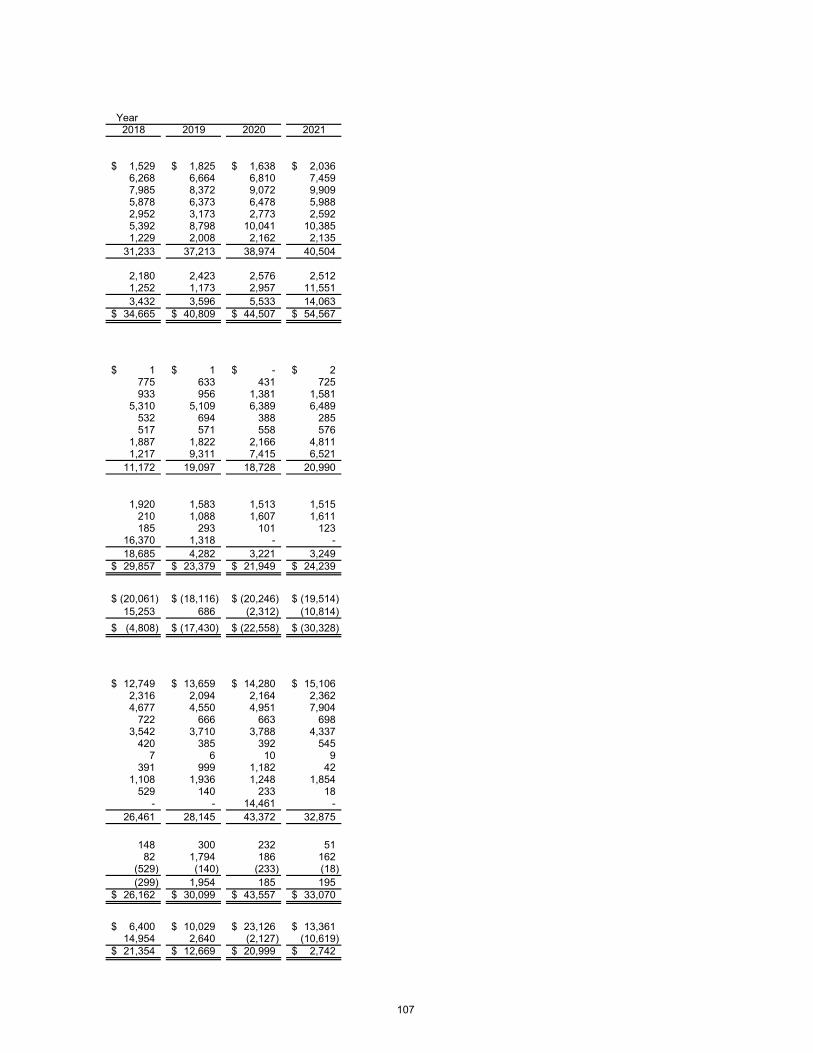
Year2018 2019 2020 2021
1,529$ 1,825$ 1,638$ 2,036$ 6,268 6,664 6,810 7,459 7,985 8,372 9,072 9,909 5,878 6,373 6,478 5,988 2,952 3,173 2,773 2,592 5,392 8,798 10,041 10,385 1,229 2,008 2,162 2,135
31,233 37,213 38,974 40,504
2,180 2,423 2,576 2,512 1,252 1,173 2,957 11,551 3,432 3,596 5,533 14,063
34,665$ 40,809$ 44,507$ 54,567$
1$ 1$ -$ 2$ 775 633 431 725 933 956 1,381 1,581
5,310 5,109 6,389 6,489 532 694 388 285 517 571 558 576
1,887 1,822 2,166 4,811 1,217 9,311 7,415 6,521
11,172 19,097 18,728 20,990
1,920 1,583 1,513 1,515 210 1,088 1,607 1,611 185 293 101 123
16,370 1,318 - - 18,685 4,282 3,221 3,249 29,857$ 23,379$ 21,949$ 24,239$
(20,061)$ (18,116)$ (20,246)$ (19,514)$ 15,253 686 (2,312) (10,814) (4,808)$ (17,430)$ (22,558)$ (30,328)$
12,749$ 13,659$ 14,280$ 15,106$ 2,316 2,094 2,164 2,362 4,677 4,550 4,951 7,904
722 666 663 698 3,542 3,710 3,788 4,337
420 385 392 545 7 6 10 9
391 999 1,182 42 1,108 1,936 1,248 1,854
529 140 233 18 - - 14,461 -
26,461 28,145 43,372 32,875
148 300 232 51 82 1,794 186 162
(529) (140) (233) (18) (299) 1,954 185 195
26,162$ 30,099$ 43,557$ 33,070$
6,400$ 10,029$ 23,126$ 13,361$ 14,954 2,640 (2,127) (10,619) 21,354$ 12,669$ 20,999$ 2,742$
107
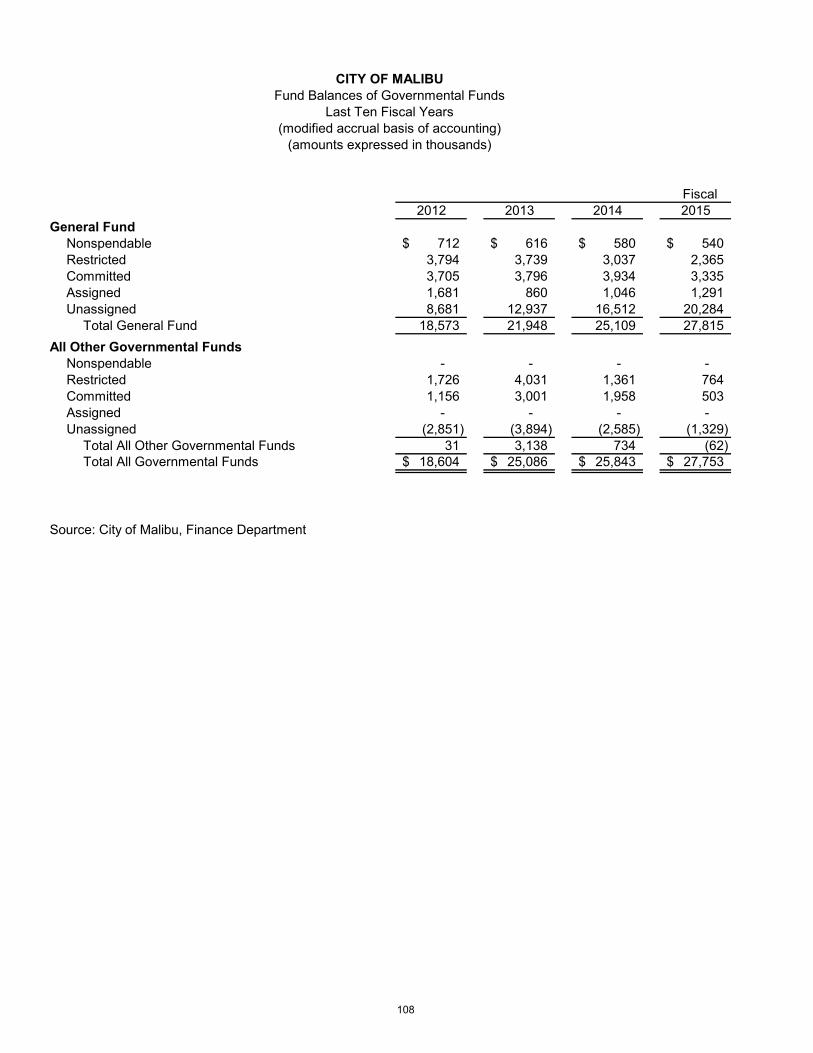
CITY OF MALIBUFund Balances of Governmental Funds
Last Ten Fiscal Years(modified accrual basis of accounting)
(amounts expressed in thousands)
Fiscal 2012 2013 2014 2015
General FundNonspendable 712$ 616$ 580$ 540$ Restricted 3,794 3,739 3,037 2,365 Committed 3,705 3,796 3,934 3,335 Assigned 1,681 860 1,046 1,291 Unassigned 8,681 12,937 16,512 20,284
Total General Fund 18,573 21,948 25,109 27,815 All Other Governmental Funds
Nonspendable - - - - Restricted 1,726 4,031 1,361 764 Committed 1,156 3,001 1,958 503 Assigned - - - - Unassigned (2,851) (3,894) (2,585) (1,329)
Total All Other Governmental Funds 31 3,138 734 (62) Total All Governmental Funds 18,604$ 25,086$ 25,843$ 27,753$
Source: City of Malibu, Finance Department
108
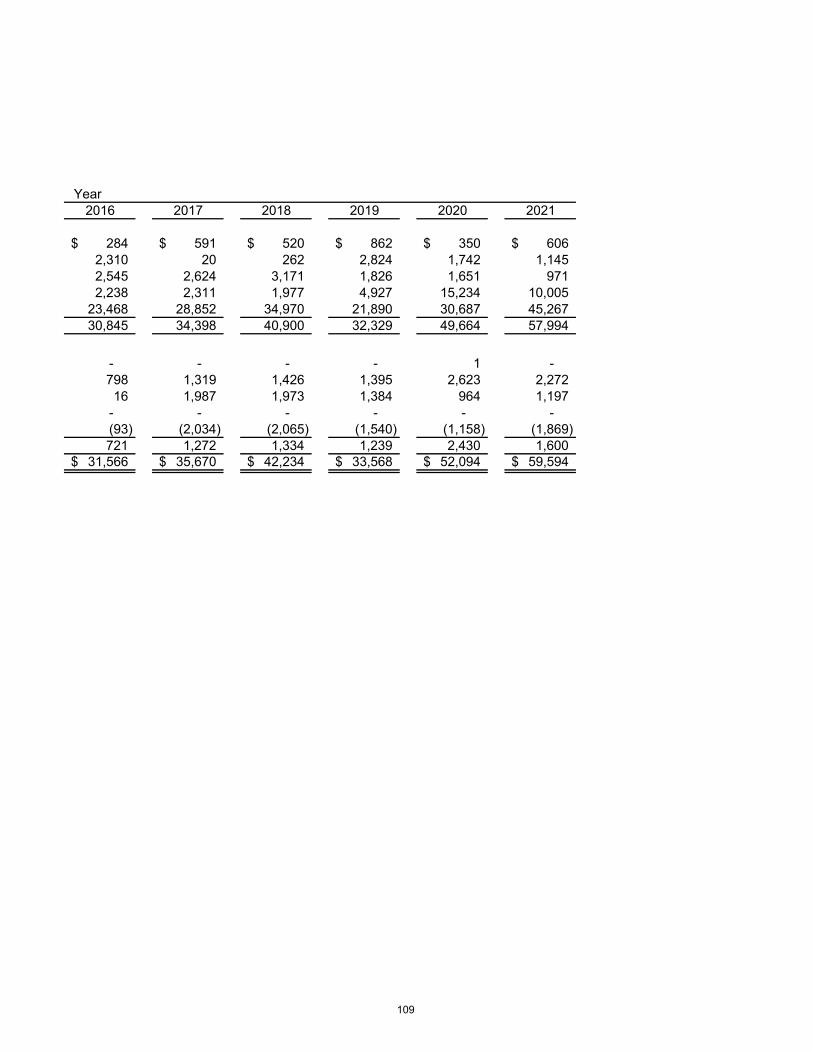
Year2016 2017 2018 2019 2020 2021
284$ 591$ 520$ 862$ 350$ 606$ 2,310 20 262 2,824 1,742 1,145 2,545 2,624 3,171 1,826 1,651 971 2,238 2,311 1,977 4,927 15,234 10,005
23,468 28,852 34,970 21,890 30,687 45,267 30,845 34,398 40,900 32,329 49,664 57,994
- - - - 1 - 798 1,319 1,426 1,395 2,623 2,272 16 1,987 1,973 1,384 964 1,197
- - - - - - (93) (2,034) (2,065) (1,540) (1,158) (1,869) 721 1,272 1,334 1,239 2,430 1,600
31,566$ 35,670$ 42,234$ 33,568$ 52,094$ 59,594$
109
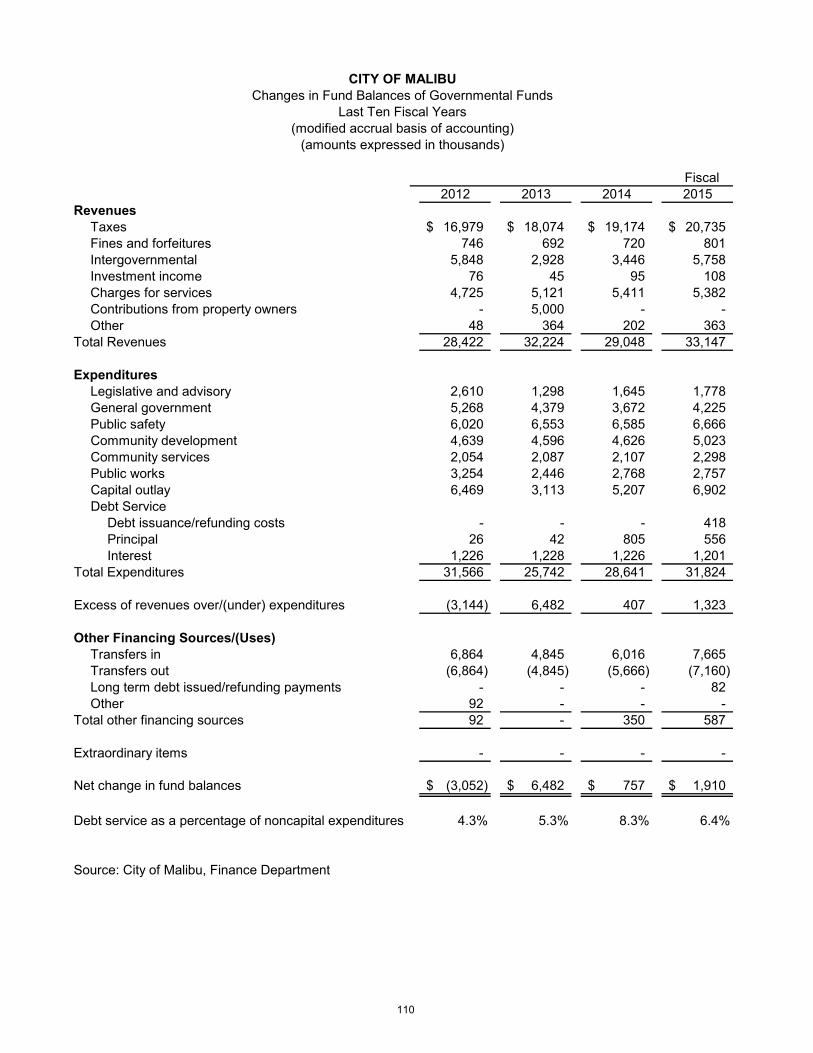
CITY OF MALIBUChanges in Fund Balances of Governmental Funds
Last Ten Fiscal Years(modified accrual basis of accounting)
(amounts expressed in thousands)
Fiscal 2012 2013 2014 2015
RevenuesTaxes 16,979$ 18,074$ 19,174$ 20,735$ Fines and forfeitures 746 692 720 801 Intergovernmental 5,848 2,928 3,446 5,758 Investment income 76 45 95 108 Charges for services 4,725 5,121 5,411 5,382 Contributions from property owners - 5,000 - - Other 48 364 202 363
Total Revenues 28,422 32,224 29,048 33,147
ExpendituresLegislative and advisory 2,610 1,298 1,645 1,778 General government 5,268 4,379 3,672 4,225 Public safety 6,020 6,553 6,585 6,666 Community development 4,639 4,596 4,626 5,023 Community services 2,054 2,087 2,107 2,298 Public works 3,254 2,446 2,768 2,757 Capital outlay 6,469 3,113 5,207 6,902 Debt Service
Debt issuance/refunding costs - - - 418 Principal 26 42 805 556 Interest 1,226 1,228 1,226 1,201
Total Expenditures 31,566 25,742 28,641 31,824
Excess of revenues over/(under) expenditures (3,144) 6,482 407 1,323
Other Financing Sources/(Uses)Transfers in 6,864 4,845 6,016 7,665 Transfers out (6,864) (4,845) (5,666) (7,160) Long term debt issued/refunding payments - - - 82 Other 92 - - -
Total other financing sources 92 - 350 587
Extraordinary items - - - -
Net change in fund balances (3,052)$ 6,482$ 757$ 1,910$
Debt service as a percentage of noncapital expenditures 4.3% 5.3% 8.3% 6.4%
Source: City of Malibu, Finance Department
110
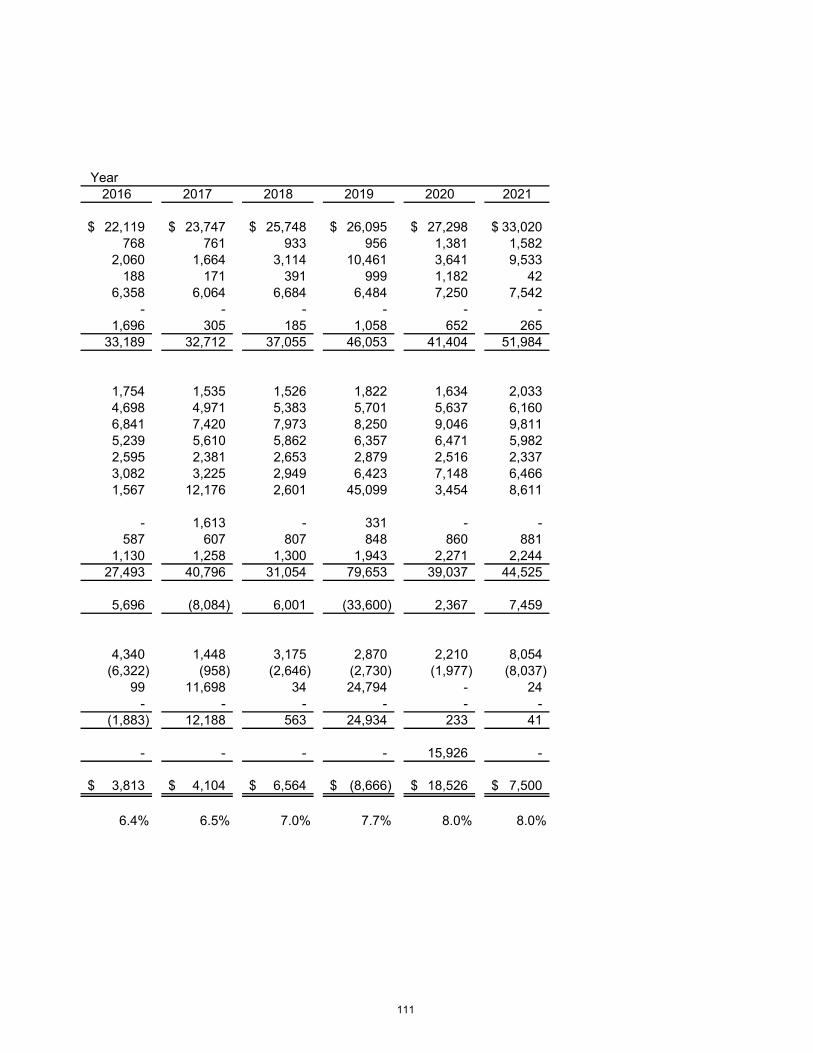
Year2016 2017 2018 2019 2020 2021
22,119$ 23,747$ 25,748$ 26,095$ 27,298$ 33,020$ 768 761 933 956 1,381 1,582
2,060 1,664 3,114 10,461 3,641 9,533 188 171 391 999 1,182 42
6,358 6,064 6,684 6,484 7,250 7,542 - - - - - -
1,696 305 185 1,058 652 265 33,189 32,712 37,055 46,053 41,404 51,984
1,754 1,535 1,526 1,822 1,634 2,033 4,698 4,971 5,383 5,701 5,637 6,160 6,841 7,420 7,973 8,250 9,046 9,811 5,239 5,610 5,862 6,357 6,471 5,982 2,595 2,381 2,653 2,879 2,516 2,337 3,082 3,225 2,949 6,423 7,148 6,466 1,567 12,176 2,601 45,099 3,454 8,611
- 1,613 - 331 - - 587 607 807 848 860 881
1,130 1,258 1,300 1,943 2,271 2,244 27,493 40,796 31,054 79,653 39,037 44,525
5,696 (8,084) 6,001 (33,600) 2,367 7,459
4,340 1,448 3,175 2,870 2,210 8,054 (6,322) (958) (2,646) (2,730) (1,977) (8,037)
99 11,698 34 24,794 - 24- - - - - -
(1,883) 12,188 563 24,934 233 41
- - - - 15,926 -
3,813$ 4,104$ 6,564$ (8,666)$ 18,526$ 7,500$
6.4% 6.5% 7.0% 7.7% 8.0% 8.0%
111
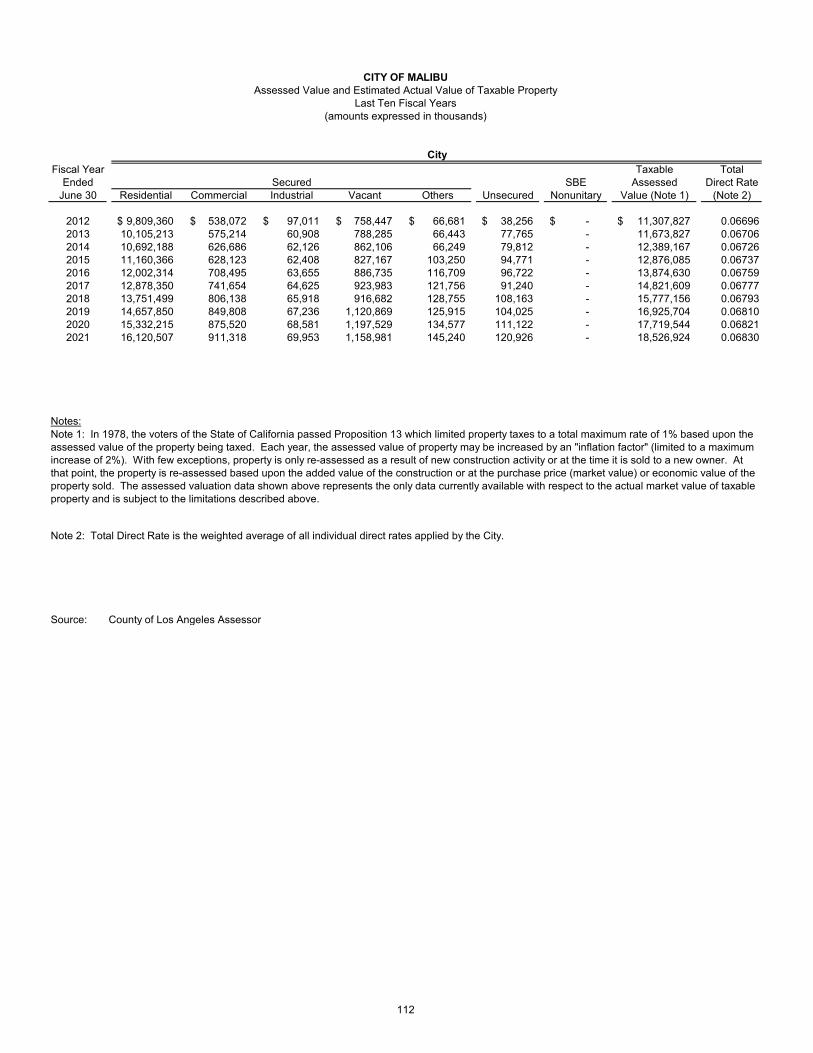
CityFiscal Year Taxable Total
Ended SBE Assessed Direct RateJune 30 Residential Commercial Industrial Vacant Others Unsecured Nonunitary Value (Note 1) (Note 2)
2012 9,809,360$ 538,072$ 97,011$ 758,447$ 66,681$ 38,256$ -$ 11,307,827$ 0.066962013 10,105,213 575,214 60,908 788,285 66,443 77,765 - 11,673,827 0.067062014 10,692,188 626,686 62,126 862,106 66,249 79,812 - 12,389,167 0.067262015 11,160,366 628,123 62,408 827,167 103,250 94,771 - 12,876,085 0.067372016 12,002,314 708,495 63,655 886,735 116,709 96,722 - 13,874,630 0.067592017 12,878,350 741,654 64,625 923,983 121,756 91,240 - 14,821,609 0.067772018 13,751,499 806,138 65,918 916,682 128,755 108,163 - 15,777,156 0.067932019 14,657,850 849,808 67,236 1,120,869 125,915 104,025 - 16,925,704 0.068102020 15,332,215 875,520 68,581 1,197,529 134,577 111,122 - 17,719,544 0.068212021 16,120,507 911,318 69,953 1,158,981 145,240 120,926 - 18,526,924 0.06830
Notes:
Source: County of Los Angeles Assessor
Note 1: In 1978, the voters of the State of California passed Proposition 13 which limited property taxes to a total maximum rate of 1% based upon the assessed value of the property being taxed. Each year, the assessed value of property may be increased by an "inflation factor" (limited to a maximum increase of 2%). With few exceptions, property is only re-assessed as a result of new construction activity or at the time it is sold to a new owner. At that point, the property is re-assessed based upon the added value of the construction or at the purchase price (market value) or economic value of the property sold. The assessed valuation data shown above represents the only data currently available with respect to the actual market value of taxable property and is subject to the limitations described above.
Note 2: Total Direct Rate is the weighted average of all individual direct rates applied by the City.
Secured
CITY OF MALIBUAssessed Value and Estimated Actual Value of Taxable Property
Last Ten Fiscal Years(amounts expressed in thousands)
112
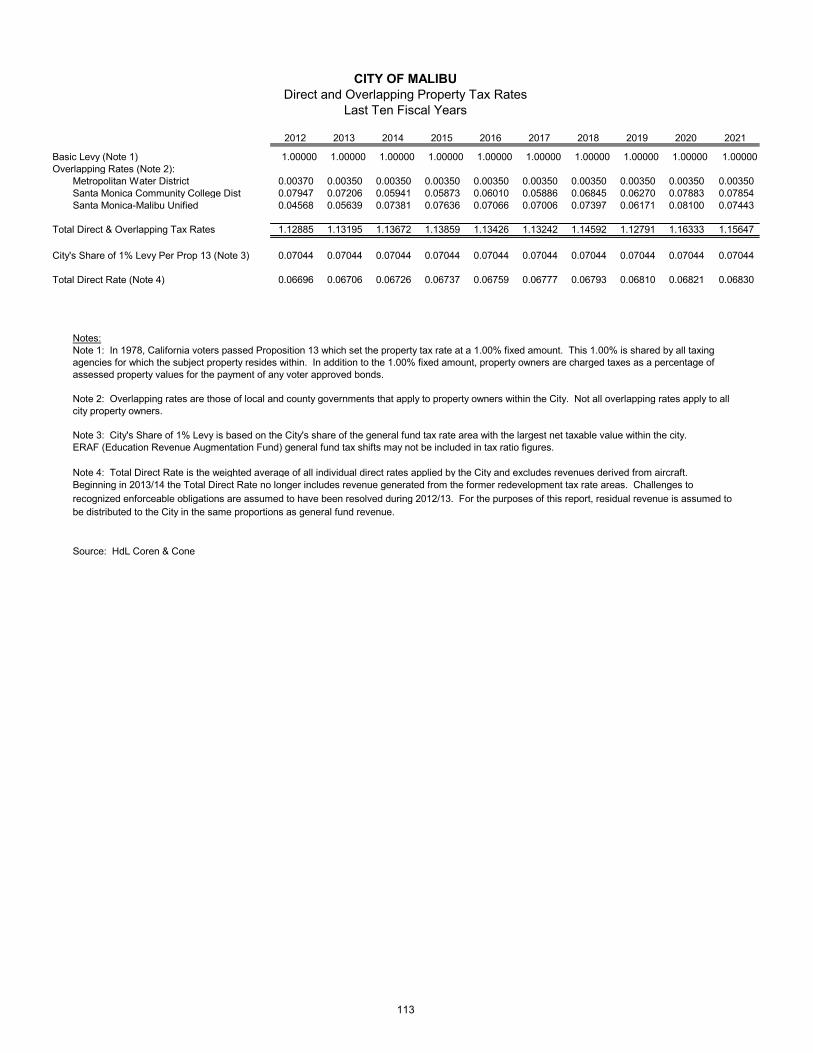
2012 2013 2014 2015 2016 2017 2018 2019 2020 2021
Basic Levy (Note 1) 1.00000 1.00000 1.00000 1.00000 1.00000 1.00000 1.00000 1.00000 1.00000 1.00000Overlapping Rates (Note 2):
Metropolitan Water District 0.00370 0.00350 0.00350 0.00350 0.00350 0.00350 0.00350 0.00350 0.00350 0.00350Santa Monica Community College Dist 0.07947 0.07206 0.05941 0.05873 0.06010 0.05886 0.06845 0.06270 0.07883 0.07854Santa Monica-Malibu Unified 0.04568 0.05639 0.07381 0.07636 0.07066 0.07006 0.07397 0.06171 0.08100 0.07443
Total Direct & Overlapping Tax Rates 1.12885 1.13195 1.13672 1.13859 1.13426 1.13242 1.14592 1.12791 1.16333 1.15647
City's Share of 1% Levy Per Prop 13 (Note 3) 0.07044 0.07044 0.07044 0.07044 0.07044 0.07044 0.07044 0.07044 0.07044 0.07044
Total Direct Rate (Note 4) 0.06696 0.06706 0.06726 0.06737 0.06759 0.06777 0.06793 0.06810 0.06821 0.06830
Notes:Note 1: In 1978, California voters passed Proposition 13 which set the property tax rate at a 1.00% fixed amount. This 1.00% is shared by all taxingagencies for which the subject property resides within. In addition to the 1.00% fixed amount, property owners are charged taxes as a percentage ofassessed property values for the payment of any voter approved bonds.
Note 2: Overlapping rates are those of local and county governments that apply to property owners within the City. Not all overlapping rates apply to allcity property owners.
Note 3: City's Share of 1% Levy is based on the City's share of the general fund tax rate area with the largest net taxable value within the city.ERAF (Education Revenue Augmentation Fund) general fund tax shifts may not be included in tax ratio figures.
Note 4: Total Direct Rate is the weighted average of all individual direct rates applied by the City and excludes revenues derived from aircraft.Beginning in 2013/14 the Total Direct Rate no longer includes revenue generated from the former redevelopment tax rate areas. Challenges torecognized enforceable obligations are assumed to have been resolved during 2012/13. For the purposes of this report, residual revenue is assumed to be distributed to the City in the same proportions as general fund revenue.
Source: HdL Coren & Cone
CITY OF MALIBUDirect and Overlapping Property Tax Rates
Last Ten Fiscal Years
113
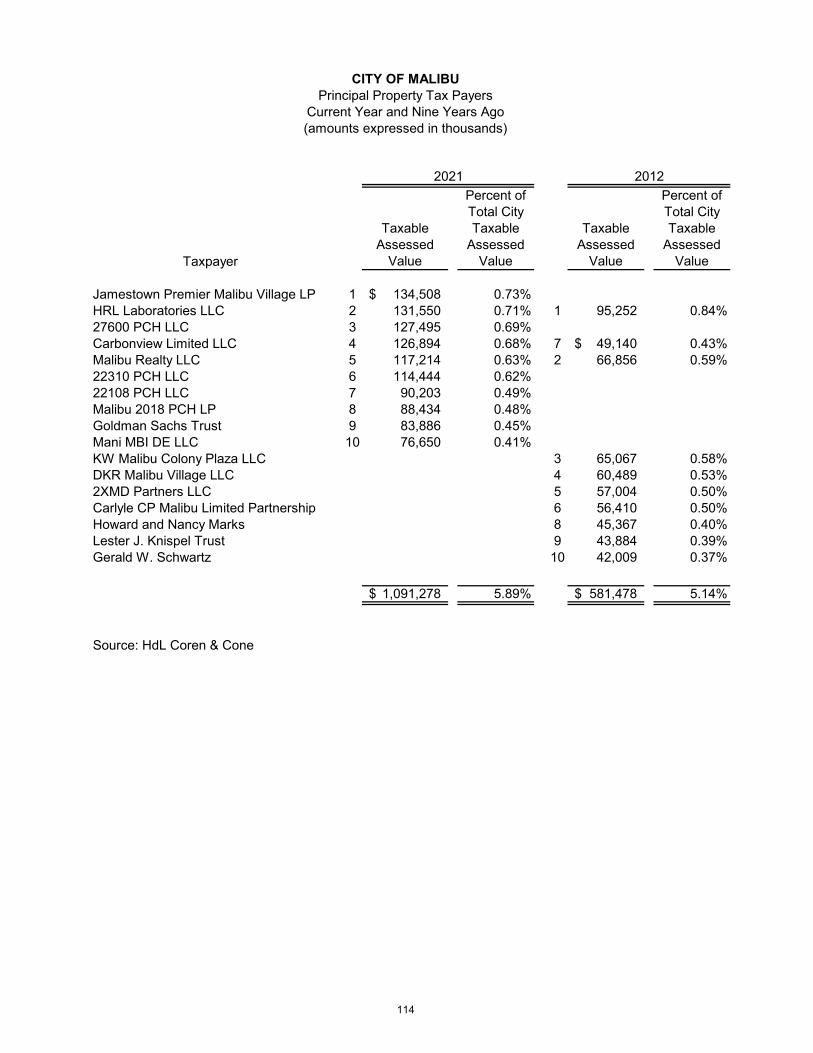
Taxpayer
Taxable Assessed
Value
Percent of Total City Taxable
Assessed Value
Taxable Assessed
Value
Percent of Total City Taxable
Assessed Value
Jamestown Premier Malibu Village LP 1 134,508$ 0.73%HRL Laboratories LLC 2 131,550 0.71% 1 95,252 0.84%27600 PCH LLC 3 127,495 0.69%Carbonview Limited LLC 4 126,894 0.68% 7 49,140$ 0.43%Malibu Realty LLC 5 117,214 0.63% 2 66,856 0.59%22310 PCH LLC 6 114,444 0.62%22108 PCH LLC 7 90,203 0.49%Malibu 2018 PCH LP 8 88,434 0.48%Goldman Sachs Trust 9 83,886 0.45%Mani MBI DE LLC 10 76,650 0.41%KW Malibu Colony Plaza LLC 3 65,067 0.58%DKR Malibu Village LLC 4 60,489 0.53%2XMD Partners LLC 5 57,004 0.50%Carlyle CP Malibu Limited Partnership 6 56,410 0.50%Howard and Nancy Marks 8 45,367 0.40%Lester J. Knispel Trust 9 43,884 0.39%Gerald W. Schwartz 10 42,009 0.37%
1,091,278$ 5.89% 581,478$ 5.14%
Source: HdL Coren & Cone
CITY OF MALIBU
20122021
Principal Property Tax PayersCurrent Year and Nine Years Ago(amounts expressed in thousands)
114
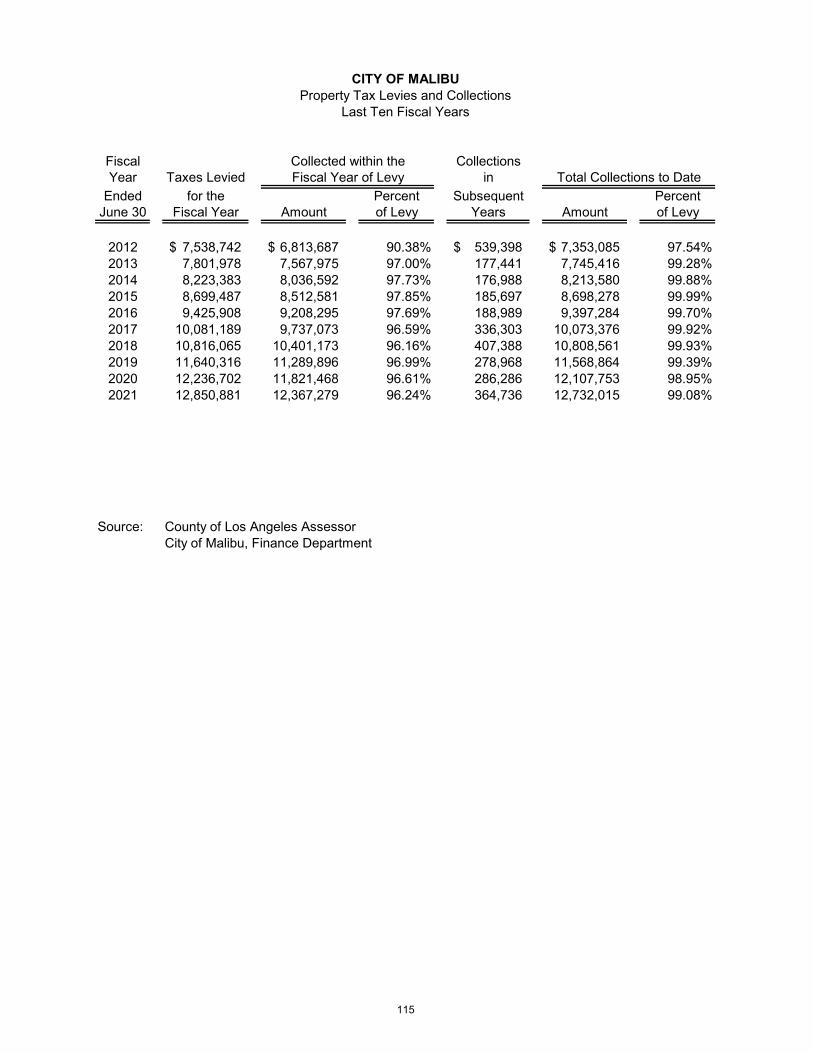
Fiscal Collected within the CollectionsYear Taxes Levied Fiscal Year of Levy in
Ended for the Percent Subsequent PercentJune 30 Fiscal Year Amount of Levy Years Amount of Levy
2012 7,538,742$ 6,813,687$ 90.38% 539,398$ 7,353,085$ 97.54%2013 7,801,978 7,567,975 97.00% 177,441 7,745,416 99.28%2014 8,223,383 8,036,592 97.73% 176,988 8,213,580 99.88%2015 8,699,487 8,512,581 97.85% 185,697 8,698,278 99.99%2016 9,425,908 9,208,295 97.69% 188,989 9,397,284 99.70%2017 10,081,189 9,737,073 96.59% 336,303 10,073,376 99.92%2018 10,816,065 10,401,173 96.16% 407,388 10,808,561 99.93%2019 11,640,316 11,289,896 96.99% 278,968 11,568,864 99.39%2020 12,236,702 11,821,468 96.61% 286,286 12,107,753 98.95%2021 12,850,881 12,367,279 96.24% 364,736 12,732,015 99.08%
Source: County of Los Angeles Assessor City of Malibu, Finance Department
Total Collections to Date
CITY OF MALIBUProperty Tax Levies and Collections
Last Ten Fiscal Years
115
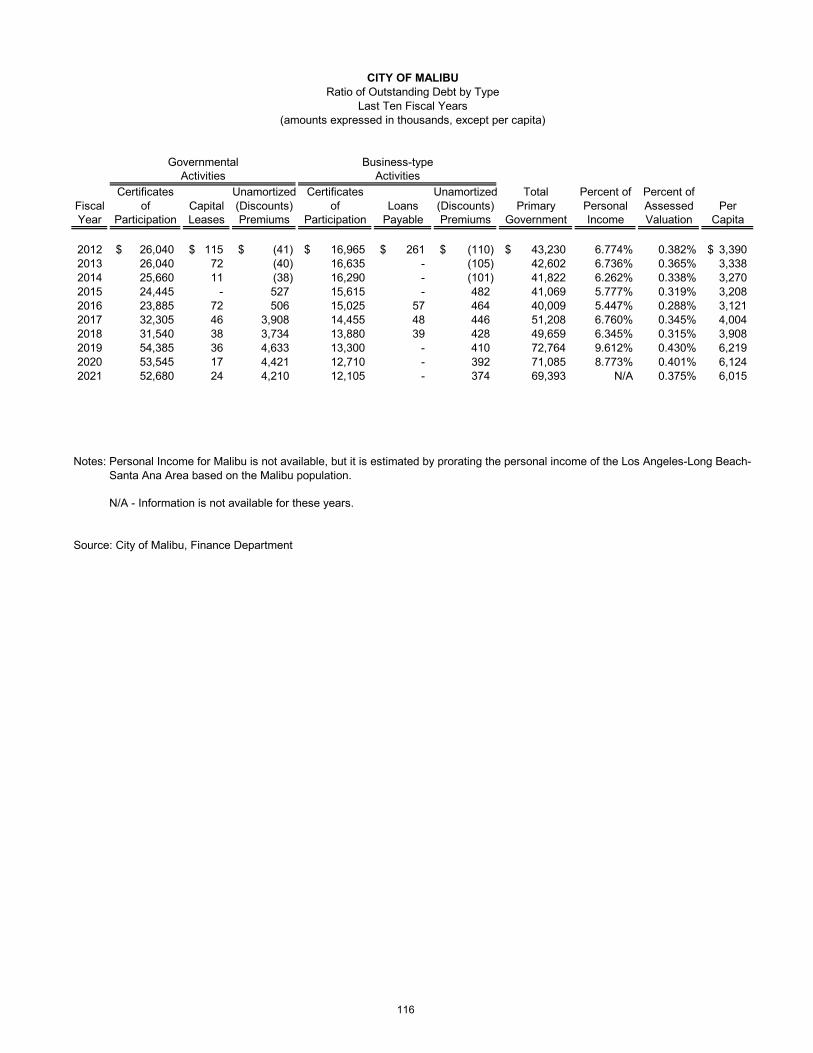
Certificates Unamortized Certificates Unamortized Total Percent of Percent ofFiscal of Capital (Discounts) of Loans (Discounts) Primary Personal Assessed PerYear Participation Leases Premiums Participation Payable Premiums Government Income Valuation Capita
2012 26,040$ 115$ (41)$ 16,965$ 261$ (110)$ 43,230$ 6.774% 0.382% 3,390$ 2013 26,040 72 (40) 16,635 - (105) 42,602 6.736% 0.365% 3,338 2014 25,660 11 (38) 16,290 - (101) 41,822 6.262% 0.338% 3,270 2015 24,445 - 527 15,615 - 482 41,069 5.777% 0.319% 3,208 2016 23,885 72 506 15,025 57 464 40,009 5.447% 0.288% 3,121 2017 32,305 46 3,908 14,455 48 446 51,208 6.760% 0.345% 4,004 2018 31,540 38 3,734 13,880 39 428 49,659 6.345% 0.315% 3,908 2019 54,385 36 4,633 13,300 - 410 72,764 9.612% 0.430% 6,219 2020 53,545 17 4,421 12,710 - 392 71,085 8.773% 0.401% 6,124 2021 52,680 24 4,210 12,105 - 374 69,393 N/A 0.375% 6,015
Notes:
N/A - Information is not available for these years.
Source: City of Malibu, Finance Department
CITY OF MALIBURatio of Outstanding Debt by Type
Last Ten Fiscal Years(amounts expressed in thousands, except per capita)
Personal Income for Malibu is not available, but it is estimated by prorating the personal income of the Los Angeles-Long Beach-Santa Ana Area based on the Malibu population.
ActivitiesGovernmental Business-type
Activities
116
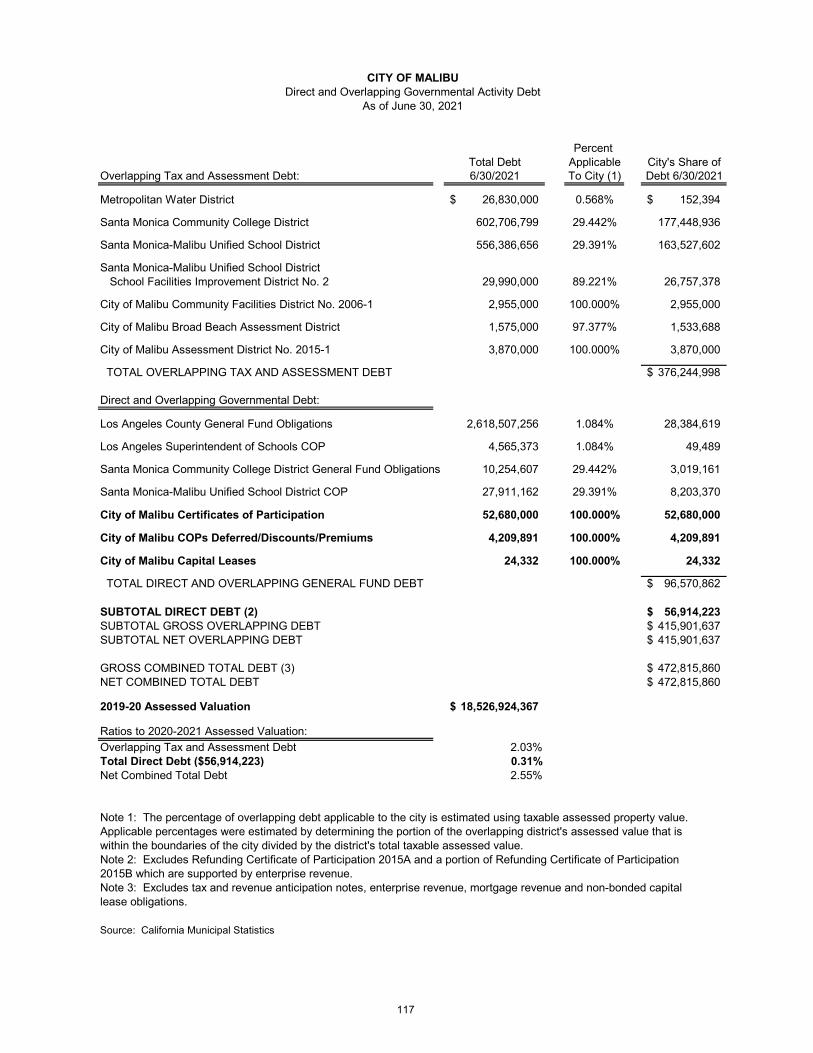
Percent Total Debt Applicable City's Share of
Overlapping Tax and Assessment Debt: 6/30/2021 To City (1) Debt 6/30/2021
Metropolitan Water District 26,830,000$ 0.568% 152,394$
Santa Monica Community College District 602,706,799 29.442% 177,448,936
Santa Monica-Malibu Unified School District 556,386,656 29.391% 163,527,602
Santa Monica-Malibu Unified School District School Facilities Improvement District No. 2 29,990,000 89.221% 26,757,378
City of Malibu Community Facilities District No. 2006-1 2,955,000 100.000% 2,955,000
City of Malibu Broad Beach Assessment District 1,575,000 97.377% 1,533,688
City of Malibu Assessment District No. 2015-1 3,870,000 100.000% 3,870,000
TOTAL OVERLAPPING TAX AND ASSESSMENT DEBT 376,244,998$
Direct and Overlapping Governmental Debt:
Los Angeles County General Fund Obligations 2,618,507,256 1.084% 28,384,619
Los Angeles Superintendent of Schools COP 4,565,373 1.084% 49,489
Santa Monica Community College District General Fund Obligations 10,254,607 29.442% 3,019,161
Santa Monica-Malibu Unified School District COP 27,911,162 29.391% 8,203,370
City of Malibu Certificates of Participation 52,680,000 100.000% 52,680,000
City of Malibu COPs Deferred/Discounts/Premiums 4,209,891 100.000% 4,209,891
City of Malibu Capital Leases 24,332 100.000% 24,332
TOTAL DIRECT AND OVERLAPPING GENERAL FUND DEBT 96,570,862$
SUBTOTAL DIRECT DEBT (2) 56,914,223$ SUBTOTAL GROSS OVERLAPPING DEBT 415,901,637$ SUBTOTAL NET OVERLAPPING DEBT 415,901,637$
GROSS COMBINED TOTAL DEBT (3) 472,815,860$ NET COMBINED TOTAL DEBT 472,815,860$
2019-20 Assessed Valuation 18,526,924,367$
Ratios to 2020-2021 Assessed Valuation:Overlapping Tax and Assessment Debt 2.03%Total Direct Debt ($56,914,223) 0.31%Net Combined Total Debt 2.55%
Note 1: The percentage of overlapping debt applicable to the city is estimated using taxable assessed property value.Applicable percentages were estimated by determining the portion of the overlapping district's assessed value that is within the boundaries of the city divided by the district's total taxable assessed value.Note 2: Excludes Refunding Certificate of Participation 2015A and a portion of Refunding Certificate of Participation2015B which are supported by enterprise revenue.Note 3: Excludes tax and revenue anticipation notes, enterprise revenue, mortgage revenue and non-bonded capitallease obligations.
Source: California Municipal Statistics
CITY OF MALIBUDirect and Overlapping Governmental Activity Debt
As of June 30, 2021
117
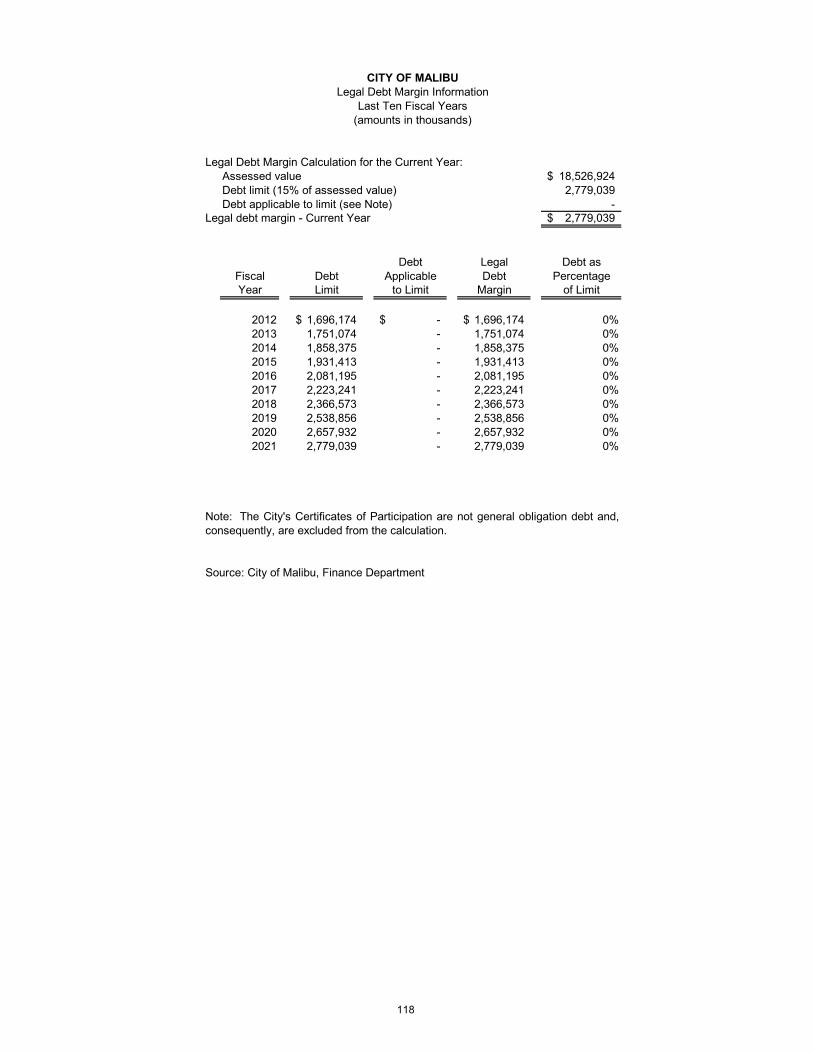
Legal Debt Margin Calculation for the Current Year:Assessed value 18,526,924$ Debt limit (15% of assessed value) 2,779,039 Debt applicable to limit (see Note) -
Legal debt margin - Current Year 2,779,039$
Debt Legal Debt asFiscal Debt Applicable Debt PercentageYear Limit to Limit Margin of Limit
2012 1,696,174$ -$ 1,696,174$ 0%2013 1,751,074 - 1,751,074 0%2014 1,858,375 - 1,858,375 0%2015 1,931,413 - 1,931,413 0%2016 2,081,195 - 2,081,195 0%2017 2,223,241 - 2,223,241 0%2018 2,366,573 - 2,366,573 0%2019 2,538,856 - 2,538,856 0%2020 2,657,932 - 2,657,932 0%2021 2,779,039 - 2,779,039 0%
Source: City of Malibu, Finance Department
Note: The City's Certificates of Participation are not general obligation debt and,consequently, are excluded from the calculation.
CITY OF MALIBULegal Debt Margin Information
Last Ten Fiscal Years(amounts in thousands)
118
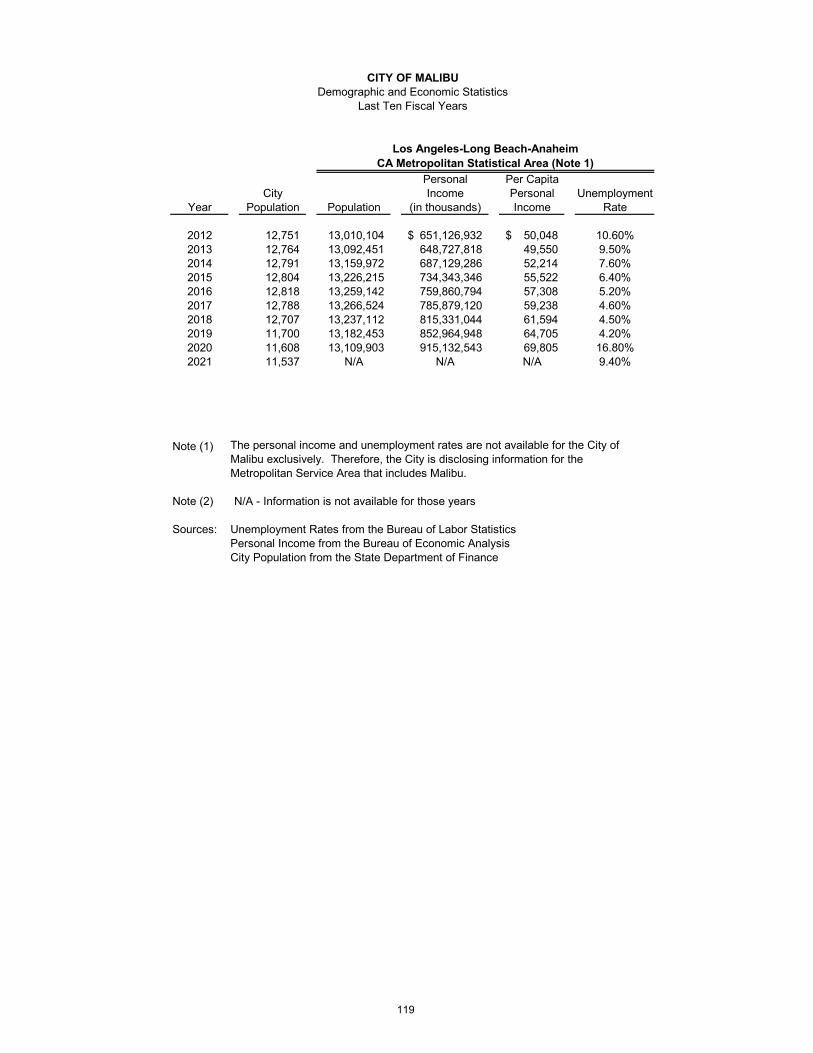
Personal Per CapitaCity Income Personal Unemployment
Year Population Population (in thousands) Income Rate
2012 12,751 13,010,104 651,126,932$ 50,048$ 10.60%2013 12,764 13,092,451 648,727,818 49,550 9.50%2014 12,791 13,159,972 687,129,286 52,214 7.60%2015 12,804 13,226,215 734,343,346 55,522 6.40%2016 12,818 13,259,142 759,860,794 57,308 5.20%2017 12,788 13,266,524 785,879,120 59,238 4.60%2018 12,707 13,237,112 815,331,044 61,594 4.50%2019 11,700 13,182,453 852,964,948 64,705 4.20%2020 11,608 13,109,903 915,132,543 69,805 16.80%2021 11,537 N/A N/A N/A 9.40%
Note (1)
Note (2) N/A - Information is not available for those years
Sources: Unemployment Rates from the Bureau of Labor StatisticsPersonal Income from the Bureau of Economic AnalysisCity Population from the State Department of Finance
Los Angeles-Long Beach-AnaheimCA Metropolitan Statistical Area (Note 1)
The personal income and unemployment rates are not available for the City of Malibu exclusively. Therefore, the City is disclosing information for the Metropolitan Service Area that includes Malibu.
CITY OF MALIBUDemographic and Economic Statistics
Last Ten Fiscal Years
119
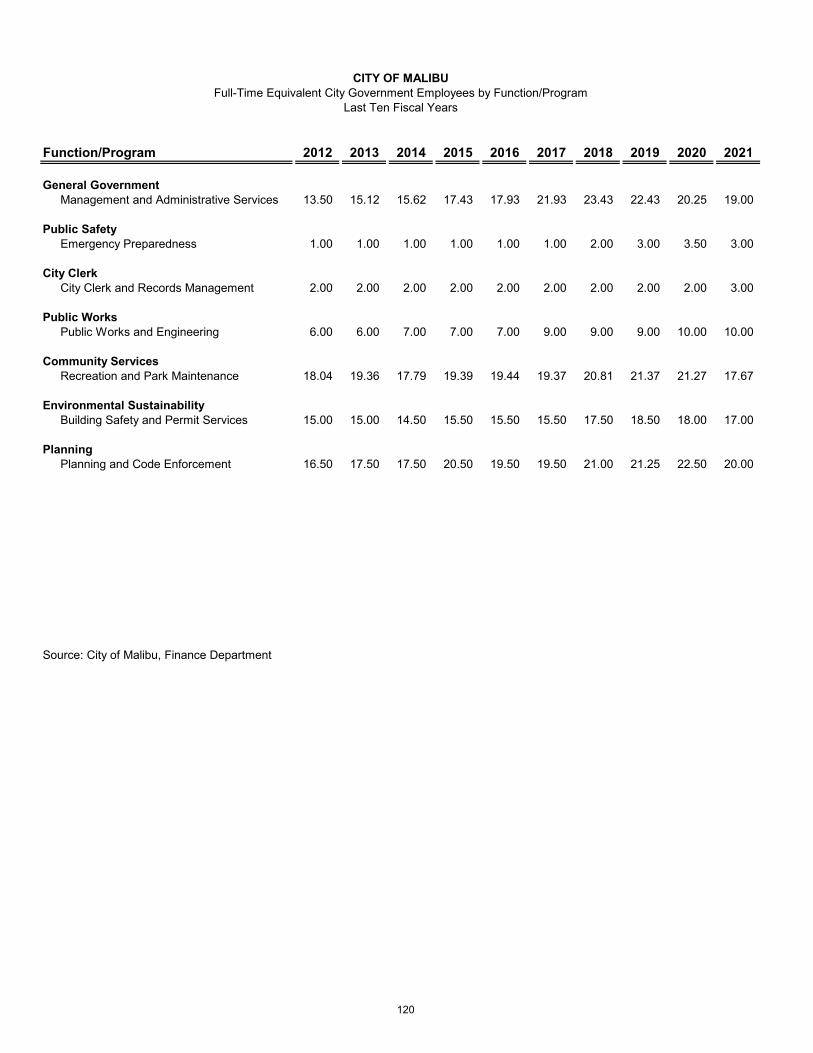
Function/Program 2012 2013 2014 2015 2016 2017 2018 2019 2020 2021
General GovernmentManagement and Administrative Services 13.50 15.12 15.62 17.43 17.93 21.93 23.43 22.43 20.25 19.00
Public SafetyEmergency Preparedness 1.00 1.00 1.00 1.00 1.00 1.00 2.00 3.00 3.50 3.00
City ClerkCity Clerk and Records Management 2.00 2.00 2.00 2.00 2.00 2.00 2.00 2.00 2.00 3.00
Public WorksPublic Works and Engineering 6.00 6.00 7.00 7.00 7.00 9.00 9.00 9.00 10.00 10.00
Community ServicesRecreation and Park Maintenance 18.04 19.36 17.79 19.39 19.44 19.37 20.81 21.37 21.27 17.67
Environmental SustainabilityBuilding Safety and Permit Services 15.00 15.00 14.50 15.50 15.50 15.50 17.50 18.50 18.00 17.00
PlanningPlanning and Code Enforcement 16.50 17.50 17.50 20.50 19.50 19.50 21.00 21.25 22.50 20.00
Source: City of Malibu, Finance Department
CITY OF MALIBUFull-Time Equivalent City Government Employees by Function/Program
Last Ten Fiscal Years
120
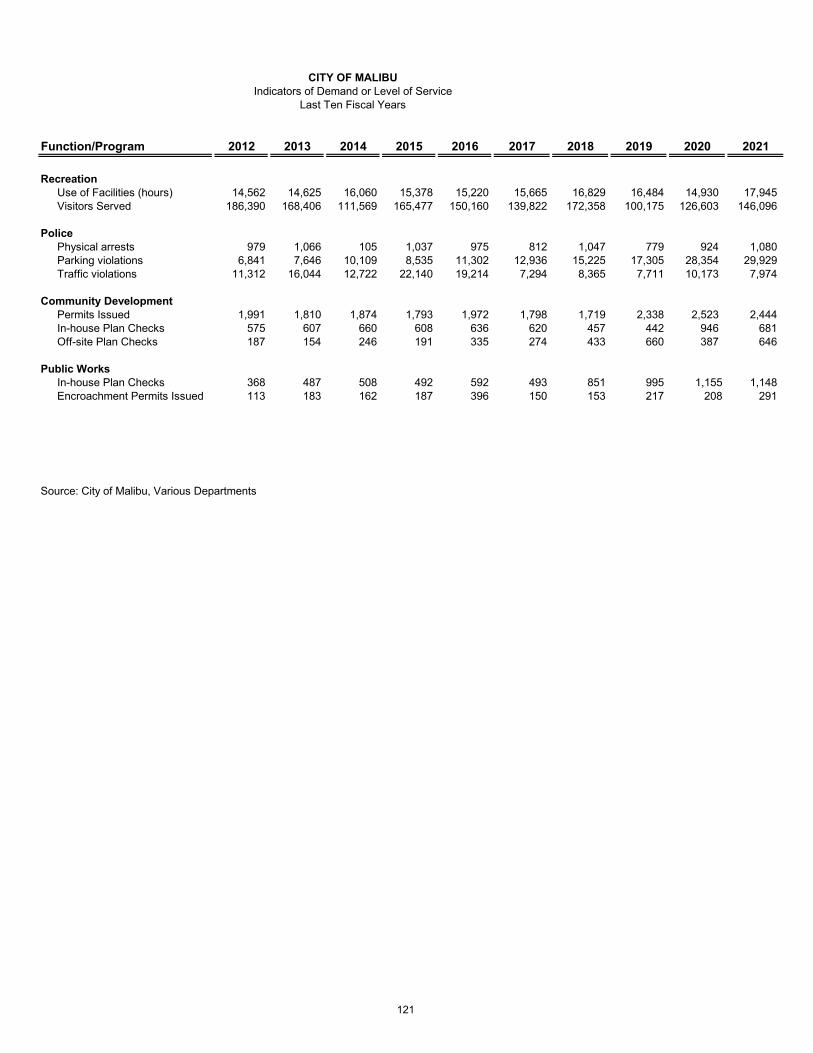
Function/Program 2012 2013 2014 2015 2016 2017 2018 2019 2020 2021
RecreationUse of Facilities (hours) 14,562 14,625 16,060 15,378 15,220 15,665 16,829 16,484 14,930 17,945 Visitors Served 186,390 168,406 111,569 165,477 150,160 139,822 172,358 100,175 126,603 146,096
PolicePhysical arrests 979 1,066 105 1,037 975 812 1,047 779 924 1,080 Parking violations 6,841 7,646 10,109 8,535 11,302 12,936 15,225 17,305 28,354 29,929 Traffic violations 11,312 16,044 12,722 22,140 19,214 7,294 8,365 7,711 10,173 7,974
Community DevelopmentPermits Issued 1,991 1,810 1,874 1,793 1,972 1,798 1,719 2,338 2,523 2,444 In-house Plan Checks 575 607 660 608 636 620 457 442 946 681 Off-site Plan Checks 187 154 246 191 335 274 433 660 387 646
Public WorksIn-house Plan Checks 368 487 508 492 592 493 851 995 1,155 1,148 Encroachment Permits Issued 113 183 162 187 396 150 153 217 208 291
Source: City of Malibu, Various Departments
CITY OF MALIBUIndicators of Demand or Level of Service
Last Ten Fiscal Years
121
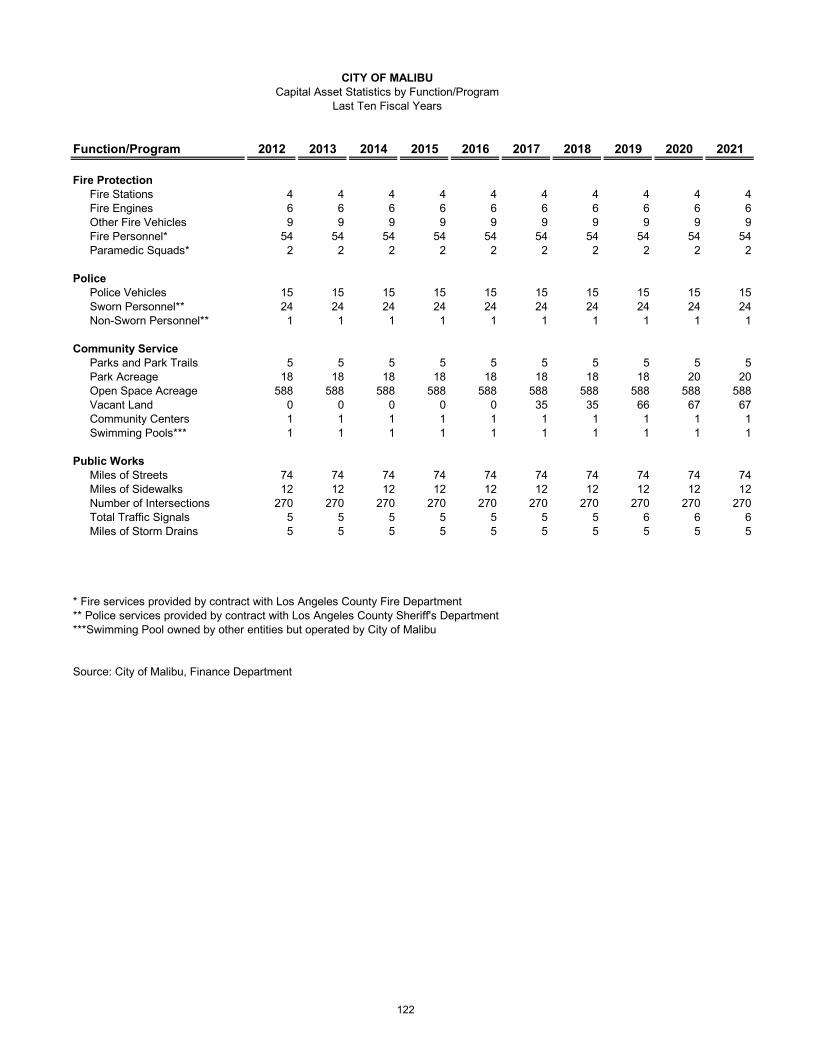
Function/Program 2012 2013 2014 2015 2016 2017 2018 2019 2020 2021
Fire ProtectionFire Stations 4 4 4 4 4 4 4 4 4 4Fire Engines 6 6 6 6 6 6 6 6 6 6Other Fire Vehicles 9 9 9 9 9 9 9 9 9 9Fire Personnel* 54 54 54 54 54 54 54 54 54 54Paramedic Squads* 2 2 2 2 2 2 2 2 2 2
PolicePolice Vehicles 15 15 15 15 15 15 15 15 15 15Sworn Personnel** 24 24 24 24 24 24 24 24 24 24Non-Sworn Personnel** 1 1 1 1 1 1 1 1 1 1
Community ServiceParks and Park Trails 5 5 5 5 5 5 5 5 5 5Park Acreage 18 18 18 18 18 18 18 18 20 20Open Space Acreage 588 588 588 588 588 588 588 588 588 588Vacant Land 0 0 0 0 0 35 35 66 67 67Community Centers 1 1 1 1 1 1 1 1 1 1Swimming Pools*** 1 1 1 1 1 1 1 1 1 1
Public WorksMiles of Streets 74 74 74 74 74 74 74 74 74 74Miles of Sidewalks 12 12 12 12 12 12 12 12 12 12Number of Intersections 270 270 270 270 270 270 270 270 270 270Total Traffic Signals 5 5 5 5 5 5 5 6 6 6Miles of Storm Drains 5 5 5 5 5 5 5 5 5 5
* Fire services provided by contract with Los Angeles County Fire Department** Police services provided by contract with Los Angeles County Sheriff's Department***Swimming Pool owned by other entities but operated by City of Malibu
Source: City of Malibu, Finance Department
CITY OF MALIBUCapital Asset Statistics by Function/Program
Last Ten Fiscal Years
122