Embed Size (px)
Citation preview
State of California
FISCAL YEAR ENDED JUNE 30, 2017
COMPREHENSIVE ANNUALFINANCIAL REPORT2017

2017
FISCAL YEAR ENDED JUNE 30, 2017
Prepared Under the Supervision of:
Scott Clark, CPA, Interim Comptroller
Sarah Mayen, CPA, Deputy Director
Karen Hernandez, Principal Accountant
COMPREHENSIVE ANNUAL FINANCIAL REPORT
City of San DiegoState of California
2017
FISCAL YEAR ENDED JUNE 30, 2017
Prepared Under the Supervision of:
Scott Clark, CPA, Interim Comptroller
Sarah Mayen, CPA, Deputy Director
Karen Hernandez, Principal Accountant
COMPREHENSIVE ANNUAL FINANCIAL REPORT
City of San DiegoState of California
�
City of San Diego ComprehenSive annual finanCial report
table of Contents
INTRODUCTORY SECTION (UNAUDITED)
letter of transmittal ........................................................................................................................................................................ 13
Government Finance Officers Association (GFOA) Award ............................................................................................................ 27
City of San Diego Current Officials ................................................................................................................................................. 28
City of San Diego legislative organization Chart .......................................................................................................................... 29
City of San Diego operations organization Chart .......................................................................................................................... 30
FINANCIAL SECTION
Independent Auditor’s Report ......................................................................................................................................................... 33
Management’s Discussion and Analysis (Required Supplementary Information - Unaudited) ....................................................... 37
BaSiC finanCial StatementS
Government-Wide Financial Statements:
Statement of net position ............................................................................................................................................... 5�
Statement of activities .................................................................................................................................................... 56
Governmental Funds Financial Statements:
Balance Sheet ................................................................................................................................................................ 58
Statement of Revenues, Expenditures and Changes in Fund Balances ........................................................................ 60
Reconciliation of the Statement of Revenues, Expenditures and Changes in Fund Balances of Governmental Funds to the Statement of Activities ............................................................................................................................... 61
Proprietary Funds Financial Statements:
Statement of Fund Net Position ...................................................................................................................................... 62
Statement of Revenues, Expenses and Changes in Fund Net Position ......................................................................... 65
Statement of Cash Flows ................................................................................................................................................ 66
Fiduciary Funds Financial Statements:
Statement of Fiduciary Net Position ............................................................................................................................... 68
Statement of Changes in Fiduciary Net Position ............................................................................................................ 69
notes to the Basic financial Statements:
1. Summary of Significant Accounting Policies ............................................................................................................ 70
table of ContentsFiscal Year Ended June 30, 2017
5
City of San Diego ComprehenSive annual finanCial report
2. Reconciliation of Government-Wide and Fund Financial Statements ..................................................................... 86
3. Cash and Investments ............................................................................................................................................. 91
�. Capital assets ........................................................................................................................................................ 122
5. Governmental Activities Long-Term Liabilities ....................................................................................................... 125
6. Business-Type Activities Long-Term Liabilities ...................................................................................................... 131
7. Discretely Presented Component Unit Long-Term Liabilities ................................................................................. 137
8. Short-Term Liabilities ............................................................................................................................................. 1��
9. Joint Ventures and Jointly Governed Organizations .............................................................................................. 1�5
10. lease Commitments .............................................................................................................................................. 1�6
11. Deferred Compensation Plan ................................................................................................................................. 1�8
12. pension plans ........................................................................................................................................................ 1�9
13. Other Postemployment Benefits ............................................................................................................................ 163
14. Interfund Receivables, Payables and Transfers .................................................................................................... 169
15. risk management .................................................................................................................................................. 170
16. Fund Balance / Net Position Deficits ..................................................................................................................... 172
17. Commitments ......................................................................................................................................................... 173
18. Contingencies ........................................................................................................................................................ 176
19. Debt Without Government Commitment ................................................................................................................ 179
20. Closure and Postclosure Care Cost ...................................................................................................................... 185
21. operating agreements ........................................................................................................................................... 186
22. Fund Balances ....................................................................................................................................................... 188
23. restatements of net position ................................................................................................................................ 190
24. Subsequent Events ................................................................................................................................................ 191
REQUIRED SUPPLEMENTARY INFORMATION (UNAUDITED)
Defined Benefit Pension Plans and OPEB Plan ........................................................................................................... 195
General Fund Schedule of Revenues, Expenditures and Changes in Fund Balance - Budget and Actual (Budgetary Basis) ......................................................................................................................................................... 202
table of ContentsFiscal Year Ended June 30, 2017
6
City of San Diego ComprehenSive annual finanCial report
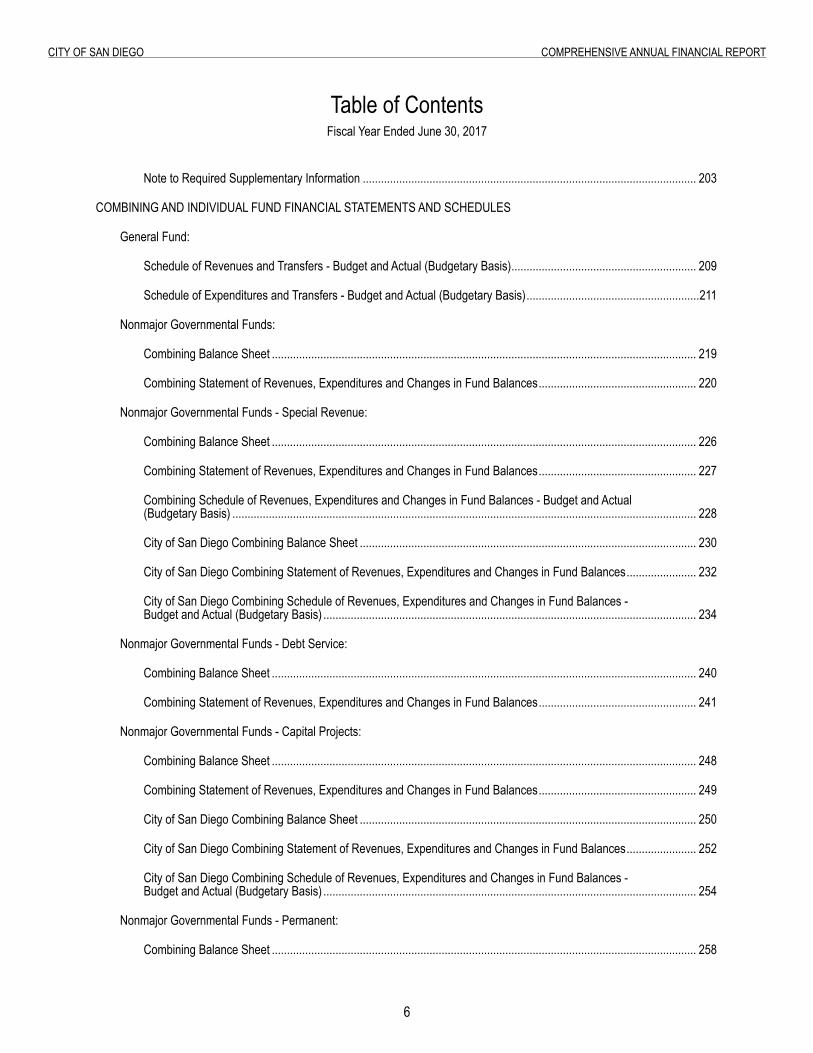
Note to Required Supplementary Information .............................................................................................................. 203
ComBining anD inDiviDual funD finanCial StatementS anD SCheDuleS
General Fund:
Schedule of Revenues and Transfers - Budget and Actual (Budgetary Basis) ............................................................. 209
Schedule of Expenditures and Transfers - Budget and Actual (Budgetary Basis) .........................................................211
Nonmajor Governmental Funds:
Combining Balance Sheet ............................................................................................................................................ 219
Combining Statement of Revenues, Expenditures and Changes in Fund Balances .................................................... 220
Nonmajor Governmental Funds - Special Revenue:
Combining Balance Sheet ............................................................................................................................................ 226
Combining Statement of Revenues, Expenditures and Changes in Fund Balances .................................................... 227
Combining Schedule of Revenues, Expenditures and Changes in Fund Balances - Budget and Actual (Budgetary Basis) ......................................................................................................................................................... 228
City of San Diego Combining Balance Sheet ............................................................................................................... 230
City of San Diego Combining Statement of Revenues, Expenditures and Changes in Fund Balances ....................... 232
City of San Diego Combining Schedule of Revenues, Expenditures and Changes in Fund Balances - Budget and Actual (Budgetary Basis) ........................................................................................................................... 23�
Nonmajor Governmental Funds - Debt Service:
Combining Balance Sheet ............................................................................................................................................ 2�0
Combining Statement of Revenues, Expenditures and Changes in Fund Balances .................................................... 2�1
Nonmajor Governmental Funds - Capital Projects:
Combining Balance Sheet ............................................................................................................................................ 2�8
Combining Statement of Revenues, Expenditures and Changes in Fund Balances .................................................... 2�9
City of San Diego Combining Balance Sheet ............................................................................................................... 250
City of San Diego Combining Statement of Revenues, Expenditures and Changes in Fund Balances ....................... 252
City of San Diego Combining Schedule of Revenues, Expenditures and Changes in Fund Balances - Budget and Actual (Budgetary Basis) ........................................................................................................................... 25�
Nonmajor Governmental Funds - Permanent:
Combining Balance Sheet ............................................................................................................................................ 258
table of ContentsFiscal Year Ended June 30, 2017
7
City of San Diego ComprehenSive annual finanCial report
table of ContentsFiscal Year Ended June 30, 2017
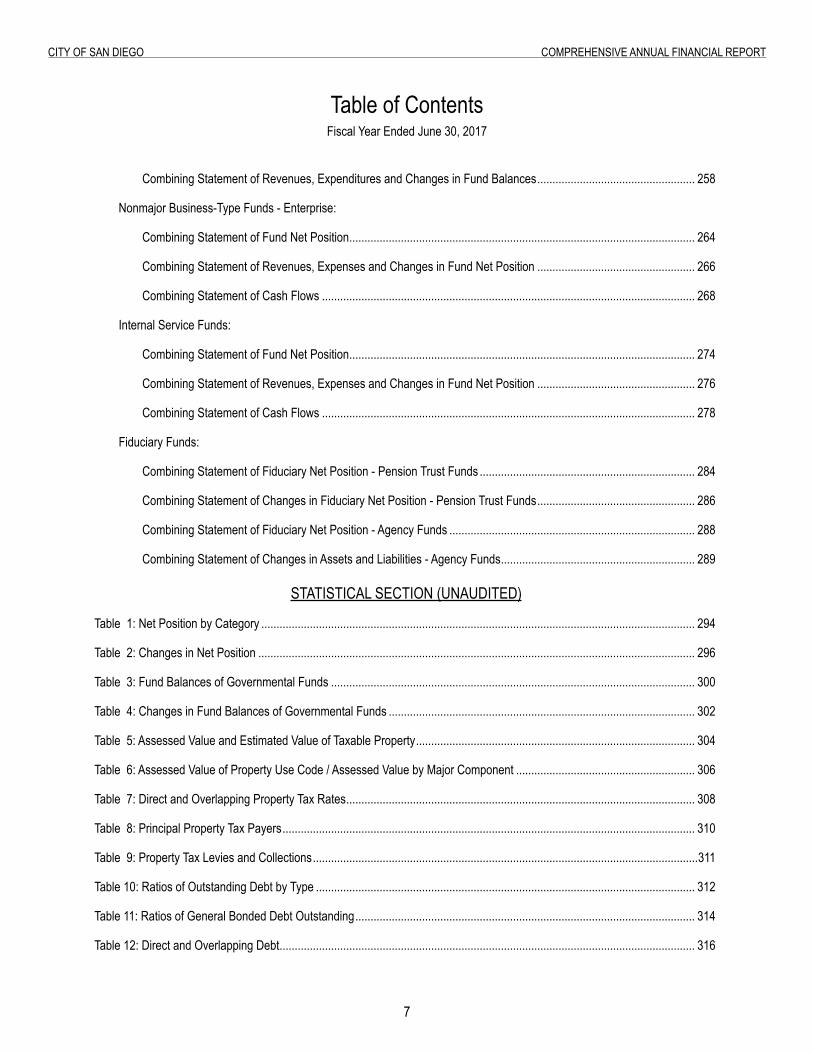
Combining Statement of Revenues, Expenditures and Changes in Fund Balances .................................................... 258
Nonmajor Business-Type Funds - Enterprise:
Combining Statement of Fund Net Position .................................................................................................................. 26�
Combining Statement of Revenues, Expenses and Changes in Fund Net Position .................................................... 266
Combining Statement of Cash Flows ........................................................................................................................... 268
Internal Service Funds:
Combining Statement of Fund Net Position .................................................................................................................. 27�
Combining Statement of Revenues, Expenses and Changes in Fund Net Position .................................................... 276
Combining Statement of Cash Flows ........................................................................................................................... 278
Fiduciary Funds:
Combining Statement of Fiduciary Net Position - Pension Trust Funds ....................................................................... 28�
Combining Statement of Changes in Fiduciary Net Position - Pension Trust Funds .................................................... 286
Combining Statement of Fiduciary Net Position - Agency Funds ................................................................................. 288
Combining Statement of Changes in Assets and Liabilities - Agency Funds ................................................................ 289
STATISTICAL SECTION (UNAUDITED)
table 1: net position by Category ............................................................................................................................................... 29�
table 2: Changes in net position ................................................................................................................................................ 296
Table 3: Fund Balances of Governmental Funds ........................................................................................................................ 300
Table 4: Changes in Fund Balances of Governmental Funds ..................................................................................................... 302
Table 5: Assessed Value and Estimated Value of Taxable Property ............................................................................................ 30�
Table 6: Assessed Value of Property Use Code / Assessed Value by Major Component ........................................................... 306
Table 7: Direct and Overlapping Property Tax Rates ................................................................................................................... 308
table 8: principal property tax payers ........................................................................................................................................ 310
Table 9: Property Tax Levies and Collections ...............................................................................................................................311
Table 10: Ratios of Outstanding Debt by Type ............................................................................................................................. 312
Table 11: Ratios of General Bonded Debt Outstanding ................................................................................................................ 31�
Table 12: Direct and Overlapping Debt ......................................................................................................................................... 316
8
City of San Diego ComprehenSive annual finanCial report
table of ContentsFiscal Year Ended June 30, 2017
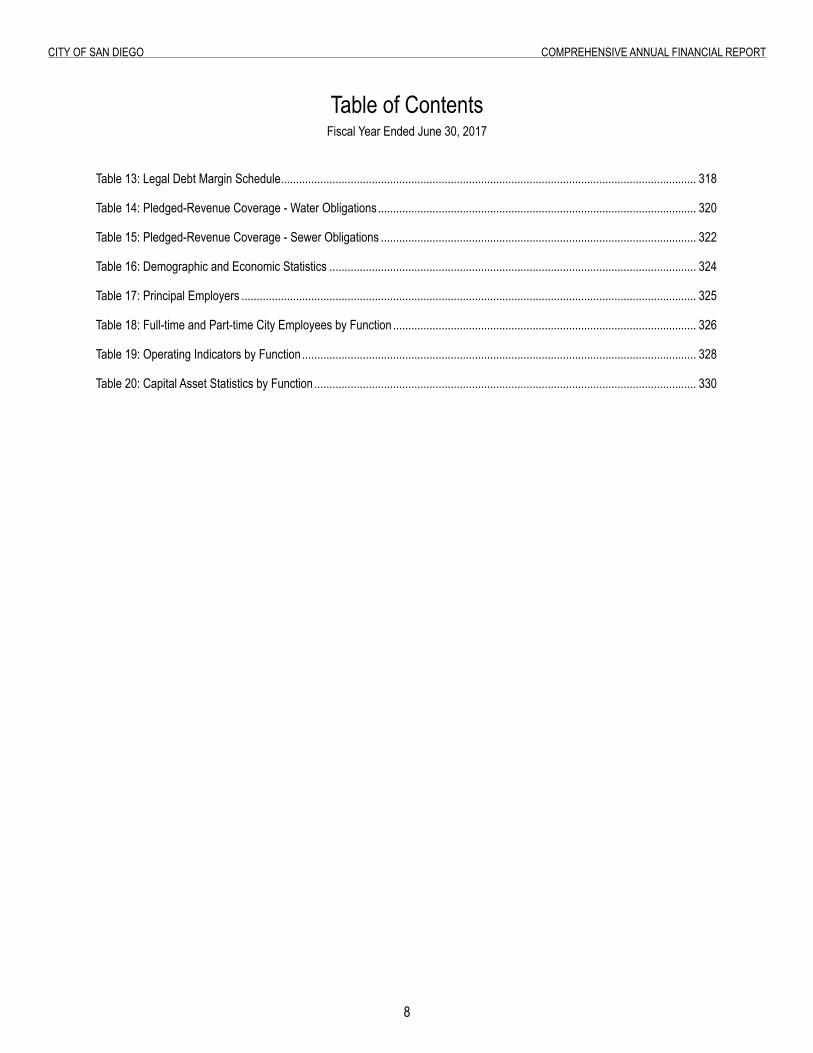
Table 13: Legal Debt Margin Schedule ......................................................................................................................................... 318
Table 14: Pledged-Revenue Coverage - Water Obligations ......................................................................................................... 320
Table 15: Pledged-Revenue Coverage - Sewer Obligations ........................................................................................................ 322
Table 16: Demographic and Economic Statistics ......................................................................................................................... 32�
table 17: principal employers ...................................................................................................................................................... 325
Table 18: Full-time and Part-time City Employees by Function .................................................................................................... 326
Table 19: Operating Indicators by Function .................................................................................................................................. 328
table 20: Capital asset Statistics by function .............................................................................................................................. 330
9
City of San Diego ComprehenSive annual finanCial report
FORWARD-LOOKING STATEMENTS
The Comprehensive Annual Financial Report (CAFR) of the City of San Diego for the fiscal year ended June 30, 2017, including the Letter of Transmittal and Management’s Discussion and Analysis, contains forward-looking statements regarding the City of San Diego’s (City) business, financial condition, results of operations and prospects. Words such as “expects,” “anticipates,” “intends,” “plans,” “believes,” “seeks,” “estimates” and similar expressions or variations of such words are intended to identify forward-looking statements, but are not the exclusive means of identifying forward-looking statements in the CAFR. Additionally, statements concerning future matters such as City budgets and the financial outlook for future years, the level of City services, California state matters that may impact the City, contingencies, revenue and expense levels, expected completion dates for projects and other statements regarding matters that are not historical are also forward-looking statements.
Although forward-looking statements in the CAFR reflect the City’s good faith judgment, such statements can only be based on facts and factors currently known by the City. Consequently, forward-looking statements are inherently subject to risks and uncertainties. The actual results and outcomes may differ materially from the results and outcomes discussed in or anticipated by the forward-looking statements. Readers are urged not to place undue reliance on these forward-looking statements, which speak only as of the date of the CAFR. The City undertakes no obligation to revise or update any forward-looking statements in order to reflect any event or circumstance that may arise after the date of the CAFR. Readers are urged to carefully review and consider the various disclosures made in the CAFR which attempt to advise interested parties of factors that may affect the business, financial condition, results of operations and prospects of the City.

this page intentionally left Blank
10
Page Intentionally Left Blank
INTRODUCTORY SECTION (UNAUDITED)
introDuCtory SeCtion (UNAUDITED)
INTRODUCTORY SECTION(UNAUDITED)

13
City of San Diego ComprehenSive annual finanCial report
letter of transmittal
December 14, 2017 To the Honorable Mayor, Members of the City Council and Residents of the City of San Diego: We are pleased to submit the Comprehensive Annual Financial Report (CAFR) of the City of San Diego (City) for the fiscal year (FY) ended June 30, 2017, in accordance with Section 111 of the City Charter (Charter). The CAFR has been prepared in accordance with accounting principles generally accepted in the United States of America. The City’s management is responsible for the accuracy of the data, the completeness and fairness of the presentation and the adequacy of its disclosures. This includes the design, implementation and maintenance of internal controls over the preparation and fair presentation of financial statements that are free from material misstatement and for assurance that the assets of the City are protected from loss, theft or misuse. Because the cost of internal controls should not exceed the anticipated benefits, the objective is to provide reasonable, rather than absolute, assurance that the financial statements are free from any material misstatements. We believe that the information presented is complete and reliable in all material respects. The independent audit firm of Macias Gini & O’Connell LLP has audited the fiscal year 2017 financial statements of the City and has issued an unmodified opinion on the basic financial statements. The independent auditor’s report is located at the front of the financial section of this report. A narrative introduction, overview and analysis of the financial statements can be found in the Management’s Discussion and Analysis (MD&A), which immediately follows the independent auditor’s report. The MD&A complements this letter of transmittal and both should be read in conjunction. The notes, along with the other financial and operational data included in the City’s CAFR, must be read in their entirety to obtain a complete understanding of the City’s financial position as of June 30, 2017 and the respective changes in its financial position. Readers of these financial statements should pay particular attention to Notes 12, 13, 17 and 18, concerning Pension Plans, Other Postemployment Benefits, Commitments and Contingencies, respectively. These notes address certain issues underlying the City’s financial condition as well as future potential or anticipated expenses/expenditures related to regulatory and environmental costs. The financial statements included in this report present the balances and activity of the City and its blended, discretely presented and fiduciary component units. Blended component units are presented as funds of the City and include not-for-profit public benefit corporations and other financing authorities. In addition, the CAFR includes the San Diego Housing Commission, a discretely presented component unit. Fiduciary component units include the San Diego City
1�
City of San Diego ComprehenSive annual finanCial report
Employees’ Retirement System (SDCERS) and the Successor Agency of the Redevelopment Agency of the City of San Diego. See Note 1a of the financial statements for more information on the reporting entities of the City. It is important to note that the General Fund’s presentation in the CAFR is different from the presentation in the City’s annual budget. The General Fund in the CAFR incorporates the balances and activity of additional special revenue funds which are not included as part of the General Fund and are reported as separate funds in the budget. All references to the General Fund in the narrative below are based on the General Fund as reported in the CAFR. PROFILE OF THE CITY OF SAN DIEGO
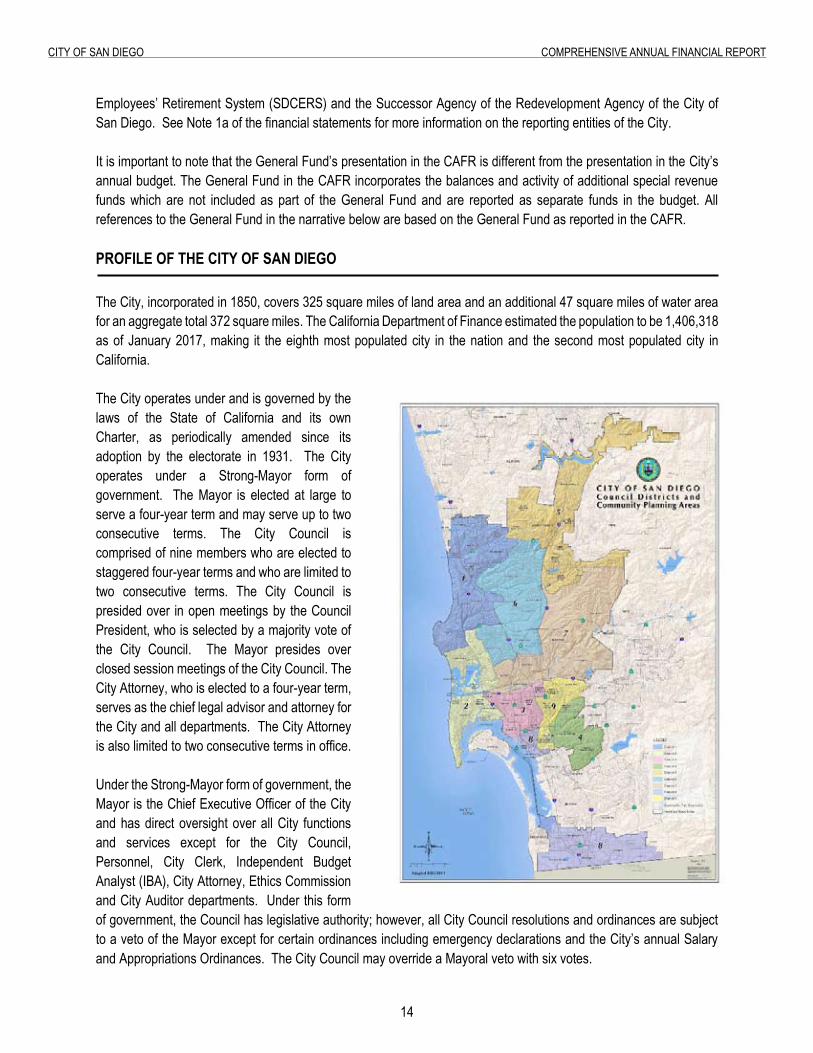
The City, incorporated in 1850, covers 325 square miles of land area and an additional 47 square miles of water area for an aggregate total 372 square miles. The California Department of Finance estimated the population to be 1,406,318 as of January 2017, making it the eighth most populated city in the nation and the second most populated city in California. The City operates under and is governed by the laws of the State of California and its own Charter, as periodically amended since its adoption by the electorate in 1931. The City operates under a Strong-Mayor form of government. The Mayor is elected at large to serve a four-year term and may serve up to two consecutive terms. The City Council is comprised of nine members who are elected to staggered four-year terms and who are limited to two consecutive terms. The City Council is presided over in open meetings by the Council President, who is selected by a majority vote of the City Council. The Mayor presides over closed session meetings of the City Council. The City Attorney, who is elected to a four-year term, serves as the chief legal advisor and attorney for the City and all departments. The City Attorney is also limited to two consecutive terms in office. Under the Strong-Mayor form of government, the Mayor is the Chief Executive Officer of the City and has direct oversight over all City functions and services except for the City Council, Personnel, City Clerk, Independent Budget Analyst (IBA), City Attorney, Ethics Commission and City Auditor departments. Under this form of government, the Council has legislative authority; however, all City Council resolutions and ordinances are subject to a veto of the Mayor except for certain ordinances including emergency declarations and the City’s annual Salary and Appropriations Ordinances. The City Council may override a Mayoral veto with six votes.
15
City of San Diego ComprehenSive annual finanCial report
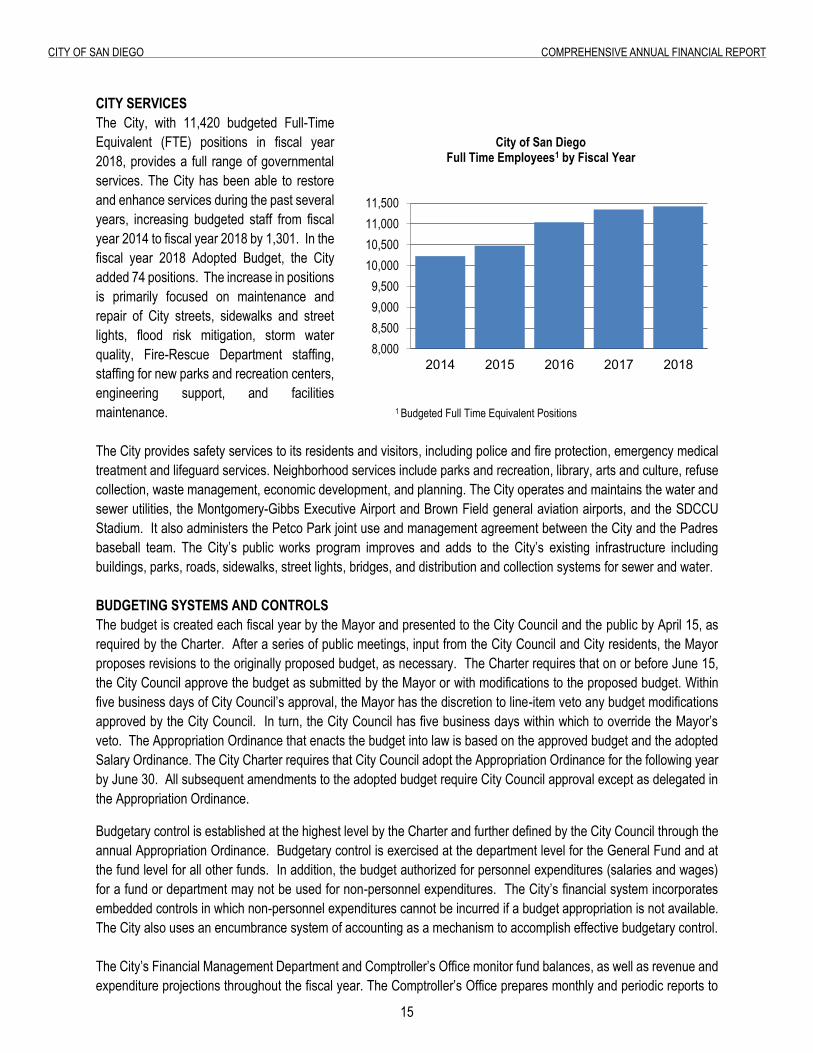
CITY SERVICES The City, with 11,420 budgeted Full-Time Equivalent (FTE) positions in fiscal year 2018, provides a full range of governmental services. The City has been able to restore and enhance services during the past several years, increasing budgeted staff from fiscal year 2014 to fiscal year 2018 by 1,301. In the fiscal year 2018 Adopted Budget, the City added 74 positions. The increase in positions is primarily focused on maintenance and repair of City streets, sidewalks and street lights, flood risk mitigation, storm water quality, Fire-Rescue Department staffing, staffing for new parks and recreation centers, engineering support, and facilities maintenance. 1 Budgeted Full Time Equivalent Positions The City provides safety services to its residents and visitors, including police and fire protection, emergency medical treatment and lifeguard services. Neighborhood services include parks and recreation, library, arts and culture, refuse collection, waste management, economic development, and planning. The City operates and maintains the water and sewer utilities, the Montgomery-Gibbs Executive Airport and Brown Field general aviation airports, and the SDCCU Stadium. It also administers the Petco Park joint use and management agreement between the City and the Padres baseball team. The City’s public works program improves and adds to the City’s existing infrastructure including buildings, parks, roads, sidewalks, street lights, bridges, and distribution and collection systems for sewer and water. BUDGETING SYSTEMS AND CONTROLS The budget is created each fiscal year by the Mayor and presented to the City Council and the public by April 15, as required by the Charter. After a series of public meetings, input from the City Council and City residents, the Mayor proposes revisions to the originally proposed budget, as necessary. The Charter requires that on or before June 15, the City Council approve the budget as submitted by the Mayor or with modifications to the proposed budget. Within five business days of City Council’s approval, the Mayor has the discretion to line-item veto any budget modifications approved by the City Council. In turn, the City Council has five business days within which to override the Mayor’s veto. The Appropriation Ordinance that enacts the budget into law is based on the approved budget and the adopted Salary Ordinance. The City Charter requires that City Council adopt the Appropriation Ordinance for the following year by June 30. All subsequent amendments to the adopted budget require City Council approval except as delegated in the Appropriation Ordinance.
Budgetary control is established at the highest level by the Charter and further defined by the City Council through the annual Appropriation Ordinance. Budgetary control is exercised at the department level for the General Fund and at the fund level for all other funds. In addition, the budget authorized for personnel expenditures (salaries and wages) for a fund or department may not be used for non-personnel expenditures. The City’s financial system incorporates embedded controls in which non-personnel expenditures cannot be incurred if a budget appropriation is not available. The City also uses an encumbrance system of accounting as a mechanism to accomplish effective budgetary control. The City’s Financial Management Department and Comptroller’s Office monitor fund balances, as well as revenue and expenditure projections throughout the fiscal year. The Comptroller’s Office prepares monthly and periodic reports to
8,0008,5009,0009,500
10,00010,50011,00011,500
2014 2015 2016 2017 2018
City of San DiegoFull Time Employees1 by Fiscal Year
16
City of San Diego ComprehenSive annual finanCial report
the City Council that each serve as a summary of the year-to-date financial activity of the General Fund and other budgeted funds. The Financial Management Department prepares an analysis of actual and projected financial activity for the entire fiscal year on a quarterly basis by issuing three budget monitoring reports during the year (First Quarter, Mid-Year, and Year-End Budget Monitoring Reports). Subsequent to the end of the fiscal year, the Financial Management Department, in collaboration with the Comptroller’s Office, prepares a report analyzing and explaining variances between year-end projections and unaudited year-end actual revenues and expenditures for the General Fund.
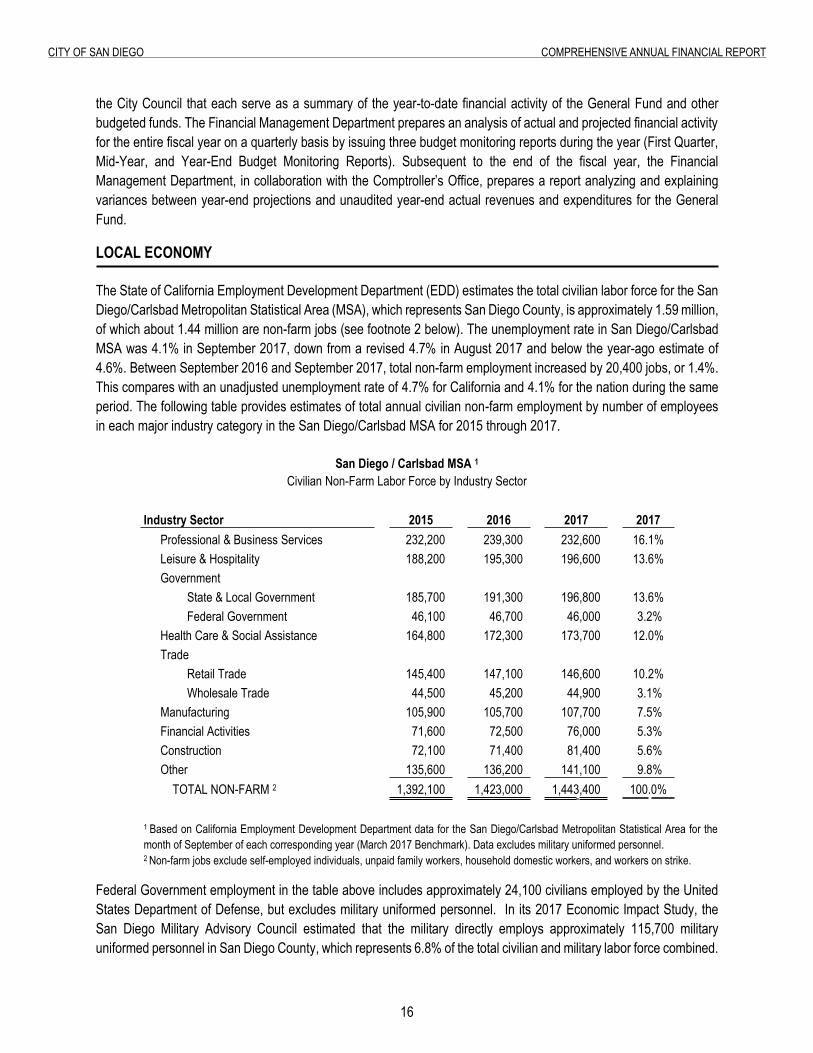
LOCAL ECONOMY The State of California Employment Development Department (EDD) estimates the total civilian labor force for the San Diego/Carlsbad Metropolitan Statistical Area (MSA), which represents San Diego County, is approximately 1.59 million, of which about 1.44 million are non-farm jobs (see footnote 2 below). The unemployment rate in San Diego/Carlsbad MSA was 4.1% in September 2017, down from a revised 4.7% in August 2017 and below the year-ago estimate of 4.6%. Between September 2016 and September 2017, total non-farm employment increased by 20,400 jobs, or 1.4%. This compares with an unadjusted unemployment rate of 4.7% for California and 4.1% for the nation during the same period. The following table provides estimates of total annual civilian non-farm employment by number of employees in each major industry category in the San Diego/Carlsbad MSA for 2015 through 2017.
San Diego / Carlsbad MSA 1
Civilian Non-Farm Labor Force by Industry Sector
Industry Sector 2015 2016 2017 2017 Professional & Business Services 232,200 239,300 232,600 16.1% Leisure & Hospitality 188,200 195,300 196,600 13.6% Government
State & Local Government 185,700 191,300 196,800 13.6% Federal Government 46,100 46,700 46,000 3.2%
Health Care & Social Assistance 164,800 172,300 173,700 12.0% Trade
Retail Trade 145,400 147,100 146,600 10.2% Wholesale Trade 44,500 45,200 44,900 3.1%
Manufacturing 105,900 105,700 107,700 7.5% Financial Activities 71,600 72,500 76,000 5.3% Construction 72,100 71,400 81,400 5.6% Other 135,600 136,200 141,100 9.8% TOTAL NON-FARM 2 1,392,100 1,423,000 1,443,400 100.0%
1 Based on California Employment Development Department data for the San Diego/Carlsbad Metropolitan Statistical Area for the
month of September of each corresponding year (March 2017 Benchmark). Data excludes military uniformed personnel. 2 Non-farm jobs exclude self-employed individuals, unpaid family workers, household domestic workers, and workers on strike.
Federal Government employment in the table above includes approximately 24,100 civilians employed by the United States Department of Defense, but excludes military uniformed personnel. In its 2017 Economic Impact Study, the San Diego Military Advisory Council estimated that the military directly employs approximately 115,700 military uniformed personnel in San Diego County, which represents 6.8% of the total civilian and military labor force combined.
17
City of San Diego ComprehenSive annual finanCial report
MAJOR INDUSTRIES San Diego’s economic base has evolved from one with a greater reliance on defense spending and tourism to one that includes more high-technology manufacturing and an expanded international trade sector. The City’s Economic Development Strategy for 2017 through 2019, prepared by the City’s Economic Development Department and adopted by the City Council in December 2016, identified four economic base industries in San Diego: (1) manufacturing and innovation, (2) international trade and logistics, (3) military installations, and (4) tourism. These are sectors that bring money and wealth into the region by exporting goods and services to the rest of the nation and the world. The City’s economic base is anchored by higher education and major scientific research institutions, including the University of California San Diego, San Diego State University, Scripps Research Institute, the Salk Institute for Biological Studies, and the San Diego Supercomputer Center. This provides a research and development foundation that helps create new products, which can then be manufactured in the region, especially in biotech and high-tech. San Diego’s manufacturing sector is diverse, including several manufacturing clusters: biotech; cleantech; defense and security systems; electronics and telecommunications; and food and beverage production. With its proximity to Mexico and the Pacific Rim, San Diego is in a unique geographical position that creates opportunities for growth in international trade. The proximity of Mexican manufacturing to the United States often makes “near-sourcing” of manufacturing back to Mexico attractive for U.S. companies. The Port of San Diego, built around one of the world’s great natural harbors, also facilitates international trade which provides for the importation of a wide variety of bulk products and large equipment. According to the U.S. Department of Commerce, in 2016, the San Diego area was the 20th largest merchandise exporter in the U.S. with an export value of $18.1 billion, an increase of 33% since 2006. On average, exports from the San Diego area have increased by 2.9% annually over the past 10 years. The military continues to play a significant role in the San Diego economy. The San Diego Military Advisory Council (SDMAC) issued a Military Economic Impact Study in November 2017 (SDMAC Study) estimating that in 2017 defense-related activities and spending will generate approximately $50.1 billion of Gross Regional Product (GRP) for San Diego County, or 22% of the region’s total GRP. Approximately 115,700 uniformed military and 24,100 U.S. Department of Defense (DoD) civilians work at various locations throughout San Diego County. The SDMAC Study estimates $25.2 billion in federal defense funds allocated to San Diego County, an increase of 3.2% from the previous year. This direct spending is estimated to rise approximately 3.8% in fiscal year 2018. Tourism is a major economic driver for the City. In March 2016, San Diego was ranked as the best domestic travel destination by Time.com because of its combination of outdoor attractions, cultural landmarks, great weather and affordable hotels. According to the San Diego Tourism Authority (SDTA), the hospitality industry employs approximately 184,000 people as of January 2017 throughout the County. The SDTA further states that San Diego hosted 34.9 million visitors in calendar year 2016 who spent over $10.4 billion at local businesses and generated $267 million in Transient Occupancy Tax for the San Diego region during fiscal year 2016.
18
City of San Diego ComprehenSive annual finanCial report
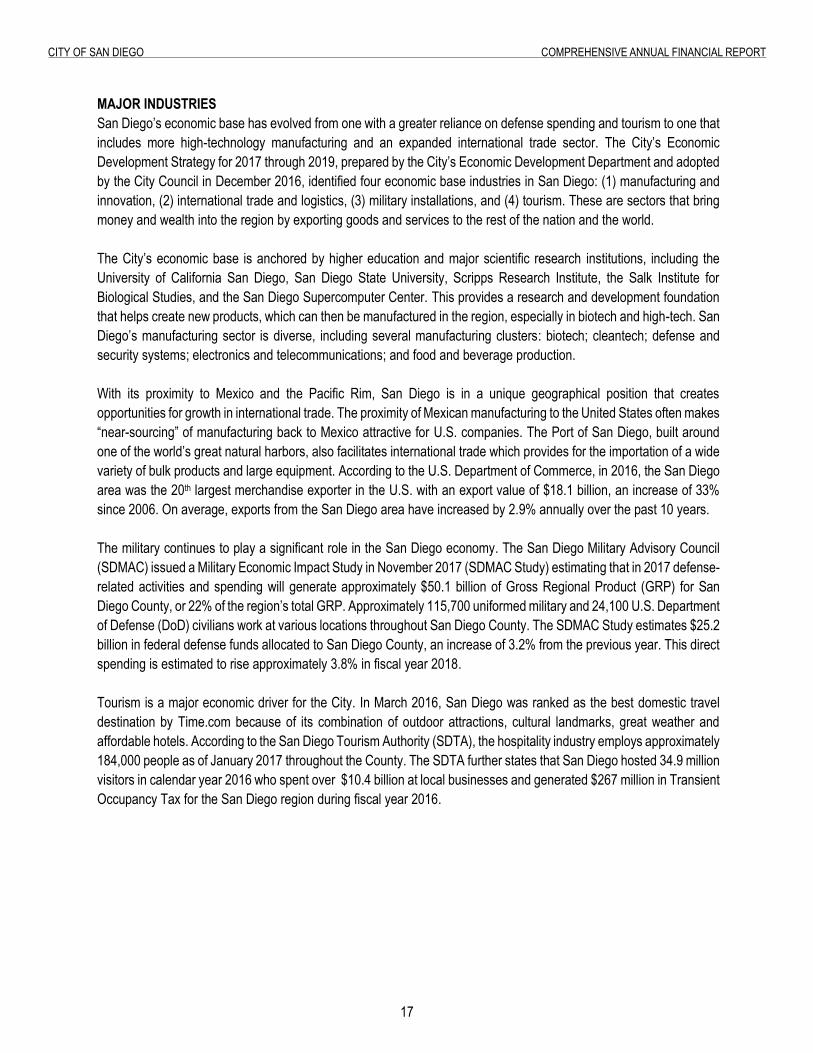
FINANCIAL AND ECONOMIC TRENDS In fiscal year 2017, the General Fund’s four major operating revenue sources - property tax, sales tax, transient occupancy tax (TOT), and franchise fees (unrestricted) - made up 68% of total General Fund revenues. Based on revenue projections for the first quarter of fiscal year 2018, major revenues for the General Fund are expected to increase by $36.5 million (3.6%) compared to major revenues reported for the General Fund in the fiscal year 2017 basic financial statements.
The table below shows historical trends for the General Fund major revenues for the past four fiscal years and revenue projections for fiscal year 2018.
General Fund Major Revenues by Fiscal Year (Dollars in Thousands)
1 Source: Fiscal Year 2018 First Quarter Budget Monitoring Report – Financial Management Department, City of San Diego. 2 Includes Safety Sales Tax. 3 Includes the General Fund portion of Transient Occupancy Tax (5.5% of the 10.5% levy). $105.4 million was deposited into the TOT Special Revenue Fund in fiscal year 2017. 4 Excludes $13.9 million of SDG&E franchise fee revenue restricted by the Charter to preserve and enhance the environment of the City. Property Tax Property Tax revenue is the largest revenue source for the General Fund, representing 37.2% of total General Fund revenue recognized in fiscal year 2017. There is a two year lag between the time at which property values are assessed by the County of San Diego and the time the property tax revenue is received by the City. Therefore, the property tax revenue received in fiscal year 2017 and the estimated revenue for fiscal year 2018 are based on assessments from January 1, 2015 and 2016, respectively. The 6.0% growth rate projected for property tax revenue in fiscal year 2018 in the First Quarter Budget Monitoring Report, is based on year over year increases in the median home price of 6.3% and an increase in home sales of 2.6%. The fiscal year 2018 Assessed valuation of properties not sold or otherwise improved, in accordance with limits established by Proposition 13, is based on the change in the California Consumer Price Index (CCPI) from October 2015 to October 2016. During this period, the CCPI increased by 2.6%. Furthermore, Proposition 13 limits the inflation factor to 2.0%, therefore the assessed valuation of properties not sold or otherwise improved will increase their taxable basis by 2.0%.
2014 2015 2016 2017 2018 1
Property Tax $ 460,592 $ 449,244 $ 471,321 $ 506,197 $ 539,323 Sales Tax 2 254,219 265,295 284,448 280,558 287,070 TOT 3 89,673 98,138 107,675 116,869 123,279 Franchise Fees 4 71,953 81,251 81,929 73,080 75,597
TOTAL $ 876,437 $ 893,928 $ 945,373 $ 976,704 $ 1,025,269
Major Revenues
68%
Other Revenue
32%
General Fund Revenues - Fiscal Year 2017
19
City of San Diego ComprehenSive annual finanCial report
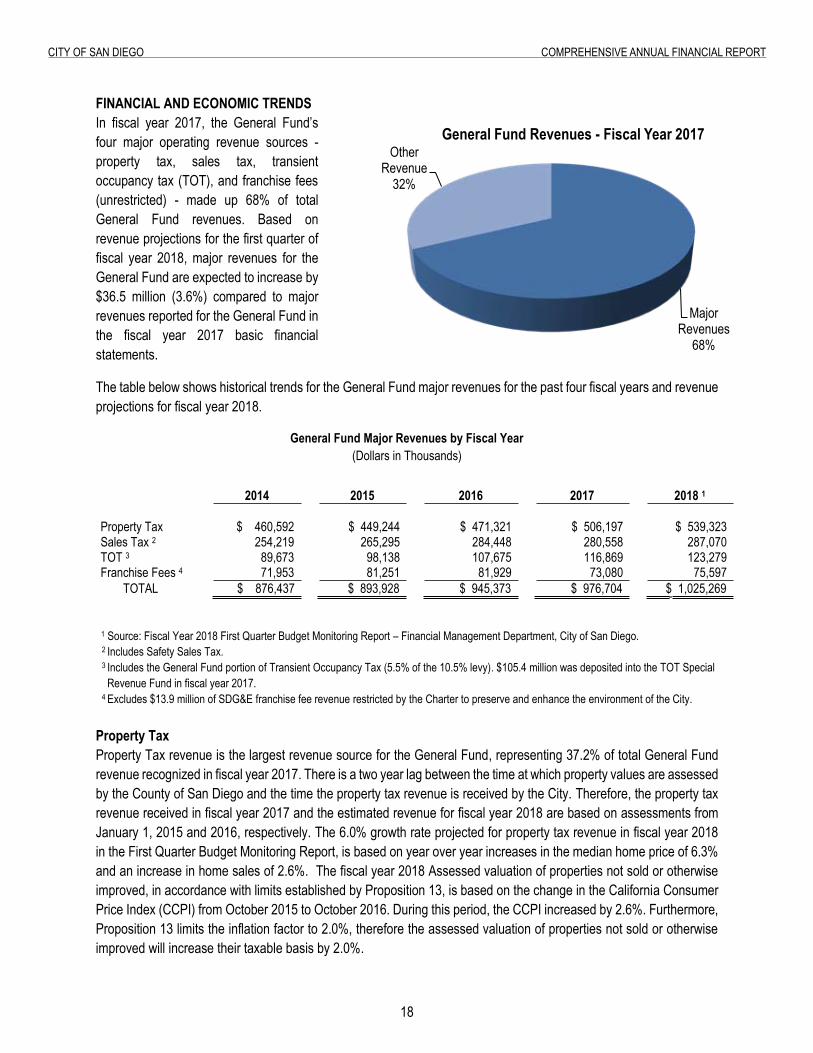
Property tax revenue trends have been affected by tax sharing distributions resulting from the dissolution of the former redevelopment agency. The City receives tax sharing distributions in accordance with redevelopment dissolution laws and a proportional share of residual property tax payments of funds remaining in the Redevelopment Property Tax Trust Fund (RPTTF) after Recognized Obligation Payments are made. The amount of these payments has varied over the last four fiscal years. The graph below shows property taxes, net of tax sharing amounts, for fiscal years 2013 through 2017, and the corresponding tax sharing amounts for each respective fiscal year (projected amounts for fiscal year 2018).
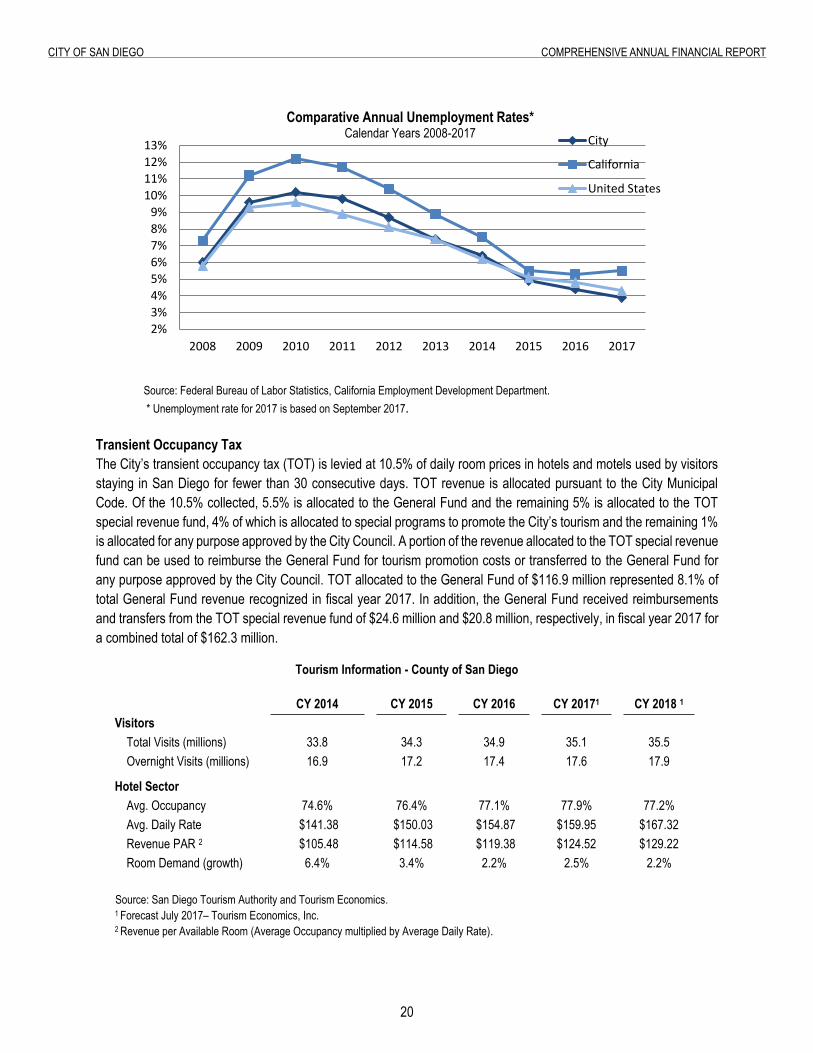
* Source: Fiscal Year 2018 First Quarter Budget Monitoring Report – Financial Management Department, City of San Diego Sales Tax The City’s second largest revenue source for the General Fund is Sales Tax, representing 19.5% of total General Fund revenue recognized in fiscal year 2017. The total citywide sales tax rate in San Diego is 8.0%, of which the City receives approximately 1.0% for general purposes. The City also receives a portion of the 0.5% collected by SanDAG for the TransNet program to fund transportation improvements throughout the City, and a portion of the 0.5% Safety Sales Tax to fund local public safety needs. General purpose and Safety Sales Tax are deposited in the General Fund, while TransNet sales tax revenue is deposited in the Transnet Capital Projects Fund. The major local economic drivers of the City’s Sales Tax revenue include the unemployment rate and consumer confidence. The unemployment rate for the City was 3.9% in September 2017, down from 4.5% in September 2016 and 4.4% in September 2015. The unemployment rate has returned to pre-recession levels, when the unemployment rate ranged between 4% and 5%. A lower local unemployment rate generally improves consumer confidence which, in turn, improves the City’s sales tax receipts. In fiscal year 2017, actual sales tax revenue were lower than anticipated. While the local economic indicators for sales tax are positive and stable, growth in sales tax will be restrained by online sales. As consumers shift from in-store purchases to online sales, the City receives a smaller portion of sales tax revenues. Based on the fiscal year 2018 projection, the City estimates a year-over-year decrease in Sales Tax revenue of approximately $5.5 million (-2.0%) compared to fiscal year 2017 actual revenue recognized.
408,772 431,421
457,955 482,944
512,162 $51,820 $17,823
$13,366
$23,253
$27,161
350,000 370,000 390,000 410,000 430,000 450,000 470,000 490,000 510,000 530,000 550,000
2014 2015 2016 2017 2018 Estimate*
Property Taxes by Fiscal Year(Dollars in Thousands)
Property Taxes - Excluding Tax Sharing Tax Sharing
20
City of San Diego ComprehenSive annual finanCial report
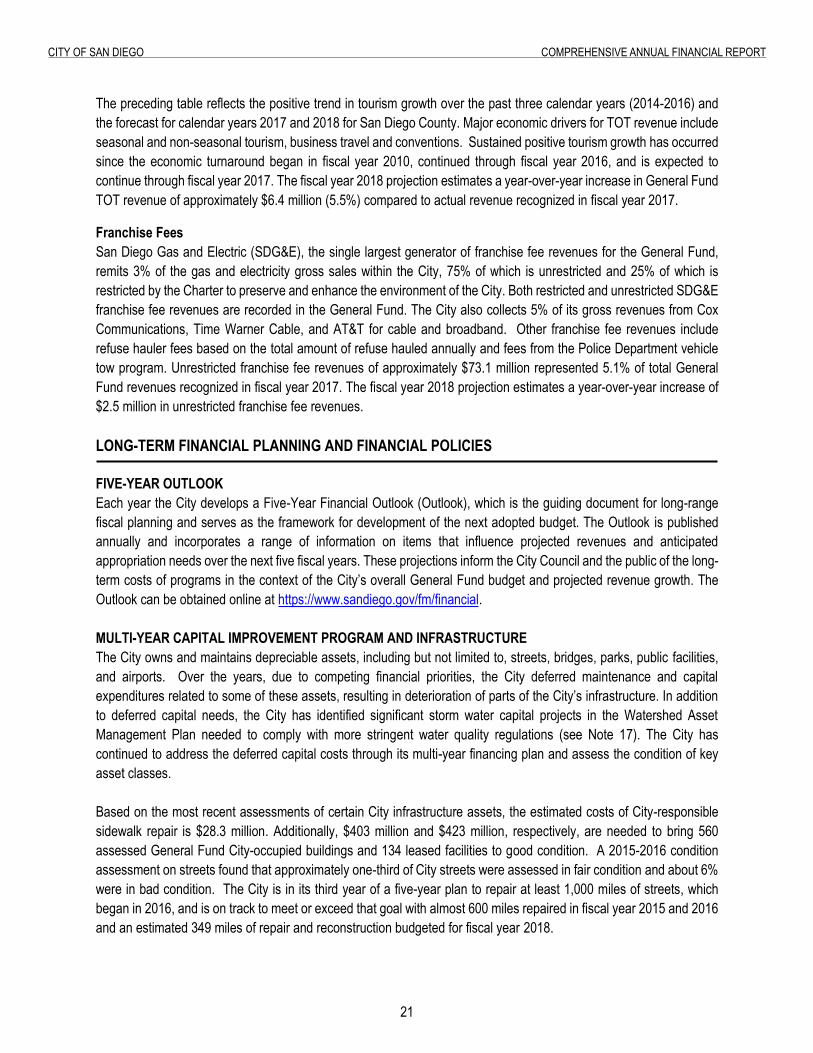
Source: Federal Bureau of Labor Statistics, California Employment Development Department. * Unemployment rate for 2017 is based on September 2017. Transient Occupancy Tax The City’s transient occupancy tax (TOT) is levied at 10.5% of daily room prices in hotels and motels used by visitors staying in San Diego for fewer than 30 consecutive days. TOT revenue is allocated pursuant to the City Municipal Code. Of the 10.5% collected, 5.5% is allocated to the General Fund and the remaining 5% is allocated to the TOT special revenue fund, 4% of which is allocated to special programs to promote the City’s tourism and the remaining 1% is allocated for any purpose approved by the City Council. A portion of the revenue allocated to the TOT special revenue fund can be used to reimburse the General Fund for tourism promotion costs or transferred to the General Fund for any purpose approved by the City Council. TOT allocated to the General Fund of $116.9 million represented 8.1% of total General Fund revenue recognized in fiscal year 2017. In addition, the General Fund received reimbursements and transfers from the TOT special revenue fund of $24.6 million and $20.8 million, respectively, in fiscal year 2017 for a combined total of $162.3 million.
Tourism Information - County of San Diego
CY 2014 CY 2015 CY 2016 CY 20171 CY 2018 1
Visitors Total Visits (millions) 33.8 34.3 34.9 35.1 35.5 Overnight Visits (millions) 16.9 17.2 17.4 17.6 17.9
Hotel Sector Avg. Occupancy 74.6% 76.4% 77.1% 77.9% 77.2% Avg. Daily Rate $141.38 $150.03 $154.87 $159.95 $167.32 Revenue PAR 2 $105.48 $114.58 $119.38 $124.52 $129.22 Room Demand (growth) 6.4% 3.4% 2.2% 2.5% 2.2%
Source: San Diego Tourism Authority and Tourism Economics. 1 Forecast July 2017– Tourism Economics, Inc. 2 Revenue per Available Room (Average Occupancy multiplied by Average Daily Rate).
2%3%4%5%6%7%8%9%
10%11%12%13%
2008 2009 2010 2011 2012 2013 2014 2015 2016 2017
City
California
United States
Comparative Annual Unemployment Rates*Calendar Years 2008-2017
21
City of San Diego ComprehenSive annual finanCial report
The preceding table reflects the positive trend in tourism growth over the past three calendar years (2014-2016) and the forecast for calendar years 2017 and 2018 for San Diego County. Major economic drivers for TOT revenue include seasonal and non-seasonal tourism, business travel and conventions. Sustained positive tourism growth has occurred since the economic turnaround began in fiscal year 2010, continued through fiscal year 2016, and is expected to continue through fiscal year 2017. The fiscal year 2018 projection estimates a year-over-year increase in General Fund TOT revenue of approximately $6.4 million (5.5%) compared to actual revenue recognized in fiscal year 2017.
Franchise Fees San Diego Gas and Electric (SDG&E), the single largest generator of franchise fee revenues for the General Fund, remits 3% of the gas and electricity gross sales within the City, 75% of which is unrestricted and 25% of which is restricted by the Charter to preserve and enhance the environment of the City. Both restricted and unrestricted SDG&E franchise fee revenues are recorded in the General Fund. The City also collects 5% of its gross revenues from Cox Communications, Time Warner Cable, and AT&T for cable and broadband. Other franchise fee revenues include refuse hauler fees based on the total amount of refuse hauled annually and fees from the Police Department vehicle tow program. Unrestricted franchise fee revenues of approximately $73.1 million represented 5.1% of total General Fund revenues recognized in fiscal year 2017. The fiscal year 2018 projection estimates a year-over-year increase of $2.5 million in unrestricted franchise fee revenues. LONG-TERM FINANCIAL PLANNING AND FINANCIAL POLICIES FIVE-YEAR OUTLOOK Each year the City develops a Five-Year Financial Outlook (Outlook), which is the guiding document for long-range fiscal planning and serves as the framework for development of the next adopted budget. The Outlook is published annually and incorporates a range of information on items that influence projected revenues and anticipated appropriation needs over the next five fiscal years. These projections inform the City Council and the public of the long-term costs of programs in the context of the City’s overall General Fund budget and projected revenue growth. The Outlook can be obtained online at https://www.sandiego.gov/fm/financial. MULTI-YEAR CAPITAL IMPROVEMENT PROGRAM AND INFRASTRUCTURE The City owns and maintains depreciable assets, including but not limited to, streets, bridges, parks, public facilities, and airports. Over the years, due to competing financial priorities, the City deferred maintenance and capital expenditures related to some of these assets, resulting in deterioration of parts of the City’s infrastructure. In addition to deferred capital needs, the City has identified significant storm water capital projects in the Watershed Asset Management Plan needed to comply with more stringent water quality regulations (see Note 17). The City has continued to address the deferred capital costs through its multi-year financing plan and assess the condition of key asset classes. Based on the most recent assessments of certain City infrastructure assets, the estimated costs of City-responsible sidewalk repair is $28.3 million. Additionally, $403 million and $423 million, respectively, are needed to bring 560 assessed General Fund City-occupied buildings and 134 leased facilities to good condition. A 2015-2016 condition assessment on streets found that approximately one-third of City streets were assessed in fair condition and about 6% were in bad condition. The City is in its third year of a five-year plan to repair at least 1,000 miles of streets, which began in 2016, and is on track to meet or exceed that goal with almost 600 miles repaired in fiscal year 2015 and 2016 and an estimated 349 miles of repair and reconstruction budgeted for fiscal year 2018.
22
City of San Diego ComprehenSive annual finanCial report
These assessments cover only a subset of City assets and represent a portion of the City’s deferred maintenance and infrastructure needs. As additional assessments for parks, public utility assets, and other essential public infrastructure are conducted, the City will continue to gain a better understanding of funding needs. Generally, the City has discretion on the condition levels at which City assets are maintained. Therefore, deferred maintenance on City assets does not constitute a liability of the City. There are, however, significant commitments and contingent liabilities related to infrastructure spending and other requirements disclosed in notes 17 and 18. Spending priorities on asset maintenance and infrastructure are reassessed annually and incorporated into the budget process in order to ensure that condition level goals are met in a manner that is balanced with other budget priorities and spending requirements. A financial plan for addressing General Fund deferred capital needs was initiated in 2009 with the issuance of $103 million in Lease Revenue Bonds. Since then, an additional $230 million in lease revenue bonds have been issued for General Fund infrastructure repair, including streets, facilities and storm drains, and for new facilities. In the 2019-2023 Five Year Outlook released in November 2017, the City expects to finance approximately $270 million for infrastructure spending and deferred capital over the next five years, subject to City Council approval. There are also significant additional revenue sources restricted for capital projects and infrastructure, such as TransNet, proceeds from real property sales, developer impact fees, and capital grants that are anticipated to be invested in City infrastructure and deferred maintenance. Additionally, on June 7, 2016, San Diego residents passed Proposition H, a Charter amendment measure that establishes an infrastructure fund to be used exclusively to pay for capital improvements and repair and maintenance of City infrastructure. Beginning in fiscal year 2018, the City must deposit 50% of major revenue growth over the base year of fiscal year 2016 into the Infrastructure Fund for five years. The fiscal year 2018 adopted budget is $17.8 million. Major revenues are property tax, transient occupancy tax, and unrestricted franchise fees. Thereafter, for the next 20 years, the Infrastructure Fund deposit will be (1) the incremental growth in sales tax from the base year after a CPI allocation to the General Fund, and (2) any savings from a reduction in annual pension payments. RESERVES Strong financial reserves position the City to weather significant economic downturns more effectively and manage the consequences of outside agency actions that may result in revenue reductions. They also serve to address unexpected emergencies such as natural disasters and catastrophic events, unanticipated critical expenditures or legal judgments against the City. The City’s approach to establishing and maintaining strong reserves across the spectrum of City operations, including General Fund, risk management and enterprise operations, is documented in the City’s Reserve Policy.
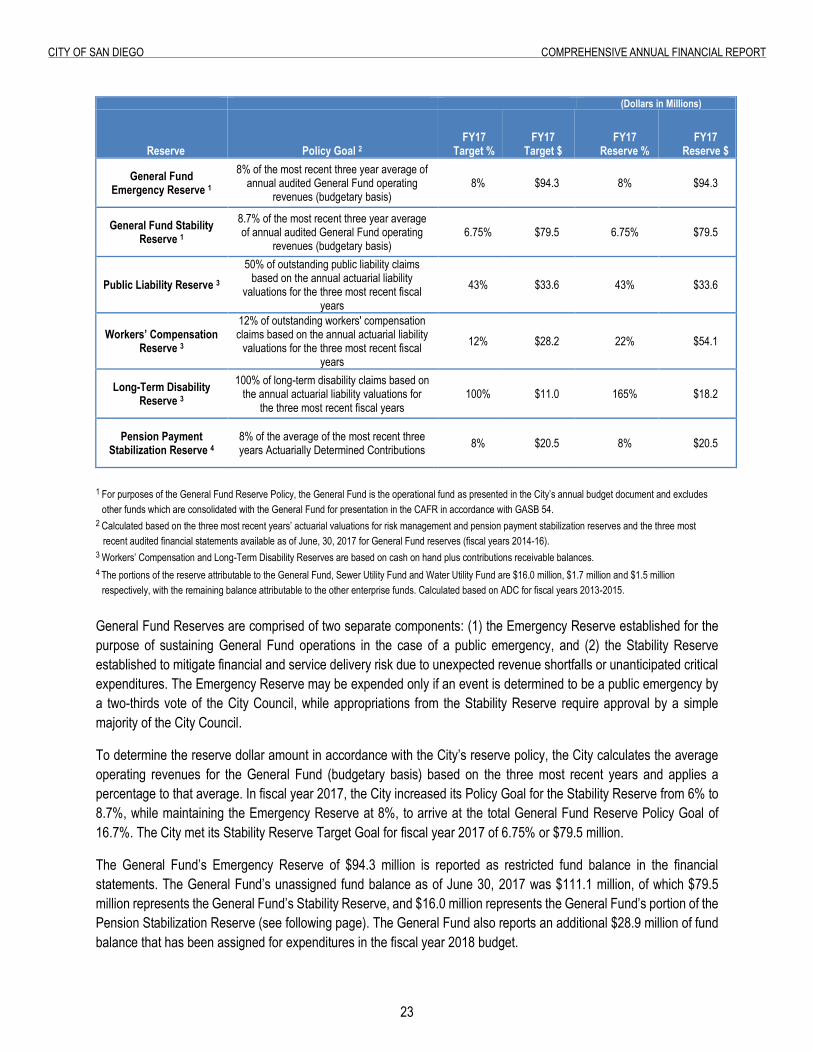
The City’s Reserve Policy establishes policy goals, which represent the total reserve level that the City is trying to achieve for each of its reserves (Policy Goal). For those reserves that are not at Policy Goal levels, the City’s Reserve Policy establishes incremental funding levels for each fiscal year (Target Goal) until arriving at full funding. The following table identifies the Policy Goal, Target Goal (percentage and dollar), and current reserve levels as of the end of fiscal year 2017 for General Fund, Risk Management and Pension Payment Stabilization Reserves.
23
City of San Diego ComprehenSive annual finanCial report
(Dollars in Millions)
Reserve Policy Goal 2 FY17
Target % FY17
Target $ FY17
Reserve % FY17
Reserve $
General Fund Emergency Reserve 1
8% of the most recent three year average of annual audited General Fund operating
revenues (budgetary basis) 8% $94.3 8% $94.3
General Fund Stability Reserve 1
8.7% of the most recent three year average of annual audited General Fund operating
revenues (budgetary basis) 6.75% $79.5 6.75% $79.5
Public Liability Reserve 3 50% of outstanding public liability claims
based on the annual actuarial liability valuations for the three most recent fiscal
years 43% $33.6 43% $33.6
Workers’ Compensation Reserve 3
12% of outstanding workers' compensation claims based on the annual actuarial liability
valuations for the three most recent fiscal years
12% $28.2 22% $54.1
Long-Term Disability Reserve 3
100% of long-term disability claims based on the annual actuarial liability valuations for
the three most recent fiscal years 100% $11.0 165% $18.2
Pension Payment Stabilization Reserve 4
8% of the average of the most recent three years Actuarially Determined Contributions 8% $20.5 8% $20.5
1 For purposes of the General Fund Reserve Policy, the General Fund is the operational fund as presented in the City’s annual budget document and excludes other funds which are consolidated with the General Fund for presentation in the CAFR in accordance with GASB 54.
2 Calculated based on the three most recent years’ actuarial valuations for risk management and pension payment stabilization reserves and the three most recent audited financial statements available as of June, 30, 2017 for General Fund reserves (fiscal years 2014-16). 3 Workers’ Compensation and Long-Term Disability Reserves are based on cash on hand plus contributions receivable balances. 4 The portions of the reserve attributable to the General Fund, Sewer Utility Fund and Water Utility Fund are $16.0 million, $1.7 million and $1.5 million
respectively, with the remaining balance attributable to the other enterprise funds. Calculated based on ADC for fiscal years 2013-2015. General Fund Reserves are comprised of two separate components: (1) the Emergency Reserve established for the purpose of sustaining General Fund operations in the case of a public emergency, and (2) the Stability Reserve established to mitigate financial and service delivery risk due to unexpected revenue shortfalls or unanticipated critical expenditures. The Emergency Reserve may be expended only if an event is determined to be a public emergency by a two-thirds vote of the City Council, while appropriations from the Stability Reserve require approval by a simple majority of the City Council.
To determine the reserve dollar amount in accordance with the City’s reserve policy, the City calculates the average operating revenues for the General Fund (budgetary basis) based on the three most recent years and applies a percentage to that average. In fiscal year 2017, the City increased its Policy Goal for the Stability Reserve from 6% to 8.7%, while maintaining the Emergency Reserve at 8%, to arrive at the total General Fund Reserve Policy Goal of 16.7%. The City met its Stability Reserve Target Goal for fiscal year 2017 of 6.75% or $79.5 million.
The General Fund’s Emergency Reserve of $94.3 million is reported as restricted fund balance in the financial statements. The General Fund’s unassigned fund balance as of June 30, 2017 was $111.1 million, of which $79.5 million represents the General Fund’s Stability Reserve, and $16.0 million represents the General Fund’s portion of the Pension Stabilization Reserve (see following page). The General Fund also reports an additional $28.9 million of fund balance that has been assigned for expenditures in the fiscal year 2018 budget.
2�
City of San Diego ComprehenSive annual finanCial report
The City also maintains reserves to manage risk, including reserves for the payment of claims and judgments (Public Liability Reserve), a reserve for obligations related to workers’ compensation claims (Workers’ Compensation Reserve), and a reserve for long-term disability payments for City employees (Long-Term Disability Reserve). As of June 30, 2017, both the Workers’ Compensation and Long-Term Disability Reserves were funded in excess of Policy Goal levels. The City met its Public Liability Target Goal for fiscal year 2017 of 43% or $33.6 million. The City’s Reserve Policy establishes incremental target levels of funding for the Public Liability Reserve through fiscal year 2019 to arrive at full funding. However, the City’s contribution to the Public Liability Fund Reserve is reassessed annually and incorporated into the budget process in order to ensure that the targeted goal is met in a manner that is balanced with other budget priorities. Public liability and workers’ compensation reserves are reported in the financial statements as part of the General Fund’s committed fund balance. The Long-Term Disability Reserve is reported as cash in the Miscellaneous Internal Service Fund. Liability claims paid after the end of fiscal year 2017 could reduce risk management reserve balances.
In April 2016, the City created the Pension Payment Stabilization Reserve. The purpose of this reserve is to mitigate service delivery risk by providing a source of funding for unanticipated increases in the Actuarially Determined Contribution (ADC). The ADC is calculated by SDCERS’ actuary as part of its annual Actuarial Valuation Report. Unanticipated increases in the ADC could be caused by several factors, such as lower than expected investment returns; changes in actuarial assumptions approved by the SDCERS Board, including a reduction in the discount rate; and other significant liability experience losses. The reserve amount for the various funds is prorated based on the most recently adopted budget allocation. The fiscal year 2018 adopted budget included full utilization of the General Fund and non-General Fund reserves to minimize the impact from the significant increase in the City’s July 1, 2017 ADC payment to $324.5 million.
The City also maintains other reserves for the following enterprise funds: the Water and Sewer Utility Funds, Development Services Fund, Environmental Services Fund, and the Golf Course Fund. Other than the pension payment stabilization reserve, the City has made no draws on its primary reserves.
OTHER FINANCIAL POLICIES In addition to policies related to reserves, budget development, budget monitoring and the Outlook, the City has adopted a comprehensive set of financial policies including policies on debt management, investments, Capital Improvement Program prioritization and transparency, among others. A summary of these policies can be found online at https://www.sandiego.gov/fm/policies. MAJOR ACCOMPLISHMENTS AND INITIATIVES Beginning with the fiscal year 2015 Adopted Budget, Mayor Faulconer committed at least 50% of the City's new major General Fund revenue growth toward infrastructure and street repairs. During fiscal year 2017, the City continued its progress towards Mayor Faulconer’s five-year plan to repair at least 1,000 miles of City Streets, and is on track to meet or exceed the road repair pledge. The City also awarded 85 construction contracts totaling $337 million and 47 architectural engineering and other public works-related contracts totaling $146 million. To foster the sustainability and health of the environment, the City developed a bold Climate Action Plan, which was unanimously approved by the City Council in December 2015. A highlight of the plan is to use 100% renewable energy citywide by 2035, making San Diego the largest city in the country to adopt such a standard. The second annual report issued in October 2017 revealed that the City is seeing early results and remains ahead of schedule of the goal of reducing citywide carbon pollution by 50% by 2035. The report noted that greenhouse gas emissions have been reduced by 19% since 2010, outpacing the 2020 goal of a 15% reduction.
25
City of San Diego ComprehenSive annual finanCial report
A section of San Diego was designated by the U.S. Department of Housing and Urban Development as a Promise Zone and will receive targeted investment to address key challenges. The Federal government will work strategically with the City, local leaders, organizations and residents to boost economic activity and job growth, improve educational opportunities, reduce crime, and leverage private investment to improve the quality of life in neighborhoods from East Village and Barrio Logan in the west extending to Encanto and Emerald Hills in the east, with a population of more than 77,000 residents. The City served as the lead applicant with six implementing partners including the County of San Diego, Civic San Diego, San Diego Housing Commission, Jacobs Center, San Diego Unified School District and San Diego Workforce Partnership. Among its responsibilities as the lead applicant, the City will administer all funding, track and report progress on the program and delegate activities to implementing partners. In the area of water and wastewater infrastructure, the City is furthering the progress on a plan to implement a potable water reuse program (Pure Water) to provide future water reliability to San Diego residents, making the City a leader in water sustainability technology. In July 2017, the Environmental Protection Agency announced that Pure Water had been selected to apply for a federal loan of $492 million which would cover up to approximately 49% of the costs for the first phase of the program. The first phase will be to construct the infrastructure necessary to produce 30 million gallons per day of purified water by 2021. The City’s Information Technology (IT) was ranked third best among cities with populations greater than 500,000 nationwide for using IT to improve services, enhance transparency and boost citizen engagement. The Center of Digital Government, a national research and advisory institute for IT policies and best practices by state and local governments, conducted the ranking as part of its annual Digital Cities Survey. The survey examines the overall performance of existing IT programs and plans. A first-ever national survey by Governing Magazine recognized San Diego among the top 10 best performing cities in the country. The results of the national survey are published in Equipt to Innovate: Becoming a High-Performing City, a report issued in May 2017. The report defines a city as high-performing if it is dynamically planned, broadly partnered, resident involved, race informed, smartly resourced, employee engaged and data driven. As a result of modest positive trends in revenue growth, the fiscal year 2018 Adopted Budget preserves a number of service enhancements added in previous years for residents of San Diego focusing on three strategic goals: achieve safe and livable neighborhoods; create an economically prosperous city; and provide high quality public service. Safe and livable neighborhoods are enhanced through funding for emergency command and data center dispatch, General Fund infrastructure support, police recruitment and retention, parks master plan and new recreation facilities, and library system programming. The fiscal year 2018 budget also recognizes Community Development Block Grant (CDBG) reinvestment, affordable housing, and homeless initiatives. Public service is enhanced through funding and associated revenue to administer and enforce the Cannabis Business Tax, and General Fund and Public Liability reserve levels. The City was able to preserve and enhance these core services, fully fund its pension payment, and fully fund General Fund and Risk Management reserves to policy targets. This was made possible by utilizing the pension stabilization reserve and making strategic operational budget reductions throughout the General Fund. Balancing the General Fund Fiscal Year 2018 budget involved making tough decisions which support the City’s strong commitment to fiscal sustainability. As evidenced through an upgraded Issuer Rating by Fitch Ratings Agency in February 2017, the City continues to exercise responsible fiscal management policies, strong financial planning and disclosure practices. San Diego’s
26
City of San Diego ComprehenSive annual finanCial report
commitment to fiscal stability and financial oversight promotes a healthy financial future and the ability to provide outstanding service to communities throughout the City. ACKNOWLEDGMENTS The Government Finance Officers Association of the United States and Canada (GFOA) awarded a Certificate of Achievement for Excellence in Financial Reporting to the City for its CAFR for the fiscal year ended June 30, 2016. In order to be awarded a Certificate of Achievement, the City had to publish an easily readable and efficiently organized CAFR that satisfied both generally accepted accounting principles and applicable program requirements. A Certificate of Achievement for Excellence in Financial Reporting is valid for a period of one year. We believe our current CAFR continues to meet the requirements of the Certificate of Achievement for Excellence in Financial Reporting Program, and we are submitting it to the GFOA to determine its eligibility for another certificate. The preparation of this report would not have been possible without the dedication and professionalism of the entire staff of the Comptroller’s Office. We wish to thank all City departments for their valuable contributions and thank the staff of Civic San Diego, San Diego Convention Center, San Diego Housing Commission and San Diego City Employees’ Retirement System for providing component unit information which has been incorporated into this report. We also want to thank the City’s independent auditors, Macias Gini & O’Connell LLP for their work. Finally, we would like to thank Mayor Kevin Faulconer for his support in maintaining the highest standards of professionalism in management of the City and the Audit Committee for their governance role over the audit of the CAFR. Respectfully submitted, Scott Chadwick Rolando Charvel Scott Clark Chief Operating Officer Chief Financial Officer Interim City Comptroller
27
City of San Diego ComprehenSive annual finanCial report
Government Finance Officers Association (GFOA) Award
28
City of San Diego ComprehenSive annual finanCial report
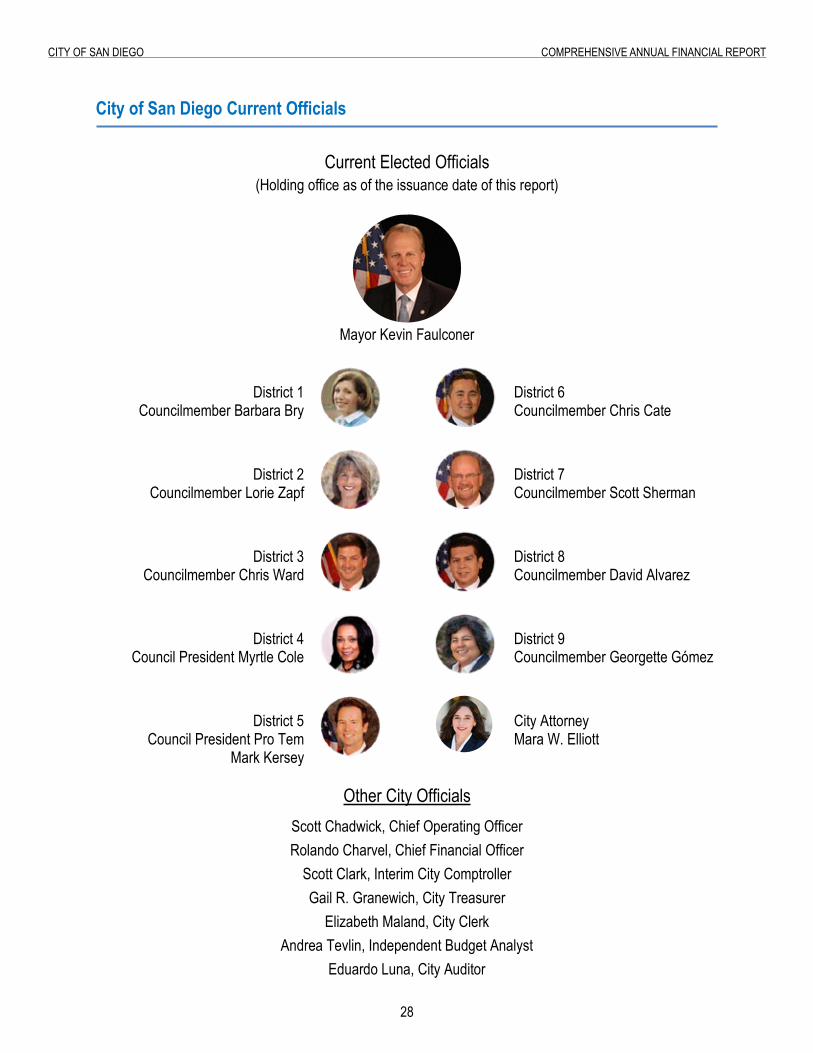
City of San Diego Current Officials
City of San Diego Current Officials
Current Elected Officials (Holding office as of the issuance date of this report)
Mayor Kevin Faulconer
District 1 Councilmember Barbara Bry
District 6 Councilmember Chris Cate
District 2 Councilmember Lorie Zapf
District 7 Councilmember Scott Sherman
District 3 Councilmember Chris Ward
District 8 Councilmember David Alvarez
District 4 Council President Myrtle Cole
District 9 Councilmember Georgette Gómez
District 5 Council President Pro Tem
Mark Kersey
City Attorney Mara W. Elliott
Other City Officials
Scott Chadwick, Chief Operating Officer Rolando Charvel, Chief Financial Officer
Scott Clark, Interim City Comptroller Gail R. Granewich, City Treasurer
Elizabeth Maland, City Clerk Andrea Tevlin, Independent Budget Analyst
Eduardo Luna, City Auditor
29
City of San Diego ComprehenSive annual finanCial report
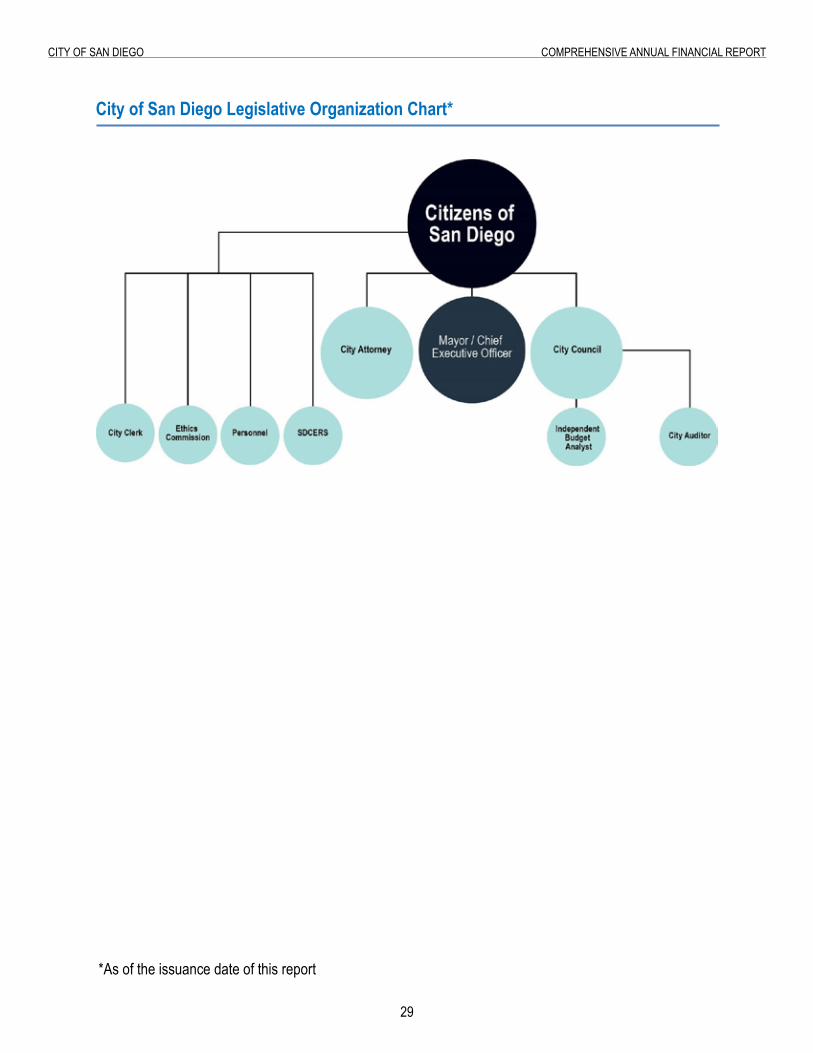
City of San Diego legislative organization Chart
City of San Diego Legislative Organization Chart*
*As of the issuance date of this report
30
City of San Diego ComprehenSive annual finanCial report
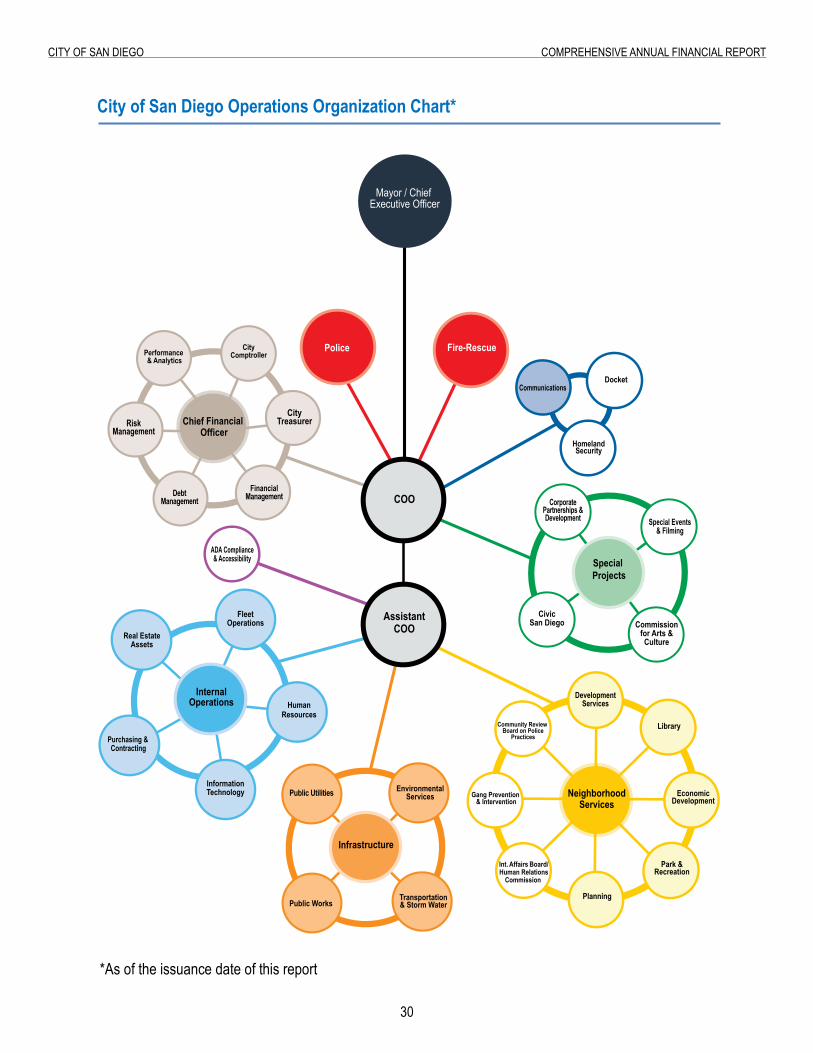
City of San Diego operations organization Chart
AssistantCOO
NeighborhoodServices
FleetOperations
InformationTechnology
Real EstateAssets
Purchasing &Contracting
Police Fire-Rescue
CommunicationsDocket
HomelandSecurity
COO
RiskManagement
CityTreasurer
FinancialManagementDebt
Management
Chief Financial Officer
EnvironmentalServicesPublic Utilities
Public WorksTransportation& Storm Water
Int. Affairs Board/Human Relations
Commission
Planning
EconomicDevelopment
Library
Gang Prevention & Intervention
Park &Recreation
Community Review Board on Police
Practices
ADA Compliance& Accessibility
DevelopmentServices
CityComptroller
CorporatePartnerships &Development Special Events
& Filming
Commissionfor Arts &Culture
CivicSan Diego
Infrastructure
SpecialProjects
HumanResources
InternalOperations
Mayor / Chief Executive Officer
Performance& Analytics
City of San Diego Operations Organization Chart*
*As of the issuance date of this report
finanCial SeCtion
finanCial SeCtion
FINANCIAL SECTION

33
City of San Diego ComprehenSive annual finanCial report
Independent Auditor’s Report
www.mgocpa.comMacias Gini & OÕConnell LLP 225 Broadway, Suite 1750San Diego, CA 92101
Independent Auditor’s Report
To the Honorable Mayor and Members of the City Council of the City of San Diego, California
Report on the Financial Statements
We have audited the accompanying financial statements of the governmental activities, the business-type activities, the discretely presented component unit, each major fund, and the aggregate remaining fund information of the City of San Diego, California (City), as of and for the year ended June 30, 2017, and the related notes to the financial statements, which collectively comprise the City’s basic financial statements as listed in the table of contents.
Management’s Responsibility for the Financial Statements
Management is responsible for the preparation and fair presentation of these financial statements in accordance with accounting principles generally accepted in the United States of America; this includes the design, implementation, and maintenance of internal control relevant to the preparation and fair presentation of financial statements that are free from material misstatement, whether due to fraud or error.
Auditor’s Responsibility
Our responsibility is to express opinions on these financial statements based on our audit. We did not audit the financial statements of the San Diego Housing Commission, a discretely presented component unit,which represents 100% of the assets, net position, and revenues of the discretely presented component unit. Those statements were audited by other auditors whose report has been furnished to us, and our opinion, insofar as it relates to the amounts included for the San Diego Housing Commission, is based solely on the report of the other auditors. We conducted our audit in accordance with auditing standards generally accepted in the United States of America and the standards applicable to financial audits contained in Government Auditing Standards, issued by the Comptroller General of the United States. Those standards require that we plan and perform the audit to obtain reasonable assurance about whether the financial statements are free from material misstatement.
An audit involves performing procedures to obtain audit evidence about the amounts and disclosures in the financial statements. The procedures selected depend on the auditor’s judgment, including the assessment of the risks of material misstatement of the financial statements, whether due to fraud or error. In making those risk assessments, the auditor considers internal control relevant to the entity’s preparation and fair presentation of the financial statements in order to design audit procedures that are appropriate in the circumstances, but not for the purpose of expressing an opinion on the effectiveness of the entity’s internal control. Accordingly, we express no such opinion. An audit also includes evaluating the appropriateness of accounting policies used and the reasonableness of significant accounting estimates made by management, as well as evaluating the overall presentation of the financial statements.
We believe that the audit evidence we have obtained is sufficient and appropriate to provide a basis for our audit opinions.
3�
City of San Diego ComprehenSive annual finanCial report
Opinions In our opinion, based on our audit and the report of other auditors, the financial statements referred to above present fairly, in all material respects, the respective financial position of the governmental activities, the business-type activities, the discretely presented component unit, each major fund, and the aggregate remaining fund information of the City as of June 30, 2017, and the respective changes in financial position and, where applicable, cash flows thereof for the year then ended in accordance with accounting principles generally accepted in the United States of America. Emphasis of Matter As discussed in Notes 1 and 23 to the basic financial statements, effective July 1, 2016, the City adopted the provisions of Governmental Accounting Standards Board (GASB) Statement No. 80, Blending Requirements for Certain Component Units – An Amendment of GASB Statement No. 14. As a result of the implementation of GASB Statement No. 80, the net position as of July 1, 2016, of the business-type activities and the other remaining fund information opinion units were restated and increased by $18,309,000 for inclusion of the San Diego Convention Center Corporation as a blended component unit and the discretely presented component unit opinion unit’s net position was restated and reduced by an equivalent amount. Our opinions are not modified with respect to this matter. Other Matters Required Supplementary Information Accounting principles generally accepted in the United States of America require that the management’s discussion and analysis on pages 37-50; schedule of changes in net pension liability and related ratios, preservation of benefits plan total pension liability, schedule of employer contributions, other postemployment benefit (OPEB) trust fund schedule of funding progress, and OPEB trust fund schedule of employer contributions on pages 195-197; and the general fund schedule of revenues, expenditures and changes in fund balance – budget and actual (budgetary basis) on page 202, be presented to supplement the basic financial statements. Such information, although not a part of the basic financial statements, is required by the Governmental Accounting Standards Board who considers it to be an essential part of financial reporting for placing the basic financial statements in an appropriate operational, economic, or historical context. We have applied certain limited procedures to the required supplementary information in accordance with auditing standards generally accepted in the United States of America, which consisted of inquiries of management about the methods of preparing the information and comparing the information for consistency with management’s responses to our inquiries, the basic financial statements, and other knowledge we obtained during our audit of the basic financial statements. We do not express an opinion or provide any assurance on the information because the limited procedures do not provide us with sufficient evidence to express an opinion or provide any assurance. Other Information Our audit was conducted for the purpose of forming opinions on the financial statements that collectively comprise the City’s basic financial statements. The accompanying introductory section, combining and individual fund financial statements and schedules, and statistical section are presented for purposes of additional analysis and are not a required part of the basic financial statements.
35
City of San Diego ComprehenSive annual finanCial report
The combining and individual fund financial statements and schedules are the responsibility of management and were derived from and relate directly to the underlying accounting and other records used to prepare the basic financial statements. Such information has been subjected to the auditing procedures applied in the audit of the basic financial statements and certain additional procedures, including comparing and reconciling such information directly to the underlying accounting and other records used to prepare the basic financial statements or to the basic financial statements themselves, and other additional procedures in accordance with auditing standards generally accepted in the United States of America. In our opinion, the combining and individual fund financial statements and schedules are fairly stated, in all material respects, in relation to the basic financial statements as a whole.
The introductory and statistical sections have not been subjected to the auditing procedures applied in the audit of the basic financial statements and, accordingly, we do not express an opinion or provide any assurance on them.
Other Reporting Required by Government Auditing Standards
In accordance with Government Auditing Standards, we have also issued our report dated December 14,2017, on our consideration of the City’s internal control over financial reporting and on our tests of its compliance with certain provisions of laws, regulations, contracts, and grant agreements and other matters. The purpose of that report is solely to describe the scope of our testing of internal control over financial reporting and compliance and the results of that testing, and not to provide an opinion on the effectiveness of the City’s internal control over financial reporting or on compliance. That report is an integral part of an audit performed in accordance with Government Auditing Standards in considering the City’s internal control over financial reporting and compliance.
San Diego, California December 14, 2017

this page intentionally left Blank
36
Page Intentionally Left Blank
37
City of San Diego ComprehenSive annual finanCial report
Management’s Discussion and Analysis (Required Supplementary Information - Unaudited)
MANAGEMENT’S DISCUSSION AND ANALYSIS (Unaudited) Fiscal Year Ended June 30, 2017
(Dollars in Thousands)
As management of the City of San Diego (City), we offer readers of the City’s financial statements this narrative overview and analysis of the financial activities of the City for the fiscal year ended June 30, 2017. We encourage the reader to consider the information presented here in addition to the information presented in the Letter of Transmittal.
OVERVIEW OF THE FINANCIAL STATEMENTS
This discussion and analysis is intended to serve as an introduction to the City’s basic financial statements. The City’s basic financial statements are comprised of three components: (1) government-wide financial statements; (2) fund financial statements; and (3) notes to the basic financial statements. This report also contains other supplementary information in addition to the basic financial statements.
GOVERNMENT-WIDE FINANCIAL STATEMENTS
The focus of the government-wide financial statements is on reporting the operating results and financial position of the government as an economic entity. These statements are intended to report the City’s operational accountability to its readers, giving information about the probable medium and long-term effects of past decisions on the City’s financial position.
The Statement of Net Position presents information on all of the City’s assets, deferred outflows of resources, liabilities, and deferred inflows of resources, with the residual amount reported as net position. Over time, increases or decreases in net position may serve as a useful indicator of whether the financial position of the City is improving or deteriorating.
The Statement of Activities presents information showing changes in the City’s net position during the fiscal year. All changes in net position are reported when the underlying event giving rise to the change occurs, regardless of the timing of related cash flows. The focus is on both gross and net costs of City functions, which are supported by general revenues. This statement also distinguishes functions of the City that are principally supported by taxes and intergovernmental revenues (governmental activities) from other functions that are intended to recover all or a significant portion of their costs through user fees and charges (business-type activities). The governmental activities of the City include: General Government and Support; Public Safety-Police; Public Safety-Fire and Life Safety and Homeland Security; Parks, Recreation, Culture and Leisure; Transportation; Sanitation and Health; Neighborhood Services; and Interest on Debt Service. The business-type activities of the City include: Sewer Utility; Water Utility; Airports; Development Services; Environmental Services; Golf Course; Recycling; and San Diego Convention Center Corporation (SDCCC).
The government-wide financial statements include the City (known as the primary government) and the San Diego Housing Commission (SDHC), a legally separate, discretely presented component unit. Financial information for this component unit is reported separately from the financial information presented for the primary government. The City also reports fiduciary component units which are not included in the government-wide financial statements. Fiduciary component units include the San Diego City Employees’ Retirement System (SDCERS) and the Successor Agency of the Redevelopment Agency of the City of San Diego (Successor Agency). Blended component units, also legally separate entities, are a part of the City’s operations and are combined with the primary government.
In fiscal year 2017, the City implemented GASB Statement No. 80, Blending Requirements for Certain Component Units – an amendment of GASB No. 14. The statement amends the blending requirements for the financial statement presentation of component units of state and local governments by requiring blending of a component unit incorporated as a not-for-profit corporation in which the primary government is the sole corporate member. The statement resulted in a change in the presentation of the San Diego Convention Center Corporation (SDCCC) component unit from discretely presented to blended.
38
City of San Diego ComprehenSive annual finanCial report
Included within the primary government as blended component units are the following:
Civic San Diego (CSD) Convention Center Expansion Financial Authority (CCEFA) Public Facilities Financing Authority (PFFA) San Diego Facilities and Equipment Leasing Corporation (SDFELC) San Diego Industrial Development Authority (SDIDA) Tobacco Settlement Revenue Funding Corporation (TSRFC) San Diego Convention Center Corporation (SDCCC)
The government-wide financial statements can be found beginning on page 54 of this report.
FUND FINANCIAL STATEMENTS
A fund is a grouping of related accounts that is used to maintain control over resources that have been segregated for specific activities or objectives. The City, like other state and local governments, uses fund accounting to ensure and demonstrate compliance with finance-related legal requirements. All funds of the City can be divided into three categories: governmental funds, proprietary funds, and fiduciary funds.
GOVERNMENTAL FUNDS
Governmental funds are used to account for essentially the same functions reported as governmental activities in the government-wide financial statements. However, unlike the government-wide financial statements, governmental fund financial statements focus on near-term inflows and outflows of spendable resources, as well as balances of spendable resources available at the end of the fiscal year. Such information may be useful in evaluating a government’s near-term financing requirements.
Because the focus of governmental funds is narrower than that of the government-wide financial statements, it is useful to compare the information presented for governmental funds with similar information presented for governmental activities in the government-wide financial statements. By doing so, readers may better understand the long-term impact of the government’s near-term financing decisions. Both the governmental funds Balance Sheet and the governmental funds Statement of Revenues, Expenditures and Changes in Fund Balances provide a reconciliation to facilitate this comparison between governmental funds and governmental activities.
The City maintains individual governmental funds. Information is presented separately in the governmental funds Balance Sheet and in the governmental funds Statements of Revenues, Expenditures and Changes in Fund Balances for the General Fund, which is a major fund. Data for the other governmental funds are combined into a single, aggregated presentation. Individual fund data for each of these nonmajor governmental funds is provided in the Combining and Individual Fund Financial Statements and Schedules section of this report.
The City adopts an annual appropriated budget for its General Fund. A budgetary comparison schedule has been provided for the General Fund to demonstrate compliance with this budget and is presented as required supplementary information.
The basic governmental funds financial statements can be found beginning on page 58 of this report.
39
City of San Diego ComprehenSive annual finanCial report
PROPRIETARY FUNDS
The City maintains two different types of proprietary funds, enterprise funds and internal service funds. Enterprise funds are used to report the same functions presented as business-type activities in the government-wide financial statements. The City uses enterprise funds to account for its various business-type activities, such as Sewer and Water Utilities. Internal service funds, such as Central Stores, Fleet Operations, and Publishing Services, are used to report activities that provide centralized supplies and/or services to the City.
Proprietary fund statements provide the same type of information as the government-wide financial statements, only in more detail. The proprietary funds financial statements provide separate information for the Sewer and Water Utility funds, which are considered to be major funds of the City. Data for the nonmajor enterprise funds are combined into a single, aggregated presentation, and the internal service funds are combined into a single, aggregated presentation as well. Included in the Combining and Individual Fund Financial Statements and Schedules section of this report are individual fund data for the nonmajor enterprise funds and the internal service funds. The basic proprietary funds financial statements can be found beginning on page 62 of this report.
FIDUCIARY FUNDS
Fiduciary funds are used to account for resources held for the benefit of parties outside the government. Fiduciary funds are not reflected in the government-wide financial statements because the resources of those funds are not available to support the City’s operations. The accounting used for fiduciary funds is much like that used for proprietary funds.
The basic fiduciary funds financial statements can be found beginning on page 68 of this report.
NOTES TO THE BASIC FINANCIAL STATEMENTS
The notes provide additional information that is essential to a full understanding of the data provided in the government-wide and fund financial statements. The notes to the basic financial statements can be found beginning on page 70 of this report.
OTHER INFORMATION
In addition to the basic financial statements and accompanying notes, this report presents certain required supplementary information regarding: changes in the City’s net pension liability; changes in the City’s total pension liability for the Preservation of Benefits (POB) Plan; the City’s obligation to provide postemployment healthcare benefits to its employees; employer contributions to the pension plan; and employer contributions to the postemployment healthcare benefits plan. The required supplementary information also includes a budgetary comparison schedule for the General Fund. Required supplementary information can be found beginning on page 195 of this report.
The individual fund data referred to earlier in connection with nonmajor governmental funds, nonmajor enterprise funds, internal service funds, and fiduciary funds are presented immediately following the required supplementary information beginning on page 219 of this report.
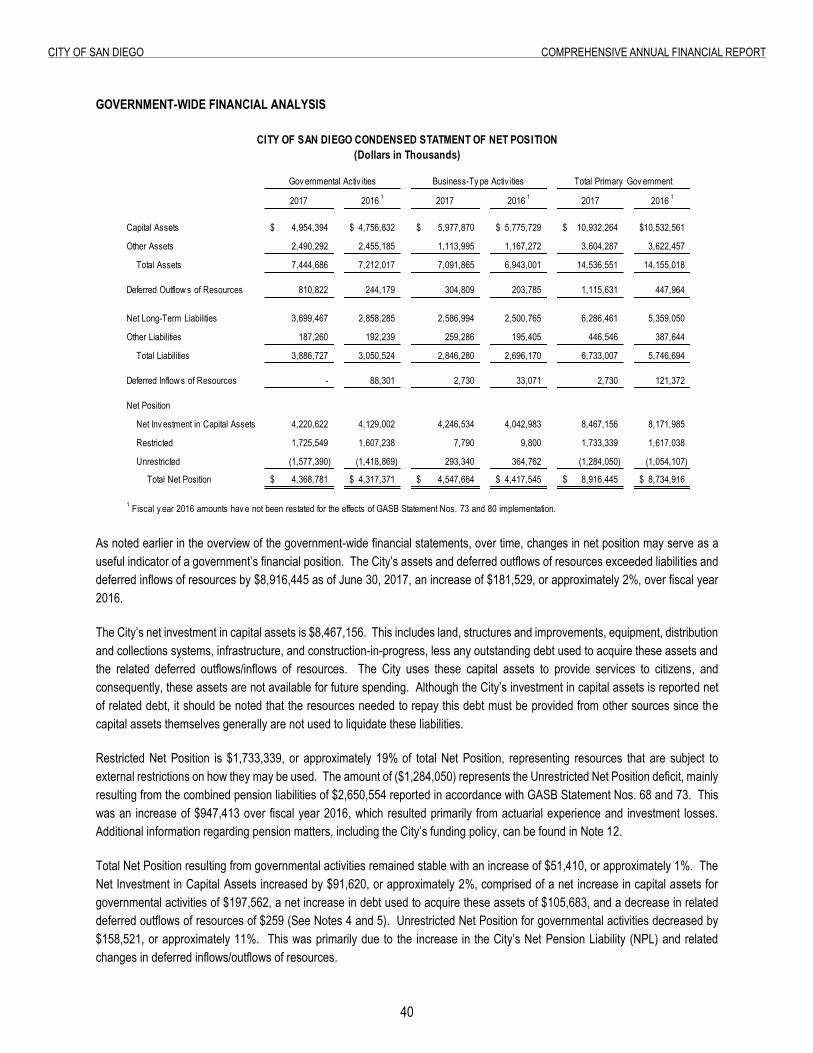
�0
City of San Diego ComprehenSive annual finanCial report
GOVERNMENT-WIDE FINANCIAL ANALYSIS
CITY OF SAN DIEGO CONDENSED STATMENT OF NET POSITION(Dollars in Thousands)
2017 2016 1 2017 2016 1 2017 2016 1
Capital Assets 4,954,394$ 4,756,832$ 5,977,870$ 5,775,729$ 10,932,264$ 10,532,561$
Other Assets 2,490,292 2,455,185 1,113,995 1,167,272 3,604,287 3,622,457
Total Assets 7,444,686 7,212,017 7,091,865 6,943,001 14,536,551 14,155,018
Deferred Outflow s of Resources 810,822 244,179 304,809 203,785 1,115,631 447,964
Net Long-Term Liabilities 3,699,467 2,858,285 2,586,994 2,500,765 6,286,461 5,359,050
Other Liabilities 187,260 192,239 259,286 195,405 446,546 387,644
Total Liabilities 3,886,727 3,050,524 2,846,280 2,696,170 6,733,007 5,746,694
Deferred Inflow s of Resources - 88,301 2,730 33,071 2,730 121,372
Net Position
Inv ested in Capital Assets, Net Inv estment in Capital Assets 4,220,622 4,129,002 4,246,534 4,042,983 8,467,156 8,171,985
Restricted 1,725,549 1,607,238 7,790 9,800 1,733,339 1,617,038
RestrictedUnrestricted (1,577,390) (1,418,869) 293,340 364,762 (1,284,050) (1,054,107)
UnrestrictedTotal Net Position 4,368,781$ 4,317,371$ 4,547,664$ 4,417,545$ 8,916,445$ 8,734,916$
1 Fiscal y ear 2016 amounts hav e not been restated for the effects of GASB Statement Nos. 73 and 80 implementation.
Gov ernmental Activ ities Business-Ty pe Activ ities Total Primary Gov ernment
As noted earlier in the overview of the government-wide financial statements, over time, changes in net position may serve as a useful indicator of a government’s financial position. The City’s assets and deferred outflows of resources exceeded liabilities and deferred inflows of resources by $8,916,445 as of June 30, 2017, an increase of $181,529, or approximately 2%, over fiscal year 2016.
The City’s net investment in capital assets is $8,467,156. This includes land, structures and improvements, equipment, distribution and collections systems, infrastructure, and construction-in-progress, less any outstanding debt used to acquire these assets and the related deferred outflows/inflows of resources. The City uses these capital assets to provide services to citizens, and consequently, these assets are not available for future spending. Although the City’s investment in capital assets is reported net of related debt, it should be noted that the resources needed to repay this debt must be provided from other sources since the capital assets themselves generally are not used to liquidate these liabilities.
Restricted Net Position is $1,733,339, or approximately 19% of total Net Position, representing resources that are subject to external restrictions on how they may be used. The amount of ($1,284,050) represents the Unrestricted Net Position deficit, mainly resulting from the combined pension liabilities of $2,650,554 reported in accordance with GASB Statement Nos. 68 and 73. This was an increase of $947,413 over fiscal year 2016, which resulted primarily from actuarial experience and investment losses. Additional information regarding pension matters, including the City’s funding policy, can be found in Note 12.
Total Net Position resulting from governmental activities remained stable with an increase of $51,410, or approximately 1%. The Net Investment in Capital Assets increased by $91,620, or approximately 2%, comprised of a net increase in capital assets for governmental activities of $197,562, a net increase in debt used to acquire these assets of $105,683, and a decrease in related deferred outflows of resources of $259 (See Notes 4 and 5). Unrestricted Net Position for governmental activities decreased by $158,521, or approximately 11%. This was primarily due to the increase in the City’s Net Pension Liability (NPL) and related changes in deferred inflows/outflows of resources.
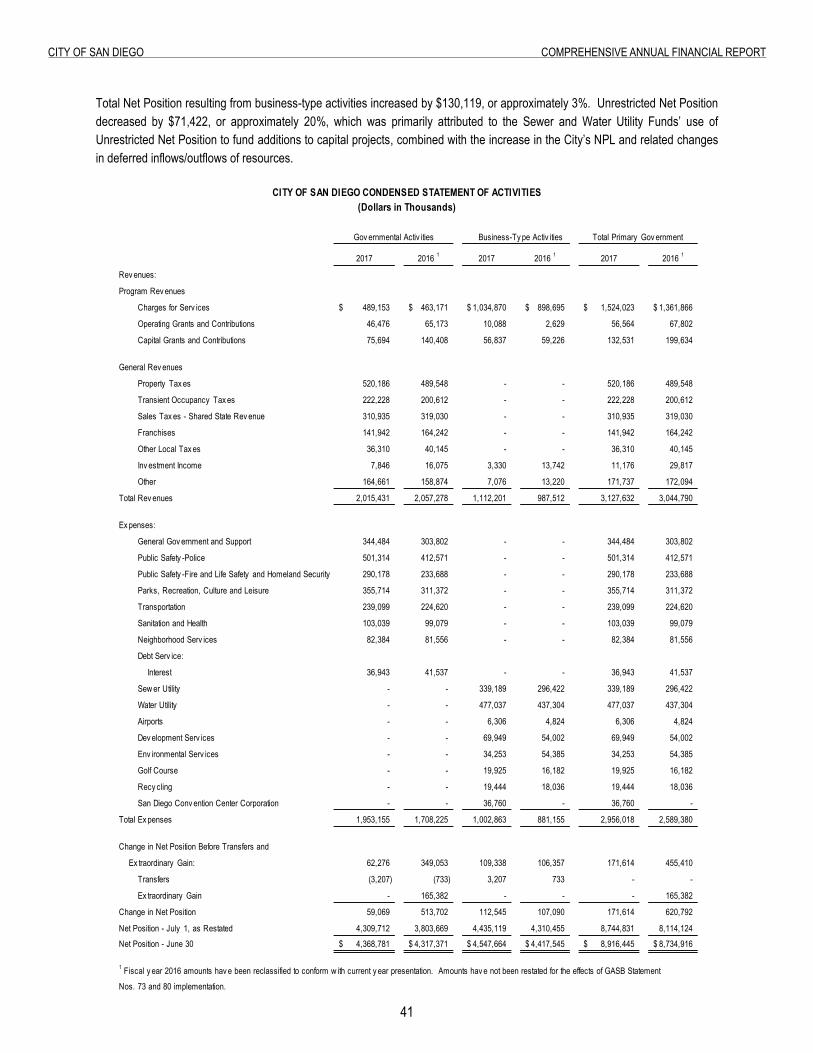
�1
City of San Diego ComprehenSive annual finanCial report
Total Net Position resulting from business-type activities increased by $130,119, or approximately 3%. Unrestricted Net Position decreased by $71,422, or approximately 20%, which was primarily attributed to the Sewer and Water Utility Funds’ use of Unrestricted Net Position to fund additions to capital projects, combined with the increase in the City’s NPL and related changes in deferred inflows/outflows of resources.
CITY OF SAN DIEGO CONDENSED STATEMENT OF ACTIVITIES(Dollars in Thousands)
Gov ernmental Activ ities Business-Ty pe Activ ities Total Primary Gov ernment
2017 2016 1 2017 2016 1 2017 2016 1
Rev enues:
Program Rev enues
Charges for Serv ices 489,153$ 463,171$ 1,034,870$ 898,695$ 1,524,023$ 1,361,866$
Operating Grants and Contributions 46,476 65,173 10,088 2,629 56,564 67,802
Capital Grants and Contributions 75,694 140,408 56,837 59,226 132,531 199,634
General Rev enues
Property Tax es 520,186 489,548 - - 520,186 489,548
Transient Occupancy Tax es 222,228 200,612 - - 222,228 200,612
Sales Tax es - Shared State Rev enue 310,935 319,030 - - 310,935 319,030
Franchises 141,942 164,242 - - 141,942 164,242
Other Local Tax es 36,310 40,145 - - 36,310 40,145
Inv estment Income 7,846 16,075 3,330 13,742 11,176 29,817
Other 164,661 158,874 7,076 13,220 171,737 172,094
Total Rev enues 2,015,431 2,057,278 1,112,201 987,512 3,127,632 3,044,790
Ex penses:
General Gov ernment and Support 344,484 303,802 - - 344,484 303,802
Public Safety -Police 501,314 412,571 - - 501,314 412,571
Public Safety -Fire and Life Safety and Homeland Security 290,178 233,688 - - 290,178 233,688
Parks, Recreation, Culture and Leisure 355,714 311,372 - - 355,714 311,372
Transportation 239,099 224,620 - - 239,099 224,620
Sanitation and Health 103,039 99,079 - - 103,039 99,079
Neighborhood Serv ices 82,384 81,556 - - 82,384 81,556
Debt Serv ice:
Interest 36,943 41,537 - - 36,943 41,537
Sew er Utility - - 339,189 296,422 339,189 296,422
Water Utility - - 477,037 437,304 477,037 437,304
Airports - - 6,306 4,824 6,306 4,824
Dev elopment Serv ices - - 69,949 54,002 69,949 54,002
Env ironmental Serv ices - - 34,253 54,385 34,253 54,385
Golf Course - - 19,925 16,182 19,925 16,182
Recy cling - - 19,444 18,036 19,444 18,036
San Diego Conv ention Center Corporation - - 36,760 - 36,760 -
Total Ex penses 1,953,155 1,708,225 1,002,863 881,155 2,956,018 2,589,380
Change in Net Position Before Transfers and
Ex traordinary Gain: 62,276 349,053 109,338 106,357 171,614 455,410
Transfers (3,207) (733) 3,207 733 - -
Ex traordinary Gain - 165,382 - - - 165,382
Change in Net Position 59,069 513,702 112,545 107,090 171,614 620,792
Net Position - July 1, as Restated 4,309,712 3,803,669 4,435,119 4,310,455 8,744,831 8,114,124 Net Position - June 30 4,368,781$ 4,317,371$ 4,547,664$ 4,417,545$ 8,916,445$ 8,734,916$
1 Fiscal y ear 2016 amounts hav e been reclassified to conform w ith current y ear presentation. Amounts hav e not been restated for the effects of GASB StatementNos. 73 and 80 implementation.
�2
City of San Diego ComprehenSive annual finanCial report
GOVERNMENTAL ACTIVITIES
Governmental activities increased the City’s net position by $59,069 during fiscal year 2017. Variances from fiscal year 2016 of more than 10% and $5,000 are discussed below.
Operating Grants and Contributions decreased by $18,697, or approximately 29%. This was primarily due to decreased expenditures for several reimbursement grants, including Citizens’ Option for Public Safety (COPS) and Urban Area Security Initiatives (UASI), as well as a decrease in SANDAG grant revenue received by Civic San Diego.
Capital Grants and Contributions revenue decreased by $64,714, or approximately 46%, primarily due to a decrease in the amount of land, buildings, and infrastructure conveyed to the City from the Successor Agency. Also contributing to the decrease was a developer reimbursement agreement for the Civita Park project in Mission Valley, which resulted in a large donation of assets during fiscal year 2016, in exchange for credits against future development impact fees.
Transient Occupancy Taxes increased by $21,616, or approximately 11%. This was primarily the result of higher occupancy and an increase in the average daily hotel rate, due to continued growth in San Diego’s tourism.
Franchise Revenue decreased by $22,300, or approximately 14%. Due to a decision by the California Public Utilities Commission in February 2017, SDG&E modified their methodology for calculating the municipal surcharge remittances to be consistent with other utility companies. This change resulted in a significantly lower amount of franchise revenues for both the General Fund and the Underground Surcharge Fund.
Investment Income decreased by $8,229, or approximately 51%, primarily due to the net change in unrealized gains and losses, which was partially offset by rising interest rates and an increase in the average investment pool balance.
General Government and Support expenses increased by $40,682, or approximately 13%, primarily due to changes in the City’s net pension liability (See Note 12).
Public Safety-Police expenses increased by $88,743, or approximately 22%, primarily due to changes in the City’s net
pension liability (See Note 12).
Public Safety-Fire and Life Safety and Homeland Security expense increased by $56,490, or approximately 24%, primarily due to changes in the City’s net pension liability (See Note 12).
Parks, Recreation, Culture and Leisure expenses increased by $44,342, or approximately 14%, primarily due to changes in the City’s net pension liability (See Note 12).
BUSINESS-TYPE ACTIVITIES
Business-type activities increased the City’s net position by $112,545 during fiscal year 2017. Variances from fiscal year 2016 of more than 10% and $5,000 are discussed below.
Charges for Services revenue increased by $136,175, or approximately 15%, primarily due to a rate increase for the Water Utility fund effective July 2016, combined with the inclusion of SDCCC as a blended component unit in accordance with GASB Statement No. 80 (See Note 23).
Operating Grants and Contributions revenue increased by $7,459, or approximately 284%, primarily due to federal grant revenue received for the Pure Water Project as well as the inclusion of SDCCC as a blended component unit.
�3
City of San Diego ComprehenSive annual finanCial report
Investment Income decreased by $10,412, or approximately 76%, primarily due to the net change in unrealized gains and losses, which was partially offset by rising interest rates and an increase in the average investment pool balance.
Other revenue decreased by $6,144, or approximately 46%, primarily due to the Kinder Morgan litigation settlement received by the Water Utility Fund during fiscal year 2016.
Sewer Utility expense increased by $42,767, or approximately 14%, due to several factors including: changes in the City’s net pension liability; higher interest expense due to debt service payments made on the Sewer Revenue Refunding Bonds Series 2015 and 2016A; payments to the City’s Participating Agencies that were higher than estimated; and timing differences in payments for electricity due to a one-time billing correction from San Diego Gas & Electric during fiscal year 2017.
Development Services expense increased by $15,947, or approximately 30%, primarily due to changes in the City’s net
pension liability (See Note 12), a transitional period of paying office space rent in two locations, and filling new positions.
Environmental Services expense decreased by $20,132, or approximately 37%, primarily due to changes in cost estimates for landfill closure and postclosure care during fiscal year 2016.
FINANCIAL ANALYSIS OF THE GOVERNMENT’S FUNDS
As noted earlier, the City uses fund accounting to ensure and demonstrate compliance with finance-related legal requirements.
GOVERNMENTAL FUNDS
The focus of the City’s governmental funds is to provide information on near-term inflows, outflows, and balances of spendable resources. Such information is useful in assessing the City’s financing requirements. In particular, governmental fund balance classifications comprise a hierarchy based primarily on the extent to which a government is bound to observe constraints imposed upon the use of the resources reported.
As of the end of fiscal year 2017, the City’s governmental funds reported combined ending fund balances of $2,091,754, an increase of $42,858 from fiscal year 2016. The General Fund and Other Governmental Funds had unassigned fund balances of $111,057 and ($33,843) respectively, for a total unassigned fund balance of $77,214. The General Fund unassigned fund balance of $111,057 includes both the Stability Reserve and Pension Stabilization Reserves of $79,532 and $16,000, respectively. The restricted, committed, and assigned fund balances are (1) to liquidate contracts and purchase orders of the period, (2) to pay debt service, (3) to generate income to pay for the perpetual funding of various programs, (4) for use in the subsequent year’s budget, (5) for emergency reserves, or (6) for a variety of other purposes, and are not available for new spending.
The General Fund is the principal operating fund of the City. Total Fund Balance for the General Fund was $373,459. General Fund revenues totaled $1,438,894, which was an increase of $42,338, primarily due to higher Property Tax and Sales Tax revenues. In addition, Charges for Current Services increased, mainly due to reimbursements for work performed by the Transportation and Storm Water Department for various capital improvement projects. General Fund expenditures totaled $1,475,635, which was an increase of $106,581. This was mainly due to an increase in capital outlay expenditures related to the capital lease of 101 West Ash Street.
��
City of San Diego ComprehenSive annual finanCial report
PROPRIETARY FUNDS
The City’s proprietary fund statements provide the same type of information found in business-type activities in the government-wide financial statement, but in more detail.
As of the end of fiscal year 2017, total Net Position for the Sewer Utility Fund was $2,461,738, an increase of $51,570, or approximately 2% over fiscal year 2016. The Net Investment in Capital Assets increased by $110,984, or approximately 5%. This was comprised of: a net increase in capital assets of $51,813, mainly in the construction in progress and infrastructure categories; a net decrease in capital related debt of $68,683; and a decrease in associated deferred outflows of resources of $9,512. Unrestricted Net Position was $203,700, a decrease of $59,050, or approximately 22% from fiscal year 2016. This was primarily caused by the use of Unrestricted Net Position to fund additions to capital assets. Total Operating Income was $61,671, a decrease of $21,240 from fiscal year 2016. This was primarily due to changes in the City’s Net Pension Liability, payments to the City’s Participating Agencies for 2014 and 2015 that were higher than estimated, and timing differences in payments for electricity due to a one-time billing correction from San Diego Gas & Electric during fiscal year 2017. The Water Utility Fund had total Net Position of $1,985,699 at the end of fiscal year 2017, an increase of $55,761, or approximately 3%. The Net Investment in Capital Assets increased by $72,621, or approximately 4%. This was comprised of: a net increase in capital assets of $122,992, mainly in the construction in progress and infrastructure categories; a net increase in capital related debt of $46,988 which was primarily due to the issuance of commercial paper; and a decrease in associated deferred inflows/outflows of resources of $3,383. Unrestricted Net Position was $104,553, a decrease of $15,674, or approximately 13% from fiscal year 2016. This was primarily caused by the use of Unrestricted Net Position to fund additions to capital assets. Total operating income was $43,061, an increase of $45,873 over fiscal year 2016. This was primarily due to a 6.9% water rate increase effective in July 2016, partially offset by an increase in the cost of water purchased from the San Diego County Water Authority and changes in the City’s Net Pension Liability.
GENERAL FUND BUDGETARY HIGHLIGHTS
The following General Fund budgetary highlights include only those funds associated with General Fund operations as reported in the City’s budget, and exclude the additional budgeted funds included with the General Fund for GAAP reporting purposes. The final budget for General Fund expenditures and transfers out was $3,702 higher than the original budget due to increases/(decreases) in appropriations primarily attributed to the following:
$2,200 increase in Citywide Program Expenditures for rent and operating expenditures for 101 West Ash Street $2,000 increase for overtime expenditures in the Fire-Rescue Department $3,000 increase for Transportation and Storm Water contracts related to equipment rental, as-needed emergency
contracts, and overtime associated with recent winter storms ($2,200) decrease for delayed moving expenses related to the Civic Center Plaza office space reconfiguration
Actual revenues earned in the General Fund were $15,050 higher than budgeted. Property Taxes were over budget by $2,533, primarily due to growth in assessed values, increases in supplemental property taxes related to home sales, and increases in the distribution of residual funds from the Redevelopment Property Tax Trust Fund (RPTTF). Fines, Forfeitures and Penalties were over budget by $1,327, primarily due to an increase in parking citations revenue, as a result of recruitment and improved retention of parking enforcement officers. Transient Occupancy Taxes were over budget by $3,544, primarily due to the continued increase in occupancy and average daily room rates. Revenue from Use of Money and Property was over budget by $5,422 primarily due to an increase in rent from non-General Fund departments, and Revenue from Other Agencies was over budget by $14,839 primarily due to the annexation of property near Mt. Hope Cemetery. These increases were partially offset by Franchise Fees coming in under budget by $9,488 due to decreases in SDG&E franchise fee revenues.
�5
City of San Diego ComprehenSive annual finanCial report
Actual expenditures for the General Fund were $17,164 under budget. The categories with material variances between actuals and budget were General Government and Support with appropriation savings of $11,524, and Parks, Recreation, Culture and Leisure with appropriation savings of $2,152. Both variances were primarily due to vacant positions not filled as anticipated.
CAPITAL ASSET AND DEBT ADMINISTRATION
TotalGovernmental Activ ities Business-Type Activ ities Primary Government
2017 2016 2017 2016 1 2017 2016 1
Land and Rights of Way 1,883,487$ 1,834,363$ 97,611$ 97,212$ 1,981,098$ 1,931,575$
Easements 5,228 4,190 2,520 2,280 7,748 6,470
Construction in Progress 462,111 348,937 405,589 302,530 867,700 651,467
Structures and Improvements 1 866,531 827,356 1,425,351 1,427,912 2,291,882 2,255,268
Equipment 1 166,696 152,452 128,799 146,170 295,495 298,622
Intangible Equipment 14,816 11,708 10,669 12,945 25,485 24,653
Distribution and Collection Systems - - 3,907,331 3,798,387 3,907,331 3,798,387
Infrastructure 1,555,525 1,577,826 - - 1,555,525 1,577,826
Totals 4,954,394$ 4,756,832$ 5,977,870$ 5,787,436$ 10,932,264$ 10,544,268$
CITY OF SAN DIEGO'S CAPITAL ASSETS(Net of Accumulated Depreciation/Amortization)
(Dollars in Thousands)
1 Prior year balances have been restated due to the inclusion of SDCCC as a blended component unit, pursuant to GASB Statement No. 80 (See Note 23)
CAPITAL ASSETS
In accordance with Governmental Accounting Standards Board (GASB) Statement Nos. 34 and 51, all major assets such as streets, signals, bridges, storm drains, distribution and collection systems for water and sewer, and intangible assets are capitalized by the City in the government-wide statements. While capital assets of both governmental and proprietary funds are capitalized at the government-wide level, only the proprietary funds report capital assets at the fund level. Governmental funds are reported on a modified accrual basis. Differences between reporting at the fund level and government-wide level for these governmental assets are explained in both the reconciliation and the accompanying notes to the basic financial statements.
The City’s investment in capital assets (including infrastructure) for governmental and business-type activities as of June 30, 2017 was $10,932,264 (net of accumulated depreciation/amortization). There was an overall increase in the City’s investment in capital assets over fiscal year 2016 of $387,996. Readers interested in more detailed information on capital asset activity should refer to Note 4.
�6
City of San Diego ComprehenSive annual finanCial report
HIGHLIGHTS OF FISCAL YEAR 2017 CAPITAL IMPROVEMENT ACTIVITIES (CIP)
Governmental Activities
The City executed a twenty year lease-to-own agreement with 101 Ash, LLC. The total value of the assets recognized was $72,440, of which $54,406 was for the existing structure and improvements, and $18,034 was for land.
The asphalt overlay of approximately 71 miles of roads citywide was completed during fiscal year 2017. These projects provided for resurfacing and reconstruction of City streets, in order to maintain the streets in serviceable condition and mitigate roadway deterioration. These projects were funded primarily with lease revenue bonds. Fiscal year 2017 expenditures totaled $17,665.
The land acquisition for the SR 163/Friars Road Project began in fiscal year 2017, with Phase 1 of construction scheduled to begin in fiscal year 2018 and anticipated to be completed in fiscal year 2020. This project will provide for the construction of a new southbound 163 to westbound Friars Road off-ramp, and the widening of the Friars Road overcrossing to eight lanes. Fiscal year 2017 expenditures for this project totaled $9,238.
Construction is in progress on Fire Station No. 2 (Bayside) in the Centre City-Little Italy area, west of the railroad tracks.
The new fire station will provide approximately 24,680 square feet of work and living space, underground parking, three apparatus bays to accommodate a twenty-four hour crew of twelve, and the acquisition of a new fire apparatus. Fiscal year 2017 expenditures for this project totaled $6,673.
The City was in the realization phase of the Infrastructure Asset Management (IAM) San Diego Project in fiscal year 2017. Completion of this phase and a partial go-live are anticipated to occur during the second quarter of fiscal year 2018. The IAM San Diego project is a citywide strategic initiative to develop and implement an integrated software solution that will improve the City’s management of infrastructure assets. Fiscal year 2017 expenditures for this project totaled $12,236.
Construction began during fiscal year 2017 on Cesar Solis Community Park. This project included an acquisition of land which was completed in fiscal year 2010, and the design was completed in fiscal year 2011. Construction was delayed due to a pending property acquisition and reimbursement agreement. This park will include fifteen acres with an additional five acres of joint use with the adjacent Ocean View Hills School. Amenities include lighted ball fields, a comfort station, a children’s play area, and picnic areas. The fiscal year 2017 expenditures totaled $5,842.
Construction began in fiscal year 2017 on the Georgia Street Bridge Improvements Project, and is scheduled to be completed in fiscal year 2018. The project provides for seismic and structural improvements to the bridge and adjacent retaining walls. Fiscal year 2017 expenditures for this project totaled $6,450.
The annual allocation for drainage projects provides for reconstruction and replacement of failing drainage facilities citywide. There are currently over 900 miles of storm drains in the City of San Diego. Fiscal year 2017 expenditures for drainage projects totaled $13,768.
Business-Type Activities
The Sewer Utility Fund incurred capital expenditures of approximately $84,950 related to CIP, of which the Metropolitan System CIP incurred approximately $15,420, and the Municipal System CIP incurred approximately $69,530. The following major projects continued during fiscal year 2017: Manning Canyon Sewer Replacement; IAM San Diego Project; Advanced Metering Infrastructure; and the continued replacement of sewer mains and upgrades to the sewer infrastructure. Capital write-offs (net) for fiscal year 2017 totaled approximately $6,760 and were primarily related to losses on abandoned projects and retirements of distribution and collection system assets.
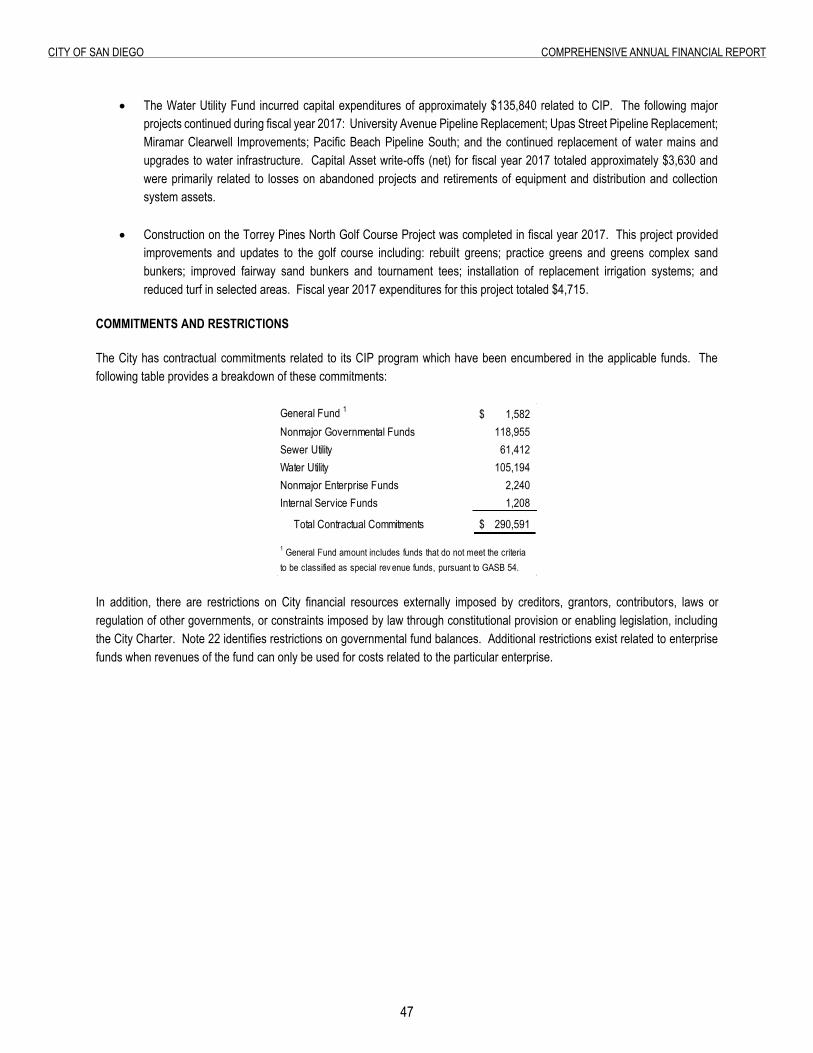
�7
City of San Diego ComprehenSive annual finanCial report
The Water Utility Fund incurred capital expenditures of approximately $135,840 related to CIP. The following major projects continued during fiscal year 2017: University Avenue Pipeline Replacement; Upas Street Pipeline Replacement; Miramar Clearwell Improvements; Pacific Beach Pipeline South; and the continued replacement of water mains and upgrades to water infrastructure. Capital Asset write-offs (net) for fiscal year 2017 totaled approximately $3,630 and were primarily related to losses on abandoned projects and retirements of equipment and distribution and collection system assets.
Construction on the Torrey Pines North Golf Course Project was completed in fiscal year 2017. This project provided improvements and updates to the golf course including: rebuilt greens; practice greens and greens complex sand bunkers; improved fairway sand bunkers and tournament tees; installation of replacement irrigation systems; and reduced turf in selected areas. Fiscal year 2017 expenditures for this project totaled $4,715.
COMMITMENTS AND RESTRICTIONS
The City has contractual commitments related to its CIP program which have been encumbered in the applicable funds. The following table provides a breakdown of these commitments:
General Fund 1 1,582$ Nonmajor Governmental Funds 118,955 Sewer Utility 61,412 Water Utility 105,194 Nonmajor Enterprise Funds 2,240 Internal Service Funds 1,208
Total Contractual Commitments 290,591$
1 General Fund amount includes funds that do not meet the criteria to be classified as special rev enue funds, pursuant to GASB 54.
In addition, there are restrictions on City financial resources externally imposed by creditors, grantors, contributors, laws or regulation of other governments, or constraints imposed by law through constitutional provision or enabling legislation, including the City Charter. Note 22 identifies restrictions on governmental fund balances. Additional restrictions exist related to enterprise funds when revenues of the fund can only be used for costs related to the particular enterprise.
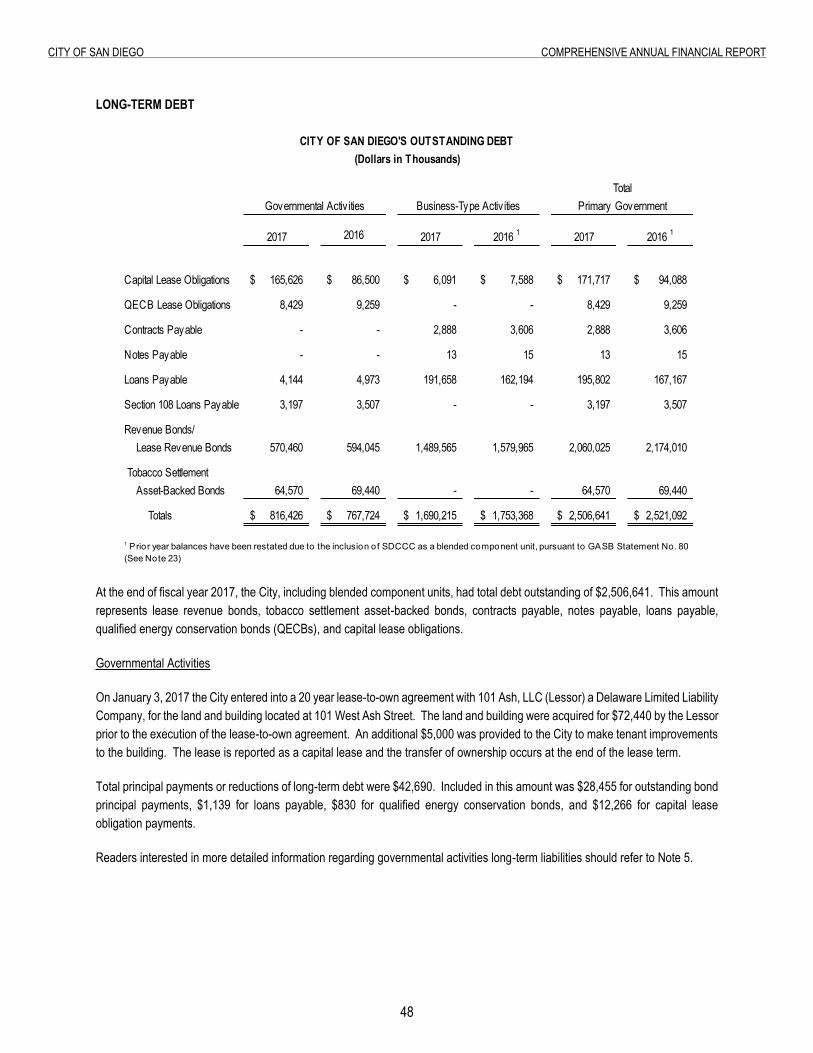
�8
City of San Diego ComprehenSive annual finanCial report
LONG-TERM DEBT
CITY OF SAN DIEGO'S OUTSTANDING DEBT(Dollars in Thousands)
TotalGovernmental Activ ities Business-Type Activ ities Primary Government
2017 2016 2017 2016 1 2017 2016 1
Capital Lease Obligations 165,626$ 86,500$ 6,091$ 7,588$ 171,717$ 94,088$
QECB Lease Obligations 8,429 9,259 - - 8,429 9,259
Contracts Payable - - 2,888 3,606 2,888 3,606
Notes Payable - - 13 15 13 15
Loans Payable 4,144 4,973 191,658 162,194 195,802 167,167
Section 108 Loans Payable 3,197 3,507 - - 3,197 3,507
Revenue Bonds/Lease Revenue Bonds 570,460 594,045 1,489,565 1,579,965 2,060,025 2,174,010
Asset-Backed Bonds 64,570 69,440 - - 64,570 69,440
Totals 816,426$ 767,724$ 1,690,215$ 1,753,368$ 2,506,641$ 2,521,092$
Tobacco Settlement
1 Prior year balances have been restated due to the inclusion of SDCCC as a blended component unit, pursuant to GASB Statement No. 80 (See Note 23)
At the end of fiscal year 2017, the City, including blended component units, had total debt outstanding of $2,506,641. This amount represents lease revenue bonds, tobacco settlement asset-backed bonds, contracts payable, notes payable, loans payable, qualified energy conservation bonds (QECBs), and capital lease obligations.
Governmental Activities
On January 3, 2017 the City entered into a 20 year lease-to-own agreement with 101 Ash, LLC (Lessor) a Delaware Limited Liability Company, for the land and building located at 101 West Ash Street. The land and building were acquired for $72,440 by the Lessor prior to the execution of the lease-to-own agreement. An additional $5,000 was provided to the City to make tenant improvements to the building. The lease is reported as a capital lease and the transfer of ownership occurs at the end of the lease term.
Total principal payments or reductions of long-term debt were $42,690. Included in this amount was $28,455 for outstanding bond principal payments, $1,139 for loans payable, $830 for qualified energy conservation bonds, and $12,266 for capital lease obligation payments.
Readers interested in more detailed information regarding governmental activities long-term liabilities should refer to Note 5.
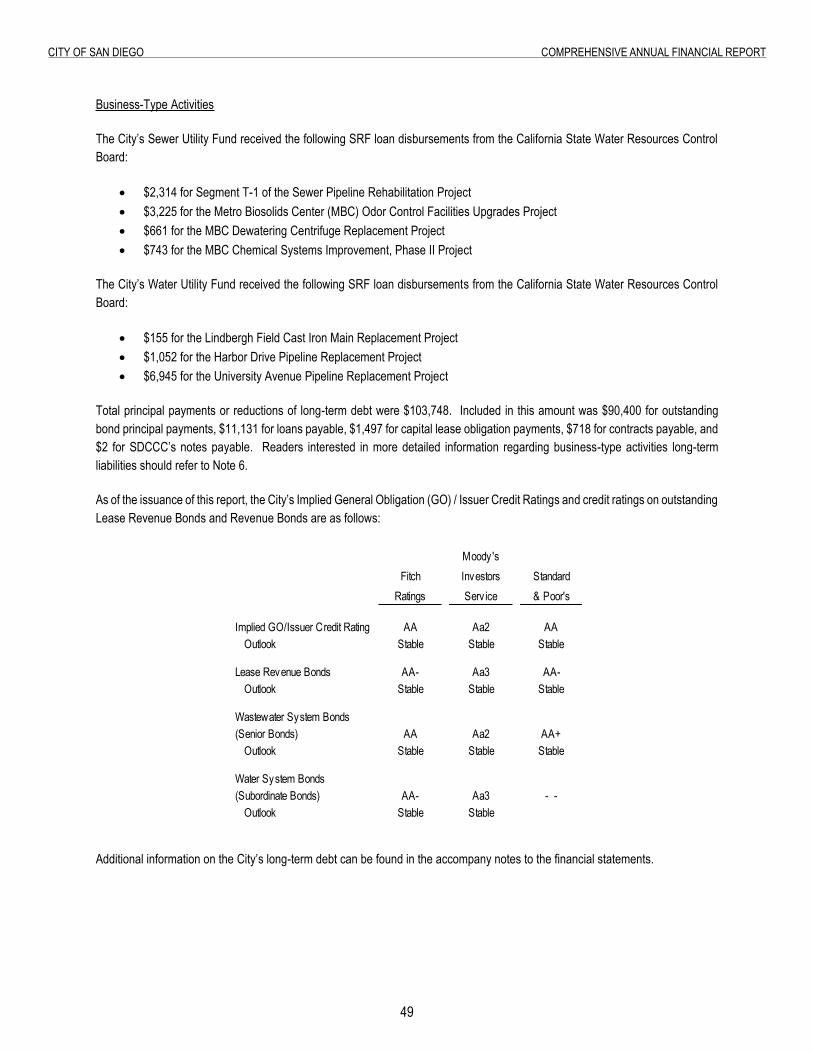
�9
City of San Diego ComprehenSive annual finanCial report
Business-Type Activities
The City’s Sewer Utility Fund received the following SRF loan disbursements from the California State Water Resources Control Board:
$2,314 for Segment T-1 of the Sewer Pipeline Rehabilitation Project $3,225 for the Metro Biosolids Center (MBC) Odor Control Facilities Upgrades Project $661 for the MBC Dewatering Centrifuge Replacement Project $743 for the MBC Chemical Systems Improvement, Phase II Project
The City’s Water Utility Fund received the following SRF loan disbursements from the California State Water Resources Control Board:
$155 for the Lindbergh Field Cast Iron Main Replacement Project $1,052 for the Harbor Drive Pipeline Replacement Project $6,945 for the University Avenue Pipeline Replacement Project
Total principal payments or reductions of long-term debt were $103,748. Included in this amount was $90,400 for outstanding bond principal payments, $11,131 for loans payable, $1,497 for capital lease obligation payments, $718 for contracts payable, and $2 for SDCCC’s notes payable. Readers interested in more detailed information regarding business-type activities long-term liabilities should refer to Note 6.
As of the issuance of this report, the City’s Implied General Obligation (GO) / Issuer Credit Ratings and credit ratings on outstanding Lease Revenue Bonds and Revenue Bonds are as follows:
Moody 'sFitch Investors Standard
Ratings Serv ice & Poor's
Implied GO/Issuer Credit Rating AA Aa2 AAOutlook Stable Stable Stable
Lease Revenue Bonds AA- Aa3 AA-Outlook Stable Stable Stable
Wastewater System Bonds(Senior Bonds) AA Aa2 AA+
Outlook Stable Stable Stable
Water System Bonds(Subordinate Bonds) AA- Aa3 - -
Outlook Stable Stable
Additional information on the City’s long-term debt can be found in the accompany notes to the financial statements.
50
City of San Diego ComprehenSive annual finanCial report
OTHER INFORMATION
Utilization of Pension Payment Stabilization Reserve for Fiscal Year 2018 Actuarially Determined Contribution
The fiscal year 2018 adopted budget included full utilization of the Pension Payment Stabilization Reserve balance of $20,536 to minimize the impact from the significant increase in the City’s July 1, 2017 Actuarially Determined Contribution (ADC) to $324,500. This reserve was established in fiscal year 2016 to mitigate service delivery risk due to the unanticipated increases in the ADC. Per the City’s Reserve Policy, in the event the Pension Payment Stabilization Reserve is reduced below the established amount, a plan to replenish the balance to the policy level shall be prepared no later than one year from the reserve action.
Labor Agreement with San Diego Police Officers Association (POA)
On December 5, 2017, the City Council ratified an agreement with the POA to increase pensionable compensation for represented employees totaling 25.6% to 30.6%, depending on the length of sworn service, beginning July 1, 2018. Increases range from 5% to 8.3% semi-annually through the end of the term on June 30, 2020.
GE Intelligent Lighting Master Purchase Agreement On February 10, 2017, the City executed a GE Government Finance, Inc. (GEGF) California Master Lease Agreement for a tax-exempt equipment lease-purchase financing of the GE Intelligent Cities Project for energy efficient street lighting and adaptive controls. Proceeds of approximately $30,274 will be used to reimburse the City for eligible project expenses. The lease term is for thirteen years at a fixed interest rate that reflects the 10-year swap rate less 0.68%. REQUESTS FOR INFORMATION
This financial report is designed to provide a general overview of the City’s finances. Questions concerning any of the information provided in this report or requests for additional financial information should be sent to the Office of the City Comptroller at [email protected]. This financial report is also available on the City’s website at www.sandiego.gov, under the Office of the City Comptroller. Additional information intended for the investor community is available on the Investor Information web page also located on the City’s website listed above.

BaSiC finanCial StatementS
BASIC FINANCIAL STATEMENTS
BASIC FINANCIAL STATEMENTS


this page intentionally left Blank
53
Page Intentionally Left Blank
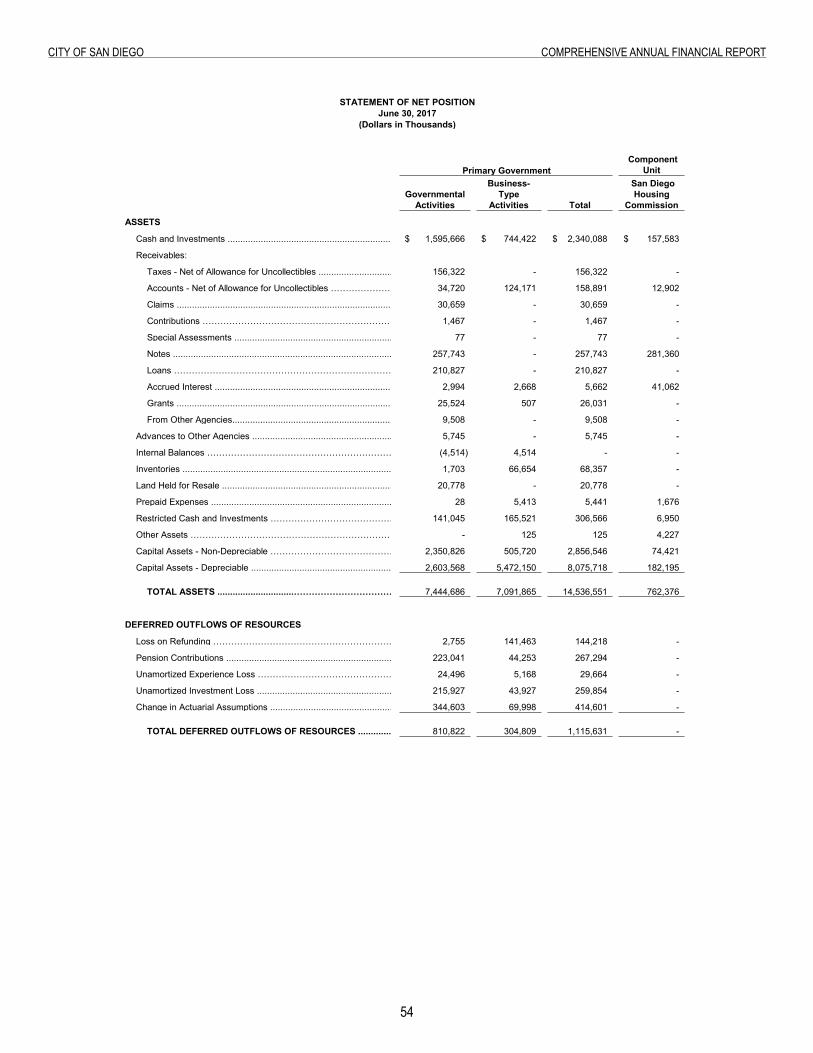
5�
City of San Diego ComprehenSive annual finanCial report
Government-Wide Financial State- Statement of net position
Component Unit
Governmental
Activities
Business-Type
Activities Total
San Diego Housing
Commission
ASSETS
Cash and Investments ............................................................................................................................................1,595,666$ 744,422$ 2,340,088$ 157,583$
Receivables:
Taxes - Net of Allowance for Uncollectibles ...................................................................................................................................................................................................................................................156,322 - 156,322 -
Accounts - Net of Allowance for Uncollectibles ………………………………………….34,720 124,171 158,891 12,902
Claims ..................................................................................................................................................................................................................................................30,659 - 30,659 -
Contributions …………………………………………………………………………………………………………………………….1,467 - 1,467 -
Special Assessments .....................................................................................................................................................................................................................................77 - 77 -
Notes .........................................................................................................................................................................................................................................................257,743 - 257,743 281,360
Loans …………………………………………………………………………………….210,827 - 210,827 -
Accrued Interest ..............................................................................................................................................................................................................................................2,994 2,668 5,662 41,062
Grants ........................................................................................................................................................................................................................................................25,524 507 26,031 -
From Other Agencies..........................................................................................................................................................................................................................................9,508 - 9,508 -
Advances to Other Agencies ....................................................................................................................................................................................................................................5,745 - 5,745 -
Internal Balances ……………………………………………………………………………………………………………………………………(4,514) 4,514 - -
Inventories ...................................................................................................................................................................................................................................................1,703 66,654 68,357 -
Land Held for Resale ..........................................................................................................................................................................................................................................20,778 - 20,778 -
Prepaid Expenses ...................................................................................................................................................................................................................28 5,413 5,441 1,676
Restricted Cash and Investments …………………………………………………………..141,045 165,521 306,566 6,950
Other Assets ……………………………………………………………………………………………- 125 125 4,227
Capital Assets - Non-Depreciable …………………………………………………………………………………………………………………….2,350,826 505,720 2,856,546 74,421
Capital Assets - Depreciable ..............................................................................................................................................................................................................................................2,603,568 5,472,150 8,075,718 182,195
TOTAL ASSETS ..............................………………………………………………………………………………………………………………………………………………......................................................................................................................................7,444,686 7,091,865 14,536,551 762,376
DEFERRED OUTFLOWS OF RESOURCES
Loss on Refunding …………………………………………………………………………………………………………………………………………………2,755 141,463 144,218 -
Pension Contributions ................................................................................................................................................................................................................223,041 44,253 267,294 -
Unamortized Experience Loss ………………………………………………………………24,496 5,168 29,664 -
Unamortized Investment Loss ...............................................................................................................................................................................................................215,927 43,927 259,854 -
Change in Actuarial Assumptions ...............................................................................................................................................................................................................344,603 69,998 414,601 -
TOTAL DEFERRED OUTFLOWS OF RESOURCES ..............................................................................................................................................................................................................................810,822 304,809 1,115,631 -
(Dollars in Thousands)
STATEMENT OF NET POSITIONJune 30, 2017
Primary Government
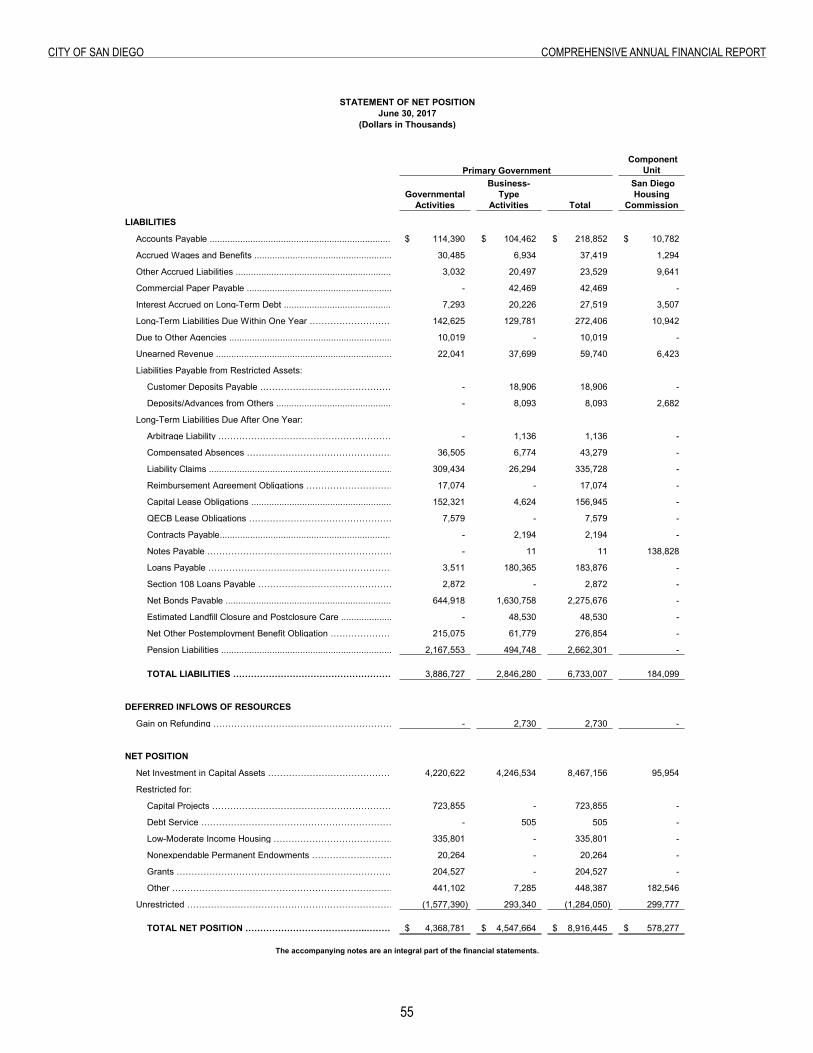
55
City of San Diego ComprehenSive annual finanCial report
Component Unit
Governmental
Activities
Business-Type
Activities Total
San Diego Housing
Commission
(Dollars in Thousands)
STATEMENT OF NET POSITIONJune 30, 2017
Primary Government
LIABILITIES
Accounts Payable ........................................................................................................................................................114,390$ 104,462$ 218,852$ 10,782$
Accrued Wages and Benefits ..............................................................................................................................................30,485 6,934 37,419 1,294
Other Accrued Liabilities ....................................................................................................................................................3,032 20,497 23,529 9,641
Commercial Paper Payable .....................................................................................................................................................................................................................- 42,469 42,469 -
Interest Accrued on Long-Term Debt ..........................................................................................................................................7,293 20,226 27,519 3,507
Long-Term Liabilities Due Within One Year ……………………………………………………………………………………….142,625 129,781 272,406 10,942
Due to Other Agencies .....................................................................................................................................................10,019 - 10,019 -
Unearned Revenue ...........................................................................................................................................................22,041 37,699 59,740 6,423
Liabilities Payable from Restricted Assets:
Customer Deposits Payable ……………………………………………………………………………………………………….- 18,906 18,906 -
Deposits/Advances from Others ..............................................................................................................................................- 8,093 8,093 2,682
Long-Term Liabilities Due After One Year:
Arbitrage Liability ………………………………………………………………… - 1,136 1,136 -
Compensated Absences ………………………………………………………………………………….36,505 6,774 43,279 -
Liability Claims ..........................................................................................................................................................309,434 26,294 335,728 -
Reimbursement Agreement Obligations …………………………………………………….17,074 - 17,074 -
Capital Lease Obligations ...............................................................................................................................................152,321 4,624 156,945 -
QECB Lease Obligations …………………………………………………………………..7,579 - 7,579 -
Contracts Payable..........................................................................................................................................................- 2,194 2,194 -
Notes Payable …………………………………………………………………………………………..- 11 11 138,828
Loans Payable ………………………………………………………………………………………………………………………………..3,511 180,365 183,876 -
Section 108 Loans Payable ……………………………………………………………………………………………………2,872 - 2,872 -
Net Bonds Payable ...................................................................................................................................................................644,918 1,630,758 2,275,676 -
Estimated Landfill Closure and Postclosure Care .........................................................................................................................- 48,530 48,530 -
Net Other Postemployment Benefit Obligation ……………………………………….215,075 61,779 276,854 -
Pension Liabilities .................................................................................................................................................2,167,553 494,748 2,662,301 -
TOTAL LIABILITIES …………………………………………………………………..………………………………………………………………………………………………………………………………………………………………………………………………………………………………………………………………………………………………3,886,727 2,846,280 6,733,007 184,099
DEFERRED INFLOWS OF RESOURCES
Gain on Refunding …………………………………………………………………………………….- 2,730 2,730 -
NET POSITION
Net Investment in Capital Assets …………………………………………………………………………….4,220,622 4,246,534 8,467,156 95,954
Restricted for:
Capital Projects …………………………………………………………………………………………………………………………………723,855 - 723,855 -
Debt Service ……………………………………………………………………………………………………………………………..- 505 505 -
Low-Moderate Income Housing ……………………………………………………………..335,801 - 335,801 -
Nonexpendable Permanent Endowments ………………………………………………………………………………………………………………………..20,264 - 20,264 -
Grants …………………………………………………………………………………….204,527 - 204,527 -
Other ……………………………………………………………………………………………………..441,102 7,285 448,387 182,546
Unrestricted …………………………………………………………………………………………………………………………………………………(1,577,390) 293,340 (1,284,050) 299,777
TOTAL NET POSITION …………………………………..…………………..…………………..…………………..…………………..…………………..……………………………….4,368,781$ 4,547,664$ 8,916,445$ 578,277$
The accompanying notes are an integral part of the financial statements.
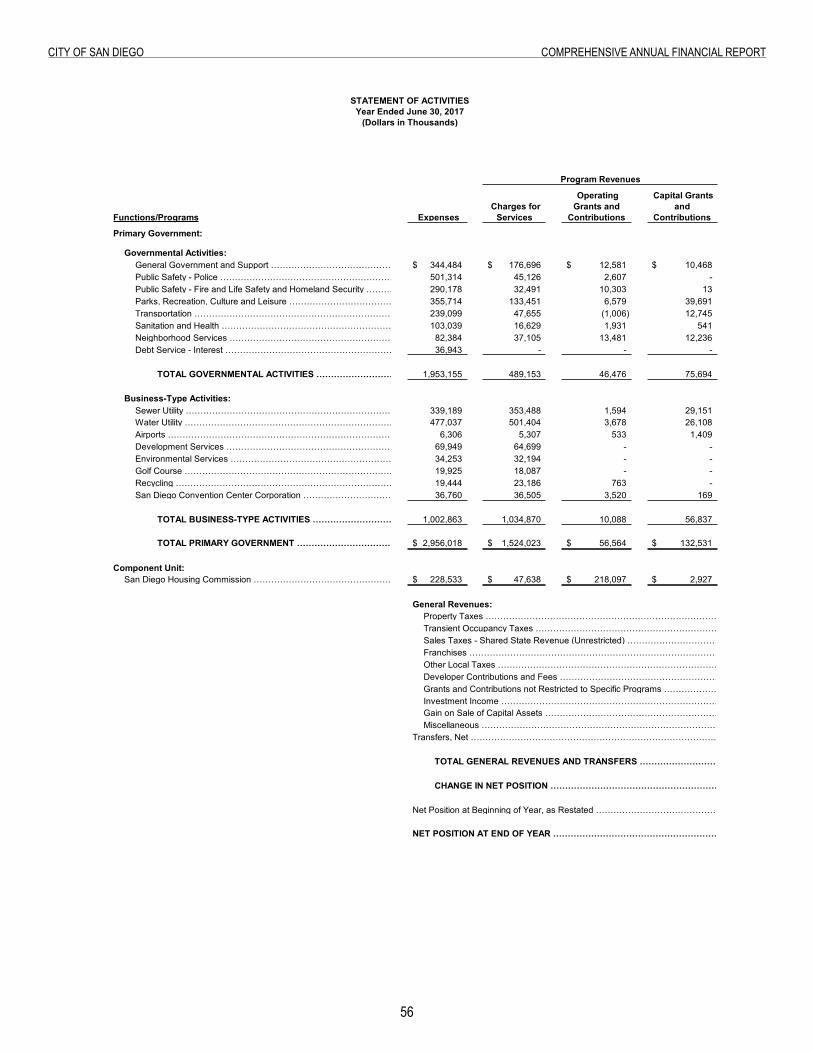
56
City of San Diego ComprehenSive annual finanCial report
Statement of activities
Functions/Programs Expenses Charges for
Services
Operating Grants and
Contributions
Capital Grants and
Contributions
Primary Government:
Governmental Activities:General Government and Support …………………………………………………………………………………………………………………………………………………………………………………………………………………………………………………… 344,484$ 176,696$ 12,581$ 10,468$ Public Safety - Police …………………………………………………………………………………………………………………………………………………………………………………………………………………………………………………… 501,314 45,126 2,607 - Public Safety - Fire and Life Safety and Homeland Security …………………………………………………………………………………………………………………………………………………………………………………………………………………………………………………… 290,178 32,491 10,303 13 Parks, Recreation, Culture and Leisure …………………………………………………………………………………………………………………………………………………………………………………………………………………………………………………… 355,714 133,451 6,579 39,691 Transportation …………………………………………………………………………………………………………………………………………………………………………………………………………………………………………………… 239,099 47,655 (1,006) 12,745 Sanitation and Health …………………………………………………………………………………………………………………………………………………………………………………………………………………………………………………… 103,039 16,629 1,931 541 Neighborhood Services …………………………………………………………………………………………………………………………………………………………………………………………………………………………………………………… 82,384 37,105 13,481 12,236 Debt Service - Interest ………………………………………………………………………………….. 36,943 - - -
TOTAL GOVERNMENTAL ACTIVITIES …………………………………………………………………………………………………………………………………………………………………………………………………………………………………………………… 1,953,155 489,153 46,476 75,694
Business-Type Activities:
Sewer Utility …………………………………………………………………………………………………………………………………………………………………………………………………………………………………………………… 339,189 353,488 1,594 29,151 Water Utility …………………………………………………………………………………………………………………………………………………………………………………………………………………………………………………… 477,037 501,404 3,678 26,108 Airports …………………………………………………………………………………………………………………………………………………………………………………………………………………………………………………… 6,306 5,307 533 1,409 Development Services …………………………………………………………………………………………………………………………………………………………………………………………………………………………………………………… 69,949 64,699 - - Environmental Services …………………………………………………………………………………………………………………………………………………………………………………………………………………………………………………… 34,253 32,194 - - Golf Course …………………………………………………………………………………………………………………………………………………………………………………………………………………………………………………… 19,925 18,087 - - Recycling …………………………………………………………………………………………………………………………………………………………………………………………………………………………………………………… 19,444 23,186 763 - San Diego Convention Center Corporation …………………………………………………………………………………………………………………………………………………………………………………………………………………………………………………… 36,760 36,505 3,520 169
TOTAL BUSINESS-TYPE ACTIVITIES …………………………………………………………………………………………………………………………………………………………………………………………………………………………………………………… 1,002,863 1,034,870 10,088 56,837
TOTAL PRIMARY GOVERNMENT …………………………………………………………………………………………………………………………………………………………………………………………………………………………………………………… 2,956,018$ 1,524,023$ 56,564$ 132,531$
Component Unit:
San Diego Housing Commission …………………………………………………………………………………………………………………………………………………………………………………………………………………………………………………… 228,533$ 47,638$ 218,097$ 2,927$
General Revenues:Property Taxes ……………………………………………………………………………………………………………………………………………………………………………………………………………………………………………………………………. Transient Occupancy Taxes ……………………………………………………………………………………………………………………………………………………………………………………………………………………………………………………… Sales Taxes - Shared State Revenue (Unrestricted) ………………………………………………………………………………………………………………. Franchises ………………………………………………………………………………………………………………………………….Other Local Taxes ……………………………………………………………………………………………………………………………………………………………………………………………………………………………………………………… Developer Contributions and Fees ………………………………………………………………………………………………………… Grants and Contributions not Restricted to Specific Programs ……………………………………………………………………………………………………………………………………………………………………………………………………………………………………………………… Investment Income ……………………………………………………………………………………………………………………………………………………………………………………………………………………………………………………… Gain on Sale of Capital Assets ……………………………………………………………………………………………………………………………………………………………………………………………………………………………………………………… Miscellaneous …………………………………………………………………………………………………………………………………………………
Transfers, Net ………………………………………………………………………………………………………………………………………………………………………………………………………………………………………………………
TOTAL GENERAL REVENUES AND TRANSFERS ………………………………………………………………………………………………………………………………………………………………………………………………………………………………………………………
CHANGE IN NET POSITION ………………………………………………………………………………………………………………………………………………………………………………………………………………………………………………………
Net Position at Beginning of Year, as Restated ………………………………………………………………………………………………………………………………………………………………………………………………………………………………………………………
NET POSITION AT END OF YEAR ………………………………………………………………………………………………………………………………………………………………………………………………………………………………………………………
Program Revenues
STATEMENT OF ACTIVITIESYear Ended June 30, 2017
(Dollars in Thousands)
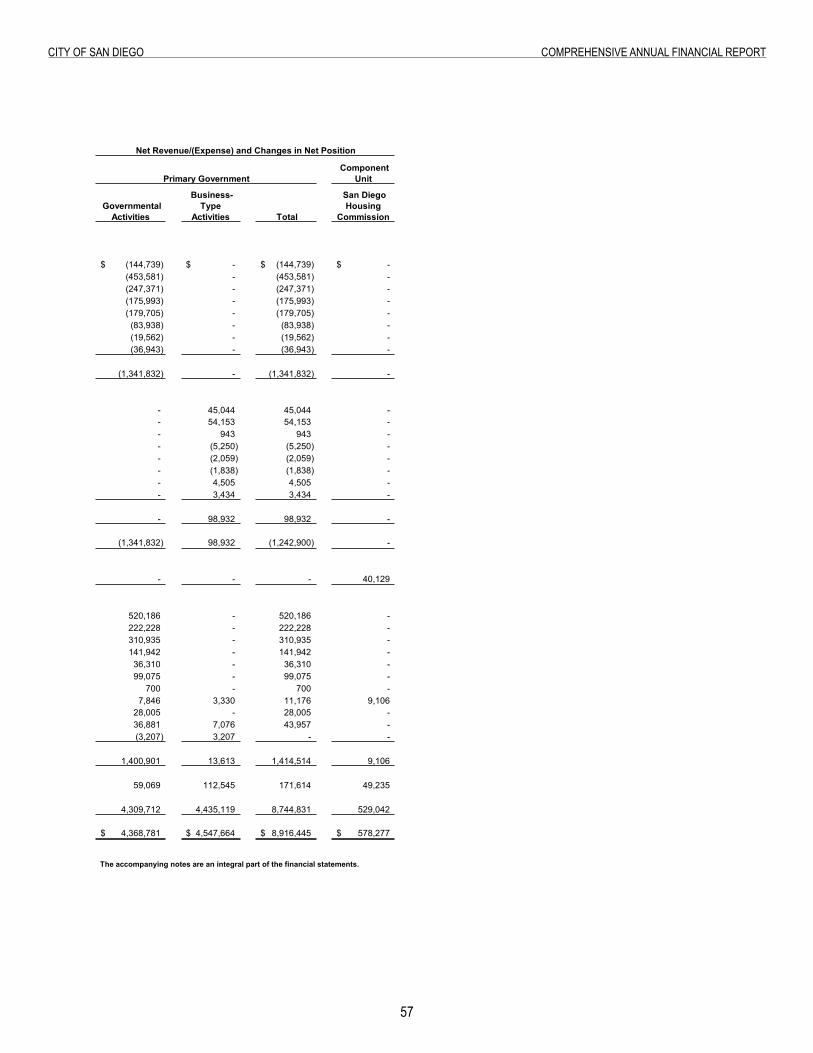
57
City of San Diego ComprehenSive annual finanCial report
Component Unit
Governmental Activities
Business-Type
Activities Total
San Diego Housing
Commission
(144,739)$ -$ (144,739)$ -$ (453,581) - (453,581) - (247,371) - (247,371) - (175,993) - (175,993) - (179,705) - (179,705) -
(83,938) - (83,938) - (19,562) - (19,562) - (36,943) - (36,943) -
(1,341,832) - (1,341,832) -
- 45,044 45,044 - - 54,153 54,153 - - 943 943 - - (5,250) (5,250) - - (2,059) (2,059) - - (1,838) (1,838) - - 4,505 4,505 - - 3,434 3,434 -
- 98,932 98,932 -
(1,341,832) 98,932 (1,242,900) -
- - - 40,129
520,186 - 520,186 - 222,228 - 222,228 - 310,935 - 310,935 - 141,942 - 141,942 -
36,310 - 36,310 - 99,075 - 99,075 -
700 - 700 - 7,846 3,330 11,176 9,106
28,005 - 28,005 - 36,881 7,076 43,957 - (3,207) 3,207 - -
1,400,901 13,613 1,414,514 9,106
59,069 112,545 171,614 49,235
4,309,712 4,435,119 8,744,831 529,042
4,368,781$ 4,547,664$ 8,916,445$ 578,277$
The accompanying notes are an integral part of the financial statements.
Net Revenue/(Expense) and Changes in Net Position
Primary Government
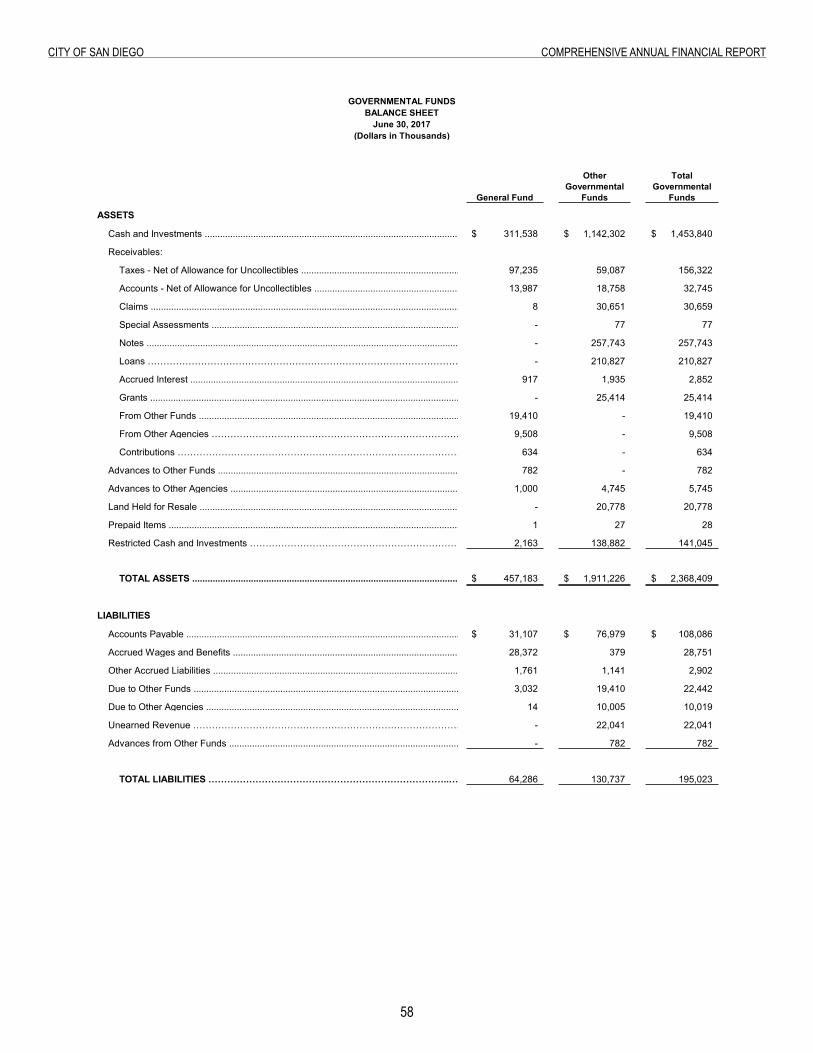
58
City of San Diego ComprehenSive annual finanCial report
Governmental Funds Financial State- Balance Sheet
General Fund
Other Governmental
Funds
Total Governmental
Funds
ASSETS
Cash and Investments ..............................................................................................................................................................................311,538$ 1,142,302$ 1,453,840$
Receivables:
Taxes - Net of Allowance for Uncollectibles ...........................................................................................................................................................................................................................................................................................97,235 59,087 156,322
Accounts - Net of Allowance for Uncollectibles .............................................................................................................................................................13,987 18,758 32,745
Claims ......................................................................................................................................................................................................................................................................................................................................................................................8 30,651 30,659
Special Assessments ....................................................................................................................................................................................................................................................................................................................................................................- 77 77
Notes ........................................................................................................................................................................................................................................................................................................- 257,743 257,743
Loans …………………………………………………………………………………………………………………………………………………………………………………………………- 210,827 210,827
Accrued Interest ..........................................................................................................................................................................................................................................................................................................................................................917 1,935 2,852
Grants ..........................................................................................................................................................................................................................................................................................................................................................................- 25,414 25,414
From Other Funds ........................................................................................................................................................................................................................................................................................................................................................19,410 - 19,410
From Other Agencies …………………………………………………………………………………………………………………………………………………………………..9,508 - 9,508
Contributions …………………………………………………………………………………………………634 - 634
Advances to Other Funds .......................................................................................................................................................................................................................................................................................................................................................782 - 782
Advances to Other Agencies ..........................................................................................................................................................................................................................................................................................................................................................1,000 4,745 5,745
Land Held for Resale .............................................................................................................................................................................................................................................................................- 20,778 20,778
Prepaid Items ..........................................................................................................................................................................................................................................................................................................................................................1 27 28
Restricted Cash and Investments …………………………………………………………………………………………………………………………………..2,163 138,882 141,045
TOTAL ASSETS ....................................................................................................................................................................457,183$ 1,911,226$ 2,368,409$
LIABILITIES
Accounts Payable .....................................................................................................................................................……………………………………………..31,107$ 76,979$ 108,086$
Accrued Wages and Benefits .........................................................................................................................................................................................28,372 379 28,751
Other Accrued Liabilities .................................................................................................................................................………………………………..1,761 1,141 2,902
Due to Other Funds ........................................................................................................................................................……………………………………….3,032 19,410 22,442
Due to Other Agencies ..................................................................................................................................................………………………………………………..14 10,005 10,019
Unearned Revenue ……………………………………………………………………………………………………………………………………………………………………………………………….- 22,041 22,041
Advances from Other Funds ............................................................................................................................................................................- 782 782
TOTAL LIABILITIES …………………………………………………………………..………………………………………………………………………………………………………………………………………64,286 130,737 195,023
GOVERNMENTAL FUNDSBALANCE SHEET
June 30, 2017(Dollars in Thousands)
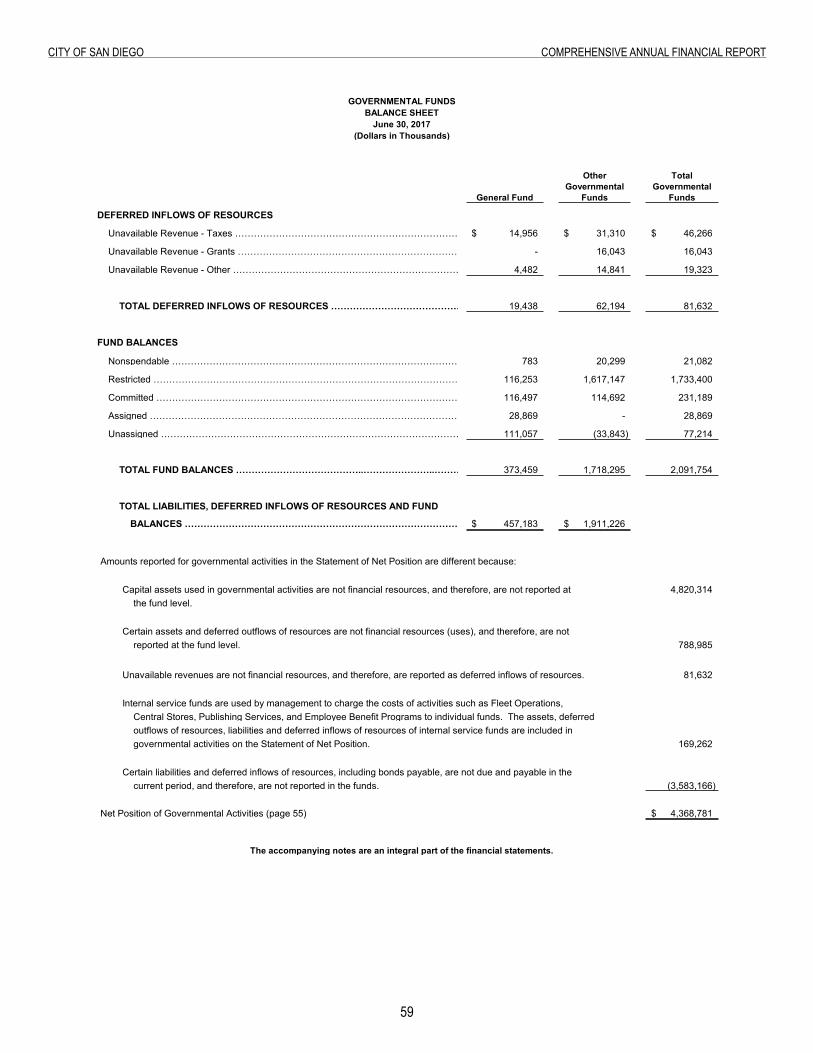
59
City of San Diego ComprehenSive annual finanCial report
General Fund
Other Governmental
Funds
Total Governmental
Funds
GOVERNMENTAL FUNDSBALANCE SHEET
June 30, 2017(Dollars in Thousands)
DEFERRED INFLOWS OF RESOURCES
Unavailable Revenue - Taxes ………………………………………………………………………………………………………………………………………………… 14,956$ 31,310$ 46,266$
Unavailable Revenue - Grants ………………………………………………………………………………………………………………………………………………….. - 16,043 16,043
Unavailable Revenue - Other …………………………………………………………………………………………………………………………………………………… 4,482 14,841 19,323
TOTAL DEFERRED INFLOWS OF RESOURCES ……………………………………………………………………………………………………………..19,438 62,194 81,632
FUND BALANCES
Nonspendable ………………………………………………………………………………………………………………………………………………………………………………………………. 783 20,299 21,082
Restricted ……………………………………………………………………………………………………………………………………………………………………………………………… 116,253 1,617,147 1,733,400
Committed ………………………………………………………………………………………………………………………………………………………………………………………………. 116,497 114,692 231,189
Assigned ……………………………………………………………………………………………………………………………………………………………………………………………………….. 28,869 - 28,869
Unassigned ………………………………………………………………………………………………………………………………………………………………………………………………… 111,057 (33,843) 77,214
TOTAL FUND BALANCES …………………………………..…………………..…………………..…………………..…………………..…………………..……………………………….373,459 1,718,295 2,091,754
TOTAL LIABILITIES, DEFERRED INFLOWS OF RESOURCES AND FUND
BALANCES ……………………………………………………………………………………………………………………………………………………………………………….457,183$ 1,911,226$
Amounts reported for governmental activities in the Statement of Net Position are different because:
Capital assets used in governmental activities are not financial resources, and therefore, are not reported at 4,820,314 the fund level.
Certain assets and deferred outflows of resources are not financial resources (uses), and therefore, are notreported at the fund level. 788,985
Unavailable revenues are not financial resources, and therefore, are reported as deferred inflows of resources. 81,632
Internal service funds are used by management to charge the costs of activities such as Fleet Operations,Central Stores, Publishing Services, and Employee Benefit Programs to individual funds. The assets, deferredoutflows of resources, liabilities and deferred inflows of resources of internal service funds are included ingovernmental activities on the Statement of Net Position. 169,262
Certain liabilities and deferred inflows of resources, including bonds payable, are not due and payable in thecurrent period, and therefore, are not reported in the funds. (3,583,166)
Net Position of Governmental Activities (page 55) 4,368,781$
The accompanying notes are an integral part of the financial statements.
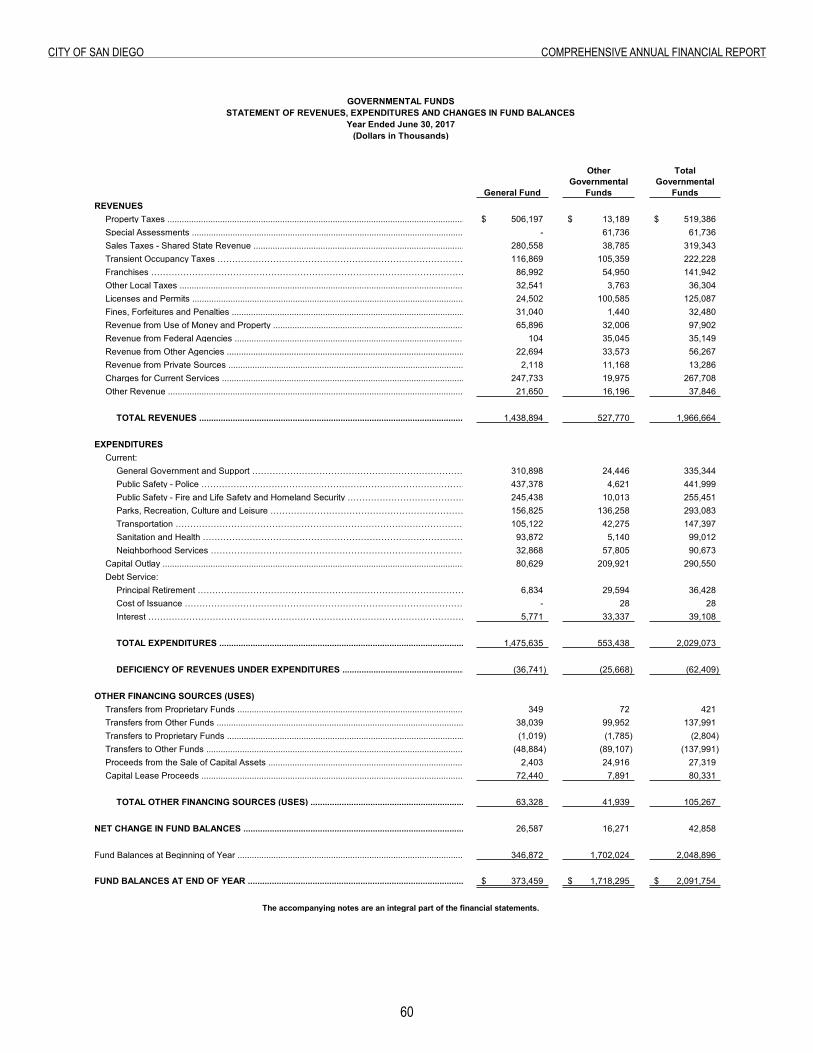
60
City of San Diego ComprehenSive annual finanCial report
Statement of Revenues, Expenditures and Changes in Fund Balances
General Fund
Other Governmental
Funds
Total Governmental
FundsREVENUES
Property Taxes ................................................................................................................................................................................................................................ 506,197$ 13,189$ 519,386$ Special Assessments ........................................................................................................................................................................................................................................... - 61,736 61,736 Sales Taxes - Shared State Revenue ...................................................................................................................................................................................................................................................280,558 38,785 319,343 Transient Occupancy Taxes …………………………………………………………………………………………………………………………………………………………………….. 116,869 105,359 222,228 Franchises ……………………………………………………………………………………………………………………………………………………………………..86,992 54,950 141,942 Other Local Taxes ............................................................................................................................................................................................................................. 32,541 3,763 36,304 Licenses and Permits .......................................................................................................................................................................................................................... 24,502 100,585 125,087 Fines, Forfeitures and Penalties ............................................................................................................................................................................................................... 31,040 1,440 32,480 Revenue from Use of Money and Property ........................................................................................................................................................................................................ 65,896 32,006 97,902 Revenue from Federal Agencies ................................................................................................................................................................................................................. 104 35,045 35,149 Revenue from Other Agencies ................................................................................................................................................................................................................... 22,694 33,573 56,267 Revenue from Private Sources .................................................................................................................................................................................................................. 2,118 11,168 13,286 Charges for Current Services .................................................................................................................................................................................................................. 247,733 19,975 267,708 Other Revenue ................................................................................................................................................................................................................................. 21,650 16,196 37,846
TOTAL REVENUES ................................................................................................................................................................................................................................ 1,438,894 527,770 1,966,664
EXPENDITURES
Current: General Government and Support …………………………………………………………………………………………………………………………………………………………………………………………………………………………………………………… 310,898 24,446 335,344 Public Safety - Police …………………………………………………………………………………………………………………………………………………………………………………………………………………………………………………… 437,378 4,621 441,999 Public Safety - Fire and Life Safety and Homeland Security …………………………………………………………………………………………………………………………………………………………………………………………………………………………………………………… 245,438 10,013 255,451 Parks, Recreation, Culture and Leisure …………………………………………………………………………………………………………………………………………………………………………………………………………………………………………………… 156,825 136,258 293,083 Transportation …………………………………………………………………………………………………………………………………………………………………………………………………………………………………………………… 105,122 42,275 147,397 Sanitation and Health …………………………………………………………………………………………………………………………………………………………………………………………………………………………………………………… 93,872 5,140 99,012 Neighborhood Services …………………………………………………………………………………………………………………………………………………………………………………………………………………………………………………… 32,868 57,805 90,673
Capital Outlay .............................................................................................................................................................................................................................. 80,629 209,921 290,550 Debt Service:
Principal Retirement …………………………………………………………………………………………………………………………………………………………………………………………………………………………………………………… 6,834 29,594 36,428 Cost of Issuance …………………………………………………………………………………………………………………………………………………………………………………………………………………………………………………… - 28 28 Interest …………………………………………………………………………………………………………………………………………………………………………………………………………………………………………………… 5,771 33,337 39,108
TOTAL EXPENDITURES ............................................................................................................................................................................................................................ 1,475,635 553,438 2,029,073
DEFICIENCY OF REVENUES UNDER EXPENDITURES ............................................................................................................................................................................................. (36,741) (25,668) (62,409)
OTHER FINANCING SOURCES (USES)Transfers from Proprietary Funds .................................................................................................................................................................................................... 349 72 421 Transfers from Other Funds .................................................................................................................................................................................................................... 38,039 99,952 137,991 Transfers to Proprietary Funds ................................................................................................................................................................................................................ (1,019) (1,785) (2,804) Transfers to Other Funds ...................................................................................................................................................................................................................... (48,884) (89,107) (137,991) Proceeds from the Sale of Capital Assets .............................................................................................................................................................................2,403 24,916 27,319 Capital Lease Proceeds ......................................................................................................................................................................................................................72,440 7,891 80,331
TOTAL OTHER FINANCING SOURCES (USES) .......................................................................................................................................................................................................... 63,328 41,939 105,267
NET CHANGE IN FUND BALANCES .......................................................................................................................................................................................................... 26,587 16,271 42,858
Fund Balances at Beginning of Year .......................................................................................................................................................................................................................................................................................................................... 346,872 1,702,024 2,048,896
FUND BALANCES AT END OF YEAR .......................................................................................................................................................................................................................................................................................................................... 373,459$ 1,718,295$ 2,091,754$
GOVERNMENTAL FUNDSSTATEMENT OF REVENUES, EXPENDITURES AND CHANGES IN FUND BALANCES
The accompanying notes are an integral part of the financial statements.
Year Ended June 30, 2017(Dollars in Thousands)
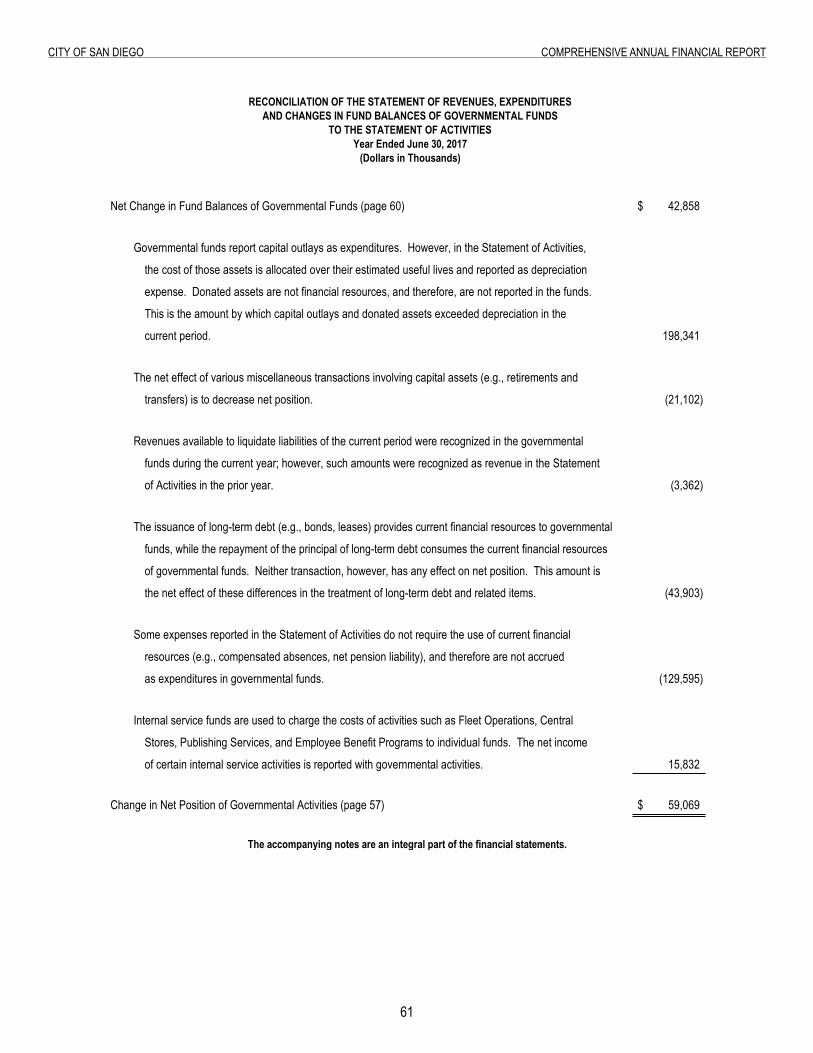
61
City of San Diego ComprehenSive annual finanCial report
Reconciliation of the Statement of Revenues, Expenditures and Changes in Fund Balances of Governmental Funds to the
Net Change in Fund Balances of Governmental Funds (page 60) 42,858$
Governmental funds report capital outlays as expenditures. However, in the Statement of Activities,
the cost of those assets is allocated over their estimated useful lives and reported as depreciation
expense. Donated assets are not financial resources, and therefore, are not reported in the funds.
This is the amount by which capital outlays and donated assets exceeded depreciation in the
current period. 198,341
The net effect of various miscellaneous transactions involving capital assets (e.g., retirements and
transfers) is to decrease net position. (21,102)
Revenues available to liquidate liabilities of the current period were recognized in the governmental
funds during the current year; however, such amounts were recognized as revenue in the Statement
of Activities in the prior year. (3,362)
The issuance of long-term debt (e.g., bonds, leases) provides current financial resources to governmental
funds, while the repayment of the principal of long-term debt consumes the current financial resources
of governmental funds. Neither transaction, however, has any effect on net position. This amount is
the net effect of these differences in the treatment of long-term debt and related items. (43,903)
Some expenses reported in the Statement of Activities do not require the use of current financial
resources (e.g., compensated absences, net pension liability), and therefore are not accrued
as expenditures in governmental funds. (129,595)
Internal service funds are used to charge the costs of activities such as Fleet Operations, Central
Stores, Publishing Services, and Employee Benefit Programs to individual funds. The net income
of certain internal service activities is reported with governmental activities. 15,832
Change in Net Position of Governmental Activities (page 57) 59,069$
The accompanying notes are an integral part of the financial statements.
RECONCILIATION OF THE STATEMENT OF REVENUES, EXPENDITURESAND CHANGES IN FUND BALANCES OF GOVERNMENTAL FUNDS
TO THE STATEMENT OF ACTIVITIESYear Ended June 30, 2017
(Dollars in Thousands)
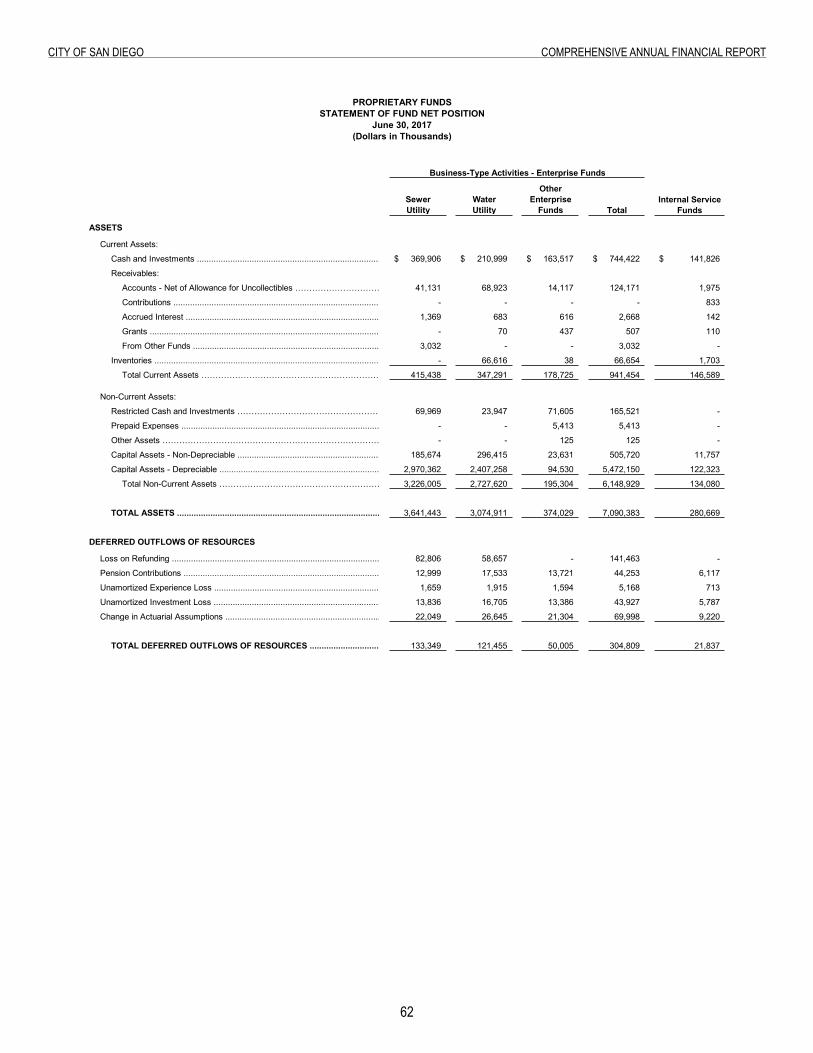
62
City of San Diego ComprehenSive annual finanCial report
Proprietary Funds Financial State- Statement of Fund Net Position
Sewer Utility
Water Utility
Other Enterprise
Funds Total
ASSETS
Current Assets:
Cash and Investments ...................................................................................................................................................................................................369,906$ 210,999$ 163,517$ 744,422$ 141,826$
Receivables:
Accounts - Net of Allowance for Uncollectibles ……………………………………………………………………………….. 41,131 68,923 14,117 124,171 1,975
Contributions ...............................................................................................................................................................................................................................- - - - 833
Accrued Interest ...............................................................................................................................................................................................................................1,369 683 616 2,668 142
Grants .........................................................................................................................................................................................................................................- 70 437 507 110
From Other Funds ...............................................................................................................................................................................................................................3,032 - - 3,032 -
Inventories ....................................................................................................................................................................................................................................- 66,616 38 66,654 1,703
Total Current Assets …………………………………………………………………………………………………………………………….. 415,438 347,291 178,725 941,454 146,589
Non-Current Assets:
Restricted Cash and Investments ………………………………………………………………………………………………………………. 69,969 23,947 71,605 165,521 -
Prepaid Expenses ....................................................................................................................................................................................................- - 5,413 5,413 -
Other Assets …………………………………………………………………………………………………………………………………………….. - - 125 125 -
Capital Assets - Non-Depreciable ............................................................................................................................................................................................................................... 185,674 296,415 23,631 505,720 11,757
Capital Assets - Depreciable ................................................................................................................………. 2,970,362 2,407,258 94,530 5,472,150 122,323
Total Non-Current Assets ……………………………………………………………………………………………………………………………………… 3,226,005 2,727,620 195,304 6,148,929 134,080
TOTAL ASSETS ...................................................................................................................................................................................................................................3,641,443 3,074,911 374,029 7,090,383 280,669
DEFERRED OUTFLOWS OF RESOURCES
Loss on Refunding ................................................................................................................................................................................................................ 82,806 58,657 - 141,463 -
Pension Contributions ................................................................................................................................................................................................................ 12,999 17,533 13,721 44,253 6,117
Unamortized Experience Loss ................................................................................................................................................................................................................ 1,659 1,915 1,594 5,168 713
Unamortized Investment Loss ...............................................................................................................................................................................................................13,836 16,705 13,386 43,927 5,787
Change in Actuarial Assumptions ...............................................................................................................................................................................................................22,049 26,645 21,304 69,998 9,220
TOTAL DEFERRED OUTFLOWS OF RESOURCES ..............................................................................................................................................................................................................................133,349 121,455 50,005 304,809 21,837
PROPRIETARY FUNDSSTATEMENT OF FUND NET POSITION
June 30, 2017(Dollars in Thousands)
Business-Type Activities - Enterprise Funds
Internal Service Funds
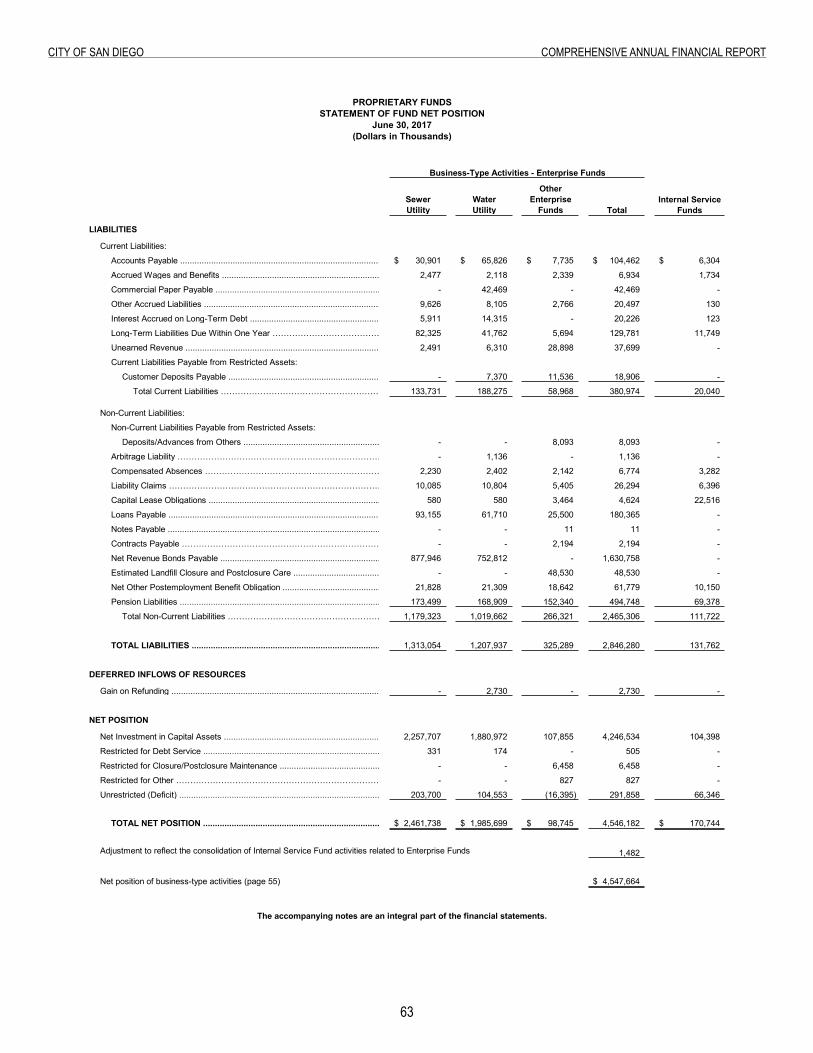
63
City of San Diego ComprehenSive annual finanCial report
Sewer Utility
Water Utility
Other Enterprise
Funds Total
PROPRIETARY FUNDSSTATEMENT OF FUND NET POSITION
June 30, 2017(Dollars in Thousands)
Business-Type Activities - Enterprise Funds
Internal Service Funds
LIABILITIES
Current Liabilities:
Accounts Payable ...............................................................................................................................................................................................................................30,901$ 65,826$ 7,735$ 104,462$ 6,304$
Accrued Wages and Benefits .....................................................................................................................................................................................................................2,477 2,118 2,339 6,934 1,734
Commercial Paper Payable .....................................................................................................................................................................................................................- 42,469 - 42,469 -
Other Accrued Liabilities .....................................................................................................................................................................................................................9,626 8,105 2,766 20,497 130
Interest Accrued on Long-Term Debt ..............................................................................................................................................................................................................5,911 14,315 - 20,226 123
Long-Term Liabilities Due Within One Year …………………………………………………………………………………………………. 82,325 41,762 5,694 129,781 11,749
Unearned Revenue ...............................................................................................................................................................................................................................2,491 6,310 28,898 37,699 -
Current Liabilities Payable from Restricted Assets:
Customer Deposits Payable ...............................................................................................................................................................................................................................- 7,370 11,536 18,906 -
Total Current Liabilities ……………………………………………………………………………………………………………………. 133,731 188,275 58,968 380,974 20,040
Non-Current Liabilities:
Non-Current Liabilities Payable from Restricted Assets:
Deposits/Advances from Others ..................................................................................................................................................................................................................- - 8,093 8,093 -
Arbitrage Liability …………………………………………………………………………………………………………………………………….. - 1,136 - 1,136 -
Compensated Absences ……………………………………………………………………………………………………………………………………….. 2,230 2,402 2,142 6,774 3,282
Liability Claims ……………………………………………………………………………………………………………………………………….. 10,085 10,804 5,405 26,294 6,396
Capital Lease Obligations .....................................................................................................................................................................................................................................580 580 3,464 4,624 22,516
Loans Payable ....................................................................................................................................................................................................................93,155 61,710 25,500 180,365 -
Notes Payable ....................................................................................................................................................................................................................- - 11 11 -
Contracts Payable ……………………………………………………………………………………………………………………………….- - 2,194 2,194 -
Net Revenue Bonds Payable ....................................................................................................................................................................................................................877,946 752,812 - 1,630,758 -
Estimated Landfill Closure and Postclosure Care .................................................................................................................................................................................................- - 48,530 48,530 -
Net Other Postemployment Benefit Obligation ............................................................. 21,828 21,309 18,642 61,779 10,150
Pension Liabilities .......................................................................................................................................................................................................................................173,499 168,909 152,340 494,748 69,378
Total Non-Current Liabilities …………………………………………………………………………………………………………….. 1,179,323 1,019,662 266,321 2,465,306 111,722
TOTAL LIABILITIES ..............................................................................................................................................................................................................................1,313,054 1,207,937 325,289 2,846,280 131,762
DEFERRED INFLOWS OF RESOURCES
Gain on Refunding ................................................................................................................................................................................................................ - 2,730 - 2,730 -
NET POSITION
Net Investment in Capital Assets ...........................................................................................................................................................................................................................2,257,707 1,880,972 107,855 4,246,534 104,398
Restricted for Debt Service ............................................................................................................................................................................................................................331 174 - 505 -
Restricted for Closure/Postclosure Maintenance ............................................................................................................................................................................................................................- - 6,458 6,458 -
Restricted for Other …………………………………………………………………………………………………………………………………. - - 827 827 -
Unrestricted (Deficit) ............................................................................................................................................................................................................................203,700 104,553 (16,395) 291,858 66,346
TOTAL NET POSITION ..............................................................................................................................................................................................................................2,461,738$ 1,985,699$ 98,745$ 4,546,182 170,744$
Adjustment to reflect the consolidation of Internal Service Fund activities related to Enterprise Funds 1,482
Net position of business-type activities (page 55) 4,547,664$
The accompanying notes are an integral part of the financial statements.

this page intentionally left Blank
6�
Page Intentionally Left Blank
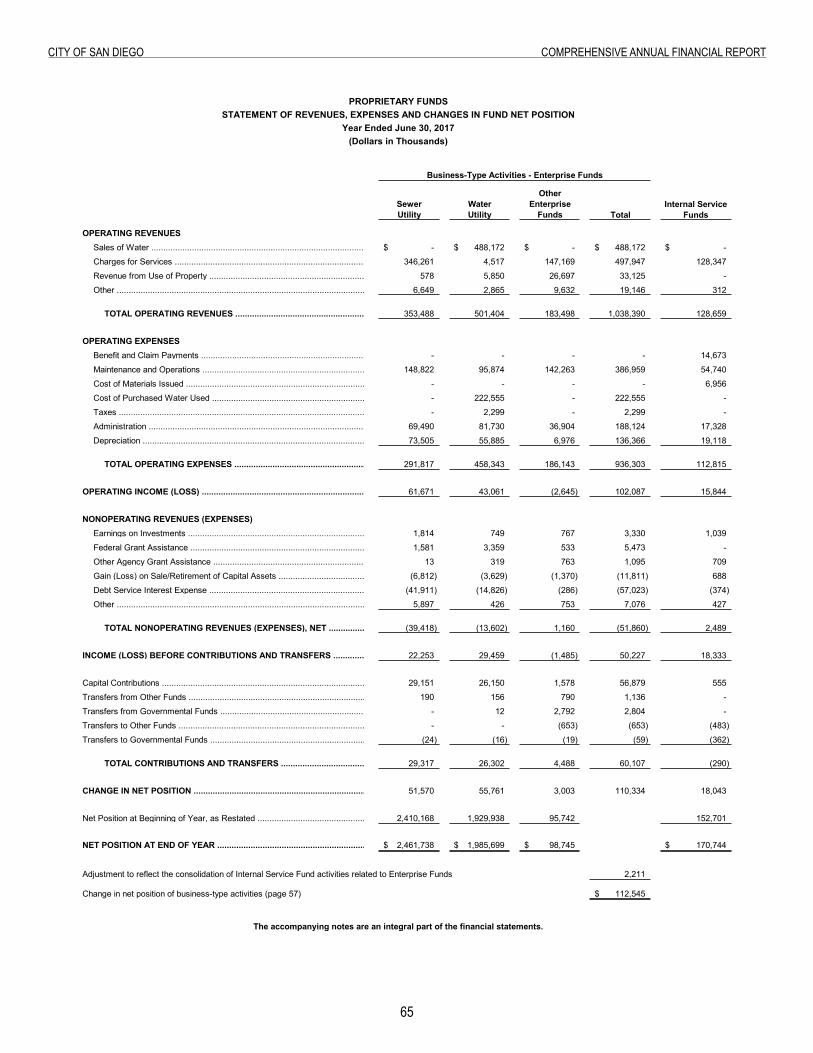
65
City of San Diego ComprehenSive annual finanCial report
Statement of Revenues, Expenses and Changes in Fund Net Position
Sewer Utility
Water Utility
Other Enterprise
Funds Total
OPERATING REVENUESSales of Water ................................................................................................................................................................................................................................. -$ 488,172$ -$ 488,172$ -$
Charges for Services ........................................................................................................................................................................................................................... 346,261 4,517 147,169 497,947 128,347
Revenue from Use of Property .................................................................................................................................................................................................................... 578 5,850 26,697 33,125 -
Other ............................................................................................................................................................................................................................................ 6,649 2,865 9,632 19,146 312
TOTAL OPERATING REVENUES .......................................................................................................................................................................................................................353,488 501,404 183,498 1,038,390 128,659
OPERATING EXPENSESBenefit and Claim Payments .........................................................................................................................................................................................................................- - - - 14,673
Maintenance and Operations .........................................................................................................................................................................................................................148,822 95,874 142,263 386,959 54,740
Cost of Materials Issued ......................................................................................................................................................................................................................- - - - 6,956
Cost of Purchased Water Used ........................................................................................................................................................................................................................- 222,555 - 222,555 -
Taxes ..........................................................................................................................................................................................................................................- 2,299 - 2,299 -
Administration ..................................................................................................................................................................................................................................69,490 81,730 36,904 188,124 17,328
Depreciation ...................................................................................................................................................................................................................73,505 55,885 6,976 136,366 19,118
TOTAL OPERATING EXPENSES .......................................................................................................................................................................................................................291,817 458,343 186,143 936,303 112,815
OPERATING INCOME (LOSS) ........................................................................................................................................................................................................................61,671 43,061 (2,645) 102,087 15,844
NONOPERATING REVENUES (EXPENSES)Earnings on Investments .........................................................................................................................................................................................................................1,814 749 767 3,330 1,039
Federal Grant Assistance .......................................................................................................................................................................................................................1,581 3,359 533 5,473 -
Other Agency Grant Assistance ..................................................................................................................................................................................................................13 319 763 1,095 709
Gain (Loss) on Sale/Retirement of Capital Assets .................................................................................................................................................................................................(6,812) (3,629) (1,370) (11,811) 688
Debt Service Interest Expense .........................................................................................................................................................................................................................(41,911) (14,826) (286) (57,023) (374)
Other .........................................................................................................................................................................................................................5,897 426 753 7,076 427
TOTAL NONOPERATING REVENUES (EXPENSES), NET .........................................................................................................................................................................................................(39,418) (13,602) 1,160 (51,860) 2,489
INCOME (LOSS) BEFORE CONTRIBUTIONS AND TRANSFERS .......................................22,253 29,459 (1,485) 50,227 18,333
Capital Contributions ............................................................................................................................................................................................................................ 29,151 26,150 1,578 56,879 555
Transfers from Other Funds ............................................................................................................................................................................................................................190 156 790 1,136 -
Transfers from Governmental Funds ..........................................................................................................................................................................................................................- 12 2,792 2,804 -
Transfers to Other Funds .......................................................................................................................................................................................................................- - (653) (653) (483)
Transfers to Governmental Funds ................................................................................................................................................................................................................(24) (16) (19) (59) (362)
TOTAL CONTRIBUTIONS AND TRANSFERS ......................................................................................................................................................................................................... 29,317 26,302 4,488 60,107 (290)
CHANGE IN NET POSITION ..............................................................................................................................................................................................................................51,570 55,761 3,003 110,334 18,043
Net Position at Beginning of Year, as Restated .........................................................................................................................................................................................… 2,410,168 1,929,938 95,742 152,701
NET POSITION AT END OF YEAR ...............................................................................................................................................................................................................2,461,738$ 1,985,699$ 98,745$ 170,744$
Adjustment to reflect the consolidation of Internal Service Fund activities related to Enterprise Funds 2,211
Change in net position of business-type activities (page 57) 112,545$
The accompanying notes are an integral part of the financial statements.
PROPRIETARY FUNDSSTATEMENT OF REVENUES, EXPENSES AND CHANGES IN FUND NET POSITION
Year Ended June 30, 2017(Dollars in Thousands)
Business-Type Activities - Enterprise Funds
Internal Service Funds
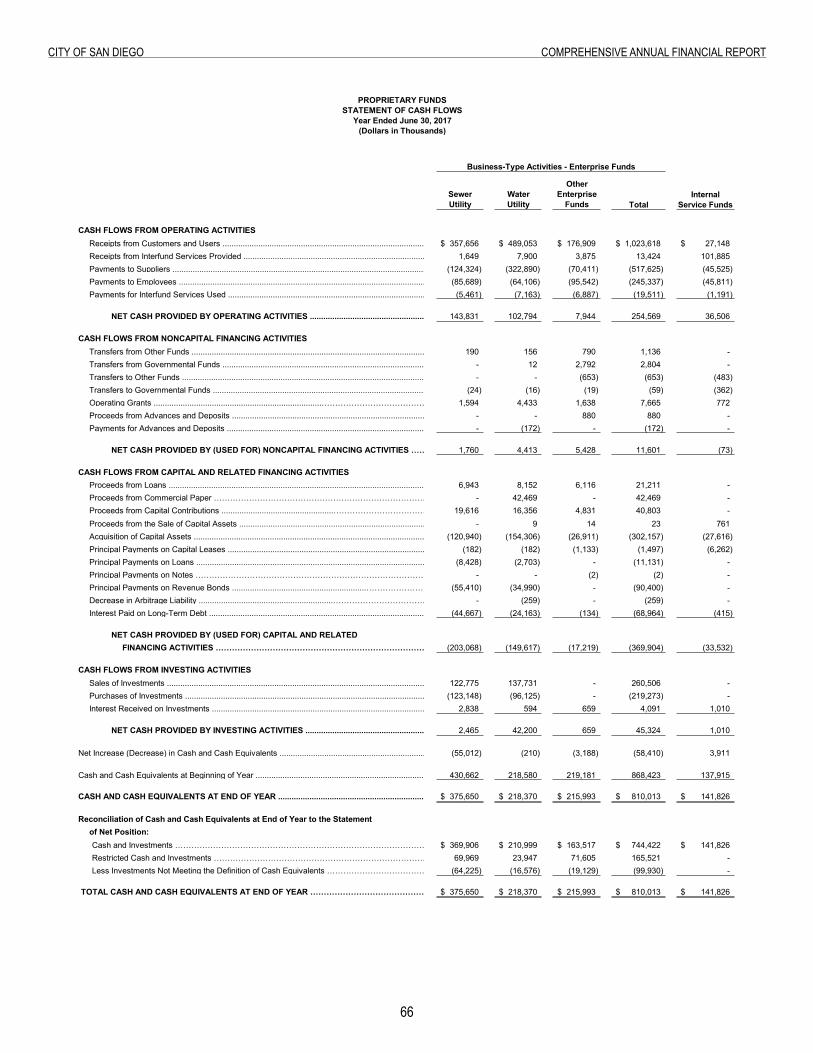
66
City of San Diego ComprehenSive annual finanCial report
Statement of Cash Flows
Sewer Utility
Water Utility
Other Enterprise
Funds Total
CASH FLOWS FROM OPERATING ACTIVITIESReceipts from Customers and Users ......................................................................................................................................................................................................................... 357,656$ 489,053$ 176,909$ 1,023,618$ 27,148$ Receipts from Interfund Services Provided ......................................................................................................................................................................................................................... 1,649 7,900 3,875 13,424 101,885 Payments to Suppliers ......................................................................................................................................................................................................................... (124,324) (322,890) (70,411) (517,625) (45,525) Payments to Employees ......................................................................................................................................................................................................................... (85,689) (64,106) (95,542) (245,337) (45,811) Payments for Interfund Services Used ......................................................................................................................................................................................................................... (5,461) (7,163) (6,887) (19,511) (1,191)
NET CASH PROVIDED BY OPERATING ACTIVITIES ...........................................................................................................................................................................................143,831 102,794 7,944 254,569 36,506
CASH FLOWS FROM NONCAPITAL FINANCING ACTIVITIESTransfers from Other Funds .........................................................................................................................................................................................................................190 156 790 1,136 - Transfers from Governmental Funds ..............................................................................................................................................................................................................- 12 2,792 2,804 - Transfers to Other Funds ........................................................................................................................................................................................................................- - (653) (653) (483) Transfers to Governmental Funds ................................................................................................................................................................................................................(24) (16) (19) (59) (362) Operating Grants ...........................................................................………………………………………………………………………………………..1,594 4,433 1,638 7,665 772 Proceeds from Advances and Deposits .....................................................................................................................……….. - - 880 880 - Payments for Advances and Deposits ..........................................................................................................................................................................................................…… - (172) - (172) -
NET CASH PROVIDED BY (USED FOR) NONCAPITAL FINANCING ACTIVITIES ……………………………………………………………………..1,760 4,413 5,428 11,601 (73)
CASH FLOWS FROM CAPITAL AND RELATED FINANCING ACTIVITIESProceeds from Loans ............................................................................................................................................... 6,943 8,152 6,116 21,211 - Proceeds from Commercial Paper ………………………………………………………………………………….. - 42,469 - 42,469 - Proceeds from Capital Contributions ..................................................…………………………………………………………………………. 19,616 16,356 4,831 40,803 - Proceeds from the Sale of Capital Assets .........................................................................................................................................................................................................- 9 14 23 761 Acquisition of Capital Assets ....................................................................................................................................................................................................................(120,940) (154,306) (26,911) (302,157) (27,616) Principal Payments on Capital Leases ..............................................................................................................................................................................................................(182) (182) (1,133) (1,497) (6,262) Principal Payments on Loans ..............................................................................................................................................................................................................(8,428) (2,703) - (11,131) - Principal Payments on Notes ………………………………………………………………………………. - - (2) (2) - Principal Payments on Revenue Bonds ............................................................………………………………………………………………..(55,410) (34,990) - (90,400) - Decrease in Arbitrage Liability ............................................................………………………………………………………………..- (259) - (259) - Interest Paid on Long-Term Debt ........................................................................................................................................................................................................(44,667) (24,163) (134) (68,964) (415)
NET CASH PROVIDED BY (USED FOR) CAPITAL AND RELATEDFINANCING ACTIVITIES ……………………………………………………………………………………. (203,068) (149,617) (17,219) (369,904) (33,532)
CASH FLOWS FROM INVESTING ACTIVITIESSales of Investments .................................................................................................................................................................................................122,775 137,731 - 260,506 - Purchases of Investments .................................................................................................................................................................................................(123,148) (96,125) - (219,273) - Interest Received on Investments .................................................................................................................................................................................................2,838 594 659 4,091 1,010
NET CASH PROVIDED BY INVESTING ACTIVITIES ...........................................................................................................................................................................................2,465 42,200 659 45,324 1,010
Net Increase (Decrease) in Cash and Cash Equivalents ..........................................................................................................................................................................................(55,012) (210) (3,188) (58,410) 3,911
Cash and Cash Equivalents at Beginning of Year ................................................................................................................................................................................................430,662 218,580 219,181 868,423 137,915
CASH AND CASH EQUIVALENTS AT END OF YEAR ......................................................................................................................................................................................................375,650$ 218,370$ 215,993$ 810,013$ 141,826$
Reconciliation of Cash and Cash Equivalents at End of Year to the Statementof Net Position:Cash and Investments ……………………………………………………………………………………………………………………………………………………………………………………….. 369,906$ 210,999$ 163,517$ 744,422$ 141,826$ Restricted Cash and Investments ………………………………………………………………………………………………………………………………………………………….. 69,969 23,947 71,605 165,521 - Less Investments Not Meeting the Definition of Cash Equivalents ………………………………………………………………………………………………………………………………………………………….. (64,225) (16,576) (19,129) (99,930) -
TOTAL CASH AND CASH EQUIVALENTS AT END OF YEAR …………………………………………………. 375,650$ 218,370$ 215,993$ 810,013$ 141,826$
PROPRIETARY FUNDSSTATEMENT OF CASH FLOWS
Year Ended June 30, 2017(Dollars in Thousands)
Business-Type Activities - Enterprise Funds
Internal Service Funds
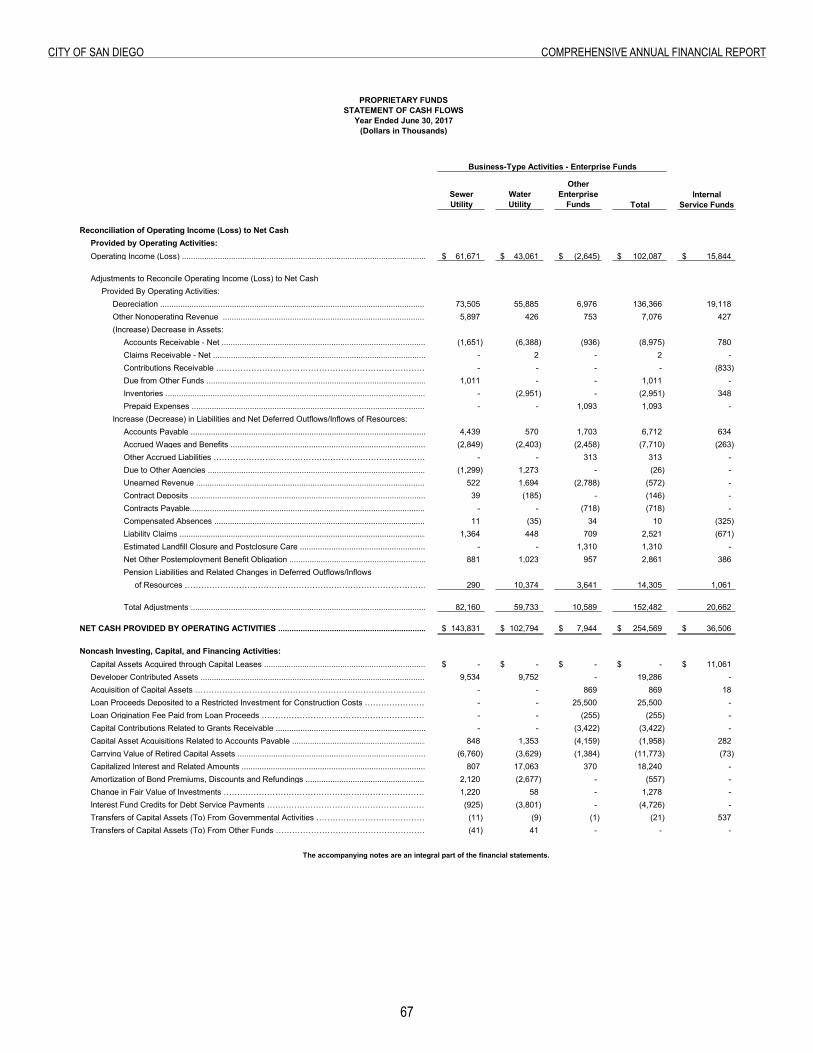
67
City of San Diego ComprehenSive annual finanCial report
Sewer Utility
Water Utility
Other Enterprise
Funds Total
PROPRIETARY FUNDSSTATEMENT OF CASH FLOWS
Year Ended June 30, 2017(Dollars in Thousands)
Business-Type Activities - Enterprise Funds
Internal Service Funds
Reconciliation of Operating Income (Loss) to Net Cash Provided by Operating Activities:Operating Income (Loss) ........................................................................................................................................................................................................................61,671$ 43,061$ (2,645)$ 102,087$ 15,844$
Adjustments to Reconcile Operating Income (Loss) to Net CashProvided By Operating Activities:
Depreciation ..................................................................................................................................................................................................................73,505 55,885 6,976 136,366 19,118 Other Nonoperating Revenue ..........................................................................................................................................................................................................5,897 426 753 7,076 427 (Increase) Decrease in Assets:
Accounts Receivable - Net ................................................................................................................................................................................................................................... (1,651) (6,388) (936) (8,975) 780 Claims Receivable - Net ...................................................................................................................................................................................................................................- 2 - 2 - Contributions Receivable ……………………………………………………………………………………………….. - - - - (833) Due from Other Funds ...................................................................................................................................................................................................................................1,011 - - 1,011 - Inventories .............................................................................................................................................................................................................- (2,951) - (2,951) 348 Prepaid Expenses ............................................................................................................................................................................................- - 1,093 1,093 -
Increase (Decrease) in Liabilities and Net Deferred Outflows/Inflows of Resources:Accounts Payable .......................................................................................................................................................................................................4,439 570 1,703 6,712 634 Accrued Wages and Benefits ..............................................................................................................................................................................................(2,849) (2,403) (2,458) (7,710) (263) Other Accrued Liabilities ………………………………………………………………………………. - - 313 313 - Due to Other Agencies .................................................................................................................................................................................... (1,299) 1,273 - (26) - Unearned Revenue ........................................................................................................................................................................................................522 1,694 (2,788) (572) - Contract Deposits ........................................................................................................................................................................................................ 39 (185) - (146) - Contracts Payable........................................................................................................................................................................................................- - (718) (718) - Compensated Absences ........................................................................................................................................................................................................11 (35) 34 10 (325) Liability Claims ........................................................................................................................................................................................................1,364 448 709 2,521 (671) Estimated Landfill Closure and Postclosure Care ........................................................................................................................................................................................................ - - 1,310 1,310 - Net Other Postemployment Benefit Obligation .................................................................................. 881 1,023 957 2,861 386 Pension Liabilities and Related Changes in Deferred Outflows/Inflows
of Resources …………………………………………………………………………………………………………………… 290 10,374 3,641 14,305 1,061
Total Adjustments ........................................................................................................................................................................................................ 82,160 59,733 10,589 152,482 20,662
NET CASH PROVIDED BY OPERATING ACTIVITIES .......................................................................................................................................................................................................... 143,831$ 102,794$ 7,944$ 254,569$ 36,506$
Noncash Investing, Capital, and Financing Activities: Capital Assets Acquired through Capital Leases .....................................................................................................................................................................................................................-$ -$ -$ -$ 11,061$ Developer Contributed Assets ......................................................................................................................................................................................................................9,534 9,752 - 19,286 - Acquisition of Capital Assets …………………………………………………………………………………………. - - 869 869 18 Loan Proceeds Deposited to a Restricted Investment for Construction Costs ……………………………… - - 25,500 25,500 - Loan Origination Fee Paid from Loan Proceeds …………………………………………………………………… - - (255) (255) - Capital Contributions Related to Grants Receivable ......................................................................................................................................................................................................................- - (3,422) (3,422) - Capital Asset Acquisitions Related to Accounts Payable ...................................................................................................................................................................................................................... 848 1,353 (4,159) (1,958) 282 Carrying Value of Retired Capital Assets ...................................................................................................................................................................................................................(6,760) (3,629) (1,384) (11,773) (73) Capitalized Interest and Related Amounts ...................................................................................................................................................................................................................807 17,063 370 18,240 - Amortization of Bond Premiums, Discounts and Refundings ...................................................................................................................................................................................................................2,120 (2,677) - (557) - Change in Fair Value of Investments ………………………………………………………………………………………………………………………..1,220 58 - 1,278 - Interest Fund Credits for Debt Service Payments ………………………………………………………………………………………………………………..(925) (3,801) - (4,726) - Transfers of Capital Assets (To) From Governmental Activities ……………………………………………………………………………………………………………………………………………….. (11) (9) (1) (21) 537 Transfers of Capital Assets (To) From Other Funds ……………………………………………………………………………………………………………………………………………….. (41) 41 - - -
The accompanying notes are an integral part of the financial statements.
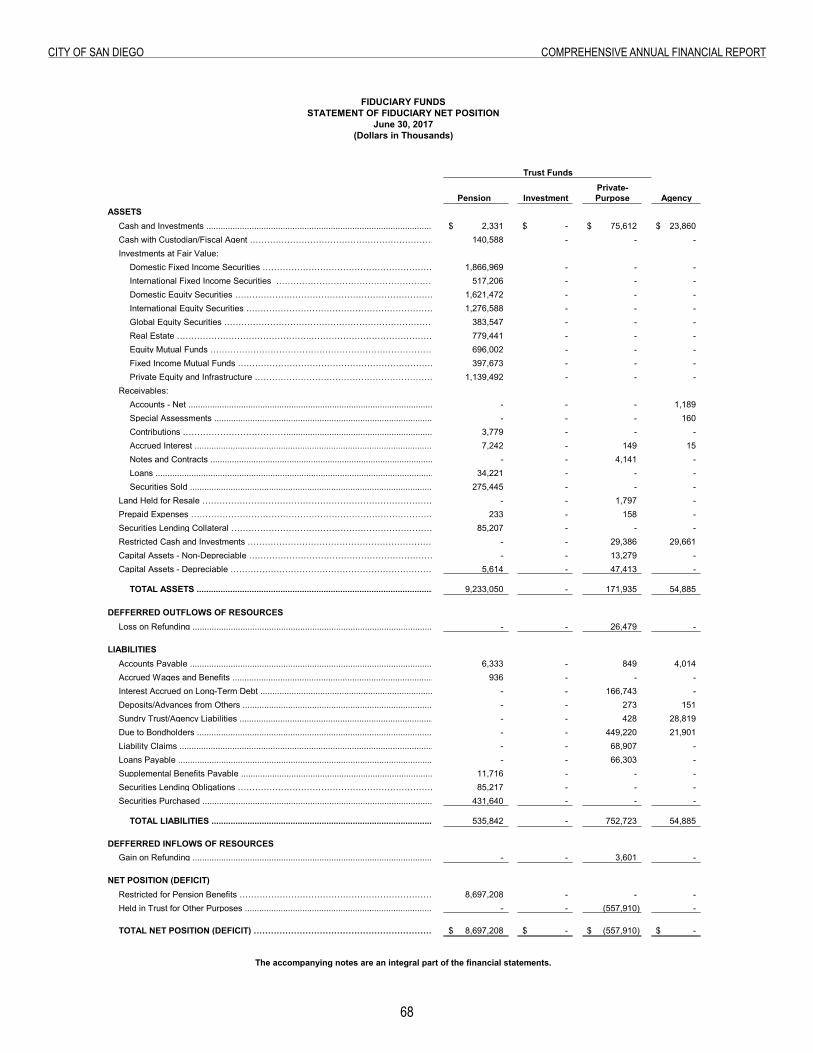
68
City of San Diego ComprehenSive annual finanCial report
Statement of Fiduciary Net Position Fiduciary Funds Financial Statements:
Trust Funds
Private-Pension Investment Purpose Agency
ASSETSCash and Investments ............................................................................................................................................................……… 2,331$ -$ 75,612$ 23,860$ Cash with Custodian/Fiscal Agent ………………………………………………………………………………………………………………………………………………………………………… 140,588 - - - Investments at Fair Value:
Domestic Fixed Income Securities ……………………………………………………………………………………………………………………………………………………… 1,866,969 - - - International Fixed Income Securities ……………………………………………………………………………….................................................................. 517,206 - - - Domestic Equity Securities …………………………………………………………………………………………………………………………………………………………. 1,621,472 - - - International Equity Securities ……………………………………………………………………………………………………………………………………………….. 1,276,588 - - - Global Equity Securities ……………………………………………………………………………………………………………………………………………… 383,547 - - - Real Estate ……………………………………….……………………………………………………………………………………………………………………………………………………. 779,441 - - - Equity Mutual Funds ……………………………………………………………………………………………………………………………………………………………………………………. 696,002 - - - Fixed Income Mutual Funds ……………………………………………………………………………………………………………………………………………………………. 397,673 - - - Private Equity and Infrastructure ………………………………………………………………………………………………………………………………………………………… 1,139,492 - - -
Receivables: Accounts - Net ................................................................................................................................................................................................................…………………………. - - - 1,189 Special Assessments ................................................................................................................................................................................................................…………………………. - - - 160 Contributions ………………………………............................................................................................................……………………………………………………………………… 3,779 - - - Accrued Interest .......................................................................................................................................................................................…………………………….. 7,242 - 149 15 Notes and Contracts .......................................................................................................................................................................................…………………………….. - - 4,141 - Loans ............................................................................................................................................................................................................…………………………………………….. 34,221 - - - Securities Sold .........................................................................................................................................................................................……………………………. 275,445 - - -
Land Held for Resale ………………………………………………………………………………………………………………………………………………………………………… - - 1,797 - Prepaid Expenses ………………………………………………………………………………………………………………………………………………………………………… 233 - 158 - Securities Lending Collateral …………………………………………………………………………………………………………………………………………………………….. 85,207 - - - Restricted Cash and Investments ……………………………………………………………………………………………………………………………………………………… - - 29,386 29,661 Capital Assets - Non-Depreciable …………………………………………………………………………………………………………………………………………….. - - 13,279 - Capital Assets - Depreciable ……………………………………………………………………………………………………………………………………………………………… 5,614 - 47,413 -
TOTAL ASSETS .................................................................................................................................................................................................................… 9,233,050 - 171,935 54,885
DEFFERRED OUTFLOWS OF RESOURCESLoss on Refunding ................................................................................................................................................................………………………… - - 26,479 -
LIABILITIES Accounts Payable ................................................................................................................................................................………………………… 6,333 - 849 4,014 Accrued Wages and Benefits ........................................................................................................................................................................................................................……. 936 - - - Interest Accrued on Long-Term Debt .............................................................................................................................................................................................…………………………….. - - 166,743 - Deposits/Advances from Others ..........................................................................................................................................................................................................………………………. - - 273 151 Sundry Trust/Agency Liabilities .......................................................................................................................................................................................................…………………………….. - - 428 28,819 Due to Bondholders .......................................................................................................................................................................................................…………………………….. - - 449,220 21,901 Liability Claims .......................................................................................................................................................................................................…………………………….. - - 68,907 - Loans Payable .......................................................................................................................................................................................................…………………………….. - - 66,303 - Supplemental Benefits Payable .......................................................................................................................................................................................................…………………………….. 11,716 - - - Securities Lending Obligations ……………………………………………………………………………………………………………………………………………………………….85,217 - - - Securities Purchased ...........................................................................................................................................................………………………………………………………. 431,640 - - -
TOTAL LIABILITIES ...........................................................................................................................................................................................… 535,842 - 752,723 54,885
DEFFERRED INFLOWS OF RESOURCESGain on Refunding ................................................................................................................................................................………………………… - - 3,601 -
NET POSITION (DEFICIT) Restricted for Pension Benefits …………………………………………………………………………………………………………………………………………………………….. 8,697,208 - - - Held in Trust for Other Purposes ................................................................................................................................................................………………………… - - (557,910) -
TOTAL NET POSITION (DEFICIT) …………………………………………………………………………………………………………………………….. 8,697,208$ -$ (557,910)$ -$
FIDUCIARY FUNDS
June 30, 2017(Dollars in Thousands)
The accompanying notes are an integral part of the financial statements.
STATEMENT OF FIDUCIARY NET POSITION
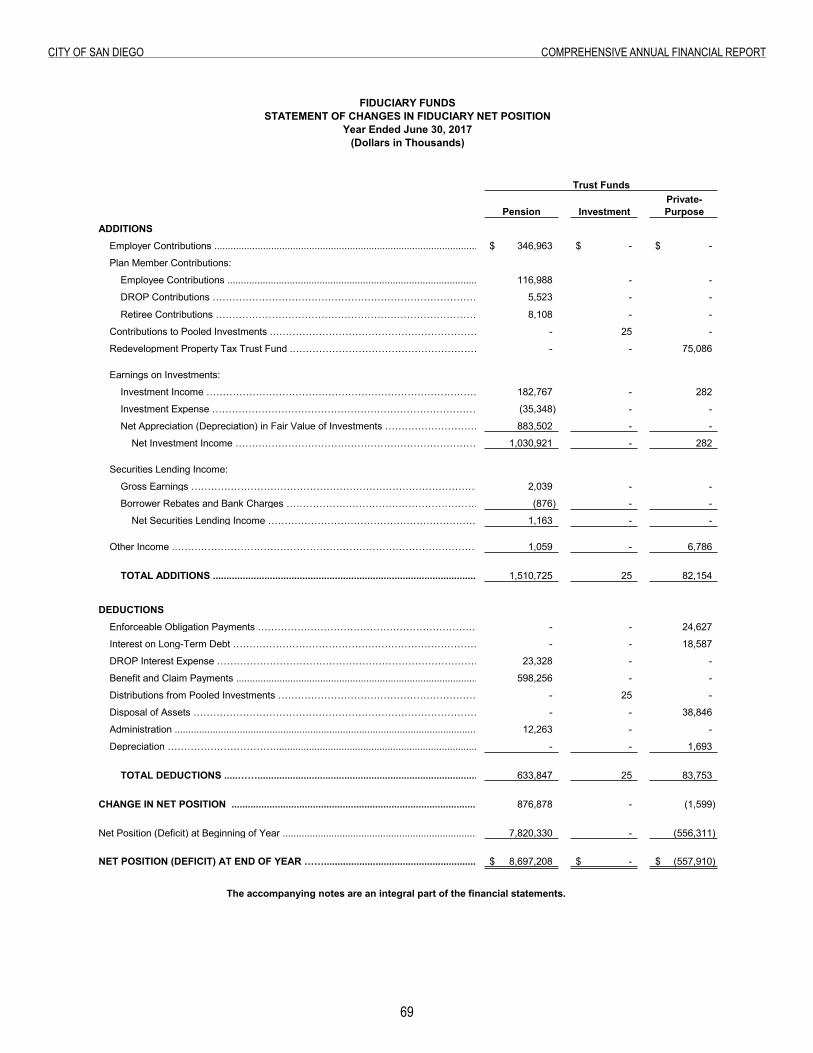
69
City of San Diego ComprehenSive annual finanCial report
Statement of Changes in Fiduciary Net Position
Private-Pension Investment Purpose
ADDITIONSEmployer Contributions .............................................................................................................................................................................................................… 346,963$ -$ -$
Plan Member Contributions:
Employee Contributions .............................................................................................................................................................................................................… 116,988 - -
DROP Contributions ……………………………………………………………………………………………… 5,523 - -
Retiree Contributions ……………………………………………………………………………………………………………………………………………………………………………………………….. 8,108 - -
Contributions to Pooled Investments .………………………………………………………………………………………………………...……………………………………………………………………………….. - 25 -
Redevelopment Property Tax Trust Fund .………………………………………………………………………………………………………...……………………………………………………………………………….. - - 75,086
Earnings on Investments:
Investment Income ………………………………………………………………………………………………………………………………………………………………………………………………………… 182,767 - 282
Investment Expense …………………………………………………………………………………………………………………………………………………………………………………………………………………………. (35,348) - -
Net Appreciation (Depreciation) in Fair Value of Investments …………………………………………………………………………………………………………………………………………………………………………………………………………………………. 883,502 - -
Net Investment Income …………………………………………………………………………………………………………………………………………………………………………………………………………. 1,030,921 - 282
Securities Lending Income:
Gross Earnings ………………………………………………………………………………………………………………………………………………………………………………………………………………………….. 2,039 - -
Borrower Rebates and Bank Charges ……………………………………………………………………………………………………………………………………………………………………………………………………………………………………… (876) - -
Net Securities Lending Income ………………………………………………………………………………………………………………………………………………………………………………………………. 1,163 - -
Other Income .………………………………………………………………………………………………………...……………………………………………………………………………….. 1,059 - 6,786
TOTAL ADDITIONS .............................................................................................................................................................................… 1,510,725 25 82,154
DEDUCTIONS
Enforceable Obligation Payments ……………………………………………………………………………………………………………………………………………………………………………………………………………………………………………………………………………………….. - - 24,627
Interest on Long-Term Debt ……………………………………………………………………………………………………………………………………………………………………………………………………………………………………………………………………………………….. - - 18,587
DROP Interest Expense ……………………………………………………………………………………………………………………………………………………………………………………………………………………………………………………………………………………….. 23,328 - -
Benefit and Claim Payments ....................................................................................................................................................................................................… 598,256 - -
Distributions from Pooled Investments …………………………………………………………………………………………………………………………………………………………………………….. - 25 -
Disposal of Assets …………………………………………………………………………………… - - 38,846
Administration ...............................................................................................................................................................................................................................… 12,263 - -
Depreciation ……………………………...........................................................................................................................................................…………………………………….. - - 1,693
TOTAL DEDUCTIONS .....……..................................................................................................................................................................….. 633,847 25 83,753
CHANGE IN NET POSITION ...................................................................................................................................................................................................… 876,878 - (1,599)
Net Position (Deficit) at Beginning of Year .........................................................................................................................................................................................................… 7,820,330 - (556,311)
NET POSITION (DEFICIT) AT END OF YEAR ……................................................................................................................................................……………………………… 8,697,208$ -$ (557,910)$
The accompanying notes are an integral part of the financial statements.
Trust Funds
FIDUCIARY FUNDSSTATEMENT OF CHANGES IN FIDUCIARY NET POSITION
Year Ended June 30, 2017(Dollars in Thousands)
70
City of San Diego ComprehenSive annual finanCial report
1. Summary of Significant Accounting Policies Notes to the Basic Financial Statements:
NOTES TO THE BASIC FINANCIAL STATEMENTS Fiscal Year Ended June 30, 2017
1. SUMMARY OF SIGNIFICANT ACCOUNTING POLICIES (Dollars in Thousands)
The City of San Diego (City) adopted its current charter on April 7, 1931 and operates as a municipality in accordance with State laws. Since adoption, the City Charter has been amended many times.
The accounting policies of the City conform to accounting principles generally accepted in the United States of America (GAAP) as applicable to governmental units. The following is a summary of the City’s significant accounting policies:
a. Financial Reporting Entity
As required by GAAP, these financial statements present the primary government and its component units. The City is the primary government while entities for which the primary government is considered to be financially accountable represent its component units. Component units can be blended with the primary government or discretely presented.
A blended component unit is a legally separate entity whose functions are an integral part of the primary government. A component unit is considered to be an integral part of the primary government, and hence a blended component unit, in any of these circumstances: (1) the entity and the primary government substantively have the same governing body and a financial benefit/burden relationship exists; (2) the entity and the primary government substantially have the same governing body and management of the primary government have operational responsibility for the entity; (3) if the entity exists to serve or benefit exclusively (or almost exclusively) the primary government; (4) the total debt of the entity is repayable entirely (or almost entirely) from resources of the primary government; or (5) the entity is organized as a not-for-profit corporation in which the primary government is the sole corporate member, as identified in the entity’s articles of incorporation or bylaws. Blended component units are reported as funds of the primary government. A discretely presented component unit does not function as an integral part of the primary government. It is reported in the government-wide financial statements in a column separate from the primary government. The City also reports fiduciary component units which are not included in the government-wide financial statements. Fiduciary component units are not part of the primary government and are reported as fiduciary funds to account for assets held in a trustee or agency capacity for others that cannot be used to support the government’s own programs.
Included within the reporting entity as blended component units are the following:
Civic San Diego (CSD) Convention Center Expansion Financing Authority (CCEFA) Public Facilities Financing Authority (PFFA) San Diego Convention Center Corporation (SDCCC) San Diego Facilities and Equipment Leasing Corporation (SDFELC) San Diego Industrial Development Authority (SDIDA) Tobacco Settlement Revenue Funding Corporation (TSRFC)
71
City of San Diego ComprehenSive annual finanCial report
A brief description of each blended component unit follows:
Civic San Diego (CSD) is a not-for-profit public benefit corporation established upon dissolution of the former San Diego Redevelopment Agency (RDA). One of CSD’s primary functions is providing administrative and advisory services to the City as the Successor Agency. CSD also assists the City with downtown parking management administration and affordable housing development. CSD is governed by a nine member board appointed by the Mayor and City Council. CSD’s budget and governing board are approved by the City of San Diego and services primarily benefit the City. CSD is reported as a governmental fund. Financial statements are available at www.civicsd.com.
The Convention Center Expansion Financing Authority (CCEFA) was established in 1996 by the City and the San Diego Unified Port District (Port) to acquire and construct the expansion of the existing convention center. The CCEFA is governed by a board consisting of the Mayor, the City Manager, the President/CEO of the Port, and a member of the Board of Commissioners for the Port. The current working title of the City Manager is the Chief Operating Officer. The CCEFA provides services which primarily benefit the City. CCEFA is reported as a governmental fund.
The Public Facilities Financing Authority (PFFA) was established in 1991 by the City and the former RDA to acquire
and construct public capital improvements. As of June 30, 2017, the members are the City, the Successor Agency, and the Housing Authority of the City of San Diego. PFFA is governed by a board of commissioners composed of the members of the City Council. PFFA provides services exclusively to the City. Financing for governmental funds is reported as a governmental activity and financing for enterprise funds is reported as a business-type activity.
San Diego Convention Center Corporation (SDCCC) is a not-for-profit public benefit corporation, originally organized to market, operate, and maintain the San Diego Convention Center. The City is the sole member of SDCCC and acts through the San Diego City Council in accordance with the City Charter and the City’s Municipal Code. The City appoints all seven voting members to the Board of Directors of SDCCC. In accordance with the management agreement with SDCCC, the City allocates to SDCCC approved budgetary amounts for marketing, promotion, and capital projects for the Convention Center. In accordance with GASB Statement No. 80 effective in fiscal year 2017, SDCCC was reclassified from a discrete component unit to a blended component unit (See Note 23 for more information). SDCCC is reported as an enterprise fund. Complete stand-alone financial statements are available at www.visitsandiego.com.
The San Diego Facilities and Equipment Leasing Corporation (SDFELC) is a not-for-profit public benefit corporation
established in 1987 for the purpose of acquiring and leasing to the City real and personal property to be used in the municipal operations of the City. SDFELC is governed by a three member board consisting of the City Attorney, the Chief Financial Officer, and the Mayor. Services are provided exclusively to the City. Financing provided through SDFELC for governmental funds is reported as a governmental activity and financing for enterprise funds is reported as a business-type activity.
The San Diego Industrial Development Authority (SDIDA) was established in 1983 by the City for the purpose of
providing an alternate method of financing to participating parties for economic development purposes. The City Council is the governing board and the City has operational responsibility. SDIDA is reported as a governmental fund.
The Tobacco Settlement Revenue Funding Corporation (TSRFC) is a not-for-profit public benefit corporation
established in 2006 for the purpose of acquiring the tobacco settlement revenues allocated to the City from the State of California, pursuant to the Master Settlement Agreement. TSRFC purchased from the City the rights to receive future tobacco settlement revenues due to the City. TSRFC is governed by a board of directors, which
72
City of San Diego ComprehenSive annual finanCial report
consists of the Chief Operating Officer, the Chief Financial Officer, and one independent director. The independent director is appointed by the Mayor or the remaining directors. TSRFC is reported as a governmental fund.
There are two fiduciary component units:
San Diego City Employees’ Retirement System (SDCERS) was established in 1927 by the City and administers
independent, qualified, single employer governmental defined benefit plans and trusts for the City, the Port and the San Diego County Regional Airport Authority (Airport). SDCERS’ Board of Administration (Board) adopted a Declaration of Group Trust, effective July 1, 2007. Under the Group Trust, the City, Port and Airport plans are treated as separate plans, with assets pooled for investment purposes only. SDCERS also processes certain postemployment healthcare activities on behalf of the City. SDCERS is a legally separate, fiduciary component unit of the City. It is governed by a 13 member Board of Administration, eight of which are appointed by the City, and a Pension Administrator who does not report to or work under the direction of the elected officials or appointed managers of the City. As such, the City does not maintain direct operational oversight of SDCERS or its financial reports. SDCERS provides services primarily to the City and is reported as a pension trust fund. Complete stand- alone financial statements are available at www.sdcers.org.
The Successor Agency of the Redevelopment Agency of the City of San Diego (Successor Agency) is a legally separate entity from the City, reported as a fiduciary component unit of the City. It was established to hold the former RDA’s assets until they are distributed to other units of state and local government, or where appropriate, to private parties, and to administer the payments of the former RDA’s obligations. Pursuant to ABX1 26, redevelopment agencies and their successor agencies in the State of California generally cannot enter into new projects, obligations or commitments. On January 12, 2012, the City was designated to serve as the Successor Agency subject to control of an oversight board. The Successor Agency is reported as a private-purpose trust fund in the fiduciary funds financial statements.
There is one discretely presented component unit:
San Diego Housing Commission (SDHC)
SDHC is a governmental agency, which was formed by the City under Ordinance No. 2515 on December 5, 1978 in accordance with the Housing Authority Law of the State of California. SDHC’s priority is to serve low and moderate income persons by providing rental assistance payments, rental housing, loans and grants to families, individuals and not-for-profit organizations to create and preserve affordable housing. SDHC is governed by the San Diego Housing Authority, which is composed of the nine members of the San Diego City Council. The Housing Authority is assisted by a Board of Commissioners, a seven-member advisory body appointed by the Mayor and confirmed by the City Council. The Housing Authority has final authority over the SDHC’s budget and major policy changes. SDHC is discretely presented because the City appoints the voting members of the SDHC Board, is financially accountable for SDHC, and SDHC provides its services directly to the citizens. SDHC has seven blended component units and thirteen discretely presented component units which are included in the City’s basic financial statements. The thirteen discretely presented component units are financially and legally separate entities from SDHC. SDHC’s discretely presented component units reflect the financial reporting entity of consolidated Housing Development Partners, which includes the legal entities: Housing Development Partners of San Diego (HDP); HDP Mason Housing Corporation (Mason); Casa Colina, LP (Casa Colina); Logan Development II, LP (Logan II); HDP Broadway, LP (Broadway); HDP Churchill, LLC (Churchill); HDP Parker Kier, LLC (Parker Kier); HDP New Palace, LP (New Palace); Logan Development Management, LLC (Logan Mgmt); and HDP Broadway Management, LLC (Broadway Mgmt); HDP Churchill, LP (Churchill LP); HDP Island Village, LLP (Island Village) and HDP New Palace Management, LLC (New Palace Mgmt) collectively referred to as the
73
City of San Diego ComprehenSive annual finanCial report
“Corporation”. Complete stand-alone financial statements are available at www.sdhc.org.
Each blended and discretely presented component unit of the City has a June 30 fiscal year-end, with the exception of SDHC’s discretely presented component units, which have a December 31, 2016 fiscal year-end.
b. Government-Wide and Fund Financial Statements
The government-wide financial statements (i.e., the Statement of Net Position and the Statement of Activities) report information on all of the non-fiduciary activities of the City and its blended component units. Governmental activities are normally supported by taxes and intergovernmental revenues and are reported separately from business-type activities, which rely to a significant extent on user fees and charges for support. The primary government is reported discretely from SDHC, a legally separate component unit for which the primary government is financially accountable.
The Statement of Activities demonstrates the degree to which the direct expenses of a given function or segment are offset by program revenues. Direct expenses are those that are clearly identifiable to a specific function or segment. Direct expenses reported include administrative and overhead charges. Program revenues include (1) charges to customers or applicants who purchase, use, or directly benefit from goods, services, or privileges provided by a given function or segment and (2) grants and contributions that are restricted to meeting the operational or capital requirements of a particular function or segment. Taxes and other items that do not qualify as program revenues are reported as general revenues.
Separate financial statements are provided for governmental funds, proprietary funds, and fiduciary funds, the latter of which are excluded from the government-wide financial statements. Major individual governmental funds and major individual enterprise funds are reported as separate columns in the fund financial statements.
c. Measurement Focus, Basis of Accounting, and Financial Statement Presentation
Government-wide financial statements are reported using the economic resources measurement focus and the accrual basis of accounting, as are the proprietary and fiduciary funds financial statements. Revenues are recorded when earned and expenses are recorded when a liability is incurred, regardless of the timing of related cash flows. Property taxes are recognized as revenues in the year for which they are levied. Grants and similar items are recognized as revenue as soon as all eligibility requirements imposed by the provider have been met.
As a general rule, the effect of interfund activity has been eliminated from the government-wide financial statements. Exceptions to this general rule are payments-in-lieu of taxes and other interfund services provided and used between functions of the City. Elimination of these charges would distort the direct costs and program revenues reported for the various functions concerned.
Governmental funds financial statements are reported using the current financial resources measurement focus and the modified accrual basis of accounting. Revenues are recognized as soon as they are both measurable and available. Revenues are considered to be available when they are collectible within the current period or soon enough thereafter to pay liabilities of the current period. Revenues which are considered susceptible to accrual include: real and personal property taxes; special assessments collected via property taxes; sales taxes; transient occupancy taxes; other local taxes; franchise fees; fines, forfeitures and penalties; rents and concessions; interest; and state and federal grants and subventions, provided they are received within 60 days from the end of the fiscal year.
Licenses and permits, parking citations, and some miscellaneous revenues are recorded as revenues when received in cash because they generally are not measurable until actually received.
7�
City of San Diego ComprehenSive annual finanCial report
Expenditures are recognized when the related fund liability is incurred except for (1) principal and interest of general long-term debt, which are recognized when due; and (2) employee annual leave and claims and judgments from litigation, which are recorded in the period due and payable since such amounts will not currently be liquidated with expendable available financial resources. General capital asset acquisitions are reported as expenditures in governmental funds.
The governmental funds financial statements do not present long-term debt, but the related debt is shown in the reconciliation of the governmental funds Balance Sheet to the government-wide Statement of Net Position. Issuance of long-term debt, bond premiums, and discounts are reflected as other financing sources (uses) and recognized in the period in which they are issued. Permanent funds, commonly referred to as endowment funds, are governmental funds used to report resources that are legally restricted to the extent that only earnings, and not principal, may be used for purposes that support City programs. The City has received endowments for various programs, a list of which can be found in the Permanent Funds section of the Combining and Individual Fund Financial Statements and Schedules. The corpus of permanent funds is reported as Nonspendable Fund Balance and investment earnings available for expenditure are reported as Restricted Fund Balance in the fund level financial statements. The endowment principal is reported as Restricted for Nonexpendable Permanent Endowments in the Statement of Net Position. Funds are spent in accordance with the City budget, subject to State law governing the spending of endowment fund investment earnings in California Probate Code Section 18504.
Proprietary funds distinguish operating revenues and expenses from nonoperating items. Operating revenues and expenses generally result from providing services and producing and delivering goods in connection with a proprietary fund’s principal ongoing operations. The principal operating revenues of the City’s proprietary funds are charges to customers for sales and services. Operating expenses for proprietary funds include the cost of sales and services, administrative expenses, and depreciation on capital assets. All revenues and expenses not meeting this definition are reported as nonoperating revenues and expenses.
Fiduciary funds are used to account for assets held by the City in a trustee capacity or as an agent for individuals, private organizations, and/or other governmental units, and include pension trust, investment trust, private-purpose trust and agency funds. Trust funds are reported using the same measurement focus and basis of accounting as proprietary funds. Agency funds are reported using the accrual basis of accounting and only report assets and liabilities, and therefore, do not have a measurement focus.
The following is the City’s only major governmental fund: General Fund - The General Fund is the principal operating fund of the City. It is used to account for all financial resources, except those required to be accounted for in another fund. The following are the City’s major enterprise funds: Sewer Utility Fund - The Sewer Utility Fund is used to account for the operation, maintenance and development of the City’s sewer system. The City’s Sewer Utility Fund includes activities related to the performance of services for Participating Agencies. Water Utility Fund - The Water Utility Fund is used to account for operating and maintenance costs, replacements, betterments, expansion of facilities, and payments necessary in obtaining water from the Colorado River, the State Water Project, and local sources, and supplying water to its customers.
75
City of San Diego ComprehenSive annual finanCial report
The following are the City’s other fund types: Internal Service Funds - These funds account for fleet vehicles and transportation, printing, and storeroom services provided to City departments on a cost-reimbursement basis. Internal service funds also account for energy conservation, risk management, unemployment insurance, unused compensatory time, unused sick leave, and long-term disability programs, which derive revenues from rates charged to benefiting departments. Pension Trust Funds - These funds account for SDCERS, the Preservation of Benefits Plan, the Postemployment Healthcare Benefit Plan, the Supplemental Pension Savings Plan (SPSP), the 401(a) Plan and the 401(k) Plan.
Private-Purpose Trust Fund - This fund was established to account for the ongoing obligations of the Successor Agency (former RDA).
Agency Funds - These funds account for assets held by the City as an agent for individuals, private organizations, and other governments, including federal and state income taxes withheld from employees, parking citation revenues on behalf of other agencies, certain employee benefit plans, and special assessments.
d. Property Taxes
The County of San Diego (County) assesses, bills, and collects property taxes on behalf of numerous special districts and incorporated cities, including the City of San Diego. The City receives the current year’s taxes through periodic apportionments from the County. The County’s tax calendar is from July 1 to June 30. Property taxes attach as a lien on property on January 1. Taxes are levied on July 1, based on the assessed values as of the lien date, are payable in two equal installments on November 1 and February 1, and become delinquent after December 10 and April 10, respectively. Since the passage of California’s Proposition 13, beginning with fiscal year ended 1979, general property taxes are based on either (1) a flat 1% rate applied to the 1975-76 full value of the property or (2) 1% of the sales price of any property sold or of the cost of any new construction after the 1975-76 valuation. Taxable values of properties (exclusive of increases related to sales and new construction) can increase by a maximum of 2% per year. The Proposition 13 limitation on general property taxes does not apply to taxes levied to pay the debt service on any indebtedness approved by the voters prior to June 6, 1978 (the date of passage of Proposition 13). At the government-wide level, property tax revenue is recognized in the fiscal year for which the taxes have been levied. Property taxes received after the fiscal year and which do not meet the 60 day availability criterion are not considered available as a resource that can be used to finance the current year operations of the City and, therefore, are recorded as deferred inflows of resources in the governmental funds. The City provides an allowance for uncollectible property taxes, which is analyzed each year against the most recent data from the County. For fiscal year 2017, the allowance amount was $2,606. Property owners can appeal the assessment value of their property to the County Assessment Appeals Board. If successful, the County Assessor may reduce the taxable value of a property and/or provide a refund to affected property owners. Reductions of taxable property value within the City of San Diego have a negative impact on future tax collections until assessed valuations increase.
76
City of San Diego ComprehenSive annual finanCial report
e. Cash and Investments
The City’s cash and cash equivalents for statement of cash flows purposes include cash on hand, demand deposits, restricted cash, and investments held in the City Treasurer’s Pooled Investment Fund (pool) and are reported at fair value. Cash equivalents reported in the Statement of Cash Flows for the Water and Sewer Utility Funds do not include restricted investments represented as Restricted Cash and Investments with an original maturity date greater than ninety days from the time of purchase. The City’s cash resources are combined to form a cash and investment pool managed by the City Treasurer. The City is not required to register the pool as an investment company with the Securities and Exchange Commission (SEC). The investment activities of the City Treasurer in managing the pool are governed by California Government Code § 53601 and the City of San Diego City Treasurer’s Investment Policy, which is reviewed by the City Treasurer’s Investment Advisory Committee and presented annually to the City Council. Interest earned on pooled investments is allocated to participating funds and entities based upon their average daily cash balance during the allocation month. Fair value adjustments to the pool are recorded annually; however, the City Treasury reports on market values monthly. The pool participates in the California State Treasurer’s Local Agency Investment Fund (LAIF). Investments in LAIF are governed by State statutes and overseen by a five member Local Investment Advisory Board. The fair value of the City’s position in LAIF may be greater or less than the value of the shares. Investments in LAIF are valued in these financial statements using a fair value factor provided by LAIF applied to the value of the City’s shares in the investment pool. It has been the City’s policy to allow the General Fund to receive interest earned by certain governmental funds, internal service funds, and agency funds, unless otherwise expressly stated in the resolutions creating the individual funds. These transactions cause an increase in the “Transfers from Other Funds” amount for the General Fund and a corresponding increase in the “Transfers to Other Funds” amount for the funds earning the interest. In the case of negative interest, these transactions cause an increase to the “Transfers from Other Funds” amount for the funds transferring the negative interest and a like increase to the “Transfers to Other Funds” amount for the General Fund. During fiscal year 2017, interest of $1,613 was assigned from various funds to the General Fund. Certain governmental funds maintain investments outside of the pool. These funds are supervised and controlled by a five member Funds Commission, which is appointed by the Mayor and confirmed by the City Council. The Funds Commission engages money managers to direct the investments of these funds. Additionally, the City and its component units maintain individual accounts pursuant to bond issuances and major construction contracts, which may or may not be related to debt issuances. The investment of these funds is governed by the policies set forth in the individual indenture and trustee agreements. Certain component units of the City also participate in LAIF separately from the pool. All City investments are reported at fair value in accordance with Governmental Accounting Standards Board (GASB) Statement No. 31, Accounting and Financial Reporting for Certain Investments and External Investment Pools and GASB Statement No. 72, Fair Value Measurement and Application. Note 3 contains additional information on permissible investments per the City Treasurer’s Investment Policy and other policies applicable to the cash and investments reported herein. The discharge of fiduciary duties by SDCERS’ Board is governed by Section 144 of the City Charter and Article XVI, Section 17 of the California State Constitution. SDCERS' Board has the authority to delegate investment management duties to outside advisors, to seek the advice of outside investment counsel, and to provide oversight and monitoring of the investment managers it hires. Additional discretion beyond the City Charter is provided for under the California State Constitution and other relevant authorities whereby the Board may, at its discretion, invest funds in any form or type of investment, financial instrument, or financial transaction. SDCERS’
77
City of San Diego ComprehenSive annual finanCial report
investment managers manage all investments, which are held in SDCERS’ name. SDCERS’ investments are reported at fair value or net asset value (NAV), in accordance with GASB Statement No. 72, in the accompanying Statement of Fiduciary Net Position. SDCERS’ custodial bank, State Street Bank & Trust Company, provides the fair values of exchange traded assets. Through its agents, SDCERS also holds investments in non-publicly traded institutional investment funds. These institutional investment funds are comprised of exchange traded securities, the fair values of which are provided by the respective investment managers. Directly-owned real estate assets are stated at appraised values as determined by SDCERS’ real estate managers and third party appraisal firms. Private equity and infrastructure assets are measured at fair value using the NAV per share or its equivalent by their respective investment managers, giving consideration to the financial condition and operating results of the portfolio companies, and other factors deemed relevant. These values are reviewed by SDCERS’ investments staff and their real estate, private equity and infrastructure consultants.
f. Receivables
The City’s receivables are comprised mainly of taxes, accounts and grants. Accounts receivable and taxes receivable are reported net of an allowance for uncollectible amounts. The allowance amounts as of June 30, 2017 are as follows:
Accounts Receivable Taxes ReceivableFund Allowance Allowance
General Fund 6,725$ 2,546$ Nonmajor Governmental Funds 2,731 60 Sewer Utility 999 - Water Utility 1,212 - Nonmajor Enterprise Funds 3,100 - Internal Service Funds 495 -
Total 15,262$ 2,606$
g. Inventories
Inventories reported in the government-wide financial statements and the proprietary funds financial statements, which consist primarily of water in storage intended for resale, are valued at the lower of cost or market. Such inventories are expensed when consumed using primarily the first-in, first-out (FIFO) and weighted-average methods for inventories of water in storage and supplies, respectively. Inventory supplies of governmental funds are recorded as expenditures when purchased.
h. Land Held for Resale
Land Held for Resale is reported in the government-wide and fund financial statements at the lower of cost or net realizable value. In the governmental funds financial statements, fund balances associated with properties held for resale are reported as restricted fund balances as proceeds from the sale of such properties are restricted for the purpose of affordable housing as codified in the California Health and Safety Code. Land is originally recorded at historical cost and adjusted to net realizable value when a property is impaired, when the determination is made that a property will be sold for less than its cost, or when property values decrease due to market conditions.
78
City of San Diego ComprehenSive annual finanCial report
i. Deferred Outflows/Inflows of Resources
Deferred Outflows of Resources represent the consumption of net position that is applicable to a future reporting period. Similarly, Deferred Inflows of Resources represent the acquisition of net position that is applicable to a future reporting period. The City reports Deferred Outflows/Inflows of Resources in the basic financial statements as follows: Unavailable Revenues - In the governmental funds financial statements, deferred inflows of resources represent revenues which have been earned but have not met the recognition criteria based on the modified accrual basis of accounting. Gain/Loss on Refunding - In the government-wide, proprietary fund, and private-purpose trust fund financial statements, deferred outflows/inflows of resources represent the difference between the reacquisition price of refunded bonds and its net carrying amount, which is amortized and recognized as a component of interest expense over the remaining life of the old refunded bonds or the new refunding bonds, whichever is shorter. Pension Contributions - In the government-wide and proprietary fund financial statements, deferred outflows of resources for pension contributions represent the deferral of the City’s fiscal year 2017 contributions to the pension plan. Using the measurement date of June 30, 2016 per the actuarial report produced by SDCERS’ actuary, the fiscal year 2017 contributions were not factored into the calculation of the Net Pension Liability. Actuarial Gains/Losses - In the government-wide and proprietary fund financial statements, the deferred outflows/inflows of resources for unamortized actuarial gains/losses represent the impact of experience and, investment gains or losses as of the measurement date of June 30, 2016 per the actuarial report produced by SDCERS’ actuary. Actuarial investment gains and losses are amortized and recognized over a period of five years. Actuarial experience gains and losses are amortized and recognized over a period of three years. Additional gains and losses on investments and actuarial experience will also be deferred in future years and recognized over their respective amortization periods. See Note 12 for additional detail on actuarial gains/losses. Change in Actuarial Assumptions - In the government-wide and proprietary fund financial statements, deferred outflows of resources for assumption changes represent the impact of demographic adjustments as of the measurement date of June 30, 2016 per the actuarial report produced by SDCERS’ actuary. Changes in assumptions are amortized and recognized over the average expected remaining service life of all active and inactive members of the pension system. As of the measurement date, this recognition period was three years.
j. Capital Assets
Non-Depreciable Capital Assets, which include land, rights of way, easements, and construction in progress, are reported in the applicable Governmental or Business-Type Activities column in the government-wide financial statements, as well as in the proprietary funds and fiduciary funds financial statements. Depreciable Capital Assets, which include structures and improvements, equipment, intangible assets, distribution and collection systems, and infrastructure, are reported net of accumulated depreciation/amortization in the applicable Governmental or Business-Type Activities column in the government-wide financial statements, as well as in the proprietary funds and fiduciary funds financial statements. The City considers capital expenditures those that result in assets that are used in City operations and have a useful life in excess of one year. It is the City’s policy to capitalize structures and improvements, equipment outlay, distribution and collection systems and infrastructure that meet or exceed a capitalization threshold of $5 and to capitalize intangible assets that meet or exceed a capitalization threshold of $ 1 0 0 . Land is capitalized regardless of cost and subsequent
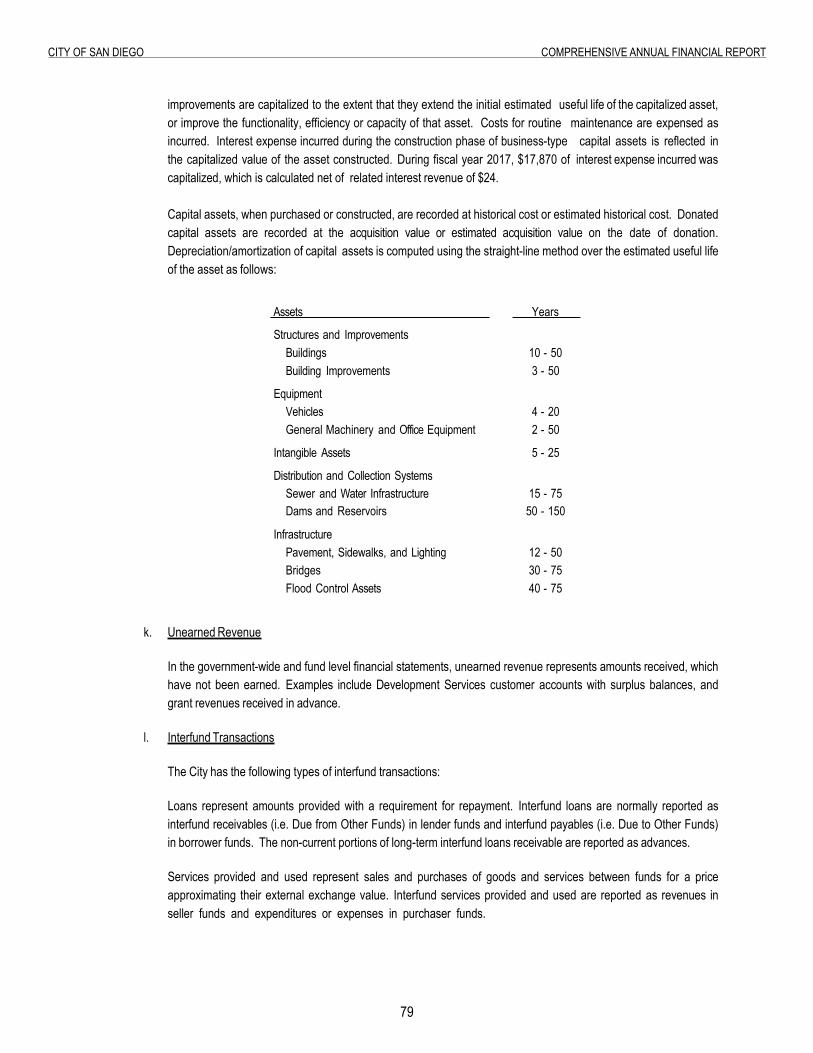
79
City of San Diego ComprehenSive annual finanCial report
improvements are capitalized to the extent that they extend the initial estimated useful life of the capitalized asset, or improve the functionality, efficiency or capacity of that asset. Costs for routine maintenance are expensed as incurred. Interest expense incurred during the construction phase of business-type capital assets is reflected in the capitalized value of the asset constructed. During fiscal year 2017, $17,870 of interest expense incurred was capitalized, which is calculated net of related interest revenue of $24. Capital assets, when purchased or constructed, are recorded at historical cost or estimated historical cost. Donated capital assets are recorded at the acquisition value or estimated acquisition value on the date of donation. Depreciation/amortization of capital assets is computed using the straight-line method over the estimated useful life of the asset as follows:
Assets
Structures and Improvements
Years
Buildings 10 - 50 Building Improvements 3 - 50
Equipment Vehicles 4 - 20 General Machinery and Office Equipment 2 - 50
Intangible Assets 5 - 25
Distribution and Collection Systems Sewer and Water Infrastructure
15 - 75 Dams and Reservoirs 50 - 150
Infrastructure
Pavement, Sidewalks, and Lighting 12 - 50 Bridges 30 - 75 Flood Control Assets 40 - 75
k. Unearned Revenue
In the government-wide and fund level financial statements, unearned revenue represents amounts received, which have not been earned. Examples include Development Services customer accounts with surplus balances, and grant revenues received in advance.
l. Interfund Transactions
The City has the following types of interfund transactions: Loans represent amounts provided with a requirement for repayment. Interfund loans are normally reported as interfund receivables (i.e. Due from Other Funds) in lender funds and interfund payables (i.e. Due to Other Funds) in borrower funds. The non-current portions of long-term interfund loans receivable are reported as advances. Services provided and used represent sales and purchases of goods and services between funds for a price approximating their external exchange value. Interfund services provided and used are reported as revenues in seller funds and expenditures or expenses in purchaser funds.
80
City of San Diego ComprehenSive annual finanCial report
Reimbursements represent repayments from the funds responsible for particular expenditures or expenses to the funds that initially paid for them. The reimbursement is reported as expenditures or expenses in the reimbursing fund and a reduction of expenditures or expenses in the fund that initially incurred the expense. Transfers represent flows of assets, such as cash or goods, without equivalent flows of assets in return, and without a requirement for repayment. In governmental funds, transfers are reported as other financing uses in the funds making transfers and as other financing sources in the funds receiving transfers. In proprietary funds, transfers are reported after nonoperating revenues and expenses.
m. Long-Term Liabilities
In the government-wide, proprietary, and fiduciary funds financial statements, long-term debt and other long-term obligations are reported as liabilities in the applicable Statements of Net Position. Capital appreciation bond accretion and bond premiums and discounts are amortized over the life of the bonds using a method which approximates the effective interest method. Net bonds payable reflects amortized bond accretion and unamortized bond discounts and premiums.
n. Compensated Absences
The City provides combined annual leave to cover both vacation and sick leave. It is the City’s policy to permit employees to accumulate between 8.75 weeks and 17.5 weeks of earned but unused annual leave, depending on hire date. Accumulation of these earnings will be paid to employees upon separation from service. The liability for compensated absences reported in the government-wide and proprietary funds financial statements consists of unpaid accumulated vacation balances. The liability has been calculated using the vesting method, in which leave amounts for both employees who currently are eligible to receive termination payments and other employees who are expected to become eligible in the future to receive such payments upon termination are included. The liability has been calculated based on the employees’ current salary level and includes salary related costs (e.g. Medicare Tax). The short-term portion is an estimate calculated based on leave taken in the prior year, as a percentage of total outstanding balances. A liability for these amounts is reported in governmental funds only if they have matured, for example, as a result of employee resignations and retirements.
o. Claims and Judgments
The costs of claims and judgments are accrued when incurred and measurable in the government-wide, proprietary and fiduciary funds financial statements. In governmental funds, the costs of claims and judgments are recorded as expenditures when payments are due and payable.
p. Non-Monetary Transactions The City, as part of approving new development in the community planning process, requires that certain public facilities be constructed per the provisions of community financing plans. These facilities are typically funded in whole or part with impact fees collected from new development. The City often enters into reimbursement agreements with developers to construct the facilities. These agreements provide developers with credits (also referred to as FBA/DIF/RTCIP credits) for future permit fees. These credits are earned by the developer upon successful completion of construction phases and when City engineers have accepted the work. The credits are recognized as permit revenue upon issuance and a corresponding capital asset is recorded in the government-wide financial statements. See Note 5 for additional detail on reimbursement agreements.
81
City of San Diego ComprehenSive annual finanCial report
q. Net Position In the government-wide and proprietary funds financial statements, Net Position is categorized as follows: Net Investment in Capital Assets consists of capital assets, net of accumulated depreciation, reduced by
outstanding debt and deferred outflows/inflows of resources attributed to the acquisition, construction or improvement of these assets.
Restricted Net Position consists of restricted assets reduced by liabilities related to those assets. It is the City’s policy to first apply restricted resources when an expense is incurred for purposes for which both restricted and unrestricted net position components are available. As of June 30, 2017, the amount of restricted net position due to enabling legislation was approximately $308,341.
Unrestricted Net Position consists of net position that does not meet the definition of Net Investment in Capital
Assets or Restricted Net Position.
r. Fund Balances In the fund financial statements, governmental funds report fund balances as nonspendable, restricted, committed, assigned or unassigned based on the extent to which the City is bound to observe constraints imposed on the use of resources.
Nonspendable fund balance - amounts that cannot be spent because they are either (a) not spendable in
form or (b) legally or contractually required to be maintained intact.
Restricted fund balance - amounts with constraints placed on their use that are either (a) externally imposed by creditors, grantors, contributors or laws or regulations of other governments, or (b) imposed by law through constitutional provisions or enabling legislation.
Committed fund balance - amounts that can only be used for specific purposes imposed by formal action of
the City Council. The City Council uses ordinances or resolutions to commit fund balances. Ordinances and resolutions both meet the criteria to establish a commitment since the limitations on the redeployment of those resources for other purposes is the same. Committed amounts cannot be used for other purposes unless City Council removes or changes the specified use by taking the same type of action it employed to previously commit those amounts.
Assigned fund balance - amounts that are constrained by the City’s intent to be used for specific
purposes, but do not meet the criteria to be classified as restricted or committed. City Council may assign fund balance through approval of budget appropriations. The Mayor and his/her designees are authorized by the City Charter to assign fund balance through the encumbrance process. Designees generally include the Chief Operating Officer, Assistant Chief Operating Officer, Deputy Chief Operating Officers and Department Directors.
Unassigned fund balance - the residual classification for the City’s General Fund that includes amounts not
included in other classifications. In funds other than the General Fund, the unassigned classification is used only if expenditures incurred for specific purposes exceed the amounts restricted, committed or assigned to those purposes.
When both restricted and unrestricted resources are available for use, it is the City’s policy to use restricted resources first, followed by committed, assigned and unassigned as they are needed.
82
City of San Diego ComprehenSive annual finanCial report
s. Reserves The City’s formal reserve policy, which was adopted in fiscal year 2008 via City Council ordinance, last amended in February 2017, was created in accordance with Charter Section 91 and defines the General Fund Reserve. The City’s General Fund Reserve is comprised of two separate components: (1) the Emergency Reserve and (2) the Stability Reserve. For the purpose of the policy, the General Fund is the operational fund as presented in the City’s annual budget document. Emergency Reserve - maintained for the purpose of sustaining General Fund operations in the case of a
public emergency such as a natural disaster or other unforeseen catastrophic event. This reserve may be expended when an event is determined to be a public emergency by a two-thirds vote of the City Council, when such expenditures are necessary to ensure the safety of the City’s residents and their property. This reserve is reported as restricted fund balance.
Stability Reserve - maintained to mitigate financial and service delivery risk due to unexpected revenue shortfalls or unanticipated critical expenditures. The purpose of this reserve is to provide budgetary stabilization and not serve as an alternative funding source for new programs. Recommendations to appropriate from the Stability Reserve are brought forward by the Mayor and require approval by a majority of the City Council. This reserve is a component of unassigned fund balance.
The policy level for total General Fund Reserves is 16.7% of the most recent three year average of annual audited General Fund operating revenues (budgetary basis). The Emergency Reserve is set at a policy level of 8%, and the Stability Reserve is set at a policy level of 8.7%. The City’s reserve policy established funding targets for each fiscal year ending 2016 to 2025 to reach policy levels. For fiscal year 2017, the Emergency Reserve funding target was 8%, and the Stability Reserve funding target was 6.75%. The balances of the Emergency Reserve and the Stability Reserve, as of June 30, 2017, were $94,300 and $79,532, respectively, meeting policy target levels. In the event either reserve component is reduced below the amount established by this policy, the Mayor will prepare a plan as promptly as conditions warrant to replenish the reserve to the policy level. Spendable and unassigned fund balance that is not part of General Fund Reserves is available for appropriation. The Pension Payment Stabilization Reserve was established to mitigate service delivery risk due to the unanticipated increases in the annual pension payment, the Actuarially Determined Contribution (ADC). The purpose of this reserve is to provide a source of funding for the ADC when these conditions occur and the ADC has increased year over year. The Pension Payment Stabilization Reserve is funded at a level equal to 8% of the average of the last three ADCs to the pension system. The balance of the Pension Stabilization Reserve, as of June 30, 2017 was $20,536, of which $16,000 is reported as unassigned fund balance in the General Fund. The balance of $4,536 was funded by the Sewer Utility, Water Utility, and Other Enterprise funds. In the event this reserve is reduced below the amount established by this policy, the Mayor shall prepare a plan no later than one year from the reserve action to replenish the reserve to the policy level. The fiscal year 2018 adopted budget includes full utilization of the reserve in order to minimize the impact of the significant increase in the July 1, 2017 ADC payment of $324,500. The City also maintains reserves to manage risk including public liability reserves for the payment of claims and judgments, a reserve for obligations related to workers’ compensation claims, and a reserve for long-term disability payments for City employees. In addition, the City maintains reserves for the following enterprise funds: the Water and Sewer Utility Funds, Development Services Fund, Environmental Services Fund, and the Golf Course Fund. Information regarding reserves maintained by the City is contained in Council Policy No. 100-20.
83
City of San Diego ComprehenSive annual finanCial report
t. Participating Agencies Revenue Recognition The Regional Wastewater Disposal Agreement between the City and the Participating Agencies (PA) in the Metropolitan Sewerage System allows for quarterly invoicing of local area member municipalities and utility districts to collect and process sewage waste using the City’s facilities. The invoicing is based on an estimated allocation of costs associated with each PA and may not represent each PA’s proportionate allocation of actual maintenance and operating costs of the sewage system, resulting in an overstatement or understatement of revenue reported in the Sewer Utility Statement of Revenues, Expenses and Changes in Fund Net Position.
u. Estimates The preparation of financial statements in conformity with GAAP requires management to make estimates and assumptions that affect certain reported amounts and disclosures. Actual results could differ from those estimates. Management believes that the estimates are reasonable.
v. New Governmental Accounting Standards Implemented During Year Ended June 30, 2017
The requirements of the following accounting standards are effective for the purpose of implementation, if applicable to the City, for the year ended June 30, 2017. In February 2015, GASB issued Statement No. 73, Accounting and Financial Reporting for Pensions and Related Assets That Are Not Within the Scope of GASB Statement 68, and Amendments to Certain Provisions of GASB Statements 67 and 68. The requirements of this statement extend the approach to accounting and financial reporting established in GASB 68 to all pensions, with modifications as necessary to reflect that for accounting and financial reporting purposes, any assets accumulated for pensions that are provided through pension plans that are not administered through trusts that meet the criteria specified in GASB 68 should not be considered pension plan assets. It also requires that information similar to that required by GASB 68 be included in notes to financial statements and required supplementary information by all similarly situated employers and non-employer contributing entities. This statement also clarifies the application of certain provisions of GASB 67 and 68. See Notes 12 and 23 for more information regarding the City’s Preservation of Benefits Plan and required reporting under this Statement. In June 2015, GASB issued Statement No. 74, Financial Reporting for Postemployment Benefit Plans Other Than Pension Plans (GASB 74), which establishes financial reporting standards for state and local governmental OPEB plans—defined benefit OPEB plans and defined contribution OPEB plans—that are administered through trusts or equivalent arrangements. It applies to entities that have all of the characteristics of an OPEB plan, as defined by GASB 74. GASB 74 replaces previously issued statements related to accounting and financial reporting for OPEB. See Note 13 for reference to the Statement regarding the City’s postemployment trust. In August 2015, GASB issued Statement No. 77, Tax Abatement Disclosures. For financial reporting purposes, this statement requires certain disclosures when a government enters into tax abatement agreements with a third party. This statement defines tax abatement as resulting from an agreement between a government and an individual or entity in which the government promises to forgo tax revenues and the individual or entity promises to subsequently take a specific action that contributes to economic development or otherwise benefits the government or its citizens. The City had no reportable impacts during fiscal year 2017.
8�
City of San Diego ComprehenSive annual finanCial report
In January 2016, GASB issued Statement No. 80, Blending Requirements for Certain Component Units - An Amendment of GASB Statement No. 14. For financial reporting purposes, this statement amends the blending requirements for the presentation of component units of all state and local governments. The additional criterion requires blending of a component unit incorporated as a not-for-profit corporation in which the primary government is the sole corporate member. See Note 23 for more information regarding the financial restatements as result of implementation. In March 2016, GASB issued Statement No. 81, Irrevocable Split-Interest Agreements. Split-interest agreements are a type of giving agreement used by donors to provide resources to two or more beneficiaries, including governments. Examples include charitable lead trusts, charitable remainder trusts, and life-interests in real estate. This statement requires that a government that receives resources pursuant to an irrevocable split-interest agreement recognize assets, liabilities, and deferred inflows at the inception of the agreement. It further requires that a government recognize revenue when the resources become applicable to the reporting period. This statement does not impact the City’s financial statements. In March 2016, GASB issued Statement No. 82, Pension Issues-An Amendment of GASB Statements No. 67, No. 68, and No. 73. This statement addresses the specific issues regarding (1) the presentation of payroll-related measures in required supplementary information, (2) the select assumptions and the treatment of deviations from the guidance in an Actuarial Standard of Practice for financial reporting purposes, and (3) the classification of payments made by employers to satisfy employee (plan member) contribution requirements. The financial statements reflect implementation of applicable issues.
w. Upcoming Governmental Accounting Standards Implementation The requirements of the following accounting standards become effective in future periods, if applicable to the City. Management is currently in the process of evaluating the potential impacts to the City’s basic financial statements. In June 2015, GASB issued Statement No. 75, Accounting and Financial Reporting for Postemployment Benefits Other Than Pensions (GASB 75), which applies to state and local government employers who provide OPEB to employees, such as the City. GASB 75 replaces previously issued statements related to accounting and financial reporting for OPEB and establishes new accounting and financial reporting requirements for OPEB plans. GASB 75 details the recognition and disclosure requirements for employers with payables to defined benefit OPEB plans that are administered through trusts that meet specific criteria, and for employers whose employees are provided with defined contribution OPEB. For OPEB that is administered through trusts, GASB 75 requires the liability of employers to be measured as the portion of the present value of projected benefit payments to be provided to current active and inactive employees that is attributed to those employees’ past periods of service (total OPEB liability), less the amount of the OPEB plan’s fiduciary net position. This statement will become effective in fiscal year 2018. In November 2016, GASB issued Statement No. 83, Certain Asset Retirement Obligations. This statement addresses accounting and financial reporting for certain asset retirement obligations (AROs). An ARO is a legally enforceable liability associated with the retirement of a tangible capital asset. A government that has legal obligations to perform future asset retirement activities related to its tangible capital assets should recognize a liability based on the guidance in this statement. It also establishes criteria for determining the timing and pattern of recognition of a liability and a corresponding deferred outflow of resources for AROs. This statement will become effective in fiscal year 2019.
85
City of San Diego ComprehenSive annual finanCial report
In January 2017, GASB issued Statement No. 84, Fiduciary Activities. This statement establishes criteria for identifying fiduciary activities of all state and local governments. The focus of the criteria generally is on (1) whether a government is controlling the assets of the fiduciary activity and (2) the beneficiaries with whom a fiduciary relationship exists. Separate criteria are included to identify fiduciary component units and postemployment benefit arrangements that are fiduciary activities. This statement will become effective in fiscal year 2020. In March 2017, GASB issued Statement No. 85, Omnibus 2017. This statement is to address practice issues that have been identified during implementation and application of certain GASB statements. This statement addresses a variety of topics including issues related to blending component units, goodwill, fair value measurement and application, and postemployment benefits (pensions and other postemployment benefits [OPEB]). This statement will become effective in fiscal year 2018. In May 2017, GASB issued Statement No. 86, Certain Debt Extinguishment Issues. The primary objective of this statement is to improve consistency in accounting and financial reporting for in-substance defeasance of debt by providing guidance for transactions in which cash and other monetary assets acquired with only existing resources—resources other than the proceeds of refunding debt—are placed in an irrevocable trust for the sole purpose of extinguishing debt. This statement also improves accounting and financial reporting for prepaid insurance on debt that is extinguished and notes to financial statements for debt that is defeased in substance. This statement will become effective in fiscal year 2018. In June 2017, GASB issued Statement No. 87, Leases. This statement increases the usefulness of governments’ financial statements by requiring recognition of certain lease assets and liabilities for leases that previously were classified as operating leases and recognized as inflows of resources or outflows of resources based on the payment provisions of the contract. It establishes a single model for lease accounting based on the foundational principle that leases are financings of the right to use an underlying asset. Under this statement, a lessee is required to recognize a lease liability and an intangible right-to-use lease asset, and a lessor is required to recognize a lease receivable and a deferred inflow of resources, thereby enhancing the relevance and consistency of information about governments’ leasing activities. This statement will become effective in fiscal year 2021.
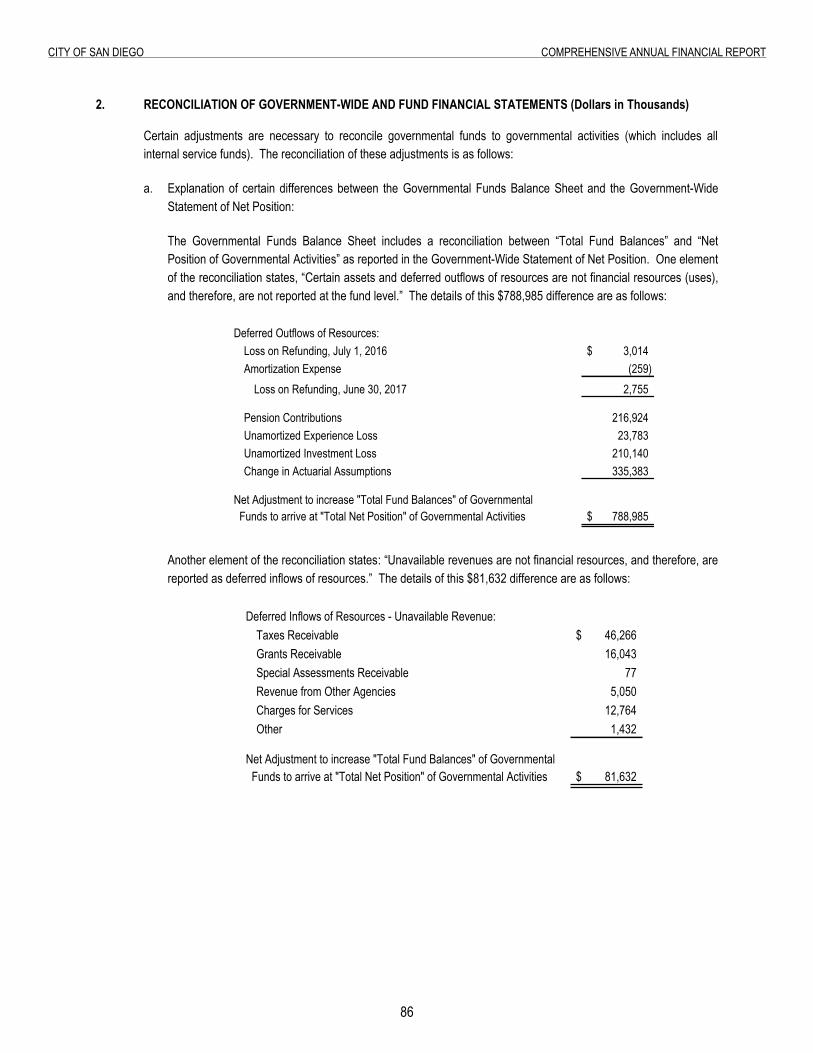
86
City of San Diego ComprehenSive annual finanCial report
2. Reconciliation of Government-Wide and Fund Financial Statements
2. RECONCILIATION OF GOVERNMENT-WIDE AND FUND FINANCIAL STATEMENTS (Dollars in Thousands)
Certain adjustments are necessary to reconcile governmental funds to governmental activities (which includes all internal service funds). The reconciliation of these adjustments is as follows:
a. Explanation of certain differences between the Governmental Funds Balance Sheet and the Government-Wide Statement of Net Position:
The Governmental Funds Balance Sheet includes a reconciliation between “Total Fund Balances” and “Net Position of Governmental Activities” as reported in the Government-Wide Statement of Net Position. One element of the reconciliation states, “Certain assets and deferred outflows of resources are not financial resources (uses), and therefore, are not reported at the fund level.” The details of this $788,985 difference are as follows:
Deferred Outflows of Resources:Loss on Refunding, July 1, 2016 3,014$ Amortization Expense (259)
Loss on Refunding, June 30, 2017 2,755
Pension Contributions 216,924 Unamortized Experience Loss 23,783 Unamortized Investment Loss 210,140 Change in Actuarial Assumptions 335,383
Net Adjustment to increase "Total Fund Balances" of Governmental Funds to arrive at "Total Net Position" of Governmental Activities 788,985$
Another element of the reconciliation states: “Unavailable revenues are not financial resources, and therefore, are reported as deferred inflows of resources.” The details of this $81,632 difference are as follows:
Deferred Inflows of Resources - Unavailable Revenue:Taxes Receivable 46,266$ Grants Receivable 16,043 Special Assessments Receivable 77 Revenue from Other Agencies 5,050 Charges for Services 12,764 Other 1,432
Net Adjustment to increase "Total Fund Balances" of Governmental Funds to arrive at "Total Net Position" of Governmental Activities 81,632$
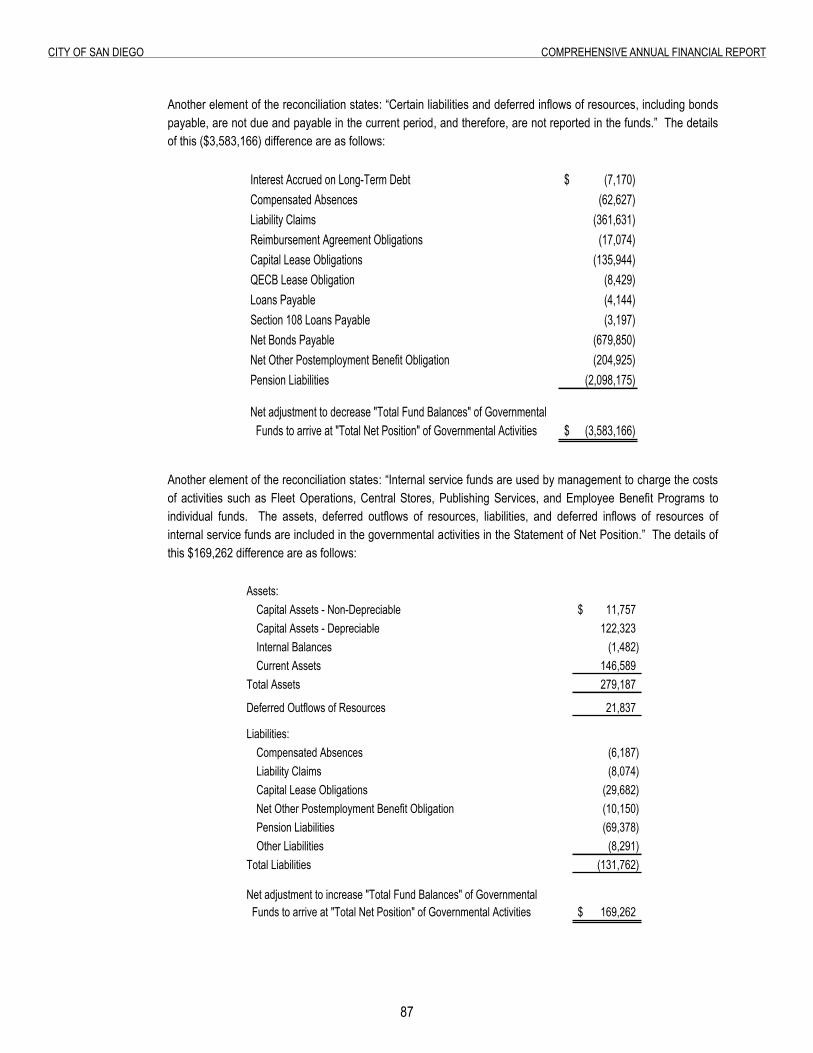
87
City of San Diego ComprehenSive annual finanCial report
Another element of the reconciliation states: “Certain liabilities and deferred inflows of resources, including bonds payable, are not due and payable in the current period, and therefore, are not reported in the funds.” The details of this ($3,583,166) difference are as follows:
Interest Accrued on Long-Term Debt (7,170)$ Compensated Absences (62,627) Liability Claims (361,631) Reimbursement Agreement Obligations (17,074) Capital Lease Obligations (135,944) QECB Lease Obligation (8,429) Loans Payable (4,144) Section 108 Loans Payable (3,197) Net Bonds Payable (679,850) Net Other Postemployment Benefit Obligation (204,925) Pension Liabilities (2,098,175)
Net adjustment to decrease "Total Fund Balances" of Governmental Funds to arrive at "Total Net Position" of Governmental Activities (3,583,166)$
Another element of the reconciliation states: “Internal service funds are used by management to charge the costs of activities such as Fleet Operations, Central Stores, Publishing Services, and Employee Benefit Programs to individual funds. The assets, deferred outflows of resources, liabilities, and deferred inflows of resources of internal service funds are included in the governmental activities in the Statement of Net Position.” The details of this $169,262 difference are as follows:
Assets:Capital Assets - Non-Depreciable 11,757$ Capital Assets - Depreciable 122,323 Internal Balances (1,482) Current Assets 146,589
Total Assets 279,187
Deferred Outflows of Resources 21,837
Liabilities:Compensated Absences (6,187) Liability Claims (8,074) Capital Lease Obligations (29,682) Net Other Postemployment Benefit Obligation (10,150) Pension Liabilities (69,378) Other Liabilities (8,291)
Total Liabilities (131,762)
Net adjustment to increase "Total Fund Balances" of Governmental Funds to arrive at "Total Net Position" of Governmental Activities 169,262$
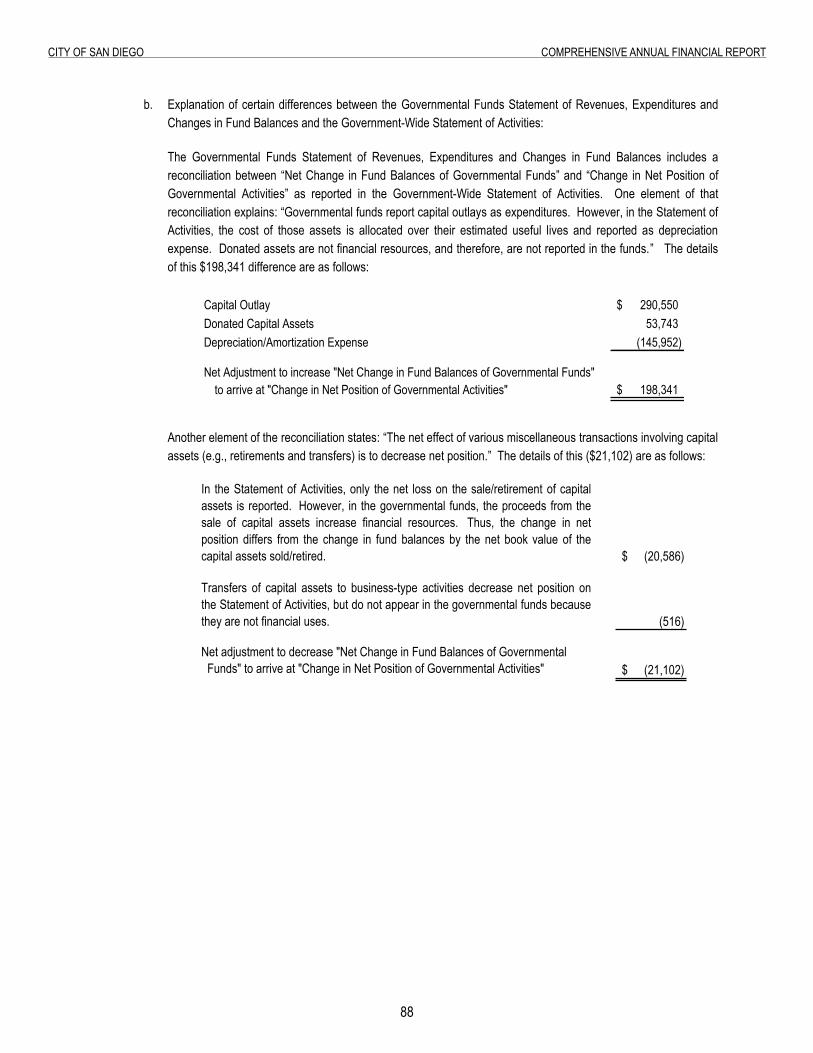
88
City of San Diego ComprehenSive annual finanCial report
b. Explanation of certain differences between the Governmental Funds Statement of Revenues, Expenditures and Changes in Fund Balances and the Government-Wide Statement of Activities:
The Governmental Funds Statement of Revenues, Expenditures and Changes in Fund Balances includes a reconciliation between “Net Change in Fund Balances of Governmental Funds” and “Change in Net Position of Governmental Activities” as reported in the Government-Wide Statement of Activities. One element of that reconciliation explains: “Governmental funds report capital outlays as expenditures. However, in the Statement of Activities, the cost of those assets is allocated over their estimated useful lives and reported as depreciation expense. Donated assets are not financial resources, and therefore, are not reported in the funds.” The details of this $198,341 difference are as follows:
Capital Outlay 290,550$ Donated Capital Assets 53,743 Depreciation/Amortization Expense (145,952)
Net Adjustment to increase "Net Change in Fund Balances of Governmental Funds"to arrive at "Change in Net Position of Governmental Activities" 198,341$
Another element of the reconciliation states: “The net effect of various miscellaneous transactions involving capital assets (e.g., retirements and transfers) is to decrease net position.” The details of this ($21,102) are as follows:
In the Statement of Activities, only the net loss on the sale/retirement of capitalassets is reported. However, in the governmental funds, the proceeds from thesale of capital assets increase financial resources. Thus, the change in netposition differs from the change in fund balances by the net book value of thecapital assets sold/retired. (20,586)$
Transfers of capital assets to business-type activities decrease net position onthe Statement of Activities, but do not appear in the governmental funds becausethey are not financial uses. (516)
Net adjustment to decrease "Net Change in Fund Balances of Governmental Funds" to arrive at "Change in Net Position of Governmental Activities" (21,102)$
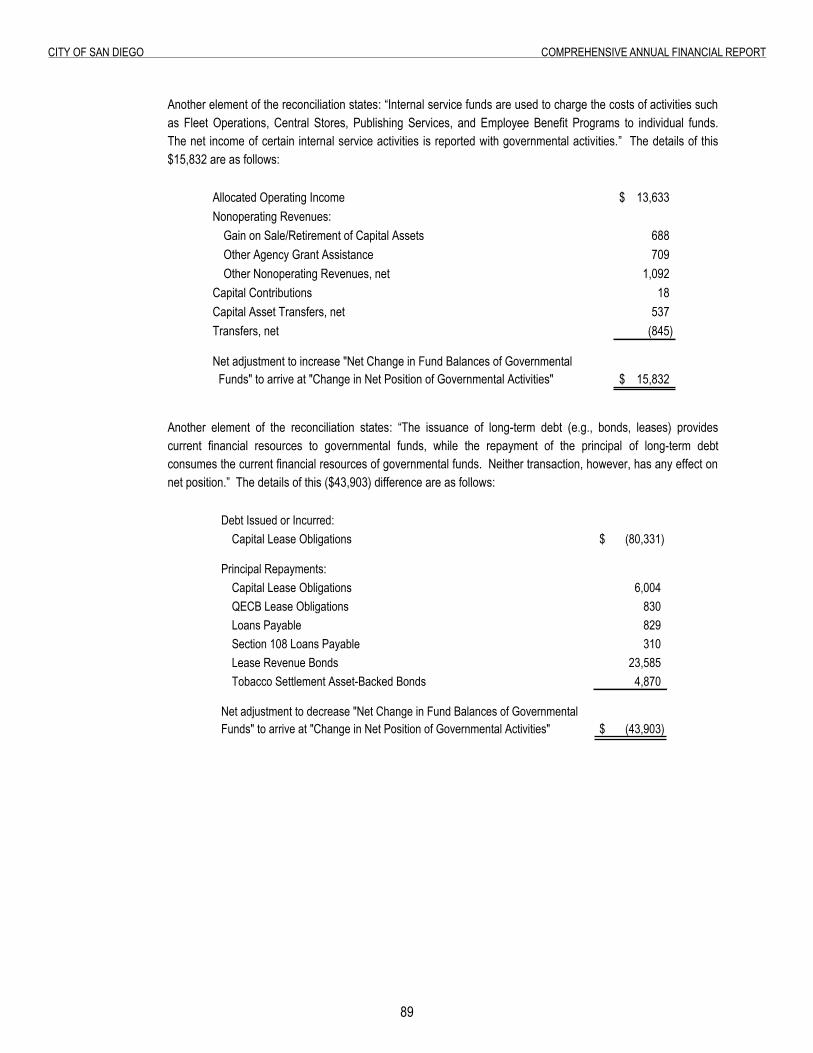
89
City of San Diego ComprehenSive annual finanCial report
Another element of the reconciliation states: “Internal service funds are used to charge the costs of activities such as Fleet Operations, Central Stores, Publishing Services, and Employee Benefit Programs to individual funds. The net income of certain internal service activities is reported with governmental activities.” The details of this $15,832 are as follows:
Allocated Operating Income 13,633$ Nonoperating Revenues:
Gain on Sale/Retirement of Capital Assets 688 Other Agency Grant Assistance 709 Other Nonoperating Revenues, net 1,092
Capital Contributions 18 Capital Asset Transfers, net 537 Transfers, net (845)
Net adjustment to increase "Net Change in Fund Balances of Governmental Funds" to arrive at "Change in Net Position of Governmental Activities" 15,832$
Another element of the reconciliation states: “The issuance of long-term debt (e.g., bonds, leases) provides current financial resources to governmental funds, while the repayment of the principal of long-term debt consumes the current financial resources of governmental funds. Neither transaction, however, has any effect on net position.” The details of this ($43,903) difference are as follows:
Debt Issued or Incurred:Capital Lease Obligations (80,331)$
Principal Repayments:Capital Lease Obligations 6,004 QECB Lease Obligations 830 Loans Payable 829 Section 108 Loans Payable 310 Lease Revenue Bonds 23,585 Tobacco Settlement Asset-Backed Bonds 4,870
Net adjustment to decrease "Net Change in Fund Balances of GovernmentalFunds" to arrive at "Change in Net Position of Governmental Activities" (43,903)$
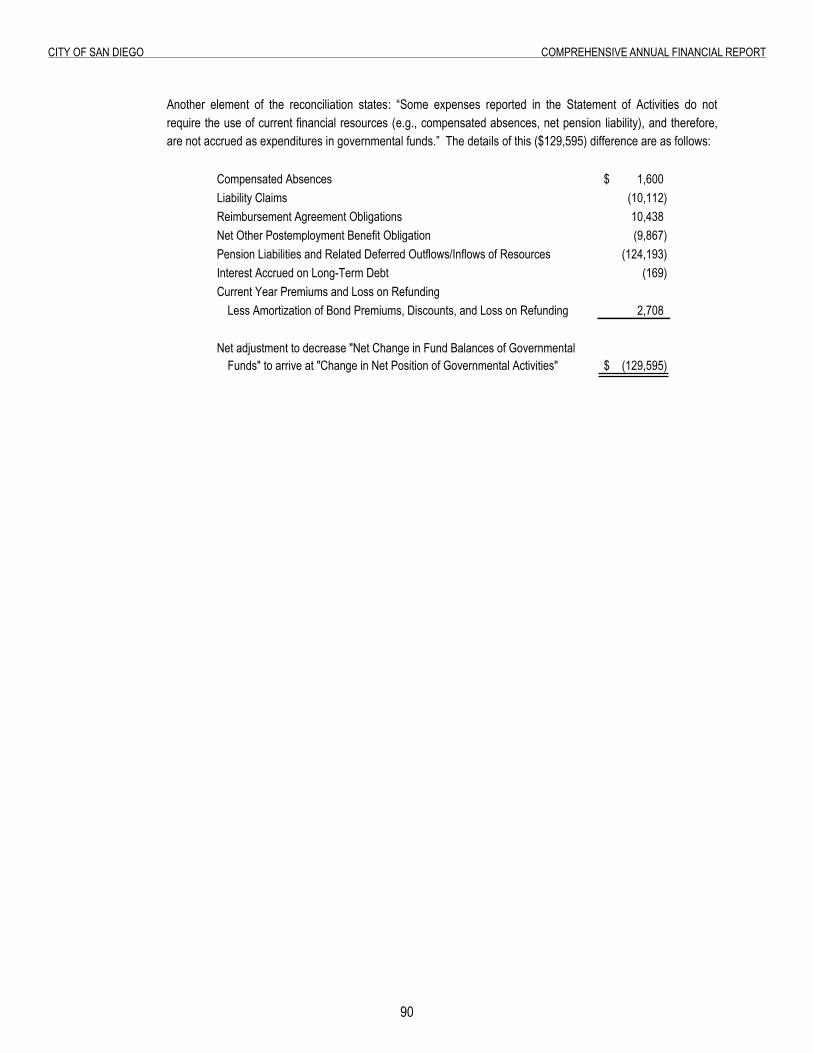
90
City of San Diego ComprehenSive annual finanCial report
Another element of the reconciliation states: “Some expenses reported in the Statement of Activities do not require the use of current financial resources (e.g., compensated absences, net pension liability), and therefore, are not accrued as expenditures in governmental funds.” The details of this ($129,595) difference are as follows:
Compensated Absences 1,600$ Liability Claims (10,112) Reimbursement Agreement Obligations 10,438 Net Other Postemployment Benefit Obligation (9,867) Pension Liabilities and Related Deferred Outflows/Inflows of Resources (124,193) Interest Accrued on Long-Term Debt (169) Current Year Premiums and Loss on Refunding
Less Amortization of Bond Premiums, Discounts, and Loss on Refunding 2,708
Net adjustment to decrease "Net Change in Fund Balances of GovernmentalFunds" to arrive at "Change in Net Position of Governmental Activities" (129,595)$
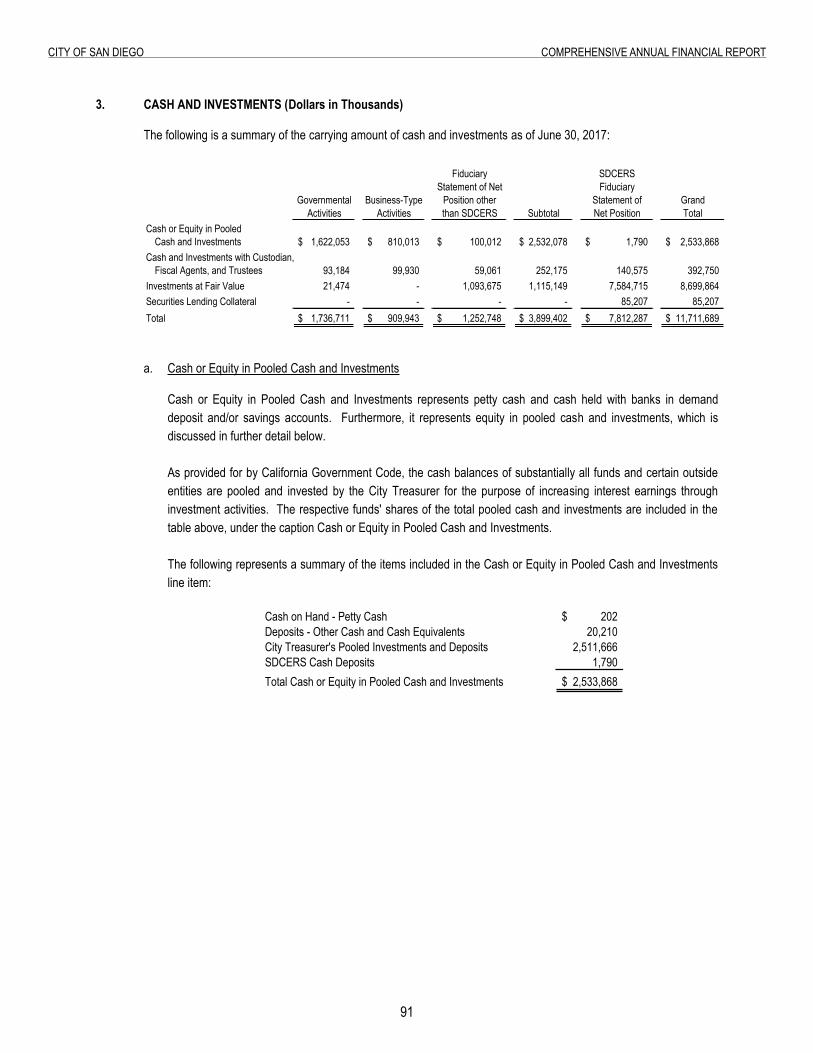
91
City of San Diego ComprehenSive annual finanCial report
3. Cash and Investments
3. CASH AND INVESTMENTS (Dollars in Thousands)
The following is a summary of the carrying amount of cash and investments as of June 30, 2017:
Fiduciary SDCERSStatement of Net Fiduciary
Governmental Business-Type Position other Statement of GrandActivities Activities than SDCERS Subtotal Net Position Total
Cash or Equity in Pooled Cash and Investments 1,622,053$ 810,013$ 100,012$ 2,532,078$ 1,790$ 2,533,868$
Cash and Investments with Custodian,Fiscal Agents, and Trustees 93,184 99,930 59,061 252,175 140,575 392,750
Investments at Fair Value 21,474 - 1,093,675 1,115,149 7,584,715 8,699,864 Securities Lending Collateral - - - - 85,207 85,207 Total 1,736,711$ 909,943$ 1,252,748$ 3,899,402$ 7,812,287$ 11,711,689$
a. Cash or Equity in Pooled Cash and Investments
Cash or Equity in Pooled Cash and Investments represents petty cash and cash held with banks in demand deposit and/or savings accounts. Furthermore, it represents equity in pooled cash and investments, which is discussed in further detail below.
As provided for by California Government Code, the cash balances of substantially all funds and certain outside entities are pooled and invested by the City Treasurer for the purpose of increasing interest earnings through investment activities. The respective funds' shares of the total pooled cash and investments are included in the table above, under the caption Cash or Equity in Pooled Cash and Investments.
The following represents a summary of the items included in the Cash or Equity in Pooled Cash and Investments line item:
Cash on Hand - Petty Cash 202$ Deposits - Other Cash and Cash Equivalents 20,210 City Treasurer's Pooled Investments and Deposits 2,511,666 SDCERS Cash Deposits 1,790 Total Cash or Equity in Pooled Cash and Investments 2,533,868$
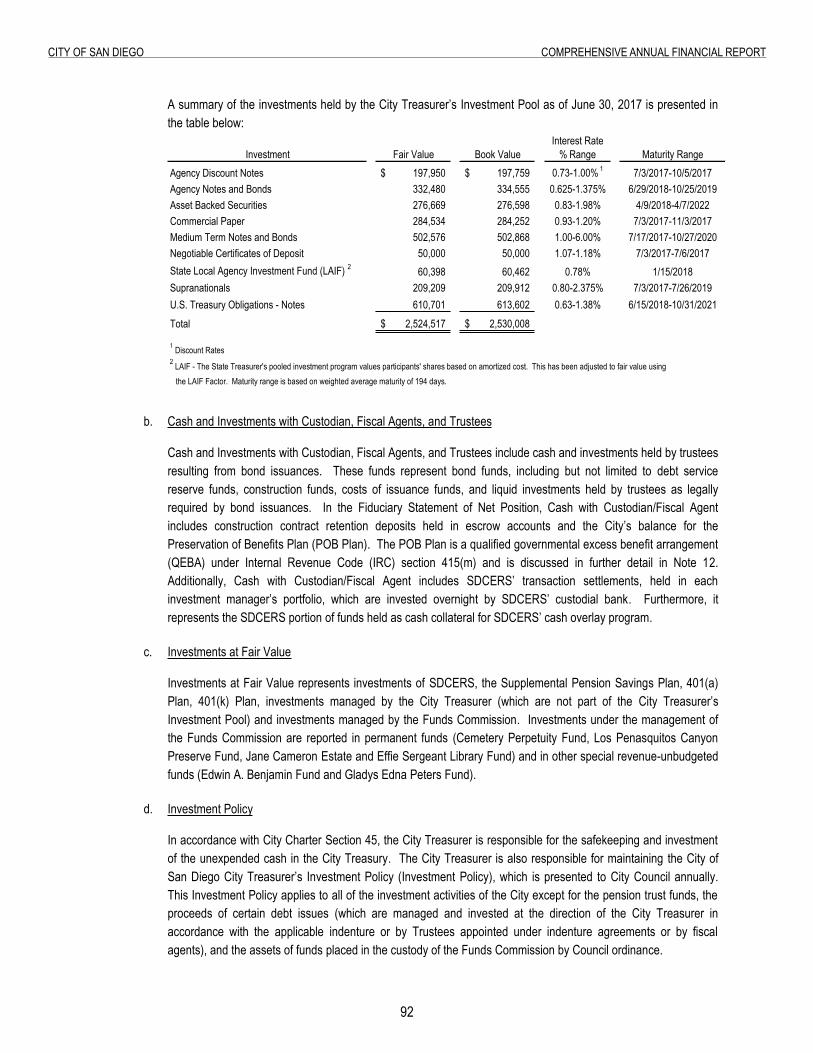
92
City of San Diego ComprehenSive annual finanCial report
A summary of the investments held by the City Treasurer’s Investment Pool as of June 30, 2017 is presented in the table below:
Interest RateInvestment Fair Value Book Value % Range Maturity Range
Agency Discount Notes 197,950$ 197,759$ 0.73-1.00% 1 7/3/2017-10/5/2017Agency Notes and Bonds 332,480 334,555 0.625-1.375% 6/29/2018-10/25/2019Asset Backed Securities 276,669 276,598 0.83-1.98% 4/9/2018-4/7/2022Commercial Paper 284,534 284,252 0.93-1.20% 7/3/2017-11/3/2017Medium Term Notes and Bonds 502,576 502,868 1.00-6.00% 7/17/2017-10/27/2020Negotiable Certificates of Deposit 50,000 50,000 1.07-1.18% 7/3/2017-7/6/2017State Local Agency Investment Fund (LAIF) 2 60,398 60,462 0.78% 1/15/2018Supranationals 209,209 209,912 0.80-2.375% 7/3/2017-7/26/2019U.S. Treasury Obligations - Notes 610,701 613,602 0.63-1.38% 6/15/2018-10/31/2021Total 2,524,517$ 2,530,008$
1 Discount Rates2 LAIF - The State Treasurer's pooled investment program values participants' shares based on amortized cost. This has been adjusted to fair value using the LAIF Factor. Maturity range is based on weighted average maturity of 194 days.
b. Cash and Investments with Custodian, Fiscal Agents, and Trustees
Cash and Investments with Custodian, Fiscal Agents, and Trustees include cash and investments held by trustees resulting from bond issuances. These funds represent bond funds, including but not limited to debt service reserve funds, construction funds, costs of issuance funds, and liquid investments held by trustees as legally required by bond issuances. In the Fiduciary Statement of Net Position, Cash with Custodian/Fiscal Agent includes construction contract retention deposits held in escrow accounts and the City’s balance for the Preservation of Benefits Plan (POB Plan). The POB Plan is a qualified governmental excess benefit arrangement (QEBA) under Internal Revenue Code (IRC) section 415(m) and is discussed in further detail in Note 12. Additionally, Cash with Custodian/Fiscal Agent includes SDCERS’ transaction settlements, held in each investment manager’s portfolio, which are invested overnight by SDCERS’ custodial bank. Furthermore, it represents the SDCERS portion of funds held as cash collateral for SDCERS’ cash overlay program.
c. Investments at Fair Value
Investments at Fair Value represents investments of SDCERS, the Supplemental Pension Savings Plan, 401(a) Plan, 401(k) Plan, investments managed by the City Treasurer (which are not part of the City Treasurer’s Investment Pool) and investments managed by the Funds Commission. Investments under the management of the Funds Commission are reported in permanent funds (Cemetery Perpetuity Fund, Los Penasquitos Canyon Preserve Fund, Jane Cameron Estate and Effie Sergeant Library Fund) and in other special revenue-unbudgeted funds (Edwin A. Benjamin Fund and Gladys Edna Peters Fund).
d. Investment Policy
In accordance with City Charter Section 45, the City Treasurer is responsible for the safekeeping and investment of the unexpended cash in the City Treasury. The City Treasurer is also responsible for maintaining the City of San Diego City Treasurer’s Investment Policy (Investment Policy), which is presented to City Council annually. This Investment Policy applies to all of the investment activities of the City except for the pension trust funds, the proceeds of certain debt issues (which are managed and invested at the direction of the City Treasurer in accordance with the applicable indenture or by Trustees appointed under indenture agreements or by fiscal agents), and the assets of funds placed in the custody of the Funds Commission by Council ordinance.
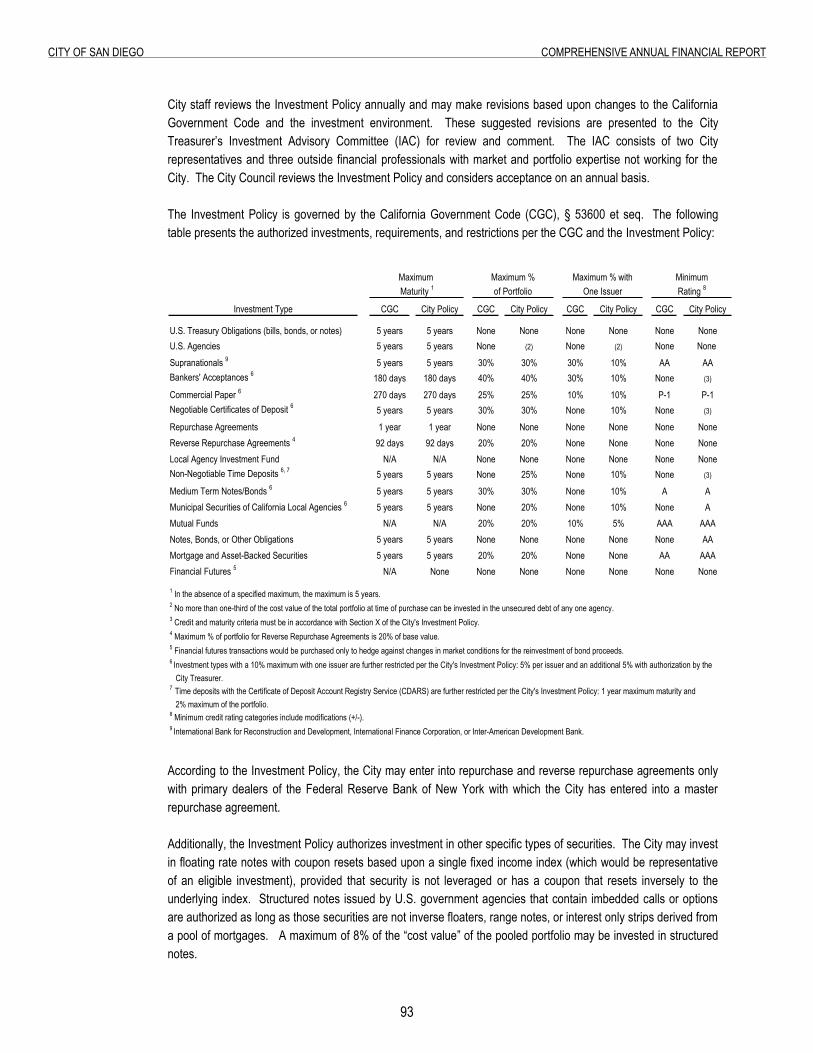
93
City of San Diego ComprehenSive annual finanCial report
City staff reviews the Investment Policy annually and may make revisions based upon changes to the California Government Code and the investment environment. These suggested revisions are presented to the City Treasurer’s Investment Advisory Committee (IAC) for review and comment. The IAC consists of two City representatives and three outside financial professionals with market and portfolio expertise not working for the City. The City Council reviews the Investment Policy and considers acceptance on an annual basis.
The Investment Policy is governed by the California Government Code (CGC), § 53600 et seq. The following table presents the authorized investments, requirements, and restrictions per the CGC and the Investment Policy:
Investment Type CGC City Policy CGC City Policy CGC City Policy CGC City Policy
U.S. Treasury Obligations (bills, bonds, or notes) 5 years 5 years None None None None None NoneU.S. Agencies 5 years 5 years None (2) None (2) None None Supranationals 9 5 years 5 years 30% 30% 30% 10% AA AABankers' Acceptances 6 180 days 180 days 40% 40% 30% 10% None (3)
Commercial Paper 6 270 days 270 days 25% 25% 10% 10% P-1 P-1Negotiable Certificates of Deposit 6 5 years 5 years 30% 30% None 10% None (3)
Repurchase Agreements 1 year 1 year None None None None None NoneReverse Repurchase Agreements 4 92 days 92 days 20% 20% None None None NoneLocal Agency Investment Fund N/A N/A None None None None None NoneNon-Negotiable Time Deposits 6, 7 5 years 5 years None 25% None 10% None (3)
Medium Term Notes/Bonds 6 5 years 5 years 30% 30% None 10% A AMunicipal Securities of California Local Agencies 6 5 years 5 years None 20% None 10% None AMutual Funds N/A N/A 20% 20% 10% 5% AAA AAANotes, Bonds, or Other Obligations 5 years 5 years None None None None None AAMortgage and Asset-Backed Securities 5 years 5 years 20% 20% None None AA AAAFinancial Futures 5 N/A None None None None None None None
1 In the absence of a specified maximum, the maximum is 5 years. 2 No more than one-third of the cost value of the total portfolio at time of purchase can be invested in the unsecured debt of any one agency.3 Credit and maturity criteria must be in accordance with Section X of the City's Investment Policy.4 Maximum % of portfolio for Reverse Repurchase Agreements is 20% of base value.5 Financial futures transactions would be purchased only to hedge against changes in market conditions for the reinvestment of bond proceeds.6 Investment types with a 10% maximum with one issuer are further restricted per the City's Investment Policy: 5% per issuer and an additional 5% with authorization by the City Treasurer.7 Time deposits with the Certificate of Deposit Account Registry Service (CDARS) are further restricted per the City's Investment Policy: 1 year maximum maturity and 2% maximum of the portfolio.8 Minimum credit rating categories include modifications (+/-).9 International Bank for Reconstruction and Development, International Finance Corporation, or Inter-American Development Bank.
Minimumof Portfolio One Issuer Rating 8
Maximum Maximum % Maturity 1
Maximum % with
According to the Investment Policy, the City may enter into repurchase and reverse repurchase agreements only with primary dealers of the Federal Reserve Bank of New York with which the City has entered into a master repurchase agreement.
Additionally, the Investment Policy authorizes investment in other specific types of securities. The City may invest
in floating rate notes with coupon resets based upon a single fixed income index (which would be representative of an eligible investment), provided that security is not leveraged or has a coupon that resets inversely to the underlying index. Structured notes issued by U.S. government agencies that contain imbedded calls or options are authorized as long as those securities are not inverse floaters, range notes, or interest only strips derived from a pool of mortgages. A maximum of 8% of the “cost value” of the pooled portfolio may be invested in structured notes.
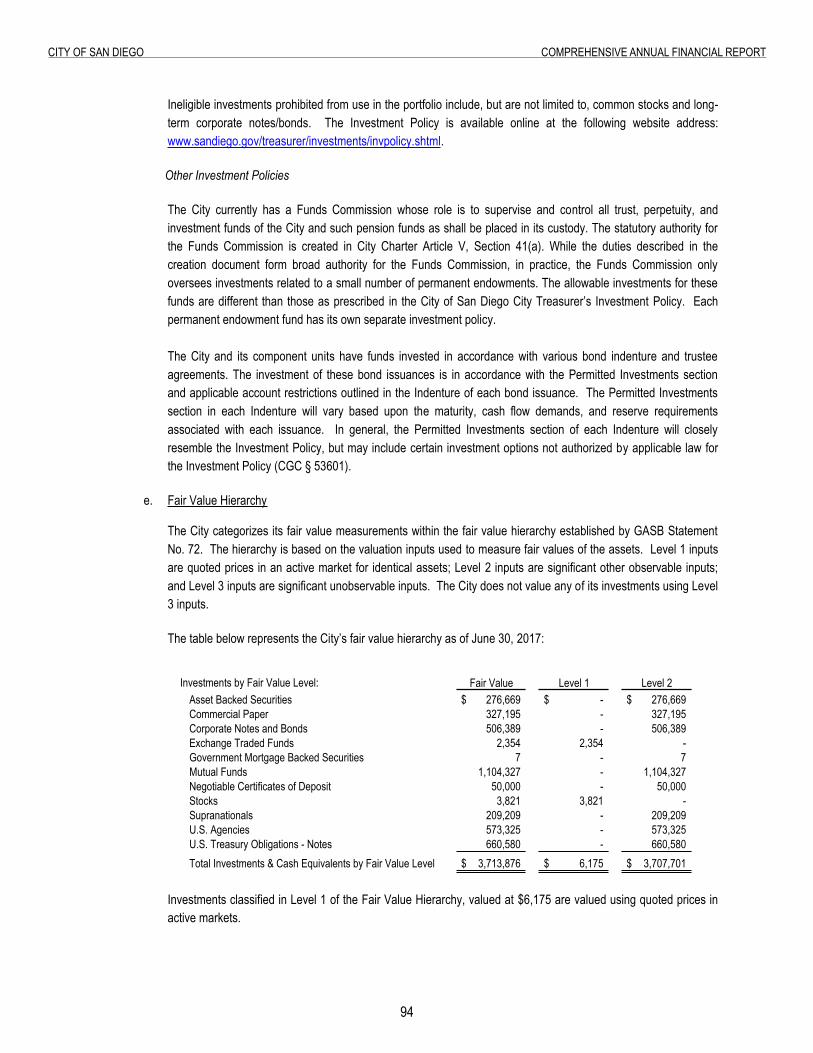
9�
City of San Diego ComprehenSive annual finanCial report
Ineligible investments prohibited from use in the portfolio include, but are not limited to, common stocks and long-term corporate notes/bonds. The Investment Policy is available online at the following website address: www.sandiego.gov/treasurer/investments/invpolicy.shtml.
Other Investment Policies
The City currently has a Funds Commission whose role is to supervise and control all trust, perpetuity, and investment funds of the City and such pension funds as shall be placed in its custody. The statutory authority for the Funds Commission is created in City Charter Article V, Section 41(a). While the duties described in the creation document form broad authority for the Funds Commission, in practice, the Funds Commission only oversees investments related to a small number of permanent endowments. The allowable investments for these funds are different than those as prescribed in the City of San Diego City Treasurer’s Investment Policy. Each permanent endowment fund has its own separate investment policy.
The City and its component units have funds invested in accordance with various bond indenture and trustee
agreements. The investment of these bond issuances is in accordance with the Permitted Investments section and applicable account restrictions outlined in the Indenture of each bond issuance. The Permitted Investments section in each Indenture will vary based upon the maturity, cash flow demands, and reserve requirements associated with each issuance. In general, the Permitted Investments section of each Indenture will closely resemble the Investment Policy, but may include certain investment options not authorized by applicable law for the Investment Policy (CGC § 53601).
e. Fair Value Hierarchy
The City categorizes its fair value measurements within the fair value hierarchy established by GASB Statement No. 72. The hierarchy is based on the valuation inputs used to measure fair values of the assets. Level 1 inputs are quoted prices in an active market for identical assets; Level 2 inputs are significant other observable inputs; and Level 3 inputs are significant unobservable inputs. The City does not value any of its investments using Level 3 inputs.
The table below represents the City’s fair value hierarchy as of June 30, 2017:
Investments by Fair Value Level: Fair Value Level 1 Level 2Asset Backed Securities 276,669$ -$ 276,669$ Commercial Paper 327,195 - 327,195 Corporate Notes and Bonds 506,389 - 506,389 Exchange Traded Funds 2,354 2,354 - Government Mortgage Backed Securities 7 - 7 Mutual Funds 1,104,327 - 1,104,327 Negotiable Certificates of Deposit 50,000 - 50,000 Stocks 3,821 3,821 - Supranationals 209,209 - 209,209 U.S. Agencies 573,325 - 573,325 U.S. Treasury Obligations - Notes 660,580 - 660,580 Total Investments & Cash Equivalents by Fair Value Level 3,713,876$ 6,175$ 3,707,701$
Investments classified in Level 1 of the Fair Value Hierarchy, valued at $6,175 are valued using quoted prices in active markets.
95
City of San Diego ComprehenSive annual finanCial report
Asset backed securities, commercial paper, corporate notes and bonds, government mortgage backed securities, mutual funds, negotiable certificates of deposit, supranationals, investments in U.S. Agencies, and U.S. Treasury notes are all classified in Level 2 of the Fair Value Hierarchy. These investments are valued using either bid evaluation or matrix pricing techniques. Bid evaluation may include market quotations, yields, maturities, call features, and ratings. Matrix pricing is used to value the securities based on the securities' relationship to benchmark quoted prices which are maintained by various pricing vendors. Fair value is defined as the quoted market value on the last trading day of the period. These prices are obtained from various pricing sources by our custodian banks.
Investments that are measured at fair value using the net asset value (NAV) per share (or its equivalent) are not classified in the fair value hierarchy. The City of San Diego values investments in money market mutual funds at NAV based on amortized cost. The City also has investments in LAIF which are reported based upon the application of a fair value factor to each one dollar share invested, and therefore are not included in the fair value hierarchy.
City of San Diego – Disclosures for Specific Risks
f. Interest Rate Risk Interest rate risk is the risk that changes in interest rates will adversely affect the fair value of an investment.
Interest rate risk for the City Treasurer’s Investment Pool is intended to be mitigated by establishing two portfolios, a liquidity portfolio and a core portfolio. Target durations are based upon the expected short and long-term cash needs of the City. The liquidity portfolio is structured with an adequate mix of highly liquid securities and maturities to meet major cash outflow requirements for at least six months (per CGC § 53646). The liquidity portfolio uses the Bank of America Merrill Lynch 3-6 month Treasury Index as a benchmark with a target duration of plus or minus 40% of the duration of that benchmark.
The core portfolio uses the Bank of America Merrill Lynch 1-3 year Treasury Index as a benchmark with a rolling three year period. It consists of high quality liquid securities with a maximum maturity of 5 years and is structured to meet the longer-term cash needs of the City. Information about the sensitivity of the fair value of the City’s investments to market interest rate fluctuations is presented in the table on the following page.
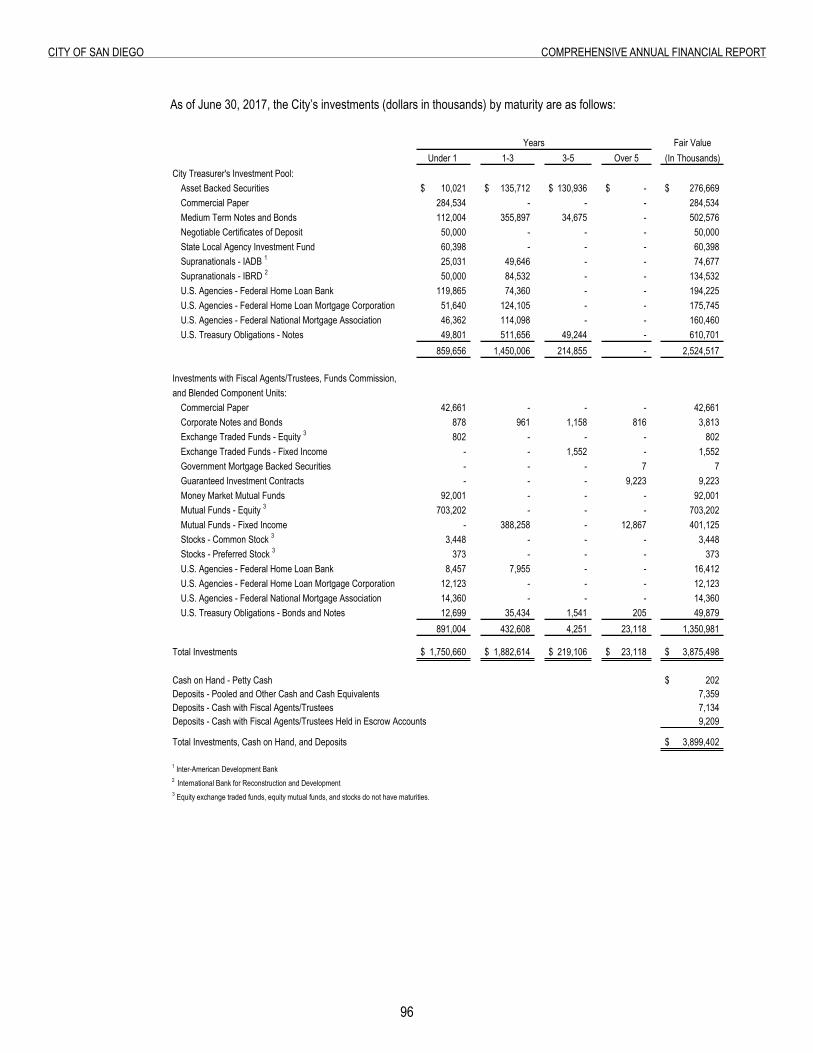
96
City of San Diego ComprehenSive annual finanCial report
As of June 30, 2017, the City’s investments (dollars in thousands) by maturity are as follows:
Fair ValueUnder 1 1-3 3-5 Over 5 (In Thousands)
City Treasurer's Investment Pool:Asset Backed Securities 10,021$ 135,712$ 130,936$ -$ 276,669$ Commercial Paper 284,534 - - - 284,534 Medium Term Notes and Bonds 112,004 355,897 34,675 - 502,576 Negotiable Certificates of Deposit 50,000 - - - 50,000 State Local Agency Investment Fund 60,398 - - - 60,398 Supranationals - IADB 1 25,031 49,646 - - 74,677 Supranationals - IBRD 2 50,000 84,532 - - 134,532 U.S. Agencies - Federal Home Loan Bank 119,865 74,360 - - 194,225 U.S. Agencies - Federal Home Loan Mortgage Corporation 51,640 124,105 - - 175,745 U.S. Agencies - Federal National Mortgage Association 46,362 114,098 - - 160,460 U.S. Treasury Obligations - Notes 49,801 511,656 49,244 - 610,701
859,656 1,450,006 214,855 - 2,524,517
Investments with Fiscal Agents/Trustees, Funds Commission, and Blended Component Units:
Commercial Paper 42,661 - - - 42,661 Corporate Notes and Bonds 878 961 1,158 816 3,813 Exchange Traded Funds - Equity 3 802 - - - 802 Exchange Traded Funds - Fixed Income - - 1,552 - 1,552 Government Mortgage Backed Securities - - - 7 7 Guaranteed Investment Contracts - - - 9,223 9,223 Money Market Mutual Funds 92,001 - - - 92,001 Mutual Funds - Equity 3 703,202 - - - 703,202 Mutual Funds - Fixed Income - 388,258 - 12,867 401,125 Stocks - Common Stock 3 3,448 - - - 3,448 Stocks - Preferred Stock 3 373 - - - 373 U.S. Agencies - Federal Home Loan Bank 8,457 7,955 - - 16,412 U.S. Agencies - Federal Home Loan Mortgage Corporation 12,123 - - - 12,123 U.S. Agencies - Federal National Mortgage Association 14,360 - - - 14,360 U.S. Treasury Obligations - Bonds and Notes 12,699 35,434 1,541 205 49,879
891,004 432,608 4,251 23,118 1,350,981
Total Investments 1,750,660$ 1,882,614$ 219,106$ 23,118$ 3,875,498$
Cash on Hand - Petty Cash 202$ Deposits - Pooled and Other Cash and Cash Equivalents 7,359 Deposits - Cash with Fiscal Agents/Trustees 7,134 Deposits - Cash with Fiscal Agents/Trustees Held in Escrow Accounts 9,209
Total Investments, Cash on Hand, and Deposits 3,899,402$
1 Inter-American Development Bank2 International Bank for Reconstruction and Development3 Equity exchange traded funds, equity mutual funds, and stocks do not have maturities.
Years
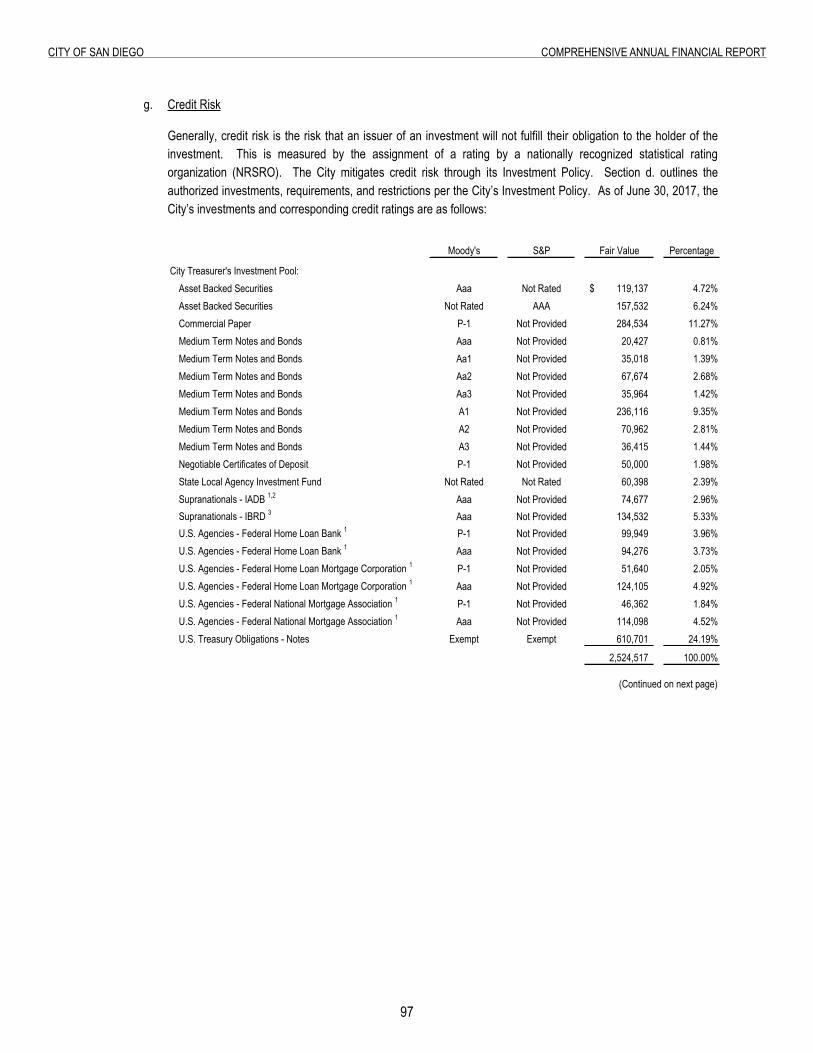
97
City of San Diego ComprehenSive annual finanCial report
g. Credit Risk
Generally, credit risk is the risk that an issuer of an investment will not fulfill their obligation to the holder of the investment. This is measured by the assignment of a rating by a nationally recognized statistical rating organization (NRSRO). The City mitigates credit risk through its Investment Policy. Section d. outlines the authorized investments, requirements, and restrictions per the City’s Investment Policy. As of June 30, 2017, the City’s investments and corresponding credit ratings are as follows:
Moody's S&P Fair Value Percentage
City Treasurer's Investment Pool:Asset Backed Securities Aaa Not Rated 119,137$ 4.72%Asset Backed Securities Not Rated AAA 157,532 6.24%Commercial Paper P-1 Not Provided 284,534 11.27%Medium Term Notes and Bonds Aaa Not Provided 20,427 0.81%Medium Term Notes and Bonds Aa1 Not Provided 35,018 1.39%Medium Term Notes and Bonds Aa2 Not Provided 67,674 2.68%Medium Term Notes and Bonds Aa3 Not Provided 35,964 1.42%Medium Term Notes and Bonds A1 Not Provided 236,116 9.35%Medium Term Notes and Bonds A2 Not Provided 70,962 2.81%Medium Term Notes and Bonds A3 Not Provided 36,415 1.44%Negotiable Certificates of Deposit P-1 Not Provided 50,000 1.98%State Local Agency Investment Fund Not Rated Not Rated 60,398 2.39%Supranationals - IADB 1,2 Aaa Not Provided 74,677 2.96%Supranationals - IBRD 3 Aaa Not Provided 134,532 5.33%U.S. Agencies - Federal Home Loan Bank 1 P-1 Not Provided 99,949 3.96%U.S. Agencies - Federal Home Loan Bank 1 Aaa Not Provided 94,276 3.73%U.S. Agencies - Federal Home Loan Mortgage Corporation 1 P-1 Not Provided 51,640 2.05%U.S. Agencies - Federal Home Loan Mortgage Corporation 1 Aaa Not Provided 124,105 4.92%U.S. Agencies - Federal National Mortgage Association 1 P-1 Not Provided 46,362 1.84%U.S. Agencies - Federal National Mortgage Association 1 Aaa Not Provided 114,098 4.52%U.S. Treasury Obligations - Notes Exempt Exempt 610,701 24.19%
2,524,517 100.00%
(Continued on next page)
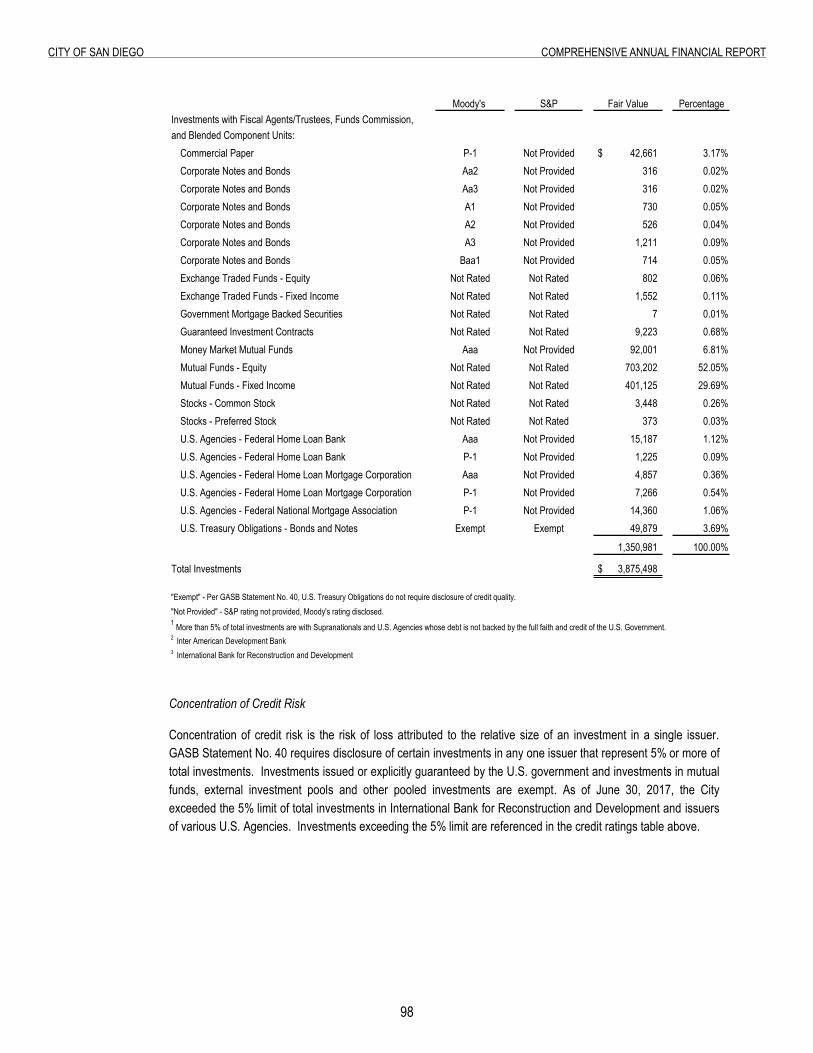
98
City of San Diego ComprehenSive annual finanCial report
Moody's S&P Fair Value PercentageInvestments with Fiscal Agents/Trustees, Funds Commission, and Blended Component Units:
Commercial Paper P-1 Not Provided 42,661$ 3.17%Corporate Notes and Bonds Aa2 Not Provided 316 0.02%Corporate Notes and Bonds Aa3 Not Provided 316 0.02%Corporate Notes and Bonds A1 Not Provided 730 0.05%Corporate Notes and Bonds A2 Not Provided 526 0.04%Corporate Notes and Bonds A3 Not Provided 1,211 0.09%Corporate Notes and Bonds Baa1 Not Provided 714 0.05%Exchange Traded Funds - Equity Not Rated Not Rated 802 0.06%Exchange Traded Funds - Fixed Income Not Rated Not Rated 1,552 0.11%Government Mortgage Backed Securities Not Rated Not Rated 7 0.01%Guaranteed Investment Contracts Not Rated Not Rated 9,223 0.68%Money Market Mutual Funds Aaa Not Provided 92,001 6.81%Mutual Funds - Equity Not Rated Not Rated 703,202 52.05%Mutual Funds - Fixed Income Not Rated Not Rated 401,125 29.69%Stocks - Common Stock Not Rated Not Rated 3,448 0.26%Stocks - Preferred Stock Not Rated Not Rated 373 0.03%U.S. Agencies - Federal Home Loan Bank Aaa Not Provided 15,187 1.12%U.S. Agencies - Federal Home Loan Bank P-1 Not Provided 1,225 0.09%U.S. Agencies - Federal Home Loan Mortgage Corporation Aaa Not Provided 4,857 0.36%U.S. Agencies - Federal Home Loan Mortgage Corporation P-1 Not Provided 7,266 0.54%U.S. Agencies - Federal National Mortgage Association P-1 Not Provided 14,360 1.06%U.S. Treasury Obligations - Bonds and Notes Exempt Exempt 49,879 3.69%
1,350,981 100.00%
Total Investments 3,875,498$
"Not Provided" - S&P rating not provided, Moody's rating disclosed.1 More than 5% of total investments are with Supranationals and U.S. Agencies whose debt is not backed by the full faith and credit of the U.S. Government.2 Inter American Development Bank3 International Bank for Reconstruction and Development
"Exempt" - Per GASB Statement No. 40, U.S. Treasury Obligations do not require disclosure of credit quality.
Concentration of Credit Risk
Concentration of credit risk is the risk of loss attributed to the relative size of an investment in a single issuer. GASB Statement No. 40 requires disclosure of certain investments in any one issuer that represent 5% or more of total investments. Investments issued or explicitly guaranteed by the U.S. government and investments in mutual funds, external investment pools and other pooled investments are exempt. As of June 30, 2017, the City exceeded the 5% limit of total investments in International Bank for Reconstruction and Development and issuers of various U.S. Agencies. Investments exceeding the 5% limit are referenced in the credit ratings table above.
99
City of San Diego ComprehenSive annual finanCial report
h. Custodial Credit Risk
Custodial credit risk is the risk that if a financial institution or counterparty fails, the City would not be able to recover the value of its deposits or investments. The City does not have a specific policy relating to custodial credit risk. The City’s exposure to custodial credit risk is further discussed below.
Deposits
At June 30, 2017, the carrying amount of the City's cash on hand and deposits was approximately $14,695 and the bank balance was approximately $38,644; the difference is substantially due to outstanding checks. For the balance of cash deposits in financial institutions, approximately $1,279 was covered by federal depository insurance and approximately $37,365 was uninsured. Pursuant to the California Government Code, California banks and savings and loan associations are required to secure the City’s deposits not covered by federal depository insurance by pledging government securities as collateral. As such, $37,365 of the City’s deposits are pledged at 110% and held by a bank acting as the City’s agent, in the City’s name.
The City also has deposits held in escrow accounts with a carrying amount and bank balance of approximately
$9,209. For the balance of deposits in escrow accounts, approximately $2,230 was covered by federal depository insurance. The remaining balance of $6,979 was uninsured, but collateralized and pledged at 110%.
Investments
At June 30, 2017, all of the City’s investments were held in the City’s name and were not exposed to custodial credit risk.
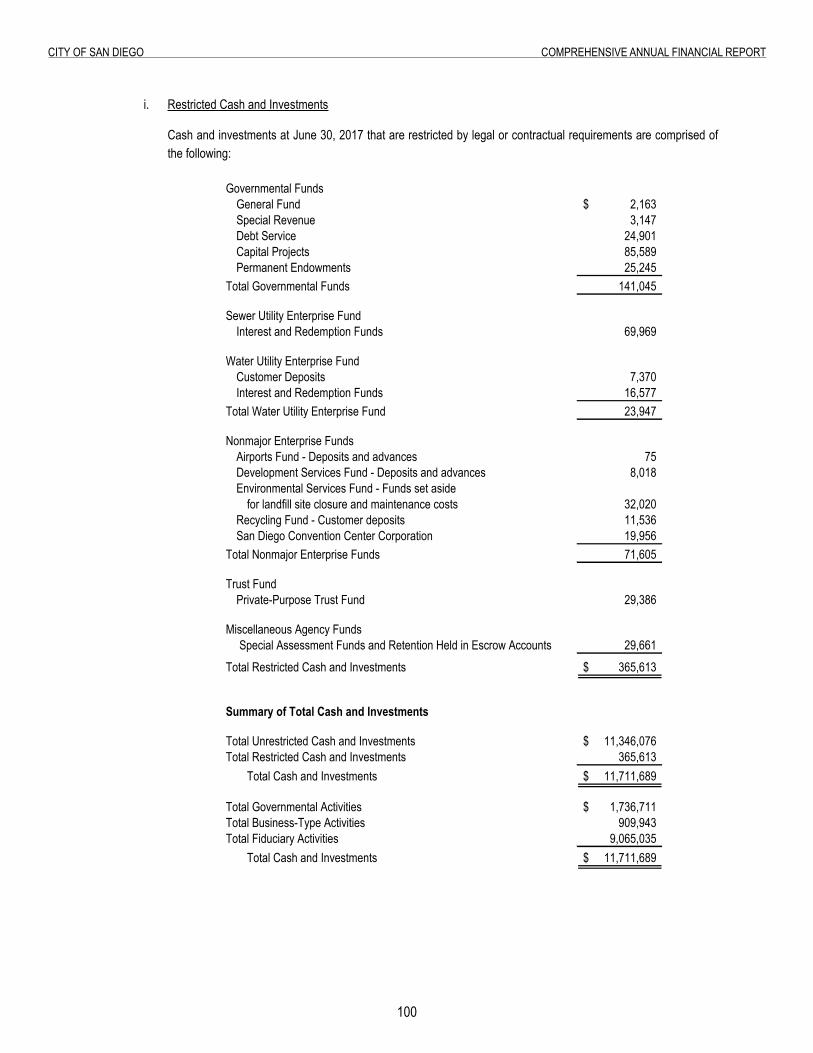
100
City of San Diego ComprehenSive annual finanCial report
i. Restricted Cash and Investments Cash and investments at June 30, 2017 that are restricted by legal or contractual requirements are comprised of
the following:
Governmental FundsGeneral Fund 2,163$ Special Revenue 3,147 Debt Service 24,901 Capital Projects 85,589 Permanent Endowments 25,245
Total Governmental Funds 141,045
Sewer Utility Enterprise FundInterest and Redemption Funds 69,969
Water Utility Enterprise FundCustomer Deposits 7,370 Interest and Redemption Funds 16,577
Total Water Utility Enterprise Fund 23,947
Nonmajor Enterprise FundsAirports Fund - Deposits and advances 75 Development Services Fund - Deposits and advances 8,018 Environmental Services Fund - Funds set aside
for landfill site closure and maintenance costs 32,020 Recycling Fund - Customer deposits 11,536 San Diego Convention Center Corporation 19,956
Total Nonmajor Enterprise Funds 71,605
Trust FundPrivate-Purpose Trust Fund 29,386
Miscellaneous Agency Funds Special Assessment Funds and Retention Held in Escrow Accounts 29,661
Total Restricted Cash and Investments 365,613$
Summary of Total Cash and Investments
Total Unrestricted Cash and Investments 11,346,076$ Total Restricted Cash and Investments 365,613
Total Cash and Investments 11,711,689$
Total Governmental Activities 1,736,711$ Total Business-Type Activities 909,943 Total Fiduciary Activities 9,065,035
Total Cash and Investments 11,711,689$
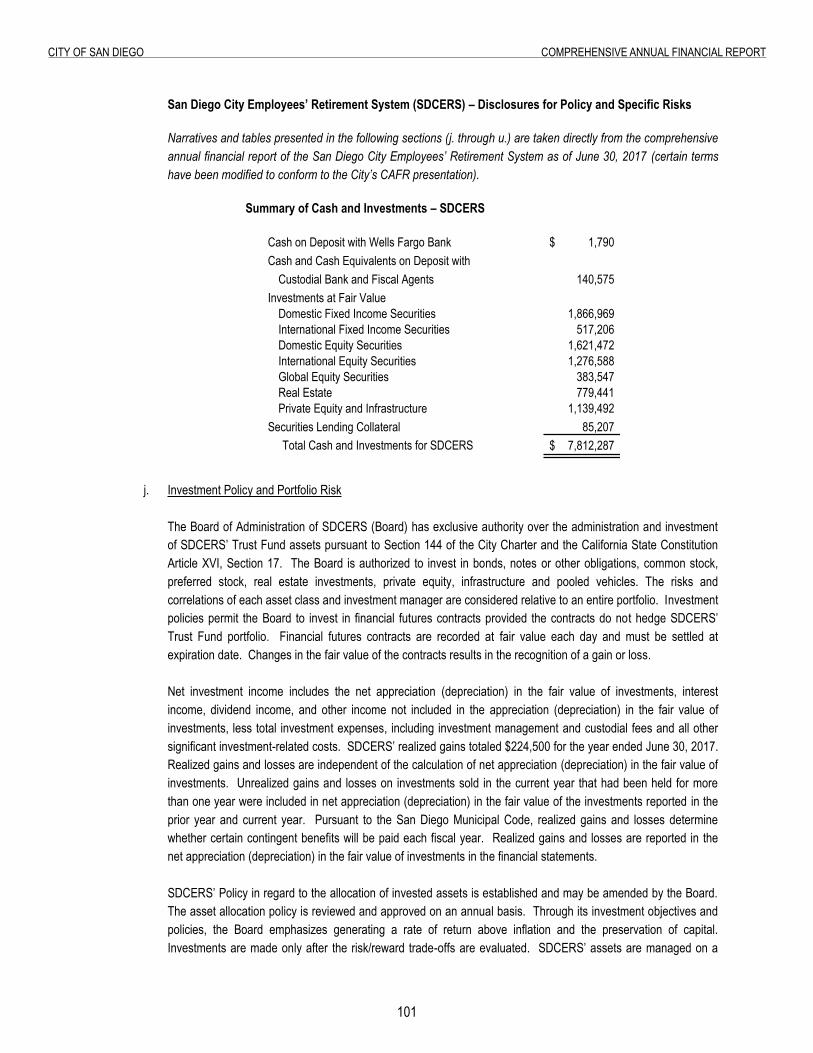
101
City of San Diego ComprehenSive annual finanCial report
San Diego City Employees’ Retirement System (SDCERS) – Disclosures for Policy and Specific Risks Narratives and tables presented in the following sections (j. through u.) are taken directly from the comprehensive annual financial report of the San Diego City Employees’ Retirement System as of June 30, 2017 (certain terms have been modified to conform to the City’s CAFR presentation).
Summary of Cash and Investments – SDCERS
Cash on Deposit with Wells Fargo Bank 1,790$ Cash and Cash Equivalents on Deposit with
Custodial Bank and Fiscal Agents 140,575 Investments at Fair Value
Domestic Fixed Income Securities 1,866,969 International Fixed Income Securities 517,206 Domestic Equity Securities 1,621,472 International Equity Securities 1,276,588 Global Equity Securities 383,547 Real Estate 779,441 Private Equity and Infrastructure 1,139,492
Securities Lending Collateral 85,207 Total Cash and Investments for SDCERS 7,812,287$
j. Investment Policy and Portfolio Risk
The Board of Administration of SDCERS (Board) has exclusive authority over the administration and investment of SDCERS’ Trust Fund assets pursuant to Section 144 of the City Charter and the California State Constitution Article XVI, Section 17. The Board is authorized to invest in bonds, notes or other obligations, common stock, preferred stock, real estate investments, private equity, infrastructure and pooled vehicles. The risks and correlations of each asset class and investment manager are considered relative to an entire portfolio. Investment policies permit the Board to invest in financial futures contracts provided the contracts do not hedge SDCERS’ Trust Fund portfolio. Financial futures contracts are recorded at fair value each day and must be settled at expiration date. Changes in the fair value of the contracts results in the recognition of a gain or loss.
Net investment income includes the net appreciation (depreciation) in the fair value of investments, interest
income, dividend income, and other income not included in the appreciation (depreciation) in the fair value of investments, less total investment expenses, including investment management and custodial fees and all other significant investment-related costs. SDCERS’ realized gains totaled $224,500 for the year ended June 30, 2017. Realized gains and losses are independent of the calculation of net appreciation (depreciation) in the fair value of investments. Unrealized gains and losses on investments sold in the current year that had been held for more than one year were included in net appreciation (depreciation) in the fair value of the investments reported in the prior year and current year. Pursuant to the San Diego Municipal Code, realized gains and losses determine whether certain contingent benefits will be paid each fiscal year. Realized gains and losses are reported in the net appreciation (depreciation) in the fair value of investments in the financial statements.
SDCERS’ Policy in regard to the allocation of invested assets is established and may be amended by the Board.
The asset allocation policy is reviewed and approved on an annual basis. Through its investment objectives and policies, the Board emphasizes generating a rate of return above inflation and the preservation of capital. Investments are made only after the risk/reward trade-offs are evaluated. SDCERS’ assets are managed on a
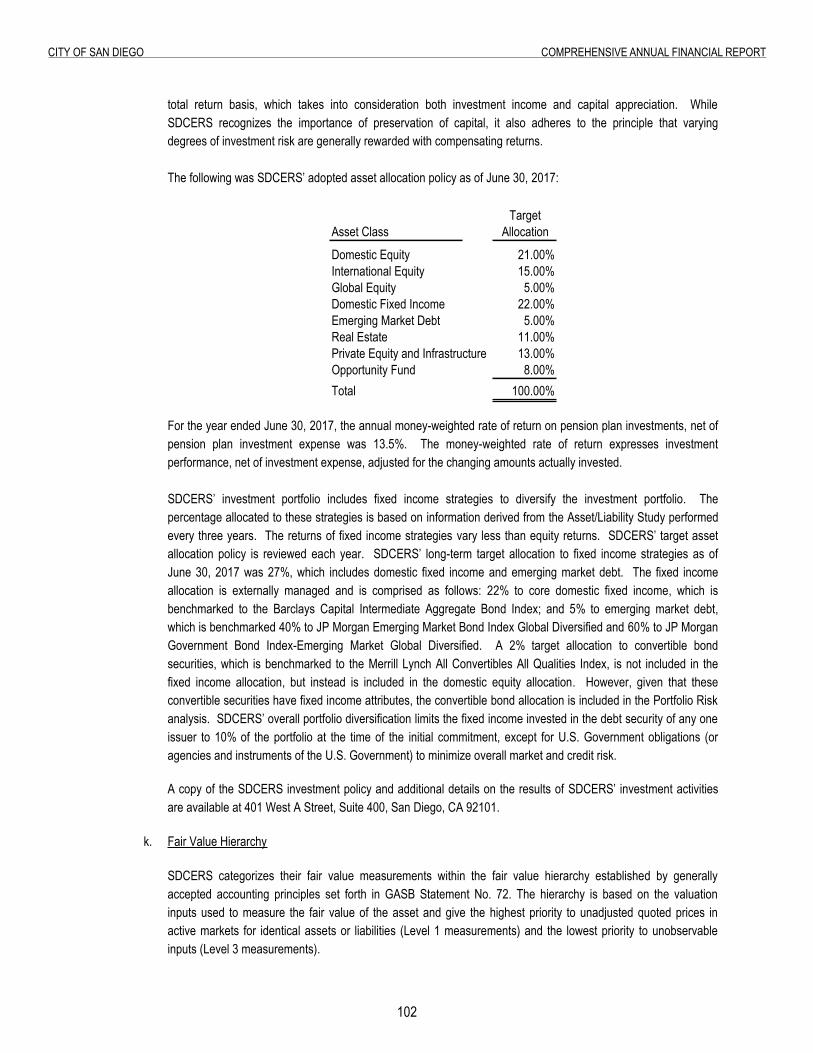
102
City of San Diego ComprehenSive annual finanCial report
total return basis, which takes into consideration both investment income and capital appreciation. While SDCERS recognizes the importance of preservation of capital, it also adheres to the principle that varying degrees of investment risk are generally rewarded with compensating returns.
The following was SDCERS’ adopted asset allocation policy as of June 30, 2017:
Target
Asset Class AllocationDomestic Equity 21.00%International Equity 15.00%Global Equity 5.00%Domestic Fixed Income 22.00%Emerging Market Debt 5.00%Real Estate 11.00%Private Equity and Infrastructure 13.00%Opportunity Fund 8.00%Total 100.00%
For the year ended June 30, 2017, the annual money-weighted rate of return on pension plan investments, net of pension plan investment expense was 13.5%. The money-weighted rate of return expresses investment performance, net of investment expense, adjusted for the changing amounts actually invested.
SDCERS’ investment portfolio includes fixed income strategies to diversify the investment portfolio. The percentage allocated to these strategies is based on information derived from the Asset/Liability Study performed every three years. The returns of fixed income strategies vary less than equity returns. SDCERS’ target asset allocation policy is reviewed each year. SDCERS’ long-term target allocation to fixed income strategies as of June 30, 2017 was 27%, which includes domestic fixed income and emerging market debt. The fixed income allocation is externally managed and is comprised as follows: 22% to core domestic fixed income, which is benchmarked to the Barclays Capital Intermediate Aggregate Bond Index; and 5% to emerging market debt, which is benchmarked 40% to JP Morgan Emerging Market Bond Index Global Diversified and 60% to JP Morgan Government Bond Index-Emerging Market Global Diversified. A 2% target allocation to convertible bond securities, which is benchmarked to the Merrill Lynch All Convertibles All Qualities Index, is not included in the fixed income allocation, but instead is included in the domestic equity allocation. However, given that these convertible securities have fixed income attributes, the convertible bond allocation is included in the Portfolio Risk analysis. SDCERS’ overall portfolio diversification limits the fixed income invested in the debt security of any one issuer to 10% of the portfolio at the time of the initial commitment, except for U.S. Government obligations (or agencies and instruments of the U.S. Government) to minimize overall market and credit risk.
A copy of the SDCERS investment policy and additional details on the results of SDCERS’ investment activities
are available at 401 West A Street, Suite 400, San Diego, CA 92101.
k. Fair Value Hierarchy
SDCERS categorizes their fair value measurements within the fair value hierarchy established by generally accepted accounting principles set forth in GASB Statement No. 72. The hierarchy is based on the valuation inputs used to measure the fair value of the asset and give the highest priority to unadjusted quoted prices in active markets for identical assets or liabilities (Level 1 measurements) and the lowest priority to unobservable inputs (Level 3 measurements).
103
City of San Diego ComprehenSive annual finanCial report
Level 1: Unadjusted quoted prices for identical instruments in active markets. Level 2: Quoted prices for similar instruments in active markets; quoted prices for identical or similar instruments in markets that are not active; and model-derived valuations in which all significant inputs are observable. Level 3: Valuations derived from valuation techniques in which significant inputs are unobservable. Investments that are measured at fair value using the net asset value (NAV) per share (or its equivalent) as a practical expedient are not classified in the fair value hierarchy. Where inputs used to measure fair value fall into different fair value levels, fair value measurements are categorized based on the lowest level input that is significant to the valuation. SDCERS’ assessment of the significance of particular inputs to these fair value measurements requires judgment and considers factors specific to each asset or liability. The table on the next page shows the fair value leveling of the investments for the pension system. Short-term securities generally include investments in money market-type securities reported at cost plus accrued interest.
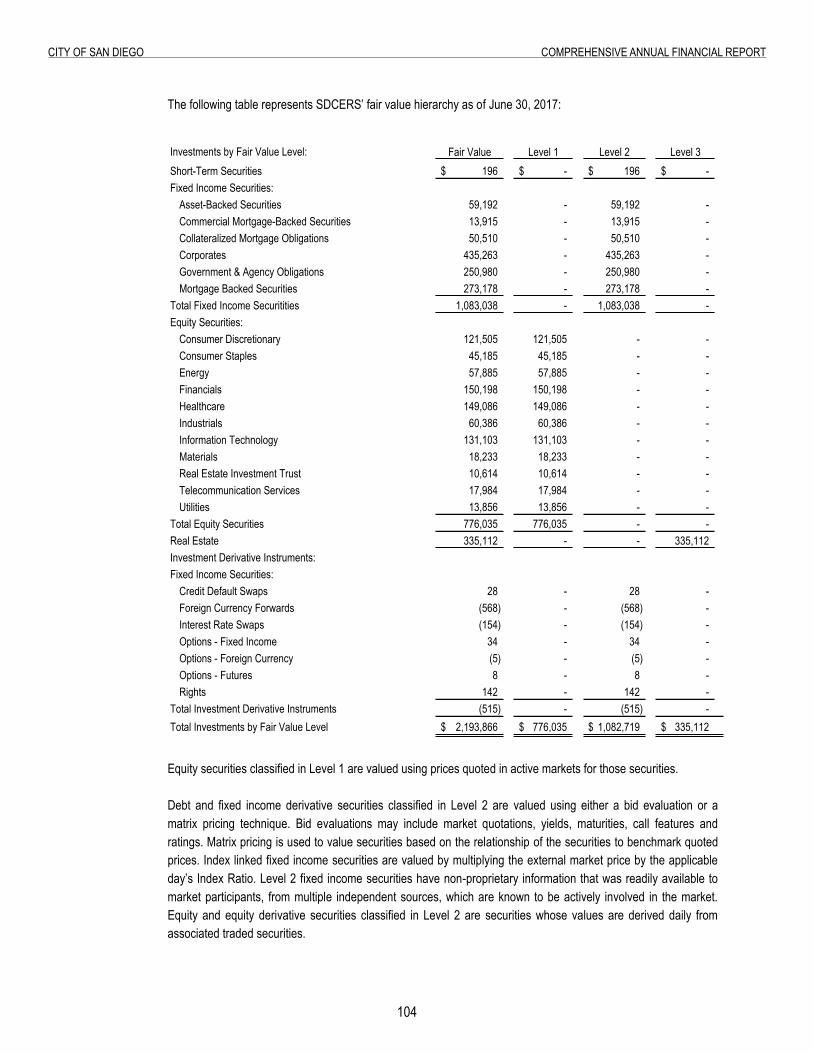
10�
City of San Diego ComprehenSive annual finanCial report
The following table represents SDCERS’ fair value hierarchy as of June 30, 2017:
Investments by Fair Value Level: Fair Value Level 1 Level 2 Level 3Short-Term Securities 196$ -$ 196$ -$ Fixed Income Securities:
Asset-Backed Securities 59,192 - 59,192 - Commercial Mortgage-Backed Securities 13,915 - 13,915 - Collateralized Mortgage Obligations 50,510 - 50,510 - Corporates 435,263 - 435,263 - Government & Agency Obligations 250,980 - 250,980 - Mortgage Backed Securities 273,178 - 273,178 -
Total Fixed Income Securitities 1,083,038 - 1,083,038 - Equity Securities:
Consumer Discretionary 121,505 121,505 - - Consumer Staples 45,185 45,185 - - Energy 57,885 57,885 - - Financials 150,198 150,198 - - Healthcare 149,086 149,086 - - Industrials 60,386 60,386 - - Information Technology 131,103 131,103 - - Materials 18,233 18,233 - - Real Estate Investment Trust 10,614 10,614 - - Telecommunication Services 17,984 17,984 - - Utilities 13,856 13,856 - -
Total Equity Securities 776,035 776,035 - - Real Estate 335,112 - - 335,112 Investment Derivative Instruments:Fixed Income Securities:
Credit Default Swaps 28 - 28 - Foreign Currency Forwards (568) - (568) - Interest Rate Swaps (154) - (154) - Options - Fixed Income 34 - 34 - Options - Foreign Currency (5) - (5) - Options - Futures 8 - 8 - Rights 142 - 142 -
Total Investment Derivative Instruments (515) - (515) - Total Investments by Fair Value Level 2,193,866$ 776,035$ 1,082,719$ 335,112$
Equity securities classified in Level 1 are valued using prices quoted in active markets for those securities. Debt and fixed income derivative securities classified in Level 2 are valued using either a bid evaluation or a matrix pricing technique. Bid evaluations may include market quotations, yields, maturities, call features and ratings. Matrix pricing is used to value securities based on the relationship of the securities to benchmark quoted prices. Index linked fixed income securities are valued by multiplying the external market price by the applicable day’s Index Ratio. Level 2 fixed income securities have non-proprietary information that was readily available to market participants, from multiple independent sources, which are known to be actively involved in the market. Equity and equity derivative securities classified in Level 2 are securities whose values are derived daily from associated traded securities.
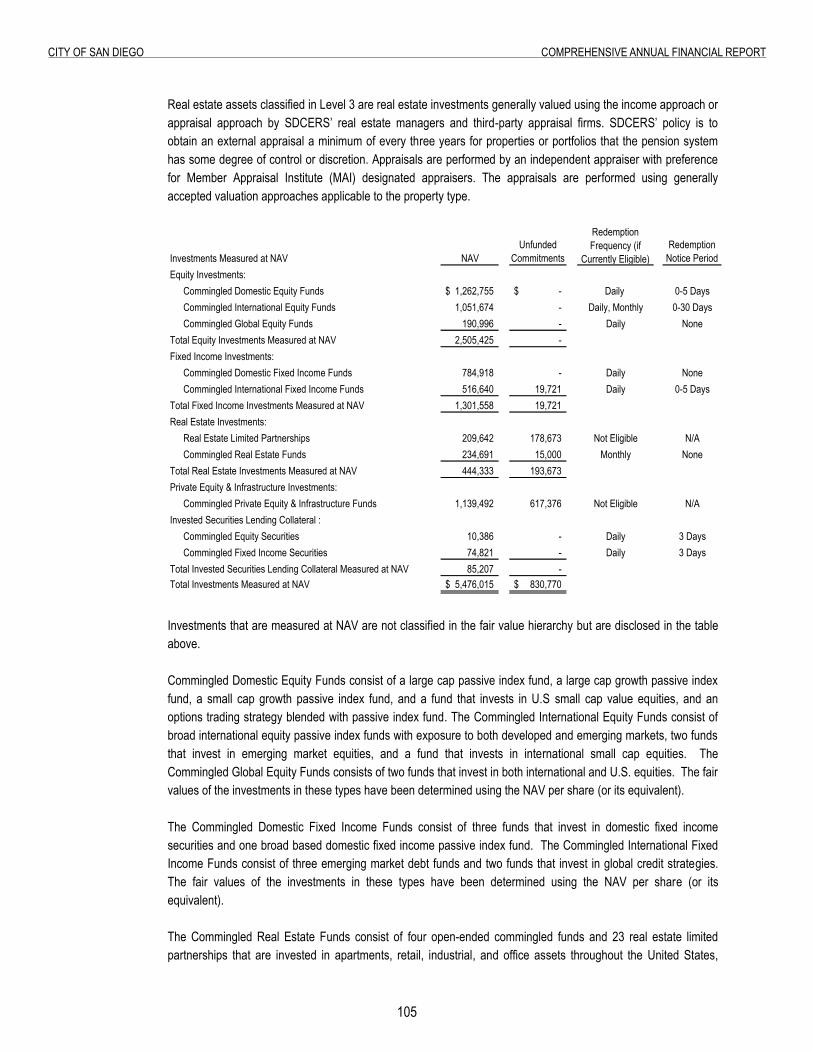
105
City of San Diego ComprehenSive annual finanCial report
Real estate assets classified in Level 3 are real estate investments generally valued using the income approach or appraisal approach by SDCERS’ real estate managers and third-party appraisal firms. SDCERS’ policy is to obtain an external appraisal a minimum of every three years for properties or portfolios that the pension system has some degree of control or discretion. Appraisals are performed by an independent appraiser with preference for Member Appraisal Institute (MAI) designated appraisers. The appraisals are performed using generally accepted valuation approaches applicable to the property type.
Investments Measured at NAV NAVUnfunded
Commitments
Redemption Frequency (if
Currently Eligible)Redemption
Notice PeriodEquity Investments:
Commingled Domestic Equity Funds 1,262,755$ -$ Daily 0-5 DaysCommingled International Equity Funds 1,051,674 - Daily, Monthly 0-30 DaysCommingled Global Equity Funds 190,996 - Daily None
Total Equity Investments Measured at NAV 2,505,425 - Fixed Income Investments:
Commingled Domestic Fixed Income Funds 784,918 - Daily NoneCommingled International Fixed Income Funds 516,640 19,721 Daily 0-5 Days
Total Fixed Income Investments Measured at NAV 1,301,558 19,721 Real Estate Investments:
Real Estate Limited Partnerships 209,642 178,673 Not Eligible N/ACommingled Real Estate Funds 234,691 15,000 Monthly None
Total Real Estate Investments Measured at NAV 444,333 193,673 Private Equity & Infrastructure Investments:
Commingled Private Equity & Infrastructure Funds 1,139,492 617,376 Not Eligible N/AInvested Securities Lending Collateral :
Commingled Equity Securities 10,386 - Daily 3 DaysCommingled Fixed Income Securities 74,821 - Daily 3 Days
Total Invested Securities Lending Collateral Measured at NAV 85,207 - Total Investments Measured at NAV 5,476,015$ 830,770$
Investments that are measured at NAV are not classified in the fair value hierarchy but are disclosed in the table above. Commingled Domestic Equity Funds consist of a large cap passive index fund, a large cap growth passive index fund, a small cap growth passive index fund, and a fund that invests in U.S small cap value equities, and an options trading strategy blended with passive index fund. The Commingled International Equity Funds consist of broad international equity passive index funds with exposure to both developed and emerging markets, two funds that invest in emerging market equities, and a fund that invests in international small cap equities. The Commingled Global Equity Funds consists of two funds that invest in both international and U.S. equities. The fair values of the investments in these types have been determined using the NAV per share (or its equivalent). The Commingled Domestic Fixed Income Funds consist of three funds that invest in domestic fixed income securities and one broad based domestic fixed income passive index fund. The Commingled International Fixed Income Funds consist of three emerging market debt funds and two funds that invest in global credit strategies. The fair values of the investments in these types have been determined using the NAV per share (or its equivalent). The Commingled Real Estate Funds consist of four open-ended commingled funds and 23 real estate limited partnerships that are invested in apartments, retail, industrial, and office assets throughout the United States,
106
City of San Diego ComprehenSive annual finanCial report
Europe and Asia. Although the open-ended commingled funds are private investments, they can be redeemed on a monthly basis, subject to available liquidity, and the fair value of these investments has been determined using the NAV per share (or its equivalent). Investments in the limited partnerships can never be redeemed with the funds. Instead, the nature of these investment funds is that distributions from each investment will be received as the underlying investments are liquidated. Because it is not probable that any individual investment will be sold, the fair value of SDCERS’ ownership interest in partner’s capital has been determined using the NAV per share (or its equivalent). The Commingled Private Equity and Infrastructure Funds consist of two limited partnerships that are managed by two discretionary advisors. Generally, the limited partnerships invest in venture capital, growth equity, buyouts, special situations, mezzanine, and distressed debt. These investments are considered illiquid and cannot be redeemed during the lives of the partnerships. Instead, the nature of these investments is that distributions from each investment will be received as the underlying investments are liquidated. Because it is not probable that any individual investment will be sold, the fair value of each individual investment has been determined using the NAV per share (or its equivalent).
l. Interest Rate Risk
Interest rate risk is the risk that changes in interest rates will adversely affect the fair value of an investment. Fixed income portfolios use duration to measure how a change in interest rates will affect the value of the portfolio. SDCERS does not have a general investment policy that addresses interest rate risk. Rather, each investment manager’s specific investment guidelines place limits on each portfolio to manage interest rate risk.
Convertible bonds are generally less sensitive to changes in interest rates and more sensitive to the profitability of the underlying issuer. Company fundamentals are the overriding factor in the bond’s return, while fluctuations in interest rates have significantly less impact.
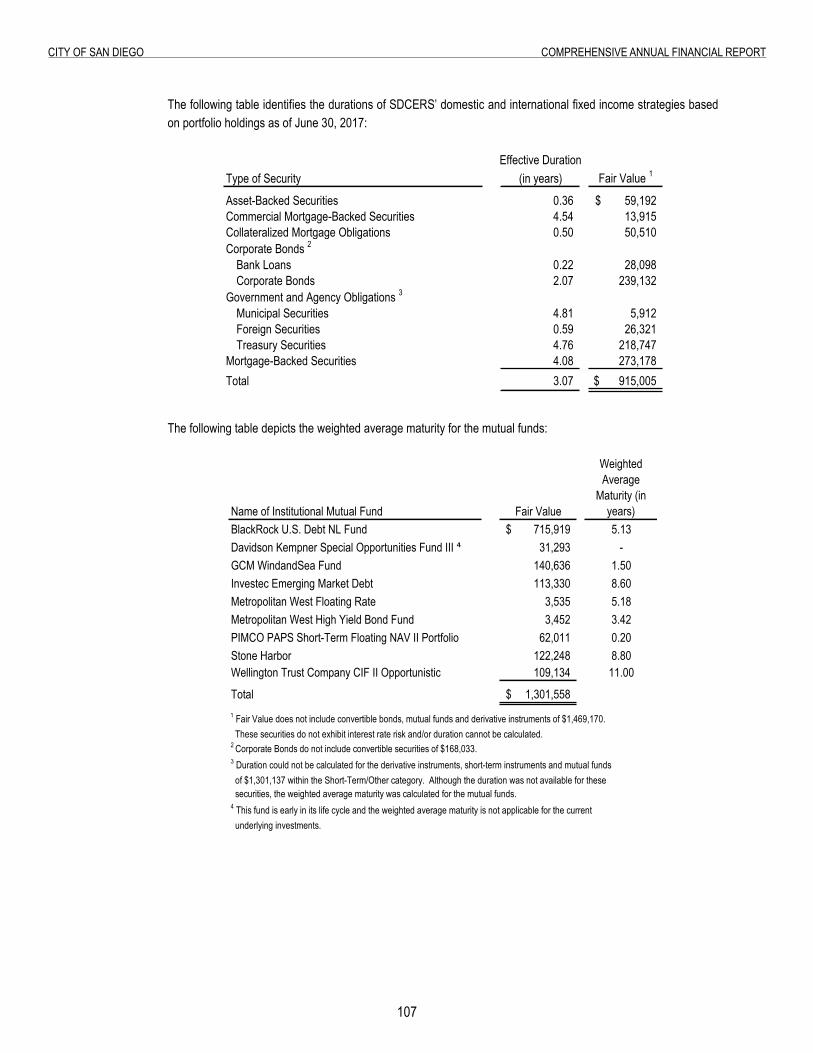
107
City of San Diego ComprehenSive annual finanCial report
The following table identifies the durations of SDCERS’ domestic and international fixed income strategies based on portfolio holdings as of June 30, 2017:
Effective DurationType of Security (in years) Fair Value 1
Asset-Backed Securities 0.36 59,192$ Commercial Mortgage-Backed Securities 4.54 13,915 Collateralized Mortgage Obligations 0.50 50,510 Corporate Bonds 2
Bank Loans 0.22 28,098 Corporate Bonds 2.07 239,132
Government and Agency Obligations 3
Municipal Securities 4.81 5,912 Foreign Securities 0.59 26,321 Treasury Securities 4.76 218,747
Mortgage-Backed Securities 4.08 273,178 Total 3.07 915,005$
The following table depicts the weighted average maturity for the mutual funds:
Name of Institutional Mutual Fund Fair Value
Weighted Average
Maturity (in years)
BlackRock U.S. Debt NL Fund 715,919$ 5.13Davidson Kempner Special Opportunities Fund III ⁴ 31,293 -GCM WindandSea Fund 140,636 1.50Investec Emerging Market Debt 113,330 8.60Metropolitan West Floating Rate 3,535 5.18Metropolitan West High Yield Bond Fund 3,452 3.42PIMCO PAPS Short-Term Floating NAV II Portfolio 62,011 0.20Stone Harbor 122,248 8.80Wellington Trust Company CIF II Opportunistic 109,134 11.00
Total 1,301,558$ 1 Fair Value does not include convertible bonds, mutual funds and derivative instruments of $1,469,170. These securities do not exhibit interest rate risk and/or duration cannot be calculated.2 Corporate Bonds do not include convertible securities of $168,033.3 Duration could not be calculated for the derivative instruments, short-term instruments and mutual funds of $1,301,137 within the Short-Term/Other category. Although the duration was not available for these securities, the weighted average maturity was calculated for the mutual funds.4 This fund is early in its life cycle and the weighted average maturity is not applicable for the current underlying investments.
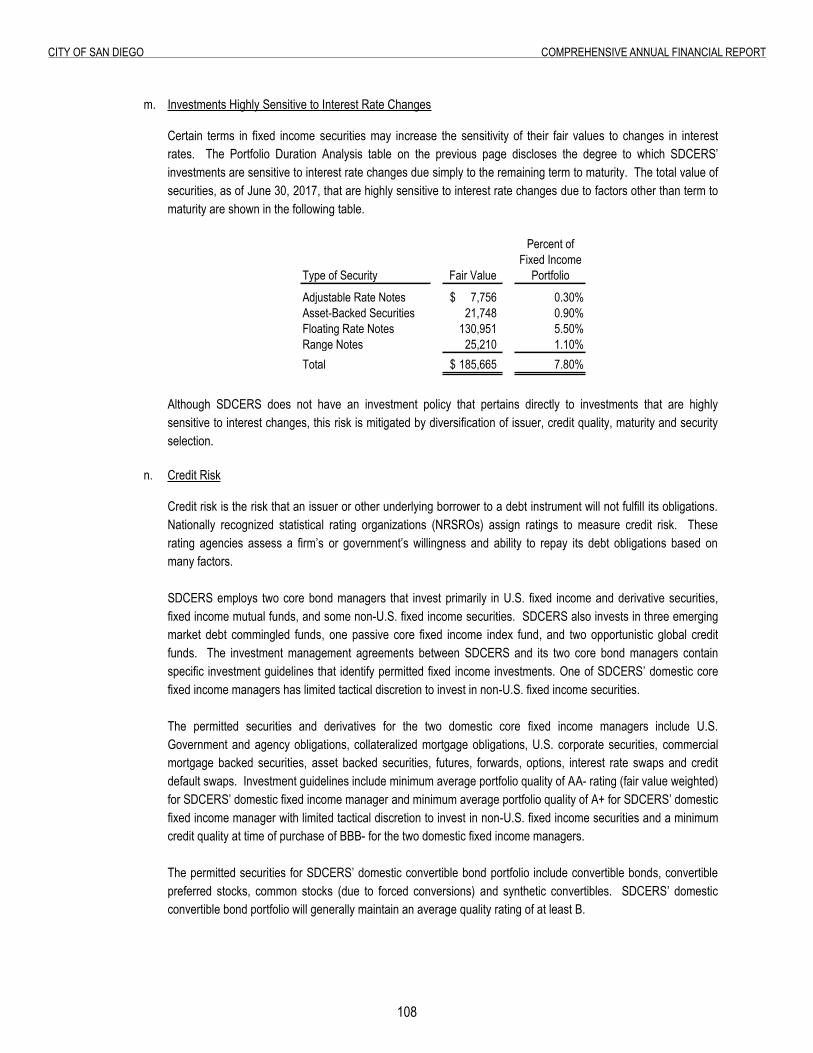
108
City of San Diego ComprehenSive annual finanCial report
m. Investments Highly Sensitive to Interest Rate Changes
Certain terms in fixed income securities may increase the sensitivity of their fair values to changes in interest rates. The Portfolio Duration Analysis table on the previous page discloses the degree to which SDCERS’ investments are sensitive to interest rate changes due simply to the remaining term to maturity. The total value of securities, as of June 30, 2017, that are highly sensitive to interest rate changes due to factors other than term to maturity are shown in the following table.
Percent ofFixed Income
Type of Security Fair Value PortfolioAdjustable Rate Notes 7,756$ 0.30%Asset-Backed Securities 21,748 0.90%Floating Rate Notes 130,951 5.50%Range Notes 25,210 1.10%Total 185,665$ 7.80%
Although SDCERS does not have an investment policy that pertains directly to investments that are highly sensitive to interest changes, this risk is mitigated by diversification of issuer, credit quality, maturity and security selection.
n. Credit Risk
Credit risk is the risk that an issuer or other underlying borrower to a debt instrument will not fulfill its obligations. Nationally recognized statistical rating organizations (NRSROs) assign ratings to measure credit risk. These rating agencies assess a firm’s or government’s willingness and ability to repay its debt obligations based on many factors.
SDCERS employs two core bond managers that invest primarily in U.S. fixed income and derivative securities, fixed income mutual funds, and some non-U.S. fixed income securities. SDCERS also invests in three emerging market debt commingled funds, one passive core fixed income index fund, and two opportunistic global credit funds. The investment management agreements between SDCERS and its two core bond managers contain specific investment guidelines that identify permitted fixed income investments. One of SDCERS’ domestic core fixed income managers has limited tactical discretion to invest in non-U.S. fixed income securities. The permitted securities and derivatives for the two domestic core fixed income managers include U.S. Government and agency obligations, collateralized mortgage obligations, U.S. corporate securities, commercial mortgage backed securities, asset backed securities, futures, forwards, options, interest rate swaps and credit default swaps. Investment guidelines include minimum average portfolio quality of AA- rating (fair value weighted) for SDCERS’ domestic fixed income manager and minimum average portfolio quality of A+ for SDCERS’ domestic fixed income manager with limited tactical discretion to invest in non-U.S. fixed income securities and a minimum credit quality at time of purchase of BBB- for the two domestic fixed income managers.
The permitted securities for SDCERS’ domestic convertible bond portfolio include convertible bonds, convertible
preferred stocks, common stocks (due to forced conversions) and synthetic convertibles. SDCERS’ domestic convertible bond portfolio will generally maintain an average quality rating of at least B.
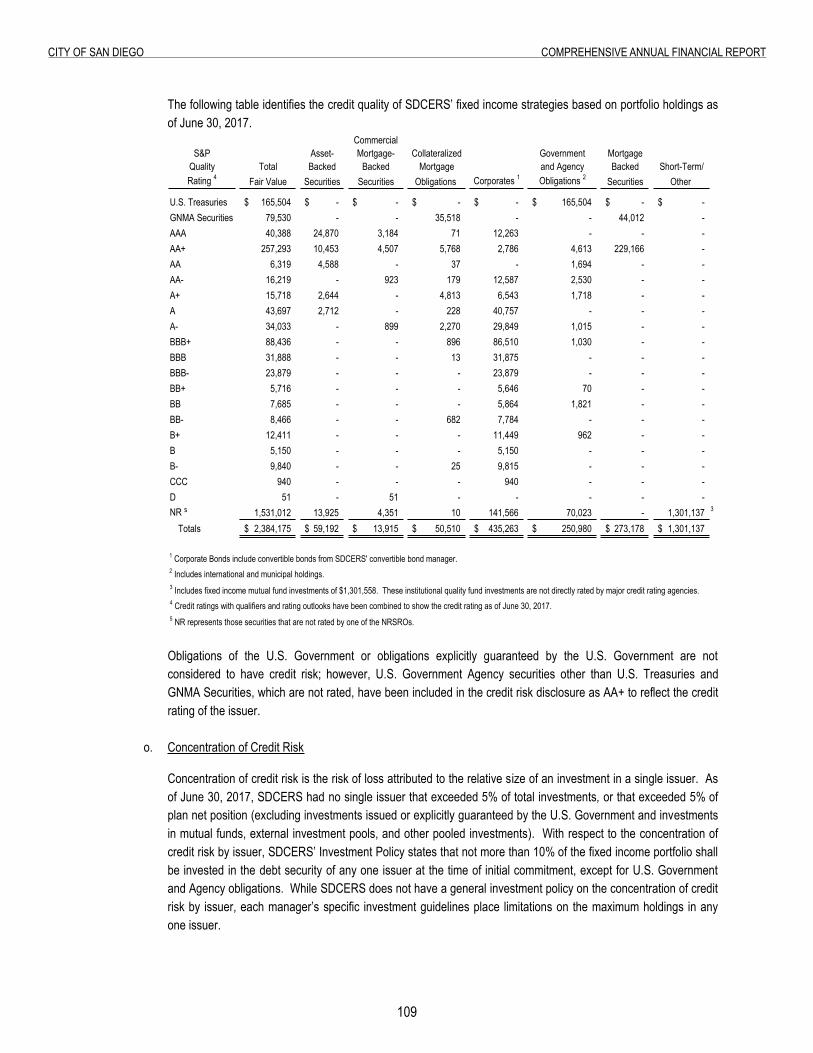
109
City of San Diego ComprehenSive annual finanCial report
The following table identifies the credit quality of SDCERS’ fixed income strategies based on portfolio holdings as of June 30, 2017.
CommercialS&P Asset- Mortgage- Collateralized Government Mortgage
Quality Total Backed Backed Mortgage and Agency Backed Short-Term/Rating 4 Fair Value Securities Securities Obligations Corporates 1 Obligations 2 Securities Other
U.S. Treasuries 165,504$ -$ -$ -$ -$ 165,504$ -$ -$ GNMA Securities 79,530 - - 35,518 - - 44,012 - AAA 40,388 24,870 3,184 71 12,263 - - - AA+ 257,293 10,453 4,507 5,768 2,786 4,613 229,166 - AA 6,319 4,588 - 37 - 1,694 - - AA- 16,219 - 923 179 12,587 2,530 - - A+ 15,718 2,644 - 4,813 6,543 1,718 - - A 43,697 2,712 - 228 40,757 - - - A- 34,033 - 899 2,270 29,849 1,015 - - BBB+ 88,436 - - 896 86,510 1,030 - - BBB 31,888 - - 13 31,875 - - - BBB- 23,879 - - - 23,879 - - - BB+ 5,716 - - - 5,646 70 - - BB 7,685 - - - 5,864 1,821 - - BB- 8,466 - - 682 7,784 - - - B+ 12,411 - - - 11,449 962 - - B 5,150 - - - 5,150 - - - B- 9,840 - - 25 9,815 - - - CCC 940 - - - 940 - - - D 51 - 51 - - - - - NR ⁵ 1,531,012 13,925 4,351 10 141,566 70,023 - 1,301,137 3
Totals 2,384,175$ 59,192$ 13,915$ 50,510$ 435,263$ 250,980$ 273,178$ 1,301,137$
1 Corporate Bonds include convertible bonds from SDCERS' convertible bond manager.2 Includes international and municipal holdings.3 Includes fixed income mutual fund investments of $1,301,558. These institutional quality fund investments are not directly rated by major credit rating agencies.
5 NR represents those securities that are not rated by one of the NRSROs.
4 Credit ratings with qualifiers and rating outlooks have been combined to show the credit rating as of June 30, 2017.
Obligations of the U.S. Government or obligations explicitly guaranteed by the U.S. Government are not considered to have credit risk; however, U.S. Government Agency securities other than U.S. Treasuries and GNMA Securities, which are not rated, have been included in the credit risk disclosure as AA+ to reflect the credit rating of the issuer.
o. Concentration of Credit Risk
Concentration of credit risk is the risk of loss attributed to the relative size of an investment in a single issuer. As of June 30, 2017, SDCERS had no single issuer that exceeded 5% of total investments, or that exceeded 5% of plan net position (excluding investments issued or explicitly guaranteed by the U.S. Government and investments in mutual funds, external investment pools, and other pooled investments). With respect to the concentration of credit risk by issuer, SDCERS’ Investment Policy states that not more than 10% of the fixed income portfolio shall be invested in the debt security of any one issuer at the time of initial commitment, except for U.S. Government and Agency obligations. While SDCERS does not have a general investment policy on the concentration of credit risk by issuer, each manager’s specific investment guidelines place limitations on the maximum holdings in any one issuer.
110
City of San Diego ComprehenSive annual finanCial report
p. Custodial Credit Risk
Custodial credit risk is the risk that if a financial institution or counterparty fails, SDCERS would not be able to recover the value of its deposits, investments, or securities. SDCERS’ exposure to custodial credit risk is further discussed in the following paragraphs.
Deposits
As of June 30, 2017 SDCERS’ cash balance was $1,800. Cash and cash equivalents on deposit with custodial bank and fiscal agents was $140,600, which includes cash collateral for SDCERS’ cash overlay program of $32,100 and residual cash held in each manager’s portfolio of $108,500, which is invested overnight by SDCERS’ custodial bank. SDCERS does not have a target allocation to cash; any cash or cash equivalent balances on deposit are reserved for paying benefits and SDCERS’ operational expenses.
SDCERS’ un-invested cash balances held in a demand deposit account (DDA) are subject to custodial credit risk. Such a balance or deposit with the bank establishes a debtor-creditor relationship and is not subject to the protection afforded SDCERS’ other investments. Cash balances held in Short-Term Investment Funds (STIF) at State Street Bank and Trust Company (State Street) are held in SDCERS’ name and are not subject to custodial credit risk. As of June 30, 2017, SDCERS held $131,800 in STIF and a cash balance of $8,800. SDCERS does not have a specific policy relating to custodial credit risk because the majority of SDCERS’ assets are held in SDCERS’ name and are not available to satisfy the obligations of State Street to its creditors.
Investments
As of June 30, 2017, 100% of SDCERS’ investments were held in SDCERS’ name. SDCERS is not exposed to custodial credit risk related to these investments.
Securities Lending Collateral
SDCERS’ custodial bank acts as its securities lending agent. SDCERS is exposed to custodial credit risk for the securities lending collateral such that certain collateral is received in the form of letters of credit, tri-party collateral or securities collateral. The fair value of non-cash collateral totaled $198,900 as of June 30, 2017. The non-cash collateral is not held in SDCERS’ name and cannot be sold without a borrower default. The cash collateral held by SDCERS’ custodian in conjunction with the securities lending program, which totaled $85,200 as of June 30, 2017, is also at risk as it is invested in pooled vehicles managed by the custodian. The investment characteristics of the collateral pool are disclosed in the Securities Lending section of this note.
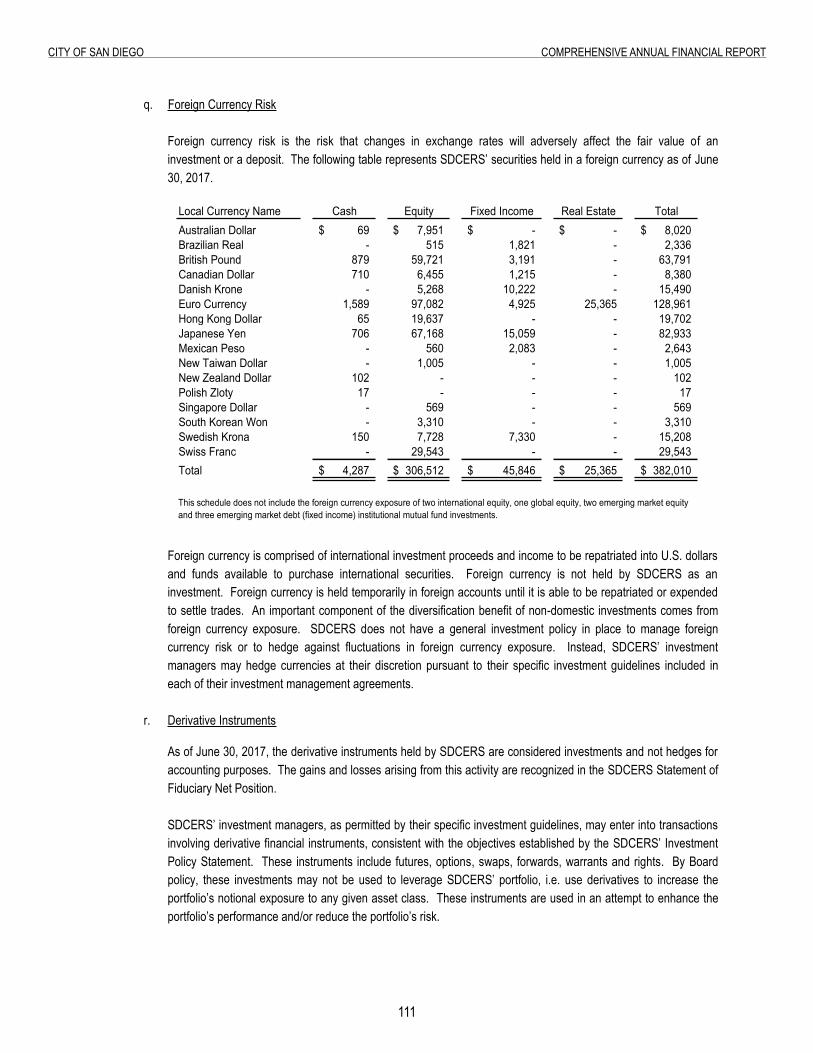
111
City of San Diego ComprehenSive annual finanCial report
q. Foreign Currency Risk
Foreign currency risk is the risk that changes in exchange rates will adversely affect the fair value of an investment or a deposit. The following table represents SDCERS’ securities held in a foreign currency as of June 30, 2017.
Local Currency Name Cash Equity Fixed Income Real Estate TotalAustralian Dollar 69$ 7,951$ -$ -$ 8,020$ Brazilian Real - 515 1,821 - 2,336 British Pound 879 59,721 3,191 - 63,791 Canadian Dollar 710 6,455 1,215 - 8,380 Danish Krone - 5,268 10,222 - 15,490 Euro Currency 1,589 97,082 4,925 25,365 128,961 Hong Kong Dollar 65 19,637 - - 19,702 Japanese Yen 706 67,168 15,059 - 82,933 Mexican Peso - 560 2,083 - 2,643 New Taiwan Dollar - 1,005 - - 1,005 New Zealand Dollar 102 - - - 102 Polish Zloty 17 - - - 17 Singapore Dollar - 569 - - 569 South Korean Won - 3,310 - - 3,310 Swedish Krona 150 7,728 7,330 - 15,208 Swiss Franc - 29,543 - - 29,543 Total 4,287$ 306,512$ 45,846$ 25,365$ 382,010$
This schedule does not include the foreign currency exposure of two international equity, one global equity, two emerging market equity and three emerging market debt (fixed income) institutional mutual fund investments.
Foreign currency is comprised of international investment proceeds and income to be repatriated into U.S. dollars and funds available to purchase international securities. Foreign currency is not held by SDCERS as an investment. Foreign currency is held temporarily in foreign accounts until it is able to be repatriated or expended to settle trades. An important component of the diversification benefit of non-domestic investments comes from foreign currency exposure. SDCERS does not have a general investment policy in place to manage foreign currency risk or to hedge against fluctuations in foreign currency exposure. Instead, SDCERS’ investment managers may hedge currencies at their discretion pursuant to their specific investment guidelines included in each of their investment management agreements.
r. Derivative Instruments
As of June 30, 2017, the derivative instruments held by SDCERS are considered investments and not hedges for accounting purposes. The gains and losses arising from this activity are recognized in the SDCERS Statement of Fiduciary Net Position.
SDCERS’ investment managers, as permitted by their specific investment guidelines, may enter into transactions involving derivative financial instruments, consistent with the objectives established by the SDCERS’ Investment Policy Statement. These instruments include futures, options, swaps, forwards, warrants and rights. By Board policy, these investments may not be used to leverage SDCERS’ portfolio, i.e. use derivatives to increase the portfolio’s notional exposure to any given asset class. These instruments are used in an attempt to enhance the portfolio’s performance and/or reduce the portfolio’s risk.
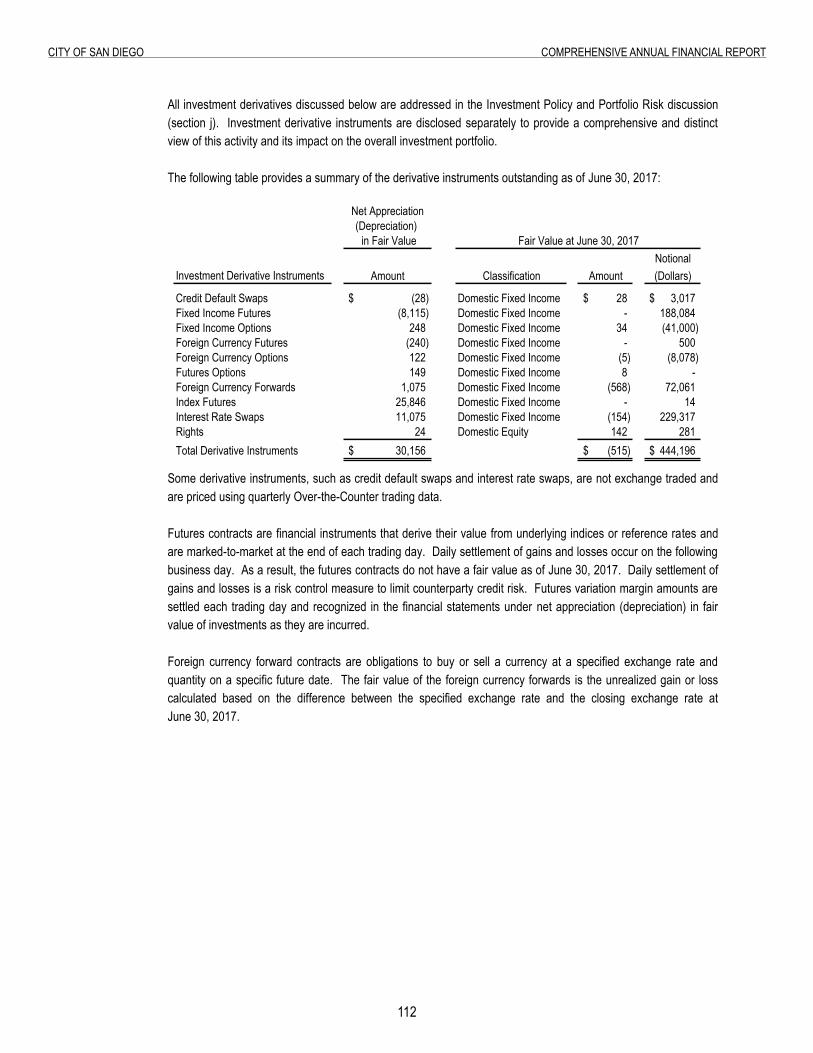
112
City of San Diego ComprehenSive annual finanCial report
All investment derivatives discussed below are addressed in the Investment Policy and Portfolio Risk discussion (section j). Investment derivative instruments are disclosed separately to provide a comprehensive and distinct view of this activity and its impact on the overall investment portfolio. The following table provides a summary of the derivative instruments outstanding as of June 30, 2017:
Net Appreciation(Depreciation) in Fair Value
NotionalInvestment Derivative Instruments Amount Classification Amount (Dollars)
Credit Default Swaps (28)$ Domestic Fixed Income 28$ 3,017$ Fixed Income Futures (8,115) Domestic Fixed Income - 188,084 Fixed Income Options 248 Domestic Fixed Income 34 (41,000) Foreign Currency Futures (240) Domestic Fixed Income - 500 Foreign Currency Options 122 Domestic Fixed Income (5) (8,078) Futures Options 149 Domestic Fixed Income 8 - Foreign Currency Forwards 1,075 Domestic Fixed Income (568) 72,061 Index Futures 25,846 Domestic Fixed Income - 14 Interest Rate Swaps 11,075 Domestic Fixed Income (154) 229,317 Rights 24 Domestic Equity 142 281 Total Derivative Instruments 30,156$ (515)$ 444,196$
Fair Value at June 30, 2017
Some derivative instruments, such as credit default swaps and interest rate swaps, are not exchange traded and are priced using quarterly Over-the-Counter trading data.
Futures contracts are financial instruments that derive their value from underlying indices or reference rates and
are marked-to-market at the end of each trading day. Daily settlement of gains and losses occur on the following business day. As a result, the futures contracts do not have a fair value as of June 30, 2017. Daily settlement of gains and losses is a risk control measure to limit counterparty credit risk. Futures variation margin amounts are settled each trading day and recognized in the financial statements under net appreciation (depreciation) in fair value of investments as they are incurred.
Foreign currency forward contracts are obligations to buy or sell a currency at a specified exchange rate and
quantity on a specific future date. The fair value of the foreign currency forwards is the unrealized gain or loss calculated based on the difference between the specified exchange rate and the closing exchange rate at June 30, 2017.
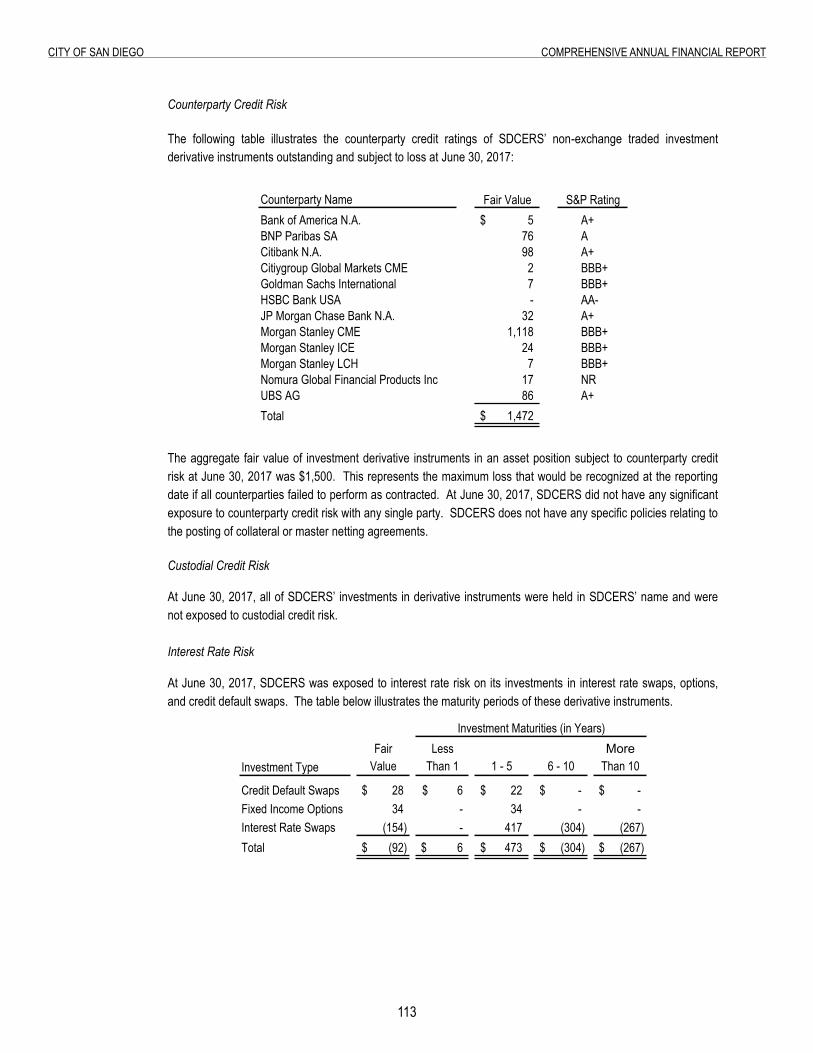
113
City of San Diego ComprehenSive annual finanCial report
Counterparty Credit Risk
The following table illustrates the counterparty credit ratings of SDCERS’ non-exchange traded investment derivative instruments outstanding and subject to loss at June 30, 2017:
Counterparty Name Fair Value S&P RatingBank of America N.A. 5$ A+BNP Paribas SA 76 ACitibank N.A. 98 A+Citiygroup Global Markets CME 2 BBB+Goldman Sachs International 7 BBB+HSBC Bank USA - AA-JP Morgan Chase Bank N.A. 32 A+Morgan Stanley CME 1,118 BBB+Morgan Stanley ICE 24 BBB+Morgan Stanley LCH 7 BBB+Nomura Global Financial Products Inc 17 NRUBS AG 86 A+Total 1,472$
The aggregate fair value of investment derivative instruments in an asset position subject to counterparty credit risk at June 30, 2017 was $1,500. This represents the maximum loss that would be recognized at the reporting date if all counterparties failed to perform as contracted. At June 30, 2017, SDCERS did not have any significant exposure to counterparty credit risk with any single party. SDCERS does not have any specific policies relating to the posting of collateral or master netting agreements.
Custodial Credit Risk
At June 30, 2017, all of SDCERS’ investments in derivative instruments were held in SDCERS’ name and were not exposed to custodial credit risk. Interest Rate Risk
At June 30, 2017, SDCERS was exposed to interest rate risk on its investments in interest rate swaps, options, and credit default swaps. The table below illustrates the maturity periods of these derivative instruments.
Fair Less MoreInvestment Type Value Than 1 1 - 5 6 - 10 Than 10
Credit Default Swaps 28$ 6$ 22$ -$ -$ Fixed Income Options 34 - 34 - - Interest Rate Swaps (154) - 417 (304) (267) Total (92)$ 6$ 473$ (304)$ (267)$
Investment Maturities (in Years)
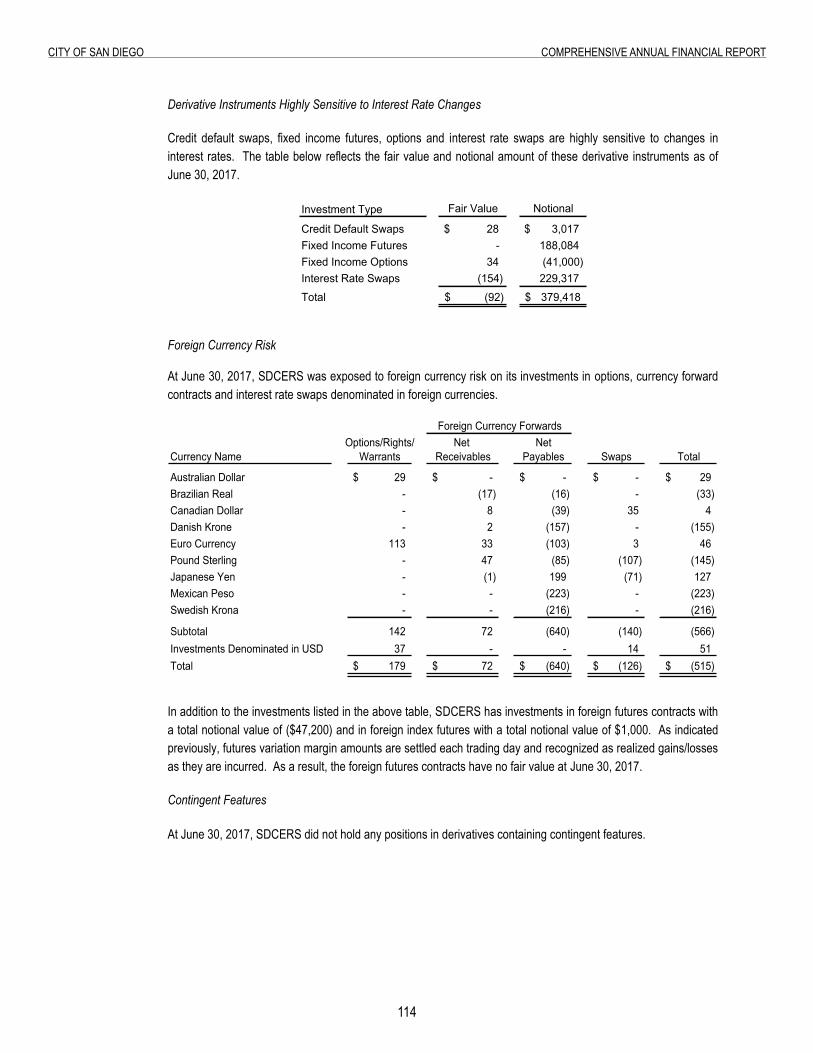
11�
City of San Diego ComprehenSive annual finanCial report
Derivative Instruments Highly Sensitive to Interest Rate Changes
Credit default swaps, fixed income futures, options and interest rate swaps are highly sensitive to changes in interest rates. The table below reflects the fair value and notional amount of these derivative instruments as of June 30, 2017.
Investment Type Fair Value Notional
Credit Default Swaps $ 28 $ 3,017 Fixed Income Futures - 188,084 Fixed Income Options 34 (41,000)Interest Rate Swaps (154) 229,317 Total (92)$ 379,418$
Foreign Currency Risk
At June 30, 2017, SDCERS was exposed to foreign currency risk on its investments in options, currency forward contracts and interest rate swaps denominated in foreign currencies.
Options/Rights/ Net NetCurrency Name Warrants Receivables Payables Swaps Total
Australian Dollar 29$ -$ -$ -$ 29$ Brazilian Real - (17) (16) - (33) Canadian Dollar - 8 (39) 35 4 Danish Krone - 2 (157) - (155) Euro Currency 113 33 (103) 3 46 Pound Sterling - 47 (85) (107) (145) Japanese Yen - (1) 199 (71) 127 Mexican Peso - - (223) - (223) Swedish Krona - - (216) - (216)
Subtotal 142 72 (640) (140) (566) Investments Denominated in USD 37 - - 14 51 Total 179$ 72$ (640)$ (126)$ (515)$
Foreign Currency Forwards
In addition to the investments listed in the above table, SDCERS has investments in foreign futures contracts with a total notional value of ($47,200) and in foreign index futures with a total notional value of $1,000. As indicated previously, futures variation margin amounts are settled each trading day and recognized as realized gains/losses as they are incurred. As a result, the foreign futures contracts have no fair value at June 30, 2017.
Contingent Features
At June 30, 2017, SDCERS did not hold any positions in derivatives containing contingent features.
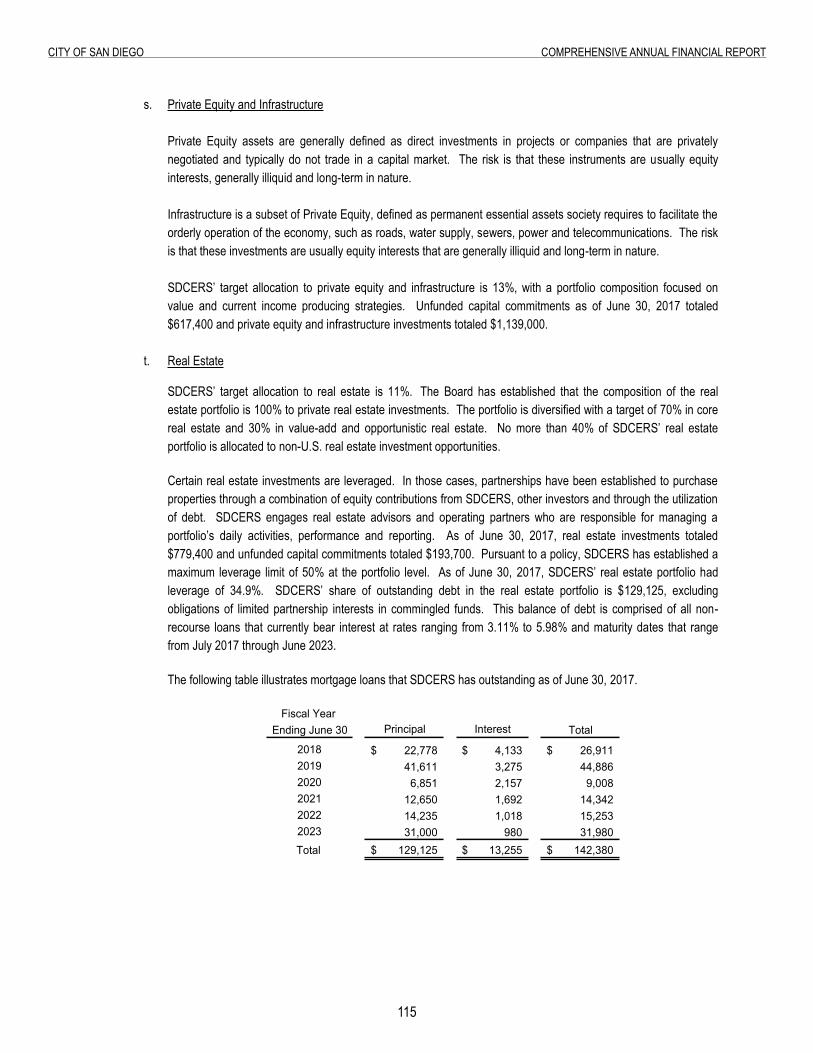
115
City of San Diego ComprehenSive annual finanCial report
s. Private Equity and Infrastructure Private Equity assets are generally defined as direct investments in projects or companies that are privately
negotiated and typically do not trade in a capital market. The risk is that these instruments are usually equity interests, generally illiquid and long-term in nature.
Infrastructure is a subset of Private Equity, defined as permanent essential assets society requires to facilitate the
orderly operation of the economy, such as roads, water supply, sewers, power and telecommunications. The risk is that these investments are usually equity interests that are generally illiquid and long-term in nature.
SDCERS’ target allocation to private equity and infrastructure is 13%, with a portfolio composition focused on
value and current income producing strategies. Unfunded capital commitments as of June 30, 2017 totaled $617,400 and private equity and infrastructure investments totaled $1,139,000.
t. Real Estate SDCERS’ target allocation to real estate is 11%. The Board has established that the composition of the real
estate portfolio is 100% to private real estate investments. The portfolio is diversified with a target of 70% in core real estate and 30% in value-add and opportunistic real estate. No more than 40% of SDCERS’ real estate portfolio is allocated to non-U.S. real estate investment opportunities.
Certain real estate investments are leveraged. In those cases, partnerships have been established to purchase properties through a combination of equity contributions from SDCERS, other investors and through the utilization of debt. SDCERS engages real estate advisors and operating partners who are responsible for managing a portfolio’s daily activities, performance and reporting. As of June 30, 2017, real estate investments totaled $779,400 and unfunded capital commitments totaled $193,700. Pursuant to a policy, SDCERS has established a maximum leverage limit of 50% at the portfolio level. As of June 30, 2017, SDCERS’ real estate portfolio had leverage of 34.9%. SDCERS’ share of outstanding debt in the real estate portfolio is $129,125, excluding obligations of limited partnership interests in commingled funds. This balance of debt is comprised of all non-recourse loans that currently bear interest at rates ranging from 3.11% to 5.98% and maturity dates that range from July 2017 through June 2023.
The following table illustrates mortgage loans that SDCERS has outstanding as of June 30, 2017.
Fiscal Year Ending June 30 Principal Interest Total
2018 22,778$ 4,133$ 26,911$ 2019 41,611 3,275 44,886 2020 6,851 2,157 9,008 2021 12,650 1,692 14,342 2022 14,235 1,018 15,253 2023 31,000 980 31,980 Total 129,125$ 13,255$ 142,380$
116
City of San Diego ComprehenSive annual finanCial report
u. Securities Lending
SDCERS has entered into an agreement with State Street, its custodial bank, to lend domestic and international equity and fixed income securities to broker-dealers and banks in exchange for pledged collateral that will be returned for the same securities plus a fee in the future. All securities loans can be terminated on demand by either the lender or the borrower.
State Street manages SDCERS’ securities lending program and receives cash and/or securities as collateral.
Borrowers are required to deliver collateral for each loan equal to at least 102% for domestic loans and 105% for international loans. State Street does not have the ability to pledge or sell collateral securities delivered absent a borrower default. During fiscal year 2017, SDCERS had no credit risk exposure to borrowers because the amounts provided to State Street on behalf of SDCERS, in the form of collateral plus accrued interest, exceeded the amounts broker-dealers and banks owed to State Street on behalf of SDCERS for securities borrowed. State Street has indemnified SDCERS by agreeing to purchase replacement securities or return cash collateral if a borrower fails to return or pay distributions on a loaned security. SDCERS incurred no losses during the fiscal year resulting from any reported default of the borrowers or State Street. Non-cash collateral (securities and letters of credit) are not reported in SDCERS’ financial statements.
When lending its securities on a fully collateralized basis, SDCERS may encounter various risks related to securities lending agreements. These risks include operational risk, borrower or counterparty default risk, and collateral reinvestment risk. State Street is required to maintain its securities lending program in compliance with applicable laws of the United States and all countries in which lending activities take place, as well as all rules, regulations, and exemptions from time to time promulgated and issued under the authority of those laws. As of June 30, 2017, securities on loan collateralized by cash had a fair value of $83,400 and SDCERS received cash collateral of $85,200, which was reported as securities lending obligations in the accompanying Statement of Fiduciary Net Position. The collateral value exceeds the fair value of the securities on loan because borrowers are required to deliver collateral for each loan up to 102% for domestic loans and 105% for international loans. As of June 30, 2017, securities on loan collateralized by securities, irrevocable letters of credit, or tri-party collateral had a fair value of $184,500 and a collateral value of $198,900, which were not reported as assets or liabilities in the accompanying Statement of Fiduciary Net Position. The total collateral pledged to SDCERS at June 30, 2017 for its securities lending activities was $284,100.
SDCERS and the borrowers maintain the right to terminate securities lending transactions upon notice. The cash
collateral received for lent securities was invested by State Street, together with the cash collateral of other qualified tax-exempt plan lenders, in a collective investment fund, or collateral pool. State Street maintains two collateral pools: a liquidity pool and a duration pool. As of June 30, 2017, these collateral pools were not rated by the NRSROs.
As of June 30, 2017, SDCERS had $82,400 invested in the Quality D liquidity collateral pool, which had an
average duration of 29 days and an average weighted final maturity of 108 days. SDCERS had $2,800 invested in the Quality D duration pool, which had an average duration of 23 days and an average weighted final maturity of 3,187 days. Duration is the weighted time average until cash flows are received in the collateral pool, and is measured in days. Alternatively, the weighted average final maturity measures when all final maturities in the portfolio will occur. The duration of the investments made with cash collateral does not generally match the duration of the loans. This is because the loans are terminable at any time by SDCERS or the borrower.
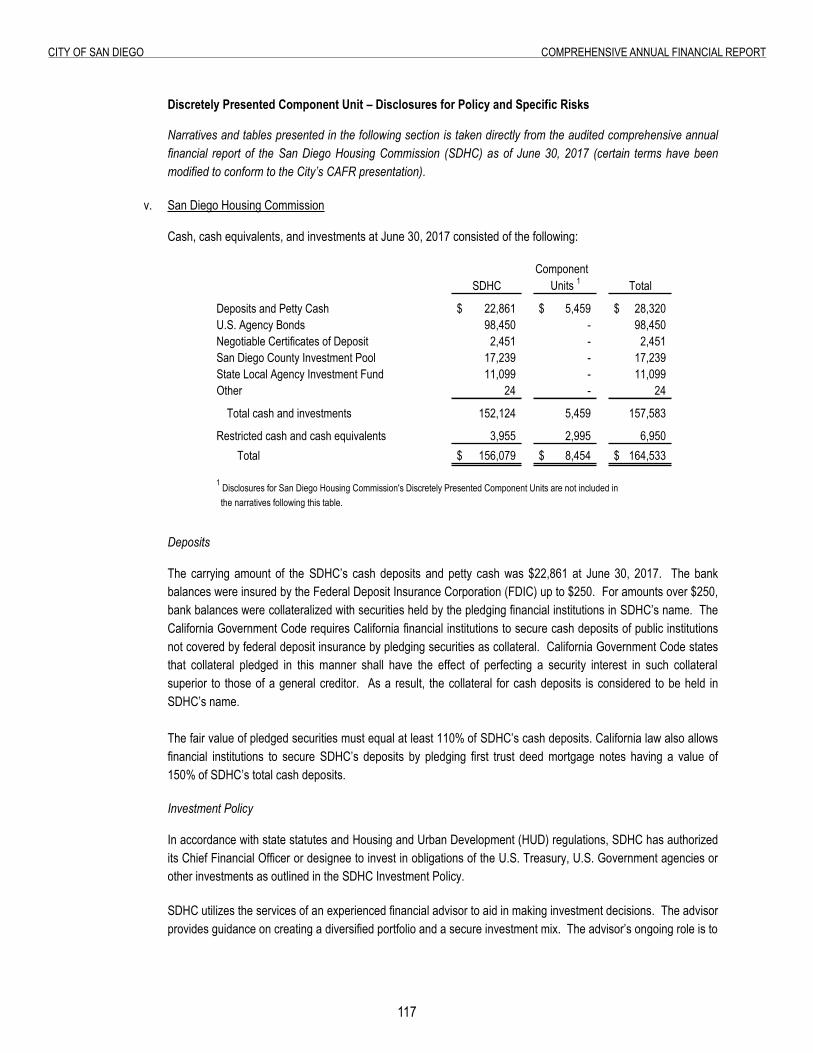
117
City of San Diego ComprehenSive annual finanCial report
Discretely Presented Component Unit – Disclosures for Policy and Specific Risks Narratives and tables presented in the following section is taken directly from the audited comprehensive annual
financial report of the San Diego Housing Commission (SDHC) as of June 30, 2017 (certain terms have been modified to conform to the City’s CAFR presentation).
v. San Diego Housing Commission
Cash, cash equivalents, and investments at June 30, 2017 consisted of the following:
ComponentSDHC Units 1 Total
Deposits and Petty Cash 22,861$ 5,459$ 28,320$ U.S. Agency Bonds 98,450 - 98,450 Negotiable Certificates of Deposit 2,451 - 2,451 San Diego County Investment Pool 17,239 - 17,239 State Local Agency Investment Fund 11,099 - 11,099 Other 24 - 24
Total cash and investments 152,124 5,459 157,583
Restricted cash and cash equivalents 3,955 2,995 6,950 Total 156,079$ 8,454$ 164,533$
the narratives following this table.
1 Disclosures for San Diego Housing Commission's Discretely Presented Component Units are not included in
Deposits
The carrying amount of the SDHC’s cash deposits and petty cash was $22,861 at June 30, 2017. The bank balances were insured by the Federal Deposit Insurance Corporation (FDIC) up to $250. For amounts over $250, bank balances were collateralized with securities held by the pledging financial institutions in SDHC’s name. The California Government Code requires California financial institutions to secure cash deposits of public institutions not covered by federal deposit insurance by pledging securities as collateral. California Government Code states that collateral pledged in this manner shall have the effect of perfecting a security interest in such collateral superior to those of a general creditor. As a result, the collateral for cash deposits is considered to be held in SDHC’s name.
The fair value of pledged securities must equal at least 110% of SDHC’s cash deposits. California law also allows
financial institutions to secure SDHC’s deposits by pledging first trust deed mortgage notes having a value of 150% of SDHC’s total cash deposits.
Investment Policy
In accordance with state statutes and Housing and Urban Development (HUD) regulations, SDHC has authorized its Chief Financial Officer or designee to invest in obligations of the U.S. Treasury, U.S. Government agencies or other investments as outlined in the SDHC Investment Policy.
SDHC utilizes the services of an experienced financial advisor to aid in making investment decisions. The advisor provides guidance on creating a diversified portfolio and a secure investment mix. The advisor’s ongoing role is to
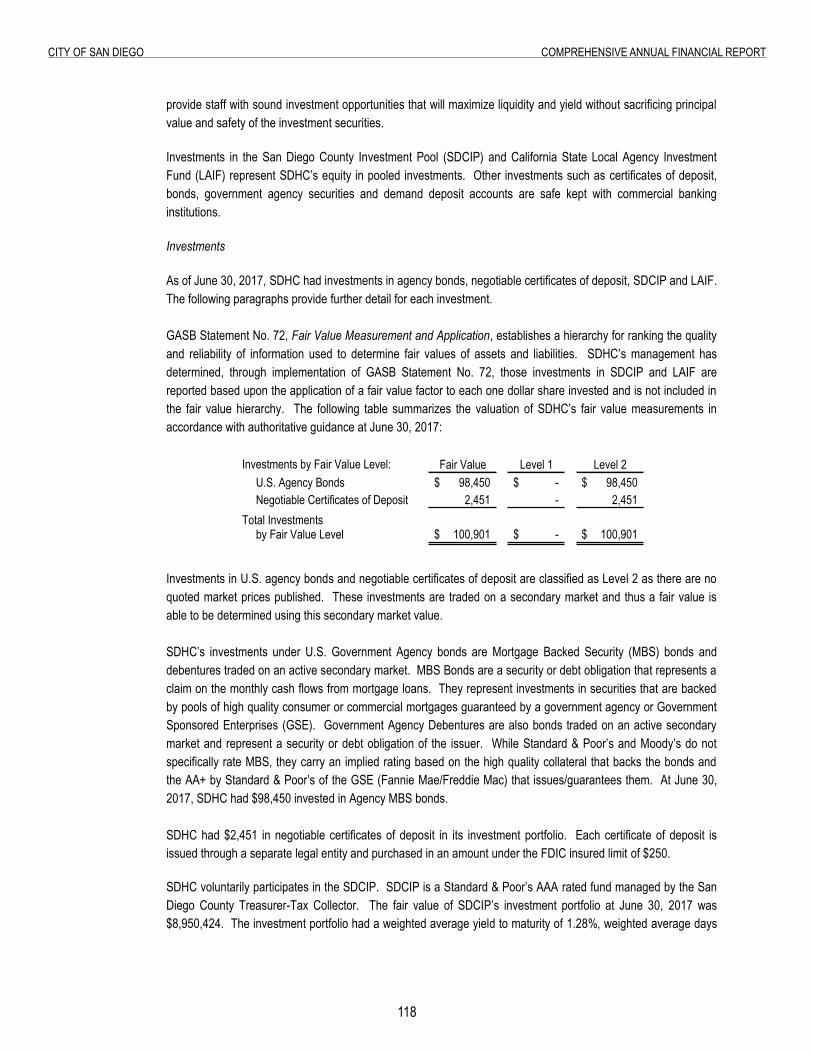
118
City of San Diego ComprehenSive annual finanCial report
provide staff with sound investment opportunities that will maximize liquidity and yield without sacrificing principal value and safety of the investment securities.
Investments in the San Diego County Investment Pool (SDCIP) and California State Local Agency Investment Fund (LAIF) represent SDHC’s equity in pooled investments. Other investments such as certificates of deposit, bonds, government agency securities and demand deposit accounts are safe kept with commercial banking institutions.
Investments
As of June 30, 2017, SDHC had investments in agency bonds, negotiable certificates of deposit, SDCIP and LAIF. The following paragraphs provide further detail for each investment.
GASB Statement No. 72, Fair Value Measurement and Application, establishes a hierarchy for ranking the quality and reliability of information used to determine fair values of assets and liabilities. SDHC’s management has determined, through implementation of GASB Statement No. 72, those investments in SDCIP and LAIF are reported based upon the application of a fair value factor to each one dollar share invested and is not included in the fair value hierarchy. The following table summarizes the valuation of SDHC’s fair value measurements in accordance with authoritative guidance at June 30, 2017:
Investments by Fair Value Level: Fair Value Level 1 Level 2
U.S. Agency Bonds 98,450$ -$ 98,450$ Negotiable Certificates of Deposit 2,451 - 2,451
Total Investmentsby Fair Value Level 100,901$ -$ 100,901$
Investments in U.S. agency bonds and negotiable certificates of deposit are classified as Level 2 as there are no quoted market prices published. These investments are traded on a secondary market and thus a fair value is able to be determined using this secondary market value. SDHC’s investments under U.S. Government Agency bonds are Mortgage Backed Security (MBS) bonds and debentures traded on an active secondary market. MBS Bonds are a security or debt obligation that represents a claim on the monthly cash flows from mortgage loans. They represent investments in securities that are backed by pools of high quality consumer or commercial mortgages guaranteed by a government agency or Government Sponsored Enterprises (GSE). Government Agency Debentures are also bonds traded on an active secondary market and represent a security or debt obligation of the issuer. While Standard & Poor’s and Moody’s do not specifically rate MBS, they carry an implied rating based on the high quality collateral that backs the bonds and the AA+ by Standard & Poor’s of the GSE (Fannie Mae/Freddie Mac) that issues/guarantees them. At June 30, 2017, SDHC had $98,450 invested in Agency MBS bonds.
SDHC had $2,451 in negotiable certificates of deposit in its investment portfolio. Each certificate of deposit is issued through a separate legal entity and purchased in an amount under the FDIC insured limit of $250.
SDHC voluntarily participates in the SDCIP. SDCIP is a Standard & Poor’s AAA rated fund managed by the San Diego County Treasurer-Tax Collector. The fair value of SDCIP’s investment portfolio at June 30, 2017 was $8,950,424. The investment portfolio had a weighted average yield to maturity of 1.28%, weighted average days
119
City of San Diego ComprehenSive annual finanCial report
to maturity of 417 days and an effective duration of 1.02 years. As of June 30, 2017, SDHC had $17,239 invested in SDCIP.
In addition to SDCIP, SDHC participates in the State’s LAIF. LAIF is part of the State of California Pooled Money Investment Account (PMIA) and is protected by statute ensuring invested funds remain SDHC’s assets. PMIA is not registered with the SEC but is required to invest in accordance with California State Code. As of June 30, 2017, the average maturity of PMIA investments was 194 days and the balance of the investment portfolio of PMIA was $77,539,516. SDHC had $11,099 invested with LAIF as of June 30, 2017.
Investment Risk Factors
SDHC’s investment policy allows the agency to invest surplus funds in accordance with the provisions of HUD Notice PIH 96 – 33 and California Government Code Sections 5922 and 53601. The investment policy’s foremost objective is the safety of principal, which is achieved by mitigating credit risk and interest rate risk. These risks, along with custodial risk, concentration of credit risk and market risk, all affect the value of investments to a varying degree. Equity and debt securities respond to such factors as economic conditions, individual company earnings performance and market liquidity, while fixed income securities are particularly sensitive to credit risk and changes in interest rates.
Market Risk
Market risk is the risk that the value of an investment will change due to changes in the financial market. Changes in market conditions can increase Interest Rate Risk, Liquidity Risk and Reinvestment Risk.
Interest Rate Risk is the risk associated with declines or rises in interest rates, which cause an investment in a fixed-income security to increase or decrease in value. The terms of a debt investment may cause its fair value to be highly sensitive to interest rate changes. SDHC does not have a formal policy related to interest rate risk.
Liquidity Risk is the risk of being unable to liquidate an investment prior to maturity. Related to liquidity risk is the concept of marketability, or the ability to sell an instrument on short notice without incurring a meaningful loss in price.
Reinvestment Risk is the risk that the proceeds from a fixed income security cannot be reinvested at the same rate of return currently generated by that holding. This risk is common with securities that are callable.
In accordance with its investment policy, SDHC manages market risk by matching portfolio maturities to projected liabilities and monitoring the weighted average maturity of its portfolio. This is done by maintaining a portion of the portfolio in readily available funds and investing in securities with limited call features and an active secondary market. These measures ensure that appropriate liquidity is maintained in order to meet ongoing operations, maximize return and limit exposure to changing market conditions.
120
City of San Diego ComprehenSive annual finanCial report
SDHC’s exposure to interest rate risk as of June 30, 2017 is as follows:
Less Than 4-12 1-5 Total3 Months Months Years Fair Value
Cash and Cash Equivalents 1
Deposits 22,849$ -$ -$ 22,849$ Petty Cash 12 - - 12 Restricted Cash and Cash Equivalents 3,955 - - 3,955
Total Cash and Cash Equivalents 26,816 - - 26,816
Short-Term InvestmentsU.S. Agency Bonds 235 18,160 - 18,395 Negotiable Certificates of Deposit 490 491 - 981 Other 24 - - 24 San Diego County Investment Pool - - 17,239 17,239 State Local Agency Investment Fund - 11,099 - 11,099
Total Short-Term Investments 749 29,750 17,239 47,738
Long-Term InvestmentsU.S. Agency Bonds - - 80,055 80,055 Negotiable Certificates of Deposit - - 1,470 1,470
Total Long-Term Investments - - 81,525 81,525
Total Cash, Cash Equivalents, and Investments 27,565$ 29,750$ 98,764$ 156,079$ 1 Cash and Cash Equivalents do not have maturities.
Maturities as of June 30, 2017
Credit Risk
Fixed income securities are subject to credit risk, which is the risk that an issuer will fail to pay interest or principal in a timely manner or that negative perceptions of the issuer’s ability to make these payments will cause security prices to decline. Certain fixed income securities, including obligations of the U.S. Government or those explicitly guaranteed by the U.S. Government are considered to have minimal credit risk. SDHC minimizes credit risk by limiting investments to those listed in the investment policy. In addition, SDHC pre-qualifies the financial institutions, broker/dealers, intermediaries, and advisors with which SDHC will do business in accordance with the investment policy. SDHC diversifies the investment portfolio to minimize potential losses from any one type of security or issuer.
Concentration of Credit Risk
Concentration of credit risk is the risk associated with a lack of diversification, such as having substantial investments in a few individual issuers, thereby exposing SDHC to greater risks resulting from adverse economic, political, regulatory, geographic, or credit developments. Investments issued or guaranteed by the U.S. government and investments in external investment pools such as LAIF and SDCIP are not considered subject to concentration of credit risk.
121
City of San Diego ComprehenSive annual finanCial report
Custodial Credit Risk
Custodial credit risk is the risk that, in the event of the failure of the custodian, the investments may not be returned. All bonds are purchased through SDHC’s primary financial institution’s clearing account in SDHC’s name where all securities are held in safekeeping.
The exposure of SDHC’s debt securities to credit risk as of June 30, 2017 is as follows:
Standard & Poor's Credit
RatingRating Not
AAA ProvidedShort-Term Investments
U.S. Agency Bonds 1 -$ 18,395$ 18,395$ Negotiable Certificates of Deposit - 981 981 San Diego County Investment Pool 17,239 - 17,239 State Local Agency Investment Fund - 11,099 11,099 Other 24 - 24
Total Short-Term Investments 17,263 30,475 47,738
Long-Term InvestmentsU.S. Agency Bonds 1 - 80,055 80,055 Negotiable Certificates of Deposit - 1,470 1,470
Total Long-Term Investments - 81,525 81,525
Total Investments 17,263$ 112,000$ 129,263$
1 As of June 30, 2017, SDHC exceeded the 5% limit of total investments for issuers of various U.S. Agency Bonds.
Total Fair Value
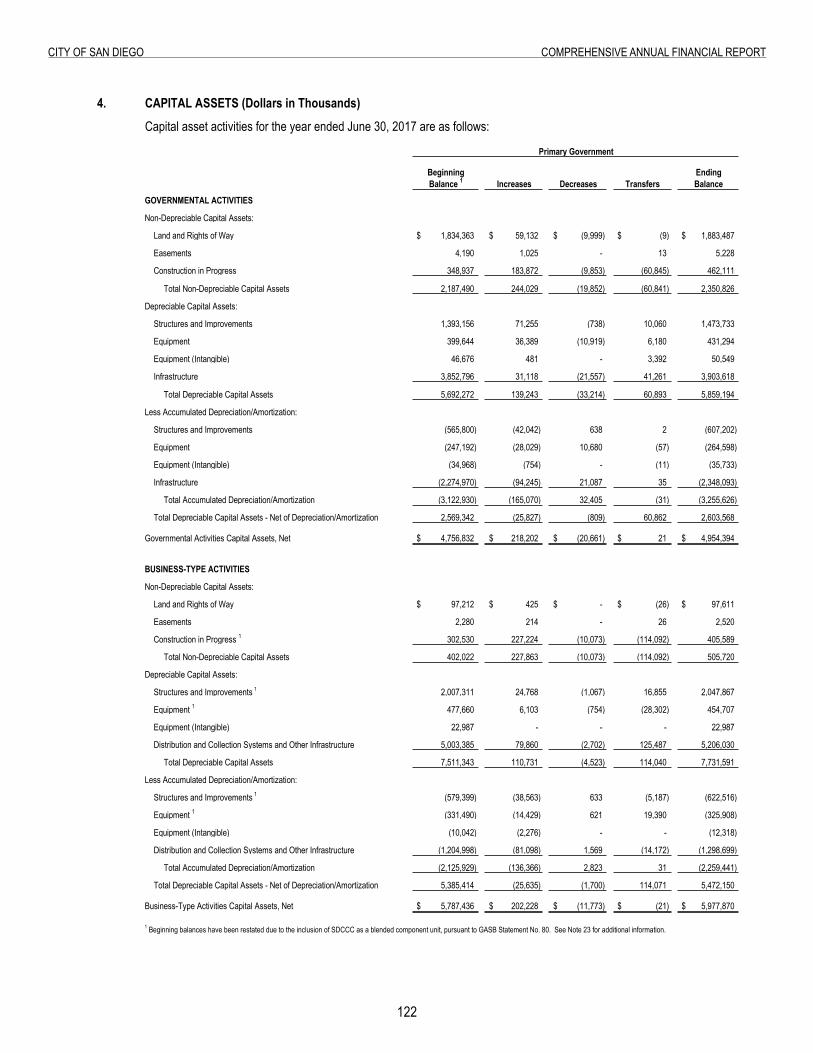
122
City of San Diego ComprehenSive annual finanCial report
�. Capital assets
4. CAPITAL ASSETS (Dollars in Thousands) Capital asset activities for the year ended June 30, 2017 are as follows:
Primary Government
Beginning EndingBalance 1 Increases Decreases Transfers Balance
GOVERNMENTAL ACTIVITIES
Non-Depreciable Capital Assets:
Land and Rights of Way 1,834,363$ 59,132$ (9,999)$ (9)$ 1,883,487$
Easements 4,190 1,025 - 13 5,228
Construction in Progress 348,937 183,872 (9,853) (60,845) 462,111
Total Non-Depreciable Capital Assets 2,187,490 244,029 (19,852) (60,841) 2,350,826
Depreciable Capital Assets:
Structures and Improvements 1,393,156 71,255 (738) 10,060 1,473,733
Equipment 399,644 36,389 (10,919) 6,180 431,294
Equipment (Intangible) 46,676 481 - 3,392 50,549
Infrastructure 3,852,796 31,118 (21,557) 41,261 3,903,618
Total Depreciable Capital Assets 5,692,272 139,243 (33,214) 60,893 5,859,194
Less Accumulated Depreciation/Amortization:
Structures and Improvements (565,800) (42,042) 638 2 (607,202)
Equipment (247,192) (28,029) 10,680 (57) (264,598)
Equipment (Intangible) (34,968) (754) - (11) (35,733)
Infrastructure (2,274,970) (94,245) 21,087 35 (2,348,093)
Total Accumulated Depreciation/Amortization (3,122,930) (165,070) 32,405 (31) (3,255,626)
Total Depreciable Capital Assets - Net of Depreciation/Amortization 2,569,342 (25,827) (809) 60,862 2,603,568
Governmental Activities Capital Assets, Net 4,756,832$ 218,202$ (20,661)$ 21$ 4,954,394$
BUSINESS-TYPE ACTIVITIES
Non-Depreciable Capital Assets:
Land and Rights of Way 97,212$ 425$ -$ (26)$ 97,611$
Easements 2,280 214 - 26 2,520
Construction in Progress 1 302,530 227,224 (10,073) (114,092) 405,589
Total Non-Depreciable Capital Assets 402,022 227,863 (10,073) (114,092) 505,720
Depreciable Capital Assets:
Structures and Improvements 1 2,007,311 24,768 (1,067) 16,855 2,047,867
Equipment 1 477,660 6,103 (754) (28,302) 454,707
Equipment (Intangible) 22,987 - - - 22,987
Distribution and Collection Systems and Other Infrastructure 5,003,385 79,860 (2,702) 125,487 5,206,030
Total Depreciable Capital Assets 7,511,343 110,731 (4,523) 114,040 7,731,591
Less Accumulated Depreciation/Amortization:
Structures and Improvements 1 (579,399) (38,563) 633 (5,187) (622,516)
Equipment 1 (331,490) (14,429) 621 19,390 (325,908)
Equipment (Intangible) (10,042) (2,276) - - (12,318)
Distribution and Collection Systems and Other Infrastructure (1,204,998) (81,098) 1,569 (14,172) (1,298,699)
Total Accumulated Depreciation/Amortization (2,125,929) (136,366) 2,823 31 (2,259,441)
Total Depreciable Capital Assets - Net of Depreciation/Amortization 5,385,414 (25,635) (1,700) 114,071 5,472,150
Business-Type Activities Capital Assets, Net 5,787,436$ 202,228$ (11,773)$ (21)$ 5,977,870$ - -
1 Beginning balances have been restated due to the inclusion of SDCCC as a blended component unit, pursuant to GASB Statement No. 80. See Note 23 for additional information.
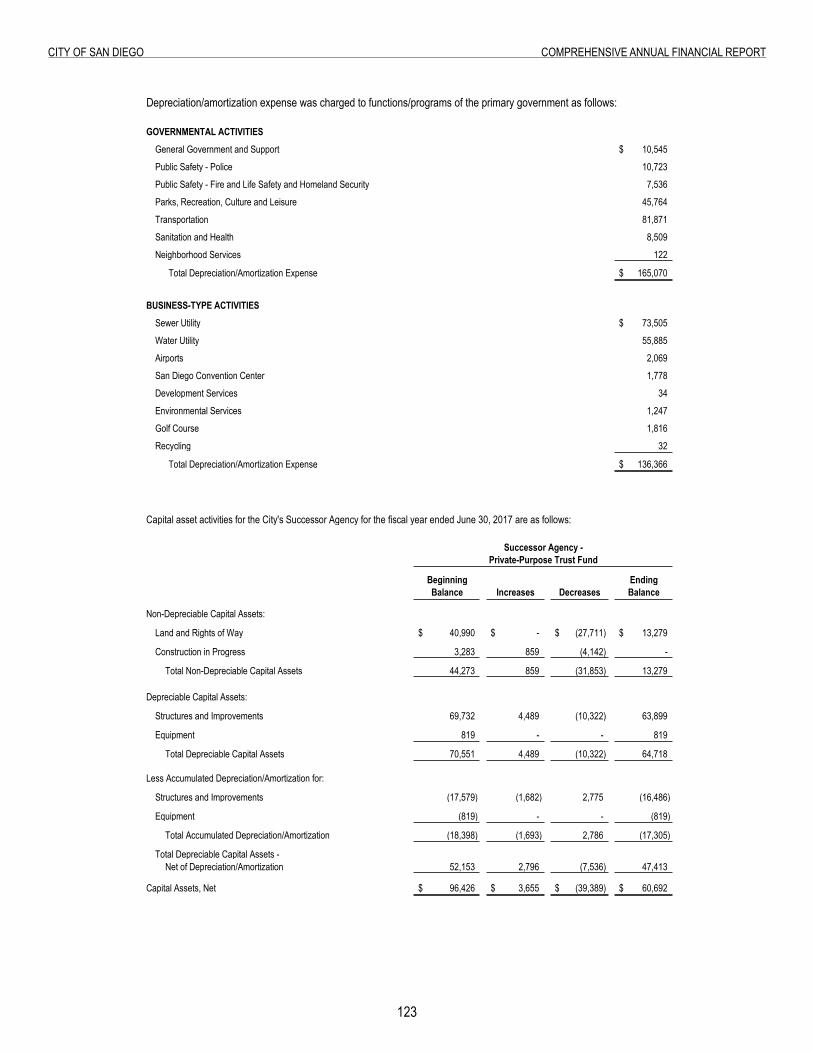
123
City of San Diego ComprehenSive annual finanCial report
Depreciation/amortization expense was charged to functions/programs of the primary government as follows:
GOVERNMENTAL ACTIVITIESGeneral Government and Support 10,545$
Public Safety - Police 10,723
Public Safety - Fire and Life Safety and Homeland Security 7,536
Parks, Recreation, Culture and Leisure 45,764
Transportation 81,871
Sanitation and Health 8,509
Neighborhood Services 122
Total Depreciation/Amortization Expense 165,070$ -
BUSINESS-TYPE ACTIVITIESSewer Utility 73,505$
Water Utility 55,885
Airports 2,069
San Diego Convention Center 1,778
Development Services 34
Environmental Services 1,247
Golf Course 1,816
Recycling 32
Total Depreciation/Amortization Expense 136,366$ -
Capital asset activities for the City's Successor Agency for the fiscal year ended June 30, 2017 are as follows:
Successor Agency -Private-Purpose Trust Fund
Beginning EndingBalance Increases Decreases Balance
Non-Depreciable Capital Assets:
Land and Rights of Way 40,990$ -$ (27,711)$ 13,279$
Construction in Progress 3,283 859 (4,142) -
Total Non-Depreciable Capital Assets 44,273 859 (31,853) 13,279
Depreciable Capital Assets:
Structures and Improvements 69,732 4,489 (10,322) 63,899
Equipment 819 - - 819
Total Depreciable Capital Assets 70,551 4,489 (10,322) 64,718
Less Accumulated Depreciation/Amortization for:
Structures and Improvements (17,579) (1,682) 2,775 (16,486)
Equipment (819) - - (819)
Total Accumulated Depreciation/Amortization (18,398) (1,693) 2,786 (17,305)
Total Depreciable Capital Assets - Net of Depreciation/Amortization 52,153 2,796 (7,536) 47,413
Capital Assets, Net 96,426$ 3,655$ (39,389)$ 60,692$
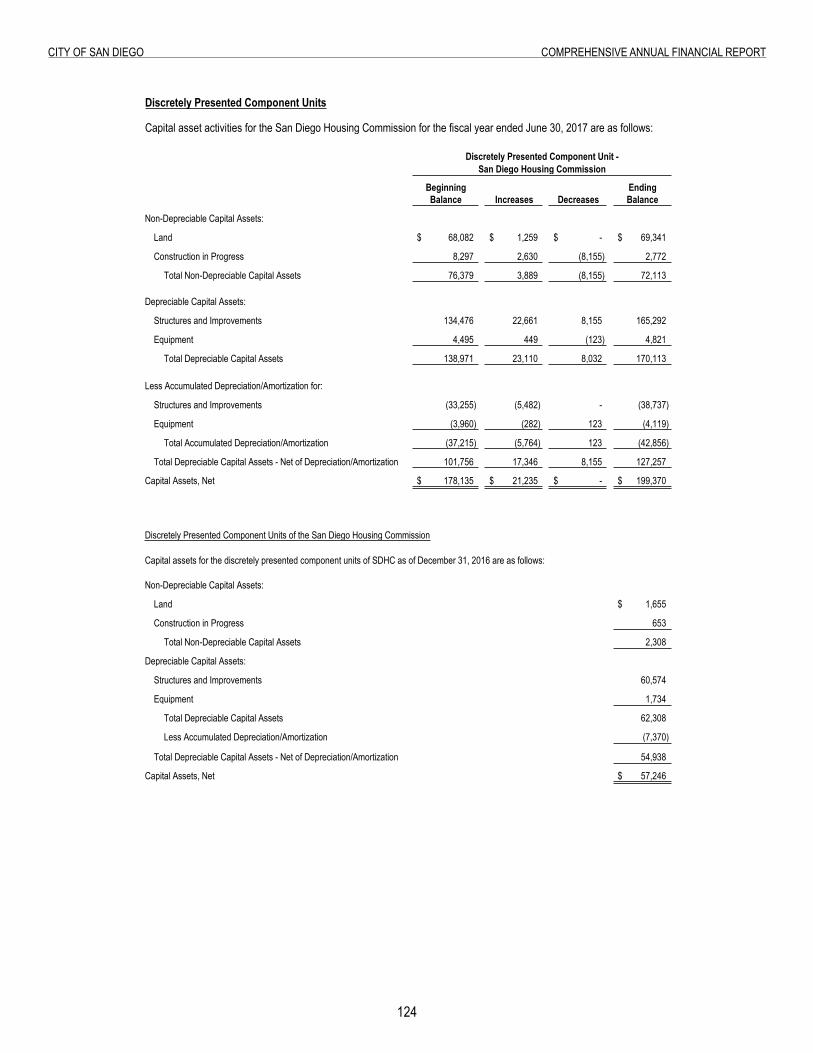
12�
City of San Diego ComprehenSive annual finanCial report
Discretely Presented Component Units
Capital asset activities for the San Diego Housing Commission for the fiscal year ended June 30, 2017 are as follows:
Discretely Presented Component Unit -San Diego Housing Commission
Beginning EndingBalance Increases Decreases Balance
Non-Depreciable Capital Assets:
Land 68,082$ 1,259$ -$ 69,341$
Construction in Progress 8,297 2,630 (8,155) 2,772
Total Non-Depreciable Capital Assets 76,379 3,889 (8,155) 72,113
Depreciable Capital Assets:
Structures and Improvements 134,476 22,661 8,155 165,292
Equipment 4,495 449 (123) 4,821
Total Depreciable Capital Assets 138,971 23,110 8,032 170,113
Less Accumulated Depreciation/Amortization for:
Structures and Improvements (33,255) (5,482) - (38,737)
Equipment (3,960) (282) 123 (4,119)
Total Accumulated Depreciation/Amortization (37,215) (5,764) 123 (42,856)
Total Depreciable Capital Assets - Net of Depreciation/Amortization 101,756 17,346 8,155 127,257
Capital Assets, Net 178,135$ 21,235$ -$ 199,370$
Discretely Presented Component Units of the San Diego Housing Commission
Capital assets for the discretely presented component units of SDHC as of December 31, 2016 are as follows:
Non-Depreciable Capital Assets:
Land 1,655$
Construction in Progress 653
Total Non-Depreciable Capital Assets 2,308
Depreciable Capital Assets:
Structures and Improvements 60,574
Equipment 1,734
Total Depreciable Capital Assets 62,308
Less Accumulated Depreciation/Amortization (7,370)
Total Depreciable Capital Assets - Net of Depreciation/Amortization 54,938
Capital Assets, Net 57,246$
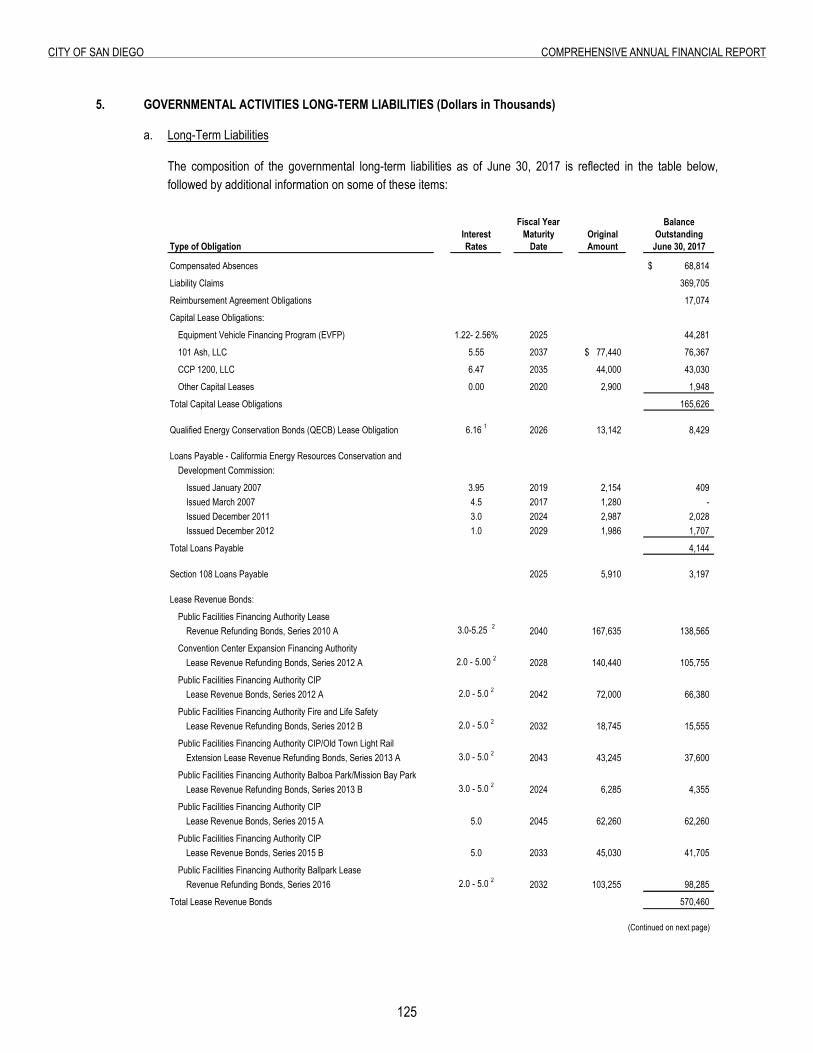
125
City of San Diego ComprehenSive annual finanCial report
5. Governmental Activities Long-
5. GOVERNMENTAL ACTIVITIES LONG-TERM LIABILITIES (Dollars in Thousands)
a. Long-Term Liabilities
The composition of the governmental long-term liabilities as of June 30, 2017 is reflected in the table below, followed by additional information on some of these items:
Fiscal Year BalanceInterest Maturity Original Outstanding
Type of Obligation Rates Date Amount June 30, 2017
Compensated Absences 68,814$
Liability Claims 369,705
Reimbursement Agreement Obligations 17,074
Capital Lease Obligations:
Equipment Vehicle Financing Program (EVFP) 1.22- 2.56% 2025 44,281
101 Ash, LLC 5.55 2037 77,440$ 76,367
CCP 1200, LLC 6.47 2035 44,000 43,030
Other Capital Leases 0.00 2020 2,900 1,948
Total Capital Lease Obligations 165,626
Qualified Energy Conservation Bonds (QECB) Lease Obligation 6.16 1 2026 13,142 8,429
Loans Payable - Califormia Energy Resources Conservation andDevelopment Commission:
Issued January 2007 3.95 2019 2,154 409 Issued March 2007 4.5 2017 1,280 - Issued December 2011 3.0 2024 2,987 2,028 Isssued December 2012 1.0 2029 1,986 1,707
Total Loans Payable 4,144
Section 108 Loans Payable 2025 5,910 3,197
Lease Revenue Bonds:
Public Facilities Financing Authority LeaseRevenue Refunding Bonds, Series 2010 A 3.0-5.25 2 2040 167,635 138,565
Convention Center Expansion Financing AuthorityLease Revenue Refunding Bonds, Series 2012 A 2.0 - 5.00 2 2028 140,440 105,755
Public Facilities Financing Authority CIPLease Revenue Bonds, Series 2012 A 2.0 - 5.0 2 2042 72,000 66,380
Public Facilities Financing Authority Fire and Life SafetyLease Revenue Refunding Bonds, Series 2012 B 2.0 - 5.0 2 2032 18,745 15,555
Public Facilities Financing Authority CIP/Old Town Light RailExtension Lease Revenue Refunding Bonds, Series 2013 A 3.0 - 5.0 2 2043 43,245 37,600
Public Facilities Financing Authority Balboa Park/Mission Bay ParkLease Revenue Refunding Bonds, Series 2013 B 3.0 - 5.0 2 2024 6,285 4,355
Public Facilities Financing Authority CIPLease Revenue Bonds, Series 2015 A 5.0 2045 62,260 62,260
Public Facilities Financing Authority CIPLease Revenue Bonds, Series 2015 B 5.0 2033 45,030 41,705
Public Facilities Financing Authority Ballpark LeaseRevenue Refunding Bonds, Series 2016 2.0 - 5.0 2 2032 103,255 98,285
Total Lease Revenue Bonds 570,460
(Continued on next page)
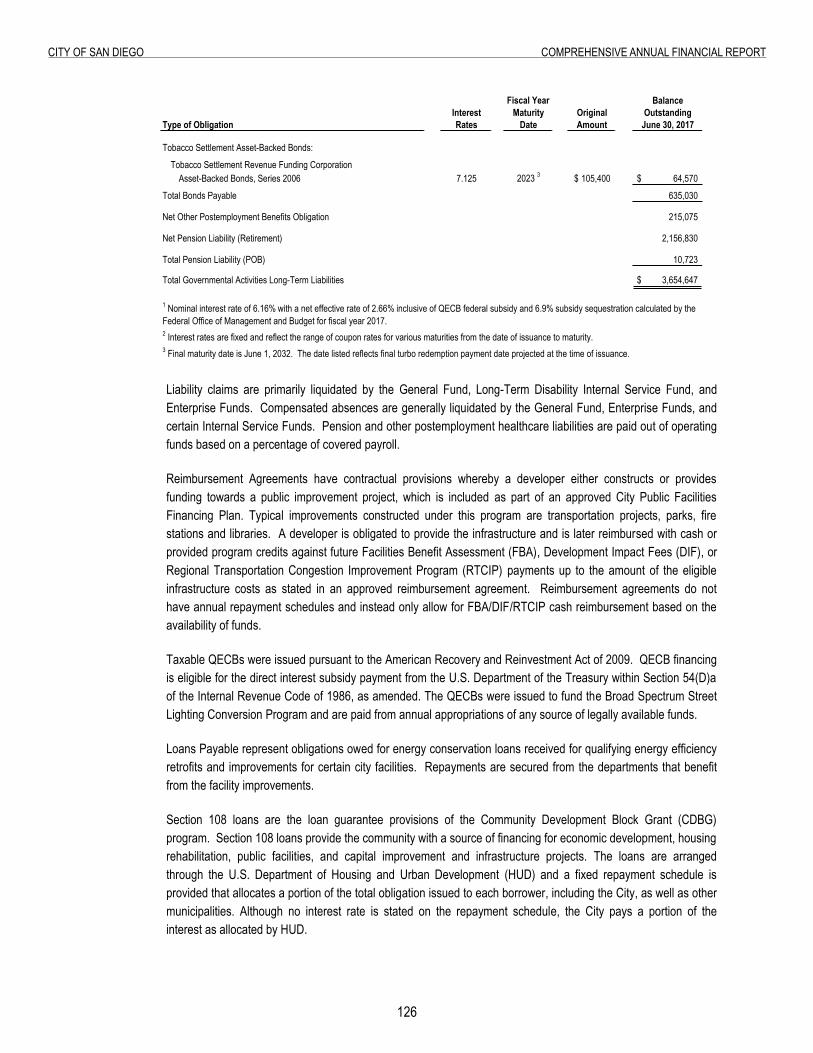
126
City of San Diego ComprehenSive annual finanCial report
Fiscal Year BalanceInterest Maturity Original Outstanding
Type of Obligation Rates Date Amount June 30, 2017
Tobacco Settlement Asset-Backed Bonds:
Tobacco Settlement Revenue Funding CorporationAsset-Backed Bonds, Series 2006 7.125 2023 3 105,400$ 64,570$
Total Bonds Payable 635,030
Net Other Postemployment Benefits Obligation 215,075
Net Pension Liability (Retirement) 2,156,830
Total Pension Liability (POB) 10,723
Total Governmental Activities Long-Term Liabilities 3,654,647$
2 Interest rates are fixed and reflect the range of coupon rates for various maturities from the date of issuance to maturity.3 Final maturity date is June 1, 2032. The date listed reflects final turbo redemption payment date projected at the time of issuance.
1 Nominal interest rate of 6.16% with a net effective rate of 2.66% inclusive of QECB federal subsidy and 6.9% subsidy sequestration calculated by the Federal Office of Management and Budget for fiscal year 2017.
Liability claims are primarily liquidated by the General Fund, Long-Term Disability Internal Service Fund, and Enterprise Funds. Compensated absences are generally liquidated by the General Fund, Enterprise Funds, and certain Internal Service Funds. Pension and other postemployment healthcare liabilities are paid out of operating funds based on a percentage of covered payroll.
Reimbursement Agreements have contractual provisions whereby a developer either constructs or provides funding towards a public improvement project, which is included as part of an approved City Public Facilities Financing Plan. Typical improvements constructed under this program are transportation projects, parks, fire stations and libraries. A developer is obligated to provide the infrastructure and is later reimbursed with cash or provided program credits against future Facilities Benefit Assessment (FBA), Development Impact Fees (DIF), or Regional Transportation Congestion Improvement Program (RTCIP) payments up to the amount of the eligible infrastructure costs as stated in an approved reimbursement agreement. Reimbursement agreements do not have annual repayment schedules and instead only allow for FBA/DIF/RTCIP cash reimbursement based on the availability of funds.
Taxable QECBs were issued pursuant to the American Recovery and Reinvestment Act of 2009. QECB financing is eligible for the direct interest subsidy payment from the U.S. Department of the Treasury within Section 54(D)a of the Internal Revenue Code of 1986, as amended. The QECBs were issued to fund the Broad Spectrum Street Lighting Conversion Program and are paid from annual appropriations of any source of legally available funds.
Loans Payable represent obligations owed for energy conservation loans received for qualifying energy efficiency retrofits and improvements for certain city facilities. Repayments are secured from the departments that benefit from the facility improvements.
Section 108 loans are the loan guarantee provisions of the Community Development Block Grant (CDBG) program. Section 108 loans provide the community with a source of financing for economic development, housing rehabilitation, public facilities, and capital improvement and infrastructure projects. The loans are arranged through the U.S. Department of Housing and Urban Development (HUD) and a fixed repayment schedule is provided that allocates a portion of the total obligation issued to each borrower, including the City, as well as other municipalities. Although no interest rate is stated on the repayment schedule, the City pays a portion of the interest as allocated by HUD.
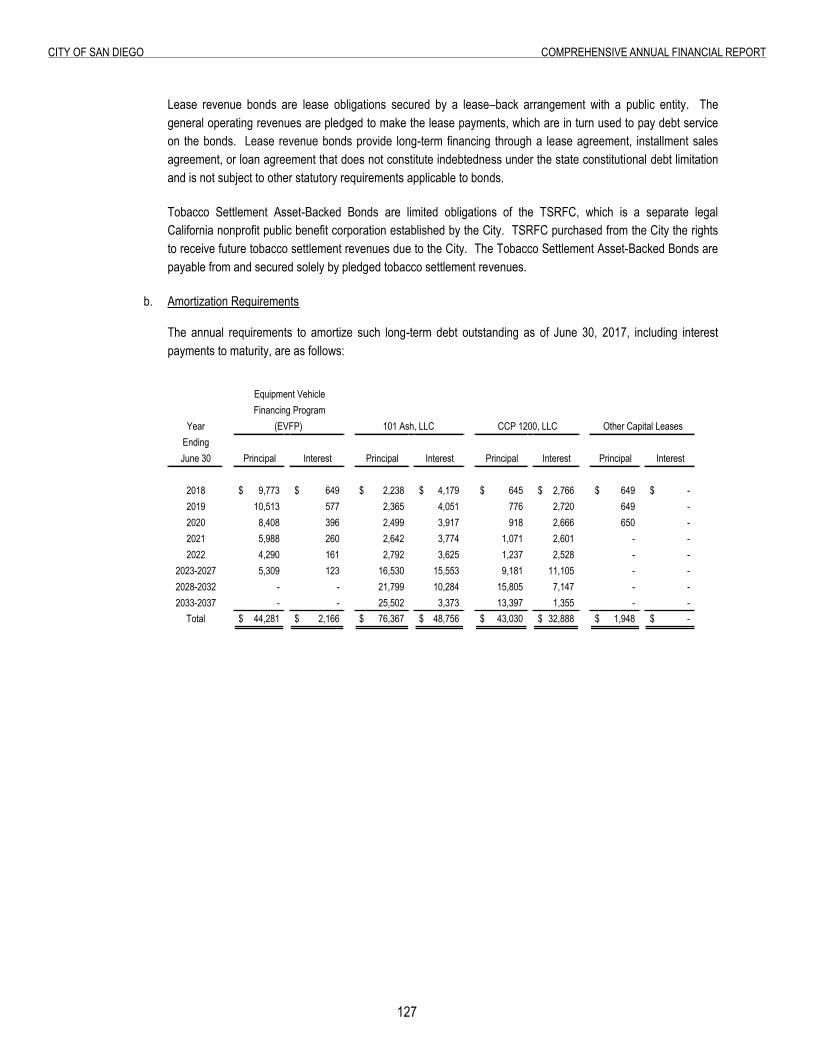
127
City of San Diego ComprehenSive annual finanCial report
Lease revenue bonds are lease obligations secured by a lease–back arrangement with a public entity. The general operating revenues are pledged to make the lease payments, which are in turn used to pay debt service on the bonds. Lease revenue bonds provide long-term financing through a lease agreement, installment sales agreement, or loan agreement that does not constitute indebtedness under the state constitutional debt limitation and is not subject to other statutory requirements applicable to bonds.
Tobacco Settlement Asset-Backed Bonds are limited obligations of the TSRFC, which is a separate legal California nonprofit public benefit corporation established by the City. TSRFC purchased from the City the rights to receive future tobacco settlement revenues due to the City. The Tobacco Settlement Asset-Backed Bonds are payable from and secured solely by pledged tobacco settlement revenues.
b. Amortization Requirements
The annual requirements to amortize such long-term debt outstanding as of June 30, 2017, including interest payments to maturity, are as follows:
Equipment VehicleFinancing Program
Year (EVFP) 101 Ash, LLC CCP 1200, LLC Other Capital LeasesEndingJune 30 Principal Interest Principal Interest Principal Interest Principal Interest
2018 9,773$ 649$ 2,238$ 4,179$ 645$ 2,766$ 649$ -$ 2019 10,513 577 2,365 4,051 776 2,720 649 - 2020 8,408 396 2,499 3,917 918 2,666 650 - 2021 5,988 260 2,642 3,774 1,071 2,601 - - 2022 4,290 161 2,792 3,625 1,237 2,528 - -
2023-2027 5,309 123 16,530 15,553 9,181 11,105 - - 2028-2032 - - 21,799 10,284 15,805 7,147 - - 2033-2037 - - 25,502 3,373 13,397 1,355 - -
Total 44,281$ 2,166$ 76,367$ 48,756$ 43,030$ 32,888$ 1,948$ -$
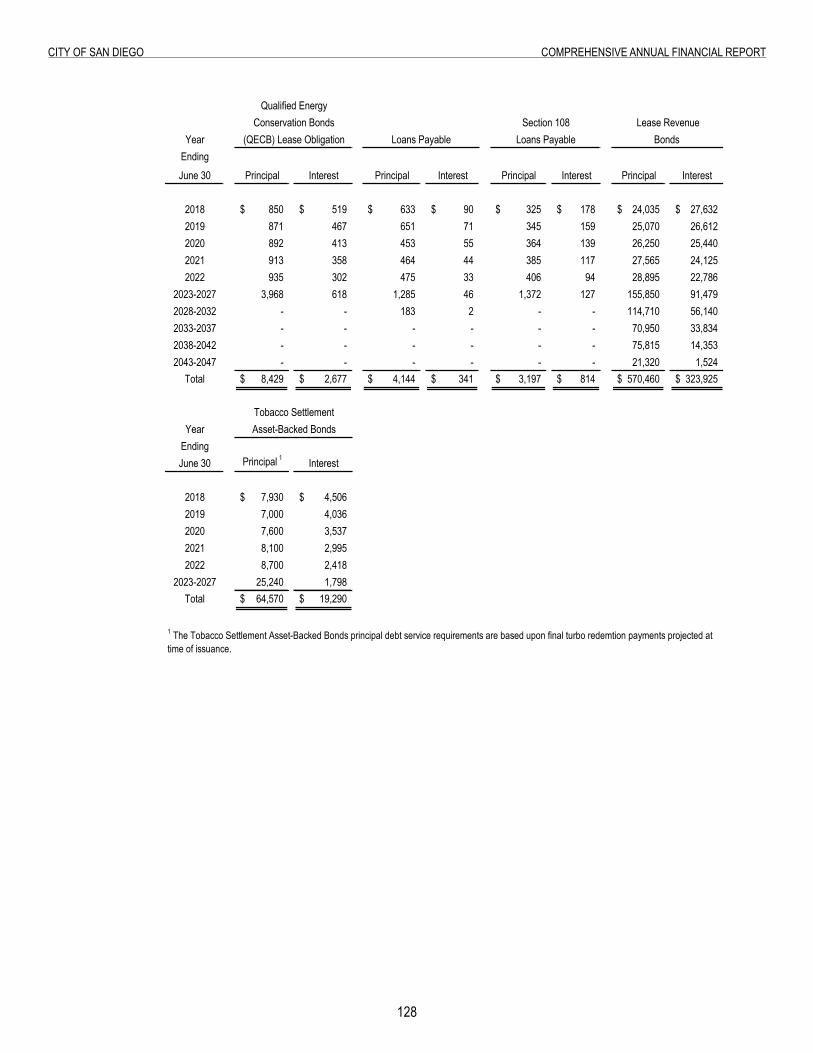
128
City of San Diego ComprehenSive annual finanCial report
Qualified EnergyConservation Bonds Section 108 Lease Revenue
Year (QECB) Lease Obligation Loans Payable Loans Payable Bonds EndingJune 30 Principal Interest Principal Interest Principal Interest Principal Interest
2018 850$ 519$ 633$ 90$ 325$ 178$ 24,035$ 27,632$ 2019 871 467 651 71 345 159 25,070 26,612 2020 892 413 453 55 364 139 26,250 25,440 2021 913 358 464 44 385 117 27,565 24,125 2022 935 302 475 33 406 94 28,895 22,786
2023-2027 3,968 618 1,285 46 1,372 127 155,850 91,479 2028-2032 - - 183 2 - - 114,710 56,140 2033-2037 - - - - - - 70,950 33,834 2038-2042 - - - - - - 75,815 14,353 2043-2047 - - - - - - 21,320 1,524
Total 8,429$ 2,677$ 4,144$ 341$ 3,197$ 814$ 570,460$ 323,925$
Tobacco SettlementYear
EndingJune 30 Principal 1 Interest
2018 7,930$ 4,506$ 2019 7,000 4,036 2020 7,600 3,537 2021 8,100 2,995 2022 8,700 2,418
2023-2027 25,240 1,798 Total 64,570$ 19,290$
Asset-Backed Bonds
1 The Tobacco Settlement Asset-Backed Bonds principal debt service requirements are based upon final turbo redemtion payments projected at time of issuance.
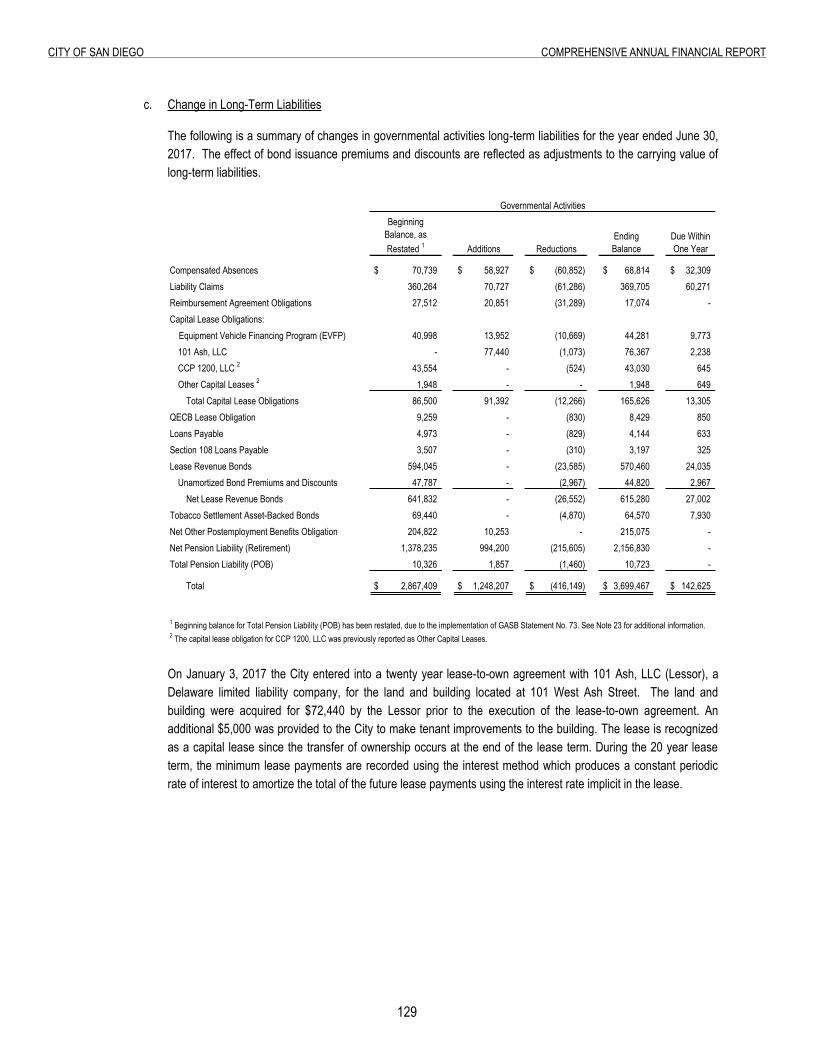
129
City of San Diego ComprehenSive annual finanCial report
c. Change in Long-Term Liabilities
The following is a summary of changes in governmental activities long-term liabilities for the year ended June 30, 2017. The effect of bond issuance premiums and discounts are reflected as adjustments to the carrying value of long-term liabilities.
Governmental Activities
Additions ReductionsEnding Balance
Due Within One Year
Compensated Absences 70,739$ 58,927$ (60,852)$ 68,814$ 32,309$ Liability Claims 360,264 70,727 (61,286) 369,705 60,271 Reimbursement Agreement Obligations 27,512 20,851 (31,289) 17,074 - Capital Lease Obligations: Equipment Vehicle Financing Program (EVFP) 40,998 13,952 (10,669) 44,281 9,773
101 Ash, LLC - 77,440 (1,073) 76,367 2,238 CCP 1200, LLC 2 43,554 - (524) 43,030 645 Other Capital Leases 2 1,948 - - 1,948 649
Total Capital Lease Obligations 86,500 91,392 (12,266) 165,626 13,305 QECB Lease Obligation 9,259 - (830) 8,429 850 Loans Payable 4,973 - (829) 4,144 633 Section 108 Loans Payable 3,507 - (310) 3,197 325 Lease Revenue Bonds 594,045 - (23,585) 570,460 24,035
Unamortized Bond Premiums and Discounts 47,787 - (2,967) 44,820 2,967 Net Lease Revenue Bonds 641,832 - (26,552) 615,280 27,002
Tobacco Settlement Asset-Backed Bonds 69,440 - (4,870) 64,570 7,930 Net Other Postemployment Benefits Obligation 204,822 10,253 - 215,075 - Net Pension Liability (Retirement) 1,378,235 994,200 (215,605) 2,156,830 - Total Pension Liability (POB) 10,326 1,857 (1,460) 10,723 -
Total 2,867,409$ 1,248,207$ (416,149)$ 3,699,467$ 142,625$
2 The capital lease obligation for CCP 1200, LLC was previously reported as Other Capital Leases.
Beginning Balance, as Restated 1
1 Beginning balance for Total Pension Liability (POB) has been restated, due to the implementation of GASB Statement No. 73. See Note 23 for additional information.
On January 3, 2017 the City entered into a twenty year lease-to-own agreement with 101 Ash, LLC (Lessor), a Delaware limited liability company, for the land and building located at 101 West Ash Street. The land and building were acquired for $72,440 by the Lessor prior to the execution of the lease-to-own agreement. An additional $5,000 was provided to the City to make tenant improvements to the building. The lease is recognized as a capital lease since the transfer of ownership occurs at the end of the lease term. During the 20 year lease term, the minimum lease payments are recorded using the interest method which produces a constant periodic rate of interest to amortize the total of the future lease payments using the interest rate implicit in the lease.
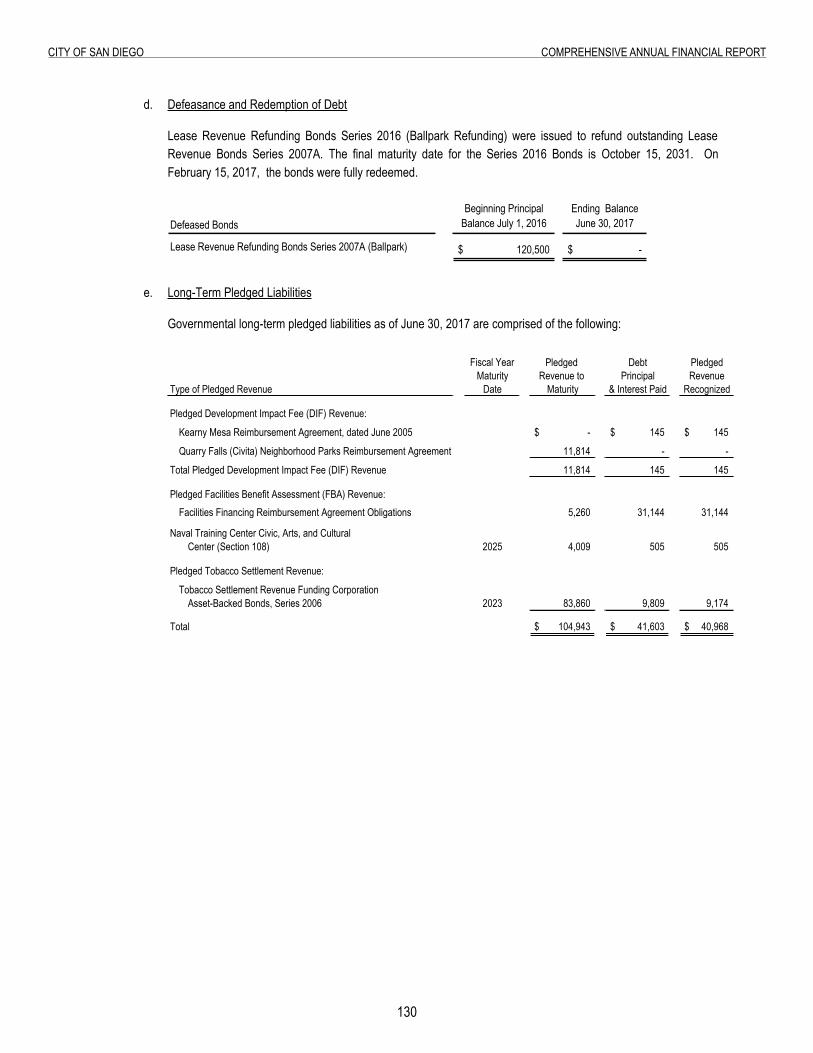
130
City of San Diego ComprehenSive annual finanCial report
d. Defeasance and Redemption of Debt
Lease Revenue Refunding Bonds Series 2016 (Ballpark Refunding) were issued to refund outstanding Lease Revenue Bonds Series 2007A. The final maturity date for the Series 2016 Bonds is October 15, 2031. On February 15, 2017, the bonds were fully redeemed.
Defeased BondsBeginning Principal
Balance July 1, 2016Ending Balance June 30, 2017
Lease Revenue Refunding Bonds Series 2007A (Ballpark) 120,500$ -$
e. Long-Term Pledged Liabilities
Governmental long-term pledged liabilities as of June 30, 2017 are comprised of the following:
Fiscal Year Pledged Debt PledgedMaturity Revenue to Principal Revenue
Type of Pledged Revenue Date Maturity & Interest Paid Recognized
Pledged Development Impact Fee (DIF) Revenue:
Kearny Mesa Reimbursement Agreement, dated June 2005 -$ 145$ 145$
Quarry Falls (Civita) Neighborhood Parks Reimbursement Agreement 11,814 - -
Total Pledged Development Impact Fee (DIF) Revenue 11,814 145 145
Pledged Facilities Benefit Assessment (FBA) Revenue:Facilities Financing Reimbursement Agreement Obligations 5,260 31,144 31,144
Naval Training Center Civic, Arts, and CulturalCenter (Section 108) 2025 4,009 505 505
Pledged Tobacco Settlement Revenue:
Tobacco Settlement Revenue Funding CorporationAsset-Backed Bonds, Series 2006 2023 83,860 9,809 9,174
Total 104,943$ 41,603$ 40,968$
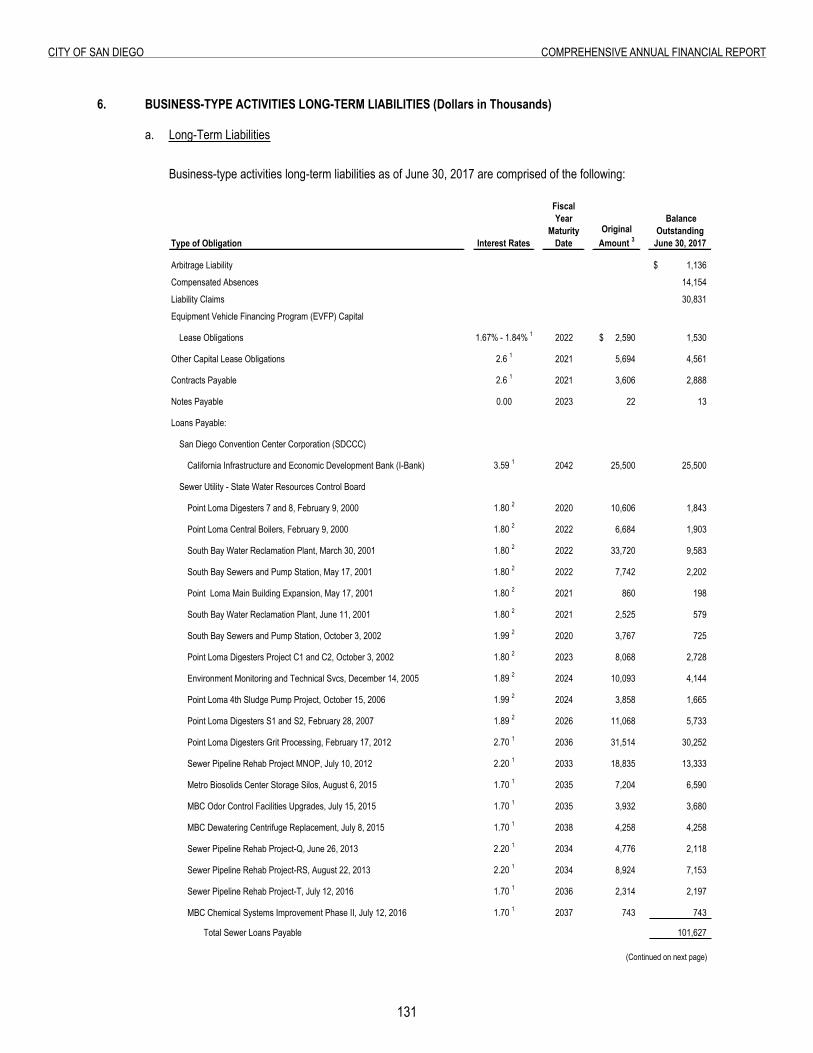
131
City of San Diego ComprehenSive annual finanCial report
6. Business-Type Activities Long-Term Liabilities
6. BUSINESS-TYPE ACTIVITIES LONG-TERM LIABILITIES (Dollars in Thousands)
a. Long-Term Liabilities
Business-type activities long-term liabilities as of June 30, 2017 are comprised of the following:
Type of Obligation Interest Rates
Fiscal Year
Maturity Date
Original Amount 3
Balance Outstanding
June 30, 2017
Arbitrage Liability 1,136$
Compensated Absences 14,154
Liability Claims 30,831
Equipment Vehicle Financing Program (EVFP) Capital
Lease Obligations 1.67% - 1.84% 1 2022 2,590$ 1,530
Other Capital Lease Obligations 2.6 1 2021 5,694 4,561
Contracts Payable 2.6 1 2021 3,606 2,888
Notes Payable 0.00 2023 22 13
Loans Payable:
San Diego Convention Center Corporation (SDCCC)
California Infrastructure and Economic Development Bank (I-Bank) 3.59 1 2042 25,500 25,500
Sewer Utility - State Water Resources Control Board
Point Loma Digesters 7 and 8, February 9, 2000 1.80 2 2020 10,606 1,843
Point Loma Central Boilers, February 9, 2000 1.80 2 2022 6,684 1,903
South Bay Water Reclamation Plant, March 30, 2001 1.80 2 2022 33,720 9,583
South Bay Sewers and Pump Station, May 17, 2001 1.80 2 2022 7,742 2,202
Point Loma Main Building Expansion, May 17, 2001 1.80 2 2021 860 198
South Bay Water Reclamation Plant, June 11, 2001 1.80 2 2021 2,525 579
South Bay Sewers and Pump Station, October 3, 2002 1.99 2 2020 3,767 725
Point Loma Digesters Project C1 and C2, October 3, 2002 1.80 2 2023 8,068 2,728
Environment Monitoring and Technical Svcs, December 14, 2005 1.89 2 2024 10,093 4,144
Point Loma 4th Sludge Pump Project, October 15, 2006 1.99 2 2024 3,858 1,665
Point Loma Digesters S1 and S2, February 28, 2007 1.89 2 2026 11,068 5,733
Point Loma Digesters Grit Processing, February 17, 2012 2.70 1 2036 31,514 30,252
Sewer Pipeline Rehab Project MNOP, July 10, 2012 2.20 1 2033 18,835 13,333
Metro Biosolids Center Storage Silos, August 6, 2015 1.70 1 2035 7,204 6,590
MBC Odor Control Facilities Upgrades, July 15, 2015 1.70 1 2035 3,932 3,680
MBC Dewatering Centrifuge Replacement, July 8, 2015 1.70 1 2038 4,258 4,258
Sewer Pipeline Rehab Project-Q, June 26, 2013 2.20 1 2034 4,776 2,118
Sewer Pipeline Rehab Project-RS, August 22, 2013 2.20 1 2034 8,924 7,153
Sewer Pipeline Rehab Project-T, July 12, 2016 1.70 1 2036 2,314 2,197
MBC Chemical Systems Improvement Phase II, July 12, 2016 1.70 1 2037 743 743
Total Sewer Loans Payable 101,627
(Continued on next page)
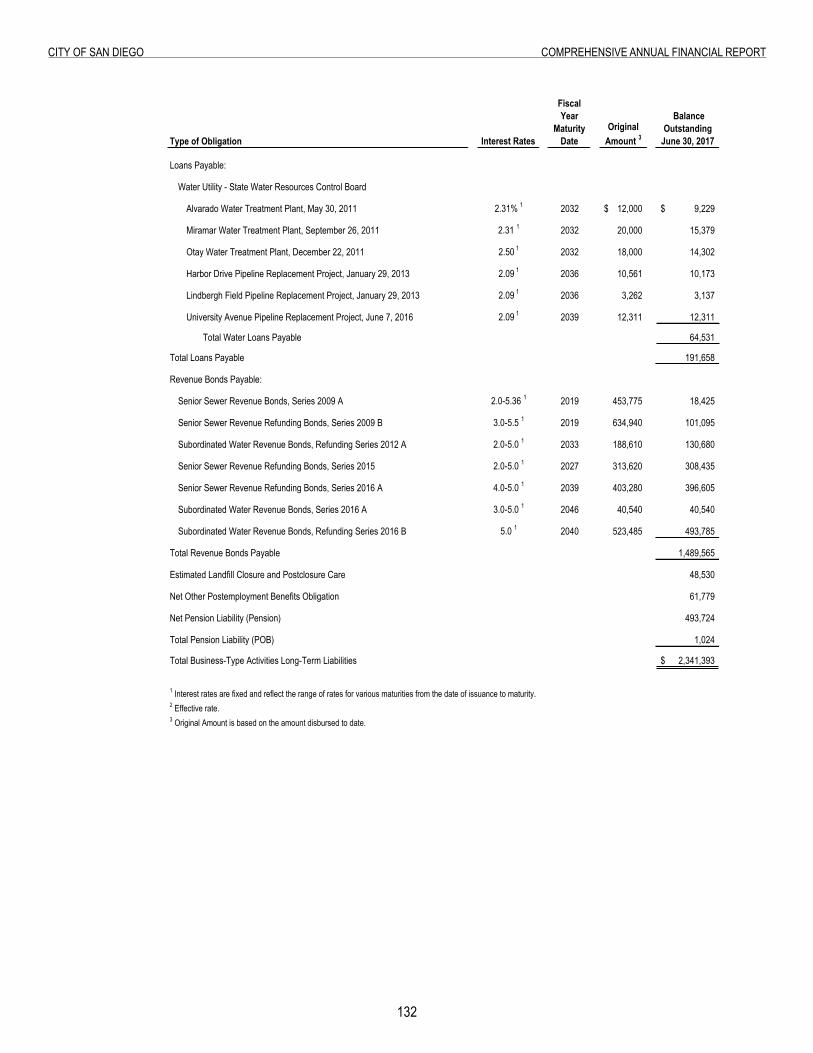
132
City of San Diego ComprehenSive annual finanCial report
Type of Obligation Interest Rates
Fiscal Year
Maturity Date
Original Amount 3
Balance Outstanding
June 30, 2017
Loans Payable:
Water Utility - State Water Resources Control Board
Alvarado Water Treatment Plant, May 30, 2011 2.31% 1 2032 12,000$ 9,229$
Miramar Water Treatment Plant, September 26, 2011 2.31 1 2032 20,000 15,379
Otay Water Treatment Plant, December 22, 2011 2.50 1 2032 18,000 14,302
Harbor Drive Pipeline Replacement Project, January 29, 2013 2.09 1 2036 10,561 10,173
Lindbergh Field Pipeline Replacement Project, January 29, 2013 2.09 1 2036 3,262 3,137
University Avenue Pipeline Replacement Project, June 7, 2016 2.09 1 2039 12,311 12,311
Total Water Loans Payable 64,531
Total Loans Payable 191,658
Revenue Bonds Payable:
Senior Sewer Revenue Bonds, Series 2009 A 2.0-5.36 1 2019 453,775 18,425
Senior Sewer Revenue Refunding Bonds, Series 2009 B 3.0-5.5 1 2019 634,940 101,095
Subordinated Water Revenue Bonds, Refunding Series 2012 A 2.0-5.0 1 2033 188,610 130,680
Senior Sewer Revenue Refunding Bonds, Series 2015 2.0-5.0 1 2027 313,620 308,435
Senior Sewer Revenue Refunding Bonds, Series 2016 A 4.0-5.0 1 2039 403,280 396,605
Subordinated Water Revenue Bonds, Series 2016 A 3.0-5.0 1 2046 40,540 40,540
Subordinated Water Revenue Bonds, Refunding Series 2016 B 5.0 1 2040 523,485 493,785
Total Revenue Bonds Payable 1,489,565
Estimated Landfill Closure and Postclosure Care 48,530
Net Other Postemployment Benefits Obligation 61,779
Net Pension Liability (Pension) 493,724
Total Pension Liability (POB) 1,024
Total Business-Type Activities Long-Term Liabilities 2,341,393$
1 Interest rates are fixed and reflect the range of rates for various maturities from the date of issuance to maturity.2 Effective rate.3 Original Amount is based on the amount disbursed to date.
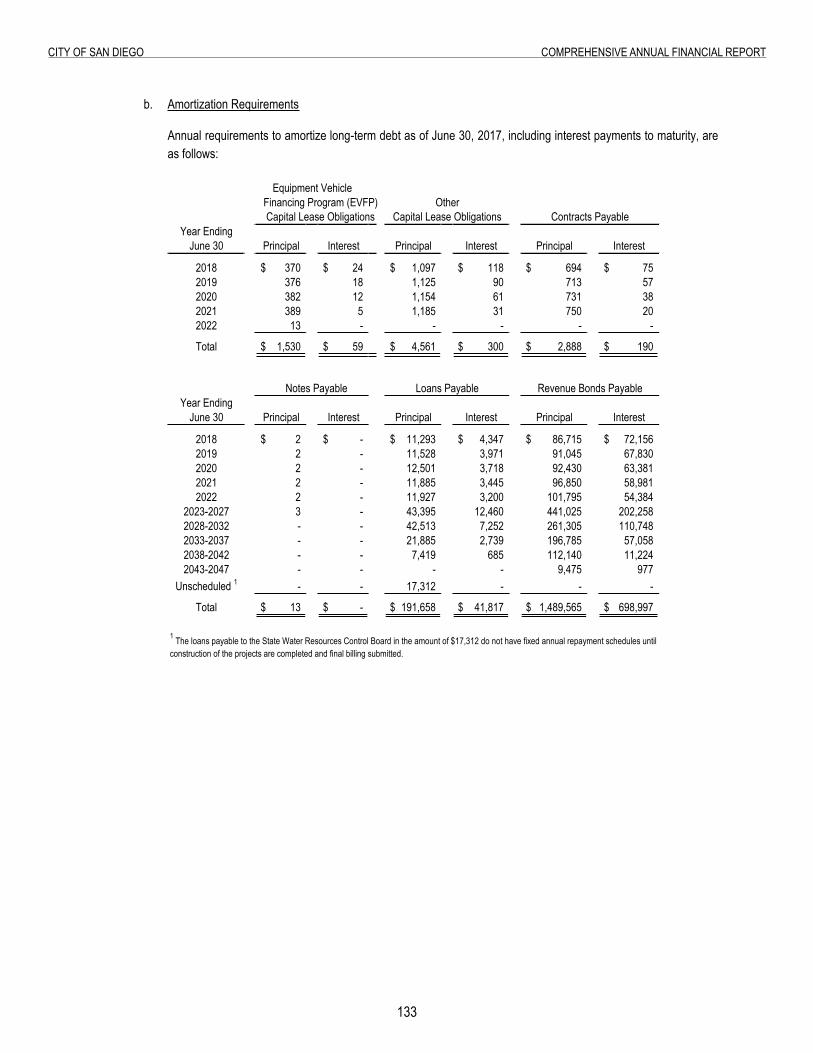
133
City of San Diego ComprehenSive annual finanCial report
b. Amortization Requirements
Annual requirements to amortize long-term debt as of June 30, 2017, including interest payments to maturity, are as follows:
Financing Program (EVFP)Capital Lease Obligations Capital Lease Obligations Contracts Payable
Year EndingJune 30 Principal Interest Principal Interest Principal Interest
2018 370$ 24$ 1,097$ 118$ 694$ 75$ 2019 376 18 1,125 90 713 57 2020 382 12 1,154 61 731 38 2021 389 5 1,185 31 750 20 2022 13 - - - - -
Total 1,530$ 59$ 4,561$ 300$ 2,888$ 190$
Notes Payable Loans Payable Revenue Bonds PayableYear Ending
June 30 Principal Interest Principal Interest Principal Interest
2018 2$ -$ 11,293$ 4,347$ 86,715$ 72,156$ 2019 2 - 11,528 3,971 91,045 67,830 2020 2 - 12,501 3,718 92,430 63,381 2021 2 - 11,885 3,445 96,850 58,981 2022 2 - 11,927 3,200 101,795 54,384
2023-2027 3 - 43,395 12,460 441,025 202,258 2028-2032 - - 42,513 7,252 261,305 110,748 2033-2037 - - 21,885 2,739 196,785 57,058 2038-2042 - - 7,419 685 112,140 11,224 2043-2047 - - - - 9,475 977
Unscheduled 1 - - 17,312 - - -
Total 13$ -$ 191,658$ 41,817$ 1,489,565$ 698,997$
Other
1 The loans payable to the State Water Resources Control Board in the amount of $17,312 do not have fixed annual repayment schedules until construction of the projects are completed and final billing submitted.
Equipment Vehicle
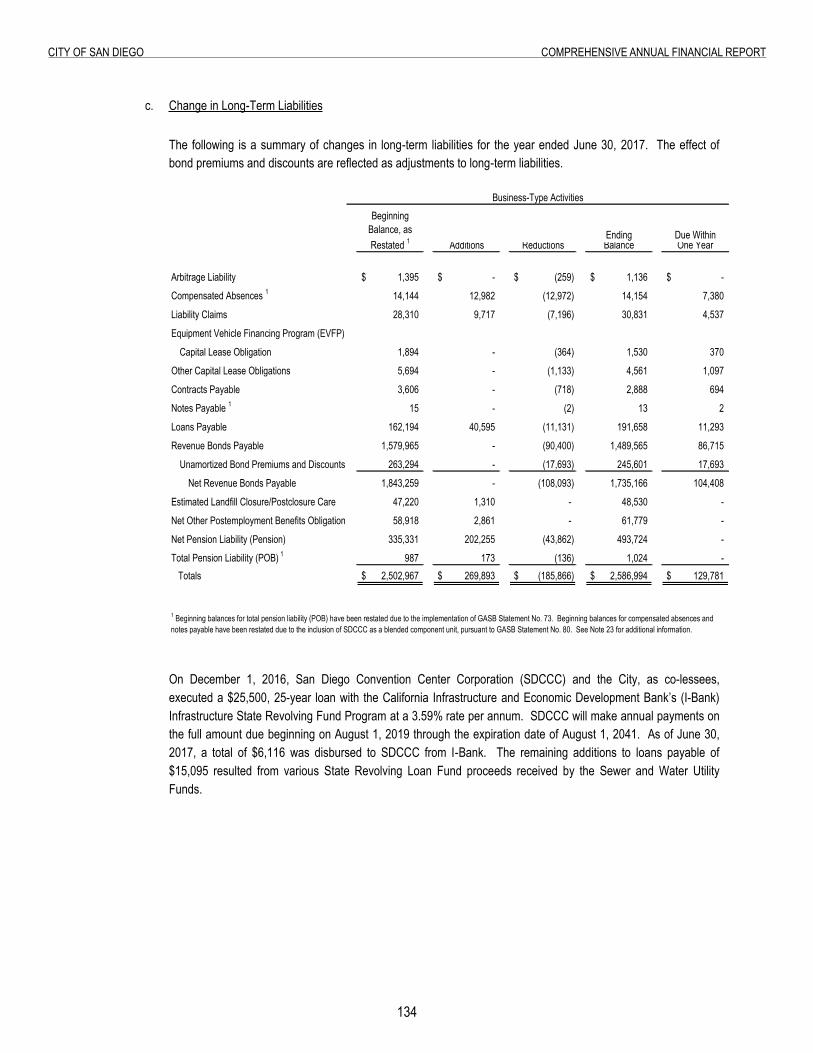
13�
City of San Diego ComprehenSive annual finanCial report
c. Change in Long-Term Liabilities
The following is a summary of changes in long-term liabilities for the year ended June 30, 2017. The effect of bond premiums and discounts are reflected as adjustments to long-term liabilities.
Ending Due WithinAdditions Reductions Balance One Year
Arbitrage Liability 1,395$ -$ (259)$ 1,136$ -$ Compensated Absences 1 14,144 12,982 (12,972) 14,154 7,380
Liability Claims 28,310 9,717 (7,196) 30,831 4,537
Equipment Vehicle Financing Program (EVFP)
Capital Lease Obligation 1,894 - (364) 1,530 370
Other Capital Lease Obligations 5,694 - (1,133) 4,561 1,097
Contracts Payable 3,606 - (718) 2,888 694 Notes Payable 1 15 - (2) 13 2
Loans Payable 162,194 40,595 (11,131) 191,658 11,293
Revenue Bonds Payable 1,579,965 - (90,400) 1,489,565 86,715
Unamortized Bond Premiums and Discounts 263,294 - (17,693) 245,601 17,693
Net Revenue Bonds Payable 1,843,259 - (108,093) 1,735,166 104,408
Estimated Landfill Closure/Postclosure Care 47,220 1,310 - 48,530 -
Net Other Postemployment Benefits Obligation 58,918 2,861 - 61,779 -
Net Pension Liability (Pension) 335,331 202,255 (43,862) 493,724 - Total Pension Liability (POB) 1 987 173 (136) 1,024 - Totals 2,502,967$ 269,893$ (185,866)$ 2,586,994$ 129,781$
Business-Type ActivitiesBeginning
Balance, as Restated 1
1 Beginning balances for total pension liability (POB) have been restated due to the implementation of GASB Statement No. 73. Beginning balances for compensated absences and notes payable have been restated due to the inclusion of SDCCC as a blended component unit, pursuant to GASB Statement No. 80. See Note 23 for additional information.
On December 1, 2016, San Diego Convention Center Corporation (SDCCC) and the City, as co-lessees, executed a $25,500, 25-year loan with the California Infrastructure and Economic Development Bank’s (I-Bank) Infrastructure State Revolving Fund Program at a 3.59% rate per annum. SDCCC will make annual payments on the full amount due beginning on August 1, 2019 through the expiration date of August 1, 2041. As of June 30, 2017, a total of $6,116 was disbursed to SDCCC from I-Bank. The remaining additions to loans payable of $15,095 resulted from various State Revolving Loan Fund proceeds received by the Sewer and Water Utility Funds.
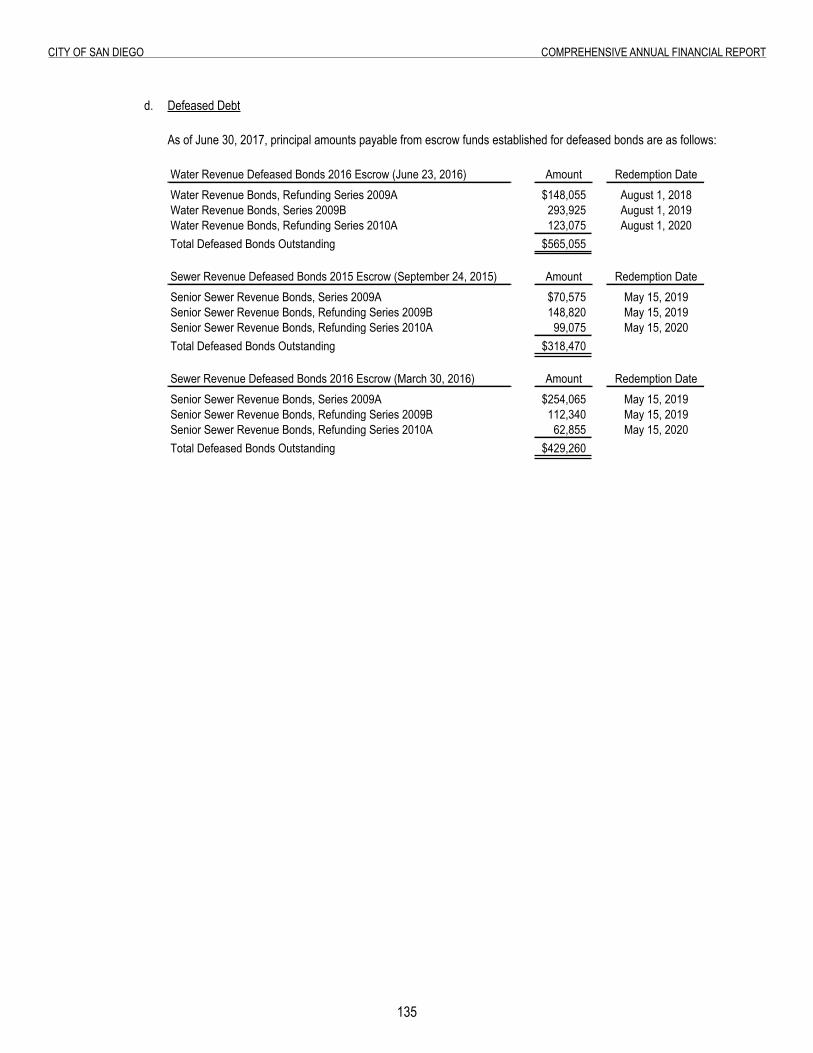
135
City of San Diego ComprehenSive annual finanCial report
d. Defeased Debt
As of June 30, 2017, principal amounts payable from escrow funds established for defeased bonds are as follows:
Water Revenue Defeased Bonds 2016 Escrow (June 23, 2016) Amount Redemption DateWater Revenue Bonds, Refunding Series 2009A $148,055 August 1, 2018Water Revenue Bonds, Series 2009B 293,925 August 1, 2019Water Revenue Bonds, Refunding Series 2010A 123,075 August 1, 2020Total Defeased Bonds Outstanding $565,055
Sewer Revenue Defeased Bonds 2015 Escrow (September 24, 2015) Amount Redemption DateSenior Sewer Revenue Bonds, Series 2009A $70,575 May 15, 2019Senior Sewer Revenue Bonds, Refunding Series 2009B 148,820 May 15, 2019Senior Sewer Revenue Bonds, Refunding Series 2010A 99,075 May 15, 2020Total Defeased Bonds Outstanding $318,470
Sewer Revenue Defeased Bonds 2016 Escrow (March 30, 2016) Amount Redemption DateSenior Sewer Revenue Bonds, Series 2009A $254,065 May 15, 2019Senior Sewer Revenue Bonds, Refunding Series 2009B 112,340 May 15, 2019Senior Sewer Revenue Bonds, Refunding Series 2010A 62,855 May 15, 2020Total Defeased Bonds Outstanding $429,260
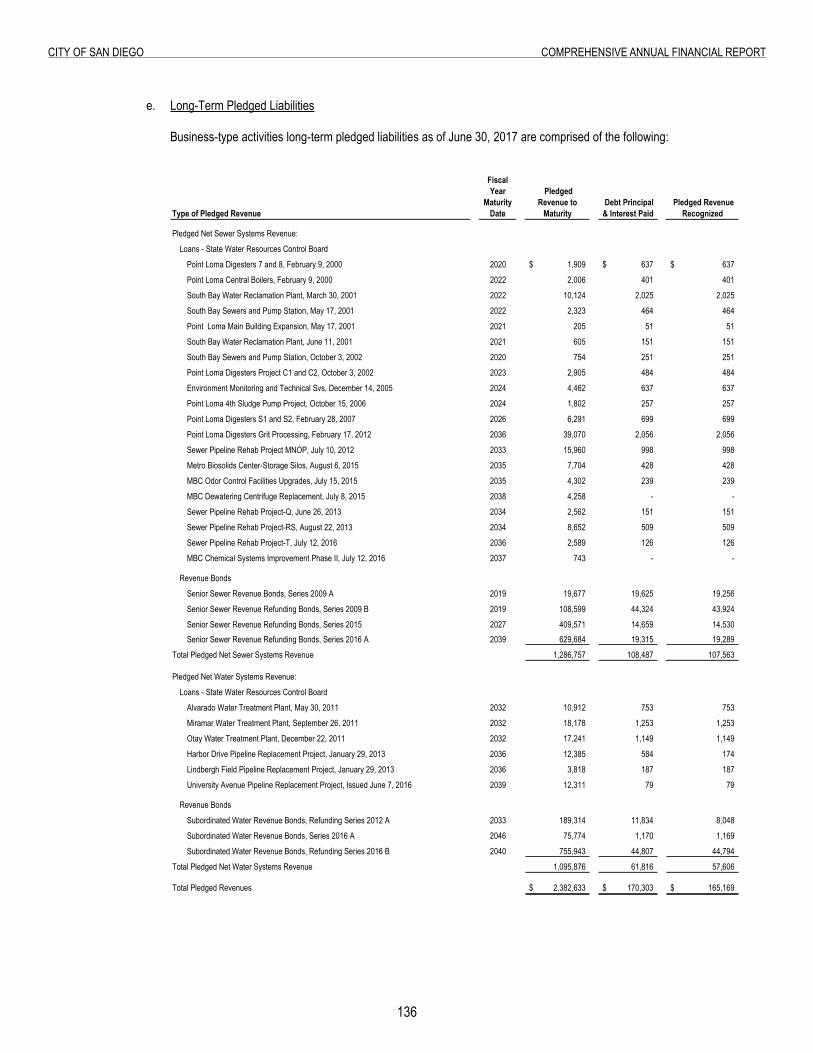
136
City of San Diego ComprehenSive annual finanCial report
e. Long-Term Pledged Liabilities
Business-type activities long-term pledged liabilities as of June 30, 2017 are comprised of the following:
Type of Pledged Revenue
Fiscal Year
Maturity Date
Pledged Revenue to
Maturity Debt Principal & Interest Paid
Pledged Revenue Recognized
Pledged Net Sewer Systems Revenue:
Loans - State Water Resources Control Board
Point Loma Digesters 7 and 8, February 9, 2000 2020 1,909$ 637$ 637$
Point Loma Central Boilers, February 9, 2000 2022 2,006 401 401
South Bay Water Reclamation Plant, March 30, 2001 2022 10,124 2,025 2,025
South Bay Sewers and Pump Station, May 17, 2001 2022 2,323 464 464
Point Loma Main Building Expansion, May 17, 2001 2021 205 51 51
South Bay Water Reclamation Plant, June 11, 2001 2021 605 151 151
South Bay Sewers and Pump Station, October 3, 2002 2020 754 251 251
Point Loma Digesters Project C1 and C2, October 3, 2002 2023 2,905 484 484
Environment Monitoring and Technical Svs, December 14, 2005 2024 4,462 637 637
Point Loma 4th Sludge Pump Project, October 15, 2006 2024 1,802 257 257
Point Loma Digesters S1 and S2, February 28, 2007 2026 6,291 699 699
Point Loma Digesters Grit Processing, February 17, 2012 2036 39,070 2,056 2,056
Sewer Pipeline Rehab Project MNOP, July 10, 2012 2033 15,960 998 998
Metro Biosolids Center-Storage Silos, August 6, 2015 2035 7,704 428 428
MBC Odor Control Facilities Upgrades, July 15, 2015 2035 4,302 239 239
MBC Dewatering Centrifuge Replacement, July 8, 2015 2038 4,258 - -
Sewer Pipeline Rehab Project-Q, June 26, 2013 2034 2,562 151 151
Sewer Pipeline Rehab Project-RS, August 22, 2013 2034 8,652 509 509
Sewer Pipeline Rehab Project-T, July 12, 2016 2036 2,589 126 126
MBC Chemical Systems Improvement Phase II, July 12, 2016 2037 743 - -
Revenue Bonds
Senior Sewer Revenue Bonds, Series 2009 A 2019 19,677 19,625 19,256
Senior Sewer Revenue Refunding Bonds, Series 2009 B 2019 108,599 44,324 43,924
Senior Sewer Revenue Refunding Bonds, Series 2015 2027 409,571 14,659 14,530 Senior Sewer Revenue Refunding Bonds, Series 2016 A 2039 629,684 19,315 19,289
Total Pledged Net Sewer Systems Revenue 1,286,757 108,487 107,563
Pledged Net Water Systems Revenue:
Loans - State Water Resources Control Board
Alvarado Water Treatment Plant, May 30, 2011 2032 10,912 753 753
Miramar Water Treatment Plant, September 26, 2011 2032 18,178 1,253 1,253
Otay Water Treatment Plant, December 22, 2011 2032 17,241 1,149 1,149
Harbor Drive Pipeline Replacement Project, January 29, 2013 2036 12,385 584 174
Lindbergh Field Pipeline Replacement Project, January 29, 2013 2036 3,818 187 187
University Avenue Pipeline Replacement Project, Issued June 7, 2016 2039 12,311 79 79
Revenue Bonds
Subordinated Water Revenue Bonds, Refunding Series 2012 A 2033 189,314 11,834 8,048
Subordinated Water Revenue Bonds, Series 2016 A 2046 75,774 1,170 1,169
Subordinated Water Revenue Bonds, Refunding Series 2016 B 2040 755,943 44,807 44,794
Total Pledged Net Water Systems Revenue 1,095,876 61,816 57,606
Total Pledged Revenues 2,382,633$ 170,303$ 165,169$
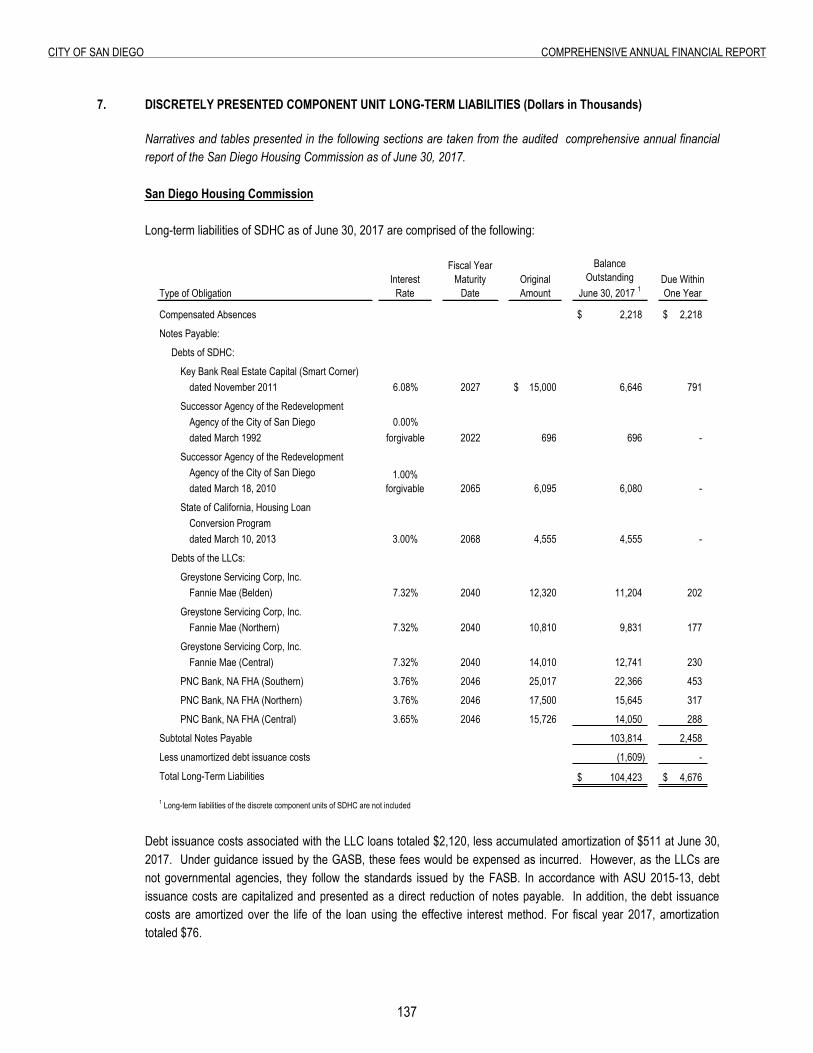
137
City of San Diego ComprehenSive annual finanCial report
7. Discretely Presented Component Unit Long-Term Liabilities
7. DISCRETELY PRESENTED COMPONENT UNIT LONG-TERM LIABILITIES (Dollars in Thousands)
Narratives and tables presented in the following sections are taken from the audited comprehensive annual financial report of the San Diego Housing Commission as of June 30, 2017. San Diego Housing Commission Long-term liabilities of SDHC as of June 30, 2017 are comprised of the following:
Interest Rate
Fiscal Year Maturity
DateOriginal Amount
Balance Outstanding
June 30, 2017 1Due Within One Year
Compensated Absences 2,218$ 2,218$
Notes Payable:
Debts of SDHC:
Key Bank Real Estate Capital (Smart Corner)dated November 2011 6.08% 2027 15,000$ 6,646 791
Successor Agency of the RedevelopmentAgency of the City of San Diego 0.00%dated March 1992 forgivable 2022 696 696 -
Successor Agency of the RedevelopmentAgency of the City of San Diegodated March 18, 2010 2065 6,095 6,080 -
State of California, Housing Loan Conversion Program dated March 10, 2013 2068 4,555 4,555 -
Debts of the LLCs:
Greystone Servicing Corp, Inc.Fannie Mae (Belden) 7.32% 2040 12,320 11,204 202
Greystone Servicing Corp, Inc. Fannie Mae (Northern) 7.32% 2040 10,810 9,831 177
Greystone Servicing Corp, Inc.Fannie Mae (Central) 7.32% 2040 14,010 12,741 230
PNC Bank, NA FHA (Southern) 3.76% 2046 25,017 22,366 453
PNC Bank, NA FHA (Northern) 3.76% 2046 17,500 15,645 317
PNC Bank, NA FHA (Central) 3.65% 2046 15,726 14,050 288
Subtotal Notes Payable 103,814 2,458
Less unamortized debt issuance costs (1,609) -
Total Long-Term Liabilities 104,423$ 4,676$
1 Long-term liabilities of the discrete component units of SDHC are not included
3.00%
Type of Obligation
1.00% forgivable
Debt issuance costs associated with the LLC loans totaled $2,120, less accumulated amortization of $511 at June 30, 2017. Under guidance issued by the GASB, these fees would be expensed as incurred. However, as the LLCs are not governmental agencies, they follow the standards issued by the FASB. In accordance with ASU 2015-13, debt issuance costs are capitalized and presented as a direct reduction of notes payable. In addition, the debt issuance costs are amortized over the life of the loan using the effective interest method. For fiscal year 2017, amortization totaled $76.
138
City of San Diego ComprehenSive annual finanCial report
In November 2011, SDHC entered into a loan agreement with GE Capital Financial Inc. to refinance the Smart Corner Building, which houses the administrative offices of SDHC. In September 2015, Key Bank Real Estate Capital took over as servicer of the loan. The term of the loan is 15 years, amortized over 25 years, with a fixed interest rate of 6.08% until November 2021, at which time the rate will convert to a variable rate. In February 2017, SDHC exercised the annual option to pay down the loan principal in the amount of $773.
SDHC entered into a loan agreement with the former RDA as of March 18, 2010, for the acquisition and rehabilitation of the Hotel Sandford. The loan from the former RDA is a forgivable loan, with a term of 55 years and 1% simple interest. The total approved loan amount is $6,095 with the loan being fully disbursed as of June 30, 2016. The project incurred savings and the City’s portion of the savings was returned to the City in the form of a payment on the loan. As of June 30, 2016, $252 of cost savings were returned with $237 applied to interest and $15 to principal. As of June 30, 2017 accrued interest totaled $136.
In May 2013, two State of California loans were renegotiated through the Housing Loan Conversion Program and extended for 55 years to 2068. They now bear an interest rate of 3% with required annual interest payments and with residual receipt requirements.
On December 30, 2009, Belden SDHC FNMA, LLC, Central SDHC FNMA, LLC and Northern SDHC FNMA, LLC (blended component units of the SDHC) entered into debt agreements with Greystone Servicing Corp. Inc. in the amount of $37,140. The debt agreement is to obtain financing towards acquiring over 350 affordable housing units in the City. The FNMA loans are nonrecourse obligations of the LLCs and not of SDHC. Under the terms of the loan agreements, the LLCs agree to pay a fixed interest rate of 7.32% on the life of the loan through the maturity date January 1, 2040.
On August 31, 2010, Northern SDHC FHA, LLC, and Southern SDHC FHA, LLC entered into debt agreements with PNC Bank, N. A. On September 20, 2010, Central SDHC FHA, LLC entered into a debt agreement with PNC Bank, N. A. for the combined total amount of $58,243. The debt agreements are to obtain financing towards acquiring additional affordable housing units in the City. The FHA loans are nonrecourse obligations of the LLCs. and not of SDHC. Under the terms of the loan agreements, the LLCs agree to pay a fixed interest rate not to exceed 4.0% on the life of the loan through the maturity dates of September 1, 2045 and October 1, 2045 for the Northern & Southern LLC loans and the Central LLC loan, respectively.
The American Recovery and Reinvestment Act of 2009 created the new Build America Bond (BABs) program. State and local governments receive directly from the U.S. Treasury subsidy payments for a portion of their borrowing costs on BABs equal to 35% of the total coupon interest paid less reductions in federal appropriations. The subsidy stream is paid for the full term of the bonds. The Belden SDHC FNMA, LLC, the Northern SDHC FHA, LLC and the Southern SDHC FHA, LLC loans have been approved as qualified direct subsidy BABs loans. SDHC received subsidy payments of $722 in fiscal year 2017.
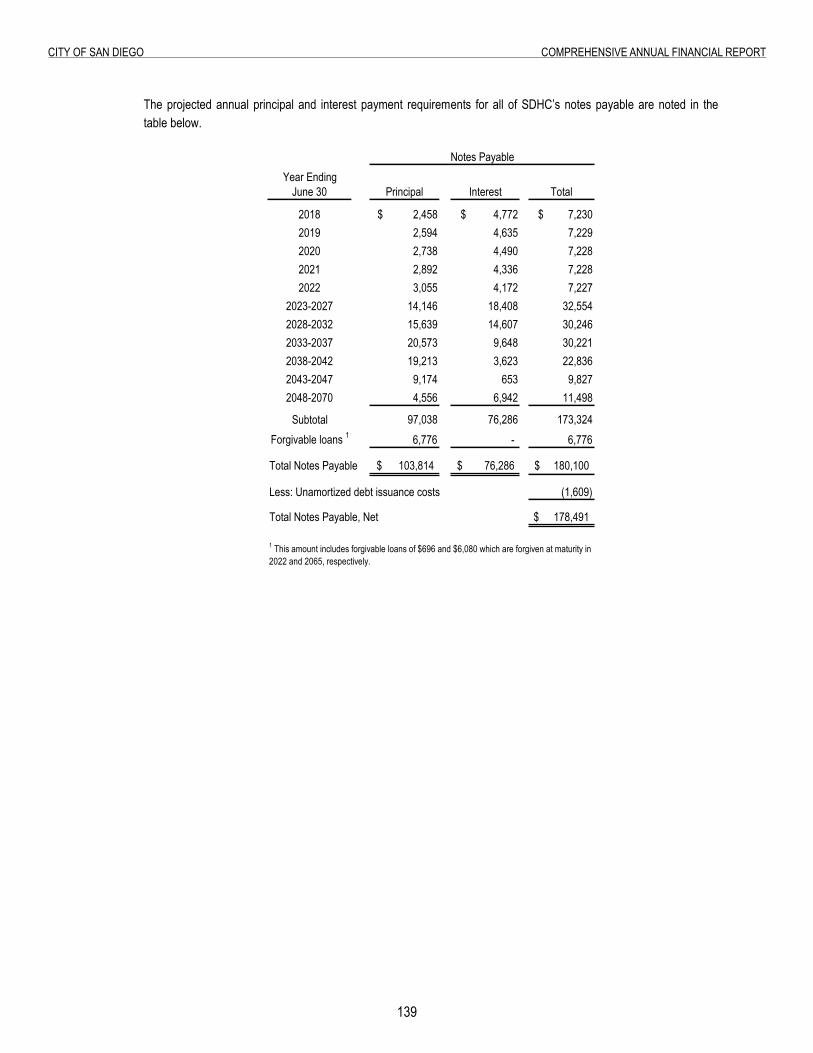
139
City of San Diego ComprehenSive annual finanCial report
The projected annual principal and interest payment requirements for all of SDHC’s notes payable are noted in the table below.
Year EndingJune 30 Principal Interest Total
2018 $ 2,458 $ 4,772 $ 7,230 2019 2,594 4,635 7,229 2020 2,738 4,490 7,228 2021 2,892 4,336 7,228 2022 3,055 4,172 7,227
2023-2027 14,146 18,408 32,554 2028-2032 15,639 14,607 30,246 2033-2037 20,573 9,648 30,221 2038-2042 19,213 3,623 22,836 2043-2047 9,174 653 9,827 2048-2070 4,556 6,942 11,498
Subtotal 97,038 76,286 173,324 Forgivable loans 1 6,776 - 6,776
Total Notes Payable 103,814$ 76,286$ 180,100$
Less: Unamortized debt issuance costs (1,609)
Total Notes Payable, Net 178,491$
Notes Payable
1 This amount includes forgivable loans of $696 and $6,080 which are forgiven at maturity in 2022 and 2065, respectively.
1�0
City of San Diego ComprehenSive annual finanCial report
Discretely Presented Component Units of the San Diego Housing Commission
The long-term liabilities for the discretely presented component units of SDHC as of December 31, 2016 are as follows:
Notes Payable:
HDP MasonNote payable is held by the San Diego Housing Commission in the original amount of $2,365. Thenote bears interest at 3% per annum. Beginning May 1, 2014 and annually on May 1 of each yearthereafter, principal and interest are due and payable from 47.8% of “residual receipts” as definedin the loan agreement through February 2068. The note is secured by a deed of trust on theMason Hotel. Accrued interest totaled $328 at December 31, 2016. $ 2,365
Note payable is held by the Successor Agency to the former Redevelopment Agency of the City ofSan Diego and administered by Civic San Diego in the original amount of $1,319. The note bearsinterest at 5% per annum. Principal and interest are due and payable from 26.6% of “residualreceipts” each operating year as defined in the loan agreement note through May 2057. The noteis secured by a deed of trust on the Mason Hotel. Accrued interest totaled $199 at December 31,2016. 1,319
Note payable is held by California Housing Finance Agency in the original amount of $1,181. Thenote bears interest at 3% per annum. Annual payments of principal and interest are payable from23.9% of the Development’s “residual receipts,” as defined in the loan agreement throughDecember 2066. The note is secured by a deed of trust on the Mason Hotel. Accrued interesttotaled $156 at December 31, 2016. 1,181
Note payable is held by the San Diego Housing Commission in the original amount of $226. Thenote bears interest at 3% per annum. Annual payments of principal and interest are payable onlyfrom 1.7% of “residual receipts,” as defined in the loan agreement through May 2057. The note issecured by a deed of trust on the Mason Hotel. Accrued interest totaled $27 at December 31,2016. 69
Note payable is held by the San Diego Housing Commission in the original amount of $230. Thenote is noninterest bearing. The note shall be incrementally forgiven beginning May 2013 at 10%per year provided the Corporation has complied with all provisions of the note. The note is securedby a deed of trust on the Mason Hotel. Forgiveness of debt totaled $23 for the year endedDecember 31, 2016. 138
Total HDP Mason 5,072 Less: Unamortized debt issuance costs (17) Total HDP Mason, Net 5,055
HDP Broadway
Multi-family note payable to the Housing Authority of the City of San Diego with a maximumprincipal sum of $17,825 was originated on November 25, 2014. The note is being serviced byBerkadia Commercial Mortgage and bears interest at 4.49%. The note is payable in monthlyinstallments of principal and interest of $84 through maturity on December 1, 2044. The note issecured by a deed of trust on San Diego Square. Accrued interest totaled $65 at December 31,2016.
Total HDP Broadway 17,386
Less: Unamortized debt issuance costs (307)
Total HDP Broadway, Net 17,079
1�1
City of San Diego ComprehenSive annual finanCial report
Casa Colina
Note payable is held by Red Mortgage Capital, Inc. in the original amount of $3,465. Monthlypayments of $19 including principal and interest at 5.68% are due through February 1, 2039. Thenote is secured by a deed of trust on Casa Colina. Accrued interest totaled $14 at December 31,2016. $ 2,874
Note payable is held by the San Diego Housing Commission in the original amount of $1,600. Thenote bears interest at 3% per annum. Annual payments of principal and interest are payable onlyfrom 50% of “residual receipts,” as defined in the loan agreement through February 2059. Thenote is secured by a deed of trust on Casa Colina. Accrued interest totaled $22 at December 31,2016. 1,476
Total Casa Colina 4,350
Less: Unamortized debt issuance costs (289)
Total Casa Colina, Net 4,061
Logan
The note payable which was originated in November 2012, is held by the Housing Authority of theCity of San Diego and serviced by JP Morgan Chase Bank, N.A. in the original amount of 5,300.The note bears interest at a fixed rate of 5.58% and is payable in monthly installments of principaland interest through February 2032. The note is secured by a deed of trust on Knox GlenTownhomes. Accrued interest totaled $15 at December 31, 2016. 3,181
Mortgage note is held by the San Diego Housing Commission in the original amount of $1,400 wasoriginated on November 30,1995 and bears interest at 6% per annum. Payments of principal andinterest are payable annually from residual receipts, as defined in the note. Principal and accruedinterest are due November 20, 2050. The note is secured by a deed of trust on Knox GlenTownhomes. Accrued interest totaled $1,363 at December 31, 2016. 1,400
Mortgage note is held by the Successor Agency to the former Redevelopment Agency of the City of San Diego and administered by Civic San Diego in the original amount of $150 was originated onDecember 1, 1995. The note bears interest at 3% per annum. Principal and accrued interest aredue in December, 2050. The note is secured by a deed of trust on Knox Glen Townhomes.Accrued interest totaled $62 at December 31, 2016. 150
Total Logan 4,731
Less: Unamortized debt issuance costs (137)
Total Logan, Net 4,594
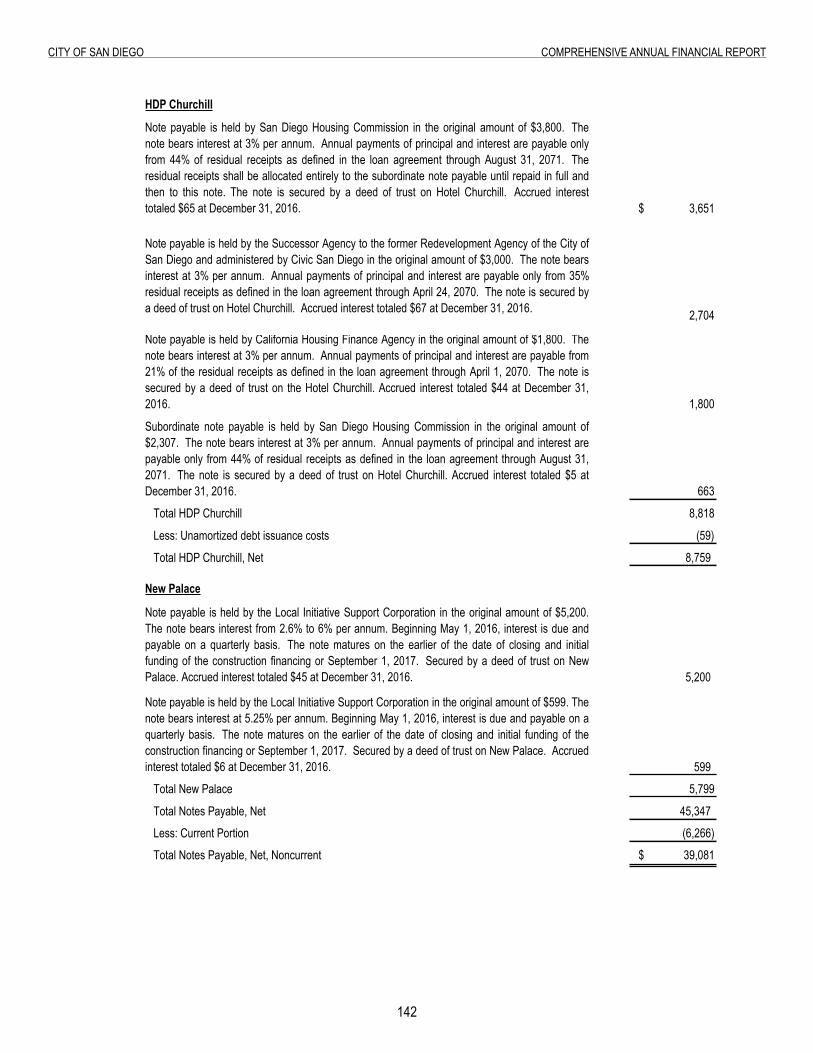
1�2
City of San Diego ComprehenSive annual finanCial report
HDP Churchill
Note payable is held by San Diego Housing Commission in the original amount of $3,800. Thenote bears interest at 3% per annum. Annual payments of principal and interest are payable onlyfrom 44% of residual receipts as defined in the loan agreement through August 31, 2071. Theresidual receipts shall be allocated entirely to the subordinate note payable until repaid in full andthen to this note. The note is secured by a deed of trust on Hotel Churchill. Accrued interesttotaled $65 at December 31, 2016. $ 3,651
Note payable is held by the Successor Agency to the former Redevelopment Agency of the City ofSan Diego and administered by Civic San Diego in the original amount of $3,000. The note bearsinterest at 3% per annum. Annual payments of principal and interest are payable only from 35%residual receipts as defined in the loan agreement through April 24, 2070. The note is secured bya deed of trust on Hotel Churchill. Accrued interest totaled $67 at December 31, 2016. 2,704
Note payable is held by California Housing Finance Agency in the original amount of $1,800. Thenote bears interest at 3% per annum. Annual payments of principal and interest are payable from21% of the residual receipts as defined in the loan agreement through April 1, 2070. The note issecured by a deed of trust on the Hotel Churchill. Accrued interest totaled $44 at December 31,2016. 1,800
Subordinate note payable is held by San Diego Housing Commission in the original amount of$2,307. The note bears interest at 3% per annum. Annual payments of principal and interest arepayable only from 44% of residual receipts as defined in the loan agreement through August 31,2071. The note is secured by a deed of trust on Hotel Churchill. Accrued interest totaled $5 atDecember 31, 2016. 663
Total HDP Churchill 8,818
Less: Unamortized debt issuance costs (59)
Total HDP Churchill, Net 8,759
New Palace
Note payable is held by the Local Initiative Support Corporation in the original amount of $5,200.The note bears interest from 2.6% to 6% per annum. Beginning May 1, 2016, interest is due andpayable on a quarterly basis. The note matures on the earlier of the date of closing and initialfunding of the construction financing or September 1, 2017. Secured by a deed of trust on NewPalace. Accrued interest totaled $45 at December 31, 2016. 5,200
Note payable is held by the Local Initiative Support Corporation in the original amount of $599. Thenote bears interest at 5.25% per annum. Beginning May 1, 2016, interest is due and payable on aquarterly basis. The note matures on the earlier of the date of closing and initial funding of theconstruction financing or September 1, 2017. Secured by a deed of trust on New Palace. Accruedinterest totaled $6 at December 31, 2016. 599 Total New Palace 5,799
Total Notes Payable, Net 45,347 Less: Current Portion (6,266) Total Notes Payable, Net, Noncurrent $ 39,081
Debt issuance costs total $1,016 less accumulated amortization of $207 at December 31, 2016. The annual requirements to amortize long-term debt as of December 31, 2016 are as follows:
Notes Payable
Year EndingDecember 31 Principal
2017 6,266$ 2018 396 2019 415 2020 434 2021 455
Thereafter 38,190 Total 46,156
Less: Unamortized DebtIssuance Costs (809)
Total 45,347$
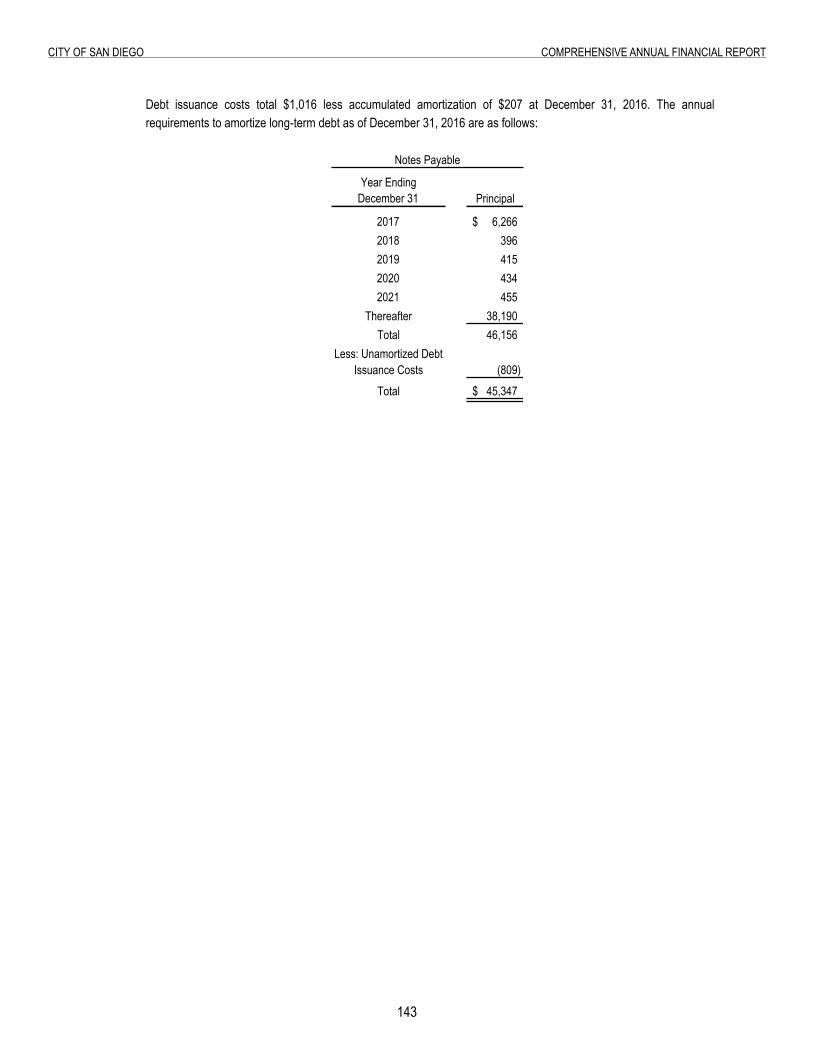
1�3
City of San Diego ComprehenSive annual finanCial report
Debt issuance costs total $1,016 less accumulated amortization of $207 at December 31, 2016. The annual requirements to amortize long-term debt as of December 31, 2016 are as follows:
Notes Payable
Year EndingDecember 31 Principal
2017 6,266$ 2018 396 2019 415 2020 434 2021 455
Thereafter 38,190 Total 46,156
Less: Unamortized DebtIssuance Costs (809)
Total 45,347$
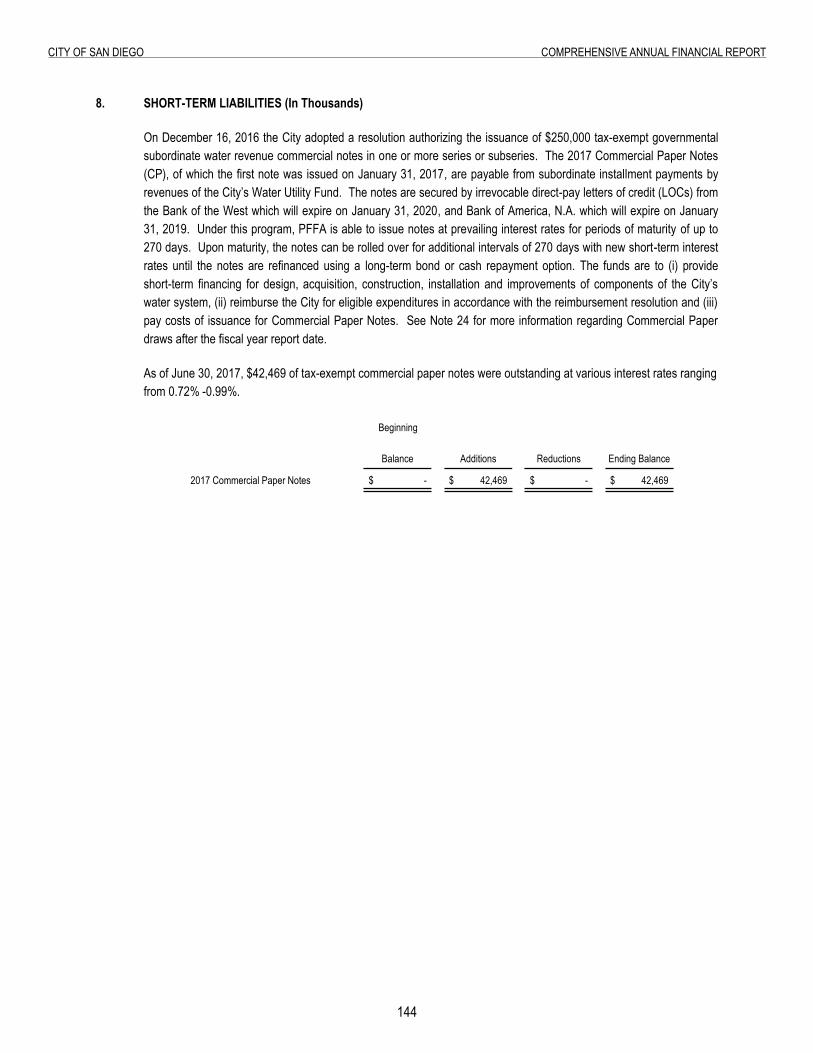
1��
City of San Diego ComprehenSive annual finanCial report
8. Short-Term Liabilities
8. SHORT-TERM LIABILITIES (In Thousands)
On December 16, 2016 the City adopted a resolution authorizing the issuance of $250,000 tax-exempt governmental subordinate water revenue commercial notes in one or more series or subseries. The 2017 Commercial Paper Notes (CP), of which the first note was issued on January 31, 2017, are payable from subordinate installment payments by revenues of the City’s Water Utility Fund. The notes are secured by irrevocable direct-pay letters of credit (LOCs) from the Bank of the West which will expire on January 31, 2020, and Bank of America, N.A. which will expire on January 31, 2019. Under this program, PFFA is able to issue notes at prevailing interest rates for periods of maturity of up to 270 days. Upon maturity, the notes can be rolled over for additional intervals of 270 days with new short-term interest rates until the notes are refinanced using a long-term bond or cash repayment option. The funds are to (i) provide short-term financing for design, acquisition, construction, installation and improvements of components of the City’s water system, (ii) reimburse the City for eligible expenditures in accordance with the reimbursement resolution and (iii) pay costs of issuance for Commercial Paper Notes. See Note 24 for more information regarding Commercial Paper draws after the fiscal year report date.
As of June 30, 2017, $42,469 of tax-exempt commercial paper notes were outstanding at various interest rates ranging from 0.72% -0.99%.
Beginning
Balance Additions Reductions Ending Balance
2017 Commercial Paper Notes -$ 42,469$ -$ 42,469$
1�5
City of San Diego ComprehenSive annual finanCial report
9. Joint Ventures and Jointly Governed Organizations
9. JOINT VENTURES AND JOINTLY GOVERNED ORGANIZATIONS (Dollars in Thousands)
San Diego Geographic Information Source (SanGIS)
SanGIS was created in 1997 as a joint powers agreement between the City and the County of San Diego. The agreement was amended and restated in 2016 to update its provisions and to reflect the current status of the structure and operations of SanGIS. SanGIS objectives are to create and maintain a geographic information system, to market and license digital geographic data and software, to provide technical services, and to publish geographical and land-related information for the City and County, other public agencies, and the private sector. SanGIS is governed by a Board of Directors consisting of one voting member from the City and one from the County. The Board approves the annual budget and fiscal audit, sets long range plans and strategic goals, and authorizes major project funding. All initiatives and decisions must be approved by a consensus of both members of the Board before being implemented. The SanGIS fiscal year 2017 annual budget of $1,360 was funded primarily by equal contributions from the City and County. In its latest audited report, SanGIS reported an increase in net position of $89 and an ending net position of $326 for the fiscal year ended June 30, 2016. Complete stand-alone financial statements are available at www.sangis.org.
San Diego Workforce Partnership (SDWP)
In 1974 the City and County of San Diego jointly formed a Consortium to provide regional employment and training services throughout San Diego County. In 2016, a revised Joint Powers Authority (JPA) agreement was approved to achieve compliance with Workforce Innovation and Opportunity Act federal legislation. The City and County jointly govern the Consortium. The Consortium’s Board of Directors consists of two members of the City Council, two members from the County Board of Supervisors, and one member of a charitable organization. The Consortium is empowered to make applications for and receive grants from governmental or private sources. The Board assigned the non-profit San Diego Workforce Partnership, Inc. as the grant recipient and administrative entity to operate the Consortium. To the extent that law mandates any responsibility upon the City and County for debt obligation or liability, the City and the County have agreed to share equally the payment of such an obligation. In its latest audited report, SDWP reported a decrease in net position of $122 and ending net position of $301 for the fiscal year ended June 30, 2016. Complete stand-alone financial statements can be requested from San Diego Workforce Partnership, Inc. 3910 University Avenue, Suite 400, San Diego, CA 92105.
San Dieguito River Valley Regional Open Space Park
The San Dieguito River Valley Regional Open Space Park Joint Powers Authority (JPA) was formed in 1989 by the City and County of San Diego and the Cities of Del Mar, Escondido, Poway, and Solana Beach to create, preserve and enhance the San Dieguito River Valley Regional Open Space Park for the benefit of the public. In 2015 an amended and restated agreement was executed, continuing the JPA for fifty years. The JPA Board is composed of two elected officials each from the County and the City, one elected official each from the Cities of Del Mar, Escondido, Poway, and Solana Beach, and one public member representing the Citizens Advisory Committee. The JPA’s funding is primarily comprised of operating grants, contributions, and agency assessments based on population and jurisdictional area. The JPA’s fiscal year 2017 annual budget for agency contributions was $960, of which the City’s share was $307, or 32%. In its latest audited report, for the fiscal year ended June 30, 2016, the JPA reported a decrease in net position of $322 and an ending net position of $56,390. The debts, liabilities, or obligations of the JPA belong to the JPA, and not the agencies. Upon termination of the agreement or existence of the JPA, real property owned by the JPA will be distributed to the jurisdiction on which the land is located, while remaining assets and liabilities will be divided among the agencies based on the contribution calculation percentages. Complete stand-alone financial statements are available at www.sdrp.org.
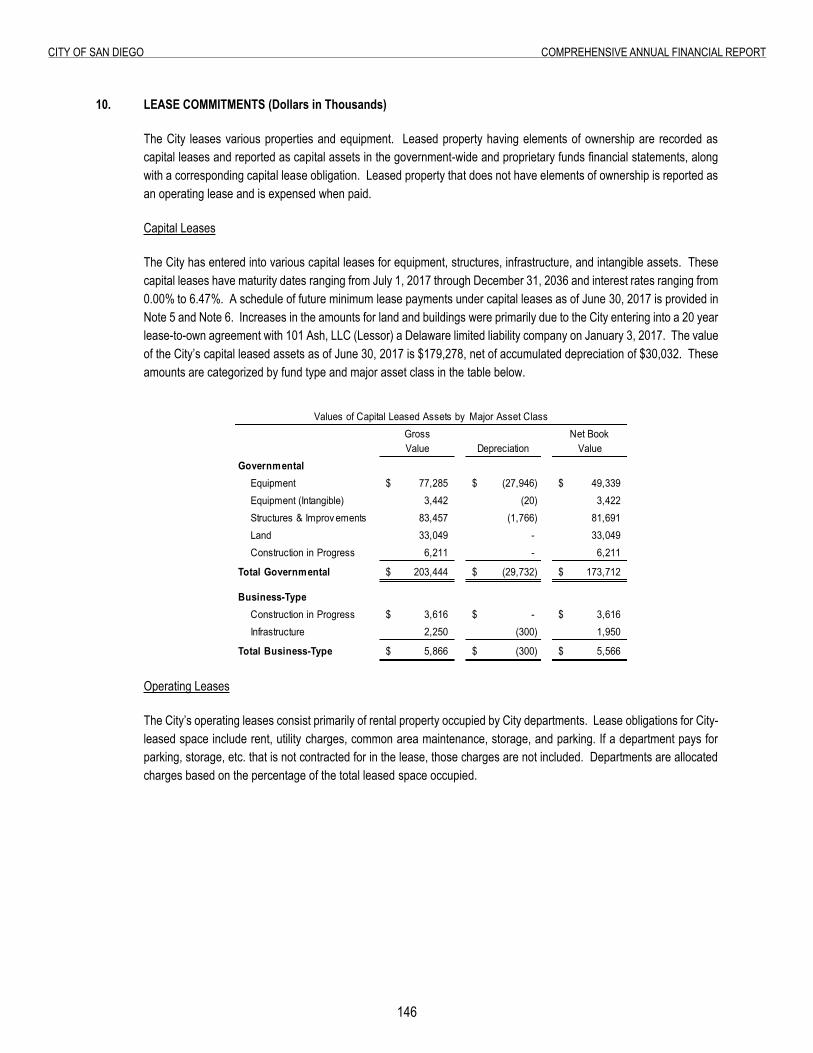
1�6
City of San Diego ComprehenSive annual finanCial report
10. lease Commitments
10. LEASE COMMITMENTS (Dollars in Thousands)
The City leases various properties and equipment. Leased property having elements of ownership are recorded as capital leases and reported as capital assets in the government-wide and proprietary funds financial statements, along with a corresponding capital lease obligation. Leased property that does not have elements of ownership is reported as an operating lease and is expensed when paid.
Capital Leases
The City has entered into various capital leases for equipment, structures, infrastructure, and intangible assets. These capital leases have maturity dates ranging from July 1, 2017 through December 31, 2036 and interest rates ranging from 0.00% to 6.47%. A schedule of future minimum lease payments under capital leases as of June 30, 2017 is provided in Note 5 and Note 6. Increases in the amounts for land and buildings were primarily due to the City entering into a 20 year lease-to-own agreement with 101 Ash, LLC (Lessor) a Delaware limited liability company on January 3, 2017. The value of the City’s capital leased assets as of June 30, 2017 is $179,278, net of accumulated depreciation of $30,032. These amounts are categorized by fund type and major asset class in the table below.
Gross Net BookValue Depreciation Value
GovernmentalEquipment 77,285$ (27,946)$ 49,339$ Equipment (Intangible) 3,442 (20) 3,422 Structures & Improv ements 83,457 (1,766) 81,691 Land 33,049 - 33,049 Construction in Progress 6,211 - 6,211
Total Governmental 203,444$ (29,732)$ 173,712$
Business-TypeConstruction in Progress 3,616$ -$ 3,616$ Infrastructure 2,250 (300) 1,950
Total Business-Type 5,866$ (300)$ 5,566$
Values of Capital Leased Assets by Major Asset Class
Operating Leases
The City’s operating leases consist primarily of rental property occupied by City departments. Lease obligations for City-leased space include rent, utility charges, common area maintenance, storage, and parking. If a department pays for parking, storage, etc. that is not contracted for in the lease, those charges are not included. Departments are allocated charges based on the percentage of the total leased space occupied.
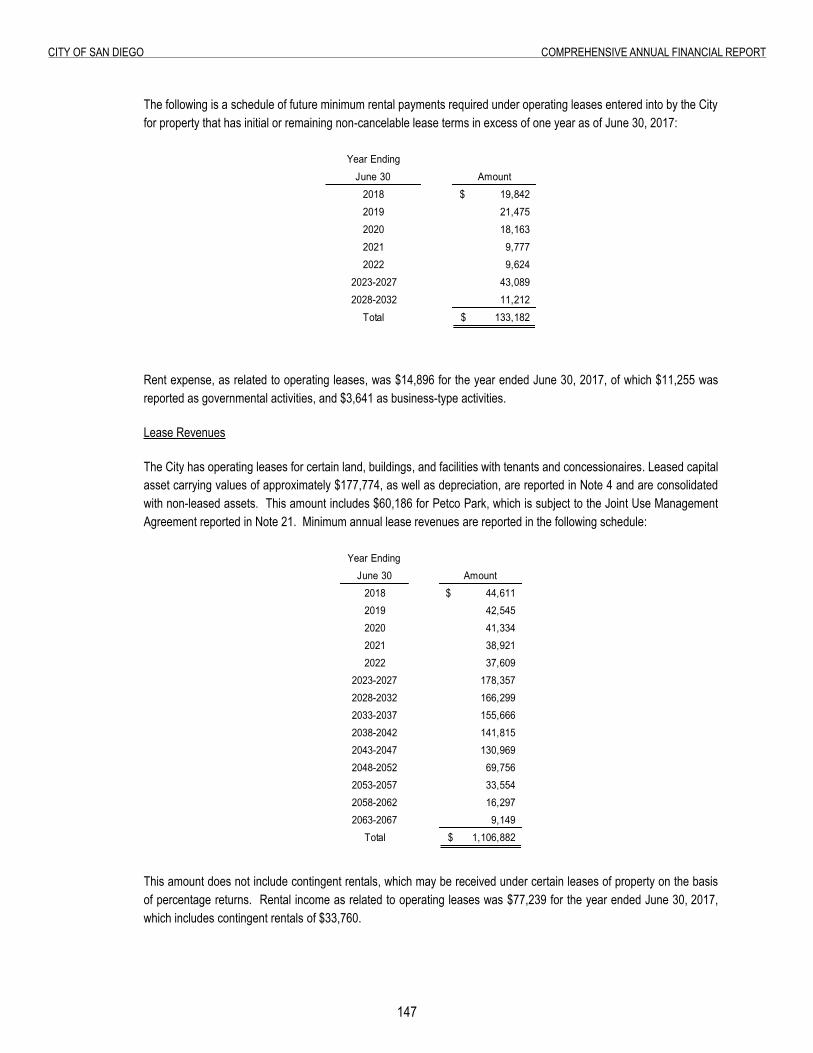
1�7
City of San Diego ComprehenSive annual finanCial report
The following is a schedule of future minimum rental payments required under operating leases entered into by the City for property that has initial or remaining non-cancelable lease terms in excess of one year as of June 30, 2017:
Year EndingJune 30
2018 19,842$ 2019 21,475 2020 18,163 2021 9,777 2022 9,624
2023-2027 43,089 2028-2032 11,212
Total 133,182$
Amount
Rent expense, as related to operating leases, was $14,896 for the year ended June 30, 2017, of which $11,255 was reported as governmental activities, and $3,641 as business-type activities.
Lease Revenues
The City has operating leases for certain land, buildings, and facilities with tenants and concessionaires. Leased capital asset carrying values of approximately $177,774, as well as depreciation, are reported in Note 4 and are consolidated with non-leased assets. This amount includes $60,186 for Petco Park, which is subject to the Joint Use Management Agreement reported in Note 21. Minimum annual lease revenues are reported in the following schedule:
Year EndingJune 30
2018 44,611$ 2019 42,545 2020 41,334 2021 38,921 2022 37,609
2023-2027 178,357 2028-2032 166,299 2033-2037 155,666 2038-2042 141,815 2043-2047 130,969 2048-2052 69,756 2053-2057 33,554 2058-2062 16,297 2063-2067 9,149
Total 1,106,882$
Amount
This amount does not include contingent rentals, which may be received under certain leases of property on the basis of percentage returns. Rental income as related to operating leases was $77,239 for the year ended June 30, 2017, which includes contingent rentals of $33,760.
1�8
City of San Diego ComprehenSive annual finanCial report
11. Deferred Compensation Plan
11. DEFERRED COMPENSATION PLAN (Dollars in Thousands)
The City, SDCCC, and SDHC each offer their employees a deferred compensation plan, created in accordance with Internal Revenue Service Code Section 457, State and Local Government Deferred Compensation Plans. These plans permit eligible employees to defer, pre-tax, a portion of their salary until future years. Deferred compensation is not available to employees until termination, retirement, death, disability, or an unforeseeable emergency. All assets and income of the deferred compensation plans are held in trust for the exclusive benefit of plan participants and their beneficiaries.
In accordance with GASB Statement No. 32, Accounting and Financial Reporting for Internal Revenue Code Section 457 Deferred Compensation Plans, the deferred compensation plans are not considered part of the City’s financial reporting entity.
1�9
City of San Diego ComprehenSive annual finanCial report
12. pension plans
12. PENSION PLANS (Dollars in Thousands)
The City has a defined benefit pension plan and various defined contribution pension plans covering substantially all of its employees. The defined benefit pension plan (Pension Plan) is closed to new City employees hired on or after July 20, 2012 except for sworn police officers who continue to participate in the Pension Plan.
An initiative titled “Comprehensive Pension Reform of San Diego” (Proposition B) was approved by voters on June 5, 2012 and implemented by the City in fiscal year 2013. Generally, the measure amended the City Charter to provide all new City employees hired on or after July 20, 2012, except sworn police officers, with a 401(a) defined contribution plan instead of a defined benefit plan. The initiative contains other provisions intended to limit pension costs for existing employees by directing the City to seek, through labor negotiations, to limit City employees’ compensation used to calculate pension benefits. This limitation on the City’s negotiating authority is in effect until June 30, 2018. Pensionable pay increases may be authorized with a two-thirds vote of the City Council following preparation of an actuarial report that discloses the impact of any proposed increases in compensation or benefits on the City’s Pension Plan.
In fiscal year 2013, the City reached five-year agreements with each of the employees’ collective bargaining units for non-pensionable compensation increases for fiscal years 2014 through 2018. The agreements freeze pensionable pay and cost-of-living increases for the same period (pensionable pay ranges were frozen, but pensionable pay within those ranges continues to increase for some employees based on years of service in salary classes as specified by the 2011 salary ordinance). The labor agreements may be reopened at the option of employee organizations in fiscal years 2017 and 2018, but only for changes in non-pensionable compensation. On July 1, 2015, the San Diego Police Officers Association (SDPOA), the labor group that represents sworn safety officers, entered into a Memorandum of Understanding (MOU) with the City for fiscal years 2016 through 2020. Also, on October 15, 2015, the San Diego Municipal Employee Association (MEA), the labor group that represents technical, office, professionals, and supervisory City employees, voted to ratify a tentative labor agreement between MEA and the City for fiscal years 2017 through 2020. Likewise, on or about April 22, 2016, the City reached agreements with AFSCME Local 127, Fire Local 145, DCAA and Teamsters Local 911 effective for fiscal years 2017 through 2020 (with the exception of DCAA which expires at the end of fiscal year 2019). Each labor agreement increased pensionable pay for fiscal years 2019 and 2020 by 3.3% for each fiscal year, with DCAA only for fiscal year 2019. See the Management Discussion and Analysis for more information regarding updates to the SDPOA agreement.
Proposition B is the subject of ongoing litigation. On February 11, 2013, a PERB administrative law judge issued a proposed decision finding that the City violated state labor laws by failing to meet and confer with City labor organizations prior to placing Proposition B on the ballot. The City filed exceptions to the proposed decision. On December 29, 2015 PERB issued Decision No. 2464 M (PERB Decision), which affirmed and adopted the proposed decision with minor modifications. The City had filed an appeal with the Fourth District California Court of Appeal, and on April 11, 2017, the Court found the City did not violate state labor laws, however, on July 27, 2017, the California Supreme Court announced they have agreed to review the Fourth District Court of Appeal ruling on Proposition B. The litigation could potentially repeal or unwind the implementation of some requirements of Proposition B. Based on the analysis conducted by the SDCERS actuary of the employees hired after the effective date of Proposition B (July 20, 2012 to December 31, 2015), the liability for the employer’s UAAL is estimated at $20,200 as of the December 31, 2015 valuation date, subject to increase with the passage of time and the addition of affected employees. All actual outcomes are dependent on the negotiations with the employee organizations and actual financial impacts are unknown. Notwithstanding the PERB litigation, the actuarial valuation as of June 30, 2016 assumes the validity of Proposition B that the City has fully implemented its requirements as it relates to the City’s Pension Plan, and that the City intends to comply with those requirements under the terms specified in the initiative. See Note 24 for more information regarding SDCERS Board actions after the fiscal year reporting date.

150
City of San Diego ComprehenSive annual finanCial report
DEFINED BENEFIT PLAN
a. Pension Plan Description and Benefits Provided
SDCERS is a public employee retirement system established in fiscal year 1927 by the City, authorized by Article IX of the City Charter. SDCERS administers independent, qualified, single employer governmental defined benefit plans and trusts for the City, the San Diego Unified Port District (Port), and the San Diego County Regional Airport Authority (Airport). The assets of the three separate plans and trusts are pooled in the SDCERS Group Trust for investment purposes. These plans are administered by the SDCERS Board (Board) to provide retirement, disability, death and survivor benefits for its members. Amendments to the City’s benefit provisions require City Council approval and amendments to retirement benefits require a majority vote by those SDCERS members who are also eligible City employees or retirees. Benefit increases also require a majority vote of the public. All approved benefit changes are codified in the City’s Municipal Code.
The plans cover all eligible employees of the City, the Port, and the Airport. All City employees initially hired before July 20, 2012 working half-time or greater, all sworn police officers of the City irrespective of hire date, and full-time employees of the Port and Airport are eligible for membership and are required to join SDCERS. The Port and Airport are not component units of the City; however, the financial statements of the SDCERS Pension Trust do include the Port and Airport activity and are reported in the fiduciary funds section of this report.
The information disclosed in this note relates solely to the City’s participation in SDCERS. City employment classes participating in the City’s Pension Plan are elected officers, general employees and safety employees (including police, fire and lifeguard members). These classes are represented by various unions depending on the type and nature of work performed, except for elected officials, unclassified and unrepresented employees.
As a defined benefit plan, retirement benefits are determined under the Pension Plan primarily by a member’s class, hire date, age at retirement, number of years of creditable service, and the member’s final compensation. The Pension Plan provides annual cost-of-living adjustments not to exceed 2% to retirees, which is factored into the actuarial assumptions. Increases in retirement benefits due to cost-of-living adjustments do not require voter approval. Final compensation is based upon either the highest salary earned over a consecutive twelve month period, the highest average salary earned over three one-year periods, or the highest salary earned over a consecutive 36 month period, depending on the member’s hire date. To qualify for a service retirement benefit, the Pension Plan requires ten years of service at age 62 for general members (55 for safety members) or 20 years of service at age 55 for general members (50 for safety members), which could include certain service purchased or service earned at a reciprocating government entity. Under Proposition B, sworn police officers have a reduction of 3% per year if retiring earlier than age 55. Retirement benefits are awarded at various rates, ranging from 1.0% to 3.5% per year of service multiplied by final compensation depending on the member’s plan and hire date. The actual percentage of final compensation per year served component of the calculation rises as the employee’s retirement age increases, with the exception of some safety employees and all elected officials, and depends on the retirement option selected by the employee. Some safety members also have the option to elect 3.0% per year of service at age 50 and above, not to exceed 90% of final compensation, as part of the formula to calculate their retirement benefits. The maximum percentage of final compensation per year served is 2.8% for general members, 3% for safety members and 3.5% for elected officers. Depending on the number of years of service, participants of the Elected Officer’s Retirement Pension component of the Pension Plan can retire earlier than the age of 55; however, their retirement allowance is reduced by 2.0% for each year under the age of 55.
151
City of San Diego ComprehenSive annual finanCial report
At June 30, 2016, the most recent actuarial valuation, the following employees were covered by the benefit terms:
Inactive employees or beneficiaries currently receiving benefits 1 9,454 Inactive (Terminated) employees entitled to but not yet receiving benefits 2,865 Active employees 6,748 Total 19,067 1 Inactive employees include Disabled, Retired, and DROP participants.
Deferred Retirement Option Plan (DROP)
DROP is a program designed to allow members an alternate method of accruing additional retirement benefits from the Pension Plan while they continue to work for the City. Only members hired before July 1, 2005 are eligible to participate in DROP. A member must be eligible for a service retirement to enter DROP. In addition, the member may only participate in the program up to a maximum of five years. Members of Local 145 are permitted to extend the five year period by that amount of post-2002 annual leave not converted to service credits. A DROP participant must agree to end employment with the City on or before the end of the selected DROP participation period. The member’s decision to enter DROP is irrevocable.
Upon entering DROP, the participant stops making pension contributions to SDCERS and stops earning service credit. Instead, amounts equivalent to the participant’s retirement benefit plus additional DROP contributions are credited to an interest bearing individual account held in the participant’s name. While participants were employed by the City, the quarterly interest credited to the DROP participant accounts was 1.7% in the first half of fiscal year 2017 and 1.5% in the second half. When the participant leaves DROP and retires from City service, the participant’s DROP account balance may be paid in a lump sum, rolled over to another plan, or converted to monthly payments. The DROP annuity factor used to calculate the monthly payments in the first half of fiscal year 2017 was 3.0% and 2.8% in the second half. During the period of participation, the participant continues to receive employer offered benefits available to regular employees with exception to earning service credit, as previously discussed.
Purchase of Service Credits
Pension Plan members hired prior to July 1, 2005 are permitted to purchase service credits to be used in determining retirement allowances. Members hired after July 1, 2005 are only permitted to purchase service credits related to certain employee absences such as military leave, long-term disability leave and leave taken under the Family Leave Act. The cost of purchased service credits is determined by the SDCERS Board consistent with the requirements of the San Diego Municipal Code (SDMC).
Supplemental Cost-of-Living Benefit
On August 5, 2013, the City Council amended the San Diego Municipal Code to provide a method for funding a supplemental cost-of-living benefit (the “Supplemental COLA”) previously given to a closed group of retirees who retired on or before June 30, 1982. SDCERS holds a reserve separately from plan assets, and pays Supplemental COLA benefits from this reserve. On a yearly basis, the City cash funds the Supplemental COLA reserve based on an estimate of benefits to be paid during the fiscal year. In fiscal year 2017, the City contributed $1,900 towards the Supplemental COLA reserve and paid approximately $1,956 in benefits. As of June 30, 2017, the Supplemental COLA reserve had an unspent balance of $116.
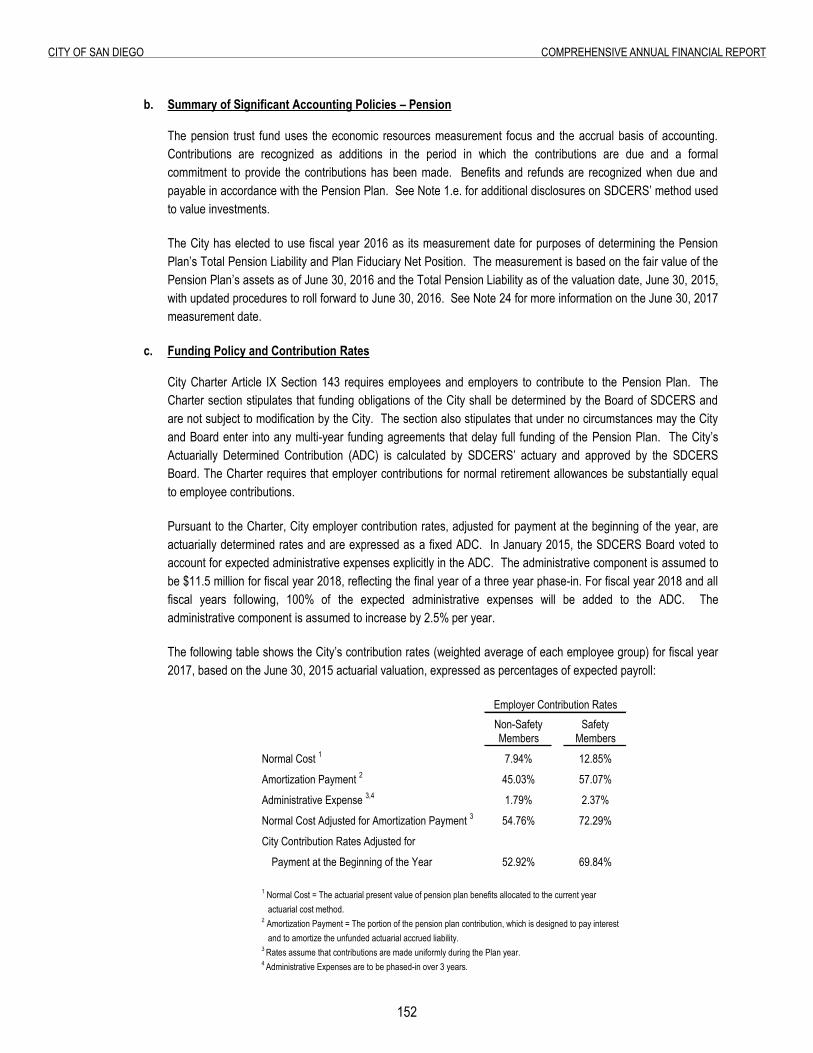
152
City of San Diego ComprehenSive annual finanCial report
b. Summary of Significant Accounting Policies – Pension
The pension trust fund uses the economic resources measurement focus and the accrual basis of accounting. Contributions are recognized as additions in the period in which the contributions are due and a formal commitment to provide the contributions has been made. Benefits and refunds are recognized when due and payable in accordance with the Pension Plan. See Note 1.e. for additional disclosures on SDCERS’ method used to value investments.
The City has elected to use fiscal year 2016 as its measurement date for purposes of determining the Pension Plan’s Total Pension Liability and Plan Fiduciary Net Position. The measurement is based on the fair value of the Pension Plan’s assets as of June 30, 2016 and the Total Pension Liability as of the valuation date, June 30, 2015, with updated procedures to roll forward to June 30, 2016. See Note 24 for more information on the June 30, 2017 measurement date.
c. Funding Policy and Contribution Rates
City Charter Article IX Section 143 requires employees and employers to contribute to the Pension Plan. The Charter section stipulates that funding obligations of the City shall be determined by the Board of SDCERS and are not subject to modification by the City. The section also stipulates that under no circumstances may the City and Board enter into any multi-year funding agreements that delay full funding of the Pension Plan. The City’s Actuarially Determined Contribution (ADC) is calculated by SDCERS’ actuary and approved by the SDCERS Board. The Charter requires that employer contributions for normal retirement allowances be substantially equal to employee contributions.
Pursuant to the Charter, City employer contribution rates, adjusted for payment at the beginning of the year, are actuarially determined rates and are expressed as a fixed ADC. In January 2015, the SDCERS Board voted to account for expected administrative expenses explicitly in the ADC. The administrative component is assumed to be $11.5 million for fiscal year 2018, reflecting the final year of a three year phase-in. For fiscal year 2018 and all fiscal years following, 100% of the expected administrative expenses will be added to the ADC. The administrative component is assumed to increase by 2.5% per year.
The following table shows the City’s contribution rates (weighted average of each employee group) for fiscal year 2017, based on the June 30, 2015 actuarial valuation, expressed as percentages of expected payroll:
Non-Safety SafetyMembers Members
Normal Cost 1 7.94% 12.85%
Amortization Payment 2 45.03% 57.07%
Administrative Expense 3,4 1.79% 2.37%
Normal Cost Adjusted for Amortization Payment 3 54.76% 72.29%
City Contribution Rates Adjusted for
Payment at the Beginning of the Year 52.92% 69.84%
and to amortize the unfunded actuarial accrued liability.
4 Administrative Expenses are to be phased-in over 3 years.
1 Normal Cost = The actuarial present value of pension plan benefits allocated to the current year
2 Amortization Payment = The portion of the pension plan contribution, which is designed to pay interest
Employer Contribution Rates
3 Rates assume that contributions are made uniformly during the Plan year.
actuarial cost method.
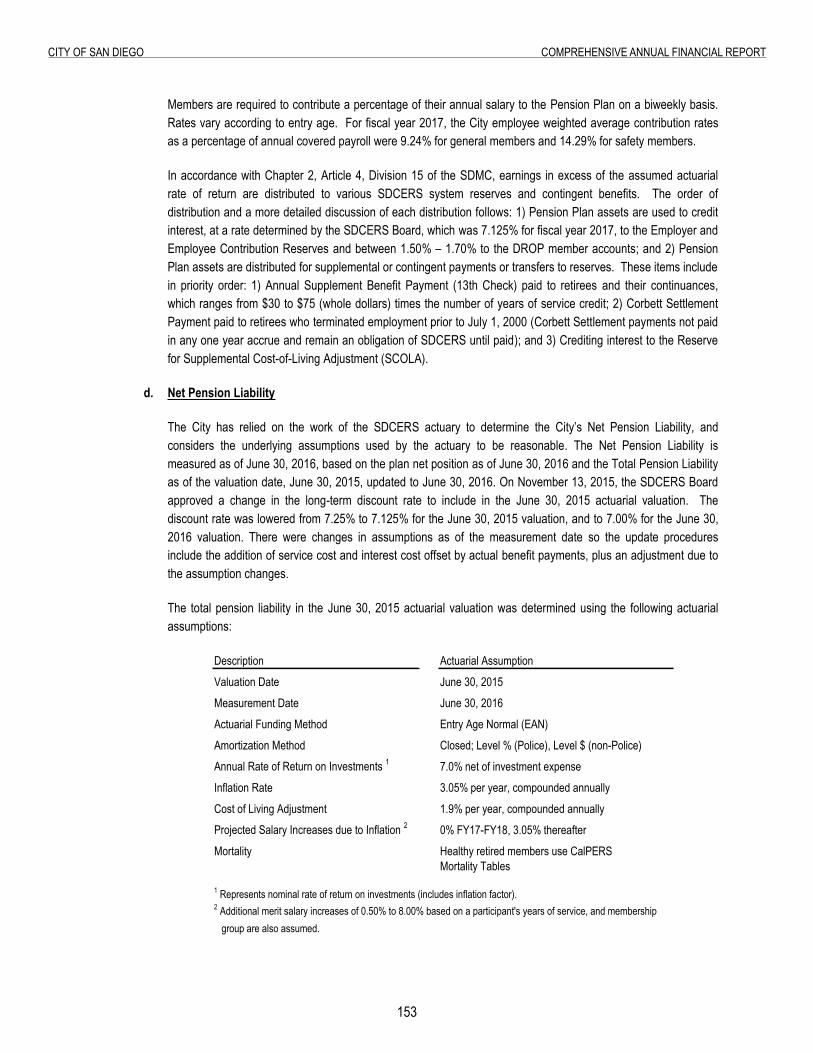
153
City of San Diego ComprehenSive annual finanCial report
Members are required to contribute a percentage of their annual salary to the Pension Plan on a biweekly basis. Rates vary according to entry age. For fiscal year 2017, the City employee weighted average contribution rates as a percentage of annual covered payroll were 9.24% for general members and 14.29% for safety members.
In accordance with Chapter 2, Article 4, Division 15 of the SDMC, earnings in excess of the assumed actuarial rate of return are distributed to various SDCERS system reserves and contingent benefits. The order of distribution and a more detailed discussion of each distribution follows: 1) Pension Plan assets are used to credit interest, at a rate determined by the SDCERS Board, which was 7.125% for fiscal year 2017, to the Employer and Employee Contribution Reserves and between 1.50% – 1.70% to the DROP member accounts; and 2) Pension Plan assets are distributed for supplemental or contingent payments or transfers to reserves. These items include in priority order: 1) Annual Supplement Benefit Payment (13th Check) paid to retirees and their continuances, which ranges from $30 to $75 (whole dollars) times the number of years of service credit; 2) Corbett Settlement Payment paid to retirees who terminated employment prior to July 1, 2000 (Corbett Settlement payments not paid in any one year accrue and remain an obligation of SDCERS until paid); and 3) Crediting interest to the Reserve for Supplemental Cost-of-Living Adjustment (SCOLA).
d. Net Pension Liability
The City has relied on the work of the SDCERS actuary to determine the City’s Net Pension Liability, and considers the underlying assumptions used by the actuary to be reasonable. The Net Pension Liability is measured as of June 30, 2016, based on the plan net position as of June 30, 2016 and the Total Pension Liability as of the valuation date, June 30, 2015, updated to June 30, 2016. On November 13, 2015, the SDCERS Board approved a change in the long-term discount rate to include in the June 30, 2015 actuarial valuation. The discount rate was lowered from 7.25% to 7.125% for the June 30, 2015 valuation, and to 7.00% for the June 30, 2016 valuation. There were changes in assumptions as of the measurement date so the update procedures include the addition of service cost and interest cost offset by actual benefit payments, plus an adjustment due to the assumption changes.
The total pension liability in the June 30, 2015 actuarial valuation was determined using the following actuarial assumptions:
Description Actuarial Assumption
Valuation Date June 30, 2015
Measurement Date June 30, 2016
Actuarial Funding Method Entry Age Normal (EAN)
Amortization Method Closed; Level % (Police), Level $ (non-Police)Annual Rate of Return on Investments 1 7.0% net of investment expense
Inflation Rate 3.05% per year, compounded annually
Cost of Living Adjustment 1.9% per year, compounded annuallyProjected Salary Increases due to Inflation 2 0% FY17-FY18, 3.05% thereafter
Mortality Healthy retired members use CalPERS Mortality Tables
1 Represents nominal rate of return on investments (includes inflation factor). 2 Additional merit salary increases of 0.50% to 8.00% based on a participant's years of service, and membership group are also assumed.
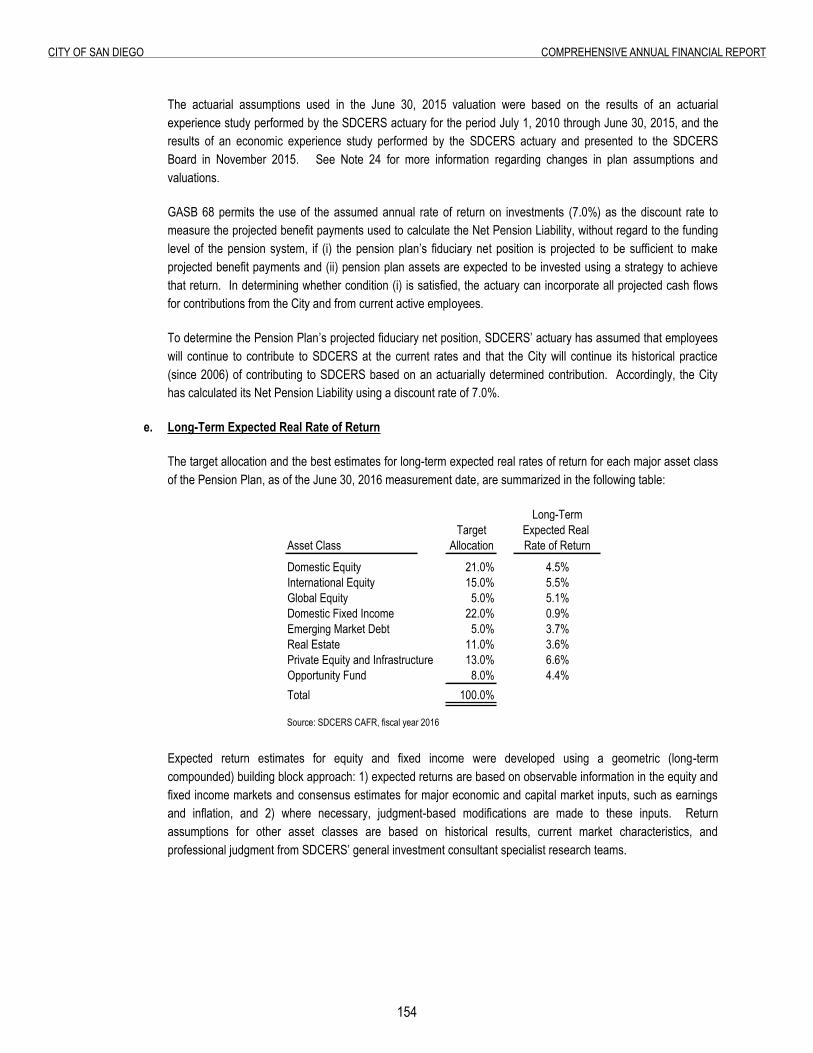
15�
City of San Diego ComprehenSive annual finanCial report
The actuarial assumptions used in the June 30, 2015 valuation were based on the results of an actuarial experience study performed by the SDCERS actuary for the period July 1, 2010 through June 30, 2015, and the results of an economic experience study performed by the SDCERS actuary and presented to the SDCERS Board in November 2015. See Note 24 for more information regarding changes in plan assumptions and valuations.
GASB 68 permits the use of the assumed annual rate of return on investments (7.0%) as the discount rate to measure the projected benefit payments used to calculate the Net Pension Liability, without regard to the funding level of the pension system, if (i) the pension plan’s fiduciary net position is projected to be sufficient to make projected benefit payments and (ii) pension plan assets are expected to be invested using a strategy to achieve that return. In determining whether condition (i) is satisfied, the actuary can incorporate all projected cash flows for contributions from the City and from current active employees.
To determine the Pension Plan’s projected fiduciary net position, SDCERS’ actuary has assumed that employees will continue to contribute to SDCERS at the current rates and that the City will continue its historical practice (since 2006) of contributing to SDCERS based on an actuarially determined contribution. Accordingly, the City has calculated its Net Pension Liability using a discount rate of 7.0%.
e. Long-Term Expected Real Rate of Return
The target allocation and the best estimates for long-term expected real rates of return for each major asset class of the Pension Plan, as of the June 30, 2016 measurement date, are summarized in the following table:
Long-TermTarget Expected Real
Asset Class Allocation Rate of ReturnDomestic Equity 21.0% 4.5%International Equity 15.0% 5.5%Global Equity 5.0% 5.1%Domestic Fixed Income 22.0% 0.9%Emerging Market Debt 5.0% 3.7%Real Estate 11.0% 3.6%Private Equity and Infrastructure 13.0% 6.6%Opportunity Fund 8.0% 4.4%Total 100.0%
Source: SDCERS CAFR, fiscal year 2016
Expected return estimates for equity and fixed income were developed using a geometric (long-term compounded) building block approach: 1) expected returns are based on observable information in the equity and fixed income markets and consensus estimates for major economic and capital market inputs, such as earnings and inflation, and 2) where necessary, judgment-based modifications are made to these inputs. Return assumptions for other asset classes are based on historical results, current market characteristics, and professional judgment from SDCERS’ general investment consultant specialist research teams.
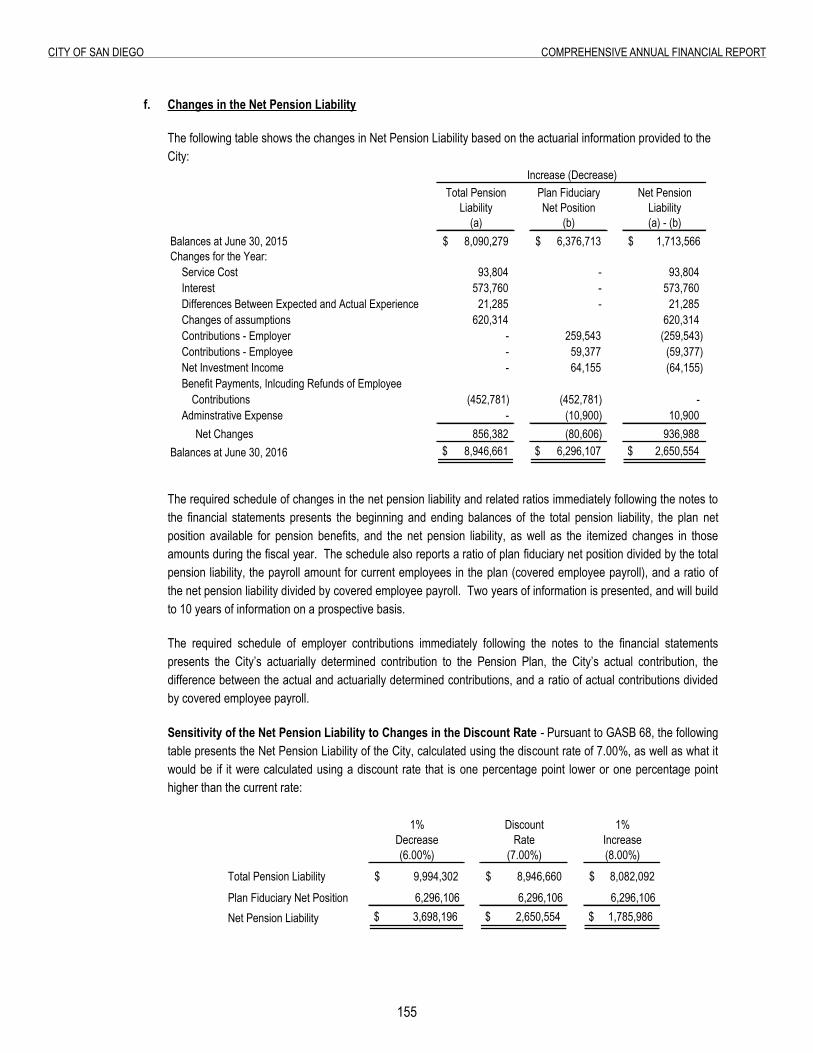
155
City of San Diego ComprehenSive annual finanCial report
f. Changes in the Net Pension Liability The following table shows the changes in Net Pension Liability based on the actuarial information provided to the City:
Increase (Decrease)Total Pension Plan Fiduciary Net Pension
Liability Net Position Liability(a) (b) (a) - (b)
Balances at June 30, 2015 8,090,279$ 6,376,713$ 1,713,566$ Changes for the Year:
Service Cost 93,804 - 93,804 Interest 573,760 - 573,760 Differences Between Expected and Actual Experience 21,285 - 21,285 Changes of assumptions 620,314 620,314 Contributions - Employer - 259,543 (259,543)Contributions - Employee - 59,377 (59,377)Net Investment Income - 64,155 (64,155)Benefit Payments, Inlcuding Refunds of Employee
Contributions (452,781) (452,781) - Adminstrative Expense - (10,900) 10,900 Net Changes 856,382 (80,606) 936,988
Balances at June 30, 2016 $ 8,946,661 $ 6,296,107 $ 2,650,554
The required schedule of changes in the net pension liability and related ratios immediately following the notes to the financial statements presents the beginning and ending balances of the total pension liability, the plan net position available for pension benefits, and the net pension liability, as well as the itemized changes in those amounts during the fiscal year. The schedule also reports a ratio of plan fiduciary net position divided by the total pension liability, the payroll amount for current employees in the plan (covered employee payroll), and a ratio of the net pension liability divided by covered employee payroll. Two years of information is presented, and will build to 10 years of information on a prospective basis.
The required schedule of employer contributions immediately following the notes to the financial statements presents the City’s actuarially determined contribution to the Pension Plan, the City’s actual contribution, the difference between the actual and actuarially determined contributions, and a ratio of actual contributions divided by covered employee payroll.
Sensitivity of the Net Pension Liability to Changes in the Discount Rate - Pursuant to GASB 68, the following table presents the Net Pension Liability of the City, calculated using the discount rate of 7.00%, as well as what it would be if it were calculated using a discount rate that is one percentage point lower or one percentage point higher than the current rate:
1% Discount 1%Decrease Rate Increase(6.00%) (7.00%) (8.00%)
Total Pension Liability 9,994,302$ 8,946,660$ 8,082,092$
Plan Fiduciary Net Position 6,296,106 6,296,106 6,296,106 Net Pension Liability $ 3,698,196 $ 2,650,554 $ 1,785,986
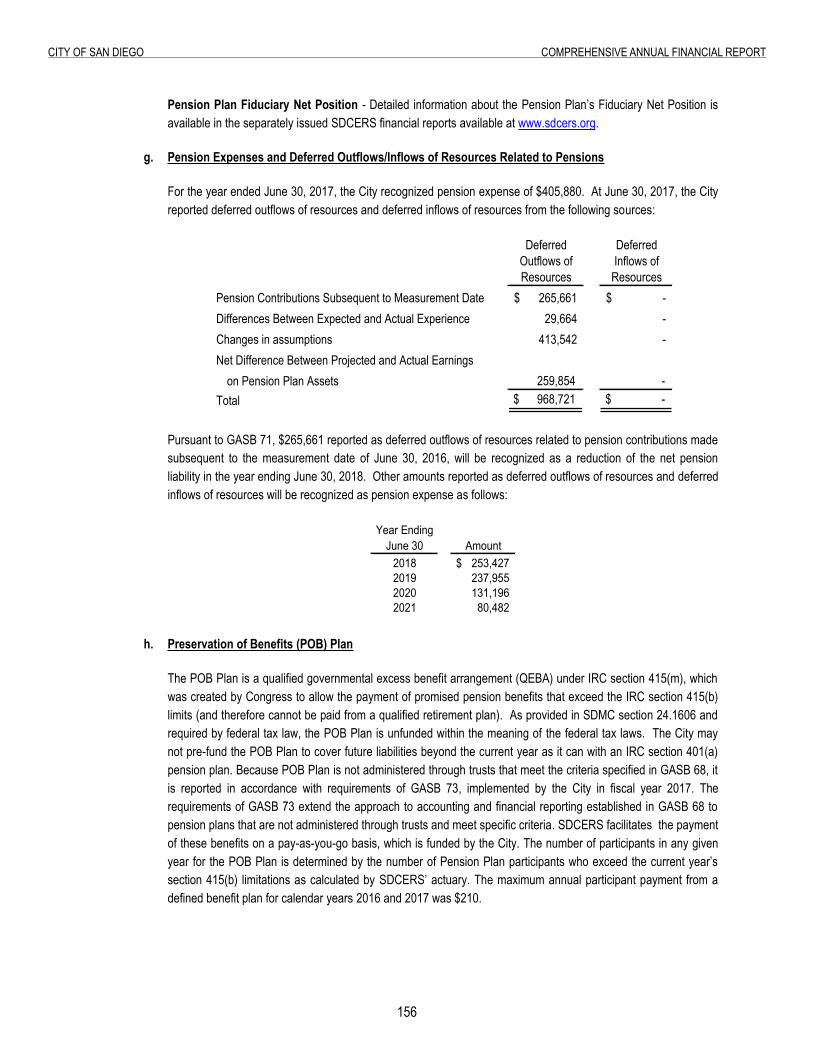
156
City of San Diego ComprehenSive annual finanCial report
Pension Plan Fiduciary Net Position - Detailed information about the Pension Plan’s Fiduciary Net Position is available in the separately issued SDCERS financial reports available at www.sdcers.org.
g. Pension Expenses and Deferred Outflows/Inflows of Resources Related to Pensions
For the year ended June 30, 2017, the City recognized pension expense of $405,880. At June 30, 2017, the City reported deferred outflows of resources and deferred inflows of resources from the following sources:
Deferred DeferredOutflows of Inflows ofResources Resources
Pension Contributions Subsequent to Measurement Date 265,661$ -$ Differences Between Expected and Actual Experience 29,664 - Changes in assumptions 413,542 - Net Difference Between Projected and Actual Earnings
on Pension Plan Assets 259,854 - Total $ 968,721 $ -
Pursuant to GASB 71, $265,661 reported as deferred outflows of resources related to pension contributions made subsequent to the measurement date of June 30, 2016, will be recognized as a reduction of the net pension liability in the year ending June 30, 2018. Other amounts reported as deferred outflows of resources and deferred inflows of resources will be recognized as pension expense as follows:
Year EndingJune 30 Amount
2018 253,427$ 2019 237,955 2020 131,196 2021 80,482
h. Preservation of Benefits (POB) Plan
The POB Plan is a qualified governmental excess benefit arrangement (QEBA) under IRC section 415(m), which was created by Congress to allow the payment of promised pension benefits that exceed the IRC section 415(b) limits (and therefore cannot be paid from a qualified retirement plan). As provided in SDMC section 24.1606 and required by federal tax law, the POB Plan is unfunded within the meaning of the federal tax laws. The City may not pre-fund the POB Plan to cover future liabilities beyond the current year as it can with an IRC section 401(a) pension plan. Because POB Plan is not administered through trusts that meet the criteria specified in GASB 68, it is reported in accordance with requirements of GASB 73, implemented by the City in fiscal year 2017. The requirements of GASB 73 extend the approach to accounting and financial reporting established in GASB 68 to pension plans that are not administered through trusts and meet specific criteria. SDCERS facilitates the payment of these benefits on a pay-as-you-go basis, which is funded by the City. The number of participants in any given year for the POB Plan is determined by the number of Pension Plan participants who exceed the current year’s section 415(b) limitations as calculated by SDCERS’ actuary. The maximum annual participant payment from a defined benefit plan for calendar years 2016 and 2017 was $210.
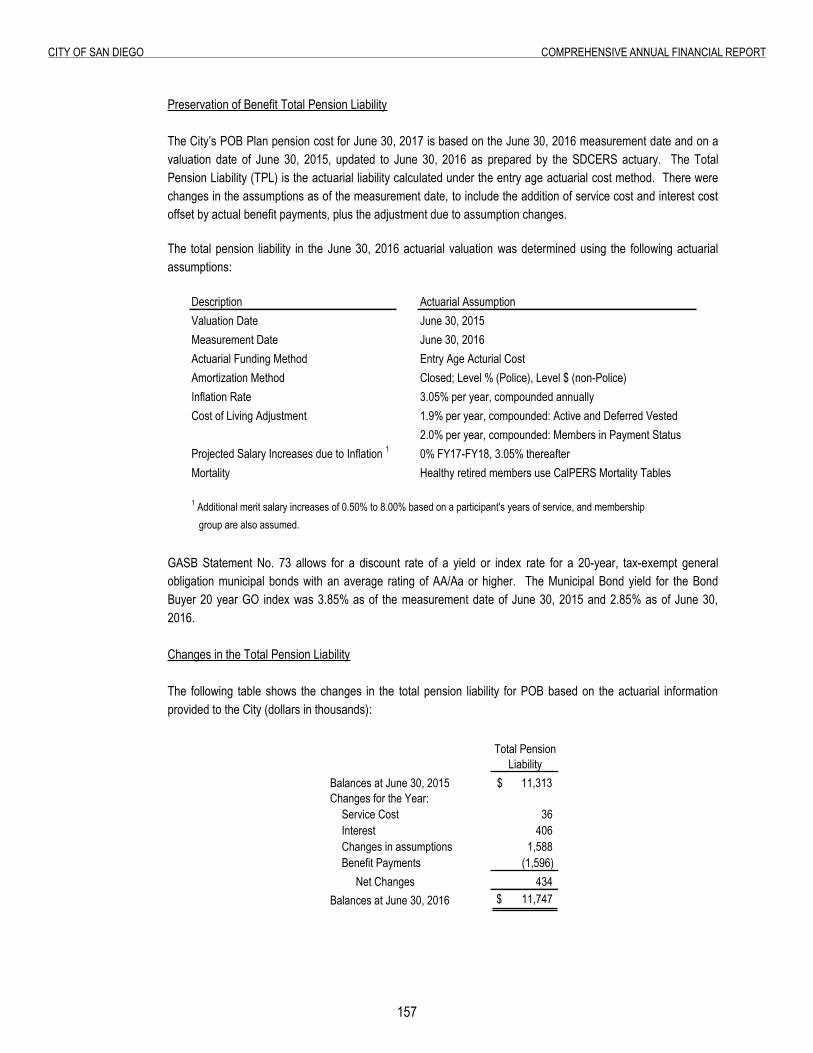
157
City of San Diego ComprehenSive annual finanCial report
Preservation of Benefit Total Pension Liability The City’s POB Plan pension cost for June 30, 2017 is based on the June 30, 2016 measurement date and on a valuation date of June 30, 2015, updated to June 30, 2016 as prepared by the SDCERS actuary. The Total Pension Liability (TPL) is the actuarial liability calculated under the entry age actuarial cost method. There were changes in the assumptions as of the measurement date, to include the addition of service cost and interest cost offset by actual benefit payments, plus the adjustment due to assumption changes.
The total pension liability in the June 30, 2016 actuarial valuation was determined using the following actuarial assumptions:
Description Actuarial AssumptionValuation Date June 30, 2015Measurement Date June 30, 2016Actuarial Funding Method Entry Age Acturial CostAmortization Method Closed; Level % (Police), Level $ (non-Police)Inflation Rate 3.05% per year, compounded annuallyCost of Living Adjustment 1.9% per year, compounded: Active and Deferred Vested
2.0% per year, compounded: Members in Payment StatusProjected Salary Increases due to Inflation 1 0% FY17-FY18, 3.05% thereafterMortality Healthy retired members use CalPERS Mortality Tables
1 Additional merit salary increases of 0.50% to 8.00% based on a participant's years of service, and membership group are also assumed.
GASB Statement No. 73 allows for a discount rate of a yield or index rate for a 20-year, tax-exempt general obligation municipal bonds with an average rating of AA/Aa or higher. The Municipal Bond yield for the Bond Buyer 20 year GO index was 3.85% as of the measurement date of June 30, 2015 and 2.85% as of June 30, 2016. Changes in the Total Pension Liability The following table shows the changes in the total pension liability for POB based on the actuarial information provided to the City (dollars in thousands):
Total PensionLiability
Balances at June 30, 2015 11,313$ Changes for the Year:
Service Cost 36 Interest 406 Changes in assumptions 1,588 Benefit Payments (1,596) Net Changes 434
Balances at June 30, 2016 $ 11,747
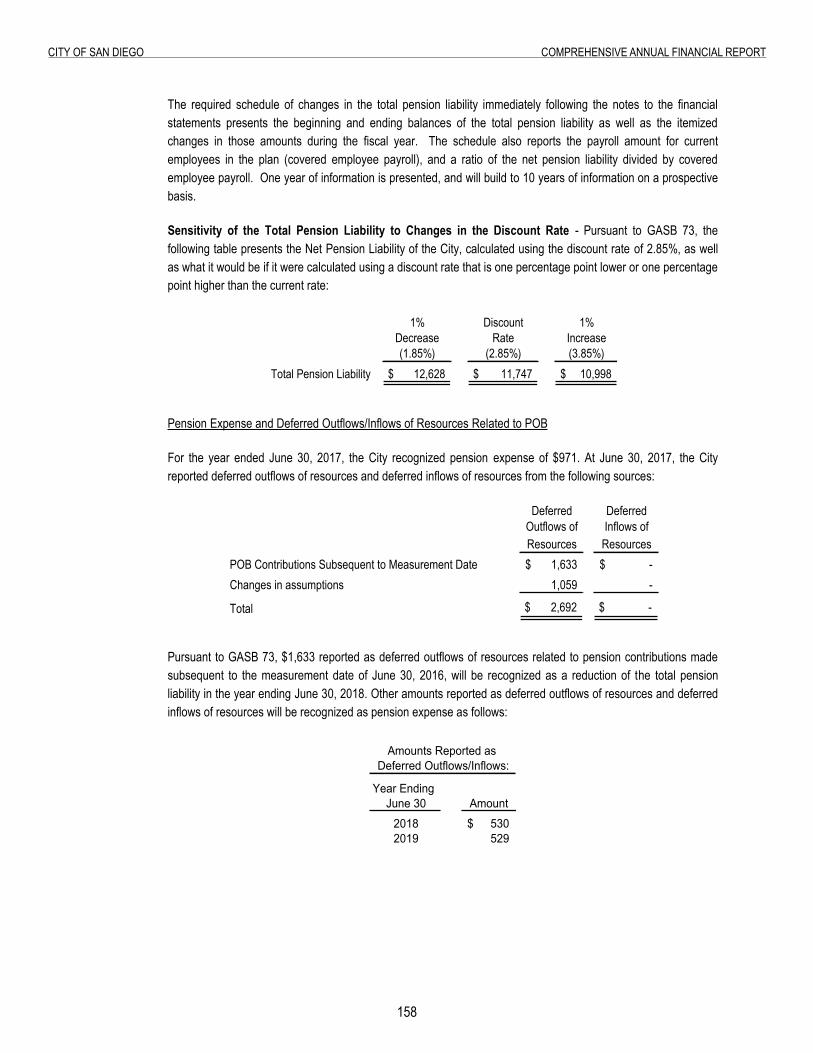
158
City of San Diego ComprehenSive annual finanCial report
The required schedule of changes in the total pension liability immediately following the notes to the financial statements presents the beginning and ending balances of the total pension liability as well as the itemized changes in those amounts during the fiscal year. The schedule also reports the payroll amount for current employees in the plan (covered employee payroll), and a ratio of the net pension liability divided by covered employee payroll. One year of information is presented, and will build to 10 years of information on a prospective basis.
Sensitivity of the Total Pension Liability to Changes in the Discount Rate - Pursuant to GASB 73, the following table presents the Net Pension Liability of the City, calculated using the discount rate of 2.85%, as well as what it would be if it were calculated using a discount rate that is one percentage point lower or one percentage point higher than the current rate:
1% Discount 1%Decrease Rate Increase(1.85%) (2.85%) (3.85%)
Total Pension Liability 12,628$ 11,747$ 10,998$
Pension Expense and Deferred Outflows/Inflows of Resources Related to POB
For the year ended June 30, 2017, the City recognized pension expense of $971. At June 30, 2017, the City reported deferred outflows of resources and deferred inflows of resources from the following sources:
Deferred DeferredOutflows of Inflows ofResources Resources
POB Contributions Subsequent to Measurement Date 1,633$ -$ Changes in assumptions 1,059 -
Total $ 2,692 $ -
Pursuant to GASB 73, $1,633 reported as deferred outflows of resources related to pension contributions made subsequent to the measurement date of June 30, 2016, will be recognized as a reduction of the total pension liability in the year ending June 30, 2018. Other amounts reported as deferred outflows of resources and deferred inflows of resources will be recognized as pension expense as follows:
Amounts Reported as Deferred Outflows/Inflows:
Year EndingJune 30 Amount
2018 530$ 2019 529
159
City of San Diego ComprehenSive annual finanCial report
DEFINED CONTRIBUTION PLANS a. Supplemental Pension Savings Plan - City
Pursuant to the City’s withdrawal from the Federal Social Security System effective January 8, 1982, the City established the Supplemental Pension Savings Plan (SPSP). Pursuant to the Federal Government’s mandate of a Social Security Medicare tax for all employees not covered by Social Security hired on or after April 1, 1986, the City established the Supplemental Pension Savings Plan-Medicare (SPSP-M). The SPSP and SPSP-M were merged into a single plan (SPSP) on November 12, 2004 for administrative simplification, without a change in benefits. Pursuant to the requirements of the Omnibus Budget Reconciliation Act of 1990 (OBRA-90) requiring employee coverage under a retirement system in lieu of coverage under the Federal Insurance Contributions Act (FICA) effective July 1, 1991, the City Council established the Supplemental Pension Savings Plan-Hourly (SPSP-H). These supplemental plans are defined contribution plans administered by Wells Fargo to provide pension benefits for eligible employees. The City Council can amend any provisions of the plans that are not part of any employee’s vested retirement benefit. If the City amends any non-legally mandated provisions, it must first comply with procedural requirements, including collective bargaining under the Meyers-Millas-Brown Act and for the SPSP plan, after approval by a simple majority vote of all active members. There are no plan members who belong to an entity other than the City. In a defined contribution plan, benefits depend solely on amounts contributed to the plan plus investment earnings, less investment losses. The City’s general members, lifeguard members and elected officers participate in the plan. Eligible employees may participate from the date of employment; however, the SPSP plan was closed to general and lifeguard members hired on or after July 1, 2009 and January 1, 2011, respectively. The following table details plan participation as of June 30, 2017:
Plan ParticipantsSPSP 6,083SPSP-H 7,560
The SPSP requires that both the employee and the City contribute an amount equal to 3% of the employee’s total salary each pay period. Participants in the plan hired before July 1, 1986 may voluntarily contribute up to an additional 4.5% and participants hired on or after July 1, 1986 may voluntarily contribute up to an additional 3.05% of total salary, with the City matching each. Hourly employees contribute 3.75% on a mandatory basis, which is matched by City contributions except for employees represented by the MEA and the California Teamsters Local 911. The match for these employees was 6% during fiscal year 2017. Under the SPSP, the City’s contributions for each employee (and interest allocated to the employee’s account) are fully vested after five years of continuous service at a rate of 20% for each year of service. Hourly employees are immediately 100% vested. The unvested portion of City contributions and interest forfeited by employees who leave employment before five years of service are used to reduce the City’s SPSP cost. 401(a) Plan Under Proposition B - Proposition B amended the City Charter to provide all new City employees initially hired on or after July 20, 2012, except sworn police officers, with a 401(a) plan that is administered along with SPSP but with different contribution rates, vesting periods and employer match. Non-public safety employees contribute an amount equal to 9.2% of salary, and firefighters, lifeguards, and police recruits contribute 11% of salary (including overtime) on a mandatory basis. The City matches all such contributions and contributions are fully vested immediately upon employment. Police recruits participate in SDCERS upon acceptance of full-time police employment. Due to ongoing litigation regarding Proposition B, the City has not established a new plan for eligible employees. Instead, the City has contributed funds to SPSP-H, an existing 401(a) plan, to eligible employees in accordance with the SPSP-H plan provisions. The City will continue to contribute funds for such employees through the SPSP-H, pending resolution of Proposition B litigation.
160
City of San Diego ComprehenSive annual finanCial report
In fiscal year 2017, the City and the covered employees contributed $31,570 and $31,240, respectively, including contributions made under the 401(a) Plan under Proposition B. The City also recognized approximately $45 in forfeitures. As of June 30, 2017, the plan fiduciary net position totaled $747,936. SPSP, which includes SPSP-H, is considered part of the City’s financial reporting entity and is reported as a pension trust fund.
b. 401(a) Plan - City
The City Council established a 401(a) Plan for all General Member employees hired on or after July 1, 2009 and before July 20, 2012. The 401(a) Plan is a defined contribution plan administered by Wells Fargo to provide pension benefits for eligible employees. Employees are eligible to participate from the date of employment and are immediately 100% vested. Employees contribute 1% on a mandatory basis, which is matched by City contributions. Additionally, employees can make voluntary contributions to their 401(a) Plan accounts through payroll deductions not to exceed IRS limits. Voluntary contributions to the plan are not matched by the City. The City Council can amend any provisions of the plan that are not part of any employee’s vested retirement benefit. However, if the City amends any non-vested provisions, it must first comply with procedural requirements, including collective bargaining under the Meyers-Millais-Brown Act.
The City and employees contributed $391 and $546, respectively, during the year ended June 30, 2017. As of June 30, 2017, the plan fiduciary net position totaled $5,013. The 401(a) Plan is considered part of the City’s financial reporting entity and is reported as a pension trust fund.
c. 401(k) Plan - City
The City Council established a 401(k) Plan effective July 1, 1985. The 401(k) Plan is a defined contribution plan administered by Wells Fargo to provide retirement benefits for eligible employees. Employees are eligible to participate from the date of employment. Employees make contributions to their 401(k) Plan accounts through payroll deductions. The City Council can amend any provisions of the plan that are not part of any employee’s vested retirement benefit. However, if the City amends any non-vested provisions, it must first comply with procedural requirements, including collective bargaining under the Meyers-Millais-Brown Act.
The employees’ 401(k) contributions are based on IRS calendar year limits. Employees contributed $23,619 during the year ended June 30, 2017. There is no City contribution towards the 401(k) Plan. As of June 30, 2017, the plan fiduciary net position totaled $375,488. The 401(k) Plan is considered part of the City’s financial reporting entity and is reported as a pension trust fund.
Narratives presented in the following sections (d. through g.) are taken directly from the fiscal year 2017 annual financial reports of the corresponding entity (certain terms have been modified to conform to the City’s CAFR presentation).
d. Pension Plan - Civic San Diego
CSD sponsors a 403(b) tax deferred retirement plan (Plan) of the Internal Revenue Code of 1986, which is provided to all full-time regular employees. The Plan is a defined contribution plan under which benefits depend solely on amounts contributed to the Plan by the employer and the employees, plus investment earnings. All full-time regular employees are eligible to participate on their first day of employment and contribute an amount equal to 7.5% of their semi-monthly compensation.
Effective on the first payroll following three months of employment, CSD contributes an amount equal to 12% of the total semi-monthly compensation for all full-time regular employees. CSD’s contributions for each employee are fully vested at the time of contribution. CSD’s total payroll (excluding benefits) for fiscal year 2017 was
161
City of San Diego ComprehenSive annual finanCial report
$3,247. CSD’s contributions were calculated based on the Plan’s total defined compensation amounts for all eligible employees, which totaled $3,199. CSD made its required contribution amounting to $377 for fiscal year 2017.
The fiduciary responsibilities of CSD consist of making timely contributions and remitting deposits collected. The Plan is not a component unit of CSD and is therefore not reported in the basic financial statements.
CSD defined that an eligible participant is a permanent and full-time employee that normally works at least 30 hours per week. An employee is considered to work at least 30 hours per week, if for the 12-month period beginning on the date the employee’s employment commenced, CSD reasonably expects the employee to work at least 1,500 service hours and, for each Plan year ending after the close of that 12-month period, the employee has worked at least 1,500 service hours.
e. Pension Plan - San Diego Convention Center Corporation
The SDCCC Money Purchase Pension Plan (SDCCC Plan) is a governmental plan under IRC section 414(d), which was established effective January 1, 1986, by SDCCC’s Board of Directors. The SDCCC Plan is administered by SDCCC through a Defined Contribution Committee, represented by the SDCCC Board and staff, who act by a majority of its members in office to carry out the general administration of the plan. Any recommended plan amendments are subject to the approval and adoption by SDCCC’s Board of Directors. As part of the SDCCC Plan, SDCCC through Board action selected Wells Fargo & Company as Trustee, to hold and administer plan assets subject to the terms of the SDCCC Plan. The SDCCC Plan is a qualified defined contribution plan and as such, benefits depend on amounts contributed to the plan plus investment earnings less allowable plan expenses. The SDCCC Plan covers all employees who have completed at least 1,000 or more hours of service in one year and are not covered through a union retirement plan. Employees are eligible to participate in the SDCCC Plan on the first day of the month after completion of 1,000 hours of service during the twelve-month period beginning from the employee’s hire date (or during any subsequent plan year). For each plan year, SDCCC contributes 10% of compensation paid after becoming an eligible participant, which is transferred to the trustee on behalf of each qualifying individual.
SDCCC’s Plan year is defined as a calendar year. The balance in the SDCCC Plan for each eligible employee is vested gradually over five years of continuing service with an eligible employee becoming fully vested after five years. Forfeitures and SDCCC Plan expenses are allocated in accordance with SDCCC Plan provisions. For the year ended June 30, 2017, pension expense amounted to $1,241, with no employee contributions made to the SDCCC Plan. Included in pension expense were forfeitures in the amount of $3. SDCCC records pension expense during the fiscal year based upon employee compensation that is included in gross compensation.
The City does not act in a trustee or agency capacity for the SDCCC Plan; therefore, these assets are not reported within the City’s basic financial statements.
f. Pension Plan - San Diego Housing Commission
SDHC provides a pension plan b through a defined contribution plan intended to be a “governmental plan” as by Section 411(s) (1) (A) and 414(d) of the IRC and Section 3(32) of employee Retirement Income Security Act of 1974 as amended (ERISA). The SDHC plan covers permanent full time and permanent part time (at least 20 hours per week). In a defined contribution plan, benefits depend solely on amounts contributed to the plan plus investment earnings. Employees are eligible to participate on the first day of their employment. SDHC’s contributions for each employee (and interest allocated to the employee’s account) are fully vested after four years of continuous service, with a year of service defined as completing at least 1,000 hours of service. SDHC’s
162
City of San Diego ComprehenSive annual finanCial report
contributions for, and interest forfeited by, employees who leave employment before four years of service are used to reduce SDHC’s current-period contribution requirement.
The SDHC retirement pension benefit is available at 62nd birthday or upon termination or disability. Distributions must commence no later than April 1st of the calendar year in which the participant attains age seventy and one-half years of age.
The SDHC Plan has a third party fiduciary, Retirement Benefits Group, and is administered by SDHC, with outside recordkeeping performed by Transamerica. SDHC has the authority to establish and amend the provisions of the SDHC Plan, including the contribution requirements, with the approval of the Board of Commissioners. The SDHC Plan is audited by an outside firm and a copy of the report can be obtained by contacting the San Diego Housing Commission at 1122 Broadway, Suite 300, San Diego, California 92101.
SDHC’s covered payroll in fiscal year 2017 was $20,852. SDHC made its required 14% contribution in the amount of $2,919 and plan members contributed $159 for the year ended June 30, 2017.
The City does not act in a trustee or agency capacity for the SDHC Plan; therefore, these assets are not reported within the City’s basic financial statements.
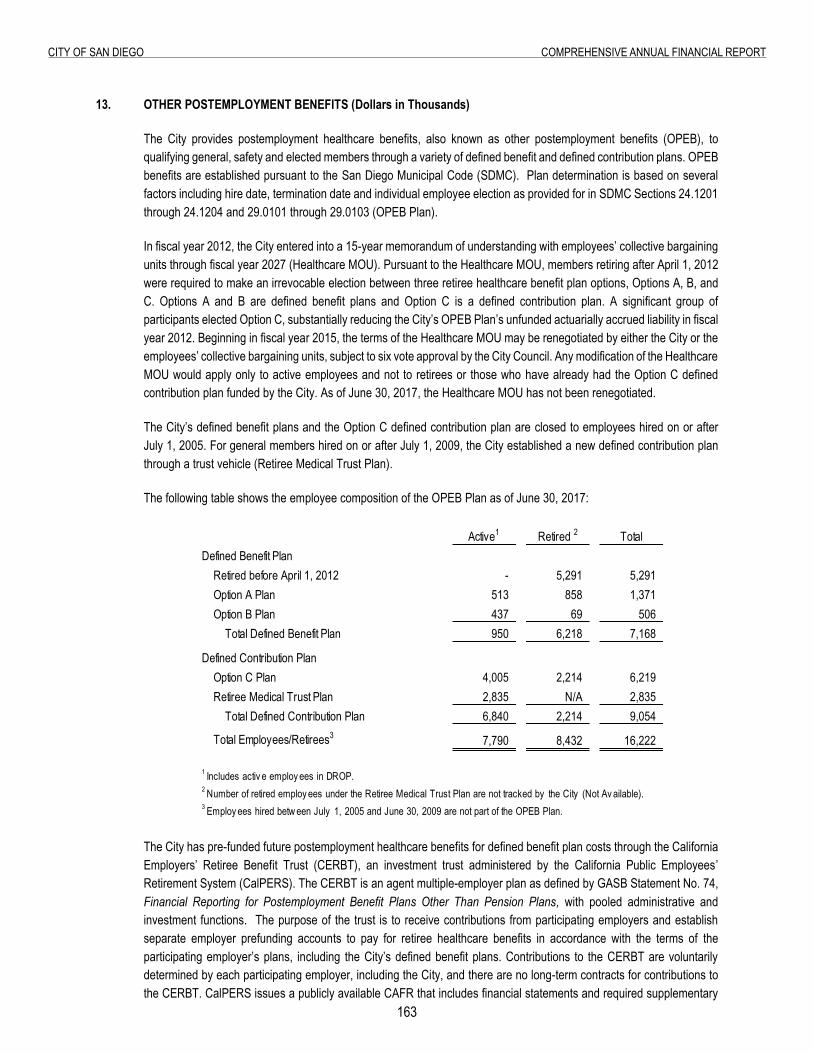
163
City of San Diego ComprehenSive annual finanCial report
13. Other Postemployment Benefits
13. OTHER POSTEMPLOYMENT BENEFITS (Dollars in Thousands)
The City provides postemployment healthcare benefits, also known as other postemployment benefits (OPEB), to qualifying general, safety and elected members through a variety of defined benefit and defined contribution plans. OPEB benefits are established pursuant to the San Diego Municipal Code (SDMC). Plan determination is based on several factors including hire date, termination date and individual employee election as provided for in SDMC Sections 24.1201 through 24.1204 and 29.0101 through 29.0103 (OPEB Plan).
In fiscal year 2012, the City entered into a 15-year memorandum of understanding with employees’ collective bargaining units through fiscal year 2027 (Healthcare MOU). Pursuant to the Healthcare MOU, members retiring after April 1, 2012 were required to make an irrevocable election between three retiree healthcare benefit plan options, Options A, B, and C. Options A and B are defined benefit plans and Option C is a defined contribution plan. A significant group of participants elected Option C, substantially reducing the City’s OPEB Plan’s unfunded actuarially accrued liability in fiscal year 2012. Beginning in fiscal year 2015, the terms of the Healthcare MOU may be renegotiated by either the City or the employees’ collective bargaining units, subject to six vote approval by the City Council. Any modification of the Healthcare MOU would apply only to active employees and not to retirees or those who have already had the Option C defined contribution plan funded by the City. As of June 30, 2017, the Healthcare MOU has not been renegotiated.
The City’s defined benefit plans and the Option C defined contribution plan are closed to employees hired on or after July 1, 2005. For general members hired on or after July 1, 2009, the City established a new defined contribution plan through a trust vehicle (Retiree Medical Trust Plan).
The following table shows the employee composition of the OPEB Plan as of June 30, 2017:
Active1 Retired 2 TotalDefined Benefit Plan
Retired before April 1, 2012 - 5,291 5,291 Option A Plan 513 858 1,371 Option B Plan 437 69 506
Total Defined Benefit Plan 950 6,218 7,168
Defined Contribution PlanOption C Plan 4,005 2,214 6,219 Retiree Medical Trust Plan 2,835 N/A 2,835
Total Defined Contribution Plan 6,840 2,214 9,054
Total Employees/Retirees3 7,790 8,432 16,222
1 Includes activ e employ ees in DROP.2 Number of retired employ ees under the Retiree Medical Trust Plan are not tracked by the City (Not Av ailable).3 Employ ees hired betw een July 1, 2005 and June 30, 2009 are not part of the OPEB Plan.
The City has pre-funded future postemployment healthcare benefits for defined benefit plan costs through the California Employers’ Retiree Benefit Trust (CERBT), an investment trust administered by the California Public Employees’ Retirement System (CalPERS). The CERBT is an agent multiple-employer plan as defined by GASB Statement No. 74, Financial Reporting for Postemployment Benefit Plans Other Than Pension Plans, with pooled administrative and investment functions. The purpose of the trust is to receive contributions from participating employers and establish separate employer prefunding accounts to pay for retiree healthcare benefits in accordance with the terms of the participating employer’s plans, including the City’s defined benefit plans. Contributions to the CERBT are voluntarily determined by each participating employer, including the City, and there are no long-term contracts for contributions to the CERBT. CalPERS issues a publicly available CAFR that includes financial statements and required supplementary
16�
City of San Diego ComprehenSive annual finanCial report
information for the CERBT, which can be found online at www.calpers.ca.gov. The City’s OPEB Plan does not issue a separate annual financial report.
DEFINED BENEFIT PLANS
a. Plan Description Pursuant to the SDMC, SDCERS processes health insurance premium payments and healthcare reimbursement requests pertaining to the City’s retiree healthcare defined benefit plans for eligible retirees. This activity and related balances are reported in the SDCERS CAFR as an agency fund. Postemployment healthcare benefits for members retiring from City employment are based on their health eligibility status. Members receiving defined retiree healthcare benefits can be categorized into four main groups as described below:
I. Limited Retiree Health Benefit - Members who retired before October 6, 1980 and are eligible to receive a retirement allowance from SDCERS are entitled to be reimbursed up to $1,2001 per year for health insurance costs. The retired members are not reimbursed more than the actual health premium or medical costs he or she incurs. This amount does not increase.
II. Plan for members who retired between 1980 and 2012 - Members who retired between October 6, 1980 and March 31, 2012 require 10 years of service with the City to receive 50% of the retiree health reimbursement allowance and receive an additional 5% per year of service in excess of 10 years, resulting in a maximum benefit of 100% at 20 years of service. Reimbursement allowances vary based on retirement date and Medicare eligibility. Medicare eligible retirees under this plan are entitled to receive reimbursement of healthcare premiums, ranging from approximately $8,400¹ to $12,400¹ per year. Retirees who are not eligible for Medicare are entitled to receive reimbursement of healthcare premiums, ranging from approximately $8,900¹ to $13,200¹ per year. Retirees under this plan can obtain health insurance coverage with the plan of their choice, including any City sponsored, union sponsored, or privately secured health plan. Reimbursements for certain retirees under this plan are adjusted annually based upon the projected increase for National Health Expenditures by the Centers for Medicare and Medicaid Services (Annual Inflator). Annual adjustments may not exceed 10% for any plan year. In addition, 100% of Medicare Part B premiums are reimbursed, including income related increases to the standard Part B premium amount. Disabled retirees are eligible for the maximum allowance regardless of years of eligible service credit.
III. Option A Plan - Members not retired by April 1, 2012 who elected Option A under the Healthcare MOU are paid or reimbursed for health insurance premiums by the City up to $9,6151. Option A was available only to those members who had 25 years of service or were eligible to retire as of April 1, 2012. This benefit amount increases 2% per year. Employees under the Option A Plan are required to pay biweekly contributions annually totaling $8351 for General Members and $8771 for Safety Members while active or in DROP status in order to receive retiree medical benefits. Employee contribution amounts do not change and cannot be refunded.
IV. Option B Plan - Members not retired by April 1, 2012 who elected Option B under the Healthcare MOU are paid or reimbursed for health insurance premiums by the City up to $5,5001. The benefit amount for Option B does not change. Option B retirees with 10 years of service receive 50% of the retiree health reimbursement allowance and receive an additional 5% per year of service in excess of 10 years, resulting in a maximum benefit of 100% at 20 years of service. Employees under the Option B Plan are required to pay biweekly contributions annually totaling $4171 for General Members and $4431 for Safety Members while active or in DROP status in order to receive retiree medical benefits. Employee contribution amounts do not change and cannot be refunded. ¹ Reported as whole dollars.
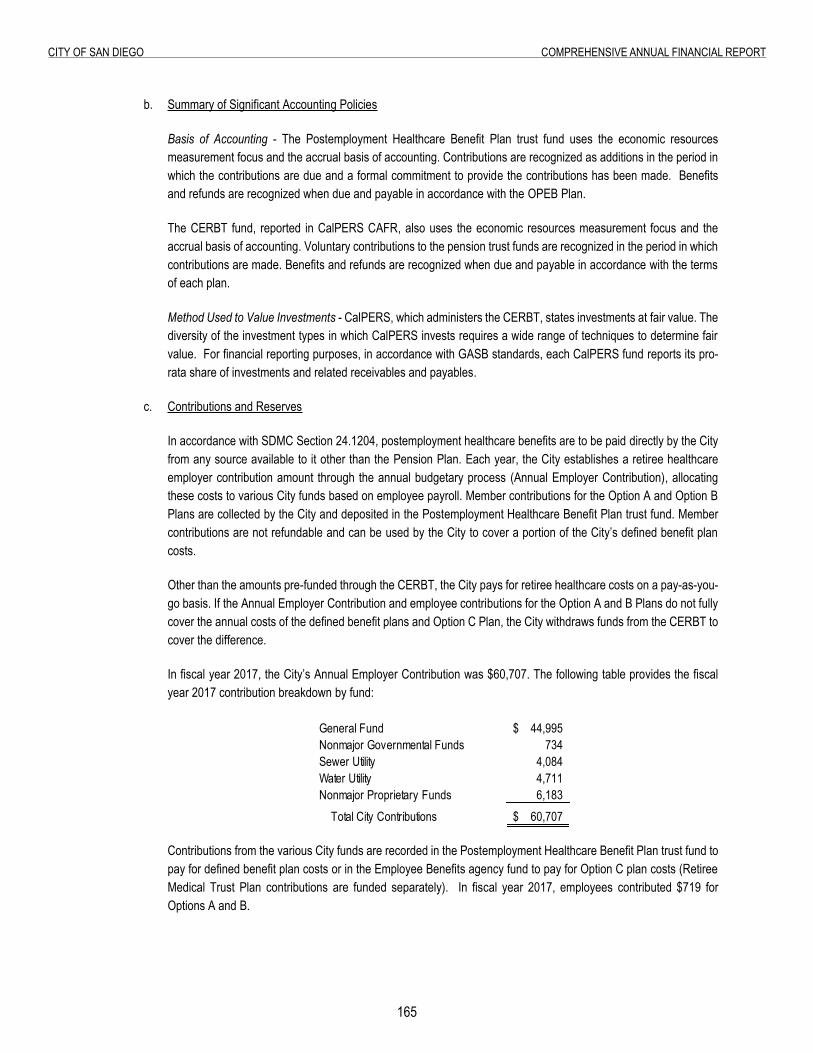
165
City of San Diego ComprehenSive annual finanCial report
b. Summary of Significant Accounting Policies
Basis of Accounting - The Postemployment Healthcare Benefit Plan trust fund uses the economic resources measurement focus and the accrual basis of accounting. Contributions are recognized as additions in the period in which the contributions are due and a formal commitment to provide the contributions has been made. Benefits and refunds are recognized when due and payable in accordance with the OPEB Plan.
The CERBT fund, reported in CalPERS CAFR, also uses the economic resources measurement focus and the accrual basis of accounting. Voluntary contributions to the pension trust funds are recognized in the period in which contributions are made. Benefits and refunds are recognized when due and payable in accordance with the terms of each plan.
Method Used to Value Investments - CalPERS, which administers the CERBT, states investments at fair value. The diversity of the investment types in which CalPERS invests requires a wide range of techniques to determine fair value. For financial reporting purposes, in accordance with GASB standards, each CalPERS fund reports its pro-rata share of investments and related receivables and payables.
c. Contributions and Reserves
In accordance with SDMC Section 24.1204, postemployment healthcare benefits are to be paid directly by the City from any source available to it other than the Pension Plan. Each year, the City establishes a retiree healthcare employer contribution amount through the annual budgetary process (Annual Employer Contribution), allocating these costs to various City funds based on employee payroll. Member contributions for the Option A and Option B Plans are collected by the City and deposited in the Postemployment Healthcare Benefit Plan trust fund. Member contributions are not refundable and can be used by the City to cover a portion of the City’s defined benefit plan costs.
Other than the amounts pre-funded through the CERBT, the City pays for retiree healthcare costs on a pay-as-you-go basis. If the Annual Employer Contribution and employee contributions for the Option A and B Plans do not fully cover the annual costs of the defined benefit plans and Option C Plan, the City withdraws funds from the CERBT to cover the difference.
In fiscal year 2017, the City’s Annual Employer Contribution was $60,707. The following table provides the fiscal year 2017 contribution breakdown by fund:
General Fund 44,995$ Nonmajor Governmental Funds 734 Sewer Utility 4,084 Water Utility 4,711 Nonmajor Proprietary Funds 6,183
Total City Contributions 60,707$
Contributions from the various City funds are recorded in the Postemployment Healthcare Benefit Plan trust fund to pay for defined benefit plan costs or in the Employee Benefits agency fund to pay for Option C plan costs (Retiree Medical Trust Plan contributions are funded separately). In fiscal year 2017, employees contributed $719 for Options A and B.
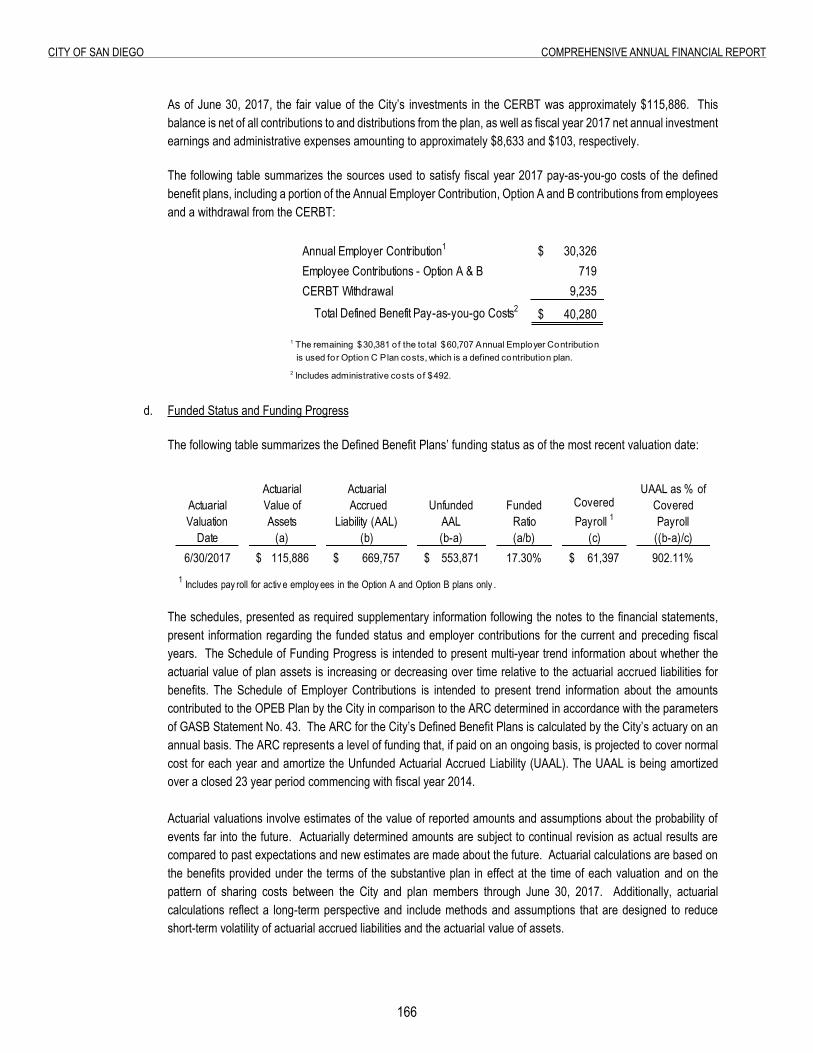
166
City of San Diego ComprehenSive annual finanCial report
As of June 30, 2017, the fair value of the City’s investments in the CERBT was approximately $115,886. This balance is net of all contributions to and distributions from the plan, as well as fiscal year 2017 net annual investment earnings and administrative expenses amounting to approximately $8,633 and $103, respectively.
The following table summarizes the sources used to satisfy fiscal year 2017 pay-as-you-go costs of the defined benefit plans, including a portion of the Annual Employer Contribution, Option A and B contributions from employees and a withdrawal from the CERBT:
Annual Employer Contribution1 30,326$ Employee Contributions - Option A & B 719 CERBT Withdrawal 9,235
Total Defined Benefit Pay-as-you-go Costs2 40,280$
1 The remaining $30,381 of the total $60,707 Annual Employer Contribution is used for Option C Plan costs, which is a defined contribution plan.2 Includes administrative costs of $492.
d. Funded Status and Funding Progress
The following table summarizes the Defined Benefit Plans’ funding status as of the most recent valuation date:
Actuarial Valuation
Date
ActuarialValue of Assets
(a)
Actuarial Accrued
Liability (AAL)(b)
Unfunded AAL(b-a)
FundedRatio(a/b)
Covered Payroll 1
(c)
UAAL as % ofCoveredPayroll
((b-a)/c)6/30/2017 115,886$ 669,757$ 553,871$ 17.30% 61,397$ 902.11%
1 Includes pay roll for activ e employ ees in the Option A and Option B plans only .
The schedules, presented as required supplementary information following the notes to the financial statements, present information regarding the funded status and employer contributions for the current and preceding fiscal years. The Schedule of Funding Progress is intended to present multi-year trend information about whether the actuarial value of plan assets is increasing or decreasing over time relative to the actuarial accrued liabilities for benefits. The Schedule of Employer Contributions is intended to present trend information about the amounts contributed to the OPEB Plan by the City in comparison to the ARC determined in accordance with the parameters of GASB Statement No. 43. The ARC for the City’s Defined Benefit Plans is calculated by the City’s actuary on an annual basis. The ARC represents a level of funding that, if paid on an ongoing basis, is projected to cover normal cost for each year and amortize the Unfunded Actuarial Accrued Liability (UAAL). The UAAL is being amortized over a closed 23 year period commencing with fiscal year 2014.
Actuarial valuations involve estimates of the value of reported amounts and assumptions about the probability of events far into the future. Actuarially determined amounts are subject to continual revision as actual results are compared to past expectations and new estimates are made about the future. Actuarial calculations are based on the benefits provided under the terms of the substantive plan in effect at the time of each valuation and on the pattern of sharing costs between the City and plan members through June 30, 2017. Additionally, actuarial calculations reflect a long-term perspective and include methods and assumptions that are designed to reduce short-term volatility of actuarial accrued liabilities and the actuarial value of assets.
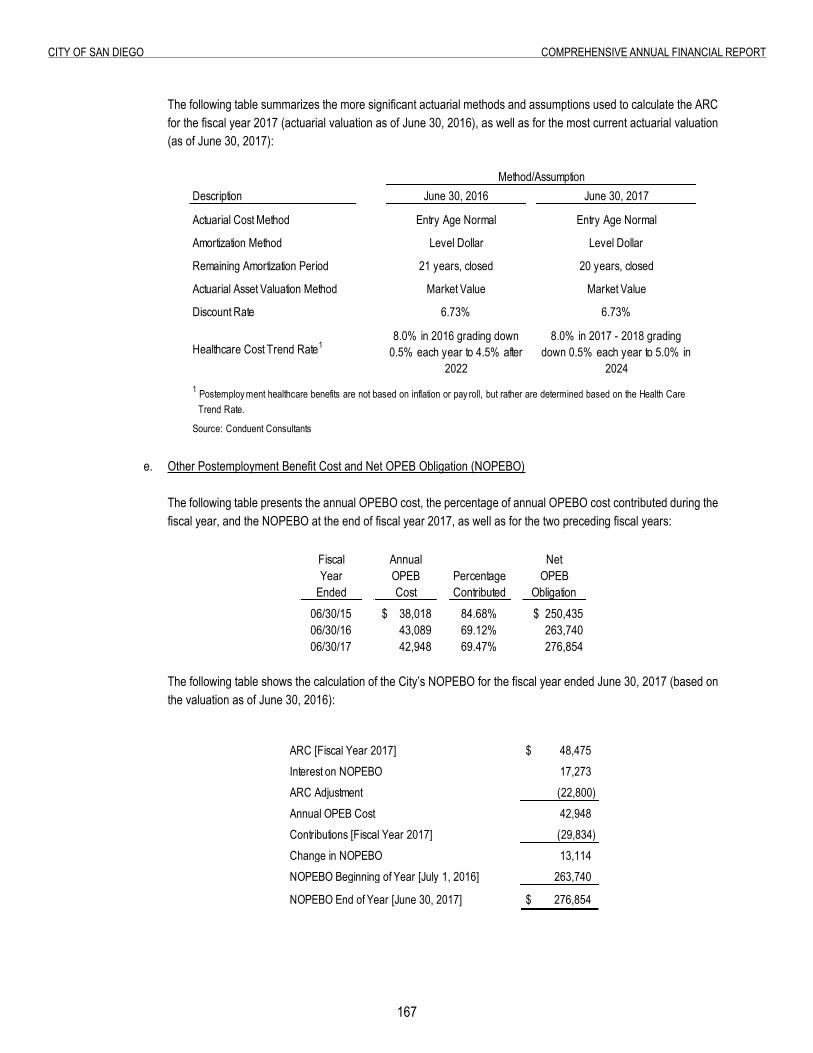
167
City of San Diego ComprehenSive annual finanCial report
The following table summarizes the more significant actuarial methods and assumptions used to calculate the ARC for the fiscal year 2017 (actuarial valuation as of June 30, 2016), as well as for the most current actuarial valuation (as of June 30, 2017):
Description June 30, 2016 June 30, 2017
Actuarial Cost Method Entry Age Normal Entry Age Normal
Amortization Method Level Dollar Level Dollar
Remaining Amortization Period 21 years, closed 20 years, closed
Actuarial Asset Valuation Method Market Value Market Value
Discount Rate 6.73% 6.73%
Healthcare Cost Trend Rate18.0% in 2016 grading down
0.5% each year to 4.5% after 2022
8.0% in 2017 - 2018 grading down 0.5% each year to 5.0% in
2024
Trend Rate.
Source: Conduent Consultants
Method/Assumption
1 Postemploy ment healthcare benefits are not based on inflation or pay roll, but rather are determined based on the Health Care
e. Other Postemployment Benefit Cost and Net OPEB Obligation (NOPEBO)
The following table presents the annual OPEBO cost, the percentage of annual OPEBO cost contributed during the fiscal year, and the NOPEBO at the end of fiscal year 2017, as well as for the two preceding fiscal years:
Fiscal Year
Ended
AnnualOPEBCost
Percentage Contributed
Net OPEB
Obligation06/30/15 $ 38,018 84.68% $ 250,435 06/30/16 43,089 69.12% 263,740 06/30/17 42,948 69.47% 276,854
The following table shows the calculation of the City’s NOPEBO for the fiscal year ended June 30, 2017 (based on the valuation as of June 30, 2016):
ARC [Fiscal Year 2017] $ 48,475 Interest on NOPEBO 17,273 ARC Adjustment (22,800)Annual OPEB Cost 42,948 Contributions [Fiscal Year 2017] (29,834)Change in NOPEBO 13,114 NOPEBO Beginning of Year [July 1, 2016] 263,740
NOPEBO End of Year [June 30, 2017] $ 276,854
168
City of San Diego ComprehenSive annual finanCial report
DEFINED CONTRIBUTION PLAN
The City provides two defined contribution plans to eligible employees as described below:
a. Option C Plan - For employees hired prior to July 1, 2005 and who elected to participate in the Option C Plan, the City provides a lump sum distribution, estimated by an actuary to yield approximately $8,500 (whole dollars) annually during the member’s life expectancy after retirement. The distribution is made when the member first becomes eligible to retire, based on age and Service Credit. There is no member contribution to this plan. Retirees with 10 years of service receive 50% of the distribution, with additional City annual contributions each year thereafter until reaching 20 years. Contributions to the Option C Plan are reported in an agency fund, as the City does not administer them and simply passes through contribution amounts to the plan administrators. Option C is administered by various third parties depending on employee classification and/or membership in employee collective bargaining units. Total City contributions for the Option C Plan in fiscal year 2017 were $30,381.
b. Retiree Medical Trust Plan - For general members hired on or after July 1, 2009, the City established a trust vehicle for a defined contribution plan, which requires a mandatory employee contribution of 0.25% of gross salary with a corresponding 0.25% match by the City. Contributions to the Retiree Medical Trust Plan are reported in an agency fund, as the City does not administer them and simply passes through contribution amounts to the plan administrators. The Retiree Medical Trust Plan is administered by HRA Administrator, LLC, a member of the Variable Annuity Life Insurance Company (VALIC). Elected and safety members are ineligible for this plan. The City and employees each contributed $380 to the Retiree Medical Trust Plan in fiscal year 2017.
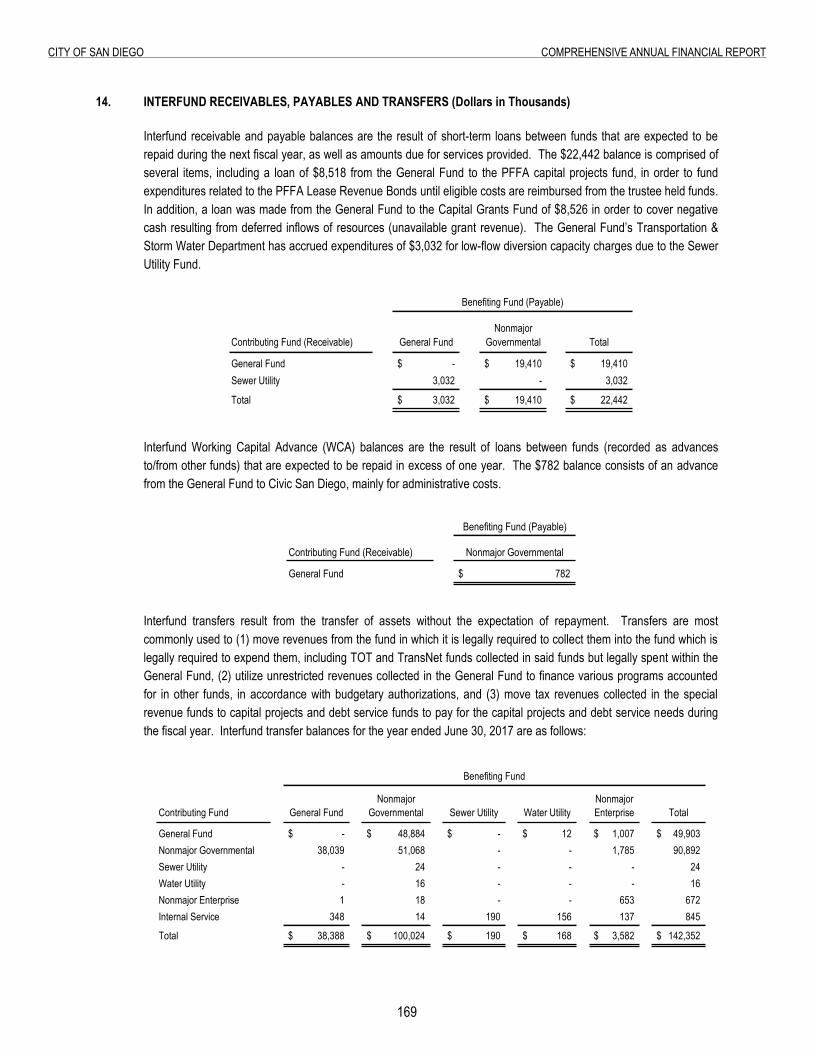
169
City of San Diego ComprehenSive annual finanCial report
14. Interfund Receivables, Payables and Transfers
14. INTERFUND RECEIVABLES, PAYABLES AND TRANSFERS (Dollars in Thousands)
Interfund receivable and payable balances are the result of short-term loans between funds that are expected to be repaid during the next fiscal year, as well as amounts due for services provided. The $22,442 balance is comprised of several items, including a loan of $8,518 from the General Fund to the PFFA capital projects fund, in order to fund expenditures related to the PFFA Lease Revenue Bonds until eligible costs are reimbursed from the trustee held funds. In addition, a loan was made from the General Fund to the Capital Grants Fund of $8,526 in order to cover negative cash resulting from deferred inflows of resources (unavailable grant revenue). The General Fund’s Transportation & Storm Water Department has accrued expenditures of $3,032 for low-flow diversion capacity charges due to the Sewer Utility Fund.
Contributing Fund (Receivable) General FundNonmajor
Governmental Total
General Fund -$ 19,410$ 19,410$ Sewer Utility 3,032 - 3,032
Total 3,032$ 19,410$ 22,442$
Benefiting Fund (Payable)
Interfund Working Capital Advance (WCA) balances are the result of loans between funds (recorded as advances to/from other funds) that are expected to be repaid in excess of one year. The $782 balance consists of an advance from the General Fund to Civic San Diego, mainly for administrative costs.
Benefiting Fund (Payable)
Contributing Fund (Receivable) Nonmajor Governmental
General Fund 782$
Interfund transfers result from the transfer of assets without the expectation of repayment. Transfers are most commonly used to (1) move revenues from the fund in which it is legally required to collect them into the fund which is legally required to expend them, including TOT and TransNet funds collected in said funds but legally spent within the General Fund, (2) utilize unrestricted revenues collected in the General Fund to finance various programs accounted for in other funds, in accordance with budgetary authorizations, and (3) move tax revenues collected in the special revenue funds to capital projects and debt service funds to pay for the capital projects and debt service needs during the fiscal year. Interfund transfer balances for the year ended June 30, 2017 are as follows:
Contributing Fund General FundNonmajor
Governmental Sewer Utility Water UtilityNonmajor Enterprise Total
General Fund -$ 48,884$ -$ 12$ 1,007$ 49,903$ Nonmajor Governmental 38,039 51,068 - - 1,785 90,892 Sewer Utility - 24 - - - 24 Water Utility - 16 - - - 16 Nonmajor Enterprise 1 18 - - 653 672 Internal Service 348 14 190 156 137 845
Total 38,388$ 100,024$ 190$ 168$ 3,582$ 142,352$
Benefiting Fund
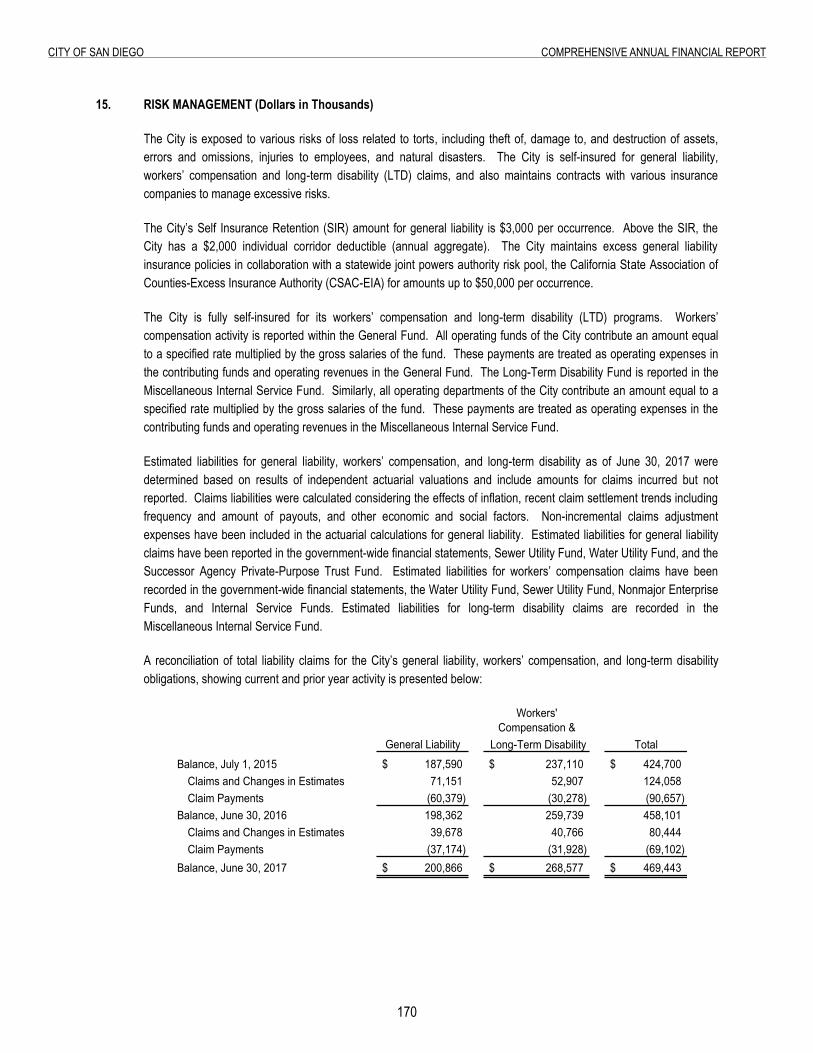
170
City of San Diego ComprehenSive annual finanCial report
15. risk management
15. RISK MANAGEMENT (Dollars in Thousands)
The City is exposed to various risks of loss related to torts, including theft of, damage to, and destruction of assets, errors and omissions, injuries to employees, and natural disasters. The City is self-insured for general liability, workers’ compensation and long-term disability (LTD) claims, and also maintains contracts with various insurance companies to manage excessive risks.
The City’s Self Insurance Retention (SIR) amount for general liability is $3,000 per occurrence. Above the SIR, the City has a $2,000 individual corridor deductible (annual aggregate). The City maintains excess general liability insurance policies in collaboration with a statewide joint powers authority risk pool, the California State Association of Counties-Excess Insurance Authority (CSAC-EIA) for amounts up to $50,000 per occurrence.
The City is fully self-insured for its workers’ compensation and long-term disability (LTD) programs. Workers’ compensation activity is reported within the General Fund. All operating funds of the City contribute an amount equal to a specified rate multiplied by the gross salaries of the fund. These payments are treated as operating expenses in the contributing funds and operating revenues in the General Fund. The Long-Term Disability Fund is reported in the Miscellaneous Internal Service Fund. Similarly, all operating departments of the City contribute an amount equal to a specified rate multiplied by the gross salaries of the fund. These payments are treated as operating expenses in the contributing funds and operating revenues in the Miscellaneous Internal Service Fund.
Estimated liabilities for general liability, workers’ compensation, and long-term disability as of June 30, 2017 were determined based on results of independent actuarial valuations and include amounts for claims incurred but not reported. Claims liabilities were calculated considering the effects of inflation, recent claim settlement trends including frequency and amount of payouts, and other economic and social factors. Non-incremental claims adjustment expenses have been included in the actuarial calculations for general liability. Estimated liabilities for general liability claims have been reported in the government-wide financial statements, Sewer Utility Fund, Water Utility Fund, and the Successor Agency Private-Purpose Trust Fund. Estimated liabilities for workers’ compensation claims have been recorded in the government-wide financial statements, the Water Utility Fund, Sewer Utility Fund, Nonmajor Enterprise Funds, and Internal Service Funds. Estimated liabilities for long-term disability claims are recorded in the Miscellaneous Internal Service Fund.
A reconciliation of total liability claims for the City’s general liability, workers’ compensation, and long-term disability obligations, showing current and prior year activity is presented below:
Workers'Compensation &
General Liability Long-Term Disability TotalBalance, July 1, 2015 187,590$ 237,110$ 424,700$
Claims and Changes in Estimates 71,151 52,907 124,058 Claim Payments (60,379) (30,278) (90,657)
Balance, June 30, 2016 198,362 259,739 458,101 Claims and Changes in Estimates 39,678 40,766 80,444 Claim Payments (37,174) (31,928) (69,102)
Balance, June 30, 2017 200,866$ 268,577$ 469,443$
171
City of San Diego ComprehenSive annual finanCial report
The City, in collaboration with CSAC-EIA, maintains an “All Risk” policy, which includes flood coverage for amounts up to $25,000 per occurrence under the primary policy and with access to additional excess limits. The policy is subject to a $25 deductible. Additional excess limits are available as part of the City’s insurance property program through CSAC-EIA, where coverage “towers” with designated coverage limits are provided. Coverage towers are groups of properties, which are diversified based on occupancy (risk-pool members) and geographical location. The City participates in four coverage towers with dedicated coverage limits of $300,000 for “All Risk” and Flood. If tower limits are exhausted, additional coverage may be accessible by any of the towers in the risk-pool. These additional coverage limits are shared by all towers in the risk-pool and may not exceed an aggregate amount of $300,000 for “All Risk” and Flood, for all claims made by all towers during the coverage period. Limits include coverage for business interruption losses for designated leased properties for various financings. There is no sharing of limits among the City and member counties of the CSAC-EIA pool, unless the City and member counties are mutually subject to losses from the same occurrence. Limits and coverage may be adjusted periodically in response to the requirements of bond financed projects, grant requirements, acquisitions, and in response to changes in the insurance marketplace.
CSAC-EIA’s insurance property program structure of dedicated tower limits also applies to earthquake coverage. The City participates in four coverage towers. Earthquake coverage is provided for designated buildings/structures in the amount of $100,000 under primary policies per tower. If tower limits are exhausted, additional coverage may be accessible by any of the towers in the risk pool. The additional coverage limits are shared by all towers in the risk-pool and may not exceed an aggregate amount of $440,000 for all claims made by all towers during the coverage period, including coverage for business interruption caused by earthquake at certain designated locations. Earthquake coverage is subject to a deductible of 2% of total insured values per unit per occurrence, subject to a $100 minimum. The City’s earthquake coverage is purchased jointly and limits are shared with the member counties in the CSAC-EIA pool. Due to the potential for geographically concentrated earthquake losses, the CSAC-EIA pool is geographically diverse to minimize any potential sharing of coverage in the case of an individual earthquake occurrence. Depending upon the availability and affordability of earthquake insurance, the City may elect not to purchase such coverage in the future, or the City may elect to increase the deductible or reduce the coverage from present levels.
The City is a public agency subject to liability for the dishonest and negligent acts or omissions of its officers and employees acting within the scope of their duty (“employee dishonesty” and “faithful performance”). The City participates in the joint purchase of insurance covering employee dishonesty and faithful performance through the CSAC-EIA pool. Coverage is provided in the amount of $15,000 per occurrence, subject to a $25 deductible.
During fiscal year 2017, there were no significant reductions in insurance coverage from the prior year. For each of the past three fiscal years, settlements which were covered by insurance have not exceeded the City’s insurance coverage limits. However, some losses may not be covered by insurance and would need to be funded by the City. The City can give no assurance that particular losses will be covered or that coverage providers will be able to pay recorded losses.
See Note 18 for additional information.
172
City of San Diego ComprehenSive annual finanCial report
16. Fund Balance / Net Position Deficits
16. FUND BALANCE / NET POSITION DEFICITS (Dollars in Thousands)
The Capital Grants Capital Projects Fund has a fund balance deficit of $9,655, which represents deferred inflows of resources related to grant revenue which did not meet the City’s availability criteria.
Implementation of GASB Statement No. 68 resulted in a significant impact to the net position of most proprietary funds. The Development Services Fund has a net position deficit of $55,399. The Central Stores and Publishing Services Internal Service Funds have net position deficits of $1,105 and $998, respectively. These deficits are primarily due to the Net Pension Liability (NPL) expected to be repaid over the long-term. Generally, the NPL is reduced annually as the City continues to fully pay its ADC for the Pension Plan, which includes amortized payments of the unfunded portion of the accrued liability (see Note 12). The cost recovery rates for these funds are developed to fully fund the respective ADC on a yearly basis. As the City continues to fully pay its ADC for the Pension Plan, the net position deficit of these funds will be corrected over the long-term.
The Private-Purpose Trust Fund (Successor Agency) has a net position deficit of $557,910, which represents unfunded liabilities of the former RDA, primarily related to long-term debt obligations. On an annual basis, the Successor Agency submits funding requests to the County of San Diego, through Recognized Obligation Payment Schedules (ROPS). Funding is then allocated to the Successor Agency from the County’s Redevelopment Property Tax Trust Fund (RPTTF) to satisfy obligations of the corresponding twelve month period. As obligations are funded twice annually and liabilities are paid, the net position deficit will continue to decrease. Once all the obligations of the Successor Agency are fully satisfied, the deficit will be eliminated.
173
City of San Diego ComprehenSive annual finanCial report
17. Commitments
17. COMMITMENTS (Dollars in Thousands)
The City has contractual and regulatory commitments that will result in expenses/expenditures in future years. These include operating and capital contractual commitments for which funds have been encumbered as of June 30, 2017 and are reflected in the table below. It is the City’s policy to pay for operating encumbrances remaining at the end of the fiscal year from the following year’s appropriations, not from fund balance. Encumbrances related to capital projects are funded through the current year appropriated budget, which carries over to the following fiscal year. Additional commitments resulting from regulatory matters are described following the table.
General Fund 15,828$ Nonmajor Governmental Funds 205,803 Sewer Utility 73,361 Water Utility 130,814 Nonmajor Business-Type Funds 36,029
Total Contractual Commitments 461,835$
California Regional Water Quality Control Board Administrative Proceeding – Municipal Storm Water Permit
The Regional Water Quality Control Board (RWQCB) is the State agency charged with implementing the federal Clean Water Act (Clean Water Act). The RWQCB issues the Municipal Storm Water National Pollutant Discharge Elimination System Permit (Municipal Permit) as required by the Clean Water Act. Under the Municipal Permit, the City must comply with water quality requirements established by the RWQCB by maintaining and operating storm drain systems, eliminating dry weather flows and reducing pollutants in storm water runoff. The RWQCB has established specific numeric limitations on the maximum amount of pollutants that can be received by some of the City’s six watersheds. The RWQCB periodically conducts water quality tests to determine if the receiving waters are meeting water quality requirements.
The Municipal Permit also requires the City to develop Water Quality Improvement Plans (Improvement Plans) to identify and address the highest priority water quality problems, including all of the City’s existing storm water quality regulatory deadlines between fiscal year 2012 and fiscal year 2035 for each of the six watersheds within the City’s jurisdiction. These Improvement Plans were reviewed and accepted by the RWQCB in March 2016. In October 2016, the City updated its estimate for implementation costs for the period between fiscal year 2017 and fiscal year 2035 as follows:
Operating Cost Estimate 1,376,809$ Capital Cost Estimate 1,922,827 Total 3,299,636$
These estimates could be higher or lower depending on numerous factors, including but not limited to, changes in regulatory standards; science and technology advancements; and new impairments that could be identified by the RWQCB as future water quality tests are conducted. In June 2017 the RWQCB adopted Order No. R9-2017-0077 which directs Municipal Permit holders to control trash discharges to water bodies (State Trash Policy). The State Trash Policy will be included in the next Municipal Permit reissuance in 2018, and estimated funding needs to comply range from a combined total of $12,000 to $17,000 over 10 years beginning in fiscal year 2019. This funding need increase is in addition to the compliance funding needs identified above. Most of these compliance activities represent pollution prevention or control obligations with respect to current storm water operations and are not subject to accrual in the basic financial statements.
17�
City of San Diego ComprehenSive annual finanCial report
The City Storm Water Division’s estimated costs to implement the Improvement Plans are higher compared to current spending levels and projected budget allocations. Estimated operating expenses budgeted for fiscal year 2018 are approximately $53,044. The estimated allocated Capital Improvement Program budget for fiscal year 2018 is approximately $36,065, which is funded with General Fund revenues, TransNet, and bond proceeds. The City’s storm water fees of 95 cents per month per residence generated approximately $5,617 in fiscal year 2017 and cover only a small portion of the City’s annual storm water expenses.
The City currently is employing a multi-faceted strategy to comply with Municipal Permit requirements and reduce estimated costs to implement the Improvement Plans. First, the City is continuing to work collaboratively with the RWQCB to evaluate, and where justified with scientific data, amend regulations to reduce or eliminate certain program elements that are not needed to meet water quality targets. The City is also evaluating the possibility of extending compliance schedules to reduce annual funding needs through the U.S. Environmental Protection Agency’s (USEPA) Integrated Planning Framework (IPF) program. Extending the compliance schedules may likely increase the costs of implementing the Improvement Plans. The IPF program provides a framework for municipalities to extend compliance schedules and focus on the highest priority water quality issues when Clean Water Act funding need obligations exceed specified ratepayer affordability thresholds. The RWQCB retains discretion whether to allow municipalities to utilize the IPF program, therefore the City is actively seeking RWQCB approval to incorporate the IPF program into the next five-year Municipal Permit issuance expected to be adopted in late 2018 or early 2019. Second, the City is pursuing a combination of alternative funding and financing strategies, such as grants and State Revolving Fund loans. Third, the City continues to implement pilot studies, such as studies of street sweeping, storm drain cleaning and business inspection programs, to identify cost-saving improvements to operations. Absent an increase in storm water fees or other new funding sources discussed above, the unfunded or increased compliance funding needs would continue to be paid from the General Fund.
The Municipal Permit contains several regulatory deadlines through fiscal year 2035. The City has met or is projected to meet the first three regulatory deadlines, but is currently not projected to meet certain regulatory deadlines related to the Los Peñasquitos watershed in 2020 due to insufficient funding, and related to the bacteria Total Maximum Daily Load (TDML) in fiscal year 2021 due to insufficient funding and the time requirements to implement capital projects. As discussed above, the City is currently pursuing a multi-faceted strategy to meet these regulatory deadlines that includes seeking regulatory adjustments, pursuing alternative funding sources, and reducing funding needs through program improvements. If the City does not meet these required storm water regulations by the compliance deadlines, it is possible that the RWQCB could levy fines and penalties on the City of $10 per day per violation and the USEPA could levy penalties of up to $52 per day. Each storm drain outfall that flows to a receiving water body may be assessed as a separate violation. Additionally, should the City fall out of compliance, it could be exposed to litigation from third parties.
California Department of Public Health Compliance Order
In 1997, the State of California Department of Public Health (DDW) issued a Compliance Order requiring the City to correct operational deficiencies and begin necessary capital improvements related to the City’s water system. The Compliance Order was last amended in May of 2007 (Amendment 11) and included additional items that were not in the original Compliance Order. As amended, the Compliance Order will remain in effect until the required projects are completed.
Water Utility expects to substantially fulfill all terms of the Compliance Order by fiscal year 2019. For fiscal years 2018 through 2019, the City estimates Compliance Order project costs to total $62,404. The Public Utilities Department expects to fund these commitments through a combination of existing net position, system revenues, and financing proceeds from loans and commercial paper issuances.
175
City of San Diego ComprehenSive annual finanCial report
Additionally, the City plans to continue with twenty miles of water main replacements in fiscal year 2018 at an estimated cost of $30,000 to $40,000. The City will continue with the water main replacement program for the remaining cast iron distribution and transmission mains, in addition to continuing replacement of high priority asbestos cement water pipelines. Agreement Relative to Modified Permit for the Point Loma Wastewater Treatment
In June 2010, the City received a third renewal of the Modified Permit for the Point Loma Wastewater Treatment Plant (Pt. Loma) and agreed to identify opportunities to maximize recycling wastewater for potable and non-potable uses. That permit expired in July 2015 and was administratively continued while the regulatory agencies completed work on the renewal application. In August 2017 the Environmental Protection Agency (EPA), in conjunction with the California Regional Water Quality Control Board (RWQCB), issued the final approval renewing the Modified Permit and the waiver from secondary treatment standards for another 5 years. The permit term took effect October 1, 2017 and expires on September 30, 2022.
The Modified Permit renewal was based on the compliance with the Clean Water Act requirements, progress of the Pure Water San Diego Program (Program), and a reduction in permitted emissions from the previous permit level. The Program is designed to reduce discharge into the ocean from Pt. Loma while providing a new local source of potable water for the City. The renewal recognized the value of the Program in the early phases of implementation, and it is anticipated that Program continuance can be reflected in future permits. The total capital cost to build the Program facilities and infrastructure is estimated to be approximately $3,000,000 (current dollars) of which approximately $1,800,000 will be a cost to the Sewer Utility Fund, and approximately $1,200,000 will be a cost to the Water Utility Fund. The first phase of the Program is estimated to cost approximately $1,100,000 - $1,300,000, of which, approximately $400,000 - $500,000 will be a cost to the Sewer Utility Fund, and approximately $700,000 - $800,000 will be a cost to the Water Utility Fund.
176
City of San Diego ComprehenSive annual finanCial report
18. Contingencies
18. CONTINGENCIES (Dollars in Thousands)
FEDERAL AND STATE GRANTS
The City recognizes as revenue grant monies received as reimbursement for costs incurred related to certain Federal and State programs it administers. Although the City's federal grant programs are audited in accordance with the requirements of the Federal Single Audit Act of 1984, the Single Audit Act Amendments of 1996, and the related U.S. Office of Management and Budget Circular A-133 and 2 CFR 200 Uniform Guidance as applicable based on the date of the award, these programs may be subject to financial and compliance audits by the reimbursing agencies. The amount, if any, of expenditures which may be disallowed by the granting agencies cannot be determined at this time. The Single Audit for fiscal year 2017 is in process.
LITIGATION AND REGULATORY ACTIONS
The City is a defendant in lawsuits pertaining to material matters, including claims asserted, which are incidental to performing routine governmental and other functions. This litigation includes, but is not limited to: actions commenced and claims asserted against the City arising out of alleged torts; alleged breaches of contracts; alleged violations of law; and condemnation proceedings. The City received 2,255 notices of claims in fiscal year 2017.
As of June 30, 2017, the City estimates the amount of tort and non-tort liabilities to be $200,866, which has been reported in the government-wide statement of net position, the proprietary funds financial statements, and the fiduciary funds financial statements. The liability was actuarially determined and was supplemented by information provided by the City Attorney with respect to certain large individual claims and proceedings. The liability recorded is the City’s best estimate based on information available as of the issuance of this report. The City Attorney also estimates that in the event of an adverse ruling, certain pending lawsuits and claims have a reasonable possibility of resulting in an additional liability, in the aggregate, ranging from $0 to $181,283. However, the potential liabilities related to these claims are not individually accrued because it is not probable that a loss has been incurred as of June 30, 2017.
Additional information on litigation regarding the Pension Plan can be found in the introductory section of Note 12.
POLLUTION REMEDIATION OBLIGATIONS
Los Peñasquitos Lagoon Sedimentation Total Maximum Daily Load (TMDL)
The City is a listed responsible party regarding the sedimentation of Los Peñasquitos Lagoon. This TMDL was adopted by the State of California in July 2014. The TMDL included requirements for sediment reductions in the Los Peñasquitos Watershed and the establishment of 84 acres of new salt marsh habitat in the Los Peñasquitos Lagoon by July 2034. The habitat restoration requirements associated with the establishment of 84 acres of salt marsh habitat represent pollution remediation obligations; however any estimated costs cannot be reasonably determined at this time pending the development of the final concept design for the restoration of Los Peñasquitos Lagoon. In addition, because a design for the restoration of the lagoon has not been developed, the City has not yet estimated what portion of the costs would be operating or capital costs.
Chollas Creek Mouth Sediment Investigative Order
On October 26, 2015, the Regional Water Quality Control Board (RWQCB) released the Chollas Creek Mouth Sediment Investigative Order (SIO) R9-2015-0058. The order names the City as one of the responsible parties to determine if sediment contamination at the mouth of Chollas Creek in San Diego Bay and potential sediment
177
City of San Diego ComprehenSive annual finanCial report
contamination of the tidal prism of Chollas Creek has occurred. The responsible parties submitted a Phase I monitoring work plan to the Regional Board to evaluate the current nature and extent of impairment related to contaminated sediments in the mouth of Chollas Creek and the Chollas Creek tidally influenced area. Source identification studies of any potential sediment contamination within the investigation area is underway. The Order requires the development of the Phase 2 work plan, which was submitted on August 30, 2017, and monitoring is being performed to identify the sources of impairment found during Phase 1. Costs of remediation cannot be estimated until the investigation is completed to determine if there are problems, and if so, the cleanup levels will be negotiated with and ultimately imposed by the RWQCB. In addition, the responsible parties will then need to negotiate the allocation of clean up responsibilities.
Boat Channel at Naval Training Center (NTC)
The old Naval Training Center (NTC) was closed and, with the exception of the Boat Channel, the property was conveyed to the City under the Base Realignment and Closure (BRAC) process that culminated in a Memorandum of Agreement (MOA) between the City and the U.S. government (Navy) in 2000. NTC was redeveloped as Liberty Station by the Corky McMillin Companies. The transfer of the NTC Boat Channel was excluded from the conveyance because it was polluted. The MOA requires the Navy to remediate the boat channel and obtain appropriate regulatory site closure prior to conveyance. The Navy is still in the process of obtaining regulatory approval of a plan to clean-up the Boat Channel. The Navy claims the City is partly responsible for discharges which polluted the channel and therefore is responsible to pay a portion of the remediation costs. The City denies the Navy’s claim for a number of reasons, including the terms of the MOA and the fact that military facilities (both NTC and the Marine Corps Recruit Depot) surrounded the channel for decades, and most if not all pollutant discharges were Navy-originated. The City cannot estimate its apportioned responsibility for such remediation costs, if any, at this time.
San Diego Bay’s Laurel Hawthorne Central and East Embayment Draft Sediment Investigative Orders R9-2017-0097
On December 20, 2016, the RWQCB released a Tentative Sediment Investigative Order (SIO) that named the City as one of the responsible parties to determine the extent and magnitude of sediment contamination in the Laurel Hawthorne Embayment (LHE). On September 8, 2017, the RWQCB issued the draft SIO R9-2017-0097 regarding the investigation of the presence of waste and the identification of potential sources in LHE. The City is preparing responses to this SIO and a draft work plan for both land and water investigations is due within 180 days of final SIO issuance. Costs of the remediation cannot be estimated until the investigations are completed to determine if there are problems, and if so, the cleanup levels will be negotiated with and ultimately imposed by the RWQCB. In addition, the responsible parties will then need to negotiate the allocation of clean up responsibilities.
San Diego Bay Adjacent to Tenth Avenue Marine Terminal Draft Sediment Investigative Order R9-2017-0081
On May 11, 2017, the RWQCB released the draft SIO R9-2017-0081 that named the City as one of two responsible parties to determine if sediment contamination around the Tenth Avenue Marine Terminal has occurred. On August 4, 2017, the RWQCB issued the final SIO requiring the responsible parties to submit a Sediment Chemistry Assessment Work Plan in 180 days evaluating the current nature and extent of impairment. Costs of remediation cannot be estimated until the investigation is completed to determine if there are problems, and if so, the cleanup levels will be negotiated with and ultimately imposed by the RWQCB. In addition, the responsible parties will then need to negotiate the allocation of clean up responsibilities.
178
City of San Diego ComprehenSive annual finanCial report
San Diego Bay Adjacent to Continental Maritime Draft Sediment Investigative Order R9-2017-0082
On May 11, 2017, the RWQCB released the draft SIO R9-2017-0082 that named the City as one of the responsible parties to determine if sediment contamination around Continental Maritime has occurred. On August 4, 2017, the RWQCB issued the final SIO requiring the responsible parties to submit a Sediment Chemistry Assessment Work Plan in 180 days evaluating the current nature and extent of impairment. Costs of remediation cannot be estimated until the investigation is completed to determine if there are problems, and if so, the cleanup levels will be negotiated with and ultimately imposed by the RWQCB. In addition, the responsible parties will then need to negotiate the allocation of clean up responsibilities.
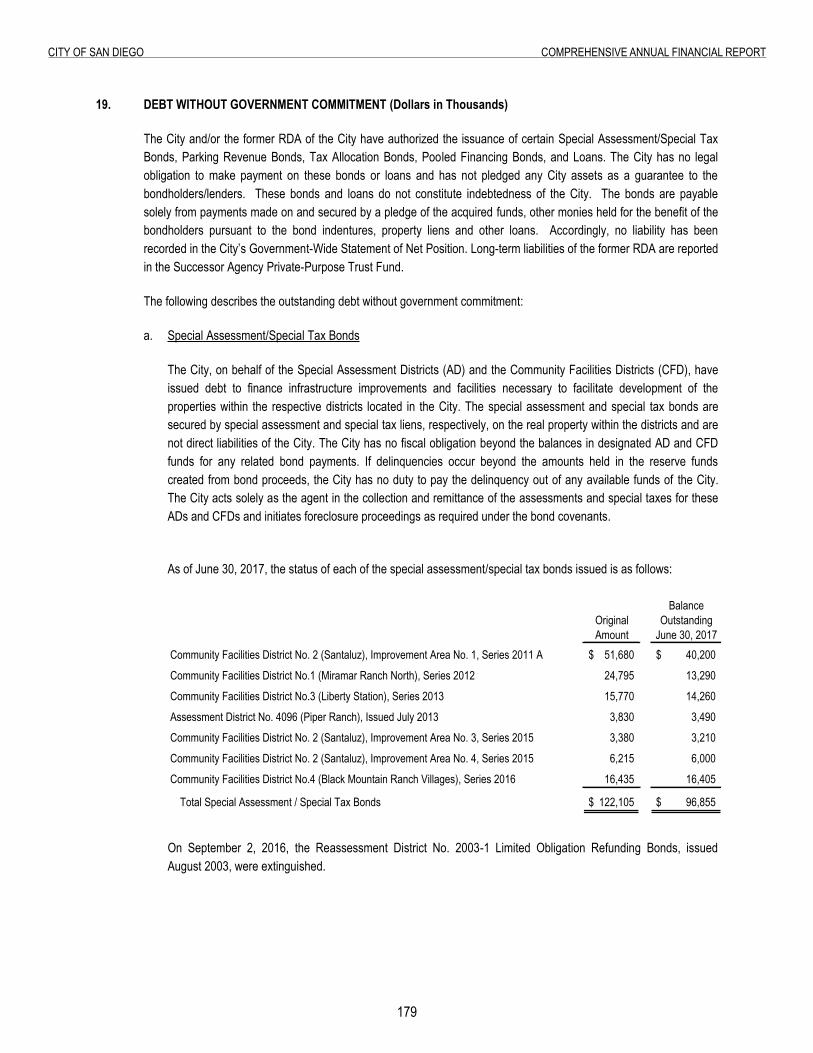
179
City of San Diego ComprehenSive annual finanCial report
19. Debt Without Government Commitment
19. DEBT WITHOUT GOVERNMENT COMMITMENT (Dollars in Thousands)
The City and/or the former RDA of the City have authorized the issuance of certain Special Assessment/Special Tax Bonds, Parking Revenue Bonds, Tax Allocation Bonds, Pooled Financing Bonds, and Loans. The City has no legal obligation to make payment on these bonds or loans and has not pledged any City assets as a guarantee to the bondholders/lenders. These bonds and loans do not constitute indebtedness of the City. The bonds are payable solely from payments made on and secured by a pledge of the acquired funds, other monies held for the benefit of the bondholders pursuant to the bond indentures, property liens and other loans. Accordingly, no liability has been recorded in the City’s Government-Wide Statement of Net Position. Long-term liabilities of the former RDA are reported in the Successor Agency Private-Purpose Trust Fund.
The following describes the outstanding debt without government commitment:
a. Special Assessment/Special Tax Bonds
The City, on behalf of the Special Assessment Districts (AD) and the Community Facilities Districts (CFD), have issued debt to finance infrastructure improvements and facilities necessary to facilitate development of the properties within the respective districts located in the City. The special assessment and special tax bonds are secured by special assessment and special tax liens, respectively, on the real property within the districts and are not direct liabilities of the City. The City has no fiscal obligation beyond the balances in designated AD and CFD funds for any related bond payments. If delinquencies occur beyond the amounts held in the reserve funds created from bond proceeds, the City has no duty to pay the delinquency out of any available funds of the City. The City acts solely as the agent in the collection and remittance of the assessments and special taxes for these ADs and CFDs and initiates foreclosure proceedings as required under the bond covenants.
As of June 30, 2017, the status of each of the special assessment/special tax bonds issued is as follows:
BalanceOriginal OutstandingAmount June 30, 2017
Community Facilities District No. 2 (Santaluz), Improvement Area No. 1, Series 2011 A 51,680$ 40,200$
Community Facilities District No.1 (Miramar Ranch North), Series 2012 24,795 13,290
Community Facilities District No.3 (Liberty Station), Series 2013 15,770 14,260
Assessment District No. 4096 (Piper Ranch), Issued July 2013 3,830 3,490
Community Facilities District No. 2 (Santaluz), Improvement Area No. 3, Series 2015 3,380 3,210
Community Facilities District No. 2 (Santaluz), Improvement Area No. 4, Series 2015 6,215 6,000
Community Facilities District No.4 (Black Mountain Ranch Villages), Series 2016 16,435 16,405
Total Special Assessment / Special Tax Bonds 122,105$ 96,855$
On September 2, 2016, the Reassessment District No. 2003-1 Limited Obligation Refunding Bonds, issued August 2003, were extinguished.
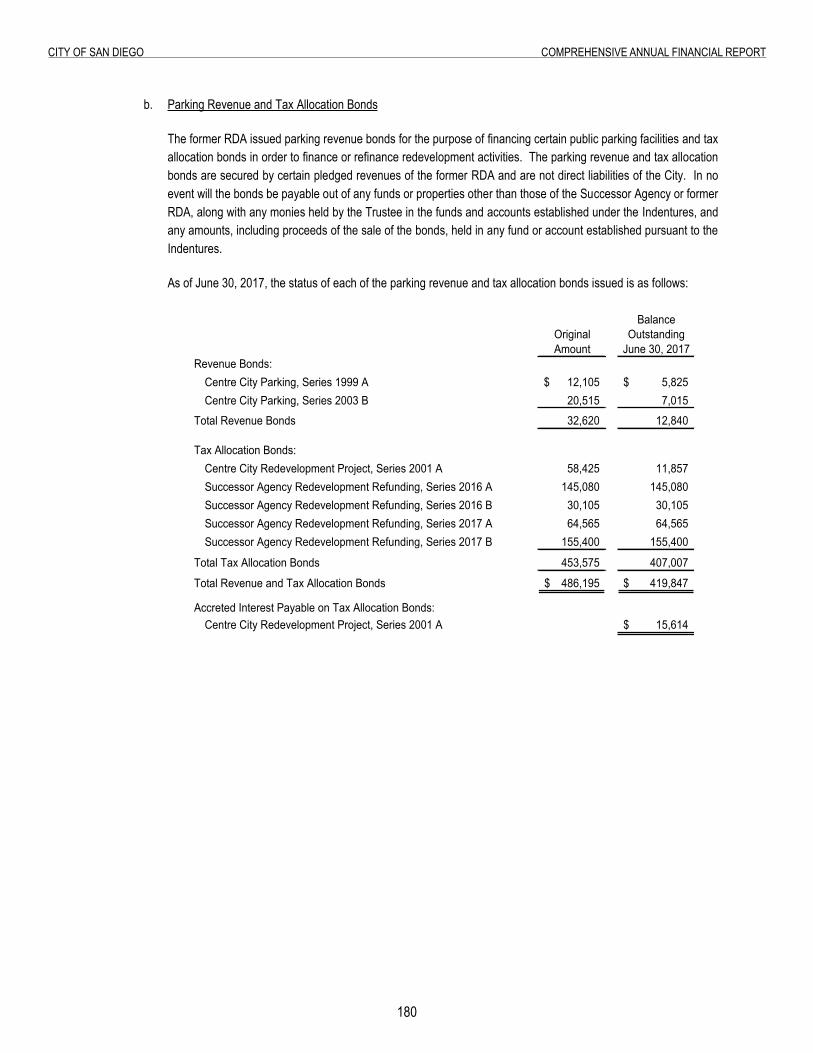
180
City of San Diego ComprehenSive annual finanCial report
b. Parking Revenue and Tax Allocation Bonds
The former RDA issued parking revenue bonds for the purpose of financing certain public parking facilities and tax allocation bonds in order to finance or refinance redevelopment activities. The parking revenue and tax allocation bonds are secured by certain pledged revenues of the former RDA and are not direct liabilities of the City. In no event will the bonds be payable out of any funds or properties other than those of the Successor Agency or former RDA, along with any monies held by the Trustee in the funds and accounts established under the Indentures, and any amounts, including proceeds of the sale of the bonds, held in any fund or account established pursuant to the Indentures.
As of June 30, 2017, the status of each of the parking revenue and tax allocation bonds issued is as follows:
BalanceOriginal OutstandingAmount June 30, 2017
Revenue Bonds:Centre City Parking, Series 1999 A 12,105$ 5,825$ Centre City Parking, Series 2003 B 20,515 7,015
Total Revenue Bonds 32,620 12,840
Tax Allocation Bonds:Centre City Redevelopment Project, Series 2001 A 58,425 11,857 Successor Agency Redevelopment Refunding, Series 2016 A 145,080 145,080 Successor Agency Redevelopment Refunding, Series 2016 B 30,105 30,105 Successor Agency Redevelopment Refunding, Series 2017 A 64,565 64,565 Successor Agency Redevelopment Refunding, Series 2017 B 155,400 155,400
Total Tax Allocation Bonds 453,575 407,007 Total Revenue and Tax Allocation Bonds 486,195$ 419,847$
Accreted Interest Payable on Tax Allocation Bonds:Centre City Redevelopment Project, Series 2001 A 15,614$
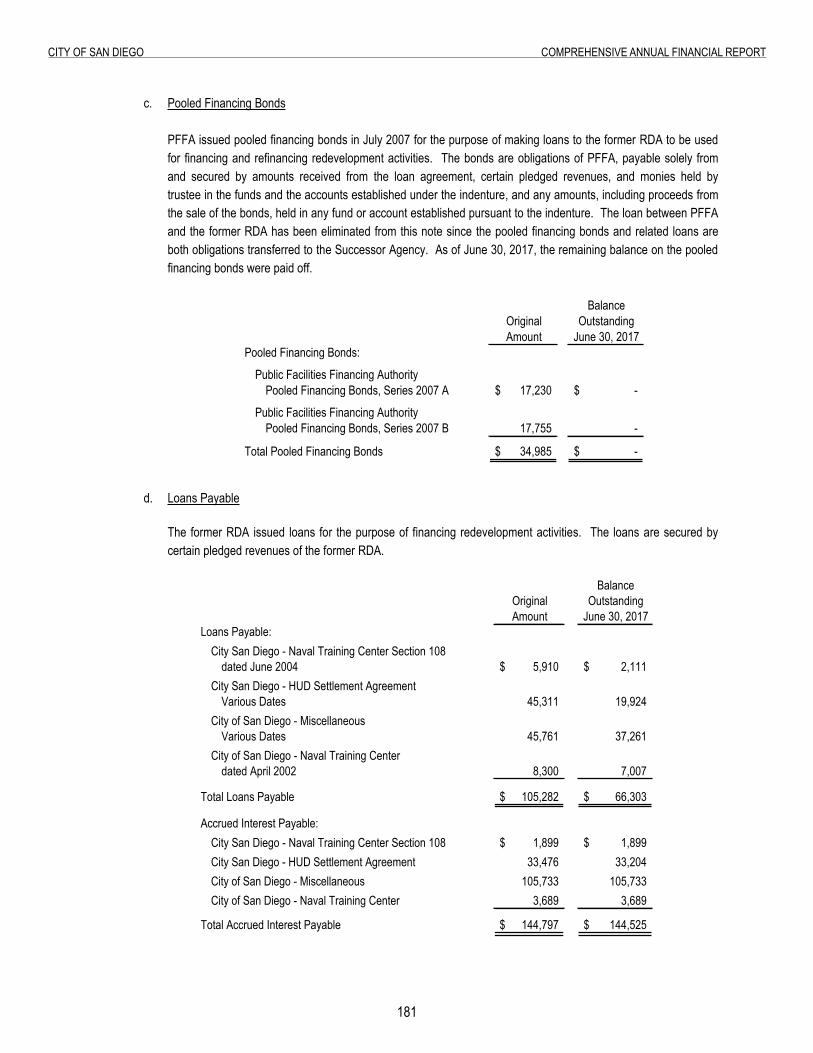
181
City of San Diego ComprehenSive annual finanCial report
c. Pooled Financing Bonds PFFA issued pooled financing bonds in July 2007 for the purpose of making loans to the former RDA to be used for financing and refinancing redevelopment activities. The bonds are obligations of PFFA, payable solely from and secured by amounts received from the loan agreement, certain pledged revenues, and monies held by trustee in the funds and the accounts established under the indenture, and any amounts, including proceeds from the sale of the bonds, held in any fund or account established pursuant to the indenture. The loan between PFFA and the former RDA has been eliminated from this note since the pooled financing bonds and related loans are both obligations transferred to the Successor Agency. As of June 30, 2017, the remaining balance on the pooled financing bonds were paid off.
BalanceOriginal OutstandingAmount June 30, 2017
Pooled Financing Bonds:
Public Facilities Financing Authority Pooled Financing Bonds, Series 2007 A 17,230$ -$
Public Facilities Financing Authority Pooled Financing Bonds, Series 2007 B 17,755 -
Total Pooled Financing Bonds 34,985$ -$
d. Loans Payable
The former RDA issued loans for the purpose of financing redevelopment activities. The loans are secured by certain pledged revenues of the former RDA.
BalanceOriginal OutstandingAmount June 30, 2017
Loans Payable:City San Diego - Naval Training Center Section 108
dated June 2004 5,910$ 2,111$ City San Diego - HUD Settlement Agreement
Various Dates 45,311 19,924 City of San Diego - Miscellaneous
Various Dates 45,761 37,261 City of San Diego - Naval Training Center
dated April 2002 8,300 7,007
Total Loans Payable 105,282$ 66,303$
Accrued Interest Payable:City San Diego - Naval Training Center Section 108 1,899$ 1,899$ City San Diego - HUD Settlement Agreement 33,476 33,204 City of San Diego - Miscellaneous 105,733 105,733 City of San Diego - Naval Training Center 3,689 3,689
Total Accrued Interest Payable 144,797$ 144,525$
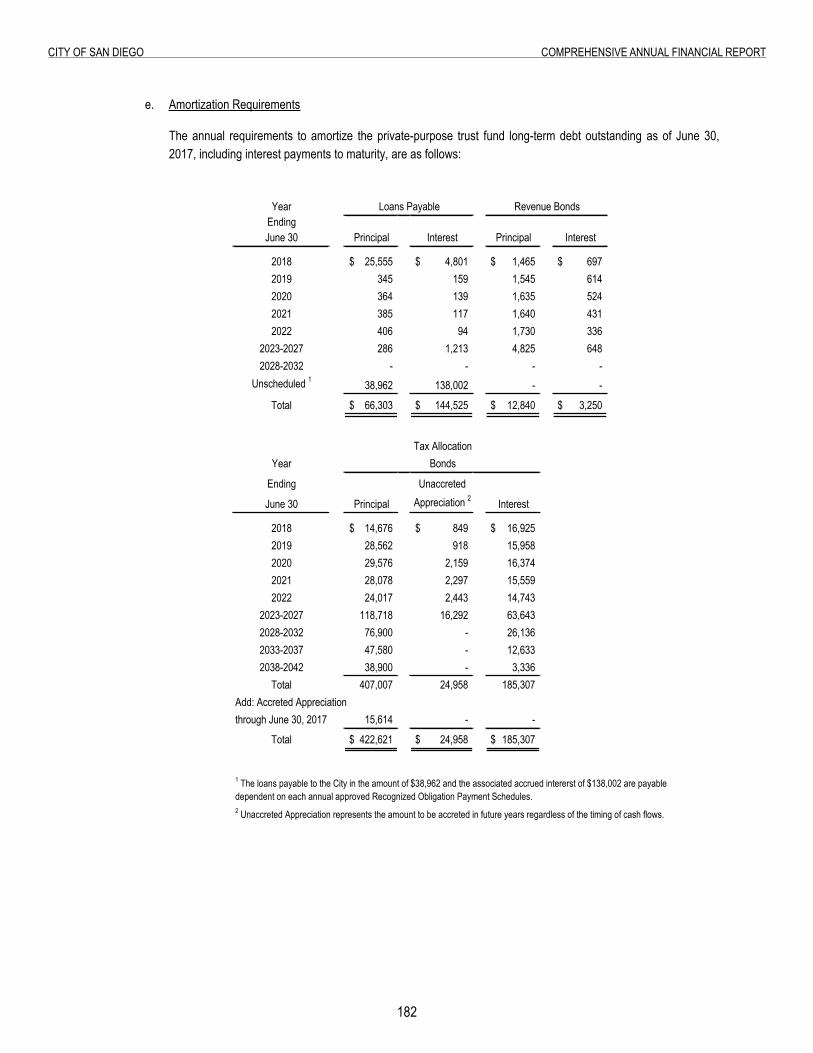
182
City of San Diego ComprehenSive annual finanCial report
e. Amortization Requirements
The annual requirements to amortize the private-purpose trust fund long-term debt outstanding as of June 30, 2017, including interest payments to maturity, are as follows:
Year Loans Payable Revenue BondsEndingJune 30 Principal Interest Principal Interest
2018 25,555$ 4,801$ 1,465$ 697$ 2019 345 159 1,545 614 2020 364 139 1,635 524 2021 385 117 1,640 431 2022 406 94 1,730 336
2023-2027 286 1,213 4,825 648 2028-2032 - - - -
Unscheduled 1 38,962 138,002 - -
Total 66,303$ 144,525$ 12,840$ 3,250$
Tax AllocationYear Bonds
Ending Unaccreted
June 30 Principal Appreciation 2 Interest
2018 14,676$ 849$ 16,925$ 2019 28,562 918 15,958 2020 29,576 2,159 16,374 2021 28,078 2,297 15,559 2022 24,017 2,443 14,743
2023-2027 118,718 16,292 63,643 2028-2032 76,900 - 26,136 2033-2037 47,580 - 12,633 2038-2042 38,900 - 3,336
Total 407,007 24,958 185,307 Add: Accreted Appreciationthrough June 30, 2017 15,614 - -
Total 422,621$ 24,958$ 185,307$
1 The loans payable to the City in the amount of $38,962 and the associated accrued intererst of $138,002 are payable dependent on each annual approved Recognized Obligation Payment Schedules. 2 Unaccreted Appreciation represents the amount to be accreted in future years regardless of the timing of cash flows.
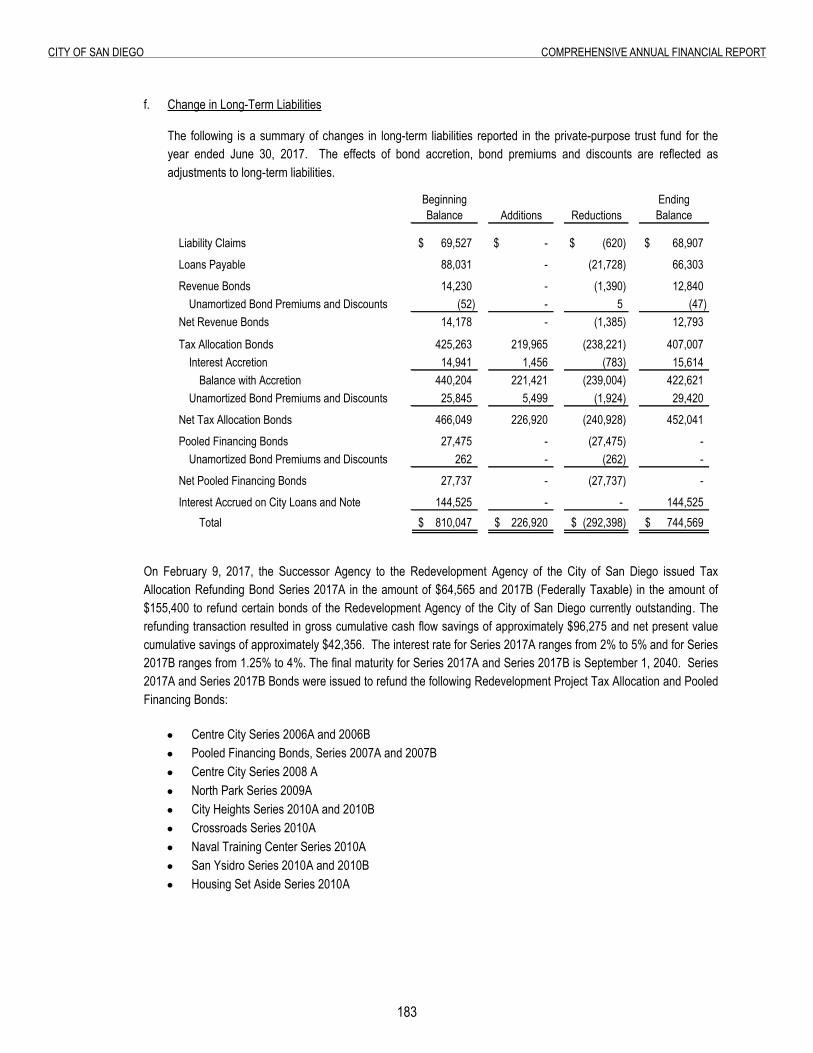
183
City of San Diego ComprehenSive annual finanCial report
f. Change in Long-Term Liabilities
The following is a summary of changes in long-term liabilities reported in the private-purpose trust fund for the year ended June 30, 2017. The effects of bond accretion, bond premiums and discounts are reflected as adjustments to long-term liabilities.
Beginning Balance Additions Reductions
Ending Balance
Liability Claims 69,527$ -$ (620)$ 68,907$
Loans Payable 88,031 - (21,728) 66,303
Revenue Bonds 14,230 - (1,390) 12,840 Unamortized Bond Premiums and Discounts (52) - 5 (47)
Net Revenue Bonds 14,178 - (1,385) 12,793
Tax Allocation Bonds 425,263 219,965 (238,221) 407,007 Interest Accretion 14,941 1,456 (783) 15,614
Balance with Accretion 440,204 221,421 (239,004) 422,621 Unamortized Bond Premiums and Discounts 25,845 5,499 (1,924) 29,420
Net Tax Allocation Bonds 466,049 226,920 (240,928) 452,041
Pooled Financing Bonds 27,475 - (27,475) - Unamortized Bond Premiums and Discounts 262 - (262) -
Net Pooled Financing Bonds 27,737 - (27,737) -
Interest Accrued on City Loans and Note 144,525 - - 144,525 Total 810,047$ 226,920$ (292,398)$ 744,569$
On February 9, 2017, the Successor Agency to the Redevelopment Agency of the City of San Diego issued Tax Allocation Refunding Bond Series 2017A in the amount of $64,565 and 2017B (Federally Taxable) in the amount of $155,400 to refund certain bonds of the Redevelopment Agency of the City of San Diego currently outstanding. The refunding transaction resulted in gross cumulative cash flow savings of approximately $96,275 and net present value cumulative savings of approximately $42,356. The interest rate for Series 2017A ranges from 2% to 5% and for Series 2017B ranges from 1.25% to 4%. The final maturity for Series 2017A and Series 2017B is September 1, 2040. Series 2017A and Series 2017B Bonds were issued to refund the following Redevelopment Project Tax Allocation and Pooled Financing Bonds:
Centre City Series 2006A and 2006B Pooled Financing Bonds, Series 2007A and 2007B Centre City Series 2008 A North Park Series 2009A City Heights Series 2010A and 2010B Crossroads Series 2010A Naval Training Center Series 2010A San Ysidro Series 2010A and 2010B Housing Set Aside Series 2010A
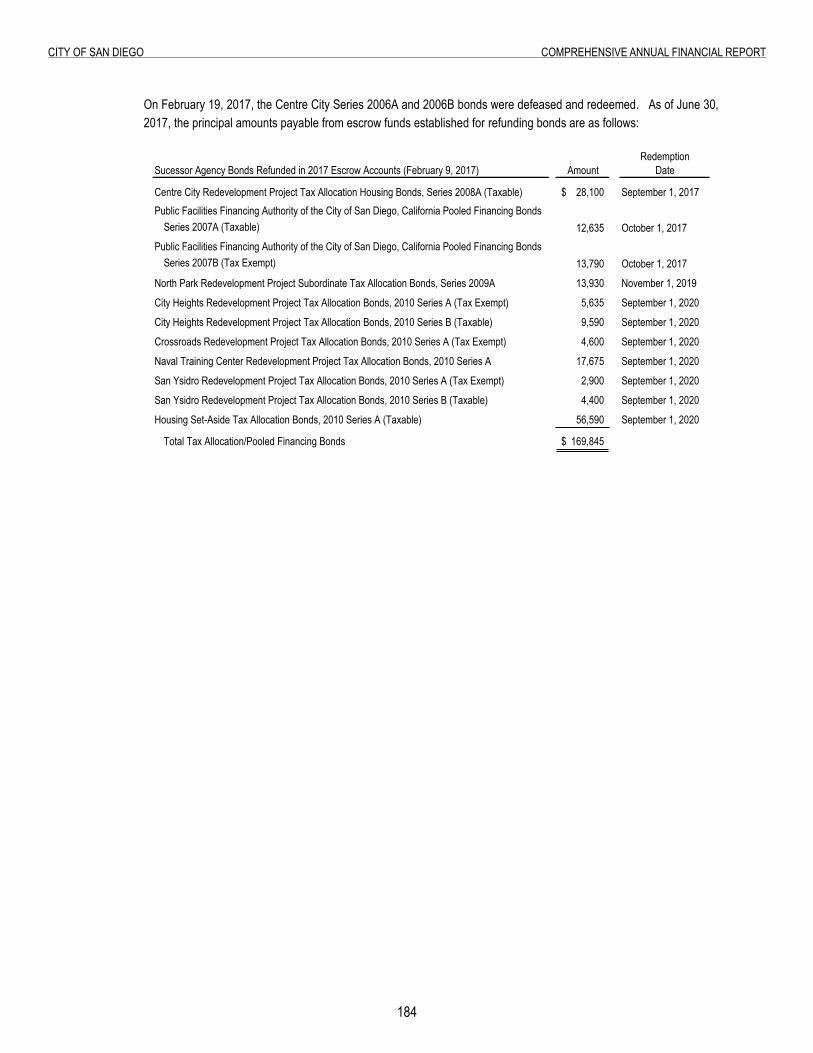
18�
City of San Diego ComprehenSive annual finanCial report
On February 19, 2017, the Centre City Series 2006A and 2006B bonds were defeased and redeemed. As of June 30, 2017, the principal amounts payable from escrow funds established for refunding bonds are as follows:
RedemptionSucessor Agency Bonds Refunded in 2017 Escrow Accounts (February 9, 2017) Amount Date
Centre City Redevelopment Project Tax Allocation Housing Bonds, Series 2008A (Taxable) 28,100$ September 1, 2017Public Facilities Financing Authority of the City of San Diego, California Pooled Financing Bonds
Series 2007A (Taxable) 12,635 October 1, 2017Public Facilities Financing Authority of the City of San Diego, California Pooled Financing Bonds
Series 2007B (Tax Exempt) 13,790 October 1, 2017
North Park Redevelopment Project Subordinate Tax Allocation Bonds, Series 2009A 13,930 November 1, 2019
City Heights Redevelopment Project Tax Allocation Bonds, 2010 Series A (Tax Exempt) 5,635 September 1, 2020
City Heights Redevelopment Project Tax Allocation Bonds, 2010 Series B (Taxable) 9,590 September 1, 2020
Crossroads Redevelopment Project Tax Allocation Bonds, 2010 Series A (Tax Exempt) 4,600 September 1, 2020
Naval Training Center Redevelopment Project Tax Allocation Bonds, 2010 Series A 17,675 September 1, 2020
San Ysidro Redevelopment Project Tax Allocation Bonds, 2010 Series A (Tax Exempt) 2,900 September 1, 2020
San Ysidro Redevelopment Project Tax Allocation Bonds, 2010 Series B (Taxable) 4,400 September 1, 2020
Housing Set-Aside Tax Allocation Bonds, 2010 Series A (Taxable) 56,590 September 1, 2020
Total Tax Allocation/Pooled Financing Bonds 169,845$
185
City of San Diego ComprehenSive annual finanCial report
20. Closure and Postclosure Care Cost
20. CLOSURE AND POSTCLOSURE CARE COST (Dollars in Thousands)
State and federal laws and regulations require that the City place a final cover on its Miramar Landfill site when it stops accepting waste and to perform certain maintenance and monitoring functions at the site for thirty years after closure. In addition, federal and state regulations require that the City set aside funds annually to fund closure costs and to demonstrate financial resources sufficient to meet certain corrective actions.
Closure and Postclosure Care Liability
The City is currently permitted by the State to keep the landfill open through fiscal year 2025. However, based on recent changes in recycling policies and compaction methods, the City projects the life expectancy of the landfill will be extended through 2030. Although closure and postclosure care costs will be paid only near or after the date that the landfill stops accepting waste, the City reports a portion of these closure and postclosure care costs as an operating expense in each period based on landfill capacity used as of each financial statement date.
The $48,530 reported as landfill closure and postclosure care liability as of June 30, 2017 represents the cumulative amount reported to date based on the use of 86% of the estimated capacity of the landfill. The City will recognize the remaining estimated cost of closure and postclosure care of $7,861 as the remaining estimated capacity is filled. These amounts are based on what it would cost to perform all closure and postclosure care as of June 30, 2017. These cost estimates are subject to changes resulting from inflation, deflation, technology, or changes in applicable laws or regulations.
Funding Requirements
As of June 30, 2017, the City is in compliance with state and federal laws and regulations requiring annual contributions to finance closure costs. At the end of fiscal year 2017, cash or equity in pooled cash and investments of $30,426 was held for this purpose. The closure/postclosure care liability amount of $48,530 reported in the Environmental Services Enterprise Fund includes $25,656 for closure costs. The amount by which the restricted cash exceeds the closure liability, or $4,770, is reported as restricted net position in the Environmental Services Enterprise Fund. The City has pledged its greenery recycling revenues as financial assurance for postclosure maintenance costs and is not required to advance fund postclosure care costs.
As of June 30, 2017, the City is in compliance with state and federal laws and regulations to demonstrate financial resources sufficient to conduct corrective action for all known or reasonably foreseeable releases from the Miramar Landfill site, meeting the cost estimate approved by the San Diego Regional Water Quality Control Board. At the end of fiscal year 2017, cash or equity in pooled cash and investments of $1,594 was held for this purpose. This amount is reported as restricted net position in the Environmental Services Fund.
For both closure/postclosure care and corrective action, the City expects that future inflation costs will be paid from interest earnings on these annual contributions. However, if interest earnings are inadequate or additional closure/postclosure care requirements are imposed (due to changes in technology or applicable laws or regulations, for example), these costs may need to be paid by charges to future landfill users or from other sources. At the end of fiscal year 2017, accrued interest of $94 is reported as restricted net position in the Environmental Services Fund.
186
City of San Diego ComprehenSive annual finanCial report
21. operating agreements
21. OPERATING AGREEMENTS (Dollars in Thousands)
City of San Diego and Padres L.P.
On February 1, 2000, the City entered into a Joint Use and Management Agreement (Agreement) with the San Diego Padres baseball team (Padres) governing the rights and duties of the City and Padres with respect to the use and operation of the Petco Park Ballpark Facility (Facility). The Padres own 30% and the City owns 70% of the Facility, which is shown as a capital asset on the City’s Statement of Net Position. The occupancy agreement expires on December 14, 2033 and includes the right of the Padres to exercise two five-year extensions. Upon expiration, the Padres’ ownership interest will automatically transfer to the City. Under the terms of the Agreement, the Padres are responsible for Facility operation and management, including maintenance, repairs and security required to preserve its condition. The City is responsible for paying certain expenses associated with the operation and maintenance of the Facility, subject to certain inflationary adjustments. In fiscal year 2017, the City paid approximately $3,739 related to the operation and maintenance of the Facility.

this page intentionally left Blank
187
Page Intentionally Left Blank
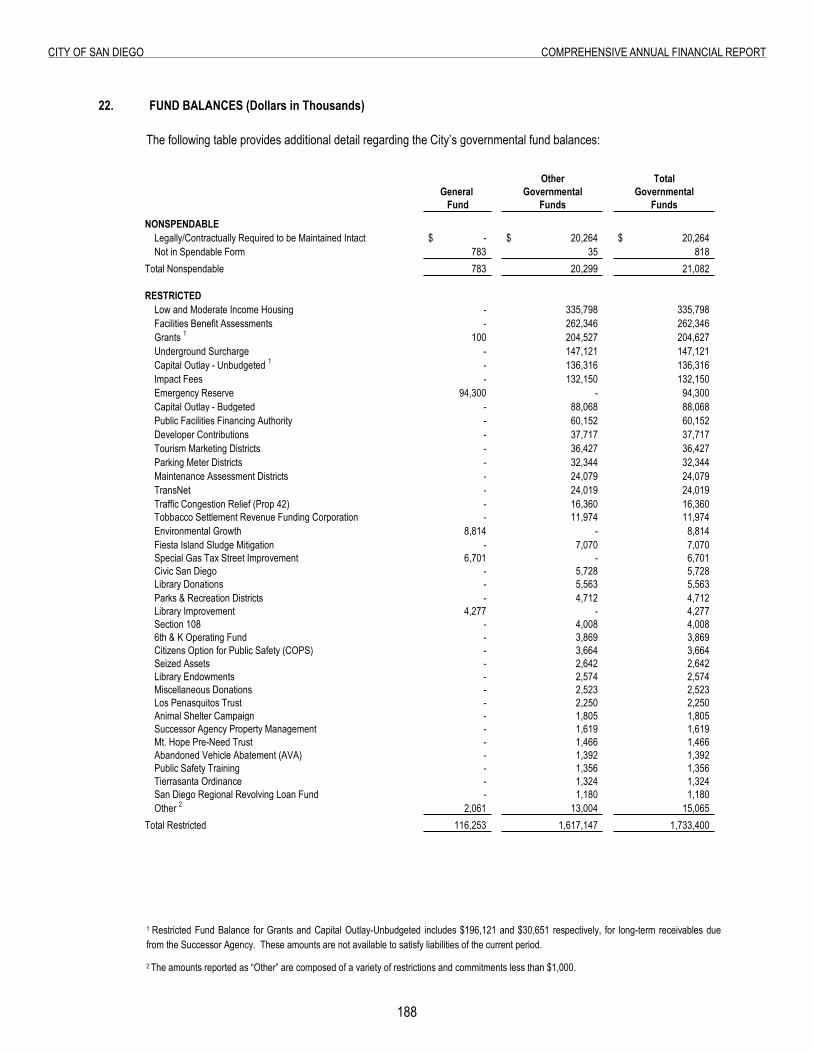
188
City of San Diego ComprehenSive annual finanCial report
22. Fund Balances
22. FUND BALANCES (Dollars in Thousands)
The following table provides additional detail regarding the City’s governmental fund balances:
1 Restricted Fund Balance for Grants and Capital Outlay-Unbudgeted includes $196,121 and $30,651 respectively, for long-term receivables due from the Successor Agency. These amounts are not available to satisfy liabilities of the current period.
2 The amounts reported as “Other” are composed of a variety of restrictions and commitments less than $1,000.
Other TotalGeneral Governmental Governmental
Fund Funds Funds
NONSPENDABLELegally/Contractually Required to be Maintained Intact -$ 20,264$ 20,264$ Not in Spendable Form 783 35 818
Total Nonspendable 783 20,299 21,082
RESTRICTEDLow and Moderate Income Housing - 335,798 335,798 Facilities Benefit Assessments - 262,346 262,346 Grants 1 100 204,527 204,627 Underground Surcharge - 147,121 147,121 Capital Outlay - Unbudgeted 1 - 136,316 136,316 Impact Fees - 132,150 132,150 Emergency Reserve 94,300 - 94,300 Capital Outlay - Budgeted - 88,068 88,068 Public Facilities Financing Authority - 60,152 60,152 Developer Contributions - 37,717 37,717 Tourism Marketing Districts - 36,427 36,427 Parking Meter Districts - 32,344 32,344 Maintenance Assessment Districts - 24,079 24,079 TransNet - 24,019 24,019 Traffic Congestion Relief (Prop 42) - 16,360 16,360 Tobbacco Settlement Revenue Funding Corporation - 11,974 11,974 Environmental Growth 8,814 - 8,814 Fiesta Island Sludge Mitigation - 7,070 7,070 Special Gas Tax Street Improvement 6,701 - 6,701 Civic San Diego - 5,728 5,728 Library Donations - 5,563 5,563 Parks & Recreation Districts - 4,712 4,712 Library Improvement 4,277 - 4,277 Section 108 - 4,008 4,008 6th & K Operating Fund - 3,869 3,869 Citizens Option for Public Safety (COPS) - 3,664 3,664 Seized Assets - 2,642 2,642 Library Endowments - 2,574 2,574 Miscellaneous Donations - 2,523 2,523 Los Penasquitos Trust - 2,250 2,250 Animal Shelter Campaign - 1,805 1,805 Successor Agency Property Management - 1,619 1,619 Mt. Hope Pre-Need Trust - 1,466 1,466 Abandoned Vehicle Abatement (AVA) - 1,392 1,392 Public Safety Training - 1,356 1,356 Tierrasanta Ordinance - 1,324 1,324 San Diego Regional Revolving Loan Fund - 1,180 1,180 Other 2 2,061 13,004 15,065
Total Restricted 116,253 1,617,147 1,733,400
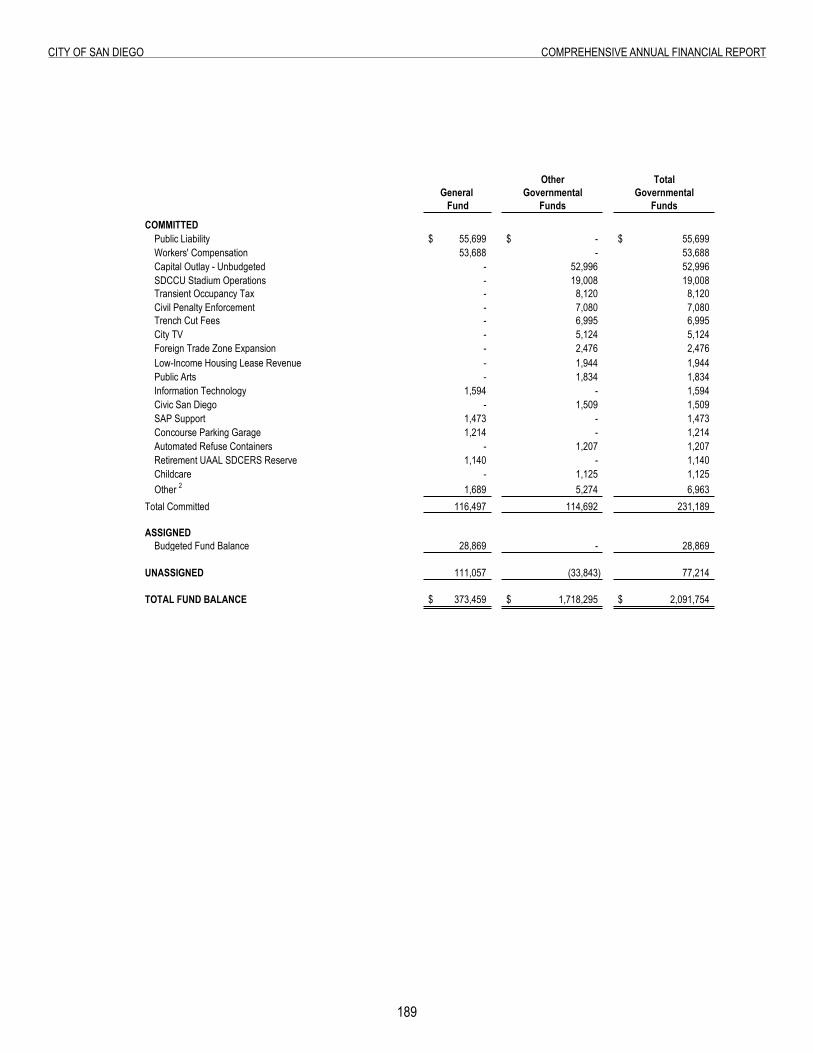
189
City of San Diego ComprehenSive annual finanCial report
Other TotalGeneral Governmental Governmental
Fund Funds Funds
COMMITTEDPublic Liability 55,699$ -$ 55,699$ Workers' Compensation 53,688 - 53,688 Capital Outlay - Unbudgeted - 52,996 52,996 SDCCU Stadium Operations - 19,008 19,008 Transient Occupancy Tax - 8,120 8,120 Civil Penalty Enforcement - 7,080 7,080 Trench Cut Fees - 6,995 6,995 City TV - 5,124 5,124 Foreign Trade Zone Expansion - 2,476 2,476 Low-Income Housing Lease Revenue - 1,944 1,944 Public Arts - 1,834 1,834 Information Technology 1,594 - 1,594 Civic San Diego - 1,509 1,509 SAP Support 1,473 - 1,473 Concourse Parking Garage 1,214 - 1,214 Automated Refuse Containers - 1,207 1,207 Retirement UAAL SDCERS Reserve 1,140 - 1,140 Childcare - 1,125 1,125 Other 2 1,689 5,274 6,963
Total Committed 116,497 114,692 231,189
ASSIGNEDBudgeted Fund Balance 28,869 - 28,869
UNASSIGNED 111,057 (33,843) 77,214
TOTAL FUND BALANCE 373,459$ 1,718,295$ 2,091,754$
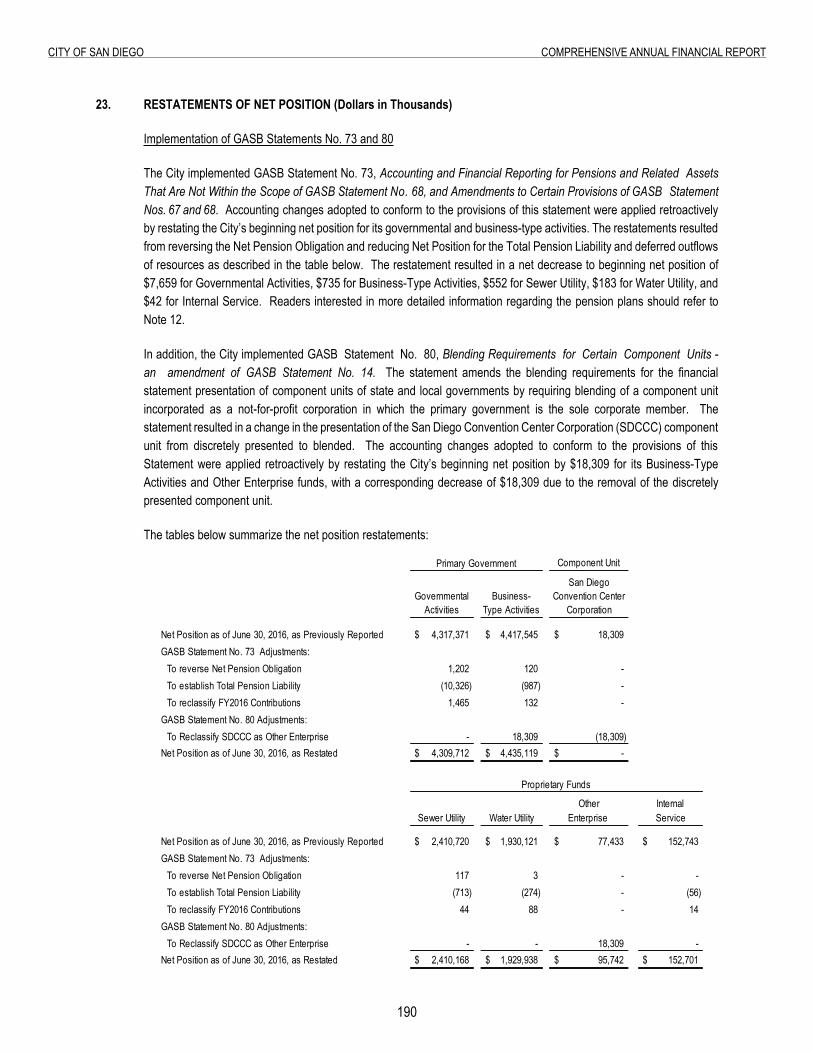
190
City of San Diego ComprehenSive annual finanCial report
23. restatements of net position
23. RESTATEMENTS OF NET POSITION (Dollars in Thousands)
Implementation of GASB Statements No. 73 and 80
The City implemented GASB Statement No. 73, Accounting and Financial Reporting for Pensions and Related Assets That Are Not Within the Scope of GASB Statement No. 68, and Amendments to Certain Provisions of GASB Statement Nos. 67 and 68. Accounting changes adopted to conform to the provisions of this statement were applied retroactively by restating the City’s beginning net position for its governmental and business-type activities. The restatements resulted from reversing the Net Pension Obligation and reducing Net Position for the Total Pension Liability and deferred outflows of resources as described in the table below. The restatement resulted in a net decrease to beginning net position of $7,659 for Governmental Activities, $735 for Business-Type Activities, $552 for Sewer Utility, $183 for Water Utility, and $42 for Internal Service. Readers interested in more detailed information regarding the pension plans should refer to Note 12.
In addition, the City implemented GASB Statement No. 80, Blending Requirements for Certain Component Units - an amendment of GASB Statement No. 14. The statement amends the blending requirements for the financial statement presentation of component units of state and local governments by requiring blending of a component unit incorporated as a not-for-profit corporation in which the primary government is the sole corporate member. The statement resulted in a change in the presentation of the San Diego Convention Center Corporation (SDCCC) component unit from discretely presented to blended. The accounting changes adopted to conform to the provisions of this Statement were applied retroactively by restating the City’s beginning net position by $18,309 for its Business-Type Activities and Other Enterprise funds, with a corresponding decrease of $18,309 due to the removal of the discretely presented component unit.
The tables below summarize the net position restatements:
Component Unit
Governmental Activities
Business-Type Activities
San Diego Convention Center
Corporation
Net Position as of June 30, 2016, as Previously Reported 4,317,371$ 4,417,545$ 18,309$ GASB Statement No. 73 Adjustments:
To reverse Net Pension Obligation 1,202 120 - To establish Total Pension Liability (10,326) (987) - To reclassify FY2016 Contributions 1,465 132 -
GASB Statement No. 80 Adjustments: To Reclassify SDCCC as Other Enterprise - 18,309 (18,309)
Net Position as of June 30, 2016, as Restated 4,309,712$ 4,435,119$ -$
Other InternalSewer Utility Water Utility Enterprise Service
Net Position as of June 30, 2016, as Previously Reported 2,410,720$ 1,930,121$ 77,433$ 152,743$ GASB Statement No. 73 Adjustments:
To reverse Net Pension Obligation 117 3 - - To establish Total Pension Liability (713) (274) - (56) To reclassify FY2016 Contributions 44 88 - 14
GASB Statement No. 80 Adjustments: To Reclassify SDCCC as Other Enterprise - - 18,309 -
Net Position as of June 30, 2016, as Restated 2,410,168$ 1,929,938$ 95,742$ 152,701$
Proprietary Funds
Primary Government
191
City of San Diego ComprehenSive annual finanCial report
24. Subsequent Events
24. SUBSEQUENT EVENTS (Dollars in Thousands)
The following information describes certain events that occurred after the end of the fiscal year. Loan Agreements
On July 10, 2017, the City’s Sewer Utility Fund received an additional $1,913 disbursement from a $12,425 State Revolving Fund (SRF) Loan agreement with the California State Water Resources Control Board (SWRCB) for the Metropolitan Biosolids Center (MBC) Dewatering Centrifuge Replacement Project. The interest rate on the loan is 1.7% and the repayment period for the loan is 20 years, beginning one year after the completion of construction on the project currently projected for May 2018.
On August 15, 2017, the City’s Sewer Utility Fund received the final $4,537 disbursement from a $5,280 SRF Loan agreement with the SWRCB for the MBC Chemical Systems Improvement Project. The interest rate on the loan is 1.7% and the repayment period for the loan is 20 years, beginning November 2017.
On September 6, 2017, the City’s Water Utility Fund executed Amendment No. 1 to the Funding Agreement with the State Water Resources Control Board for the University Avenue Pipeline Replacement Project. Amendment No. 1 revised various terms and conditions of the Funding Agreement including an increase of the loan commitment from $15,300 to $26,000. The original Funding Agreement was executed on June 11, 2014.
On September 12, 2017, the City’s Water Utility Fund received an additional $1,080 disbursement from a $26,000 SRF Loan agreement with the SWRCB for the University Avenue Pipeline Replacement Project. The interest rate on the loan is 2.085% and the repayment period for the loan is 20 years, beginning one year after the completion of construction on the project. On October 30, 2017, the City’s Water Utility Fund executed an SRF loan agreement with the SWRCB in the amount of $15,000 for the 69th Street and Mohawk Pump Station Project. This project will include the installation of six pumps with MGD total capacity, the installation of approximately 7,000 feet of new pipelines, and provide structural improvements to meet seismic code. The obligation is secured by revenues of the Water Utility Fund. The interest rate on the loan is 1.7% and the repayment period is 30 years from completion of construction, which is estimated to be May 1, 2020.
Commercial Paper Notes
The PFFA issued tax-exempt governmental subordinate water revenue commercial paper notes in the amounts of $20,128 on October 10, 2017, $6,246 and $10,000 on December 5, 2017, to finance the design, acquisition, construction, installation and improvements of components of the City’s water system. The interest rates on the notes are 1.03%, 0.93% and 1.04%, respectively, and were issued in accordance with the commercial paper program resolution for the Water Utility Fund adopted on December 16, 2016. Changes to Pension Actuarial Assumptions On September 8, 2017, the SDCERS Board approved changes to actuarial assumptions, including: a) reductions in the pension system’s long-term discount rate from 7.00% to 6.75% effective with the July 1, 2017 actuarial valuation, and from 6.75% to 6.50% effective thereafter; b) investment earnings of 12% with the July 1, 2017 actuarial valuation and 6.64% effective thereafter; and c) a smoothing of future payments requiring higher City contributions from 2029 to 2023. SDCERS Board decisions are subject to further consideration with other assumptions in the following year’s
192
City of San Diego ComprehenSive annual finanCial report
Board approval process. Employer and employee contributions are anticipated to change, however, the revised contribution rates are not expected until spring 2018. Update to Actuarial Valuation of Net Pension Liability (NPL)
On November 17, 2017, the SDCERS actuary released the GASB 67/68 report identifying changes to the City’s NPL as of the measurement date of June 30, 2017. The report indicates the NPL is $2,522,057, a decrease of $128,497 due to the net results of the effective discount rate reduction to 6.75%, offset with an increase in net investment income in the pension plan during fiscal year 2017. The City reports its NPL one year in arrears, using the measurement date of June 30, 2016. The results of the new report will be reported in the fiscal year 2018 financial statements. Fourth District Court of Appeal Ruling on Proposition B On July 27, 2017, the California Supreme Court announced it has agreed to review the Fourth District Court of Appeals’ ruling on Proposition B, an initiative approved by City voters in 2012 that made significant changes to the pension benefits offered to City employees. In April 2017, the Court of Appeals found that the City was not required to meet and confer with City labor unions prior to Proposition B being placed on the ballot, as had been alleged by the City labor unions challenging the validity of Proposition B. Among other things, Proposition B closed the defined benefit retirement plan to newly hired City employees except sworn police officers. Other employees hired after the effective date of Proposition B participate in a defined contribution plan. Since its passage, the City has assumed the validity of Proposition B and has complied with its requirements in all respects. The City does not have a current estimate of the potential cost to the City in the event that Proposition B is invalidated by the California Supreme Court.

REQUIRED SUPPLEMENTARY INFORMATION (UNAUDITED)DefineD Benefit penSion plan
anDopeB plan
REQUIRED SUPPLEMENTARY INFORMATION (UNAUDITED)
DEFINED BENEFIT PENSION PLANS AND OPEB PLAN

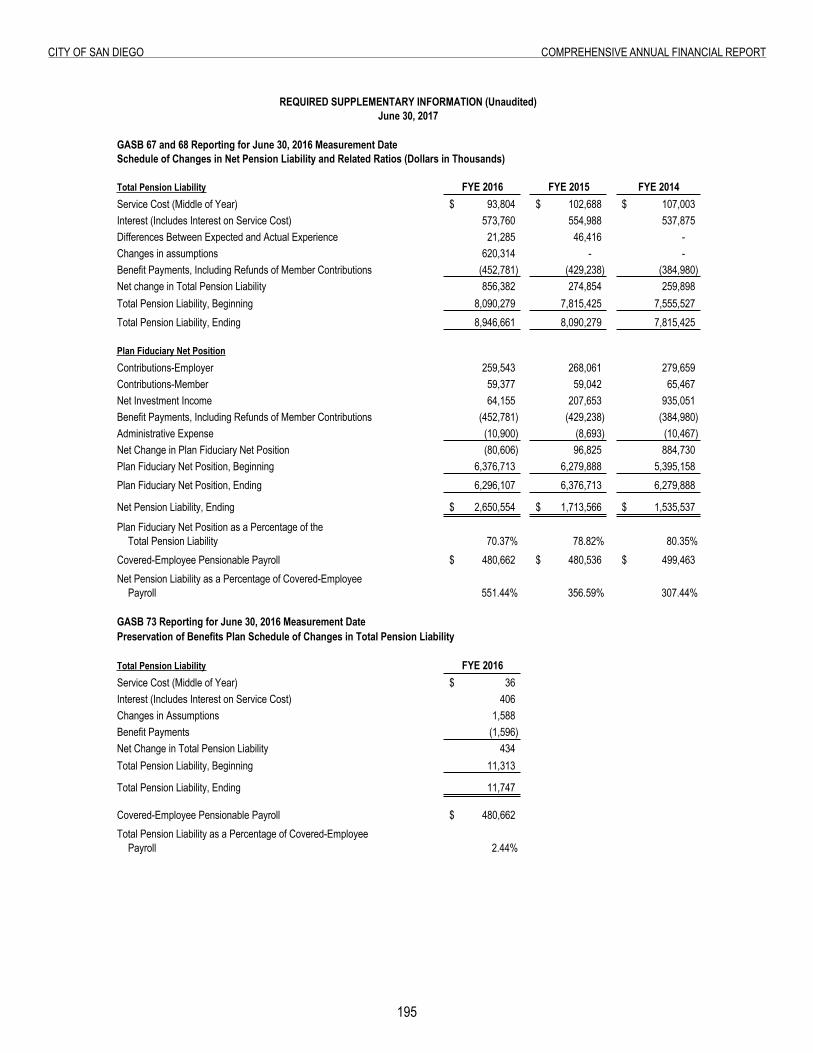
195
City of San Diego ComprehenSive annual finanCial report
Defined Benefit Pension Plans and OPEB PlanREQUIRED SUPPLEMENTARY INFOR-
GASB 67 and 68 Reporting for June 30, 2016 Measurement DateSchedule of Changes in Net Pension Liability and Related Ratios (Dollars in Thousands)
FYE 2016 FYE 2015 FYE 2014Service Cost (Middle of Year) 93,804$ 102,688$ 107,003$
573,760 554,988 537,875 Differences Between Expected and Actual Experience 21,285 46,416 - Changes in assumptions 620,314 - - Benefit Payments, Including Refunds of Member Contributions (452,781) (429,238) (384,980)
856,382 274,854 259,898 8,090,279 7,815,425 7,555,527 8,946,661 8,090,279 7,815,425
Contributions-Employer 259,543 268,061 279,659 Contributions-Member 59,377 59,042 65,467 Net Investment Income 64,155 207,653 935,051 Benefit Payments, Including Refunds of Member Contributions (452,781) (429,238) (384,980) Administrative Expense (10,900) (8,693) (10,467) Net Change in Plan Fiduciary Net Position (80,606) 96,825 884,730
6,376,713 6,279,888 5,395,158 6,296,107 6,376,713 6,279,888
Net Pension Liability, Ending 2,650,554$ 1,713,566$ 1,535,537$
Plan Fiduciary Net Position as a Percentage of theTotal Pension Liability 70.37% 78.82% 80.35%
Covered-Employee Pensionable Payroll 480,662$ 480,536$ 499,463$ Net Pension Liability as a Percentage of Covered-Employee
Payroll 551.44% 356.59% 307.44%
GASB 73 Reporting for June 30, 2016 Measurement DatePreservation of Benefits Plan Schedule of Changes in Total Pension Liability
FYE 2016Service Cost (Middle of Year) 36$
406 Changes in Assumptions 1,588 Benefit Payments (1,596)
434 11,313
11,747
Covered-Employee Pensionable Payroll 480,662$ Total Pension Liability as a Percentage of Covered-Employee
Payroll 2.44%
REQUIRED SUPPLEMENTARY INFORMATION (Unaudited)June 30, 2017
Total Pension Liability
Interest (Includes Interest on Service Cost)
Net change in Total Pension LiabilityTotal Pension Liability, BeginningTotal Pension Liability, Ending
Plan Fiduciary Net Position
Plan Fiduciary Net Position, BeginningPlan Fiduciary Net Position, Ending
Total Pension Liability
Interest (Includes Interest on Service Cost)
Net Change in Total Pension LiabilityTotal Pension Liability, Beginning
Total Pension Liability, Ending
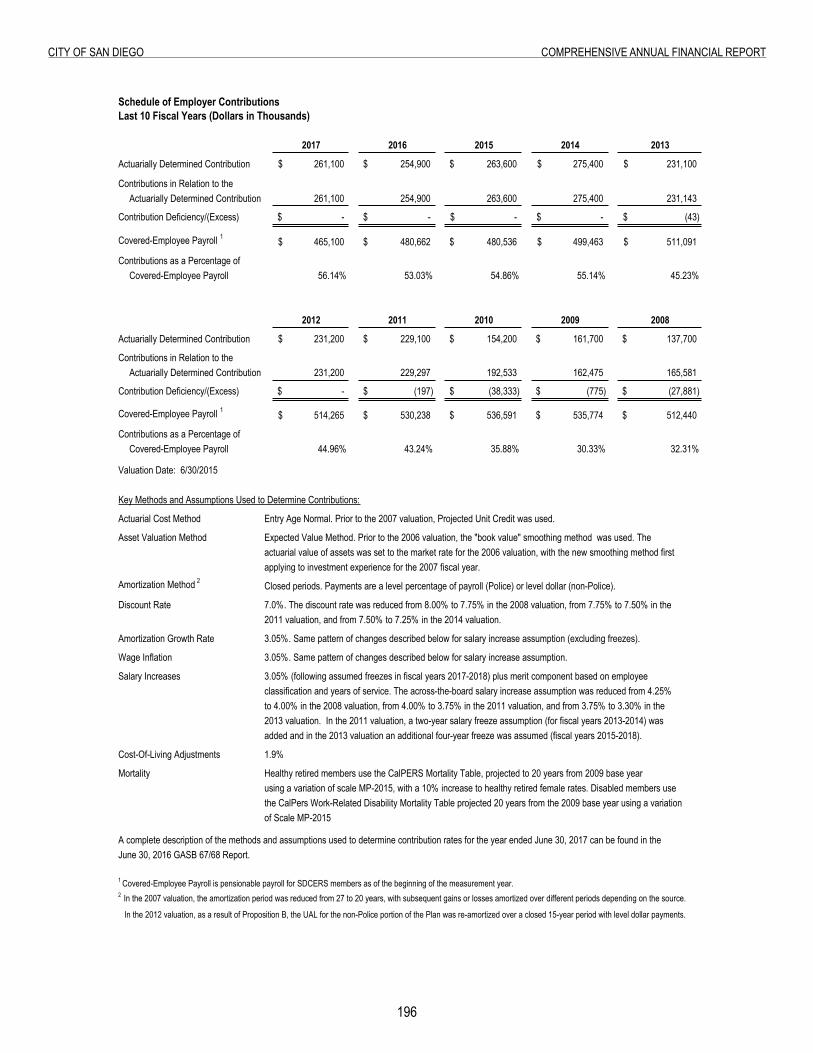
196
City of San Diego ComprehenSive annual finanCial report
Schedule of Employer ContributionsLast 10 Fiscal Years (Dollars in Thousands)
2017 2016 2015 2014 2013
Actuarially Determined Contribution 261,100$ 254,900$ 263,600$ 275,400$ 231,100$
Contributions in Relation to theActuarially Determined Contribution 261,100 254,900 263,600 275,400 231,143
Contribution Deficiency/(Excess) -$ -$ -$ -$ (43)$
Covered-Employee Payroll 1 465,100$ 480,662$ 480,536$ 499,463$ 511,091$
Contributions as a Percentage ofCovered-Employee Payroll 56.14% 53.03% 54.86% 55.14% 45.23%
2012 2011 2010 2009 2008
Actuarially Determined Contribution 231,200$ 229,100$ 154,200$ 161,700$ 137,700$
Contributions in Relation to theActuarially Determined Contribution 231,200 229,297 192,533 162,475 165,581
Contribution Deficiency/(Excess) -$ (197)$ (38,333)$ (775)$ (27,881)$
Covered-Employee Payroll 1 514,265$ 530,238$ 536,591$ 535,774$ 512,440$
Contributions as a Percentage ofCovered-Employee Payroll 44.96% 43.24% 35.88% 30.33% 32.31%
Valuation Date: 6/30/2015
Key Methods and Assumptions Used to Determine Contributions:
Actuarial Cost Method Entry Age Normal. Prior to the 2007 valuation, Projected Unit Credit was used.
Asset Valuation Method Expected Value Method. Prior to the 2006 valuation, the "book value" smoothing method was used. The actuarial value of assets was set to the market rate for the 2006 valuation, with the new smoothing method firstapplying to investment experience for the 2007 fiscal year.
Amortization Method 2 Closed periods. Payments are a level percentage of payroll (Police) or level dollar (non-Police).
Discount Rate 7.0%. The discount rate was reduced from 8.00% to 7.75% in the 2008 valuation, from 7.75% to 7.50% in the2011 valuation, and from 7.50% to 7.25% in the 2014 valuation.
Amortization Growth Rate 3.05%. Same pattern of changes described below for salary increase assumption (excluding freezes).
Wage Inflation 3.05%. Same pattern of changes described below for salary increase assumption.
Salary Increases 3.05% (following assumed freezes in fiscal years 2017-2018) plus merit component based on employee classification and years of service. The across-the-board salary increase assumption was reduced from 4.25%to 4.00% in the 2008 valuation, from 4.00% to 3.75% in the 2011 valuation, and from 3.75% to 3.30% in the2013 valuation. In the 2011 valuation, a two-year salary freeze assumption (for fiscal years 2013-2014) wasadded and in the 2013 valuation an additional four-year freeze was assumed (fiscal years 2015-2018).
Cost-Of-Living Adjustments
Mortality Healthy retired members use the CalPERS Mortality Table, projected to 20 years from 2009 base yearusing a variation of scale MP-2015, with a 10% increase to healthy retired female rates. Disabled members use the CalPers Work-Related Disability Mortality Table projected 20 years from the 2009 base year using a variation of Scale MP-2015
A complete description of the methods and assumptions used to determine contribution rates for the year ended June 30, 2017 can be found in the June 30, 2016 GASB 67/68 Report.
1 Covered-Employee Payroll is pensionable payroll for SDCERS members as of the beginning of the measurement year. 2 In the 2007 valuation, the amortization period was reduced from 27 to 20 years, with subsequent gains or losses amortized over different periods depending on the source.
In the 2012 valuation, as a result of Proposition B, the UAL for the non-Police portion of the Plan was re-amortized over a closed 15-year period with level dollar payments.
1.9%
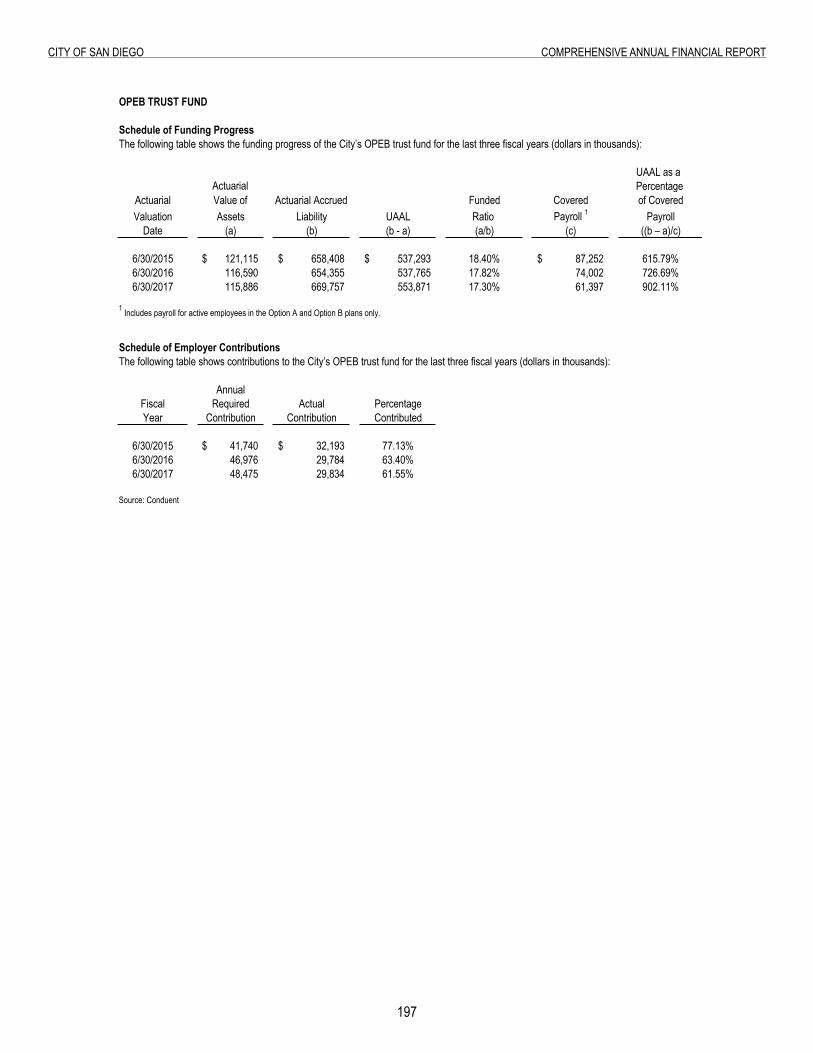
197
City of San Diego ComprehenSive annual finanCial report
UAAL as a Percentage of Covered
Valuation Assets Liability UAAL Ratio Payroll 1 PayrollDate (a) (b) (b - a) (a/b) (c) ((b – a)/c)
6/30/2015 121,115$ 658,408$ 537,293$ 18.40% 87,252$ 615.79%6/30/2016 116,590 654,355 537,765 17.82% 74,002 726.69%6/30/2017 115,886 669,757 553,871 17.30% 61,397 902.11%
AnnualFiscal Required Actual PercentageYear Contribution Contribution Contributed
6/30/2015 41,740$ 32,193$ 77.13%6/30/2016 46,976 29,784 63.40%6/30/2017 48,475 29,834 61.55%
Source: Conduent
OPEB TRUST FUND
The following table shows contributions to the City’s OPEB trust fund for the last three fiscal years (dollars in thousands):Schedule of Employer Contributions
FundedActuarial Accrued Covered
Schedule of Funding Progress
ActuarialActuarial Value of
The following table shows the funding progress of the City’s OPEB trust fund for the last three fiscal years (dollars in thousands):
1 Includes payroll for active employees in the Option A and Option B plans only.

this page intentionally left Blank
198
Page Intentionally Left Blank

REQUIRED SUPPLEMENTARY INFORMATION (UNAUDITED)general funD
REQUIRED SUPPLEMENTARY INFORMATION (UNAUDITED)
GENERAL FUND

201
City of San Diego ComprehenSive annual finanCial report
GENERAL FUND
The General Fund is the chief operating fund of the City. It is used to account for all financial resources except those required to be accounted for in another fund.
General Fund revenues are derived from such sources as: Taxes; Licenses and Permits; Fines, Forfeitures, and Penalties; Revenue from the Use of Money and Property; Revenue from Federal and Other Agencies; Revenue from Private Sources; Charges for Current Services; and Other Revenue.
Current expenditures are classified by the following functions: General Government and Support; Public Safety - Police; Public Safety - Fire and Life Safety and Homeland Security; Parks, Recreation, Culture and Leisure; Transportation; Sanitation and Health; Neighborhood Services; Capital Outlay; and Debt Service Principal and Interest. This fund is appropriated annually.
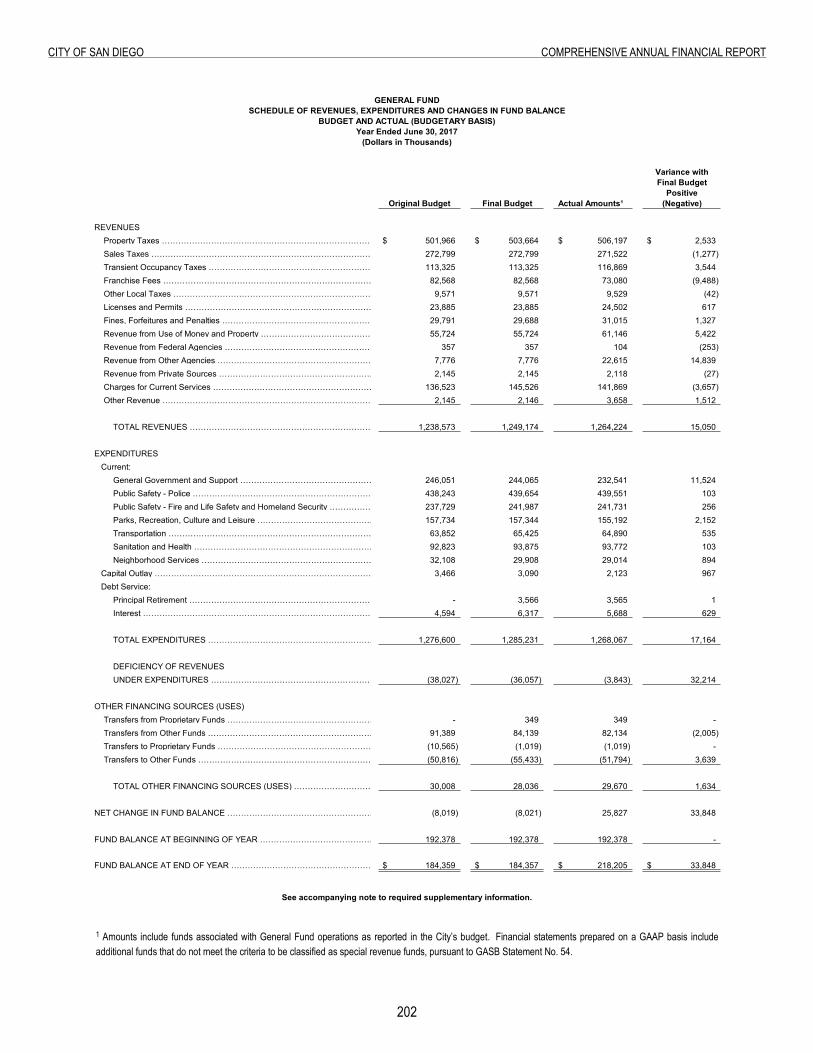
202
City of San Diego ComprehenSive annual finanCial report
GENERAL FUNDSCHEDULE OF REVENUES, EXPENDITURES AND CHANGES IN FUND BALANCE
BUDGET AND ACTUAL (BUDGETARY BASIS)Year Ended June 30, 2017
(Dollars in Thousands)
Variance withFinal Budget
PositiveOriginal Budget Final Budget Actual Amounts¹ (Negative)
REVENUESProperty Taxes …………………………………………………………………………………………………………………………………..501,966$ 503,664$ 506,197$ 2,533$ Sales Taxes …………………………………………………………………………………………………………………………………………….272,799 272,799 271,522 (1,277) Transient Occupancy Taxes ………………………………………………………………………………………………………..113,325 113,325 116,869 3,544 Franchise Fees ………………………………………………………………………………………………………………………………………… 82,568 82,568 73,080 (9,488) Other Local Taxes …………………………………………………………………………………………………………………………………………9,571 9,571 9,529 (42) Licenses and Permits ………………………………………………………………………………………………………………………………23,885 23,885 24,502 617 Fines, Forfeitures and Penalties ………………………………………………………………………………………………..29,791 29,688 31,015 1,327 Revenue from Use of Money and Property ………………………………………………………………………..55,724 55,724 61,146 5,422 Revenue from Federal Agencies …………………………………………………………………………………………357 357 104 (253) Revenue from Other Agencies …………………………………………………………………………………………….7,776 7,776 22,615 14,839 Revenue from Private Sources …………………………………………………………………………………………….2,145 2,145 2,118 (27) Charges for Current Services ……………………………………………………………………………………………….136,523 145,526 141,869 (3,657) Other Revenue …………………………………………………………………………………………………………………………………………………2,145 2,146 3,658 1,512
TOTAL REVENUES ………………………………………………………………………………………………………..1,238,573 1,249,174 1,264,224 15,050
EXPENDITURES Current:
General Government and Support ………………………………………………………………………………………………………246,051 244,065 232,541 11,524 Public Safety - Police ……………………………………………………………………………………………………………………………438,243 439,654 439,551 103 Public Safety - Fire and Life Safety and Homeland Security …………………………………………………………….237,729 241,987 241,731 256 Parks, Recreation, Culture and Leisure ……………………………………………………………………………………………..157,734 157,344 155,192 2,152 Transportation ……………………………………………………………………………………………………………………………………………….63,852 65,425 64,890 535 Sanitation and Health ……………………………………………………………………………………………………………………….92,823 93,875 93,772 103 Neighborhood Services ……………………………………………………………………………………………………………………..32,108 29,908 29,014 894
Capital Outlay ……………………………………………………………………………..…………………………………………………………….3,466 3,090 2,123 967 Debt Service:
Principal Retirement …………………………………………………………………………………………………………………………..- 3,566 3,565 1 Interest …………………………………………………………………………………………………………………………………………………………4,594 6,317 5,688 629
TOTAL EXPENDITURES ……………………………………………………………………………………………………..1,276,600 1,285,231 1,268,067 17,164
DEFICIENCY OF REVENUESUNDER EXPENDITURES ………………………………………………………………………………………..(38,027) (36,057) (3,843) 32,214
OTHER FINANCING SOURCES (USES)Transfers from Proprietary Funds ……………………………………………………………………………………………………..- 349 349 - Transfers from Other Funds ………………………………………………………………………………………………………………91,389 84,139 82,134 (2,005) Transfers to Proprietary Funds ………………………………………………………………………………………………………..(10,565) (1,019) (1,019) - Transfers to Other Funds ………………………………………………………………………………………………………………………(50,816) (55,433) (51,794) 3,639
TOTAL OTHER FINANCING SOURCES (USES) ……………………………………………………………30,008 28,036 29,670 1,634
NET CHANGE IN FUND BALANCE ……………………………………………………………………………………..(8,019) (8,021) 25,827 33,848
FUND BALANCE AT BEGINNING OF YEAR ……………………………………………………………………………………………………………..192,378 192,378 192,378 -
FUND BALANCE AT END OF YEAR ………………………………………………………………………………………………………………………………………….184,359$ 184,357$ 218,205$ 33,848$
See accompanying note to required supplementary information.
General Fund Schedule of Revenues, Expenditures and Changes in Fund Balance - Budget and Actual
1 Amounts include funds associated with General Fund operations as reported in the City’s budget. Financial statements prepared on a GAAP basis include additional funds that do not meet the criteria to be classified as special revenue funds, pursuant to GASB Statement No. 54.
203
City of San Diego ComprehenSive annual finanCial report
Note to Required Supplementary Information
NOTE TO REQUIRED SUPPLEMENTARY INFORMATION Year Ended June 30, 2017
SUMMARY OF SIGNIFICANT ACCOUNTING POLICIES
Budgetary Data
Each year, the Mayor submits to the City Council and the public a proposed operating and capital improvements budget by April 15 for the fiscal year commencing July 1. This budget includes annual budgets for the following governmental funds:
General Fund Special Revenue Funds City of San Diego: Acquisition, Improvement and Operations SDCCU Stadium Operations Transient Occupancy Tax Underground Surcharge Zoological Exhibits Other Special Revenue Civic San Diego Capital Projects Funds City of San Diego: TransNet Capital Outlay
Included in the budget are funds that include appropriations for personnel expenses and capital projects and certain funds that collect restricted or committed revenue sources. For those funds not specifically included in the budget, the Appropriation Ordinance includes authorization to appropriate funds for the purpose established by applicable laws and/or in accordance with provisions of agreements authorized by the City Council.
Public hearings are conducted to obtain residents’ comments on the proposed budget. A budget resolution legally adopting the budget for the next fiscal year is passed prior to June 15. During the month of July, the Appropriation Ordinance is passed by the City Council, appropriating funds according to the budget resolution. Budgets are prepared on the modified accrual basis of accounting, with the exception that any increase/decrease in advances to other funds and agencies are considered as additions/deductions of expenditures. The City budget is prepared excluding unrealized gains or losses resulting from the change in fair value of investments.
Budgetary control is established at the highest level by the City Charter and further defined by the City Council in the Appropriation Ordinance. The level of budgetary control for all City funds is exercised at the salaries and wages and non-personnel expenditures level. Budgetary control for the General Fund is at the department level, while control for other budgeted funds, including those of certain component units, is maintained at the total fund appropriation level. All amendments to the adopted budget require City Council approval except as delegated in the Appropriation Ordinance.
Reported budget figures are as originally adopted or subsequently amended. Appropriations lapse at year-end to the extent that they have not been expended except for those of a capital nature, which continue to subsequent years.
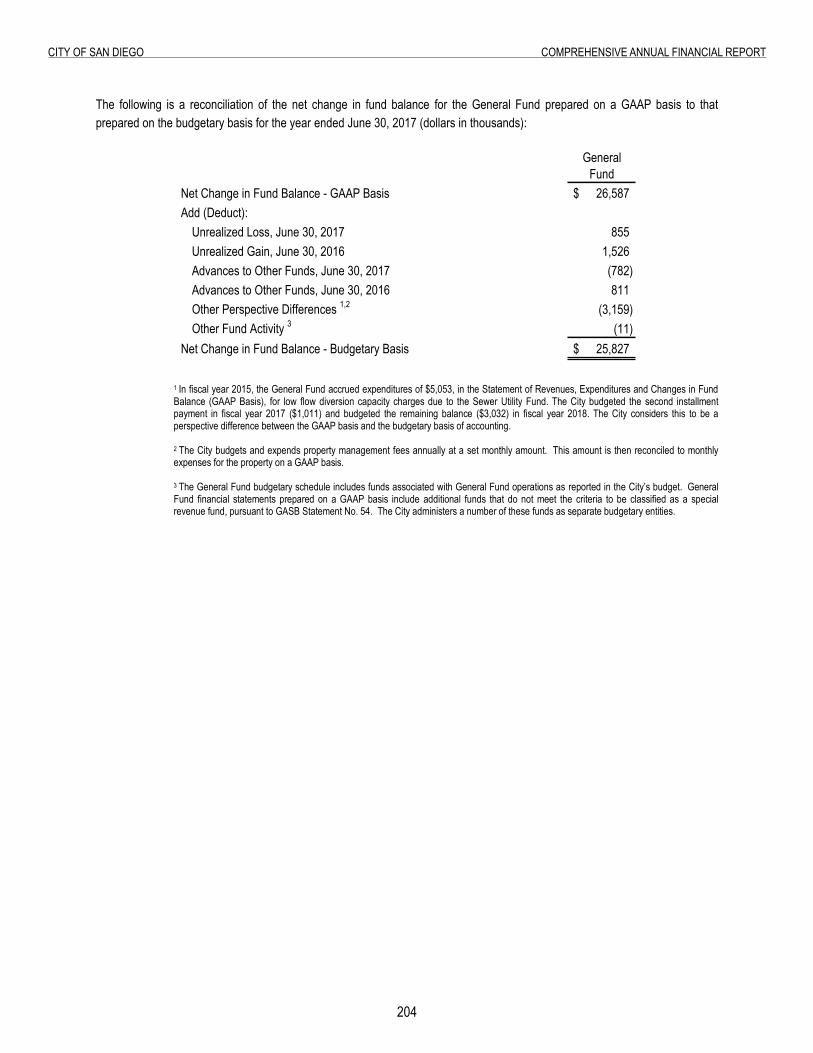
20�
City of San Diego ComprehenSive annual finanCial report
The following is a reconciliation of the net change in fund balance for the General Fund prepared on a GAAP basis to that prepared on the budgetary basis for the year ended June 30, 2017 (dollars in thousands):1
General
FundNet Change in Fund Balance - GAAP Basis 26,587$ Add (Deduct):
Unrealized Loss, June 30, 2017 855 Unrealized Gain, June 30, 2016 1,526 Advances to Other Funds, June 30, 2017 (782) Advances to Other Funds, June 30, 2016 811 Other Perspective Differences 1,2 (3,159) Other Fund Activity 3 (11)
Net Change in Fund Balance - Budgetary Basis 25,827$
1 In fiscal year 2015, the General Fund accrued expenditures of $5,053, in the Statement of Revenues, Expenditures and Changes in Fund Balance (GAAP Basis), for low flow diversion capacity charges due to the Sewer Utility Fund. The City budgeted the second installment payment in fiscal year 2017 ($1,011) and budgeted the remaining balance ($3,032) in fiscal year 2018. The City considers this to be a perspective difference between the GAAP basis and the budgetary basis of accounting. 2 The City budgets and expends property management fees annually at a set monthly amount. This amount is then reconciled to monthly expenses for the property on a GAAP basis.
3 The General Fund budgetary schedule includes funds associated with General Fund operations as reported in the City’s budget. General Fund financial statements prepared on a GAAP basis include additional funds that do not meet the criteria to be classified as a special revenue fund, pursuant to GASB Statement No. 54. The City administers a number of these funds as separate budgetary entities.
ComBining anD inDiviDual funDfinanCial StatementS anD SCheDuleS
COMBINING AND INDIVIDU-
COMBINING AND INDIVIDUAL FUND FINANCIAL STATEMENTS
AND SCHEDULES

General Fund:
general funD
GENERAL FUND

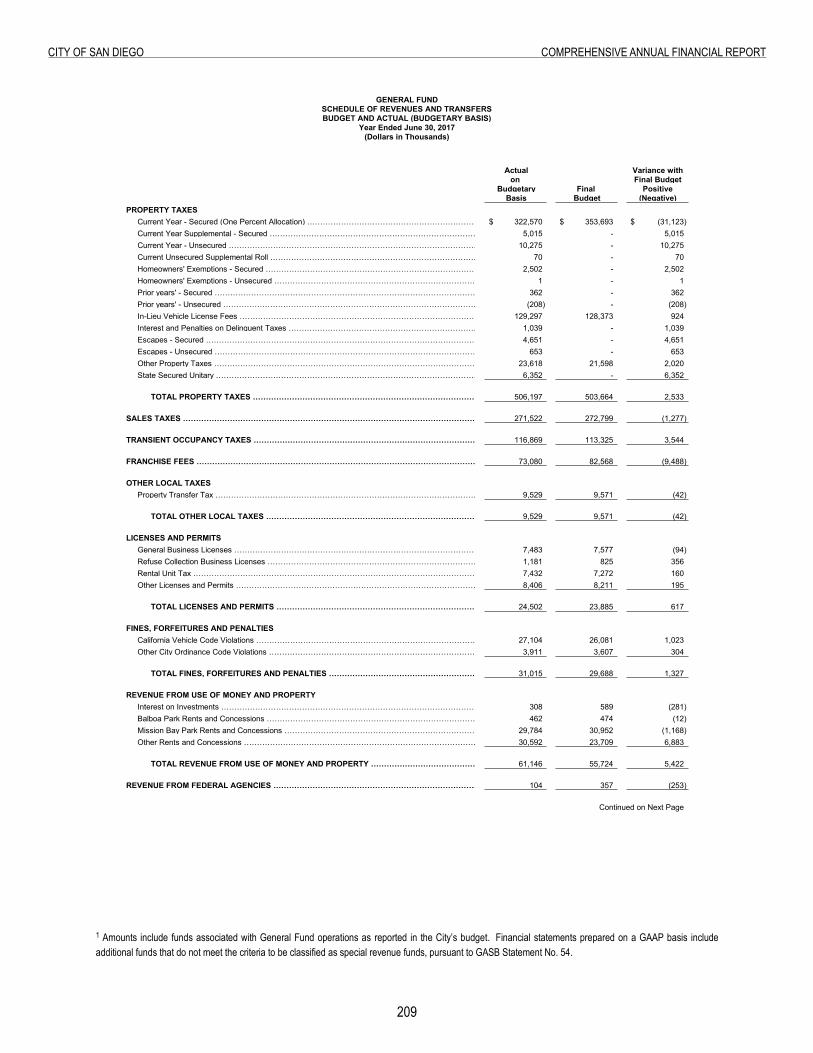
209
City of San Diego ComprehenSive annual finanCial report
Schedule of Revenues and Transfers - Budget and Actual (Budgetary Basis)
Actual Variance with on Final Budget Budgetary Final Positive Basis Budget (Negative)
PROPERTY TAXES Current Year - Secured (One Percent Allocation) ………………………………………………………………………………………………………………………………………………………………………………… 322,570$ 353,693$ (31,123)$ Current Year Supplemental - Secured ……………………………………………………………………………………………………….. 5,015 - 5,015 Current Year - Unsecured ………………………………………………………………………………………………………………………….. 10,275 - 10,275 Current Unsecured Supplemental Roll ……………………………………………………………………………………………………….. 70 - 70 Homeowners' Exemptions - Secured ………………………………………………………………………………………………………………….. 2,502 - 2,502 Homeowners' Exemptions - Unsecured ……………………………………………………………………………………………………………... 1 - 1 Prior years' - Secured …………………………………………………………………………………………………………………………………. 362 - 362 Prior years' - Unsecured …………………………………………………………………………………………………………………………………. (208) - (208) In-Lieu Vehicle License Fees …………………………………………………………………………………………………………………………………. 129,297 128,373 924 Interest and Penalties on Delinquent Taxes …………………………………………………………………………………………….. 1,039 - 1,039 Escapes - Secured ………………………………………………………………………………………………………………………………………… 4,651 - 4,651 Escapes - Unsecured ………………………………………………………………………………………………………………………………. 653 - 653 Other Property Taxes …………………………………………………………………………………………………………………………………. 23,618 21,598 2,020 State Secured Unitary ………………………………………………………………………………………………………………………………………. 6,352 - 6,352
TOTAL PROPERTY TAXES ………………………………………………………………………………………………………………. 506,197 503,664 2,533
SALES TAXES …………………………………………………………………………………………………………………………………………………. 271,522 272,799 (1,277)
TRANSIENT OCCUPANCY TAXES …………………………………………………………………………………………………………… 116,869 113,325 3,544
FRANCHISE FEES ………………………………………………………………………………………………………………………………………………………………………… 73,080 82,568 (9,488)
OTHER LOCAL TAXES Property Transfer Tax ……………………………………………………………………………………………………………………………………….. 9,529 9,571 (42)
TOTAL OTHER LOCAL TAXES …………………………………………………………………………………………………….. 9,529 9,571 (42)
LICENSES AND PERMITS
General Business Licenses ………………………………………………………………………………………………………………………………………….. 7,483 7,577 (94) Refuse Collection Business Licenses ………………………………………………………………………………………………………………………. 1,181 825 356 Rental Unit Tax ……………………………………………………………………………………………………………………………………………………….. 7,432 7,272 160 Other Licenses and Permits ……………………………………………………………………………………………………………………………………….. 8,406 8,211 195
TOTAL LICENSES AND PERMITS ……………………………………………………………………………………………….. 24,502 23,885 617
FINES, FORFEITURES AND PENALTIES
California Vehicle Code Violations …………………………………………………………………………………………………………………………… 27,104 26,081 1,023 Other City Ordinance Code Violations ……………………………………………………………………………………………………………. 3,911 3,607 304
TOTAL FINES, FORFEITURES AND PENALTIES …………………………………………………………………………. 31,015 29,688 1,327
REVENUE FROM USE OF MONEY AND PROPERTY
Interest on Investments …………………………………………………………………………………………………………………………………… 308 589 (281) Balboa Park Rents and Concessions ………………………………………………………………………………………………………………. 462 474 (12) Mission Bay Park Rents and Concessions ……………………………………………………………………………………………………… 29,784 30,952 (1,168) Other Rents and Concessions …………………………………………………………………………………………………………………………………. 30,592 23,709 6,883
TOTAL REVENUE FROM USE OF MONEY AND PROPERTY …………………………………………. 61,146 55,724 5,422
REVENUE FROM FEDERAL AGENCIES ……………………………………………………………………………… 104 357 (253)
Continued on Next Page
GENERAL FUNDSCHEDULE OF REVENUES AND TRANSFERSBUDGET AND ACTUAL (BUDGETARY BASIS)
Year Ended June 30, 2017(Dollars in Thousands)
1 Amounts include funds associated with General Fund operations as reported in the City’s budget. Financial statements prepared on a GAAP basis include additional funds that do not meet the criteria to be classified as special revenue funds, pursuant to GASB Statement No. 54.
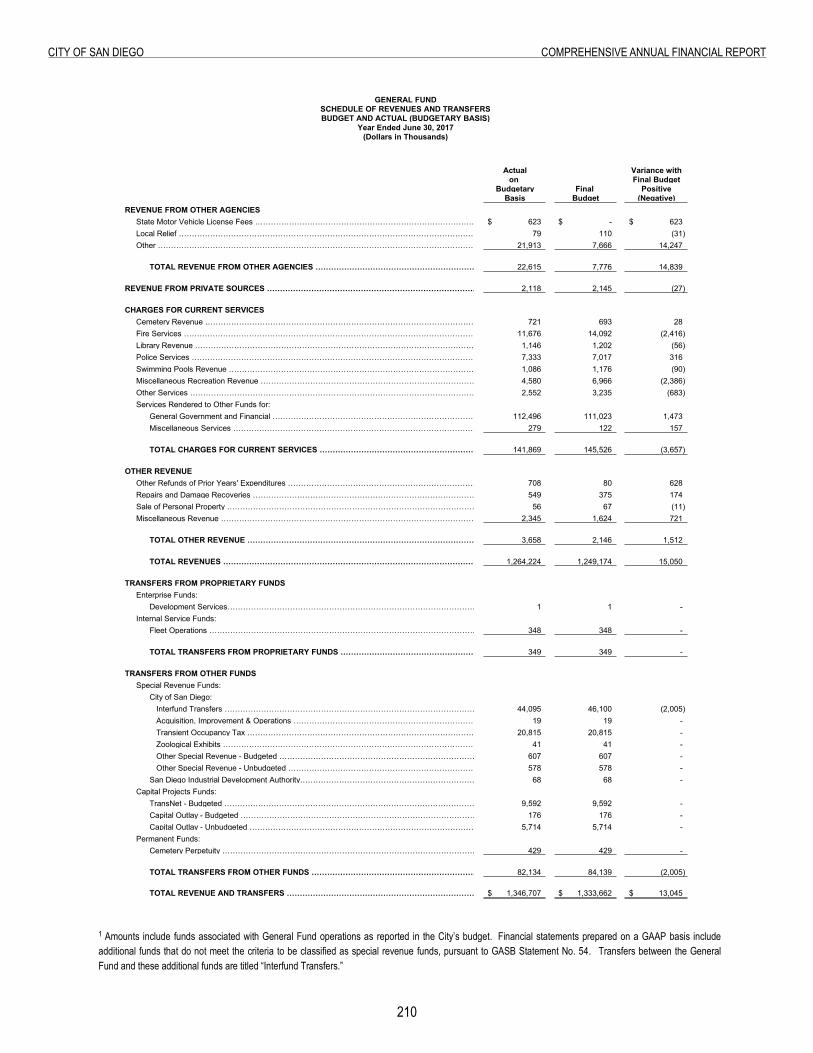
210
City of San Diego ComprehenSive annual finanCial report
Actual Variance with on Final Budget Budgetary Final Positive Basis Budget (Negative)
GENERAL FUNDSCHEDULE OF REVENUES AND TRANSFERSBUDGET AND ACTUAL (BUDGETARY BASIS)
Year Ended June 30, 2017(Dollars in Thousands)
REVENUE FROM OTHER AGENCIES State Motor Vehicle License Fees ………………………………………………………………………………………………………… 623$ -$ 623$ Local Relief ………………………………………………………………………………………………………………………………………………….. 79 110 (31) Other …………………………………………………………………………………………………………………………………………………………… 21,913 7,666 14,247
TOTAL REVENUE FROM OTHER AGENCIES ……………………………………………………………………………………………………. 22,615 7,776 14,839
REVENUE FROM PRIVATE SOURCES ………………………………………………………………………………………………… 2,118 2,145 (27)
CHARGES FOR CURRENT SERVICES
Cemetery Revenue ……………………………………………………………………………………………………………………………………….. 721 693 28 Fire Services ………………………………………………………………………………………………………………………………………………… 11,676 14,092 (2,416) Library Revenue …………………………………………………………………………………………………………………………………………………… 1,146 1,202 (56) Police Services ………………………………………………………………………………………………………………………………………………. 7,333 7,017 316 Swimming Pools Revenue ……………………………………………………………………………………………………………………………… 1,086 1,176 (90) Miscellaneous Recreation Revenue …………………………………………………………………………………………………………… 4,580 6,966 (2,386) Other Services ………………………………………………………………………………………………………………………………………….. 2,552 3,235 (683) Services Rendered to Other Funds for:
General Government and Financial …………………………………………………………………………………………………. 112,496 111,023 1,473 Miscellaneous Services …………………………………………………………………………………………………………………………. 279 122 157
TOTAL CHARGES FOR CURRENT SERVICES ……………………………………………………………………………. 141,869 145,526 (3,657)
OTHER REVENUE
Other Refunds of Prior Years' Expenditures ……………………………………………………………………………………………….. 708 80 628 Repairs and Damage Recoveries ………………………………………………………………………………………………………………….. 549 375 174 Sale of Personal Property …………………………………………………………………………………………………………………………. 56 67 (11) Miscellaneous Revenue …………………………………………………………………………………………………………………………… 2,345 1,624 721
TOTAL OTHER REVENUE …………………………………………………………………………………………………….. 3,658 2,146 1,512
TOTAL REVENUES ………………………………………………………………………………………………………………. 1,264,224 1,249,174 15,050
TRANSFERS FROM PROPRIETARY FUNDS Enterprise Funds:
Development Services………………………………………………………………………………………………………………………………………….. 1 1 - Internal Service Funds:
Fleet Operations ………………………………………………………………………………………………………………………………………………. 348 348 -
TOTAL TRANSFERS FROM PROPRIETARY FUNDS ………………………………………………….. 349 349 -
TRANSFERS FROM OTHER FUNDS Special Revenue Funds:
City of San Diego: Interfund Transfers ………………………………………………………………………………………………………………………………………….. 44,095 46,100 (2,005) Acquisition, Improvement & Operations …………………………………………………………………………………………………………… 19 19 - Transient Occupancy Tax …………………………………………………………………………………………………………………… 20,815 20,815 - Zoological Exhibits ……………………………………………………………………………………………………………………………………… 41 41 - Other Special Revenue - Budgeted ………………………………………………………………………………………………….. 607 607 - Other Special Revenue - Unbudgeted ………………………………………………………………………………………………….. 578 578 - San Diego Industrial Development Authority……………………………………………………………………… 68 68 -
Capital Projects Funds: TransNet - Budgeted …………………………………………………………………………………………………………………………………………. 9,592 9,592 - Capital Outlay - Budgeted …………………………………………………………………………………………………………………… 176 176 - Capital Outlay - Unbudgeted …………………………………………………………………………………………………………………………….. 5,714 5,714 -
Permanent Funds: Cemetery Perpetuity ……………………………………………………………………………………………………………………………… 429 429 -
TOTAL TRANSFERS FROM OTHER FUNDS ………………………………………………………………………………………. 82,134 84,139 (2,005)
TOTAL REVENUE AND TRANSFERS …………………………………………………………………………………………………………. 1,346,707$ 1,333,662$ 13,045$
1 Amounts include funds associated with General Fund operations as reported in the City’s budget. Financial statements prepared on a GAAP basis include additional funds that do not meet the criteria to be classified as special revenue funds, pursuant to GASB Statement No. 54. Transfers between the General Fund and these additional funds are titled “Interfund Transfers.”
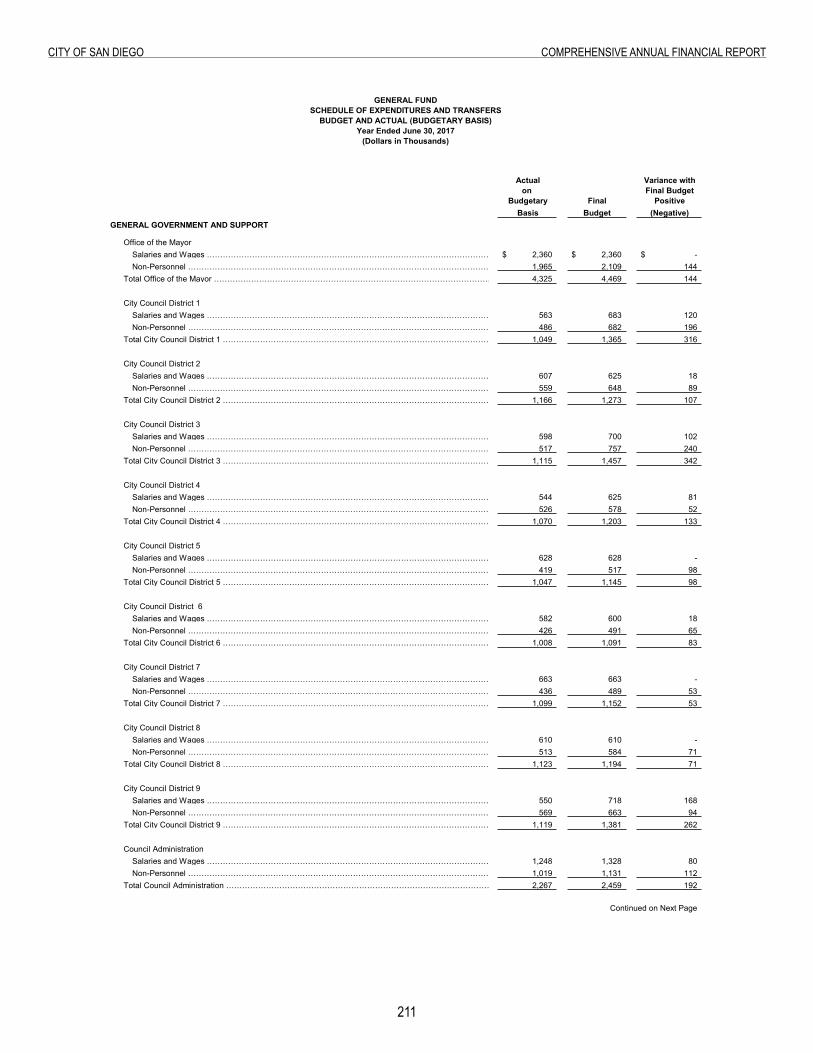
211
City of San Diego ComprehenSive annual finanCial report
Schedule of Expenditures and Transfers - Budget and Actual (Budgetary Basis)
GENERAL FUNDSCHEDULE OF EXPENDITURES AND TRANSFERS
BUDGET AND ACTUAL (BUDGETARY BASIS)
(Dollars in Thousands)
Actual Variance with on Final Budget Budgetary Final Positive
Basis Budget (Negative)GENERAL GOVERNMENT AND SUPPORT
Office of the MayorSalaries and Wages ……………………………………………………………………………………………………….. 2,360$ 2,360$ -$ Non-Personnel …………………………………………………………………………………………………………… 1,965 2,109 144
Total Office of the Mayor ………………………………………………………………………………………………………………………………………….4,325 4,469 144
City Council District 1Salaries and Wages ………………………………………………………………………………………………… 563 683 120 Non-Personnel …………………………………………………………………………………………………………… 486 682 196
Total City Council District 1 …………………………………………………………………………………………… 1,049 1,365 316
City Council District 2Salaries and Wages …………………………………………………………………………………………………… 607 625 18 Non-Personnel …………………………………………………………………………………………………………… 559 648 89
Total City Council District 2 ……………………………………………………………………………………………… 1,166 1,273 107
City Council District 3Salaries and Wages ………………………………………………………………………………………………………………………………598 700 102 Non-Personnel …………………………………………………………………………………………………………… 517 757 240
Total City Council District 3 ……………………………………………………………………………………………………. 1,115 1,457 342
City Council District 4Salaries and Wages ………………………………………………………………………………………………………… 544 625 81 Non-Personnel …………………………………………………………………………………………………………… 526 578 52
Total City Council District 4 …………………………………………………………………………………………………………1,070 1,203 133
City Council District 5Salaries and Wages ……………………………………………………………………………………………………………. 628 628 - Non-Personnel …………………………………………………………………………………………………………… 419 517 98
Total City Council District 5 ………………………………………………………………………………………………………………1,047 1,145 98
City Council District 6Salaries and Wages ………………………………………………………………………………………………………………582 600 18 Non-Personnel …………………………………………………………………………………………………………… 426 491 65
Total City Council District 6 …………………………………………………………………………………………………………1,008 1,091 83
City Council District 7Salaries and Wages ……………………………………………………………………………………………………………………………………663 663 - Non-Personnel …………………………………………………………………………………………………………… 436 489 53
Total City Council District 7 ……………………………………………………………………………………………………. 1,099 1,152 53
City Council District 8Salaries and Wages ……………………………………………………………………………………………………………..610 610 - Non-Personnel ………………………………………………………………………………………………………………………….513 584 71
Total City Council District 8 …………………………………………………………………………………………………………..1,123 1,194 71
City Council District 9Salaries and Wages …………………………………………………………………………………………………………… 550 718 168 Non-Personnel ………………………………………………………………………………………………………………………………………..569 663 94
Total City Council District 9 ………………………………………………………………………………………………………………………..1,119 1,381 262
Council AdministrationSalaries and Wages …………………………………………………………………………………………………………………………1,248 1,328 80 Non-Personnel ……………………………………………………………………………………………………………………………………..1,019 1,131 112
Total Council Administration ………………………………………………………………………………………………………………….2,267 2,459 192
Continued on Next Page
Year Ended June 30, 2017
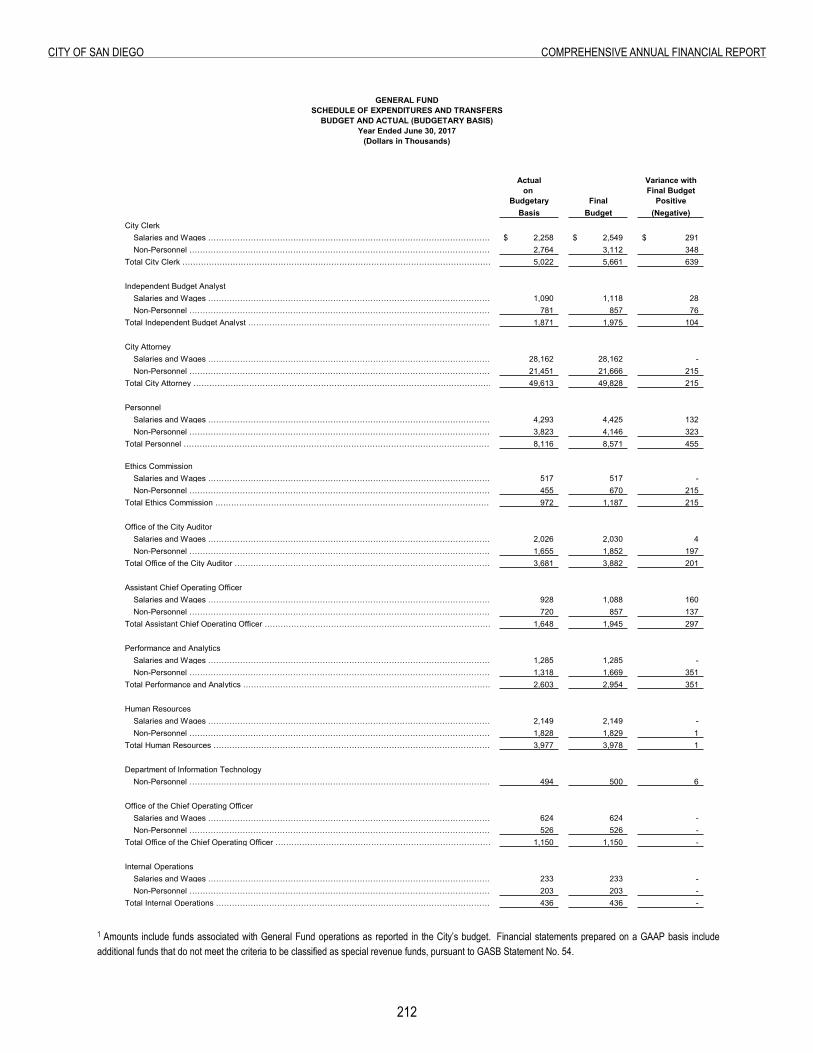
212
City of San Diego ComprehenSive annual finanCial report
GENERAL FUNDSCHEDULE OF EXPENDITURES AND TRANSFERS
BUDGET AND ACTUAL (BUDGETARY BASIS)
(Dollars in Thousands)
Actual Variance with on Final Budget Budgetary Final Positive
Basis Budget (Negative)
Year Ended June 30, 2017
City ClerkSalaries and Wages ………………………………………………………………………………………………………………………….2,258$ 2,549$ 291$ Non-Personnel …………………………………………………………………………………………………………………………………………….2,764 3,112 348
Total City Clerk ………………………………………………………………………………………………………………………………………….5,022 5,661 639
Independent Budget AnalystSalaries and Wages …………………………………………………………………………………………………………………………1,090 1,118 28 Non-Personnel ………………………………………………………………………………………………………………………………………………781 857 76
Total Independent Budget Analyst …………………………………………………………………………………………………………………..1,871 1,975 104
City AttorneySalaries and Wages …………………………………………………………………………………………………………………………28,162 28,162 - Non-Personnel …………………………………………………………………………………………………………………………………….21,451 21,666 215
Total City Attorney ……………………………………………………………………………………………………………………………….49,613 49,828 215
PersonnelSalaries and Wages ……………………………………………………………………………………………………………………..4,293 4,425 132 Non-Personnel ………………………………………………………………………………………………………………………………………………….3,823 4,146 323
Total Personnel ……………………………………………………………………………………………………………………………………8,116 8,571 455
Ethics CommissionSalaries and Wages …………………………………………………………………………………………………………………………..517 517 - Non-Personnel ……………………………………………………………………………………………………………………………………………………455 670 215
Total Ethics Commission ………………………………………………………………………………………………………………………….972 1,187 215
Office of the City AuditorSalaries and Wages ………………………………………………………………………………………………………………………………2,026 2,030 4 Non-Personnel ………………………………………………………………………………………………………………………………………………….1,655 1,852 197
Total Office of the City Auditor …………………………………………………………………………………………………………………………………………..3,681 3,882 201
Assistant Chief Operating OfficerSalaries and Wages …………………………………………………………………………………………………………………………….928 1,088 160 Non-Personnel ……………………………………………………………………………………………………………………………………………………….720 857 137
Total Assistant Chief Operating Officer ………………………………………………………………………………………………………………………………………….1,648 1,945 297
Performance and AnalyticsSalaries and Wages ……………………………………………………………………………………………………………………………………..1,285 1,285 - Non-Personnel ……………………………………………………………………………………………………………………………………………………………………..1,318 1,669 351
Total Performance and Analytics …………………………………………………………………………………………………………………………………………………………2,603 2,954 351
Human ResourcesSalaries and Wages ………………………………………………………………………………………………………………………………………………2,149 2,149 - Non-Personnel …………………………………………………………………………………………………………………………………………………….1,828 1,829 1
Total Human Resources ………………………………………………………………………………………………………………………………….3,977 3,978 1
Department of Information TechnologyNon-Personnel ……………………………………………………………………………………………………………………………………………………………..494 500 6
Office of the Chief Operating OfficerSalaries and Wages ………………………………………………………………………………………………………………………………..624 624 - Non-Personnel …………………………………………………………………………………………………………………………………………………………………..526 526 -
Total Office of the Chief Operating Officer ……………………………………………………………………………………………………..1,150 1,150 -
Internal OperationsSalaries and Wages ………………………………………………………………………………………………………………………………..233 233 - Non-Personnel ………………………………………………………………………………………………………………………………………………………………..203 203 -
Total Internal Operations …………………………………………………………………………………………………………………………..436 436 -
1 Amounts include funds associated with General Fund operations as reported in the City’s budget. Financial statements prepared on a GAAP basis include additional funds that do not meet the criteria to be classified as special revenue funds, pursuant to GASB Statement No. 54.
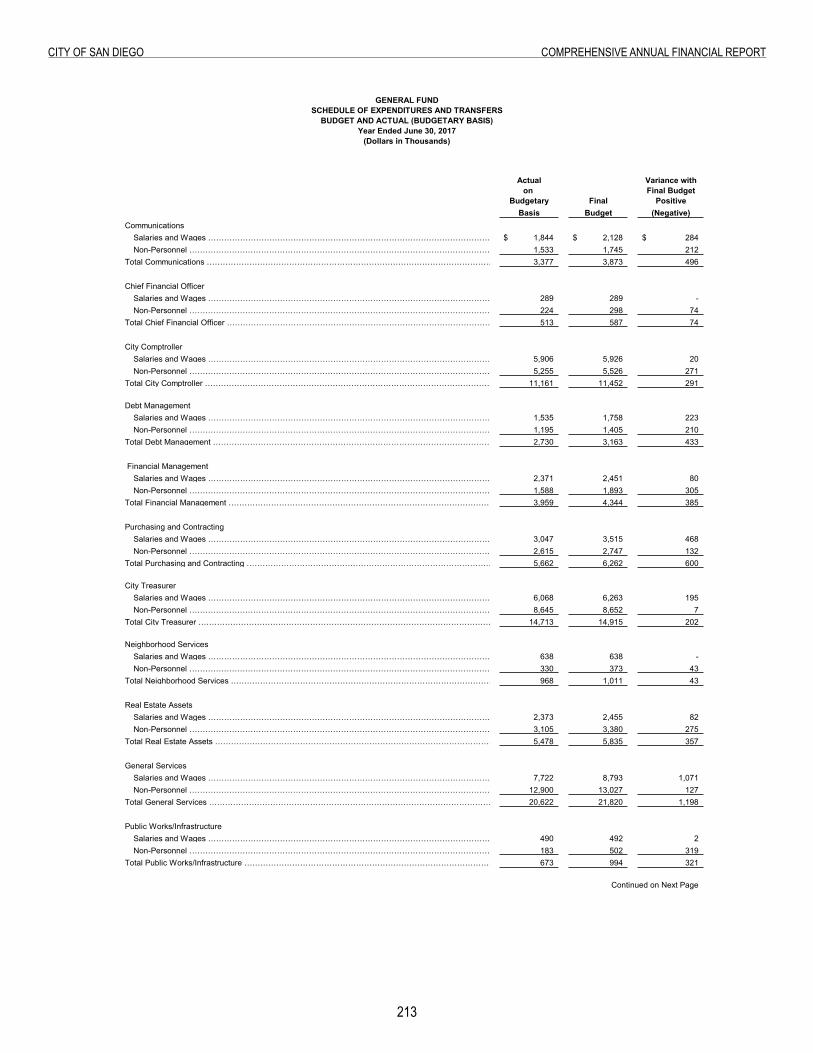
213
City of San Diego ComprehenSive annual finanCial report
GENERAL FUNDSCHEDULE OF EXPENDITURES AND TRANSFERS
BUDGET AND ACTUAL (BUDGETARY BASIS)
(Dollars in Thousands)
Actual Variance with on Final Budget Budgetary Final Positive
Basis Budget (Negative)
Year Ended June 30, 2017
CommunicationsSalaries and Wages ……………………………………………………………………………………………………………………….1,844$ 2,128$ 284$ Non-Personnel …………………………………………………………………………………………………………… 1,533 1,745 212
Total Communications ……………………………………………………………………………………………………………………..3,377 3,873 496
Chief Financial OfficerSalaries and Wages ……………………………………………………………………………………………………………..289 289 - Non-Personnel …………………………………………………………………………………………………………… 224 298 74
Total Chief Financial Officer …………………………………………………………………………………………………………………………513 587 74
City ComptrollerSalaries and Wages …………………………………………………………………………………………………………………………..5,906 5,926 20 Non-Personnel …………………………………………………………………………………………………………… 5,255 5,526 271
Total City Comptroller …………………………………………………………………………………………………………………………………11,161 11,452 291
Debt ManagementSalaries and Wages ……………………………………………………………………………………………………………………………1,535 1,758 223 Non-Personnel …………………………………………………………………………………………………………… 1,195 1,405 210
Total Debt Management ……………………………………………………………………………………………………………….2,730 3,163 433
Financial ManagementSalaries and Wages ……………………………………………………………………………………………………………………2,371 2,451 80 Non-Personnel …………………………………………………………………………………………………………… 1,588 1,893 305
Total Financial Management ……………………………………………………………………………………………………………..3,959 4,344 385
Purchasing and ContractingSalaries and Wages ……………………………………………………………………………………………………………..3,047 3,515 468 Non-Personnel …………………………………………………………………………………………………………… 2,615 2,747 132
Total Purchasing and Contracting …………………………………………………………………………………………………………………….5,662 6,262 600
City TreasurerSalaries and Wages ……………………………………………………………………………………………………………………….6,068 6,263 195 Non-Personnel …………………………………………………………………………………………………………… 8,645 8,652 7
Total City Treasurer …………………………………………………………………………………………………… 14,713 14,915 202
Neighborhood ServicesSalaries and Wages ……………………………………………………………………………………………………………………..638 638 - Non-Personnel …………………………………………………………………………………………………………… 330 373 43
Total Neighborhood Services …………………………………………………………………………………………… 968 1,011 43
Real Estate AssetsSalaries and Wages …………………………………………………………………………………………………………………………2,373 2,455 82 Non-Personnel …………………………………………………………………………………………………………… 3,105 3,380 275
Total Real Estate Assets ………………………………………………………………………………………………………………5,478 5,835 357
General Services Salaries and Wages ……………………………………………………………………………………………………………….7,722 8,793 1,071 Non-Personnel …………………………………………………………………………………………………………… 12,900 13,027 127
Total General Services ………………………………………………………………………………………………………………..20,622 21,820 1,198
Public Works/InfrastructureSalaries and Wages ………………………………………………………………………………………………………………..490 492 2 Non-Personnel …………………………………………………………………………………………………………… 183 502 319
Total Public Works/Infrastructure …………………………………………………………………………………. 673 994 321
Continued on Next Page
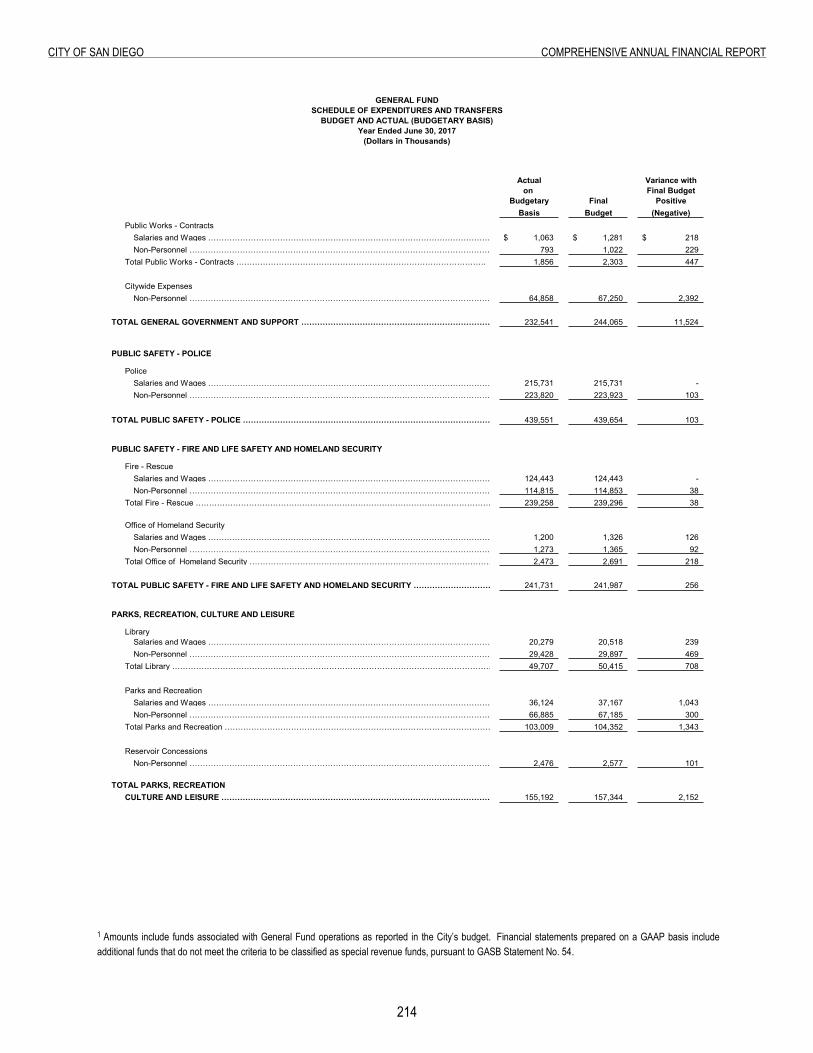
21�
City of San Diego ComprehenSive annual finanCial report
GENERAL FUNDSCHEDULE OF EXPENDITURES AND TRANSFERS
BUDGET AND ACTUAL (BUDGETARY BASIS)
(Dollars in Thousands)
Actual Variance with on Final Budget Budgetary Final Positive
Basis Budget (Negative)
Year Ended June 30, 2017
Public Works - ContractsSalaries and Wages ……………………………………………………………………………………………………………..1,063$ 1,281$ 218$ Non-Personnel …………………………………………………………………………………………………………… 793 1,022 229
Total Public Works - Contracts …………………………………………………………………………………. 1,856 2,303 447
Citywide Expenses Non-Personnel …………………………………………………………………………………………………………… 64,858 67,250 2,392
TOTAL GENERAL GOVERNMENT AND SUPPORT …………………………………………………………………………………232,541 244,065 11,524
PUBLIC SAFETY - POLICE
PoliceSalaries and Wages ………………………………………………………………………………………………………….215,731 215,731 - Non-Personnel …………………………………………………………………………………………………………… 223,820 223,923 103
TOTAL PUBLIC SAFETY - POLICE …………………………………………………………………………………………… 439,551 439,654 103
PUBLIC SAFETY - FIRE AND LIFE SAFETY AND HOMELAND SECURITY
Fire - RescueSalaries and Wages …………………………………………………………………………………………………………………..124,443 124,443 - Non-Personnel …………………………………………………………………………………………………………… 114,815 114,853 38
Total Fire - Rescue ………………………………………………………………………………………………………………………………239,258 239,296 38
Office of Homeland SecuritySalaries and Wages …………………………………………………………………………………………………………………..1,200 1,326 126 Non-Personnel …………………………………………………………………………………………………………… 1,273 1,365 92
Total Office of Homeland Security …………………………………………………………………………………….. 2,473 2,691 218
TOTAL PUBLIC SAFETY - FIRE AND LIFE SAFETY AND HOMELAND SECURITY ………………………………………………………………241,731 241,987 256
PARKS, RECREATION, CULTURE AND LEISURE
LibrarySalaries and Wages ………………………………………………………………………………………………………………20,279 20,518 239 Non-Personnel …………………………………………………………………………………………………………… 29,428 29,897 469
Total Library ………………………………………………………………………………………………………………… 49,707 50,415 708
Parks and Recreation Salaries and Wages ………………………………………………………………………………………………………………………36,124 37,167 1,043 Non-Personnel …………………………………………………………………………………………………………… 66,885 67,185 300
Total Parks and Recreation …………………………………………………………………………………………………….103,009 104,352 1,343
Reservoir ConcessionsNon-Personnel …………………………………………………………………………………………………………… 2,476 2,577 101
TOTAL PARKS, RECREATIONCULTURE AND LEISURE …………………………………………………………………………………………… 155,192 157,344 2,152
1 Amounts include funds associated with General Fund operations as reported in the City’s budget. Financial statements prepared on a GAAP basis include additional funds that do not meet the criteria to be classified as special revenue funds, pursuant to GASB Statement No. 54.
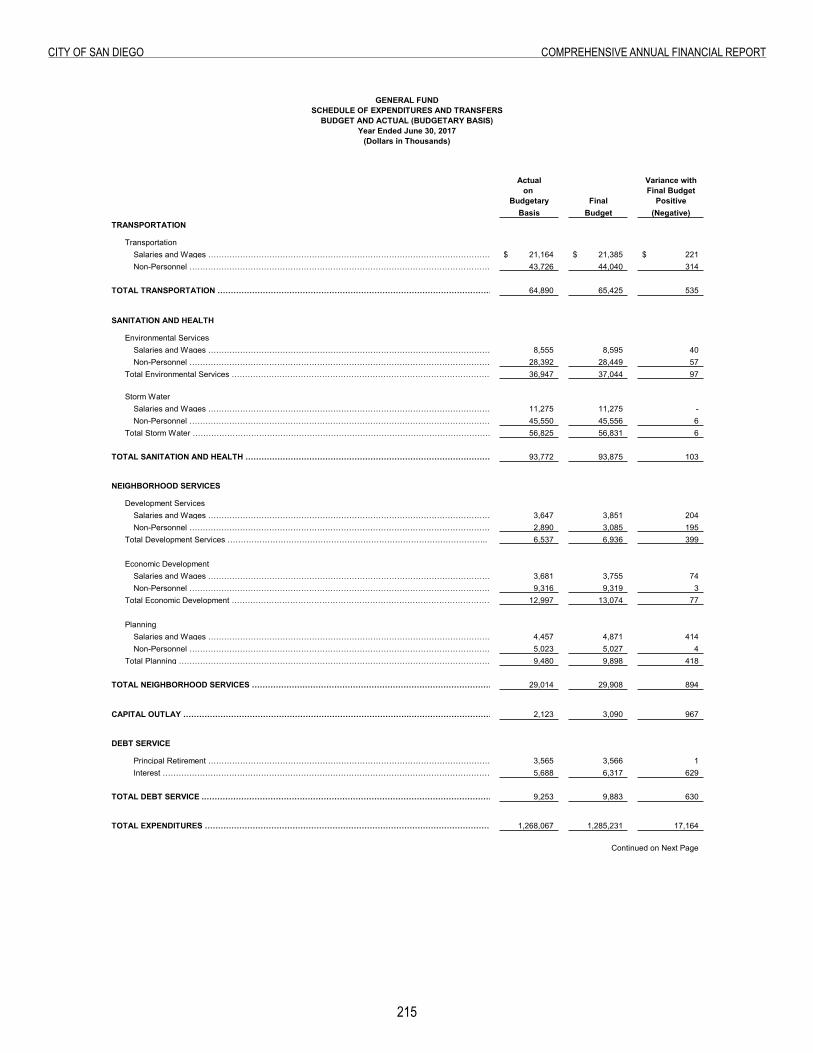
215
City of San Diego ComprehenSive annual finanCial report
GENERAL FUNDSCHEDULE OF EXPENDITURES AND TRANSFERS
BUDGET AND ACTUAL (BUDGETARY BASIS)
(Dollars in Thousands)
Actual Variance with on Final Budget Budgetary Final Positive
Basis Budget (Negative)
Year Ended June 30, 2017
TRANSPORTATION
TransportationSalaries and Wages ……………………………………………………………………………………………………………….21,164$ 21,385$ 221$ Non-Personnel …………………………………………………………………………………………………………… 43,726 44,040 314
TOTAL TRANSPORTATION ……………………………………………………………………………………………… 64,890 65,425 535
SANITATION AND HEALTH
Environmental ServicesSalaries and Wages ……………………………………………………………………………………………………………………….8,555 8,595 40 Non-Personnel …………………………………………………………………………………………………………… 28,392 28,449 57
Total Environmental Services …………………………………………………………………………………….. 36,947 37,044 97
Storm WaterSalaries and Wages …………………………………………………………………………………………………………………………..11,275 11,275 - Non-Personnel …………………………………………………………………………………………………………… 45,550 45,556 6
Total Storm Water ……………………………………………………………………………………………………………………………56,825 56,831 6
TOTAL SANITATION AND HEALTH ………………………………………………………………………………………………93,772 93,875 103
NEIGHBORHOOD SERVICES
Development ServicesSalaries and Wages ………………………………………………………………………………………………………………………..3,647 3,851 204 Non-Personnel …………………………………………………………………………………………………………… 2,890 3,085 195
Total Development Services …………………………………………………………………………………….. 6,537 6,936 399
Economic DevelopmentSalaries and Wages ………………………………………………………………………………………………………………………..3,681 3,755 74 Non-Personnel …………………………………………………………………………………………………………… 9,316 9,319 3
Total Economic Development ……………………………………………………………………………………………. 12,997 13,074 77
PlanningSalaries and Wages …………………………………………………………………………………………………………….4,457 4,871 414 Non-Personnel …………………………………………………………………………………………………………… 5,023 5,027 4
Total Planning …………………………………………………………………………………………………………………………….9,480 9,898 418
TOTAL NEIGHBORHOOD SERVICES ………………………………………………………………………………………………………………..29,014 29,908 894
CAPITAL OUTLAY ………………………………………………………………………….………………………………………………………….2,123 3,090 967
DEBT SERVICE
Principal Retirement ………………………………………………………………………………………………………………………3,565 3,566 1 Interest …………………………………………………………………………………………………………… 5,688 6,317 629
TOTAL DEBT SERVICE .………………………………………………………………………………………………………………………………….9,253 9,883 630
TOTAL EXPENDITURES …………………………………………………………………………………………………………………..1,268,067 1,285,231 17,164
Continued on Next Page
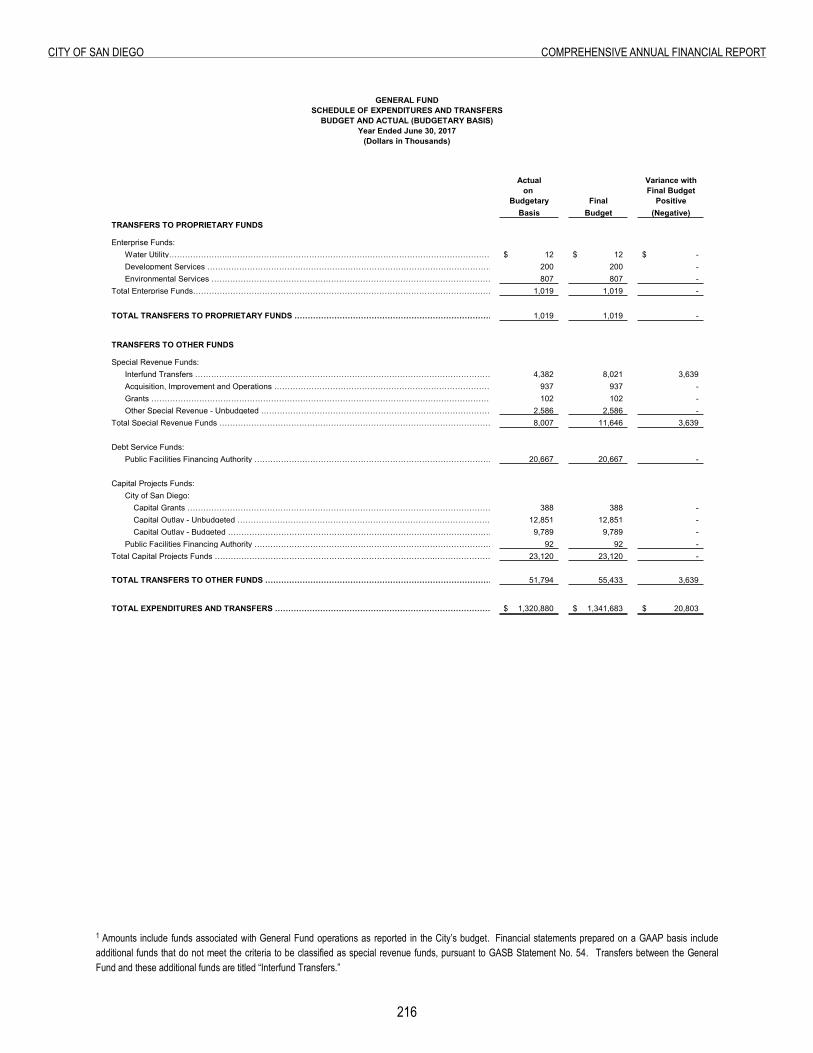
216
City of San Diego ComprehenSive annual finanCial report
GENERAL FUNDSCHEDULE OF EXPENDITURES AND TRANSFERS
BUDGET AND ACTUAL (BUDGETARY BASIS)
(Dollars in Thousands)
Actual Variance with on Final Budget Budgetary Final Positive
Basis Budget (Negative)
Year Ended June 30, 2017
TRANSFERS TO PROPRIETARY FUNDS
Enterprise Funds:Water Utility…………………..…………………………………………….……………………………………………………………………………………………………….12$ 12$ -$ Development Services …………………………………………….………………………………………………………………………………….200 200 - Environmental Services …………………………………………………………………………………………………………………………………………………………………807 807 -
Total Enterprise Funds………………………………………………………………………………………………………………………………….1,019 1,019 -
TOTAL TRANSFERS TO PROPRIETARY FUNDS ……………………………………………………………………………. 1,019 1,019 -
TRANSFERS TO OTHER FUNDS
Special Revenue Funds:Interfund Transfers ………………………………………………………………………………………………….………………………………………………………4,382 8,021 3,639 Acquisition, Improvement and Operations ……………………………………………………………………………………………..937 937 - Grants ………………………………………………………………………………………………………………………………………………..102 102 - Other Special Revenue - Unbudgeted ……………………………………………………………………………………………………..2,586 2,586 -
Total Special Revenue Funds …………………………………………………………………………………………………………………………………8,007 11,646 3,639
Debt Service Funds:Public Facilities Financing Authority ……………………………………………………………………………………………………………………………………20,667 20,667 -
Capital Projects Funds:City of San Diego:
Capital Grants ……………………………………………………………………………………………………………………………..388 388 - Capital Outlay - Unbudgeted …………………………………………………………………………………………………………………………….12,851 12,851 - Capital Outlay - Budgeted ………………………………………………………………………………………………………………………………9,789 9,789 -
Public Facilities Financing Authority ………………………………………………………………………………………………………………92 92 - Total Capital Projects Funds ………………………………………………………………………..…………………………………………………………….23,120 23,120 -
TOTAL TRANSFERS TO OTHER FUNDS ………………………………………………………………………………………………………….51,794 55,433 3,639
TOTAL EXPENDITURES AND TRANSFERS ……………………………………………………………………………………………………………1,320,880$ 1,341,683$ 20,803$
1 Amounts include funds associated with General Fund operations as reported in the City’s budget. Financial statements prepared on a GAAP basis include additional funds that do not meet the criteria to be classified as special revenue funds, pursuant to GASB Statement No. 54. Transfers between the General Fund and these additional funds are titled “Interfund Transfers.”
NONMAJOR GOVERNMENTAL FUNDS
Nonmajor Governmental
NONMAJOR GOVERNMENTAL FUNDS

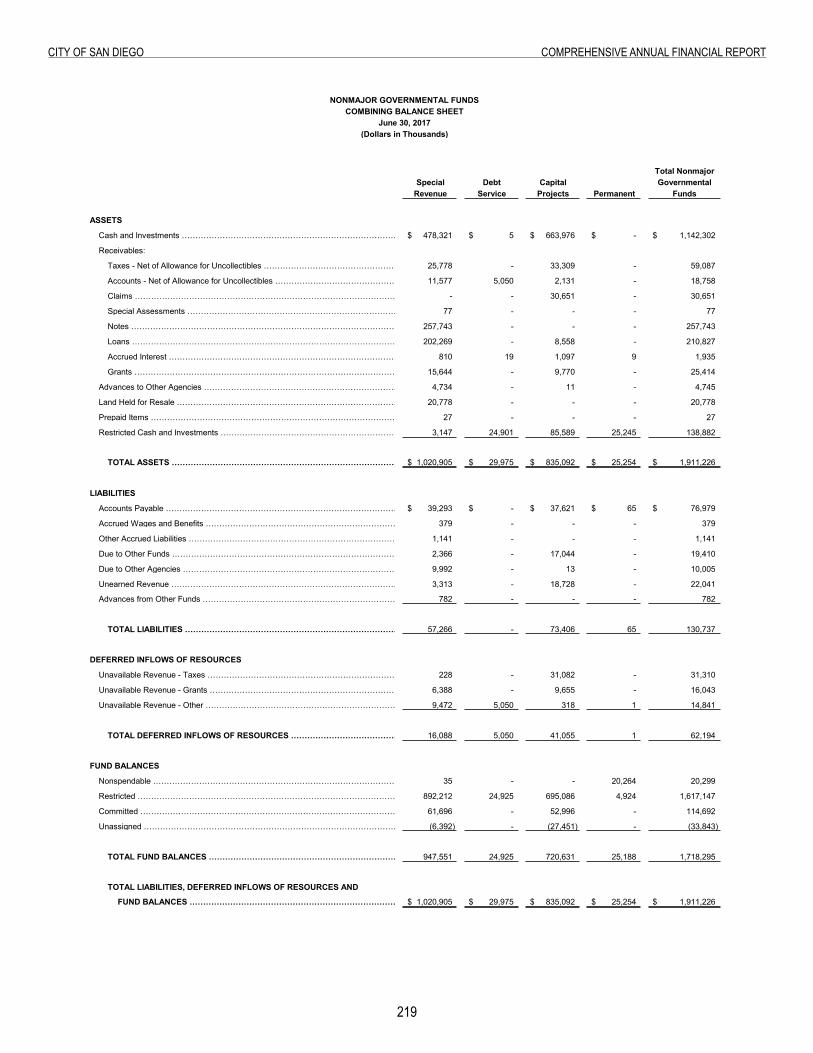
219
City of San Diego ComprehenSive annual finanCial report
Total NonmajorSpecial Debt Capital Governmental
Revenue Service Projects Permanent Funds
ASSETS
Cash and Investments …………………………………………………………………………………………………………. 478,321$ 5$ 663,976$ -$ 1,142,302$
Receivables:
Taxes - Net of Allowance for Uncollectibles ……………………………………………………………………………………………………………………………… 25,778 - 33,309 - 59,087
Accounts - Net of Allowance for Uncollectibles ……………………………………………… 11,577 5,050 2,131 - 18,758
Claims ………………………………………………………………………………………………………………………. - - 30,651 - 30,651
Special Assessments …………………………………………………………………………………………………………….. 77 - - - 77
Notes ……………………………………………………………………………………………………………………………………. 257,743 - - - 257,743
Loans ………………………………………………………………………………………………………….. 202,269 - 8,558 - 210,827
Accrued Interest …………………………………………………………………………………………………………………….. 810 19 1,097 9 1,935
Grants …………………………………………………………………………………………………………………………………………………………………. 15,644 - 9,770 - 25,414
Advances to Other Agencies …………………………………………………………………………………………………………….. 4,734 - 11 - 4,745
Land Held for Resale ………………………………………………………………………………………………………………….. 20,778 - - - 20,778
Prepaid Items ………………………………………………………………………………………………………………………………. 27 - - - 27
Restricted Cash and Investments …………………………………………………………………………………………….. 3,147 24,901 85,589 25,245 138,882
TOTAL ASSETS ……………………………………………………………………………………………………………………….. 1,020,905$ 29,975$ 835,092$ 25,254$ 1,911,226$
LIABILITIES
Accounts Payable …………………………………………………………………………………………………………………………. 39,293$ -$ 37,621$ 65$ 76,979$
Accrued Wages and Benefits ………………………………………………………………………………………………… 379 - - - 379
Other Accrued Liabilities ………………………………………………………………………………………………………. 1,141 - - - 1,141
Due to Other Funds …………………………………………………………………………………………………………….. 2,366 - 17,044 - 19,410
Due to Other Agencies …………………………………………………………………………………………………………… 9,992 - 13 - 10,005
Unearned Revenue ………………………………………………………………………………………………………………. 3,313 - 18,728 - 22,041
Advances from Other Funds ………………………………………………………………………………………………………. 782 - - - 782
TOTAL LIABILITIES …………………………………………………………………………………………………….. 57,266 - 73,406 65 130,737
DEFERRED INFLOWS OF RESOURCES
Unavailable Revenue - Taxes ……………………………………………………………………………………………… 228 - 31,082 - 31,310
Unavailable Revenue - Grants ……………………………………………………………………………………………………….. 6,388 - 9,655 - 16,043
Unavailable Revenue - Other ………………………………………………………………………………………………………………………………… 9,472 5,050 318 1 14,841
TOTAL DEFERRED INFLOWS OF RESOURCES ……………………………………………………………. 16,088 5,050 41,055 1 62,194
FUND BALANCES
Nonspendable ………………………………………………………………………………………….. 35 - - 20,264 20,299
Restricted ………………………………………………………………………………………………….. 892,212 24,925 695,086 4,924 1,617,147
Committed ……………………………………………………………………………………………… 61,696 - 52,996 - 114,692
Unassigned …………………………………………………………………………………………………….. (6,392) - (27,451) - (33,843)
TOTAL FUND BALANCES ……………………………………………………………………………………………………. 947,551 24,925 720,631 25,188 1,718,295
TOTAL LIABILITIES, DEFERRED INFLOWS OF RESOURCES AND
FUND BALANCES ………………………………………………………………………………………….. 1,020,905$ 29,975$ 835,092$ 25,254$ 1,911,226$
NONMAJOR GOVERNMENTAL FUNDSCOMBINING BALANCE SHEET
June 30, 2017(Dollars in Thousands)
Combining Balance Sheet
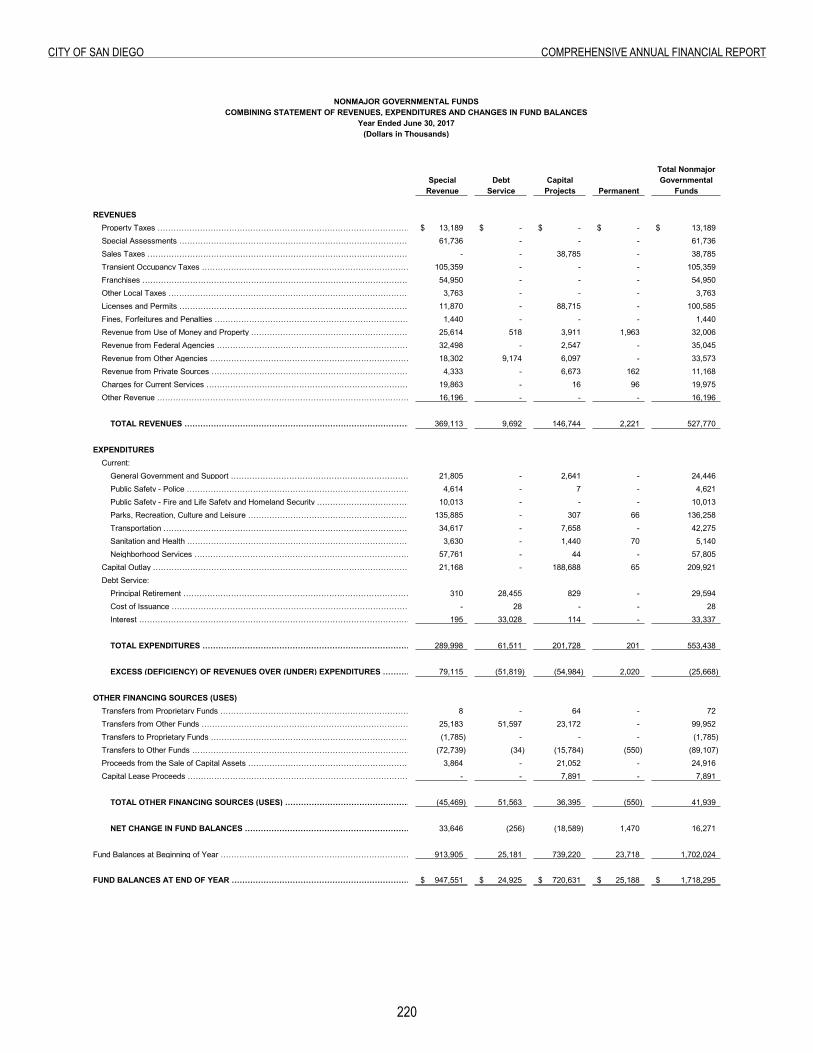
220
City of San Diego ComprehenSive annual finanCial report
Total NonmajorSpecial Debt Capital Governmental
Revenue Service Projects Permanent Funds
REVENUESProperty Taxes …………………………………………………………………………………………………………………………….. 13,189$ -$ -$ -$ 13,189$ Special Assessments ……………………………………………………………………………………………………………………. 61,736 - - - 61,736 Sales Taxes ………………………………………………………………………………………………………………………….. - - 38,785 - 38,785 Transient Occupancy Taxes …………………………………………………………………………………………………………. 105,359 - - - 105,359 Franchises ………………………………………………………………………………………………………….54,950 - - - 54,950 Other Local Taxes ……………………………………………………………………………………………………………………… 3,763 - - - 3,763 Licenses and Permits …………………………………………………………………………………………………………………. 11,870 - 88,715 - 100,585 Fines, Forfeitures and Penalties …………………………………………………………………………………………………….. 1,440 - - - 1,440 Revenue from Use of Money and Property ……………………………………………………………………………………. 25,614 518 3,911 1,963 32,006 Revenue from Federal Agencies ………………………………………………………………………………………………. 32,498 - 2,547 - 35,045 Revenue from Other Agencies …………………………………………………………………………………………………. 18,302 9,174 6,097 - 33,573 Revenue from Private Sources …………………………………………………………………………………………………… 4,333 - 6,673 162 11,168 Charges for Current Services ……………………………………………………………………………………………………… 19,863 - 16 96 19,975 Other Revenue ……………………………………………………………………………………………………………………….. 16,196 - - - 16,196
TOTAL REVENUES ……………………………………………………………………………………………………………. 369,113 9,692 146,744 2,221 527,770
EXPENDITURESCurrent:
. General Government and Support ……………………………………………………………………………………………. 21,805 - 2,641 - 24,446
. Public Safety - Police ………………………………………………………………………………………………………….. 4,614 - 7 - 4,621
. Public Safety - Fire and Life Safety and Homeland Security ………………………………………………………………………………………………….. 10,013 - - - 10,013
. Parks, Recreation, Culture and Leisure ………………………………………………………………………………… 135,885 - 307 66 136,258
. Transportation …………………………………………………………………………………………………………………. 34,617 - 7,658 - 42,275
. Sanitation and Health ……………………………………………………………………………………………………………. 3,630 - 1,440 70 5,140
. Neighborhood Services ……………………………………………………………………………………………………… 57,761 - 44 - 57,805 Capital Outlay ……………………………………………………………………………………………………………………… 21,168 - 188,688 65 209,921 Debt Service:
Principal Retirement …………………………………………………………………………………………………………… 310 28,455 829 - 29,594 Cost of Issuance ……………………………………………………………………………………………………………. - 28 - - 28 Interest …………………………………………………………………………………………………. 195 33,028 114 - 33,337
TOTAL EXPENDITURES ………………………………………………………………………………………………………. 289,998 61,511 201,728 201 553,438
EXCESS (DEFICIENCY) OF REVENUES OVER (UNDER) EXPENDITURES ………………………………………………… 79,115 (51,819) (54,984) 2,020 (25,668)
OTHER FINANCING SOURCES (USES)
Transfers from Proprietary Funds ……………………………………………………………………………………………… 8 - 64 - 72 Transfers from Other Funds ……………………………………………………………………………………………………. 25,183 51,597 23,172 - 99,952 Transfers to Proprietary Funds ……………………………………………………………………………………………………. (1,785) - - - (1,785) Transfers to Other Funds …………………………………………………………………………………………………………. (72,739) (34) (15,784) (550) (89,107) Proceeds from the Sale of Capital Assets ………………………………………………………………………………………… 3,864 - 21,052 - 24,916 Capital Lease Proceeds ………………………………………………………………………………………….. - - 7,891 - 7,891
TOTAL OTHER FINANCING SOURCES (USES) ……………………………………………………………………………. (45,469) 51,563 36,395 (550) 41,939
NET CHANGE IN FUND BALANCES …………………………………………………………………………………………. 33,646 (256) (18,589) 1,470 16,271
Fund Balances at Beginning of Year ……………………………………………………………………………………………… 913,905 25,181 739,220 23,718 1,702,024
FUND BALANCES AT END OF YEAR …………………………………………………………………………………………….. 947,551$ 24,925$ 720,631$ 25,188$ 1,718,295$
NONMAJOR GOVERNMENTAL FUNDSCOMBINING STATEMENT OF REVENUES, EXPENDITURES AND CHANGES IN FUND BALANCES
Year Ended June 30, 2017(Dollars in Thousands)
Combining Statement of Revenues, Expenditures and Changes in Fund Balances
NONMAJOR GOVERNMENTAL FUNDSSpeCial revenue
Nonmajor Governmental
NONMAJOR GOVERNMENTAL FUNDS SPECIAL REVENUE

223
City of San Diego ComprehenSive annual finanCial report
SPECIAL REVENUE FUNDS
Special revenue funds are used to account for the proceeds of specific revenue sources (other than those for debt service or major capital projects) that are restricted or committed to expenditures for specified purposes.
CITY OF SAN DIEGO
ACQUISITION, IMPROVEMENT AND OPERATIONS - BUDGETED
This fund accounts for various operating activities including business improvement areas, lighting and landscape maintenance areas, facilities financing, and the City's public art program. Revenues are derived from business tax surcharges, special assessments on property, various rents, concessions and fees.
SDCCU STADIUM OPERATIONS - BUDGETED
This fund accounts for the operations of the SDCCU Stadium. The Stadium is host to San Diego State University Aztecs football, the San Diego County Credit Union Holiday Bowl, and other special events. Revenues are derived from rents, concessions, parking, and advertising.
TRANSIENT OCCUPANCY TAX - BUDGETED
This fund was established to receive and expend transient occupancy taxes. Since 1964, a tax has been imposed on transients of hotel and motel rooms in the City of San Diego. Effective since August 1994, the tax rate is 10.5%.
UNDERGROUND SURCHARGE - BUDGETED
This fund was established to account for activities related to the undergrounding of utilities. This fund receives and disburses undergrounding surcharge revenue in accordance with the City’s franchise agreements with SDG&E.
ZOOLOGICAL EXHIBITS - BUDGETED
This fund was established to collect monies from a fixed property tax levy authorized by Section 77a of the City Charter for the maintenance of zoological exhibits. These funds are remitted in accordance with a contractual agreement with the San Diego Zoological Society, a not-for-profit corporation independent from the City.
OTHER SPECIAL REVENUE – BUDGETED
This fund was established to account for revenues derived specifically for a variety of budgeted special programs administered by City departments such as Police, Development Services, and General Services. Revenues in this fund are derived from service charges, revenues from other agencies, and fines.
GRANTS - UNBUDGETED
This fund was established to account for revenue received from federal, state and other governmental agencies. Expenditures are made and accounted for as prescribed by appropriate grant provisions/agreements.
LOW-MODERATE INCOME HOUSING - UNBUDGETED
This fund was established to account for affordable housing assets transferred from the Successor Agency to the Successor Housing Entity, which is the City, as required by California Health and Safety Code Section 34176(d), due to the dissolution of the Redevelopment Agency. This fund will also account for any future revenues generated from the housing assets.
22�
City of San Diego ComprehenSive annual finanCial report
OTHER SPECIAL REVENUE - UNBUDGETED
This fund was established to account for revenues earmarked for a variety of special programs administered by such City departments as Engineering and Capital Projects, Libraries, Park and Recreation, and Police. Revenues in this fund are derived from such sources as parking fees, service charges, contributions from other agencies and private sources, and interest earnings.
BLENDED COMPONENT UNITS
CIVIC SAN DIEGO Civic San Diego (CSD) is a not-for-profit public benefit corporation resulting from restructuring and reorganizing the former Centre City Development Corporation (CCDC) and the Southeastern Economic Development Corporation (SEDC) into a single corporation. CCDC and SEDC were originally established to administer certain redevelopment project areas throughout the City. Upon dissolution of the former San Diego Redevelopment Agency (former RDA), CSD’s main function is now focused on providing administrative and advisory services to the City as the Successor Agency. CSD also assists the City with downtown parking management administration and affordable housing development. SAN DIEGO INDUSTRIAL DEVELOPMENT AUTHORITY This fund was established to account for revenues and expenditures of the SDIDA. SDIDA was formed in 1983 pursuant to the California Industrial Development Financing Act for the purpose of providing an alternative method of financing to participating parties for economic development purposes, through the sale and issuance of revenue bonds. Revenues are derived from fees collected from companies applying for industrial development bond financing. Expenditures are incurred for management and administrative services provided by the City. TOBACCO SETTLEMENT REVENUE FUNDING CORPORATION (TSRFC) This fund was established to account for the activities of the TSRFC. TSRFC was established for the purpose of acquiring the tobacco settlement revenues allocated to the City from the State of California, pursuant to the Master Settlement Agreement. The TSRFC’s special revenue fund is used to account for the expenditures incurred for administrative services provided by the City.

this page intentionally left Blank
225
Page Intentionally Left Blank
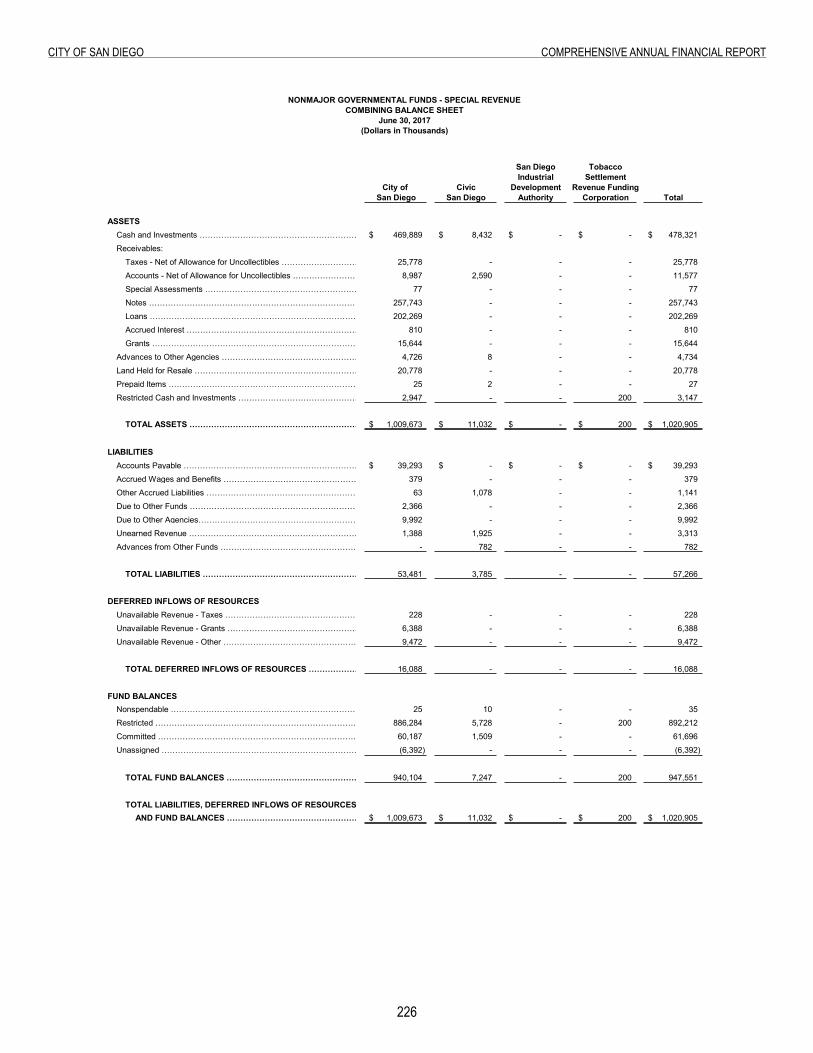
226
City of San Diego ComprehenSive annual finanCial report
Combining Balance Sheet
San Diego TobaccoIndustrial Settlement
City of Civic Development Revenue FundingSan Diego San Diego Authority Corporation Total
ASSETSCash and Investments ……………………………………………………………………………………………………………….. 469,889$ 8,432$ -$ -$ 478,321$
Receivables: .
Taxes - Net of Allowance for Uncollectibles ……………………………………………………………………………………………………………………………….. 25,778 - - - 25,778
Accounts - Net of Allowance for Uncollectibles …………………………………………….. 8,987 2,590 - - 11,577
Special Assessments ……………………………………………………………………………………………………………. 77 - - - 77
Notes ……………………………………………………………………………………………………………………………………….. 257,743 - - - 257,743
Loans …………………………………………………………………………………………………………………………………………….. 202,269 - - - 202,269
Accrued Interest …………………………………………………………………………………………………………………….. 810 - - - 810
Grants …………………………………………………………………………………………………………………………………………. 15,644 - - - 15,644
Advances to Other Agencies ………………………………………………………………………………………………………. 4,726 8 - - 4,734
Land Held for Resale ……………………………………………………………………………………………………………... 20,778 - - - 20,778
Prepaid Items …………………………………………………………………………………………………………………………. 25 2 - - 27
Restricted Cash and Investments …………………………………………………………………………………………………….. 2,947 - - 200 3,147
.TOTAL ASSETS ……………………………………………………………………………………………………………….. 1,009,673$ 11,032$ -$ 200$ 1,020,905$
.
LIABILITIES .
Accounts Payable ……………………………………………………………………………………………………………………………... 39,293$ -$ -$ -$ 39,293$
Accrued Wages and Benefits ………………………………………………………………………………………………….. 379 - - - 379
Other Accrued Liabilities ………………………………………………………………………………………………………... 63 1,078 - - 1,141
Due to Other Funds …………………………………………………………………………………………………………………. 2,366 - - - 2,366
Due to Other Agencies………………………………………………………………………………………………………………. 9,992 - - - 9,992
Unearned Revenue ………………………………………………………………………………………………………………………. 1,388 1,925 - - 3,313
Advances from Other Funds ………………………………………………………………………………………………………... - 782 - - 782
.
TOTAL LIABILITIES ………………………………………………………………………………………………………... 53,481 3,785 - - 57,266
DEFERRED INFLOWS OF RESOURCESUnavailable Revenue - Taxes ……………………………………………………………………………………………………... 228 - - - 228
Unavailable Revenue - Grants ………………………………………………………………………………………………….. 6,388 - - - 6,388
Unavailable Revenue - Other ………………………………………………………………………………………………………….. 9,472 - - - 9,472
TOTAL DEFERRED INFLOWS OF RESOURCES ……………………………………………………………………………….. 16,088 - - - 16,088
FUND BALANCES .Nonspendable ……………………………………………………………………………………………………………………………………………….. 25 10 - - 35
Restricted …………………………………………………………………………………………………………………………………………... 886,284 5,728 - 200 892,212
Committed ………………………………………………………………………………………………………………………………………………... 60,187 1,509 - - 61,696
Unassigned ……………………………………………………………………………………………………………………………………... (6,392) - - - (6,392)
TOTAL FUND BALANCES …………………………………………………………………………………………………………………………………… 940,104 7,247 - 200 947,551
TOTAL LIABILITIES, DEFERRED INFLOWS OF RESOURCESAND FUND BALANCES ……………………………………………………………………………………………………… 1,009,673$ 11,032$ -$ 200$ 1,020,905$
NONMAJOR GOVERNMENTAL FUNDS - SPECIAL REVENUECOMBINING BALANCE SHEET
June 30, 2017(Dollars in Thousands)
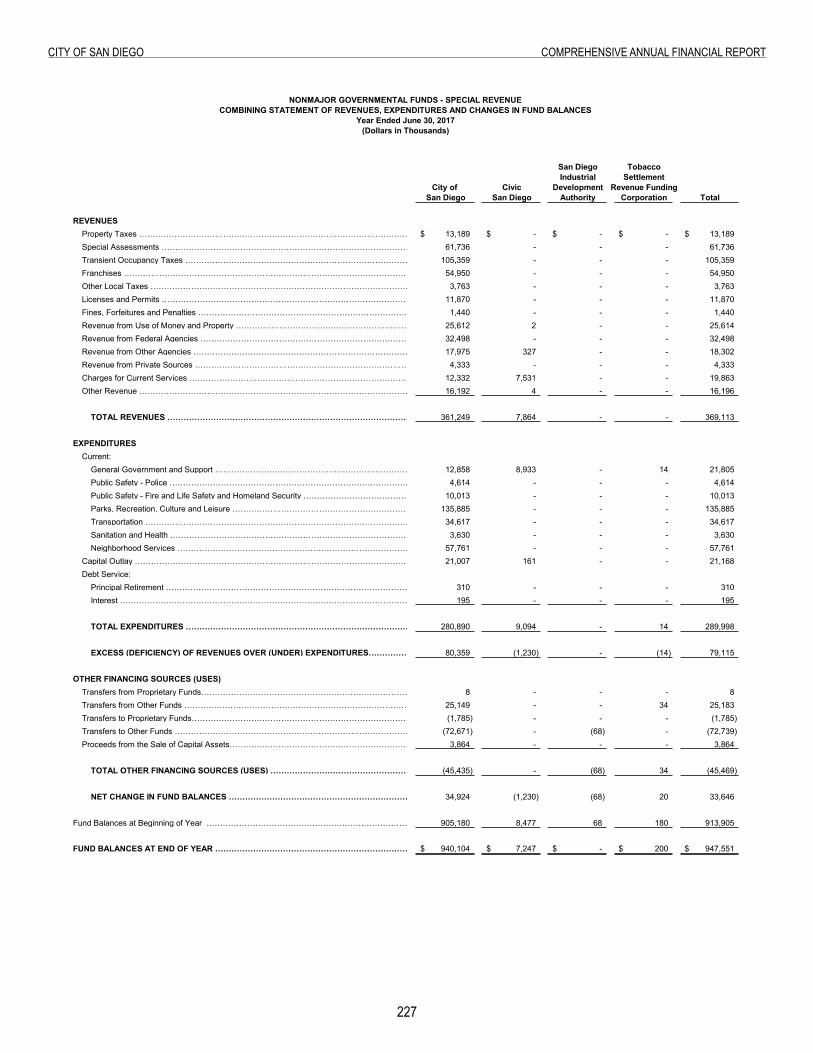
227
City of San Diego ComprehenSive annual finanCial report
Combining Statement of Revenues, Expenditures and Changes in Fund Balances
San Diego TobaccoIndustrial Settlement
City of Civic Development Revenue FundingSan Diego San Diego Authority Corporation Total
REVENUESProperty Taxes ………………………………………………………………………………………………………………………………………………………………………….. 13,189$ -$ -$ -$ 13,189$ Special Assessments …………………………………………………………………………………………………………………………………………….. 61,736 - - - 61,736 Transient Occupancy Taxes …………………………………………………………………………………………………………………………………………….. 105,359 - - - 105,359 Franchises ……………………………………………………………………………………………………………………………………………………………………………... 54,950 - - - 54,950 Other Local Taxes …………………………………………………………………………………………………………………………………………………………. 3,763 - - - 3,763 Licenses and Permits …………………………………………………………………………………………………………………………………………….. 11,870 - - - 11,870 Fines, Forfeitures and Penalties …………………………………………………………………………………………………………………………………………….. 1,440 - - - 1,440 Revenue from Use of Money and Property …………………………………………………………………………………………………………………………………………….. 25,612 2 - - 25,614 Revenue from Federal Agencies …………………………………………………………………………………………………………………………………………….. 32,498 - - - 32,498 Revenue from Other Agencies …………………………………………………………………………………………………………………………………………….. 17,975 327 - - 18,302 Revenue from Private Sources …………………………………………………………………………………………………………………………………………….. 4,333 - - - 4,333 Charges for Current Services …………………………………………………………………………………………………………………………………………….. 12,332 7,531 - - 19,863 Other Revenue …………………………………………………………………………………………………………………………………………………………………….. 16,192 4 - - 16,196
.TOTAL REVENUES …………………………………………………………………………………………………………………………………………….. 361,249 7,864 - - 369,113
.EXPENDITURES .
Current: .. General Government and Support …………………………………………………………………………………………………………………………………………….. 12,858 8,933 - 14 21,805 . Public Safety - Police …………………………………………………………………………………………………………………………………………….. 4,614 - - - 4,614 . Public Safety - Fire and Life Safety and Homeland Security …………………………………………………………………………………………………………………………………………….. 10,013 - - - 10,013 . Parks, Recreation, Culture and Leisure …………………………………………………………………………………………………………………………………………….. 135,885 - - - 135,885 . Transportation ………………………………………………………………………………………………………………………………………………………………….. 34,617 - - - 34,617 . Sanitation and Health …………………………………………………………………………………………………………………………………………….. 3,630 - - - 3,630 . Neighborhood Services …………………………………………………………………………………………………………………………………………….. 57,761 - - - 57,761
Capital Outlay …………………………………………………………………………………………………………………………………………………………………………... 21,007 161 - - 21,168 Debt Service: .
Principal Retirement …………………………………………………………………………………………………………………………………………….. 310 - - - 310 Interest ………………………………………………………………………………………………………………………………………………………………………………….. 195 - - - 195
.TOTAL EXPENDITURES …………………………………………………………………………………………………………………………………………….. 280,890 9,094 - 14 289,998
.EXCESS (DEFICIENCY) OF REVENUES OVER (UNDER) EXPENDITURES…………………………………………………………………………………………………………………………………………….. 80,359 (1,230) - (14) 79,115
.OTHER FINANCING SOURCES (USES) .
Transfers from Proprietary Funds…………………………………………………………………………………………………………………………………………….. 8 - - - 8 Transfers from Other Funds …………………………………………………………………………………………………………………………………………….. 25,149 - - 34 25,183 Transfers to Proprietary Funds…………………………………………………………………………………………………………………………………………….. (1,785) - - - (1,785) Transfers to Other Funds …………………………………………………………………………………………………………………………………………….. (72,671) - (68) - (72,739) Proceeds from the Sale of Capital Assets…………………………………………………………………………………………………………………………………………….. 3,864 - - - 3,864
.TOTAL OTHER FINANCING SOURCES (USES) …………………………………………………………………………………………………………………………………………….. (45,435) - (68) 34 (45,469)
NET CHANGE IN FUND BALANCES …………………………………………………………………………………………………………………………………………….. 34,924 (1,230) (68) 20 33,646 .
Fund Balances at Beginning of Year …………………………………………………………………………………………………………………………………………….. 905,180 8,477 68 180 913,905 .
FUND BALANCES AT END OF YEAR …………………………………………………………………………………………………………………………………………….. 940,104$ 7,247$ -$ 200$ 947,551$
NONMAJOR GOVERNMENTAL FUNDS - SPECIAL REVENUECOMBINING STATEMENT OF REVENUES, EXPENDITURES AND CHANGES IN FUND BALANCES
Year Ended June 30, 2017(Dollars in Thousands)
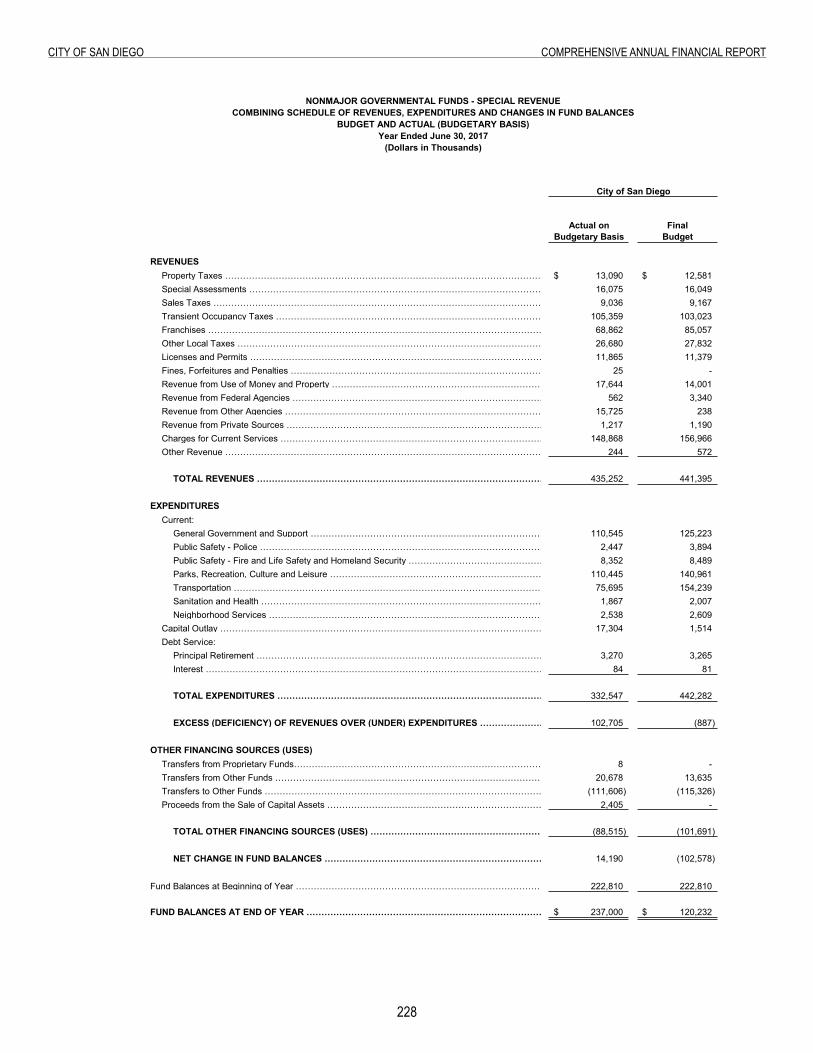
228
City of San Diego ComprehenSive annual finanCial report
Combining Schedule of Revenues, Expenditures and Changes in Fund Balances - Budget and Actual
Actual on FinalBudgetary Basis Budget
REVENUESProperty Taxes …………………………………………………………………………………………………………………………………………………………... 13,090$ 12,581$ Special Assessments …………………………………………………………………………………………………………………………………………………………... 16,075 16,049 Sales Taxes …………………………………………………………………………………………………………………………………………………………... 9,036 9,167 Transient Occupancy Taxes …………………………………………………………………………………………………………………………………………………………... 105,359 103,023 Franchises …………………………………………………………………………………………………………………………………………………………………. 68,862 85,057 Other Local Taxes …………………………………………………………………………………………………………………………………………………………... 26,680 27,832 Licenses and Permits …………………………………………………………………………………………………………………………………………………………... 11,865 11,379 Fines, Forfeitures and Penalties …………………………………………………………………………………………………………………………………………………………... 25 - Revenue from Use of Money and Property …………………………………………………………………………………………………………………………………………………………... 17,644 14,001 Revenue from Federal Agencies …………………………………………………………………………………………………………………………………………………………... 562 3,340 Revenue from Other Agencies …………………………………………………………………………………………………………………………………………………………... 15,725 238 Revenue from Private Sources …………………………………………………………………………………………………………………………………………………………... 1,217 1,190 Charges for Current Services …………………………………………………………………………………………………………………………………………………………... 148,868 156,966 Other Revenue …………………………………………………………………………………………………………………………………………………………... 244 572
.TOTAL REVENUES …………………………………………………………………………………………………………………………………………………………... 435,252 441,395
.EXPENDITURES .
Current: .. General Government and Support …………………………………………………………………………………………………………………………………………………………... 110,545 125,223 . Public Safety - Police …………………………………………………………………………………………………………………………………………………………... 2,447 3,894 . Public Safety - Fire and Life Safety and Homeland Security …………………………………………………………………………………………………………………………………………………………... 8,352 8,489 . Parks, Recreation, Culture and Leisure …………………………………………………………………………………………………………………………………………………………... 110,445 140,961 . Transportation …………………………………………………………………………………………………………………………………………………………... 75,695 154,239 . Sanitation and Health …………………………………………………………………………………………………………………………………………………………... 1,867 2,007 . Neighborhood Services …………………………………………………………………………………………………………………………………………………………... 2,538 2,609
Capital Outlay …………………………………………………………………………………………………………………………………………………………... 17,304 1,514 Debt Service: .
Principal Retirement …………………………………………………………………………………………………………………………………………………………... 3,270 3,265 Interest …………………………………………………………………………………………………………………………………………………………... 84 81
.TOTAL EXPENDITURES …………………………………………………………………………………………………………………………………………………………... 332,547 442,282
.EXCESS (DEFICIENCY) OF REVENUES OVER (UNDER) EXPENDITURES …………………………………………………………………………………………………………………………………………………………... 102,705 (887)
.OTHER FINANCING SOURCES (USES) .
Transfers from Proprietary Funds…………………………………………………………………………………………………………………………………………………………... 8 - Transfers from Other Funds …………………………………………………………………………………………………………………………………………………………... 20,678 13,635 Transfers to Other Funds …………………………………………………………………………………………………………………………………………………………... (111,606) (115,326) Proceeds from the Sale of Capital Assets …………………………………………………………………………………………………………………………………………………………... 2,405 -
.TOTAL OTHER FINANCING SOURCES (USES) …………………………………………………………………………………………………………………………………………………………... (88,515) (101,691)
.NET CHANGE IN FUND BALANCES …………………………………………………………………………………………………………………………………………………………... 14,190 (102,578)
.Fund Balances at Beginning of Year ……………………………………………………………………………………………………………………………………. 222,810 222,810
.FUND BALANCES AT END OF YEAR …………………………………………………………………………. 237,000$ 120,232$
City of San Diego
NONMAJOR GOVERNMENTAL FUNDS - SPECIAL REVENUECOMBINING SCHEDULE OF REVENUES, EXPENDITURES AND CHANGES IN FUND BALANCES
BUDGET AND ACTUAL (BUDGETARY BASIS)Year Ended June 30, 2017
(Dollars in Thousands)
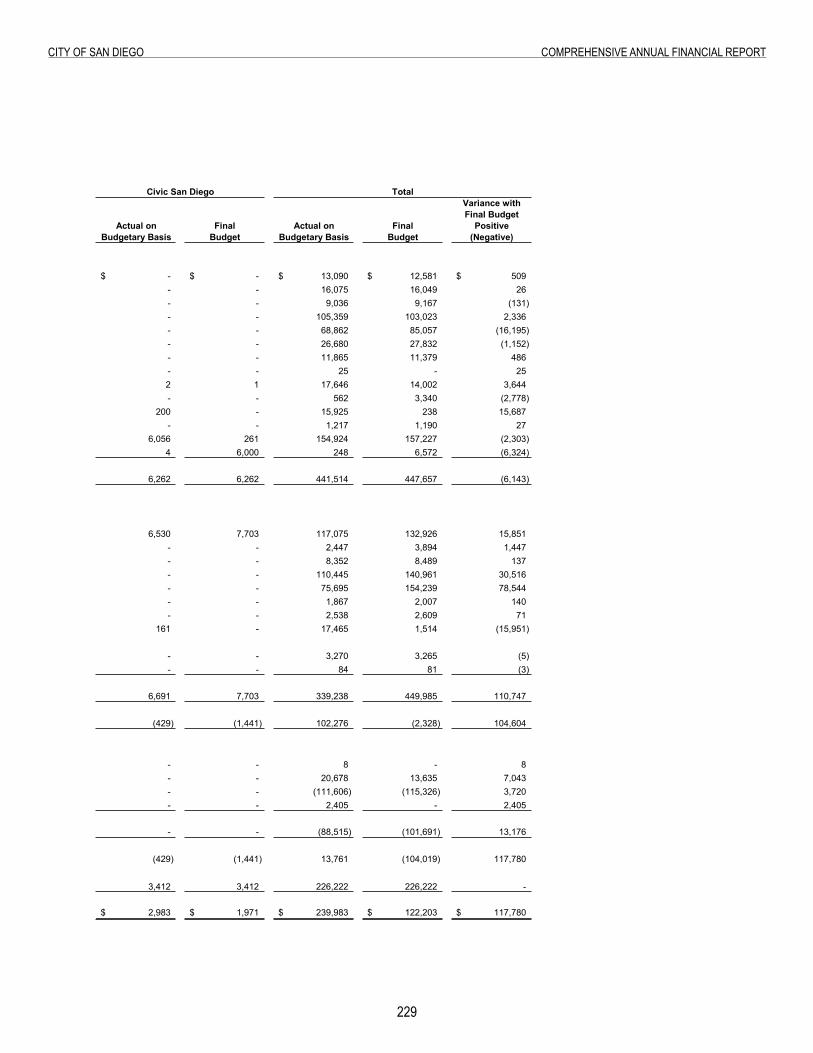
229
City of San Diego ComprehenSive annual finanCial report
Variance withFinal Budget
Actual on Final Actual on Final PositiveBudgetary Basis Budget Budgetary Basis Budget (Negative)
-$ -$ 13,090$ 12,581$ 509$ - - 16,075 16,049 26 - - 9,036 9,167 (131) - - 105,359 103,023 2,336 - - 68,862 85,057 (16,195) - - 26,680 27,832 (1,152) - - 11,865 11,379 486 - - 25 - 25 2 1 17,646 14,002 3,644 - - 562 3,340 (2,778)
200 - 15,925 238 15,687 - - 1,217 1,190 27
6,056 261 154,924 157,227 (2,303) 4 6,000 248 6,572 (6,324)
6,262 6,262 441,514 447,657 (6,143)
6,530 7,703 117,075 132,926 15,851 - - 2,447 3,894 1,447 - - 8,352 8,489 137 - - 110,445 140,961 30,516 - - 75,695 154,239 78,544 - - 1,867 2,007 140 - - 2,538 2,609 71
161 - 17,465 1,514 (15,951)
- - 3,270 3,265 (5) - - 84 81 (3)
6,691 7,703 339,238 449,985 110,747
(429) (1,441) 102,276 (2,328) 104,604
- - 8 - 8 - - 20,678 13,635 7,043 - - (111,606) (115,326) 3,720 - - 2,405 - 2,405
- - (88,515) (101,691) 13,176
(429) (1,441) 13,761 (104,019) 117,780
3,412 3,412 226,222 226,222 -
2,983$ 1,971$ 239,983$ 122,203$ 117,780$
TotalCivic San Diego
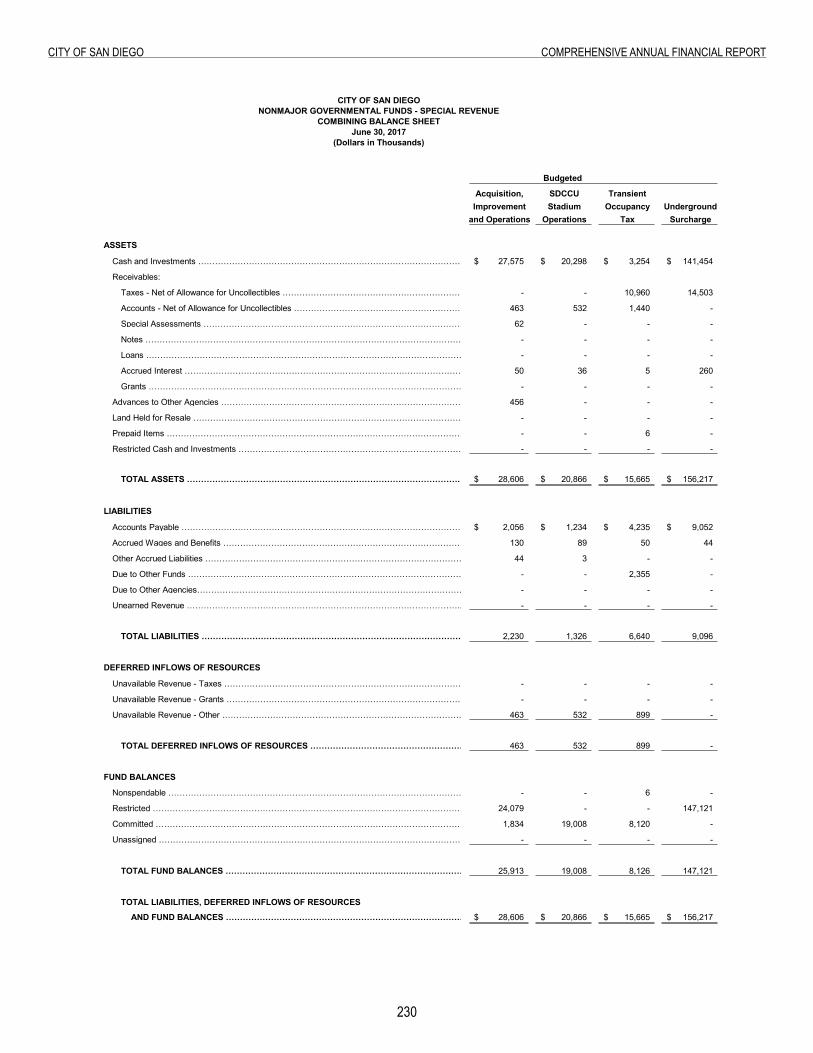
230
City of San Diego ComprehenSive annual finanCial report
City of San Diego Combining Balance Sheet
Acquisition, SDCCU TransientImprovement Stadium Occupancy Underground
and Operations Operations Tax Surcharge
ASSETS
Cash and Investments ………………………………………………………………………………………………………... 27,575$ 20,298$ 3,254$ 141,454$
Receivables: .
Taxes - Net of Allowance for Uncollectibles ……………………………………………………………………………………………. - - 10,960 14,503
Accounts - Net of Allowance for Uncollectibles ……………………………………………………………………… 463 532 1,440 -
Special Assessments ……………………………………………………………………………………………………... 62 - - -
Notes ……………………………………………………………………………………………………………………….. - - - -
Loans …………………………………………………………………………………………………………………. - - - -
Accrued Interest …………………………………………………………………………………………………………………………………………………………... 50 36 5 260
Grants ………………………………………………………………………………………………………………... - - - -
Advances to Other Agencies …………………………………………………………………………………………….. 456 - - -
Land Held for Resale ………………………………………………………………………………………….. - - - -
Prepaid Items …………………………………………………………………………………………………………. - - 6 -
Restricted Cash and Investments …………………………………………………………………………………… - - - -
TOTAL ASSETS ……………………………………………………………………………………. 28,606$ 20,866$ 15,665$ 156,217$
LIABILITIES
Accounts Payable ……………………………………………………………………………………………… 2,056$ 1,234$ 4,235$ 9,052$
Accrued Wages and Benefits ………………………………………………………………………………… 130 89 50 44
Other Accrued Liabilities ……………………………………………………………………………………… 44 3 - -
Due to Other Funds ………………………………………………………………………………………. - - 2,355 -
Due to Other Agencies…………………………………………………………………………………….. - - - -
Unearned Revenue …………………………………………………………………………………….. - - - -
TOTAL LIABILITIES ………………………………………………………………………………………………………….. 2,230 1,326 6,640 9,096
DEFERRED INFLOWS OF RESOURCES
Unavailable Revenue - Taxes …………………………………………………………………………………………………………………………… - - - -
Unavailable Revenue - Grants …………………………………………………………………………. - - - -
Unavailable Revenue - Other ………………………………………………………………………….. 463 532 899 -
TOTAL DEFERRED INFLOWS OF RESOURCES …………………………………………………. 463 532 899 -
FUND BALANCES
Nonspendable …………………………………………………………………………………………………………… - - 6 -
Restricted ……………………………………………………………………………………………………….. 24,079 - - 147,121
Committed ……………………………………………………………………………………………………………. 1,834 19,008 8,120 -
Unassigned ……………………………………………………………………………………………………………………. - - - -
TOTAL FUND BALANCES ……………………………………………………………………………………………. 25,913 19,008 8,126 147,121
TOTAL LIABILITIES, DEFERRED INFLOWS OF RESOURCES
AND FUND BALANCES ……………………………………………………………………………………………………… 28,606$ 20,866$ 15,665$ 156,217$
CITY OF SAN DIEGONONMAJOR GOVERNMENTAL FUNDS - SPECIAL REVENUE
COMBINING BALANCE SHEETJune 30, 2017
(Dollars in Thousands)
Budgeted
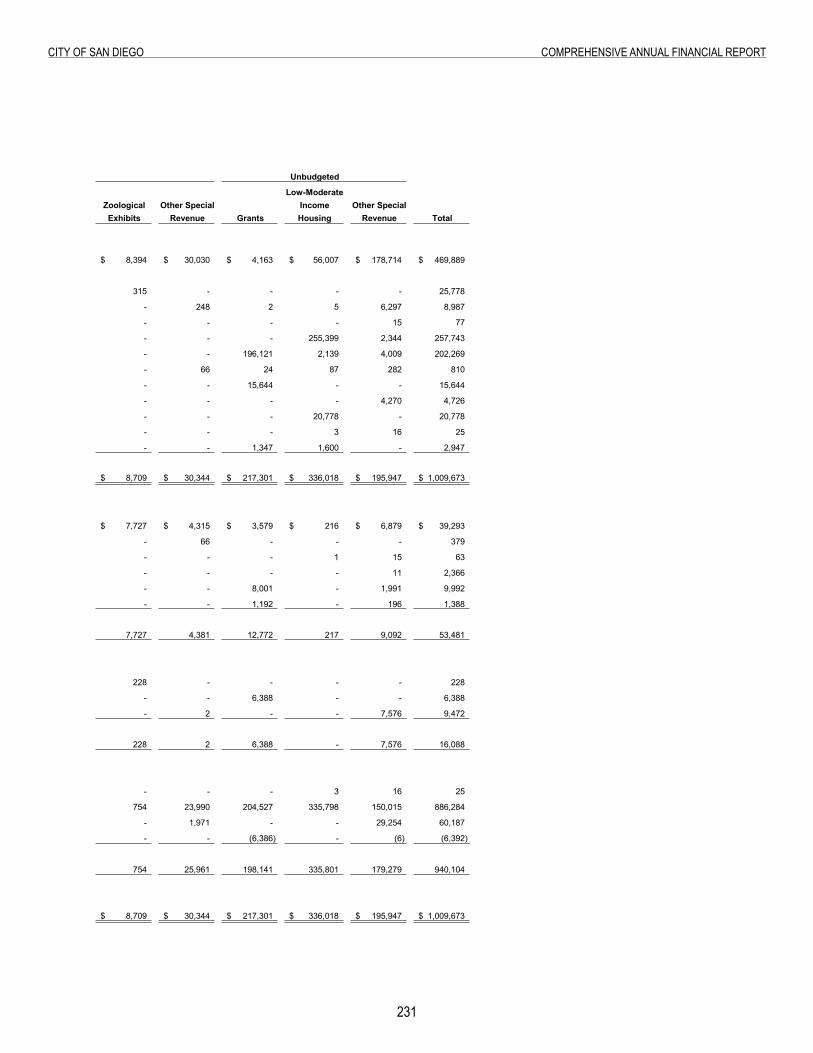
231
City of San Diego ComprehenSive annual finanCial report
Low-ModerateZoological Other Special Income Other SpecialExhibits Revenue Grants Housing Revenue Total
8,394$ 30,030$ 4,163$ 56,007$ 178,714$ 469,889$
315 - - - - 25,778
- 248 2 5 6,297 8,987
- - - - 15 77
- - - 255,399 2,344 257,743
- - 196,121 2,139 4,009 202,269
- 66 24 87 282 810
- - 15,644 - - 15,644
- - - - 4,270 4,726
- - - 20,778 - 20,778
- - - 3 16 25
- - 1,347 1,600 - 2,947
8,709$ 30,344$ 217,301$ 336,018$ 195,947$ 1,009,673$
7,727$ 4,315$ 3,579$ 216$ 6,879$ 39,293$
- 66 - - - 379
- - - 1 15 63
- - - - 11 2,366
- - 8,001 - 1,991 9,992
- - 1,192 - 196 1,388
7,727 4,381 12,772 217 9,092 53,481
228 - - - - 228
- - 6,388 - - 6,388
- 2 - - 7,576 9,472
228 2 6,388 - 7,576 16,088
- - - 3 16 25
754 23,990 204,527 335,798 150,015 886,284
- 1,971 - - 29,254 60,187
- - (6,386) - (6) (6,392)
754 25,961 198,141 335,801 179,279 940,104
8,709$ 30,344$ 217,301$ 336,018$ 195,947$ 1,009,673$
Unbudgeted
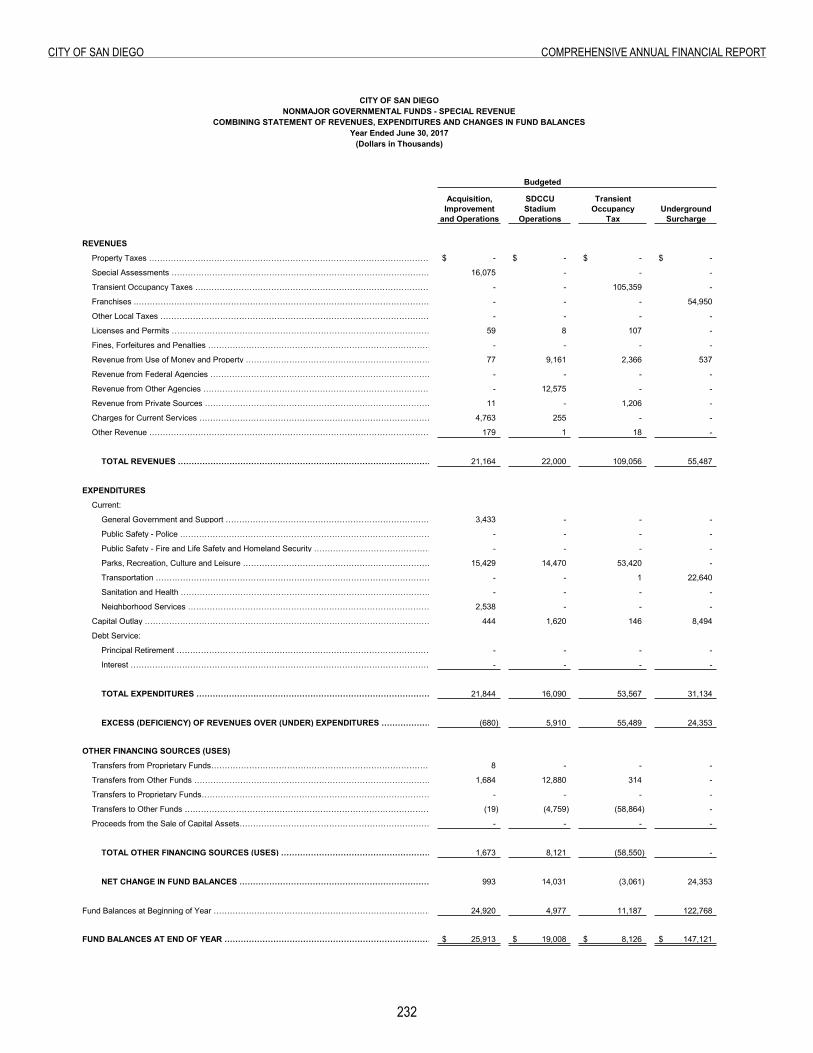
232
City of San Diego ComprehenSive annual finanCial report
City of San Diego Combining Statement of Revenues, Expenditures and Changes in Fund Balances
CITY OF SAN DIEGONONMAJOR GOVERNMENTAL FUNDS - SPECIAL REVENUE
COMBINING STATEMENT OF REVENUES, EXPENDITURES AND CHANGES IN FUND BALANCESYear Ended June 30, 2017
(Dollars in Thousands)
Acquisition, SDCCU TransientImprovement Stadium Occupancy Underground
and Operations Operations Tax Surcharge
REVENUES
Property Taxes ……………………………………………………………………………………………………………………………………………………………….. -$ -$ -$ -$
Special Assessments …………………………………………………………………………………………………………………………………………….. 16,075 - - -
Transient Occupancy Taxes …………………………………………………………………………………………………………………………………………….. - - 105,359 -
Franchises .……………………………………………………………………………………………………………………………………………………………………- - - 54,950
Other Local Taxes ……………………………………………………………………………………………………………………………………………………... - - - -
Licenses and Permits …………………………………………………………………………………………………………………………………………….. 59 8 107 -
Fines, Forfeitures and Penalties …………………………………………………………………………………………………………………………………………….. - - - -
Revenue from Use of Money and Property …………………………………………………………………………………………………………………………………………….. 77 9,161 2,366 537
Revenue from Federal Agencies …………………………………………………………………………………………………………………………………………….. - - - -
Revenue from Other Agencies …………………………………………………………………………………………………………………………………………….. - 12,575 - -
Revenue from Private Sources …………………………………………………………………………………………………………………………………………….. 11 - 1,206 -
Charges for Current Services …………………………………………………………………………………………………………………………………………….. 4,763 255 - -
Other Revenue ……………………………………………………………………………………………………………………………………………………………….. 179 1 18 -
.
TOTAL REVENUES …………………………………………………………………………………………………………………………………………….. 21,164 22,000 109,056 55,487
.
EXPENDITURES .
Current: .
. General Government and Support …………………………………………………………………………………………………………………………………………….. 3,433 - - -
. Public Safety - Police …………………………………………………………………………………………………………………………………………….. - - - -
. Public Safety - Fire and Life Safety and Homeland Security …………………………………………………………………………………………………………………………………………….. - - - -
. Parks, Recreation, Culture and Leisure …………………………………………………………………………………………………………………………………………….. 15,429 14,470 53,420 -
. Transportation …………………………………………………………………………………………………………………………………………………………. - - 1 22,640
. Sanitation and Health …………………………………………………………………………………………………………………………………………….. - - - -
. Neighborhood Services …………………………………………………………………………………………………………………………………………….. 2,538 - - -
Capital Outlay ………………………………………………………………………………………………………………………………………………………………... 444 1,620 146 8,494
Debt Service: .
Principal Retirement …………………………………………………………………………………………………………………………………………….. - - - -
Interest …………………………………………………………………………………………………………………………………………………………………………. - - - -
.
TOTAL EXPENDITURES …………………………………………………………………………………………………………………………………………….. 21,844 16,090 53,567 31,134
.
EXCESS (DEFICIENCY) OF REVENUES OVER (UNDER) EXPENDITURES …………………………………………………………………………………………………………………………………………….. (680) 5,910 55,489 24,353
.
OTHER FINANCING SOURCES (USES) .
Transfers from Proprietary Funds…………………………………………………………………………………………………………………………………………….. 8 - - -
Transfers from Other Funds …………………………………………………………………………………………………………………………………………….. 1,684 12,880 314 -
Transfers to Proprietary Funds…………………………………………………………………………………………………………………………………………….. - - - -
Transfers to Other Funds …………………………………………………………………………………………………………………………………………….. (19) (4,759) (58,864) -
Proceeds from the Sale of Capital Assets…………………………………………………………………………………………………………………………………………….. - - - -
.
TOTAL OTHER FINANCING SOURCES (USES) …………………………………………………………………………………………………………………………………………….. 1,673 8,121 (58,550) -
.
NET CHANGE IN FUND BALANCES …………………………………………………………………………………………………………………………………………….. 993 14,031 (3,061) 24,353
.
Fund Balances at Beginning of Year …………………………………………………………………………………………………………………………………………….. 24,920 4,977 11,187 122,768
.
FUND BALANCES AT END OF YEAR …………………………………………………………………………………………………………………………………………….. 25,913$ 19,008$ 8,126$ 147,121$
Budgeted
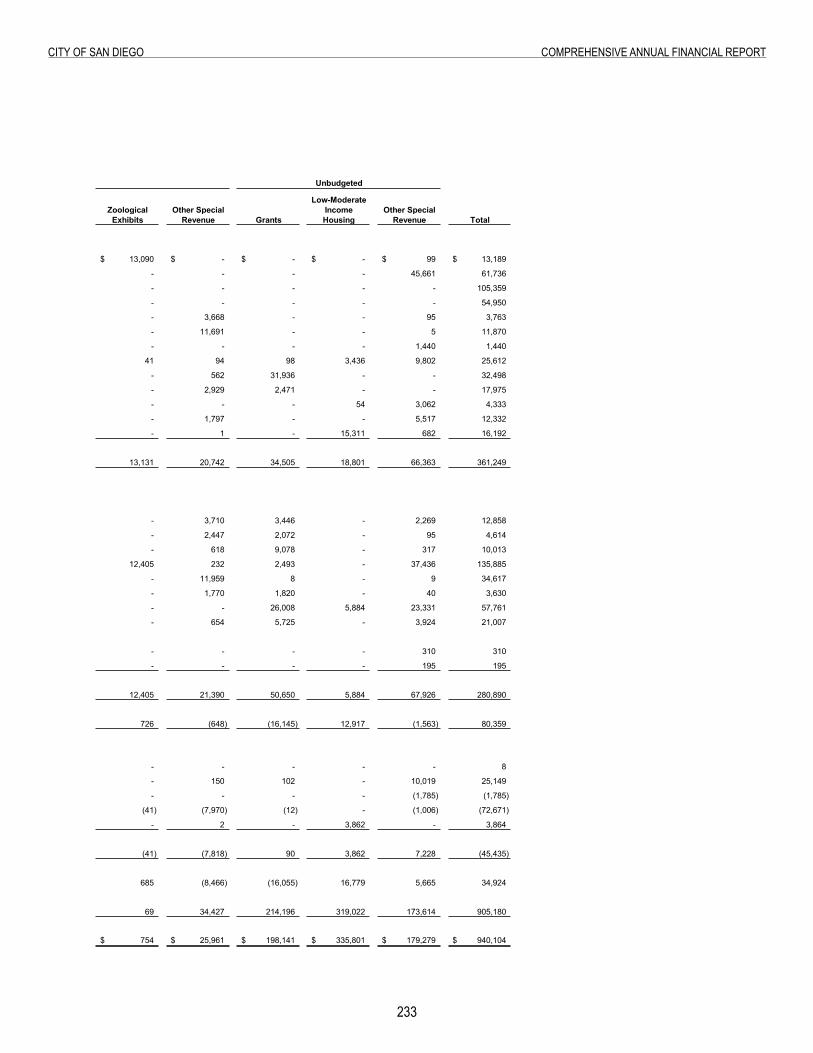
233
City of San Diego ComprehenSive annual finanCial report
Low-ModerateZoological Other Special Income Other Special
Exhibits Revenue Grants Housing Revenue Total
13,090$ -$ -$ -$ 99$ 13,189$
- - - - 45,661 61,736
- - - - - 105,359
- - - - - 54,950
- 3,668 - - 95 3,763
- 11,691 - - 5 11,870
- - - - 1,440 1,440
41 94 98 3,436 9,802 25,612
- 562 31,936 - - 32,498
- 2,929 2,471 - - 17,975
- - - 54 3,062 4,333
- 1,797 - - 5,517 12,332
- 1 - 15,311 682 16,192
13,131 20,742 34,505 18,801 66,363 361,249
- 3,710 3,446 - 2,269 12,858
- 2,447 2,072 - 95 4,614
- 618 9,078 - 317 10,013
12,405 232 2,493 - 37,436 135,885
- 11,959 8 - 9 34,617
- 1,770 1,820 - 40 3,630
- - 26,008 5,884 23,331 57,761
- 654 5,725 - 3,924 21,007
- - - - 310 310
- - - - 195 195
12,405 21,390 50,650 5,884 67,926 280,890
726 (648) (16,145) 12,917 (1,563) 80,359
- - - - - 8
- 150 102 - 10,019 25,149
- - - - (1,785) (1,785)
(41) (7,970) (12) - (1,006) (72,671)
- 2 - 3,862 - 3,864
(41) (7,818) 90 3,862 7,228 (45,435)
685 (8,466) (16,055) 16,779 5,665 34,924
69 34,427 214,196 319,022 173,614 905,180
754$ 25,961$ 198,141$ 335,801$ 179,279$ 940,104$
Unbudgeted
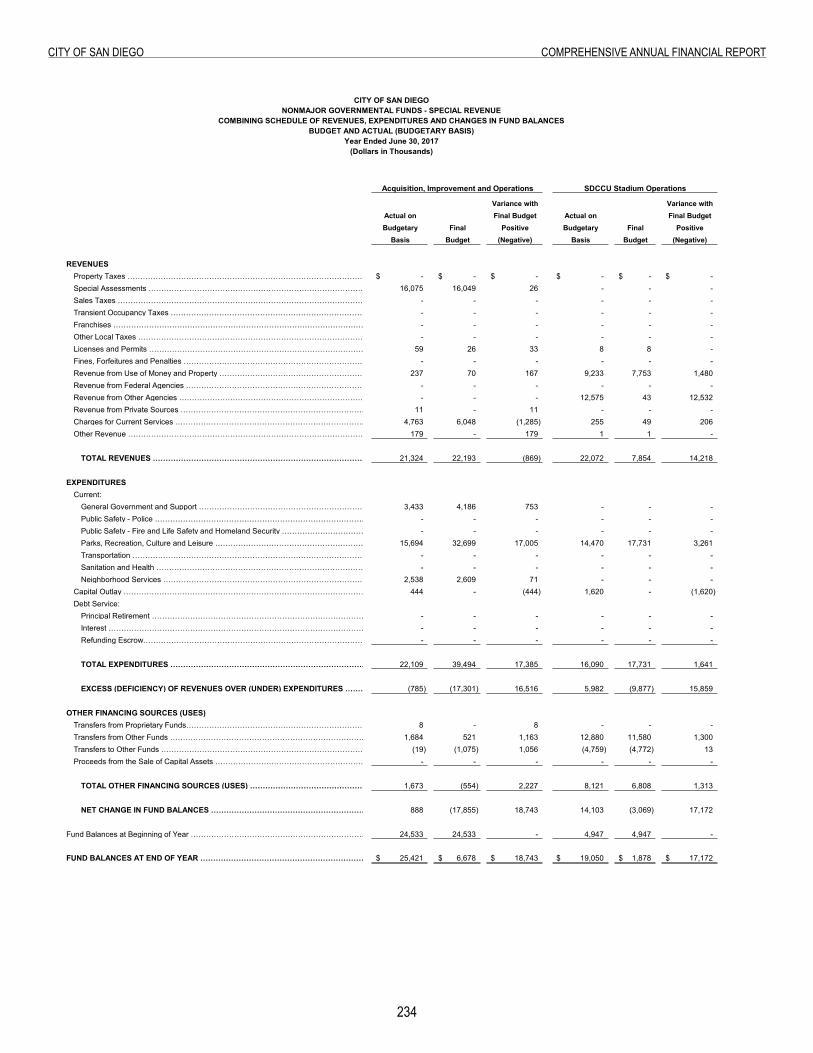
23�
City of San Diego ComprehenSive annual finanCial report
City of San Diego Combining Schedule of Revenues, Expenditures and Changes in Fund Balances -
CITY OF SAN DIEGONONMAJOR GOVERNMENTAL FUNDS - SPECIAL REVENUE
COMBINING SCHEDULE OF REVENUES, EXPENDITURES AND CHANGES IN FUND BALANCESBUDGET AND ACTUAL (BUDGETARY BASIS)
Year Ended June 30, 2017(Dollars in Thousands)
Acquisition, Improvement and Operations SDCCU Stadium Operations
Variance with Variance withActual on Final Budget Actual on Final BudgetBudgetary Final Positive Budgetary Final Positive
Basis Budget (Negative) Basis Budget (Negative)
REVENUESProperty Taxes …………………………………………………………………………………………………………………………………………………………... -$ -$ -$ -$ -$ -$ Special Assessments …………………………………………………………………………………………………………………………………………………………... 16,075 16,049 26 - - - Sales Taxes …………………………………………………………………………………………………………………………………………………………... - - - - - - Transient Occupancy Taxes …………………………………………………………………………………………………………………………………………………………... - - - - - - Franchises ………………………………………………………………………………………………….. - - - - - - Other Local Taxes …………………………………………………………………………………………………………………………………………………………... - - - - - - Licenses and Permits …………………………………………………………………………………………………………………………………………………………... 59 26 33 8 8 - Fines, Forfeitures and Penalties …………………………………………………………………………………………………………………………………………………………... - - - - - - Revenue from Use of Money and Property …………………………………………………………………………………………………………………………………………………………... 237 70 167 9,233 7,753 1,480 Revenue from Federal Agencies …………………………………………………………………………………………………………………………………………………………... - - - - - - Revenue from Other Agencies …………………………………………………………………………………………………………………………………………………………... - - - 12,575 43 12,532 Revenue from Private Sources …………………………………………………………………………………………………………………………………………………………... 11 - 11 - - - Charges for Current Services …………………………………………………………………………………………………………………………………………………………... 4,763 6,048 (1,285) 255 49 206 Other Revenue …………………………………………………………………………………………………………………………………………………………... 179 - 179 1 1 -
.TOTAL REVENUES …………………………………………………………………………………………………………………………………………………………... 21,324 22,193 (869) 22,072 7,854 14,218
.EXPENDITURES .
Current: .. General Government and Support …………………………………………………………………………………………………………………………………………………………... 3,433 4,186 753 - - - . Public Safety - Police …………………………………………………………………………………………………………………………………………………………... - - - - - - . Public Safety - Fire and Life Safety and Homeland Security …………………………………………………………………………………………………………………………………………………………... - - - - - - . Parks, Recreation, Culture and Leisure …………………………………………………………………………………………………………………………………………………………... 15,694 32,699 17,005 14,470 17,731 3,261 . Transportation …………………………………………………………………………………………………………………………………………………………... - - - - - - . Sanitation and Health …………………………………………………………………………………………………………………………………………………………... - - - - - - . Neighborhood Services …………………………………………………………………………………………………………………………………………………………... 2,538 2,609 71 - - -
Capital Outlay …………………………………………………………………………………………………………………………………………………………... 444 - (444) 1,620 - (1,620) Debt Service: .
Principal Retirement …………………………………………………………………………………………………………………………………………………………... - - - - - - Interest …………………………………………………………………………………………………………………………………………………………... - - - - - - Refunding Escrow…………………………………………………………………………………………………………………………………………………………... - - - - - -
.TOTAL EXPENDITURES …………………………………………………………………………………………………………………………………………………………... 22,109 39,494 17,385 16,090 17,731 1,641
.EXCESS (DEFICIENCY) OF REVENUES OVER (UNDER) EXPENDITURES …………………………………………………………………………………………………………………………………………………………... (785) (17,301) 16,516 5,982 (9,877) 15,859
.OTHER FINANCING SOURCES (USES) .
Transfers from Proprietary Funds…………………………………………………………………………………………………………………………………………………………... 8 - 8 - - - Transfers from Other Funds …………………………………………………………………………………………………………………………………………………………... 1,684 521 1,163 12,880 11,580 1,300 Transfers to Other Funds …………………………………………………………………………………………………………………………………………………………... (19) (1,075) 1,056 (4,759) (4,772) 13 Proceeds from the Sale of Capital Assets …………………………………………………………………………………………………………………………………………………………... - - - - - -
.TOTAL OTHER FINANCING SOURCES (USES) …………………………………………………………………………………………………………………………………………………………... 1,673 (554) 2,227 8,121 6,808 1,313
.NET CHANGE IN FUND BALANCES …………………………………………………………………………………………………………………………………………………………... 888 (17,855) 18,743 14,103 (3,069) 17,172
.Fund Balances at Beginning of Year …………………………………………………………………………………………………………………………………. 24,533 24,533 - . 4,947 4,947 -
.FUND BALANCES AT END OF YEAR …………………………………………………………………………. 25,421$ 6,678$ 18,743$ . 19,050$ 1,878$ 17,172$
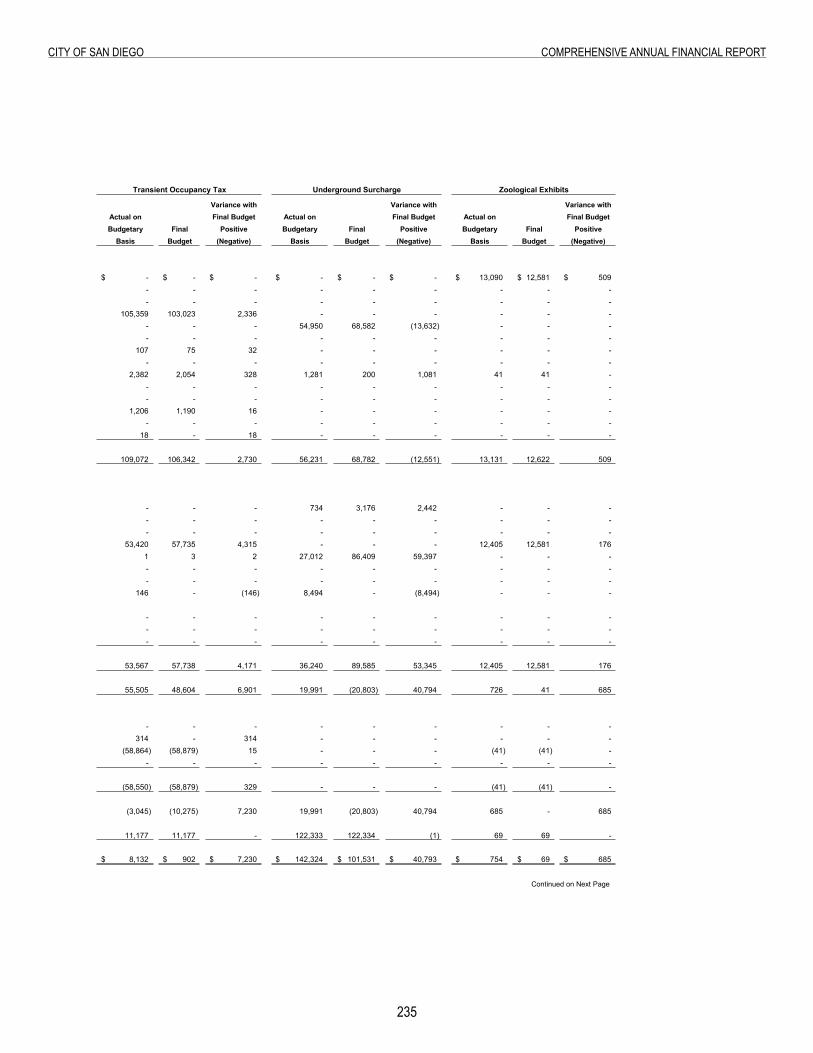
235
City of San Diego ComprehenSive annual finanCial report
Underground Surcharge Zoological Exhibits
Variance with Variance with Variance withActual on Final Budget Actual on Final Budget Actual on Final BudgetBudgetary Final Positive Budgetary Final Positive Budgetary Final Positive
Basis Budget (Negative) Basis Budget (Negative) Basis Budget (Negative)
-$ -$ -$ -$ -$ -$ 13,090$ 12,581$ 509$ - - - - - - - - -
- - - - - - - - - 105,359 103,023 2,336 - - - - - -
- - - 54,950 68,582 (13,632) - - - - - - - - - - - - 107 75 32 - - - - - - - - - - - - - - - 2,382 2,054 328 1,281 200 1,081 41 41 - - - - - - - - - - - - - - - - - - - 1,206 1,190 16 - - - - - - - - - - - - - - - 18 - 18 - - - - - - 109,072 106,342 2,730 56,231 68,782 (12,551) 13,131 12,622 509 - - - 734 3,176 2,442 - - - - - - - - - - - - - - - - - - - - - 53,420 57,735 4,315 - - - 12,405 12,581 176 1 3 2 27,012 86,409 59,397 - - - - - - - - - - - - - - - - - - - - - 146 - (146) 8,494 - (8,494) - - -
- - - - - - - - - - - - - - - - - - - - - - - - - - -
53,567 57,738 4,171 36,240 89,585 53,345 12,405 12,581 176 55,505 48,604 6,901 19,991 (20,803) 40,794 726 41 685 - - - - - - - - - 314 - 314 - - - - - - (58,864) (58,879) 15 - - - (41) (41) - - - - - - - - - - (58,550) (58,879) 329 - - - (41) (41) -
(3,045) (10,275) 7,230 19,991 (20,803) 40,794 685 - 685 11,177 11,177 - 122,333 122,334 (1) 69 69 -
8,132$ 902$ 7,230$ 142,324$ 101,531$ 40,793$ 754$ 69$ 685$
Continued on Next Page
Transient Occupancy Tax
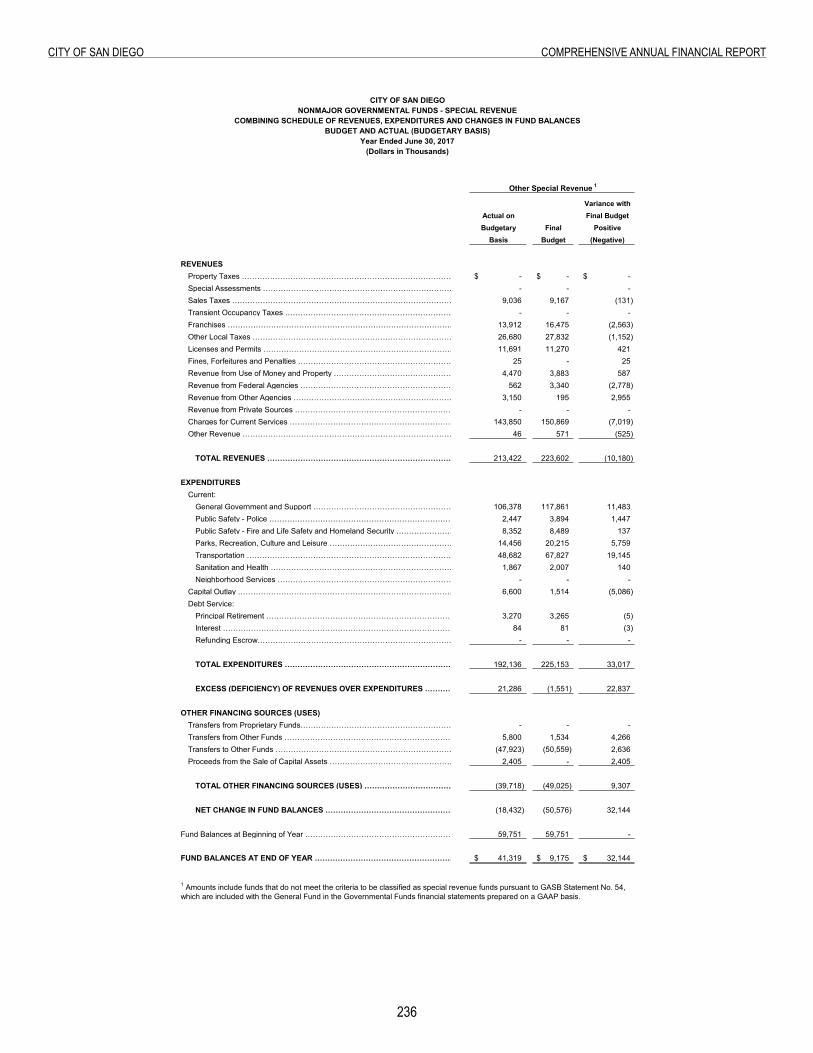
236
City of San Diego ComprehenSive annual finanCial report
CITY OF SAN DIEGONONMAJOR GOVERNMENTAL FUNDS - SPECIAL REVENUE
COMBINING SCHEDULE OF REVENUES, EXPENDITURES AND CHANGES IN FUND BALANCESBUDGET AND ACTUAL (BUDGETARY BASIS)
Year Ended June 30, 2017(Dollars in Thousands)
Other Special Revenue 1
Variance withActual on Final BudgetBudgetary Final Positive
Basis Budget (Negative)
REVENUES Property Taxes ………………………………………………………………………………………………………………………………………………………….. -$ -$ -$ Special Assessments ………………………………………………………………………………………………………………………………………………………….. - - - Sales Taxes ………………………………………………………………………………………………………………………………………………………….. 9,036 9,167 (131) Transient Occupancy Taxes ………………………………………………………………………………………………………………………………………………………….. - - -
Franchises …………………………………………………………………………………………. 13,912 16,475 (2,563) Other Local Taxes ………………………………………………………………………………………………………………………………………………………….. 26,680 27,832 (1,152) Licenses and Permits ………………………………………………………………………………………………………………………………………………………….. 11,691 11,270 421 Fines, Forfeitures and Penalties ………………………………………………………………………………………………………………………………………………………….. 25 - 25 Revenue from Use of Money and Property ………………………………………………………………………………………………………………………………………………………….. 4,470 3,883 587 Revenue from Federal Agencies ………………………………………………………………………………………………………………………………………………………….. 562 3,340 (2,778) Revenue from Other Agencies ………………………………………………………………………………………………………………………………………………………….. 3,150 195 2,955 Revenue from Private Sources ………………………………………………………………………………………………………………………………………………………….. - - - Charges for Current Services ………………………………………………………………………………………………………………………………………………………….. 143,850 150,869 (7,019) Other Revenue ………………………………………………………………………………………………………………………………………………………….. 46 571 (525) TOTAL REVENUES ………………………………………………………………………………………………………………………………………………………….. 213,422 223,602 (10,180) EXPENDITURES
Current: . General Government and Support ………………………………………………………………………………………………………………………………………………………….. 106,378 117,861 11,483 . Public Safety - Police ………………………………………………………………………………………………………………………………………………………….. 2,447 3,894 1,447 . Public Safety - Fire and Life Safety and Homeland Security ………………………………………………………………………………………………………………………………………………………….. 8,352 8,489 137 . Parks, Recreation, Culture and Leisure ………………………………………………………………………………………………………………………………………………………….. 14,456 20,215 5,759 . Transportation ………………………………………………………………………………………………………………………………………………………….. 48,682 67,827 19,145 . Sanitation and Health ………………………………………………………………………………………………………………………………………………………….. 1,867 2,007 140 . Neighborhood Services ………………………………………………………………………………………………………………………………………………………….. - - -
Capital Outlay ………………………………………………………………………………………………………………………………………………………….. 6,600 1,514 (5,086) Debt Service: Principal Retirement ………………………………………………………………………………………………………………………………………………………….. 3,270 3,265 (5) Interest ………………………………………………………………………………………………………………………………………………………….. 84 81 (3) Refunding Escrow………………………………………………………………………………………………………………………………………………………….. - - - TOTAL EXPENDITURES ………………………………………………………………………………………………………………………………………………………….. 192,136 225,153 33,017 EXCESS (DEFICIENCY) OF REVENUES OVER EXPENDITURES ………………………………………………………………………………………………………………………………………………………….. 21,286 (1,551) 22,837 OTHER FINANCING SOURCES (USES)
Transfers from Proprietary Funds………………………………………………………………………………………………………………………………………………………….. - - - Transfers from Other Funds ………………………………………………………………………………………………………………………………………………………….. 5,800 1,534 4,266 Transfers to Other Funds ………………………………………………………………………………………………………………………………………………………….. (47,923) (50,559) 2,636 Proceeds from the Sale of Capital Assets ………………………………………………………………………………………………………………………………………………………….. 2,405 - 2,405 TOTAL OTHER FINANCING SOURCES (USES) ………………………………………………………………………………………………………………………………………………………….. (39,718) (49,025) 9,307 NET CHANGE IN FUND BALANCES ………………………………………………………………………………………………………………………………………………………….. (18,432) (50,576) 32,144 Fund Balances at Beginning of Year ………………………………………………………………………………………………………………………………… 59,751 59,751 -
FUND BALANCES AT END OF YEAR ………………………………………………………………………… 41,319$ 9,175$ 32,144$
1 Amounts include funds that do not meet the criteria to be classified as special revenue funds pursuant to GASB Statement No. 54, which are included with the General Fund in the Governmental Funds financial statements prepared on a GAAP basis.
NONMAJOR GOVERNMENTAL FUNDSDeBt ServiCe
Nonmajor Governmental
NONMAJOR GOVERNMENTAL FUNDSDEBT SERVICE

239
City of San Diego ComprehenSive annual finanCial report
DEBT SERVICE FUNDS
Debt service funds are used to account for and report financial resources that are restricted, committed, or assigned to expenditure for general long-term debt principal, interest, and related costs.
BLENDED COMPONENT UNITS
CONVENTION CENTER EXPANSION FINANCING AUTHORITY
This fund was established to account for the debt service activities of the CCEFA. CCEFA, created by the City and the Port of San Diego, facilitates the financing, acquisition and construction of an expansion to the San Diego Convention Center. CCEFA’s debt service fund is used to account for the payment of long-term debt principal and interest.
PUBLIC FACILITIES FINANCING AUTHORITY
This fund was established to account for the debt service activities of the PFFA. PFFA, a joint powers authority consisting of the City, the Successor Agency and the Housing Authority of the City of San Diego, facilitates the financing, acquisition and construction of public capital facility improvements. PFFA’s debt service fund is used to account for the payment of long-term debt principal and interest.
TOBACCO SETTLEMENT REVENUE FUNDING CORPORATION (TSRFC)
This fund was established to account for the debt service activities of the TSRFC. TSRFC was established for the purpose of acquiring the tobacco settlement revenues allocated to the City from the State of California, pursuant to the Master Settlement Agreement. The TSRFC’s debt service fund is used to account for the payment of long-term debt principal and interest.
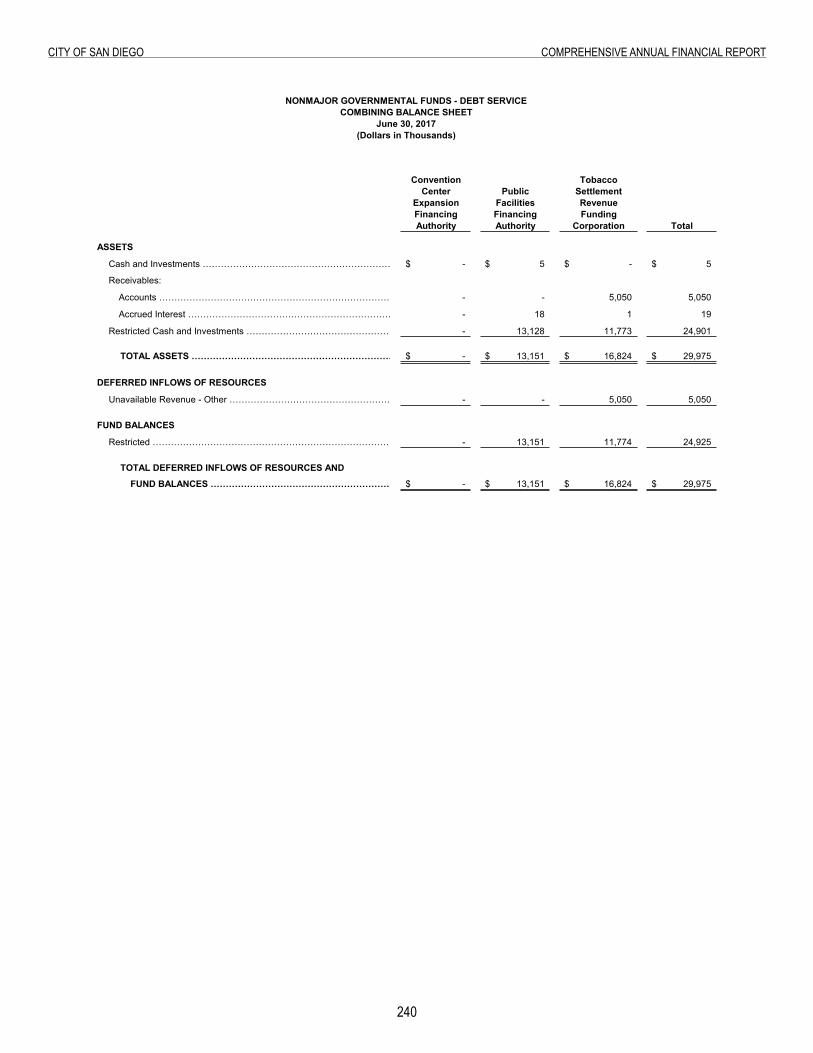
2�0
City of San Diego ComprehenSive annual finanCial report
Combining Balance Sheet
Convention TobaccoCenter Public Settlement
Expansion Facilities RevenueFinancing Financing FundingAuthority Authority Corporation Total
ASSETS
Cash and Investments ……………………………………………………………………………………………... -$ 5$ -$ 5$
Receivables: .
Accounts ……………………………………………………………………………………………………………... - - 5,050 5,050
Accrued Interest ………………………………………………………………………………………………………………….. - 18 1 19
Restricted Cash and Investments ……………………………………………………………………….. - 13,128 11,773 24,901 .
TOTAL ASSETS …………………………………………………………………………………………………. -$ 13,151$ 16,824$ 29,975$ .
DEFERRED INFLOWS OF RESOURCES
Unavailable Revenue - Other …………………………………………………………………………………………………………………………… - - 5,050 5,050
FUND BALANCES .
Restricted …………………………………………………………………………………………………………………….. - 13,151 11,774 24,925
TOTAL DEFERRED INFLOWS OF RESOURCES AND
FUND BALANCES ……………………………………………………………………………….. -$ 13,151$ 16,824$ 29,975$
NONMAJOR GOVERNMENTAL FUNDS - DEBT SERVICECOMBINING BALANCE SHEET
June 30, 2017(Dollars in Thousands)
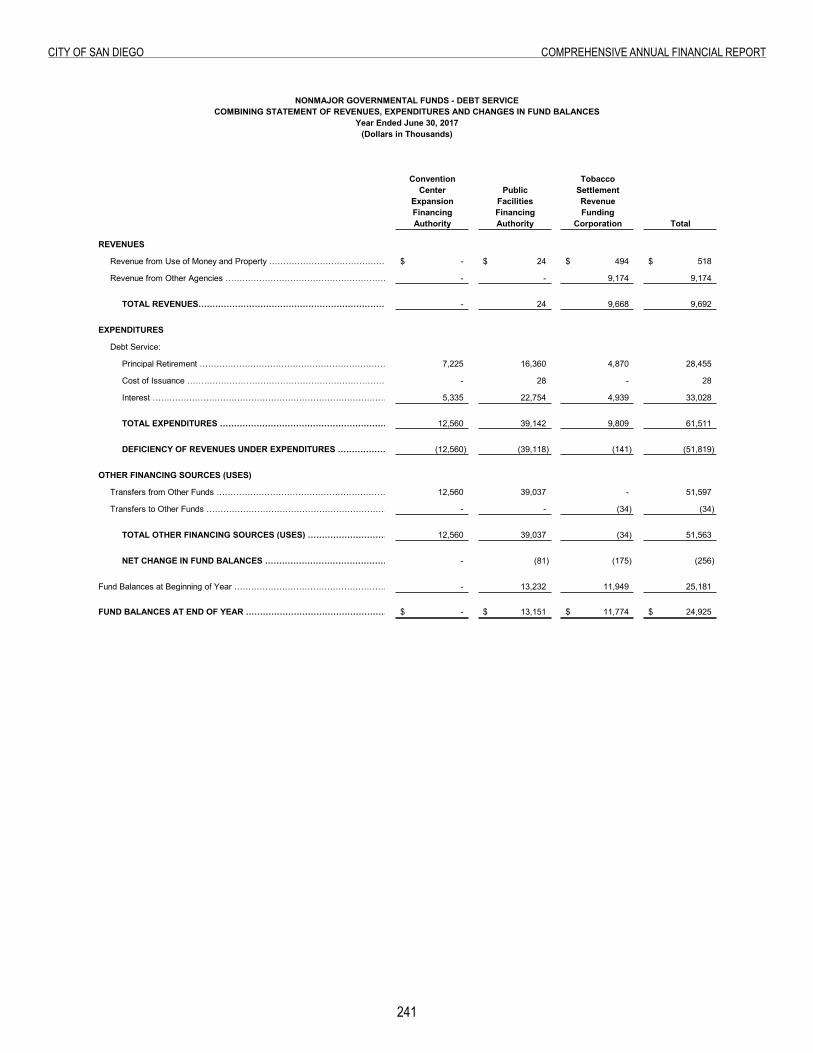
2�1
City of San Diego ComprehenSive annual finanCial report
Combining Statement of Revenues, Expenditures and Changes in Fund Balances
Convention TobaccoCenter Public Settlement
Expansion Facilities RevenueFinancing Financing FundingAuthority Authority Corporation Total
REVENUES
Revenue from Use of Money and Property …………………………………………………………………………………………………………………………………………….. -$ 24$ 494$ 518$
Revenue from Other Agencies …………………………………………………………………………………………………………………………………………….. - - 9,174 9,174 .
TOTAL REVENUES…………………………………………………………………………………………………………………………………………….. - 24 9,668 9,692 .
EXPENDITURES .
Debt Service: .
Principal Retirement …………………………………………………………………………………………………………………………………………….. 7,225 16,360 4,870 28,455
Cost of Issuance …………………………………………………………………………………………………………………………………………….. - 28 - 28
Interest …………………………………………………………………………………………………………………………………………….. 5,335 22,754 4,939 33,028 .
TOTAL EXPENDITURES …………………………………………………………………………………………………………………………………………….. 12,560 39,142 9,809 61,511 .
DEFICIENCY OF REVENUES UNDER EXPENDITURES …………………………………………………………………………………………………………………………………………….. (12,560) (39,118) (141) (51,819) .
OTHER FINANCING SOURCES (USES) .
Transfers from Other Funds …………………………………………………………………………………………………………………………………………….. 12,560 39,037 - 51,597
Transfers to Other Funds …………………………………………………………………………………………………………………………………………….. - - (34) (34) .
TOTAL OTHER FINANCING SOURCES (USES) …………………………………………………………………………………………………………………………………………….. 12,560 39,037 (34) 51,563
NET CHANGE IN FUND BALANCES …………………………………………………………………………………………………………………………………………….. - (81) (175) (256) .
Fund Balances at Beginning of Year …………………………………………………………………………………………………………………………………………….. - 13,232 11,949 25,181 .
FUND BALANCES AT END OF YEAR …………………………………………………………………………………………………………………………………………….. -$ 13,151$ 11,774$ 24,925$
NONMAJOR GOVERNMENTAL FUNDS - DEBT SERVICECOMBINING STATEMENT OF REVENUES, EXPENDITURES AND CHANGES IN FUND BALANCES
Year Ended June 30, 2017(Dollars in Thousands)

this page intentionally left Blank
2�2
Page Intentionally Left Blank
NONMAJOR GOVERNMENTAL FUNDSCAPITAL PROJECTS
Nonmajor Governmental Funds - Capital Projects:
NONMAJOR GOVERNMENTAL FUNDS CAPITAL PROJECTS
photo: JM2Group

2�5
City of San Diego ComprehenSive annual finanCial report
CAPITAL PROJECTS FUNDS
Capital projects funds are used to account for and report financial resources that are restricted, committed, or assigned to expenditure for the acquisition or construction of major capital facilities.
CITY OF SAN DIEGO
TRANSNET - BUDGETED
This fund was established to account for transportation improvements funded by the 2009 extension of a local sales tax approved by voters in the County of San Diego. Funds are used to relieve traffic congestion, increase safety, and improve air quality by performing repairs, restorations, and construction of needed facilities within the public rights-of-way.
CAPITAL OUTLAY - BUDGETED
This fund was established to account for capital improvements per Sections 55.2 and 77 of the City Charter. This fund includes a variety of capital projects including, but not limited to, building improvements to city facilities, park improvements, and street improvements. Revenues in this fund are derived from the sale of City-owned real property and Mission Bay Park lease revenues.
CAPITAL GRANTS - UNBUDGETED
This fund was established to account for capital grants from Federal, State and other governmental agencies.
PARKS & RECREATION DISTRICTS - UNBUDGETED
This fund was established to account for park fees collected at the time of subdivision or permit issuance and is mandated per the City of San Diego Municipal Code. Fee assessments are only to be used for park purposes within a Community Park Service District to purchase land, facilities, or reimburse those who have donated more than their proportionate responsibilities.
FACILITIES BENEFIT ASSESSMENTS - UNBUDGETED
This fund was established to account for building permit fees collected at the time of permit issuance and is mandated by the City Charter. Fee assessments are only to be used in the community the assessments are collected and are the primary source of project funding, excluding maintenance costs.
IMPACT FEES - UNBUDGETED
This fund was established to account for building permit fees collected at the time of permit issuance and has specific State reporting requirements. Fee assessments are only to be used in the community the assessments are collected and are not the primary source of project funding and exclude maintenance costs.
SPECIAL ASSESSMENT/SPECIAL TAX BONDS - UNBUDGETED
This fund was established to account for Community Facilities Districts and Special Assessment Districts, which under various sections of State law, issue limited obligation bonds to finance infrastructure facilities and other public improvements necessary to facilitate development of the properties within each district. The bonds are secured solely by the properties within each district, and are repaid through revenues generated by the annual levy of special taxes or special assessments on the benefiting properties.
TRANSNET - UNBUDGETED
This fund was established to account for transportation improvements funded by local sales tax approved by voters in the County of San Diego, as well as developer impact fees under the SANDAG administered TransNet Program. Funds are used to relieve traffic congestion, increase safety, and improve air quality by performing repairs, restorations, and construction of needed facilities within the public rights-of-way.
2�6
City of San Diego ComprehenSive annual finanCial report
CAPITAL OUTLAY - UNBUDGETED
This fund was established to account for the acquisition, construction and completion of permanent public improvements and real property. This fund also accounts for a variety of capital projects including, but not limited to, park and street improvements, and the construction of public facilities in new development areas. Revenues in this fund are derived from developer contributions, private donations, special assessments, special taxes, fees, leases, and interest derived there from.
BLENDED COMPONENT UNITS
PUBLIC FACILITIES FINANCING AUTHORITY
This fund was established to account for the capital improvement acquisition and construction activities of the Public Facilities Financing Authority (PFFA). PFFA, which was created by the City and the former Redevelopment Agency, facilitates the financing and construction of public capital improvements. PFFA’s current members are the City, the Successor Agency and the Housing Authority of the City of San Diego. Revenues are derived from the issuance of bonds and interest earnings on investments.

this page intentionally left Blank
2�7
Page Intentionally Left Blank
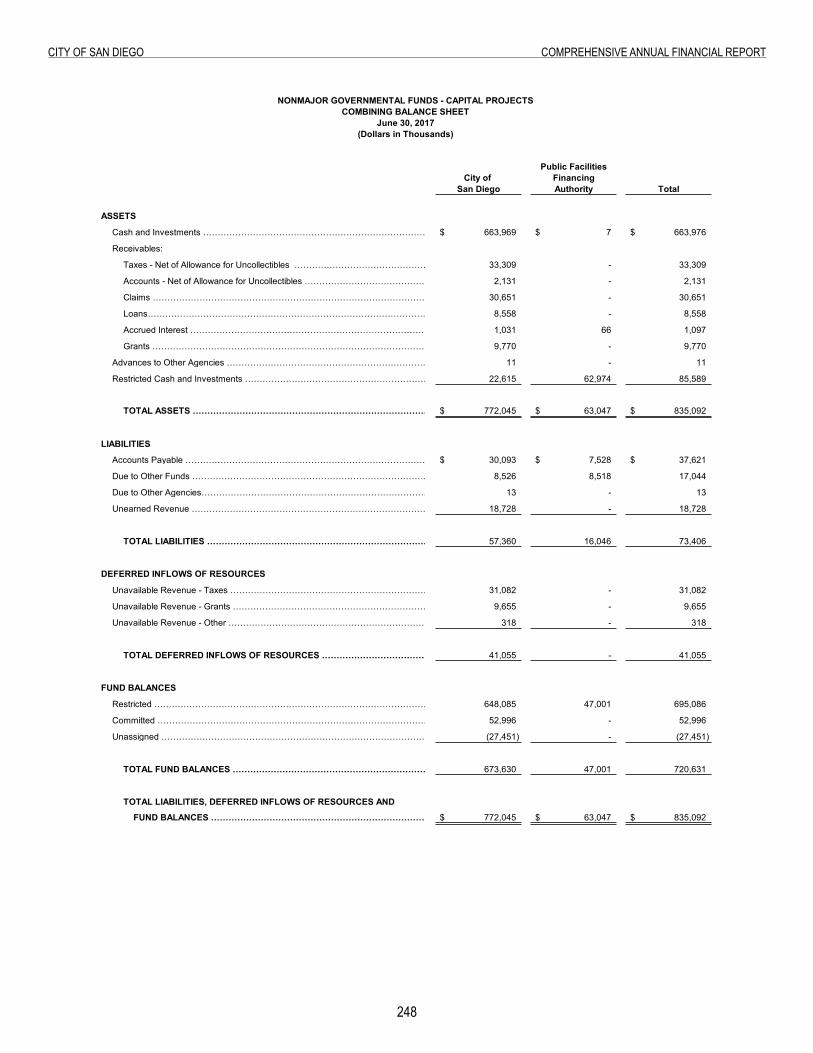
2�8
City of San Diego ComprehenSive annual finanCial report
Combining Balance Sheet
Public FacilitiesCity of Financing
San Diego Authority Total
ASSETS
Cash and Investments …………………………………………………………………………………………………………………. 663,969$ 7$ 663,976$
Receivables: .
Taxes - Net of Allowance for Uncollectibles ………………………………………………………………………………………………………………………………………………………………. 33,309 - 33,309
Accounts - Net of Allowance for Uncollectibles …………………………………………………………………………………………………………………………………………. 2,131 - 2,131
Claims ……………………………………………………………………………………………………………………………………………….. 30,651 - 30,651
Loans……………………………………………………………………………………………………………………………………………. 8,558 - 8,558
Accrued Interest …………………………………………………………………………………………………………………………... 1,031 66 1,097
Grants …………………………………………………………………………………………………………………………………………. 9,770 - 9,770
Advances to Other Agencies …………………………………………………………………………………………………………………………….. 11 - 11
Restricted Cash and Investments …………………………………………………………………………………………………………….. 22,615 62,974 85,589
.
TOTAL ASSETS ………………………………………………………………………………………………………. 772,045$ 63,047$ 835,092$
.
LIABILITIES .
Accounts Payable ……………………………………………………………………………………………………………………………………. 30,093$ 7,528$ 37,621$
Due to Other Funds ………………………………………………………………………………………………………………………….. 8,526 8,518 17,044
Due to Other Agencies………………………………………………………………………………………………………………….. 13 - 13
Unearned Revenue ……………………………………………………………………………………………………………………………... 18,728 - 18,728
.
TOTAL LIABILITIES ………………………………………………………………………………………………….. 57,360 16,046 73,406
DEFERRED INFLOWS OF RESOURCES
Unavailable Revenue - Taxes …………………………………………………………………………………………………………………………………………………. 31,082 - 31,082
Unavailable Revenue - Grants …………………………………………………………………………………………………………………………………………………... 9,655 - 9,655
Unavailable Revenue - Other ……………………………………………………………………………………………………………………………………………………. 318 - 318
TOTAL DEFERRED INFLOWS OF RESOURCES ……………………………………………………………………………………………... 41,055 - 41,055
FUND BALANCES .
Restricted ……………………………………………………………………………………………………………………………... 648,085 47,001 695,086
Committed …………………………………………………………………………………………………………………………………. 52,996 - 52,996
Unassigned …………………………………………………………………………………………………………………………………... (27,451) - (27,451)
TOTAL FUND BALANCES ……………………………………………………………………………………………………….. 673,630 47,001 720,631
TOTAL LIABILITIES, DEFERRED INFLOWS OF RESOURCES AND
FUND BALANCES ………………………………………………………………………………….. 772,045$ 63,047$ 835,092$
NONMAJOR GOVERNMENTAL FUNDS - CAPITAL PROJECTSCOMBINING BALANCE SHEET
June 30, 2017(Dollars in Thousands)
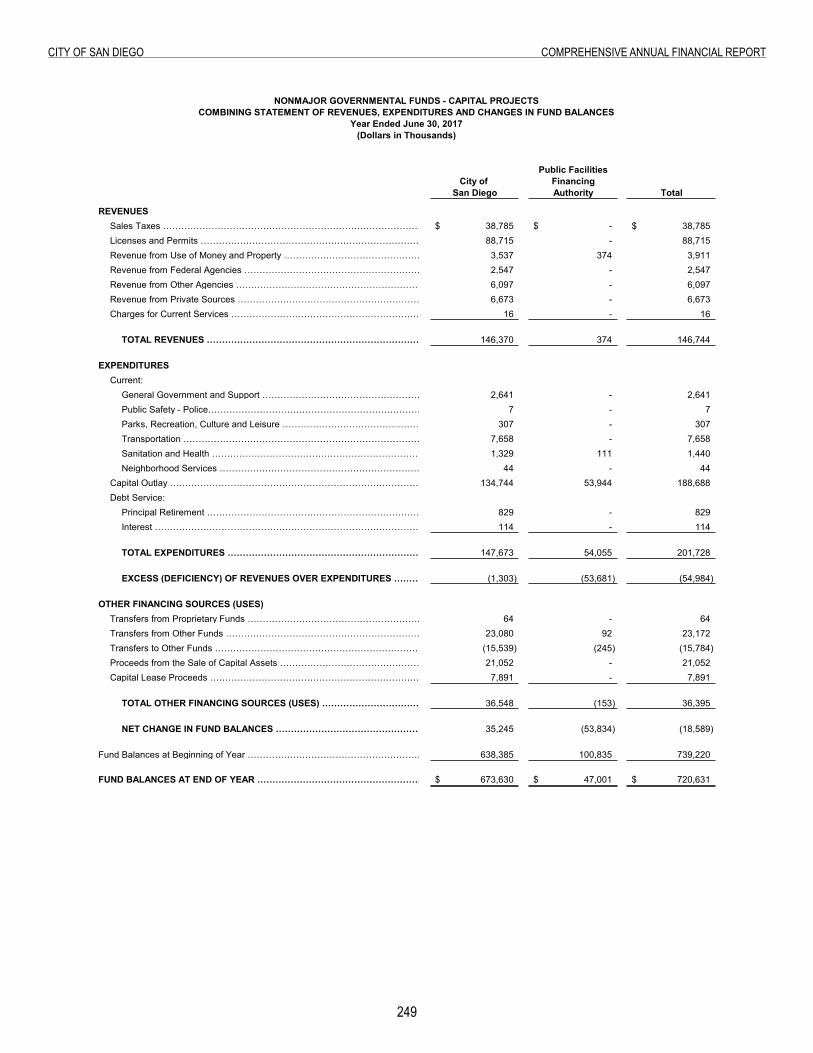
2�9
City of San Diego ComprehenSive annual finanCial report
Combining Statement of Revenues, Expenditures and Changes in Fund Balances
Public FacilitiesCity of Financing
San Diego Authority Total
REVENUESSales Taxes …………………………………………………………………………………………………………………………………………….. 38,785$ -$ 38,785$ Licenses and Permits …………………………………………………………………………………………………………………………………………….. 88,715 - 88,715 Revenue from Use of Money and Property …………………………………………………………………………………………………………………………………………….. 3,537 374 3,911 Revenue from Federal Agencies …………………………………………………………………………………………………………………………………………….. 2,547 - 2,547 Revenue from Other Agencies …………………………………………………………………………………………………………………………………………….. 6,097 - 6,097 Revenue from Private Sources …………………………………………………………………………………………………………………………………………….. 6,673 - 6,673 Charges for Current Services …………………………………………………………………………………………………………………………………………….. 16 - 16
.TOTAL REVENUES …………………………………………………………………………………………………………………………………………….. 146,370 374 146,744
.EXPENDITURES .
Current: .. General Government and Support …………………………………………………………………………………………………………………………………………….. 2,641 - 2,641 . Public Safety - Police…………………………………………………………………………………………………………………………………………….. 7 - 7 . Parks, Recreation, Culture and Leisure …………………………………………………………………………………………………………………………………………….. 307 - 307 . Transportation …………………………………………………………………………………………………………………………………………….. 7,658 - 7,658 . Sanitation and Health …………………………………………………………………………………………………………………………………………….. 1,329 111 1,440 . Neighborhood Services …………………………………………………………………………………………………………………………………………….. 44 - 44
Capital Outlay …………………………………………………………………………………………………………………………………………….. 134,744 53,944 188,688 Debt Service: .
Principal Retirement …………………………………………………………………………………………………………………………………………….. 829 - 829 Interest …………………………………………………………………………………………………………………………………………….. 114 - 114
.TOTAL EXPENDITURES …………………………………………………………………………………………………………………………………………….. 147,673 54,055 201,728
.EXCESS (DEFICIENCY) OF REVENUES OVER EXPENDITURES …………………………………………………………………………………………………………………………………………….. (1,303) (53,681) (54,984)
.OTHER FINANCING SOURCES (USES) .
Transfers from Proprietary Funds …………………………………………………………………………………………………………………………………………….. 64 - 64 Transfers from Other Funds …………………………………………………………………………………………………………………………………………….. 23,080 92 23,172 Transfers to Other Funds …………………………………………………………………………………………………………………………………………….. (15,539) (245) (15,784) Proceeds from the Sale of Capital Assets …………………………………………………………………………………………………………………………………………….. 21,052 - 21,052 Capital Lease Proceeds …………………………………………………………………………………………………………………………………………….. 7,891 - 7,891
.TOTAL OTHER FINANCING SOURCES (USES) …………………………………………………………………………………………………………………………………………….. 36,548 (153) 36,395
NET CHANGE IN FUND BALANCES …………………………………………………………………………………………………………………………………………….. 35,245 (53,834) (18,589) .
Fund Balances at Beginning of Year …………………………………………………………………………………………………………………………………………….. 638,385 100,835 739,220 .
FUND BALANCES AT END OF YEAR …………………………………………………………………………………………………………………………………………….. 673,630$ 47,001$ 720,631$
NONMAJOR GOVERNMENTAL FUNDS - CAPITAL PROJECTSCOMBINING STATEMENT OF REVENUES, EXPENDITURES AND CHANGES IN FUND BALANCES
Year Ended June 30, 2017(Dollars in Thousands)
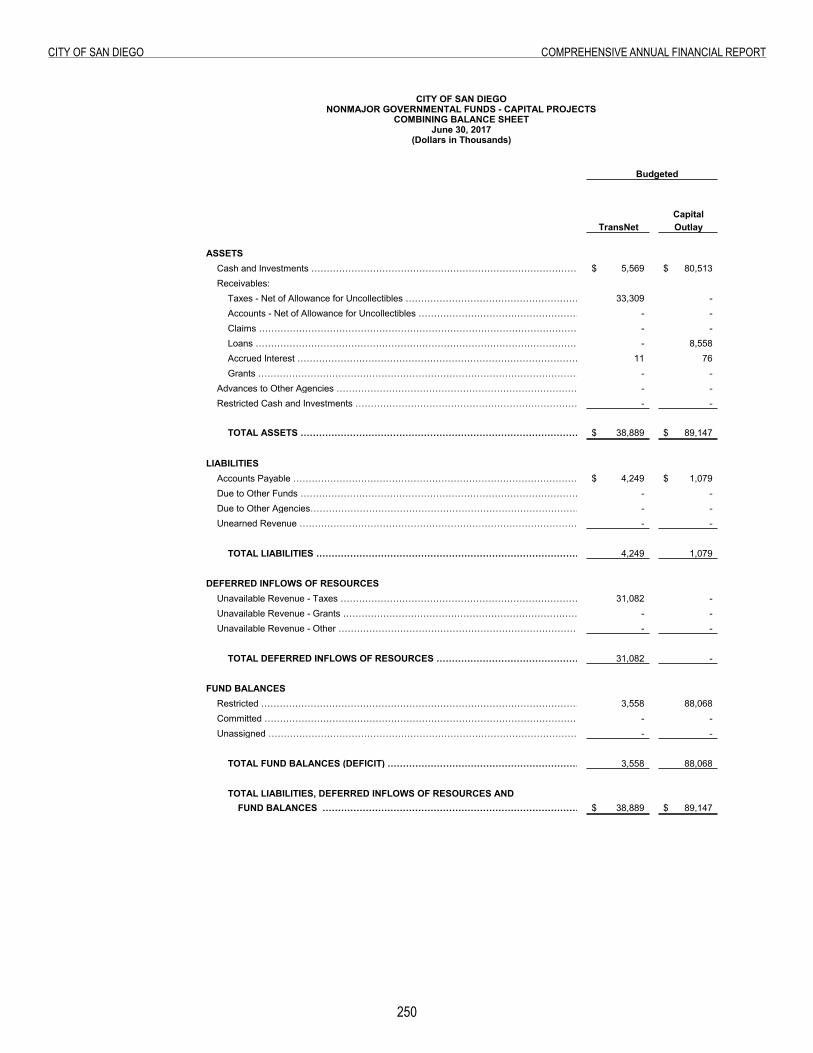
250
City of San Diego ComprehenSive annual finanCial report
City of San Diego Combining Balance Sheet
Budgeted
CapitalTransNet Outlay
ASSETSCash and Investments ………………………………………………………………………………………………………………………………………………………………. 5,569$ 80,513$ Receivables: .
Taxes - Net of Allowance for Uncollectibles ………………………………………………………………………………………………………………………………………………………………. 33,309 - Accounts - Net of Allowance for Uncollectibles ………………………………………………………………………………………………………………………………………………………………………………………... - - Claims ………………………………………………………………………………………………………………………………………………………………………………………………………………………………………………………………………………….. - - Loans ……………………………………………………………………………………………………………………………………………………………………………… - 8,558 Accrued Interest …………………………………………………………………………………………………………………………………………………………………………. 11 76 Grants ……………………………………………………………………………………………………………………………………………………………………………………………... - -
Advances to Other Agencies …………………………………………………………………………………………………………………………………………. - - Restricted Cash and Investments …………………………………………………………………………………………………………………………………………………………. - -
.TOTAL ASSETS ………………………………………………………………………………………………………………………………………………….. 38,889$ 89,147$
.LIABILITIES .
Accounts Payable …………………………………………………………………………………………………………………………………………………………………………... 4,249$ 1,079$ Due to Other Funds …………………………………………………………………………………………………………………………………………………………………….. - - Due to Other Agencies……………………………………………………………………………………………………………………………………………………………………. - - Unearned Revenue ………………………………………………………………………………………………………………………………………………………………………………….. - -
.TOTAL LIABILITIES ……………………………………………………………………………………………………………………………………….. 4,249 1,079
DEFERRED INFLOWS OF RESOURCESUnavailable Revenue - Taxes ……………………………………………………………………………………………………………………………………………………………….. 31,082 - Unavailable Revenue - Grants ……………………………………………………………………………………………………………………………………………………………... - - Unavailable Revenue - Other ……………………………………………………………………………………………………………………………………………………………….. - -
TOTAL DEFERRED INFLOWS OF RESOURCES ………………………………………………………………………………………………. 31,082 -
FUND BALANCES .Restricted ………………………………………………………………………………………………………………………………………………………………………………………….. 3,558 88,068 Committed ………………………………………………………………………………………………………………………………………………………………………………………. - - Unassigned …………………………………………………………………………………………………………………………………………………………………………………... - -
TOTAL FUND BALANCES (DEFICIT) ………………………………………………………………………………………………………….. 3,558 88,068
TOTAL LIABILITIES, DEFERRED INFLOWS OF RESOURCES ANDFUND BALANCES …………………………………………………………………………………………………………………………………………………………………… 38,889$ 89,147$
CITY OF SAN DIEGONONMAJOR GOVERNMENTAL FUNDS - CAPITAL PROJECTS
COMBINING BALANCE SHEETJune 30, 2017
(Dollars in Thousands)
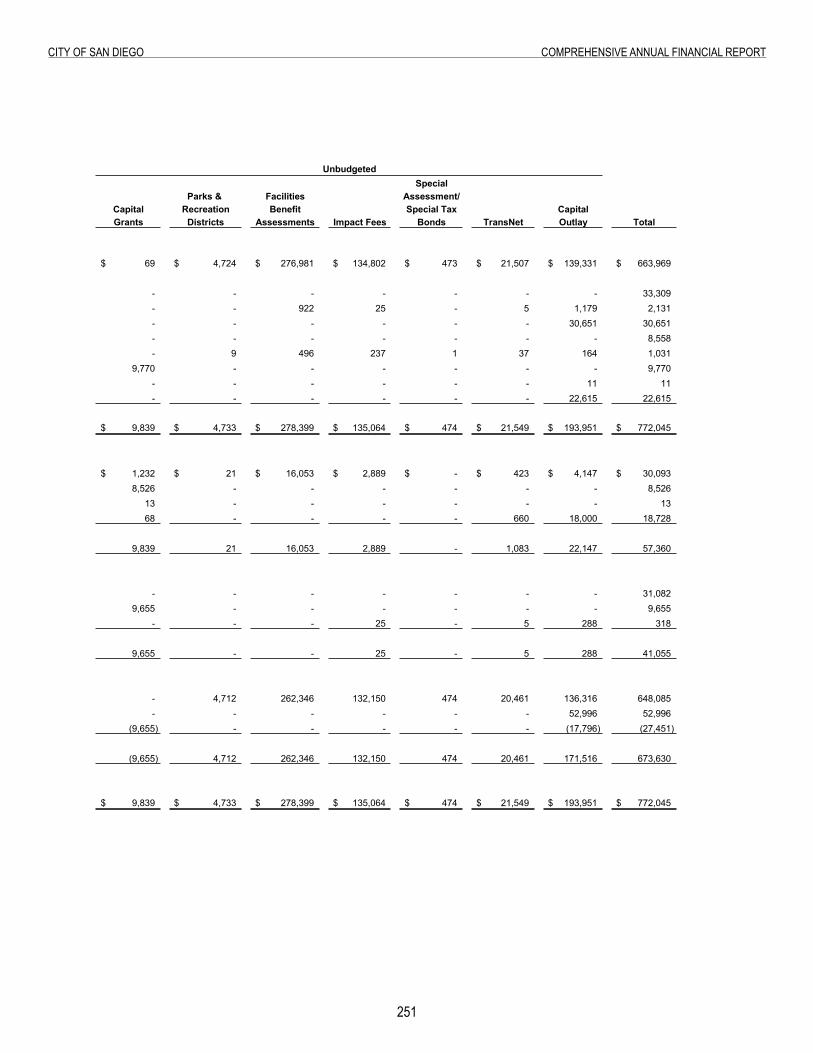
251
City of San Diego ComprehenSive annual finanCial report
SpecialParks & Facilities Assessment/
Capital Recreation Benefit Special Tax CapitalGrants Districts Assessments Impact Fees Bonds TransNet Outlay Total
69$ 4,724$ 276,981$ 134,802$ 473$ 21,507$ 139,331$ 663,969$
- - - - - - - 33,309 - - 922 25 - 5 1,179 2,131 - - - - - - 30,651 30,651 - - - - - - - 8,558 - 9 496 237 1 37 164 1,031
9,770 - - - - - - 9,770 - - - - - - 11 11 - - - - - - 22,615 22,615
9,839$ 4,733$ 278,399$ 135,064$ 474$ 21,549$ 193,951$ 772,045$
1,232$ 21$ 16,053$ 2,889$ -$ 423$ 4,147$ 30,093$ 8,526 - - - - - - 8,526
13 - - - - - - 13 68 - - - - 660 18,000 18,728
9,839 21 16,053 2,889 - 1,083 22,147 57,360
- - - - - - - 31,082 9,655 - - - - - - 9,655
- - - 25 - 5 288 318
9,655 - - 25 - 5 288 41,055
- 4,712 262,346 132,150 474 20,461 136,316 648,085 - - - - - - 52,996 52,996
(9,655) - - - - - (17,796) (27,451)
(9,655) 4,712 262,346 132,150 474 20,461 171,516 673,630
9,839$ 4,733$ 278,399$ 135,064$ 474$ 21,549$ 193,951$ 772,045$
Unbudgeted
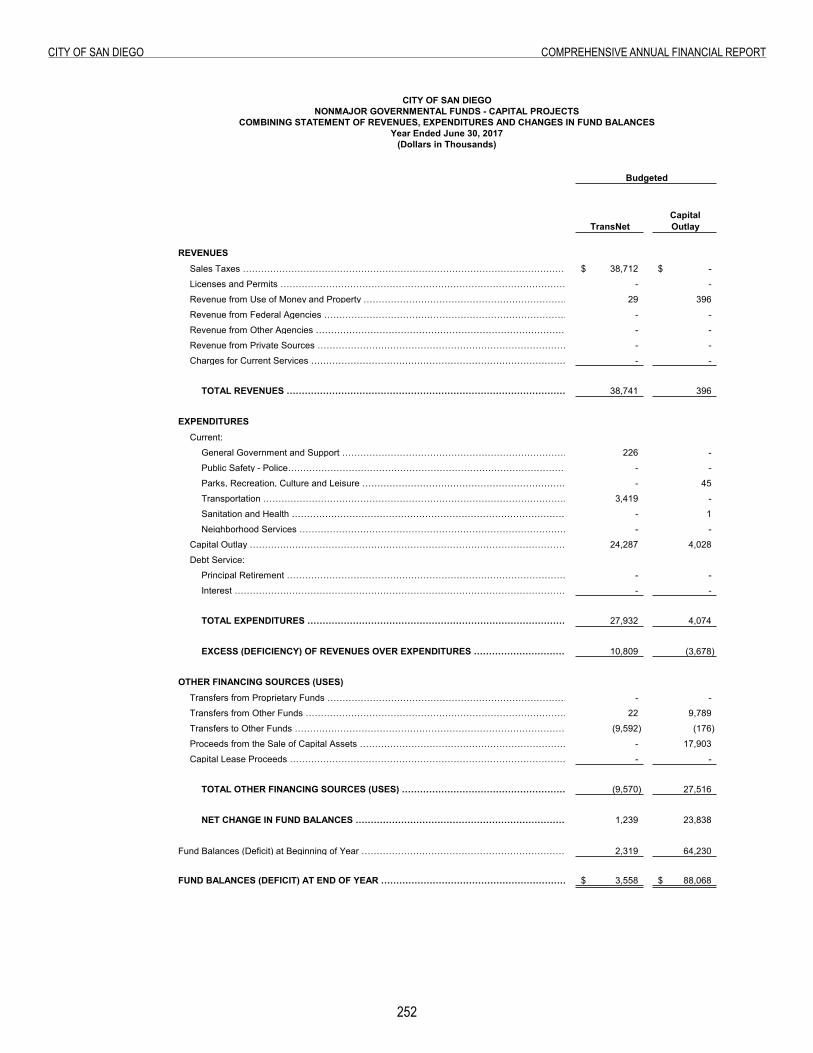
252
City of San Diego ComprehenSive annual finanCial report
City of San Diego Combining Statement of Revenues, Expenditures and Changes in Fund Balances
Budgeted
CapitalTransNet Outlay
REVENUESSales Taxes …………………………………………………………………………………………………………………………………………….. 38,712$ -$
Licenses and Permits …………………………………………………………………………………………………………………………………………….. - -
Revenue from Use of Money and Property …………………………………………………………………………………………………………………………………………….. 29 396
Revenue from Federal Agencies …………………………………………………………………………………………………………………………………………….. - -
Revenue from Other Agencies …………………………………………………………………………………………………………………………………………….. - -
Revenue from Private Sources …………………………………………………………………………………………………………………………………………….. - -
Charges for Current Services …………………………………………………………………………………………………………………………………………….. - -
.TOTAL REVENUES …………………………………………………………………………………………………………………………………………….. 38,741 396
.EXPENDITURES .
Current: .
. General Government and Support …………………………………………………………………………………………………………………………………………….. 226 -
. Public Safety - Police…………………………………………………………………………………………………………………………………………….. - -
. Parks, Recreation, Culture and Leisure …………………………………………………………………………………………………………………………………………….. - 45
. Transportation …………………………………………………………………………………………………………………………………………….. 3,419 -
. Sanitation and Health …………………………………………………………………………………………………………………………………………….. - 1
. Neighborhood Services …………………………………………………………………………………………………………………………………………….. - -
Capital Outlay …………………………………………………………………………………………………………………………………………….. 24,287 4,028
Debt Service: .
Principal Retirement …………………………………………………………………………………………………………………………………………….. - -
Interest …………………………………………………………………………………………………………………………………………….. - -
.TOTAL EXPENDITURES …………………………………………………………………………………………………………………………………………….. 27,932 4,074
.EXCESS (DEFICIENCY) OF REVENUES OVER EXPENDITURES …………………………………………………………………………………………………………………………………………….. 10,809 (3,678)
.OTHER FINANCING SOURCES (USES) .
Transfers from Proprietary Funds …………………………………………………………………………………………………………………………………………….. - -
Transfers from Other Funds …………………………………………………………………………………………………………………………………………….. 22 9,789
Transfers to Other Funds …………………………………………………………………………………………………………………………………………….. (9,592) (176)
Proceeds from the Sale of Capital Assets …………………………………………………………………………………………………………………………………………….. - 17,903
Capital Lease Proceeds …………………………………………………………………………………………………………………………………………….. - -
.TOTAL OTHER FINANCING SOURCES (USES) …………………………………………………………………………………………………………………………………………….. (9,570) 27,516
NET CHANGE IN FUND BALANCES …………………………………………………………………………………………………………………………………………….. 1,239 23,838
.
Fund Balances (Deficit) at Beginning of Year …………………………………………………………………………………………………………………………………………….. 2,319 64,230
.FUND BALANCES (DEFICIT) AT END OF YEAR …………………………………………………………………………………………………………………………………………….. 3,558$ 88,068$
CITY OF SAN DIEGONONMAJOR GOVERNMENTAL FUNDS - CAPITAL PROJECTS
COMBINING STATEMENT OF REVENUES, EXPENDITURES AND CHANGES IN FUND BALANCESYear Ended June 30, 2017
(Dollars in Thousands)
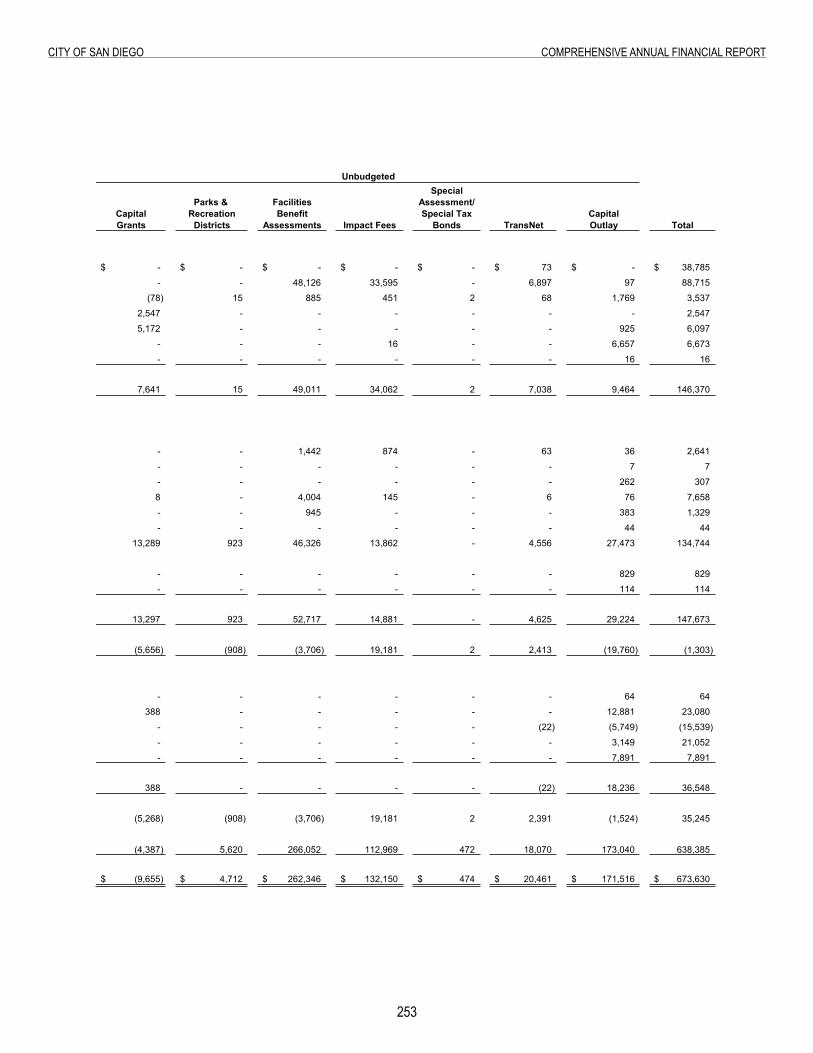
253
City of San Diego ComprehenSive annual finanCial report
UnbudgetedSpecial
Parks & Facilities Assessment/Capital Recreation Benefit Special Tax CapitalGrants Districts Assessments Impact Fees Bonds TransNet Outlay Total
-$ -$ -$ -$ -$ 73$ -$ 38,785$
- - 48,126 33,595 - 6,897 97 88,715
(78) 15 885 451 2 68 1,769 3,537
2,547 - - - - - - 2,547
5,172 - - - - - 925 6,097
- - - 16 - - 6,657 6,673
- - - - - - 16 16
7,641 15 49,011 34,062 2 7,038 9,464 146,370
- - 1,442 874 - 63 36 2,641
- - - - - - 7 7
- - - - - - 262 307
8 - 4,004 145 - 6 76 7,658
- - 945 - - - 383 1,329
- - - - - - 44 44
13,289 923 46,326 13,862 - 4,556 27,473 134,744
- - - - - - 829 829
- - - - - - 114 114
13,297 923 52,717 14,881 - 4,625 29,224 147,673
(5,656) (908) (3,706) 19,181 2 2,413 (19,760) (1,303)
- - - - - - 64 64
388 - - - - - 12,881 23,080
- - - - - (22) (5,749) (15,539)
- - - - - - 3,149 21,052
- - - - - - 7,891 7,891
388 - - - - (22) 18,236 36,548
(5,268) (908) (3,706) 19,181 2 2,391 (1,524) 35,245
(4,387) 5,620 266,052 112,969 472 18,070 173,040 638,385
(9,655)$ 4,712$ 262,346$ 132,150$ 474$ 20,461$ 171,516$ 673,630$
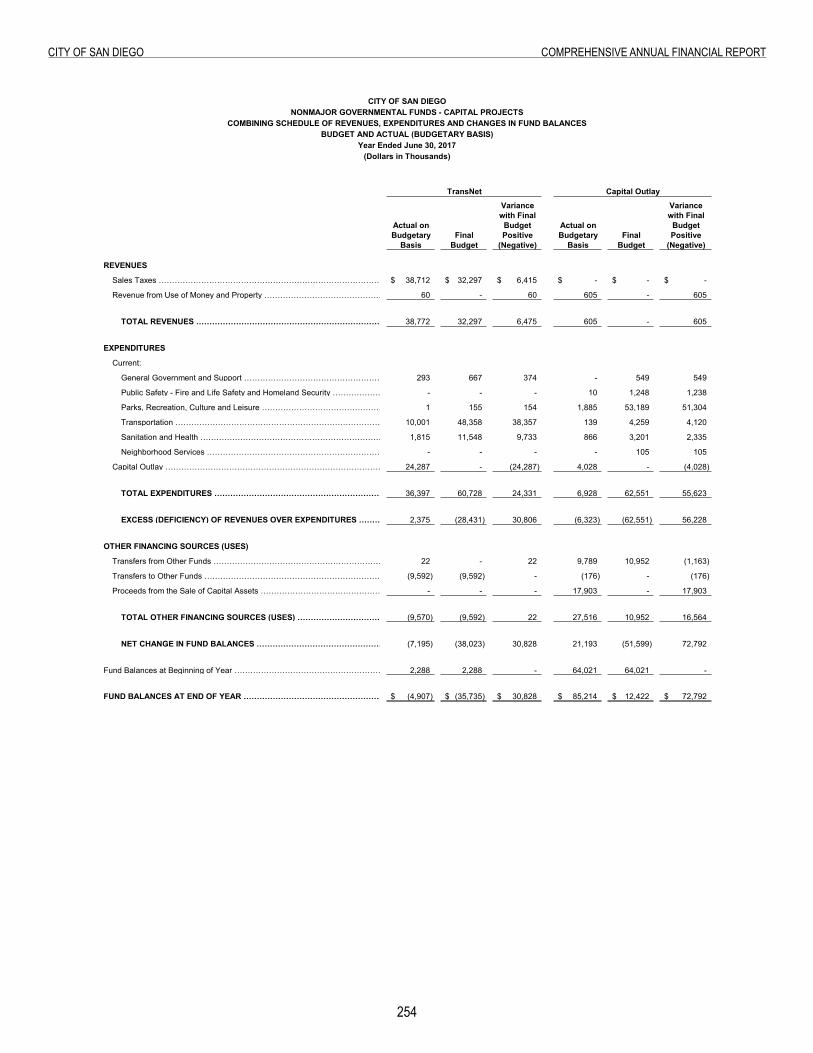
25�
City of San Diego ComprehenSive annual finanCial report
City of San Diego Combining Schedule of Revenues, Expenditures and Changes in Fund Balances - Budget and Actual (Budgetary Basis)
CITY OF SAN DIEGONONMAJOR GOVERNMENTAL FUNDS - CAPITAL PROJECTS
COMBINING SCHEDULE OF REVENUES, EXPENDITURES AND CHANGES IN FUND BALANCESBUDGET AND ACTUAL (BUDGETARY BASIS)
Year Ended June 30, 2017(Dollars in Thousands)
Capital Outlay
Variance Variancewith Final with Final
Actual on Budget Actual on BudgetBudgetary Final Positive Budgetary Final Positive
Basis Budget (Negative) Basis Budget (Negative)
REVENUES
Sales Taxes …………………………………………………………………………………………………………………………………………………………... 38,712$ 32,297$ 6,415$ -$ -$ -$
Revenue from Use of Money and Property …………………………………………………………………………………………………………………………………………………………... 60 - 60 605 - 605 .
TOTAL REVENUES …………………………………………………………………………………………………………………………………………………………... 38,772 32,297 6,475 605 - 605 .
EXPENDITURES .
Current: .
. General Government and Support …………………………………………………………………………………………………………………………………………………………... 293 667 374 - 549 549
. Public Safety - Fire and Life Safety and Homeland Security …………………………………………………………………………………………………………………………………………………………... - - - 10 1,248 1,238
. Parks, Recreation, Culture and Leisure …………………………………………………………………………………………………………………………………………………………... 1 155 154 1,885 53,189 51,304
. Transportation …………………………………………………………………………………………………………………………………………………………... 10,001 48,358 38,357 139 4,259 4,120
. Sanitation and Health …………………………………………………………………………………………………………………………………………………………... 1,815 11,548 9,733 866 3,201 2,335
. Neighborhood Services …………………………………………………………………………………………………………………………………………………………... - - - - 105 105
Capital Outlay …………………………………………………………………………………………………………………………………………………………... 24,287 - (24,287) 4,028 - (4,028) .
TOTAL EXPENDITURES …………………………………………………………………………………………………………………………………………………………... 36,397 60,728 24,331 6,928 62,551 55,623 .
EXCESS (DEFICIENCY) OF REVENUES OVER EXPENDITURES …………………………………………………………………………………………………………………………………………………………... 2,375 (28,431) 30,806 (6,323) (62,551) 56,228 .
OTHER FINANCING SOURCES (USES) .
Transfers from Other Funds …………………………………………………………………………………………………………………………………………………………... 22 - 22 9,789 10,952 (1,163)
Transfers to Other Funds …………………………………………………………………………………………………………………………………………………………... (9,592) (9,592) - (176) - (176)
Proceeds from the Sale of Capital Assets …………………………………………………………………………………………………………………………………………………………... - - - 17,903 - 17,903 .
TOTAL OTHER FINANCING SOURCES (USES) …………………………………………………………………………………………………………………………………………………………... (9,570) (9,592) 22 27,516 10,952 16,564
NET CHANGE IN FUND BALANCES …………………………………………………………………………………………………………………………………………………………... (7,195) (38,023) 30,828 21,193 (51,599) 72,792 .
Fund Balances at Beginning of Year ……………………………………………………………………………………………………………………………………. 2,288 2,288 - . 64,021 64,021 - .
FUND BALANCES AT END OF YEAR ……………………………………………………………………………………………... (4,907)$ (35,735)$ 30,828$ . 85,214$ 12,422$ 72,792$
TransNet
NONMAJOR GOVERNMENTAL FUNDSpermanent
Nonmajor Governmental
NONMAJOR GOVERNMENTAL FUNDS PERMANENT

257
City of San Diego ComprehenSive annual finanCial report
PERMANENT FUNDS
Permanent funds are used to account for and report resources that are restricted to the extent that only earnings, and not principal, may be used for purposes that support the City’s programs (i.e., for the benefit of the City or its citizens).
CARROLL CANYON VERNAL POOL MITIGATION
This fund was established to account for an endowment from the San Diego Unified School District (The District). The endowment is to be used to implement a Memorandum of Understanding between the City and the District for biological mitigation, park land and joint use facilities involving Salk Elementary School, McAuliffe Community Park, and the Carroll Canyon Vernal Pool Preserve.
CEMETERY PERPETUITY
This fund was established to account for the Mt. Hope Cemetery endowment. Investment earnings derived from the endowment supplement grave sales revenues in order to finance cemetery operations.
LIBRARY ENDOWMENTS
This fund includes the Scripps Ranch Library endowment, and the Effie Sergeant and Jane Cameron Estate endowments, which were established to account for donations to benefit the North Park and Rancho Bernardo branch libraries, respectively. Investment earnings are used to finance library services and programs.
LOS PENASQUITOS CANYON
This fund was established to account for the Los Penasquitos Canyon Preserve Trust Fund. Investment earnings are used to finance operations, land acquisitions, historical restoration, and maintenance of the Penasquitos Preserve Park.
OTHER ENDOWMENTS
This fund includes several miscellaneous endowments, including Crescent Heights Habitat Management, Carmel Valley Sewer Maintenance, Figg Estate, Zoological Society-Mission Trails, Sycamore Estates, and the Environmental Trust Bankruptcy Endowment.
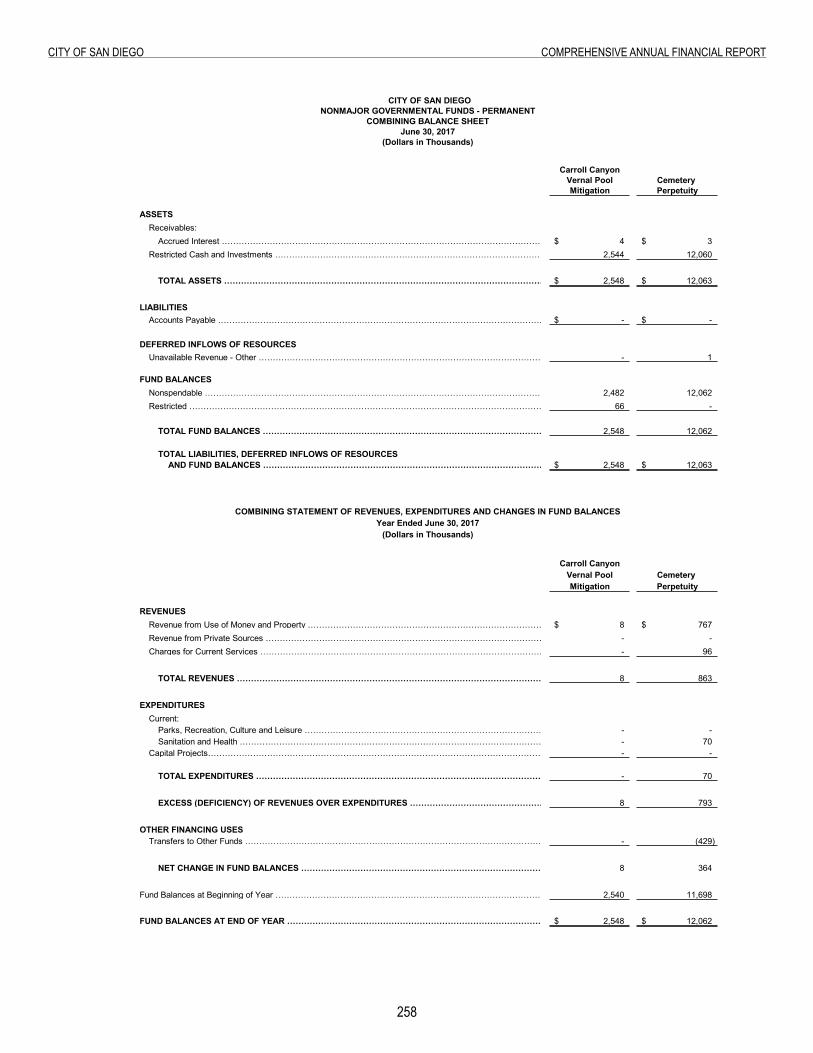
258
City of San Diego ComprehenSive annual finanCial report
Combining Balance Sheet Combining Statement of Revenues, Expenditures
CITY OF SAN DIEGONONMAJOR GOVERNMENTAL FUNDS - PERMANENT
COMBINING BALANCE SHEETJune 30, 2017
(Dollars in Thousands)
Carroll CanyonVernal Pool Cemetery Mitigation Perpetuity
ASSETSReceivables: .
Accrued Interest …………………………………………………………………………………………………………. 4$ 3$ Restricted Cash and Investments ……………………………………………………………………………………………………………………………. 2,544 12,060
.TOTAL ASSETS ………………………………………………………………………………………………………………... 2,548$ 12,063$
LIABILITIES .Accounts Payable ………………………………………………………………………………………………………….. -$ -$
.DEFERRED INFLOWS OF RESOURCES
Unavailable Revenue - Other ……………………………………………………………………………………………………… - 1
FUND BALANCES .Nonspendable ……………………………………………………………………………………………………………………….. 2,482 12,062 Restricted ………………………………………………………………………………………………………………………. 66 -
TOTAL FUND BALANCES ……………………………………………………………………………………………….. 2,548 12,062
TOTAL LIABILITIES, DEFERRED INFLOWS OF RESOURCESAND FUND BALANCES ……………………………………………………………………………………………………… 2,548$ 12,063$
COMBINING STATEMENT OF REVENUES, EXPENDITURES AND CHANGES IN FUND BALANCESYear Ended June 30, 2017
(Dollars in Thousands)
Carroll CanyonVernal Pool Cemetery Mitigation Perpetuity
REVENUESRevenue from Use of Money and Property …………………………………………………………………………………………………………………………………………….. 8$ 767$ Revenue from Private Sources …………………………………………………………………………………………………………………………………………….. - - Charges for Current Services …………………………………………………………………………………………………………………………………………….. - 96
.TOTAL REVENUES …………………………………………………………………………………………………………………………………………….. 8 863
.EXPENDITURES .
Current: .. Parks, Recreation, Culture and Leisure …………………………………………………………………………………………………………………………………………….. - - . Sanitation and Health …………………………………………………………………………………………………………………………………………….. - 70
Capital Projects…………………………………………………………………………………………………………………………………………….. - - .
TOTAL EXPENDITURES …………………………………………………………………………………………………………………………………………….. - 70 .
EXCESS (DEFICIENCY) OF REVENUES OVER EXPENDITURES …………………………………………………………………………………………………………………………………………….. 8 793 .
OTHER FINANCING USES .Transfers to Other Funds …………………………………………………………………………………………………………………………………………….. - (429)
.NET CHANGE IN FUND BALANCES …………………………………………………………………………………………………………………………………………….. 8 364
.Fund Balances at Beginning of Year …………………………………………………………………………………………………………………………………………….. 2,540 11,698
.FUND BALANCES AT END OF YEAR …………………………………………………………………………………………………………………………………………….. 2,548$ 12,062$
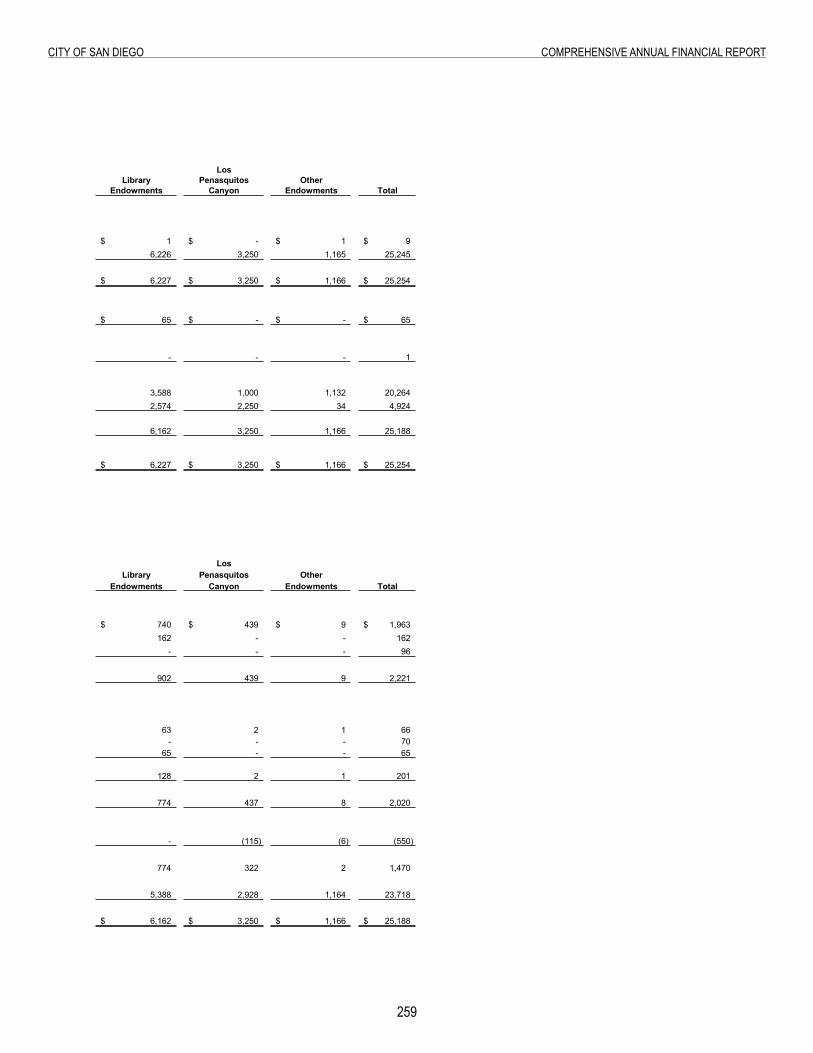
259
City of San Diego ComprehenSive annual finanCial report
LosLibrary Penasquitos Other
Endowments Canyon Endowments Total
1$ -$ 1$ 9$ 6,226 3,250 1,165 25,245
6,227$ 3,250$ 1,166$ 25,254$
65$ -$ -$ 65$
- - - 1
3,588 1,000 1,132 20,264 2,574 2,250 34 4,924
6,162 3,250 1,166 25,188
6,227$ 3,250$ 1,166$ 25,254$
LosLibrary Penasquitos Other
Endowments Canyon Endowments Total
740$ 439$ 9$ 1,963$ 162 - - 162
- - - 96
902 439 9 2,221
63 2 1 66 - - - 70
65 - - 65
128 2 1 201
774 437 8 2,020
- (115) (6) (550)
774 322 2 1,470
5,388 2,928 1,164 23,718
6,162$ 3,250$ 1,166$ 25,188$

this page intentionally left Blank
260
Page Intentionally Left Blank
NONMAJOR BUSINESS-TYPE FUNDSenterpriSe
Nonmajor Business-
NONMAJOR BUSINESS-TYPE FUNDSENTERPRISE

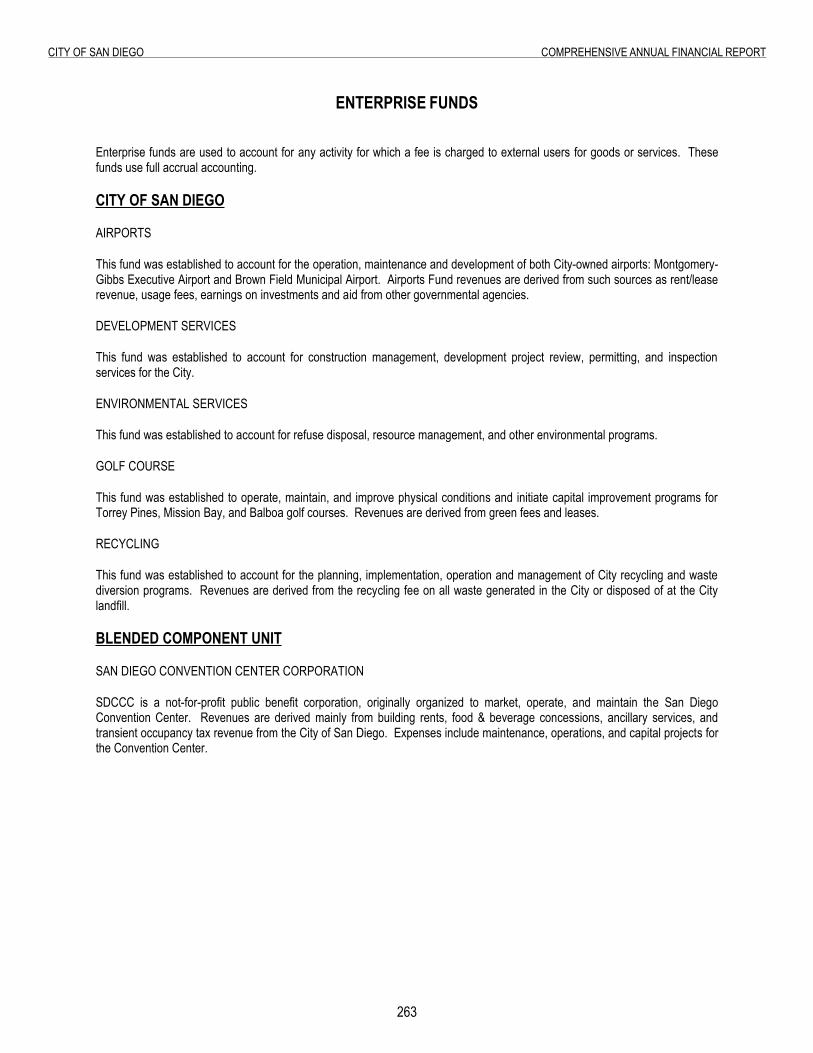
263
City of San Diego ComprehenSive annual finanCial report
ENTERPRISE FUNDS
Enterprise funds are used to account for any activity for which a fee is charged to external users for goods or services. These funds use full accrual accounting.
CITY OF SAN DIEGO
AIRPORTS
This fund was established to account for the operation, maintenance and development of both City-owned airports: Montgomery-Gibbs Executive Airport and Brown Field Municipal Airport. Airports Fund revenues are derived from such sources as rent/lease revenue, usage fees, earnings on investments and aid from other governmental agencies.
DEVELOPMENT SERVICES
This fund was established to account for construction management, development project review, permitting, and inspection services for the City.
ENVIRONMENTAL SERVICES
This fund was established to account for refuse disposal, resource management, and other environmental programs.
GOLF COURSE
This fund was established to operate, maintain, and improve physical conditions and initiate capital improvement programs for Torrey Pines, Mission Bay, and Balboa golf courses. Revenues are derived from green fees and leases.
RECYCLING
This fund was established to account for the planning, implementation, operation and management of City recycling and waste diversion programs. Revenues are derived from the recycling fee on all waste generated in the City or disposed of at the City landfill.
BLENDED COMPONENT UNIT
SAN DIEGO CONVENTION CENTER CORPORATION
SDCCC is a not-for-profit public benefit corporation, originally organized to market, operate, and maintain the San Diego Convention Center. Revenues are derived mainly from building rents, food & beverage concessions, ancillary services, and transient occupancy tax revenue from the City of San Diego. Expenses include maintenance, operations, and capital projects for the Convention Center.
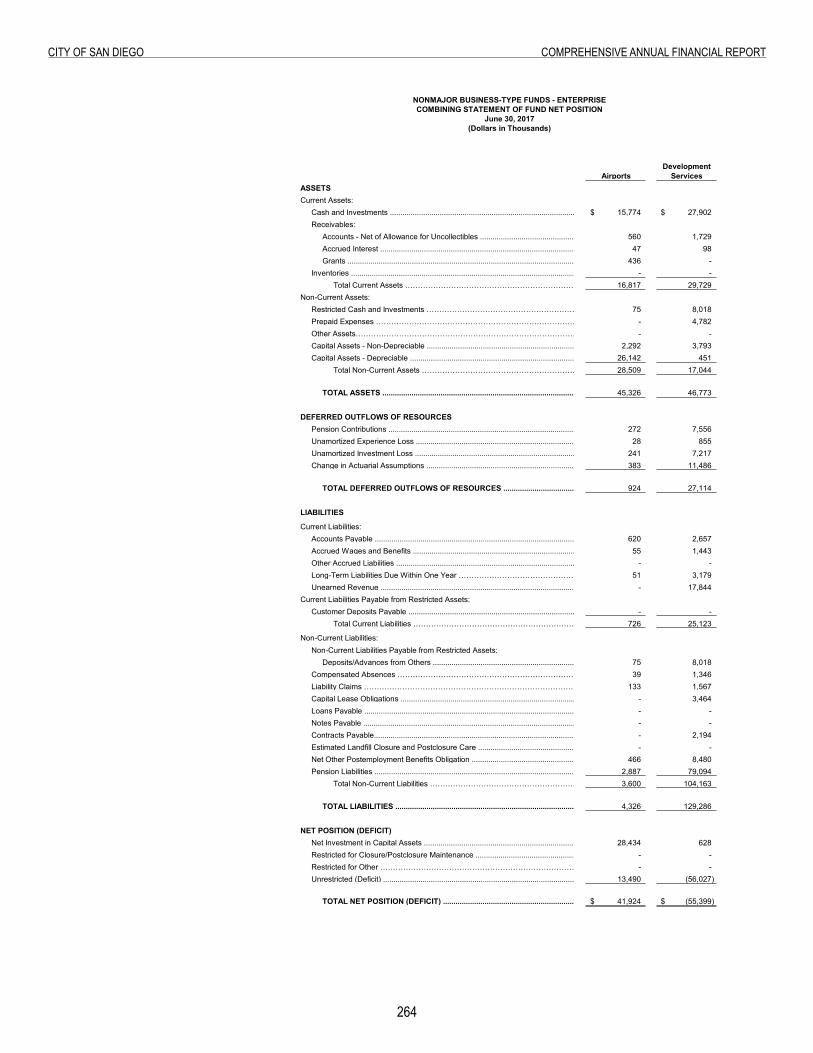
26�
City of San Diego ComprehenSive annual finanCial report
Combining Statement of Fund Net Position
NONMAJOR BUSINESS-TYPE FUNDS - ENTERPRISECOMBINING STATEMENT OF FUND NET POSITION
June 30, 2017(Dollars in Thousands)
Airports Development
Services ASSETSCurrent Assets:
Cash and Investments ................................................................................................................................................................................................... 15,774$ 27,902$ Receivables:
Accounts - Net of Allowance for Uncollectibles .............................................................................................................................................................................................................................. 560 1,729 Accrued Interest ............................................................................................................................................................................................................................... 47 98 Grants ......................................................................................................................................................................................................................................... 436 -
Inventories ....................................................................................................................................................................................................................................- - Total Current Assets ……………………………………………………………………………………………………………………. 16,817 29,729
Non-Current Assets: Restricted Cash and Investments …………………………………………………………………………………………………………………………………………………………. 75 8,018 Prepaid Expenses ……………………………………………………………………………………………… - 4,782 Other Assets………………………………………………………………………………….. - - Capital Assets - Non-Depreciable ............................................................................................................................................................................................................................... 2,292 3,793 Capital Assets - Depreciable ............................................................................................................................................................................................................................... 26,142 451
Total Non-Current Assets …………………………………………………………………………………………………………………….28,509 17,044
TOTAL ASSETS ................................................................................................................................................................................................................................... 45,326 46,773
DEFERRED OUTFLOWS OF RESOURCESPension Contributions ....................................................................................................................272 7,556Unamortized Experience Loss ................................................................................................................................................................................................................28 855Unamortized Investment Loss ...............................................................................................................................................................................................................241 7,217Change in Actuarial Assumptions ...............................................................................................................................................................................................................383 11,486
TOTAL DEFERRED OUTFLOWS OF RESOURCES ..............................................................................................................................................................................................................................924 27,114
LIABILITIES
Current Liabilities:Accounts Payable ............................................................................................................................................................................................................................... 620 2,657 Accrued Wages and Benefits ..................................................................................................................................................................................................................... 55 1,443 Other Accrued Liabilities ........................................................................................................................…………………………………………………………………………………………………. - - Long-Term Liabilities Due Within One Year ………………………………………………………………………………………………………………………………………………………. 51 3,179 Unearned Revenue ............................................................................................................................................................................................................................... - 17,844
Current Liabilities Payable from Restricted Assets: Customer Deposits Payable .................................................................................................................................................................................................................. - -
Total Current Liabilities …………………………………………………………………………………………………………………….726 25,123
Non-Current Liabilities:Non-Current Liabilities Payable from Restricted Assets:
Deposits/Advances from Others .................................................................................................................................................................................................................. 75 8,018 Compensated Absences …………………………………………………………………………………………………………………………………………………………………. 39 1,346 Liability Claims ……………………………………………………………………………………………………………………………………….. 133 1,567 Capital Lease Obligations ..................................................................................................................................................................................................................................... - 3,464 Loans Payable ....................................................................................................................................................................................................................- - Notes Payable ....................................................................................................................................................................................................................- - Contracts Payable................................................................................................................................................................................................................................... - 2,194 Estimated Landfill Closure and Postclosure Care ................................................................................................................................................................................................. - - Net Other Postemployment Benefits Obligation ........................................................................................................ 466 8,480 Pension Liabilities .......................................................................................................................................................................................................................................2,887 79,094
Total Non-Current Liabilities …………………………………………………………………………………………………………………….3,600 104,163
TOTAL LIABILITIES .............................................................................................................................................................................................................................. 4,326 129,286
NET POSITION (DEFICIT)Net Investment in Capital Assets ............................................................................................................................................................................................................................ 28,434 628 Restricted for Closure/Postclosure Maintenance ............................................................................................................................................................................................................................ - - Restricted for Other …………………………………………………………………………………… - - Unrestricted (Deficit) ............................................................................................................................................................................................................................ 13,490 (56,027)
TOTAL NET POSITION (DEFICIT) .............................................................................................................................................................................................................................. 41,924$ (55,399)$
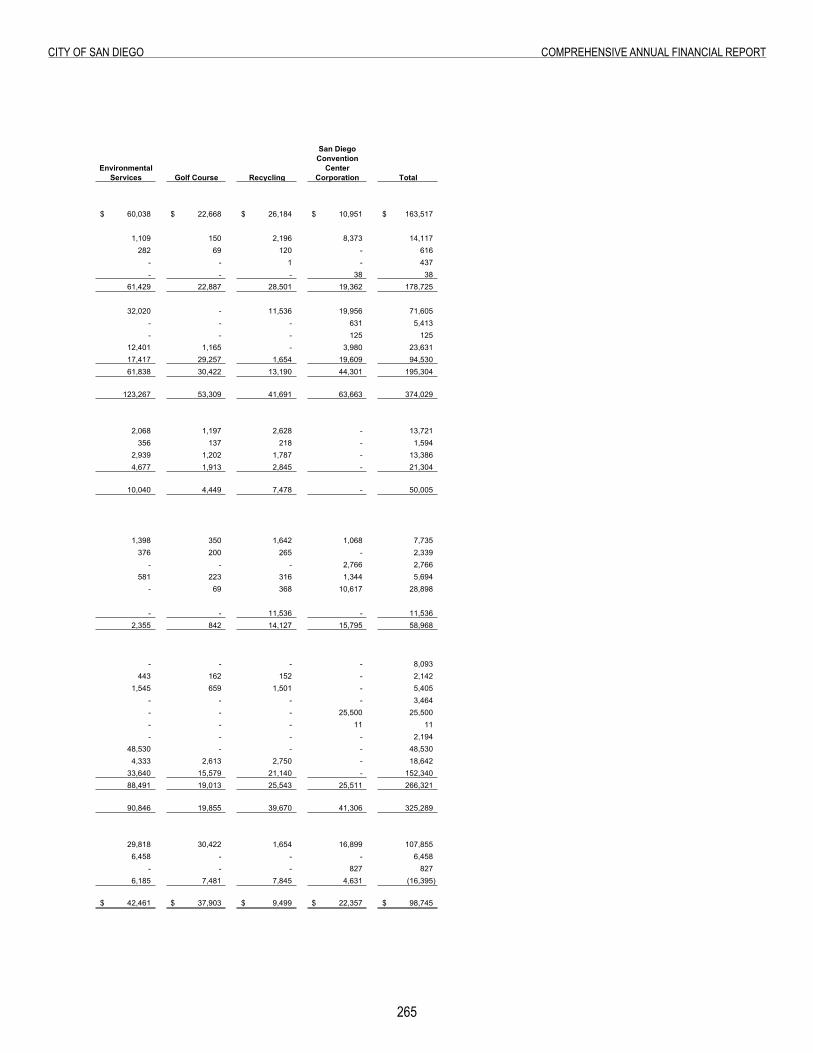
265
City of San Diego ComprehenSive annual finanCial report
Environmental Services Golf Course Recycling Total
60,038$ 22,668$ 26,184$ 10,951$ 163,517$
1,109 150 2,196 8,373 14,117 282 69 120 - 616
- - 1 - 437 - - - 38 38
61,429 22,887 28,501 19,362 178,725
32,020 - 11,536 19,956 71,605 - - - 631 5,413 - - - 125 125
12,401 1,165 - 3,980 23,631 17,417 29,257 1,654 19,609 94,530 61,838 30,422 13,190 44,301 195,304
123,267 53,309 41,691 63,663 374,029
2,068 1,197 2,628 - 13,721 356 137 218 - 1,594
2,939 1,202 1,787 - 13,386 4,677 1,913 2,845 - 21,304
10,040 4,449 7,478 - 50,005
1,398 350 1,642 1,068 7,735 376 200 265 - 2,339
- - - 2,766 2,766 581 223 316 1,344 5,694
- 69 368 10,617 28,898
- - 11,536 - 11,536 2,355 842 14,127 15,795 58,968
- - - - 8,093 443 162 152 - 2,142
1,545 659 1,501 - 5,405 - - - - 3,464 - - - 25,500 25,500 - - - 11 11 - - - - 2,194
48,530 - - - 48,530 4,333 2,613 2,750 - 18,642
33,640 15,579 21,140 - 152,340 88,491 19,013 25,543 25,511 266,321
90,846 19,855 39,670 41,306 325,289
29,818 30,422 1,654 16,899 107,855 6,458 - - - 6,458
- - - 827 827 6,185 7,481 7,845 4,631 (16,395)
42,461$ 37,903$ 9,499$ 22,357$ 98,745$
San Diego Convention
Center Corporation
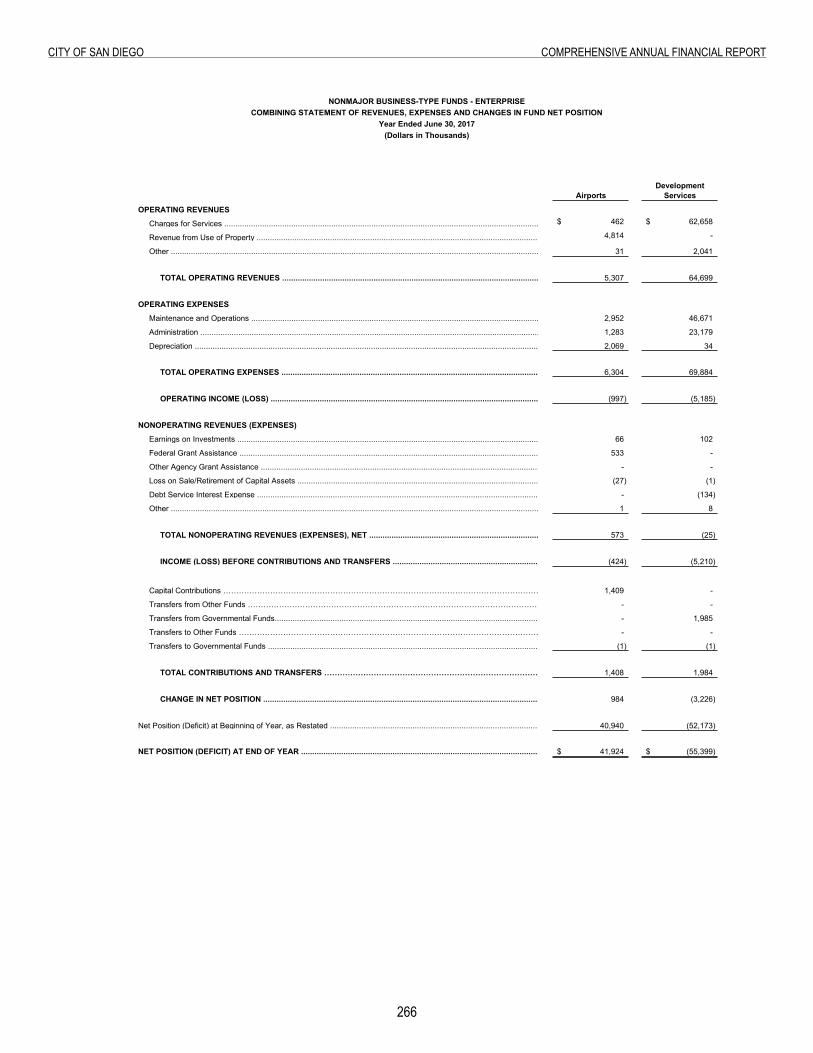
266
City of San Diego ComprehenSive annual finanCial report
Combining Statement of Revenues, Expenses and Changes in Fund Net Position
NONMAJOR BUSINESS-TYPE FUNDS - ENTERPRISECOMBINING STATEMENT OF REVENUES, EXPENSES AND CHANGES IN FUND NET POSITION
Year Ended June 30, 2017(Dollars in Thousands)
Airports Development
Services
OPERATING REVENUES
Charges for Services ........................................................................................................................................................................................................................……… 462$ 62,658$
Revenue from Use of Property ........................................................................................................................................................................................................................……… 4,814 -
Other .........................................................................................................................................................................................................................................…………………… 31 2,041
TOTAL OPERATING REVENUES .......................................................................................................................................................................................................................5,307 64,699
OPERATING EXPENSES
Maintenance and Operations .........................................................................................................................................................................................................................2,952 46,671
Administration ...............................................................................................................................................................................................................................…………………………………..1,283 23,179
Depreciation ................................................................................................................................................................................................................…………………………….2,069 34
TOTAL OPERATING EXPENSES .......................................................................................................................................................................................................................6,304 69,884
OPERATING INCOME (LOSS) ........................................................................................................................................................................................................................(997) (5,185)
NONOPERATING REVENUES (EXPENSES)
Earnings on Investments .........................................................................................................................................................................................................................66 102
Federal Grant Assistance .......................................................................................................................................................................................................................533 -
Other Agency Grant Assistance ....................................................................................................................................................................................................................... - -
Loss on Sale/Retirement of Capital Assets ................................................................................................................................…………………………………(27) (1)
Debt Service Interest Expense .........................................................................................................................................................................................................................- (134)
Other ......................................................................................................................................................................................................................…………………………………….1 8
TOTAL NONOPERATING REVENUES (EXPENSES), NET .........................................................................................................................................................................................................573 (25)
INCOME (LOSS) BEFORE CONTRIBUTIONS AND TRANSFERS .........................................................................................................................................................................................................(424) (5,210)
Capital Contributions …………………………………………………………………………………………………………………………………………………………………………………………………………………………1,409 -
Transfers from Other Funds ………………………………………………………………………………………………………………………………………………………………………………………………………………………… - -
Transfers from Governmental Funds..........................................................................................................................................................................................................................- 1,985
Transfers to Other Funds ………………………………………………………………………………………………………………………………………………………………………………………………………………..- -
Transfers to Governmental Funds .............................................................................................................................................................................................................…….(1) (1)
TOTAL CONTRIBUTIONS AND TRANSFERS …………………………………………………………………………………………………………………………………………………. 1,408 1,984
CHANGE IN NET POSITION ..............................................................................................................................................................................................................................984 (3,226)
Net Position (Deficit) at Beginning of Year, as Restated .........................................................................................................................................................................................…………………..40,940 (52,173)
NET POSITION (DEFICIT) AT END OF YEAR ...............................................................................................................................................................................................................41,924$ (55,399)$
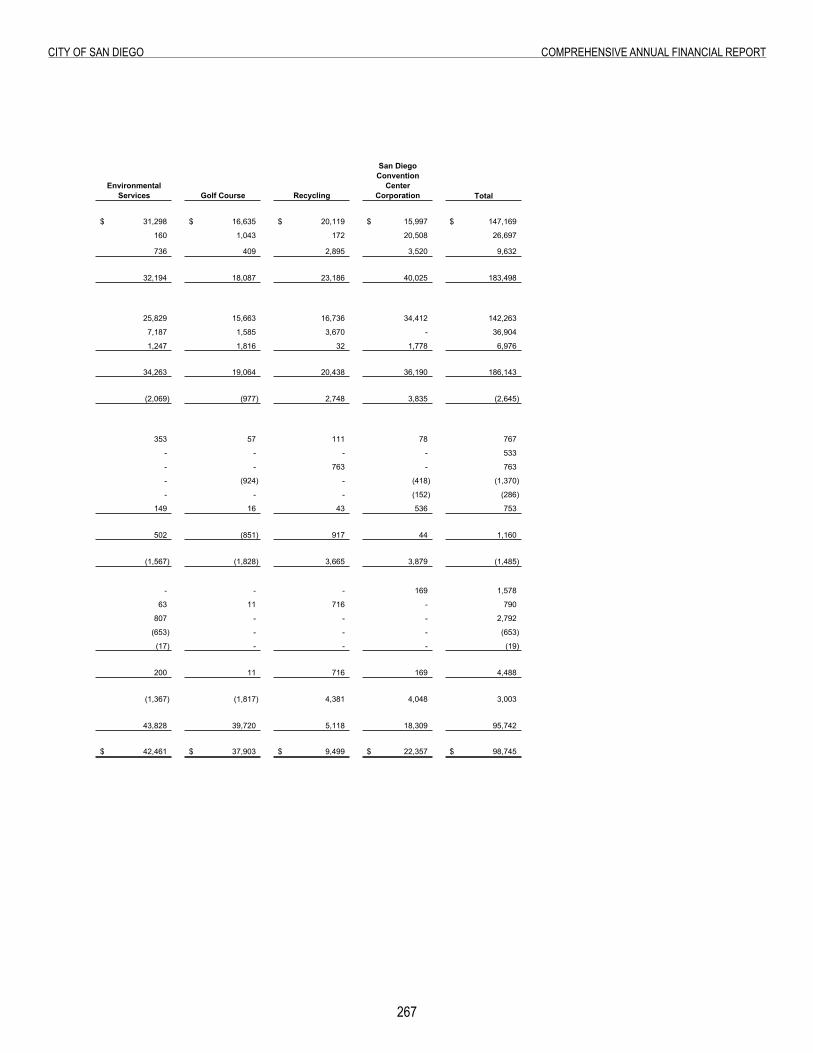
267
City of San Diego ComprehenSive annual finanCial report
Environmental Services Golf Course Recycling
San Diego Convention
Center Corporation Total
31,298$ 16,635$ 20,119$ 15,997$ 147,169$
160 1,043 172 20,508 26,697
736 409 2,895 3,520 9,632
32,194 18,087 23,186 40,025 183,498
25,829 15,663 16,736 34,412 142,263
7,187 1,585 3,670 - 36,904
1,247 1,816 32 1,778 6,976
34,263 19,064 20,438 36,190 186,143
(2,069) (977) 2,748 3,835 (2,645)
353 57 111 78 767
- - - - 533
- - 763 - 763
- (924) - (418) (1,370)
- - - (152) (286)
149 16 43 536 753
502 (851) 917 44 1,160
(1,567) (1,828) 3,665 3,879 (1,485)
- - - 169 1,578
63 11 716 - 790
807 - - - 2,792
(653) - - - (653)
(17) - - - (19)
200 11 716 169 4,488
(1,367) (1,817) 4,381 4,048 3,003
43,828 39,720 5,118 18,309 95,742
42,461$ 37,903$ 9,499$ 22,357$ 98,745$
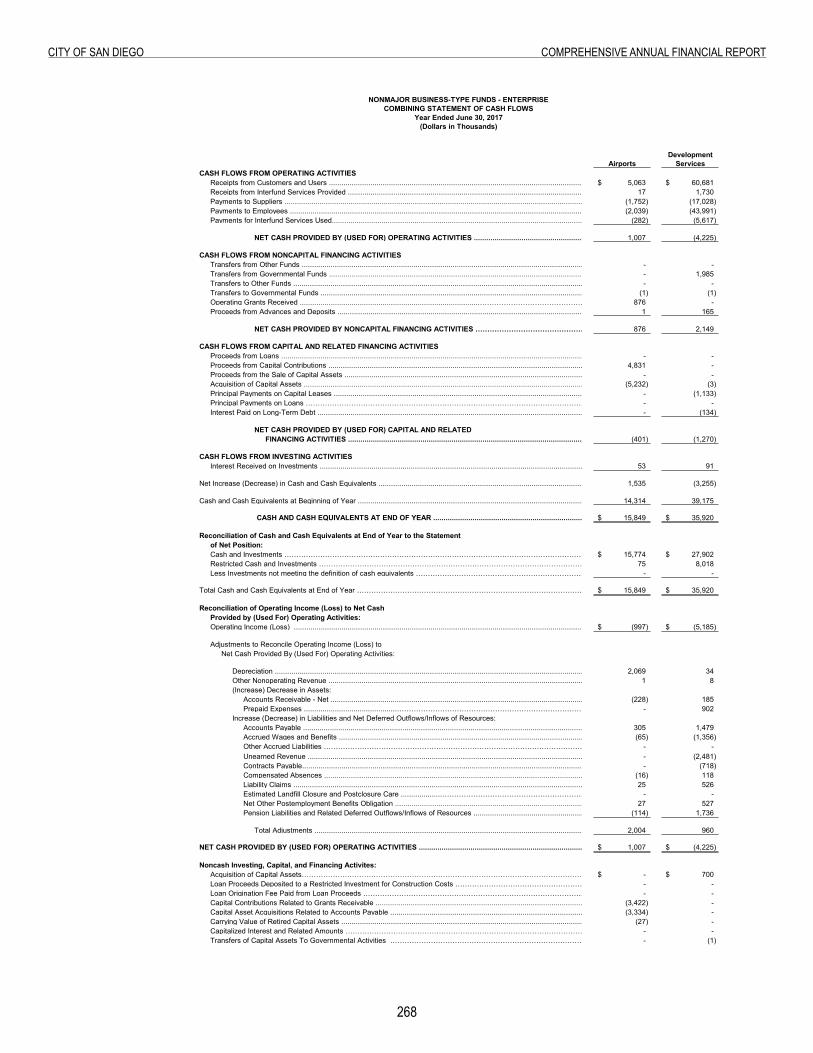
268
City of San Diego ComprehenSive annual finanCial report
Combining Statement of Cash Flows
NONMAJOR BUSINESS-TYPE FUNDS - ENTERPRISECOMBINING STATEMENT OF CASH FLOWS
Year Ended June 30, 2017(Dollars in Thousands)
Airports Development
Services CASH FLOWS FROM OPERATING ACTIVITIES
Receipts from Customers and Users ......................................................................................................................................................................................................................... 5,063$ 60,681$ Receipts from Interfund Services Provided ......................................................................................................................................................................................................................... 17 1,730 Payments to Suppliers ......................................................................................................................................................................................................................... (1,752) (17,028) Payments to Employees ......................................................................................................................................................................................................................... (2,039) (43,991) Payments for Interfund Services Used......................................................................................................................................................................................................................... (282) (5,617)
NET CASH PROVIDED BY (USED FOR) OPERATING ACTIVITIES ...........................................................................................................................................................................................1,007 (4,225)
CASH FLOWS FROM NONCAPITAL FINANCING ACTIVITIESTransfers from Other Funds .................................................................................................................................................................................................................................- - Transfers from Governmental Funds ..............................................................................................................................................................................................................- 1,985 Transfers to Other Funds .....................................................................................................................................................................................................................………….- - Transfers to Governmental Funds ................................................................................................................................................................................................................(1) (1) Operating Grants Received .......................................................................................………………………………………………………………………………………………..876 - Proceeds from Advances and Deposits .....................................................................................................................………………………………………………. 1 165
NET CASH PROVIDED BY NONCAPITAL FINANCING ACTIVITIES ………………………………………………………………………………………..876 2,149
CASH FLOWS FROM CAPITAL AND RELATED FINANCING ACTIVITIESProceeds from Loans .................................................................................................................................................................................................................... - - Proceeds from Capital Contributions .................................................................................................................................................................................................................... 4,831 - Proceeds from the Sale of Capital Assets ......................................................................................................................................................................................................... - - Acquisition of Capital Assets ....................................................................................................................................................................................................................(5,232) (3) Principal Payments on Capital Leases ..............................................................................................................................................................................…- (1,133) Principal Payments on Loans …………………………………………………………………………………………………………………………………………….. - - Interest Paid on Long-Term Debt .........................................................................................................................................................................................................- (134)
NET CASH PROVIDED BY (USED FOR) CAPITAL AND RELATEDFINANCING ACTIVITIES ..................................................................................................................................................................... (401) (1,270)
CASH FLOWS FROM INVESTING ACTIVITIESInterest Received on Investments .................................................................................................................................................................................................53 91
Net Increase (Decrease) in Cash and Cash Equivalents .......................................................................................................................................................................................... 1,535 (3,255)
Cash and Cash Equivalents at Beginning of Year ................................................................................................................................................................................................14,314 39,175
CASH AND CASH EQUIVALENTS AT END OF YEAR ......................................................................................................................................................................................................15,849$ 35,920$
Reconciliation of Cash and Cash Equivalents at End of Year to the Statementof Net Position:Cash and Investments ……………………………………………………………………………………………………………………………………………………………………………………….. 15,774$ 27,902$ Restricted Cash and Investments ………………………………………………………………………………………………………………………………………………………….. 75 8,018 Less Investments not meeting the definition of cash equivalents ………………………………………………………………………………………………………………………………………………………….. - -
Total Cash and Cash Equivalents at End of Year ……………………………………………………………………………………………………………………………………………………………………………………….. 15,849$ 35,920$
Reconciliation of Operating Income (Loss) to Net Cash Provided by (Used For) Operating Activities:Operating Income (Loss) ........................................................................................................................................................................................................................(997)$ (5,185)$
Adjustments to Reconcile Operating Income (Loss) toNet Cash Provided By (Used For) Operating Activities:
Depreciation ...............................................................................................................................................................................................................………….2,069 34 Other Nonoperating Revenue ..........................................................................................................................................................................................................1 8 (Increase) Decrease in Assets:
Accounts Receivable - Net ................................................................................................................................................................................................................................... (228) 185 Prepaid Expenses .............................................……………………………………………………………………………………………………………..………- 902
Increase (Decrease) in Liabilities and Net Deferred Outflows/Inflows of Resources:Accounts Payable .......................................................................................................................................................................................................305 1,479 Accrued Wages and Benefits ..............................................................................................................................................................................................(65) (1,356) Other Accrued Liabilities …………………………………………………………………………………………………………………………………………………………… - - Unearned Revenue ....................................................................................................................................................................................................- (2,481) Contracts Payable....................................................................................................................................................................................................- (718) Compensated Absences ........................................................................................................................................................................................................ (16) 118 Liability Claims ........................................................................................................................................................................................................25 526 Estimated Landfill Closure and Postclosure Care ....................……………………………………………………………………………- - Net Other Postemployment Benefits Obligation ........................................................................................................ 27 527 Pension Liabilities and Related Deferred Outflows/Inflows of Resources ........................................................................................................................................................................................................(114) 1,736
Total Adjustments ........................................................................................................................................................................................................ 2,004 960
NET CASH PROVIDED BY (USED FOR) OPERATING ACTIVITIES .......................................................................................................................................................................................................... 1,007$ (4,225)$
Noncash Investing, Capital, and Financing Activites: Acquisition of Capital Assets……………………………………………………………………………………………………………………………………-$ 700$ Loan Proceeds Deposited to a Restricted Investment for Construction Costs ……………………………………………………………………………………………………….. - - Loan Origination Fee Paid from Loan Proceeds ………………………………………………………………………………………………………………………… - - Capital Contributions Related to Grants Receivable ......................................................................................................................................................................................................................(3,422) - Capital Asset Acquisitions Related to Accounts Payable ...................................................................................................................................................................................................................... (3,334) - Carrying Value of Retired Capital Assets .................................................................................................................................................................................................................. (27) - Capitalized Interest and Related Amounts ……………………………………………………………………………………………………………………………………… - - Transfers of Capital Assets To Governmental Activities ………………………………………………………………………………………………………………………………………………………………………………. - (1)
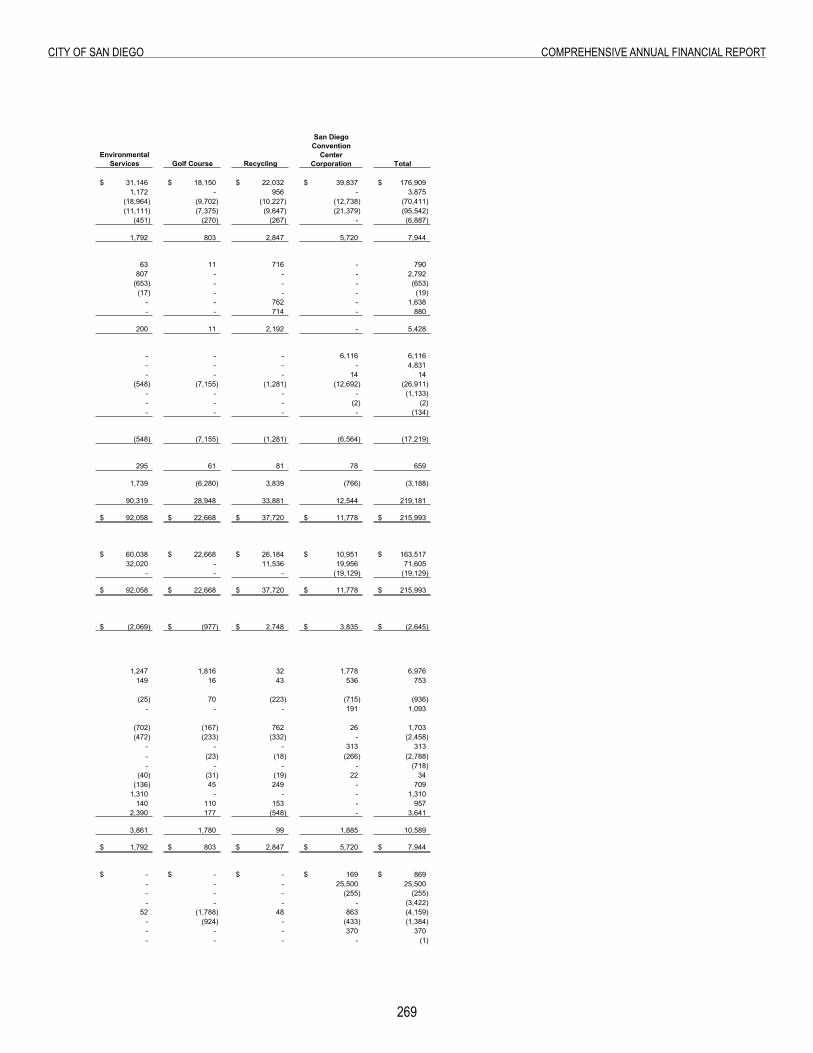
269
City of San Diego ComprehenSive annual finanCial report
Environmental Services Golf Course Recycling Total
31,146$ 18,150$ 22,032$ 39,837$ 176,909$ 1,172 - 956 - 3,875
(18,964) (9,702) (10,227) (12,738) (70,411) (11,111) (7,375) (9,647) (21,379) (95,542)
(451) (270) (267) - (6,887)
1,792 803 2,847 5,720 7,944
63 11 716 - 790 807 - - - 2,792
(653) - - - (653) (17) - - - (19)
- - 762 - 1,638 - - 714 - 880
200 11 2,192 - 5,428
- - - 6,116 6,116 - - - - 4,831 - - - 14 14
(548) (7,155) (1,281) (12,692) (26,911) - - - - (1,133) - - - (2) (2) - - - - (134)
(548) (7,155) (1,281) (6,564) (17,219)
295 61 81 78 659
1,739 (6,280) 3,839 (766) (3,188)
90,319 28,948 33,881 12,544 219,181
92,058$ 22,668$ 37,720$ 11,778$ 215,993$
60,038$ 22,668$ 26,184$ 10,951$ 163,517$ 32,020 - 11,536 19,956 71,605
- - - (19,129) (19,129)
92,058$ 22,668$ 37,720$ 11,778$ 215,993$
(2,069)$ (977)$ 2,748$ 3,835$ (2,645)$
1,247 1,816 32 1,778 6,976 149 16 43 536 753
(25) 70 (223) (715) (936) - - - 191 1,093
(702) (167) 762 26 1,703 (472) (233) (332) - (2,458)
- - - 313 313 - (23) (18) (266) (2,788) - - - - (718)
(40) (31) (19) 22 34 (136) 45 249 - 709
1,310 - - - 1,310 140 110 153 - 957
2,390 177 (548) - 3,641
3,861 1,780 99 1,885 10,589
1,792$ 803$ 2,847$ 5,720$ 7,944$
-$ -$ -$ 169$ 869$ - - - 25,500 25,500 - - - (255) (255) - - - - (3,422)
52 (1,788) 48 863 (4,159) - (924) - (433) (1,384) - - - 370 370 - - - - (1)
San Diego Convention
Center Corporation

this page intentionally left Blank
270
Page Intentionally Left Blank
internal ServiCe funDS
Internal Service Funds:
INTERNAL SERVICE FUNDS

273
City of San Diego ComprehenSive annual finanCial report
INTERNAL SERVICE FUNDS
Internal service funds are used to account for the financing of goods or services provided by one department or agency to other departments or agencies of the City, or to other governmental units and/or funds.
CITY OF SAN DIEGO
FLEET OPERATIONS
This fund was established to account for the acquisition, replacement, maintenance and fueling of the City's motive equipment.
CENTRAL STORES
This fund was established to provide centralized storeroom services to all City departments.
PUBLISHING SERVICES
This fund was established to provide printing and reproduction services to all City departments.
MISCELLANEOUS INTERNAL SERVICE
This fund accounts for various administrative activities including risk management administration, energy conservation, and administration and operation of various employee related programs such as unused compensatory time, unused sick leave, unemployment insurance, and long-term disability. Revenues are derived from rates or fees charged to the departments for specific services rendered.
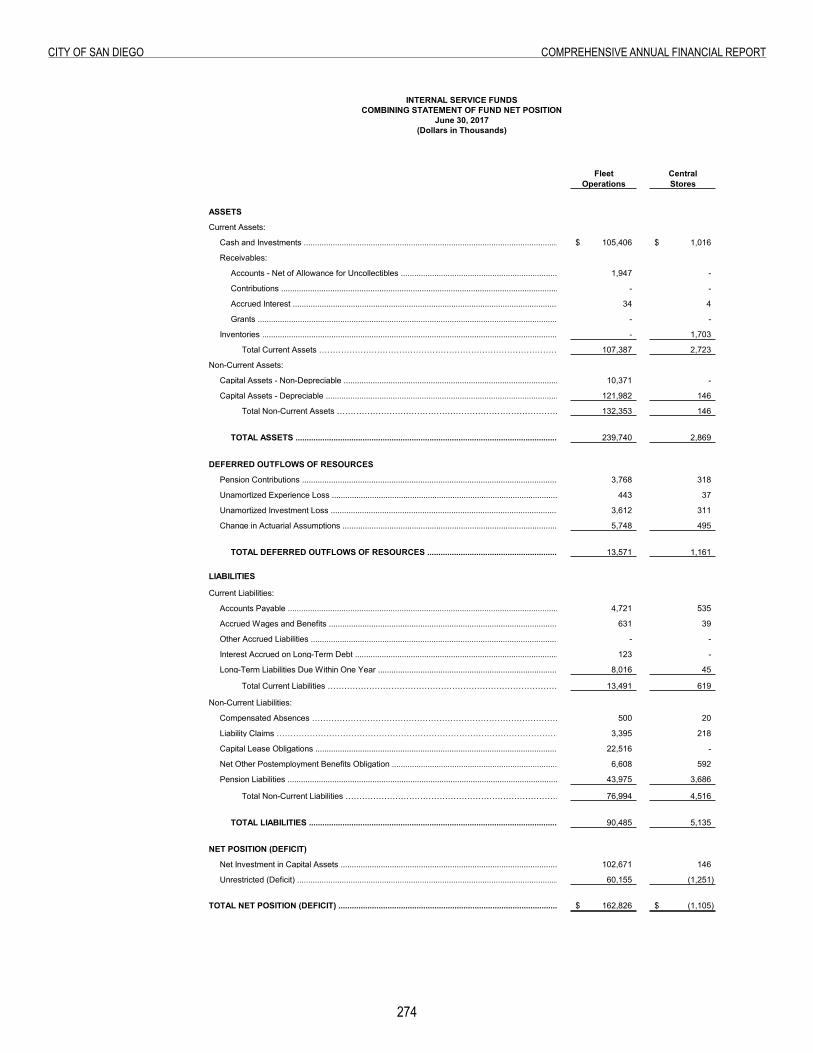
27�
City of San Diego ComprehenSive annual finanCial report
Combining Statement of Fund Net Position
Fleet Operations
Central Stores
ASSETS
Current Assets:
Cash and Investments ...........................................................................................................................................................................................................105,406$ 1,016$
Receivables:
Accounts - Net of Allowance for Uncollectibles ..................................................................................................................................................................................................................................1,947 -
Contributions ...............................................................................................................................................................................................................................- -
Accrued Interest ...............................................................................................................................................................................................................................34 4
Grants ....................................................................................................................................................... - -
Inventories ....................................................................................................................................................................................................................................- 1,703
Total Current Assets ……………………………………………………………………………………………………………………………………………………………………………………107,387 2,723
Non-Current Assets:
Capital Assets - Non-Depreciable .....................................................................................................................................................................………………………………….. 10,371 -
Capital Assets - Depreciable .....................................................................................................................................................................…………………………………..121,982 146
Total Non-Current Assets ……………………………………………………………………………………………………………………………………………………………………132,353 146
TOTAL ASSETS ...................................................................................................................................................................................................................................239,740 2,869
DEFERRED OUTFLOWS OF RESOURCES
Pension Contributions ........................................................................................................................... 3,768 318
Unamortized Experience Loss ................................................................................................................................................................................................................443 37
Unamortized Investment Loss ...............................................................................................................................................................................................................3,612 311
Change in Actuarial Assumptions ...............................................................................................................................................................................................................5,748 495
TOTAL DEFERRED OUTFLOWS OF RESOURCES ..............................................................................................................................................................................................................................13,571 1,161
LIABILITIES
Current Liabilities:
Accounts Payable ...............................................................................................................................................................................................................................4,721 535
Accrued Wages and Benefits .....................................................................................................................................................................................................................631 39
Other Accrued Liabilities ........................................................................................................................………………………………………………………………………………………………….- -
Interest Accrued on Long-Term Debt ........................................................................................................................................................................................................123 -
Long-Term Liabilities Due Within One Year ...................................................................................................................................................................................................... 8,016 45
Total Current Liabilities ………………………………………………………………………………………………………………………………………………………….13,491 619
Non-Current Liabilities:
Compensated Absences …………………………………………………………………………………………………………………………………………………………………. 500 20
Liability Claims ……………………………………………………………………………………………………………………………………………………………………………… 3,395 218
Capital Lease Obligations ....................................................................................................................................................................................................................................... 22,516 -
Net Other Postemployment Benefits Obligation ......................................................................................................................................................................... 6,608 592
Pension Liabilities .......................................................................................................................................................................................................................................43,975 3,686
Total Non-Current Liabilities ………………………………………………………………………………………………………………………………………………………………………………………………..76,994 4,516
TOTAL LIABILITIES ..............................................................................................................................................................................................................................90,485 5,135
NET POSITION (DEFICIT)
Net Investment in Capital Assets ....................................................................................................................................................................................................................102,671 146
Unrestricted (Deficit) .........................................................................................................................................................................................................................................................…60,155 (1,251)
TOTAL NET POSITION (DEFICIT) ..........................................................................................................................................................................................................................................................................162,826$ (1,105)$
INTERNAL SERVICE FUNDSCOMBINING STATEMENT OF FUND NET POSITION
June 30, 2017(Dollars in Thousands)
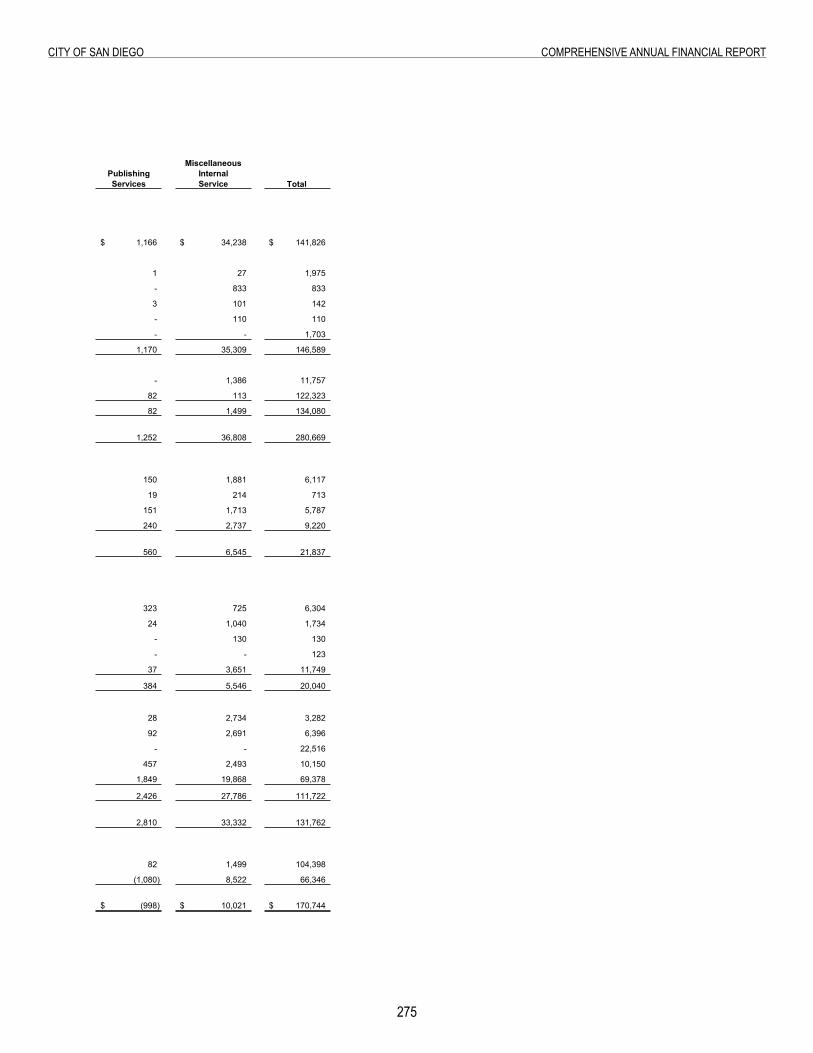
275
City of San Diego ComprehenSive annual finanCial report
Publishing Services
Miscellaneous Internal Service Total
1,166$ 34,238$ 141,826$
1 27 1,975
- 833 833
3 101 142
- 110 110
- - 1,703
1,170 35,309 146,589
- 1,386 11,757
82 113 122,323
82 1,499 134,080
1,252 36,808 280,669
150 1,881 6,117
19 214 713
151 1,713 5,787
240 2,737 9,220
560 6,545 21,837
323 725 6,304
24 1,040 1,734
- 130 130
- - 123
37 3,651 11,749
384 5,546 20,040
28 2,734 3,282
92 2,691 6,396
- - 22,516
457 2,493 10,150
1,849 19,868 69,378
2,426 27,786 111,722
2,810 33,332 131,762
82 1,499 104,398
(1,080) 8,522 66,346
(998)$ 10,021$ 170,744$
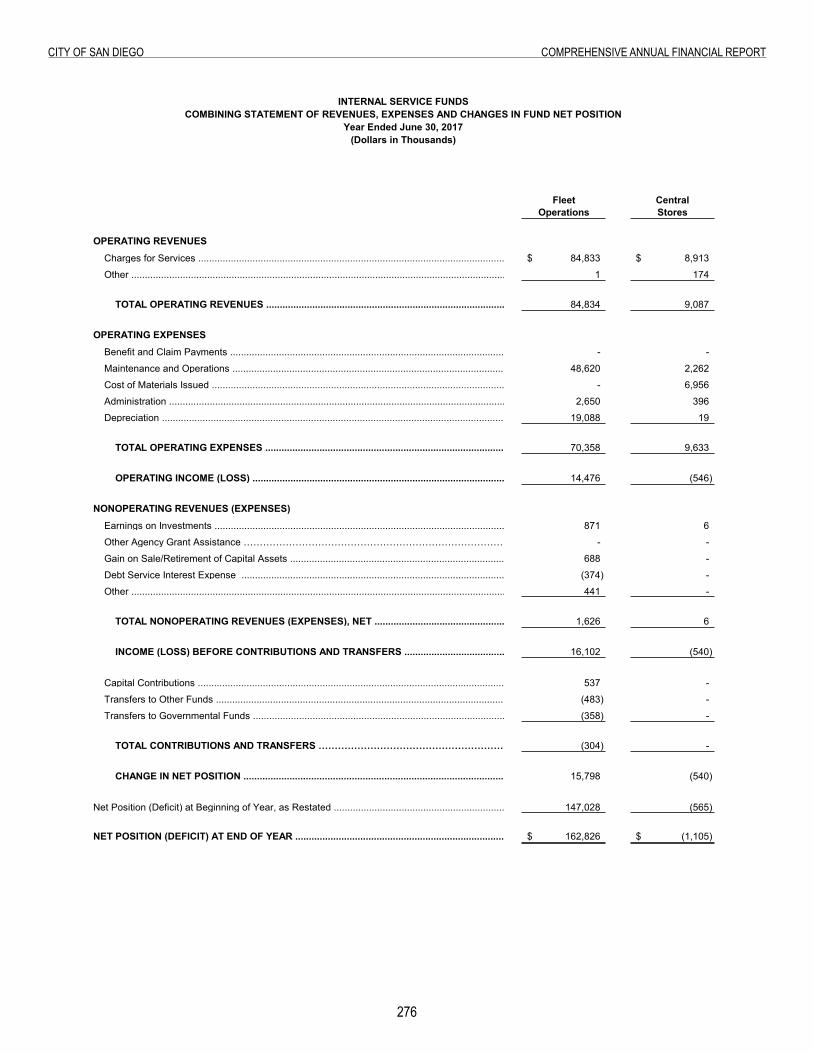
276
City of San Diego ComprehenSive annual finanCial report
Combining Statement of Revenues, Expenses and Changes in Fund Net Position
Fleet Operations
Central Stores
OPERATING REVENUES
Charges for Services ...........................................................................................................................................................................................................................84,833$ 8,913$
Other ..........................................................................................................................................................................................................................................1 174
TOTAL OPERATING REVENUES .......................................................................................................................................................................................................................84,834 9,087
OPERATING EXPENSES
Benefit and Claim Payments .....................................................................................................................................................................................................................- -
Maintenance and Operations .....................................................................................................................................................................................................................48,620 2,262
Cost of Materials Issued .......................................................................................................................................................................................................................- 6,956
Administration .................................................................................................................................................................................................................................2,650 396
Depreciation ..................................................................................................................................................................................................................19,088 19
TOTAL OPERATING EXPENSES .......................................................................................................................................................................................................................70,358 9,633
OPERATING INCOME (LOSS) ........................................................................................................................................................................................................................14,476 (546)
NONOPERATING REVENUES (EXPENSES)
Earnings on Investments ........................................................................................................................................................................................................................871 6
Other Agency Grant Assistance ………………………………………………………………………………………………………………………………………….. - -
Gain on Sale/Retirement of Capital Assets ........................................................................................................................................................................................................688 -
Debt Service Interest Expense ........................................................................................................................................................................................................................(374) -
Other ..................................................................................................................................................................................................................................441 -
TOTAL NONOPERATING REVENUES (EXPENSES), NET .........................................................................................................................................................................................................1,626 6
INCOME (LOSS) BEFORE CONTRIBUTIONS AND TRANSFERS ..............................................................................................................................................................................................................16,102 (540)
Capital Contributions ......................................................................................................................................................................................................... 537 -
Transfers to Other Funds .......................................................................................................................................................................................................................(483) -
Transfers to Governmental Funds ..............................................................................................................................................................................................................(358) -
TOTAL CONTRIBUTIONS AND TRANSFERS ……………………………………………………………………………….. (304) -
CHANGE IN NET POSITION .....................................................................................................................................................................................................................................15,798 (540)
Net Position (Deficit) at Beginning of Year, as Restated .......................................................................................................................................................................................147,028 (565)
NET POSITION (DEFICIT) AT END OF YEAR ..........................................................................................................................................................................................162,826$ (1,105)$
INTERNAL SERVICE FUNDSCOMBINING STATEMENT OF REVENUES, EXPENSES AND CHANGES IN FUND NET POSITION
Year Ended June 30, 2017(Dollars in Thousands)
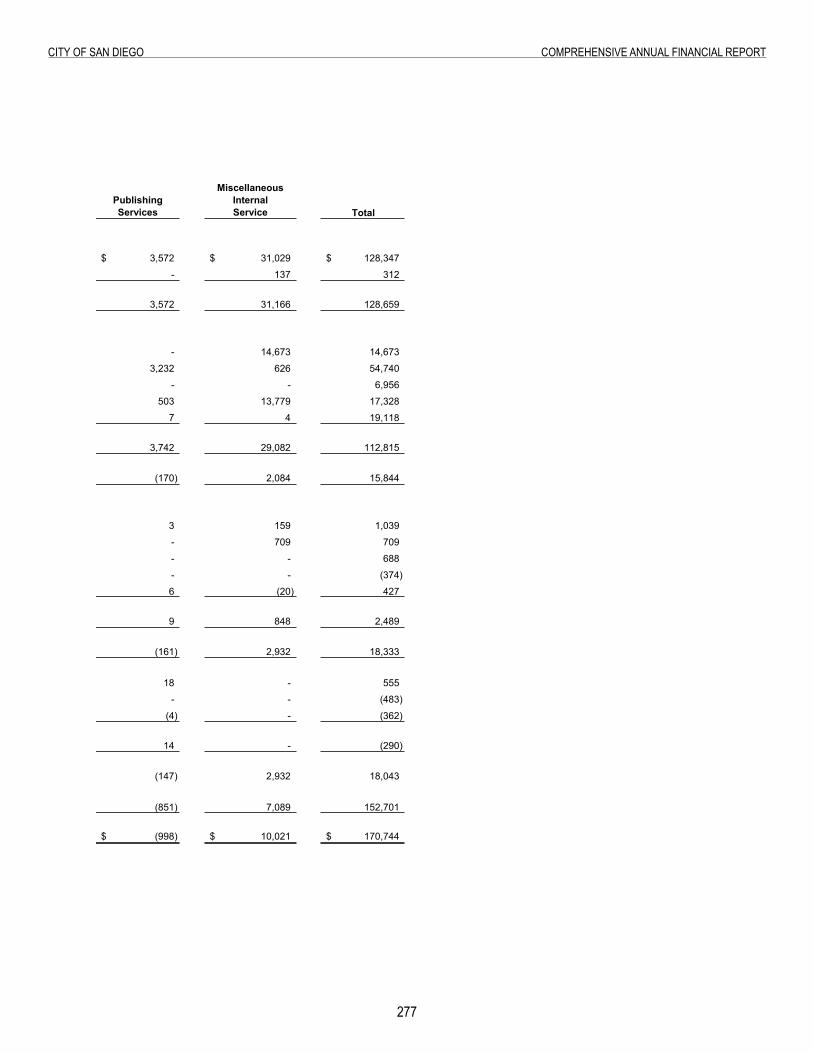
277
City of San Diego ComprehenSive annual finanCial report
Publishing Services
Miscellaneous Internal Service Total
3,572$ 31,029$ 128,347$
- 137 312
3,572 31,166 128,659
- 14,673 14,673
3,232 626 54,740
- - 6,956
503 13,779 17,328
7 4 19,118
3,742 29,082 112,815
(170) 2,084 15,844
3 159 1,039
- 709 709
- - 688
- - (374)
6 (20) 427
9 848 2,489
(161) 2,932 18,333
18 - 555
- - (483)
(4) - (362)
14 - (290)
(147) 2,932 18,043
(851) 7,089 152,701
(998)$ 10,021$ 170,744$
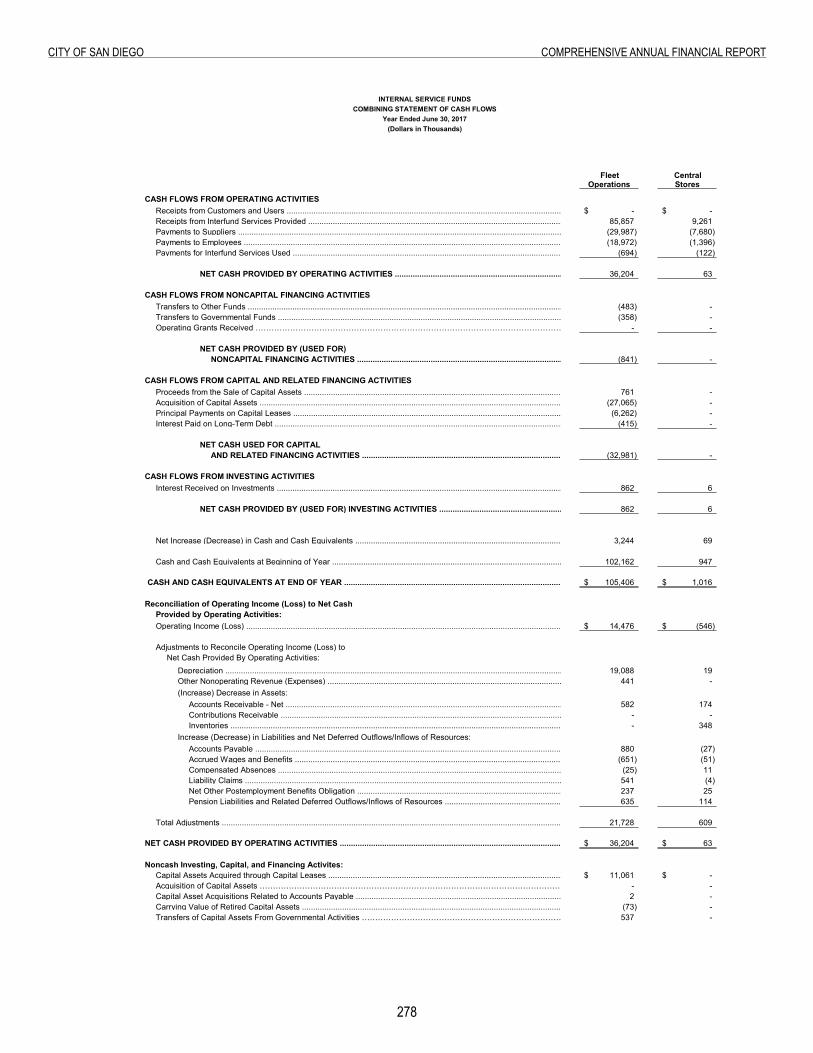
278
City of San Diego ComprehenSive annual finanCial report
Combining Statement of Cash Flows
Fleet CentralOperations Stores
CASH FLOWS FROM OPERATING ACTIVITIESReceipts from Customers and Users ......................................................................................................................................................................................................................... -$ -$ Receipts from Interfund Services Provided ......................................................................................................................................................................................................................... 85,857 9,261 Payments to Suppliers ......................................................................................................................................................................................................................... (29,987) (7,680) Payments to Employees ......................................................................................................................................................................................................................... (18,972) (1,396) Payments for Interfund Services Used ......................................................................................................................................................................................................................... (694) (122)
NET CASH PROVIDED BY OPERATING ACTIVITIES ...........................................................................................................................................................................................36,204 63
CASH FLOWS FROM NONCAPITAL FINANCING ACTIVITIESTransfers to Other Funds ......................................................................................................................................................................................................................... (483) - Transfers to Governmental Funds ..............................................................................................................................................................................................................(358) - Operating Grants Received ……………………………………………………………………………………………………………………………………. - -
NET CASH PROVIDED BY (USED FOR)NONCAPITAL FINANCING ACTIVITIES ................................................................................................................................................................................(841) -
CASH FLOWS FROM CAPITAL AND RELATED FINANCING ACTIVITIESProceeds from the Sale of Capital Assets .........................................................................................................................................................................................................761 - Acquisition of Capital Assets ....................................................................................................................................................................................................................(27,065) - Principal Payments on Capital Leases ..............................................................................................................................................................................................................(6,262) - Interest Paid on Long-Term Debt ...............................................................................................................................................................................................................(415) -
NET CASH USED FOR CAPITALAND RELATED FINANCING ACTIVITIES ........................................................................................................ (32,981) -
CASH FLOWS FROM INVESTING ACTIVITIESInterest Received on Investments .................................................................................................................................................................................................862 6
NET CASH PROVIDED BY (USED FOR) INVESTING ACTIVITIES ...........................................................................................................................................................................................862 6
Net Increase (Decrease) in Cash and Cash Equivalents ..........................................................................................................................................................................................3,244 69
Cash and Cash Equivalents at Beginning of Year ................................................................................................................................................................................................102,162 947
CASH AND CASH EQUIVALENTS AT END OF YEAR ......................................................................................................................................................................................................105,406$ 1,016$
Reconciliation of Operating Income (Loss) to Net Cash Provided by Operating Activities:Operating Income (Loss) ........................................................................................................................................................................................................................14,476$ (546)$
Adjustments to Reconcile Operating Income (Loss) toNet Cash Provided By Operating Activities:
Depreciation ..................................................................................................................................................................................................................19,088 19 Other Nonoperating Revenue (Expenses) ..........................................................................................................................................................................................................441 - (Increase) Decrease in Assets:
Accounts Receivable - Net ................................................................................................................................................................................................................................... 582 174 Contributions Receivable ................................................................................................................................................................................................................................... - - Inventories .............................................................................................................................................................................................................- 348
Increase (Decrease) in Liabilities and Net Deferred Outflows/Inflows of Resources:Accounts Payable .......................................................................................................................................................................................................880 (27) Accrued Wages and Benefits ..............................................................................................................................................................................................(651) (51) Compensated Absences ........................................................................................................................................................................................................ (25) 11 Liability Claims ........................................................................................................................................................................................................541 (4) Net Other Postemployment Benefits Obligation ..................................................................................................................... 237 25 Pension Liabilities and Related Deferred Outflows/Inflows of Resources ........................................................................................................................................................................................................635 114
Total Adjustments ........................................................................................................................................................................................................ 21,728 609
NET CASH PROVIDED BY OPERATING ACTIVITIES .......................................................................................................................................................................................................... 36,204$ 63$
Noncash Investing, Capital, and Financing Activites: Capital Assets Acquired through Capital Leases ..................................................................................................................................................................................................................... 11,061$ -$ Acquisition of Capital Assets …………………………………………………………………………………………………………………………………… - - Capital Asset Acquisitions Related to Accounts Payable ...................................................................................................................................................................................................................... 2 - Carrying Value of Retired Capital Assets ................................................................................................................................................................................................................... (73) - Transfers of Capital Assets From Governmental Activities ……………………………………………………………………………………………………………………………………………….. 537 -
INTERNAL SERVICE FUNDSCOMBINING STATEMENT OF CASH FLOWS
Year Ended June 30, 2017(Dollars in Thousands)
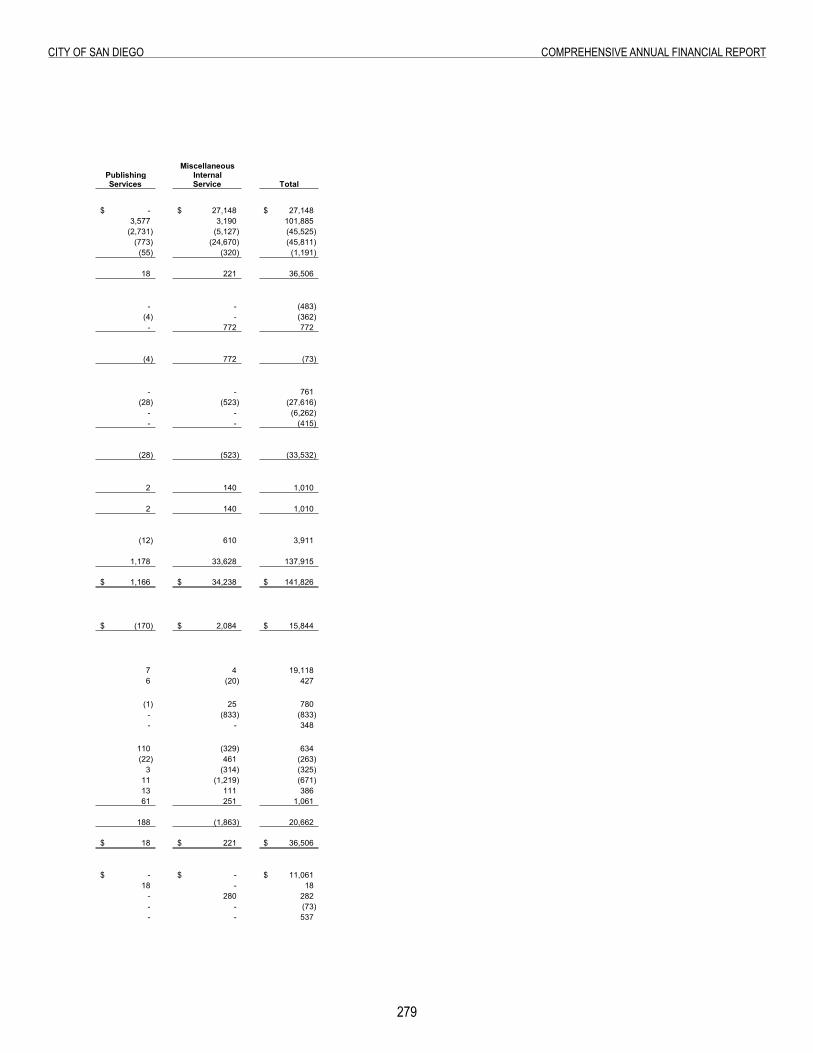
279
City of San Diego ComprehenSive annual finanCial report
MiscellaneousPublishing InternalServices Service Total
-$ 27,148$ 27,148$ 3,577 3,190 101,885
(2,731) (5,127) (45,525) (773) (24,670) (45,811)
(55) (320) (1,191)
18 221 36,506
- - (483) (4) - (362)
- 772 772
(4) 772 (73)
- - 761 (28) (523) (27,616)
- - (6,262) - - (415)
(28) (523) (33,532)
2 140 1,010
2 140 1,010
(12) 610 3,911
1,178 33,628 137,915
1,166$ 34,238$ 141,826$
(170)$ 2,084$ 15,844$
7 4 19,118 6 (20) 427
(1) 25 780 - (833) (833) - - 348
110 (329) 634 (22) 461 (263)
3 (314) (325) 11 (1,219) (671) 13 111 386 61 251 1,061
188 (1,863) 20,662
18$ 221$ 36,506$
-$ -$ 11,061$ 18 - 18
- 280 282 - - (73) - - 537

this page intentionally left Blank
280
Page Intentionally Left Blank
fiDuCiary funDS
Fiduciary Funds:
FIDUCIARY FUNDS

283
City of San Diego ComprehenSive annual finanCial report
FIDUCIARY FUNDS
Fiduciary funds are used to account for resources held for the benefit of parties outside the government. The resources of fiduciary funds are not available to support the City’s programs. The accounting used for fiduciary funds is much like that used for proprietary funds.
CITY OF SAN DIEGO
PENSION TRUST FUNDS
PRESERVATION OF BENEFITS PLAN
The Preservation of Benefits Plan is a qualified governmental excess benefit plan under IRC section 415(m), which was created by Congress to allow for the payment of promised pension benefits that exceed the IRC section 415(b) limits and therefore can’t be paid from the City’s Pension and Employee Savings Trust Fund. This fund is maintained by the SDCERS Board of Administration to reflect all amounts the City contributes for payment of pension benefits that exceed IRC section 415(b) limits.
POSTEMPLOYMENT HEALTHCARE BENEFIT PLAN
Retiree Health Insurance Trust fund is a separate trust fund used solely for providing retiree health benefits. It is maintained by the Retirement Board of Administration to reflect all amounts the City and retirees contribute to pay retiree health benefits.
SUPPLEMENTAL PENSION SAVINGS PLAN
This fund is used to account for a defined contribution plan, where benefits depend solely on amounts contributed to the plan by both the City and employees, plus investment earnings. Disbursements are made from the fund for terminations, retirements, allowable yearly withdrawals, and loans.
401(a) PLAN
This fund is used to account for a defined contribution plan, where benefits depend solely on amounts contributed to the plan by the City, employees and investment earnings. Disbursements are made from the fund for terminations, retirements, allowable yearly withdrawals, and loans.
401(k) PLAN
This fund is used to account for a defined contribution plan, where benefits depend solely on amounts contributed to the plan by City employees, plus investment earnings. Disbursements are made from the fund for terminations, retirements, allowable yearly withdrawals, and loans.
AGENCY FUNDS
These funds were established to account for assets held by the City as an agent for individuals, private organizations, other governments and/or funds, including federal and state income taxes withheld from employees, parking citation revenues, employee benefit plans and special assessments.
FIDUCIARY COMPONENT UNIT
PENSION TRUST FUNDS
CITY EMPLOYEES' RETIREMENT SYSTEM
SDCERS provides retirement, disability, and death benefits. SDCERS is a defined benefit plan, whereby funds are accumulated from City and employee contributions, plus earnings from fund investments. Currently SDCERS also administers the Port of San Diego and the San Diego County Regional Airport Authority defined benefit plans. It also performs certain administrative functions on other post-employment benefits on behalf of the City.
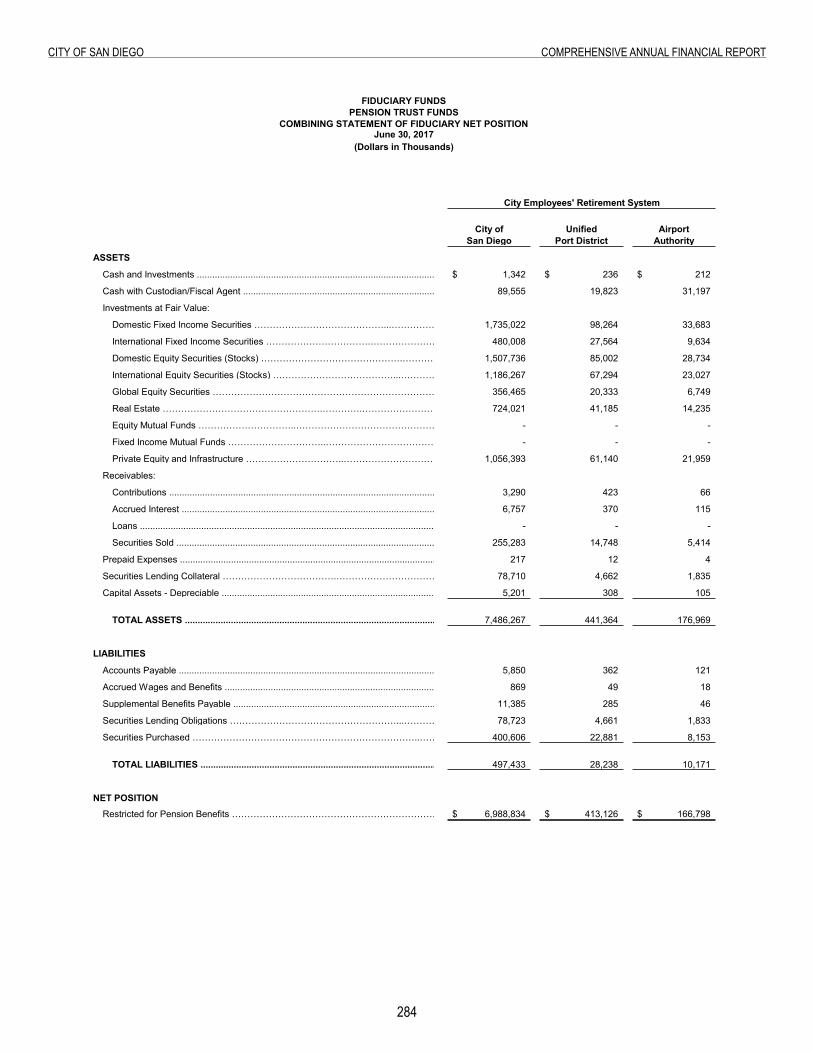
28�
City of San Diego ComprehenSive annual finanCial report
Combining Statement of Fiduciary Net Position - Pension Trust Funds
City of San Diego
Unified Port District
Airport Authority
ASSETS
Cash and Investments ...................................................................................................................................................................................................1,342$ 236$ 212$
Cash with Custodian/Fiscal Agent .............................................................................................................................................. .................................................…………………………..89,555 19,823 31,197
Investments at Fair Value:
Domestic Fixed Income Securities ……………………………………...………………………………………………………………………………………………………….1,735,022 98,264 33,683
International Fixed Income Securities …………………………….…………………………………………………………………………………………………………..480,008 27,564 9,634
Domestic Equity Securities (Stocks) ……………………………………….………………………………………………………………………………………………….1,507,736 85,002 28,734
International Equity Securities (Stocks) …………………………………...…………………………………………………………………………………………………………………………………………….1,186,267 67,294 23,027
Global Equity Securities ………………………………………………………………………………………………………………………………………………………………………………….356,465 20,333 6,749
Real Estate …………………………………………….………….…………………………...………………………………………….724,021 41,185 14,235
Equity Mutual Funds …………………………..…………………………………………………………………………………………………………………………………. - - -
Fixed Income Mutual Funds …………………………..…………………………………………………………………………………………………………………………………. - - -
Private Equity and Infrastructure …………………………..…………………………………………………………………………………………………………………………………. 1,056,393 61,140 21,959
Receivables:
Contributions .................................................................................................................................................................................................................................3,290 423 66
Accrued Interest ..............................................................................................................................................................................................................................6,757 370 115
Loans .........................................................................................................................................................................................................................................- - -
Securities Sold ......................................................................................................................................................…255,283 14,748 5,414
Prepaid Expenses ..................................................................................................................................................................................................217 12 4
Securities Lending Collateral ……………………………….……………………………………………………………………………………………………………………………..78,710 4,662 1,835
Capital Assets - Depreciable ...........................................................................................………………………..5,201 308 105
TOTAL ASSETS ..................................................................................................................................................................................................................................7,486,267 441,364 176,969
LIABILITIES
Accounts Payable ..............................................................................................................................................................................................................................5,850 362 121
Accrued Wages and Benefits ....................................................................................................................................................................................................................869 49 18
Supplemental Benefits Payable ....................................................................................................................................................................................................................11,385 285 46
Securities Lending Obligations ………………………………………………...…………………………………………………………………………..78,723 4,661 1,833
Securities Purchased ………………………………………………………………..………………………………………………………………………………………………400,606 22,881 8,153
TOTAL LIABILITIES ..............................................................................................................................................................................................................................497,433 28,238 10,171
NET POSITIONRestricted for Pension Benefits ………………………………………………………………………………………………………………….. 6,988,834$ 413,126$ 166,798$
City Employees' Retirement System
FIDUCIARY FUNDSPENSION TRUST FUNDS
COMBINING STATEMENT OF FIDUCIARY NET POSITIONJune 30, 2017
(Dollars in Thousands)
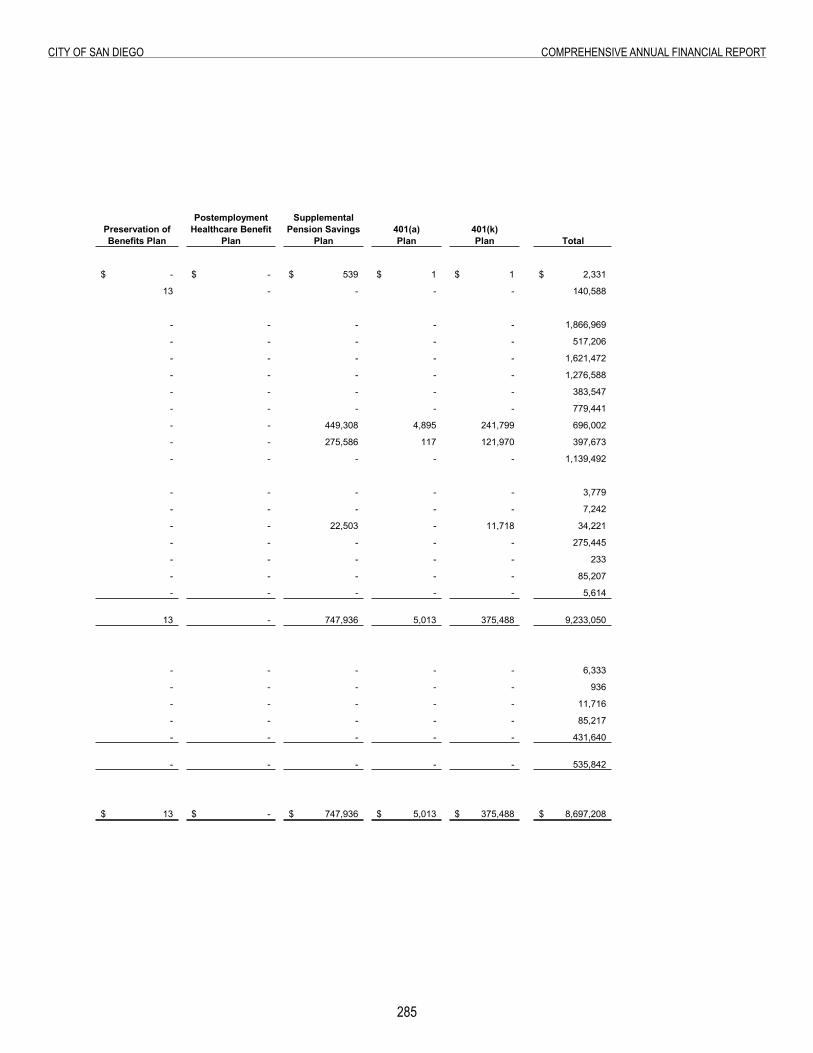
285
City of San Diego ComprehenSive annual finanCial report
Total
-$ -$ 539$ 1$ 1$ 2,331$
13 - - - - 140,588
- - - - - 1,866,969
- - - - - 517,206
- - - - - 1,621,472
- - - - - 1,276,588
- - - - - 383,547
- - - - - 779,441
- - 449,308 4,895 241,799 696,002
- - 275,586 117 121,970 397,673
- - - - - 1,139,492
- - - - - 3,779
- - - - - 7,242
- - 22,503 - 11,718 34,221
- - - - - 275,445
- - - - - 233
- - - - - 85,207
- - - - - 5,614
13 - 747,936 5,013 375,488 9,233,050
- - - - - 6,333
- - - - - 936
- - - - - 11,716
- - - - - 85,217
- - - - - 431,640
- - - - - 535,842
13$ -$ 747,936$ 5,013$ 375,488$ 8,697,208$
Supplemental Pension Savings
Plan401(k) Plan
Postemployment Healthcare Benefit
PlanPreservation of Benefits Plan
401(a) Plan
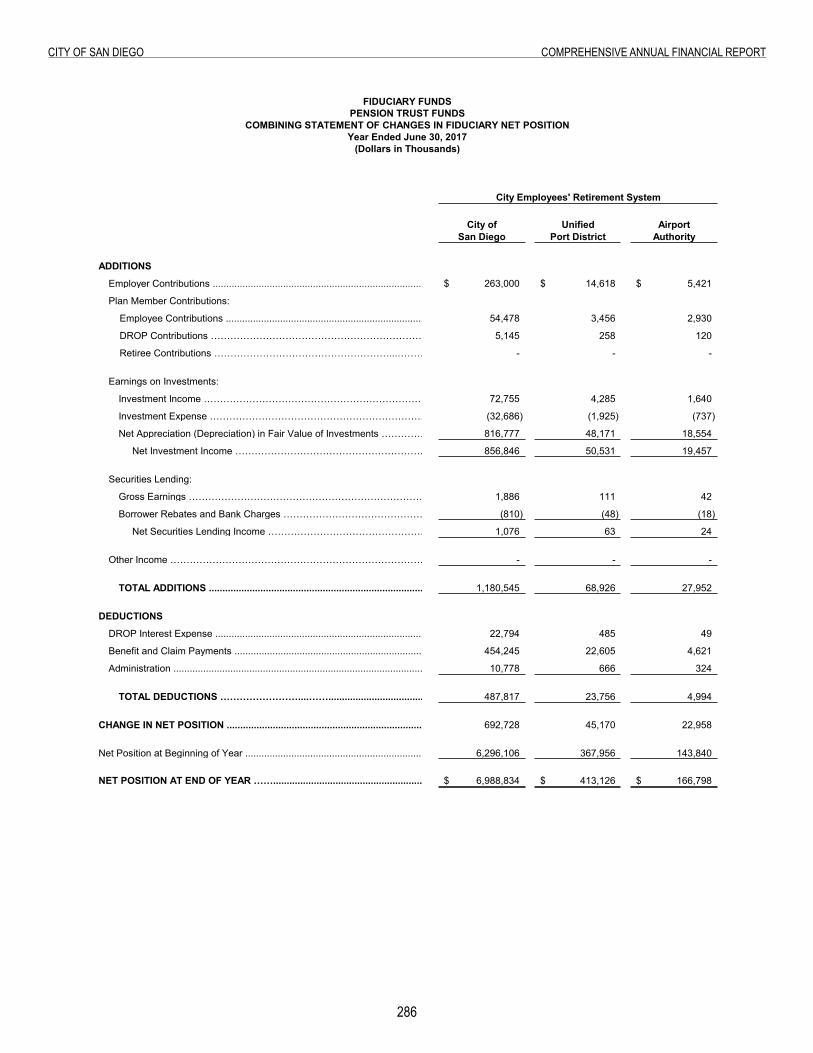
286
City of San Diego ComprehenSive annual finanCial report
Combining Statement of Changes in Fiduciary Net Position - Pension Trust Funds
City of San Diego
Unified Port District
Airport Authority
ADDITIONS
Employer Contributions .................................................................................................................................................… 263,000$ 14,618$ 5,421$
Plan Member Contributions:
Employee Contributions .................................................................................................................................................…54,478 3,456 2,930
DROP Contributions ………………………………………………………………………………………….. 5,145 258 120
Retiree Contributions ………………………………………………...………………………………………………………………..- - -
Earnings on Investments:
Investment Income …………………………………………………………………………………………………………………………..72,755 4,285 1,640
Investment Expense …………………………………………………………………………………………………………………………..(32,686) (1,925) (737)
Net Appreciation (Depreciation) in Fair Value of Investments ………………………………………………………………. 816,777 48,171 18,554
Net Investment Income …………………………………………………………………………………………………………………………..856,846 50,531 19,457
Securities Lending:
Gross Earnings …………………………………………………………………………………………………………………………..1,886 111 42
Borrower Rebates and Bank Charges …………………………………………………………………………………………………………………………..(810) (48) (18)
Net Securities Lending Income …………………………………………………………………………………………………………………………..1,076 63 24
Other Income …………………………………………………………………………………………………………………………..- - -
TOTAL ADDITIONS .............................................................................................................................................................................…………………….. 1,180,545 68,926 27,952
DEDUCTIONS
DROP Interest Expense .....................................................................................................................................................… 22,794 485 49
Benefit and Claim Payments .....................................................................................................................................................… 454,245 22,605 4,621
Administration .......................................................................................................................................………………. 10,778 666 324
TOTAL DEDUCTIONS ……………………....…….................................................………………… 487,817 23,756 4,994
CHANGE IN NET POSITION ...............................................................................................................................................................................................… 692,728 45,170 22,958
Net Position at Beginning of Year ...........................................................................................................................................................................................................… 6,296,106 367,956 143,840
NET POSITION AT END OF YEAR ……................................................................................................................................................……………………………… 6,988,834$ 413,126$ 166,798$
FIDUCIARY FUNDSPENSION TRUST FUNDS
COMBINING STATEMENT OF CHANGES IN FIDUCIARY NET POSITIONYear Ended June 30, 2017
(Dollars in Thousands)
City Employees' Retirement System
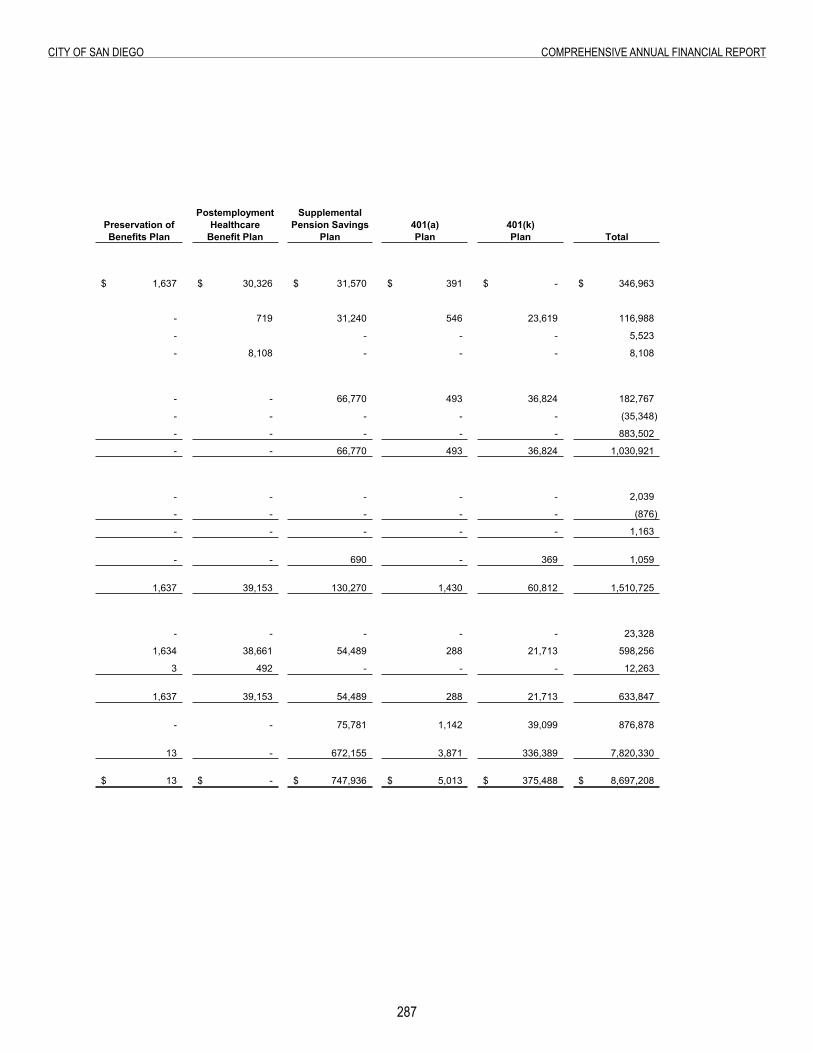
287
City of San Diego ComprehenSive annual finanCial report
Total
1,637$ 30,326$ 31,570$ 391$ -$ 346,963$
- 719 31,240 546 23,619 116,988
- - - - 5,523
- 8,108 - - - 8,108
- - 66,770 493 36,824 182,767
- - - - - (35,348)
- - - - - 883,502
- - 66,770 493 36,824 1,030,921
- - - - - 2,039
- - - - - (876)
- - - - - 1,163
- - 690 - 369 1,059
1,637 39,153 130,270 1,430 60,812 1,510,725
- - - - - 23,328
1,634 38,661 54,489 288 21,713 598,256
3 492 - - - 12,263
1,637 39,153 54,489 288 21,713 633,847
- - 75,781 1,142 39,099 876,878
13 - 672,155 3,871 336,389 7,820,330
13$ -$ 747,936$ 5,013$ 375,488$ 8,697,208$
Postemployment Healthcare
Benefit Plan
Supplemental Pension Savings
Plan401(a) Plan
401(k) Plan
Preservation of Benefits Plan
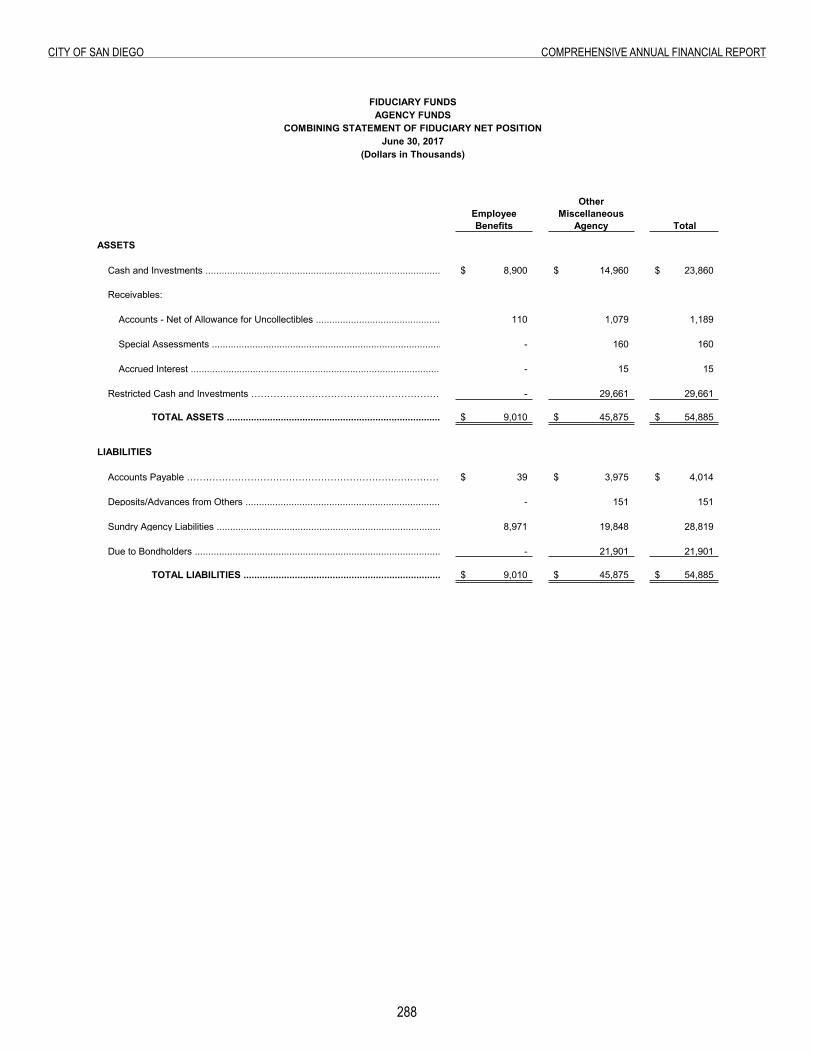
288
City of San Diego ComprehenSive annual finanCial report
Combining Statement of Fiduciary Net Position - Agency Funds
Total
ASSETS
Cash and Investments ...................................................................................................................................................................................................8,900$ 14,960$ 23,860$
Receivables:
Accounts - Net of Allowance for Uncollectibles ................................................................................................................................................................................................................................110 1,079 1,189
Special Assessments ................................................................................................................................................................................................................................- 160 160
Accrued Interest ..............................................................................................................................................................................................................................- 15 15
Restricted Cash and Investments …………………………………………………………………………………………………… - 29,661 29,661
TOTAL ASSETS ..................................................................................................................................................................................................................................9,010$ 45,875$ 54,885$
LIABILITIES
Accounts Payable ……………………………………………………………………………………………………………………… 39$ 3,975$ 4,014$
Deposits/Advances from Others .................................................................................................................................................................................................................- 151 151
Sundry Agency Liabilities ......................................................................................................................................................................................................................8,971 19,848 28,819
Due to Bondholders ......................................................................................................................................................................................................................- 21,901 21,901
TOTAL LIABILITIES ..............................................................................................................................................................................................................................9,010$ 45,875$ 54,885$
Other Miscellaneous
AgencyEmployee Benefits
FIDUCIARY FUNDS
June 30, 2017(Dollars in Thousands)
COMBINING STATEMENT OF FIDUCIARY NET POSITIONAGENCY FUNDS
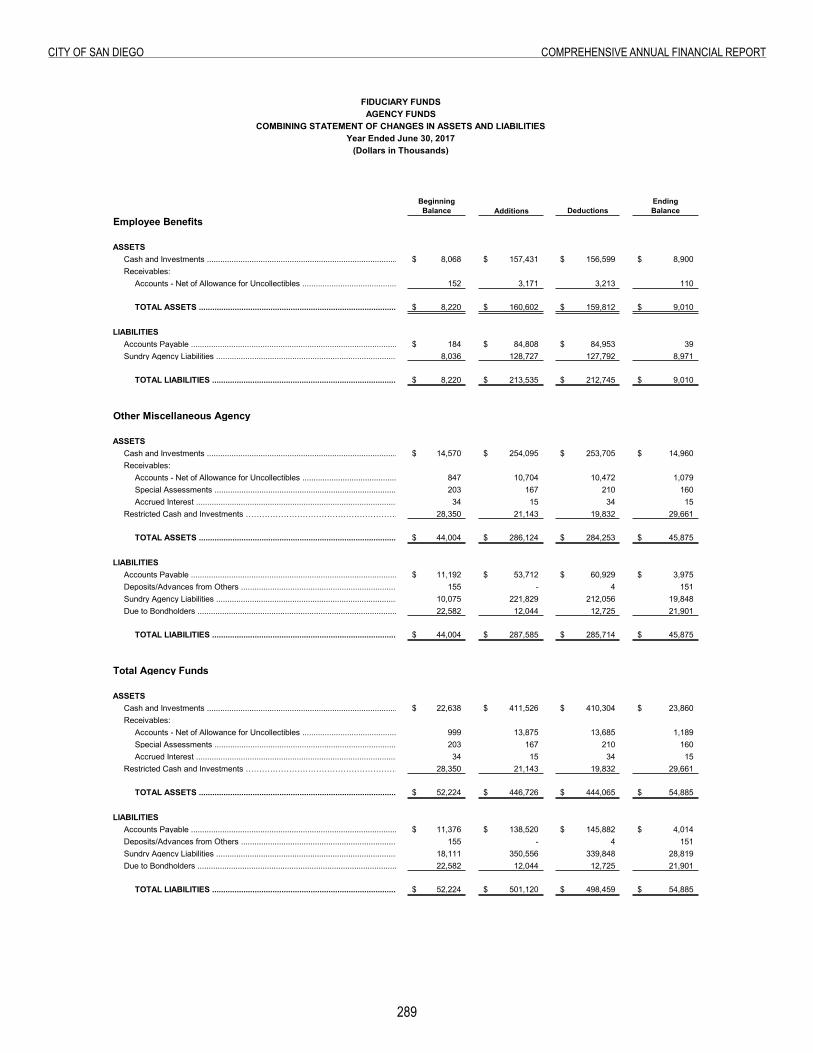
289
City of San Diego ComprehenSive annual finanCial report
Combining Statement of Changes in Assets and Liabilities - Agency Funds
Beginning Balance Additions Deductions
Ending Balance
Employee Benefits
ASSETSCash and Investments ...................................................................................................................................................................................................8,068$ 157,431$ 156,599$ 8,900$ Receivables:
Accounts - Net of Allowance for Uncollectibles ................................................................................................................................................................................................................................152 3,171 3,213 110
TOTAL ASSETS ..................................................................................................................................................................................................................................8,220$ 160,602$ 159,812$ 9,010$
LIABILITIESAccounts Payable ..............................................................................................................................................................................................................................184$ 84,808$ 84,953$ 39 Sundry Agency Liabilities ......................................................................................................................................................................................................................8,036 128,727 127,792 8,971
TOTAL LIABILITIES .................................................................................................................................................................................................................................. 8,220$ 213,535$ 212,745$ 9,010$
Other Miscellaneous Agency
ASSETSCash and Investments ...................................................................................................................................................................................................14,570$ 254,095$ 253,705$ 14,960$ Receivables:
Accounts - Net of Allowance for Uncollectibles ................................................................................................................................................................................................................................847 10,704 10,472 1,079 Special Assessments ................................................................................................................................................................................................................................203 167 210 160 Accrued Interest ..............................................................................................................................................................................................................................34 15 34 15
Restricted Cash and Investments ……………………………………………………………………………………………………………………………… 28,350 21,143 19,832 29,661
TOTAL ASSETS ..................................................................................................................................................................................................................................44,004$ 286,124$ 284,253$ 45,875$
LIABILITIESAccounts Payable ..............................................................................................................................................................................................................................11,192$ 53,712$ 60,929$ 3,975$ Deposits/Advances from Others .................................................................................................................................................................................................................155 - 4 151 Sundry Agency Liabilities ......................................................................................................................................................................................................................10,075 221,829 212,056 19,848 Due to Bondholders ......................................................................................................................................................................................................................22,582 12,044 12,725 21,901
TOTAL LIABILITIES ..............................................................................................................................................................................................................................44,004$ 287,585$ 285,714$ 45,875$
Total Agency Funds
ASSETSCash and Investments ...................................................................................................................................................................................................22,638$ 411,526$ 410,304$ 23,860$ Receivables:
Accounts - Net of Allowance for Uncollectibles ................................................................................................................................................................................................................................999 13,875 13,685 1,189 Special Assessments ................................................................................................................................................................................................................................203 167 210 160 Accrued Interest ..............................................................................................................................................................................................................................34 15 34 15
Restricted Cash and Investments …………………………………………………………………………………………………………………………… 28,350 21,143 19,832 29,661
TOTAL ASSETS ..................................................................................................................................................................................................................................52,224$ 446,726$ 444,065$ 54,885$
LIABILITIESAccounts Payable ......................................................................................................................................................... 11,376$ 138,520$ 145,882$ 4,014$ Deposits/Advances from Others .................................................................................................................................................................................................................155 - 4 151 Sundry Agency Liabilities ......................................................................................................................................................................................................................18,111 350,556 339,848 28,819 Due to Bondholders ......................................................................................................................................................................................................................22,582 12,044 12,725 21,901
TOTAL LIABILITIES ..............................................................................................................................................................................................................................52,224$ 501,120$ 498,459$ 54,885$
FIDUCIARY FUNDS
Year Ended June 30, 2017COMBINING STATEMENT OF CHANGES IN ASSETS AND LIABILITIES
(Dollars in Thousands)
AGENCY FUNDS

this page intentionally left Blank
290
Page Intentionally Left Blank
STATISTICAL SECTION (UNAUDITED)
StatiStiCal SeCtion(UNAUDITED)
STATISTICAL SECTION(UNAUDITED)

293
City of San Diego ComprehenSive annual finanCial report
STATISTICAL SECTION
The Statistical Section presents information as required by GASB Statement No. 44. In addition to utilizing the basic financial statements, notes to the basic financial statements, and required supplementary information, the statistical data presented in this section helps users assess the City’s economic condition. Ten-year trend information has been provided when available. The statistical tables are footnoted to indicate sources and when accounting data or other information is unavailable.
CONTENTS
FINANCIAL TRENDS
Tables 1 through 4 contain information to help the reader understand how the City’s financial performance and well-being have changed over time.
REVENUE CAPACITY
Tables 5 through 9 contain information to help the reader assess the City’s ability to generate its most significant local revenue source, property tax.
DEBT CAPACITY
Tables 10 through 15 present information to help the reader assess the affordability of the City’s current levels of certain outstanding debt categories.
DEMOGRAPHIC AND ECONOMIC INFORMATION
Tables 16 and 17 offer demographic and economic indicators to help the reader understand the environment in which the City’s financial activities take place and to provide comparisons over time with other governments.
OPERATING INFORMATION
Tables 18 through 20 contain information about the City’s resources and operations to help the reader understand how the City’s financial report relates to the services provided and activities performed by the City.
*Additional financial information (audited and statistical) on the Sewer and Water Utilities can be obtained in the Annual Report Disclosure filings submitted to the Municipal Securities Rulemaking Board, http://emma.msrb.org.
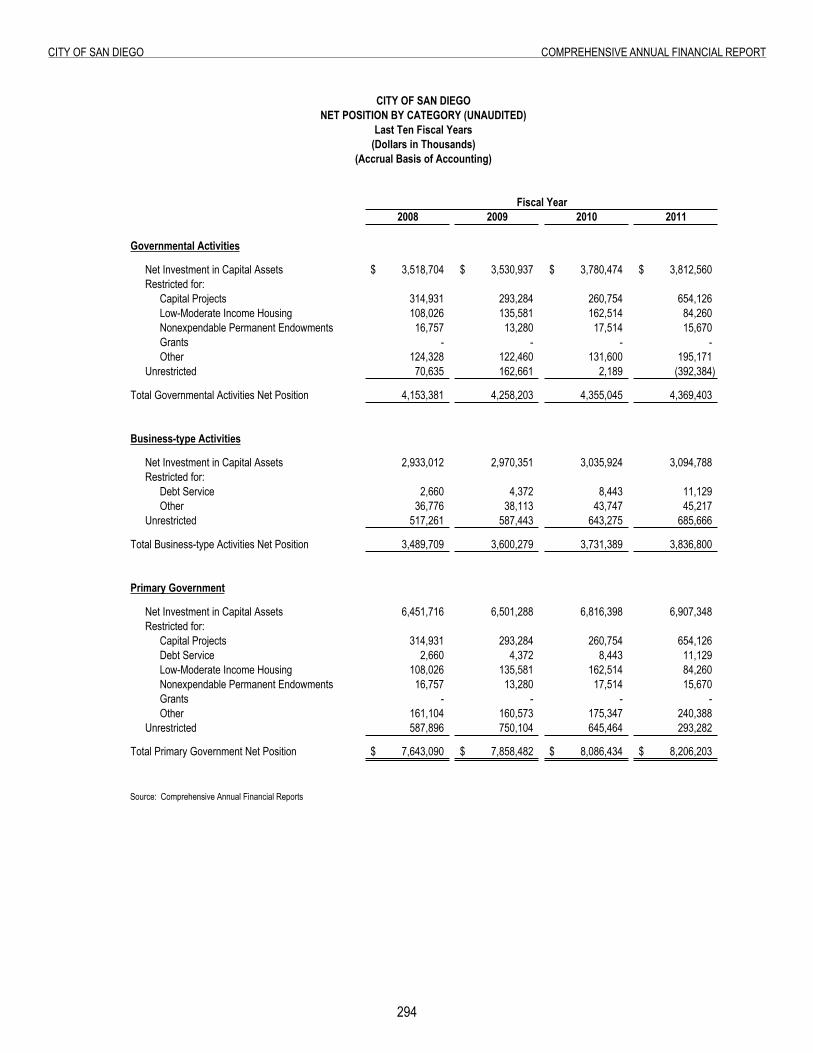
29�
City of San Diego ComprehenSive annual finanCial report
table 1: net position by Category
2008 2009 2010 2011
Governmental Activities
Net Investment in Capital Assets 3,518,704$ 3,530,937$ 3,780,474$ 3,812,560$ Restricted for:
Capital Projects 314,931 293,284 260,754 654,126 Low-Moderate Income Housing 108,026 135,581 162,514 84,260 Nonexpendable Permanent Endowments 16,757 13,280 17,514 15,670 Grants - - - - Other 124,328 122,460 131,600 195,171
Unrestricted 70,635 162,661 2,189 (392,384)
Total Governmental Activities Net Position 4,153,381 4,258,203 4,355,045 4,369,403
Business-type Activities
Net Investment in Capital Assets 2,933,012 2,970,351 3,035,924 3,094,788 Restricted for:
Debt Service 2,660 4,372 8,443 11,129 Other 36,776 38,113 43,747 45,217
Unrestricted 517,261 587,443 643,275 685,666
Total Business-type Activities Net Position 3,489,709 3,600,279 3,731,389 3,836,800
Primary Government
Net Investment in Capital Assets 6,451,716 6,501,288 6,816,398 6,907,348 Restricted for:
Capital Projects 314,931 293,284 260,754 654,126 Debt Service 2,660 4,372 8,443 11,129 Low-Moderate Income Housing 108,026 135,581 162,514 84,260 Nonexpendable Permanent Endowments 16,757 13,280 17,514 15,670 Grants - - - - Other 161,104 160,573 175,347 240,388
Unrestricted 587,896 750,104 645,464 293,282
Total Primary Government Net Position 7,643,090$ 7,858,482$ 8,086,434$ 8,206,203$
Source: Comprehensive Annual Financial Reports
CITY OF SAN DIEGONET POSITION BY CATEGORY (UNAUDITED)
Last Ten Fiscal Years(Dollars in Thousands)
(Accrual Basis of Accounting)
Fiscal Year
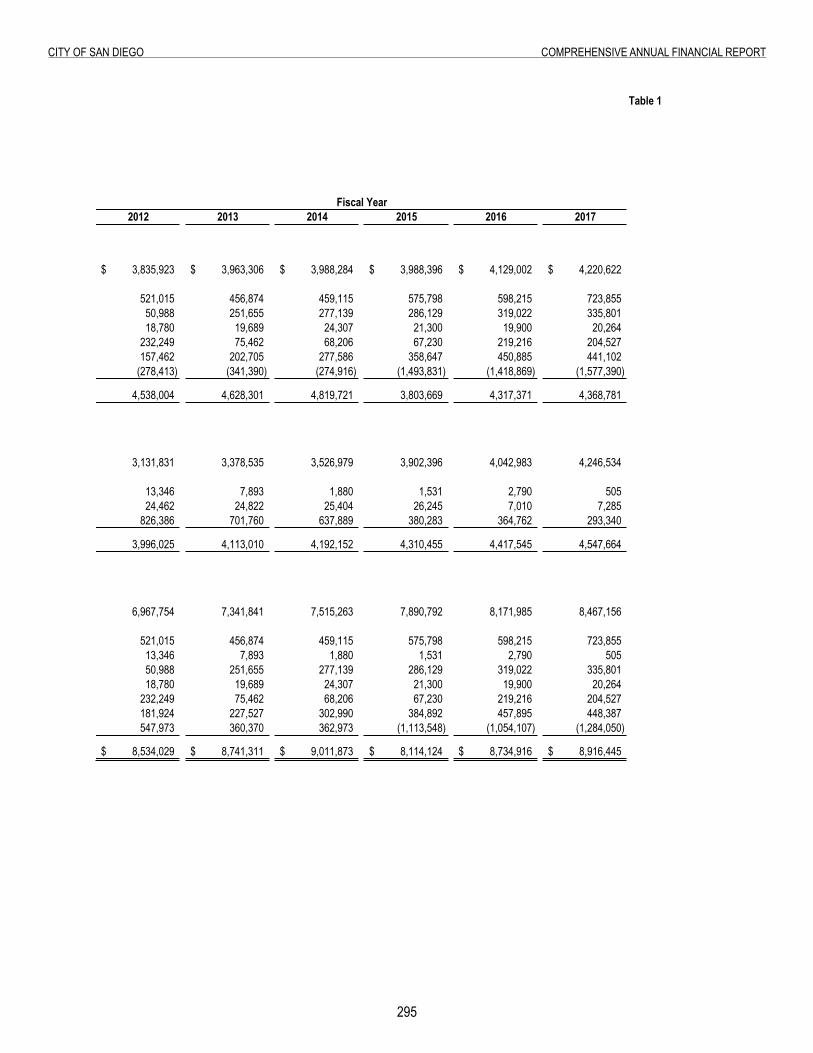
295
City of San Diego ComprehenSive annual finanCial report
Table 1
2012 2013 2014 2015 2016 2017
3,835,923$ 3,963,306$ 3,988,284$ 3,988,396$ 4,129,002$ 4,220,622$
521,015 456,874 459,115 575,798 598,215 723,855 50,988 251,655 277,139 286,129 319,022 335,801 18,780 19,689 24,307 21,300 19,900 20,264
232,249 75,462 68,206 67,230 219,216 204,527 157,462 202,705 277,586 358,647 450,885 441,102
(278,413) (341,390) (274,916) (1,493,831) (1,418,869) (1,577,390)
4,538,004 4,628,301 4,819,721 3,803,669 4,317,371 4,368,781
3,131,831 3,378,535 3,526,979 3,902,396 4,042,983 4,246,534
13,346 7,893 1,880 1,531 2,790 505 24,462 24,822 25,404 26,245 7,010 7,285
826,386 701,760 637,889 380,283 364,762 293,340
3,996,025 4,113,010 4,192,152 4,310,455 4,417,545 4,547,664
6,967,754 7,341,841 7,515,263 7,890,792 8,171,985 8,467,156
521,015 456,874 459,115 575,798 598,215 723,855 13,346 7,893 1,880 1,531 2,790 505 50,988 251,655 277,139 286,129 319,022 335,801 18,780 19,689 24,307 21,300 19,900 20,264
232,249 75,462 68,206 67,230 219,216 204,527 181,924 227,527 302,990 384,892 457,895 448,387 547,973 360,370 362,973 (1,113,548) (1,054,107) (1,284,050)
8,534,029$ 8,741,311$ 9,011,873$ 8,114,124$ 8,734,916$ 8,916,445$
Fiscal Year
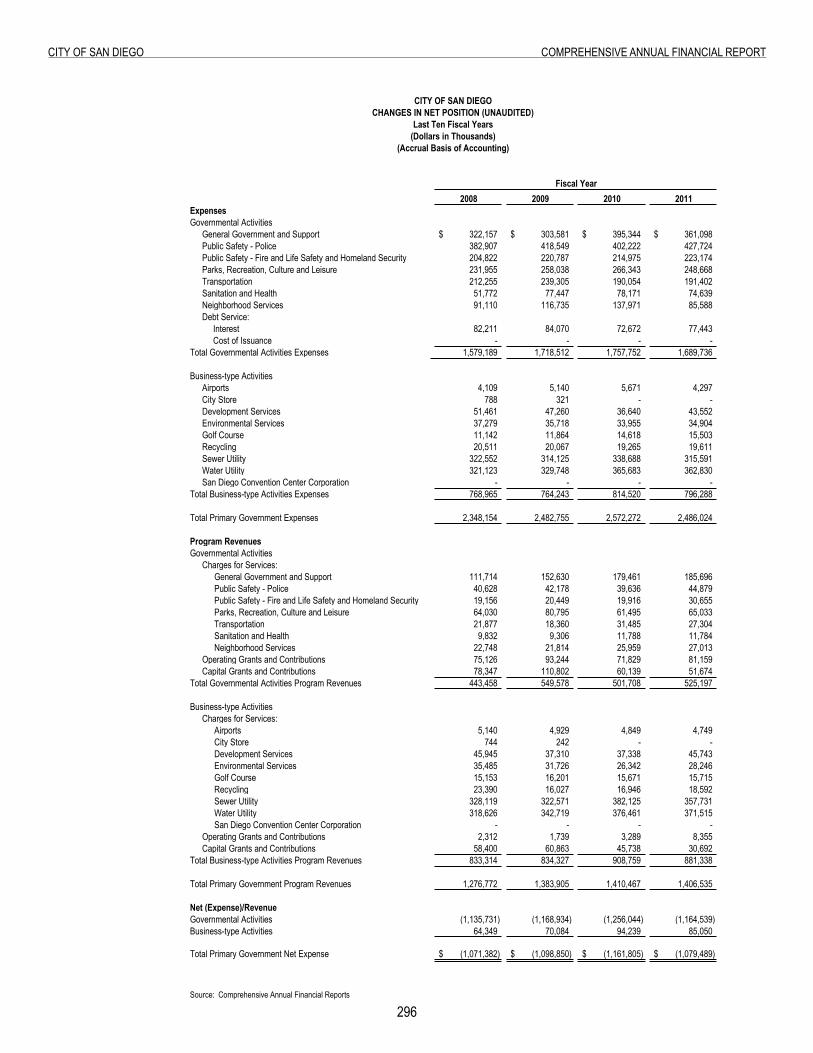
296
City of San Diego ComprehenSive annual finanCial report
table 2: Changes in net position
2008 2009 2010 2011ExpensesGovernmental Activities
General Government and Support 322,157$ 303,581$ 395,344$ 361,098$ Public Safety - Police 382,907 418,549 402,222 427,724 Public Safety - Fire and Life Safety and Homeland Security 204,822 220,787 214,975 223,174 Parks, Recreation, Culture and Leisure 231,955 258,038 266,343 248,668 Transportation 212,255 239,305 190,054 191,402 Sanitation and Health 51,772 77,447 78,171 74,639 Neighborhood Services 91,110 116,735 137,971 85,588 Debt Service:
Interest 82,211 84,070 72,672 77,443 Cost of Issuance - - - -
Total Governmental Activities Expenses 1,579,189 1,718,512 1,757,752 1,689,736
Business-type ActivitiesAirports 4,109 5,140 5,671 4,297 City Store 788 321 - - Development Services 51,461 47,260 36,640 43,552 Environmental Services 37,279 35,718 33,955 34,904 Golf Course 11,142 11,864 14,618 15,503 Recycling 20,511 20,067 19,265 19,611 Sewer Utility 322,552 314,125 338,688 315,591 Water Utility 321,123 329,748 365,683 362,830 San Diego Convention Center Corporation - - - -
Total Business-type Activities Expenses 768,965 764,243 814,520 796,288
Total Primary Government Expenses 2,348,154 2,482,755 2,572,272 2,486,024
Program RevenuesGovernmental Activities
Charges for Services:General Government and Support 111,714 152,630 179,461 185,696 Public Safety - Police 40,628 42,178 39,636 44,879 Public Safety - Fire and Life Safety and Homeland Security 19,156 20,449 19,916 30,655 Parks, Recreation, Culture and Leisure 64,030 80,795 61,495 65,033 Transportation 21,877 18,360 31,485 27,304 Sanitation and Health 9,832 9,306 11,788 11,784 Neighborhood Services 22,748 21,814 25,959 27,013
Operating Grants and Contributions 75,126 93,244 71,829 81,159 Capital Grants and Contributions 78,347 110,802 60,139 51,674
Total Governmental Activities Program Revenues 443,458 549,578 501,708 525,197
Business-type ActivitiesCharges for Services:
Airports 5,140 4,929 4,849 4,749 City Store 744 242 - - Development Services 45,945 37,310 37,338 45,743 Environmental Services 35,485 31,726 26,342 28,246 Golf Course 15,153 16,201 15,671 15,715 Recycling 23,390 16,027 16,946 18,592 Sewer Utility 328,119 322,571 382,125 357,731 Water Utility 318,626 342,719 376,461 371,515 San Diego Convention Center Corporation - - - -
Operating Grants and Contributions 2,312 1,739 3,289 8,355 Capital Grants and Contributions 58,400 60,863 45,738 30,692
Total Business-type Activities Program Revenues 833,314 834,327 908,759 881,338
Total Primary Government Program Revenues 1,276,772 1,383,905 1,410,467 1,406,535
Net (Expense)/RevenueGovernmental Activities (1,135,731) (1,168,934) (1,256,044) (1,164,539) Business-type Activities 64,349 70,084 94,239 85,050
Total Primary Government Net Expense (1,071,382)$ (1,098,850)$ (1,161,805)$ (1,079,489)$
Source: Comprehensive Annual Financial Reports
Fiscal Year
CITY OF SAN DIEGOCHANGES IN NET POSITION (UNAUDITED)
Last Ten Fiscal Years(Dollars in Thousands)
(Accrual Basis of Accounting)
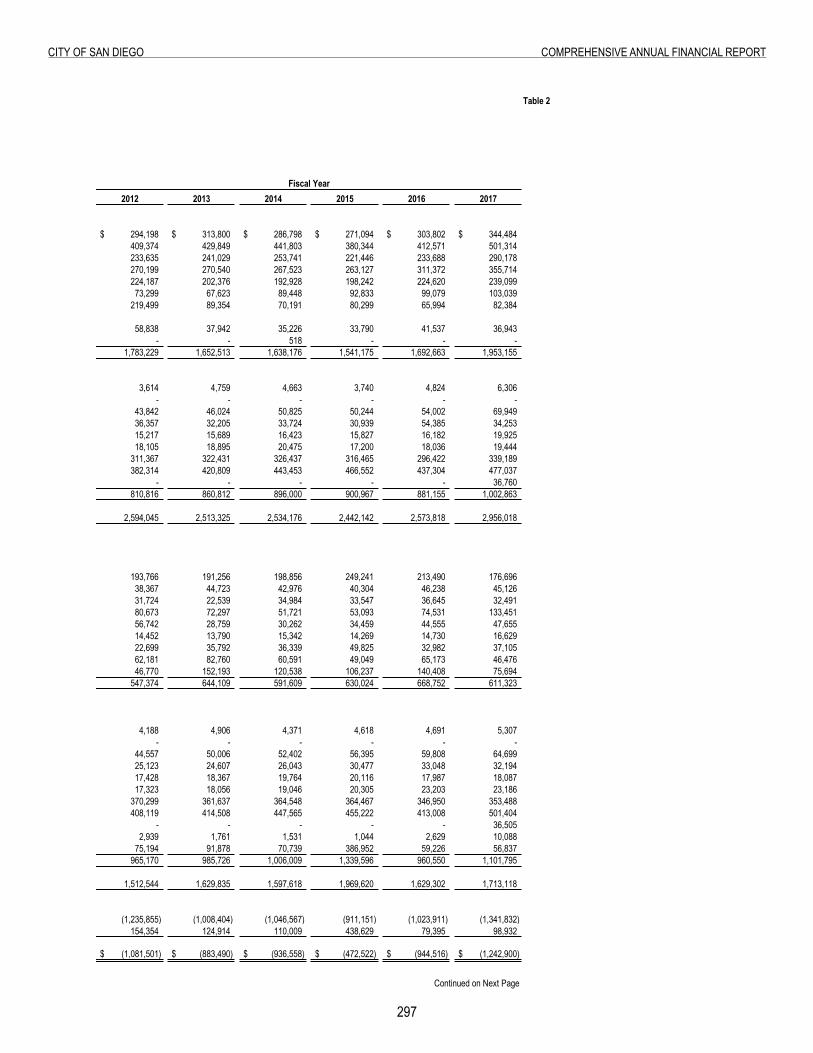
297
City of San Diego ComprehenSive annual finanCial report
Table 2
2012 2013 2014 2015 2016 2017
294,198$ 313,800$ 286,798$ 271,094$ 303,802$ 344,484$ 409,374 429,849 441,803 380,344 412,571 501,314 233,635 241,029 253,741 221,446 233,688 290,178 270,199 270,540 267,523 263,127 311,372 355,714 224,187 202,376 192,928 198,242 224,620 239,099 73,299 67,623 89,448 92,833 99,079 103,039
219,499 89,354 70,191 80,299 65,994 82,384
58,838 37,942 35,226 33,790 41,537 36,943 - - 518 - - -
1,783,229 1,652,513 1,638,176 1,541,175 1,692,663 1,953,155
3,614 4,759 4,663 3,740 4,824 6,306 - - - - - -
43,842 46,024 50,825 50,244 54,002 69,949 36,357 32,205 33,724 30,939 54,385 34,253 15,217 15,689 16,423 15,827 16,182 19,925 18,105 18,895 20,475 17,200 18,036 19,444
311,367 322,431 326,437 316,465 296,422 339,189 382,314 420,809 443,453 466,552 437,304 477,037
- - - - - 36,760 810,816 860,812 896,000 900,967 881,155 1,002,863
2,594,045 2,513,325 2,534,176 2,442,142 2,573,818 2,956,018
193,766 191,256 198,856 249,241 213,490 176,696 38,367 44,723 42,976 40,304 46,238 45,126 31,724 22,539 34,984 33,547 36,645 32,491 80,673 72,297 51,721 53,093 74,531 133,451 56,742 28,759 30,262 34,459 44,555 47,655 14,452 13,790 15,342 14,269 14,730 16,629 22,699 35,792 36,339 49,825 32,982 37,105 62,181 82,760 60,591 49,049 65,173 46,476 46,770 152,193 120,538 106,237 140,408 75,694
547,374 644,109 591,609 630,024 668,752 611,323
4,188 4,906 4,371 4,618 4,691 5,307 - - - - - -
44,557 50,006 52,402 56,395 59,808 64,699 25,123 24,607 26,043 30,477 33,048 32,194 17,428 18,367 19,764 20,116 17,987 18,087 17,323 18,056 19,046 20,305 23,203 23,186
370,299 361,637 364,548 364,467 346,950 353,488 408,119 414,508 447,565 455,222 413,008 501,404
- - - - - 36,505 2,939 1,761 1,531 1,044 2,629 10,088
75,194 91,878 70,739 386,952 59,226 56,837 965,170 985,726 1,006,009 1,339,596 960,550 1,101,795
1,512,544 1,629,835 1,597,618 1,969,620 1,629,302 1,713,118
(1,235,855) (1,008,404) (1,046,567) (911,151) (1,023,911) (1,341,832) 154,354 124,914 110,009 438,629 79,395 98,932
(1,081,501)$ (883,490)$ (936,558)$ (472,522)$ (944,516)$ (1,242,900)$
Continued on Next Page
Fiscal Year
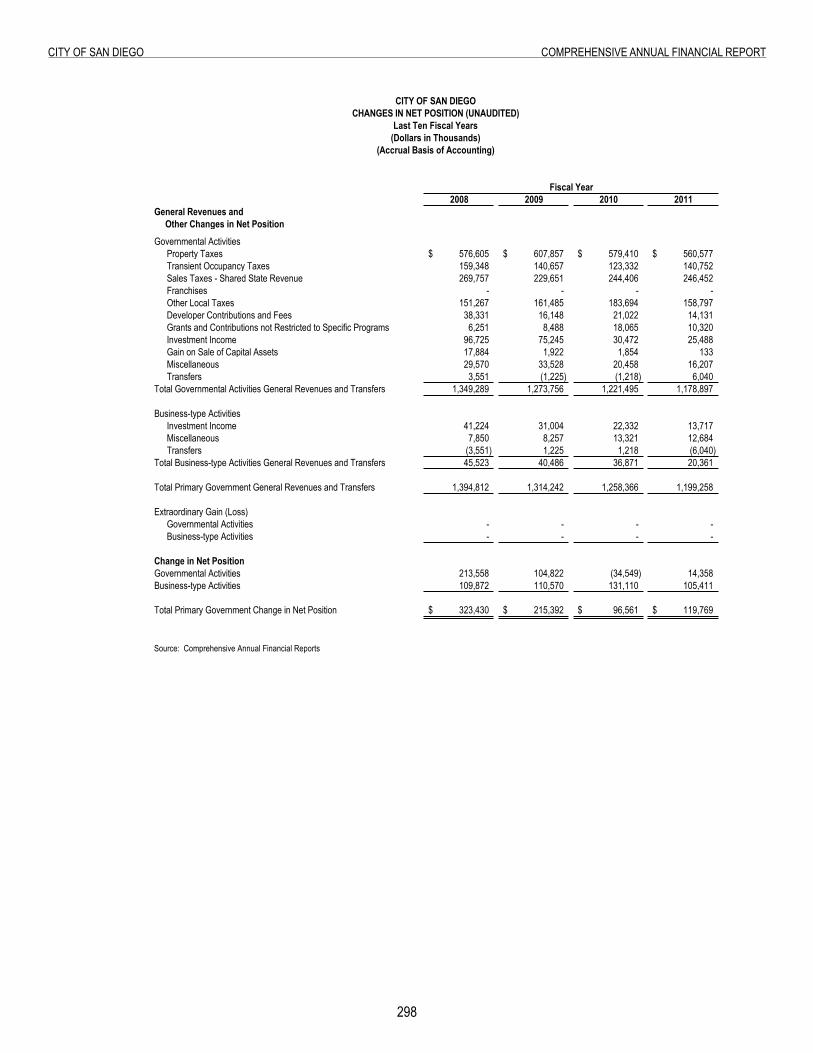
298
City of San Diego ComprehenSive annual finanCial report
2008 2009 2010 2011General Revenues and
Other Changes in Net PositionGovernmental Activities
Property Taxes 576,605$ 607,857$ 579,410$ 560,577$ Transient Occupancy Taxes 159,348 140,657 123,332 140,752 Sales Taxes - Shared State Revenue 269,757 229,651 244,406 246,452 Franchises - - - - Other Local Taxes 151,267 161,485 183,694 158,797 Developer Contributions and Fees 38,331 16,148 21,022 14,131 Grants and Contributions not Restricted to Specific Programs 6,251 8,488 18,065 10,320 Investment Income 96,725 75,245 30,472 25,488 Gain on Sale of Capital Assets 17,884 1,922 1,854 133 Miscellaneous 29,570 33,528 20,458 16,207 Transfers 3,551 (1,225) (1,218) 6,040
1,349,289 1,273,756 1,221,495 1,178,897
Business-type ActivitiesInvestment Income 41,224 31,004 22,332 13,717 Miscellaneous 7,850 8,257 13,321 12,684 Transfers (3,551) 1,225 1,218 (6,040)
Total Business-type Activities General Revenues and Transfers 45,523 40,486 36,871 20,361
1,394,812 1,314,242 1,258,366 1,199,258
Extraordinary Gain (Loss)Governmental Activities - - - - Business-type Activities - - - -
Change in Net PositionGovernmental Activities 213,558 104,822 (34,549) 14,358 Business-type Activities 109,872 110,570 131,110 105,411
Total Primary Government Change in Net Position 323,430$ 215,392$ 96,561$ 119,769$
Source: Comprehensive Annual Financial Reports
Total Governmental Activities General Revenues and Transfers
Total Primary Government General Revenues and Transfers
CITY OF SAN DIEGOCHANGES IN NET POSITION (UNAUDITED)
Last Ten Fiscal Years(Dollars in Thousands)
(Accrual Basis of Accounting)
Fiscal Year
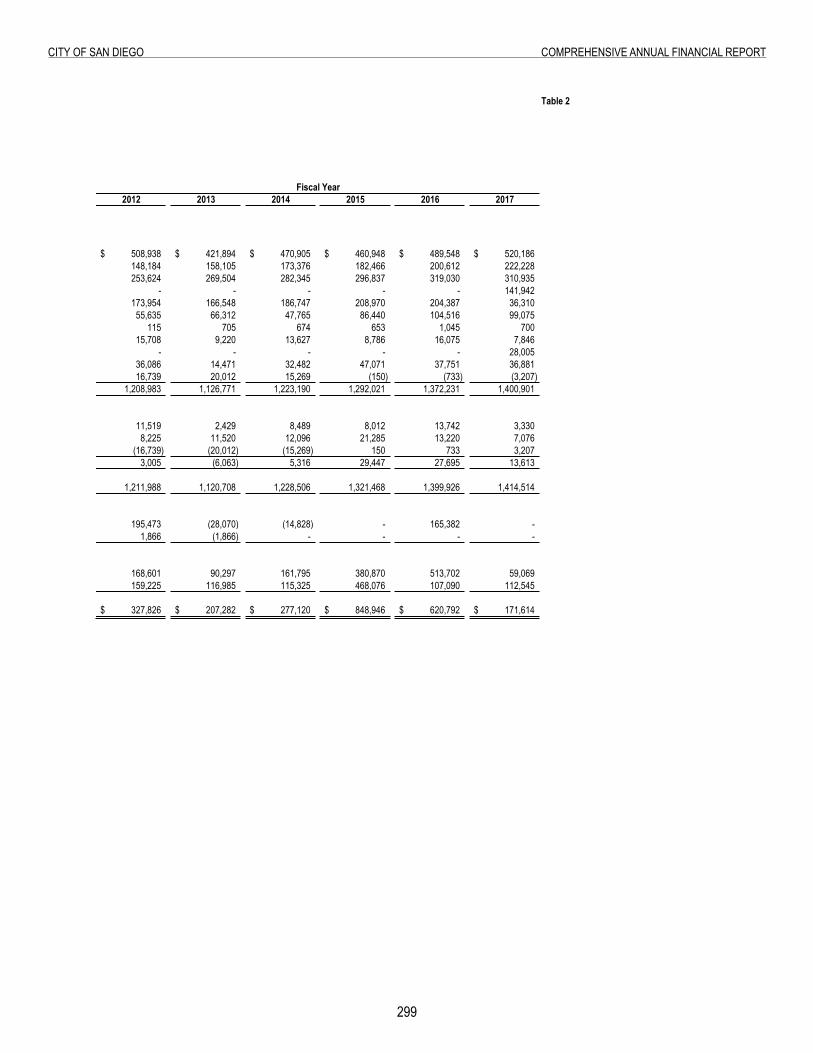
299
City of San Diego ComprehenSive annual finanCial report
Table 2
2012 2013 2014 2015 2016 2017
508,938$ 421,894$ 470,905$ 460,948$ 489,548$ 520,186$ 148,184 158,105 173,376 182,466 200,612 222,228 253,624 269,504 282,345 296,837 319,030 310,935
- - - - - 141,942 173,954 166,548 186,747 208,970 204,387 36,310
55,635 66,312 47,765 86,440 104,516 99,075 115 705 674 653 1,045 700
15,708 9,220 13,627 8,786 16,075 7,846 - - - - - 28,005
36,086 14,471 32,482 47,071 37,751 36,881 16,739 20,012 15,269 (150) (733) (3,207)
1,208,983 1,126,771 1,223,190 1,292,021 1,372,231 1,400,901
11,519 2,429 8,489 8,012 13,742 3,330 8,225 11,520 12,096 21,285 13,220 7,076
(16,739) (20,012) (15,269) 150 733 3,207 3,005 (6,063) 5,316 29,447 27,695 13,613
1,211,988 1,120,708 1,228,506 1,321,468 1,399,926 1,414,514
195,473 (28,070) (14,828) - 165,382 - 1,866 (1,866) - - - -
168,601 90,297 161,795 380,870 513,702 59,069 159,225 116,985 115,325 468,076 107,090 112,545
327,826$ 207,282$ 277,120$ 848,946$ 620,792$ 171,614$
Fiscal Year
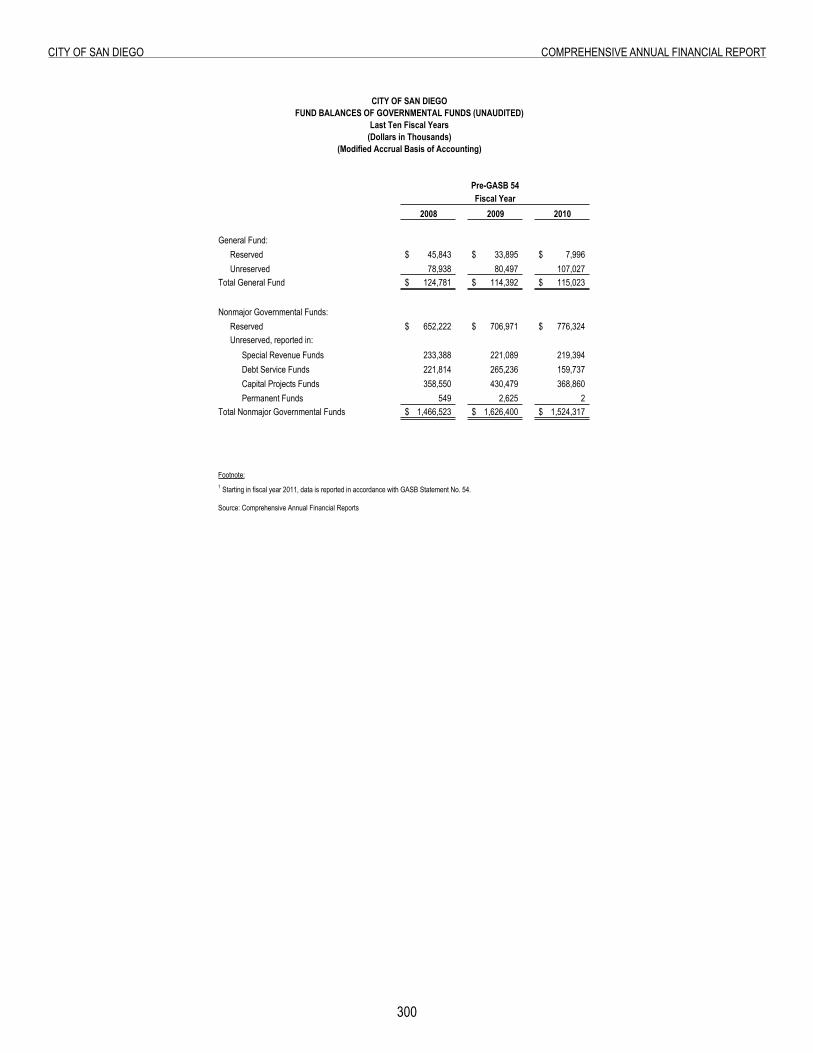
300
City of San Diego ComprehenSive annual finanCial report
Table 3: Fund Balances of Governmental Funds
2008 2009 2010
General Fund:Reserved 45,843$ 33,895$ 7,996$ Unreserved 78,938 80,497 107,027
Total General Fund 124,781$ 114,392$ 115,023$
Nonmajor Governmental Funds:Reserved 652,222$ 706,971$ 776,324$ Unreserved, reported in:
Special Revenue Funds 233,388 221,089 219,394 Debt Service Funds 221,814 265,236 159,737 Capital Projects Funds 358,550 430,479 368,860 Permanent Funds 549 2,625 2
Total Nonmajor Governmental Funds 1,466,523$ 1,626,400$ 1,524,317$
Footnote:1 Starting in fiscal year 2011, data is reported in accordance with GASB Statement No. 54.
Source: Comprehensive Annual Financial Reports
Pre-GASB 54Fiscal Year
CITY OF SAN DIEGOFUND BALANCES OF GOVERNMENTAL FUNDS (UNAUDITED)
Last Ten Fiscal Years(Dollars in Thousands)
(Modified Accrual Basis of Accounting)
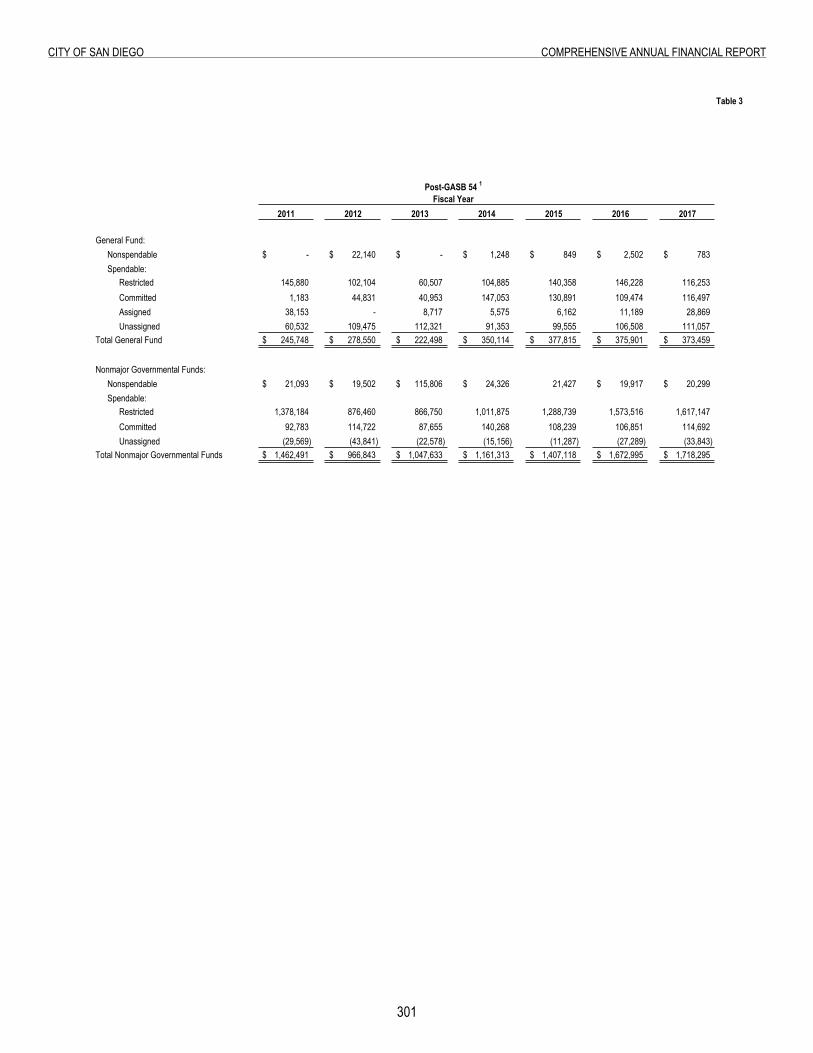
301
City of San Diego ComprehenSive annual finanCial report
Table 3
2011 2012 2013 2014 2015 2016 2017
General Fund:Nonspendable -$ 22,140$ -$ 1,248$ 849$ 2,502$ 783$ Spendable:
Restricted 145,880 102,104 60,507 104,885 140,358 146,228 116,253 Committed 1,183 44,831 40,953 147,053 130,891 109,474 116,497 Assigned 38,153 - 8,717 5,575 6,162 11,189 28,869 Unassigned 60,532 109,475 112,321 91,353 99,555 106,508 111,057
Total General Fund 245,748$ 278,550$ 222,498$ 350,114$ 377,815$ 375,901$ 373,459$
Nonmajor Governmental Funds:Nonspendable 21,093$ 19,502$ 115,806$ 24,326$ 21,427 19,917$ 20,299$ Spendable:
Restricted 1,378,184 876,460 866,750 1,011,875 1,288,739 1,573,516 1,617,147 Committed 92,783 114,722 87,655 140,268 108,239 106,851 114,692 Unassigned (29,569) (43,841) (22,578) (15,156) (11,287) (27,289) (33,843)
Total Nonmajor Governmental Funds 1,462,491$ 966,843$ 1,047,633$ 1,161,313$ 1,407,118$ 1,672,995$ 1,718,295$
Post-GASB 54 1Fiscal Year
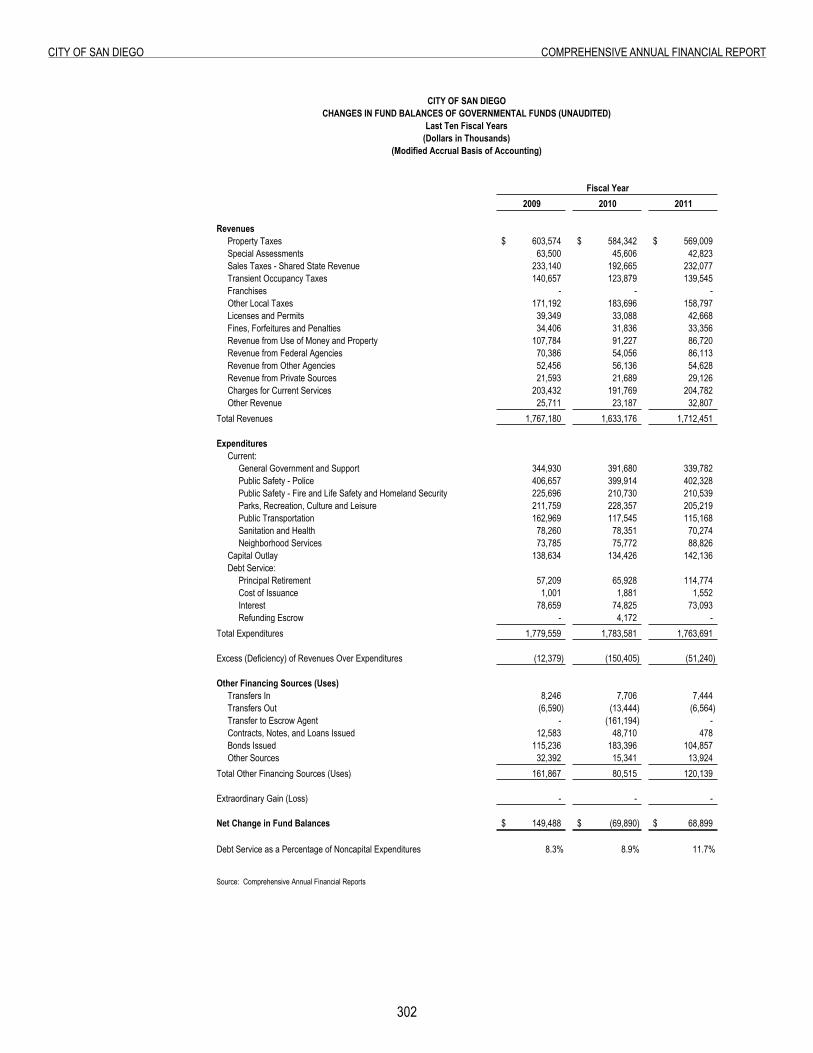
302
City of San Diego ComprehenSive annual finanCial report
Table 4: Changes in Fund Balances of Governmental Funds
2009 2010 2011
RevenuesProperty Taxes 603,574$ 584,342$ 569,009$ Special Assessments 63,500 45,606 42,823 Sales Taxes - Shared State Revenue 233,140 192,665 232,077 Transient Occupancy Taxes 140,657 123,879 139,545 Franchises - - - Other Local Taxes 171,192 183,696 158,797 Licenses and Permits 39,349 33,088 42,668 Fines, Forfeitures and Penalties 34,406 31,836 33,356 Revenue from Use of Money and Property 107,784 91,227 86,720 Revenue from Federal Agencies 70,386 54,056 86,113 Revenue from Other Agencies 52,456 56,136 54,628 Revenue from Private Sources 21,593 21,689 29,126 Charges for Current Services 203,432 191,769 204,782 Other Revenue 25,711 23,187 32,807
Total Revenues 1,767,180 1,633,176 1,712,451
ExpendituresCurrent:
General Government and Support 344,930 391,680 339,782 Public Safety - Police 406,657 399,914 402,328 Public Safety - Fire and Life Safety and Homeland Security 225,696 210,730 210,539 Parks, Recreation, Culture and Leisure 211,759 228,357 205,219 Public Transportation 162,969 117,545 115,168 Sanitation and Health 78,260 78,351 70,274 Neighborhood Services 73,785 75,772 88,826
Capital Outlay 138,634 134,426 142,136 Debt Service:
Principal Retirement 57,209 65,928 114,774 Cost of Issuance 1,001 1,881 1,552 Interest 78,659 74,825 73,093 Refunding Escrow - 4,172 -
Total Expenditures 1,779,559 1,783,581 1,763,691
Excess (Deficiency) of Revenues Over Expenditures (12,379) (150,405) (51,240)
Other Financing Sources (Uses)Transfers In 8,246 7,706 7,444 Transfers Out (6,590) (13,444) (6,564) Transfer to Escrow Agent - (161,194) - Contracts, Notes, and Loans Issued 12,583 48,710 478 Bonds Issued 115,236 183,396 104,857 Other Sources 32,392 15,341 13,924
Total Other Financing Sources (Uses) 161,867 80,515 120,139
Extraordinary Gain (Loss) - - -
Net Change in Fund Balances 149,488$ (69,890)$ 68,899$
Debt Service as a Percentage of Noncapital Expenditures 8.3% 8.9% 11.7%
Source: Comprehensive Annual Financial Reports
CITY OF SAN DIEGOCHANGES IN FUND BALANCES OF GOVERNMENTAL FUNDS (UNAUDITED)
Last Ten Fiscal Years(Dollars in Thousands)
(Modified Accrual Basis of Accounting)
Fiscal Year
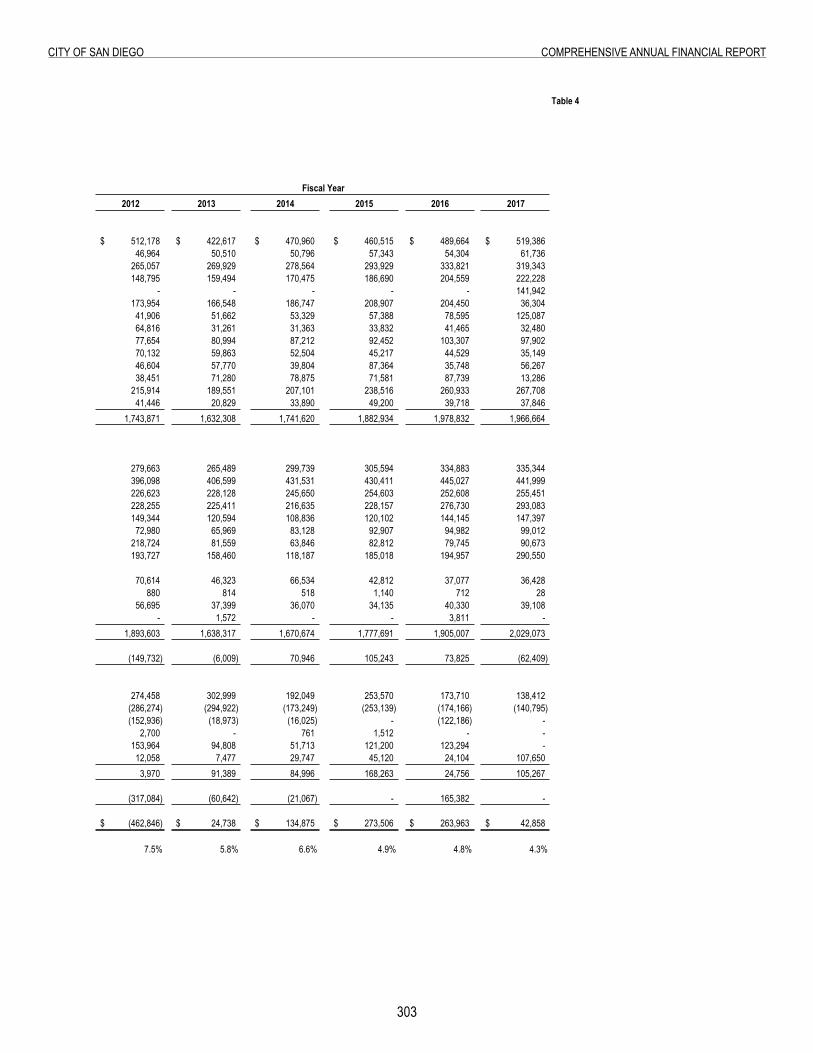
303
City of San Diego ComprehenSive annual finanCial report
Table 4
2012 2013 2014 2015 2016 2017
512,178$ 422,617$ 470,960$ 460,515$ 489,664$ 519,386$ 46,964 50,510 50,796 57,343 54,304 61,736
265,057 269,929 278,564 293,929 333,821 319,343 148,795 159,494 170,475 186,690 204,559 222,228
- - - - - 141,942 173,954 166,548 186,747 208,907 204,450 36,304
41,906 51,662 53,329 57,388 78,595 125,087 64,816 31,261 31,363 33,832 41,465 32,480 77,654 80,994 87,212 92,452 103,307 97,902 70,132 59,863 52,504 45,217 44,529 35,149 46,604 57,770 39,804 87,364 35,748 56,267 38,451 71,280 78,875 71,581 87,739 13,286
215,914 189,551 207,101 238,516 260,933 267,708 41,446 20,829 33,890 49,200 39,718 37,846
1,743,871 1,632,308 1,741,620 1,882,934 1,978,832 1,966,664
279,663 265,489 299,739 305,594 334,883 335,344 396,098 406,599 431,531 430,411 445,027 441,999 226,623 228,128 245,650 254,603 252,608 255,451 228,255 225,411 216,635 228,157 276,730 293,083 149,344 120,594 108,836 120,102 144,145 147,397
72,980 65,969 83,128 92,907 94,982 99,012 218,724 81,559 63,846 82,812 79,745 90,673 193,727 158,460 118,187 185,018 194,957 290,550
70,614 46,323 66,534 42,812 37,077 36,428 880 814 518 1,140 712 28
56,695 37,399 36,070 34,135 40,330 39,108 - 1,572 - - 3,811 -
1,893,603 1,638,317 1,670,674 1,777,691 1,905,007 2,029,073
(149,732) (6,009) 70,946 105,243 73,825 (62,409)
274,458 302,999 192,049 253,570 173,710 138,412 (286,274) (294,922) (173,249) (253,139) (174,166) (140,795) (152,936) (18,973) (16,025) - (122,186) -
2,700 - 761 1,512 - - 153,964 94,808 51,713 121,200 123,294 -
12,058 7,477 29,747 45,120 24,104 107,650 3,970 91,389 84,996 168,263 24,756 105,267
(317,084) (60,642) (21,067) - 165,382 -
(462,846)$ 24,738$ 134,875$ 273,506$ 263,963$ 42,858$
7.5% 5.8% 6.6% 4.9% 4.8% 4.3%
Fiscal Year
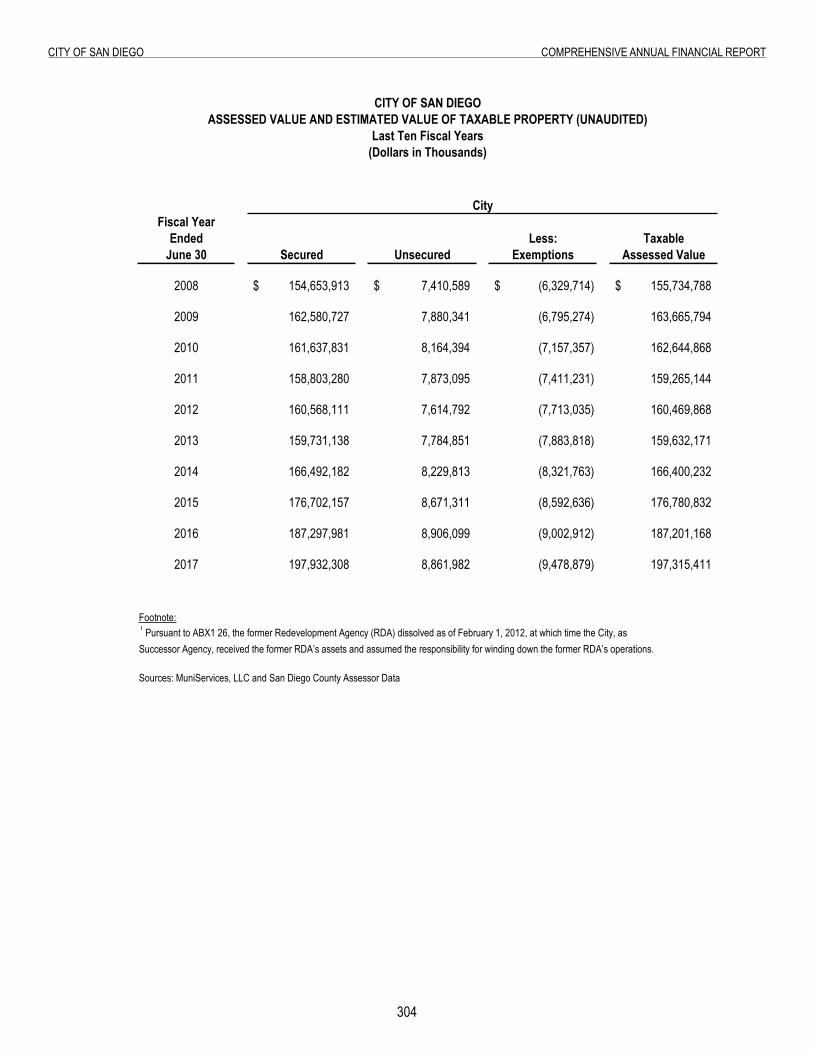
30�
City of San Diego ComprehenSive annual finanCial report
Table 5: Assessed Value and Estimated Value of Taxable Property
Fiscal YearEnded Less: Taxable
June 30 Secured Unsecured Exemptions Assessed Value
2008 154,653,913$ 7,410,589$ (6,329,714)$ 155,734,788$
2009 162,580,727 7,880,341 (6,795,274) 163,665,794
2010 161,637,831 8,164,394 (7,157,357) 162,644,868
2011 158,803,280 7,873,095 (7,411,231) 159,265,144
2012 160,568,111 7,614,792 (7,713,035) 160,469,868
2013 159,731,138 7,784,851 (7,883,818) 159,632,171
2014 166,492,182 8,229,813 (8,321,763) 166,400,232
2015 176,702,157 8,671,311 (8,592,636) 176,780,832
2016 187,297,981 8,906,099 (9,002,912) 187,201,168
2017 197,932,308 8,861,982 (9,478,879) 197,315,411
Footnote:1 Pursuant to ABX1 26, the former Redevelopment Agency (RDA) dissolved as of February 1, 2012, at which time the City, asSuccessor Agency, received the former RDA’s assets and assumed the responsibility for winding down the former RDA’s operations.
Sources: MuniServices, LLC and San Diego County Assessor Data
City
CITY OF SAN DIEGOASSESSED VALUE AND ESTIMATED VALUE OF TAXABLE PROPERTY (UNAUDITED)
Last Ten Fiscal Years(Dollars in Thousands)
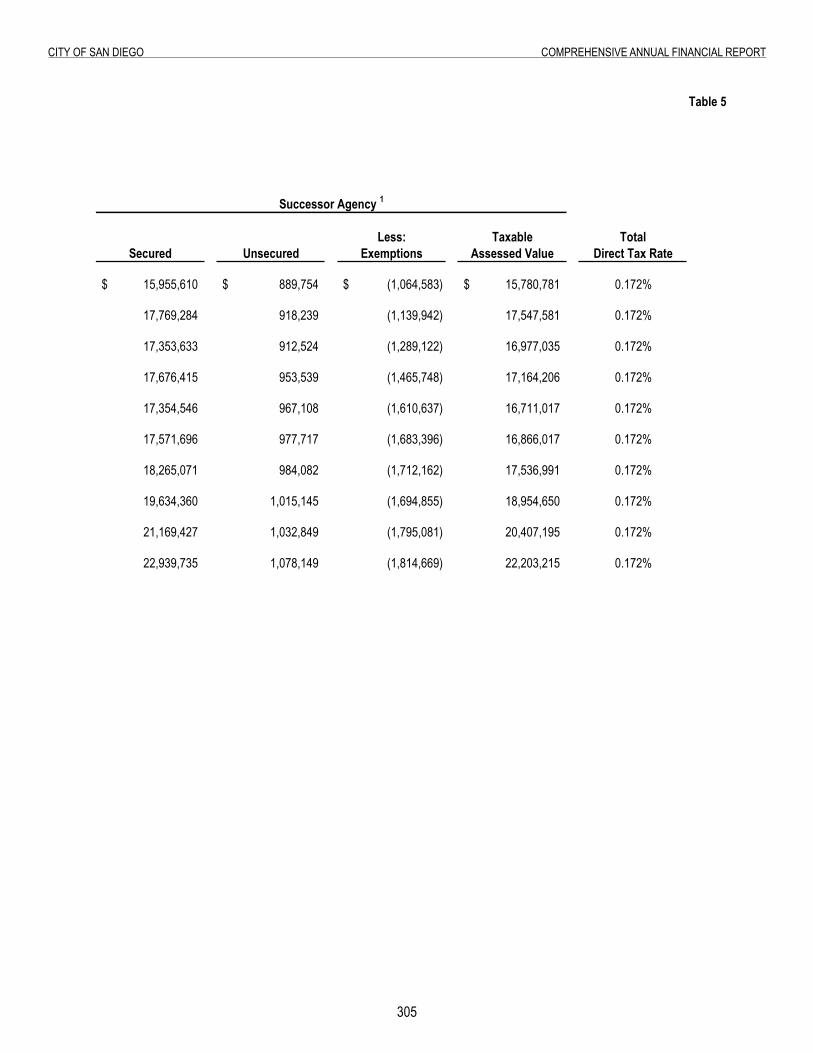
305
City of San Diego ComprehenSive annual finanCial report
Table 5
Less: Taxable TotalSecured Unsecured Exemptions Assessed Value Direct Tax Rate
15,955,610$ 889,754$ (1,064,583)$ 15,780,781$ 0.172%
17,769,284 918,239 (1,139,942) 17,547,581 0.172%
17,353,633 912,524 (1,289,122) 16,977,035 0.172%
17,676,415 953,539 (1,465,748) 17,164,206 0.172%
17,354,546 967,108 (1,610,637) 16,711,017 0.172%
17,571,696 977,717 (1,683,396) 16,866,017 0.172%
18,265,071 984,082 (1,712,162) 17,536,991 0.172%
19,634,360 1,015,145 (1,694,855) 18,954,650 0.172%
21,169,427 1,032,849 (1,795,081) 20,407,195 0.172%
22,939,735 1,078,149 (1,814,669) 22,203,215 0.172%
Successor Agency 1
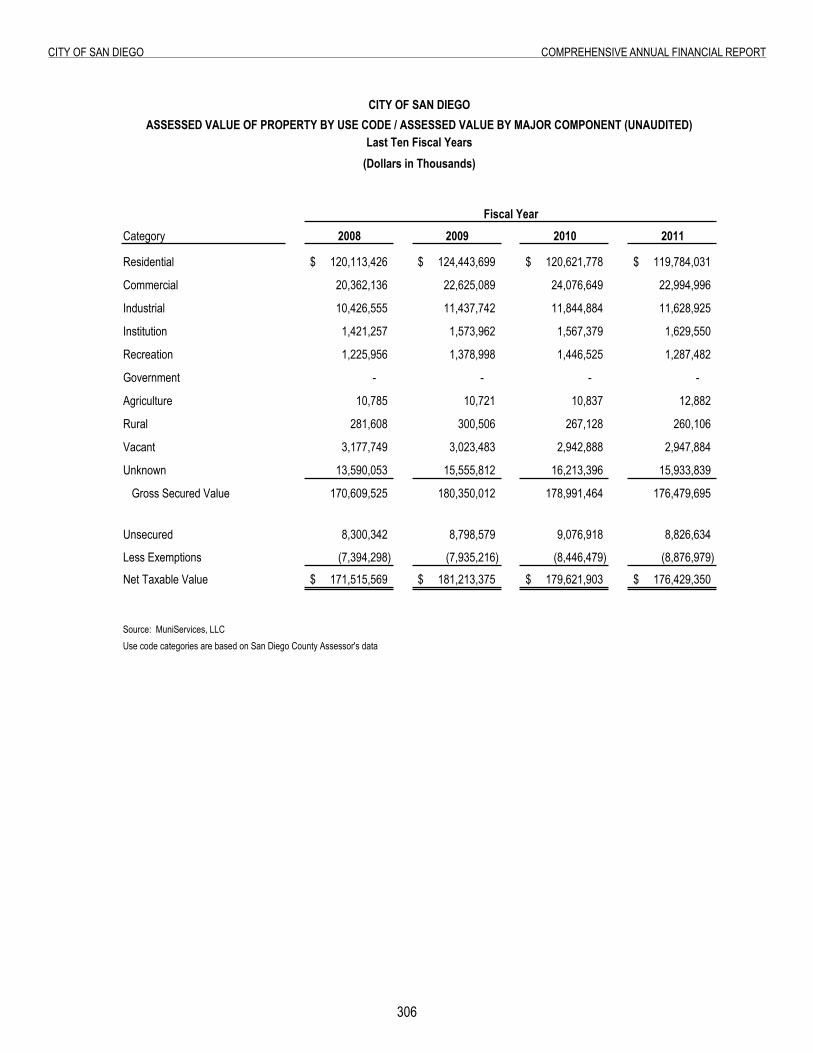
306
City of San Diego ComprehenSive annual finanCial report
Table 6: Assessed Value of Property Use Code / Assessed Value by Major Component
Category 2008 2009 2010 2011
Residential 120,113,426$ 124,443,699$ 120,621,778$ 119,784,031$
Commercial 20,362,136 22,625,089 24,076,649 22,994,996
Industrial 10,426,555 11,437,742 11,844,884 11,628,925
Institution 1,421,257 1,573,962 1,567,379 1,629,550
Recreation 1,225,956 1,378,998 1,446,525 1,287,482
Government - - - -
Agriculture 10,785 10,721 10,837 12,882
Rural 281,608 300,506 267,128 260,106
Vacant 3,177,749 3,023,483 2,942,888 2,947,884
Unknown 13,590,053 15,555,812 16,213,396 15,933,839
Gross Secured Value 170,609,525 180,350,012 178,991,464 176,479,695
Unsecured 8,300,342 8,798,579 9,076,918 8,826,634
Less Exemptions (7,394,298) (7,935,216) (8,446,479) (8,876,979)
Net Taxable Value 171,515,569$ 181,213,375$ 179,621,903$ 176,429,350$
Source: MuniServices, LLCUse code categories are based on San Diego County Assessor's data
CITY OF SAN DIEGOASSESSED VALUE OF PROPERTY BY USE CODE / ASSESSED VALUE BY MAJOR COMPONENT (UNAUDITED)
Last Ten Fiscal Years(Dollars in Thousands)
Fiscal Year
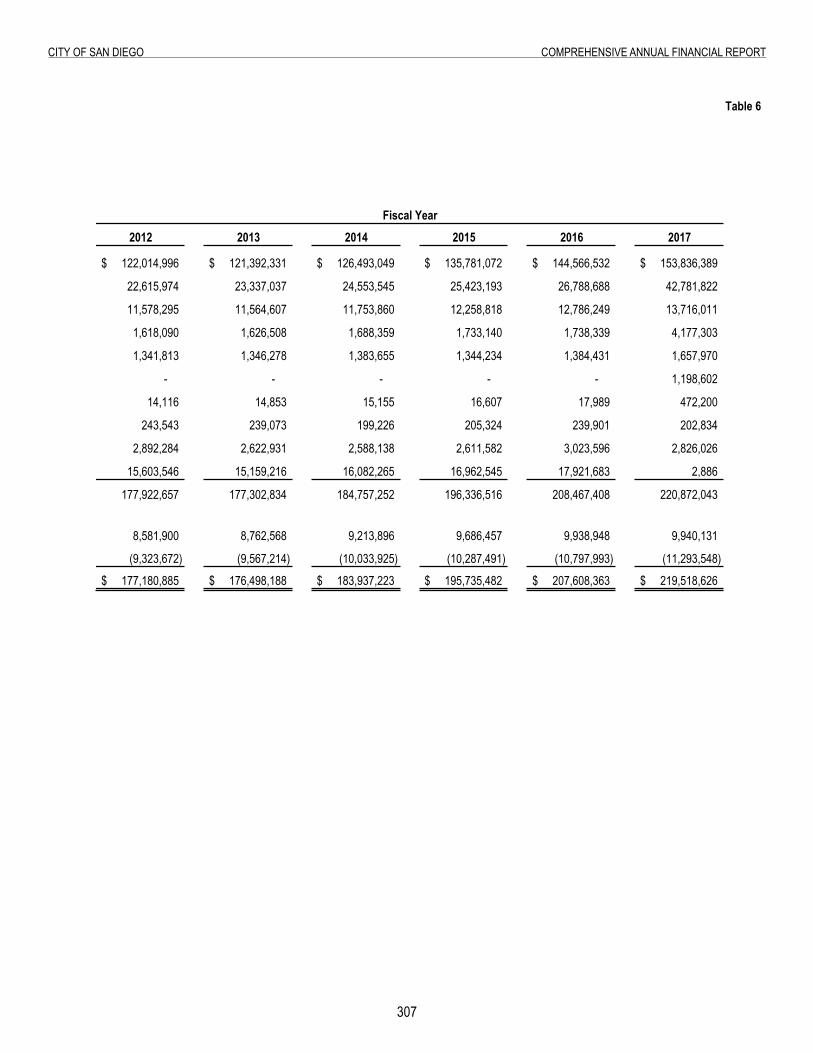
307
City of San Diego ComprehenSive annual finanCial report
Table 6
2012 2013 2014 2015 2016 2017
122,014,996$ 121,392,331$ 126,493,049$ 135,781,072$ 144,566,532$ 153,836,389$
22,615,974 23,337,037 24,553,545 25,423,193 26,788,688 42,781,822
11,578,295 11,564,607 11,753,860 12,258,818 12,786,249 13,716,011
1,618,090 1,626,508 1,688,359 1,733,140 1,738,339 4,177,303
1,341,813 1,346,278 1,383,655 1,344,234 1,384,431 1,657,970
- - - - - 1,198,602
14,116 14,853 15,155 16,607 17,989 472,200
243,543 239,073 199,226 205,324 239,901 202,834
2,892,284 2,622,931 2,588,138 2,611,582 3,023,596 2,826,026
15,603,546 15,159,216 16,082,265 16,962,545 17,921,683 2,886
177,922,657 177,302,834 184,757,252 196,336,516 208,467,408 220,872,043
8,581,900 8,762,568 9,213,896 9,686,457 9,938,948 9,940,131
(9,323,672) (9,567,214) (10,033,925) (10,287,491) (10,797,993) (11,293,548)
177,180,885$ 176,498,188$ 183,937,223$ 195,735,482$ 207,608,363$ 219,518,626$
Fiscal Year
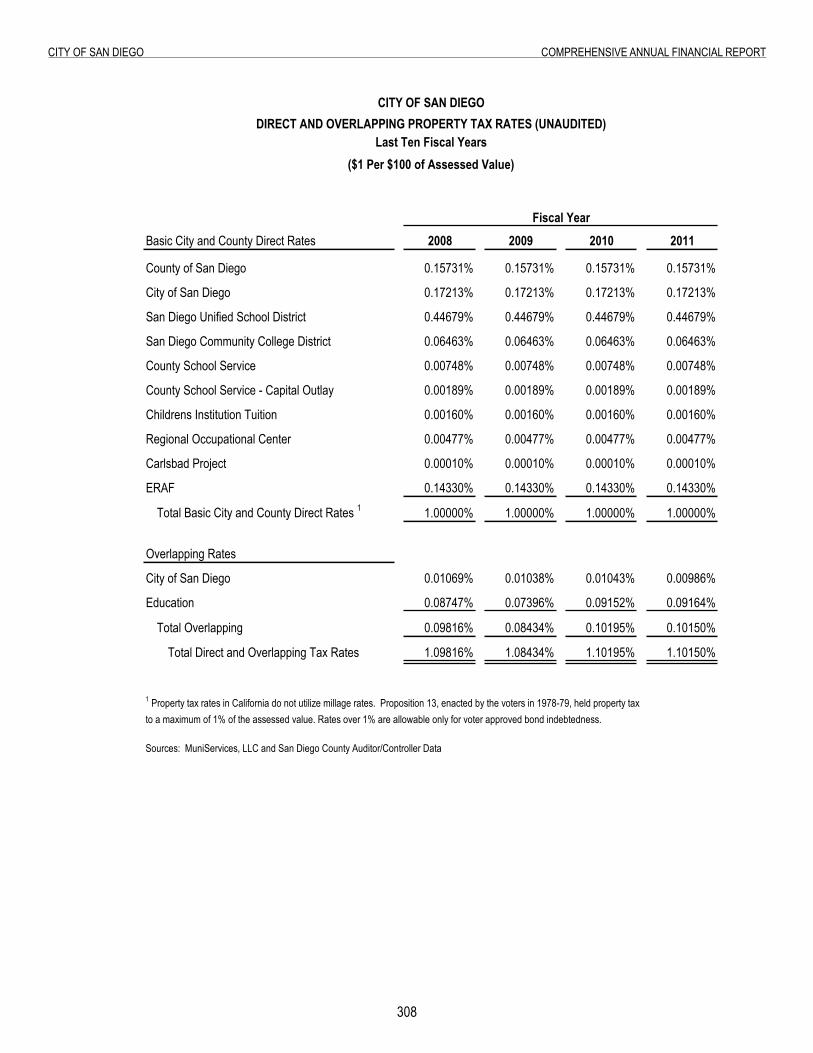
308
City of San Diego ComprehenSive annual finanCial report
Table 7: Direct and Overlapping Property Tax Rates
Basic City and County Direct Rates 2008 2009 2010 2011
County of San Diego 0.15731% 0.15731% 0.15731% 0.15731%
City of San Diego 0.17213% 0.17213% 0.17213% 0.17213%
San Diego Unified School District 0.44679% 0.44679% 0.44679% 0.44679%
San Diego Community College District 0.06463% 0.06463% 0.06463% 0.06463%
County School Service 0.00748% 0.00748% 0.00748% 0.00748%
County School Service - Capital Outlay 0.00189% 0.00189% 0.00189% 0.00189%
Childrens Institution Tuition 0.00160% 0.00160% 0.00160% 0.00160%
Regional Occupational Center 0.00477% 0.00477% 0.00477% 0.00477%
Carlsbad Project 0.00010% 0.00010% 0.00010% 0.00010%
ERAF 0.14330% 0.14330% 0.14330% 0.14330%
Total Basic City and County Direct Rates 1 1.00000% 1.00000% 1.00000% 1.00000%
Overlapping Rates
City of San Diego 0.01069% 0.01038% 0.01043% 0.00986%
Education 0.08747% 0.07396% 0.09152% 0.09164%
Total Overlapping 0.09816% 0.08434% 0.10195% 0.10150%
Total Direct and Overlapping Tax Rates 1.09816% 1.08434% 1.10195% 1.10150%
1 Property tax rates in California do not utilize millage rates. Proposition 13, enacted by the voters in 1978-79, held property taxto a maximum of 1% of the assessed value. Rates over 1% are allowable only for voter approved bond indebtedness.
Sources: MuniServices, LLC and San Diego County Auditor/Controller Data
CITY OF SAN DIEGODIRECT AND OVERLAPPING PROPERTY TAX RATES (UNAUDITED)
Last Ten Fiscal Years($1 Per $100 of Assessed Value)
Fiscal Year
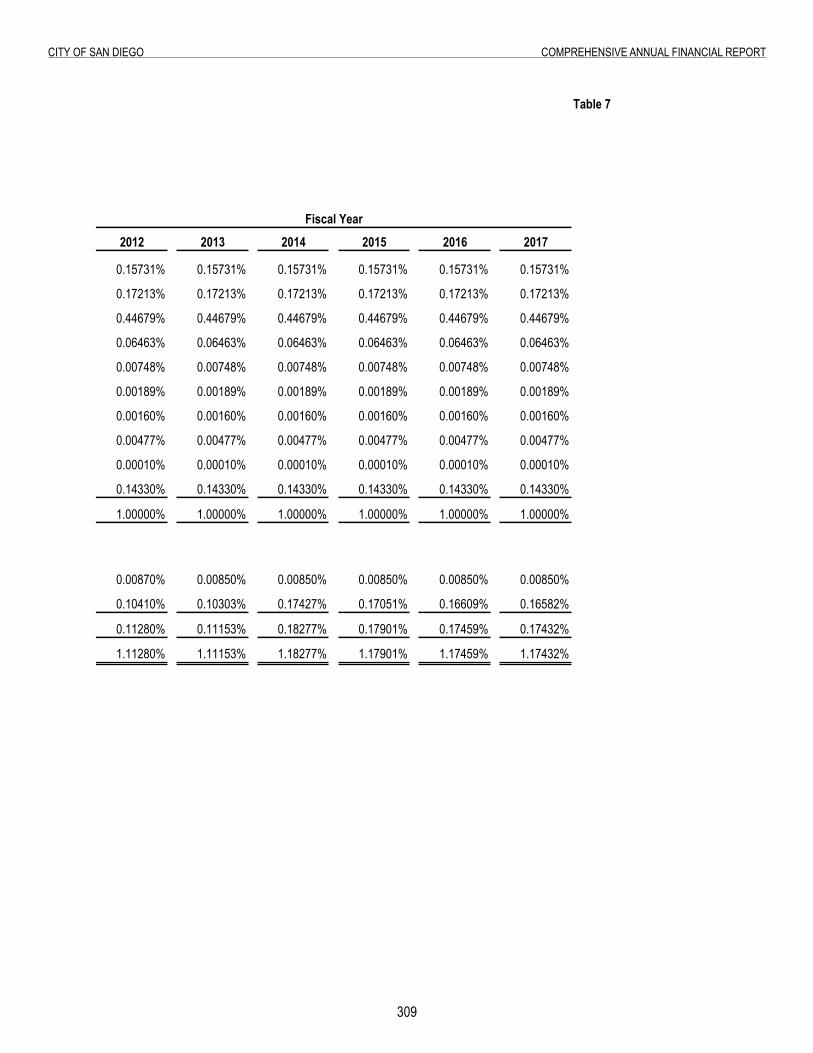
309
City of San Diego ComprehenSive annual finanCial report
Table 7
2012 2013 2014 2015 2016 2017
0.15731% 0.15731% 0.15731% 0.15731% 0.15731% 0.15731%
0.17213% 0.17213% 0.17213% 0.17213% 0.17213% 0.17213%
0.44679% 0.44679% 0.44679% 0.44679% 0.44679% 0.44679%
0.06463% 0.06463% 0.06463% 0.06463% 0.06463% 0.06463%
0.00748% 0.00748% 0.00748% 0.00748% 0.00748% 0.00748%
0.00189% 0.00189% 0.00189% 0.00189% 0.00189% 0.00189%
0.00160% 0.00160% 0.00160% 0.00160% 0.00160% 0.00160%
0.00477% 0.00477% 0.00477% 0.00477% 0.00477% 0.00477%
0.00010% 0.00010% 0.00010% 0.00010% 0.00010% 0.00010%
0.14330% 0.14330% 0.14330% 0.14330% 0.14330% 0.14330%
1.00000% 1.00000% 1.00000% 1.00000% 1.00000% 1.00000%
0.00870% 0.00850% 0.00850% 0.00850% 0.00850% 0.00850%
0.10410% 0.10303% 0.17427% 0.17051% 0.16609% 0.16582%
0.11280% 0.11153% 0.18277% 0.17901% 0.17459% 0.17432%
1.11280% 1.11153% 1.18277% 1.17901% 1.17459% 1.17432%
Fiscal Year
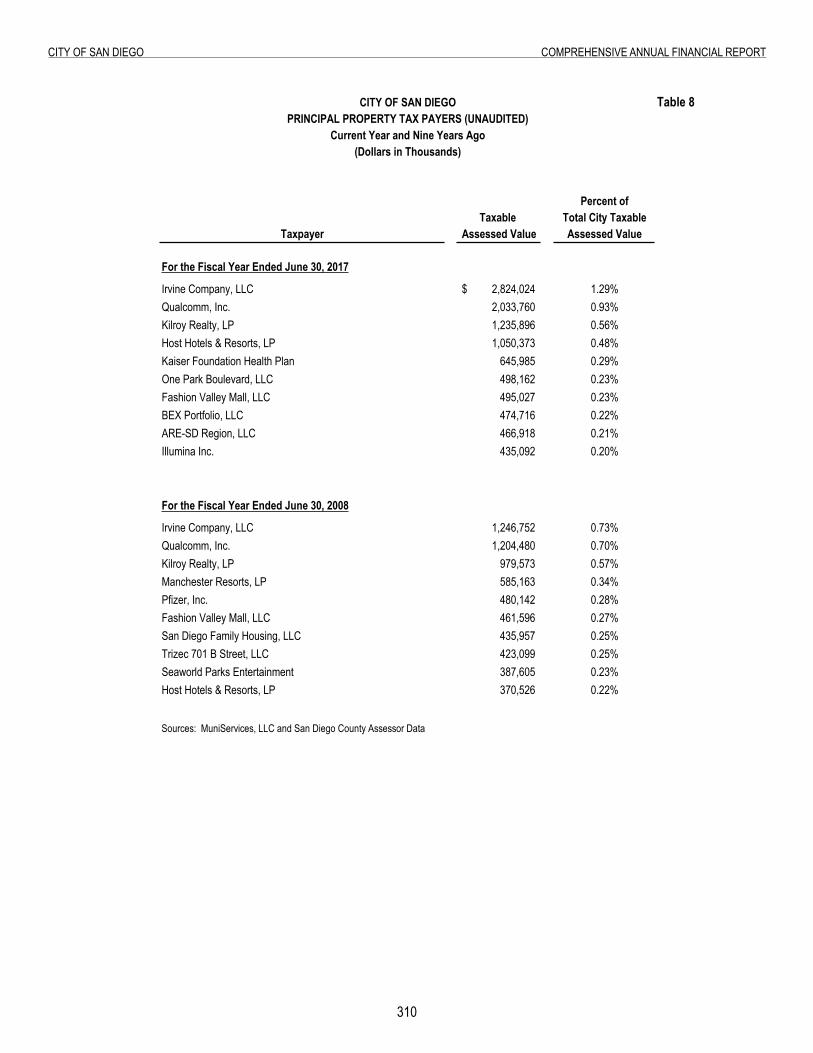
310
City of San Diego ComprehenSive annual finanCial report
table 8: principal property tax payers
Table 8
Percent ofTaxable Total City Taxable
Taxpayer Assessed Value Assessed Value
For the Fiscal Year Ended June 30, 2017
Irvine Company, LLC 2,824,024$ 1.29%Qualcomm, Inc. 2,033,760 0.93%Kilroy Realty, LP 1,235,896 0.56%Host Hotels & Resorts, LP 1,050,373 0.48%Kaiser Foundation Health Plan 645,985 0.29%One Park Boulevard, LLC 498,162 0.23%Fashion Valley Mall, LLC 495,027 0.23%BEX Portfolio, LLC 474,716 0.22%ARE-SD Region, LLC 466,918 0.21%Illumina Inc. 435,092 0.20%
For the Fiscal Year Ended June 30, 2008
Irvine Company, LLC 1,246,752 0.73%Qualcomm, Inc. 1,204,480 0.70%Kilroy Realty, LP 979,573 0.57%Manchester Resorts, LP 585,163 0.34%Pfizer, Inc. 480,142 0.28%Fashion Valley Mall, LLC 461,596 0.27%San Diego Family Housing, LLC 435,957 0.25%Trizec 701 B Street, LLC 423,099 0.25%Seaworld Parks Entertainment 387,605 0.23%Host Hotels & Resorts, LP 370,526 0.22%
Sources: MuniServices, LLC and San Diego County Assessor Data
CITY OF SAN DIEGOPRINCIPAL PROPERTY TAX PAYERS (UNAUDITED)
Current Year and Nine Years Ago(Dollars in Thousands)
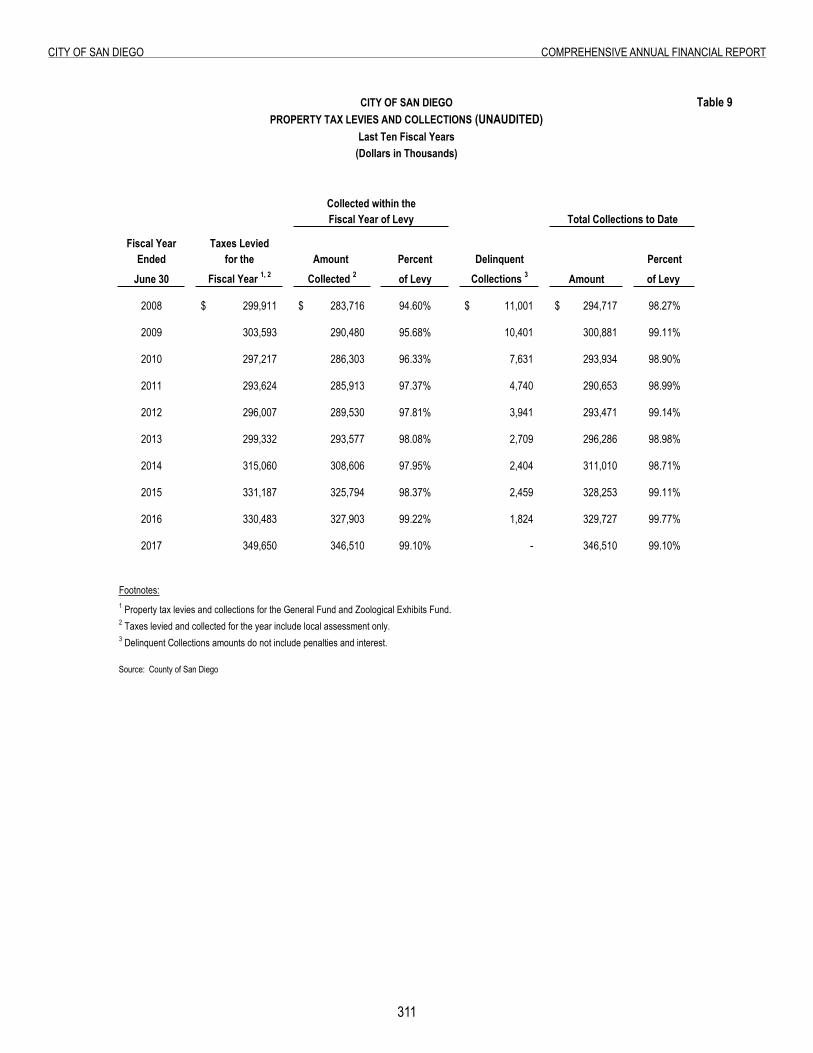
311
City of San Diego ComprehenSive annual finanCial report
Table 9: Property Tax Levies and Collections
Table 9
Fiscal Year Taxes LeviedEnded for the Amount Percent Delinquent Percent
June 30 Fiscal Year 1, 2 Collected 2 of Levy Collections 3 Amount of Levy
2008 299,911$ 283,716$ 94.60% 11,001$ 294,717$ 98.27%
2009 303,593 290,480 95.68% 10,401 300,881 99.11%
2010 297,217 286,303 96.33% 7,631 293,934 98.90%
2011 293,624 285,913 97.37% 4,740 290,653 98.99%
2012 296,007 289,530 97.81% 3,941 293,471 99.14%
2013 299,332 293,577 98.08% 2,709 296,286 98.98%
2014 315,060 308,606 97.95% 2,404 311,010 98.71%
2015 331,187 325,794 98.37% 2,459 328,253 99.11%
2016 330,483 327,903 99.22% 1,824 329,727 99.77%
2017 349,650 346,510 99.10% - 346,510 99.10%
Footnotes:1 Property tax levies and collections for the General Fund and Zoological Exhibits Fund.2 Taxes levied and collected for the year include local assessment only.3 Delinquent Collections amounts do not include penalties and interest.
Source: County of San Diego
Fiscal Year of Levy Total Collections to DateCollected within the
CITY OF SAN DIEGOPROPERTY TAX LEVIES AND COLLECTIONS (UNAUDITED)
Last Ten Fiscal Years(Dollars in Thousands)
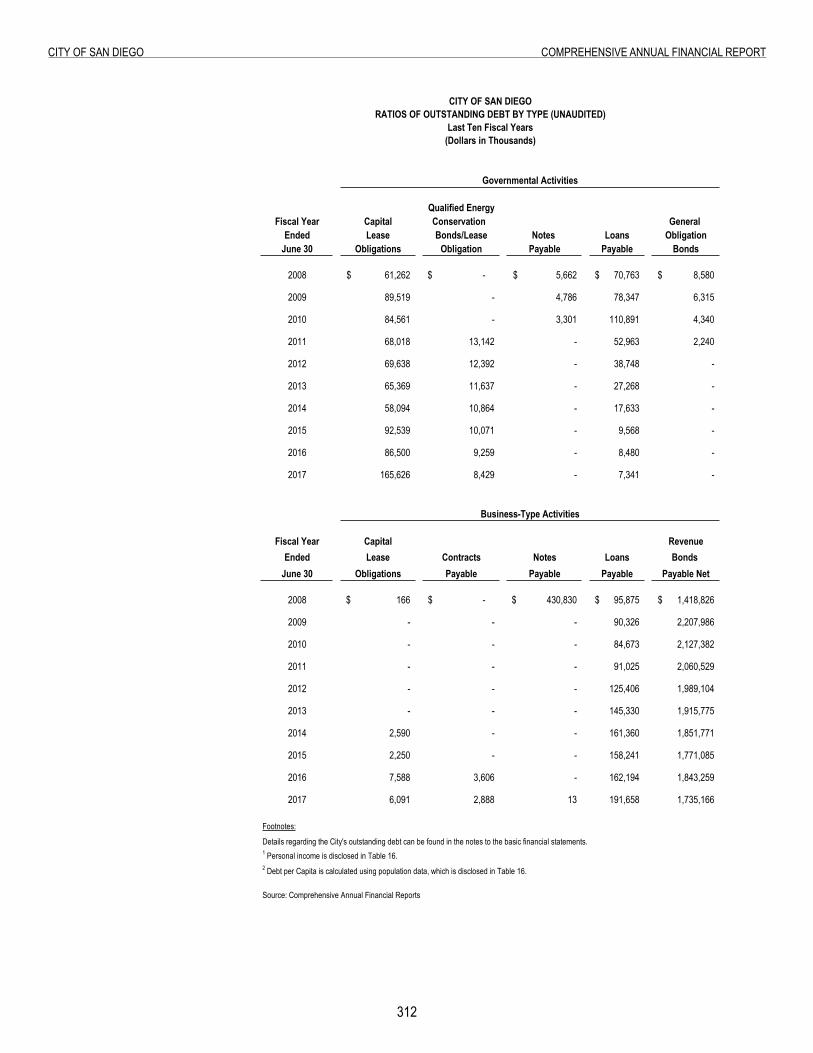
312
City of San Diego ComprehenSive annual finanCial report
Table 10: Ratios of Outstanding Debt by Type
CITY OF SAN DIEGORATIOS OF OUTSTANDING DEBT BY TYPE (UNAUDITED)
Last Ten Fiscal Years(Dollars in Thousands)
Governmental Activities
Qualified EnergyFiscal Year Capital Conservation General
Ended Lease Bonds/Lease Notes Loans ObligationJune 30 Obligations Obligation Payable Payable Bonds
2008 61,262$ -$ 5,662$ 70,763$ 8,580$
2009 89,519 - 4,786 78,347 6,315
2010 84,561 - 3,301 110,891 4,340
2011 68,018 13,142 - 52,963 2,240
2012 69,638 12,392 - 38,748 -
2013 65,369 11,637 - 27,268 -
2014 58,094 10,864 - 17,633 -
2015 92,539 10,071 - 9,568 -
2016 86,500 9,259 - 8,480 -
2017 165,626 8,429 - 7,341 -
Business-Type Activities
Fiscal Year Capital RevenueEnded Lease Contracts Notes Loans Bonds
June 30 Obligations Payable Payable Payable Payable Net
2008 166$ -$ 430,830$ 95,875$ 1,418,826$
2009 - - - 90,326 2,207,986
2010 - - - 84,673 2,127,382
2011 - - - 91,025 2,060,529
2012 - - - 125,406 1,989,104
2013 - - - 145,330 1,915,775
2014 2,590 - - 161,360 1,851,771
2015 2,250 - - 158,241 1,771,085
2016 7,588 3,606 - 162,194 1,843,259
2017 6,091 2,888 13 191,658 1,735,166
Footnotes:
Details regarding the City's outstanding debt can be found in the notes to the basic financial statements.1 Personal income is disclosed in Table 16.2 Debt per Capita is calculated using population data, which is disclosed in Table 16.
Source: Comprehensive Annual Financial Reports
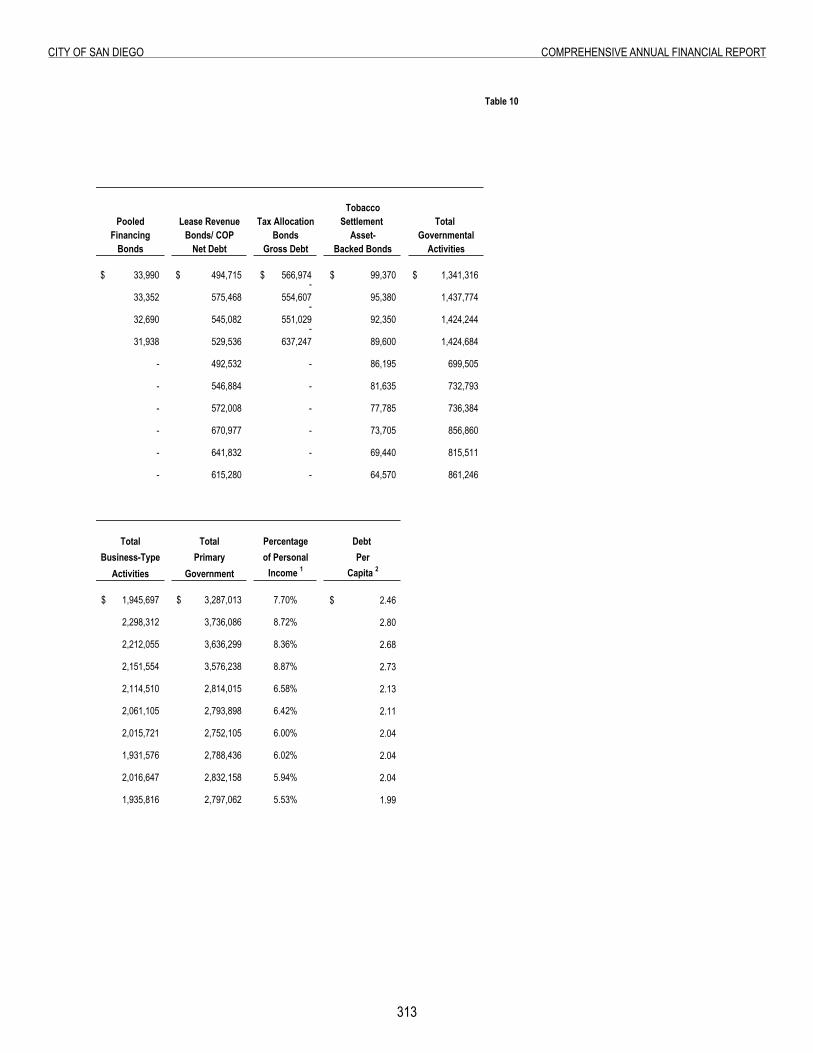
313
City of San Diego ComprehenSive annual finanCial report
Table 10
TobaccoPooled Lease Revenue Tax Allocation Settlement Total
Financing Bonds/ COP Bonds Asset- GovernmentalBonds Net Debt Gross Debt Backed Bonds Activities
33,990$ 494,715$ 566,974$ 99,370$ 1,341,316$ -
33,352 575,468 554,607 95,380 1,437,774 -
32,690 545,082 551,029 92,350 1,424,244 -
31,938 529,536 637,247 89,600 1,424,684
- 492,532 - 86,195 699,505
- 546,884 - 81,635 732,793
- 572,008 - 77,785 736,384
- 670,977 - 73,705 856,860
- 641,832 - 69,440 815,511
- 615,280 - 64,570 861,246
Total Total Percentage Debt Business-Type Primary of Personal Per
Activities Government Income 1 Capita 2
1,945,697$ 3,287,013$ 7.70% 2.46$
2,298,312 3,736,086 8.72% 2.80
2,212,055 3,636,299 8.36% 2.68
2,151,554 3,576,238 8.87% 2.73
2,114,510 2,814,015 6.58% 2.13
2,061,105 2,793,898 6.42% 2.11
2,015,721 2,752,105 6.00% 2.04
1,931,576 2,788,436 6.02% 2.04
2,016,647 2,832,158 5.94% 2.04
1,935,816 2,797,062 5.53% 1.99
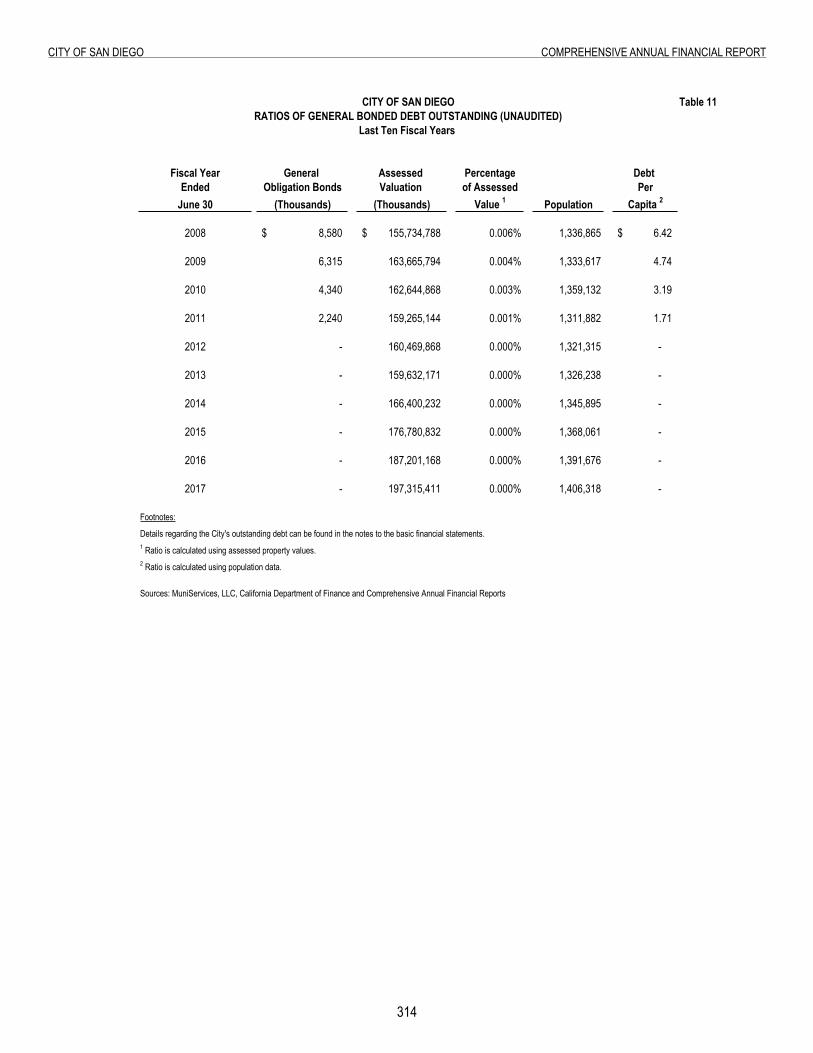
31�
City of San Diego ComprehenSive annual finanCial report
Table 11: Ratios of General Bonded Debt Outstanding
Table 11
Fiscal Year General Assessed Percentage Debt Ended Obligation Bonds Valuation of Assessed Per
June 30 (Thousands) (Thousands) Value 1 Population Capita 2
2008 8,580$ 155,734,788$ 0.006% 1,336,865 6.42$
2009 6,315 163,665,794 0.004% 1,333,617 4.74
2010 4,340 162,644,868 0.003% 1,359,132 3.19
2011 2,240 159,265,144 0.001% 1,311,882 1.71
2012 - 160,469,868 0.000% 1,321,315 -
2013 - 159,632,171 0.000% 1,326,238 -
2014 - 166,400,232 0.000% 1,345,895 -
2015 - 176,780,832 0.000% 1,368,061 -
2016 - 187,201,168 0.000% 1,391,676 -
2017 - 197,315,411 0.000% 1,406,318 -
Footnotes:
Details regarding the City's outstanding debt can be found in the notes to the basic financial statements.1 Ratio is calculated using assessed property values. 2 Ratio is calculated using population data.
Sources: MuniServices, LLC, California Department of Finance and Comprehensive Annual Financial Reports
CITY OF SAN DIEGORATIOS OF GENERAL BONDED DEBT OUTSTANDING (UNAUDITED)
Last Ten Fiscal Years

this page intentionally left Blank
315
Page Intentionally Left Blank
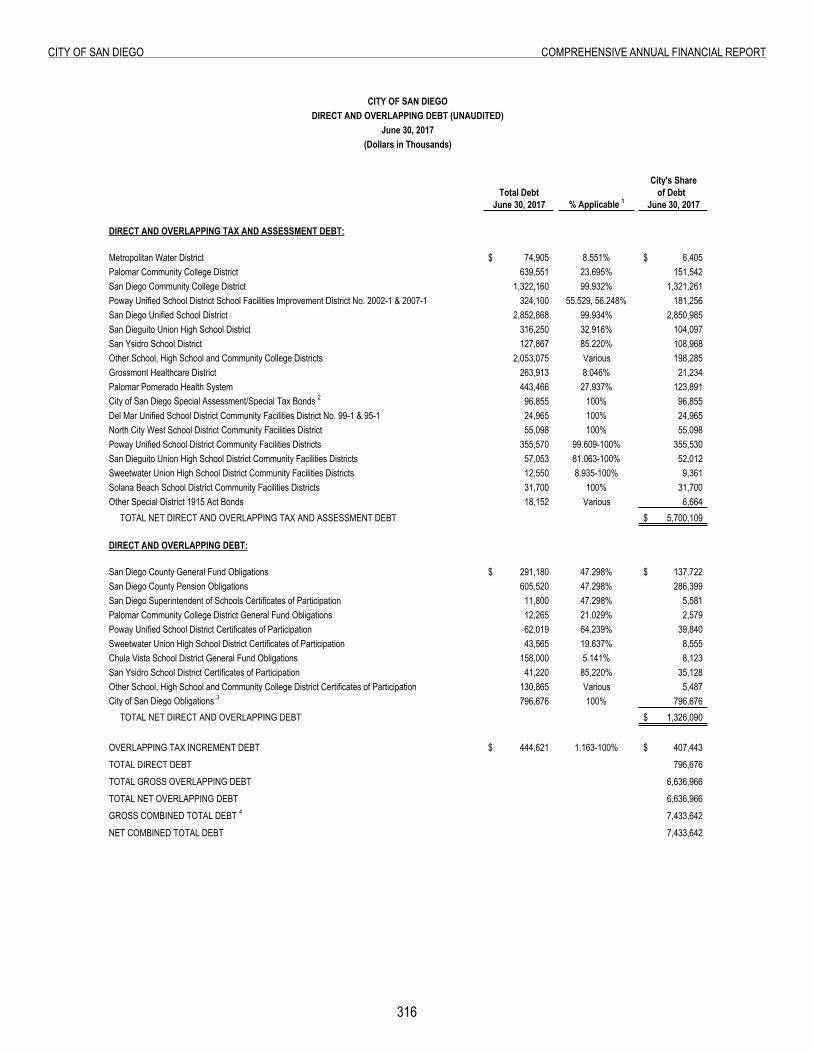
316
City of San Diego ComprehenSive annual finanCial report
Table 12: Direct and Overlapping Debt
City's ShareTotal Debt of Debt
June 30, 2017 % Applicable 1 June 30, 2017
DIRECT AND OVERLAPPING TAX AND ASSESSMENT DEBT:
Metropolitan Water District 74,905$ 8.551% 6,405$ Palomar Community College District 639,551 23.695% 151,542 San Diego Community College District 1,322,160 99.932% 1,321,261 Poway Unified School District School Facilities Improvement District No. 2002-1 & 2007-1 324,100 55.529, 56.248% 181,256 San Diego Unified School District 2,852,868 99.934% 2,850,985 San Dieguito Union High School District 316,250 32.916% 104,097 San Ysidro School District 127,867 85.220% 108,968 Other School, High School and Community College Districts 2,053,075 Various 198,285 Grossmont Healthcare District 263,913 8.046% 21,234 Palomar Pomerado Health System 443,466 27.937% 123,891 City of San Diego Special Assessment/Special Tax Bonds 2 96,855 100% 96,855 Del Mar Unified School District Community Facilities District No. 99-1 & 95-1 24,965 100% 24,965 North City West School District Community Facilities District 55,098 100% 55,098 Poway Unified School District Community Facilities Districts 355,570 99.609-100% 355,530 San Dieguito Union High School District Community Facilities Districts 57,053 81.063-100% 52,012 Sweetwater Union High School District Community Facilities Districts 12,550 8.935-100% 9,361 Solana Beach School District Community Facilities Districts 31,700 100% 31,700 Other Special District 1915 Act Bonds 18,152 Various 6,664 TOTAL NET DIRECT AND OVERLAPPING TAX AND ASSESSMENT DEBT 5,700,109$
DIRECT AND OVERLAPPING DEBT:
San Diego County General Fund Obligations 291,180$ 47.298% 137,722$ San Diego County Pension Obligations 605,520 47.298% 286,399 San Diego Superintendent of Schools Certificates of Participation 11,800 47.298% 5,581 Palomar Community College District General Fund Obligations 12,265 21.029% 2,579 Poway Unified School District Certificates of Participation 62,019 64.239% 39,840 Sweetwater Union High School District Certificates of Participation 43,565 19.637% 8,555 Chula Vista School District General Fund Obligations 158,000 5.141% 8,123 San Ysidro School District Certificates of Participation 41,220 85.220% 35,128 Other School, High School and Community College District Certificates of Participation 130,865 Various 5,487 City of San Diego Obligations 3 796,676 100% 796,676 TOTAL NET DIRECT AND OVERLAPPING DEBT 1,326,090$
OVERLAPPING TAX INCREMENT DEBT 444,621$ 1.163-100% 407,443$ TOTAL DIRECT DEBT 796,676 TOTAL GROSS OVERLAPPING DEBT 6,636,966 TOTAL NET OVERLAPPING DEBT 6,636,966 GROSS COMBINED TOTAL DEBT 4 7,433,642 NET COMBINED TOTAL DEBT 7,433,642
CITY OF SAN DIEGODIRECT AND OVERLAPPING DEBT (UNAUDITED)
June 30, 2017(Dollars in Thousands)
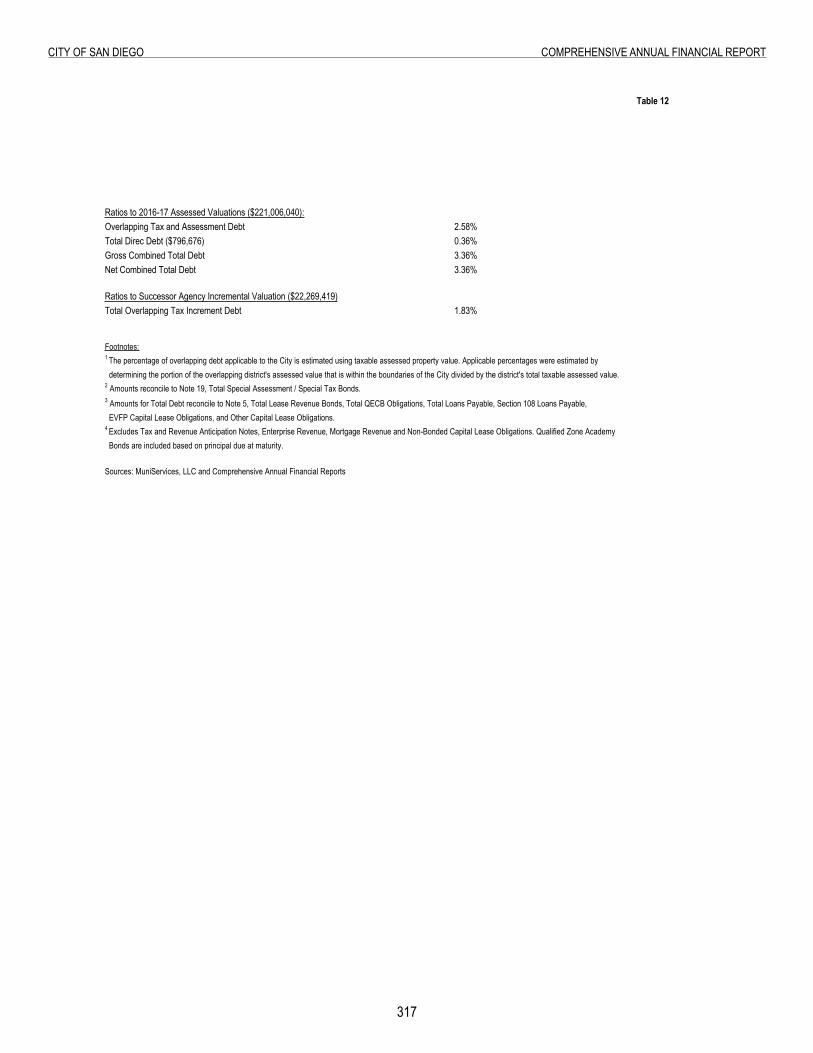
317
City of San Diego ComprehenSive annual finanCial report
Table 12
Ratios to 2016-17 Assessed Valuations ($221,006,040):Overlapping Tax and Assessment Debt 2.58%Total Direc Debt ($796,676) 0.36%Gross Combined Total Debt 3.36%Net Combined Total Debt 3.36%
Ratios to Successor Agency Incremental Valuation ($22,269,419)Total Overlapping Tax Increment Debt 1.83%
Footnotes:1 The percentage of overlapping debt applicable to the City is estimated using taxable assessed property value. Applicable percentages were estimated by determining the portion of the overlapping district's assessed value that is within the boundaries of the City divided by the district's total taxable assessed value.2 Amounts reconcile to Note 19, Total Special Assessment / Special Tax Bonds.3 Amounts for Total Debt reconcile to Note 5, Total Lease Revenue Bonds, Total QECB Obligations, Total Loans Payable, Section 108 Loans Payable, EVFP Capital Lease Obligations, and Other Capital Lease Obligations.4 Excludes Tax and Revenue Anticipation Notes, Enterprise Revenue, Mortgage Revenue and Non-Bonded Capital Lease Obligations. Qualified Zone Academy Bonds are included based on principal due at maturity.
Sources: MuniServices, LLC and Comprehensive Annual Financial Reports
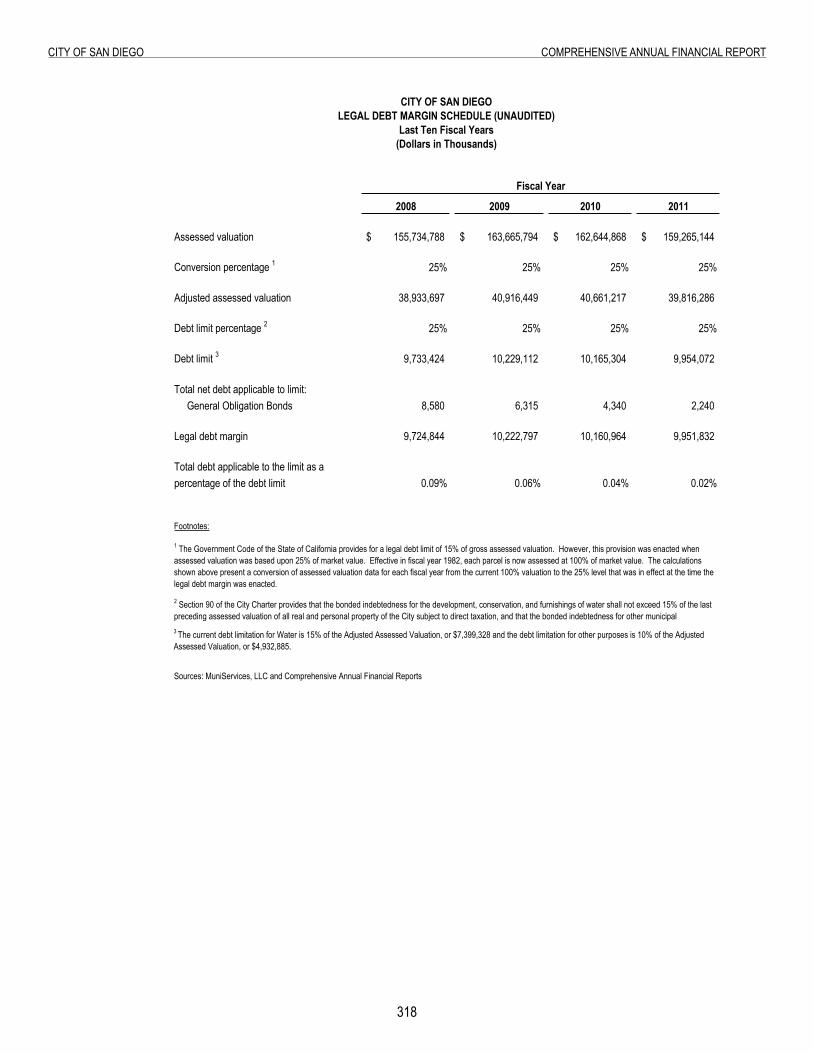
318
City of San Diego ComprehenSive annual finanCial report
Table 13: Legal Debt Margin Schedule
2008 2009 2010 2011
Assessed valuation 155,734,788$ 163,665,794$ 162,644,868$ 159,265,144$
Conversion percentage 1 25% 25% 25% 25%
Adjusted assessed valuation 38,933,697 40,916,449 40,661,217 39,816,286
Debt limit percentage 2 25% 25% 25% 25%
Debt limit 3 9,733,424 10,229,112 10,165,304 9,954,072
Total net debt applicable to limit: General Obligation Bonds 8,580 6,315 4,340 2,240
Legal debt margin 9,724,844 10,222,797 10,160,964 9,951,832
Total debt applicable to the limit as apercentage of the debt limit 0.09% 0.06% 0.04% 0.02%
Footnotes:
Sources: MuniServices, LLC and Comprehensive Annual Financial Reports
CITY OF SAN DIEGOLEGAL DEBT MARGIN SCHEDULE (UNAUDITED)
Last Ten Fiscal Years(Dollars in Thousands)
Fiscal Year
1 The Government Code of the State of California provides for a legal debt limit of 15% of gross assessed valuation. However, this provision was enacted when assessed valuation was based upon 25% of market value. Effective in fiscal year 1982, each parcel is now assessed at 100% of market value. The calculations shown above present a conversion of assessed valuation data for each fiscal year from the current 100% valuation to the 25% level that was in effect at the time the legal debt margin was enacted.
2 Section 90 of the City Charter provides that the bonded indebtedness for the development, conservation, and furnishings of water shall not exceed 15% of the last preceding assessed valuation of all real and personal property of the City subject to direct taxation, and that the bonded indebtedness for other municipal 3 The current debt limitation for Water is 15% of the Adjusted Assessed Valuation, or $7,399,328 and the debt limitation for other purposes is 10% of the Adjusted Assessed Valuation, or $4,932,885.
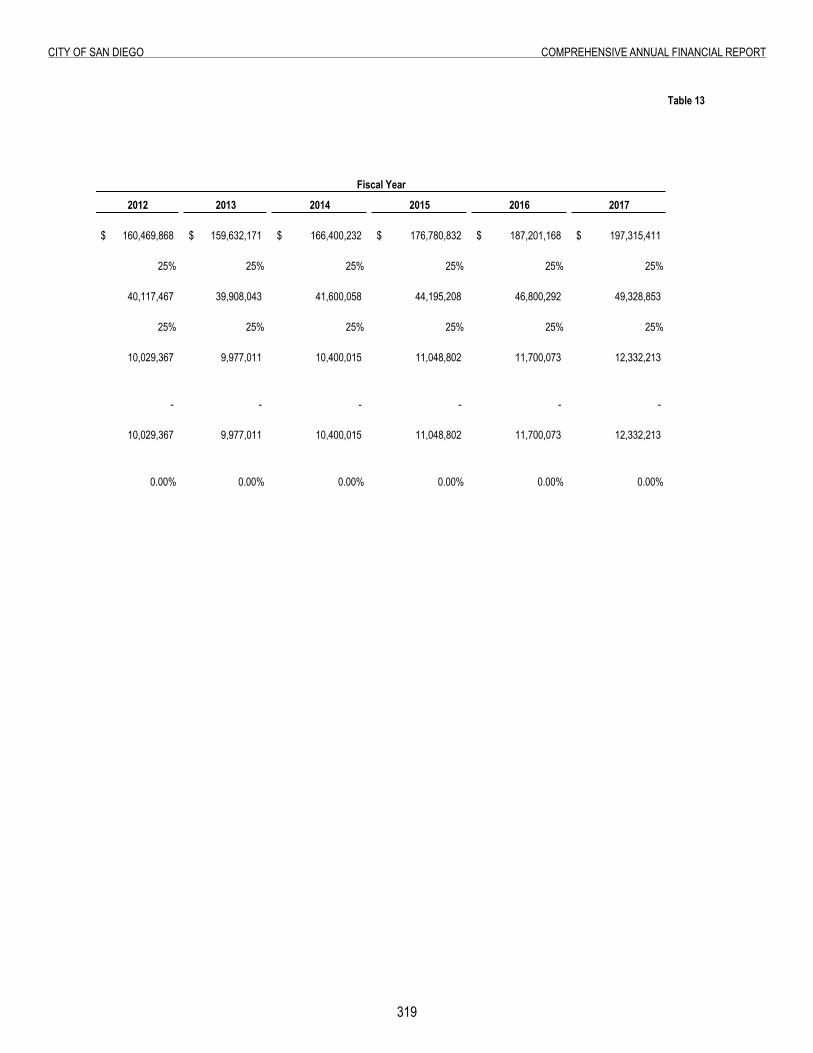
319
City of San Diego ComprehenSive annual finanCial report
Table 13
2012 2013 2014 2015 2016 2017
160,469,868$ 159,632,171$ 166,400,232$ 176,780,832$ 187,201,168$ 197,315,411$
25% 25% 25% 25% 25% 25%
40,117,467 39,908,043 41,600,058 44,195,208 46,800,292 49,328,853
25% 25% 25% 25% 25% 25%
10,029,367 9,977,011 10,400,015 11,048,802 11,700,073 12,332,213
- - - - - -
10,029,367 9,977,011 10,400,015 11,048,802 11,700,073 12,332,213
0.00% 0.00% 0.00% 0.00% 0.00% 0.00%
Fiscal Year
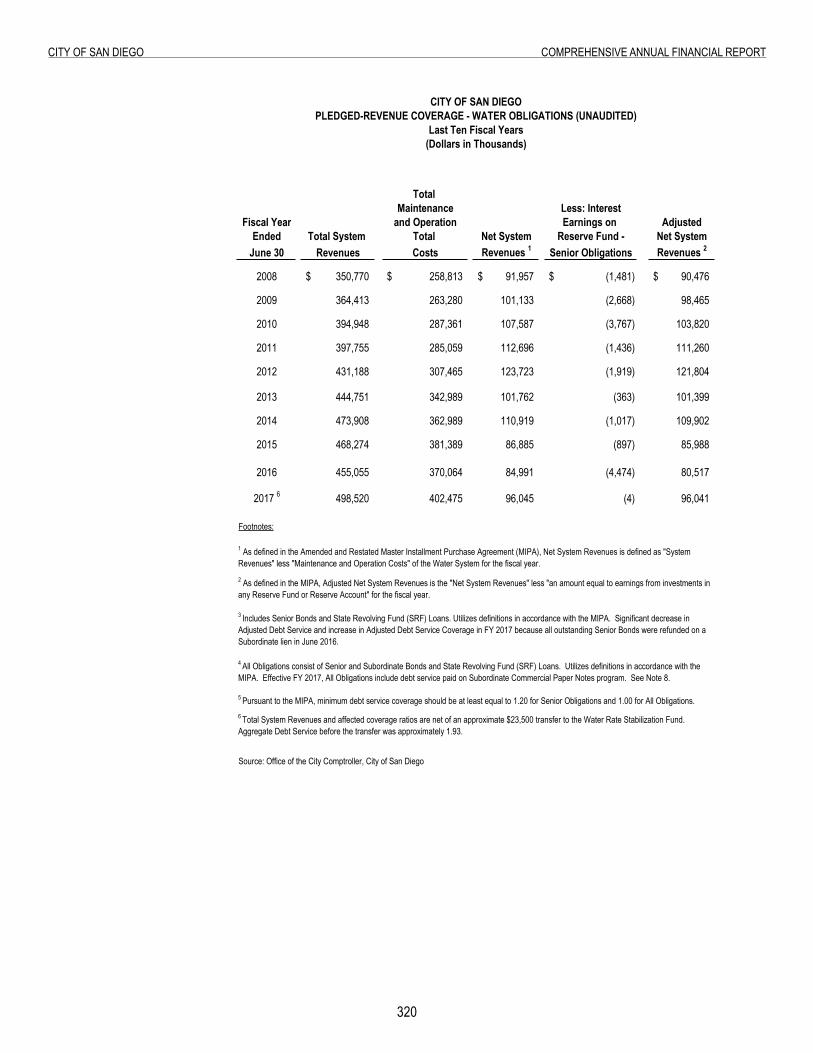
320
City of San Diego ComprehenSive annual finanCial report
Table 14: Pledged-Revenue Coverage - Water Obligations
Total Maintenance Less: Interest
Fiscal Year and Operation Earnings on AdjustedEnded Total System Total Net System Reserve Fund - Net System
June 30 Revenues Costs Revenues 1 Senior Obligations Revenues 2
2008 350,770$ 258,813$ 91,957$ (1,481)$ 90,476$
2009 364,413 263,280 101,133 (2,668) 98,465
2010 394,948 287,361 107,587 (3,767) 103,820
2011 397,755 285,059 112,696 (1,436) 111,260
2012 431,188 307,465 123,723 (1,919) 121,804
2013 444,751 342,989 101,762 (363) 101,399
2014 473,908 362,989 110,919 (1,017) 109,902
2015 468,274 381,389 86,885 (897) 85,988
2016 455,055 370,064 84,991 (4,474) 80,517
2017 6 498,520 402,475 96,045 (4) 96,041
Footnotes:
Source: Office of the City Comptroller, City of San Diego
CITY OF SAN DIEGOPLEDGED-REVENUE COVERAGE - WATER OBLIGATIONS (UNAUDITED)
Last Ten Fiscal Years(Dollars in Thousands)
1 As defined in the Amended and Restated Master Installment Purchase Agreement (MIPA), Net System Revenues is defined as "System Revenues" less "Maintenance and Operation Costs" of the Water System for the fiscal year.
5 Pursuant to the MIPA, minimum debt service coverage should be at least equal to 1.20 for Senior Obligations and 1.00 for All Obligations.6 Total System Revenues and affected coverage ratios are net of an approximate $23,500 transfer to the Water Rate Stabilization Fund. Aggregate Debt Service before the transfer was approximately 1.93.
2 As defined in the MIPA, Adjusted Net System Revenues is the "Net System Revenues" less "an amount equal to earnings from investments in any Reserve Fund or Reserve Account" for the fiscal year.
3 Includes Senior Bonds and State Revolving Fund (SRF) Loans. Utilizes definitions in accordance with the MIPA. Significant decrease in Adjusted Debt Service and increase in Adjusted Debt Service Coverage in FY 2017 because all outstanding Senior Bonds were refunded on a Subordinate lien in June 2016.
4 All Obligations consist of Senior and Subordinate Bonds and State Revolving Fund (SRF) Loans. Utilizes definitions in accordance with the MIPA. Effective FY 2017, All Obligations include debt service paid on Subordinate Commercial Paper Notes program. See Note 8.
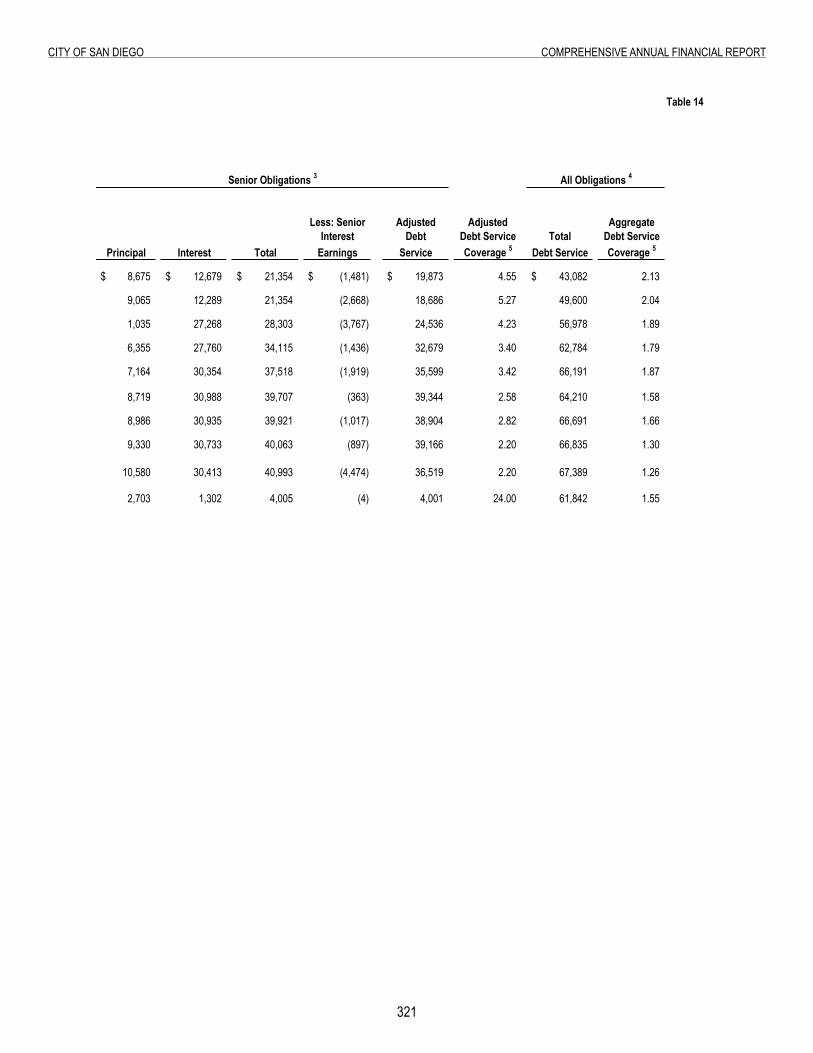
321
City of San Diego ComprehenSive annual finanCial report
Table 14
Less: Senior Adjusted Adjusted AggregateInterest Debt Debt Service Total Debt Service
Principal Interest Total Earnings Service Coverage 5 Debt Service Coverage 5
8,675$ 12,679$ 21,354$ (1,481)$ 19,873$ 4.55 43,082$ 2.13
9,065 12,289 21,354 (2,668) 18,686 5.27 49,600 2.04
1,035 27,268 28,303 (3,767) 24,536 4.23 56,978 1.89
6,355 27,760 34,115 (1,436) 32,679 3.40 62,784 1.79
7,164 30,354 37,518 (1,919) 35,599 3.42 66,191 1.87
8,719 30,988 39,707 (363) 39,344 2.58 64,210 1.58
8,986 30,935 39,921 (1,017) 38,904 2.82 66,691 1.66
9,330 30,733 40,063 (897) 39,166 2.20 66,835 1.30
10,580 30,413 40,993 (4,474) 36,519 2.20 67,389 1.26
2,703 1,302 4,005 (4) 4,001 24.00 61,842 1.55
All Obligations 4Senior Obligations 3
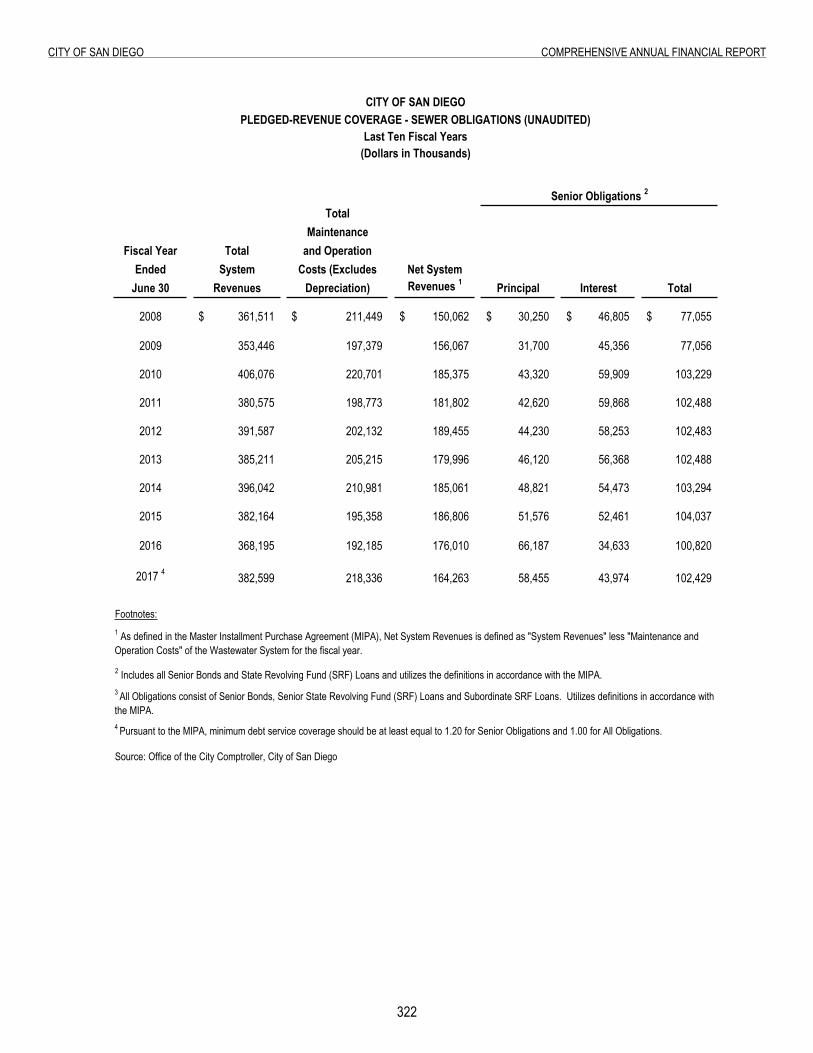
322
City of San Diego ComprehenSive annual finanCial report
Table 15: Pledged-Revenue Coverage - Sewer Obligations
TotalMaintenance
Fiscal Year Total and OperationEnded System Costs (Excludes Net System
June 30 Revenues Depreciation) Revenues 1 Principal Interest Total
2008 361,511$ 211,449$ 150,062$ 30,250$ 46,805$ 77,055$
2009 353,446 197,379 156,067 31,700 45,356 77,056
2010 406,076 220,701 185,375 43,320 59,909 103,229
2011 380,575 198,773 181,802 42,620 59,868 102,488
2012 391,587 202,132 189,455 44,230 58,253 102,483
2013 385,211 205,215 179,996 46,120 56,368 102,488
2014 396,042 210,981 185,061 48,821 54,473 103,294
2015 382,164 195,358 186,806 51,576 52,461 104,037
2016 368,195 192,185 176,010 66,187 34,633 100,820
2017 4 382,599 218,336 164,263 58,455 43,974 102,429
Footnotes:
Source: Office of the City Comptroller, City of San Diego
1 As defined in the Master Installment Purchase Agreement (MIPA), Net System Revenues is defined as "System Revenues" less "Maintenance and Operation Costs" of the Wastewater System for the fiscal year.
3 All Obligations consist of Senior Bonds, Senior State Revolving Fund (SRF) Loans and Subordinate SRF Loans. Utilizes definitions in accordance with the MIPA.4 Pursuant to the MIPA, minimum debt service coverage should be at least equal to 1.20 for Senior Obligations and 1.00 for All Obligations.
2 Includes all Senior Bonds and State Revolving Fund (SRF) Loans and utilizes the definitions in accordance with the MIPA.
CITY OF SAN DIEGOPLEDGED-REVENUE COVERAGE - SEWER OBLIGATIONS (UNAUDITED)
Last Ten Fiscal Years(Dollars in Thousands)
Senior Obligations 2
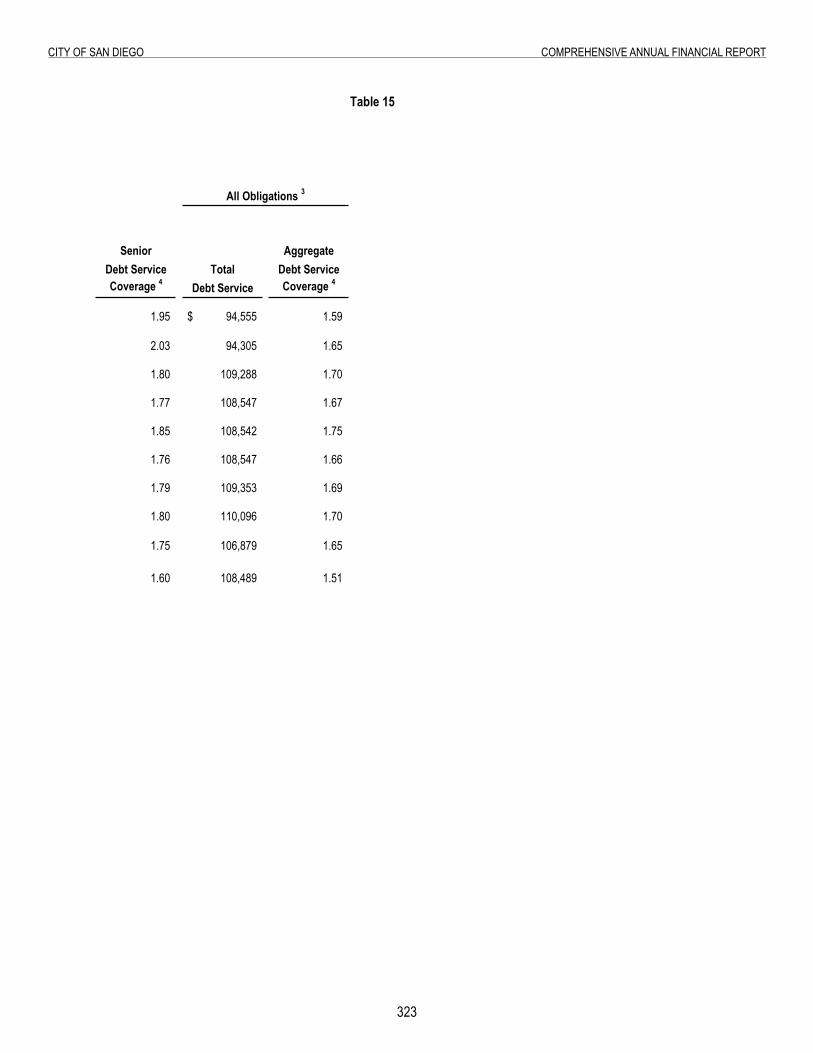
323
City of San Diego ComprehenSive annual finanCial report
Table 15
Senior AggregateDebt Service Total Debt ServiceCoverage 4 Debt Service Coverage 4
1.95 94,555$ 1.59
2.03 94,305 1.65
1.80 109,288 1.70
1.77 108,547 1.67
1.85 108,542 1.75
1.76 108,547 1.66
1.79 109,353 1.69
1.80 110,096 1.70
1.75 106,879 1.65
1.60 108,489 1.51
All Obligations 3
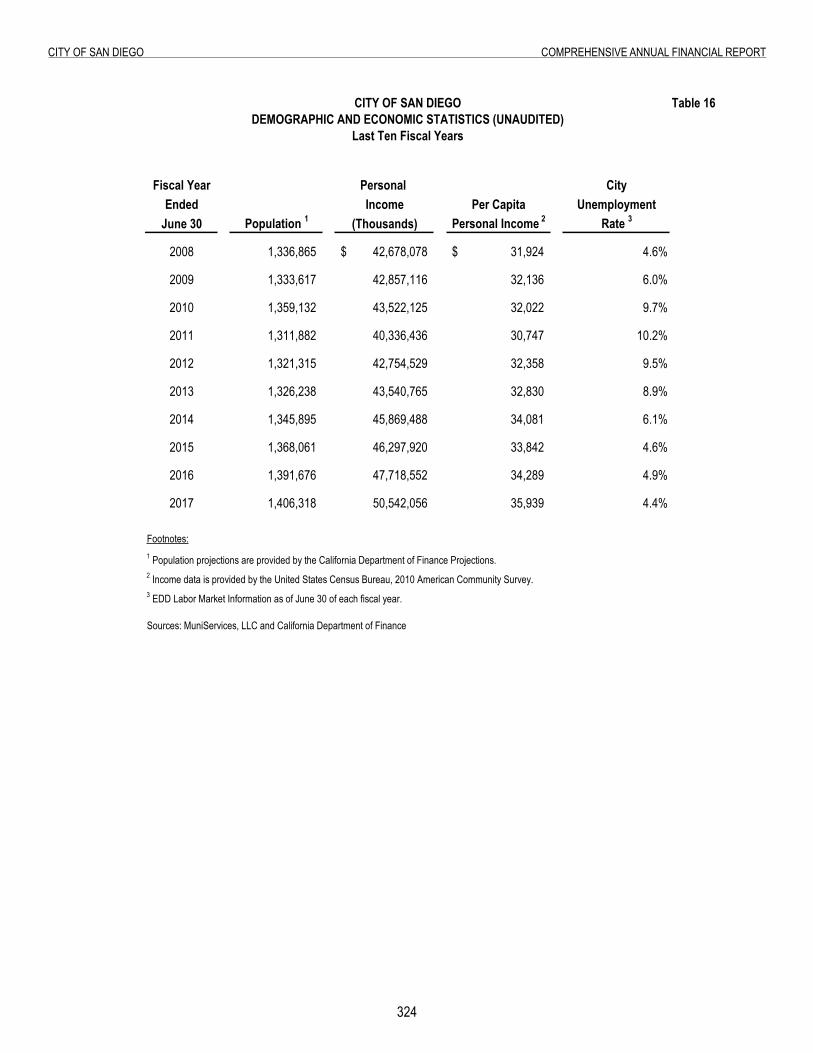
32�
City of San Diego ComprehenSive annual finanCial report
Table 16: Demographic and Economic Statistics
Table 16
Fiscal Year Personal CityEnded Income Per Capita Unemployment
June 30 Population 1 (Thousands) Personal Income 2 Rate 3
2008 1,336,865 42,678,078$ 31,924$ 4.6%
2009 1,333,617 42,857,116 32,136 6.0%
2010 1,359,132 43,522,125 32,022 9.7%
2011 1,311,882 40,336,436 30,747 10.2%
2012 1,321,315 42,754,529 32,358 9.5%
2013 1,326,238 43,540,765 32,830 8.9%
2014 1,345,895 45,869,488 34,081 6.1%
2015 1,368,061 46,297,920 33,842 4.6%
2016 1,391,676 47,718,552 34,289 4.9%
2017 1,406,318 50,542,056 35,939 4.4%
Footnotes:1 Population projections are provided by the California Department of Finance Projections.2 Income data is provided by the United States Census Bureau, 2010 American Community Survey.3 EDD Labor Market Information as of June 30 of each fiscal year.
Sources: MuniServices, LLC and California Department of Finance
CITY OF SAN DIEGODEMOGRAPHIC AND ECONOMIC STATISTICS (UNAUDITED)
Last Ten Fiscal Years
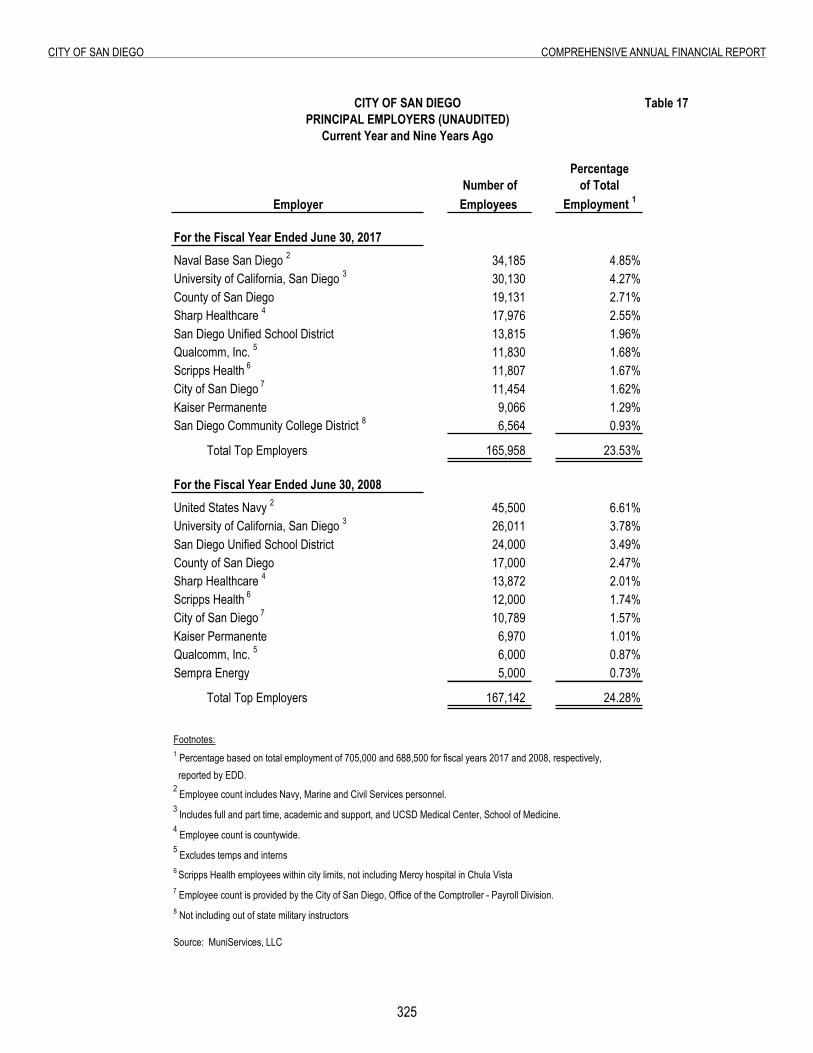
325
City of San Diego ComprehenSive annual finanCial report
table 17: principal employers
Table 17
PercentageNumber of of Total
Employer Employees Employment 1
For the Fiscal Year Ended June 30, 2017Naval Base San Diego 2 34,185 4.85%University of California, San Diego 3 30,130 4.27%County of San Diego 19,131 2.71%Sharp Healthcare 4 17,976 2.55%San Diego Unified School District 13,815 1.96%Qualcomm, Inc. 5 11,830 1.68%Scripps Health 6 11,807 1.67%City of San Diego 7 11,454 1.62%Kaiser Permanente 9,066 1.29%San Diego Community College District 8 6,564 0.93%
Total Top Employers 165,958 23.53%
For the Fiscal Year Ended June 30, 2008United States Navy 2 45,500 6.61%University of California, San Diego 3 26,011 3.78%San Diego Unified School District 24,000 3.49%County of San Diego 17,000 2.47%Sharp Healthcare 4 13,872 2.01%Scripps Health 6 12,000 1.74%City of San Diego 7 10,789 1.57%Kaiser Permanente 6,970 1.01%Qualcomm, Inc. 5 6,000 0.87%Sempra Energy 5,000 0.73%
Total Top Employers 167,142 24.28%
Footnotes:1 Percentage based on total employment of 705,000 and 688,500 for fiscal years 2017 and 2008, respectively, reported by EDD.2 Employee count includes Navy, Marine and Civil Services personnel.3 Includes full and part time, academic and support, and UCSD Medical Center, School of Medicine.4 Employee count is countywide.5 Excludes temps and interns6 Scripps Health employees within city limits, not including Mercy hospital in Chula Vista7 Employee count is provided by the City of San Diego, Office of the Comptroller - Payroll Division.8 Not including out of state military instructors
Source: MuniServices, LLC
CITY OF SAN DIEGO
Current Year and Nine Years AgoPRINCIPAL EMPLOYERS (UNAUDITED)
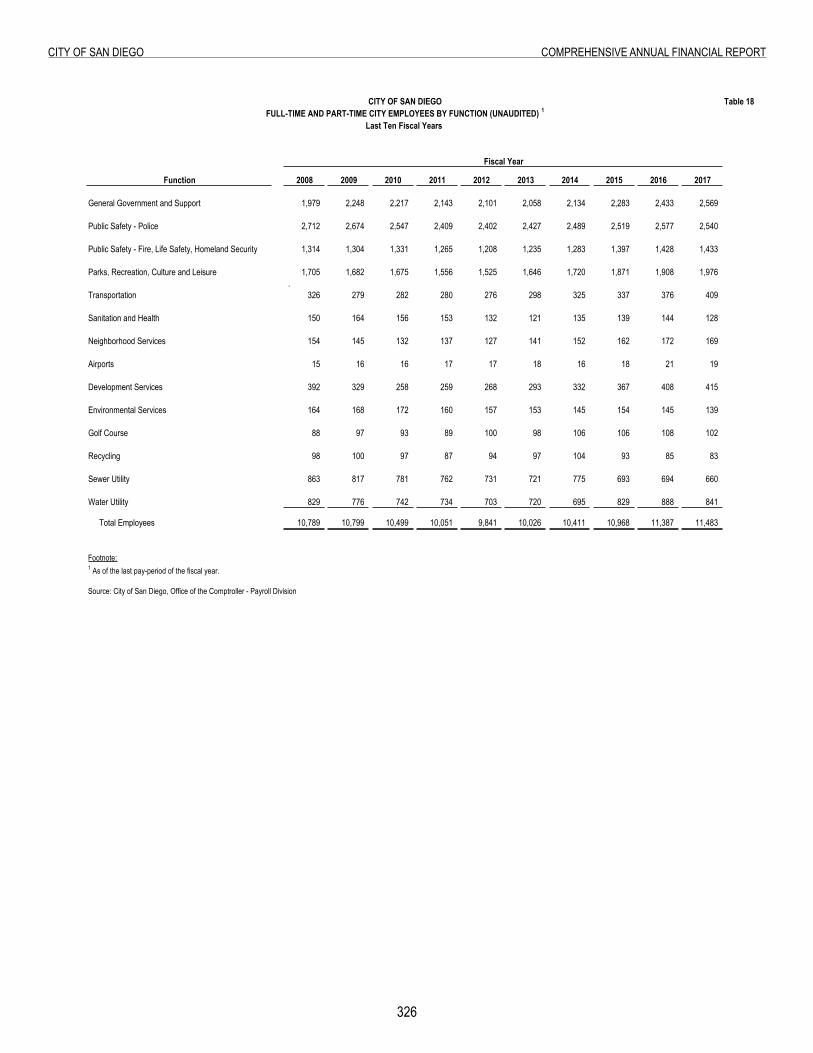
326
City of San Diego ComprehenSive annual finanCial report
Table 18: Full-time and Part-time City Employees by Function
Table 18
Function 2008 2009 2010 2011 2012 2013 2014 2015 2016 2017
General Government and Support 1,979 2,248 2,217 2,143 2,101 2,058 2,134 2,283 2,433 2,569
Public Safety - Police 2,712 2,674 2,547 2,409 2,402 2,427 2,489 2,519 2,577 2,540
Public Safety - Fire, Life Safety, Homeland Security 1,314 1,304 1,331 1,265 1,208 1,235 1,283 1,397 1,428 1,433
Parks, Recreation, Culture and Leisure 1,705 1,682 1,675 1,556 1,525 1,646 1,720 1,871 1,908 1,976 .
Transportation 326 279 282 280 276 298 325 337 376 409
Sanitation and Health 150 164 156 153 132 121 135 139 144 128
Neighborhood Services 154 145 132 137 127 141 152 162 172 169
Airports 15 16 16 17 17 18 16 18 21 19
Development Services 392 329 258 259 268 293 332 367 408 415
Environmental Services 164 168 172 160 157 153 145 154 145 139
Golf Course 88 97 93 89 100 98 106 106 108 102
Recycling 98 100 97 87 94 97 104 93 85 83
Sewer Utility 863 817 781 762 731 721 775 693 694 660
Water Utility 829 776 742 734 703 720 695 829 888 841
Total Employees 10,789 10,799 10,499 10,051 9,841 10,026 10,411 10,968 11,387 11,483
Footnote:1 As of the last pay-period of the fiscal year.
Source: City of San Diego, Office of the Comptroller - Payroll Division
Last Ten Fiscal Years FULL-TIME AND PART-TIME CITY EMPLOYEES BY FUNCTION (UNAUDITED) 1
CITY OF SAN DIEGO
Fiscal Year

this page intentionally left Blank
327
Page Intentionally Left Blank
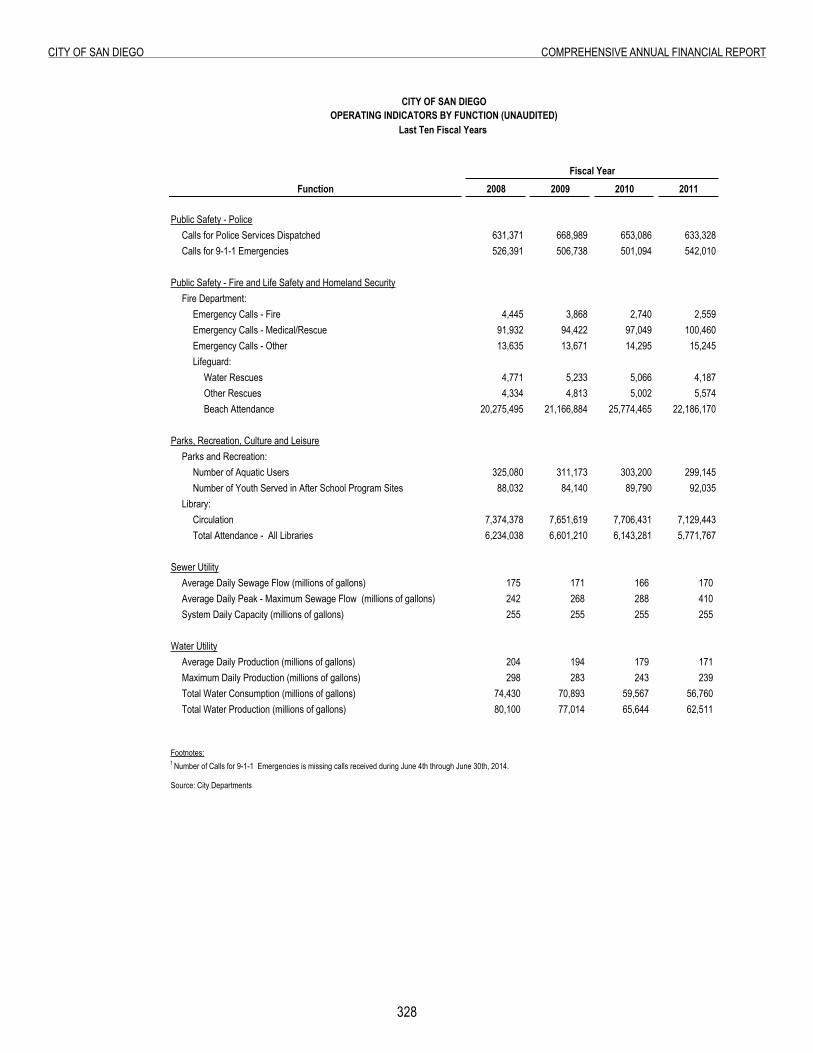
328
City of San Diego ComprehenSive annual finanCial report
Table 19: Operating Indicators by Function
Function 2008 2009 2010 2011
Public Safety - PoliceCalls for Police Services Dispatched 631,371 668,989 653,086 633,328Calls for 9-1-1 Emergencies 526,391 506,738 501,094 542,010
Public Safety - Fire and Life Safety and Homeland SecurityFire Department:
Emergency Calls - Fire 4,445 3,868 2,740 2,559Emergency Calls - Medical/Rescue 91,932 94,422 97,049 100,460Emergency Calls - Other 13,635 13,671 14,295 15,245Lifeguard:
Water Rescues 4,771 5,233 5,066 4,187Other Rescues 4,334 4,813 5,002 5,574Beach Attendance 20,275,495 21,166,884 25,774,465 22,186,170
Parks, Recreation, Culture and LeisureParks and Recreation:
Number of Aquatic Users 325,080 311,173 303,200 299,145Number of Youth Served in After School Program Sites 88,032 84,140 89,790 92,035
Library:Circulation 7,374,378 7,651,619 7,706,431 7,129,443Total Attendance - All Libraries 6,234,038 6,601,210 6,143,281 5,771,767
Sewer UtilityAverage Daily Sewage Flow (millions of gallons) 175 171 166 170 Average Daily Peak - Maximum Sewage Flow (millions of gallons) 242 268 288 410 System Daily Capacity (millions of gallons) 255 255 255 255
Water UtilityAverage Daily Production (millions of gallons) 204 194 179 171 Maximum Daily Production (millions of gallons) 298 283 243 239 Total Water Consumption (millions of gallons) 74,430 70,893 59,567 56,760 Total Water Production (millions of gallons) 80,100 77,014 65,644 62,511
Footnotes:1 Number of Calls for 9-1-1 Emergencies is missing calls received during June 4th through June 30th, 2014.
Source: City Departments
Last Ten Fiscal Years OPERATING INDICATORS BY FUNCTION (UNAUDITED)
CITY OF SAN DIEGO
Fiscal Year
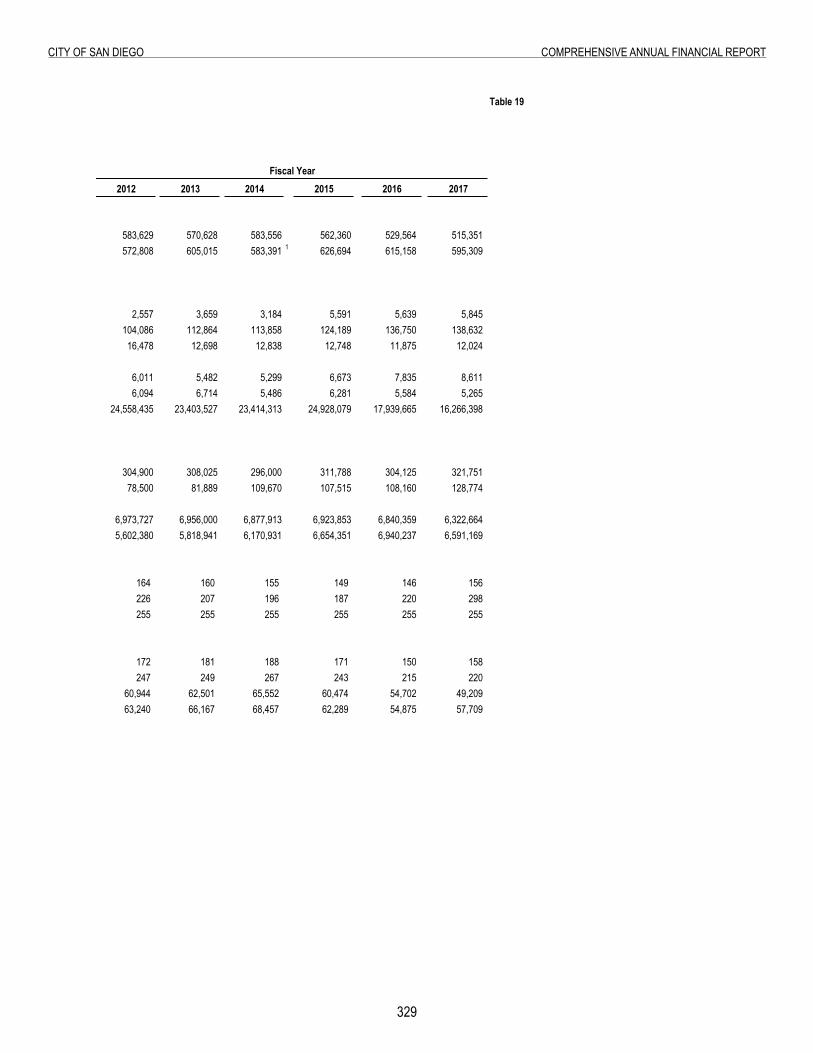
329
City of San Diego ComprehenSive annual finanCial report
Table 19
2012 2013 2014 2015 2016 2017
583,629 570,628 583,556 562,360 529,564 515,351572,808 605,015 583,391 1 626,694 615,158 595,309
2,557 3,659 3,184 5,591 5,639 5,845 104,086 112,864 113,858 124,189 136,750 138,632 16,478 12,698 12,838 12,748 11,875 12,024
6,011 5,482 5,299 6,673 7,835 8,6116,094 6,714 5,486 6,281 5,584 5,265
24,558,435 23,403,527 23,414,313 24,928,079 17,939,665 16,266,398
304,900 308,025 296,000 311,788 304,125 321,75178,500 81,889 109,670 107,515 108,160 128,774
6,973,727 6,956,000 6,877,913 6,923,853 6,840,359 6,322,6645,602,380 5,818,941 6,170,931 6,654,351 6,940,237 6,591,169
164 160 155 149 146 156226 207 196 187 220 298255 255 255 255 255 255
172 181 188 171 150 158247 249 267 243 215 220
60,944 62,501 65,552 60,474 54,702 49,20963,240 66,167 68,457 62,289 54,875 57,709
Fiscal Year
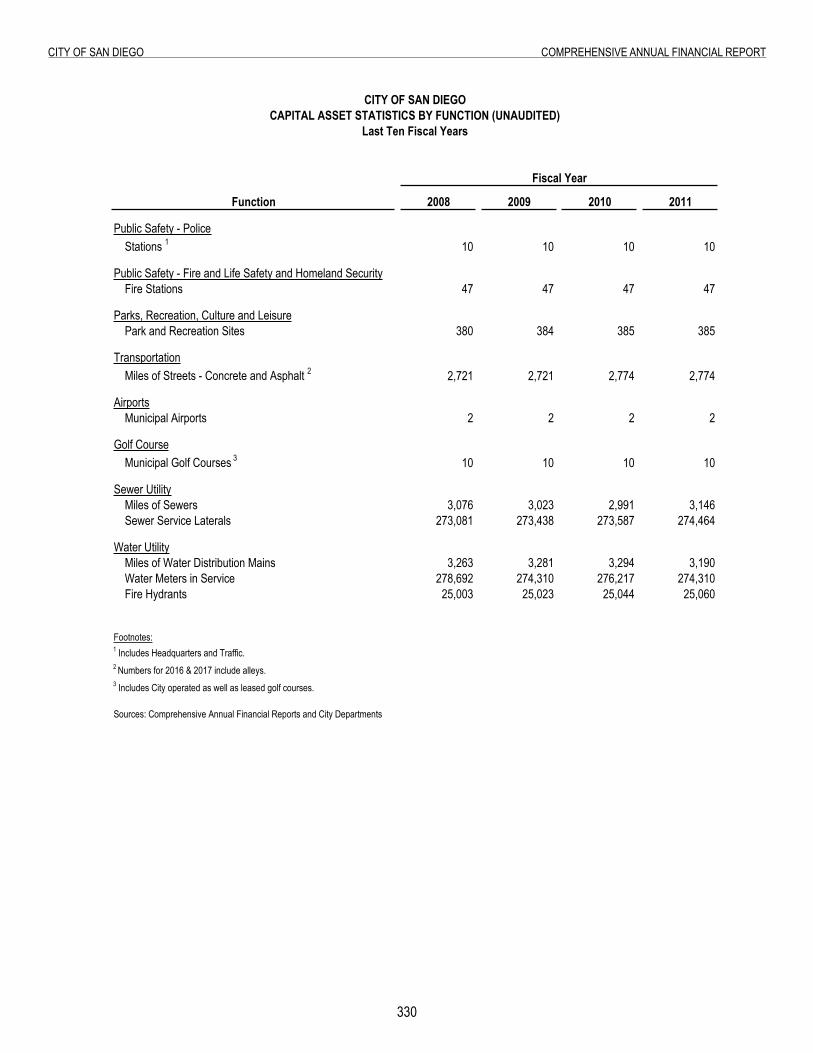
330
City of San Diego ComprehenSive annual finanCial report
table 20: Capital asset Statistics by function
Function 2008 2009 2010 2011
Public Safety - PoliceStations 1 10 10 10 10
Public Safety - Fire and Life Safety and Homeland SecurityFire Stations 47 47 47 47
Parks, Recreation, Culture and LeisurePark and Recreation Sites 380 384 385 385
TransportationMiles of Streets - Concrete and Asphalt 2 2,721 2,721 2,774 2,774
AirportsMunicipal Airports 2 2 2 2
Golf CourseMunicipal Golf Courses 3 10 10 10 10
Sewer UtilityMiles of Sewers 3,076 3,023 2,991 3,146Sewer Service Laterals 273,081 273,438 273,587 274,464
Water UtilityMiles of Water Distribution Mains 3,263 3,281 3,294 3,190Water Meters in Service 278,692 274,310 276,217 274,310Fire Hydrants 25,003 25,023 25,044 25,060
Footnotes:1 Includes Headquarters and Traffic.2 Numbers for 2016 & 2017 include alleys. 3 Includes City operated as well as leased golf courses.
Sources: Comprehensive Annual Financial Reports and City Departments
CITY OF SAN DIEGOCAPITAL ASSET STATISTICS BY FUNCTION (UNAUDITED)
Last Ten Fiscal Years
Fiscal Year
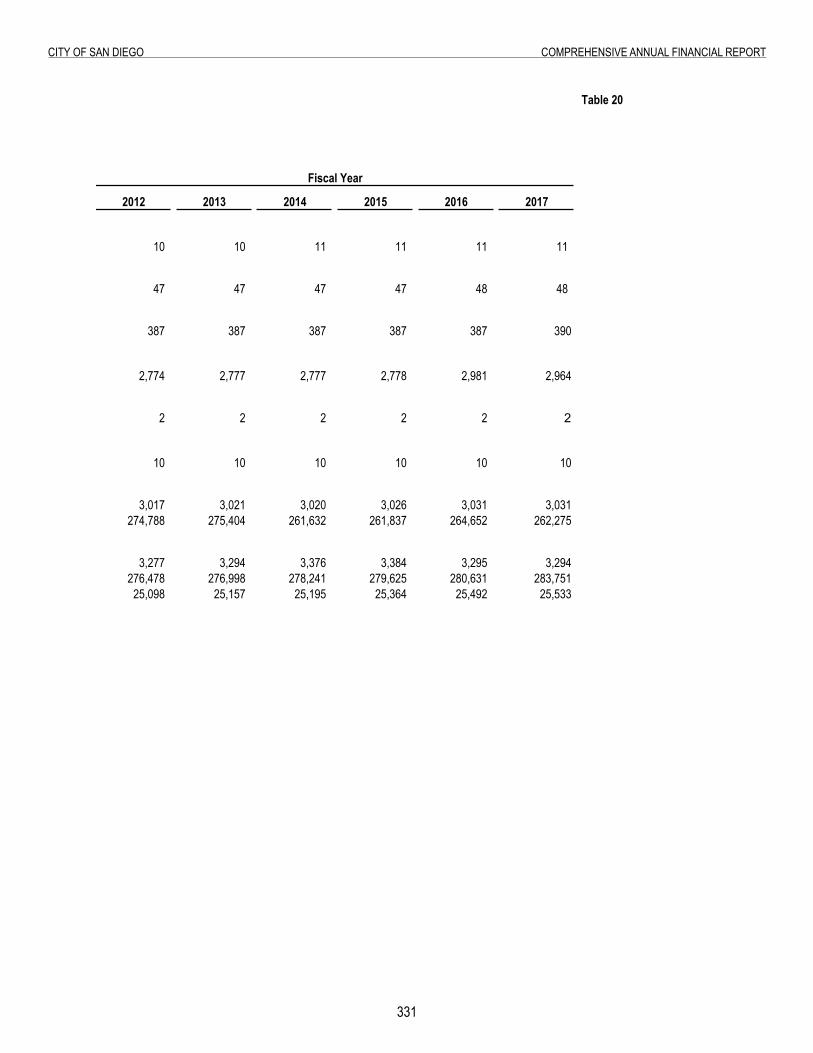
331
City of San Diego ComprehenSive annual finanCial report
Table 20
2012 2013 2014 2015 2016 2017
10 10 11 11 11 11
47 47 47 47 48 48
387 387 387 387 387 390
2,774 2,777 2,777 2,778 2,981 2,964
2 2 2 2 2 2
10 10 10 10 10 10
3,017 3,021 3,020 3,026 3,031 3,031274,788 275,404 261,632 261,837 264,652 262,275
3,277 3,294 3,376 3,384 3,295 3,294276,478 276,998 278,241 279,625 280,631 283,75125,098 25,157 25,195 25,364 25,492 25,533
Fiscal Year