Embed Size (px)
Citation preview
ANNUAL COMPREHENSIVE FINANCIAL REPORT
LEXINGTON-FAYETTE URBAN COUNTY GOVERNMENT
FISCAL YEAR ENDED JUNE 30, 2021
Cover by: Amy Wallot/Communications
COMPREHENSIVE ANNUAL FINANCIAL REPORT FOR THE YEAR ENDED JUNE 30, 2021
LEXINGTON-FAYETTE URBAN COUNTY GOVERNMENT LEXINGTON, KENTUCKY
PREPARED BY THE DEPARTMENT OF FINANCE AND ADMINISTRATION
Paid for with Lexington-Fayette Urban County Government Funds
i
TABLE OF CONTENTS LEXINGTON-FAYETTE URBAN COUNTY GOVERNMENT Comprehensive Annual Financial Report Year Ended June 30, 2021 INTRODUCTORY SECTION Mayor’s Letter of Transmittal .................................................................................................................................. 1
Elected Officials ..................................................................................................................................................... 2 Commissioner of Finance and Administration Letter of Transmittal ...................................................................... 3 GFOA Certificate of Achievement for Excellence in Financial Reporting ............................................................. 9 Organizational Chart .............................................................................................................................................. 10 Directory of Governmental Officials ..................................................................................................................... 11 FINANCIAL SECTION Independent Auditors’ Report ............................................................................................................................... 13 Management’s Discussion and Analysis................................................................................................................ 16 Basic Financial Statements .................................................................................................................................... 30 Government–Wide Financial Statements Statement of Net Position ........................................................................................................................... 31 Statement of Activities ............................................................................................................................... 33 Fund Financial Statements Governmental Fund Financial Statements Balance Sheet – Governmental Funds .................................................................................................. 35 Reconciliation of the Balance Sheet to the Statement of Net Position – Governmental Funds ............ 36 Statement of Revenues, Expenditures, and Changes in Fund Balances – Governmental Funds .......... 37
Reconciliation of the Statement of Revenues, Expenditures, and Changes in Fund Balances of Governmental Funds to the Statement of Activities ................................................................... 38
Proprietary Fund Financial Statements Statement of Net Position ....................................................... 39 Proprietary Fund Financial Statement of Revenues, Expenses, and Changes in Net Position ............. 41
Statement of Cash Flows ...................................................................................................................... 43 Fiduciary Fund Financial Statements
Statement of Net Position ..................................................................................................................... 45 Statement of Changes in Net Position .................................................................................................. 46 Component Unit Financial Statements Statement of Net Position ..................................................................................................................... 47 Statement of Activities ......................................................................................................................... 48 Notes to Financial Statements .................................................................................................................... 49
Required Supplementary Information Schedule of Revenues, Expenditures, and Changes in Fund Balance – Budgetary Comparison
Police Confiscated Federal Funds ...................................................................................................... 112 Police Confiscated State Fund ............................................................................................................ 113 Public Safety Fund ............................................................................................................................. 114 Industrial Revenue Bond Fund ........................................................................................................... 115 Municipal Aid Fund ............................................................................................................................ 116 County Aid Fund ............................................................................................................................... 117 Mineral Severance Fund ..................................................................................................................... 118 2021 Bond Projects Fund ................................................................................................................... 119 Sanitary Sewer Funds ......................................................................................................................... 120 Public Facilities Corporation Funds ................................................................................................... 121 Landfill Fund ..................................................................................................................................... 122 Stormwater Funds ............................................................................................................................... 123 Right of Way Program Fund ............................................................................................................... 124
ii
Extended School Program Fund ......................................................................................................... 125 Enhanced 911 Fund ............................................................................................................................ 126 CKY Network Fund ............................................................................................................................ 127
General Fund ...................................................................................................................................... 128 Full Urban Services District Fund ...................................................................................................... 131
Schedule of Changes in the Net Pension Liability and Related Ratios .................................................... 133 Schedule of the Government’s Contributions .......................................................................................... 134 Schedule of Changes in the Net Pension Liability and Related Ratios .................................................... 135 Schedule of Changes in the Net OPEB Liability and Related Ratios ....................................................... 136 Schedule of the Government’s Proportionate Share of the Net Pension Liability .................................... 137 Schedule of the Government’s Pension Contributions ............................................................................. 138 Schedule of the Government’s Proportionate Share of the Net OPEB Liability ...................................... 139 Schedule of the Government’s OPEB Contributions ............................................................................... 140
Other Supplementary Information Combining Balance Sheet – Nonmajor Governmental Funds .................................................................. 143 Combining Statement of Revenues, Expenditures, and Changes in Fund Balance – Nonmajor
Governmental Funds ..................................................................................................................... 145 Schedule of Expenditures of Federal Awards .......................................................................................... 147 Schedule of Expenditures of State Awards .............................................................................................. 150 Combining Statement of Net Position – Nonmajor Enterprise Funds ...................................................... 152
Combining Statement of Revenues, Expenses, and Changes in Net Position – Nonmajor Enterprise Funds ........................................................................................................................... 153
Combining Statement of Cash Flows – Nonmajor Enterprise Funds ....................................................... 154 Combining Statement of Net Position – Internal Service Funds .............................................................. 156 Combining Statement of Revenues, Expenses, and Changes in Fund Net Position – Internal
Service Funds ................................................................................................................................ 157 Combining Statement of Cash Flows – Internal Service Funds ............................................................... 158 Combining Statement of Net Position – Investment Trust Funds ............................................................ 160 Combining Statement of Changes in Net Position – Investment Trust Funds.......................................... 161 Combining Statement of Net Position – Custodial Funds ........................................................................ 162 Combining Statement of Changes in Net Position – Custodial Funds ..................................................... 163 Combining Statement of Net Position – Nonmajor Component Units ..................................................... 165 Combining Statement of Activities – Nonmajor Component Units ......................................................... 166 STATISTICAL SECTION Net Position .................................................................................................................................................... 168 Changes in Net Position ................................................................................................................................. 169 Fund Balances, Governmental Funds............................................................................................................. 171 Changes in Fund Balances, Governmental Funds .......................................................................................... 172 Changes in Fund Balance, General Fund ....................................................................................................... 173 Sanitary Sewer System, Summary of Revenues and Expenses ...................................................................... 174 Net Assessed Value – Real, Tangible & Intangible Property......................................................................... 175 Property Tax Levies and Collections ............................................................................................................. 176 Direct and Overlapping Property Tax Rates .................................................................................................. 177 Principal Property Tax Payers ........................................................................................................................ 178 Direct and Overlapping License Fee Rates .................................................................................................... 179 Ten Major Occupational Tax Withholders ..................................................................................................... 180 Ratios of Outstanding Debt by Type .............................................................................................................. 181 Ratios of General Bonded Debt Outstanding ................................................................................................. 182 Schedule of Direct and Overlapping Indebtedness ........................................................................................ 183 Legal Debt Margin Information ..................................................................................................................... 184 Revenue Bond Coverage ................................................................................................................................ 185 Demographic and Economic Statistics ........................................................................................................... 186 Principal Employers, Fayette County............................................................................................................. 187
iii
Employment by Industry, Fayette County ..................................................................................................... 188 U.S. Census Bureau Statistics ........................................................................................................................ 189 LFUCG Employees by Function/Program ..................................................................................................... 190 Operating Indicators by Function/Program .................................................................................................... 191 Capital Asset Statistics by Function/Program ................................................................................................ 192

This page intentionally left blank.

INTRODUCTORY SECTION
Lexington-Fayette Urban County Government OFFICE OF THE MAYOR
Linda Gorton Mayor
FOLLOW MAYOR GORTON: www.facebook.com/MayorGorton www.twitter.com/MayorGorton
200 East Main Street • Lexington, KY 40507 • (859) 425-2255 • www.lexingtonky.govHORSE CAPITAL OF THE WORLD
November 19, 2021
Dear Community Members,
The annual report for the fiscal year ending June 30, 2021, reflects fiscal discipline in the face of a pandemic that slowed economic activity throughout our city, and pushed unemployment to unprecedented levels.
It also reflects an economy that began shaking off the effects of COVID-19 by the end of the fiscal year. I predicted that Lexington’s economy and the government would adjust to this uncertainty coming from the pandemic, and so we did. In late FY21, our employment levels were approaching pre-pandemic levels, and we saw considerable job growth through significant new private sector investments.
Through belt-tightening, our FY21 budget balanced in the face of the pandemic downturn. We made $12.6 million in reductions throughout government. We took a strategic approach to these cutbacks, choosing thoughtfully and carefully to maintain the excellent basic services our citizens rely upon.
At the same time, this budget prepared our community to emerge from the pandemic stronger than ever through investments that enabled Lexington to continue to move forward and make progress.
Sincerely,
Linda Gorton Mayor
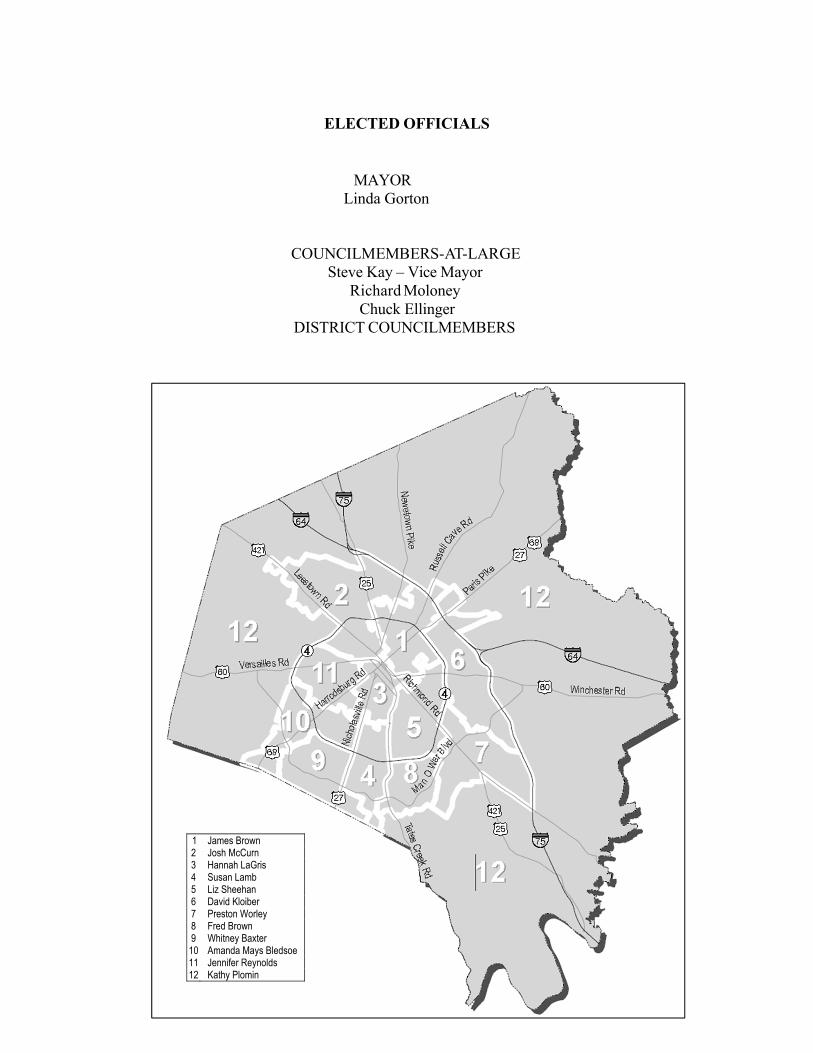
ELECTED OFFICIALS
MAYOR Linda Gorton
COUNCILMEMBERS-AT-LARGE Steve Kay – Vice Mayor
Richard Moloney Chuck Ellinger
DISTRICT COUNCILMEMBERS
1 James Brown 2 Josh McCurn 3 Hannah LaGris 4 Susan Lamb 5 Liz Sheehan 6 David Kloiber 7 Preston Worley 8 Fred Brown 9 Whitney Baxter 10 Amanda Mays Bledsoe 11 Jennifer Reynolds 12 Kathy Plomin
MAYOR LINDA GORTON � LEXINGTON ERIN HENSLEY
COMMISSIONER
FINANCE
November 19, 2021
Citizens of Lexington-Fayette Urban County Honorable Mayor Linda Gorton Members of the Urban County Council Lexington-Fayette Government
Dear Citizens, Mayor and Members of the Urban County Council:
As Commissioner of Finance, it is my pleasure to present the Comprehensive Annual Financial Report, also called the Financial Report, of the Lexington-Fayette Urban County Government (the Government) (LFUCG) for the fiscal year ended June 30, 2021. The Financial Report has been prepared in accordance with Generally Accepted Accounting Principles (GAAP) and the reporting standards of the Governmental Accounting Standards Board (GASB). The Financial Report includes all funds of the Government and its component units.
The report is organized into three sections: an introductory section, a financial section, and a statistical section. The introductory section provides general information on the Government's structure, as well as information useful in assessing the Government's financial condition. The financial section contains the independent auditor's report on the financial statement audit, management discussion and analysis, basic financial statements, required supplementary information, and information on individual funds not separately provided in the basic financial statements. The statistical section provides a broad range of trend data covering financial, demographic, and economic activity useful in assessing the Government's financial condition.
This Financial Report was prepared by the Division of Accounting with assistance from staff in the Divisions of Finance, Revenue, and Budgeting. These entities are responsible for both the accuracy of the data presented and the completeness and
fairness of the presentation. To provide a reasonable basis for making these representations, management has established a comprehensive internal control framework that is designed to protect the Government's assets from loss, theft or misuse, and to compile sufficient reliable information for preparation of the financial statements in conformance with GAAP. The internal control structure is designed to provide reasonable, but not absolute, assurance that these objectives are met. The concept of reasonable assurance recognizes that the cost of internal controls should not exceed the benefits likely to be derived from their use and that such cost-benefit evaluation requires estimates and judgment by management.
State statute and the Charter of the Government both require that an independent financial audit be conducted annually. The accounting firm of Strothman and Company, PILC performed the audit for the fiscal year ended June 30, 2021. The goal of the independent audit was to provide reasonable assurance that the financial statements of the Government for the fiscal year ended June 30, 2021 are free of material misstatements. The independent audit involved examining, on a test basis, evidence supporting the amounts and disclosures in the financial statements, assessing the accounting principles used and significant estimates made by management, and evaluating the overall financial statement presentation. The independent auditor concluded that there was a reasonable basis for rendering an unmodified opinion that the Government's financial statements for the fiscal year ended June 30, 2021, are fairly presented in conformity with GAAP. The independent auditors' report is presented as the first component in the financial section of this report.
200 East Main St., Lexington, KY 40507 / 859.425.2255 Phone/ 859.258.3385 Fax/ lexingtonky.gov
S4,oni.icant Events (as of November 19. 2021)
Federal Response to COVID-19 The American Rescue Plan Act of 2021 was signed into law on March 11, 2021 in an effort to deliver immediate relief for communities struggling in the wake of COVID-19. Ibis bill authorized funding directly impacting LFUCG, including $121 million in aid through the State and Local Fiscal Recovery Fund and $7.6 million in eviction prevention assistance through the Emergency Rental Assistance Program. These funds were partially received and expensed in FY2021, and will continue to impact LFUCG's finances through FY2027. These programs will provide increased funding to support populations disproportionately impacted by COVID-19 and to our local government to ensure the continuity of essential government services.
Local Response to COVID-19 Lexington-Fayette County began to see the impacts of the COVID-19 global pandemic in March 2020. To assist local businesses and residents whose services and income were affected by COVID-19, Lexington-Fayette County continued grant programs for small businesses, emergency financial assistance programs for residents facing evictions or utility shutoffs, and implemented administration of the federal Emergency Rental Assistance Program. These actions were combined with expenditure controls within the local government to ensure fiscal soundness and stability. The effects of COVID-19 and subsequent needs of the community will continue to have an impact throughout FY2022.
Lexington Convention Center In July 2018, the Lexington Convention Center broke ground on a more than $275 million renovation and expansion, which is the single largest capital project in Lexington's history. The new Convention Center exhibition space will be increased by over 50% and ballroom space by over 40%. The project is currently over 90% complete, with full completion anticipated in spring 2022. The facility will have over 200,000 square feet of flexible meeting and event space, and will be managed by Oak View Group Facilities as of October 1, 2021.
In March 2020, when the spread of COVID-19 worsened, the convention center and arena began to see a sharp decline in hotel tax revenues which backed the bonds issued for this project. In response to the decline in revenue and less favorable financial outlook, the Government took an active management approach and sought to restructure the existing debt. The refunding bonds issued will pay for capitalized interest through and including March 1, 2023, with the debt maturing from 2049 to 2053, a period that will include the useful life of the renovated facilities. The GO pledge earned the deal ratings of Aa2 from Moody's Investors Service and AA from S&P Global Ratings, matching the GO ratings of Lexington-Fayette County. Both rating agencies said the outlook is stable.
Town Branch Commons and Trail Construction began in July 2018 for the Town Branch Commons. The project is a linear urban trail closing the gap between our downtown parks and two major trails. Once on the Town Branch Trail, users will be able to access 22 continuous miles of dedicated walking, jogging, and cycling trails connecting the city center to the countryside. Water is featured along the path in interactive fountains and planting areas work to collect stonn water. The trail is separated and buffered from adjacent vehicular
traffic. The trail is fully funded by a diverse array of federal and state grants that leverage local dollars. Funding sources include a $14.lM federal TIGER Grant, a $5.2M federal CMAQ Grant, a $2.3M federal TAP Grant, a $1M SLX Grant, a $5.6M Kentucky Infrastructure Loan, and $11.8M of local dollars. Completion of the project is expected by December 31, 2022.
Consent DecreeThe Government is required to reduce sanitary sewer overflows as part of a court ordered settlement, the Consent Decree, with the United States (US) Department of Justice, the US Environmental Protection Agency (EPA), and the Commonwealth of Kentucky. The Consent Decree requires Lexington to address structural, operational, and
200 East Main St., Lexington, KY 40507 I 859.425.2255 Phone/ 859.258.3385 Fax I lexingtonky.gov
procedural issues within its stonn and sanitary sewer systems in accordance with the schedule developed jointly with the EPA. To date Lexington has incurred no penalties for missing a Consent Decree imposed deadline.
The sanitary sewer capital construction component of the Consent Decree consists of 115 capital improvement projects intended to rehabilitate the sanitary sewer system to prevent recurring sanitary sewer overflo ws and unpertnitted bypasses. The cost estimate for all the Remedial Measures Plan (1Uv1P) capital projects is $591 million, and LFUCG must complete the projects by December 31, 2026.
As of September 2021, a total of 61 RMP projects have been completed and another 23 are in the design/ construction phase, totaling approximately $311 million in capital expenditures. Generally projections show total RMP capital project expenses trending below the original estimated expenditure for the projects completed or are under construction to date. The Government will continue to closely monitor this trend as the overall project scope has now begun to transition away from the storage tank projects and into the pipeline upgrade projects-schedules of which are being adversely impacted by serious pipe supply shortages and price increases.
The Capacity, Management, Operation, and Maintenance (CMOM) Program is also a requirement of the Consent Decree. The CMOM Program outlines the operational changes that must be implemented and maintained for both sewer line and pump station operation. Since entering into the Consent Decree, the Division of Water Quality has completed or implemented all 154 required CMOM Program elements. Many have ongoing, continuous compliance components which are being performed. Key CMOM operational documents (Sewer Overflow Response Plan, Gravity Llne Preventative Maintenance Plan and Pump Station Operations Plan for Power Outages) have all been updated in the past 18 months.
LFUCG is in full compliance with its state-issued KPDES permit. The permit expired on May 31, 2020, and LFUCG is waiting for Kentucky to act on the submitted renewal application. As of January 2021, Lexington's Municipal Separate Storm Sewer System (MS4) provisions of the Consent Decree have been terminated, and Lexington's MS4 program is no longer operating under court ordered sanctions.
Finally, as with many other municipal utilities, the COVID-19 pandemic has negatively impacted some project delivery schedules due to staffing and significant supply chain disruptions. Lexington has requested and received regulatory relief for several near-term project schedule milestones. Lexington continues to work closely with US EPA and the Commonwealth of Kentucky to ensure compliance with the term and conditions in these unprecedented times.
Fiscal Oudook
Local Economy The unemployment rate in Fayette County was 4.6% in June 2021, as compared to 5.3% in June 2020. This decrease shows the beginnings of recovery from the economic pressures created by COVID-19, which continue to be felt in Fayette County. During April 2020 at the onset of the pandemic, unemployment rates reached 14.8%. We expect to see employment numbers continue to rise throughout FY2022.
While employment rates continue to improve, Fayette County has also seen an increase in average weekly wages. Fayette County held an average weekly wage of $1,017 in first quarter 2021, representing a 3% gain from first quarter 2020. Factored with the
200 East Main St., Lexington, KY 40507 / 859.425.2255 Phone/ 859.258.3385 Fax/ lexingtonky.gov
Government Finance Officers Association
Certificate of Achievementfor Excellence
in Financial Reporting
Presented to
Lexington-Fayette Urban CountyKentucky
For its Comprehensive AnnualFinancial Report
For the Fiscal Year Ended
June 30, 2020
Executive Director/CEO
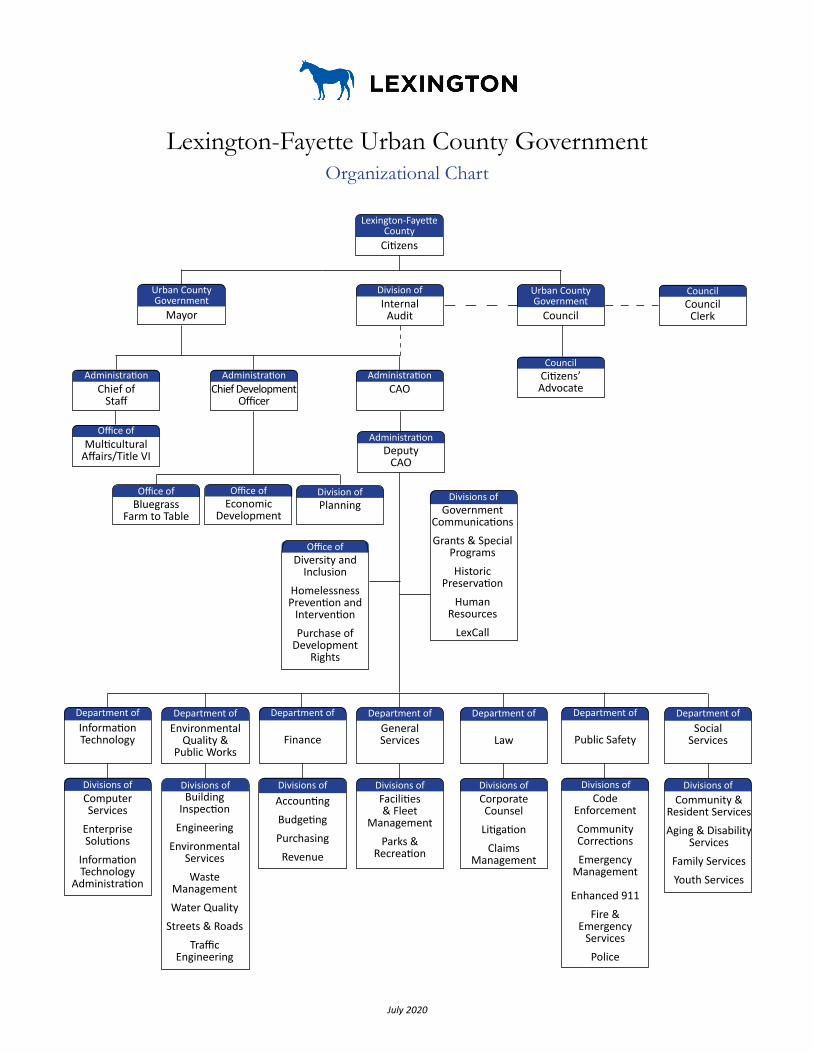
Lexington-Fayette Urban County GovernmentOrganizational Chart
Internal Audit
Division of
Citizens’ Advocate
Council
Council Clerk
CouncilUrban County Government
Mayor
Lexington-Fayette County
Citizens
Urban County Government
Council
CAOAdministration
Chief of Staff
AdministrationChief Development
Officer
Administration
Government CommunicationsGrants & Special
ProgramsHistoric
PreservationHuman
ResourcesLexCall
Divisions of
Social Services
Department of
Community & Resident ServicesAging & Disability
ServicesFamily ServicesYouth Services
Divisions of
General Services
Department of
Facilities & Fleet
ManagementParks &
Recreation
Divisions of
Finance
Department of
AccountingBudgetingPurchasing
Revenue
Divisions of
Law
Department of
Corporate Counsel
LitigationClaims
Management
Divisions of
Environmental Quality &
Public Works
Department of
Building Inspection
EngineeringEnvironmental
ServicesWaste
ManagementWater Quality
Streets & RoadsTraffic
Engineering
Divisions of
Deputy CAO
Administration
Information Technology
Department of
Computer Services
Enterprise Solutions
Information Technology
Administration
Divisions of
Public Safety
Department of
Code EnforcementCommunity CorrectionsEmergency
Management
Enhanced 911Fire &
Emergency ServicesPolice
Divisions of
Diversity and Inclusion
Homelessness Prevention and
InterventionPurchase of
Development Rights
Office of
Bluegrass Farm to Table
Office ofEconomic
Development
Office ofPlanningDivision of
July 2020
Multicultural Affairs/Title VI
Office of
11
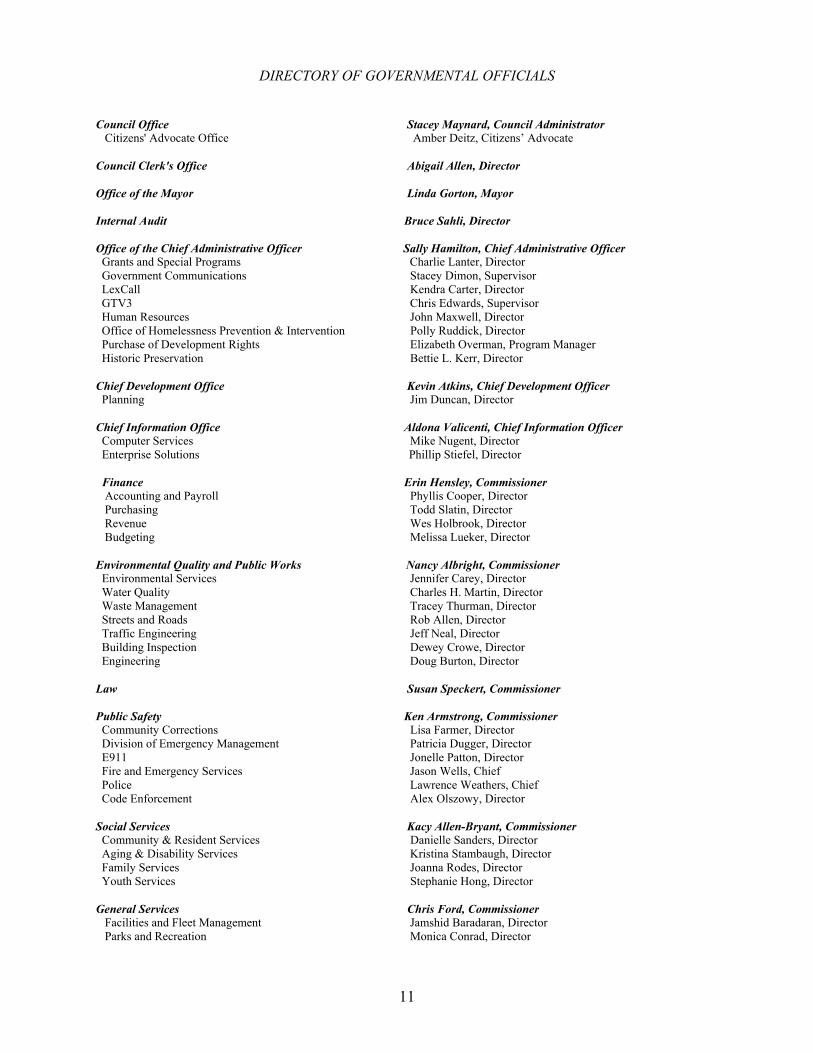
DIRECTORY OF GOVERNMENTAL OFFICIALS Council Office Stacey Maynard, Council Administrator Citizens' Advocate Office Amber Deitz, Citizens’ Advocate Council Clerk's Office Abigail Allen, Director Office of the Mayor Linda Gorton, Mayor Internal Audit Bruce Sahli, Director Office of the Chief Administrative Officer Sally Hamilton, Chief Administrative Officer Grants and Special Programs Charlie Lanter, Director Government Communications Stacey Dimon, Supervisor LexCall Kendra Carter, Director GTV3 Chris Edwards, Supervisor Human Resources John Maxwell, Director Office of Homelessness Prevention & Intervention Polly Ruddick, Director
Purchase of Development Rights Elizabeth Overman, Program Manager Historic Preservation Bettie L. Kerr, Director
Chief Development Office Kevin Atkins, Chief Development Officer Planning Jim Duncan, Director Chief Information Office Aldona Valicenti, Chief Information Officer Computer Services Mike Nugent, Director Enterprise Solutions Phillip Stiefel, Director Finance Erin Hensley, Commissioner Accounting and Payroll Phyllis Cooper, Director Purchasing Todd Slatin, Director Revenue Wes Holbrook, Director Budgeting Melissa Lueker, Director Environmental Quality and Public Works Nancy Albright, Commissioner Environmental Services Jennifer Carey, Director Water Quality Charles H. Martin, Director Waste Management Tracey Thurman, Director Streets and Roads Rob Allen, Director Traffic Engineering Jeff Neal, Director Building Inspection Dewey Crowe, Director Engineering Doug Burton, Director Law Susan Speckert, Commissioner Public Safety Ken Armstrong, Commissioner Community Corrections Lisa Farmer, Director Division of Emergency Management Patricia Dugger, Director E911 Jonelle Patton, Director Fire and Emergency Services Jason Wells, Chief Police Lawrence Weathers, Chief Code Enforcement Alex Olszowy, Director Social Services Kacy Allen-Bryant, Commissioner Community & Resident Services Danielle Sanders, Director Aging & Disability Services Kristina Stambaugh, Director Family Services Joanna Rodes, Director Youth Services Stephanie Hong, Director General Services Chris Ford, Commissioner Facilities and Fleet Management Jamshid Baradaran, Director Parks and Recreation Monica Conrad, Director
This page intentionally left blank.

FINANCIAL SECTION
-13-
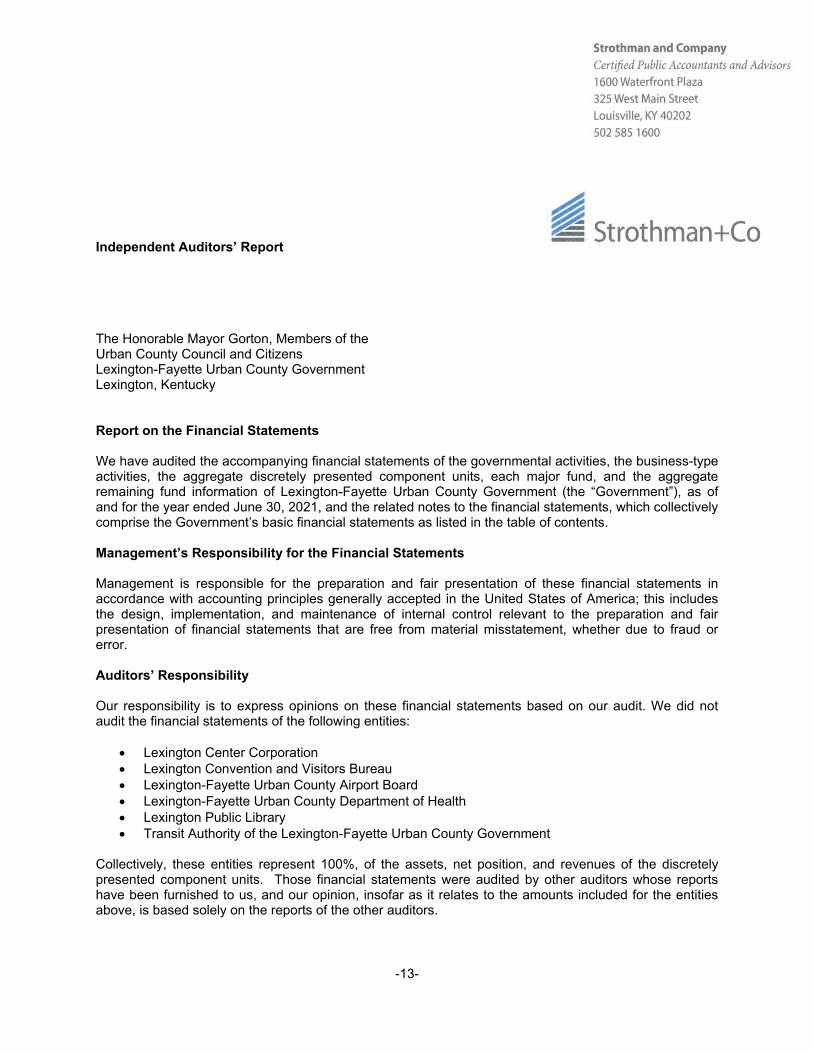
Independent Auditors’ Report The Honorable Mayor Gorton, Members of the Urban County Council and Citizens Lexington-Fayette Urban County Government Lexington, Kentucky Report on the Financial Statements We have audited the accompanying financial statements of the governmental activities, the business-type activities, the aggregate discretely presented component units, each major fund, and the aggregate remaining fund information of Lexington-Fayette Urban County Government (the “Government”), as of and for the year ended June 30, 2021, and the related notes to the financial statements, which collectively comprise the Government’s basic financial statements as listed in the table of contents. Management’s Responsibility for the Financial Statements Management is responsible for the preparation and fair presentation of these financial statements in accordance with accounting principles generally accepted in the United States of America; this includes the design, implementation, and maintenance of internal control relevant to the preparation and fair presentation of financial statements that are free from material misstatement, whether due to fraud or error. Auditors’ Responsibility Our responsibility is to express opinions on these financial statements based on our audit. We did not audit the financial statements of the following entities:
Lexington Center Corporation Lexington Convention and Visitors Bureau Lexington-Fayette Urban County Airport Board Lexington-Fayette Urban County Department of Health Lexington Public Library Transit Authority of the Lexington-Fayette Urban County Government
Collectively, these entities represent 100%, of the assets, net position, and revenues of the discretely presented component units. Those financial statements were audited by other auditors whose reports have been furnished to us, and our opinion, insofar as it relates to the amounts included for the entities above, is based solely on the reports of the other auditors.
-14-
We conducted our audit in accordance with auditing standards generally accepted in the United States of America and the standards applicable to financial audits contained in Government Auditing Standards, issued by the Comptroller General of the United States. Those standards require that we plan and perform the audit to obtain reasonable assurance about whether the financial statements are free from material misstatement. An audit involves performing procedures to obtain audit evidence about the amounts and disclosures in the financial statements. The procedures selected depend on the auditors’ judgment, including the assessment of the risks of material misstatement of the financial statements, whether due to fraud or error. In making those risk assessments, the auditors consider internal control relevant to the Government’s preparation and fair presentation of the financial statements in order to design audit procedures that are appropriate in the circumstances, but not for the purpose of expressing an opinion on the effectiveness of the Government’s internal control. Accordingly, we express no such opinion. An audit also includes evaluating the appropriateness of accounting policies used and the reasonableness of significant accounting estimates made by management, as well as evaluating the overall presentation of the financial statements. We believe that the audit evidence we have obtained is sufficient and appropriate to provide a basis for our audit opinions. Opinions In our opinion, based on our audit and the reports of the other auditors, the financial statements referred to above present fairly, in all material respects, the respective financial position of the governmental activities, the business-type activities, the aggregate discretely presented component units, each major fund, and the aggregate remaining fund information of the Government as of June 30, 2021, and the respective changes in financial position, and, where applicable, cash flows thereof for the year then ended in accordance with accounting principles generally accepted in the United States of America. Other Matters Required Supplementary Information Accounting principles generally accepted in the United States of America require that the management’s discussion and analysis on pages 16 to 29 and budgetary comparison information on pages 112 to 132 and pension and OPEB information on pages 133 to 140 be presented to supplement the basic financial statements. Such information, although not a part of the basic financial statements, is required by the Governmental Accounting Standards Board, who considers it to be an essential part of financial reporting for placing the basic financial statements in an appropriate operational, economic, or historical context. We and the other auditors have applied certain limited procedures to the required supplementary information in accordance with auditing standards generally accepted in the United States of America, which consisted of inquiries of management about the methods of preparing the information and comparing the information for consistency with management’s responses to our inquiries, the basic financial statements, and other knowledge we obtained during our audit of the basic financial statements. We do not express an opinion or provide any assurance on the information because the limited procedures do not provide us with sufficient evidence to express an opinion or provide any assurance.
-15-
Other Information Our audit was conducted for the purpose of forming opinions on the financial statements that collectively comprise the Government’s basic financial statements. The introductory section, combining and individual nonmajor fund financial statements, and statistical section are presented for purposes of additional analysis and are not a required part of the basic financial statements. The schedule of expenditures of federal awards is presented for purposes of additional analysis as required by Title 2 U.S. Code of Federal Regulations Part 200, Uniform Administrative Requirements, Cost Principles, and Audit Requirements for Federal Awards, and is also not a required part of the basic financial statements. The combining and individual nonmajor fund financial statements and the Schedule of Expenditures of Federal Awards and the Schedule of Expenditures of State Awards are the responsibility of management and were derived from and relate directly to the underlying accounting and other records used to prepare the basic financial statements. Such information has been subjected to the auditing procedures applied in the audit of the basic financial statements and certain additional procedures, including comparing and reconciling such information directly to the underlying accounting and other records used to prepare the basic financial statements or to the basic financial statements themselves, and other additional procedures in accordance with auditing standards generally accepted in the United States of America by us and the other auditors. In our opinion, based on our audit, the procedures performed as described above, and the reports of the other auditors, the combining and individual nonmajor fund financial statements and the schedule of expenditures of federal awards and the schedule of expenditures of state awards are fairly stated, in all material respects, in relation to the basic financial statements as a whole. The introductory and statistical sections have not been subjected to the auditing procedures applied in the audit of the basic financial statements and, accordingly, we do not express an opinion or provide any assurance on them. Other Reporting Required by Government Auditing Standards In accordance with Government Auditing Standards, we have also issued our report dated November 22, 2021, on our consideration of the Government’s internal control over financial reporting and on our tests of its compliance with certain provisions of laws, regulations, contracts, and grant agreements and other matters. The purpose of that report is solely to describe the scope of our testing of internal control over financial reporting and compliance and the results of that testing, and not to provide an opinion on the effectiveness of the Government’s internal control over financial reporting or on compliance. That report is an integral part of an audit performed in accordance with Government Auditing Standards in considering the Government’s internal control over financial reporting and compliance. Louisville, Kentucky November 22, 2021
16
MANAGEMENT’S DISCUSSION AND ANALYSIS
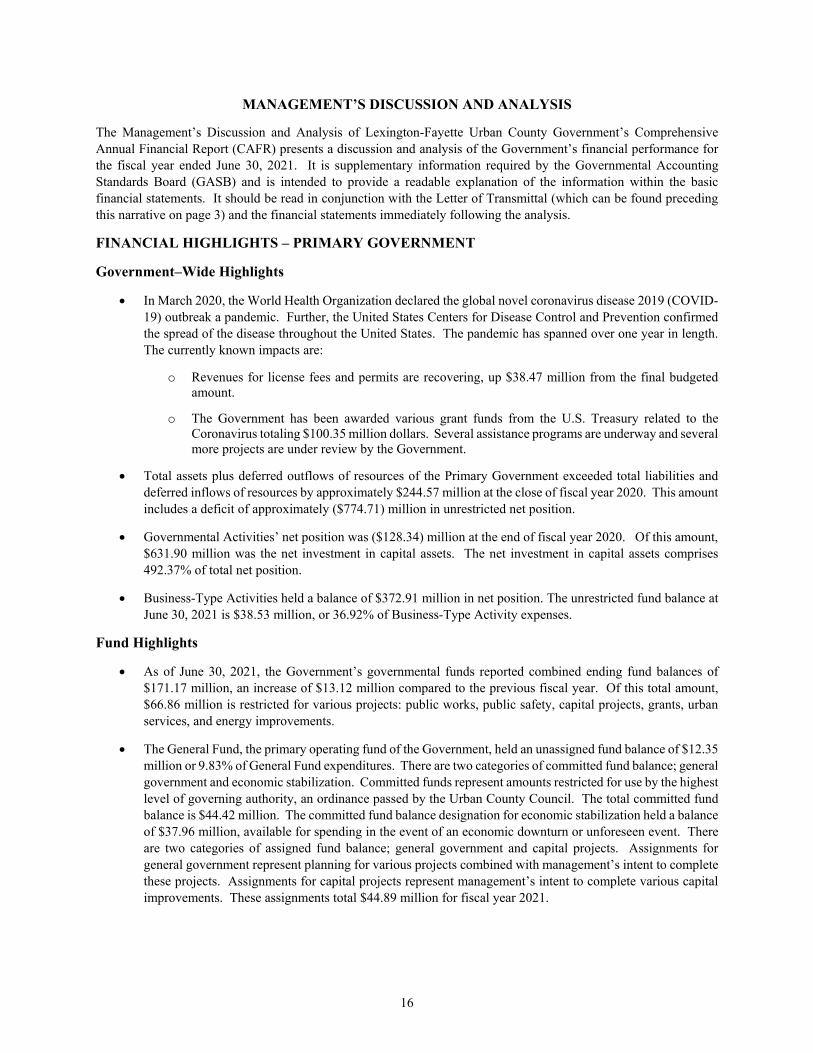
The Management’s Discussion and Analysis of Lexington-Fayette Urban County Government’s Comprehensive Annual Financial Report (CAFR) presents a discussion and analysis of the Government’s financial performance for the fiscal year ended June 30, 2021. It is supplementary information required by the Governmental Accounting Standards Board (GASB) and is intended to provide a readable explanation of the information within the basic financial statements. It should be read in conjunction with the Letter of Transmittal (which can be found preceding this narrative on page 3) and the financial statements immediately following the analysis.
FINANCIAL HIGHLIGHTS – PRIMARY GOVERNMENT
Government–Wide Highlights
In March 2020, the World Health Organization declared the global novel coronavirus disease 2019 (COVID-19) outbreak a pandemic. Further, the United States Centers for Disease Control and Prevention confirmed the spread of the disease throughout the United States. The pandemic has spanned over one year in length. The currently known impacts are:
o Revenues for license fees and permits are recovering, up $38.47 million from the final budgeted amount.
o The Government has been awarded various grant funds from the U.S. Treasury related to the Coronavirus totaling $100.35 million dollars. Several assistance programs are underway and several more projects are under review by the Government.
Total assets plus deferred outflows of resources of the Primary Government exceeded total liabilities and deferred inflows of resources by approximately $244.57 million at the close of fiscal year 2020. This amount includes a deficit of approximately ($774.71) million in unrestricted net position.
Governmental Activities’ net position was ($128.34) million at the end of fiscal year 2020. Of this amount, $631.90 million was the net investment in capital assets. The net investment in capital assets comprises 492.37% of total net position.
Business-Type Activities held a balance of $372.91 million in net position. The unrestricted fund balance at June 30, 2021 is $38.53 million, or 36.92% of Business-Type Activity expenses.
Fund Highlights
As of June 30, 2021, the Government’s governmental funds reported combined ending fund balances of $171.17 million, an increase of $13.12 million compared to the previous fiscal year. Of this total amount, $66.86 million is restricted for various projects: public works, public safety, capital projects, grants, urban services, and energy improvements.
The General Fund, the primary operating fund of the Government, held an unassigned fund balance of $12.35 million or 9.83% of General Fund expenditures. There are two categories of committed fund balance; general government and economic stabilization. Committed funds represent amounts restricted for use by the highest level of governing authority, an ordinance passed by the Urban County Council. The total committed fund balance is $44.42 million. The committed fund balance designation for economic stabilization held a balance of $37.96 million, available for spending in the event of an economic downturn or unforeseen event. There are two categories of assigned fund balance; general government and capital projects. Assignments for general government represent planning for various projects combined with management’s intent to complete these projects. Assignments for capital projects represent management’s intent to complete various capital improvements. These assignments total $44.89 million for fiscal year 2021.
17
OVERVIEW OF THE FINANCIAL STATEMENTS
Three key elements comprise the basic financial statements, including:
A) Government-Wide Financial Statements; B) Fund Financial Statements, and; C) Notes to the Financial Statements
A. Government-Wide Financial Statements
The Government-Wide Financial Statements are designed to provide readers with a broad overview of the Government’s finances in a manner similar to a private-sector business. These statements report financial information about the entire Government, except for fiduciary activities, and provide both short-term and long-term information about the Government’s financial position, and assist in the assessment of the Government’s economic condition at the end of the fiscal year. The statements are prepared using the flow of economic resources measurement focus and the accrual basis of accounting. They take into account all revenues and expenses of the fiscal year regardless of when cash is received or paid. The Government-Wide Financial Statements include two statements: The Statement of Net Position and the Statement of Activities.
The Statement of Net Position reflects the financial position of the Government at fiscal year ended June 30, 2021. Accordingly, the Government’s net position, the difference between assets (what the citizens own) plus deferred outflows of resources and liabilities (what the citizens owe), is one way to determine the financial condition of the Government. Over time, increases or decreases in net position are one indicator of whether the financial health of the Government is improving or deteriorating. However, additional factors such as changes in the Government’s revenue structure, its tax base, and its level of assets held, should be considered in order to assess thoroughly the overall financial condition of the Government.
The Statement of Activities reflects the Government’s revenues and expenses, as well as other transactions that increase or decrease net position. Program revenues are offset by program expenses in order to provide better information regarding program costs financed by general government revenues.
The Government-Wide Financial Statements divide the Government’s activities into three types:
1. Governmental Activities – The activities in this section are mostly supported by intergovernmental revenues (federal grants) and taxes, namely licenses and permits, property taxes, and charges for services. Most services normally associated with local government fall into this category, including police, fire, solid waste, parks and general administration. Internal Service Fund balances are reported as part of Governmental Activities.
2. Business-Type Activities – These activities normally are intended to recover all or a significant portion of costs through user fees and charges to external users of goods and services provided by the Government. The Business-Type Activities of the Government include the operations of various Enterprise Funds, including sanitary sewer services, landfill and disposal costs, water quality, and leases and operating costs for public facilities related to debt issues.
3. Discretely Presented Component Units – The Government includes eight separate legal entities in its reports. Although legally separate and possessing independent qualities, the Government maintains financial accountability for these entities.
B. Fund Financial Statements
A fund is a grouping of related accounts used to maintain control over resources that have been segregated for specific activities or objectives. The Fund Financial Statements report the operations of the Government in greater detail than the Government-Wide Financial Statements by providing information about the Government’s most significant funds. Local ordinance or bond covenants may require the creation of some funds; others may be created at the discretion of
18
the Administration for management and fiscal control of financial resources. All funds of the Government can be divided into three types of funds: Governmental Funds, Proprietary Funds, and Fiduciary Funds.
1. Governmental funds – Governmental funds are used to account for essentially the same functions reported as Governmental Activities in the Government-Wide Financial Statements. However, unlike the Government-Wide Financial Statements, governmental fund financial statements focus on near-term inflows and outflows of expendable resources, as well as on balances of expendable resources available at the end of the fiscal year.
Most of the basic services performed by the Government are reported in the governmental funds category. These funds are reported using the modified accrual basis of accounting, which measures cash and all other financial assets that can be readily converted to cash. Because the focus of governmental funds is narrower than that of the Government-Wide Financial Statements, it is useful to compare the information presented for governmental funds with similar information presented for Governmental Activities in the Government-Wide Financial Statements. By doing so, readers may better understand the long-term impact of the Government’s near term funding decisions. The governmental fund balance sheet and the governmental fund statement of revenues, expenditures, and changes in fund balances provide a reconciliation to facilitate this comparison between governmental funds and Governmental Activities.
2. Proprietary funds – When the Government charges a fee for services which is intended to cover the cost of providing those services – whether to outside customers or other units of the Government – those services are generally reported in the proprietary funds category. The subcategories of the proprietary funds include enterprise funds and internal service funds.
Enterprise funds are used to report the same functions presented as Business-Type Activities in the Government-Wide Financial Statements.
Internal service funds are used to accumulate and allocate costs internally among the various functions of the Government. The Government uses internal service funds to account for its health, general liability, auto, property and worker’s compensation self-insurance. These services predominantly benefit Governmental Activities rather than Business-Type Activities and they have been included with Governmental Activities in the Government-Wide Financial Statements.
The proprietary funds are reported in the same way that all activities are reported in the Government-Wide Financial Statements, but the fund statements provide more detail. The Government considers the Sanitary Sewer System Fund, the Public Facilities Corporation Fund, the Landfill Fund, and the Water Quality Fund as its major proprietary funds.
3. Fiduciary funds – Fiduciary funds are used to account for resources held for the benefit of parties outside the Government. Fiduciary funds are not reflected in the Government-Wide Financial Statements because the resources of those funds are not available to support the programs of the Government. The accounting used for the fiduciary funds is similar to that used for proprietary funds. The Government is the trustee, or fiduciary, for two employees’ pension funds, the City Employees’ Pension Fund and the Policemen’s and Firefighters’ Retirement Fund.
C. Notes to the Financial Statements
The notes to the financial statements provide information that is essential to a full understanding of the data provided in the Government-Wide and Fund Financial Statements. They are an integral part of the financial statements and focus on the primary government and its activities.
19
GOVERNMENT-WIDE FINANCIAL ANALYSIS
Analysis of Net Position
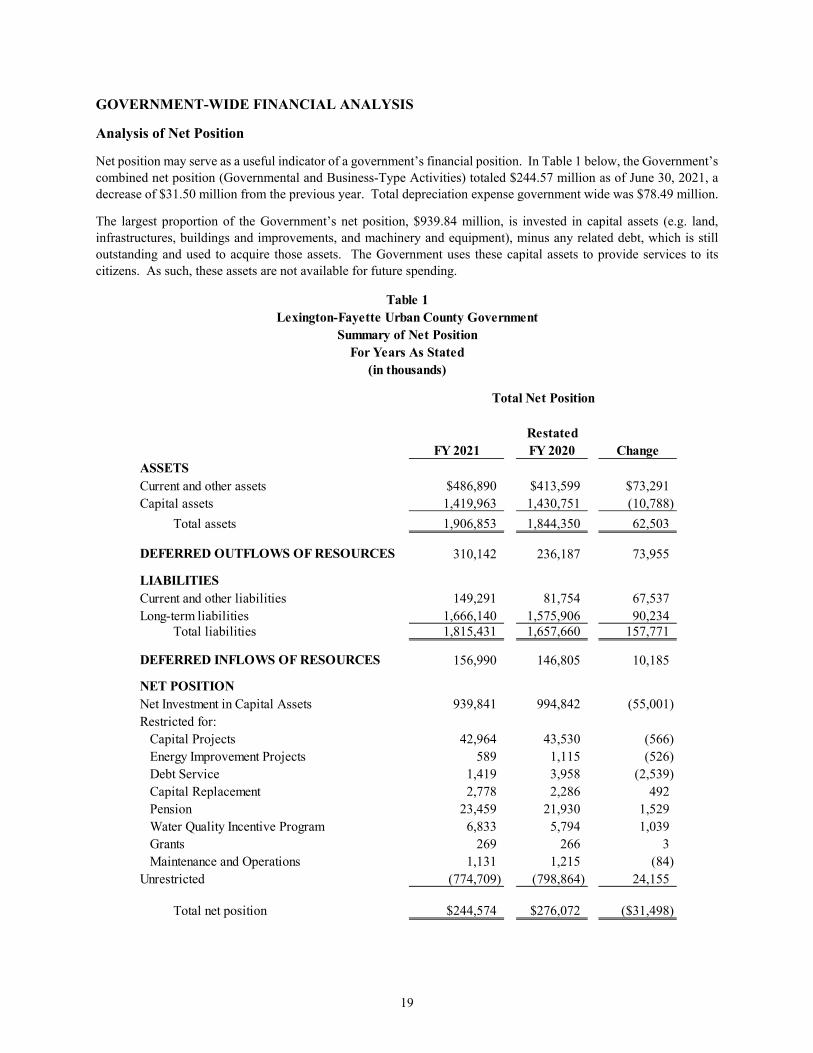
Net position may serve as a useful indicator of a government’s financial position. In Table 1 below, the Government’s combined net position (Governmental and Business-Type Activities) totaled $244.57 million as of June 30, 2021, a decrease of $31.50 million from the previous year. Total depreciation expense government wide was $78.49 million.
The largest proportion of the Government’s net position, $939.84 million, is invested in capital assets (e.g. land, infrastructures, buildings and improvements, and machinery and equipment), minus any related debt, which is still outstanding and used to acquire those assets. The Government uses these capital assets to provide services to its citizens. As such, these assets are not available for future spending.
RestatedFY 2021 FY 2020 Change
ASSETSCurrent and other assets $486,890 $413,599 $73,291Capital assets 1,419,963 1,430,751 (10,788) Total assets 1,906,853 1,844,350 62,503
DEFERRED OUTFLOWS OF RESOURCES 310,142 236,187 73,955
LIABILITIESCurrent and other liabilities 149,291 81,754 67,537Long-term liabilities 1,666,140 1,575,906 90,234 Total liabilities 1,815,431 1,657,660 157,771
DEFERRED INFLOWS OF RESOURCES 156,990 146,805 10,185
NET POSITIONNet Investment in Capital Assets 939,841 994,842 (55,001)Restricted for:
Capital Projects 42,964 43,530 (566)Energy Improvement Projects 589 1,115 (526)Debt Service 1,419 3,958 (2,539)Capital Replacement 2,778 2,286 492Pension 23,459 21,930 1,529Water Quality Incentive Program 6,833 5,794 1,039Grants 269 266 3Maintenance and Operations 1,131 1,215 (84)
Unrestricted (774,709) (798,864) 24,155
Total net position $244,574 $276,072 ($31,498)
Table 1Lexington-Fayette Urban County Government
Summary of Net PositionFor Years As Stated
(in thousands)
Total Net Position
20
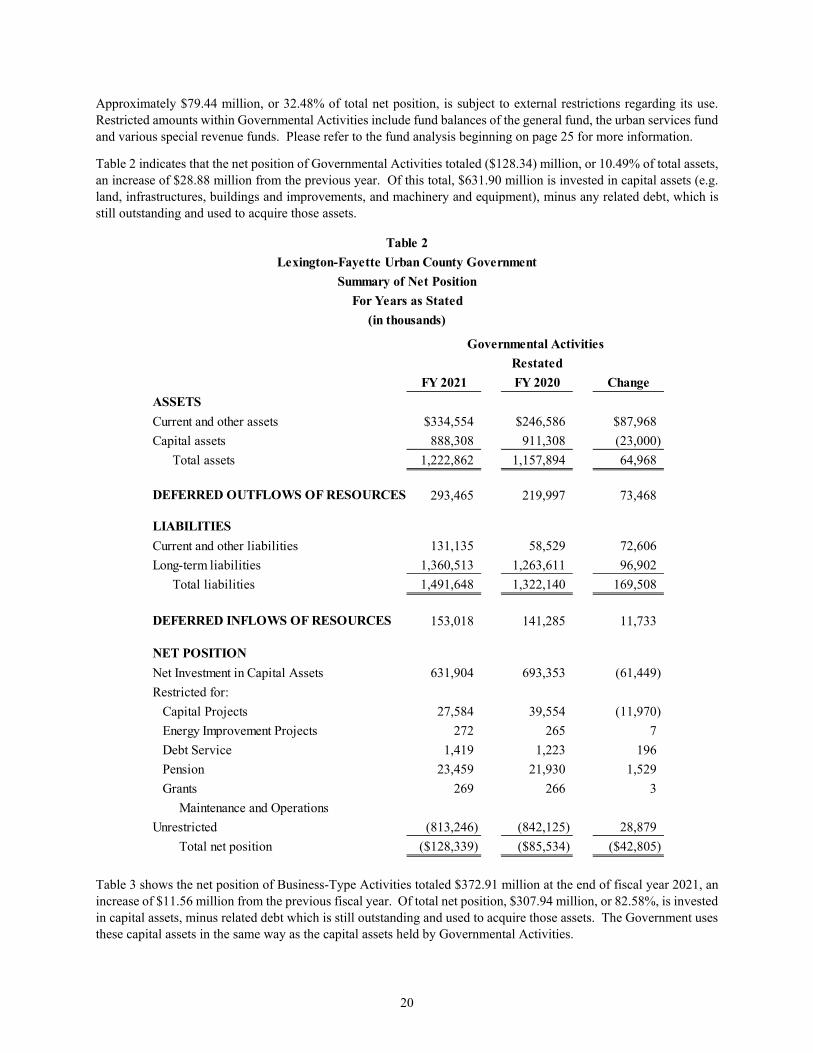
Approximately $79.44 million, or 32.48% of total net position, is subject to external restrictions regarding its use. Restricted amounts within Governmental Activities include fund balances of the general fund, the urban services fund and various special revenue funds. Please refer to the fund analysis beginning on page 25 for more information.
Table 2 indicates that the net position of Governmental Activities totaled ($128.34) million, or 10.49% of total assets, an increase of $28.88 million from the previous year. Of this total, $631.90 million is invested in capital assets (e.g. land, infrastructures, buildings and improvements, and machinery and equipment), minus any related debt, which is still outstanding and used to acquire those assets.
RestatedFY 2021 FY 2020 Change
ASSETSCurrent and other assets $334,554 $246,586 $87,968Capital assets 888,308 911,308 (23,000) Total assets 1,222,862 1,157,894 64,968
DEFERRED OUTFLOWS OF RESOURCES 293,465 219,997 73,468
LIABILITIESCurrent and other liabilities 131,135 58,529 72,606Long-term liabilities 1,360,513 1,263,611 96,902 Total liabilities 1,491,648 1,322,140 169,508
DEFERRED INFLOWS OF RESOURCES 153,018 141,285 11,733
NET POSITIONNet Investment in Capital Assets 631,904 693,353 (61,449)Restricted for:
Capital Projects 27,584 39,554 (11,970)Energy Improvement Projects 272 265 7Debt Service 1,419 1,223 196Pension 23,459 21,930 1,529Grants 269 266 3
Maintenance and OperationsUnrestricted (813,246) (842,125) 28,879 Total net position ($128,339) ($85,534) ($42,805)
Table 2Lexington-Fayette Urban County Government
Summary of Net PositionFor Years as Stated
(in thousands)
Governmental Activities
Table 3 shows the net position of Business-Type Activities totaled $372.91 million at the end of fiscal year 2021, an increase of $11.56 million from the previous fiscal year. Of total net position, $307.94 million, or 82.58%, is invested in capital assets, minus related debt which is still outstanding and used to acquire those assets. The Government uses these capital assets in the same way as the capital assets held by Governmental Activities.
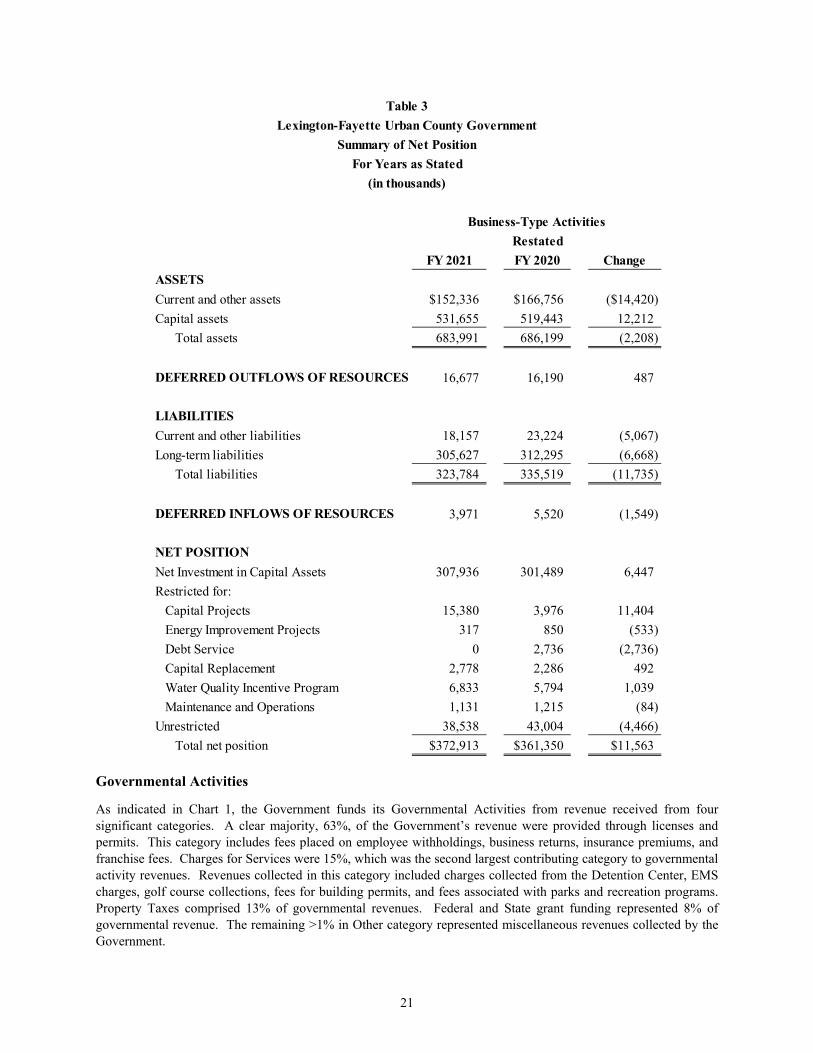
21
RestatedFY 2021 FY 2020 Change
ASSETSCurrent and other assets $152,336 $166,756 ($14,420)Capital assets 531,655 519,443 12,212 Total assets 683,991 686,199 (2,208)
DEFERRED OUTFLOWS OF RESOURCES 16,677 16,190 487
LIABILITIESCurrent and other liabilities 18,157 23,224 (5,067)Long-term liabilities 305,627 312,295 (6,668) Total liabilities 323,784 335,519 (11,735)
DEFERRED INFLOWS OF RESOURCES 3,971 5,520 (1,549)
NET POSITIONNet Investment in Capital Assets 307,936 301,489 6,447Restricted for:
Capital Projects 15,380 3,976 11,404Energy Improvement Projects 317 850 (533)Debt Service 0 2,736 (2,736)Capital Replacement 2,778 2,286 492Water Quality Incentive Program 6,833 5,794 1,039Maintenance and Operations 1,131 1,215 (84)
Unrestricted 38,538 43,004 (4,466) Total net position $372,913 $361,350 $11,563
Table 3Lexington-Fayette Urban County Government
Summary of Net PositionFor Years as Stated
(in thousands)
Business-Type Activities
Governmental Activities
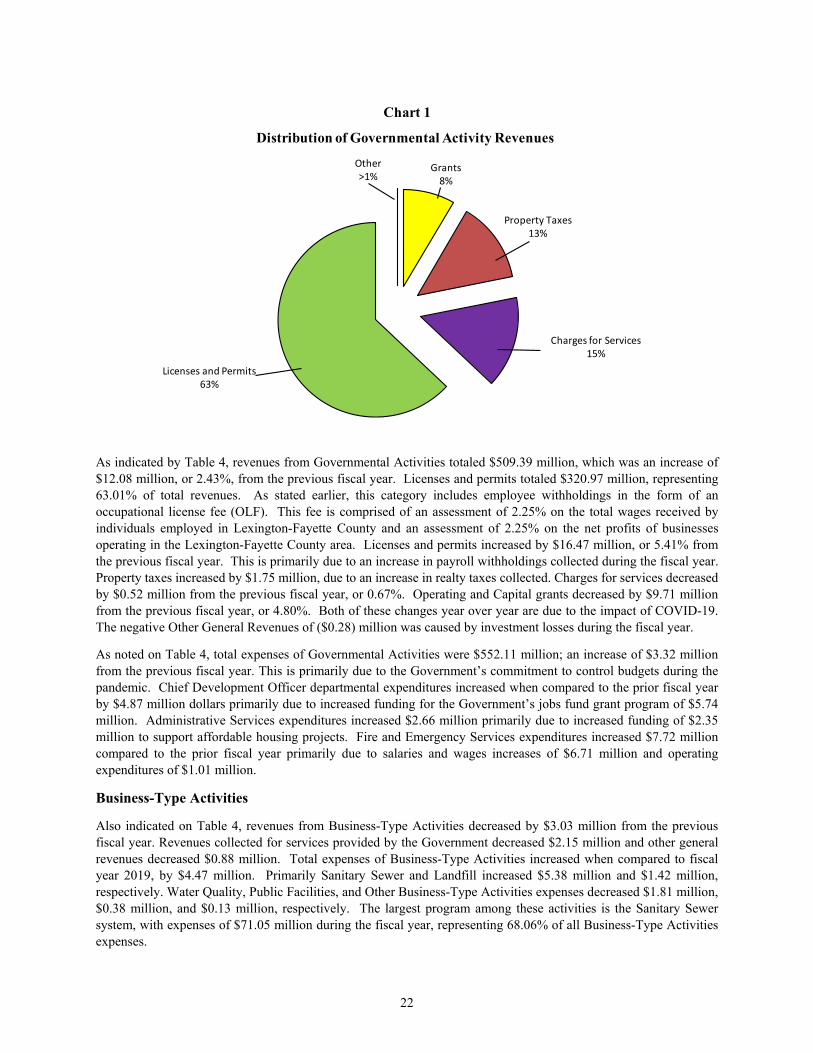
As indicated in Chart 1, the Government funds its Governmental Activities from revenue received from four significant categories. A clear majority, 63%, of the Government’s revenue were provided through licenses and permits. This category includes fees placed on employee withholdings, business returns, insurance premiums, and franchise fees. Charges for Services were 15%, which was the second largest contributing category to governmental activity revenues. Revenues collected in this category included charges collected from the Detention Center, EMS charges, golf course collections, fees for building permits, and fees associated with parks and recreation programs. Property Taxes comprised 13% of governmental revenues. Federal and State grant funding represented 8% of governmental revenue. The remaining >1% in Other category represented miscellaneous revenues collected by the Government.
22
Grants8%
Property Taxes13%
Charges for Services15%
Licenses and Permits63%
Other>1%
Chart 1
Distribution of Governmental Activity Revenues
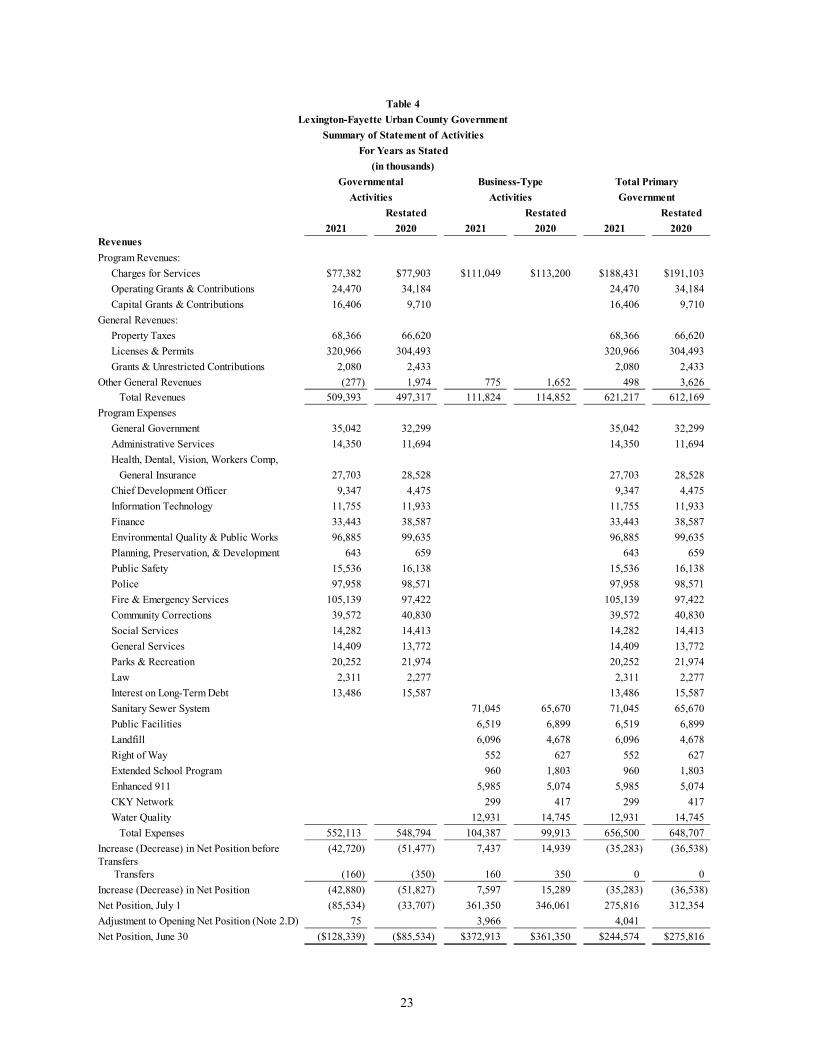
As indicated by Table 4, revenues from Governmental Activities totaled $509.39 million, which was an increase of $12.08 million, or 2.43%, from the previous fiscal year. Licenses and permits totaled $320.97 million, representing 63.01% of total revenues. As stated earlier, this category includes employee withholdings in the form of an occupational license fee (OLF). This fee is comprised of an assessment of 2.25% on the total wages received by individuals employed in Lexington-Fayette County and an assessment of 2.25% on the net profits of businesses operating in the Lexington-Fayette County area. Licenses and permits increased by $16.47 million, or 5.41% from the previous fiscal year. This is primarily due to an increase in payroll withholdings collected during the fiscal year. Property taxes increased by $1.75 million, due to an increase in realty taxes collected. Charges for services decreased by $0.52 million from the previous fiscal year, or 0.67%. Operating and Capital grants decreased by $9.71 million from the previous fiscal year, or 4.80%. Both of these changes year over year are due to the impact of COVID-19. The negative Other General Revenues of ($0.28) million was caused by investment losses during the fiscal year.
As noted on Table 4, total expenses of Governmental Activities were $552.11 million; an increase of $3.32 million from the previous fiscal year. This is primarily due to the Government’s commitment to control budgets during the pandemic. Chief Development Officer departmental expenditures increased when compared to the prior fiscal year by $4.87 million dollars primarily due to increased funding for the Government’s jobs fund grant program of $5.74 million. Administrative Services expenditures increased $2.66 million primarily due to increased funding of $2.35 million to support affordable housing projects. Fire and Emergency Services expenditures increased $7.72 million compared to the prior fiscal year primarily due to salaries and wages increases of $6.71 million and operating expenditures of $1.01 million.
Business-Type Activities
Also indicated on Table 4, revenues from Business-Type Activities decreased by $3.03 million from the previous fiscal year. Revenues collected for services provided by the Government decreased $2.15 million and other general revenues decreased $0.88 million. Total expenses of Business-Type Activities increased when compared to fiscal year 2019, by $4.47 million. Primarily Sanitary Sewer and Landfill increased $5.38 million and $1.42 million, respectively. Water Quality, Public Facilities, and Other Business-Type Activities expenses decreased $1.81 million, $0.38 million, and $0.13 million, respectively. The largest program among these activities is the Sanitary Sewer system, with expenses of $71.05 million during the fiscal year, representing 68.06% of all Business-Type Activities expenses.
23
Restated Restated Restated2021 2020 2021 2020 2021 2020
RevenuesProgram Revenues: Charges for Services $77,382 $77,903 $111,049 $113,200 $188,431 $191,103 Operating Grants & Contributions 24,470 34,184 24,470 34,184 Capital Grants & Contributions 16,406 9,710 16,406 9,710General Revenues: Property Taxes 68,366 66,620 68,366 66,620 Licenses & Permits 320,966 304,493 320,966 304,493 Grants & Unrestricted Contributions 2,080 2,433 2,080 2,433Other General Revenues (277) 1,974 775 1,652 498 3,626 Total Revenues 509,393 497,317 111,824 114,852 621,217 612,169Program Expenses General Government 35,042 32,299 35,042 32,299 Administrative Services 14,350 11,694 14,350 11,694 Health, Dental, Vision, Workers Comp, General Insurance 27,703 28,528 27,703 28,528 Chief Development Officer 9,347 4,475 9,347 4,475 Information Technology 11,755 11,933 11,755 11,933 Finance 33,443 38,587 33,443 38,587 Environmental Quality & Public Works 96,885 99,635 96,885 99,635
Planning, Preservation, & Development 643 659 643 659 Public Safety 15,536 16,138 15,536 16,138 Police 97,958 98,571 97,958 98,571 Fire & Emergency Services 105,139 97,422 105,139 97,422 Community Corrections 39,572 40,830 39,572 40,830 Social Services 14,282 14,413 14,282 14,413 General Services 14,409 13,772 14,409 13,772 Parks & Recreation 20,252 21,974 20,252 21,974 Law 2,311 2,277 2,311 2,277 Interest on Long-Term Debt 13,486 15,587 13,486 15,587 Sanitary Sewer System 71,045 65,670 71,045 65,670 Public Facilities 6,519 6,899 6,519 6,899 Landfill 6,096 4,678 6,096 4,678 Right of Way 552 627 552 627 Extended School Program 960 1,803 960 1,803 Enhanced 911 5,985 5,074 5,985 5,074 CKY Network 299 417 299 417 Water Quality 12,931 14,745 12,931 14,745 Total Expenses 552,113 548,794 104,387 99,913 656,500 648,707Increase (Decrease) in Net Position before (42,720) (51,477) 7,437 14,939 (35,283) (36,538)Transfers
Transfers (160) (350) 160 350 0 0Increase (Decrease) in Net Position (42,880) (51,827) 7,597 15,289 (35,283) (36,538)Net Position, July 1 (85,534) (33,707) 361,350 346,061 275,816 312,354Adjustment to Opening Net Position (Note 2.D) 75 3,966 4,041Net Position, June 30 ($128,339) ($85,534) $372,913 $361,350 $244,574 $275,816
Table 4Lexington-Fayette Urban County Government
Summary of Statement of ActivitiesFor Years as Stated
(in thousands)Governmental Business-Type Total Primary
Activities Activities Government
24
PERSONNEL COSTS
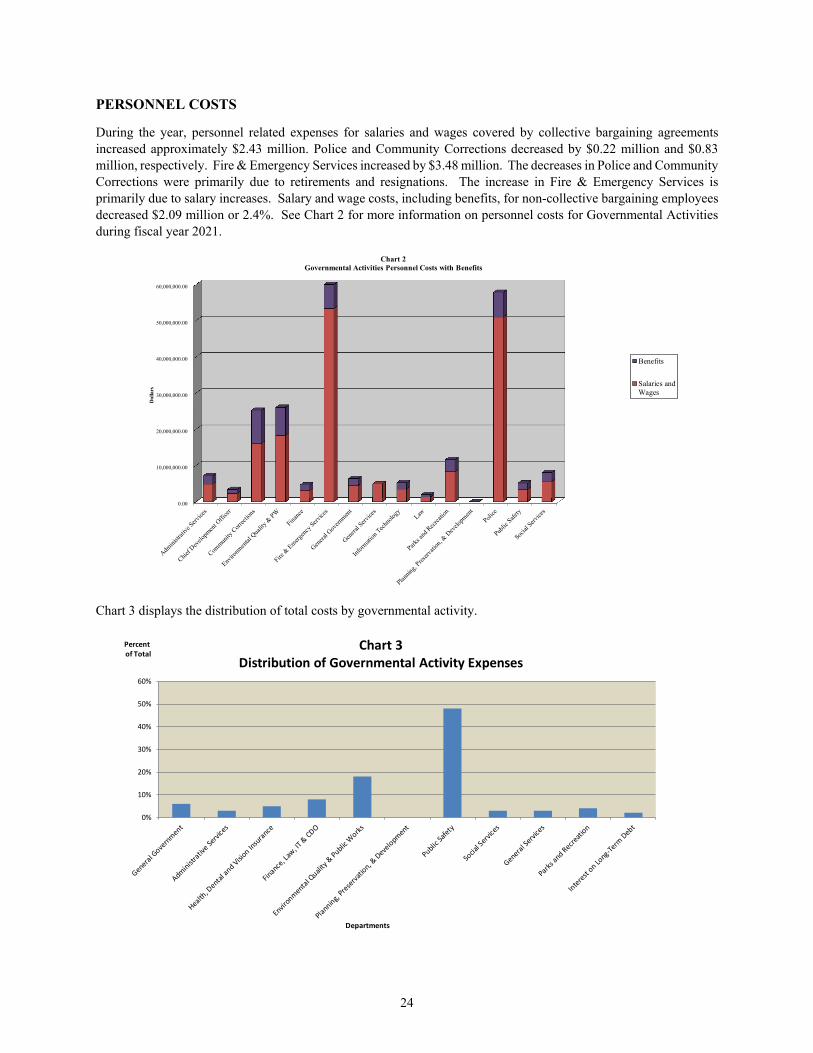
During the year, personnel related expenses for salaries and wages covered by collective bargaining agreements increased approximately $2.43 million. Police and Community Corrections decreased by $0.22 million and $0.83 million, respectively. Fire & Emergency Services increased by $3.48 million. The decreases in Police and Community Corrections were primarily due to retirements and resignations. The increase in Fire & Emergency Services is primarily due to salary increases. Salary and wage costs, including benefits, for non-collective bargaining employees decreased $2.09 million or 2.4%. See Chart 2 for more information on personnel costs for Governmental Activities during fiscal year 2021.
0.00
10,000,000.00
20,000,000.00
30,000,000.00
40,000,000.00
50,000,000.00
60,000,000.00
Dol
lars
Chart 2Governmental Activities Personnel Costs with Benefits
Benefits
Salaries andWages
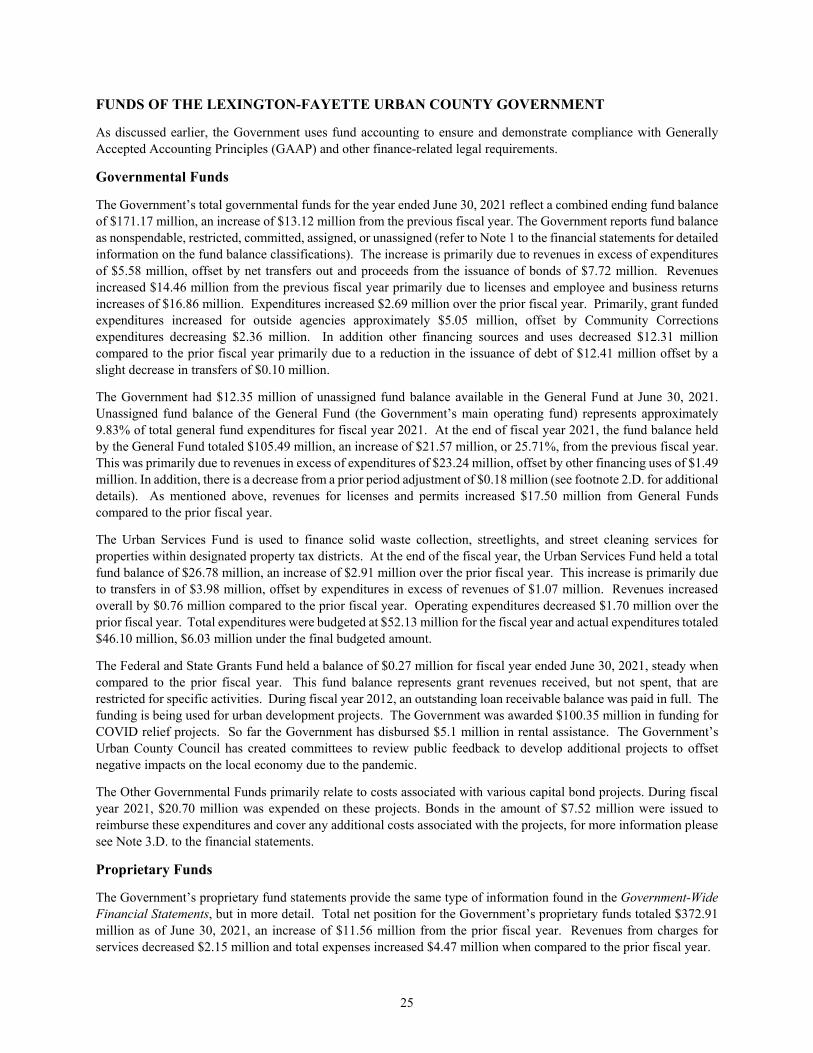
Chart 3 displays the distribution of total costs by governmental activity.
0%
10%
20%
30%
40%
50%
60%
Percentof Total
Departments
Chart 3Distribution of Governmental Activity Expenses
25
FUNDS OF THE LEXINGTON-FAYETTE URBAN COUNTY GOVERNMENT
As discussed earlier, the Government uses fund accounting to ensure and demonstrate compliance with Generally Accepted Accounting Principles (GAAP) and other finance-related legal requirements.
Governmental Funds
The Government’s total governmental funds for the year ended June 30, 2021 reflect a combined ending fund balance of $171.17 million, an increase of $13.12 million from the previous fiscal year. The Government reports fund balance as nonspendable, restricted, committed, assigned, or unassigned (refer to Note 1 to the financial statements for detailed information on the fund balance classifications). The increase is primarily due to revenues in excess of expenditures of $5.58 million, offset by net transfers out and proceeds from the issuance of bonds of $7.72 million. Revenues increased $14.46 million from the previous fiscal year primarily due to licenses and employee and business returns increases of $16.86 million. Expenditures increased $2.69 million over the prior fiscal year. Primarily, grant funded expenditures increased for outside agencies approximately $5.05 million, offset by Community Corrections expenditures decreasing $2.36 million. In addition other financing sources and uses decreased $12.31 million compared to the prior fiscal year primarily due to a reduction in the issuance of debt of $12.41 million offset by a slight decrease in transfers of $0.10 million.
The Government had $12.35 million of unassigned fund balance available in the General Fund at June 30, 2021. Unassigned fund balance of the General Fund (the Government’s main operating fund) represents approximately 9.83% of total general fund expenditures for fiscal year 2021. At the end of fiscal year 2021, the fund balance held by the General Fund totaled $105.49 million, an increase of $21.57 million, or 25.71%, from the previous fiscal year. This was primarily due to revenues in excess of expenditures of $23.24 million, offset by other financing uses of $1.49 million. In addition, there is a decrease from a prior period adjustment of $0.18 million (see footnote 2.D. for additional details). As mentioned above, revenues for licenses and permits increased $17.50 million from General Funds compared to the prior fiscal year.
The Urban Services Fund is used to finance solid waste collection, streetlights, and street cleaning services for properties within designated property tax districts. At the end of the fiscal year, the Urban Services Fund held a total fund balance of $26.78 million, an increase of $2.91 million over the prior fiscal year. This increase is primarily due to transfers in of $3.98 million, offset by expenditures in excess of revenues of $1.07 million. Revenues increased overall by $0.76 million compared to the prior fiscal year. Operating expenditures decreased $1.70 million over the prior fiscal year. Total expenditures were budgeted at $52.13 million for the fiscal year and actual expenditures totaled $46.10 million, $6.03 million under the final budgeted amount.
The Federal and State Grants Fund held a balance of $0.27 million for fiscal year ended June 30, 2021, steady when compared to the prior fiscal year. This fund balance represents grant revenues received, but not spent, that are restricted for specific activities. During fiscal year 2012, an outstanding loan receivable balance was paid in full. The funding is being used for urban development projects. The Government was awarded $100.35 million in funding for COVID relief projects. So far the Government has disbursed $5.1 million in rental assistance. The Government’s Urban County Council has created committees to review public feedback to develop additional projects to offset negative impacts on the local economy due to the pandemic.
The Other Governmental Funds primarily relate to costs associated with various capital bond projects. During fiscal year 2021, $20.70 million was expended on these projects. Bonds in the amount of $7.52 million were issued to reimburse these expenditures and cover any additional costs associated with the projects, for more information please see Note 3.D. to the financial statements.
Proprietary Funds
The Government’s proprietary fund statements provide the same type of information found in the Government-Wide Financial Statements, but in more detail. Total net position for the Government’s proprietary funds totaled $372.91 million as of June 30, 2021, an increase of $11.56 million from the prior fiscal year. Revenues from charges for services decreased $2.15 million and total expenses increased $4.47 million when compared to the prior fiscal year.
26
The Sanitary Sewer System Fund held a total net position of $277.69 million, an increase of $6.34 million over the prior year. Of the total net position held by the Sanitary Sewer System Fund, $13.90 million is restricted by bond covenants for capital replacement, projects, and debt service. In addition, $0.32 million is restricted for energy improvement projects.
The Public Facilities Corporation was created by the Government to act as an agency and instrumentality of the Government to finance and operate public projects. The net position of the Public Facilities Corporation was $22.98 million, an increase of $3.96 million from the prior fiscal year. Operating income during fiscal year 2021 was $5.72 million. The increase in net position is primarily due to operating revenues of $0.48 million, non-operating expenses of $1.27 million and transfers in of $0.28 million. In addition, a prior period adjustment increase of $4.48 million (see footnote 2.D. for additional details).
The Water Quality Fund was established to account for the revenues and expenses of developing and operating storm water related activities. The net position of the Water Quality Fund totaled $24.09 million, an increase of $2.49 million from the prior fiscal year. Revenues in excess of expenses primarily contributed to this increase.
As of June 30, 2021, the total net position of the Landfill Fund held a balance of $44.00 million, an increase of $3.04 million from the prior fiscal year, a 7.42% increase. Revenues in excess of expenses primarily contributed to this increase.
The other enterprise funds were established to account for the acquisition, operation and maintenance of the Government’s facilities and services which are entirely or predominantly self-supported by user charges or where the Government has decided that periodic determination of revenues earned, expenses incurred, and net income is appropriate for capital maintenance, public policy, management control, accountability, and other purposes. As of June 30, 2021 the other enterprise funds held total net position of $1.30 million, a decrease of $2.37 million over the previous fiscal year.
GENERAL FUND BUDGETARY HIGHLIGHTS
The General Fund is the primary operating fund of the Government. Over the course of the year, the Urban County Council revises the budget numerous times; thus, exercising one of the primary duties of the Urban County Council as guardian of the Government’s funds. Supplemental appropriations are approved to reflect actual beginning fund balances and to re-appropriate funds for capital projects. As the year progresses and actual revenue collections and budgetary experience is known, amendments are processed in order to reflect the actual results and revised expectations of future revenue and expenditures.
For fiscal year 2021, General Fund revenues totaled $386.03 million, an increase of 5.01% from the previous fiscal year. Total revenues were $38.8 million above the final budgeted amount. This increase in actual revenue is the result of increases in employee withholdings and business returns of $37.39 million and insurance premiums collected of $.88 million above the budgeted amount. Total ad valorem taxes and charges for services were $0.40 million above the final budgeted amount. Fines and forfeitures, intergovernmental, property sales, and investment returns were $1.20 million below the final budgeted amount. Other income was $1.19 million above the final budgeted amount. Total licenses and permits were $38.47 above the final budgeted amount.
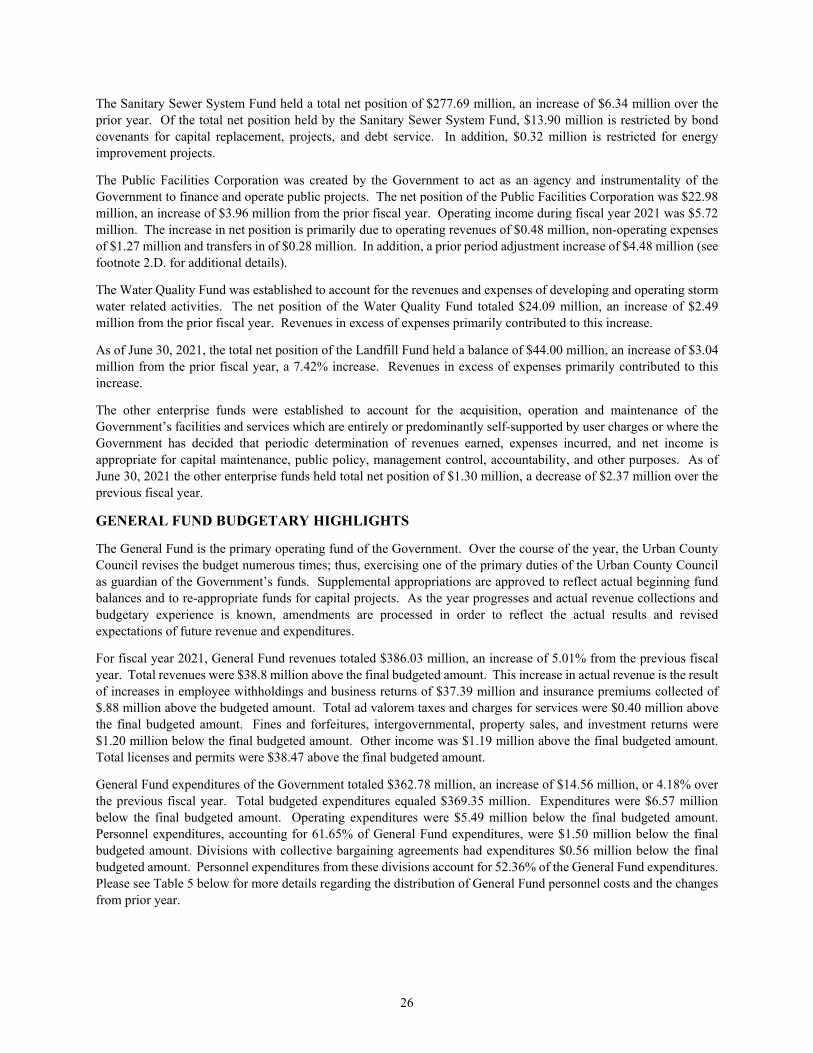
General Fund expenditures of the Government totaled $362.78 million, an increase of $14.56 million, or 4.18% over the previous fiscal year. Total budgeted expenditures equaled $369.35 million. Expenditures were $6.57 million below the final budgeted amount. Operating expenditures were $5.49 million below the final budgeted amount. Personnel expenditures, accounting for 61.65% of General Fund expenditures, were $1.50 million below the final budgeted amount. Divisions with collective bargaining agreements had expenditures $0.56 million below the final budgeted amount. Personnel expenditures from these divisions account for 52.36% of the General Fund expenditures. Please see Table 5 below for more details regarding the distribution of General Fund personnel costs and the changes from prior year.
27
Departments 2021 2020 Change % Change
% General Fund
Expenditures
Non-Collective Bargaining DivisionsAdministrative Services $6,248 $6,005 $243 4.0% 1.7%Chief Development Officer 2,552 2,861 (309) (10.8%) 0.7%Information Technology 4,977 4,984 (7) (0.1%) 1.4%Department of Finance 4,493 4,524 (31) (0.7%) 1.2%Department of General Services 4,184 4,355 (171) (3.9%) 1.2%Department of Law 1,908 1,913 (5) (0.3%) 0.5%Department of Public Safety 4,580 6,445 (1,865) (28.9%) 1.3%Department of Social Services 6,860 6,816 44 0.6% 1.9%Department of Environmental Quality & PW 25,356 10,035 15,321 152.7% 7.0%General Government 6,040 6,406 (366) (5.7%) 1.7%Parks and Recreation 11,243 12,631 (1,388) (11.0%) 3.1%
Total Non-Collective Bargaining Divisions 78,441 66,975 11,466 17.1% 21.7%
Divisions with Collective BargainingPolice 65,717 59,908 5,809 9.7% 18.1%Community Corrections 25,264 26,495 (1,231) (4.6%) 7.0%Fire & Emergency Services 71,034 64,321 6,713 10.4% 19.6%
Total Collective Bargaining Divisions 162,015 150,724 11,291 7.5% 44.7%
Total Personnel Costs with Benefits $240,456 $217,699 $22,757 10.5% 66.4%
Lexington-Fayette Urban County GovernmentSummary of General Fund Personnel Costs with Benefits
For Years as Stated(in Thousands)
CAPITAL ASSETS
The Government’s capital assets totaled $1.42 billion as of June 30, 2021, details of which are in Note 3.B. to the financial statements. This investment includes land, buildings, equipment, park facilities, roads, bridges, and sewer systems. For Governmental Activities, the net investment in capital assets totaled $631.90 million. Governmental Activities net investment in capital assets decreased by $61.45 million from the prior fiscal year. The net investment in capital assets of Business-Type Activities totaled $307.94 million, an increase of $6.45 million over the previous fiscal year.
This year’s major changes in capital assets included:
Governmental Activities total capital assets decreased by $23.00 million compared to the previous fiscal year. The decrease was primarily due to depreciation of $57.53 million and asset retirements of $0.85 million, offset capital additions of $35.38 million. Intangibles, buildings, and infrastructure decreased $1.23 million, $2.26 million, and $30.47 million respectively. Purchase of development rights, land and leasehold improvements, and construction in progress increased $0.64 million, $4.20 million, and $6.98 million respectively.
Capital assets for Business-Type Activities increased by $12.21 million. The overall increase was primarily due to additions of $31.25 million and a prior period adjustment of $4.12 million, offset by depreciation of $20.95 million and retirements of $2.20 million. The increase represents several projects underway related to the Government’s Remedial Measures Plan, filed with the Environmental Protection Agency. Additional information can be found in Note 5.B. to the financial statements.
28
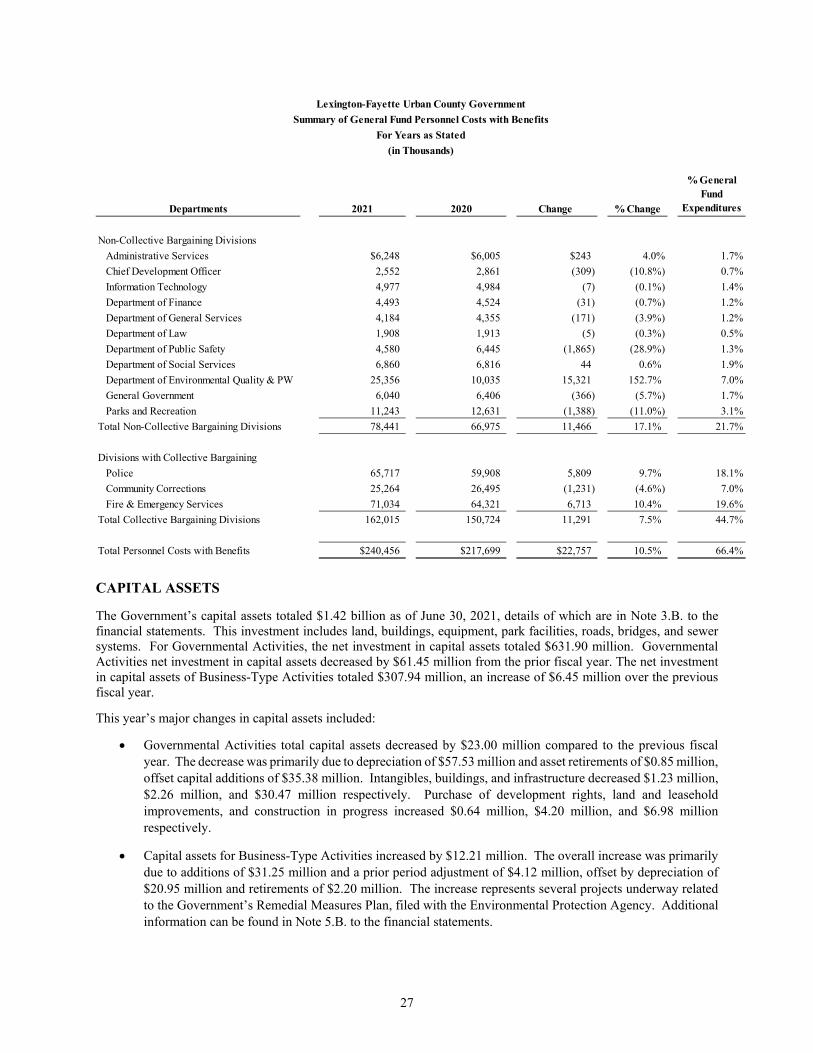
Construction in progress assets totaled $26.92 million in the Governmental Activities and $31.23 million in Business-Type Activities. The overall decrease from the previous year in construction in progress assets totaled $30.95 million. The decrease was primarily due to additions of $49.72 million offset by net asset retirements of $2.83 million, and assets placed in service of $77.83 million.
2021 2020 2021 2020 2021 2020
Land* $62,895 $62,895 $50,823 $46,422 $113,718 $109,317Purchase of Development Rights 82,560 81,923 82,560 81,923Intangibles 12,765 13,990 1,905 2,951 14,670 16,941Buildings 109,619 111,878 21,354 24,757 130,973 136,635Vehicles, Equipment, & Furniture 46,023 46,887 18,273 17,589 64,296 64,476Land and Leasehold Improvements 22,735 18,531 5,874 5,988 28,609 24,519Infrastructure & Sewer Lines/Plants 524,632 555,105 399,898 350,282 924,530 905,387Construction in Progress 26,922 19,942 33,528 71,455 60,450 91,397Developments in Progress 157 157 0 0 157 157 Total $888,308 $911,308 $531,655 $519,444 $1,419,963 $1,430,752
* Restated beginning balance due to prior period adjustment, see Note 2.D. to the financial statements.
Governmental Activities Business-Type Activities Total Primary Government
Table 6Lexington-Fayette Urban County Government
Summary of Capital AssetsFor Years as Stated
(in thousands)
Additional information on the Government’s capital assets activity can be found in Note 3.B. to the financial statements. DEBT ADMINISTRATION
The Government began issuing General Obligation (GO) bonds in fiscal year 1999 because of changes in state law that had previously precluded this type of financing. Since GO bonds are backed by the full faith and credit of the Government, they carry a higher credit rating than other forms of debt and have lower interest rates. As a result, future debt issues on behalf of the Government will be GO debt, unless such debt is secured by Enterprise Fund activities.
Prior to the issuance of GO bonds, mortgage revenue bonds were issued through various public corporations in order to finance public projects. For mortgage revenue bonds, the Government enters into annual renewable lease agreements automatically with the corporations whereby lease payments from the Government, combined with revenues generated by the operation of the facilities, are sufficient to meet debt service obligations. The underlying security for the bond is the annual lease agreements and the underlying mortgages on the property. Revenue bonds, where only the revenues from the operation of the facilities are pledged as security for the bonds, are issued to finance improvements to the sanitary sewer system.
At the end of fiscal year 2021, the Government had $607.30 million in bonds and notes outstanding; Governmental Activities’ debt decreased by $24.65 million and total debt decreased by $39.03 million. The decrease in debt for Governmental Activities resulted primarily from the issuance of GO bonds totaling $7.52 million and refunding debt issuance and payment of $4.12 million, offset by principal payments and amortized bond costs in the current fiscal year on outstanding debt of $36.29 million. The Business-Type Activities debt decreased $14.38 million primarily from bond and note payable proceeds of $0.39 million, offset by principal payments and amortized bond costs of $14.77 million.
Despite legal changes that provide for the issuance of GO debt, legal limits remain on the total amount of GO indebtedness that may be incurred. The Kentucky Constitution provides that the total principal amount of GO debt
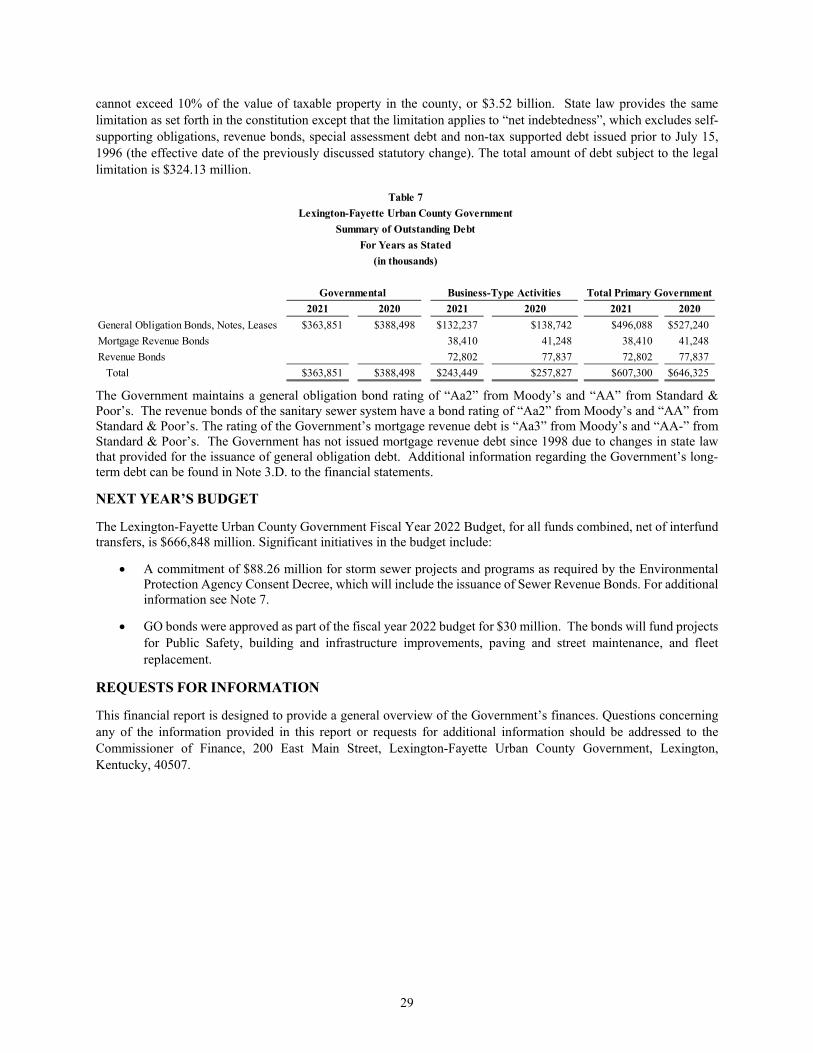
29
cannot exceed 10% of the value of taxable property in the county, or $3.52 billion. State law provides the same limitation as set forth in the constitution except that the limitation applies to “net indebtedness”, which excludes self-supporting obligations, revenue bonds, special assessment debt and non-tax supported debt issued prior to July 15, 1996 (the effective date of the previously discussed statutory change). The total amount of debt subject to the legal limitation is $324.13 million.
2021 2020 2021 2020 2021 2020General Obligation Bonds, Notes, Leases $363,851 $388,498 $132,237 $138,742 $496,088 $527,240Mortgage Revenue Bonds 38,410 41,248 38,410 41,248Revenue Bonds 72,802 77,837 72,802 77,837 Total $363,851 $388,498 $243,449 $257,827 $607,300 $646,325
Governmental Business-Type Activities Total Primary Government
Table 7Lexington-Fayette Urban County Government
Summary of Outstanding DebtFor Years as Stated
(in thousands)
The Government maintains a general obligation bond rating of “Aa2” from Moody’s and “AA” from Standard & Poor’s. The revenue bonds of the sanitary sewer system have a bond rating of “Aa2” from Moody’s and “AA” from Standard & Poor’s. The rating of the Government’s mortgage revenue debt is “Aa3” from Moody’s and “AA-” from Standard & Poor’s. The Government has not issued mortgage revenue debt since 1998 due to changes in state law that provided for the issuance of general obligation debt. Additional information regarding the Government’s long-term debt can be found in Note 3.D. to the financial statements.
NEXT YEAR’S BUDGET
The Lexington-Fayette Urban County Government Fiscal Year 2022 Budget, for all funds combined, net of interfund transfers, is $666,848 million. Significant initiatives in the budget include:
A commitment of $88.26 million for storm sewer projects and programs as required by the Environmental Protection Agency Consent Decree, which will include the issuance of Sewer Revenue Bonds. For additional information see Note 7.
GO bonds were approved as part of the fiscal year 2022 budget for $30 million. The bonds will fund projects for Public Safety, building and infrastructure improvements, paving and street maintenance, and fleet replacement.
REQUESTS FOR INFORMATION
This financial report is designed to provide a general overview of the Government’s finances. Questions concerning any of the information provided in this report or requests for additional information should be addressed to the Commissioner of Finance, 200 East Main Street, Lexington-Fayette Urban County Government, Lexington, Kentucky, 40507.
30
BASIC FINANCIAL STATEMENTS
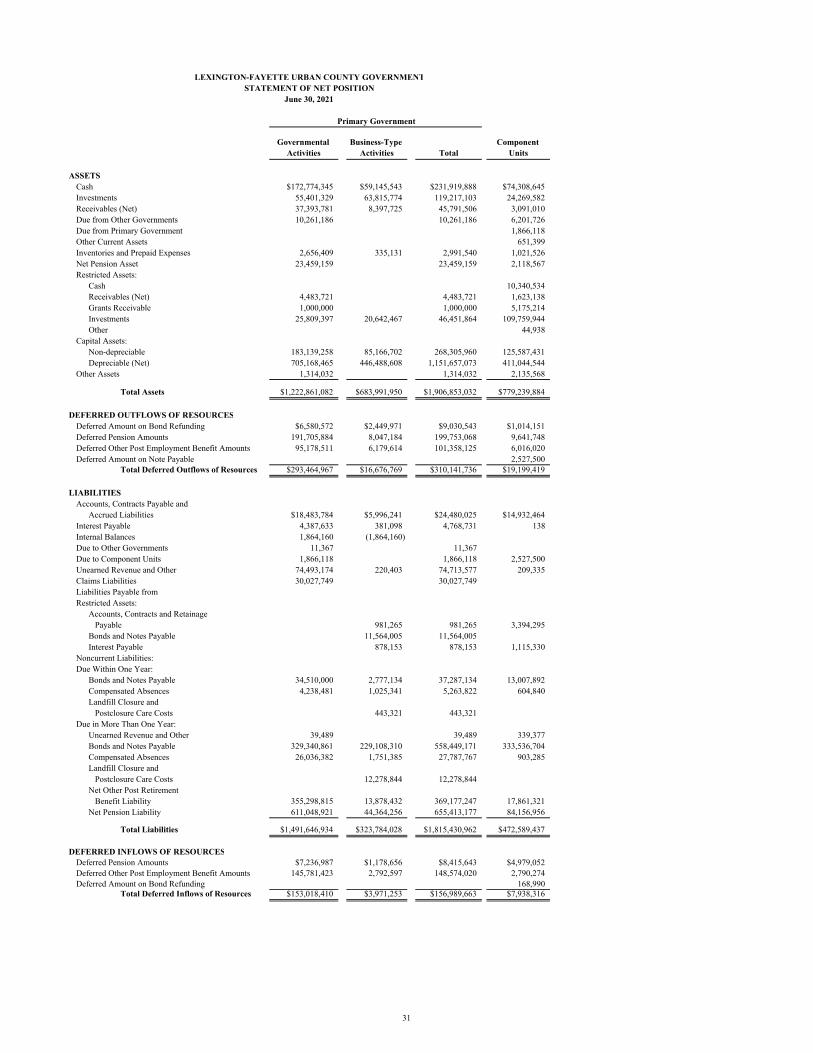
Governmental Activities
Business-Type Activities Total
Component Units
ASSETS Cash $172,774,345 $59,145,543 $231,919,888 $74,308,645 Investments 55,401,329 63,815,774 119,217,103 24,269,582 Receivables (Net) 37,393,781 8,397,725 45,791,506 3,091,010 Due from Other Governments 10,261,186 10,261,186 6,201,726 Due from Primary Government 1,866,118 Other Current Assets 651,399 Inventories and Prepaid Expenses 2,656,409 335,131 2,991,540 1,021,526 Net Pension Asset 23,459,159 23,459,159 2,118,567 Restricted Assets:
Cash 10,340,534Receivables (Net) 4,483,721 4,483,721 1,623,138Grants Receivable 1,000,000 1,000,000 5,175,214
Investments 25,809,397 20,642,467 46,451,864 109,759,944 Other 44,938 Capital Assets: Non-depreciable 183,139,258 85,166,702 268,305,960 125,587,431 Depreciable (Net) 705,168,465 446,488,608 1,151,657,073 411,044,544
Other Assets 1,314,032 1,314,032 2,135,568
Total Assets $1,222,861,082 $683,991,950 $1,906,853,032 $779,239,884
DEFERRED OUTFLOWS OF RESOURCESDeferred Amount on Bond Refunding $6,580,572 $2,449,971 $9,030,543 $1,014,151Deferred Pension Amounts 191,705,884 8,047,184 199,753,068 9,641,748Deferred Other Post Employment Benefit Amounts 95,178,511 6,179,614 101,358,125 6,016,020Deferred Amount on Note Payable 2,527,500
Total Deferred Outflows of Resources $293,464,967 $16,676,769 $310,141,736 $19,199,419
LIABILITIES Accounts, Contracts Payable and Accrued Liabilities $18,483,784 $5,996,241 $24,480,025 $14,932,464 Interest Payable 4,387,633 381,098 4,768,731 138 Internal Balances 1,864,160 (1,864,160) Due to Other Governments 11,367 11,367 Due to Component Units 1,866,118 1,866,118 2,527,500 Unearned Revenue and Other 74,493,174 220,403 74,713,577 209,335 Claims Liabilities 30,027,749 30,027,749 Liabilities Payable from Restricted Assets: Accounts, Contracts and Retainage Payable 981,265 981,265 3,394,295 Bonds and Notes Payable 11,564,005 11,564,005 Interest Payable 878,153 878,153 1,115,330 Noncurrent Liabilities: Due Within One Year: Bonds and Notes Payable 34,510,000 2,777,134 37,287,134 13,007,892 Compensated Absences 4,238,481 1,025,341 5,263,822 604,840 Landfill Closure and Postclosure Care Costs 443,321 443,321 Due in More Than One Year: Unearned Revenue and Other 39,489 39,489 339,377 Bonds and Notes Payable 329,340,861 229,108,310 558,449,171 333,536,704 Compensated Absences 26,036,382 1,751,385 27,787,767 903,285 Landfill Closure and Postclosure Care Costs 12,278,844 12,278,844
Net Other Post Retirement Benefit Liability 355,298,815 13,878,432 369,177,247 17,861,321
Net Pension Liability 611,048,921 44,364,256 655,413,177 84,156,956 Total Liabilities $1,491,646,934 $323,784,028 $1,815,430,962 $472,589,437
DEFERRED INFLOWS OF RESOURCESDeferred Pension Amounts $7,236,987 $1,178,656 $8,415,643 $4,979,052Deferred Other Post Employment Benefit Amounts 145,781,423 2,792,597 148,574,020 2,790,274Deferred Amount on Bond Refunding 168,990
Total Deferred Inflows of Resources $153,018,410 $3,971,253 $156,989,663 $7,938,316
LEXINGTON-FAYETTE URBAN COUNTY GOVERNMENTSTATEMENT OF NET POSITION
June 30, 2021
Primary Government
31
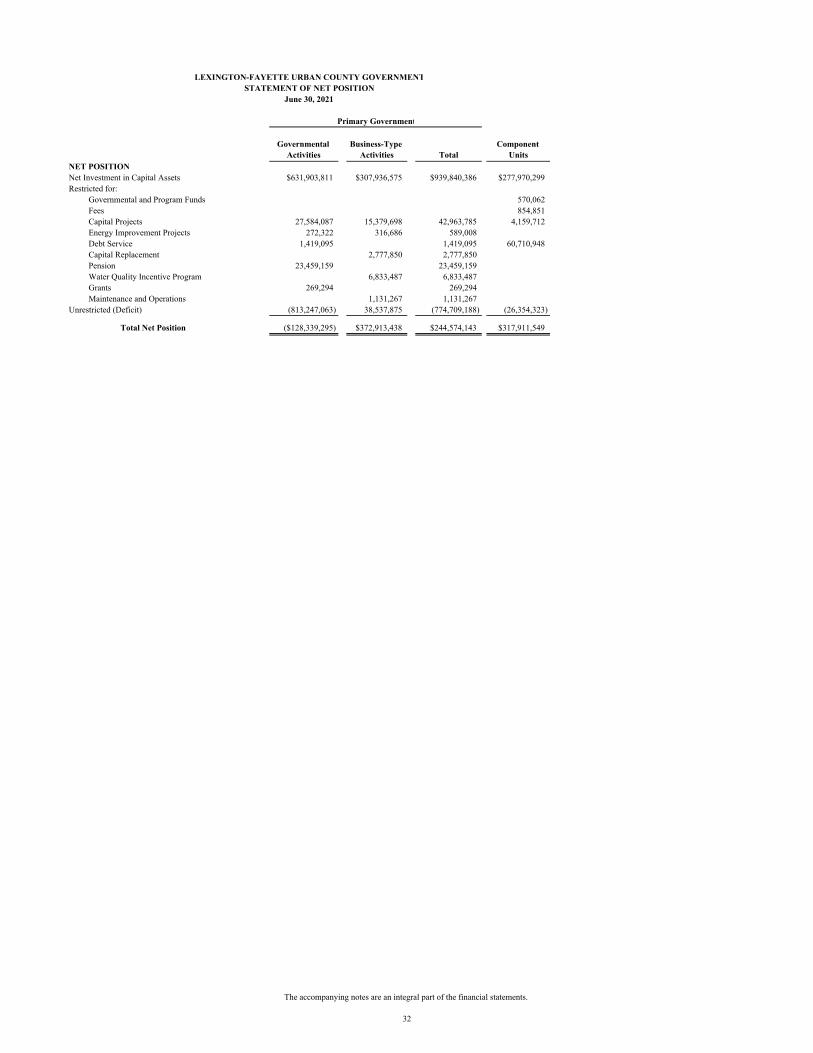
LEXINGTON-FAYETTE URBAN COUNTY GOVERNMENTSTATEMENT OF NET POSITION
June 30, 2021
Governmental Activities
Business-Type Activities Total
Component Units
NET POSITIONNet Investment in Capital Assets $631,903,811 $307,936,575 $939,840,386 $277,970,299Restricted for:
Governmental and Program Funds 570,062Fees 854,851Capital Projects 27,584,087 15,379,698 42,963,785 4,159,712Energy Improvement Projects 272,322 316,686 589,008Debt Service 1,419,095 1,419,095 60,710,948Capital Replacement 2,777,850 2,777,850Pension 23,459,159 23,459,159 Water Quality Incentive Program 6,833,487 6,833,487Grants 269,294 269,294Maintenance and Operations 1,131,267 1,131,267
Unrestricted (Deficit) (813,247,063) 38,537,875 (774,709,188) (26,354,323)
Total Net Position ($128,339,295) $372,913,438 $244,574,143 $317,911,549
Primary Government
The accompanying notes are an integral part of the financial statements.
32
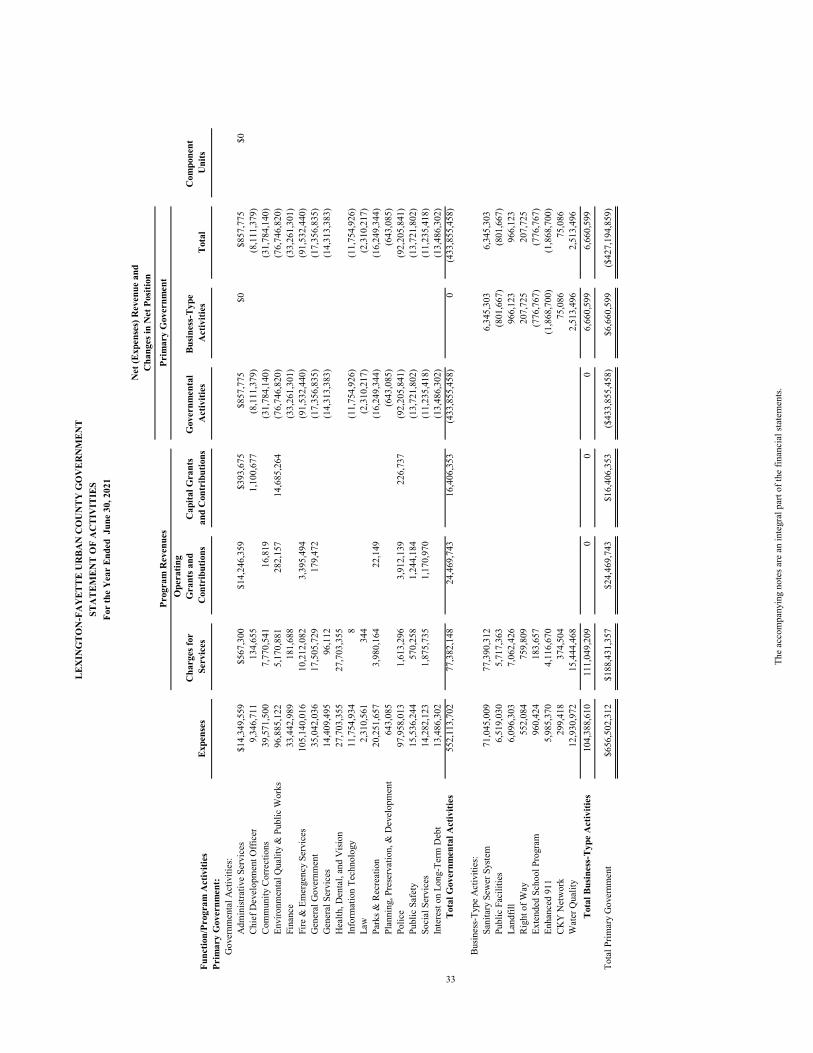
Func
tion/
Prog
ram
Act
iviti
esEx
pens
esC
harg
es fo
r Se
rvic
es
Ope
ratin
g G
rant
s and
C
ontr
ibut
ions
Cap
ital G
rant
s an
d C
ontr
ibut
ions
Gov
ernm
enta
l A
ctiv
ities
Busin
ess-
Type
A
ctiv
ities
Tota
lC
ompo
nent
U
nits
Prim
ary
Gov
ernm
ent:
Gov
ernm
enta
l Act
iviti
es:
Adm
inist
rativ
e Se
rvic
es$1
4,34
9,55
9$5
67,3
00$1
4,24
6,35
9$3
93,6
75$8
57,7
75$0
$857
,775
$0Ch
ief D
evel
opm
ent O
ffice
r9,
346,
711
134,
655
1,10
0,67
7(8
,111
,379
)(8
,111
,379
)Co
mm
unity
Cor
rect
ions
39,5
71,5
007,
770,
541
16,8
19(3
1,78
4,14
0)(3
1,78
4,14
0)En
viro
nmen
tal Q
ualit
y &
Pub
lic W
orks
96,8
85,1
225,
170,
881
282,
157
14,6
85,2
64(7
6,74
6,82
0)(7
6,74
6,82
0)Fi
nanc
e33
,442
,989
181,
688
(33,
261,
301)
(33,
261,
301)
Fire
& E
mer
genc
y Se
rvic
es10
5,14
0,01
610
,212
,082
3,39
5,49
4(9
1,53
2,44
0)(9
1,53
2,44
0)G
ener
al G
over
nmen
t35
,042
,036
17,5
05,7
2917
9,47
2(1
7,35
6,83
5)(1
7,35
6,83
5)G
ener
al S
ervi
ces
14,4
09,4
9596
,112
(14,
313,
383)
(14,
313,
383)
Hea
lth, D
enta
l, an
d V
ision
27,7
03,3
5527
,703
,355
Info
rmat
ion
Tech
nolo
g y11
,754
,934
8(1
1,75
4,92
6)(1
1,75
4,92
6)La
w2,
310,
561
344
(2,3
10,2
17)
(2,3
10,2
17)
Park
s & R
ecre
atio
n20
,251
,657
3,98
0,16
422
,149
(16,
249,
344)
(16,
249,
344)
Plan
ning
, Pre
serv
atio
n, &
Dev
elop
men
t64
3,08
5
(6
43,0
85)
(643
,085
)Po
lice
97,9
58,0
131,
613,
296
3,91
2,13
922
6,73
7(9
2,20
5,84
1)(9
2,20
5,84
1)Pu
blic
Saf
ety
15,5
36,2
4457
0,25
81,
244,
184
(13,
721,
802)
(13,
721,
802)
Soci
al S
ervi
ces
14,2
82,1
231,
875,
735
1,17
0,97
0(1
1,23
5,41
8)(1
1,23
5,41
8)In
tere
st on
Lon
g-Te
rm D
ebt
13,4
86,3
02(1
3,48
6,30
2)(1
3,48
6,30
2)To
tal G
over
nmen
tal A
ctiv
ities
552,
113,
702
77,3
82,1
4824
,469
,743
16,4
06,3
53(4
33,8
55,4
58)
0(4
33,8
55,4
58)
Busin
ess-
Type
Act
iviti
es:
Sani
tary
Sew
er S
yste
m71
,045
,009
77,3
90,3
126,
345,
303
6,34
5,30
3Pu
blic
Fac
ilitie
s6,
519,
030
5,71
7,36
3(8
01,6
67)
(801
,667
)La
ndfil
l6,
096,
303
7,06
2,42
696
6,12
396
6,12
3Ri
ght o
f Wa y
552,
084
759,
809
207,
725
207,
725
Exte
nded
Sch
ool P
rogr
am96
0,42
418
3,65
7(7
76,7
67)
(776
,767
)En
hanc
ed 9
115,
985,
370
4,11
6,67
0(1
,868
,700
)(1
,868
,700
)CK
Y N
etw
ork
299,
418
374,
504
75,0
8675
,086
Wat
er Q
ualit
y12
,930
,972
15,4
44,4
682,
513,
496
2,51
3,49
6To
tal B
usin
ess-
Type
Act
iviti
es10
4,38
8,61
011
1,04
9,20
90
00
6,66
0,59
96,
660,
599
Tota
l Prim
ary
Gov
ernm
ent
$656
,502
,312
$188
,431
,357
$24,
469,
743
$16,
406,
353
($43
3,85
5,45
8)$6
,660
,599
($42
7,19
4,85
9)
LEX
ING
TON
-FA
YET
TE U
RBA
N C
OU
NTY
GO
VER
NM
ENT
STA
TEM
ENT
OF
AC
TIV
ITIE
SFo
r th
e Y
ear
Ende
d J
une
30, 2
021
Net
(Exp
ense
s) R
even
ue a
ndC
hang
es in
Net
Pos
ition
Prog
ram
Rev
enue
sPr
imar
y G
over
nmen
t
33
The
acco
mpa
nyin
g no
tes a
re a
n in
tegr
al p
art o
f the
fina
ncia
l sta
tem
ents.
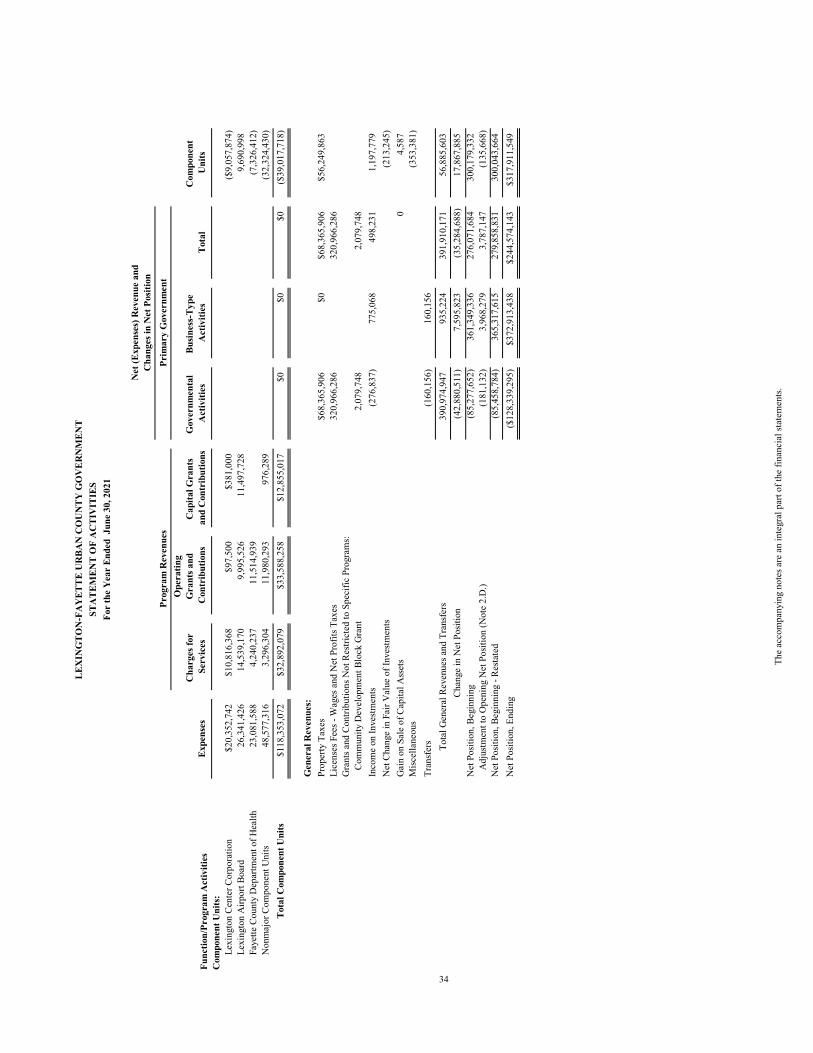
Func
tion/
Prog
ram
Act
iviti
esEx
pens
esC
harg
es fo
r Se
rvic
es
Ope
ratin
g G
rant
s and
C
ontr
ibut
ions
Cap
ital G
rant
s an
d C
ontr
ibut
ions
Gov
ernm
enta
l A
ctiv
ities
Busin
ess-
Type
A
ctiv
ities
Tota
lC
ompo
nent
U
nits
LEX
ING
TON
-FA
YET
TE U
RBA
N C
OU
NTY
GO
VER
NM
ENT
STA
TEM
ENT
OF
AC
TIV
ITIE
SFo
r th
e Y
ear
Ende
d J
une
30, 2
021
Net
(Exp
ense
s) R
even
ue a
ndC
hang
es in
Net
Pos
ition
Prog
ram
Rev
enue
sPr
imar
y G
over
nmen
t
Com
pone
nt U
nits
:Le
ton
Cent
er C
orpo
ratio
n$2
0,35
2,74
2$1
0,81
6,36
8$9
7,50
0$3
81,0
00($
9,05
7,87
4)Le
ton
Airp
ort B
oar d
26,3
41,4
2614
,539
,170
9,99
5,52
6
11,4
97,7
289,
690,
998
Faye
tte C
ount
y D
epar
tmen
t of H
ealth
23,0
81,5
884,
240,
237
11,5
14,9
39(7
,326
,412
)N
onm
ajor
Com
pone
nt U
nits
48,5
77,3
163,
296,
304
11,9
80,2
9397
6,28
9(3
2,32
4,43
0)To
tal C
ompo
nent
Uni
ts$1
18,3
53,0
72$3
2,89
2,07
9$3
3,58
8,25
8$1
2,85
5,01
7$0
$0$0
($39
,017
,718
)
Gen
eral
Rev
enue
s:Pr
oper
ty T
axes
$68,
365,
906
$0$6
8,36
5,90
6$5
6,24
9,86
3Li
cens
es F
ees -
Wag
es a
nd N
et P
rofit
s Tax
es32
0,96
6,28
632
0,96
6,28
6G
rant
s and
Con
tribu
tions
Not
Res
trict
ed to
Spe
cific
Pro
gram
s:Co
mm
unity
Dev
elop
men
t Blo
ck G
rant
2,07
9,74
82,
079,
748
Inco
me
on In
vestm
ents
(276
,837
)77
5,06
849
8,23
11,
197,
779
Net
Cha
nge
in F
air V
alue
of I
nves
tmen
ts
(213
,245
)G
ain
on S
ale
of C
apita
l Ass
ets
04,
587
Misc
ella
neou
s
(353
,381
)Tr
ansf
ers
(160
,156
)16
0,15
6
T
otal
Gen
eral
Rev
enue
s and
Tra
nsfe
rs39
0,97
4,94
793
5,22
439
1,91
0,17
156
,885
,603
Chan
ge in
Net
Pos
ition
(42,
880,
511)
7,59
5,82
3(3
5,28
4,68
8)17
,867
,885
Net
Pos
ition
, Beg
inni
ng(8
5,27
7,65
2)36
1,34
9,33
627
6,07
1,68
430
0,17
9,33
2A
djus
tmen
t to
Ope
ning
Net
Pos
ition
(Not
e 2.
D.)
(181
,132
)3,
968,
279
3,78
7,14
7(1
35,6
68)
Net
Pos
ition
, Beg
inni
ng -
Resta
ted
(85,
458,
784)
365,
317,
615
279,
858,
831
300,
043,
664
Net
Pos
ition
, End
ing
($12
8,33
9,29
5)$3
72,9
13,4
38$2
44,5
74,1
43$3
17,9
11,5
49
34
The
acco
mpa
nyin
g no
tes a
re a
n in
tegr
al p
art o
f the
fina
ncia
l sta
tem
ents.
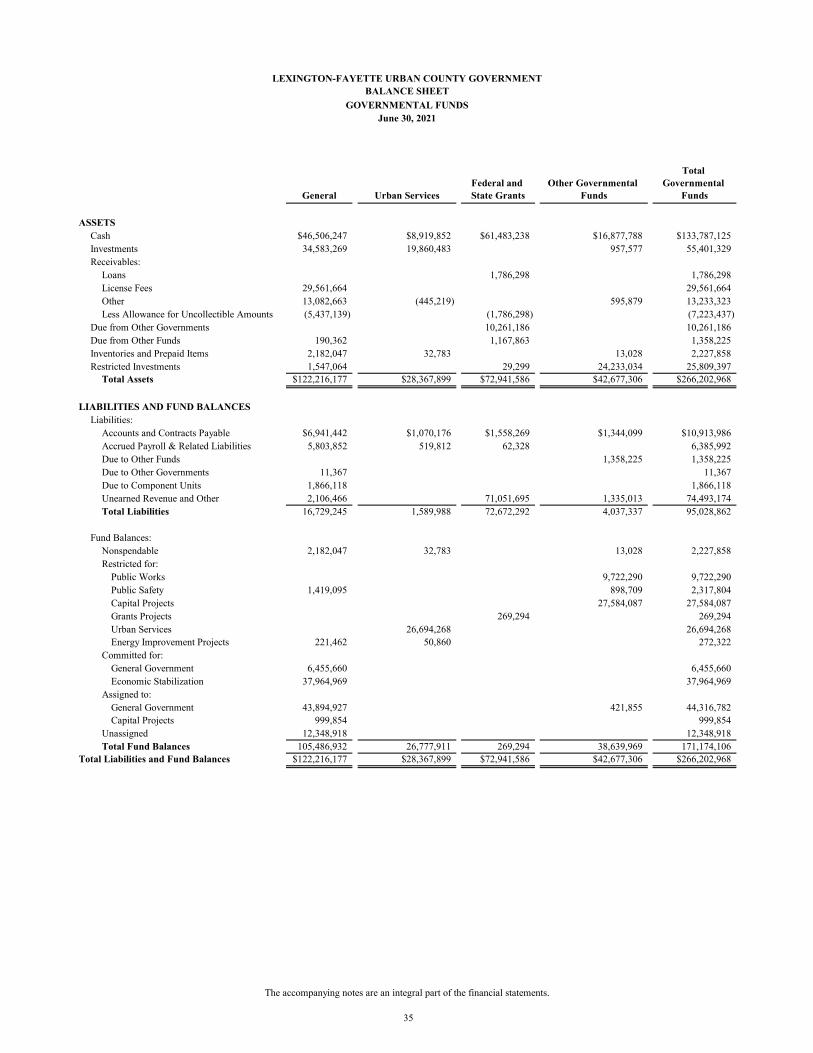
General Urban ServicesFederal and State Grants
Other Governmental Funds
Total Governmental
Funds
ASSETSCash $46,506,247 $8,919,852 $61,483,238 $16,877,788 $133,787,125Investments 34,583,269 19,860,483 957,577 55,401,329Receivables:
Loans 1,786,298 1,786,298License Fees 29,561,664 29,561,664Other 13,082,663 (445,219) 595,879 13,233,323Less Allowance for Uncollectible Amounts (5,437,139) (1,786,298) (7,223,437)
Due from Other Governments 10,261,186 10,261,186Due from Other Funds 190,362 1,167,863 1,358,225Inventories and Prepaid Items 2,182,047 32,783 13,028 2,227,858Restricted Investments 1,547,064 29,299 24,233,034 25,809,397
Total Assets $122,216,177 $28,367,899 $72,941,586 $42,677,306 $266,202,968
LIABILITIES AND FUND BALANCESLiabilities:
Accounts and Contracts Payable $6,941,442 $1,070,176 $1,558,269 $1,344,099 $10,913,986Accrued Payroll & Related Liabilities 5,803,852 519,812 62,328 6,385,992Due to Other Funds 1,358,225 1,358,225Due to Other Governments 11,367 11,367Due to Component Units 1,866,118 1,866,118Unearned Revenue and Other 2,106,466 71,051,695 1,335,013 74,493,174Total Liabilities 16,729,245 1,589,988 72,672,292 4,037,337 95,028,862
Fund Balances:Nonspendable 2,182,047 32,783 13,028 2,227,858Restricted for:
9,722,290 9,722,2901,419,095 898,709 2,317,804
27,584,087 27,584,087269,294 269,294
26,694,268 26,694,268221,462 50,860 272,322
Committed for: General Government 6,455,660 6,455,660 Economic Stabilization 37,964,969 37,964,969
Assigned to: General Government 43,894,927 421,855 44,316,782
999,854 999,854Unassigned 12,348,918 12,348,918Total Fund Balances 105,486,932 26,777,911 269,294 38,639,969 171,174,106
Total Liabilities and Fund Balances $122,216,177 $28,367,899 $72,941,586 $42,677,306 $266,202,968
Public Safety
LEXINGTON-FAYETTE URBAN COUNTY GOVERNMENTBALANCE SHEET
GOVERNMENTAL FUNDSJune 30, 2021
Public Works
Capital Projects Grants Projects Urban Services
Capital Projects
Energy Improvement Projects
The accompanying notes are an integral part of the financial statements.
35
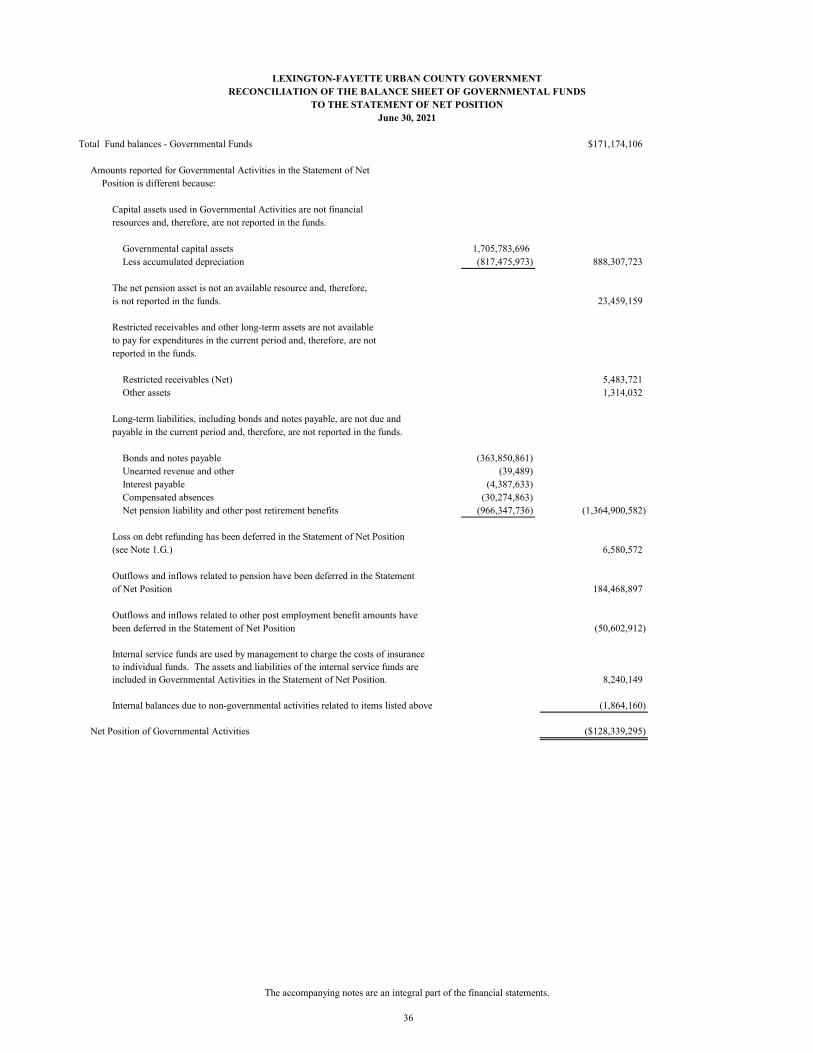
Total Fund balances - Governmental Funds $171,174,106
Amounts reported for Governmental Activities in the Statement of Net Position is different because:
Capital assets used in Governmental Activities are not financial resources and, therefore, are not reported in the funds.
Governmental capital assets 1,705,783,696Less accumulated depreciation (817,475,973) 888,307,723
The net pension asset is not an available resource and, therefore,is not reported in the funds. 23,459,159
Restricted receivables and other long-term assets are not availableto pay for expenditures in the current period and, therefore, are notreported in the funds.
Restricted receivables (Net) 5,483,721Other assets 1,314,032
Long-term liabilities, including bonds and notes payable, are not due andpayable in the current period and, therefore, are not reported in the funds.
Bonds and notes payable (363,850,861)Unearned revenue and other (39,489)Interest payable (4,387,633)Compensated absences (30,274,863)Net pension liability and other post retirement benefits (966,347,736) (1,364,900,582)
Loss on debt refunding has been deferred in the Statement of Net Position(see Note 1.G.) 6,580,572
Outflows and inflows related to pension have been deferred in the Statement of Net Position 184,468,897
Outflows and inflows related to other post employment benefit amounts havebeen deferred in the Statement of Net Position (50,602,912)
Internal service funds are used by management to charge the costs of insurance to individual funds. The assets and liabilities of the internal service funds are included in Governmental Activities in the Statement of Net Position. 8,240,149
Internal balances due to non-governmental activities related to items listed above (1,864,160)
Net Position of Governmental Activities ($128,339,295)
RECONCILIATION OF THE BALANCE SHEET OF GOVERNMENTAL FUNDSTO THE STATEMENT OF NET POSITION
June 30, 2021
LEXINGTON-FAYETTE URBAN COUNTY GOVERNMENT
The accompanying notes are an integral part of the financial statements.
36
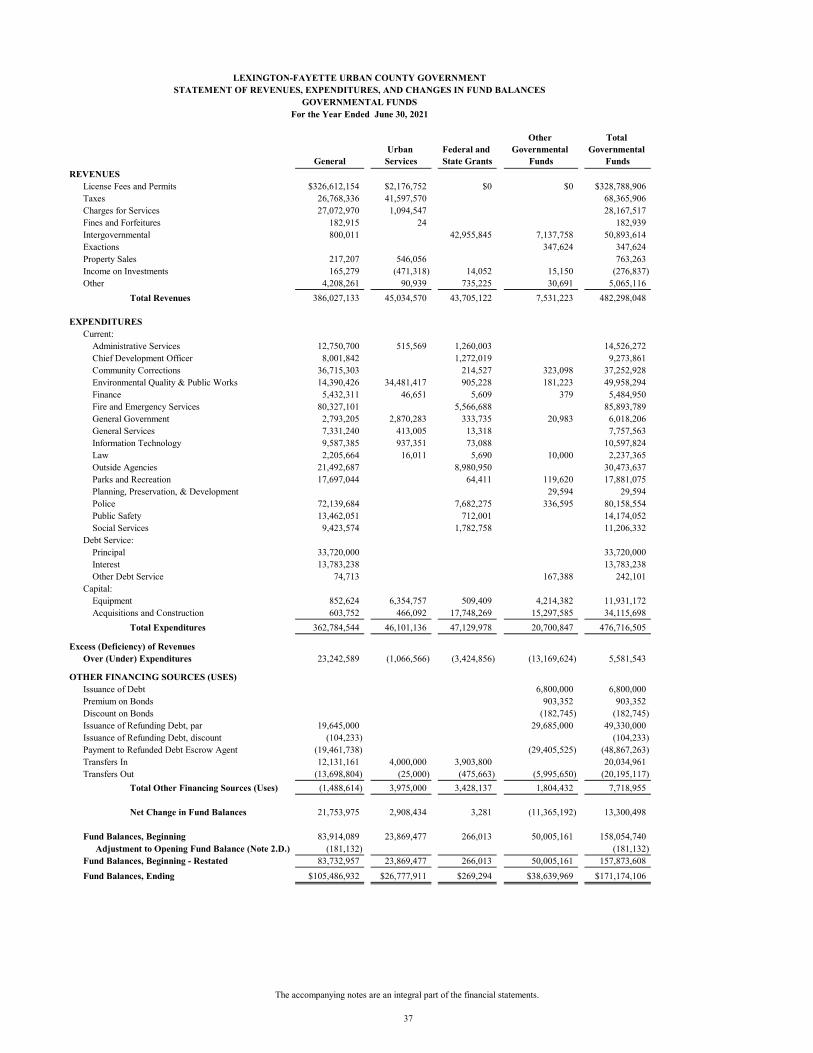
GeneralUrban
ServicesFederal and State Grants
Other Governmental
Funds
Total Governmental
FundsREVENUES
License Fees and Permits $326,612,154 $2,176,752 $0 $0 $328,788,906Taxes 26,768,336 41,597,570 68,365,906Charges for Services 27,072,970 1,094,547 28,167,517Fines and Forfeitures 182,915 24 182,939Intergovernmental 800,011 42,955,845 7,137,758 50,893,614Exactions 347,624 347,624Property Sales 217,207 546,056 763,263Income on Investments 165,279 (471,318) 14,052 15,150 (276,837)Other 4,208,261 90,939 735,225 30,691 5,065,116
Total Revenues 386,027,133 45,034,570 43,705,122 7,531,223 482,298,048
EXPENDITURESCurrent:
Administrative Services 12,750,700 515,569 1,260,003 14,526,272Chief Development Officer 8,001,842 1,272,019 9,273,861Community Corrections 36,715,303 214,527 323,098 37,252,928Environmental Quality & Public Works 14,390,426 34,481,417 905,228 181,223 49,958,294Finance 5,432,311 46,651 5,609 379 5,484,950Fire and Emergency Services 80,327,101 5,566,688 85,893,789General Government 2,793,205 2,870,283 333,735 20,983 6,018,206General Services 7,331,240 413,005 13,318 7,757,563Information Technology 9,587,385 937,351 73,088 10,597,824Law 2,205,664 16,011 5,690 10,000 2,237,365Outside Agencies 21,492,687 8,980,950 30,473,637Parks and Recreation 17,697,044 64,411 119,620 17,881,075Planning, Preservation, & Development 29,594 29,594Police 72,139,684 7,682,275 336,595 80,158,554Public Safety 13,462,051 712,001 14,174,052Social Services 9,423,574 1,782,758 11,206,332
Debt Service:Principal 33,720,000 33,720,000Interest 13,783,238 13,783,238Other Debt Service 74,713 167,388 242,101
Capital:Equipment 852,624 6,354,757 509,409 4,214,382 11,931,172Acquisitions and Construction 603,752 466,092 17,748,269 15,297,585 34,115,698
Total Expenditures 362,784,544 46,101,136 47,129,978 20,700,847 476,716,505
Excess (Deficiency) of RevenuesOver (Under) Expenditures 23,242,589 (1,066,566) (3,424,856) (13,169,624) 5,581,543
OTHER FINANCING SOURCES (USES)Issuance of Debt 6,800,000 6,800,000Premium on Bonds 903,352 903,352Discount on Bonds (182,745) (182,745)Issuance of Refunding Debt, par 19,645,000 29,685,000 49,330,000Issuance of Refunding Debt, discount (104,233) (104,233)Payment to Refunded Debt Escrow Agent (19,461,738) (29,405,525) (48,867,263)Transfers In 12,131,161 4,000,000 3,903,800 20,034,961Transfers Out (13,698,804) (25,000) (475,663) (5,995,650) (20,195,117)
Total Other Financing Sources (Uses) (1,488,614) 3,975,000 3,428,137 1,804,432 7,718,955
Net Change in Fund Balances 21,753,975 2,908,434 3,281 (11,365,192) 13,300,498
Fund Balances, Beginning 83,914,089 23,869,477 266,013 50,005,161 158,054,740Adjustment to Opening Fund Balance (Note 2.D.) (181,132) (181,132)
Fund Balances, Beginning - Restated 83,732,957 23,869,477 266,013 50,005,161 157,873,608Fund Balances, Ending $105,486,932 $26,777,911 $269,294 $38,639,969 $171,174,106
LEXINGTON-FAYETTE URBAN COUNTY GOVERNMENTSTATEMENT OF REVENUES, EXPENDITURES, AND CHANGES IN FUND BALANCES
GOVERNMENTAL FUNDSFor the Year Ended June 30, 2021
The accompanying notes are an integral part of the financial statements.
37
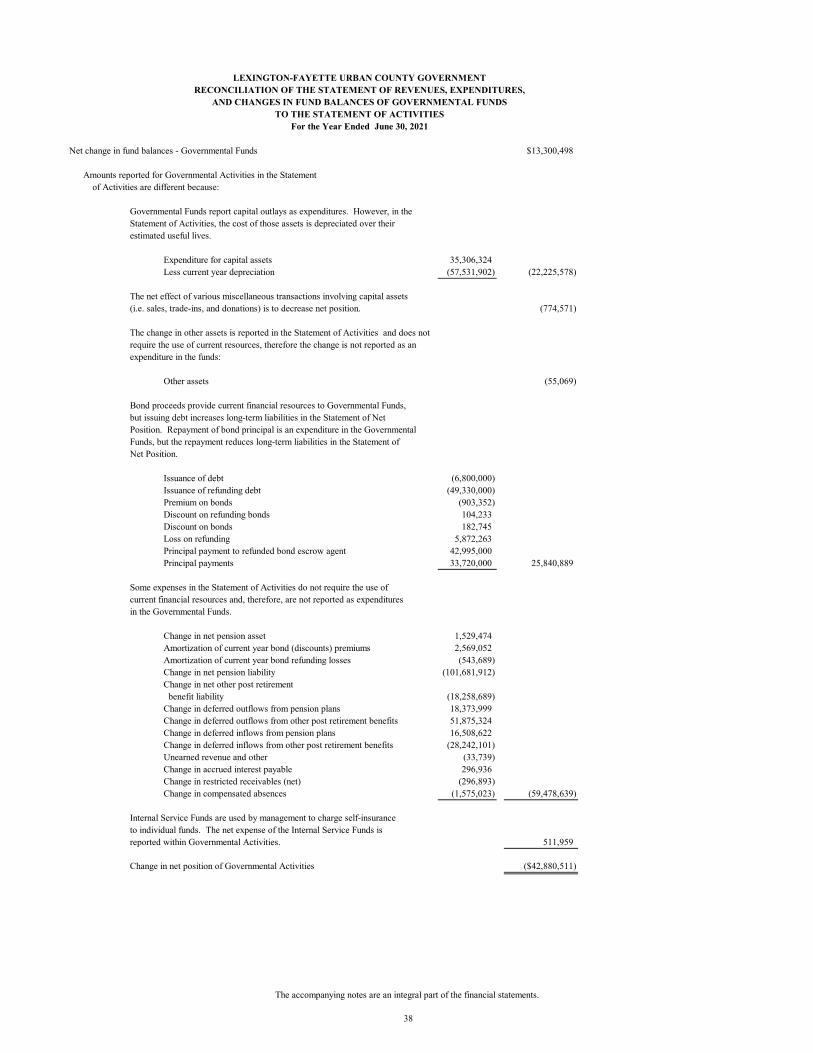
Net change in fund balances - Governmental Funds $13,300,498
Amounts reported for Governmental Activities in the Statementof Activities are different because:
Governmental Funds report capital outlays as expenditures. However, in the Statement of Activities, the cost of those assets is depreciated over their estimated useful lives.
Expenditure for capital assets 35,306,324Less current year depreciation (57,531,902) (22,225,578)
The net effect of various miscellaneous transactions involving capital assets(i.e. sales, trade-ins, and donations) is to decrease net position. (774,571)
The change in other assets is reported in the Statement of Activities and does not require the use of current resources, therefore the change is not reported as anexpenditure in the funds:
Other assets (55,069)
Bond proceeds provide current financial resources to Governmental Funds, but issuing debt increases long-term liabilities in the Statement of Net Position. Repayment of bond principal is an expenditure in the Governmental Funds, but the repayment reduces long-term liabilities in the Statement ofNet Position.
Issuance of debt (6,800,000)Issuance of refunding debt (49,330,000)Premium on bonds (903,352)Discount on refunding bonds 104,233Discount on bonds 182,745Loss on refunding 5,872,263Principal payment to refunded bond escrow agent 42,995,000Principal payments 33,720,000 25,840,889
Some expenses in the Statement of Activities do not require the use ofcurrent financial resources and, therefore, are not reported as expenditures in the Governmental Funds.
Change in net pension asset 1,529,474Amortization of current year bond (discounts) premiums 2,569,052Amortization of current year bond refunding losses (543,689)Change in net pension liability (101,681,912)Change in net other post retirement benefit liability (18,258,689)Change in deferred outflows from pension plans 18,373,999Change in deferred outflows from other post retirement benefits 51,875,324Change in deferred inflows from pension plans 16,508,622Change in deferred inflows from other post retirement benefits (28,242,101)Unearned revenue and other (33,739)Change in accrued interest payable 296,936Change in restricted receivables (net) (296,893)Change in compensated absences (1,575,023) (59,478,639)
Internal Service Funds are used by management to charge self-insurance to individual funds. The net expense of the Internal Service Funds is reported within Governmental Activities. 511,959
Change in net position of Governmental Activities ($42,880,511)
AND CHANGES IN FUND BALANCES OF GOVERNMENTAL FUNDSTO THE STATEMENT OF ACTIVITIES
For the Year Ended June 30, 2021
LEXINGTON-FAYETTE URBAN COUNTY GOVERNMENTRECONCILIATION OF THE STATEMENT OF REVENUES, EXPENDITURES,
The accompanying notes are an integral part of the financial statements.
38
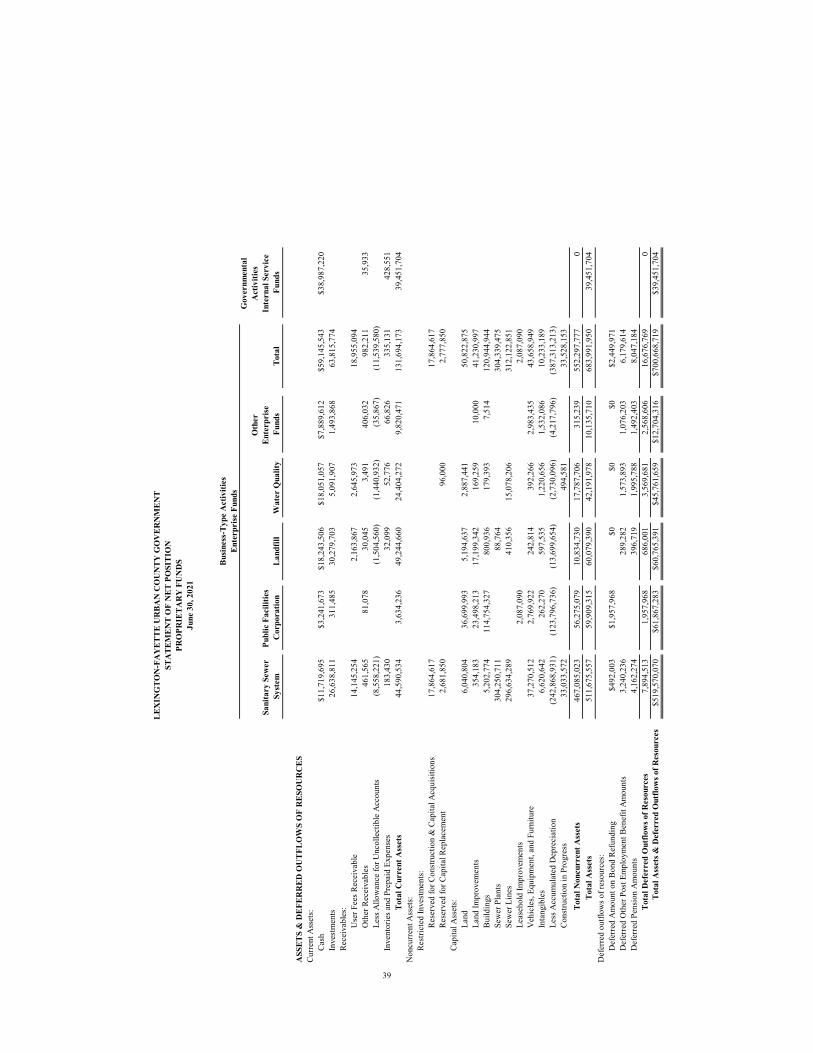
Sani
tary
Sew
er
Syst
emPu
blic
Fac
ilitie
s C
orpo
ratio
nLa
ndfil
lW
ater
Qua
lity
Oth
er
Ente
rpri
se
Fund
sTo
tal
Gov
ernm
enta
l A
ctiv
ities
In
tern
al S
ervi
ce
Fund
s
ASS
ETS
& D
EFER
RED
OU
TFLO
WS
OF
RES
OU
RC
ESCu
rren
t Ass
ets:
Cash
$11,
719,
695
$3,2
41,6
73$1
8,24
3,50
6$1
8,05
1,05
7$7
,889
,612
$59,
145,
543
$38,
987,
220
Inve
stm
ents
26,6
38,8
1131
1,48
530
,279
,703
5,09
1,90
71,
493,
868
63,8
15,7
74Re
ceiv
able
s:U
ser F
ees R
ecei
vabl
e14
,145
,254
2,
163,
867
2,64
5,97
3
18
,955
,094
Oth
er R
ecei
vabl
es46
1,56
581
,078
30,0
453,
491
406,
032
982,
211
35,9
33Le
ss A
llow
ance
for U
ncol
lect
ible
Acc
ount
s(8
,558
,221
)
(1,5
04,5
60)
(1,4
40,9
32)
(35,
867)
(11,
539,
580)
Inve
ntor
ies a
nd P
repa
id E
xpen
ses
183,
430
32,0
9952
,776
66,8
2633
5,13
142
8,55
1To
tal C
urre
nt A
sset
s44
,590
,534
3,63
4,23
649
,244
,660
24,4
04,2
729,
820,
471
131,
694,
173
39,4
51,7
04N
oncu
rren
t Ass
ets:
Rest
ricte
d In
vest
men
ts:
Rese
rved
for C
onst
ruct
ion
& C
apita
l Acq
uisi
tions
17,8
64,6
1717
,864
,617
Rese
rved
for C
apita
l Rep
lace
men
t2,
681,
850
96,0
002,
777,
850
Capi
tal A
sset
s:La
nd6,
040,
804
36,6
99,9
935,
194,
637
2,88
7,44
1
50
,822
,875
Land
Impr
ovem
ents
354,
183
23,4
98,2
1317
,199
,342
169,
259
10,0
0041
,230
,997
Bui
ldin
gs5,
202,
774
114,
754,
327
800,
936
179,
393
7,51
412
0,94
4,94
4Se
wer
Pla
nts
304,
250,
711
88
,764
304,
339,
475
Sew
er L
ines
296,
634,
289
41
0,35
615
,078
,206
312,
122,
851
Leas
ehol
d Im
prov
emen
ts2,
087,
090
2,08
7,09
0V
ehic
les,
Equi
pmen
t, an
d Fu
rnitu
re37
,270
,512
2,76
9,92
224
2,81
439
2,26
62,
983,
435
43,6
58,9
49In
tang
ible
s6,
620,
642
262,
270
597,
535
1,22
0,65
61,
532,
086
10,2
33,1
89Le
ss A
ccum
ulat
ed D
epre
ciat
ion
(242
,868
,931
)(1
23,7
96,7
36)
(13,
699,
654)
(2,7
30,0
96)
(4,2
17,7
96)
(387
,313
,213
)Co
nstru
ctio
n in
Pro
gres
s33
,033
,572
49
4,58
1
33
,528
,153
Tota
l Non
curr
ent A
sset
s46
7,08
5,02
356
,275
,079
10,8
34,7
3017
,787
,706
315,
239
552,
297,
777
0To
tal A
sset
s51
1,67
5,55
759
,909
,315
60,0
79,3
9042
,191
,978
10,1
35,7
1068
3,99
1,95
039
,451
,704
Def
erre
d ou
tflow
s of r
esou
rces
:D
efer
red
Am
ount
on
Bon
d Re
fund
ing
$492
,003
$1,9
57,9
68$0
$0$0
$2,4
49,9
71D
efer
red
Oth
er P
ost E
mpl
oym
ent B
enef
it A
mou
nts
3,24
0,23
6
289,
282
1,57
3,89
31,
076,
203
6,17
9,61
4D
efer
red
Pens
ion
Am
ount
s4,
162,
274
39
6,71
91,
995,
788
1,49
2,40
38,
047,
184
Tota
l Def
erre
d O
utflo
ws o
f Res
ourc
es7,
894,
513
1,95
7,96
868
6,00
13,
569,
681
2,56
8,60
616
,676
,769
0To
tal A
sset
s & D
efer
red
Out
flow
s of R
esou
rces
$519
,570
,070
$61,
867,
283
$60,
765,
391
$45,
761,
659
$12,
704,
316
$700
,668
,719
$39,
451,
704
LEX
ING
TON
-FA
YET
TE U
RBA
N C
OU
NTY
GO
VER
NM
ENT
STA
TEM
ENT
OF
NET
PO
SITI
ON
PRO
PRIE
TAR
Y F
UN
DS
June
30,
202
1
Busin
ess-
Type
Act
iviti
esEn
terp
rise
Fun
ds
39
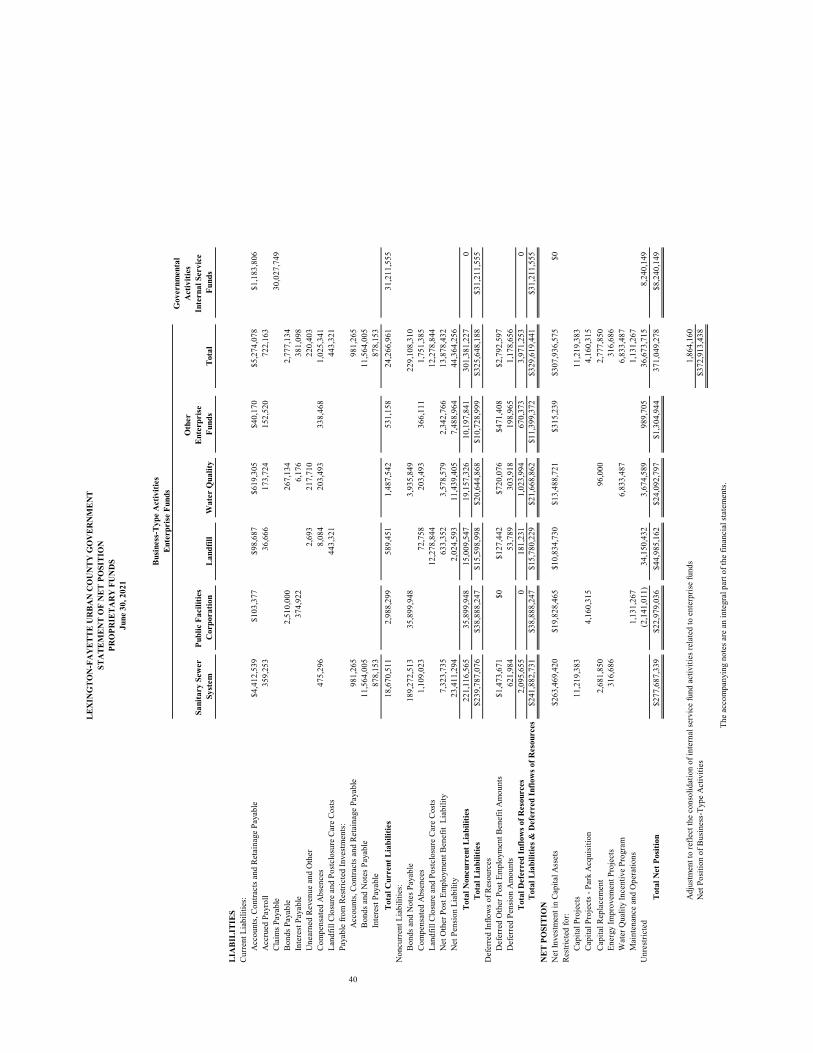
Sani
tary
Sew
er
Syst
emPu
blic
Fac
ilitie
s C
orpo
ratio
nLa
ndfil
lW
ater
Qua
lity
Oth
er
Ente
rpri
se
Fund
sTo
tal
Gov
ernm
enta
l A
ctiv
ities
In
tern
al S
ervi
ce
Fund
s
LEX
ING
TON
-FA
YET
TE U
RBA
N C
OU
NTY
GO
VER
NM
ENT
STA
TEM
ENT
OF
NET
PO
SITI
ON
PRO
PRIE
TAR
Y F
UN
DS
June
30,
202
1
Busin
ess-
Type
Act
iviti
esEn
terp
rise
Fun
ds
LIA
BILI
TIES
Curr
ent L
iabi
litie
s:A
ccou
nts,
Cont
ract
s and
Ret
aina
ge P
ayab
le$4
,412
,539
$103
,377
$98,
687
$619
,305
$40,
170
$5,2
74,0
78$1
,183
,806
Acc
rued
Pay
roll
359,
253
36,6
6617
3,72
415
2,52
072
2,16
3Cl
aim
s Pay
able
30,0
27,7
49B
onds
Pay
able
2,51
0,00
026
7,13
4
2,
777,
134
Inte
rest
Pay
able
374,
922
6,17
6
38
1,09
8U
near
ned
Reve
nue
and
Oth
er2,
693
217,
710
220,
403
Com
pens
ated
Abs
ence
s47
5,29
68,
084
203,
493
338,
468
1,02
5,34
1La
ndfil
l Clo
sure
and
Pos
tclo
sure
Car
e Co
sts
443,
321
443,
321
Paya
ble
from
Res
trict
ed In
vest
men
ts:
Acc
ount
s, Co
ntra
cts a
nd R
etai
nage
Pay
able
981,
265
981,
265
Bon
ds a
nd N
otes
Pay
able
11,5
64,0
0511
,564
,005
Inte
rest
Pay
able
878,
153
878,
153
Tota
l Cur
rent
Lia
bilit
ies
18,6
70,5
112,
988,
299
589,
451
1,48
7,54
253
1,15
824
,266
,961
31,2
11,5
55N
oncu
rren
t Lia
bilit
ies:
Bon
ds a
nd N
otes
Pay
able
189,
272,
513
35,8
99,9
483,
935,
849
229,
108,
310
Com
pens
ated
Abs
ence
s1,
109,
023
72,7
5820
3,49
336
6,11
11,
751,
385
Land
fill C
losu
re a
nd P
ostc
losu
re C
are
Cost
s12
,278
,844
12,2
78,8
44N
et O
ther
Pos
t Em
ploy
men
t Ben
efit
Lia
bilit
y7,
323,
735
633,
352
3,57
8,57
92,
342,
766
13,8
78,4
32N
et P
ensi
on L
iabi
lity
23,4
11,2
942,
024,
593
11,4
39,4
057,
488,
964
44,3
64,2
56To
tal N
oncu
rren
t Lia
bilit
ies
221,
116,
565
35,8
99,9
4815
,009
,547
19,1
57,3
2610
,197
,841
301,
381,
227
0To
tal L
iabi
litie
s$2
39,7
87,0
76$3
8,88
8,24
7$1
5,59
8,99
8$2
0,64
4,86
8$1
0,72
8,99
9$3
25,6
48,1
88$3
1,21
1,55
5D
efer
red
Inflo
ws o
f Res
ourc
esD
efer
red
Oth
er P
ost E
mpl
oym
ent B
enef
it A
mou
nts
$1,4
73,6
71$0
$127
,442
$720
,076
$471
,408
$2,7
92,5
97D
efer
red
Pens
ion
Am
ount
s62
1,98
453
,789
303,
918
198,
965
1,17
8,65
6To
tal D
efer
red
Inflo
ws o
f Res
ourc
es2,
095,
655
018
1,23
11,
023,
994
670,
373
3,97
1,25
30
Tota
l Lia
bilit
ies &
Def
erre
d In
flow
s of R
esou
rces
$241
,882
,731
$38,
888,
247
$15,
780,
229
$21,
668,
862
$11,
399,
372
$329
,619
,441
$31,
211,
555
NET
PO
SITI
ON
Net
Inve
stm
ent i
n Ca
pita
l Ass
ets
$263
,469
,420
$19,
828,
465
$10,
834,
730
$13,
488,
721
$315
,239
$307
,936
,575
$0Re
stric
ted
for:
Capi
tal P
roje
cts
11,2
19,3
8311
,219
,383
Capi
tal P
roje
cts -
Par
k A
cqui
sitio
n4,
160,
315
4,16
0,31
5Ca
pita
l Rep
lace
men
t2,
681,
850
96,0
002,
777,
850
Ener
gy Im
prov
emen
t Pro
ject
s31
6,68
631
6,68
6W
ater
Qua
lity
Ince
ntiv
e Pr
ogra
m6,
833,
487
6,83
3,48
7M
aint
enan
ce a
nd O
pera
tions
1,13
1,26
71,
131,
267
Unr
estri
cted
(2
,141
,011
)34
,150
,432
3,67
4,58
998
9,70
536
,673
,715
8,24
0,14
9
Tota
l Net
Pos
ition
$277
,687
,339
$22,
979,
036
$44,
985,
162
$24,
092,
797
$1,3
04,9
4437
1,04
9,27
8$8
,240
,149
Adj
ustm
ent t
o re
flect
the
cons
olid
atio
n of
inte
rnal
serv
ice
fund
act
iviti
es re
late
d to
ent
erpr
ise
fund
s1,
864,
160
Net
Pos
ition
of B
usin
ess-
Type
Act
iviti
es$3
72,9
13,4
38
40
The
acco
mpa
nyin
g no
tes a
re a
n in
tegr
al p
art o
f the
fina
ncia
l sta
tem
ents
.
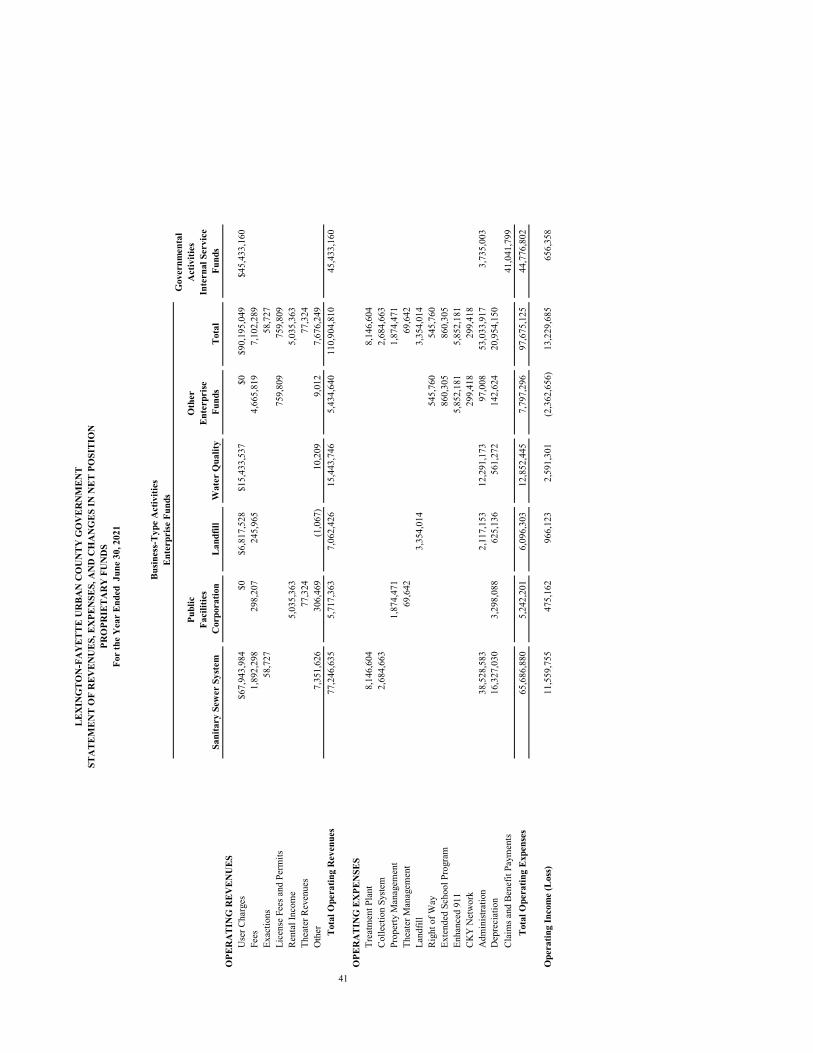
Sani
tary
Sew
er S
yste
m
Publ
ic
Faci
litie
s C
orpo
ratio
nLa
ndfil
lW
ater
Qua
lity
Oth
er
Ente
rpri
se
Fund
sTo
tal
Gov
ernm
enta
l A
ctiv
ities
In
tern
al S
ervi
ce
Fund
sO
PER
ATI
NG
REV
ENU
ESU
ser C
harg
es$6
7,94
3,98
4$0
$6,8
17,5
28$1
5,43
3,53
7$0
$90,
195,
049
$45,
433,
160
Fees
1,89
2,29
829
8,20
724
5,96
5
4,
665,
819
7,10
2,28
9Ex
actio
ns58
,727
58,7
27Li
cens
e Fe
es a
nd P
erm
its75
9,80
975
9,80
9Re
ntal
Inco
me
5,03
5,36
3
5,
035,
363
Thea
ter R
even
ues
77,3
2477
,324
Oth
er7,
351,
626
306,
469
(1,0
67)
10,2
099,
012
7,67
6,24
9To
tal O
pera
ting
Rev
enue
s77
,246
,635
5,71
7,36
37,
062,
426
15,4
43,7
465,
434,
640
110,
904,
810
45,4
33,1
60
OPE
RA
TIN
G E
XPE
NSE
STr
eatm
ent P
lant
8,14
6,60
48,
146,
604
Colle
ctio
n Sy
stem
2,68
4,66
32,
684,
663
Prop
erty
Man
agem
ent
1,87
4,47
11,
874,
471
Thea
ter M
anag
emen
t69
,642
69,6
42La
ndfil
l 3,
354,
014
3,35
4,01
4Ri
ght o
f Way
545,
760
545,
760
Exte
nded
Sch
ool P
rogr
am86
0,30
586
0,30
5En
hanc
ed 9
115,
852,
181
5,85
2,18
1CK
Y N
etw
ork
299,
418
299,
418
Adm
inist
ratio
n38
,528
,583
2,11
7,15
312
,291
,173
97,0
0853
,033
,917
3,73
5,00
3D
epre
ciat
ion
16,3
27,0
303,
298,
088
625,
136
561,
272
142,
624
20,9
54,1
50Cl
aim
s and
Ben
efit
Paym
ents
41,0
41,7
99To
tal O
pera
ting
Expe
nses
65,6
86,8
805,
242,
201
6,09
6,30
312
,852
,445
7,79
7,29
697
,675
,125
44,7
76,8
02
Ope
ratin
g In
com
e (L
oss)
11,5
59,7
5547
5,16
296
6,12
32,
591,
301
(2,3
62,6
56)
13,2
29,6
8565
6,35
8
41
LEX
ING
TON
-FA
YET
TE U
RBA
N C
OU
NTY
GO
VER
NM
ENT
STA
TEM
ENT
OF
REV
ENU
ES, E
XPE
NSE
S, A
ND
CH
AN
GES
IN N
ET P
OSI
TIO
NPR
OPR
IETA
RY
FU
ND
SFo
r th
e Y
ear
Ende
d J
une
30, 2
021
Busin
ess-
Type
Act
iviti
esEn
terp
rise
Fun
ds
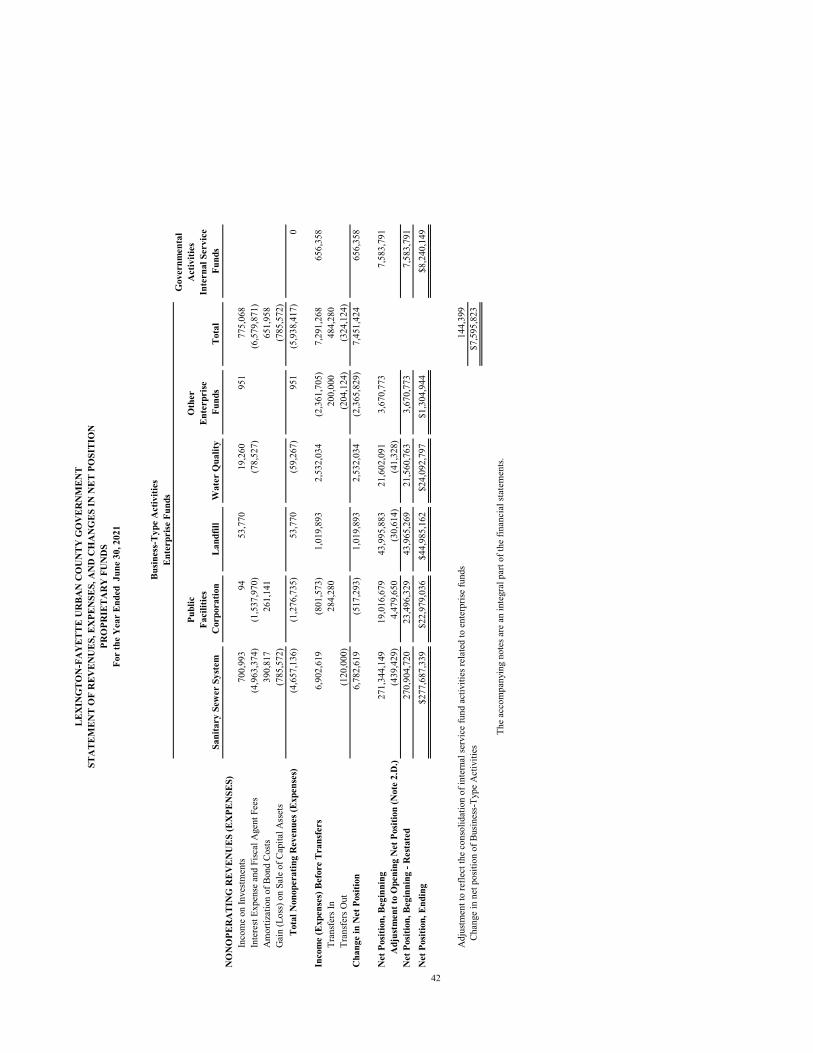
Sani
tary
Sew
er S
yste
m
Publ
ic
Faci
litie
s C
orpo
ratio
nLa
ndfil
lW
ater
Qua
lity
Oth
er
Ente
rpri
se
Fund
sTo
tal
Gov
ernm
enta
l A
ctiv
ities
In
tern
al S
ervi
ce
Fund
s
LEX
ING
TON
-FA
YET
TE U
RBA
N C
OU
NTY
GO
VER
NM
ENT
STA
TEM
ENT
OF
REV
ENU
ES, E
XPE
NSE
S, A
ND
CH
AN
GES
IN N
ET P
OSI
TIO
NPR
OPR
IETA
RY
FU
ND
SFo
r th
e Y
ear
Ende
d J
une
30, 2
021
Busin
ess-
Type
Act
iviti
esEn
terp
rise
Fun
ds
NO
NO
PER
ATI
NG
REV
ENU
ES (E
XPE
NSE
S)In
com
e on
Inve
stmen
ts70
0,99
394
53,7
7019
,260
951
775,
068
In
tere
st Ex
pens
e an
d Fi
scal
Age
nt F
ees
(4,9
63,3
74)
(1,5
37,9
70)
(78,
527)
(6,5
79,8
71)
Am
ortiz
atio
n of
Bon
d Co
sts39
0,81
726
1,14
165
1,95
8G
ain
(Los
s) o
n Sa
le o
f Cap
ital A
sset
s(7
85,5
72)
(785
,572
)To
tal N
onop
erat
ing
Rev
enue
s (Ex
pens
es)
(4,6
57,1
36)
(1,2
76,7
35)
53,7
70(5
9,26
7)95
1(5
,938
,417
)0
Inco
me
(Exp
ense
s) B
efor
e Tr
ansf
ers
6,90
2,61
9(8
01,5
73)
1,01
9,89
32,
532,
034
(2,3
61,7
05)
7,29
1,26
865
6,35
8Tr
ansf
ers I
n
28
4,28
0
20
0,00
048
4,28
0Tr
ansf
ers O
ut(1
20,0
00)
(204
,124
)(3
24,1
24)
Cha
nge
in N
et P
ositi
on6,
782,
619
(517
,293
)1,
019,
893
2,53
2,03
4(2
,365
,829
)7,
451,
424
656,
358
Net
Pos
ition
, Beg
inni
ng27
1,34
4,14
919
,016
,679
43,9
95,8
8321
,602
,091
3,67
0,77
37,
583,
791
Adj
ustm
ent t
o O
peni
ng N
et P
ositi
on (N
ote
2.D
.)(4
39,4
29)
4,47
9,65
0(3
0,61
4)(4
1,32
8)
N
et P
ositi
on, B
egin
ning
- R
esta
ted
270,
904,
720
23,4
96,3
2943
,965
,269
21,5
60,7
633,
670,
773
7,58
3,79
1N
et P
ositi
on, E
ndin
g$2
77,6
87,3
39$2
2,97
9,03
6$4
4,98
5,16
2$2
4,09
2,79
7$1
,304
,944
$8,2
40,1
49
Adj
ustm
ent t
o re
flect
the
cons
olid
atio
n of
inte
rnal
serv
ice
fund
act
iviti
es re
late
d to
ent
erpr
ise fu
nds
144,
399
Ch
ange
in n
et p
ositi
on o
f Bus
ines
s-Ty
pe A
ctiv
ities
$7
,595
,823
The
acco
mpa
nyin
g no
tes a
re a
n in
tegr
al p
art o
f the
fina
ncia
l sta
tem
ents.
42
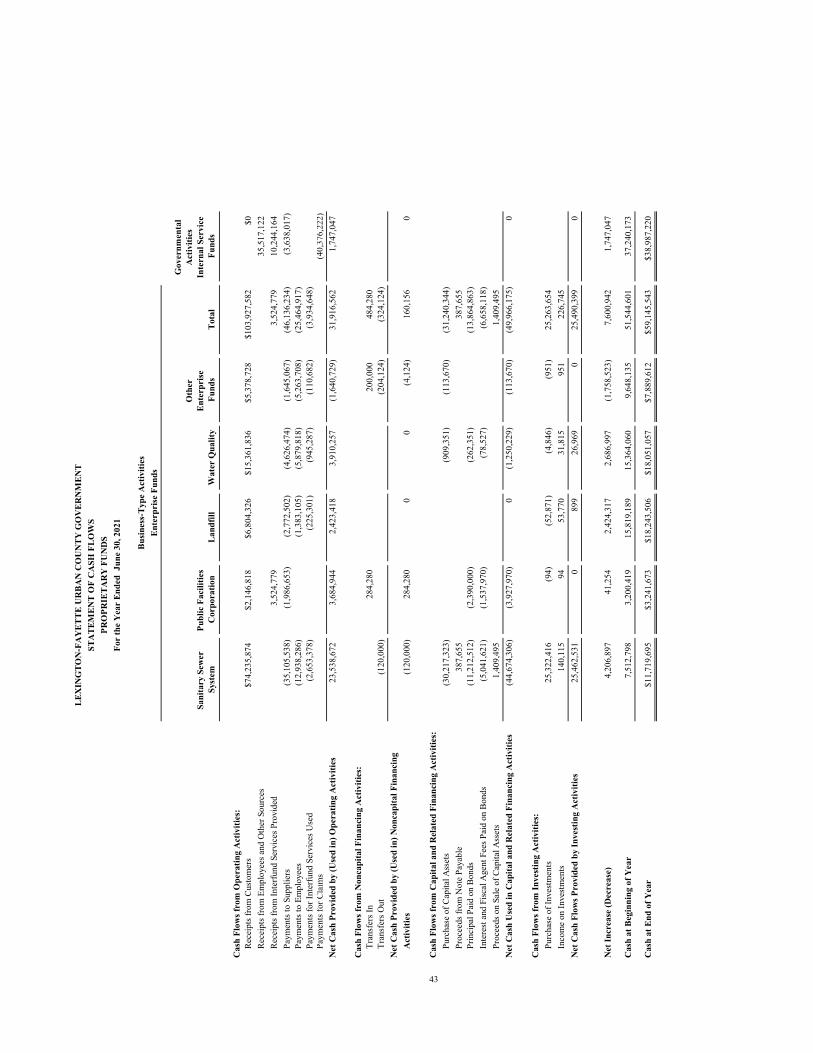
Cas
h Fl
ows f
rom
Ope
ratin
g A
ctiv
ities
:Re
ceip
ts fr
om C
usto
mer
s$7
4,23
5,87
4$2
,146
,818
$6,8
04,3
26$1
5,36
1,83
6$5
,378
,728
$103
,927
,582
$0Re
ceip
ts fr
om E
mpl
oyee
s and
Oth
er S
ourc
es35
,517
,122
Rece
ipts
from
Inte
rfund
Ser
vice
s Pro
vide
d3,
524,
779
3,52
4,77
910
,244
,164
Paym
ents
to S
uppl
iers
(35,
105,
538)
(1,9
86,6
53)
(2,7
72,5
02)
(4,6
26,4
74)
(1,6
45,0
67)
(46,
136,
234)
(3,6
38,0
17)
Paym
ents
to E
mpl
oyee
s(1
2,93
8,28
6)(1
,383
,105
)(5
,879
,818
)(5
,263
,708
)(2
5,46
4,91
7)Pa
ymen
ts fo
r Int
erfu
nd S
ervi
ces U
sed
(2,6
53,3
78)
(225
,301
)(9
45,2
87)
(110
,682
)(3
,934
,648
)Pa
ymen
ts fo
r Cla
ims
(40,
376,
222)
Net
Cas
h Pr
ovid
ed b
y (U
sed
in) O
pera
ting
Act
iviti
es23
,538
,672
3,68
4,94
42,
423,
418
3,91
0,25
7(1
,640
,729
)31
,916
,562
1,74
7,04
7
Cas
h Fl
ows f
rom
Non
capi
tal F
inan
cing
Act
iviti
es:
Tran
sfer
s In
28
4,28
0
20
0,00
048
4,28
0Tr
ansf
ers O
ut(1
20,0
00)
(204
,124
)(3
24,1
24)
Net
Cas
h Pr
ovid
ed b
y (U
sed
in) N
onca
pita
l Fin
anci
ng
Act
iviti
es(1
20,0
00)
284,
280
00
(4,1
24)
160,
156
0
Cas
h Fl
ows f
rom
Cap
ital a
nd R
elat
ed F
inan
cing
Act
iviti
es:
Purc
hase
of C
apita
l Ass
ets
(30,
217,
323)
(909
,351
)(1
13,6
70)
(31,
240,
344)
Proc
eeds
from
Not
e Pa
yabl
e38
7,65
5
38
7,65
5Pr
inci
pal P
aid
on B
onds
(11,
212,
512)
(2,3
90,0
00)
(262
,351
)
(13,
864,
863)
Inte
rest
and
Fisc
al A
gent
Fee
s Pai
d on
Bon
ds(5
,041
,621
)(1
,537
,970
)(7
8,52
7)
(6,6
58,1
18)
Proc
eeds
on
Sale
of C
apita
l Ass
ets
1,40
9,49
5
1,40
9,49
5N
et C
ash
Use
d in
Cap
ital a
nd R
elat
ed F
inan
cing
Act
iviti
es(4
4,67
4,30
6)(3
,927
,970
)0
(1,2
50,2
29)
(113
,670
)(4
9,96
6,17
5)0
Cas
h Fl
ows f
rom
Inve
stin
g A
ctiv
ities
:Pu
rcha
se o
f Inv
estm
ents
25,3
22,4
16(9
4)(5
2,87
1)(4
,846
)(9
51)
25,2
63,6
54In
com
e on
Inve
stm
ents
140,
115
9453
,770
31,8
1595
122
6,74
5
Net
Cas
h Fl
ows P
rovi
ded
by In
vest
ing
Act
iviti
es25
,462
,531
089
926
,969
025
,490
,399
0
Net
Incr
ease
(Dec
reas
e)4,
206,
897
41,2
542,
424,
317
2,68
6,99
7(1
,758
,523
)7,
600,
942
1,74
7,04
7
Cas
h at
Beg
inni
ng o
f Yea
r7,
512,
798
3,20
0,41
915
,819
,189
15,3
64,0
609,
648,
135
51,5
44,6
0137
,240
,173
Cas
h at
End
of Y
ear
$11,
719,
695
$3,2
41,6
73$1
8,24
3,50
6$1
8,05
1,05
7$7
,889
,612
$59,
145,
543
$38,
987,
220
Ente
rpri
se F
unds
LEX
ING
TON
-FA
YET
TE U
RBA
N C
OU
NTY
GO
VER
NM
ENT
STA
TEM
ENT
OF
CA
SH F
LOW
SPR
OPR
IETA
RY
FU
ND
SFo
r th
e Y
ear
Ende
d J
une
30, 2
021
Busin
ess-
Type
Act
iviti
es
Gov
ernm
enta
l A
ctiv
ities
In
tern
al S
ervi
ce
Fund
s
43
Sani
tary
Sew
er
Syst
emPu
blic
Fac
ilitie
s C
orpo
ratio
nLa
ndfil
lW
ater
Qua
lity
Oth
er
Ente
rpri
se
Fund
sTo
tal
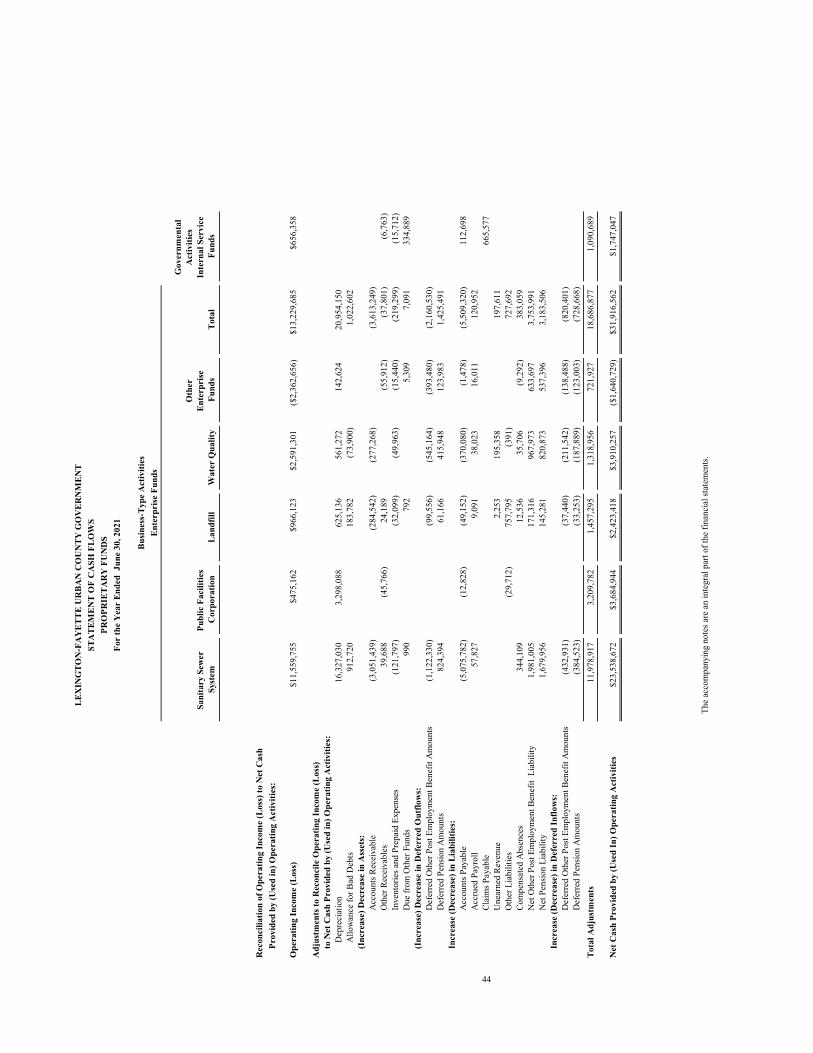
Ente
rpri
se F
unds
LEX
ING
TON
-FA
YET
TE U
RBA
N C
OU
NTY
GO
VER
NM
ENT
STA
TEM
ENT
OF
CA
SH F
LOW
SPR
OPR
IETA
RY
FU
ND
SFo
r th
e Y
ear
Ende
d J
une
30, 2
021
Busin
ess-
Type
Act
iviti
es
Gov
ernm
enta
l A
ctiv
ities
In
tern
al S
ervi
ce
Fund
sSa
nita
ry S
ewer
Sy
stem
Publ
ic F
acili
ties
Cor
pora
tion
Land
fill
Wat
er Q
ualit
y
Oth
er
Ente
rpri
se
Fund
sTo
tal
Rec
onci
liatio
n of
Ope
ratin
g In
com
e (L
oss)
to N
et C
ash
Prov
ided
by
(Use
d in
) Ope
ratin
g A
ctiv
ities
:
Ope
ratin
g In
com
e (L
oss)
$11,
559,
755
$475
,162
$966
,123
$2,5
91,3
01($
2,36
2,65
6)$1
3,22
9,68
5$6
56,3
58
Ad j
ustm
ents
to R
econ
cile
Ope
ratin
g In
com
e (L
oss)
to N
et C
ash
Prov
ided
by
(Use
d in
) Ope
ratin
g A
ctiv
ities
:D
epre
ciat
ion
16,3
27,0
303,
298,
088
625,
136
561,
272
142,
624
20,9
54,1
50A
llow
ance
for B
ad D
ebts
912,
720
183,
782
(73,
900)
1,02
2,60
2(I
ncre
ase)
Dec
reas
e in
Ass
ets:
Acc
ount
s Rec
eiva
ble
(3,0
51,4
39)
(284
,542
)(2
77,2
68)
(3,6
13,2
49)
Oth
er R
ecei
vabl
es39
,688
(45,
766)
24,1
89
(5
5,91
2)(3
7,80
1)(6
,763
)In
vent
orie
s and
Pre
paid
Exp
ense
s(1
21,7
97)
(32,
099)
(49,
963)
(15,
440)
(219
,299
)(1
5,71
2)D
ue fr
om O
ther
Fun
ds99
0
792
5,30
97,
091
334,
889
(Inc
reas
e) D
ecre
ase
in D
efer
red
Out
flow
s:D
efer
red
Oth
er P
ost E
mpl
oym
ent B
enef
it A
mou
nts
(1,1
22,3
30)
(99,
556)
(545
,164
)(3
93,4
80)
(2,1
60,5
30)
Def
erre
d Pe
nsio
n A
mou
nts
824,
394
61,1
6641
5,94
812
3,98
31,
425,
491
Incr
ease
(Dec
reas
e) in
Lia
bilit
ies:
Acc
ount
s Pay
able
(5,0
75,7
82)
(12,
828)
(49,
152)
(370
,080
)(1
,478
)(5
,509
,320
)11
2,69
8A
ccru
ed P
ayro
ll57
,827
9,09
138
,023
16,0
1112
0,95
2Cl
aim
s Pay
able
665,
577
Une
arne
d Re
venu
e
2,
253
195,
358
197,
611
Oth
er L
iabi
litie
s
(29,
712)
757,
795
(391
)
72
7,69
2Co
mpe
nsat
ed A
bsen
ces
344,
109
12,5
3635
,706
(9,2
92)
383,
059
Net
Oth
er P
ost E
mpl
oym
ent B
enef
it L
iabi
lity
1,98
1,00
517
1,31
696
7,97
363
3,69
73,
753,
991
Net
Pen
sion
Liab
ility
1,67
9,95
614
5,28
182
0,87
353
7,39
63,
183,
506
Incr
ease
(Dec
reas
e) in
Def
erre
d In
flow
s:D
efer
red
Oth
er P
ost E
mpl
oym
ent B
enef
it A
mou
nts
(432
,931
)(3
7,44
0)(2
11,5
42)
(138
,488
)(8
20,4
01)
Def
erre
d Pe
nsio
n A
mou
nts
(384
,523
)(3
3,25
3)(1
87,8
89)
(123
,003
)(7
28,6
68)
Tota
l Adj
ustm
ents
11,9
78,9
173,
209,
782
1,45
7,29
51,
318,
956
721,
927
18,6
86,8
771,
090,
689
Net
Cas
h Pr
ovid
ed b
y (U
sed
In) O
pera
ting
Act
iviti
es$2
3,53
8,67
2$3
,684
,944
$2,4
23,4
18$3
,910
,257
($1,
640,
729)
$31,
916,
562
$1,7
47,0
47
44
The
acco
mpa
nyin
g no
tes a
re a
n in
tegr
al p
art o
f the
fina
ncia
l sta
tem
ents
.
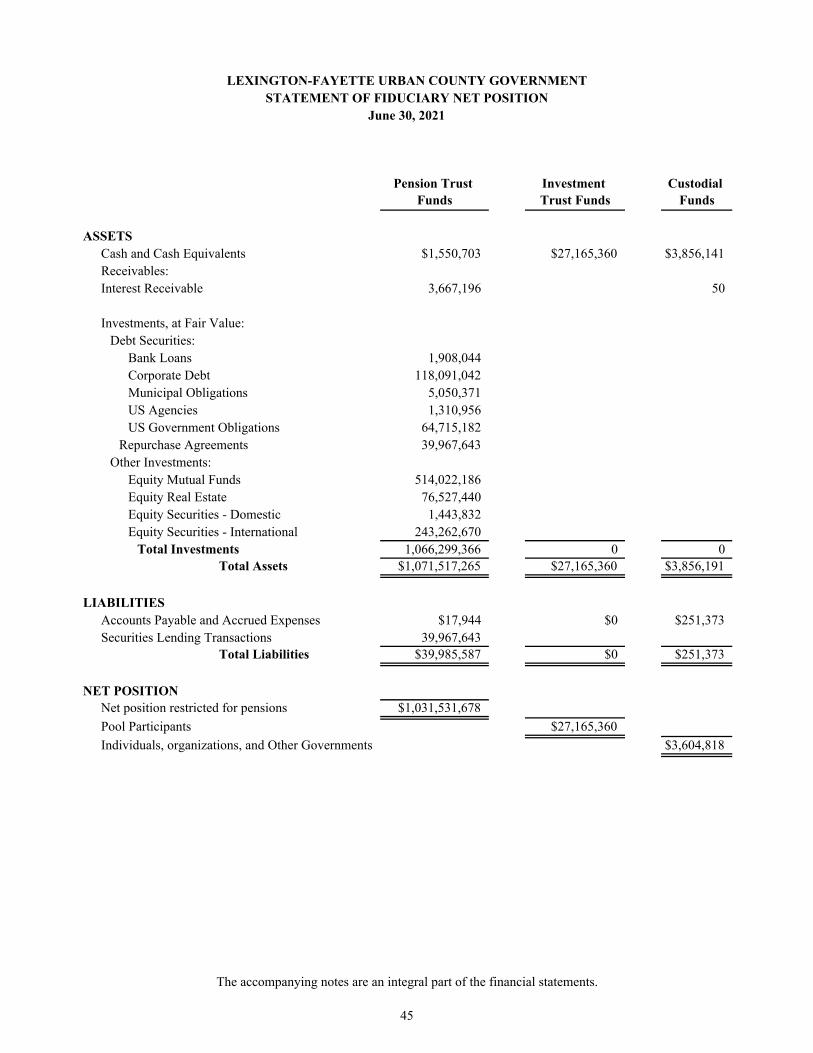
Pension Trust Funds
Investment Trust Funds
Custodial Funds
ASSETSCash and Cash Equivalents $1,550,703 $27,165,360 $3,856,141Receivables:Interest Receivable 3,667,196 50
Investments, at Fair Value: Debt Securities:
Bank Loans 1,908,044 Corporate Debt 118,091,042 Municipal Obligations 5,050,371 US Agencies 1,310,956 US Government Obligations 64,715,182
Repurchase Agreements 39,967,643 Other Investments:
Equity Mutual Funds 514,022,186 Equity Real Estate 76,527,440 Equity Securities - Domestic 1,443,832 Equity Securities - International 243,262,670
Total Investments 1,066,299,366 0 0Total Assets $1,071,517,265 $27,165,360 $3,856,191
LIABILITIESAccounts Payable and Accrued Expenses $17,944 $0 $251,373Securities Lending Transactions 39,967,643
Total Liabilities $39,985,587 $0 $251,373
NET POSITIONNet position restricted for pensions $1,031,531,678Pool Participants $27,165,360Individuals, organizations, and Other Governments $3,604,818
LEXINGTON-FAYETTE URBAN COUNTY GOVERNMENTSTATEMENT OF FIDUCIARY NET POSITION
June 30, 2021
The accompanying notes are an integral part of the financial statements.
45
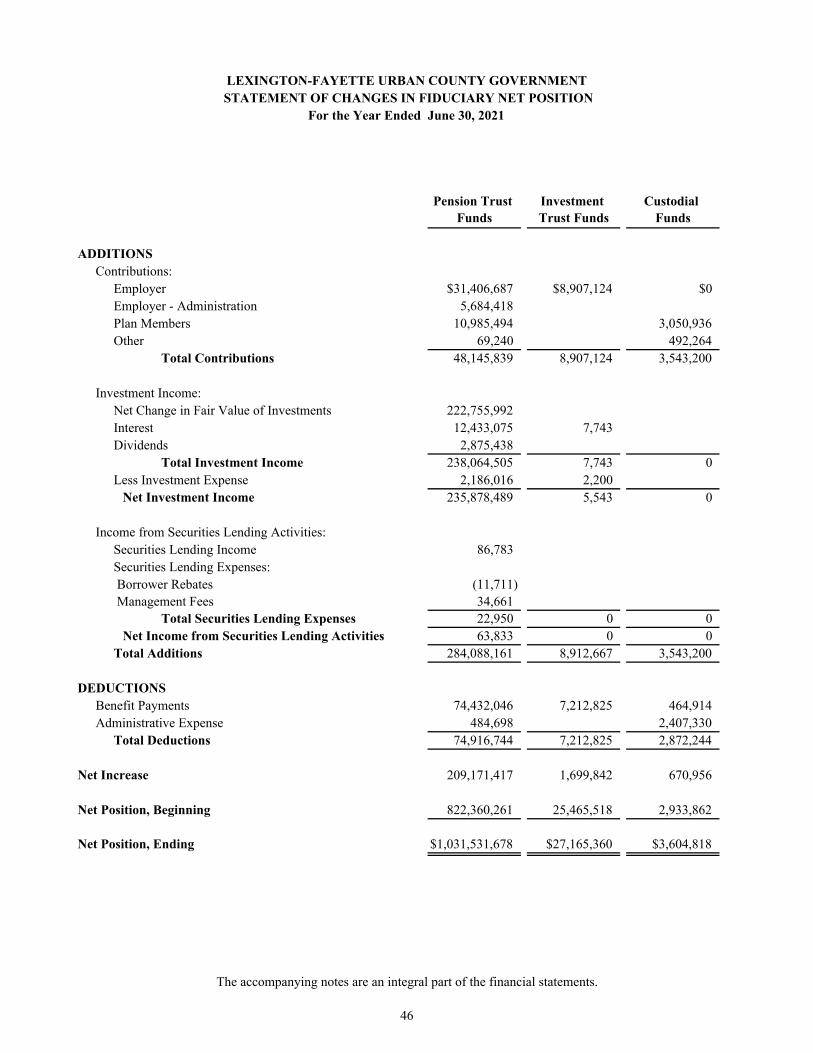
Pension Trust Funds
Investment Trust Funds
Custodial Funds
ADDITIONSContributions:
Employer $31,406,687 $8,907,124 $0Employer - Administration 5,684,418 Plan Members 10,985,494 3,050,936Other 69,240 492,264
Total Contributions 48,145,839 8,907,124 3,543,200
Investment Income:Net Change in Fair Value of Investments 222,755,992 Interest 12,433,075 7,743 Dividends 2,875,438
Total Investment Income 238,064,505 7,743 0Less Investment Expense 2,186,016 2,200
Net Investment Income 235,878,489 5,543 0
Income from Securities Lending Activities:Securities Lending Income 86,783 Securities Lending Expenses: Borrower Rebates (11,711) Management Fees 34,661
Total Securities Lending Expenses 22,950 0 0Net Income from Securities Lending Activities 63,833 0 0
Total Additions 284,088,161 8,912,667 3,543,200
DEDUCTIONSBenefit Payments 74,432,046 7,212,825 464,914Administrative Expense 484,698 2,407,330
Total Deductions 74,916,744 7,212,825 2,872,244
Net Increase 209,171,417 1,699,842 670,956
Net Position, Beginning 822,360,261 25,465,518 2,933,862
Net Position, Ending $1,031,531,678 $27,165,360 $3,604,818
LEXINGTON-FAYETTE URBAN COUNTY GOVERNMENT STATEMENT OF CHANGES IN FIDUCIARY NET POSITION
For the Year Ended June 30, 2021
The accompanying notes are an integral part of the financial statements.
46
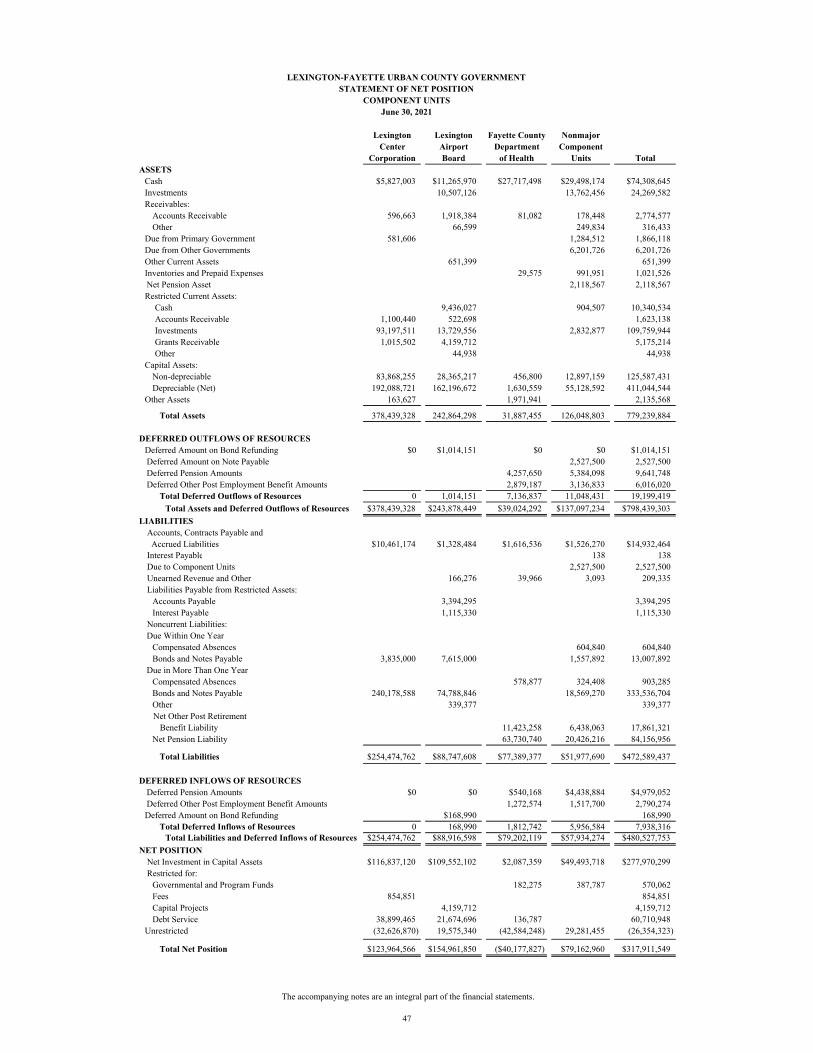
Lexington Lexington Fayette County NonmajorCenter Airport Department Component
Corporation Board of Health Units TotalASSETS
Cash $5,827,003 $11,265,970 $27,717,498 $29,498,174 $74,308,645Investments 10,507,126 13,762,456 24,269,582Receivables:
Accounts Receivable 596,663 1,918,384 81,082 178,448 2,774,577Other 66,599 249,834 316,433
Due from Primary Government 581,606 1,284,512 1,866,118Due from Other Governments 6,201,726 6,201,726Other Current Assets 651,399 651,399Inventories and Prepaid Expenses 29,575 991,951 1,021,526Net Pension Asset 2,118,567 2,118,567Restricted Current Assets:
Cash 9,436,027 904,507 10,340,534 Accounts Receivable 1,100,440 522,698 1,623,138 Investments 93,197,511 13,729,556 2,832,877 109,759,944 Grants Receivable 1,015,502 4,159,712 5,175,214 Other 44,938 44,938
Capital Assets:Non-depreciable 83,868,255 28,365,217 456,800 12,897,159 125,587,431Depreciable (Net) 192,088,721 162,196,672 1,630,559 55,128,592 411,044,544
Other Assets 163,627 1,971,941 2,135,568
Total Assets 378,439,328 242,864,298 31,887,455 126,048,803 779,239,884
DEFERRED OUTFLOWS OF RESOURCESDeferred Amount on Bond Refunding $0 $1,014,151 $0 $0 $1,014,151Deferred Amount on Note Payable 2,527,500 2,527,500Deferred Pension Amounts 4,257,650 5,384,098 9,641,748Deferred Other Post Employment Benefit Amounts 2,879,187 3,136,833 6,016,020
Total Deferred Outflows of Resources 0 1,014,151 7,136,837 11,048,431 19,199,419Total Assets and Deferred Outflows of Resources $378,439,328 $243,878,449 $39,024,292 $137,097,234 $798,439,303
LIABILITIES Accounts, Contracts Payable and Accrued Liabilities $10,461,174 $1,328,484 $1,616,536 $1,526,270 $14,932,464 Interest Payable 138 138 Due to Component Units 2,527,500 2,527,500 Unearned Revenue and Other 166,276 39,966 3,093 209,335 Liabilities Payable from Restricted Assets:
Accounts Payable 3,394,295 3,394,295Interest Payable 1,115,330 1,115,330
Noncurrent Liabilities:Due Within One Year
Compensated Absences 604,840 604,840Bonds and Notes Payable 3,835,000 7,615,000 1,557,892 13,007,892
Due in More Than One YearCompensated Absences 578,877 324,408 903,285Bonds and Notes Payable 240,178,588 74,788,846 18,569,270 333,536,704Other 339,377 339,377
Net Other Post Retirement Benefit Liability 11,423,258 6,438,063 17,861,321
Net Pension Liability 63,730,740 20,426,216 84,156,956
Total Liabilities $254,474,762 $88,747,608 $77,389,377 $51,977,690 $472,589,437
DEFERRED INFLOWS OF RESOURCESDeferred Pension Amounts $0 $0 $540,168 $4,438,884 $4,979,052Deferred Other Post Employment Benefit Amounts 1,272,574 1,517,700 2,790,274Deferred Amount on Bond Refunding $168,990 168,990
Total Deferred Inflows of Resources 0 168,990 1,812,742 5,956,584 7,938,316Total Liabilities and Deferred Inflows of Resources $254,474,762 $88,916,598 $79,202,119 $57,934,274 $480,527,753
NET POSITION Net Investment in Capital Assets $116,837,120 $109,552,102 $2,087,359 $49,493,718 $277,970,299 Restricted for:
Governmental and Program Funds 182,275 387,787 570,062Fees 854,851 854,851Capital Projects 4,159,712 4,159,712Debt Service 38,899,465 21,674,696 136,787 60,710,948
Unrestricted (32,626,870) 19,575,340 (42,584,248) 29,281,455 (26,354,323)
Total Net Position $123,964,566 $154,961,850 ($40,177,827) $79,162,960 $317,911,549
LEXINGTON-FAYETTE URBAN COUNTY GOVERNMENTSTATEMENT OF NET POSITION
COMPONENT UNITSJune 30, 2021
The accompanying notes are an integral part of the financial statements.
47
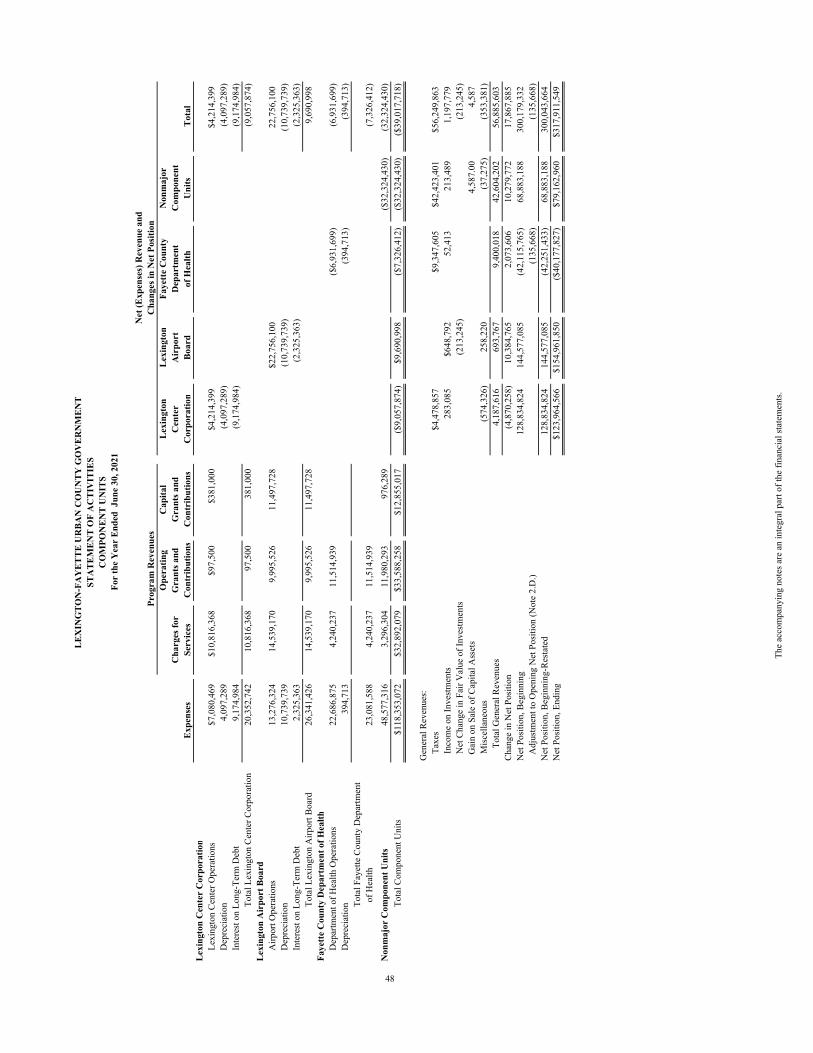
Ope
ratin
gC
apita
lLe
ton
Lexi
ngto
nFa
yette
Cou
nty
Non
maj
orC
harg
es fo
rG
rant
s and
Gra
nts a
ndC
ente
rA
irpo
rtD
epar
tmen
tC
ompo
nent
Expe
nses
Serv
ices
Con
trib
utio
nsC
ontr
ibut
ions
Cor
pora
tion
Boar
dof
Hea
lthU
nits
Tota
lLe
ton
Cen
ter
Cor
pora
tion
Lexi
ngto
n Ce
nter
Ope
ratio
ns$7
,080
,469
$10,
816,
368
$97,
500
$381
,000
$4,2
14,3
99$4
,214
,399
Dep
reci
atio
n4,
097,
289
(4,0
97,2
89)
(4,0
97,2
89)
Inte
rest
on L
ong-
Term
Deb
t9,
174,
984
(9,1
74,9
84)
(9,1
74,9
84)
Tota
l Lex
ingt
on C
ente
r Cor
pora
tion
20,3
52,7
4210
,816
,368
97,5
0038
1,00
0(9
,057
,874
)Le
ton
Air
port
Boa
r dA
irpor
t Ope
ratio
ns13
,276
,324
14,5
39,1
709,
995,
526
11,4
97,7
28$2
2,75
6,10
022
,756
,100
Dep
reci
atio
n10
,739
,739
(10,
739,
739)
(10,
739,
739)
Inte
rest
on L
ong-
Term
Deb
t2,
325,
363
(2,3
25,3
63)
(2,3
25,3
63)
Tota
l Lex
ingt
on A
irpor
t Boa
rd26
,341
,426
14,5
39,1
709,
995,
526
11,4
97,7
289,
690,
998
Faye
tte C
ount
y D
epar
tmen
t of H
ealt h
Dep
artm
ent o
f Hea
lth O
pera
tions
22,6
86,8
754,
240,
237
11,5
14,9
39($
6,93
1,69
9)(6
,931
,699
)D
epre
ciat
ion
394,
713
(394
,713
)(3
94,7
13)
Tota
l Fay
ette
Cou
nty
Dep
artm
ent
of H
ealth
23,0
81,5
884,
240,
237
11,5
14,9
39
(7,3
26,4
12)
Non
maj
or C
ompo
nent
Uni
ts48
,577
,316
3,29
6,30
411
,980
,293
976,
289
($32
,324
,430
)(3
2,32
4,43
0)To
tal C
ompo
nent
Uni
ts$1
18,3
53,0
72$3
2,89
2,07
9$3
3,58
8,25
8$1
2,85
5,01
7($
9,05
7,87
4)$9
,690
,998
($7,
326,
412)
($32
,324
,430
)($
39,0
17,7
18)
Gen
eral
Rev
enue
s:
Taxe
s$4
,478
,857
$9,3
47,6
05$4
2,42
3,40
1$5
6,24
9,86
3
Inco
me
on In
vestm
ents
283,
085
$648
,792
52,4
1321
3,48
91,
197,
779
N
et C
hang
e in
Fai
r Val
ue o
f Inv
estm
ents
(213
,245
)(2
13,2
45)
Gai
n on
Sal
e of
Cap
ital A
sset
s4,
587.
00
4,
587
M
iscel
lane
ous
(574
,326
)25
8,22
0(3
7,27
5)(3
53,3
81)
Tota
l Gen
eral
Rev
enue
s 4,
187,
616
693,
767
9,40
0,01
842
,604
,202
56,8
85,6
03Ch
ange
in N
et P
ositi
on(4
,870
,258
)10
,384
,765
2,07
3,60
610
,279
,772
17,8
67,8
85N
et P
ositi
on, B
egin
ning
128,
834,
824
144,
577,
085
(42,
115,
765)
68,8
83,1
8830
0,17
9,33
2A
djus
tmen
t to
Ope
ning
Net
Pos
ition
(Not
e 2.
D.)
(135
,668
)
(1
35,6
68)
Net
Pos
ition
, Beg
inni
ng-R
esta
ted
128,
834,
824
144,
577,
085
(42,
251,
433)
68,8
83,1
8830
0,04
3,66
4N
et P
ositi
on, E
ndin
g$1
23,9
64,5
66$1
54,9
61,8
50($
40,1
77,8
27)
$79,
162,
960
$317
,911
,549
48
LEX
ING
TON
-FA
YET
TE U
RBA
N C
OU
NTY
GO
VER
NM
ENT
STA
TEM
ENT
OF
AC
TIV
ITIE
SC
OM
PON
ENT
UN
ITS
For
the
Yea
r En
ded
Jun
e 30
, 202
1
Net
(Exp
ense
s) R
even
ue a
ndPr
ogra
m R
even
ues
Cha
nges
in N
et P
ositi
on
The
acco
mpa
nyin
g no
tes a
re a
n in
tegr
al p
art o
f the
fina
ncia
l sta
tem
ents.
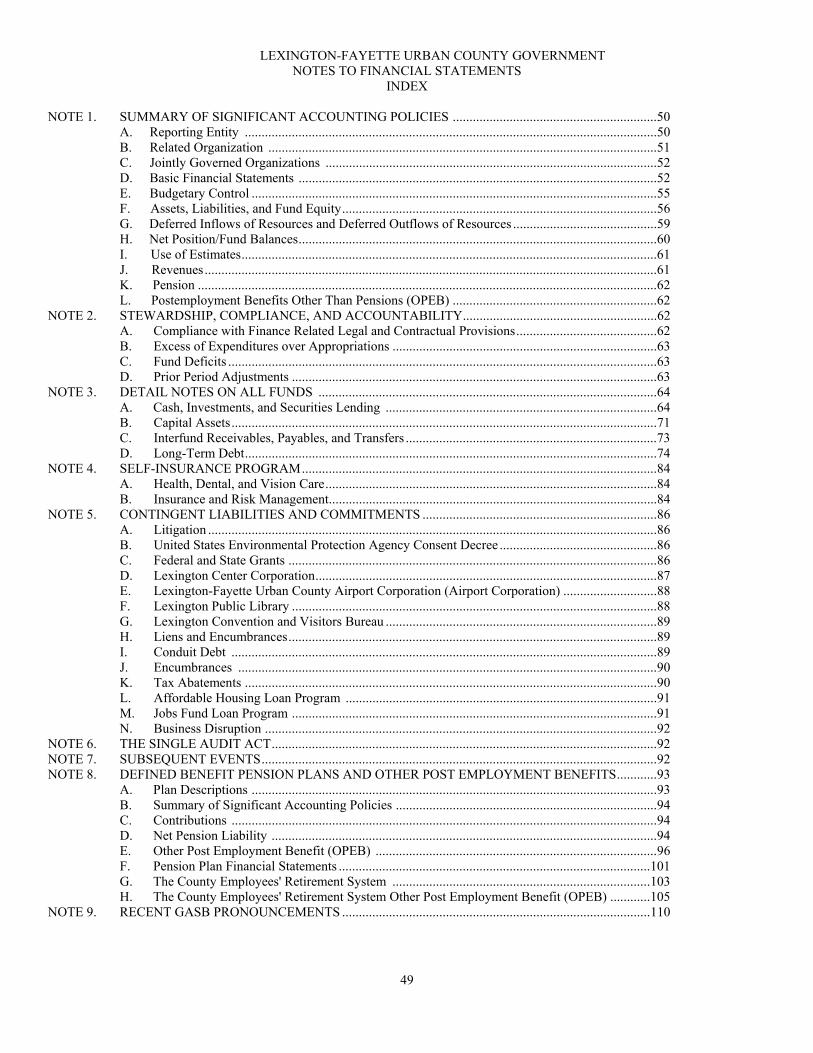
49
LEXINGTON-FAYETTE URBAN COUNTY GOVERNMENT NOTES TO FINANCIAL STATEMENTS
INDEX NOTE 1. SUMMARY OF SIGNIFICANT ACCOUNTING POLICIES ............................................................. 50 A. Reporting Entity ........................................................................................................................... 50 B. Related Organization .................................................................................................................... 51 C. Jointly Governed Organizations ................................................................................................... 52 D. Basic Financial Statements ........................................................................................................... 52 E. Budgetary Control ......................................................................................................................... 55
F. Assets, Liabilities, and Fund Equity .............................................................................................. 56 G. Deferred Inflows of Resources and Deferred Outflows of Resources ........................................... 59 H. Net Position/Fund Balances ........................................................................................................... 60 I. Use of Estimates ............................................................................................................................ 61 J. Revenues ....................................................................................................................................... 61 K. Pension ......................................................................................................................................... 62 L. Postemployment Benefits Other Than Pensions (OPEB) ............................................................. 62
NOTE 2. STEWARDSHIP, COMPLIANCE, AND ACCOUNTABILITY .......................................................... 62 A. Compliance with Finance Related Legal and Contractual Provisions .......................................... 62 B. Excess of Expenditures over Appropriations ............................................................................... 63 C. Fund Deficits ................................................................................................................................ 63 D. Prior Period Adjustments ............................................................................................................. 63
NOTE 3. DETAIL NOTES ON ALL FUNDS ..................................................................................................... 64 A. Cash, Investments, and Securities Lending ................................................................................. 64
B. Capital Assets ............................................................................................................................... 71 C. Interfund Receivables, Payables, and Transfers ........................................................................... 73 D. Long-Term Debt ........................................................................................................................... 74
NOTE 4. SELF-INSURANCE PROGRAM .......................................................................................................... 84 A. Health, Dental, and Vision Care ................................................................................................... 84 B. Insurance and Risk Management .................................................................................................. 84
NOTE 5. CONTINGENT LIABILITIES AND COMMITMENTS ...................................................................... 86 A. Litigation ...................................................................................................................................... 86 B. United States Environmental Protection Agency Consent Decree ............................................... 86 C. Federal and State Grants .............................................................................................................. 86 D. Lexington Center Corporation ...................................................................................................... 87 E. Lexington-Fayette Urban County Airport Corporation (Airport Corporation) ............................ 88 F. Lexington Public Library ............................................................................................................. 88 G. Lexington Convention and Visitors Bureau ................................................................................. 89 H. Liens and Encumbrances .............................................................................................................. 89 I. Conduit Debt ............................................................................................................................... 89 J. Encumbrances ............................................................................................................................. 90 K. Tax Abatements ........................................................................................................................... 90 L. Affordable Housing Loan Program ............................................................................................. 91 M. Jobs Fund Loan Program ............................................................................................................. 91 N. Business Disruption ..................................................................................................................... 92
NOTE 6. THE SINGLE AUDIT ACT ................................................................................................................... 92 NOTE 7. SUBSEQUENT EVENTS ...................................................................................................................... 92 NOTE 8. DEFINED BENEFIT PENSION PLANS AND OTHER POST EMPLOYMENT BENEFITS ............ 93 A. Plan Descriptions ......................................................................................................................... 93 B. Summary of Significant Accounting Policies .............................................................................. 94
C. Contributions ............................................................................................................................... 94 D. Net Pension Liability ................................................................................................................... 94
E. Other Post Employment Benefit (OPEB) .................................................................................... 96 F. Pension Plan Financial Statements ............................................................................................. 101
G. The County Employees' Retirement System ............................................................................. 103 H. The County Employees' Retirement System Other Post Employment Benefit (OPEB) ............ 105
NOTE 9. RECENT GASB PRONOUNCEMENTS ............................................................................................ 110
LEXINGTON-FAYETTE URBAN COUNTY GOVERNMENT NOTES TO FINANCIAL STATEMENTS
June 30, 2021
50
NOTE 1. SUMMARY OF SIGNIFICANT ACCOUNTING POLICIES The financial statements of the Lexington-Fayette Urban County Government (the Government) have been prepared in accordance with accounting principles generally accepted in the United States (GAAP) as applied to governmental units. The Governmental Accounting Standards Board (GASB) is the standard-setting body for government accounting and financial reporting. The GASB periodically updates its codification of the existing Governmental Accounting and Financial Reporting Standards, which, along with subsequent GASB pronouncements (Statements and Interpretations), constitutes GAAP for governmental units. The more significant of these accounting policies are described below and, where appropriate, subsequent pronouncements will be referenced. A. Reporting Entity – The Government is a merged city-county government governed by an elected mayor and a fifteen-member council. The accompanying financial statements present the Government and its component units (traditionally separate reporting entities), for which the Government is considered to be financially accountable. The Government (the primary government) is financially accountable if it appoints a voting majority of the organization’s governing board and (1) is able to impose its will on the organization, or (2) there is a potential for the organization to provide specific financial benefit to, or impose specific financial burden on the Government. Additionally, the Government is required to consider other organizations for which the nature and significance of their relationship with the Government are such that exclusion would cause the Government’s financial statements to be misleading or incomplete. The financial statements are formatted to allow the user to clearly distinguish between the primary government and its component units. 1. Blended Component Units – The agencies and organizations listed below are, in substance, the same as the Government, despite being legally separate from the Government. Therefore, they are reported as part of the primary government. They have a governing body that is substantially the same as the governing body of the Government; provide services entirely, or almost entirely, to the Government; or otherwise exclusively, or almost exclusively, benefit the Government even though they do not provide services directly to the Government; and whose total debt outstanding is expected to be repaid entirely, or almost entirely, with resources of the Government.
The Public Library Corporation (PLC) is an instrumentality of the Government created solely for acquiring, constructing, equipping, and financing public projects to be used for public library purposes. The board consists of the Mayor, Vice Mayor, two members appointed by the Lexington Public Library, and one member appointed by the other four board members. The Policemen's and Firefighters' Retirement Fund and the City Employees’ Pension Fund are single employer, defined benefit pension plans that cover eligible Government personnel. Members of both boards are comprised of officials, employees and retirees of the Government. The Policemen's and Firefighters' Retirement Fund and the City Employees’ Pension Fund are Fiduciary Funds. The Public Facilities Corporation (PFC) was created to act as an agency and instrumentality of the Government in acquiring, developing and financing public improvements and public projects. The Mayor, Vice Mayor, and Commissioner of Finance serve ex officio on the board. The Public Parking Corporation (PPC) was created to act as an agency and instrumentality of the Government in the acquisition and financing of public parking projects. The Mayor, Vice Mayor, and Commissioner of Finance serve ex-officio on the board.
2. Discretely Presented Component Units – The agencies described below are included in the Government's reporting entity because the Government appoints the governing body or a financial benefit or burden relationship exists. Additionally, the agencies are fiscally dependent on the Government. All of these agencies are reported as discretely presented component units since the governing body is not substantively the same as the governing body of the Government, and they provide services to the citizens of Fayette County and the surrounding area as opposed to only the primary government. To emphasize that they are legally separate from the Government, they are reported in a separate column in the financial statements. Fund information for the component units, if applicable, may be found in their separately issued financial statements. Requests for separately issued financial statements should be directed to the attention of those respective entities.
LEXINGTON-FAYETTE URBAN COUNTY GOVERNMENT NOTES TO FINANCIAL STATEMENTS (Continued)
June 30, 2021
51
The Lexington Public Library’s (Library) primary mission is to maintain a free public library in Lexington-Fayette County. The Mayor appoints all seven members of the board with approval by the Urban County Council and they may be removed by the vote of the Urban County Council. The Government provides financial support in the form of annual appropriations based upon property tax collections. The Lexington-Fayette Urban County Department of Health (Board of Health) has the general statutory responsibility of promoting and protecting the health of Fayette County residents. This entity provides critical services to the citizens of Fayette County on behalf of the Government. The Board of Health is governed by a nine-member board that is appointed by the Mayor and approved by the Urban County Council. In addition, the Urban County Council approves their Ad Valorem tax rate annually. The Lexington Transit Authority (LexTran) was organized to provide unification and coordination of a mass transportation system for Fayette County. This entity provides critical services to the citizens of Fayette County on behalf of the Government. LexTran is governed by an eight-member board appointed by the Mayor and approved by the Urban County Council. In addition, the Urban County Council approves the annual budget for LexTran. The Lexington Convention and Visitors Bureau (Visitors Bureau) was established by the Government for the purpose of promoting recreational, convention and tourist activity in Fayette County. The Government may abolish the Visitors Bureau by repealing the ordinance that created it. All nine members of the Visitors Bureau board are appointed by the Mayor and approved by the Urban County Council. The Government has a statutory authority to provide funds for the operation of the Visitors Bureau by imposing a transient room tax not exceeding four percent (4%) of qualified occupancy rental. The Lexington Center Corporation (LCC) is a non-profit, non-stock corporate agency and instrumentality of the Government. The purpose of the LCC is to plan, finance, develop and operate a convention, trade show, performing arts venue and sports facility. The thirteen-member board is appointed by the Mayor and approved by the Urban County Council. The Government has statutory authority to impose a transient room tax, not exceeding two percent (4.50%) of qualified occupancy rental, to provide funds for payment of debt service. As discussed in Note 5.D., the Government entered into a Lease Agreement that provides for an annual rental to be paid by the Government if net revenues are not sufficient to pay all debt service costs. The Lexington-Fayette Urban County Airport Board (Airport Board) is responsible for the operation, maintenance, and planning of airport facilities designed to serve the general public of the Central Kentucky area. The ten board members are appointed by the Mayor and approved by the Urban County Council. The Government has entered into a Contract Lease and Option Agreement, discussed in Note 5.E., which requires an annual rental to be paid by the Government if net revenues are not sufficient to pay all debt service costs.
B. Related Organization – A related organization is an entity for which the Government is not financially accountable. It does not impose will or have a financial benefit or burden relationship, even if the Government appoints a voting majority of the related organization’s governing board.
The Lexington-Fayette Urban County Housing Authority (Housing Authority) was created in order to develop and operate decent, safe and sanitary housing for low income, elderly and disabled residents. The appointment of the governing board by the Mayor and the scope of public service are not considered an adequate demonstration of oversight and control. The Government has no responsibility for their budget, debt, financing deficits, or fiscal management. Additionally, the Government does not influence their operations in any respect. Therefore, the Housing Authority is not considered to be a component unit of the Government.
Explorium of Lexington was established to provide a unique educational opportunity for Fayette County and Central Kentucky children. The Government has no responsibility for their budget, debt, financing deficits, or
LEXINGTON-FAYETTE URBAN COUNTY GOVERNMENT NOTES TO FINANCIAL STATEMENTS (Continued)
June 30, 2021
52
fiscal management. Additionally, the Government does not influence their operations in any respect. Therefore, the Explorium is not considered to be a component unit of the Government. The Downtown Lexington Management District was established for the purpose of providing and financing economic improvements that specifically benefit property within the District. The Government has no responsibility for their budget, debt, financing deficits, or fiscal management. Additionally, the Government does not influence their operations in any respect. Therefore, the Downtown Lexington Management District is not considered to be a component unit of the Government. Parking Authority of Lexington (Parking Authority) was established to centralize all public parking functions into one entity, to improve parking operations, and ultimately to improve the availability of parking in downtown Lexington. The Government has no responsibility for their budget, debt, financing deficits, or fiscal management. Additionally, the Government does not influence their operations in any respect. Therefore, the Parking Authority is not considered to be a component unit of the Government. The Downtown Lexington Partnership (DLP) promotes physical and economic development that strengthens and maintains downtown Lexington as the cultural and economic heart of Central Kentucky as well as being dedicated to enhancing downtown Lexington as a unique and vibrant destination to live, work, and play. The Government has no responsibility for their budget, debt, financing deficits, or fiscal management. Additionally, the Government does not influence their operations in any respect. Therefore, the DLP is not considered to be a component unit of the Government.
C. Jointly Governed Organizations – The Government has some level of representation in the following organizations. Since the Government does not retain an ongoing financial interest or an ongoing financial responsibility for these organizations, these are not joint ventures and are not presented in the financial statements.
The Bluegrass Regional Recycling Center (BRRC) is a non-profit Kentucky corporation whose purpose is to reduce the volume of solid waste being placed in landfills and engage in activities that promote recycling. Pursuant to an Interlocal Agreement, the BRRC is operated by the Government and fourteen counties. The Government has no legal interest in or access to the resources of the BRRC. Neither does it have any legal responsibility for the deficits or debts of, or financial support to, the BRRC. The Valley View Ferry Authority is a legally separate entity that operates and maintains the Ferry on the Kentucky River at Valley View. The board consists of seven members, two appointed by the Government, three appointed by the Madison County Fiscal Court and two appointed by the Jessamine County Fiscal Court. The Government is not legally responsible for the Valley View Ferry Authority’s finances. The Government contributed $14,000 to support the Ferry’s operations in fiscal year 2021.
D. Basic Financial Statements Government-Wide and Fund Financial Statements The basic financial statements include both the government-wide and the fund financial statements. The reporting model focus is either on the Government as a whole or on major individual funds. The government-wide financial statements report information on all of the non-fiduciary activities of the Government and its component units. Both the government-wide and fund financial statements categorize primary activities as either governmental or business-type. Governmental Activities normally are supported by taxes and intergovernmental revenues. Business-Type Activities rely to a significant extent on fees and charges for support. In the Government-Wide Statement of Net Position, both the Governmental and Business-Type Activities are presented on a consolidated basis by column. The Government-Wide Statement of Activities demonstrates the degree to which the direct expenses of a function (Public Works, Police, Fire and Emergency Services, Parks and Recreation, etc.) are offset by program revenues.
LEXINGTON-FAYETTE URBAN COUNTY GOVERNMENT NOTES TO FINANCIAL STATEMENTS (Continued)
June 30, 2021
53
Direct expenses (including depreciation) are those that are clearly identifiable with a specific function. Program revenues are directly associated with the function and include charges for services, and grants and contributions that are restricted to meeting the operational or capital requirements of a particular function. Operating grants include operating-specific and discretionary (either operating or capital) grants while capital grants are capital-specific. Occupational license fees applied to gross wages and net profits, other license fees and permits, taxes, interest income, and other revenues not included in program revenues are reported as general revenues. Separate financial statements are provided for governmental funds, proprietary funds, and fiduciary funds, even though fiduciary funds are excluded from the government-wide financial statements. Major individual governmental and enterprise funds are reported as separate columns in the fund financial statements. Nonmajor funds (by category) are summarized into a single column. Measurement Focus, Basis of Accounting, and Financial Statement Presentation The government-wide, proprietary, and fiduciary fund financial statements are reported using the economic resources measurement focus and the accrual basis of accounting. With this measurement focus, all assets and all liabilities, including long-term assets as well as long-term debt and obligations, are included in the Statement of Net Position. Revenues are recorded when earned and expenses are recorded when a liability is incurred, regardless of the timing of related cash flows. Grants and similar items are recognized as revenue as soon as all eligibility requirements imposed by the provider have been met. Governmental fund financial statements are reported using the current financial resources measurement focus and the modified accrual basis of accounting. Revenues are recognized when they are both measurable and available. Revenues are considered to be available when they are collectible within the current period or soon enough thereafter to be used to pay liabilities of the current period. For this purpose, the Government considers revenues to be available if they are collected within 60 days of the end of the period. Revenues susceptible to accrual are intergovernmental revenues, investment earnings, emergency medical services fees (EMS), insurance revenues and license fees. Major revenue sources not susceptible to accrual include charges for services (other than EMS), fines and forfeitures and miscellaneous revenues. Such revenues are recorded as revenues when received because they are generally not measurable or available until actually received. Intergovernmental revenues received for specific purposes or projects are recognized when the applicable eligibility requirements are met. Revenues received before the eligibility requirements are met are reported as unearned revenue. Expenditures are recorded when the liability is incurred except: (1) principal and interest on long-term debt, pension liabilities, and claims and judgements are recorded when due, and (2) compensated absences are accounted for as expenditures in the period used. Since the governmental fund statements are presented on a different measurement focus and basis of accounting than the government-wide statements’ governmental column, a reconciliation is presented on the page following each statement which briefly explains the adjustments necessary to transform the fund based financial statements into the governmental column of the government-wide presentation. Internal service funds provide services primarily to other funds of the Government and are presented in summary form as part of the proprietary fund statements. Since the principal users of the internal services are the Government’s governmental activities, the internal service funds’ financial statements are consolidated into the governmental activities column in the government-wide financial statements. To the extent possible, the costs of these services are reflected in the appropriate functional activity. The internal service funds also provide services to the proprietary funds. Therefore, a portion of the net position of the internal service funds is allocated to Business-Type Activities and is reported as an adjustment on the Statement of Net Position of the proprietary funds. The Government’s fiduciary funds are presented in the fund financial statements by type (pension, investment, and custodial). Since these assets are being held for the benefit of a third party (private parties, investors, pension participants, etc.) and cannot be used for activities or obligations of the Government, these funds are not incorporated into the government-wide financial statements.
LEXINGTON-FAYETTE URBAN COUNTY GOVERNMENT NOTES TO FINANCIAL STATEMENTS (Continued)
June 30, 2021
54
The Government reports the following major governmental funds:
The General Fund is the primary operating unit of the Government and accounts for the revenues and expenditures not specifically provided for in other funds. Most of the essential governmental services such as police and fire protection, community services, and general administration are reported in this fund. The Urban Services Fund accounts for the taxes that are assessed on property within designated areas, or taxing districts, based on the type of services available to property owners. These services include solid waste collection, streetlights and street cleaning. Property taxes raised from the urban services taxing districts can only be used to finance these services. The Federal and State Grants Fund accounts for the receipts of intergovernmental funds that are restricted for operational and capital use of a particular function.
The Government reports the following major proprietary funds: The Sanitary Sewer System Fund accounts for the construction activities, operation and maintenance, and the payment of principal and interest for bond issues of the Government’s sanitary sewer system. The Public Facilities Corporation Fund accounts for the acquisition, construction, and operation of government-owned facilities. The Landfill Fund accounts for the operations, closure, and postclosure care costs of the Government’s landfill. The Water Quality Fund accounts for the revenues and expenses of developing and operating storm water related activities.
Additionally, the Government reports the following fund types:
Internal Service Funds account for the Government’s insurance programs for employee health, dental and vision care insurance benefits. Workers’ compensation, vehicle liability and physical damage, general liability, and property damage insurance coverage are also accounted for in Internal Service Funds. Fiduciary Funds are used to account for assets held on behalf of outside parties, including other governments, or on behalf of other funds within the Government. Trust funds account for assets held by the Government under the terms of a formal trust agreement. Custodial funds generally are used to account for assets that the Government holds on behalf of others as their agent, are custodial in nature (assets equal liabilities), and do not involve measurement of results of operations. Fiduciary funds are as follows:
Pension Trust Funds account for the revenues received, expenses incurred, and the net position available for retirement benefits of the Policemen's and Firefighters' Retirement Fund and the City Employees' Pension Fund.
Custodial Funds account for assets held by the Government for others in an agency capacity. These are funds collected from juvenile and adult offenders and disbursed to victims in accordance with court decrees, funds collected from and disbursed for inmates who are on work release, funds collected from prisoners and disbursed based on court order, funds collected from special assessments for payment of debt service for neighborhood capital projects, funds collected from noncustodial parents for child support and disbursed to the custodial parents, and funds managed by the Government on behalf of adults who are unable to manage their own money.
LEXINGTON-FAYETTE URBAN COUNTY GOVERNMENT NOTES TO FINANCIAL STATEMENTS (Continued)
June 30, 2021
55
Investment Trust Fund operates under the Sewer indenture established to provide that the net revenues from the sewer system operations are deposited into a Bond Account held by a Trustee, whereby the bondholders are beneficiaries. In fiscal year 2014 the Government defeased all outstanding debt and entered into a new Sewer indenture agreement. The new indenture provides that the gross income and revenues of the System first be used to pay operating and maintenance expenses of the System. The account must provide coverage of 120% of the maximum annual debt service.
As a general rule, the effect of interfund activity has been eliminated from the government-wide financial statements. Exceptions to this general rule are charges between the Government’s sewer, landfill, public facilities, parking, and various other functions of the Government. Elimination of these charges would distort the direct costs and program revenues reported for the various functions concerned.
Amounts reported as program revenues include (1) charges to customers or applicants for goods, services, or privileges provided, (2) operating grants and contributions, and (3) capital grants and contributions. Internally dedicated resources are reported as general revenues rather than as program revenues. Likewise, general revenues include occupational license fees on wages and net profits, taxes, and interest income.
Proprietary funds distinguish operating revenues and expenses from non-operating items. Operating revenues and expenses generally result from providing services and delivering goods in connection with a proprietary fund’s principal ongoing operations. The principal operating revenues of the Government’s enterprise and internal service funds are charges to customers for services. Operating expenses for enterprise and internal service funds include the cost of services, administrative expenses, and depreciation on capital assets. All revenues and expenses not meeting this definition are reported as non-operating revenues and expenses.
The Government administers the Expansion Area Master Plan as follows:
The Government established a program in 1996, called the Expansion Area Master Plan (EAMP), to ensure uniform development of the Urban Services Area in Fayette County. The EAMP allows for the collection of exaction fees on new construction. The Government requires that those who develop property bear the cost of improvements in approximate proportion to the need generated by the development. Ordinance 196-96 acknowledges that it is in the best interest of the Government to encourage developers to build the system improvements identified in the Infrastructure Element of the EAMP and to provide developers who “front end” public improvements with credits against fair share fees and repayment for costs incurred in excess of their fair share.
Generally credits are granted to developers via a resolution passed by the Urban County Council. The Chief Administrative Officer has the authority to grant credits outside the resolution process and has occasionally done so. Exaction fees are assessed according to the guidelines established in the EAMP. They are due and payable when a developer applies for a building permit. Fees may be satisfied either with a cash payment or the surrender of exaction credits.
E. Budgetary Control
Budget Policy – The Urban County Council annually approves the budget ordinance for all operating funds of the Government, which includes governmental, proprietary, fiduciary, and custodial funds. Federal and State Grant funds and capital projects funds adopt project-length budgets. Additional special revenue funds which are budgeted include the Industrial Revenue Bond Fund, Police Confiscated Funds, the Public Safety Fund, County Aid Fund, Municipal Aid Fund, and Mineral Severance Fund. Budgets are adopted on a basis consistent with GAAP except that budgetary basis expenditures include purchase orders and contracts (encumbrances). Budgetary control is maintained at the division level, e.g. Division of Police, Division of Parks and Recreation, etc. The Mayor may authorize transfers within a division; however, the Urban County Council must approve by ordinance any other amendments to the budget. All budgeted amounts presented in the financial statements reflect the original budget and the amended budget which have
LEXINGTON-FAYETTE URBAN COUNTY GOVERNMENT NOTES TO FINANCIAL STATEMENTS (Continued)
June 30, 2021
56
been adjusted for legally authorized revisions of the annual budgets during the year. Appropriations lapse at year-end; however, uncompleted capital projects may be re-appropriated at the beginning of each fiscal year. The Council made several supplemental budgetary appropriations throughout fiscal year 2021. The net effect of these supplemental appropriations was a decrease of $10,627,933 in the General Fund and a decrease of $1,467,669 in the Urban Services Fund, which included re-appropriations of encumbrances from prior fiscal years and various waste management and street light re-appropriations to the following fiscal year 2022, respectively. F. Assets, Liabilities, and Fund Equity Cash and Investments – Management has adopted written policies and procedures for cash and investment management. Cash and cash equivalents include cash on hand, demand deposits and cash with fiscal agents. Cash balances of most Government funds are pooled and invested. Interest earned from investments purchased with pooled cash is allocated to each of the funds based on the fund's average monthly cash balance, except as required by ordinance for various restricted reserves. Funds that incur a negative balance in pooled cash and investments during the year are not allocated interest. The Government has adopted GASB Statement No. 72, Fair Value Measurement and Application. This statement requires that investments in interest-earning investment contracts, external investment pools, open-end mutual funds, and debt and equity securities be reported at fair value. Investments in the Pension Trust Funds and investments with a maturity of more than one year at the time of purchase are stated at fair value. Fair value for securities traded on a national exchange is determined by the last reported sales price. All other investments are stated at cost. Receivables – Receivables are amounts due representing revenues earned or accrued in the current period. Allowances for uncollectible loans in the Federal and State Grants Fund fully reserve loan balances due to the nature of the individual projects and terms of the loans. Accounts receivable from other governments include amounts due from grantors for grants for specific programs and capital projects. The majority of other receivables in the General Fund are for taxpayer-assessed revenues that are collected 30 days after year end. Franchise fee revenues are recognized if collected within 60 days after year end. Property taxes for fiscal year 2021 were levied on September 15, 2021, on the assessed valuation of property located in Fayette County as of the preceding January 1, the lien date. The due date and collection periods for all taxes exclusive of vehicle taxes are as follows: Description Per KRS 134.020 Due date for payment of taxes Upon receipt 2% discount period By November 1 Face value amount payment dates November 2 to December 31 Delinquent date, 5% penalty January 1 to January 31 10% penalty plus 10% add on fee date April 15 Per Kentucky statute, the county sheriffs are responsible for collection of property taxes. Vehicle taxes, collected by the County Clerk of Fayette County, are due and collected in the birth month of the vehicle's licensee. During the year, property tax revenues are recognized when cash is received. At year-end, a receivable is recorded for delinquent property taxes, but revenues are only recognized for taxes collected within 60 days of the close of the fiscal year. Allowance for Uncollectable Amounts – An allowance for uncollectable amounts relates to the estimated uncollectable balance of the revenues earned or accrued that have been included in accounts receivable at year end. An allowance is recorded on receivable balances based on historical bad debt experience related to the nature of each receivable balance. Interfund Transactions – During the course of its operations, the Government has numerous transactions between funds to finance operations, provide services, construct assets, and service debt. To the extent that certain transactions between funds have not been paid or received as of June 30, 2021, balances of interfund amounts receivable or payable
LEXINGTON-FAYETTE URBAN COUNTY GOVERNMENT NOTES TO FINANCIAL STATEMENTS (Continued)
June 30, 2021
57
have been recorded as “due to/from other funds”. These accounts are eliminated on the Government-Wide Statement of Net Position. Any residual balances outstanding between the Governmental Activities and Business-Type Activities are reported in the government-wide financial statements as “internal balances.” Interfund transactions that would be treated as revenues or expenditures/expenses if they involved organizations external to the Government are similarly treated when involving funds of the Government. Transactions that constitute reimbursements to a fund for expenditures/expenses initially made from it that are properly applicable to another fund are recorded as expenditures/expenses in the reimbursing fund and as reductions of expenditures/expenses in the reimbursed fund. Transfers from funds receiving revenues to funds through which the resources are to be expended and operating subsidies are classified as transfers. Transfers between governmental and proprietary funds are netted as part of the reconciliation to the government-wide columnar presentation. Inventories and Prepaid Items – Fuel and vehicle parts inventories are stated at average cost. Other inventories are valued using the first-in, first-out method. The costs of inventory items are recognized as expenditures or expenses when used. Payments made to vendors for goods and services that will benefit periods beyond June 30, 2021 are recorded in assets as prepaid items under the consumption method. In the governmental fund financial statements, reported inventories and prepaid items are equally offset in the fund balance as nonspendable, which indicates that they do not constitute “available spendable resources” even though they are a component of total assets. Restricted Assets – Restricted assets are liquid assets that have third-party (statutory, bond covenant, or granting agency) limitations on their use. Certain proceeds of revenue bonds, as well as certain resources set aside for their payment, are classified as restricted assets on the Balance Sheet and Statement of Net Position since their use is limited by applicable bond indentures. The other restricted assets are required to be maintained until the related bonds mature. The Construction and Capital Acquisitions account is used to report proceeds of bonds and notes payable that are restricted for use in construction and capital acquisitions. The Government uses the Construction and Capital Acquisitions assets for their intended purpose before using unrestricted assets. The Maintenance and Operations account represents the resources set aside to operate, maintain and insure the Sanitary Sewer System for three full months. The Capital Replacement account represents the resources set aside to provide reasonable reserves for renewals, replacements, improvements, extensions, extraordinary major repairs and contingencies in the operation of the Sanitary Sewer System. The Debt Service account is used to report resources set aside to prevent a default in payment of principal or interest on the bonds. The Sinking Fund account represents the resources accumulated for debt service payments over the next twelve months. The balances of the restricted asset’s accounts in the governmental funds are as follows: Various purpose general obligation notes account $24,312,689Federal Grants and Contracts 29,299Debt Service on QECB Bond 1,467,409
Total restricted assets $25,809,397
The balances of the restricted asset’s accounts in the enterprise funds are as follows:
Sanitary sewer reserve for construction and capital acquisition $17,864,617Sanitary sewer and stormwater capital replacement account 2,777,850
Total restricted assets $20,642,467
Unrestricted Assets – Unrestricted assets represent unrestricted liquid assets. While Government management may have categorized and segmented portions for various purposes, the Urban County Council has the unrestricted authority to revisit or alter these management decisions.
LEXINGTON-FAYETTE URBAN COUNTY GOVERNMENT NOTES TO FINANCIAL STATEMENTS (Continued)
June 30, 2021
58
Capital Assets – Capital assets, which include property, plant, equipment, infrastructure (e.g. roads, bridges, traffic signals and similar items), and intangible assets, are reported in the applicable Governmental or Business-Type Activities columns in the government-wide financial statements and in the proprietary funds. Expenditures for items having a useful life greater than one year and having a cost greater than $5,000 for equipment and $25,000 for land, buildings, infrastructure and related improvements are capitalized. Such assets are recorded at historical cost or estimated historical cost if purchased or constructed. Donated capital assets, donated works of art and similar items, and capital assets received in a service concession arrangement are recorded at acquisition value and recorded as donations at the date received. The costs of normal maintenance and repairs that do not add to the value of the asset or materially extend asset lives are not capitalized. Capital assets of the Government are depreciated using the straight-line method over the following estimated useful lives:
Buildings 10-40 years Land and leasehold improvements 10-50 years Infrastructure 10-50 years Sanitary sewer system lines and plants 10-50 years Vehicles, equipment, and furniture 5-25 years Intangibles 3-5 years Construction in progress (CIP) represents construction projects for capital assets that have not yet been placed in service. Developments in progress (DIP) represent fees accrued on urban development projects in the EAMP currently underway that have not yet been completed, where settlement of the fees by the respective developer is expected to be made through contributing infrastructure type assets (e.g. roads, sewer systems, etc.) to the Government. CIP and DIP are not depreciated until the projects are complete and placed in service. For more information on the EAMP plan, please see page 55. Land, purchase of development rights, and permanent easements are not depreciated. The Government has a collection of artwork and historical treasures presented for public exhibition and education that are being preserved for future use. These items are not capitalized or depreciated as part of capital assets. Compensated Absences – Compensated absences include accumulated unpaid vacation, sick and holiday leave. Government employees are granted vacation and sick leave in varying amounts in accordance with administrative policy. In the event of termination, an employee is reimbursed for accumulated holiday and vacation days. Employees receive annual compensation for accumulated unused sick leave in excess of 600 hours (or 840 hours for firefighters). Employees are reimbursed for all accumulated unused sick leave upon retirement. All accumulated leave pay is accrued when incurred in the government-wide and proprietary fund financial statements. In governmental funds, compensated absences are not payable with available and spendable resources, and, therefore, are only recorded when they have matured, for example, as a result of employee resignations and retirements. Long-Term Obligations – In the government-wide and proprietary fund financial statements, long-term debt and obligations are reported as liabilities in the applicable Governmental Activities, Business-Type Activities, or Proprietary Fund Statement of Net Position. The discounts and premiums related to bonds and notes issued are amortized over the life of the bond or note using the straight-line method. Bonds and notes payable are reported net of the applicable bond premium or discount. Issuance costs are expensed when incurred. Losses on advance refunding issues are reported as deferred outflows of resources and recognized as an outflow as required by GASB Statement No. 65. In the fund financial statements, governmental funds recognize bond premiums and discounts, as well as bond issuance costs, during the current period. The face amount of debt issued is reported as other financing sources. Premiums on debt issuances are reported as other financing sources while discounts are reported as other financing uses. Issuance costs are reported as debt service expenditures.
LEXINGTON-FAYETTE URBAN COUNTY GOVERNMENT NOTES TO FINANCIAL STATEMENTS (Continued)
June 30, 2021
59
The difference between the re-acquisition price (new debt) and the net carrying value of the old debt on refunded debt of the proprietary funds is amortized as a component of interest expense over the life of the old or new bonds, whichever is shorter, using the straight-line method. Long-term liabilities include the following: Compensated absences, which is the accrual for vacation time earned but not taken by employees. Principal outstanding on general obligation bonds, general obligation notes, and revenue bonds. Net Post-Retirement Health Benefits, which is the net retirement health benefit obligation for the Policemen’s
and Firefighters’ Retirement Fund and the City Employees’ Pension Fund. In addition, it includes the Government’s proportionate share of the net liability in the CERS multi-employer defined benefit post-employment health insurance plan.
Landfill closure and postclosure care liability, which is the estimated total cost to perform certain maintenance
and monitoring functions for thirty years after closure.
Unearned revenue and other liabilities, which is the cash received in advance of being earned, and other long term liabilities.
Net postemployment benefit liability, which is the net postemployment benefits obligation for the Policemen’s
and Firefighters’ Retirement Fund. In addition, it includes the Government’s proportionate share of the net postemployment benefits liability in the CERS multi-employer defined benefit pension plan.
Net pension liability, which is the net retirement obligation for the Policemen’s and Firefighters’ Retirement
Fund. In addition, it includes the Government’s proportionate share of the net pension liability in the CERS multi-employer defined benefit pension plan.
G. Deferred Inflows of Resources and Deferred Outflows of Resources With the implementation of GASB Statements 65 and 68, and GASB Statements 74 and 75, the Government’s Statement of Net Position includes deferred inflows (or deferred outflows) of resources when appropriate. Deferred outflows of resources represent a consumption of net position that applies to one or more future periods. Deferred inflows of resources represent an acquisition of net position that applies to a future period(s). These amounts will not be recognized as expense or revenue until the applicable period. Deferred Outflows – include the differences between reacquisition price and the net carrying amount of refunded debt obligations that is recognized as a component of interest expense over the remaining life of the old debt or the life of the new debt, whichever is shorter. In addition, it includes differences between expected and actual experience, changes of assumptions, changes in proportionate share, differences between projected and actual earnings, and differences between projected and actual earnings on investments in both pension plans and other paid employee benefit plans, and contributions to pension plans and other paid employee benefit plans made subsequent to the Government’s measurement date of June 30, 2020. Deferred Inflows – include differences between expected and actual experience, changes of assumptions, changes in proportionate share, and projected and actual earnings on investments in both pension plans and other paid employee benefit plans.
LEXINGTON-FAYETTE URBAN COUNTY GOVERNMENT NOTES TO FINANCIAL STATEMENTS (Continued)
June 30, 2021
60
H. Net Position/Fund Balances The government-wide and proprietary financial statements utilize a net position presentation. Net position is categorized as follows:
Net Investment in Capital Assets – is intended to reflect the portion of net position associated with capital assets (net of accumulated depreciation), less outstanding capital assets related debt, net of unspent bond proceeds. Restricted Net Position – represents amounts that are restricted for specific purposes when constraints placed on the use of resources are either (a) externally imposed by creditors, grantors, contributors, laws/regulations of other governments or constitutional provisions, or (b) resources resulting from enabling legislation. Unrestricted Net Position – This category represents amounts not appropriated for expenditures, or legally segregated for a specific future use.
In the Balance Sheet of governmental funds the difference between the assets and liabilities of governmental funds is reported as fund balance. The Government's fund balance is divided into the following classifications, as applicable:
Nonspendable – These resources include amounts that cannot be spent because they are either not spendable in form, or are legally or contractually required to be maintained intact. The Government’s nonspendable funds consisted of prepaid expenses and inventories as of June 30, 2021. Restricted – Restricted amounts represent resources that are constrained for a specific purpose by external parties, constitutional provisions, or enabling legislation. The Government had restricted funds for various projects: public works, public safety, capital projects, grants, urban services, and energy improvement as of June 30, 2021. Committed – Committed amounts are constrained for a specific purpose by the Government using its highest level of decision-making authority. For resources to be considered committed, the Urban County Council issues an ordinance that can only be changed with another corresponding ordinance. Committed fund balance for the General Fund is further classified as follows: Committed for:Affordable Housing & Homelessness Intervention $2,986,870Economic Stabilization 37,964,969Chief Development Officer 2,134,456Social Services 954,500Special Programs 379,834
Committed Fund Balance $44,420,629
The Government developed and adopted a General Fund Balance (“Economic Stabilization Fund” or “Contingency Designation Fund”) Policy on December 5, 1996, and revised on April 17, 2016. It is the Government’s policy to:
Maintain a Contingency Designation Fund funding goal of ten percent (10%) of the previous year’s total General Fund Revenues. Interest earned accrues to the fund.
Budget a deposit of $50,000 per month, for each fiscal year until meeting the Contingency Designation Fund funding goal of 10% of the last completed fiscal year total General Fund revenues, beginning with the 2007 fiscal year. The Urban County Council suspended this requirement for fiscal year 2021.
LEXINGTON-FAYETTE URBAN COUNTY GOVERNMENT NOTES TO FINANCIAL STATEMENTS (Continued)
June 30, 2021
61
Annually report to the Budget, Finance, and Economic Development Committee the dollar amount that could be deposited to the fund to maintain ten percent (10%) of the previous year’s General Fund Revenues.
The Contingency Designation Fund balance may be used in the following circumstances:
Unanticipated or unforeseen extraordinary needs of an emergency nature. Revenue stabilization to balance the budget in the event of an unanticipated shortfall. Unanticipated situations of an unusual nature involving nonrecurring expenditure(s).
The Government has made a complete and rational analysis, with justifying evidence that the Contingency Designation Fund can be maintained in the future. Assigned – Assigned amounts represent resources that the Government intends to use for a specific purpose, but do not meet the definition of restricted or committed fund balance. Amounts may be assigned by the Urban County Council or by the Commissioner of Finance under the authorization of the Mayor. Amounts classified as assigned have gone before the Government’s Urban County Council subsequent to June 30, 2021 for approval through ordinance. Assigned for: General Fund Non Major FundsAdministrative Services $125,000 $0Information Technology 150,000General Government 44,176,281 421,855General Services 403,500Social Services 40,000
Assigned Fund Balance $44,894,781 $421,855
Unassigned – Unassigned amounts represent resources that have not been classified as nonspendable, restricted, committed, or assigned to a specific purpose within the General Fund. The General Fund is the only fund that reports a positive unassigned fund balance amount. In other governmental funds it is not appropriate to report a positive unassigned fund balance amount. However, in governmental funds other than the General Fund, if expenditures incurred for specific purposes exceed the amounts that are nonspendable, restricted, committed, or assigned to those purposes, it may be necessary to report a negative unassigned fund balance in that fund.
When both restricted and unrestricted resources are available for use, it is the Government’s policy to use restricted resources first, then unrestricted resources as they are needed. Likewise, fund balances that are committed or assigned would be used first for their approved purposes. Unassigned fund balances would be used as needed. I. Use of Estimates The preparation of financial statements in conformity with GAAP requires management to make estimates and assumptions that affect certain reported amounts and disclosures. Accordingly, actual results could differ from those estimates. J. Revenues Emergency medical service fees are billed and collected by Software Development, Inc. (SDI) as an agent for the Government. Cash collected by SDI is remitted daily to the Government. The Government records all revenues (net of an allowance for doubtful accounts) billed through the end of the fiscal year by SDI. The Government utilizes an internal billing system to collect sanitary sewer and landfill user fees, along with the water quality management fee.
LEXINGTON-FAYETTE URBAN COUNTY GOVERNMENT NOTES TO FINANCIAL STATEMENTS (Continued)
June 30, 2021
62
Unearned revenue in the government-wide and proprietary funds Statement of Net Position and the Governmental Funds Balance Sheet result from resources that the Government has received before it has a legal claim to it, such as when grant money is received prior to incurring eligible expenditures. In a subsequent period, when revenue is earned, the liability is removed and revenue recognized. K. Pensions For purposes of measuring the net pension liability, deferred outflows of resources, deferred inflows of resources, pension expense, information about the fiduciary net position of the County Employees’ Retirement System (CERS), and additions to/deductions from CERS’s fiduciary net position have been determined on the same basis as they are reported by CERS. For this purpose, benefit payments (including refunds of employee contributions) are recognized when due and payable in accordance with the benefit terms. Investments are reported at fair value. The liability was measured at June 30, 2020. The Government recognized aggregate Pension Expense of $95,648,618 for all pension plans of the primary government. L. Postemployment Benefits Other Than Pensions (OPEB) For purposes of measuring the net OPEB liability, deferred outflows of resources, deferred inflows of resources, OPEB expense, information about the fiduciary net position of the County Employees’ Retirement System (CERS) Post Employment Health Insurance Plan (the Plan), and additions to/deductions from CERS the Plan’s fiduciary net position have been determined on the same basis as they are reported by CERS. For this purpose, benefit payments (including refunds of employee contributions) are recognized when due and payable in accordance with the benefit terms. Investments are reported at fair value. The liability was measured at June 30, 2020. The Government recognized aggregate OPEB Expense of $(5,322,048) for all OPEB plans of the primary government. NOTE 2. STEWARDSHIP, COMPLIANCE, AND ACCOUNTABILITY A. Compliance with Finance Related Legal and Contractual Provisions Management of the Government believes it has no material violations of finance related legal and contractual provisions.
LEXINGTON-FAYETTE URBAN COUNTY GOVERNMENT NOTES TO FINANCIAL STATEMENTS (Continued)
June 30, 2021
63
B. Excess of Expenditures over Appropriations - The following divisions, in funds that have budgets adopted annually, had excess expenditures over appropriations for the fiscal year ended June 30, 2021:
ExcessExpenditures
General Fund:Building Inspection $91,240Coroner 9,903DEEM/Enhanced 911 104,130Emergency Management 229,810Enterprise Solutions 34,560Internal Audit Office 11,102Lex Call 15,072Police 116,558Public Safety Administration 85,385Revenue 21,551Youth Services 250,006
Urban Services Fund:Central Purchasing $1,507Enterprise Solutions 388Fleet & Facilities Management 24,439Indirect Cost Allocation 400,148
Excess expenditures over appropriations were funded by favorable budget variances in other categories. C. Fund Deficits Proprietary funds – the Extended School Program had a fund deficit of ($1,716,601) as a result of the net pension liability. D. Prior Period Adjustments Primary Government The following prior period adjustments were made to the Governmental fund financial statements: General Funds: Recognize unreimbursable expenditures from the prior fiscal year in the amount of $255,746. Recognize revenue from 2017 in the amount of $74,614. The following prior period adjustments were made to the Proprietary fund financial statements: Sanitary Sewer Funds: Unrecognize revenues from the prior fiscal year in the amount of $358,303. Unrecognize revenues from fiscal year 2019 and 2018 in the amount of $32,955 and $48,171, respectively. Public Facilities Corporation Funds: Recognize revenues from the prior fiscal year in the amount of $358,303. Capitalize land acquired in fiscal years 2000 and 1998 of $630,000 and $3,491,347, respectively. Landfill Fund: Unrecognize revenues from fiscal year 2019 and 2018 in the amount of $12,436 and $18,178, respectively. Water Quality Funds: Unrecognize revenues from fiscal year 2019 and 2018 in the amount of $16,788 and $24,540, respectively.
LEXINGTON-FAYETTE URBAN COUNTY GOVERNMENT NOTES TO FINANCIAL STATEMENTS (Continued)
June 30, 2021
64
Component Units
The Fayette County Department of Health reduced net position by $135,668 to recognize grant expenditures from the prior fiscal year.
NOTE 3. DETAIL NOTES ON ALL FUNDS A. Cash, Investments, and Securities Lending Primary Government The Government’s bank balances at June 30, 2021 are entirely insured by the Federal Deposit Insurance Corporation (FDIC) and/or collateralized with securities held by the Government’s agent in the Government’s name. In accordance with Kentucky Revised Statute (KRS) 66.480 as amended March18, 2019, and the Government’s investment policy, the Government is allowed to invest in the following:
1. Obligations of the United States and of its agencies and instrumentalities, including obligations subject to repurchase agreements, provided that delivery of these obligations subject to repurchase agreements is taken either directly or through an authorized custodian.
2. Obligations and contracts for future delivery or purchase of obligations backed by the full faith and credit of the United States or a United States government agency.
3. Obligations of any corporation of the United States government. 4. Certificates of deposit or other interest-bearing accounts issued by any bank or savings and loan
institution which are insured by the FDIC, or similar entity, or which are collateralized to the extent uninsured.
5. Bankers’ acceptances for banks rated in one (1) of the three (3) highest categories by a nationally recognized rating agency.
6. Commercial paper rated in the highest category by a nationally recognized rating agency. 7. Bonds or certificates of indebtedness of the Commonwealth of Kentucky and of its agencies and
instrumentalities. 8. Securities issued by a state or local government, or any instrumentality or agency thereof, in the United
States, and rated in one (1) of the three (3) highest categories by a nationally recognized rating agency. 9. Shares of mutual funds, each of which shall have the following characteristics:
a. The mutual fund shall be an open-end diversified investment company registered under the Federal Investment Company Act of 1940, as amended
b. The management company of the investment company shall have been in operation for at least five (5) years; and
c. All of the securities in the mutual fund shall be eligible investments under this section.
In addition, the Pension Trust Funds are allowed to invest in equity securities, corporate bonds and international stocks listed as American Depository Receipts (ADR). Investments of the Government as of June 30, 2021 are summarized and categorized in the following table:
Quoted Prices in Significant Other SignificantActive Markets for Observable Unobservable
Identical Assets Inputs InputsInvestment Type Fair Value Level 1 Level 2 Level 3
Cash and Cash Equivalents $44,972,699 $44,972,699Money Market Mutual Funds 49,542,213 $49,542,213Certificates of Deposit 1,697,628 1,697,628Commercial Paper 12,992,280 12,992,280U.S. Government Agency Obligations 56,464,147 56,464,147Total Investments $165,668,967 $57,964,979 $107,703,988 $0
LEXINGTON-FAYETTE URBAN COUNTY GOVERNMENT NOTES TO FINANCIAL STATEMENTS (Continued)
June 30, 2021
65
The Government categorizes its fair value measurements within the fair value hierarchy established by GAAP. The hierarchy is based on the valuation inputs used to measure the fair value of the asset. Level 1inputs are quoted prices in active markets for identical assets, Level 2 inputs are significant other observable inputs, and Level 3 inputs are significant unobservable inputs. Level 2 fixed income securities are priced by industry standard vendors, such as Interactive Data Corporation (IDC), using inputs such as benchmark yields, reported trades, broker/dealer quotes, and issuer spreads. IDC also monitors market indices and industry and economic events including credit rating agency actions. The Government has no Level 3 inputs. Interest Rate Risk – The risk that changes in interest rates will adversely affect the fair value of an investment. While the Government has adopted an investment policy that recommends controlling interest rate risk through maturity diversification, the policy does not place any formal limits of investment maturities as a means of managing its exposure to fair value losses arising from increasing interest rates. Credit Risk – The risk that an issuer or other counterparty to an investment will not fulfill its obligations. Investments are made under the “prudent person rule” outlined in the Government’s investment policy. This rule is defined to mean “investments shall be made with judgment and care, under circumstances then prevailing, which persons of prudence, discretion, and intelligence exercise in the management of their own affairs, not for speculation, but for investment, considering the probable safety of capital as well as the probable income to be derived.” The prudent investor standard shall be applied in the context of managing the overall portfolio.
S&PInvestment Type Fair Value Less Than 1 Year 1 to 5 6 to 10 More than 10 Rating Fair Value
Cash and Cash Equivalents $44,972,699 $44,972,699 AA $56,464,147Money Market Mutual Funds 49,542,213 49,542,213 NA 109,204,820Certificates of Deposit 1,697,628 1,041,792 $450,356 $205,479Commercial Paper 12,992,280 12,992,280U.S. Government Agency Obligations 56,464,147 8,270,058 $48,194,090Total Investments $165,668,967 $116,819,042 $48,194,090 $450,356 $205,479
Investment Maturities (in years)Primary Government (except Fiduciary Funds)
Concentration of Credit Risk – The risk of loss attributed to the magnitude of the Government’s investment in a single issuer. Government securities and investments in mutual funds are excluded from this risk. In order to reduce the credit risk, the investments held by a financial institution in the Government’s name should be limited to no more than 35% of the total investments, excluding that held in a Money Market Mutual Fund. Investment Trust Fund The Government’s investment trust fund operates under the Sewer indenture established to provide that the net revenues from the sewer system operations are deposited into a Bond Account held by a Trustee. The account must provide coverage of 120% of the maximum annual debt service. The fund follows the Government’s policy in accordance with Kentucky Revised Statute (KRS) 66.480 and the Government’s investment policy.
Quoted Prices in Significant Other SignificantActive Markets for Observable Unobservable
Identical Assets Inputs InputsInvestment Type Fair Value Level 1 Level 2 Level 3
Money Market Mutual Funds $27,165,360 $27,165,360
Sewer Investment Trust Fund
Level 1 inputs are quoted prices in active markets for identical assets, Level 2 inputs are significant other observable inputs, and Level 3 inputs are significant unobservable inputs. Level 2 fixed income securities are priced by industry standard vendors, such as Interactive Data Corporation (IDC), using inputs such as benchmark yields, reported trades,
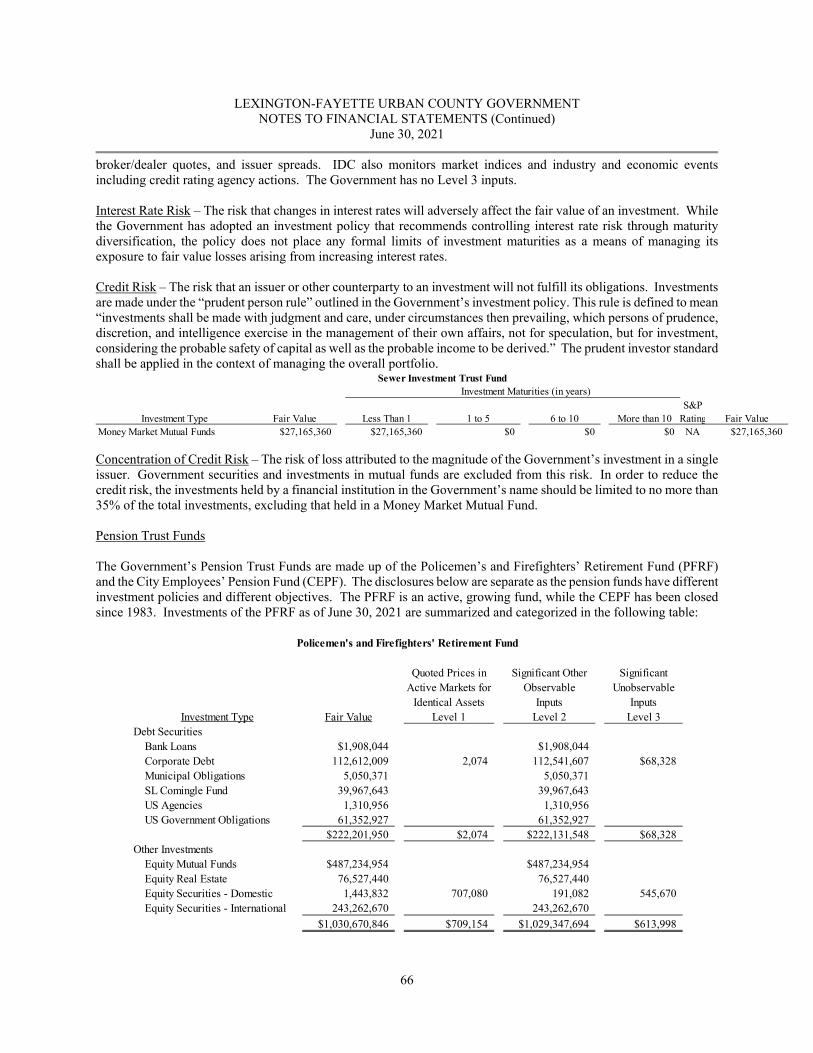
LEXINGTON-FAYETTE URBAN COUNTY GOVERNMENT NOTES TO FINANCIAL STATEMENTS (Continued)
June 30, 2021
66
broker/dealer quotes, and issuer spreads. IDC also monitors market indices and industry and economic events including credit rating agency actions. The Government has no Level 3 inputs. Interest Rate Risk – The risk that changes in interest rates will adversely affect the fair value of an investment. While the Government has adopted an investment policy that recommends controlling interest rate risk through maturity diversification, the policy does not place any formal limits of investment maturities as a means of managing its exposure to fair value losses arising from increasing interest rates. Credit Risk – The risk that an issuer or other counterparty to an investment will not fulfill its obligations. Investments are made under the “prudent person rule” outlined in the Government’s investment policy. This rule is defined to mean “investments shall be made with judgment and care, under circumstances then prevailing, which persons of prudence, discretion, and intelligence exercise in the management of their own affairs, not for speculation, but for investment, considering the probable safety of capital as well as the probable income to be derived.” The prudent investor standard shall be applied in the context of managing the overall portfolio.
S&PInvestment Type Fair Value Less Than 1 1 to 5 6 to 10 More than 10 Rating Fair Value
Money Market Mutual Funds $27,165,360 $27,165,360 $0 $0 $0 NA $27,165,360
Sewer Investment Trust FundInvestment Maturities (in years)
Concentration of Credit Risk – The risk of loss attributed to the magnitude of the Government’s investment in a single issuer. Government securities and investments in mutual funds are excluded from this risk. In order to reduce the credit risk, the investments held by a financial institution in the Government’s name should be limited to no more than 35% of the total investments, excluding that held in a Money Market Mutual Fund. Pension Trust Funds The Government’s Pension Trust Funds are made up of the Policemen’s and Firefighters’ Retirement Fund (PFRF) and the City Employees’ Pension Fund (CEPF). The disclosures below are separate as the pension funds have different investment policies and different objectives. The PFRF is an active, growing fund, while the CEPF has been closed since 1983. Investments of the PFRF as of June 30, 2021 are summarized and categorized in the following table:
Quoted Prices in Significant Other SignificantActive Markets for Observable Unobservable
Identical Assets Inputs InputsInvestment Type Fair Value Level 1 Level 2 Level 3
Debt Securities Bank Loans $1,908,044 $1,908,044 Corporate Debt 112,612,009 2,074 112,541,607 $68,328 Municipal Obligations 5,050,371 5,050,371 SL Comingle Fund 39,967,643 39,967,643 US Agencies 1,310,956 1,310,956 US Government Obligations 61,352,927 61,352,927
$222,201,950 $2,074 $222,131,548 $68,328Other Investments Equity Mutual Funds $487,234,954 $487,234,954 Equity Real Estate 76,527,440 76,527,440 Equity Securities - Domestic 1,443,832 707,080 191,082 545,670 Equity Securities - International 243,262,670 243,262,670
$1,030,670,846 $709,154 $1,029,347,694 $613,998
Policemen's and Firefighters' Retirement Fund
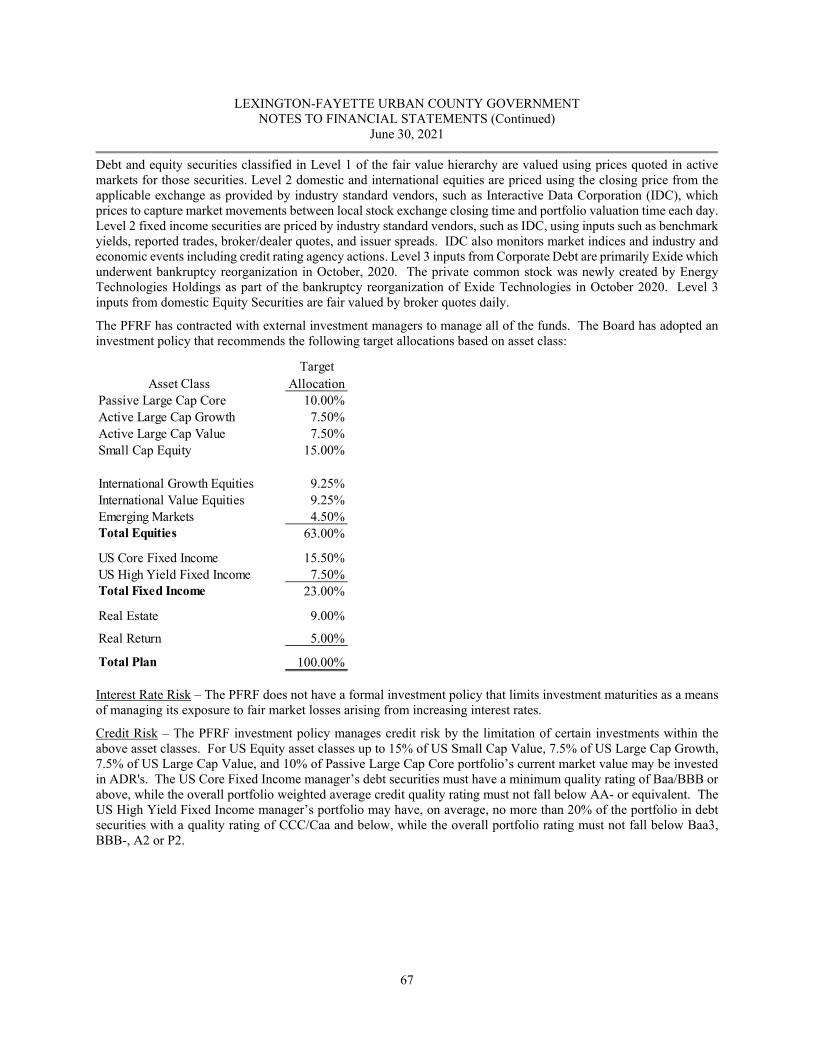
LEXINGTON-FAYETTE URBAN COUNTY GOVERNMENT NOTES TO FINANCIAL STATEMENTS (Continued)
June 30, 2021
67
Debt and equity securities classified in Level 1 of the fair value hierarchy are valued using prices quoted in active markets for those securities. Level 2 domestic and international equities are priced using the closing price from the applicable exchange as provided by industry standard vendors, such as Interactive Data Corporation (IDC), which prices to capture market movements between local stock exchange closing time and portfolio valuation time each day. Level 2 fixed income securities are priced by industry standard vendors, such as IDC, using inputs such as benchmark yields, reported trades, broker/dealer quotes, and issuer spreads. IDC also monitors market indices and industry and economic events including credit rating agency actions. Level 3 inputs from Corporate Debt are primarily Exide which underwent bankruptcy reorganization in October, 2020. The private common stock was newly created by Energy Technologies Holdings as part of the bankruptcy reorganization of Exide Technologies in October 2020. Level 3 inputs from domestic Equity Securities are fair valued by broker quotes daily.
The PFRF has contracted with external investment managers to manage all of the funds. The Board has adopted an investment policy that recommends the following target allocations based on asset class:
Target Allocation
Passive Large Cap Core 10.00%Active Large Cap Growth 7.50%Active Large Cap Value 7.50%Small Cap Equity 15.00%
International Growth Equities 9.25%International Value Equities 9.25%Emerging Markets 4.50%Total Equities 63.00%
US Core Fixed Income 15.50%US High Yield Fixed Income 7.50%Total Fixed Income 23.00%
Real Estate 9.00%
Real Return 5.00%
Total Plan 100.00%
Asset Class
Interest Rate Risk – The PFRF does not have a formal investment policy that limits investment maturities as a means of managing its exposure to fair market losses arising from increasing interest rates.
Credit Risk – The PFRF investment policy manages credit risk by the limitation of certain investments within the above asset classes. For US Equity asset classes up to 15% of US Small Cap Value, 7.5% of US Large Cap Growth, 7.5% of US Large Cap Value, and 10% of Passive Large Cap Core portfolio’s current market value may be invested in ADR's. The US Core Fixed Income manager’s debt securities must have a minimum quality rating of Baa/BBB or above, while the overall portfolio weighted average credit quality rating must not fall below AA- or equivalent. The US High Yield Fixed Income manager’s portfolio may have, on average, no more than 20% of the portfolio in debt securities with a quality rating of CCC/Caa and below, while the overall portfolio rating must not fall below Baa3, BBB-, A2 or P2.
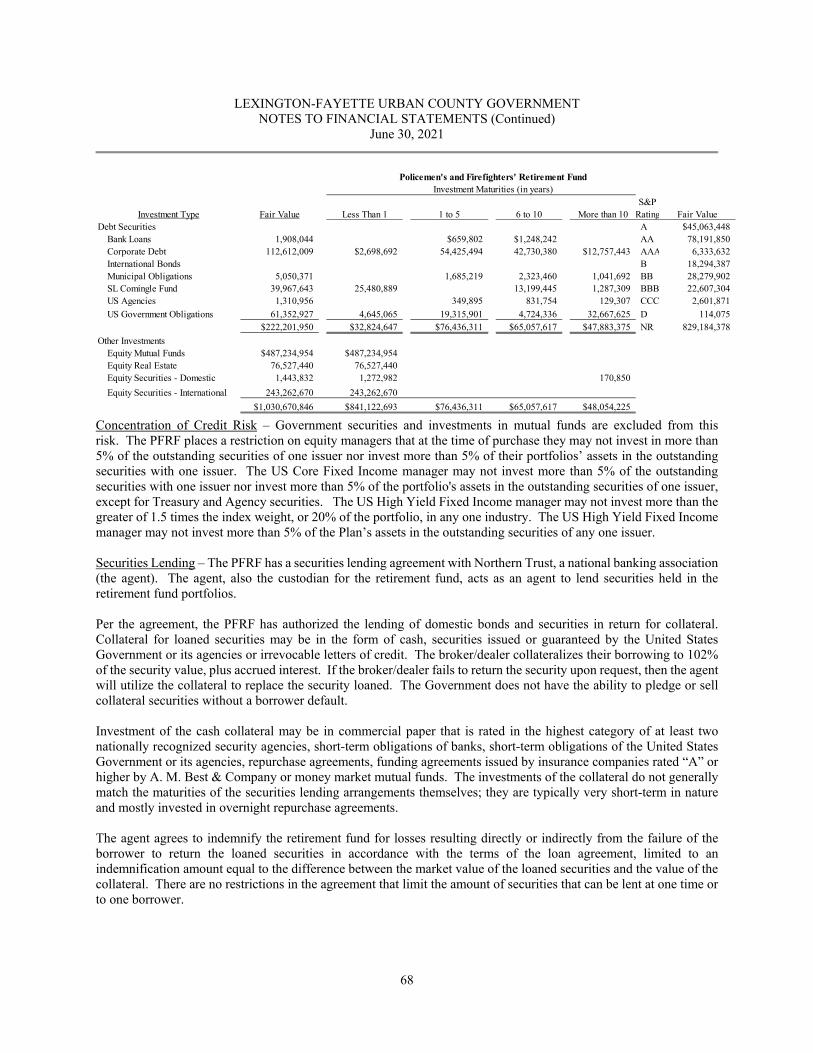
LEXINGTON-FAYETTE URBAN COUNTY GOVERNMENT NOTES TO FINANCIAL STATEMENTS (Continued)
June 30, 2021
68
S&PInvestment Type Fair Value Less Than 1 1 to 5 6 to 10 More than 10 Rating Fair Value
Debt Securities A $45,063,448 Bank Loans 1,908,044 $659,802 $1,248,242 AA 78,191,850 Corporate Debt 112,612,009 $2,698,692 54,425,494 42,730,380 $12,757,443 AAA 6,333,632 International Bonds B 18,294,387 Municipal Obligations 5,050,371 1,685,219 2,323,460 1,041,692 BB 28,279,902 SL Comingle Fund 39,967,643 25,480,889 13,199,445 1,287,309 BBB 22,607,304 US Agencies 1,310,956 349,895 831,754 129,307 CCC 2,601,871 US Government Obligations 61,352,927 4,645,065 19,315,901 4,724,336 32,667,625 D 114,075
$222,201,950 $32,824,647 $76,436,311 $65,057,617 $47,883,375 NR 829,184,378 Other Investments Equity Mutual Funds $487,234,954 $487,234,954 Equity Real Estate 76,527,440 76,527,440 Equity Securities - Domestic 1,443,832 1,272,982 170,850 Equity Securities - International 243,262,670 243,262,670
$1,030,670,846 $841,122,693 $76,436,311 $65,057,617 $48,054,225
Policemen's and Firefighters' Retirement FundInvestment Maturities (in years)
Concentration of Credit Risk – Government securities and investments in mutual funds are excluded from this risk. The PFRF places a restriction on equity managers that at the time of purchase they may not invest in more than 5% of the outstanding securities of one issuer nor invest more than 5% of their portfolios’ assets in the outstanding securities with one issuer. The US Core Fixed Income manager may not invest more than 5% of the outstanding securities with one issuer nor invest more than 5% of the portfolio's assets in the outstanding securities of one issuer, except for Treasury and Agency securities. The US High Yield Fixed Income manager may not invest more than the greater of 1.5 times the index weight, or 20% of the portfolio, in any one industry. The US High Yield Fixed Income manager may not invest more than 5% of the Plan’s assets in the outstanding securities of any one issuer. Securities Lending – The PFRF has a securities lending agreement with Northern Trust, a national banking association (the agent). The agent, also the custodian for the retirement fund, acts as an agent to lend securities held in the retirement fund portfolios. Per the agreement, the PFRF has authorized the lending of domestic bonds and securities in return for collateral. Collateral for loaned securities may be in the form of cash, securities issued or guaranteed by the United States Government or its agencies or irrevocable letters of credit. The broker/dealer collateralizes their borrowing to 102% of the security value, plus accrued interest. If the broker/dealer fails to return the security upon request, then the agent will utilize the collateral to replace the security loaned. The Government does not have the ability to pledge or sell collateral securities without a borrower default. Investment of the cash collateral may be in commercial paper that is rated in the highest category of at least two nationally recognized security agencies, short-term obligations of banks, short-term obligations of the United States Government or its agencies, repurchase agreements, funding agreements issued by insurance companies rated “A” or higher by A. M. Best & Company or money market mutual funds. The investments of the collateral do not generally match the maturities of the securities lending arrangements themselves; they are typically very short-term in nature and mostly invested in overnight repurchase agreements. The agent agrees to indemnify the retirement fund for losses resulting directly or indirectly from the failure of the borrower to return the loaned securities in accordance with the terms of the loan agreement, limited to an indemnification amount equal to the difference between the market value of the loaned securities and the value of the collateral. There are no restrictions in the agreement that limit the amount of securities that can be lent at one time or to one borrower.
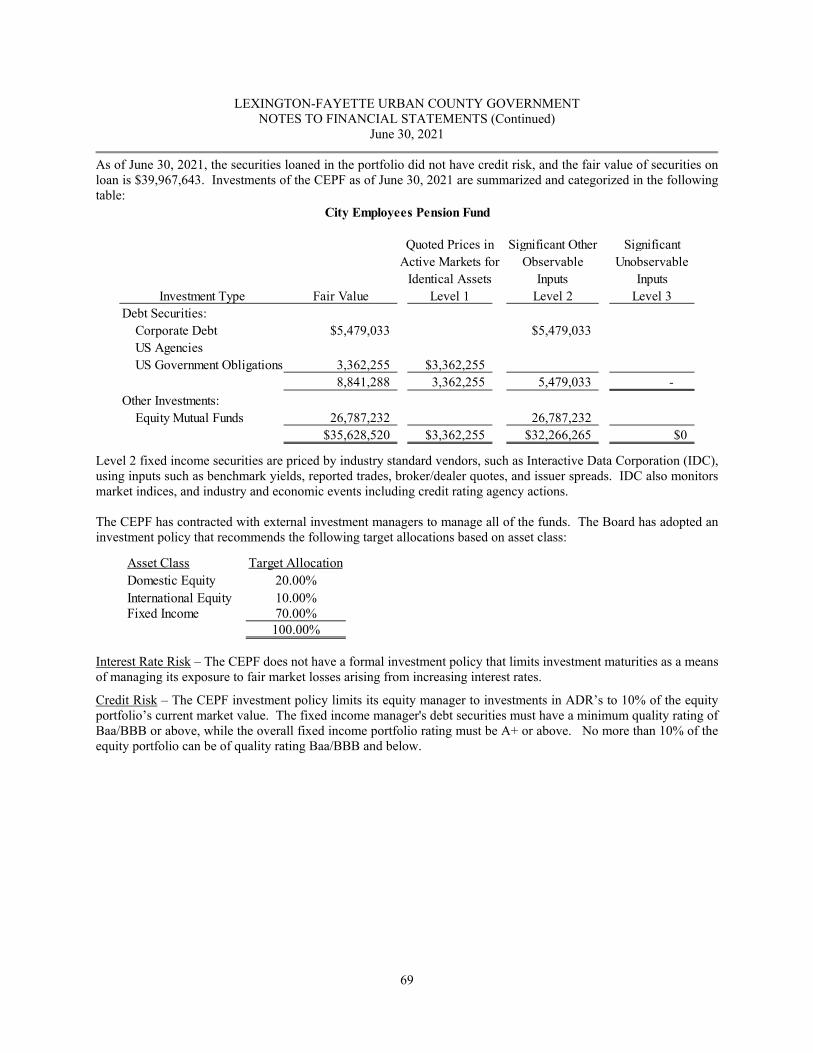
LEXINGTON-FAYETTE URBAN COUNTY GOVERNMENT NOTES TO FINANCIAL STATEMENTS (Continued)
June 30, 2021
69
As of June 30, 2021, the securities loaned in the portfolio did not have credit risk, and the fair value of securities on loan is $39,967,643. Investments of the CEPF as of June 30, 2021 are summarized and categorized in the following table:
Quoted Prices in Significant Other SignificantActive Markets for Observable Unobservable
Identical Assets Inputs InputsInvestment Type Fair Value Level 1 Level 2 Level 3
Debt Securities: Corporate Debt $5,479,033 $5,479,033 US Agencies US Government Obligations 3,362,255 $3,362,255
8,841,288 3,362,255 5,479,033 - Other Investments: Equity Mutual Funds 26,787,232 26,787,232
$35,628,520 $3,362,255 $32,266,265 $0
City Employees Pension Fund
Level 2 fixed income securities are priced by industry standard vendors, such as Interactive Data Corporation (IDC), using inputs such as benchmark yields, reported trades, broker/dealer quotes, and issuer spreads. IDC also monitors market indices, and industry and economic events including credit rating agency actions. The CEPF has contracted with external investment managers to manage all of the funds. The Board has adopted an investment policy that recommends the following target allocations based on asset class:
Asset Class Target AllocationDomestic Equity 20.00%International Equity 10.00%Fixed Income 70.00%
100.00%
Interest Rate Risk – The CEPF does not have a formal investment policy that limits investment maturities as a means of managing its exposure to fair market losses arising from increasing interest rates. Credit Risk – The CEPF investment policy limits its equity manager to investments in ADR’s to 10% of the equity portfolio’s current market value. The fixed income manager's debt securities must have a minimum quality rating of Baa/BBB or above, while the overall fixed income portfolio rating must be A+ or above. No more than 10% of the equity portfolio can be of quality rating Baa/BBB and below.
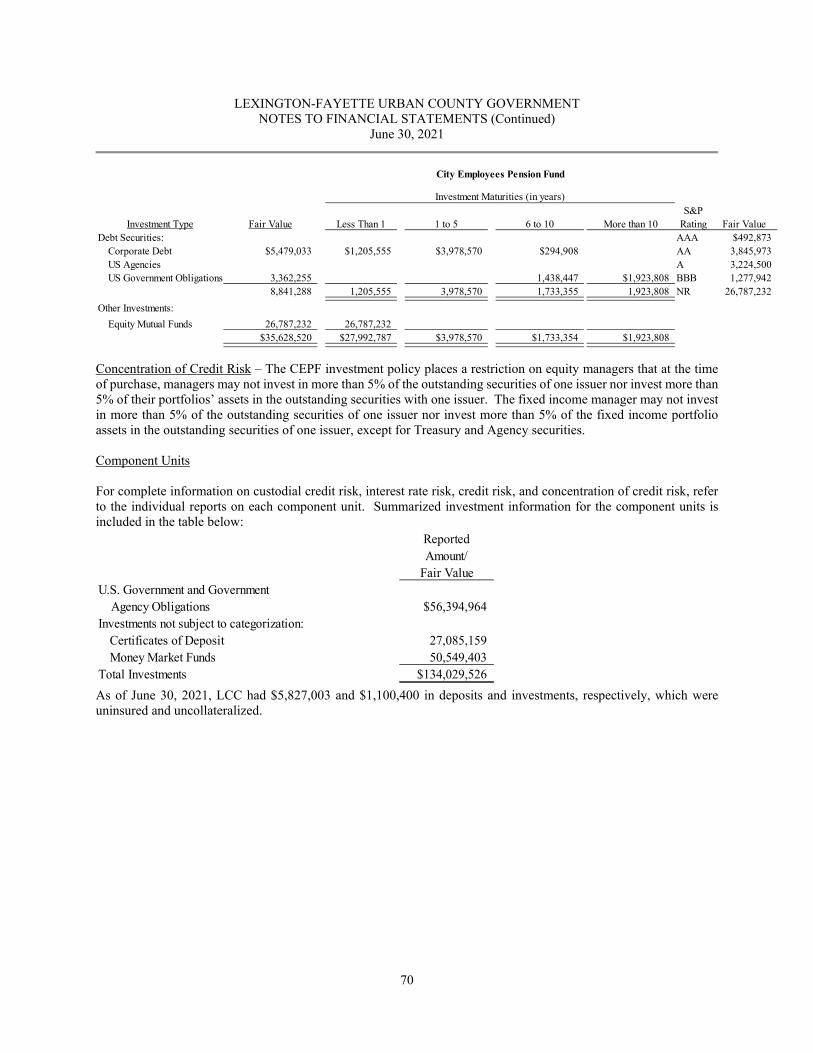
LEXINGTON-FAYETTE URBAN COUNTY GOVERNMENT NOTES TO FINANCIAL STATEMENTS (Continued)
June 30, 2021
70
S&PInvestment Type Fair Value Less Than 1 1 to 5 6 to 10 More than 10 Rating Fair Value
Debt Securities: AAA $492,873 Corporate Debt $5,479,033 $1,205,555 $3,978,570 $294,908 AA 3,845,973 US Agencies A 3,224,500 US Government Obligations 3,362,255 1,438,447 $1,923,808 BBB 1,277,942
8,841,288 1,205,555 3,978,570 1,733,355 1,923,808 NR 26,787,232Other Investments: Equity Mutual Funds 26,787,232 26,787,232
$35,628,520 $27,992,787 $3,978,570 $1,733,354 $1,923,808
Investment Maturities (in years)
City Employees Pension Fund
Concentration of Credit Risk – The CEPF investment policy places a restriction on equity managers that at the time of purchase, managers may not invest in more than 5% of the outstanding securities of one issuer nor invest more than 5% of their portfolios’ assets in the outstanding securities with one issuer. The fixed income manager may not invest in more than 5% of the outstanding securities of one issuer nor invest more than 5% of the fixed income portfolio assets in the outstanding securities of one issuer, except for Treasury and Agency securities. Component Units For complete information on custodial credit risk, interest rate risk, credit risk, and concentration of credit risk, refer to the individual reports on each component unit. Summarized investment information for the component units is included in the table below:
ReportedAmount/
Fair ValueU.S. Government and Government Agency Obligations $56,394,964Investments not subject to categorization:
Certificates of Deposit 27,085,159Money Market Funds 50,549,403
Total Investments $134,029,526 As of June 30, 2021, LCC had $5,827,003 and $1,100,400 in deposits and investments, respectively, which were uninsured and uncollateralized.
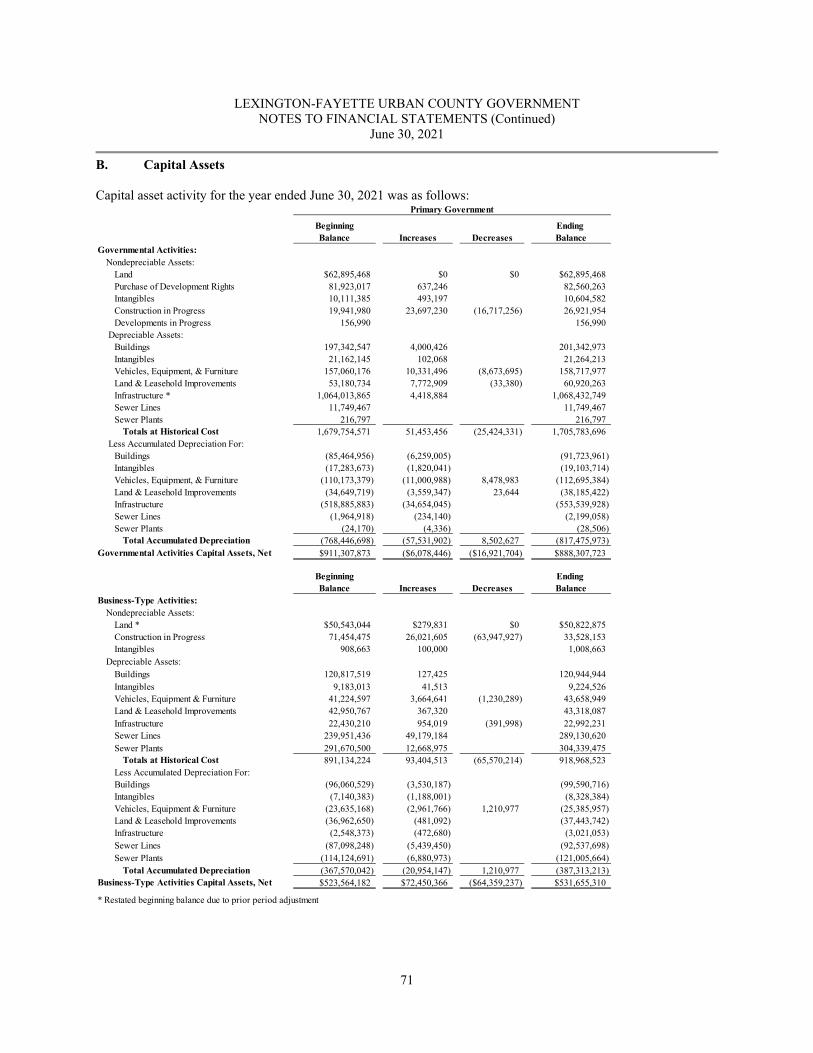
LEXINGTON-FAYETTE URBAN COUNTY GOVERNMENT NOTES TO FINANCIAL STATEMENTS (Continued)
June 30, 2021
71
B. Capital Assets Capital asset activity for the year ended June 30, 2021 was as follows:
Beginning Ending Balance Increases Decreases Balance
Governmental Activities:Nondepreciable Assets:
Land $62,895,468 $0 $0 $62,895,468Purchase of Development Rights 81,923,017 637,246 82,560,263Intangibles 10,111,385 493,197 10,604,582Construction in Progress 19,941,980 23,697,230 (16,717,256) 26,921,954Developments in Progress 156,990 0 156,990
Depreciable Assets:Buildings 197,342,547 4,000,426 201,342,973Intangibles 21,162,145 102,068 21,264,213Vehicles, Equipment, & Furniture 157,060,176 10,331,496 (8,673,695) 158,717,977Land & Leasehold Improvements 53,180,734 7,772,909 (33,380) 60,920,263Infrastructure * 1,064,013,865 4,418,884 1,068,432,749Sewer Lines 11,749,467 11,749,467Sewer Plants 216,797 216,797
Totals at Historical Cost 1,679,754,571 51,453,456 (25,424,331) 1,705,783,696 Less Accumulated Depreciation For:
Buildings (85,464,956) (6,259,005) 0 (91,723,961)Intangibles (17,283,673) (1,820,041) 0 (19,103,714)Vehicles, Equipment, & Furniture (110,173,379) (11,000,988) 8,478,983 (112,695,384)Land & Leasehold Improvements (34,649,719) (3,559,347) 23,644 (38,185,422)Infrastructure (518,885,883) (34,654,045) 0 (553,539,928)Sewer Lines (1,964,918) (234,140) (2,199,058)Sewer Plants (24,170) (4,336) (28,506)
Total Accumulated Depreciation (768,446,698) (57,531,902) 8,502,627 (817,475,973)Governmental Activities Capital Assets, Net $911,307,873 ($6,078,446) ($16,921,704) $888,307,723
Beginning Ending Balance Increases Decreases Balance
Business-Type Activities:Nondepreciable Assets:
Land * $50,543,044 $279,831 $0 $50,822,875Construction in Progress 71,454,475 26,021,605 (63,947,927) 33,528,153Intangibles 908,663 100,000 1,008,663
Depreciable Assets:Buildings 120,817,519 127,425 0 120,944,944Intangibles 9,183,013 41,513 0 9,224,526Vehicles, Equipment & Furniture 41,224,597 3,664,641 (1,230,289) 43,658,949Land & Leasehold Improvements 42,950,767 367,320 0 43,318,087Infrastructure 22,430,210 954,019 (391,998) 22,992,231Sewer Lines 239,951,436 49,179,184 289,130,620Sewer Plants 291,670,500 12,668,975 304,339,475
Totals at Historical Cost 891,134,224 93,404,513 (65,570,214) 918,968,523Less Accumulated Depreciation For:Buildings (96,060,529) (3,530,187) 0 (99,590,716)Intangibles (7,140,383) (1,188,001) 0 (8,328,384)Vehicles, Equipment & Furniture (23,635,168) (2,961,766) 1,210,977 (25,385,957)Land & Leasehold Improvements (36,962,650) (481,092) 0 (37,443,742)Infrastructure (2,548,373) (472,680) (3,021,053)Sewer Lines (87,098,248) (5,439,450) (92,537,698)Sewer Plants (114,124,691) (6,880,973) (121,005,664)
Total Accumulated Depreciation (367,570,042) (20,954,147) 1,210,977 (387,313,213)Business-Type Activities Capital Assets, Net $523,564,182 $72,450,366 ($64,359,237) $531,655,310
* Restated beginning balance due to prior period adjustment
Primary Government
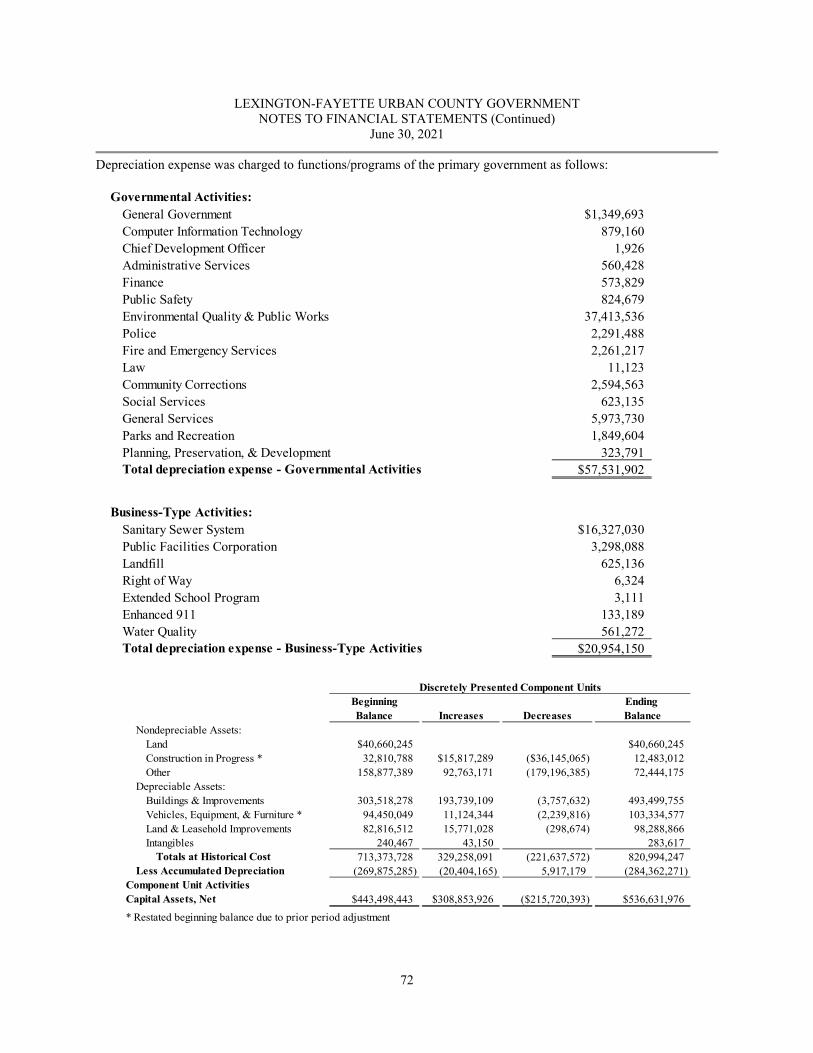
LEXINGTON-FAYETTE URBAN COUNTY GOVERNMENT NOTES TO FINANCIAL STATEMENTS (Continued)
June 30, 2021
72
Depreciation expense was charged to functions/programs of the primary government as follows:
Governmental Activities:General Government $1,349,693Computer Information Technology 879,160Chief Development Officer 1,926Administrative Services 560,428Finance 573,829Public Safety 824,679Environmental Quality & Public Works 37,413,536Police 2,291,488Fire and Emergency Services 2,261,217Law 11,123Community Corrections 2,594,563Social Services 623,135General Services 5,973,730Parks and Recreation 1,849,604Planning, Preservation, & Development 323,791Total depreciation expense - Governmental Activities $57,531,902
Business-Type Activities:Sanitary Sewer System $16,327,030Public Facilities Corporation 3,298,088Landfill 625,136Right of Way 6,324Extended School Program 3,111Enhanced 911 133,189Water Quality 561,272Total depreciation expense - Business-Type Activities $20,954,150
Beginning Ending Balance Increases Decreases Balance
Nondepreciable Assets:Land $40,660,245 $40,660,245Construction in Progress * 32,810,788 $15,817,289 ($36,145,065) 12,483,012Other 158,877,389 92,763,171 (179,196,385) 72,444,175
Depreciable Assets:Buildings & Improvements 303,518,278 193,739,109 (3,757,632) 493,499,755Vehicles, Equipment, & Furniture * 94,450,049 11,124,344 (2,239,816) 103,334,577Land & Leasehold Improvements 82,816,512 15,771,028 (298,674) 98,288,866Intangibles 240,467 43,150 283,617
Totals at Historical Cost 713,373,728 329,258,091 (221,637,572) 820,994,247Less Accumulated Depreciation (269,875,285) (20,404,165) 5,917,179 (284,362,271)
Component Unit ActivitiesCapital Assets, Net $443,498,443 $308,853,926 ($215,720,393) $536,631,976* Restated beginning balance due to prior period adjustment
Discretely Presented Component Units
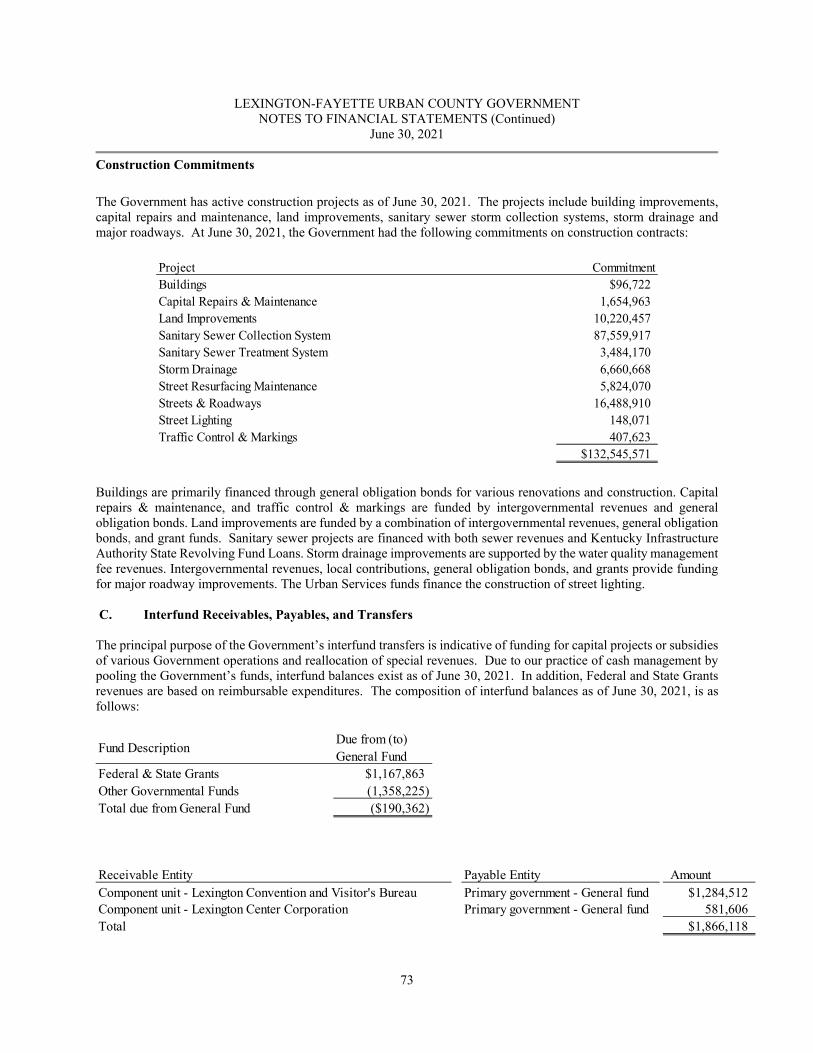
LEXINGTON-FAYETTE URBAN COUNTY GOVERNMENT NOTES TO FINANCIAL STATEMENTS (Continued)
June 30, 2021
73
Construction Commitments The Government has active construction projects as of June 30, 2021. The projects include building improvements, capital repairs and maintenance, land improvements, sanitary sewer storm collection systems, storm drainage and major roadways. At June 30, 2021, the Government had the following commitments on construction contracts:
Project CommitmentBuildings $96,722Capital Repairs & Maintenance 1,654,963Land Improvements 10,220,457Sanitary Sewer Collection System 87,559,917Sanitary Sewer Treatment System 3,484,170Storm Drainage 6,660,668Street Resurfacing Maintenance 5,824,070Streets & Roadways 16,488,910Street Lighting 148,071Traffic Control & Markings 407,623
$132,545,571
Buildings are primarily financed through general obligation bonds for various renovations and construction. Capital repairs & maintenance, and traffic control & markings are funded by intergovernmental revenues and general obligation bonds. Land improvements are funded by a combination of intergovernmental revenues, general obligation bonds, and grant funds. Sanitary sewer projects are financed with both sewer revenues and Kentucky Infrastructure Authority State Revolving Fund Loans. Storm drainage improvements are supported by the water quality management fee revenues. Intergovernmental revenues, local contributions, general obligation bonds, and grants provide funding for major roadway improvements. The Urban Services funds finance the construction of street lighting. C. Interfund Receivables, Payables, and Transfers The principal purpose of the Government’s interfund transfers is indicative of funding for capital projects or subsidies of various Government operations and reallocation of special revenues. Due to our practice of cash management by pooling the Government’s funds, interfund balances exist as of June 30, 2021. In addition, Federal and State Grants revenues are based on reimbursable expenditures. The composition of interfund balances as of June 30, 2021, is as follows:
Fund Description Due from (to) General Fund
Federal & State Grants $1,167,863Other Governmental Funds (1,358,225) Total due from General Fund ($190,362)
Receivable Entity Payable Entity AmountComponent unit - Lexington Convention and Visitor's Bureau Primary government - General fund $1,284,512Component unit - Lexington Center Corporation Primary government - General fund 581,606Total $1,866,118
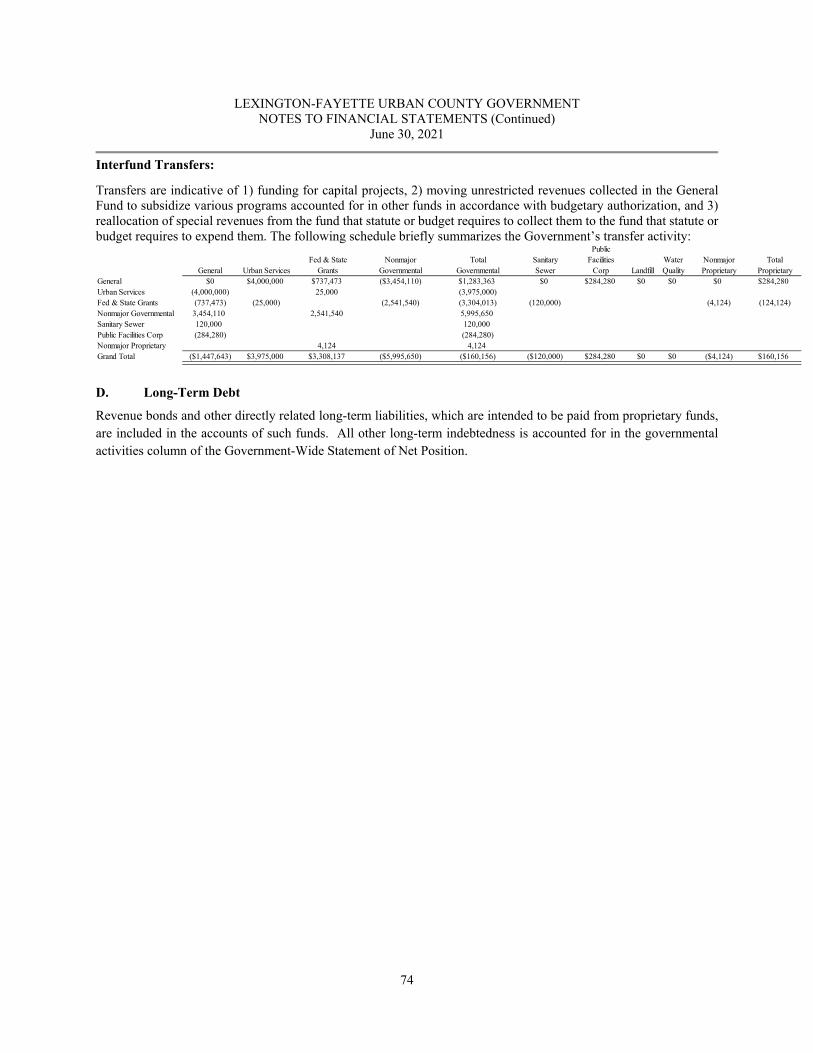
LEXINGTON-FAYETTE URBAN COUNTY GOVERNMENT NOTES TO FINANCIAL STATEMENTS (Continued)
June 30, 2021
74
Interfund Transfers:
Transfers are indicative of 1) funding for capital projects, 2) moving unrestricted revenues collected in the General Fund to subsidize various programs accounted for in other funds in accordance with budgetary authorization, and 3) reallocation of special revenues from the fund that statute or budget requires to collect them to the fund that statute or budget requires to expend them. The following schedule briefly summarizes the Government’s transfer activity:
PublicFed & State Nonmajor Total Sanitary Facilities Water Nonmajor Total
General Urban Services Grants Governmental Governmental Sewer Corp Landfill Quality Proprietary ProprietaryGeneral $0 $4,000,000 $737,473 ($3,454,110) $1,283,363 $0 $284,280 $0 $0 $0 $284,280Urban Services (4,000,000) 25,000 (3,975,000) Fed & State Grants (737,473) (25,000) (2,541,540) (3,304,013) (120,000) (4,124) (124,124)Nonmajor Governmental 3,454,110 2,541,540 5,995,650 Sanitary Sewer 120,000 120,000Public Facilities Corp (284,280) (284,280)Nonmajor Proprietary 4,124 4,124Grand Total ($1,447,643) $3,975,000 $3,308,137 ($5,995,650) ($160,156) ($120,000) $284,280 $0 $0 ($4,124) $160,156
D. Long-Term Debt Revenue bonds and other directly related long-term liabilities, which are intended to be paid from proprietary funds, are included in the accounts of such funds. All other long-term indebtedness is accounted for in the governmental activities column of the Government-Wide Statement of Net Position.
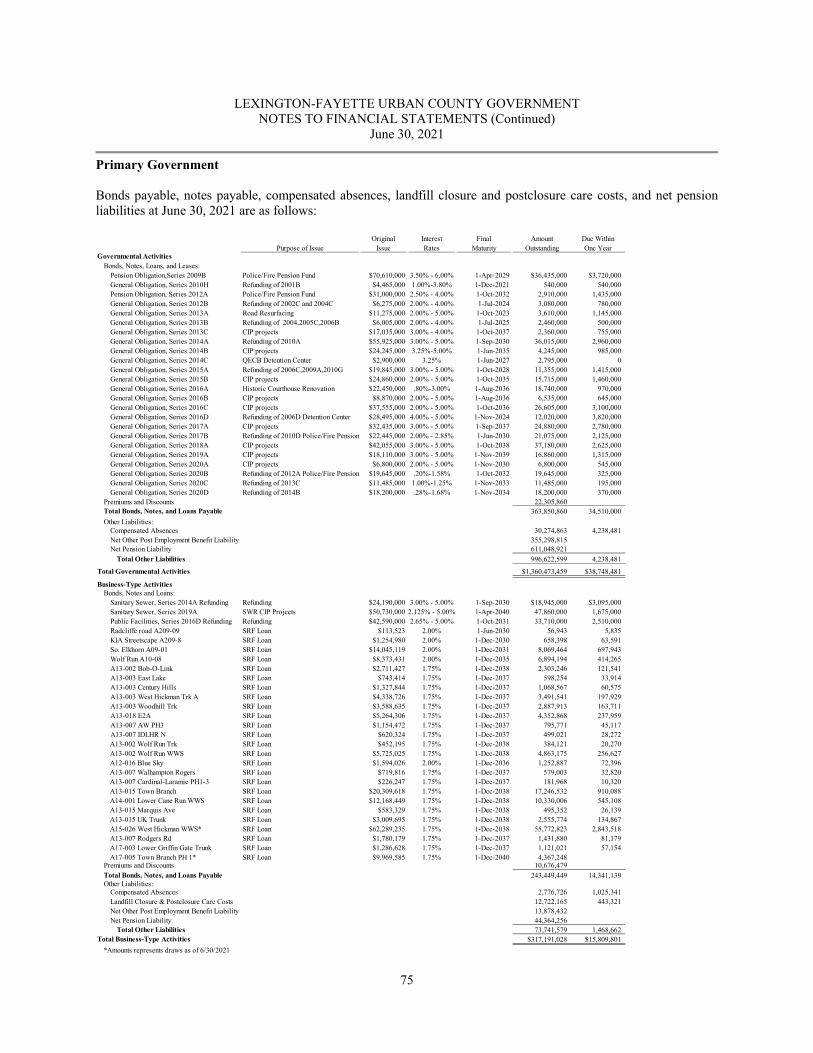
LEXINGTON-FAYETTE URBAN COUNTY GOVERNMENT NOTES TO FINANCIAL STATEMENTS (Continued)
June 30, 2021
75
Primary Government Bonds payable, notes payable, compensated absences, landfill closure and postclosure care costs, and net pension liabilities at June 30, 2021 are as follows:
Original Interest Final Amount Due WithinPurpose of Issue Issue Rates Maturity Outstanding One Year
Governmental ActivitiesBonds, Notes, Loans, and Leases:
Pension Obligation,Series 2009B Police/Fire Pension Fund $70,610,000 3.50% - 6.00% 1-Apr-2029 $36,435,000 $3,720,000General Obligation, Series 2010H Refunding of 2001B $4,465,000 1.00%-3.80% 1-Dec-2021 540,000 540,000Pension Obligation, Series 2012A Police/Fire Pension Fund $31,000,000 2.50% - 4.00% 1-Oct-2032 2,910,000 1,435,000General Obligation, Series 2012B Refunding of 2002C and 2004C $6,275,000 2.00% - 4.00% 1-Jul-2024 3,080,000 780,000General Obligation, Series 2013A Road Resurfacing $11,275,000 2.00% - 5.00% 1-Oct-2023 3,610,000 1,145,000General Obligation, Series 2013B Refunding of 2004,2005C,2006B $6,005,000 2.00% - 4.00% 1-Jul-2025 2,460,000 500,000General Obligation, Series 2013C CIP projects $17,035,000 3.00% - 4.00% 1-Oct-2037 2,360,000 755,000General Obligation, Series 2014A Refunding of 2010A $55,925,000 3.00% - 5.00% 1-Sep-2030 36,015,000 2,960,000General Obligation, Series 2014B CIP projects $24,245,000 3.25%-5.00% 1-Jan-2035 4,245,000 985,000General Obligation, Series 2014C QECB Detention Center $2,900,000 3.25% 1-Jun-2027 2,795,000 0General Obligation, Series 2015A Refunding of 2006C,2009A,2010G $19,845,000 3.00% - 5.00% 1-Oct-2028 11,355,000 1,415,000 General Obligation, Series 2015B CIP projects $24,860,000 2.00% - 5.00% 1-Oct-2035 15,715,000 1,460,000General Obligation, Series 2016A Historic Courthouse Renovation $22,450,000 .80%-3.00% 1-Aug-2036 18,740,000 970,000 General Obligation, Series 2016B CIP projects $8,870,000 2.00% - 5.00% 1-Aug-2036 6,535,000 645,000 General Obligation, Series 2016C CIP projects $37,555,000 2.00% - 5.00% 1-Oct-2036 26,605,000 3,100,000 General Obligation, Series 2016D Refunding of 2006D Detention Center $28,495,000 4.00% - 5.00% 1-Nov-2024 12,020,000 3,820,000 General Obligation, Series 2017A CIP projects $32,435,000 3.00% - 5.00% 1-Sep-2037 24,880,000 2,780,000 General Obligation, Series 2017B Refunding of 2010D Police/Fire Pension $22,445,000 2.00% - 2.85% 1-Jun-2030 21,075,000 2,125,000 General Obligation, Series 2018A CIP projects $42,055,000 3.00% - 5.00% 1-Oct-2038 37,180,000 2,625,000 General Obligation, Series 2019A CIP projects $18,110,000 3.00% - 5.00% 1-Nov-2039 16,860,000 1,315,000 General Obligation, Series 2020A CIP projects $6,800,000 2.00% - 5.00% 1-Nov-2030 6,800,000 545,000 General Obligation, Series 2020B Refunding of 2012A Police/Fire Pension $19,645,000 .20%-1.58% 1-Oct-2032 19,645,000 325,000 General Obligation, Series 2020C Refunding of 2013C $11,485,000 1.00%-1.25% 1-Nov-2033 11,485,000 195,000 General Obligation, Series 2020D Refunding of 2014B $18,200,000 .28%-1.68% 1-Nov-2034 18,200,000 370,000
Premiums and Discounts 22,305,860Total Bonds, Notes, and Loans Payable 363,850,860 34,510,000Other Liabilities:
Compensated Absences 30,274,863 4,238,481Net Other Post Employment Benefit Liability 355,298,815Net Pension Liability 611,048,921
Total Other Liabilities 996,622,599 4,238,481Total Governmental Activities $1,360,473,459 $38,748,481
Business-Type ActivitiesBonds, Notes and Loans:
Sanitary Sewer, Series 2014A Refunding Refunding $24,190,000 3.00% - 5.00% 1-Sep-2030 $18,945,000 $3,095,000Sanitary Sewer, Series 2019A SWR CIP Projects $50,730,000 2.125% - 5.00% 1-Apr-2040 47,860,000 1,675,000Public Facilities, Series 2016D Refunding Refunding $42,590,000 2.65% - 5.00% 1-Oct-2031 33,710,000 2,510,000Radcliffe road A209-09 SRF Loan $113,523 2.00% 1-Jun-2030 56,943 5,835KIA Streetscape A209-8 SRF Loan $1,254,980 2.00% 1-Dec-2030 658,398 63,591So. Elkhorn A09-01 SRF Loan $14,045,119 2.00% 1-Dec-2031 8,069,464 697,943Wolf Run A10-08 SRF Loan $8,373,431 2.00% 1-Dec-2035 6,894,194 414,265A13-002 Bob-O-Link SRF Loan $2,711,427 1.75% 1-Dec-2038 2,303,246 121,541A13-003 East Lake SRF Loan $743,414 1.75% 1-Dec-2037 598,254 33,914A13-003 Century Hills SRF Loan $1,327,844 1.75% 1-Dec-2037 1,068,567 60,575A13-003 West Hickman Trk A SRF Loan $4,338,726 1.75% 1-Dec-2037 3,491,541 197,929A13-003 Woodhill Trk SRF Loan $3,588,635 1.75% 1-Dec-2037 2,887,913 163,711A13-018 E2A SRF Loan $5,264,306 1.75% 1-Dec-2037 4,352,868 237,959A13-007 AW PH3 SRF Loan $1,154,472 1.75% 1-Dec-2037 795,771 45,117A13-007 IDLHR N SRF Loan $620,324 1.75% 1-Dec-2037 499,021 28,272
A13-002 Wolf Run Trk SRF Loan $452,195 1.75% 1-Dec-2038 384,121 20,270 A13-002 Wolf Run WWS SRF Loan $5,725,025 1.75% 1-Dec-2038 4,863,175 256,627 A12-016 Blue Sky SRF Loan $1,594,026 2.00% 1-Dec-2036 1,252,887 72,396 A13-007 Walhampton Rogers SRF Loan $719,816 1.75% 1-Dec-2037 579,003 32,820 A13-007 Cardinal-Laramie PH1-3 SRF Loan $226,247 1.75% 1-Dec-2037 181,968 10,320 A13-015 Town Branch SRF Loan $20,309,618 1.75% 1-Dec-2038 17,246,532 910,088 A14-001 Lower Cane Run WWS SRF Loan $12,168,449 1.75% 1-Dec-2038 10,330,006 545,108 A13-015 Marquis Ave SRF Loan $583,329 1.75% 1-Dec-2038 495,352 26,139 A13-015 UK Trunk SRF Loan $3,009,695 1.75% 1-Dec-2038 2,555,774 134,867 A15-026 West Hickman WWS* SRF Loan $62,289,235 1.75% 1-Dec-2038 55,772,823 2,843,518 A13-007 Rodgers Rd SRF Loan $1,780,179 1.75% 1-Dec-2037 1,431,880 81,179 A17-003 Lower Griffin Gate Trunk SRF Loan $1,286,628 1.75% 1-Dec-2037 1,121,021 57,154 A17-005 Town Branch PH 1* SRF Loan $9,969,585 1.75% 1-Dec-2040 4,367,248
Premiums and Discounts 10,676,479Total Bonds, Notes, and Loans Payable 243,449,449 14,341,139Other Liabilities:
Compensated Absences 2,776,726 1,025,341Landfill Closure & Postclosure Care Costs 12,722,165 443,321Net Other Post Employment Benefit Liability 13,878,432Net Pension Liability 44,364,256
Total Other Liabilities 73,741,579 1,468,662Total Business-Type Activities $317,191,028 $15,809,801
*Amounts represents draws as of 6/30/2021
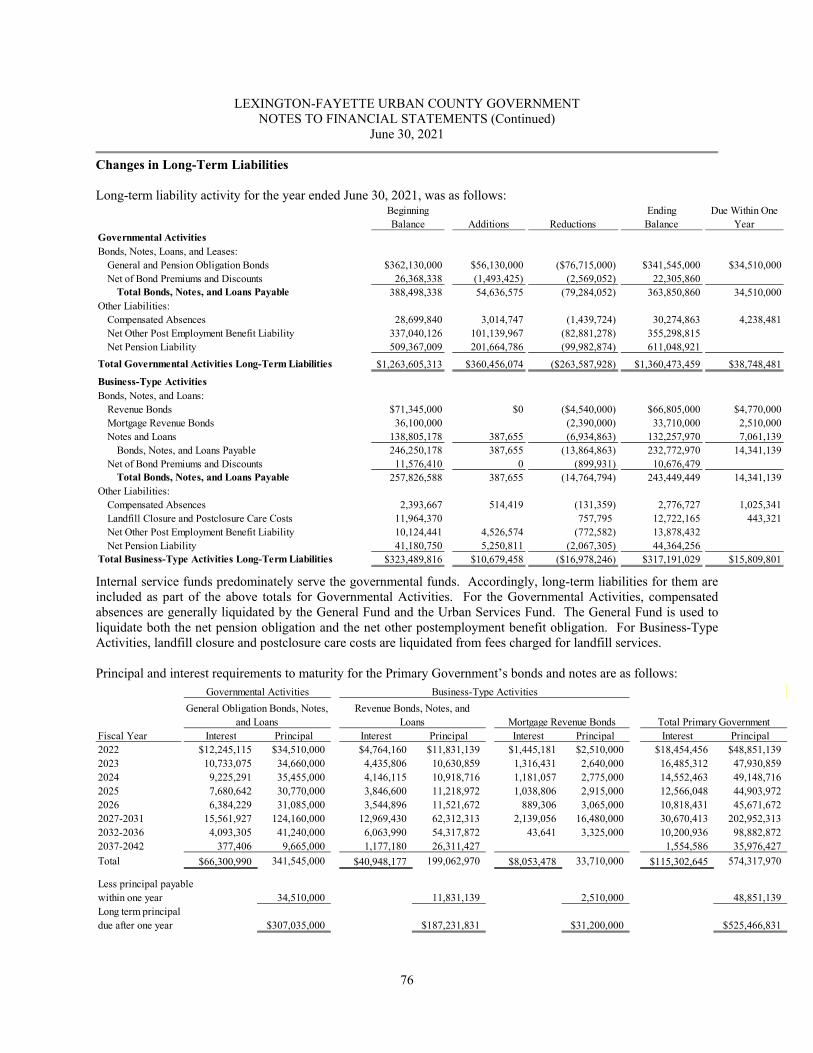
LEXINGTON-FAYETTE URBAN COUNTY GOVERNMENT NOTES TO FINANCIAL STATEMENTS (Continued)
June 30, 2021
76
Changes in Long-Term Liabilities Long-term liability activity for the year ended June 30, 2021, was as follows:
Beginning Balance Additions Reductions
EndingBalance
Due Within One Year
Governmental ActivitiesBonds, Notes, Loans, and Leases:
General and Pension Obligation Bonds $362,130,000 $56,130,000 ($76,715,000) $341,545,000 $34,510,000Net of Bond Premiums and Discounts 26,368,338 (1,493,425) (2,569,052) 22,305,860
Total Bonds, Notes, and Loans Payable 388,498,338 54,636,575 (79,284,052) 363,850,860 34,510,000Other Liabilities:
Compensated Absences 28,699,840 3,014,747 (1,439,724) 30,274,863 4,238,481Net Other Post Employment Benefit Liability 337,040,126 101,139,967 (82,881,278) 355,298,815Net Pension Liability 509,367,009 201,664,786 (99,982,874) 611,048,921
Total Governmental Activities Long-Term Liabilities $1,263,605,313 $360,456,074 ($263,587,928) $1,360,473,459 $38,748,481Business-Type ActivitiesBonds, Notes, and Loans:
Revenue Bonds $71,345,000 $0 ($4,540,000) $66,805,000 $4,770,000Mortgage Revenue Bonds 36,100,000 (2,390,000) 33,710,000 2,510,000Notes and Loans 138,805,178 387,655 (6,934,863) 132,257,970 7,061,139
Bonds, Notes, and Loans Payable 246,250,178 387,655 (13,864,863) 232,772,970 14,341,139Net of Bond Premiums and Discounts 11,576,410 0 (899,931) 10,676,479
Total Bonds, Notes, and Loans Payable 257,826,588 387,655 (14,764,794) 243,449,449 14,341,139Other Liabilities:
Compensated Absences 2,393,667 514,419 (131,359) 2,776,727 1,025,341Landfill Closure and Postclosure Care Costs 11,964,370 757,795 12,722,165 443,321Net Other Post Employment Benefit Liability 10,124,441 4,526,574 (772,582) 13,878,432Net Pension Liability 41,180,750 5,250,811 (2,067,305) 44,364,256
Total Business-Type Activities Long-Term Liabilities $323,489,816 $10,679,458 ($16,978,246) $317,191,029 $15,809,801
Internal service funds predominately serve the governmental funds. Accordingly, long-term liabilities for them are included as part of the above totals for Governmental Activities. For the Governmental Activities, compensated absences are generally liquidated by the General Fund and the Urban Services Fund. The General Fund is used to liquidate both the net pension obligation and the net other postemployment benefit obligation. For Business-Type Activities, landfill closure and postclosure care costs are liquidated from fees charged for landfill services. Principal and interest requirements to maturity for the Primary Government’s bonds and notes are as follows:
Fiscal Year Interest Principal Interest Principal Interest Principal Interest Principal2022 $12,245,115 $34,510,000 $4,764,160 $11,831,139 $1,445,181 $2,510,000 $18,454,456 $48,851,1392023 10,733,075 34,660,000 4,435,806 10,630,859 1,316,431 2,640,000 16,485,312 47,930,8592024 9,225,291 35,455,000 4,146,115 10,918,716 1,181,057 2,775,000 14,552,463 49,148,7162025 7,680,642 30,770,000 3,846,600 11,218,972 1,038,806 2,915,000 12,566,048 44,903,9722026 6,384,229 31,085,000 3,544,896 11,521,672 889,306 3,065,000 10,818,431 45,671,6722027-2031 15,561,927 124,160,000 12,969,430 62,312,313 2,139,056 16,480,000 30,670,413 202,952,3132032-2036 4,093,305 41,240,000 6,063,990 54,317,872 43,641 3,325,000 10,200,936 98,882,8722037-2042 377,406 9,665,000 1,177,180 26,311,427 1,554,586 35,976,427Total $66,300,990 341,545,000 $40,948,177 199,062,970 $8,053,478 33,710,000 $115,302,645 574,317,970
Less principal payable within one year 34,510,000 11,831,139 2,510,000 48,851,139Long term principaldue after one year $307,035,000 $187,231,831 $31,200,000 $525,466,831
Total Primary Government
Governmental Activities Business-Type ActivitiesGeneral Obligation Bonds, Notes,
and LoansRevenue Bonds, Notes, and
Loans Mortgage Revenue Bonds
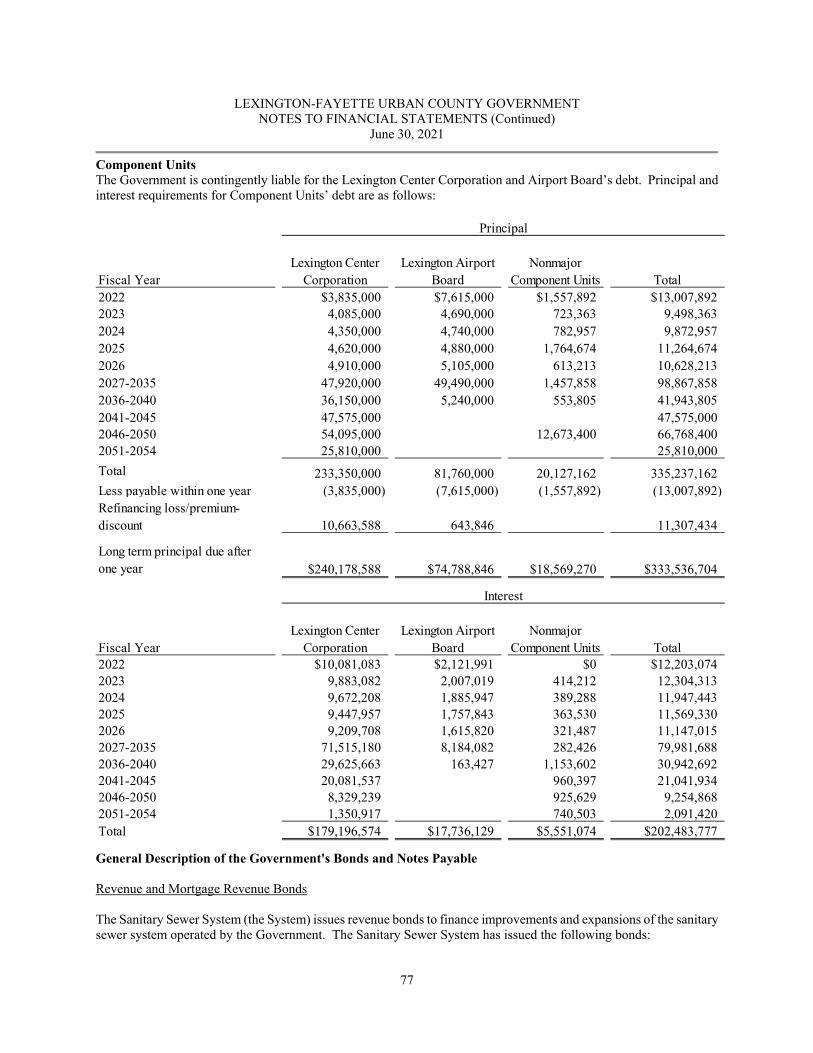
LEXINGTON-FAYETTE URBAN COUNTY GOVERNMENT NOTES TO FINANCIAL STATEMENTS (Continued)
June 30, 2021
77
Component Units The Government is contingently liable for the Lexington Center Corporation and Airport Board’s debt. Principal and interest requirements for Component Units’ debt are as follows:
Fiscal YearLexington Center
CorporationLexington Airport
BoardNonmajor
Component Units Total2022 $3,835,000 $7,615,000 $1,557,892 $13,007,8922023 4,085,000 4,690,000 723,363 9,498,3632024 4,350,000 4,740,000 782,957 9,872,9572025 4,620,000 4,880,000 1,764,674 11,264,6742026 4,910,000 5,105,000 613,213 10,628,2132027-2035 47,920,000 49,490,000 1,457,858 98,867,8582036-2040 36,150,000 5,240,000 553,805 41,943,8052041-2045 47,575,000 47,575,0002046-2050 54,095,000 12,673,400 66,768,4002051-2054 25,810,000 25,810,000Total 233,350,000 81,760,000 20,127,162 335,237,162Less payable within one year (3,835,000) (7,615,000) (1,557,892) (13,007,892)Refinancing loss/premium-discount 10,663,588 643,846 11,307,434
Long term principal due after one year $240,178,588 $74,788,846 $18,569,270 $333,536,704
Principal
Fiscal YearLexington Center
CorporationLexington Airport
BoardNonmajor
Component Units Total2022 $10,081,083 $2,121,991 $0 $12,203,0742023 9,883,082 2,007,019 414,212 12,304,3132024 9,672,208 1,885,947 389,288 11,947,4432025 9,447,957 1,757,843 363,530 11,569,3302026 9,209,708 1,615,820 321,487 11,147,0152027-2035 71,515,180 8,184,082 282,426 79,981,6882036-2040 29,625,663 163,427 1,153,602 30,942,6922041-2045 20,081,537 960,397 21,041,9342046-2050 8,329,239 925,629 9,254,8682051-2054 1,350,917 740,503 2,091,420Total $179,196,574 $17,736,129 $5,551,074 $202,483,777
Interest
General Description of the Government's Bonds and Notes Payable Revenue and Mortgage Revenue Bonds The Sanitary Sewer System (the System) issues revenue bonds to finance improvements and expansions of the sanitary sewer system operated by the Government. The Sanitary Sewer System has issued the following bonds:
LEXINGTON-FAYETTE URBAN COUNTY GOVERNMENT NOTES TO FINANCIAL STATEMENTS (Continued)
June 30, 2021
78
1. $24,190,000 of Tax-Exempt Sewer System Revenue Refunding Bonds, Series 2014A, issued at a premium, and payable annually in principal installments ranging from $500,000 to $3,095,000 plus interest over 13 years, to fully refund the Sewer System Revenue Bonds, Series 2009A, (Taxable Build America Bonds). The refunding provided for a cumulative savings of $1,119,864 over the life of the bonds and a net present value savings of $1,317,979 or 4.35% including the escrow of the partial BAB subsidy from the Sewer System Revenue Bonds, Series 2009A.
2. $55,306,428 of Sewer System Revenue Bonds, Series 2019A, issued at a premium and payable annually in principal installments ranging from $1,275,000 to 3,320,000 plus interest over 20 years for the purpose of financing various improvements to the Sanitary Sewer System mandated by the consent decree agreement with the Environmental Protection Agency.
In fiscal year 2014, the Government defeased all of the outstanding debt under its prior Sewer indenture. The new indenture provides that the gross income and revenues of the System first be used to pay operating and maintenance expenses of the System. Net Revenues of the System are then deposited into the Bond Account, which is held by the Trustee, and are to be disbursed as follows: Each month, 1/6 of the next interest payment to the Interest Subaccount and 1/12 of the next principal payment
to the Principal Subaccount. If necessary, deposit to the Bond Reserve Account. Indenture is structured so that the requirement of reserve is
applied on a series specific basis. Payment of any prior deficiencies in regards to the Interest Subaccount, Principal Subaccount, and Bond Reserve
Account. If necessary, payment of administrative fees associated with the outstanding bonds. Deposit to the Rebate Fund. Payment of debt service of other debt obligations related to the Sewer System. Deposit to the Rate Stabilization Fund. Deposit to the Surplus Account. Funds can be requested by LFUCG from the Surplus Account for Operating and Maintenance or capital projects. The Indenture also outlines parity provisions for the issuance of additional bonds for the acquisition or construction of sewer system facilities. The Net Revenues of the System, as defined in the bond ordinance, must provide coverage of 120% of Maximum Annual Debt Service. The Public Facilities Corporation (PFC) was created by the Government to act as the agency and instrumentality of the Government in acquiring, developing and financing public improvements and public projects. The PFC financed various projects through bank and mortgage notes and the issuance of revenue bonds. The debt is collateralized by the properties, a pledge of specified Government revenues and lease payments from the Government sufficient to retire the debt and to provide for the operation and maintenance of the facilities. The Government entered into various contracts, leases, and option agreements with the PFC. These agreements provide that the PFC receives title to the properties mortgaged as security for the revenue bond issues, the proceeds of which have been used to finance the acquisition, construction, and improvements to the properties. Upon payment of the outstanding bonds, title to the properties will be conveyed to the Government. The lease agreements are renewable annually and the likelihood of the leases not being renewed is remote. The PFC issued $42,590,000 Mortgage Revenue Refunding Bonds, Series 2016D, to refund $48,910,000 total principal remaining on Series 2006 bonds, issued at a premium and payable annually in principal installments ranging from $981,387 to $3,961,556 plus interest over 16 years. The refunding provided a cumulative savings of $7,984,977 over the life of the bonds resulting in a net present value savings of $6,804,749 or 13.91% of the refunded principal.
LEXINGTON-FAYETTE URBAN COUNTY GOVERNMENT NOTES TO FINANCIAL STATEMENTS (Continued)
June 30, 2021
79
Kentucky Infrastructure Authority (KIA) State Revolving Fund (SRF) Loans SRF Loans are loans that are issued by the Commonwealth of Kentucky for infrastructure improvements. These loans are 20 year loans with a 2% interest rate. The Government has received the following KIA SRF Loans. 1. KIA Loan A209-09 Radcliffe Road issued in the amount of $113,523, payable annually in principal installments
ranging from $1,837 to $3,438 plus interest over 20 years. Financing improvements to the storm water system along Radcliffe Road in Fayette County.
2. KIA Loan A209-08 Streetscape issued in the amount of $1,254,980, payable annually in principal installments
ranging from $25,671 to $37,843 plus interest over 20 years. Financing improvements to the storm water system in the city center of Lexington. These funds were used in conjunction with the streetscape project that included upgrades to the sidewalks, sewer and storm water systems. This capital project included South Limestone, East and West Main Street, and Vine Street.
3. KIA Loan A09-01 South Elkhorn Pump station issued in the amount of $14,045,119, payable annually in
principal installments ranging from $281,600 to $423,692 plus interest over 20 years. Financing the upgrade of the South Elkhorn pump station and construction of a new 36-inch force main. The Capital Replacement Reserve Fund requirement is $43,020 annually for 10 years.
4. KIA Loan A10-08 Wolf Run Pump station issued in the amount of $10,500,000, payable annually in principal
installments ranging from $375,028 to $536,379 plus interest over 20 years for the upgrade and expansion of the Wolf Run pump station. The Capital Replacement Reserve Fund requirement is $26,250 annually for 10 years.
5. KIA Loan A13-002 issued in the amount of $8,888,648, payable annually in principal installments ranging from
$184,181 to $259,589 for the upgrades to the Bob-O-Link Trunk Line, Wolf Run Trunk Line and the Wolf Run Storage Tank Capacity Upgrade. The Capital Replacement Reserve Fund requirement is $35,000 annually for 10 years.
6. KIA Loan A13-003 issued in the amount of $9,997,196, payable annually in principal installments ranging from
$205,263 to $582,140 plus interest over 20 years for the upgrades to the Eastlake Trunk Line, Century Hills Trunk Line, West Hickman Trunk Line and the Woodhill Trunk Line. The Capital Replacement Reserve Fund requirement is $25,000 annually for 10 years.
7. KIA Loan A13-007 issued in the amount of $4,298,547, payable annually in principal installments ranging from
$91,001 to $252,328 plus interest over 20 years for the upgrades to the Storm Water Systems of Anniston Wickland, Idlehour, Walhamption Rogers, and Perimeter Park Neighborhoods. The Capital Replacement Reserve Fund requirement is $12,000 annually for 10 years.
8. KIA Loan A13-18 issued in the amount of $5,264,306, payable annually in principal installments ranging from
$110,486 to $306,355 plus interest over 20 years for the upgrades to the Expansion Area 2A Wastewater System. The Capital Replacement Reserve Fund requirement is $15,000 annually for 10 years.
9. KIA Loan A12-16 issued in the amount of $1,594,025, payable annually in principal installments ranging from
$32,606 to $48,066 for the acquisition and conversion to a pump station of the Blue Sky Wastewater Treatment plant. The Capital Replacement Reserve Fund requirement is $4,825 annually for 10 years.
10. KIA Loan A13-15 issued in the amount of $31,801,000, payable annually in principal installments ranging from
$501,433 to $704,322 for design and construction of Phase 1 of a multi-phase waste water storage facility at the Town Branch Wastewater Treatment Facility, upgrades to Marquis Avenue, and the UK Trunk Line. The Capital Replacement Reserve Fund requirement is $80,000 annually for 10 years.
LEXINGTON-FAYETTE URBAN COUNTY GOVERNMENT NOTES TO FINANCIAL STATEMENTS (Continued)
June 30, 2021
80
11. KIA Loan A14-001 issued in the amount of $12,134,178, payable annually in principal installments ranging from $252,567 to $357,777 for design and construction of Phase 1 of a multi-phase waste water storage facility at the Lower Cane Run Pump Station. The Capital Replacement Reserve Fund requirement is $50,000 annually for 10 years.
12. KIA Loan A15-026 issued in the amount of $67,944,188 for design and construction of Phase 1 of a multi-phase
waste water storage facility at the West Hickman Waste Water Treatment Plant. As of June 30, 2021 the Government has received only a partial draw of $62,289,235 with the remaining balance of $5,654,953 to be requested in future years. Until the remaining balance is requested, the Kentucky Infrastructure Authority does not issue an amortization schedule for the loan, nor does the Government initiate payment of principal toward the loan. Amortization estimation has been used based on information outlined in the Assistance Agreement between KIA and the Government. The Capital Replacement Reserve Fund requirement is $170,000 annually for 10 years.
13. KIA Loan A17-003 issued in the amount of $1,286,628, payable annually in principal installments ranging from
$27,003 to $37,929 for the replacement of 4,700 linear feet of gravity sewer pipes. The Capital Replacement Reserve Fund requirement is $5,900 annually for 10 years.
14. KIA Loan A17-005 issued in the amount of $9,969,585 for the replacement of 5,600 linear feet of 12 inch sewer
pipes with 21 inch sewer pipes. Additionally a source water pump and a Bio-swale for surface water treatment from paved areas will be installed As of June 30, 2021 the Government has received only a partial draw of $4,367,248 with the remaining balance of $5,602,337 to be requested in future years. Until the remaining balance is requested, the Kentucky Infrastructure Authority does not issue an amortization schedule for the loan, nor does the Government initiate payment of principal toward the loan. Amortization estimation has been used based on information outlined in the Assistance Agreement between KIA and the Government. The Capital Replacement Reserve Fund Requirement is $25,000 annually for 10 years.
General Obligation Bonds and Notes The Government issues General Obligation bonds and notes to provide funds for the acquisition and construction of capital assets used by Governmental Activities. The Government has issued the following general obligation bonds and notes:
1. $70,610,000, Series 2009B, Taxable General Obligation Pension Funding Bonds, issued at a discount and
payable annually in principal installments ranging from $2,315,000 to $5,515,000 plus interest over 20 years, to finance additional contributions to the Policemen's and Firefighters' Retirement Plan.
2. $6,635,000, Series 2010C, General Obligation Refunding Bonds, for refunding the Series 2000E General
Obligation Bonds. Issued at a discount and payable annually in principal installments ranging from $60,000 to $675,000 plus interest over 12 years. The refunding provided for a cumulative savings of $675,874 over the life of the bonds resulting in net present value savings of $593,504 or 8.95% of the refunded principal.
3. $35,825,000, Series 2010D, Taxable General Obligation Pension Funding Bonds issued at a discount and
payable annually in principal installments ranging from $1,195,000 to $2,700,000 plus interest over 20 years, to finance additional contributions to the Policemen’s and Firefighters’ Retirement Plan. Of the outstanding balance $22,445,000 was refunded through the issuance of Series 2017B, leaving a remaining balance of $6,480,000.
4. $4,465,000, Series 2010H, General Obligation Refunding Bonds, for refunding a portion of the General
Obligation Bond Series 2001B. Issued at a discount and payable in annual principal payments ranging from $30,000 to $540,000 plus interest over 12 years. The refunding provided for a cumulative savings of $150,459 over the life of the bonds resulting in a net present value savings of $126,407 or 3.03% of the refunded principal.
LEXINGTON-FAYETTE URBAN COUNTY GOVERNMENT NOTES TO FINANCIAL STATEMENTS (Continued)
June 30, 2021
81
5. $31,000,000, Series 2012A, Taxable General Obligation Pension Funding Bonds, issued at a premium and payable annually in principal installments ranging from $1,170,000 to $2,110,000 plus interest over 20 years, to finance additional contributions to the Policemen’s and Firefighters’ Retirement Plan. Of the outstanding balance $19,645,000 was refunded through the issuance of Series 2020B, leaving a remaining balance of $4,300,000.
6. $6,275,000, Series 2012B, General Obligation Refunding Bonds, for refunding a portion of the General
Obligation Bond Series 2002C and the General Obligation Bond Series 2004C. Issued at a discount and payable in annual principal payments ranging from $20,000 to $825,000 plus interest over 12 years. The refunding provided for a cumulative savings of $597,633 over the life of the bonds resulting in net present value savings of $545,403 or 8.76% of the refunded principal.
7. $11,275,000, Series 2013A, Various Purpose General Obligation Bonds to finance various street and highway
improvements including the rehabilitation and paving of existing roads and streets throughout Lexington, Fayette County, Kentucky. Issued at a premium and payable in annual principal payments ranging from $845,000 to $1,265,000 plus interest over 10 years.
8. $6,005,000, Series 2013B, Various Purpose General Obligation Refunding Bonds, for refunding a portion of the
General Obligation Bond Series 2004C, General Obligation Bond Series 2005C and General Obligation Bond Series 2006B. Issued at a premium and payable annually in principal installments ranging from $40,000 to $925,000 plus interest over 13 years. The refunding provided for a cumulative savings of $402,579 over the life of the bonds resulting in net present value savings of $293,222 or 5.10% of the refunded principal.
9. $17,035,000, Series 2013C, Various Purpose General Obligation Bonds to finance various projects for
Departments within the Government, including but not limited to communications and computer equipment and other equipment, traffic engineering equipment, police and fire equipment, police and fire vehicles, and golf carts, remodeling and renovation of public safety buildings, Kentucky Theatre renovations, maintenance building, fire stations, street and sidewalk improvements, various park projects and improvements, HVAC system maintenance, and weather and emergency systems upgrades. Issued at a premium and payable in principal installments ranging from $595,000 to $1,195,000 plus interest over 20 years. Of the outstanding balance $11,485,000 was refunded through the issuance of Series 2020C, leaving a remaining balance of $3,085,000
10. $55,925,000, Series 2014A, Various Purpose General Obligation Refunding Bonds, for refunding the General
Obligation Bond Series 2010A Build America Bonds. Issued at a premium and payable annually in principal installments ranging from $2,325,000 to $4,220,000 plus interest over 17 years. The refunding provided for a cumulative savings of $2,214,916 over the life of the bonds resulting in net present value savings of $2,437,443 or 4.35% of the refunded principal.
11. $24,245,000 Series 2014B, Various Purpose General Obligation Bonds to finance various projects for
Departments within the Government, including but not limited to financing managed email solution/exchange, storage area network, new tax revenue system, procurement website upgrade, Accela software, network infrastructure remediation, police patrol transport wagon, general repairs, life safety, autos vehicle replacement, pothole patcher, public safety ops/Lexcall center, sidewalk and catch basin repair, sidewalks, jail management system, public safety radio system, roof repair and replacement, HVAC repair and replacement, infrastructure improvements, Shillito multipurpose sports fields, Carver Center improvements, dugout replacement, aquatics improvements, Kentucky Theatre concession renovation, fire training tower, land acquisition and fire station design #24 and relocation of fire station #2, providing funding for a program to preserve and manage agricultural, rural and natural lands, including the purchase of conservation easements or development rights, and construction of a new senior center. Issued at a premium and payable in annual principal payments ranging from $690,000 to $1,830,000 plus interest over 20 years. Of the outstanding balance $18,200,000 was refunded through the issuance of Series 2020C, leaving a remaining balance of $5,185,000
LEXINGTON-FAYETTE URBAN COUNTY GOVERNMENT NOTES TO FINANCIAL STATEMENTS (Continued)
June 30, 2021
82
12. $2,900,000 Series 2014C, Energy Conservation General Obligation Bonds-Federally Taxable Qualified Energy Conservation Bonds to finance energy conservation measures and other qualifying projects at the Fayette County Detention Center including, but not limited to, LED lighting retrofits, chiller plant optimization, intake HVAC retrofit, inner ring HVAC retrofits, constant-volume reheat fan reset, controls upgrade, demand controlled ventilation, Variable-Air-Volume (VAV) box occupancy controls, energy efficient motors, demand controlled ventilation, kitchen hoods, and installation of new walk-in refrigeration. Issued at par with annual sinking fund payments of $196,441 and a 70% interest subsidy with a final maturity of 12 years. In March of 2018, $105,000 in unused proceeds were redeemed in an extraordinary call per IRS guidelines. The new par amount is $2,795,000.
13. $19,845,000, Series 2015A, Various Purpose General Obligation Refunding Bonds, for refunding a portion of
the General Obligation Bond Series 2006C, General Obligation Bond Series 2009A and full refunding of Series 2010G, Various Purpose General Obligation Public Projects Recovery Zone Economic Development Bonds. Issued at a premium and payable annually in principal installments ranging from $1,080,000 to $2,985,000 plus interest over 14 years. The refunding provided for a cumulative savings of $1,118,502 over the life of the bonds resulting in net present value savings of $849,671 or 4.28% of the refunded principal.
14. $24,860,000 Series 2015B, Various Purpose General Obligation Bonds to finance various projects for
Departments within the Government, including but not limited to financing an ERP software upgrade, new Budgeting system, procurement website upgrade, general repairs, life safety, autos vehicle replacement, roof repair and replacement, HVAC repair and replacement, neighborhood paving, infrastructure improvements, parks improvements and upgrades providing funding for a program to preserve and manage agricultural, rural and natural lands, including the purchase of conservation easements or development rights, and additional funding for the Emergency Operations Center. Issued at a premium and payable in annual principal payments ranging from $495,000 to $2,015,000 plus interest over 20 years.
15. $22,450,000 Series 2016A, Taxable General Obligation Bonds to finance the restoration and rehabilitation of
the historic Fayette County Courthouse (the “Historic Courthouse Project”) located at 215 West Main Street in downtown Lexington, Fayette County, Kentucky which Historic Courthouse Project will help preserve the history and architecture of Lexington-Fayette County, enhance the economic development of downtown Lexington, assist in elimination of blight, and reinforce and promote additional redevelopment activities in downtown Lexington-Fayette County. Issued at Par and payable in annual principal payments ranging from $910,000 to $1,435,000 plus interest over 20 years.
16. $8,870,000 Series 2016B, Various Purpose General Obligation Bonds to finance various projects for Departments within the Government, including but not limited to: financing the design and infrastructure improvements for Town Branch Commons Corridor (TBCC), an innovative multimodal greenway that will link two regional trail systems, the Legacy Trail and Town Branch Trail, and through its unique linear park-like design and stormwater management systems, TBCC will create a livable, sustainable streetscape in downtown Lexington and will connect established and emerging neighborhoods to each other, downtown, and adjacent higher education (collectively, the "Town Branch Commons Corridor Project"); streetscape and sidewalk improvements located in the Versailles Road area; and street improvements including widening, opening, extending, realigning, grading, repaving, resurfacing, and otherwise rehabilitating and improving streets, roads, thoroughfares, avenues, and expressways throughout Lexington-Fayette County. Issued at a premium and payable in annual principal payments ranging from $190,000 to $815,000 plus interest over 20 years.
17. $37,555,000 Series 2016C, Various Purpose General Obligation Bonds financing the acquisition of various projects for departments within the Lexington-Fayette Urban County Government, including, but not limited to, (i) the construction, installation and equipping of a new fire station, software system upgrades, safety operations and other safety related projects, road resurfacing, road maintenance, road upgrades, streetscapes and sidewalk improvements, renovations, repairs and upgrades related to public buildings, renovations, repairs and upgrades related to park projects, and providing financial assistance to Lexington Center Corporation for the expansion
LEXINGTON-FAYETTE URBAN COUNTY GOVERNMENT NOTES TO FINANCIAL STATEMENTS (Continued)
June 30, 2021
83
and replacement of the Lexington Convention Center, and (ii) providing funding for a program to preserve and manage agricultural, rural and natural lands, including the purchase of conservation easements or development rights. Issued at a premium and payable in annual principal payments ranging from $975,000 to $3,100,000 plus interest over 20 years.
18. $28,495,000 Series 2016D, Various Purpose General Obligation Refunding Bonds to finance the refunding of
the 2006D Detention Center Refunding Bond. Issued at a premium and payable in annual principal payments ranging from $2,920,000 to $4,180,000 plus interest over 8 years. The refunding provided for a cumulative savings of $3,942,183 over the life of the bonds resulting in net present value savings of $3,742,315 or 11.47% of the refunded principal.
19. $32,435,000 Series 2017A, Various Purpose General Obligation Bonds financing the acquisition of various
projects for departments within the Lexington-Fayette Urban County Government, including, but not limited to, (i) the construction, installation, renovations, repairs and upgrades and equipping of fire stations, software system upgrades, safety operations and other safety related projects, new firetrucks, new police equipment, new police cars, road resurfacing, road maintenance, road upgrades, streetscapes and sidewalk improvements, renovations, repairs and upgrades related to public buildings, renovations, repairs and upgrades related to park projects, and various other improvements within departments of the Lexington-Fayette Urban County Government, (ii) providing funding for a program to preserve and manage agricultural, rural and natural lands, including the purchase of conservation easements or development rights. Issued at a premium and payable in annual principal payments ranging from $585,000 to $2,925,000 plus interest over 20 years.
20. $22,445,000 Series 2017B Taxable General Obligation Pension Funding Refunding Bonds issued to finance the
refunding of a portion of the 2010D Lexington-Fayette Urban County Government Taxable General Obligation Pension Funding Bonds. Issued at a premium and payable in annual principal payments ranging from $295,000 to $2,595,000 plus interest over 13 years. The refunding provided for a cumulative savings of $ 1,963,714 over the life of the bonds resulting in net present value savings of $1,964,340 or 9.82% of the refunded principal.
21. $42,055,000 Series 2018A Various Purpose General Obligation Bonds financing the acquisition of various
projects for departments within the Lexington-Fayette Urban County Government, including but not limited to software system upgrades, safety operations and other safety related projects, new firetrucks, new police cars, road resurfacing, road maintenance, streetscapes and sidewalk improvements, renovations and upgrades related to public buildings, fleet vehicle replacement, and upgrades related to park projects, and various other improvements within departments of the Lexington-Fayette Urban County Government, and (ii) providing funding for renovations to the Lexington Convention Center. Issued at a premium and payable in annual principal payments ranging from $1,060,000 to $3,595,000 plus interest over 20 years.
22. $18,110,000 Series 2019A Various Purpose General Obligation Bonds financing repairs and upgrades and
equipping of fire stations, safety operations, new firetrucks and other fire safety related projects, new police equipment, new police cars, road resurfacing, road maintenance, road upgrades, streetscapes and sidewalk improvements, pedestrian safety improvements, renovations, repairs and upgrades related to public buildings, new voting machines, public art funding and various other improvements within departments of the Lexington-Fayette Urban County Government. Issued at a premium and payable in annual principal payments ranging from $210,000 to $1,900,000 plus interest over 20 years.
23. 6,800,000 Series 2020A Various Purpose General Obligation Bonds financing, new police cars, road resurfacing,
traffic signal upgrades, and various other improvements within departments of the Lexington-Fayette Urban County Government. Issued at a premium and payable in annual principal payments ranging from $545,000 to $785,000 plus interest over 10 years.
24. $22,445,000 Series 2020B Taxable General Obligation Pension Funding Refunding Bonds issued to finance the
refunding of a portion of the 2012A Lexington-Fayette Urban County Government Taxable General Obligation
LEXINGTON-FAYETTE URBAN COUNTY GOVERNMENT NOTES TO FINANCIAL STATEMENTS (Continued)
June 30, 2021
84
Pension Funding Bonds. Issued at Par and payable in annual principal payments ranging from $325,000 to $2,005,000 plus interest over 13 years. The refunding provided for a cumulative savings of $ 1,998,958 over the life of the bonds resulting in net present value savings of $1,993,274 or 11.15% of the refunded principal.
25. $11,485,000 Series 2020C, Various Purpose General Obligation Refunding Bonds to finance the refunding of the 2013C Various Purpose General Obligation Bonds. Issued at Par and payable in annual principal payments ranging from $195,000 to $1,150,000 plus interest over 13 years. The refunding provided for a cumulative savings of $1,070,316 over the life of the bonds resulting in net present value savings of $1,075,104 or 10.67% of the refunded principal.
26. $18,200,000 Series 2020D, Various Purpose General Obligation Refunding Bonds to finance the refunding of the 2014B Various Purpose General Obligation Bonds. Issued at Par and payable in annual principal payments ranging from $370,000 to $1,785,000 plus interest over 14 years. The refunding provided for a cumulative savings of $1,353,965 over the life of the bonds resulting in net present value savings of $1,358,474 or 9.03% of the refunded principal.
Landfill Closure and Postclosure Care Cost State and Federal laws and regulations require the Government to place final covers on its landfills and to perform certain maintenance and postclosure monitoring functions at its landfills for thirty years. Since the operations and maintenance of the Government’s landfills are accounted for in an Enterprise Fund, the accrued liability for these costs are reported in the Landfill Fund as required by GASB 18, Accounting for Municipal Solid Waste Landfill Closure and Postclosure Care Costs. The liability at June 30, 2021 is based on the estimated cost of maintaining and monitoring the Old Frankfort Pike Landfill (OFPLF) and the Haley Pike Landfill. Actual cost may be higher due to inflation, changes in technology, or changes in regulations and these costs will be funded by the Landfill Fund. The OFPLF ceased accepting waste decades ago. The Haley Pike Landfill ceased accepting waste in December 2011. Both of these landfills are at 100% capacity. The Haley Pike Landfill has been capped. Environmental monitoring and maintenance of the property will occur over the next 30 years, in accordance with Kentucky State Law. NOTE 4. SELF-INSURANCE PROGRAM
A. Health, Dental, and Vision Care – The Government offers health, dental, and vision care insurance options to employees of the Government. The self-insured medical and pharmacy health plan is provided by Anthem and City Pharmacy. The fully insured dental and vision plans are provided by Delta Dental and Eye Med, respectively. Third party administrators are responsible for the processing of claims and cost containment. Premiums are paid through payroll deductions and may be funded fully or partially by the Benefit Pool provided by the Government. The Health, Dental, and Vision Care Insurance Fund accounts for these activities and is reported in an internal service fund. Changes in the balances of claims liabilities during the past two years are as follows:
Surplus at June 30, 2019 $0Claims and changes in estimates 36,111,252Claims paid (36,111,252)Surplus at June 30, 2020 0Claims and changes in estimates 35,517,122Claims paid (35,517,122)Surplus at June 30, 2021 $0
B. Insurance and Risk Management – The Government is exposed to various risks of loss related to torts; theft of, damage to, and destruction of assets; errors and omissions; injuries to employees; and natural disasters. These risks are covered through the Property and Casualty Claims Fund (the Fund), a self-insured program established in 1982. There are five types of coverage provided by the self-insured program: auto liability, auto physical damage, general liability, property (including boiler and machinery), and workers' compensation.
LEXINGTON-FAYETTE URBAN COUNTY GOVERNMENT NOTES TO FINANCIAL STATEMENTS (Continued)
June 30, 2021
85
All assets and employees of the primary government are covered by the Fund. Premiums are paid into the Fund by the General Fund, the Urban Services Fund, and the Sanitary Sewer System Fund and are based on both exposure and experience factors. Premiums include amounts needed to pay prior and current-year claims and administrative costs. Liabilities of the fund are reported when it is probable that a loss has occurred and the amount of the loss can be reasonably estimated. Liabilities include an amount for claims that have been incurred but not reported (IBNR). The result of the process to estimate the claims liability depends on many complex factors, such as inflation, changes in legal doctrines, and damage awards. Accordingly, claims are reevaluated periodically to consider the effects of inflation, recent claim settlement trends, and other economic and social factors. Estimated recoveries, from subrogation and excess insurance policies, for example, are another component of the claims liability estimate. Annually, as of June 30, the Fund has a third party actuary review the claim histories for all claim years for which open claims are outstanding. The actuary projects the ultimate claim payment obligation (including the IBNR claims) for each year's claim experience. The Government elected to establish the liability for these claims and loss expenses at their present value, with a discount rate of 3.5%. As of June 30, 2021 the undiscounted estimated liability was $32,750,742. The discounted estimated liability as of June 30, 2021 was $28,946,969. Changes in the balances of claims liabilities during the past two years are as follows:
Auto Liabilityand Physical General Workmens'
Damage Liability Property Compensation TotalLiability at June 30, 2019 $1,759,830 $3,695,230 $207,831 $21,086,140 $26,749,031Claims and changes in estimates FY20 (1,580,682) (1,367,803) (787,871) (5,050,024) (8,786,380)Claims Incurred FY 2020 1,234,764 1,432,895 761,791 6,064,512 9,493,962Liability at June 30, 2020 1,413,912 3,760,322 181,751 22,100,628 27,456,613Claims and changes in estimates FY21 (1,474,941) (868,651) 423,677 (5,389,121) (7,309,037)Claims Incurred FY 2021 1,464,707 1,399,466 (458,761) 6,393,980 8,799,393Liability at June 30, 2021 $1,403,678 $4,291,137 $146,667 $23,105,487 $28,946,969
The Fund uses excess insurance policies, purchased from various commercial carriers, to reduce its exposure to large losses on all types of insured events or for exposures that are difficult to self-insure. These insurance policies permit recovery of losses above the self-insured retention limits from the insurance carriers, although it does not discharge the primary liability of the Self-Insured Retention Fund as the direct source for payment of claims made against the Government. Workers' compensation self-insured retention was $1,000,000 and property self-insured retention was $250,000.
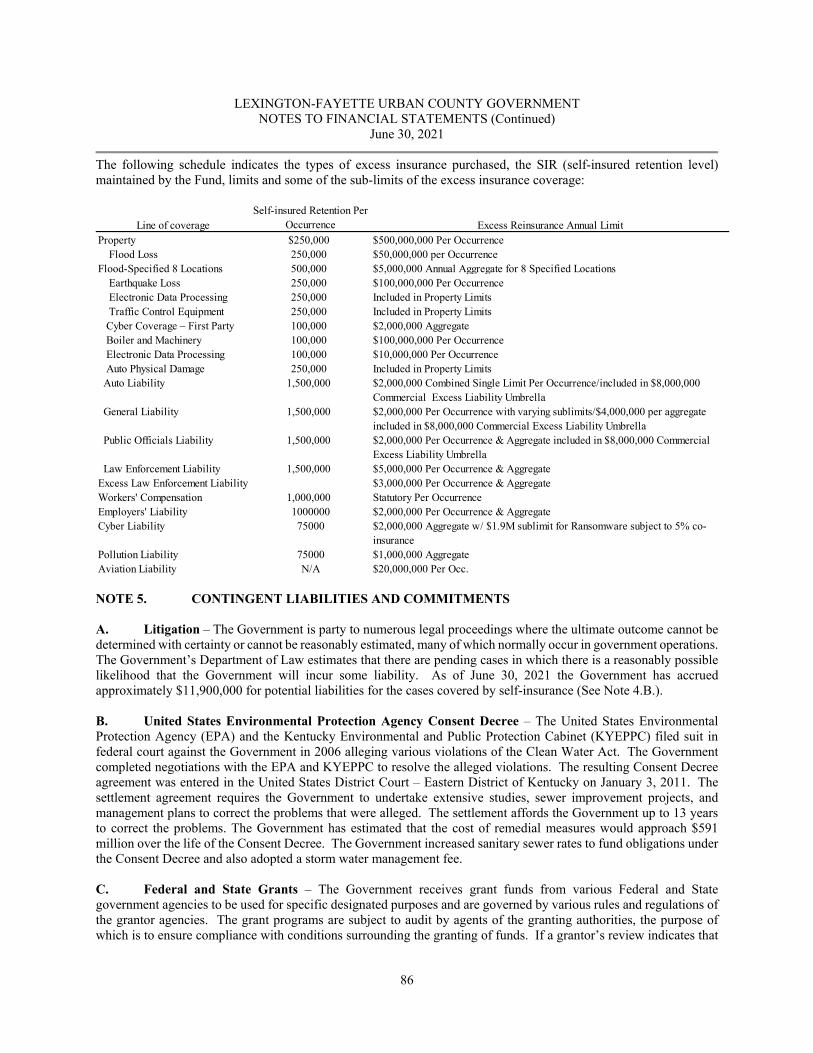
LEXINGTON-FAYETTE URBAN COUNTY GOVERNMENT NOTES TO FINANCIAL STATEMENTS (Continued)
June 30, 2021
86
The following schedule indicates the types of excess insurance purchased, the SIR (self-insured retention level) maintained by the Fund, limits and some of the sub-limits of the excess insurance coverage:
Line of coverageSelf-insured Retention Per
Occurrence Excess Reinsurance Annual LimitProperty $250,000 $500,000,000 Per Occurrence Flood Loss 250,000 $50,000,000 per OccurrenceFlood-Specified 8 Locations 500,000 $5,000,000 Annual Aggregate for 8 Specified Locations Earthquake Loss 250,000 $100,000,000 Per Occurrence Electronic Data Processing 250,000 Included in Property Limits Traffic Control Equipment 250,000 Included in Property Limits Cyber Coverage – First Party 100,000 $2,000,000 Aggregate Boiler and Machinery 100,000 $100,000,000 Per Occurrence Electronic Data Processing 100,000 $10,000,000 Per Occurrence Auto Physical Damage 250,000 Included in Property Limits Auto Liability 1,500,000 $2,000,000 Combined Single Limit Per Occurrence/included in $8,000,000
Commercial Excess Liability Umbrella General Liability 1,500,000 $2,000,000 Per Occurrence with varying sublimits/$4,000,000 per aggregate
included in $8,000,000 Commercial Excess Liability Umbrella Public Officials Liability 1,500,000 $2,000,000 Per Occurrence & Aggregate included in $8,000,000 Commercial
Excess Liability Umbrella Law Enforcement Liability 1,500,000 $5,000,000 Per Occurrence & Aggregate Excess Law Enforcement Liability $3,000,000 Per Occurrence & Aggregate Workers' Compensation 1,000,000 Statutory Per OccurrenceEmployers' Liability 1000000 $2,000,000 Per Occurrence & AggregateCyber Liability 75000 $2,000,000 Aggregate w/ $1.9M sublimit for Ransomware subject to 5% co-
insurancePollution Liability 75000 $1,000,000 AggregateAviation Liability N/A $20,000,000 Per Occ. NOTE 5. CONTINGENT LIABILITIES AND COMMITMENTS A. Litigation – The Government is party to numerous legal proceedings where the ultimate outcome cannot be determined with certainty or cannot be reasonably estimated, many of which normally occur in government operations. The Government’s Department of Law estimates that there are pending cases in which there is a reasonably possible likelihood that the Government will incur some liability. As of June 30, 2021 the Government has accrued approximately $11,900,000 for potential liabilities for the cases covered by self-insurance (See Note 4.B.).
B. United States Environmental Protection Agency Consent Decree – The United States Environmental Protection Agency (EPA) and the Kentucky Environmental and Public Protection Cabinet (KYEPPC) filed suit in federal court against the Government in 2006 alleging various violations of the Clean Water Act. The Government completed negotiations with the EPA and KYEPPC to resolve the alleged violations. The resulting Consent Decree agreement was entered in the United States District Court – Eastern District of Kentucky on January 3, 2011. The settlement agreement requires the Government to undertake extensive studies, sewer improvement projects, and management plans to correct the problems that were alleged. The settlement affords the Government up to 13 years to correct the problems. The Government has estimated that the cost of remedial measures would approach $591 million over the life of the Consent Decree. The Government increased sanitary sewer rates to fund obligations under the Consent Decree and also adopted a storm water management fee. C. Federal and State Grants – The Government receives grant funds from various Federal and State government agencies to be used for specific designated purposes and are governed by various rules and regulations of the grantor agencies. The grant programs are subject to audit by agents of the granting authorities, the purpose of which is to ensure compliance with conditions surrounding the granting of funds. If a grantor’s review indicates that
LEXINGTON-FAYETTE URBAN COUNTY GOVERNMENT NOTES TO FINANCIAL STATEMENTS (Continued)
June 30, 2021
87
the funds have not been used for the intended purpose, the grantor may request a refund of monies advanced or refuse to reimburse the Government for its expenditures. In management’s opinion, any liability for any refunds or reimbursements which may arise as a result of audits of grant funds would not have a material impact on the financial position of the Government. Continuation of the Government’s grant programs is predicated upon the grantor’s satisfaction that the funds provided are being spent as intended and the grantor’s intent to continue their programs. D. Lexington Center Corporation – LCC is a non-profit, non-stock corporate agency and instrumentality of the Government. Under the terms of a Lease Agreement dated June 15, 1993 and Supplemental Lease Agreement (Agreement) dated September 18, 2008, LCC has leased the entire Project to the LFUCG on an annual basis. The annual rental to be paid by LFUCG to LCC shall be equal to interest and principal paid on the Series 2008A Bonds, less a credit for interest earned by investments in the Debt Service Reserve Account and Bonds Service Account, plus a credit for any revenues or assets of LCC constituting operational revenue. The Agreement grants LFUCG an exclusive option to renew the lease for additional 1-year periods through June 30, 2022, and requires notice to LCC if the lease is not to be renewed. LFUCG may acquire title to the Project on any interest payment date by notifying LCC and the Trustee 60 days before such date, and by paying to the Trustee an amount equal to principal, interest and redemption premiums on the Bonds outstanding at that time, plus costs associated with the redemption of the Bonds. This Agreement was terminated and replaced on October 1, 2018. New Lease Agreement dated October 1, 2018 (New Agreement), LCC has leased the entire Project to the LFUCG on an annual basis. The annual rental to be paid by LFUCG to LCC shall be equal to interest and principal paid on the Series 2018 Bonds. The New Agreement grants LFUCG an option to renew the lease for additional 1-year periods through June 30, 2049, and requires notice to LCC if the lease is not to be renewed. LFUCG may acquire title to the Project on any interest payment date by notifying LCC and the Trustee 60 days before such date, and by paying to the Trustee an amount equal to principal, interest and redemption premiums on the Bonds outstanding at that time, plus costs associated with the redemption of the Bonds. LCC and LFUCG entered into a Management Contract dated June 15, 1993. Under this contract, LCC has full possession and control of the Project on behalf of LFUCG. The contract also provides that, in the event operating revenues exceed operating expenses in a given year, this excess may be used to establish reasonable reserves for efficient operation, depreciation, replacement of equipment, and repairs. Any remaining surplus shall be seasonably remitted to LFUCG. Accordingly, LCC has established a Capital Replacements Reserve Account to be used to fund expected replacements and major repairs of fixed assets. And a Current Operating Reserve Account to be used to provide a reasonable reserve for the operations of LCC. The Management Contract between LCC and LFUCG is coterminous with the term of the New Agreement and is automatically renewed from year to year with the New Agreement. On July 13, 2001, LCC and the University of Kentucky (UK) Athletic Association entered into a lease agreement through the 2017-18 basketball season for the use of Rupp Arena. In December 15, 2016, the University signed a Letter of Intent with LCC outlining goals and terms to be negotiated in a new 15-year lease that would extend to 2033. On February 7, 2018 UK signed a Facility Right of Use Agreement with a minimum of 16 events must be University of Kentucky men’s basketball games. LCC is to provide UK four club spaces to be constructed in the Convention Project. The agreement has a term of 15 years and terminated June 30, 2033. An agreement between LCC and the Lexington Convention and Visitors Bureau, dated March 20, 2001, provides for annual contributions of $948,000 to LCC for the period beginning 2001 and ending 2012. Contributions shall decrease in the amount of $100,000 each successive fiscal year beginning in 2013, with a final contribution of $48,000 in 2021. In an agreement signed September 20, 2018 an effective date of January 1, 2019. The new agreement establishes monthly contribution from Visit LEX of $62,500 and LCC agrees to fund an “Incentive Fund” in the amount of $250,000. The first three years of the agreement, LCC shall maintain an annual limit in the fund of $125,000 thereafter. The agreement has a term of 66 months with 5-year automatic renewals and a final 54 month term for a total of 30 years. Due to significant loss of Transient Room Tax revenues in 2020 a new agreement has been approved and the new terms are listed in sections G.
LEXINGTON-FAYETTE URBAN COUNTY GOVERNMENT NOTES TO FINANCIAL STATEMENTS (Continued)
June 30, 2021
88
A Memorandum of Agreement dated March 23, 2016 between the Finance and Administration Cabinet (the cabinet), a governmental agency of the Commonwealth of Kentucky (the Commonwealth), LFUCG, and LCC provides that the Cabinet shall pay to LCC $60,000,000 if LFUCG agrees to levy an additional 2.5% transient room tax (2% to LCC and 0.5% to the Cabinet for the recoupment of its $60 million investment) and contribute an additional $10,000,000 to LCC. LCC agrees to finance approximately $171,000,000 through the sale of bonds, and spend all funds for the renovation, expansion, or improvement of a convention center. LCC also agrees to reimburse the Commonwealth for $2,187,500, on or before December 31, 2016, it previously received towards the Arts and Entertainment Project. LCC repaid its commitment to the Commonwealth in fiscal 2017. In October 2018, LCC received approximately $221 million through the sale of bonds for the Convention Project and the Commonwealth funded its $60 million commitment. On January 1, 2018, LCC entered into an agreement with Oak View Group LLC (OVG) to retain OVG as exclusive third party booking agent for events and concerts at Rupp Arena. This agreement expires December 31, 2022. On December 4, 2018, LCC entered into a tri-party agreement between Town Branch Fund (the Fund), LFUCG and LCC to develop, construct and maintain the Town Branch Commons park project (Park Project). The Park Project will consist of approximately 9 acres of property that is now known as the Cox Street Parking Lot. LCC commits to leasing the property to the Fund under certain lease terms that will be finalized for least 75% of the total budget cost of construction of the Park Project. LFUCG will assist the Fund with the procurement of any permits and procedures for park construction and operations. If the Fund cannot raise sufficient funds as outlined in the agreement, the agreement will be terminated on December 4, 2023, with no further obligations from the Parties. E. Lexington-Fayette Urban County Airport Corporation (Airport Corporation) – The Airport Corporation is a non-profit, non-stock corporate agency and instrumentality of the Government and the Airport Board. The Government and the Airport Board have entered into a joint and severable Contract Lease and Option Agreement that provides for leasing the Bluegrass Airport from the Airport Corporation on an annual basis beginning October 1, 1976. The annual rental to be paid by the Government to the Airport Corporation is an amount equal to interest and principal on the bonds, plus costs of operating, maintaining, and insuring the leased premises, less all receipts of the Airport Corporation that are not required to be otherwise applied. The agreement grants the Government the option to renew the lease for additional one-year periods through June 30, 2024, but the Government may elect not to renew the lease with written notice to the Airport Corporation. The Airport Corporation has had sufficient revenues to pay all debt service costs without a lease payment from the Government. The financial status is expected to remain the same. The COVID-19 pandemic has adversely impacted the Airport’s operations for FY 2021 and FY 2020. The estimated loss of revenue for the Airport is approximately $13,000,000 from March 2020 through June 2021. The Airport has received $3,461,000 and $9,996,000 in COVID FAA relief grants from the Federal Aviation Administration (FAA) for FY 2020 and FY 2021, respectively. The Airport has also been awarded an additional COVID FAA relief grant in the amount of $7,100,000 that it expects to receive in FY 2022. These grants are to assist with approved expenditures and debt payments. The Airport Corporation is exposed to various risks of loss related to torts; theft of, damage to, and destruction of assets; errors and omissions; injuries to employees; general liability claims; and natural disasters. The Airport Corporation manages these risks through the purchase of commercial insurance. The amount of settlements has not exceeded coverage in any of the past three fiscal years. F. Lexington Public Library – The Library is a non-profit, non-stock corporate agency and instrumentality of the Government. The Library made capital investment during the fiscal year for equipment and building improvements and construction. The most significant investment was the purchase of the Village Branch property. The Library will be replacing the branch with a new approximately 30,000 square foot free standing building with construction planned
LEXINGTON-FAYETTE URBAN COUNTY GOVERNMENT NOTES TO FINANCIAL STATEMENTS (Continued)
June 30, 2021
89
to start late fiscal year 2022. The Library also continued the improvement project on the Central parking garage and invested in computer and technology improvements. In September 2008, the Library closed on financing for the Northside branch with Kentucky League of Cities. The total balance of both loans was $2,216,611 at June 30, 2021. On March 29, 2012, the Library closed on financing for the Energy Project with the Kentucky League of Cities. Financing the program with revenue bonds 2014 Series A. The outstanding bond payable about was $537,500 at June 30, 2021. On December 30, 2014, the Library closed on financing for the relocation project related to the Eagle Creek Branch with Kentucky Bank. The construction lease has a fixed rate of 2.78% and the principal balance is $1,736,877 as of June 30, 2021. In March 2020, the World Health Organization declared COVID-19 as a pandemic. Operations will continue to be impacted, but the disruption is uncertain and cannot be quantified. G. Lexington Convention and Visitors Bureau – The Bureau has pledged a portion of its occupancy tax receipts to the Lexington Center Corporation (LCC) to support the growth and expansion of the arena and convention facilities. The Bureau's original agreement pledged $248,000 to the LCC for fiscal year 2019. A new agreement was executed effective January 1, 2019 that terminated the prior agreement and provides financial assistance through fiscal year 2024. The agreement includes five auto renewals to allow the agreement to extend through 2049. This agreement requires the Bureau to pay annually $750,000 to help meet the LCC expansion project bond requirements. The amount is payable in equal monthly installments of $62,500 being due the last day of each month. LCC may assign its rights to the Bureau's contributions to the bondholders or lenders and in such event, the Bureau would be required to make payments directly to the lender. As of June 30, 2020, the balance of funds payable under this agreement is $2,527,500 and is recognized as a deferred outflows of resources in the Statement of Net Position. In FY20 due to the significant loss of Transient Room Tax revenues caused by the COVID-19 Pandemic, Visit Lex and LCC have agreed to the deferral of a portion of the Visit Lex contributions to LCC for a three-year period. Visit Lex contribute the sum of $97,500 annually in monthly installments of $8,125 during the period of July 1, 2020 to June 30, 2022, increasing to $405,000 annually in monthly installment of $33,750 during the period from July 1, 2022 through June 30, 2023. Visit Lex will resume monthly installments of $62,500 with an interest rate of 2.63% per annum, by paying an additional monthly amount of approximately $16,333 for 120 consecutive months.
H. Liens and Encumbrances – While the Government has satisfactory title to all owned assets, there may be some liens and encumbrances on such assets for matters unrelated to bond issues. Only a complete accurate title search of all properties would disclose such liens and encumbrances. I. Conduit Debt – The Government has issued Industrial Revenue Bonds to provide financial assistance to private sector and nonprofit entities for the acquisition and construction of industrial and commercial facilities deemed to be in the public interest. The bonds are secured by the property financed and are payable solely from payments received on the underlying mortgage loans. Upon repayment of the bonds, ownership of the acquired facilities transfers to the private sector or nonprofit entity served by the bond issue. The Government is not obligated in any manner for repayment of the bonds. Accordingly, the bonds are not reported as liabilities in the accompanying financial statements. As of June 30, 2021, there were 13 series of Industrial Revenue Bonds outstanding with an aggregate amount payable of approximately $48,083,697. To provide for the construction of a hospital facility, the PFC issued Lease Revenue Bonds, Series 2011A (Eastern State Hospital Project). The bonds are a special limited obligation of the PFC, payable solely from and secured by a pledge of rentals to be received from a lease agreement between the PFC and the Commonwealth of Kentucky. The bonds do not constitute a debt or pledge of the faith and credit of the PFC or the Government, and accordingly have not been reported in the accompanying financial statements. On June 2, 2021, the Commonwealth of Kentucky
LEXINGTON-FAYETTE URBAN COUNTY GOVERNMENT NOTES TO FINANCIAL STATEMENTS (Continued)
June 30, 2021
90
entered into a Forward Delivery Agreement with PNC Bank to fully refund the outstanding balance of $98,995,000 2011A Eastern State Hospital Project. J. Encumbrances – Encumbrance accounting is utilized during the year to facilitate effective budgetary control. Encumbrances are treated as budgeted expenditures in the year of incurrence of the commitment to purchase. Budgetary comparisons presented in this report are on this budgetary basis of accounting. Adjustments necessary to convert from the budgetary basis to GAAP are provided on the face of the budgetary comparison statements. In governmental funds, encumbrances outstanding at year-end represent commitments related to unperformed contracts for goods or services. Encumbrance accounting, under which purchase orders, contracts, and other commitments for the expenditure of resources are recorded to reserve that portion of the applicable appropriations, is utilized in the governmental funds. Encumbrances are not treated as expenditures or liabilities because the commitments will be honored during the subsequent year. Outstanding encumbrances for the governmental funds at June 30, 2021 were as follows:
General Fund $10,702,720Urban Service Fund 9,524,397Nonmajor Governmental Funds 11,456,840
Encumbrances are not recorded in the financial statements for proprietary fund types and Pension Trust Funds. However, the purchase orders outstanding at June 30, 2021 for these funds are as follows:
Sanitary Sewer System $95,035,728Public Facilities Corporatio 162,343Water Quality 14,115,479Landfill 91,402Nonmajor Enterprise Funds 601,015
K. Tax Abatements – The Government participates in the Commonwealth of Kentucky’s Tax Increment Financing (TIF) program. For a full disclosure of the program requirements, please see KRS Chapters 65 and 154. Any inducements offered under the TIF program are negotiated by the Cabinet for Economic Development officials and presented as a recommendation to the Kentucky Economic Development Finance Authority for approval. There are three state participation programs available. State participation is limited to a specific project within a blighted urban redevelopment or vacant land with 5,000 seat arena development area. Only the tax revenues generated within the footprint of the specific identified project are included in the increment. The tax abatements are granted to development areas that meet two of seven specified blight/deterioration conditions established in KRS 65.7049(3), such as abandonment or deterioration of structures, presence of environmentally contaminated land, and inadequate or deteriorating public infrastructure. Abatements are obtained through application by the property owner, including proof that the improvements have been made. The state specifies a percentage reduction of up to 100% of incremental property taxes and occupational license taxes or fees for up to 30 years. As of June 30, 2021, the Government has property tax abatement agreements through two programs available for specific projects designated to be within the blighted redevelopment areas as follows (dollars in thousands):
Commonwealth Participation Program for Real Property Ad Valorem Tax Revenues – The Government’s revenues for realty, business returns, and employee withholdings will be reduced by an estimated $443,485 for tax credits related to fiscal year 2020 under an agreement entered into by the state in the next fiscal year. Participation requirements include a positive impact on the Commonwealth as certified by a qualified independent consultant; a minimum capital investment of $10 million; not more than 20 percent of the approved project costs or 20 percent of the finished square footage shall be devoted to retail; and pledged revenues shall not exceed 100 percent of approved public infrastructure costs. The Government has pledged 80% of its revenues for realty, business returns, and employee withholdings for 20 years. As of June 30, 2021, three state abatement agreements have been entered into with local businesses.
LEXINGTON-FAYETTE URBAN COUNTY GOVERNMENT NOTES TO FINANCIAL STATEMENTS (Continued)
June 30, 2021
91
Commonwealth Participation Program for Mixed Use Redevelopment in Blighted Urban Areas – The Government’s revenues for realty, business returns, and employee withholdings will be reduced by an estimated $55,500 for tax credits related to fiscal year 2020 under an agreement entered into by the state in the next fiscal year. Projects must meet several qualifications for mixed use and blighted/deteriorated conditions. Participation requirements include being a new economic activity in the Commonwealth; having a positive impact on the Commonwealth; a minimum capital investment of at least $20 million but not over $200 million; and recovery of up to 100 percent of approved public infrastructure costs, and costs related to land preparation, demolition and clearance up to 20 years. The Government has pledged 80% of its revenues for realty, business returns, and employee withholdings for 20 years. As of June 30, 2021, four state abatement agreements have been entered into with local businesses.
Commonwealth Participation Program for Signature Projects – The Government’s revenues for realty, business returns, and employee withholdings will be reduced by an estimated $178,264 for tax credits related to fiscal year 2020 under an agreement entered into by the state in the next fiscal year. Participation requirements include a positive impact on the Commonwealth as certified by a qualified independent consultant; a minimum capital investment of $200 million; not more than 20 percent of the approved project costs or 20 percent of the finished square footage shall be devoted to retail; pledged revenues shall not exceed 80 percent of approved public infrastructure costs; recovery of up to 100 percent of public infrastructure costs less sales taxes paid, signature costs less sales tax paid, and financing costs related to the public infrastructure costs over a period of up to 30 years; and qualifies for a sales tax refund on the purchase of construction materials that no not qualify as an approved public infrastructure cost or an approved signature cost. The Government has pledged 80% of its revenues for realty, business returns, and employee withholdings for 30 years. As of June 30, 2021, two state abatement agreements have been entered into with local businesses.
The Government participates in the Commonwealth of Kentucky’s Kentucky Business Investment Program. This program is a state administered tax incentive, authorized by KRS 154.32, and approved by the Kentucky Economic Development Finance Authority. In order to be eligible, a company must create ten (10) new full-time jobs for Kentucky residents, incur eligible costs of at least $100,000, pay average hourly wages of at least one hundred fifty percent (150%) of the federal minimum wage, and provide a minimum level of benefits by the activation date. Incentives are approved for up to ten (10) years. The Government participates by providing an inducement of one percent (1%) of payroll taxes to the company per authorized job. This reduces the payroll taxes paid per job from 2.25% to 1.25%. The local inducement is approved by resolution of the Urban County Council. As of June 30, 2021, twenty one (21) companies participated in that program at the local level. Payroll withholdings are reduced by an estimated amount of $1,047,524.
L. Affordable Housing Loan Program – On May 8, 2014, the Government passed Ordinance 52-2014 establishing the affordable housing loan program to promote housing projects by developers to provide more affordable housing options to qualifying residents of Lexington, Kentucky. The Urban County Council also issued a memorandum on August 11, 2014 establishing funding in the amount of $2,000,000 beginning in fiscal year 2015 and thereafter, for total funding as of June 30, 2021 of $15,000,000. As of June 30, 2021, there are $4,454,249 in outstanding loans for this program. M. Jobs Fund Loan Program – On December 5, 2013, the Government passed Ordinance 153-2013 establishing a local economic development incentive program in order to attract or expand the level of employment in Lexington-Fayette County. The purpose of the program is to provide certain qualified businesses with local funding through grants, loans, forgivable loans, or other agreements. The program is focused on attracting innovative businesses and promoting expansion of existing businesses, with a priority focus on advanced manufacturing, technology, professional shared service operations, or healthcare, or which have or will be locating their primary base of operations or headquarters in Lexington-Fayette County. In addition, Ordinance 152-2013 establishes the “Economic Development Investment Board” to perform duties related to the program. The typical maximum of any funding agreement will not exceed $50,000 for a grant agreement and $250,000 for a loan or other agreement. Upon the recommendation of the Chief Development Officer and Economic Development Investment Board, the final
LEXINGTON-FAYETTE URBAN COUNTY GOVERNMENT NOTES TO FINANCIAL STATEMENTS (Continued)
June 30, 2021
92
approval for all agreements is given by the Urban County Council. The Urban County Council established funding with ordinance 51-2014 on May 15, 2014, in the amount of $1,000,000 beginning in fiscal year 2014 and thereafter for total funding as of June 30, 2021 of $4,020,000. As of June 30, 2021, there are $1,314,032 in outstanding loans for this program. In March 2020, the Mayor issued an executive order that granted a 90-day deferral to all jobs fund loan recipients. The mayor amended her executive order to provide an additional 90-day deferral for loan recipients, for a total deferral of 180-days. Additionally, the Economic Development Investment Board considered individual requests from program recipients for payment deferrals and restructuring due to impacts from COVID-19. Regular compliance and payments are scheduled to begin to resume in fiscal year 2022. In addition, one loan recipient has defaulted and the Government is in active negotiation for settlement. The amount of settlement is not estimable at this time. The outstanding loan amount as of June 30, 2021 is $240,860. Small Business Economic Recovery Program – During Fiscal Year 2021, the Urban Council appropriated $5,000,000 to small business recovery programs. The Small Business Economic Recovery Grant Program was created to award $2,500,000 to support the recovery of small businesses in Lexington. Eligible businesses were invited to apply for up to $25,000 in grant assistance, and were required to establish goals to sustain or increase employment and/or payroll. Businesses that do not meet their benchmarks will be required to pay back the grant based on a sliding scale of the proportion of the benchmarks achieved. N. Business Disruption – In March 2020, the World Health Organization declared the spread of the Coronavirus Disease (“COVID-19”) as a global pandemic and recommended worldwide mitigation measures. The COVID-19 pandemic had significant effects on global markets, supply chains, businesses, and communities. Specific to the Government, the pandemic impacted various parts of its operations and financial results due to mandated closure of businesses which resulted in the reduction of jobs which negatively impacted Occupational License Tax and Net Profits Tax revenues. In response to the COVID-19 pandemic, the Government created grant programs for small businesses and emergency financial assistance programs for residents facing evictions or utility shutoffs. Management believes the Government has taken appropriate actions to mitigate the negative impact. However, if the pandemic continues to evolve, the subsequent needs of the community will continue to have an impact on future operations. The extent to which the full impact of COVID-19 and its aftereffects are still unknown and cannot be reasonably estimated. NOTE 6. THE SINGLE AUDIT ACT Title 2 U.S. Code of Federal Regulations Part 200, Uniform Administrative Requirement, Cost Principles, and Audit Requirements for Federal Awards (Uniform Guidance) requires non-federal entities that expend $750,000 or more a year in Federal awards to have an audit performed in accordance with the provisions of the Circular. A separate supplemental report will be issued on active grant programs of the Government in accordance with applicable provisions of the Single Audit Act of 1984, P.L. 98-502 and the Single Audit Act Amendments of 1996, P.L. 104-156. NOTE 7. SUBSEQUENT EVENTS Primary Government It is the Government’s intent to issue bonds in January 2022 in the amount of $30 million. The bonds will fund various projects including infrastructure improvements, fleet replacement, public safety projects, and information technology improvements.
LEXINGTON-FAYETTE URBAN COUNTY GOVERNMENT NOTES TO FINANCIAL STATEMENTS (Continued)
June 30, 2021
93
Component Unit On August 31, 2021, the LCC Board of Directors approved a management agreement with Oak View Group LLC (OVG) to manage the day-to-day operations of all LCC facilities on behalf of LCC. OVG will be responsible for the marketing, sales, box office, finance, operations, and generate new business opportunities and attract a variety of events that will bring visitors and drive economic impact for Lexington and the region. OVG’s management of all facilities is scheduled to begin October 1, 2021 and continue through June 30, 2026. NOTE 8. DEFINED BENEFIT PENSION PLANS AND OTHER POST EMPLOYMENT BENEFITS The Policemen’s and Firefighters’ Retirement Fund (PFRF) and The City Employees’ Pension Fund (CEPF) A. Plan Descriptions The Government contributes to two single employer defined benefit pension plans: The PFRF and the CEPF. The sworn personnel of the divisions of Police and Fire are eligible to participate in the PFRF. For members whose participation date in the PFRF is prior to March 14, 2013, benefits vest after twenty years of service. The annuity is 2.5% of average salary multiplied by years of total service. For members whose participation date is on or after March 14, 2013, benefits vest after twenty-five years of service. The annuity is 2.25% of average salary multiplied by years of total service. Cost of living adjustments (COLA) will be granted on the following schedule for both current and future retirees beginning on the earlier of a member turning age 50 or being retired for five years until the PFRF, utilizing the current COLA provisions, is 85% funded. At that time, COLA’s will be granted each year by an amount, determined by the Board, of between 2% and 5% compounded annually. In addition, those receiving an annuity of over $100,000 will not be eligible to receive a COLA until the later of the proposed conditions or January 1, 2018.
Annual Annuity COLA % Above $100,000 1%
$75,000 to $99,000 1% $50,000 to $74,999 1.5% $40,000 to $49,999 1.5% $35,000 to $39,999 2% $30,000 to $24,999 2%
Under $30,000 2%
Members may add unused sick leave to service credit and average annual salary for purposes of calculating retirement benefits. The costs of administering the PFRF are financed by a combination of additional contributions as well as investment income. Civil service employees of the City of Lexington were covered by the CEPF. In 1973, the governments of the City of Lexington and Fayette County merged to form the Government. In December 1973, the City of Lexington froze admission of new entrants into the CEPF, and in January 1974 the new merged Government assumed the City of Lexington's liability for covered employees and the CEPF was closed to any new members. A member who has attained age 60 and completed 20 years of service or completed 30 years of service regardless of age may apply for retirement. Members who are 45 years old or older with 10 years of service may request a deferred retirement benefit to be paid when they reach 60 years of age. Retirees receive 2.5% of their average salary for each year of service up to 20 years plus 1% of average salary for each year of service over 20 years, with a maximum benefit of 65% of average salary. Members may add unused sick leave to service credit and average annual salary for purposes of calculating retirement benefits. Death and disability benefits are also provided under certain conditions. In addition, the plan includes an annual cost of living adjustment of 3% for any member retiring after July 1, 1981 that has attained age 61 or has been retired for one year. The costs of administering the CEPF are financed by a combination of additional contributions as well as investment income.
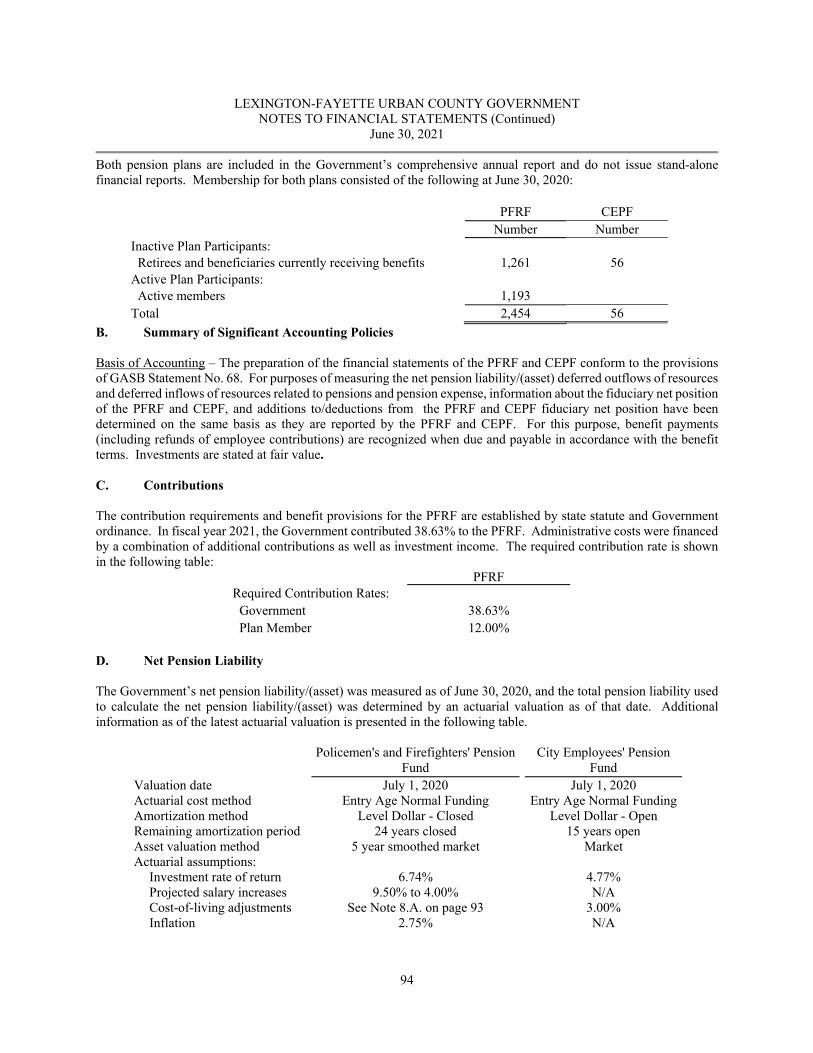
LEXINGTON-FAYETTE URBAN COUNTY GOVERNMENT NOTES TO FINANCIAL STATEMENTS (Continued)
June 30, 2021
94
Both pension plans are included in the Government’s comprehensive annual report and do not issue stand-alone financial reports. Membership for both plans consisted of the following at June 30, 2020:
PFRF CEPF Number Number Inactive Plan Participants: Retirees and beneficiaries currently receiving benefits 1,261 56 Active Plan Participants: Active members 1,193 Total 2,454 56
B. Summary of Significant Accounting Policies Basis of Accounting – The preparation of the financial statements of the PFRF and CEPF conform to the provisions of GASB Statement No. 68. For purposes of measuring the net pension liability/(asset) deferred outflows of resources and deferred inflows of resources related to pensions and pension expense, information about the fiduciary net position of the PFRF and CEPF, and additions to/deductions from the PFRF and CEPF fiduciary net position have been determined on the same basis as they are reported by the PFRF and CEPF. For this purpose, benefit payments (including refunds of employee contributions) are recognized when due and payable in accordance with the benefit terms. Investments are stated at fair value. C. Contributions
The contribution requirements and benefit provisions for the PFRF are established by state statute and Government ordinance. In fiscal year 2021, the Government contributed 38.63% to the PFRF. Administrative costs were financed by a combination of additional contributions as well as investment income. The required contribution rate is shown in the following table:
PFRF Required Contribution Rates: Government 38.63% Plan Member 12.00%
D. Net Pension Liability The Government’s net pension liability/(asset) was measured as of June 30, 2020, and the total pension liability used to calculate the net pension liability/(asset) was determined by an actuarial valuation as of that date. Additional information as of the latest actuarial valuation is presented in the following table.
Policemen's and Firefighters' Pension Fund
City Employees' Pension Fund
Valuation date July 1, 2020 July 1, 2020 Actuarial cost method Entry Age Normal Funding Entry Age Normal Funding Amortization method Level Dollar - Closed Level Dollar - Open Remaining amortization period 24 years closed 15 years open Asset valuation method 5 year smoothed market Market Actuarial assumptions: Investment rate of return 6.74% 4.77% Projected salary increases 9.50% to 4.00% N/A Cost-of-living adjustments See Note 8.A. on page 93 3.00% Inflation 2.75% N/A
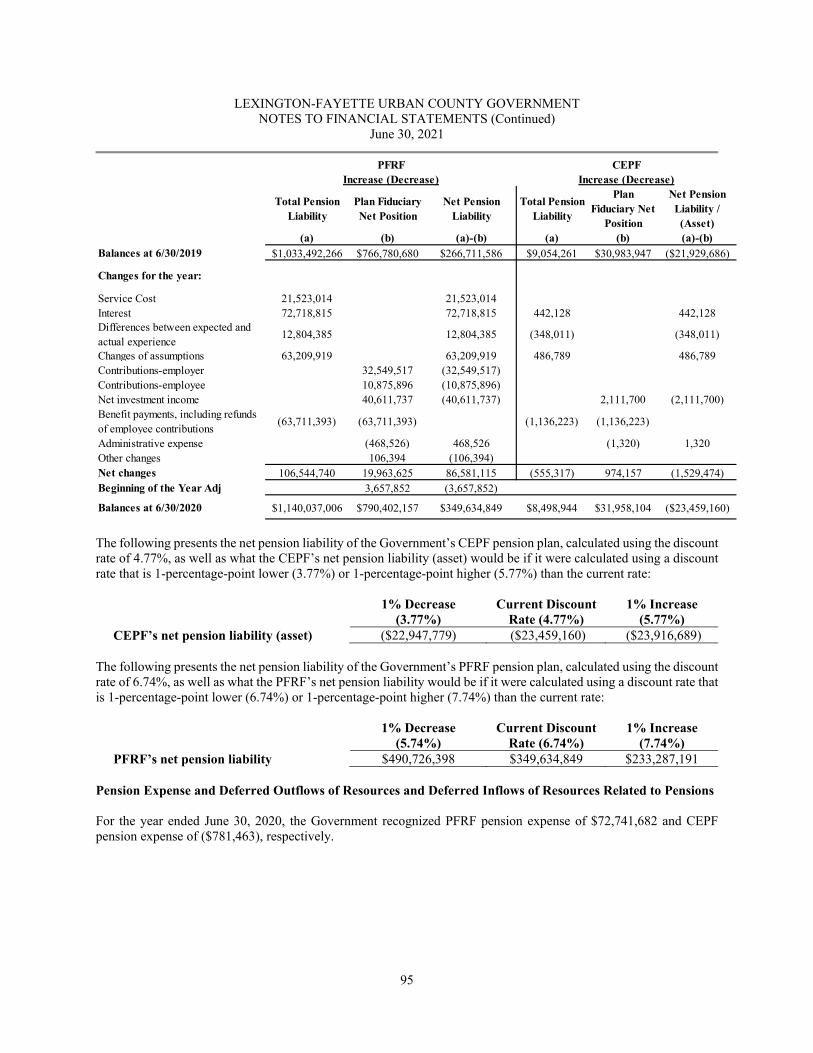
LEXINGTON-FAYETTE URBAN COUNTY GOVERNMENT NOTES TO FINANCIAL STATEMENTS (Continued)
June 30, 2021
95
Total Pension Liability
Plan Fiduciary Net Position
Net Pension Liability
Total Pension Liability
Plan Fiduciary Net
Position
Net Pension Liability /
(Asset)(a) (b) (a)-(b) (a) (b) (a)-(b)
$1,033,492,266 $766,780,680 $266,711,586 $9,054,261 $30,983,947 ($21,929,686)
21,523,014 21,523,01472,718,815 72,718,815 442,128 442,128
12,804,385 12,804,385 (348,011) (348,011)
63,209,919 63,209,919 486,789 486,789 32,549,517 (32,549,517)10,875,896 (10,875,896)40,611,737 (40,611,737) 2,111,700 (2,111,700)
(63,711,393) (63,711,393) (1,136,223) (1,136,223)
(468,526) 468,526 (1,320) 1,320 106,394 (106,394)
106,544,740 19,963,625 86,581,115 (555,317) 974,157 (1,529,474)Beginning of the Year Adj 3,657,852 (3,657,852)
$1,140,037,006 $790,402,157 $349,634,849 $8,498,944 $31,958,104 ($23,459,160)Balances at 6/30/2020
Contributions-employeeNet investment incomeBenefit payments, including refunds of employee contributionsAdministrative expenseOther changesNet changes
Contributions-employer
PFRF CEPFIncrease (Decrease) Increase (Decrease)
Balances at 6/30/2019
Changes for the year:
Service CostInterestDifferences between expected and actual experienceChanges of assumptions
The following presents the net pension liability of the Government’s CEPF pension plan, calculated using the discount rate of 4.77%, as well as what the CEPF’s net pension liability (asset) would be if it were calculated using a discount rate that is 1-percentage-point lower (3.77%) or 1-percentage-point higher (5.77%) than the current rate:
1% Decrease
(3.77%) Current Discount
Rate (4.77%) 1% Increase
(5.77%) CEPF’s net pension liability (asset) ($22,947,779) ($23,459,160) ($23,916,689)
The following presents the net pension liability of the Government’s PFRF pension plan, calculated using the discount rate of 6.74%, as well as what the PFRF’s net pension liability would be if it were calculated using a discount rate that is 1-percentage-point lower (6.74%) or 1-percentage-point higher (7.74%) than the current rate:
1% Decrease
(5.74%) Current Discount
Rate (6.74%) 1% Increase
(7.74%) PFRF’s net pension liability $490,726,398 $349,634,849 $233,287,191
Pension Expense and Deferred Outflows of Resources and Deferred Inflows of Resources Related to Pensions For the year ended June 30, 2020, the Government recognized PFRF pension expense of $72,741,682 and CEPF pension expense of ($781,463), respectively.
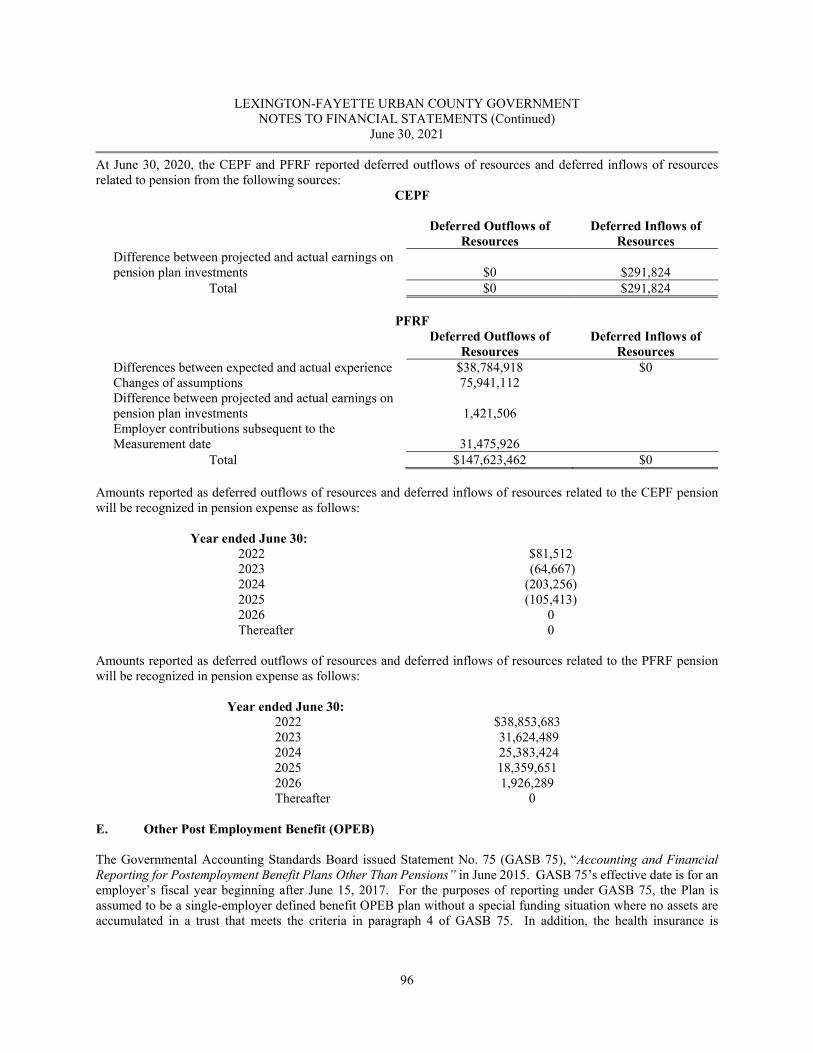
LEXINGTON-FAYETTE URBAN COUNTY GOVERNMENT NOTES TO FINANCIAL STATEMENTS (Continued)
June 30, 2021
96
At June 30, 2020, the CEPF and PFRF reported deferred outflows of resources and deferred inflows of resources related to pension from the following sources:
CEPF
Deferred Outflows of
Resources Deferred Inflows of
Resources Difference between projected and actual earnings on pension plan investments $0 $291,824
Total $0 $291,824
PFRF
Deferred Outflows of
Resources Deferred Inflows of
Resources Differences between expected and actual experience $38,784,918 $0 Changes of assumptions 75,941,112 Difference between projected and actual earnings on pension plan investments 1,421,506 Employer contributions subsequent to the Measurement date 31,475,926
Total $147,623,462 $0 Amounts reported as deferred outflows of resources and deferred inflows of resources related to the CEPF pension will be recognized in pension expense as follows:
Year ended June 30: 2022 $81,512 2023 (64,667) 2024 (203,256) 2025 (105,413) 2026 0 Thereafter 0
Amounts reported as deferred outflows of resources and deferred inflows of resources related to the PFRF pension will be recognized in pension expense as follows:
Year ended June 30: 2022 $38,853,683 2023 31,624,489 2024 25,383,424 2025 18,359,651 2026 1,926,289 Thereafter 0
E. Other Post Employment Benefit (OPEB) The Governmental Accounting Standards Board issued Statement No. 75 (GASB 75), “Accounting and Financial Reporting for Postemployment Benefit Plans Other Than Pensions” in June 2015. GASB 75’s effective date is for an employer’s fiscal year beginning after June 15, 2017. For the purposes of reporting under GASB 75, the Plan is assumed to be a single-employer defined benefit OPEB plan without a special funding situation where no assets are accumulated in a trust that meets the criteria in paragraph 4 of GASB 75. In addition, the health insurance is
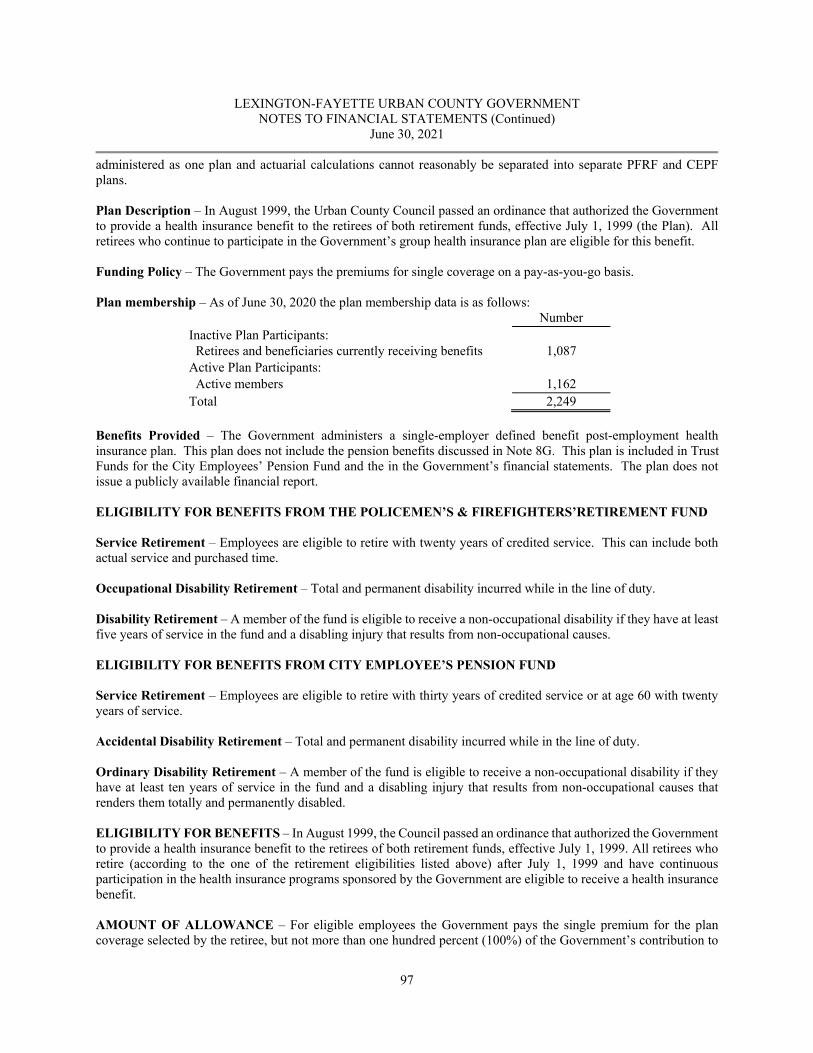
LEXINGTON-FAYETTE URBAN COUNTY GOVERNMENT NOTES TO FINANCIAL STATEMENTS (Continued)
June 30, 2021
97
administered as one plan and actuarial calculations cannot reasonably be separated into separate PFRF and CEPF plans. Plan Description – In August 1999, the Urban County Council passed an ordinance that authorized the Government to provide a health insurance benefit to the retirees of both retirement funds, effective July 1, 1999 (the Plan). All retirees who continue to participate in the Government’s group health insurance plan are eligible for this benefit. Funding Policy – The Government pays the premiums for single coverage on a pay-as-you-go basis. Plan membership – As of June 30, 2020 the plan membership data is as follows:
Number Inactive Plan Participants: Retirees and beneficiaries currently receiving benefits 1,087 Active Plan Participants: Active members 1,162 Total 2,249
Benefits Provided – The Government administers a single-employer defined benefit post-employment health insurance plan. This plan does not include the pension benefits discussed in Note 8G. This plan is included in Trust Funds for the City Employees’ Pension Fund and the in the Government’s financial statements. The plan does not issue a publicly available financial report. ELIGIBILITY FOR BENEFITS FROM THE POLICEMEN’S & FIREFIGHTERS’RETIREMENT FUND Service Retirement – Employees are eligible to retire with twenty years of credited service. This can include both actual service and purchased time. Occupational Disability Retirement – Total and permanent disability incurred while in the line of duty. Disability Retirement – A member of the fund is eligible to receive a non-occupational disability if they have at least five years of service in the fund and a disabling injury that results from non-occupational causes. ELIGIBILITY FOR BENEFITS FROM CITY EMPLOYEE’S PENSION FUND Service Retirement – Employees are eligible to retire with thirty years of credited service or at age 60 with twenty years of service. Accidental Disability Retirement – Total and permanent disability incurred while in the line of duty. Ordinary Disability Retirement – A member of the fund is eligible to receive a non-occupational disability if they have at least ten years of service in the fund and a disabling injury that results from non-occupational causes that renders them totally and permanently disabled. ELIGIBILITY FOR BENEFITS – In August 1999, the Council passed an ordinance that authorized the Government to provide a health insurance benefit to the retirees of both retirement funds, effective July 1, 1999. All retirees who retire (according to the one of the retirement eligibilities listed above) after July 1, 1999 and have continuous participation in the health insurance programs sponsored by the Government are eligible to receive a health insurance benefit. AMOUNT OF ALLOWANCE – For eligible employees the Government pays the single premium for the plan coverage selected by the retiree, but not more than one hundred percent (100%) of the Government’s contribution to
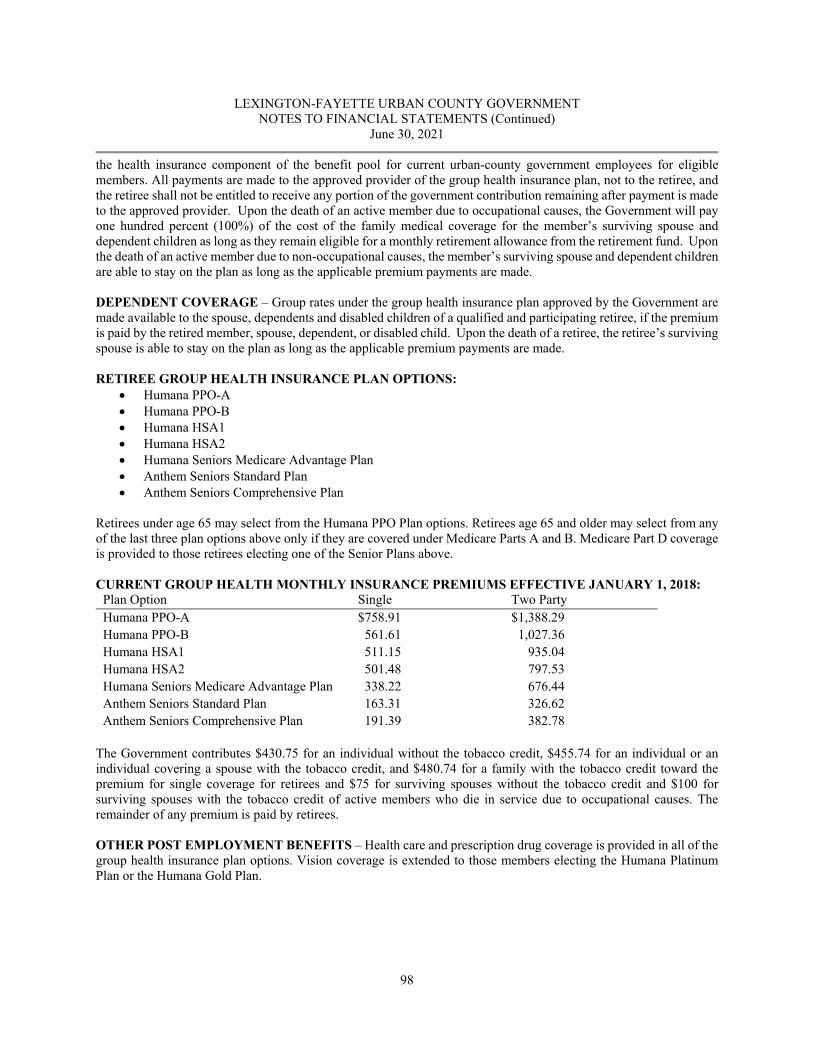
LEXINGTON-FAYETTE URBAN COUNTY GOVERNMENT NOTES TO FINANCIAL STATEMENTS (Continued)
June 30, 2021
98
the health insurance component of the benefit pool for current urban-county government employees for eligible members. All payments are made to the approved provider of the group health insurance plan, not to the retiree, and the retiree shall not be entitled to receive any portion of the government contribution remaining after payment is made to the approved provider. Upon the death of an active member due to occupational causes, the Government will pay one hundred percent (100%) of the cost of the family medical coverage for the member’s surviving spouse and dependent children as long as they remain eligible for a monthly retirement allowance from the retirement fund. Upon the death of an active member due to non-occupational causes, the member’s surviving spouse and dependent children are able to stay on the plan as long as the applicable premium payments are made. DEPENDENT COVERAGE – Group rates under the group health insurance plan approved by the Government are made available to the spouse, dependents and disabled children of a qualified and participating retiree, if the premium is paid by the retired member, spouse, dependent, or disabled child. Upon the death of a retiree, the retiree’s surviving spouse is able to stay on the plan as long as the applicable premium payments are made. RETIREE GROUP HEALTH INSURANCE PLAN OPTIONS:
Humana PPO-A Humana PPO-B Humana HSA1 Humana HSA2 Humana Seniors Medicare Advantage Plan Anthem Seniors Standard Plan Anthem Seniors Comprehensive Plan
Retirees under age 65 may select from the Humana PPO Plan options. Retirees age 65 and older may select from any of the last three plan options above only if they are covered under Medicare Parts A and B. Medicare Part D coverage is provided to those retirees electing one of the Senior Plans above. CURRENT GROUP HEALTH MONTHLY INSURANCE PREMIUMS EFFECTIVE JANUARY 1, 2018:
Plan Option Single Two Party Humana PPO-A $758.91 $1,388.29 Humana PPO-B 561.61 1,027.36 Humana HSA1 511.15 935.04 Humana HSA2 501.48 797.53 Humana Seniors Medicare Advantage Plan 338.22 676.44 Anthem Seniors Standard Plan 163.31 326.62 Anthem Seniors Comprehensive Plan 191.39 382.78
The Government contributes $430.75 for an individual without the tobacco credit, $455.74 for an individual or an individual covering a spouse with the tobacco credit, and $480.74 for a family with the tobacco credit toward the premium for single coverage for retirees and $75 for surviving spouses without the tobacco credit and $100 for surviving spouses with the tobacco credit of active members who die in service due to occupational causes. The remainder of any premium is paid by retirees. OTHER POST EMPLOYMENT BENEFITS – Health care and prescription drug coverage is provided in all of the group health insurance plan options. Vision coverage is extended to those members electing the Humana Platinum Plan or the Humana Gold Plan.
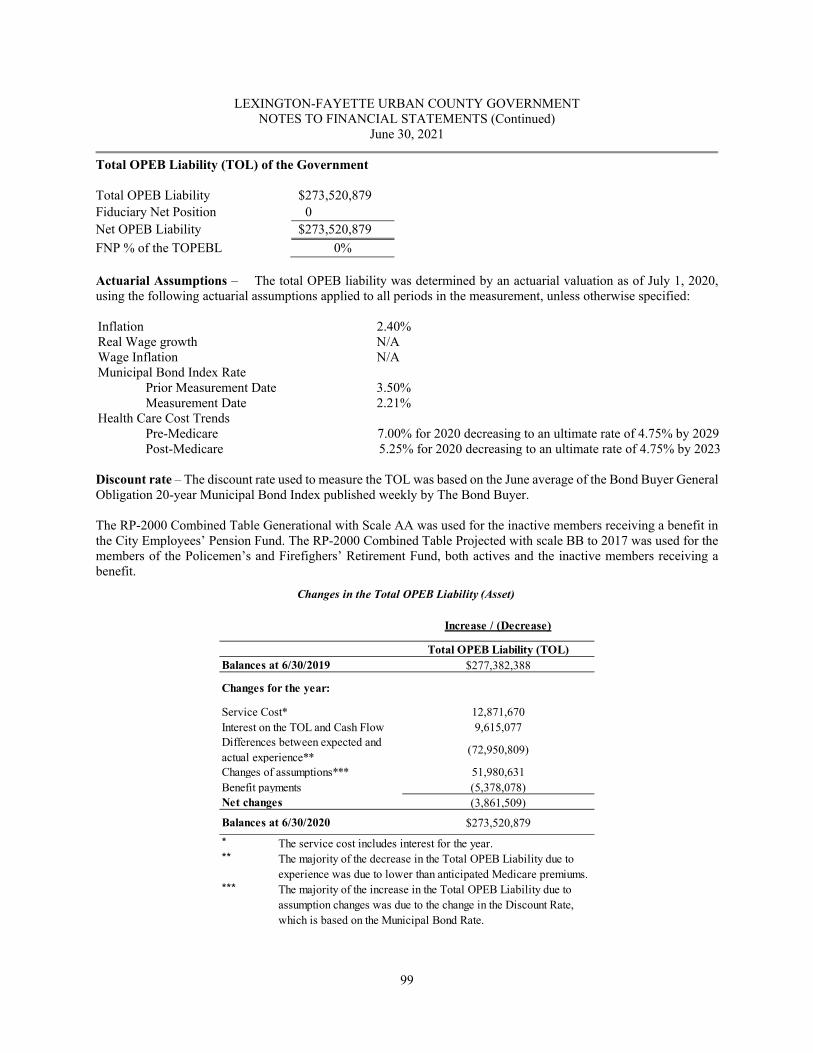
LEXINGTON-FAYETTE URBAN COUNTY GOVERNMENT NOTES TO FINANCIAL STATEMENTS (Continued)
June 30, 2021
99
Total OPEB Liability (TOL) of the Government Total OPEB Liability $273,520,879 Fiduciary Net Position 0 Net OPEB Liability $273,520,879 FNP % of the TOPEBL 0% Actuarial Assumptions – The total OPEB liability was determined by an actuarial valuation as of July 1, 2020, using the following actuarial assumptions applied to all periods in the measurement, unless otherwise specified: Inflation 2.40% Real Wage growth N/A Wage Inflation N/A Municipal Bond Index Rate
Prior Measurement Date 3.50% Measurement Date 2.21%
Health Care Cost Trends Pre-Medicare 7.00% for 2020 decreasing to an ultimate rate of 4.75% by 2029 Post-Medicare 5.25% for 2020 decreasing to an ultimate rate of 4.75% by 2023
Discount rate – The discount rate used to measure the TOL was based on the June average of the Bond Buyer General Obligation 20-year Municipal Bond Index published weekly by The Bond Buyer. The RP-2000 Combined Table Generational with Scale AA was used for the inactive members receiving a benefit in the City Employees’ Pension Fund. The RP-2000 Combined Table Projected with scale BB to 2017 was used for the members of the Policemen’s and Firefighers’ Retirement Fund, both actives and the inactive members receiving a benefit.
Increase / (Decrease)
Total OPEB Liability (TOL)$277,382,388
12,871,6709,615,077
(72,950,809)
51,980,631 (5,378,078)(3,861,509)
$273,520,879 * The service cost includes interest for the year.** The majority of the decrease in the Total OPEB Liability due to
experience was due to lower than anticipated Medicare premiums.*** The majority of the increase in the Total OPEB Liability due to
assumption changes was due to the change in the Discount Rate, which is based on the Municipal Bond Rate.
Interest on the TOL and Cash FlowDifferences between expected and actual experience**
Net changesBalances at 6/30/2020
Benefit paymentsChanges of assumptions***
Changes in the Total OPEB Liability (Asset)
Balances at 6/30/2019
Changes for the year:
Service Cost*
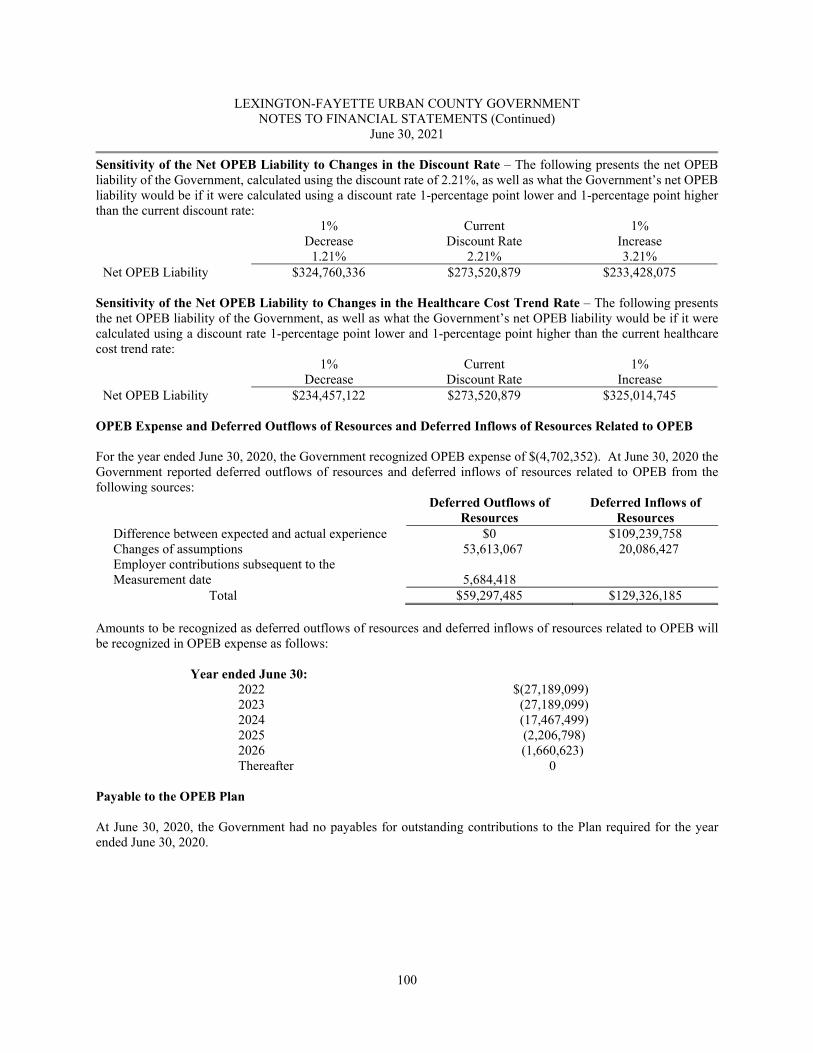
LEXINGTON-FAYETTE URBAN COUNTY GOVERNMENT NOTES TO FINANCIAL STATEMENTS (Continued)
June 30, 2021
100
Sensitivity of the Net OPEB Liability to Changes in the Discount Rate – The following presents the net OPEB liability of the Government, calculated using the discount rate of 2.21%, as well as what the Government’s net OPEB liability would be if it were calculated using a discount rate 1-percentage point lower and 1-percentage point higher than the current discount rate:
1% Decrease
1.21%
Current Discount Rate
2.21%
1% Increase 3.21%
Net OPEB Liability $324,760,336 $273,520,879 $233,428,075 Sensitivity of the Net OPEB Liability to Changes in the Healthcare Cost Trend Rate – The following presents the net OPEB liability of the Government, as well as what the Government’s net OPEB liability would be if it were calculated using a discount rate 1-percentage point lower and 1-percentage point higher than the current healthcare cost trend rate:
1% Decrease
Current Discount Rate
1% Increase
Net OPEB Liability $234,457,122 $273,520,879 $325,014,745 OPEB Expense and Deferred Outflows of Resources and Deferred Inflows of Resources Related to OPEB For the year ended June 30, 2020, the Government recognized OPEB expense of $(4,702,352). At June 30, 2020 the Government reported deferred outflows of resources and deferred inflows of resources related to OPEB from the following sources:
Deferred Outflows of
Resources Deferred Inflows of
Resources Difference between expected and actual experience $0 $109,239,758 Changes of assumptions 53,613,067 20,086,427 Employer contributions subsequent to the Measurement date 5,684,418
Total $59,297,485 $129,326,185 Amounts to be recognized as deferred outflows of resources and deferred inflows of resources related to OPEB will be recognized in OPEB expense as follows:
Year ended June 30: 2022 $(27,189,099) 2023 (27,189,099) 2024 (17,467,499) 2025 (2,206,798) 2026 (1,660,623) Thereafter 0
Payable to the OPEB Plan At June 30, 2020, the Government had no payables for outstanding contributions to the Plan required for the year ended June 30, 2020.
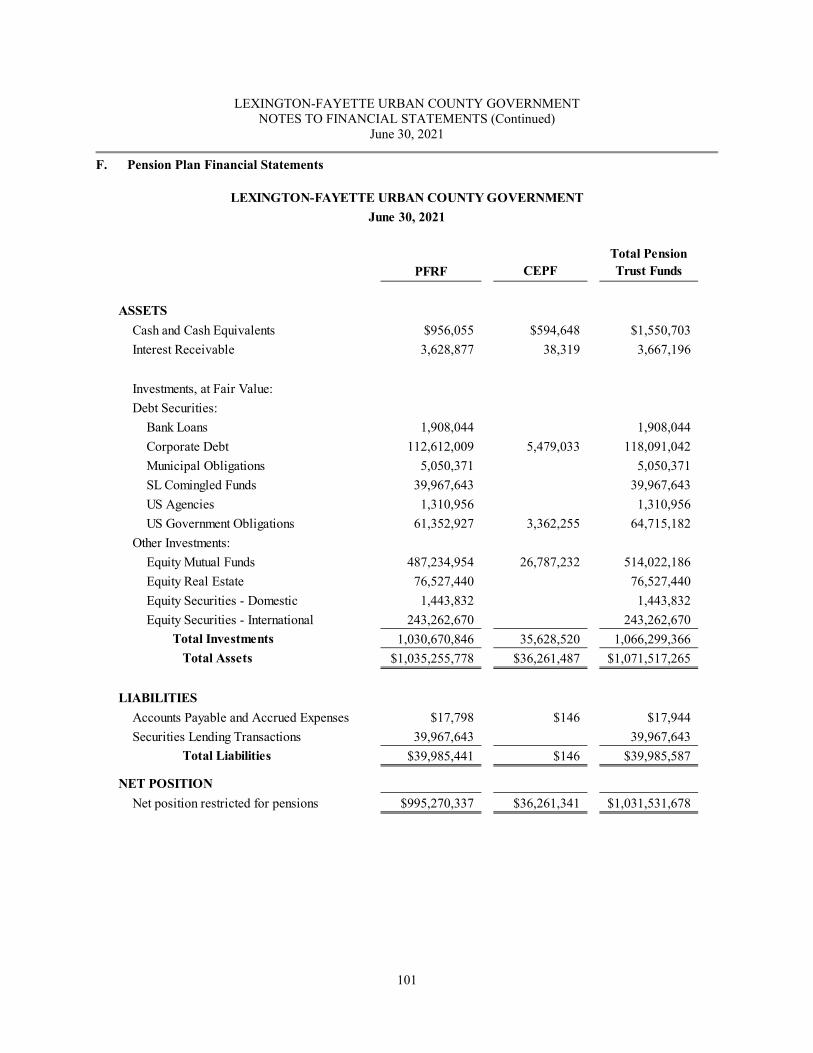
LEXINGTON-FAYETTE URBAN COUNTY GOVERNMENT NOTES TO FINANCIAL STATEMENTS (Continued)
June 30, 2021
101
F. Pension Plan Financial Statements
CEPFTotal Pension Trust Funds
ASSETSCash and Cash Equivalents $956,055 $594,648 $1,550,703Interest Receivable 3,628,877 38,319 3,667,196
Investments, at Fair Value: Debt Securities:
Bank Loans 1,908,044 1,908,044Corporate Debt 112,612,009 5,479,033 118,091,042Municipal Obligations 5,050,371 5,050,371SL Comingled Funds 39,967,643 39,967,643US Agencies 1,310,956 1,310,956US Government Obligations 61,352,927 3,362,255 64,715,182
Other Investments:Equity Mutual Funds 487,234,954 26,787,232 514,022,186Equity Real Estate 76,527,440 76,527,440Equity Securities - Domestic 1,443,832 1,443,832Equity Securities - International 243,262,670 243,262,670
Total Investments 1,030,670,846 35,628,520 1,066,299,366Total Assets $1,035,255,778 $36,261,487 $1,071,517,265
LIABILITIESAccounts Payable and Accrued Expenses $17,798 $146 $17,944Securities Lending Transactions 39,967,643 39,967,643
Total Liabilities $39,985,441 $146 $39,985,587
NET POSITIONNet position restricted for pensions $995,270,337 $36,261,341 $1,031,531,678
LEXINGTON-FAYETTE URBAN COUNTY GOVERNMENTJune 30, 2021
PFRF
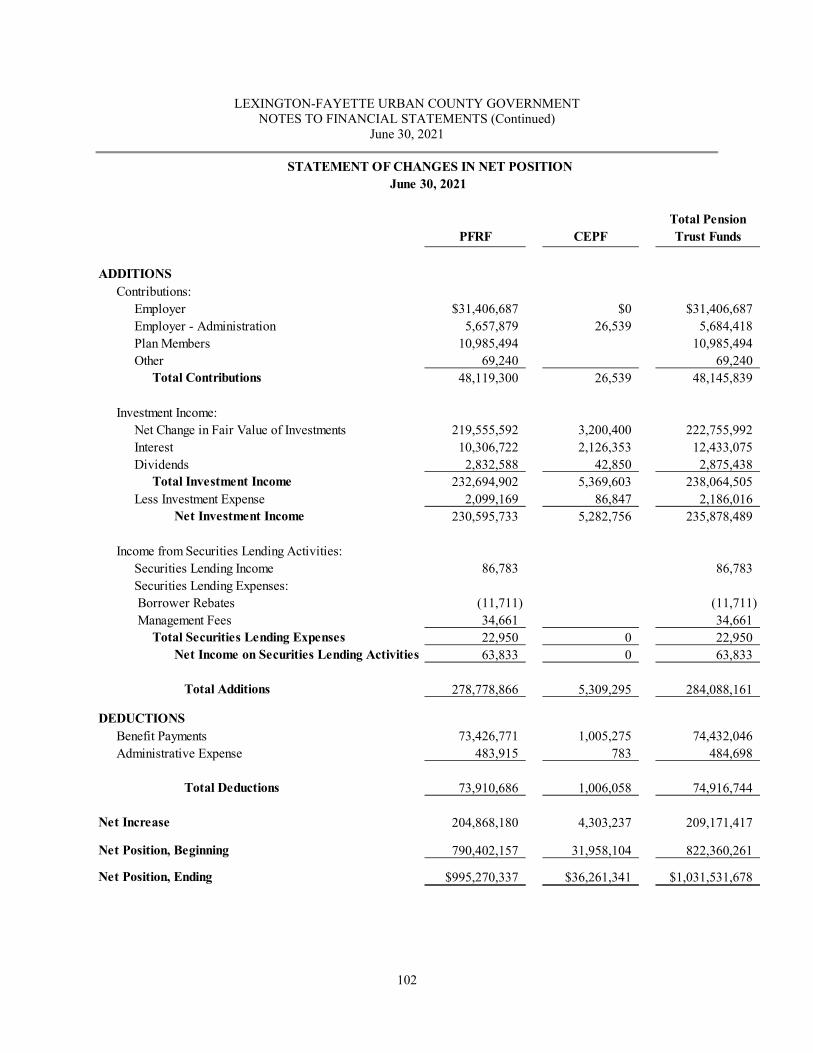
LEXINGTON-FAYETTE URBAN COUNTY GOVERNMENT NOTES TO FINANCIAL STATEMENTS (Continued)
June 30, 2021
102
PFRF CEPFTotal Pension Trust Funds
ADDITIONSContributions:
Employer $31,406,687 $0 $31,406,687Employer - Administration 5,657,879 26,539 5,684,418Plan Members 10,985,494 10,985,494Other 69,240 69,240
Total Contributions 48,119,300 26,539 48,145,839
Investment Income:Net Change in Fair Value of Investments 219,555,592 3,200,400 222,755,992Interest 10,306,722 2,126,353 12,433,075Dividends 2,832,588 42,850 2,875,438
Total Investment Income 232,694,902 5,369,603 238,064,505Less Investment Expense 2,099,169 86,847 2,186,016
Net Investment Income 230,595,733 5,282,756 235,878,489
Income from Securities Lending Activities:Securities Lending Income 86,783 86,783Securities Lending Expenses: Borrower Rebates (11,711) (11,711) Management Fees 34,661 34,661
Total Securities Lending Expenses 22,950 0 22,950Net Income on Securities Lending Activities 63,833 0 63,833
Total Additions 278,778,866 5,309,295 284,088,161
DEDUCTIONSBenefit Payments 73,426,771 1,005,275 74,432,046Administrative Expense 483,915 783 484,698
Total Deductions 73,910,686 1,006,058 74,916,744
Net Increase 204,868,180 4,303,237 209,171,417
Net Position, Beginning 790,402,157 31,958,104 822,360,261
Net Position, Ending $995,270,337 $36,261,341 $1,031,531,678
STATEMENT OF CHANGES IN NET POSITIONJune 30, 2021
LEXINGTON-FAYETTE URBAN COUNTY GOVERNMENT NOTES TO FINANCIAL STATEMENTS (Continued)
June 30, 2021
103
G. The County Employees' Retirement System Plan description – The Government contributes to the Commonwealth of Kentucky's County Employees' Retirement System (CERS) pursuant to KRS 78.530 administered by the Board of Trustees of the Kentucky Retirement System. CERS is a cost-sharing multi-employer public employee retirement system which covers substantially all regular full-time employees of each county, school board, and any additional eligible local agencies electing to participate in the System. At June 30, 2016, there were over 1,400 local government agencies participating in CERS, which provides for retirement, disability and death benefits. Beginning October 27, 1975, all eligible full-time employees of the Government were required to participate in CERS. Contributions – Nonhazardous covered employees are required to contribute 5% of their salary to the plan. Nonhazardous covered employees who begin participation on or after September 1, 2008 are required to contribute 6% of their salary to the plan. The Government’s contribution rate for nonhazardous employees was 19.30%. Hazardous covered employees are required to contribute 8% of their salary to the plan. Hazardous covered employees who began participation on or after September 1, 2008 are required to contribute 9% of their salary to be allocated as follows: 8% will go to the member’s account and 1% will go to the KRS insurance fund. The Government’s contribution rate for hazardous employees was 30.06%. The amounts contributed to CERS were $19,311,623, $20,050,133, and $16,718,583 respectively, for the years ended June 30, 2021, 2020, and 2019. The contractually required contribution amounts to CERS were $21,851,163, $20,990,058, and $21,120,711 respectively, for the years ended June 30, 2021, 2020, and 2019. Benefits provided – Benefits fully vest upon reaching five years of service for nonhazardous employees. Aspects of benefits for nonhazardous employees include retirement after 27 years of service or age 65. Nonhazardous employees who begin participation on or after September 1, 2008 must meet the rule of 87 (member’s age plus years of service credit must equal 87, and the member must be a minimum of 57 years of age) or the member is age 65, with a minimum of 60 months service credit. A cash balance plan was introduced for members whose participation date is on or after January 1, 2014. Benefits for hazardous employees include retirement after 20 years of service or age 55. For hazardous employees who began participation on or after September 1, 2008 aspects of benefits include retirement after 25 years of service or the member is age 60, with a minimum of 60 months of service credit. Prior to July 1, 2009, cost-of-living adjustments (COLA) were provided annually equal to the percentage increase in the annual average of the consumer price index for all urban consumers for the most recent calendar year, not to exceed 5% in any plan year. Effective July 2, 2009, and on July 1 of each year thereafter, the COLA is limited to 1.5% provided the recipient has been receiving a benefit for at least 12 months prior to the effective date of the COLA. If the recipient has been receiving a benefit for less than 12 months prior to the effective date of the COLA, the increase shall be reduced on a pro-rata basis for each month the recipient has not been receiving benefits in the 12 months preceding the effective date of the COLA. The Kentucky General Assembly reserves the right to suspend or reduce cost-of-living adjustments if, in its judgment, the welfare of the Commonwealth so demands. Pension Liabilities, Pension Expense, and Deferred Outflows of Resources and Deferred Inflows of Resources Related to Pensions The provisions of GASB Statement No. 67, Financial Reporting for Pension Plans, were issued in June 2012. The Statement replaced the requirements of Statements No. 25, Financial Reporting for Defined Benefit Pension Plans and Note Disclosures for Defined Contribution Plans, and No. 50, Pension Disclosures, as they relate to pension plans that are administered through trusts or equivalent arrangements that meet those criteria. At June 30, 2020, the Government reported a liability of $305,778,330 for its proportionate share of the net pension liability. The net pension liability was measured as of June 30, 2020, and the total pension liability used to calculate the net pension liability was determined by an actuarial valuation as of that date. The Government’s proportion of the
LEXINGTON-FAYETTE URBAN COUNTY GOVERNMENT NOTES TO FINANCIAL STATEMENTS (Continued)
June 30, 2021
104
net pension liability was based on a projection of the Government’s long term share of contributions to the pension plan relative to the projected contributions of all participating governmental agencies, as actuarially determined. At June 30, 2020, the Government’s portion of nonhazardous and hazardous was 3.06% and 2.34%, respectively. At June 30, 2020, the Government reported pension expense of $27,708,528. At June 30, 2020, the Government reported deferred outflows of resources and deferred inflows of resources related to pensions from the following sources:
Deferred Outflows of
Resources Deferred Inflows of
Resources Difference between expected and actual experience $8,053,991 Difference between projected and actual earnings on pension plan investments 12,867,903 $5,392,330 Change of assumptions 11,860,901 Changes in proportion and differences between Employer contributions and proportionate share of contributions 35,185 2,731,489 Government contributions subsequent to the measurement date 19,311,623
Total $52,129,603 $8,123,819 The $19,311,623 reported as deferred outflows of resources related to pensions resulting from Government contributions subsequent to the measurement date will be recognized as a reductions of the net pension liability in the subsequent fiscal period rather than in the current fiscal period. Other amounts reported as deferred outflows of resources and deferred inflows of resources related to pensions will be recognized in pension expense as follows:
Year ended June 30: 2021 $10,946,759 2022 7,203,995 2023 3,537,977 2024 3,005,432 2025 0 Thereafter 0
The total pension liability, net pension liability, and sensitivity information shown in this report are based on an actuarial valuation performed as of June 30, 2019. The total pension liability was rolled-forward from the valuation date to the plan’s fiscal year end, June 30, 2020, using generally accepted actuarial principles. There have been no changes in plan provisions since June 30, 2018. However, the Board of Trustees has adopted new actuarial assumptions since June 30, 2018. These assumptions are documented in the report titled “Kentucky Retirement Systems 2018 Actuarial Experience Study for the Period Ending June 30, 2018”. The Total Pension liability as of June 30, 2020 is determined using these updated assumptions. It is our opinion that these procedures are reasonable and appropriate, and comply with applicable requirements under GASB No. 68. The Actuarial Cost Method is Entry Age Normal, Level Percentage of Pay, as required by GASB Statement No. 67. The Entry Age Normal actuarial cost method allocates the System’s actuarial present value of future benefits to various periods based upon service. The portion of the present value of future benefits allocated to years of service prior to the valuation date is the actuarial accrued liability, and the portion allocated to years following the valuation date is the present value of future normal costs. The normal cost is determined for each active member as the level percent of pay necessary to fully fund the expected benefits to be earned over the career of each individual active member. The normal cost is partially funded with active member contributions with the remainder funded by employer contributions.
LEXINGTON-FAYETTE URBAN COUNTY GOVERNMENT NOTES TO FINANCIAL STATEMENTS (Continued)
June 30, 2021
105
The total pension liability in the June 30, 2020 actuarial valuation was determined using the following actuarial assumptions, applied to all periods included in the measurement:
Investment rate of return 6.25%, net of pension plan investment expense, including inflation
Projected salary increases 2 %, average, including inflation Inflation 2.30%
The following presents the net pension liability of the Government’s CERS pension plan, calculated using the discount rate of 6.25%, as well as what the CERS’s net pension liability would be if it were calculated using a discount rate that is 1-percentage-point lower (5.25%) or 1-percentage-point higher (7.25%) than the current rate:
1% Decrease
(5.25%) Current Discount
Rate (6.25%) 1% Increase
(7.25%) Nonhazardous $290,065,177 $235,210,053 $189,787,925 Hazardous 87,212,341 70,568,277 56,982,322
CERS’s net pension liability $377,277,518 $305,778,330 $246,770,247 Payable to the Pension Plan At June 30, 2021, the CERS reported payables of $114,179 from the Government for the outstanding amount of contributions to the pension plan required for the year ended June 30, 2021. Detailed information about the pension plan’s fiduciary net position is available in the CERS financial report that includes financial statements and required supplementary information. The report may be obtained by writing to the Kentucky Retirement Systems, Perimeter Park West, 1260 Louisville Road, Frankfort, KY 40601, or by telephone at (502) 696-8800. H. The County Employees' Retirement System Other Paid Employee Benefits (OPEB) Under the provisions of Kentucky Revised Statute Section 61.645, the Board of Trustees (the Board) of Kentucky Retirement Systems (KRS) administers the Kentucky Employees Retirement System (KERS), County Employees Retirement System (CERS), and State Police Retirement System (SPRS). Although the assets of the systems are invested as a whole, each system’s assets are used only for the payment of benefits to the members of that plan, and the administrative costs incurred by those receiving an insurance benefit, in accordance with the provisions of Kentucky Revised Statute Sections 16.510, 61.515, 61.702, 78.520, and 78.630. The Board of Trustees, as of December 3, 2020, is comprised of David L. Harris, Chair, Governor Appointee; Keith Peercy, Vice Chair, elected by SPRS; W. Joe Brothers, Governor Appointee; John E. Chilton, Governor Appointee; Kelly Downard, Governor Appointee; Joseph L. Grossman, Governor Appointee; C. Prewitt Lane, Governor Appointee; J.T. Fulkerson, Governor Appointee; Matthew Monteiro, Governor Appointee; Gerina Whethers, Personnel Secretary Ex-Officio; and one vacant Governor Appointee position; Raymond Campbell Connell, elected by KERS; Sherry Lynn Kremer, elected by KERS; Betty Pendergrass, elected by CERS; Jerry W. Powell, elected by CERS; and David Rich, elected by CERS. CERS Non‐hazardous and CERS Hazardous Insurance Funds are costsharing multiple‐employer defined benefit Other Postemployment Benefits (OPEB) plans for members that cover all regular full‐time members employed in non‐hazardous and hazardous duty positions of any state department, board, agency, county, city, school board, and any additional eligible local agencies electing to participate. The plans provide for health insurance benefits to plan members. OPEB may be extended to beneficiaries of plan members under certain circumstances.
LEXINGTON-FAYETTE URBAN COUNTY GOVERNMENT NOTES TO FINANCIAL STATEMENTS (Continued)
June 30, 2021
106
Relationship to Combining Financial Statements The Schedule was reconciled to the Plan’s Combining Statement of Changes in Fiduciary Net Position – Insurance Fund in KRS’ Comprehensive Annual Financial Report (CAFR) for the fiscal year ended June 30, 2020, with the following difference. The 1% of pay member contributions for Tier 2 and Tier 3 members to a 401(h) subaccount on the Pension Funds are considered as an OPEB asset. As a result, the reported plan fiduciary net position for the Insurance Fund as of June 30, 2020, includes the 401(h) asset balance. The components associated with OPEB expense and deferred outflows and inflows of resources have been determined based on the net increase in fiduciary net position as shown in the Combining Statement of Changes in Fiduciary Net Position and in accordance with requirements promulgated by Governmental Accounting Standards Board (GASB) Statements No. 74 and 75. The net OPEB liability at June 30, 2020, is reported in the Notes to Combining Financial Statements and Required Supplementary Information. Summary of Significant Accounting and Reporting Policies Measurement Focus, Basis of Accounting and Basis of Presentation The accompanying Schedules were prepared in accordance with U.S. generally accepted accounting principles as applicable to governmental organizations. In doing so, KRS adheres to the reporting requirements established by the Governmental Accounting Standards Board (GASB). The CERS Non-hazardous, CERS Hazardous, KERS Non-hazardous, KERS Hazardous Insurance Funds are reported as OPEB trust funds, and are accounted for on the accrual basis of accounting. OPEB contributions are determined by the KRS Board and required by the employers, and the employees contributions are set by Kentucky Revised Statute 61.702(2)(b)(1). KRS recognized employer and employee contributions to the plans through June 30, 2020. OPEB expenses are recognized as the benefits come due for the CERS Non-hazardous, CERS Hazardous, KERS Non-hazardous, and KERS Hazardous Insurance Plans, which includes payments made to the Department of Employee Insurance (DEI), and Humana Inc. for OPEB costs incurred for the fiscal year ended June 30, 2020. KRS contracts with DEI and Humana to administer the claims. DEI administers retiree claims for retirees under the age of 65, and Humana administers retiree claims for members 65 and over. Since, the average cost of providing health care benefits to retirees under age 65 is higher than the average cost of providing health care benefits to active employees, there is an implicit employer subsidy for the non-Medicare eligible retirees. GASB 74 requires that the liability associated with this implicit subsidy be included in the calculation of the Total OPEB Liability. Net investment income represents realized and unrealized gains and losses based on the fair value of investments, interest, and dividends, net of investment expenses. Investment income/loss is allocated to each plan based on the plan’s ownership in the respective investment account. The systems are charged administrative expenses based on the number of members and dependents electing an insurance policy provided by DEI or Humana, on a monthly basis. The administrative expenses are reported in KRS’ basic financial statements included in its CAFR for the Insurance Fund. The Schedule of Employer Allocations reflects employer contributions received for the fiscal year ended June 30, 2020, and includes the following for each individual employer:
employer contributing entity and reporting code; the amount of the employer contributing entity’s contributions; and, the employer contributing entity’s contributions as a percentage of total employer contributions, as
defined by this allocation.
The Employer Allocation Percentage has been rounded to six decimal places.
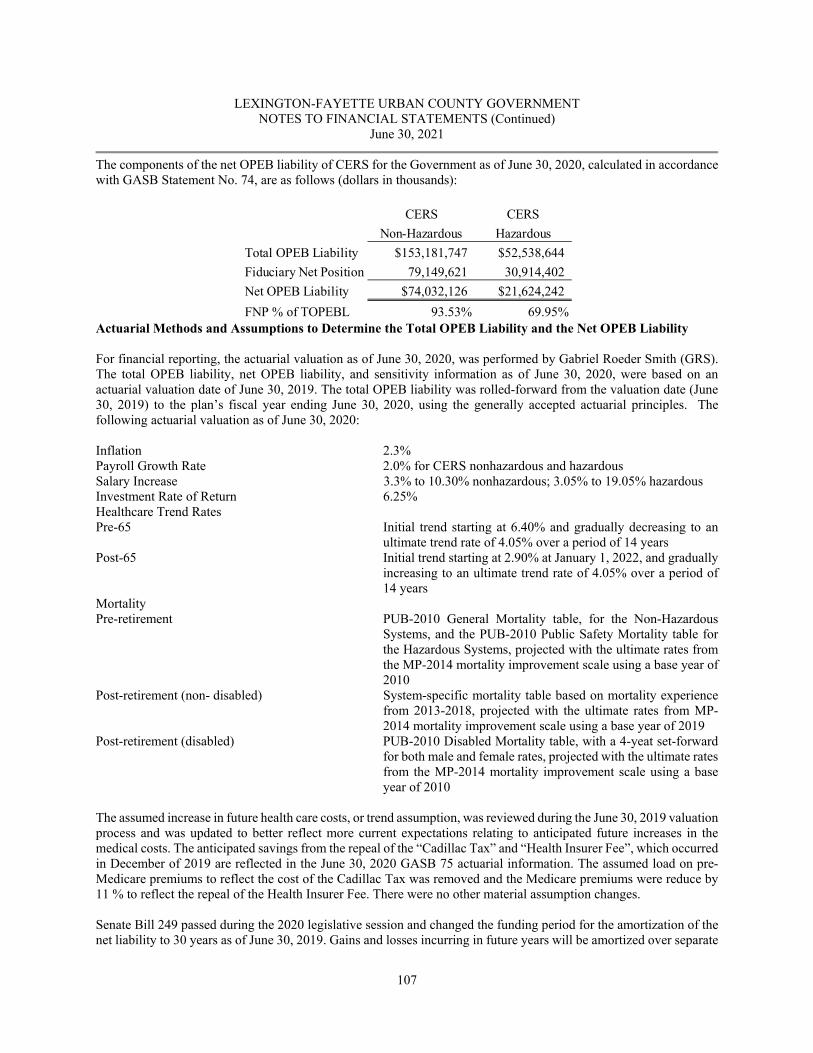
LEXINGTON-FAYETTE URBAN COUNTY GOVERNMENT NOTES TO FINANCIAL STATEMENTS (Continued)
June 30, 2021
107
The components of the net OPEB liability of CERS for the Government as of June 30, 2020, calculated in accordance with GASB Statement No. 74, are as follows (dollars in thousands):
CERS CERSNon-Hazardous Hazardous
Total OPEB Liability $153,181,747 $52,538,644Fiduciary Net Position 79,149,621 30,914,402 Net OPEB Liability $74,032,126 $21,624,242FNP % of TOPEBL 93.53% 69.95%
Actuarial Methods and Assumptions to Determine the Total OPEB Liability and the Net OPEB Liability For financial reporting, the actuarial valuation as of June 30, 2020, was performed by Gabriel Roeder Smith (GRS). The total OPEB liability, net OPEB liability, and sensitivity information as of June 30, 2020, were based on an actuarial valuation date of June 30, 2019. The total OPEB liability was rolled-forward from the valuation date (June 30, 2019) to the plan’s fiscal year ending June 30, 2020, using the generally accepted actuarial principles. The following actuarial valuation as of June 30, 2020: Inflation 2.3% Payroll Growth Rate 2.0% for CERS nonhazardous and hazardous Salary Increase 3.3% to 10.30% nonhazardous; 3.05% to 19.05% hazardous Investment Rate of Return 6.25% Healthcare Trend Rates Pre-65 Initial trend starting at 6.40% and gradually decreasing to an
ultimate trend rate of 4.05% over a period of 14 years Post‐65 Initial trend starting at 2.90% at January 1, 2022, and gradually
increasing to an ultimate trend rate of 4.05% over a period of 14 years
Mortality Pre-retirement PUB-2010 General Mortality table, for the Non-Hazardous
Systems, and the PUB-2010 Public Safety Mortality table for the Hazardous Systems, projected with the ultimate rates from the MP-2014 mortality improvement scale using a base year of 2010
Post-retirement (non- disabled) System-specific mortality table based on mortality experience from 2013-2018, projected with the ultimate rates from MP-2014 mortality improvement scale using a base year of 2019
Post-retirement (disabled) PUB-2010 Disabled Mortality table, with a 4-yeat set-forward for both male and female rates, projected with the ultimate rates from the MP-2014 mortality improvement scale using a base year of 2010
The assumed increase in future health care costs, or trend assumption, was reviewed during the June 30, 2019 valuation process and was updated to better reflect more current expectations relating to anticipated future increases in the medical costs. The anticipated savings from the repeal of the “Cadillac Tax” and “Health Insurer Fee”, which occurred in December of 2019 are reflected in the June 30, 2020 GASB 75 actuarial information. The assumed load on pre-Medicare premiums to reflect the cost of the Cadillac Tax was removed and the Medicare premiums were reduce by 11 % to reflect the repeal of the Health Insurer Fee. There were no other material assumption changes. Senate Bill 249 passed during the 2020 legislative session and changed the funding period for the amortization of the net liability to 30 years as of June 30, 2019. Gains and losses incurring in future years will be amortized over separate
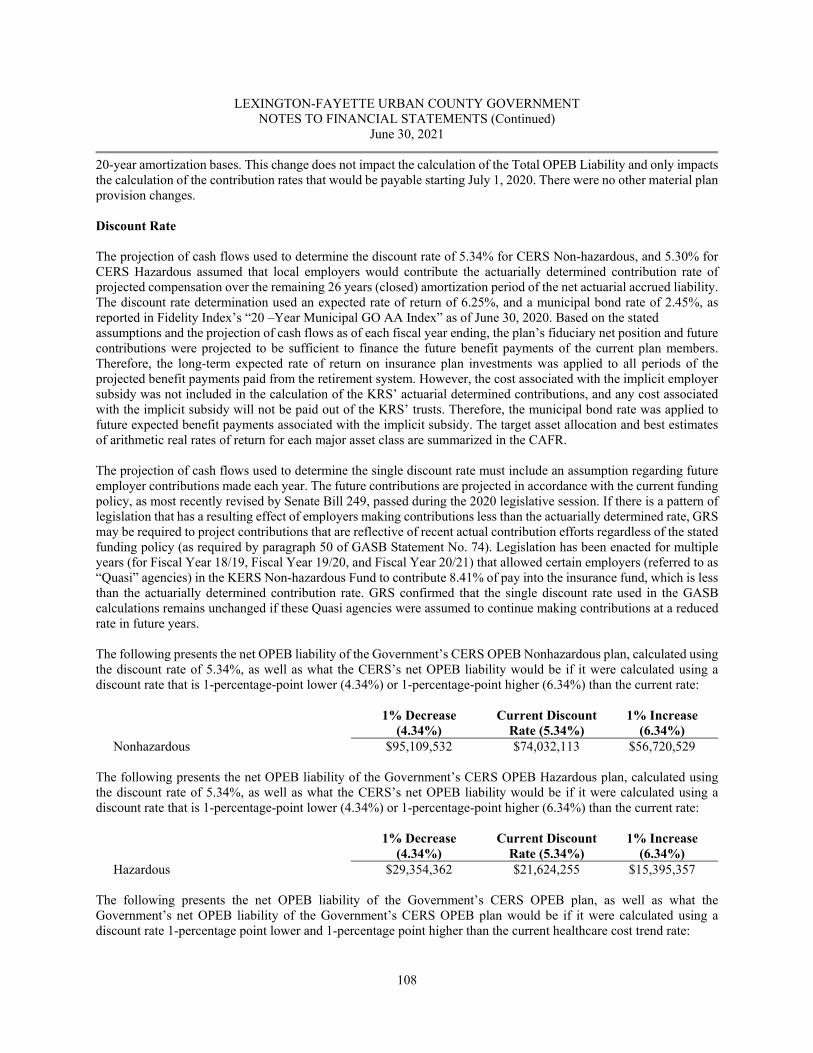
LEXINGTON-FAYETTE URBAN COUNTY GOVERNMENT NOTES TO FINANCIAL STATEMENTS (Continued)
June 30, 2021
108
20-year amortization bases. This change does not impact the calculation of the Total OPEB Liability and only impacts the calculation of the contribution rates that would be payable starting July 1, 2020. There were no other material plan provision changes. Discount Rate The projection of cash flows used to determine the discount rate of 5.34% for CERS Non‐hazardous, and 5.30% for CERS Hazardous assumed that local employers would contribute the actuarially determined contribution rate of projected compensation over the remaining 26 years (closed) amortization period of the net actuarial accrued liability. The discount rate determination used an expected rate of return of 6.25%, and a municipal bond rate of 2.45%, as reported in Fidelity Index’s “20 –Year Municipal GO AA Index” as of June 30, 2020. Based on the stated assumptions and the projection of cash flows as of each fiscal year ending, the plan’s fiduciary net position and future contributions were projected to be sufficient to finance the future benefit payments of the current plan members. Therefore, the long-term expected rate of return on insurance plan investments was applied to all periods of the projected benefit payments paid from the retirement system. However, the cost associated with the implicit employer subsidy was not included in the calculation of the KRS’ actuarial determined contributions, and any cost associated with the implicit subsidy will not be paid out of the KRS’ trusts. Therefore, the municipal bond rate was applied to future expected benefit payments associated with the implicit subsidy. The target asset allocation and best estimates of arithmetic real rates of return for each major asset class are summarized in the CAFR. The projection of cash flows used to determine the single discount rate must include an assumption regarding future employer contributions made each year. The future contributions are projected in accordance with the current funding policy, as most recently revised by Senate Bill 249, passed during the 2020 legislative session. If there is a pattern of legislation that has a resulting effect of employers making contributions less than the actuarially determined rate, GRS may be required to project contributions that are reflective of recent actual contribution efforts regardless of the stated funding policy (as required by paragraph 50 of GASB Statement No. 74). Legislation has been enacted for multiple years (for Fiscal Year 18/19, Fiscal Year 19/20, and Fiscal Year 20/21) that allowed certain employers (referred to as “Quasi” agencies) in the KERS Non-hazardous Fund to contribute 8.41% of pay into the insurance fund, which is less than the actuarially determined contribution rate. GRS confirmed that the single discount rate used in the GASB calculations remains unchanged if these Quasi agencies were assumed to continue making contributions at a reduced rate in future years. The following presents the net OPEB liability of the Government’s CERS OPEB Nonhazardous plan, calculated using the discount rate of 5.34%, as well as what the CERS’s net OPEB liability would be if it were calculated using a discount rate that is 1-percentage-point lower (4.34%) or 1-percentage-point higher (6.34%) than the current rate:
1% Decrease
(4.34%) Current Discount
Rate (5.34%) 1% Increase
(6.34%) Nonhazardous $95,109,532 $74,032,113 $56,720,529
The following presents the net OPEB liability of the Government’s CERS OPEB Hazardous plan, calculated using the discount rate of 5.34%, as well as what the CERS’s net OPEB liability would be if it were calculated using a discount rate that is 1-percentage-point lower (4.34%) or 1-percentage-point higher (6.34%) than the current rate:
1% Decrease
(4.34%) Current Discount
Rate (5.34%) 1% Increase
(6.34%) Hazardous $29,354,362 $21,624,255 $15,395,357
The following presents the net OPEB liability of the Government’s CERS OPEB plan, as well as what the Government’s net OPEB liability of the Government’s CERS OPEB plan would be if it were calculated using a discount rate 1-percentage point lower and 1-percentage point higher than the current healthcare cost trend rate:
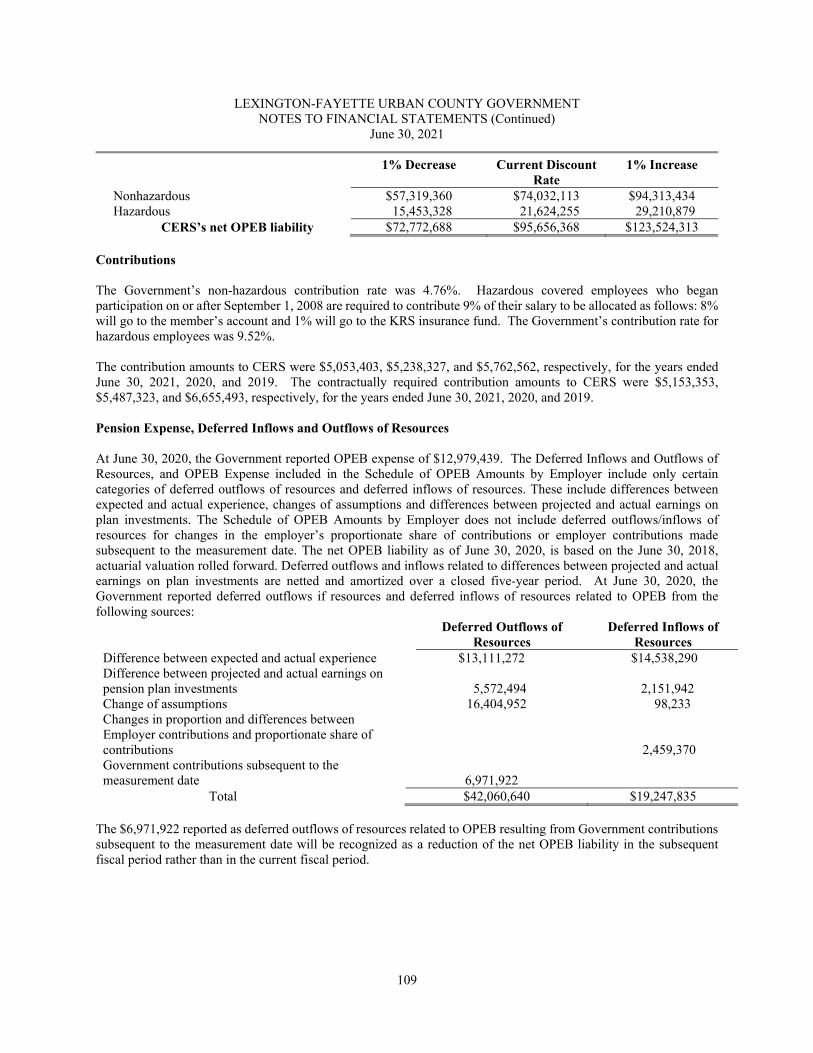
LEXINGTON-FAYETTE URBAN COUNTY GOVERNMENT NOTES TO FINANCIAL STATEMENTS (Continued)
June 30, 2021
109
1% Decrease
Current Discount
Rate 1% Increase
Nonhazardous $57,319,360 $74,032,113 $94,313,434 Hazardous 15,453,328 21,624,255 29,210,879
CERS’s net OPEB liability $72,772,688 $95,656,368 $123,524,313 Contributions The Government’s non-hazardous contribution rate was 4.76%. Hazardous covered employees who began participation on or after September 1, 2008 are required to contribute 9% of their salary to be allocated as follows: 8% will go to the member’s account and 1% will go to the KRS insurance fund. The Government’s contribution rate for hazardous employees was 9.52%. The contribution amounts to CERS were $5,053,403, $5,238,327, and $5,762,562, respectively, for the years ended June 30, 2021, 2020, and 2019. The contractually required contribution amounts to CERS were $5,153,353, $5,487,323, and $6,655,493, respectively, for the years ended June 30, 2021, 2020, and 2019. Pension Expense, Deferred Inflows and Outflows of Resources At June 30, 2020, the Government reported OPEB expense of $12,979,439. The Deferred Inflows and Outflows of Resources, and OPEB Expense included in the Schedule of OPEB Amounts by Employer include only certain categories of deferred outflows of resources and deferred inflows of resources. These include differences between expected and actual experience, changes of assumptions and differences between projected and actual earnings on plan investments. The Schedule of OPEB Amounts by Employer does not include deferred outflows/inflows of resources for changes in the employer’s proportionate share of contributions or employer contributions made subsequent to the measurement date. The net OPEB liability as of June 30, 2020, is based on the June 30, 2018, actuarial valuation rolled forward. Deferred outflows and inflows related to differences between projected and actual earnings on plan investments are netted and amortized over a closed five‐year period. At June 30, 2020, the Government reported deferred outflows if resources and deferred inflows of resources related to OPEB from the following sources:
Deferred Outflows of
Resources Deferred Inflows of
Resources Difference between expected and actual experience $13,111,272 $14,538,290 Difference between projected and actual earnings on pension plan investments 5,572,494 2,151,942 Change of assumptions 16,404,952 98,233 Changes in proportion and differences between Employer contributions and proportionate share of contributions 2,459,370 Government contributions subsequent to the measurement date 6,971,922
Total $42,060,640 $19,247,835 The $6,971,922 reported as deferred outflows of resources related to OPEB resulting from Government contributions subsequent to the measurement date will be recognized as a reduction of the net OPEB liability in the subsequent fiscal period rather than in the current fiscal period.
LEXINGTON-FAYETTE URBAN COUNTY GOVERNMENT NOTES TO FINANCIAL STATEMENTS (Continued)
June 30, 2021
110
Other amount reported as deferred outflows of resources and deferred inflows of resources related to OPEB will be recognized in OPEB expense as follows:
Year ended June 30: 2021 $4,264,375 2022 4,479,349 2023 3,552,734 2024 3,527,961 2025 16,464 Thereafter 0
Payable to the OPEB Plan At June 30, 2021, the CERS reported payables credit balance of $12,151 from the Government for the outstanding amount of contributions to the OPEB plan required for the year ended June 30, 2021. Detailed information about the OPEB plan’s fiduciary net position is available in the CERS financial report that includes financial statements and required supplementary information. The report may be obtained by writing to the Kentucky Retirement Systems, Perimeter Park West, 1260 Louisville Road, Frankfort, KY 40601, or by telephone at (502) 696-8800. NOTE 9. RECENT GASB PRONOUNCEMENTS Standards that will Become Effective for FY 2021 and Later Year Financial Statements Statement No. 87, Leases, the objective of which is to better meet the information needs of financial statement users by improving accounting and financial reporting for leases by governments. It requires recognition of certain lease assets and liabilities for leases that previously were classified as operating leases and recognized as inflows of resources or outflows of resources based on the payment provisions of the contract. (FY 2022) Statement No. 91, Conduit Debt Obligations, the primary objectives of this Statement is to provide a single method of reporting conduit debt obligations by issuers and eliminate diversity in practice associated with (1) commitments extended by issuers, (2) arrangements associated with conduit debt obligations, and (3) related note disclosures. This Statement establishes that a conduit debt obligation is not a liability of the issuer. (FY 2022) Statement No. 96, Subscription-Based Information Technology Arrangements (SBITA), provides guidance on the accounting and financial reporting for SBITAs, by establishing that a SBITA results in an intangible asset and a corresponding subscription liability, capitalization criteria, and required note disclosures. (FY 2023) GASB Statement No. 97, Certain Component Unit Criteria, and Accounting and Financial Reporting for Internal Revenue Code Section 457 Deferred Compensation Plans, this statement clarifies when the entity has no governing board and the government performs the functions that a board would normally perform, the consideration of consolidation should be the same as if the government appointed a voting majority of a hypothetical governing board and modifies the applicability of certain component unit criteria as they relate to various benefit plans. (FY 2022) GASB Statement No. 98, The Annual Comprehensive Financial Report, which establishes the term annual comprehensive financial report and its acronym ACRF. That new term and acronym replace instances of comprehensive annual financial report and its acronym in generally accepted accounting principles for state and local governments. (FY2022) The Government has not yet determined the effect, if any, that the adoption of these Statements may have on its financial statements.
111
REQUIRED SUPPLEMENTARY INFORMATION
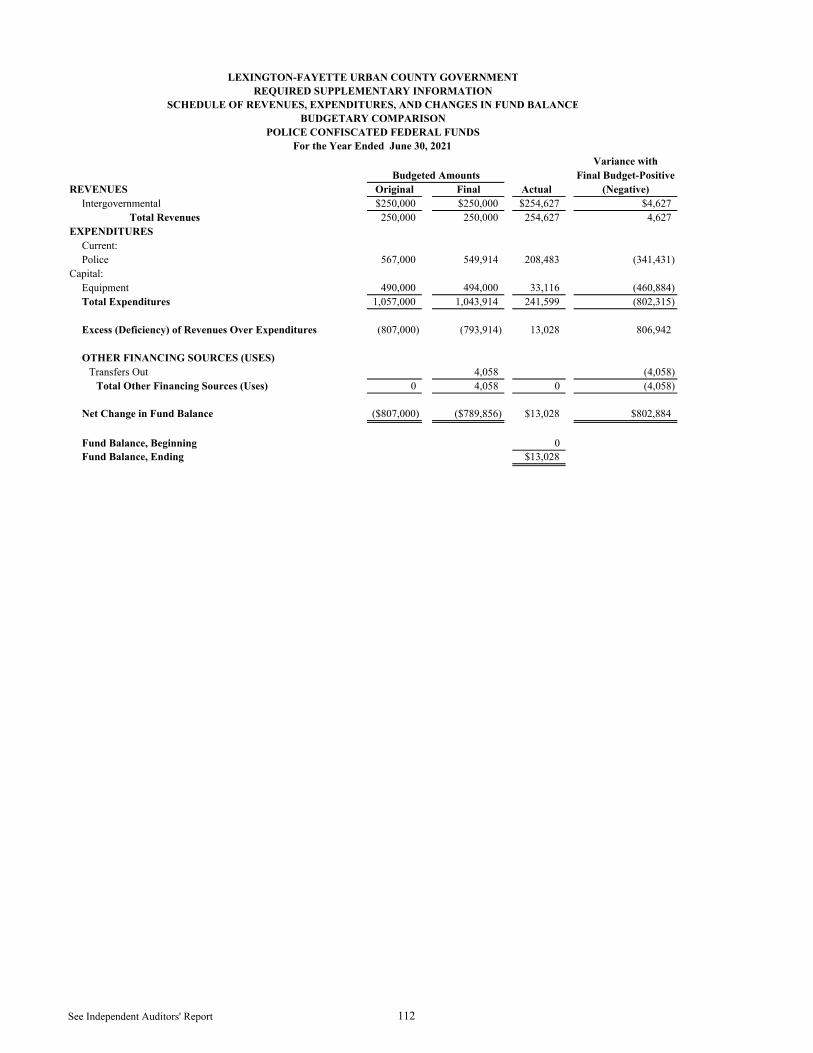
Variance withFinal Budget-Positive
REVENUES Original Final Actual (Negative)Intergovernmental $250,000 $250,000 $254,627 $4,627
Total Revenues 250,000 250,000 254,627 4,627EXPENDITURES
Current:Police 567,000 549,914 208,483 (341,431)
Capital:Equipment 490,000 494,000 33,116 (460,884)Total Expenditures 1,057,000 1,043,914 241,599 (802,315)
Excess (Deficiency) of Revenues Over Expenditures (807,000) (793,914) 13,028 806,942
OTHER FINANCING SOURCES (USES)Transfers Out 4,058 (4,058)
Total Other Financing Sources (Uses) 0 4,058 0 (4,058)
Net Change in Fund Balance ($807,000) ($789,856) $13,028 $802,884
Fund Balance, Beginning 0Fund Balance, Ending $13,028
For the Year Ended June 30, 2021
Budgeted Amounts
LEXINGTON-FAYETTE URBAN COUNTY GOVERNMENTREQUIRED SUPPLEMENTARY INFORMATION
SCHEDULE OF REVENUES, EXPENDITURES, AND CHANGES IN FUND BALANCEBUDGETARY COMPARISON
POLICE CONFISCATED FEDERAL FUNDS
See Independent Auditors' Report 112
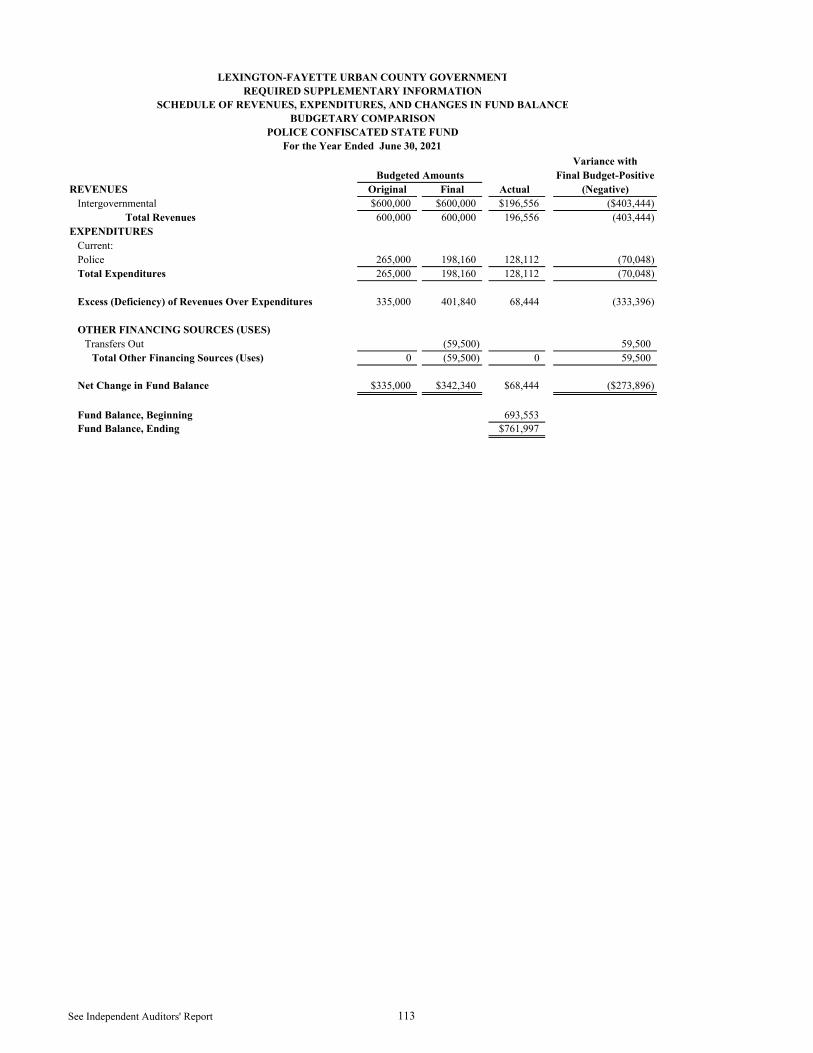
Variance withFinal Budget-Positive
REVENUES Original Final Actual (Negative)Intergovernmental $600,000 $600,000 $196,556 ($403,444)
Total Revenues 600,000 600,000 196,556 (403,444)EXPENDITURES
Current:Police 265,000 198,160 128,112 (70,048)Total Expenditures 265,000 198,160 128,112 (70,048)
Excess (Deficiency) of Revenues Over Expenditures 335,000 401,840 68,444 (333,396)
OTHER FINANCING SOURCES (USES)Transfers Out (59,500) 59,500
Total Other Financing Sources (Uses) 0 (59,500) 0 59,500
Net Change in Fund Balance $335,000 $342,340 $68,444 ($273,896)
Fund Balance, Beginning 693,553Fund Balance, Ending $761,997
Budgeted Amounts
LEXINGTON-FAYETTE URBAN COUNTY GOVERNMENTREQUIRED SUPPLEMENTARY INFORMATION
SCHEDULE OF REVENUES, EXPENDITURES, AND CHANGES IN FUND BALANCEBUDGETARY COMPARISON
POLICE CONFISCATED STATE FUNDFor the Year Ended June 30, 2021
See Independent Auditors' Report 113

Variance withFinal Budget-Positive
REVENUES Original Final Actual (Negative)Intergovernmental $250,000 $250,000 $185,654 ($64,346)
Total Revenues 250,000 250,000 185,654 (64,346)EXPENDITURES
Current:Capital:
Equipment 164,422 161,422 (3,000)Acquisitions and Construction 51,033 51,033 Total Expenditures 0 215,455 212,455 (3,000)
Excess (Deficiency) of Revenues (Under) Expenditures 250,000 34,545 (26,801) (61,346)
OTHER FINANCING SOURCES (USES)Transfers Out (300,000) (300,000) (300,000)
Total Other Financing Sources (Uses) (300,000) (300,000) (300,000) 0
Net Change in Fund Balance ($50,000) ($265,455) ($326,801) ($61,346)
Fund Balance, Beginning 463,513Fund Balance, Ending $136,712
Budgeted Amounts
LEXINGTON-FAYETTE URBAN COUNTY GOVERNMENTREQUIRED SUPPLEMENTARY INFORMATION
SCHEDULE OF REVENUES, EXPENDITURES, AND CHANGES IN FUND BALANCEBUDGETARY COMPARISON
PUBLIC SAFETY FUNDSFor the Year Ended June 30, 2021
See Independent Auditors' Report 114
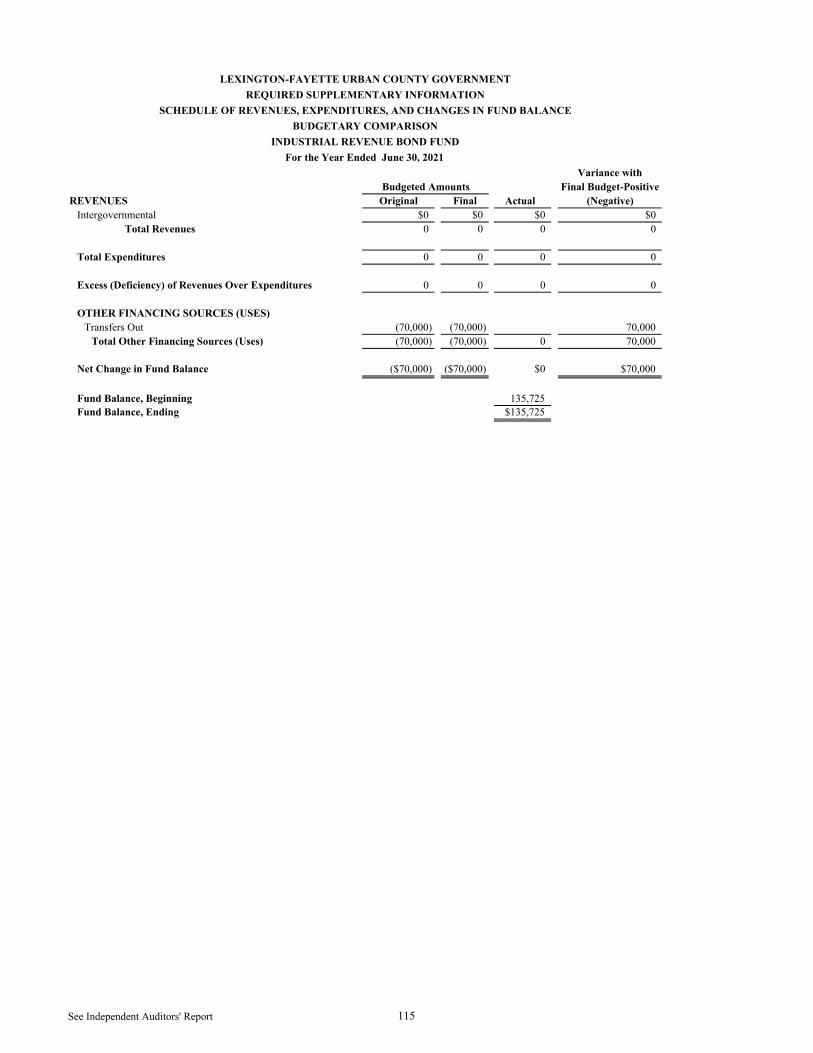
Variance withFinal Budget-Positive
REVENUES Original Final Actual (Negative)Intergovernmental $0 $0 $0 $0
Total Revenues 0 0 0 0
Total Expenditures 0 0 0 0
Excess (Deficiency) of Revenues Over Expenditures 0 0 0 0
OTHER FINANCING SOURCES (USES)Transfers Out (70,000) (70,000) 70,000
Total Other Financing Sources (Uses) (70,000) (70,000) 0 70,000
Net Change in Fund Balance ($70,000) ($70,000) $0 $70,000
Fund Balance, Beginning 135,725Fund Balance, Ending $135,725
Budgeted Amounts
LEXINGTON-FAYETTE URBAN COUNTY GOVERNMENTREQUIRED SUPPLEMENTARY INFORMATION
SCHEDULE OF REVENUES, EXPENDITURES, AND CHANGES IN FUND BALANCEBUDGETARY COMPARISON
INDUSTRIAL REVENUE BOND FUNDFor the Year Ended June 30, 2021
See Independent Auditors' Report 115
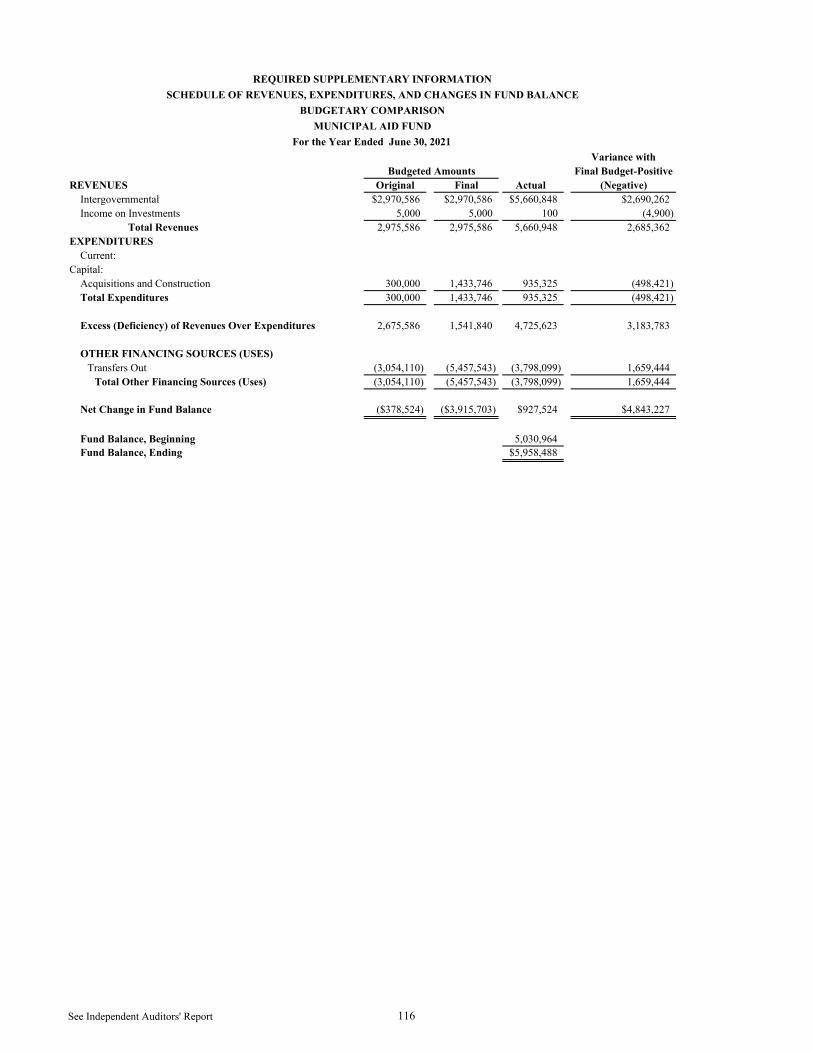
Variance withFinal Budget-Positive
REVENUES Original Final Actual (Negative)Intergovernmental $2,970,586 $2,970,586 $5,660,848 $2,690,262Income on Investments 5,000 5,000 100 (4,900)
Total Revenues 2,975,586 2,975,586 5,660,948 2,685,362EXPENDITURES
Current:Capital:
Acquisitions and Construction 300,000 1,433,746 935,325 (498,421)Total Expenditures 300,000 1,433,746 935,325 (498,421)
Excess (Deficiency) of Revenues Over Expenditures 2,675,586 1,541,840 4,725,623 3,183,783
OTHER FINANCING SOURCES (USES)Transfers Out (3,054,110) (5,457,543) (3,798,099) 1,659,444
Total Other Financing Sources (Uses) (3,054,110) (5,457,543) (3,798,099) 1,659,444
Net Change in Fund Balance ($378,524) ($3,915,703) $927,524 $4,843,227
Fund Balance, Beginning 5,030,964Fund Balance, Ending $5,958,488
Budgeted Amounts
REQUIRED SUPPLEMENTARY INFORMATIONSCHEDULE OF REVENUES, EXPENDITURES, AND CHANGES IN FUND BALANCE
BUDGETARY COMPARISONMUNICIPAL AID FUND
For the Year Ended June 30, 2021
See Independent Auditors' Report 116
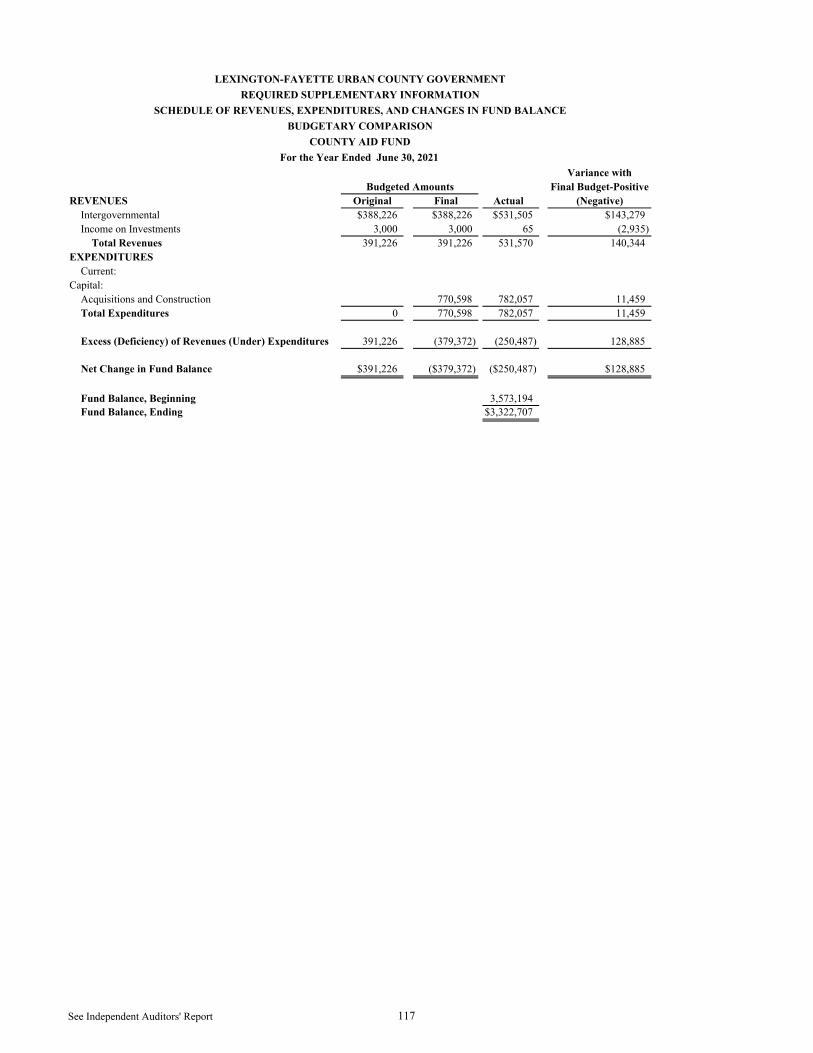
Variance withFinal Budget-Positive
REVENUES Original Final Actual (Negative)Intergovernmental $388,226 $388,226 $531,505 $143,279Income on Investments 3,000 3,000 65 (2,935)
Total Revenues 391,226 391,226 531,570 140,344EXPENDITURES
Current:Capital:
Acquisitions and Construction 770,598 782,057 11,459Total Expenditures 0 770,598 782,057 11,459
Excess (Deficiency) of Revenues (Under) Expenditures 391,226 (379,372) (250,487) 128,885
Net Change in Fund Balance $391,226 ($379,372) ($250,487) $128,885
Fund Balance, Beginning 3,573,194Fund Balance, Ending $3,322,707
Budgeted Amounts
LEXINGTON-FAYETTE URBAN COUNTY GOVERNMENTREQUIRED SUPPLEMENTARY INFORMATION
SCHEDULE OF REVENUES, EXPENDITURES, AND CHANGES IN FUND BALANCEBUDGETARY COMPARISON
COUNTY AID FUNDFor the Year Ended June 30, 2021
See Independent Auditors' Report 117

Variance withFinal Budget-Positive
REVENUES Original Final Actual (Negative)Intergovernmental $200,000 $200,000 $308,568 $108,568Income on Investments 1,000 1,000 22 (978)
Total Revenues 201,000 201,000 308,590 107,590EXPENDITURES
Current:Environmental Quality & Public Works 250,000 167,734 124,969 (42,765)
Capital:Acquisitions and Construction 479 (479)Total Expenditures 250,000 168,213 124,969 (43,244)
Excess (Deficiency) of Revenues (Under) Expenditures (49,000) 32,787 183,621 150,834
Net Change in Fund Balance ($49,000) $32,787 $183,621 $150,834
Fund Balance, Beginning 238,234Fund Balance, Ending $421,855
Budgeted Amounts
LEXINGTON-FAYETTE URBAN COUNTY GOVERNMENTREQUIRED SUPPLEMENTARY INFORMATION
SCHEDULE OF REVENUES, EXPENDITURES, AND CHANGES IN FUND BALANCEBUDGETARY COMPARISON
MINERAL SEVERANCE FUNDFor the Year Ended June 30, 2021
See Independent Auditors' Report 118
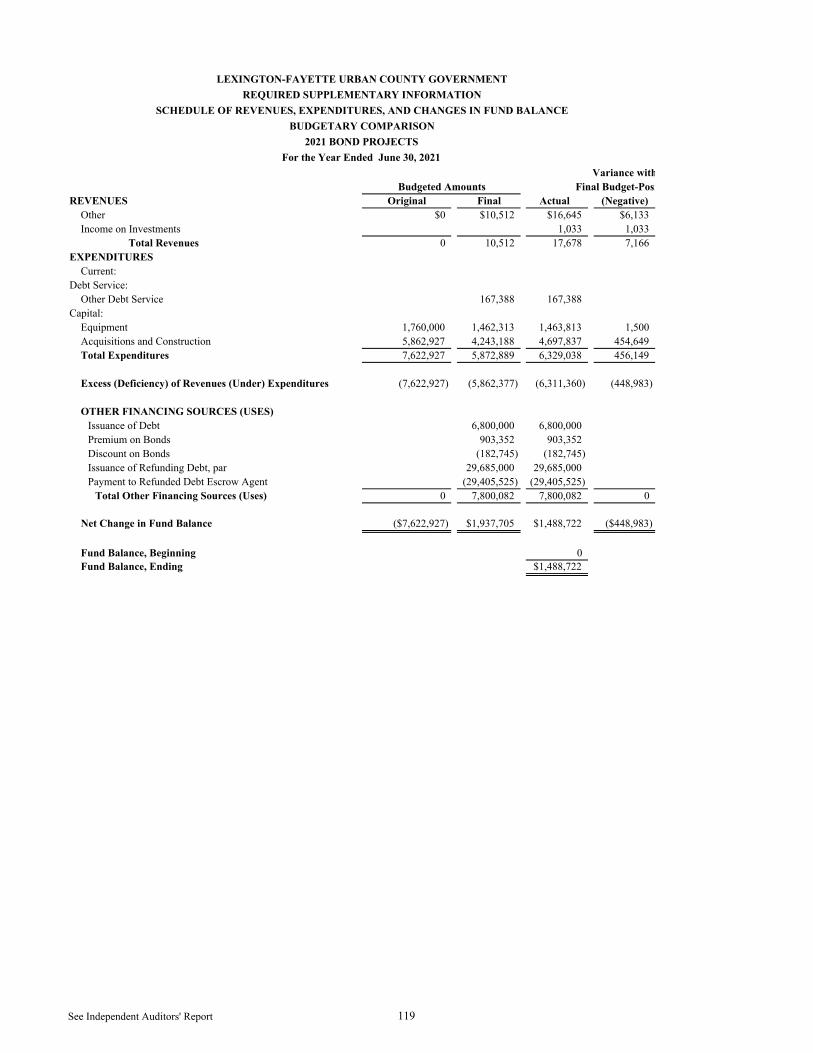
Variance withFinal Budget-Posi
REVENUES Original Final Actual (Negative)Other $0 $10,512 $16,645 $6,133Income on Investments 1,033 1,033
Total Revenues 0 10,512 17,678 7,166EXPENDITURES
Current:Debt Service:
Other Debt Service 167,388 167,388 Capital:
Equipment 1,760,000 1,462,313 1,463,813 1,500Acquisitions and Construction 5,862,927 4,243,188 4,697,837 454,649Total Expenditures 7,622,927 5,872,889 6,329,038 456,149
Excess (Deficiency) of Revenues (Under) Expenditures (7,622,927) (5,862,377) (6,311,360) (448,983)
OTHER FINANCING SOURCES (USES)Issuance of Debt 6,800,000 6,800,000 Premium on Bonds 903,352 903,352 Discount on Bonds (182,745) (182,745) Issuance of Refunding Debt, par 29,685,000 29,685,000 Payment to Refunded Debt Escrow Agent (29,405,525) (29,405,525)
Total Other Financing Sources (Uses) 0 7,800,082 7,800,082 0
Net Change in Fund Balance ($7,622,927) $1,937,705 $1,488,722 ($448,983)
Fund Balance, Beginning 0Fund Balance, Ending $1,488,722
Budgeted Amounts
LEXINGTON-FAYETTE URBAN COUNTY GOVERNMENTREQUIRED SUPPLEMENTARY INFORMATION
SCHEDULE OF REVENUES, EXPENDITURES, AND CHANGES IN FUND BALANCEBUDGETARY COMPARISON
2021 BOND PROJECTSFor the Year Ended June 30, 2021
See Independent Auditors' Report 119
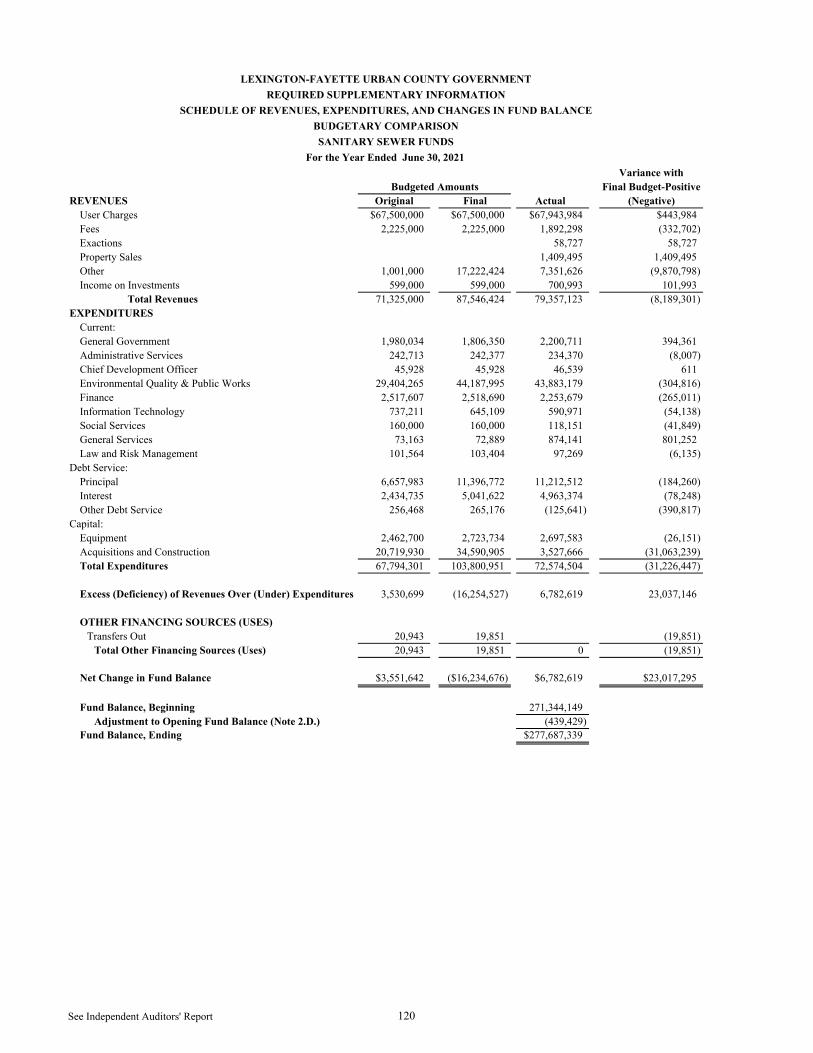
Variance withFinal Budget-Positive
REVENUES Original Final Actual (Negative)User Charges $67,500,000 $67,500,000 $67,943,984 $443,984Fees 2,225,000 2,225,000 1,892,298 (332,702)Exactions 58,727 58,727Property Sales 1,409,495 1,409,495Other 1,001,000 17,222,424 7,351,626 (9,870,798)Income on Investments 599,000 599,000 700,993 101,993
Total Revenues 71,325,000 87,546,424 79,357,123 (8,189,301)EXPENDITURES
Current:General Government 1,980,034 1,806,350 2,200,711 394,361Administrative Services 242,713 242,377 234,370 (8,007)Chief Development Officer 45,928 45,928 46,539 611Environmental Quality & Public Works 29,404,265 44,187,995 43,883,179 (304,816)Finance 2,517,607 2,518,690 2,253,679 (265,011)Information Technology 737,211 645,109 590,971 (54,138)Social Services 160,000 160,000 118,151 (41,849)General Services 73,163 72,889 874,141 801,252Law and Risk Management 101,564 103,404 97,269 (6,135)
Debt Service:Principal 6,657,983 11,396,772 11,212,512 (184,260)Interest 2,434,735 5,041,622 4,963,374 (78,248)Other Debt Service 256,468 265,176 (125,641) (390,817)
Capital:Equipment 2,462,700 2,723,734 2,697,583 (26,151)Acquisitions and Construction 20,719,930 34,590,905 3,527,666 (31,063,239)Total Expenditures 67,794,301 103,800,951 72,574,504 (31,226,447)
Excess (Deficiency) of Revenues Over (Under) Expenditures 3,530,699 (16,254,527) 6,782,619 23,037,146
OTHER FINANCING SOURCES (USES)Transfers Out 20,943 19,851 (19,851)
Total Other Financing Sources (Uses) 20,943 19,851 0 (19,851)
Net Change in Fund Balance $3,551,642 ($16,234,676) $6,782,619 $23,017,295
Fund Balance, Beginning 271,344,149Adjustment to Opening Fund Balance (Note 2.D.) (439,429)
Fund Balance, Ending $277,687,339
Budgeted Amounts
LEXINGTON-FAYETTE URBAN COUNTY GOVERNMENTREQUIRED SUPPLEMENTARY INFORMATION
SCHEDULE OF REVENUES, EXPENDITURES, AND CHANGES IN FUND BALANCEBUDGETARY COMPARISONSANITARY SEWER FUNDS
For the Year Ended June 30, 2021
See Independent Auditors' Report 120
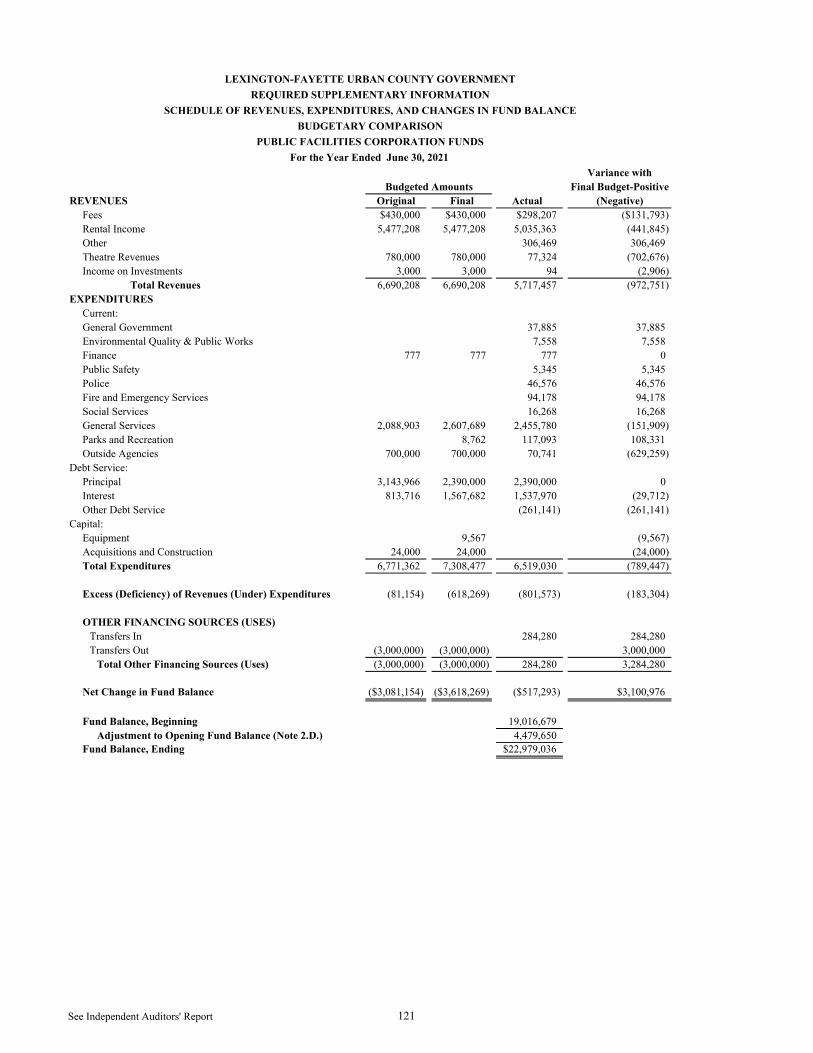
Variance withFinal Budget-Positive
REVENUES Original Final Actual (Negative)Fees $430,000 $430,000 $298,207 ($131,793)Rental Income 5,477,208 5,477,208 5,035,363 (441,845)Other 306,469 306,469Theatre Revenues 780,000 780,000 77,324 (702,676)Income on Investments 3,000 3,000 94 (2,906)
Total Revenues 6,690,208 6,690,208 5,717,457 (972,751)EXPENDITURES
Current:General Government 37,885 37,885Environmental Quality & Public Works 7,558 7,558Finance 777 777 777 0Public Safety 5,345 5,345Police 46,576 46,576Fire and Emergency Services 94,178 94,178Social Services 16,268 16,268General Services 2,088,903 2,607,689 2,455,780 (151,909)Parks and Recreation 8,762 117,093 108,331Outside Agencies 700,000 700,000 70,741 (629,259)
Debt Service:Principal 3,143,966 2,390,000 2,390,000 0Interest 813,716 1,567,682 1,537,970 (29,712)Other Debt Service (261,141) (261,141)
Capital:Equipment 9,567 (9,567)Acquisitions and Construction 24,000 24,000 (24,000)Total Expenditures 6,771,362 7,308,477 6,519,030 (789,447)
Excess (Deficiency) of Revenues (Under) Expenditures (81,154) (618,269) (801,573) (183,304)
OTHER FINANCING SOURCES (USES)Transfers In 284,280 284,280Transfers Out (3,000,000) (3,000,000) 3,000,000
Total Other Financing Sources (Uses) (3,000,000) (3,000,000) 284,280 3,284,280
Net Change in Fund Balance ($3,081,154) ($3,618,269) ($517,293) $3,100,976
Fund Balance, Beginning 19,016,679Adjustment to Opening Fund Balance (Note 2.D.) 4,479,650
Fund Balance, Ending $22,979,036
Budgeted Amounts
LEXINGTON-FAYETTE URBAN COUNTY GOVERNMENTREQUIRED SUPPLEMENTARY INFORMATION
SCHEDULE OF REVENUES, EXPENDITURES, AND CHANGES IN FUND BALANCEBUDGETARY COMPARISON
PUBLIC FACILITIES CORPORATION FUNDSFor the Year Ended June 30, 2021
See Independent Auditors' Report 121
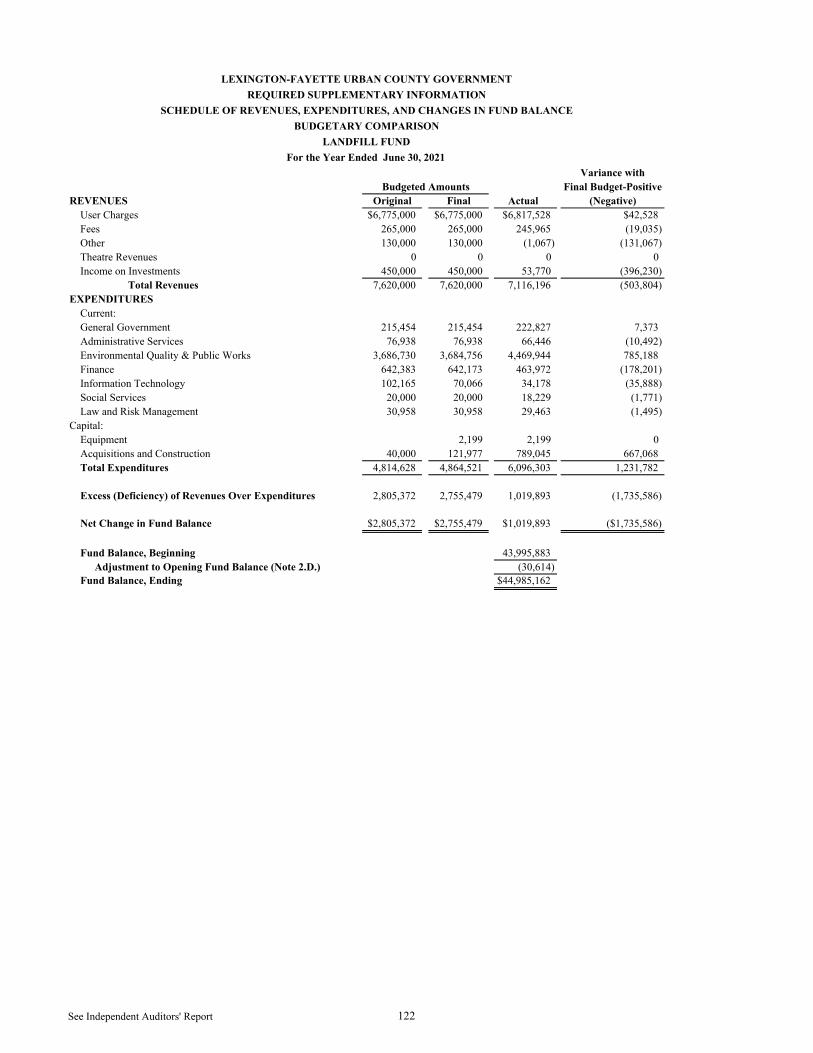
Variance withFinal Budget-Positive
REVENUES Original Final Actual (Negative)User Charges $6,775,000 $6,775,000 $6,817,528 $42,528Fees 265,000 265,000 245,965 (19,035)Other 130,000 130,000 (1,067) (131,067)Theatre Revenues 0 0 0 0Income on Investments 450,000 450,000 53,770 (396,230)
Total Revenues 7,620,000 7,620,000 7,116,196 (503,804)EXPENDITURES
Current:General Government 215,454 215,454 222,827 7,373Administrative Services 76,938 76,938 66,446 (10,492)Environmental Quality & Public Works 3,686,730 3,684,756 4,469,944 785,188Finance 642,383 642,173 463,972 (178,201)Information Technology 102,165 70,066 34,178 (35,888)Social Services 20,000 20,000 18,229 (1,771)Law and Risk Management 30,958 30,958 29,463 (1,495)
Capital:Equipment 2,199 2,199 0Acquisitions and Construction 40,000 121,977 789,045 667,068Total Expenditures 4,814,628 4,864,521 6,096,303 1,231,782
Excess (Deficiency) of Revenues Over Expenditures 2,805,372 2,755,479 1,019,893 (1,735,586)
Net Change in Fund Balance $2,805,372 $2,755,479 $1,019,893 ($1,735,586)
Fund Balance, Beginning 43,995,883Adjustment to Opening Fund Balance (Note 2.D.) (30,614)
Fund Balance, Ending $44,985,162
Budgeted Amounts
LEXINGTON-FAYETTE URBAN COUNTY GOVERNMENTREQUIRED SUPPLEMENTARY INFORMATION
SCHEDULE OF REVENUES, EXPENDITURES, AND CHANGES IN FUND BALANCEBUDGETARY COMPARISON
LANDFILL FUNDFor the Year Ended June 30, 2021
See Independent Auditors' Report 122
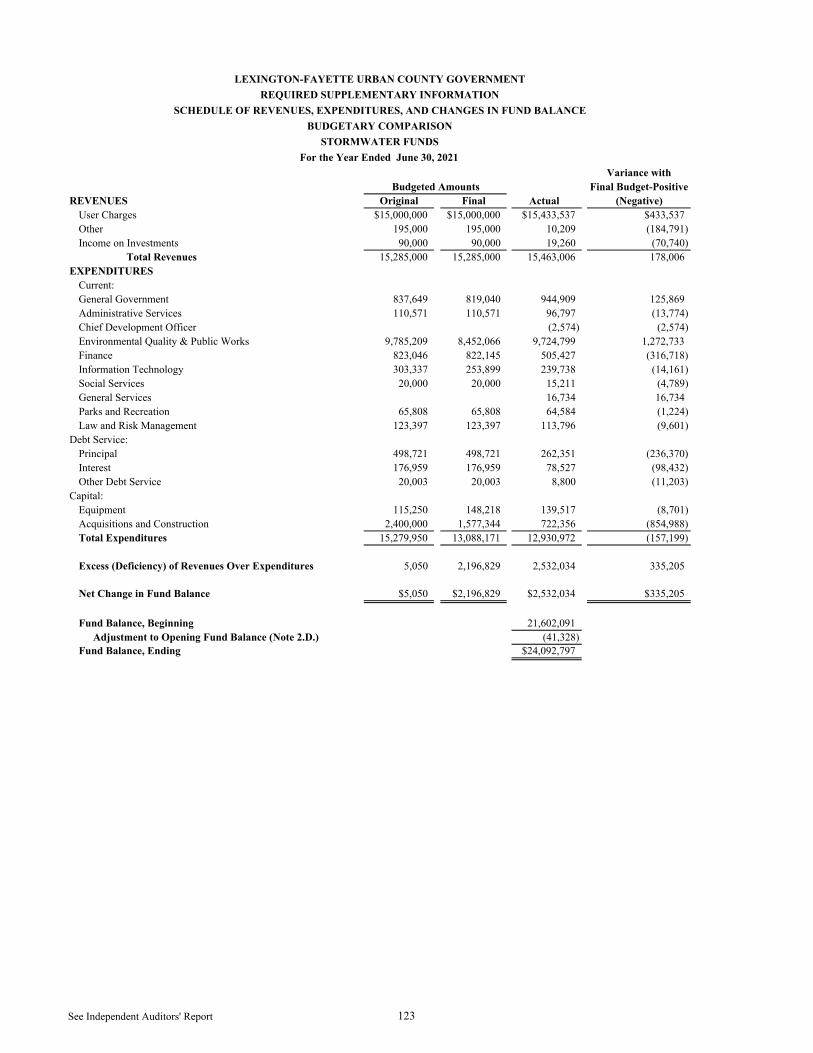
Variance withFinal Budget-Positive
REVENUES Original Final Actual (Negative)User Charges $15,000,000 $15,000,000 $15,433,537 $433,537Other 195,000 195,000 10,209 (184,791)Income on Investments 90,000 90,000 19,260 (70,740)
Total Revenues 15,285,000 15,285,000 15,463,006 178,006EXPENDITURES
Current:General Government 837,649 819,040 944,909 125,869Administrative Services 110,571 110,571 96,797 (13,774)Chief Development Officer (2,574) (2,574)Environmental Quality & Public Works 9,785,209 8,452,066 9,724,799 1,272,733Finance 823,046 822,145 505,427 (316,718)Information Technology 303,337 253,899 239,738 (14,161)Social Services 20,000 20,000 15,211 (4,789)General Services 16,734 16,734Parks and Recreation 65,808 65,808 64,584 (1,224)Law and Risk Management 123,397 123,397 113,796 (9,601)
Debt Service:Principal 498,721 498,721 262,351 (236,370)Interest 176,959 176,959 78,527 (98,432)Other Debt Service 20,003 20,003 8,800 (11,203)
Capital:Equipment 115,250 148,218 139,517 (8,701)Acquisitions and Construction 2,400,000 1,577,344 722,356 (854,988)Total Expenditures 15,279,950 13,088,171 12,930,972 (157,199)
Excess (Deficiency) of Revenues Over Expenditures 5,050 2,196,829 2,532,034 335,205
Net Change in Fund Balance $5,050 $2,196,829 $2,532,034 $335,205
Fund Balance, Beginning 21,602,091Adjustment to Opening Fund Balance (Note 2.D.) (41,328)
Fund Balance, Ending $24,092,797
BUDGETARY COMPARISONSTORMWATER FUNDS
For the Year Ended June 30, 2021
Budgeted Amounts
LEXINGTON-FAYETTE URBAN COUNTY GOVERNMENTREQUIRED SUPPLEMENTARY INFORMATION
SCHEDULE OF REVENUES, EXPENDITURES, AND CHANGES IN FUND BALANCE
See Independent Auditors' Report 123
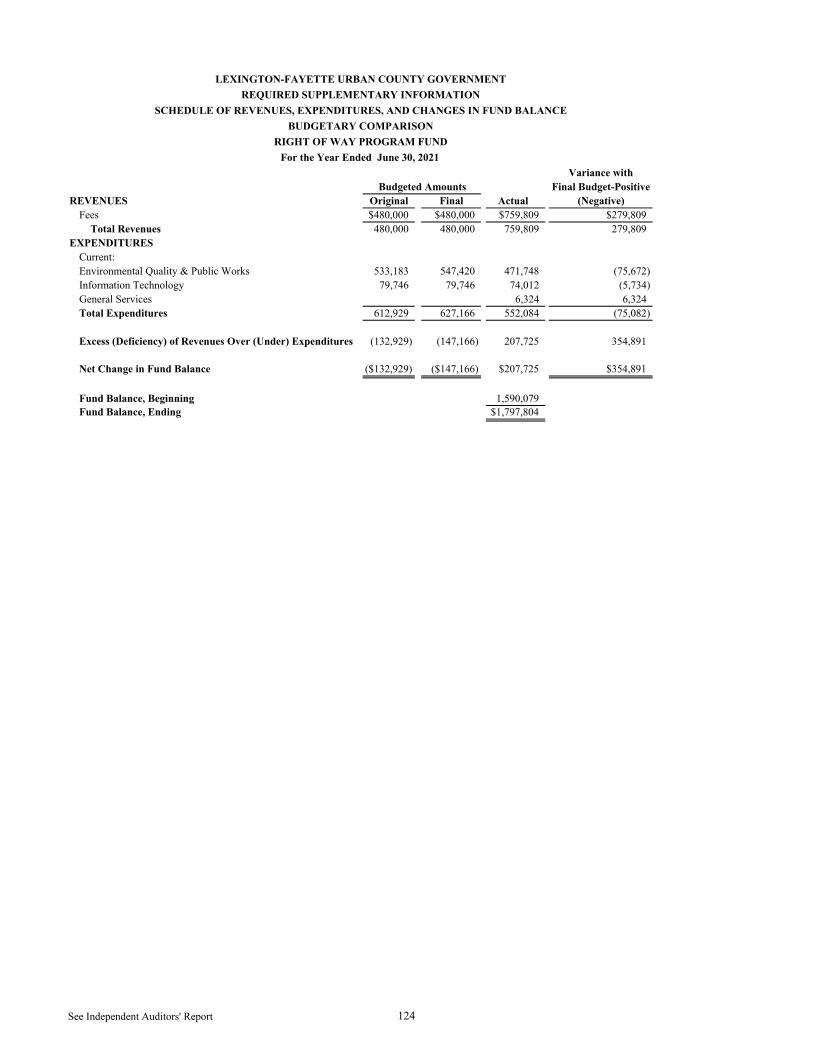
Variance withFinal Budget-Positive
REVENUES Original Final Actual (Negative)Fees $480,000 $480,000 $759,809 $279,809
Total Revenues 480,000 480,000 759,809 279,809EXPENDITURES
Current:Environmental Quality & Public Works 533,183 547,420 471,748 (75,672)Information Technology 79,746 79,746 74,012 (5,734)General Services 6,324 6,324Total Expenditures 612,929 627,166 552,084 (75,082)
Excess (Deficiency) of Revenues Over (Under) Expenditures (132,929) (147,166) 207,725 354,891
Net Change in Fund Balance ($132,929) ($147,166) $207,725 $354,891
Fund Balance, Beginning 1,590,079Fund Balance, Ending $1,797,804
Budgeted Amounts
LEXINGTON-FAYETTE URBAN COUNTY GOVERNMENTREQUIRED SUPPLEMENTARY INFORMATION
SCHEDULE OF REVENUES, EXPENDITURES, AND CHANGES IN FUND BALANCEBUDGETARY COMPARISON
RIGHT OF WAY PROGRAM FUNDFor the Year Ended June 30, 2021
See Independent Auditors' Report 124
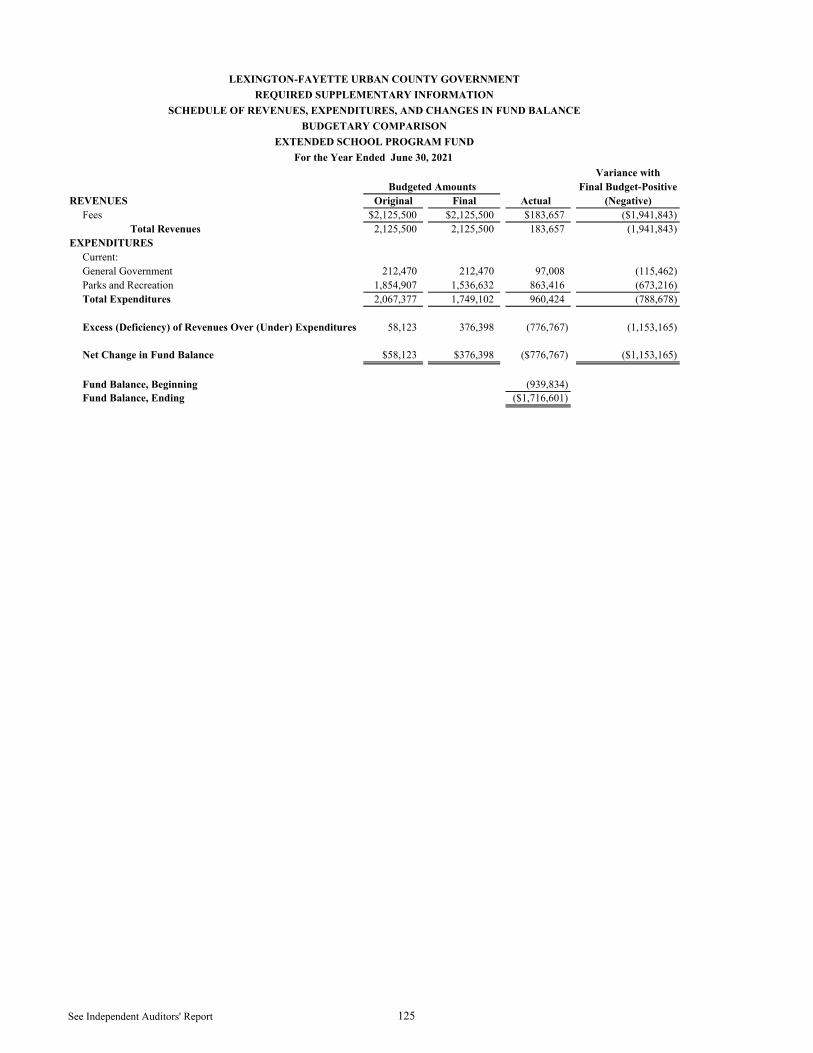
Variance withFinal Budget-Positive
REVENUES Original Final Actual (Negative)Fees $2,125,500 $2,125,500 $183,657 ($1,941,843)
Total Revenues 2,125,500 2,125,500 183,657 (1,941,843)EXPENDITURES
Current:General Government 212,470 212,470 97,008 (115,462)Parks and Recreation 1,854,907 1,536,632 863,416 (673,216)Total Expenditures 2,067,377 1,749,102 960,424 (788,678)
Excess (Deficiency) of Revenues Over (Under) Expenditures 58,123 376,398 (776,767) (1,153,165)
Net Change in Fund Balance $58,123 $376,398 ($776,767) ($1,153,165)
Fund Balance, Beginning (939,834)Fund Balance, Ending ($1,716,601)
Budgeted Amounts
LEXINGTON-FAYETTE URBAN COUNTY GOVERNMENTREQUIRED SUPPLEMENTARY INFORMATION
SCHEDULE OF REVENUES, EXPENDITURES, AND CHANGES IN FUND BALANCEBUDGETARY COMPARISON
EXTENDED SCHOOL PROGRAM FUNDFor the Year Ended June 30, 2021
See Independent Auditors' Report 125
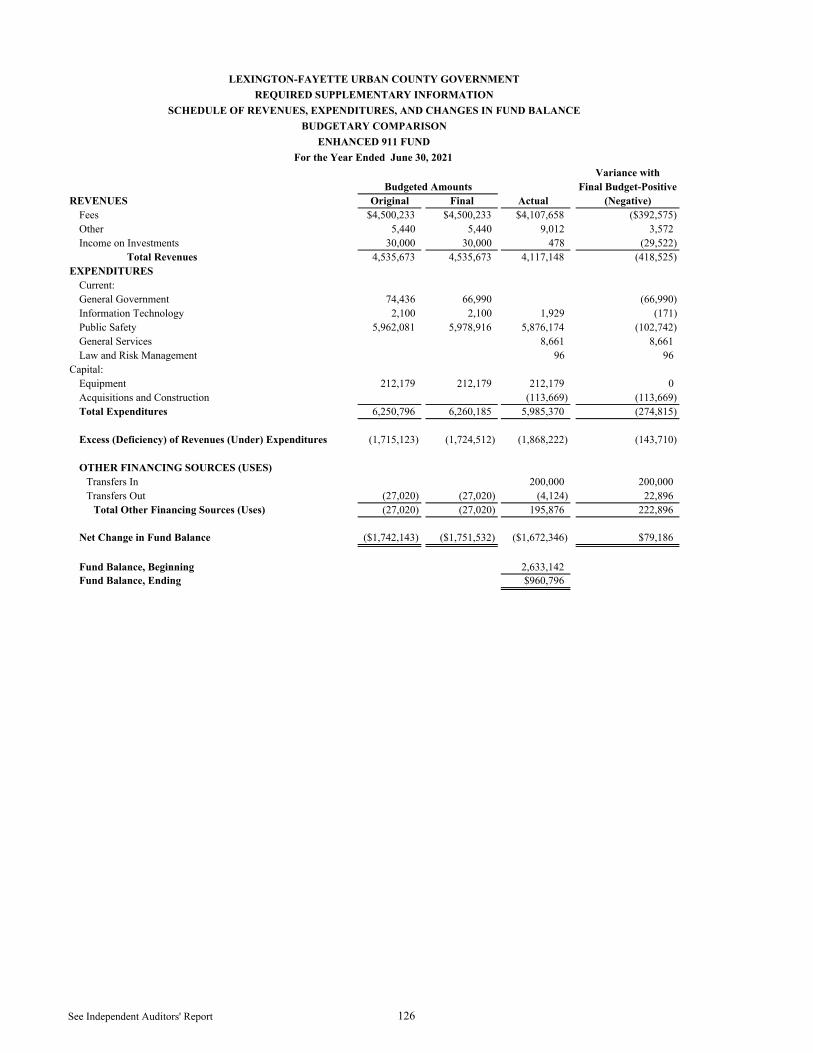
Variance withFinal Budget-Positive
REVENUES Original Final Actual (Negative)Fees $4,500,233 $4,500,233 $4,107,658 ($392,575)Other 5,440 5,440 9,012 3,572Income on Investments 30,000 30,000 478 (29,522)
Total Revenues 4,535,673 4,535,673 4,117,148 (418,525)EXPENDITURES
Current:General Government 74,436 66,990 (66,990)Information Technology 2,100 2,100 1,929 (171)Public Safety 5,962,081 5,978,916 5,876,174 (102,742)General Services 8,661 8,661Law and Risk Management 96 96
Capital:Equipment 212,179 212,179 212,179 0Acquisitions and Construction (113,669) (113,669)Total Expenditures 6,250,796 6,260,185 5,985,370 (274,815)
Excess (Deficiency) of Revenues (Under) Expenditures (1,715,123) (1,724,512) (1,868,222) (143,710)
OTHER FINANCING SOURCES (USES)Transfers In 200,000 200,000Transfers Out (27,020) (27,020) (4,124) 22,896
Total Other Financing Sources (Uses) (27,020) (27,020) 195,876 222,896
Net Change in Fund Balance ($1,742,143) ($1,751,532) ($1,672,346) $79,186
Fund Balance, Beginning 2,633,142Fund Balance, Ending $960,796
BUDGETARY COMPARISONENHANCED 911 FUND
For the Year Ended June 30, 2021
Budgeted Amounts
LEXINGTON-FAYETTE URBAN COUNTY GOVERNMENTREQUIRED SUPPLEMENTARY INFORMATION
SCHEDULE OF REVENUES, EXPENDITURES, AND CHANGES IN FUND BALANCE
See Independent Auditors' Report 126
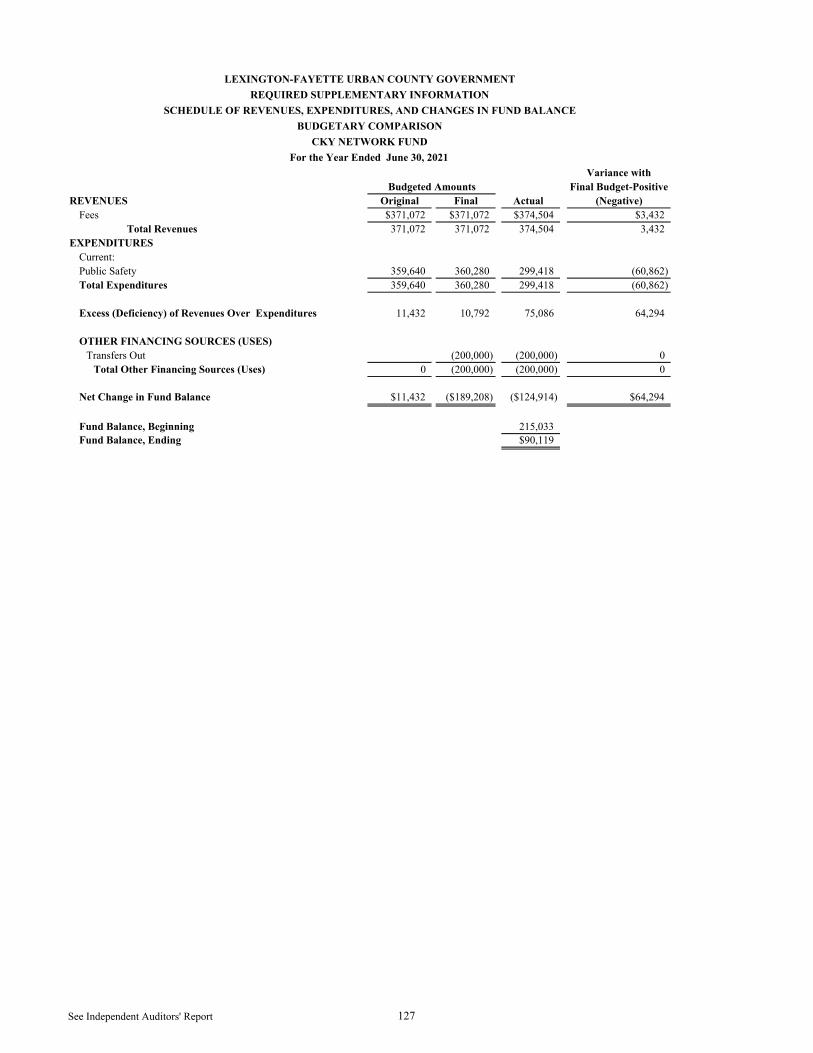
Variance withFinal Budget-Positive
REVENUES Original Final Actual (Negative)Fees $371,072 $371,072 $374,504 $3,432
Total Revenues 371,072 371,072 374,504 3,432EXPENDITURES
Current:Public Safety 359,640 360,280 299,418 (60,862)Total Expenditures 359,640 360,280 299,418 (60,862)
Excess (Deficiency) of Revenues Over Expenditures 11,432 10,792 75,086 64,294
OTHER FINANCING SOURCES (USES)Transfers Out (200,000) (200,000) 0
Total Other Financing Sources (Uses) 0 (200,000) (200,000) 0
Net Change in Fund Balance $11,432 ($189,208) ($124,914) $64,294
Fund Balance, Beginning 215,033Fund Balance, Ending $90,119
Budgeted Amounts
LEXINGTON-FAYETTE URBAN COUNTY GOVERNMENTREQUIRED SUPPLEMENTARY INFORMATION
SCHEDULE OF REVENUES, EXPENDITURES, AND CHANGES IN FUND BALANCEBUDGETARY COMPARISON
CKY NETWORK FUNDFor the Year Ended June 30, 2021
See Independent Auditors' Report 127
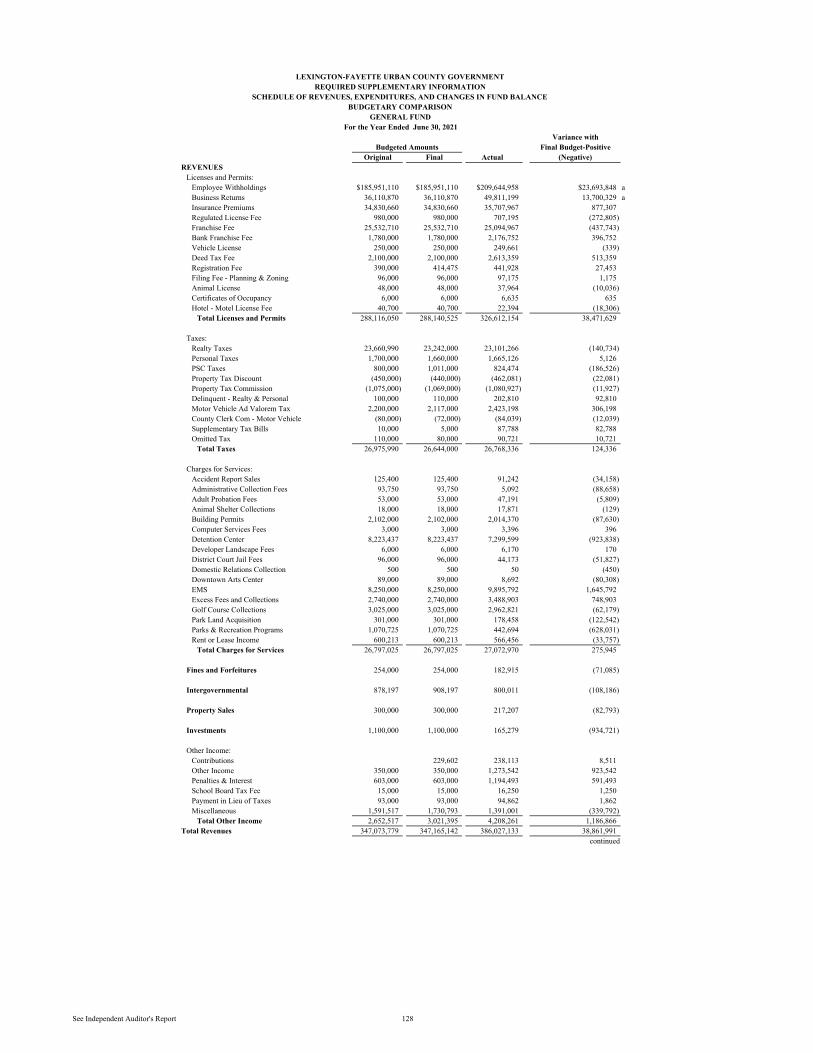
Variance withFinal Budget-Positive
Original Final Actual (Negative)REVENUES
Licenses and Permits:Employee Withholdings $185,951,110 $185,951,110 $209,644,958 $23,693,848 aBusiness Returns 36,110,870 36,110,870 49,811,199 13,700,329 aInsurance Premiums 34,830,660 34,830,660 35,707,967 877,307Regulated License Fee 980,000 980,000 707,195 (272,805)Franchise Fee 25,532,710 25,532,710 25,094,967 (437,743)Bank Franchise Fee 1,780,000 1,780,000 2,176,752 396,752Vehicle License 250,000 250,000 249,661 (339)Deed Tax Fee 2,100,000 2,100,000 2,613,359 513,359Registration Fee 390,000 414,475 441,928 27,453Filing Fee - Planning & Zoning 96,000 96,000 97,175 1,175Animal License 48,000 48,000 37,964 (10,036)Certificates of Occupancy 6,000 6,000 6,635 635Hotel - Motel License Fee 40,700 40,700 22,394 (18,306)
Total Licenses and Permits 288,116,050 288,140,525 326,612,154 38,471,629
Taxes:Realty Taxes 23,660,990 23,242,000 23,101,266 (140,734)Personal Taxes 1,700,000 1,660,000 1,665,126 5,126PSC Taxes 800,000 1,011,000 824,474 (186,526)Property Tax Discount (450,000) (440,000) (462,081) (22,081)Property Tax Commission (1,075,000) (1,069,000) (1,080,927) (11,927)Delinquent - Realty & Personal 100,000 110,000 202,810 92,810Motor Vehicle Ad Valorem Tax 2,200,000 2,117,000 2,423,198 306,198County Clerk Com - Motor Vehicle (80,000) (72,000) (84,039) (12,039)Supplementary Tax Bills 10,000 5,000 87,788 82,788Omitted Tax 110,000 80,000 90,721 10,721
Total Taxes 26,975,990 26,644,000 26,768,336 124,336
Charges for Services:Accident Report Sales 125,400 125,400 91,242 (34,158)Administrative Collection Fees 93,750 93,750 5,092 (88,658)Adult Probation Fees 53,000 53,000 47,191 (5,809)Animal Shelter Collections 18,000 18,000 17,871 (129)Building Permits 2,102,000 2,102,000 2,014,370 (87,630)Computer Services Fees 3,000 3,000 3,396 396Detention Center 8,223,437 8,223,437 7,299,599 (923,838)Developer Landscape Fees 6,000 6,000 6,170 170District Court Jail Fees 96,000 96,000 44,173 (51,827)Domestic Relations Collection 500 500 50 (450)Downtown Arts Center 89,000 89,000 8,692 (80,308)EMS 8,250,000 8,250,000 9,895,792 1,645,792Excess Fees and Collections 2,740,000 2,740,000 3,488,903 748,903Golf Course Collections 3,025,000 3,025,000 2,962,821 (62,179)Park Land Acquisition 301,000 301,000 178,458 (122,542)Parks & Recreation Programs 1,070,725 1,070,725 442,694 (628,031)Rent or Lease Income 600,213 600,213 566,456 (33,757)
Total Charges for Services 26,797,025 26,797,025 27,072,970 275,945
Fines and Forfeitures 254,000 254,000 182,915 (71,085)
Intergovernmental 878,197 908,197 800,011 (108,186)
Property Sales 300,000 300,000 217,207 (82,793)
Investments 1,100,000 1,100,000 165,279 (934,721)
Other Income:Contributions 229,602 238,113 8,511Other Income 350,000 350,000 1,273,542 923,542Penalties & Interest 603,000 603,000 1,194,493 591,493School Board Tax Fee 15,000 15,000 16,250 1,250Payment in Lieu of Taxes 93,000 93,000 94,862 1,862Miscellaneous 1,591,517 1,730,793 1,391,001 (339,792)
Total Other Income 2,652,517 3,021,395 4,208,261 1,186,866Total Revenues 347,073,779 347,165,142 386,027,133 38,861,991
continued
Budgeted Amounts
LEXINGTON-FAYETTE URBAN COUNTY GOVERNMENT
SCHEDULE OF REVENUES, EXPENDITURES, AND CHANGES IN FUND BALANCEBUDGETARY COMPARISON
GENERAL FUNDFor the Year Ended June 30, 2021
REQUIRED SUPPLEMENTARY INFORMATION
See Independent Auditor's Report 128
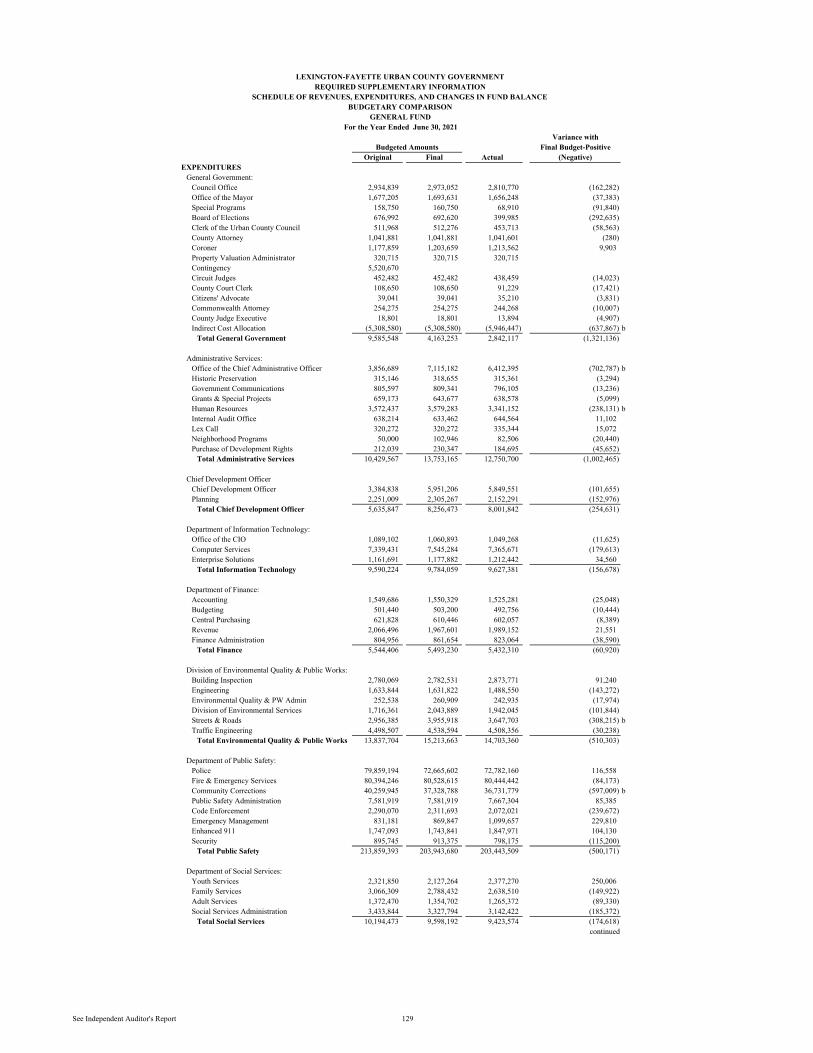
Variance withFinal Budget-Positive
Original Final Actual (Negative)Budgeted Amounts
LEXINGTON-FAYETTE URBAN COUNTY GOVERNMENT
SCHEDULE OF REVENUES, EXPENDITURES, AND CHANGES IN FUND BALANCEBUDGETARY COMPARISON
GENERAL FUNDFor the Year Ended June 30, 2021
REQUIRED SUPPLEMENTARY INFORMATION
EXPENDITURESGeneral Government:
Council Office 2,934,839 2,973,052 2,810,770 (162,282)Office of the Mayor 1,677,205 1,693,631 1,656,248 (37,383)Special Programs 158,750 160,750 68,910 (91,840)Board of Elections 676,992 692,620 399,985 (292,635)Clerk of the Urban County Council 511,968 512,276 453,713 (58,563)County Attorney 1,041,881 1,041,881 1,041,601 (280)Coroner 1,177,859 1,203,659 1,213,562 9,903Property Valuation Administrator 320,715 320,715 320,715 Contingency 5,520,670 Circuit Judges 452,482 452,482 438,459 (14,023)County Court Clerk 108,650 108,650 91,229 (17,421)Citizens' Advocate 39,041 39,041 35,210 (3,831)Commonwealth Attorney 254,275 254,275 244,268 (10,007)County Judge Executive 18,801 18,801 13,894 (4,907)Indirect Cost Allocation (5,308,580) (5,308,580) (5,946,447) (637,867) b
Total General Government 9,585,548 4,163,253 2,842,117 (1,321,136)
Administrative Services:Office of the Chief Administrative Officer 3,856,689 7,115,182 6,412,395 (702,787) bHistoric Preservation 315,146 318,655 315,361 (3,294)Government Communications 805,597 809,341 796,105 (13,236)Grants & Special Projects 659,173 643,677 638,578 (5,099)Human Resources 3,572,437 3,579,283 3,341,152 (238,131) bInternal Audit Office 638,214 633,462 644,564 11,102Lex Call 320,272 320,272 335,344 15,072Neighborhood Programs 50,000 102,946 82,506 (20,440)Purchase of Development Rights 212,039 230,347 184,695 (45,652)
Total Administrative Services 10,429,567 13,753,165 12,750,700 (1,002,465)
Chief Development OfficerChief Development Officer 3,384,838 5,951,206 5,849,551 (101,655)Planning 2,251,009 2,305,267 2,152,291 (152,976)
Total Chief Development Officer 5,635,847 8,256,473 8,001,842 (254,631)
Department of Information Technology:Office of the CIO 1,089,102 1,060,893 1,049,268 (11,625)Computer Services 7,339,431 7,545,284 7,365,671 (179,613)Enterprise Solutions 1,161,691 1,177,882 1,212,442 34,560
Total Information Technology 9,590,224 9,784,059 9,627,381 (156,678)
Department of Finance:Accounting 1,549,686 1,550,329 1,525,281 (25,048)Budgeting 501,440 503,200 492,756 (10,444)Central Purchasing 621,828 610,446 602,057 (8,389)Revenue 2,066,496 1,967,601 1,989,152 21,551Finance Administration 804,956 861,654 823,064 (38,590)
Total Finance 5,544,406 5,493,230 5,432,310 (60,920)
Division of Environmental Quality & Public Works:Building Inspection 2,780,069 2,782,531 2,873,771 91,240Engineering 1,633,844 1,631,822 1,488,550 (143,272)Environmental Quality & PW Admin 252,538 260,909 242,935 (17,974)Division of Environmental Services 1,716,361 2,043,889 1,942,045 (101,844)Streets & Roads 2,956,385 3,955,918 3,647,703 (308,215) bTraffic Engineering 4,498,507 4,538,594 4,508,356 (30,238)
Total Environmental Quality & Public Works 13,837,704 15,213,663 14,703,360 (510,303)
Department of Public Safety:Police 79,859,194 72,665,602 72,782,160 116,558Fire & Emergency Services 80,394,246 80,528,615 80,444,442 (84,173)Community Corrections 40,259,945 37,328,788 36,731,779 (597,009) bPublic Safety Administration 7,581,919 7,581,919 7,667,304 85,385Code Enforcement 2,290,070 2,311,693 2,072,021 (239,672)Emergency Management 831,181 869,847 1,099,657 229,810Enhanced 911 1,747,093 1,743,841 1,847,971 104,130Security 895,745 913,375 798,175 (115,200)
Total Public Safety 213,859,393 203,943,680 203,443,509 (500,171)
Department of Social Services:Youth Services 2,321,850 2,127,264 2,377,270 250,006Family Services 3,066,309 2,788,432 2,638,510 (149,922)Adult Services 1,372,470 1,354,702 1,265,372 (89,330)Social Services Administration 3,433,844 3,327,794 3,142,422 (185,372)
Total Social Services 10,194,473 9,598,192 9,423,574 (174,618)continued
See Independent Auditor's Report 129
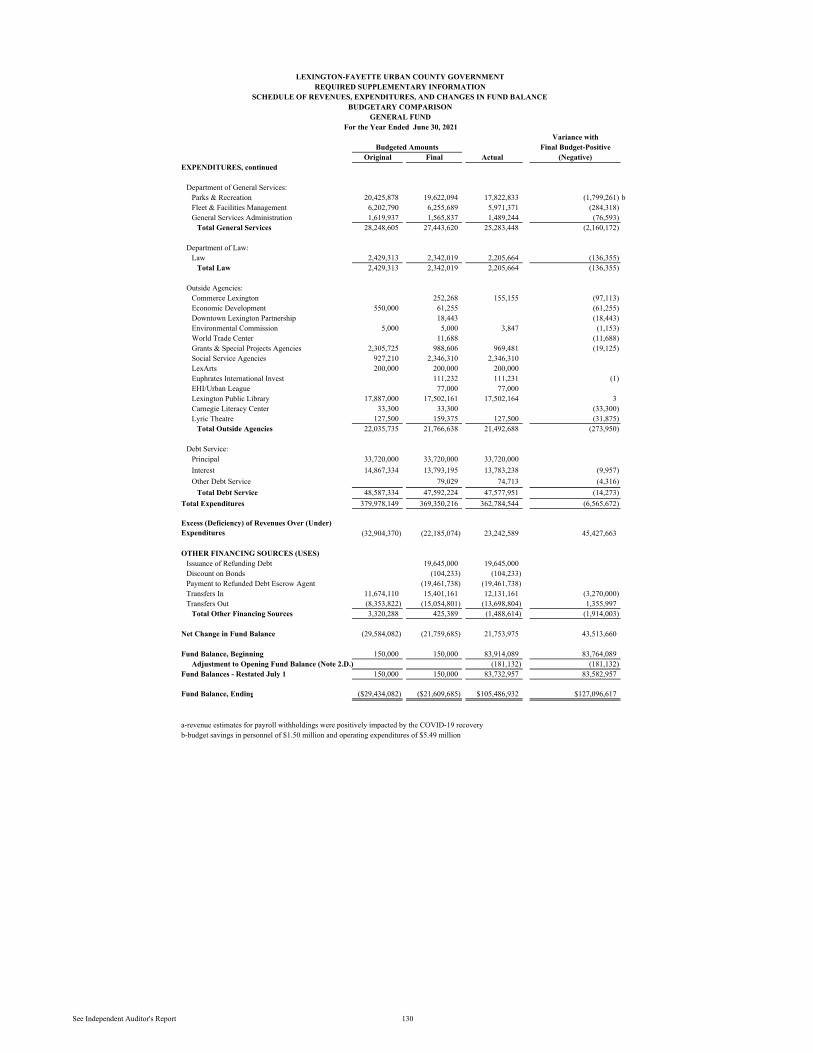
Variance withFinal Budget-Positive
Original Final Actual (Negative)Budgeted Amounts
LEXINGTON-FAYETTE URBAN COUNTY GOVERNMENT
SCHEDULE OF REVENUES, EXPENDITURES, AND CHANGES IN FUND BALANCEBUDGETARY COMPARISON
GENERAL FUNDFor the Year Ended June 30, 2021
REQUIRED SUPPLEMENTARY INFORMATION
EXPENDITURES, continued
Department of General Services:Parks & Recreation 20,425,878 19,622,094 17,822,833 (1,799,261) bFleet & Facilities Management 6,202,790 6,255,689 5,971,371 (284,318)General Services Administration 1,619,937 1,565,837 1,489,244 (76,593)
Total General Services 28,248,605 27,443,620 25,283,448 (2,160,172)
Department of Law:Law 2,429,313 2,342,019 2,205,664 (136,355)
Total Law 2,429,313 2,342,019 2,205,664 (136,355)
Outside Agencies:Commerce Lexington 252,268 155,155 (97,113)Economic Development 550,000 61,255 (61,255)Downtown Lexington Partnership 18,443 (18,443)Environmental Commission 5,000 5,000 3,847 (1,153)World Trade Center 11,688 (11,688)Grants & Special Projects Agencies 2,305,725 988,606 969,481 (19,125)Social Service Agencies 927,210 2,346,310 2,346,310 LexArts 200,000 200,000 200,000 Euphrates International Invest 111,232 111,231 (1)EHI/Urban League 77,000 77,000 Lexington Public Library 17,887,000 17,502,161 17,502,164 3Carnegie Literacy Center 33,300 33,300 (33,300)Lyric Theatre 127,500 159,375 127,500 (31,875)
Total Outside Agencies 22,035,735 21,766,638 21,492,688 (273,950)
Debt Service:Principal 33,720,000 33,720,000 33,720,000 Interest 14,867,334 13,793,195 13,783,238 (9,957)Other Debt Service 79,029 74,713 (4,316)
Total Debt Service 48,587,334 47,592,224 47,577,951 (14,273)Total Expenditures 379,978,149 369,350,216 362,784,544 (6,565,672)
Excess (Deficiency) of Revenues Over (Under) Expenditures (32,904,370) (22,185,074) 23,242,589 45,427,663
OTHER FINANCING SOURCES (USES)Issuance of Refunding Debt 19,645,000 19,645,000 Discount on Bonds (104,233) (104,233) Payment to Refunded Debt Escrow Agent (19,461,738) (19,461,738) Transfers In 11,674,110 15,401,161 12,131,161 (3,270,000)Transfers Out (8,353,822) (15,054,801) (13,698,804) 1,355,997
Total Other Financing Sources 3,320,288 425,389 (1,488,614) (1,914,003)
Net Change in Fund Balance (29,584,082) (21,759,685) 21,753,975 43,513,660
Fund Balance, Beginning 150,000 150,000 83,914,089 83,764,089Adjustment to Opening Fund Balance (Note 2.D.) (181,132) (181,132)
Fund Balances - Restated July 1 150,000 150,000 83,732,957 83,582,957
Fund Balance, Ending ($29,434,082) ($21,609,685) $105,486,932 $127,096,617
a-revenue estimates for payroll withholdings were positively impacted by the COVID-19 recoveryb-budget savings in personnel of $1.50 million and operating expenditures of $5.49 million
See Independent Auditor's Report 130
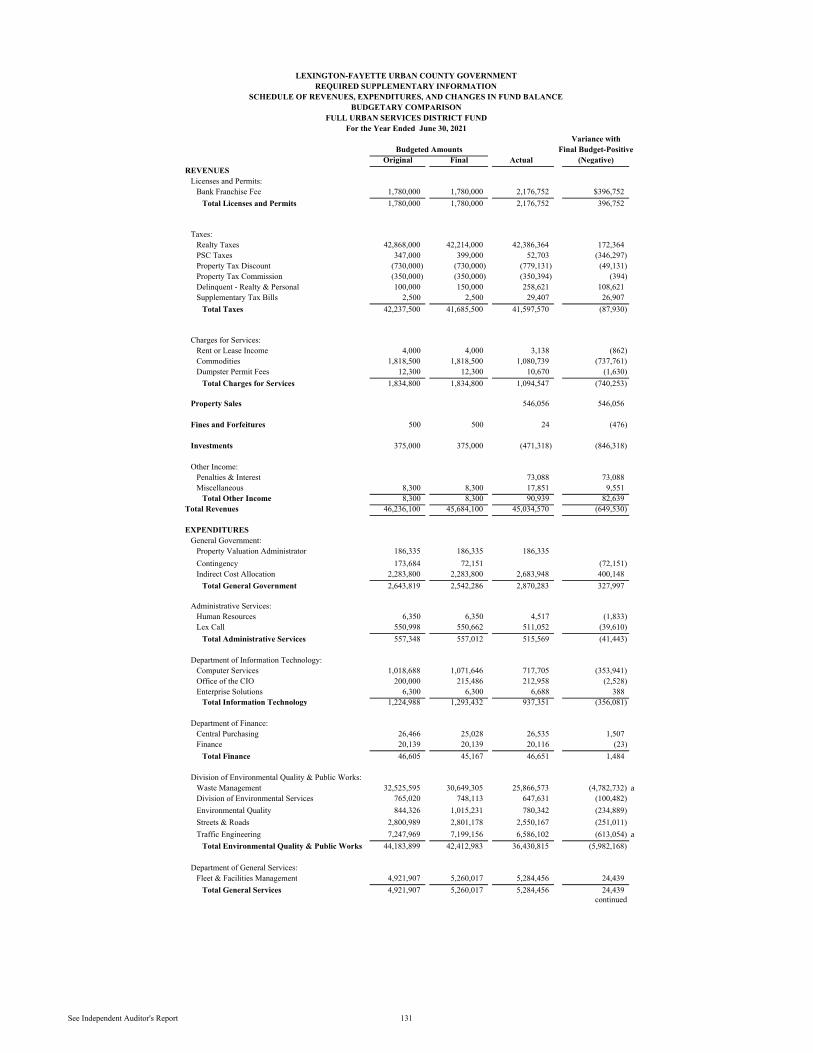
Variance withFinal Budget-Positive
Original Final Actual (Negative)REVENUES
Licenses and Permits:Bank Franchise Fee 1,780,000 1,780,000 2,176,752 $396,752
Total Licenses and Permits 1,780,000 1,780,000 2,176,752 396,752
Taxes:Realty Taxes 42,868,000 42,214,000 42,386,364 172,364PSC Taxes 347,000 399,000 52,703 (346,297)Property Tax Discount (730,000) (730,000) (779,131) (49,131)Property Tax Commission (350,000) (350,000) (350,394) (394)Delinquent - Realty & Personal 100,000 150,000 258,621 108,621Supplementary Tax Bills 2,500 2,500 29,407 26,907
Total Taxes 42,237,500 41,685,500 41,597,570 (87,930)
Charges for Services:Rent or Lease Income 4,000 4,000 3,138 (862)Commodities 1,818,500 1,818,500 1,080,739 (737,761)Dumpster Permit Fees 12,300 12,300 10,670 (1,630)
Total Charges for Services 1,834,800 1,834,800 1,094,547 (740,253)
Property Sales 546,056 546,056
Fines and Forfeitures 500 500 24 (476)
Investments 375,000 375,000 (471,318) (846,318)
Other Income:Penalties & Interest 73,088 73,088Miscellaneous 8,300 8,300 17,851 9,551
Total Other Income 8,300 8,300 90,939 82,639Total Revenues 46,236,100 45,684,100 45,034,570 (649,530)
EXPENDITURESGeneral Government:
Property Valuation Administrator 186,335 186,335 186,335 Contingency 173,684 72,151 (72,151) Indirect Cost Allocation 2,283,800 2,283,800 2,683,948 400,148
Total General Government 2,643,819 2,542,286 2,870,283 327,997
Administrative Services:Human Resources 6,350 6,350 4,517 (1,833)Lex Call 550,998 550,662 511,052 (39,610)
Total Administrative Services 557,348 557,012 515,569 (41,443)
Department of Information Technology:Computer Services 1,018,688 1,071,646 717,705 (353,941)Office of the CIO 200,000 215,486 212,958 (2,528) Enterprise Solutions 6,300 6,300 6,688 388
Total Information Technology 1,224,988 1,293,432 937,351 (356,081)
Department of Finance:Central Purchasing 26,466 25,028 26,535 1,507Finance 20,139 20,139 20,116 (23)
Total Finance 46,605 45,167 46,651 1,484
Division of Environmental Quality & Public Works:Waste Management 32,525,595 30,649,305 25,866,573 (4,782,732) aDivision of Environmental Services 765,020 748,113 647,631 (100,482)Environmental Quality 844,326 1,015,231 780,342 (234,889)Streets & Roads 2,800,989 2,801,178 2,550,167 (251,011)Traffic Engineering 7,247,969 7,199,156 6,586,102 (613,054) a
Total Environmental Quality & Public Works 44,183,899 42,412,983 36,430,815 (5,982,168)
Department of General Services:Fleet & Facilities Management 4,921,907 5,260,017 5,284,456 24,439
Total General Services 4,921,907 5,260,017 5,284,456 24,439continued
LEXINGTON-FAYETTE URBAN COUNTY GOVERNMENT
SCHEDULE OF REVENUES, EXPENDITURES, AND CHANGES IN FUND BALANCEBUDGETARY COMPARISON
FULL URBAN SERVICES DISTRICT FUNDFor the Year Ended June 30, 2021
Budgeted Amounts
REQUIRED SUPPLEMENTARY INFORMATION
See Independent Auditor's Report 131
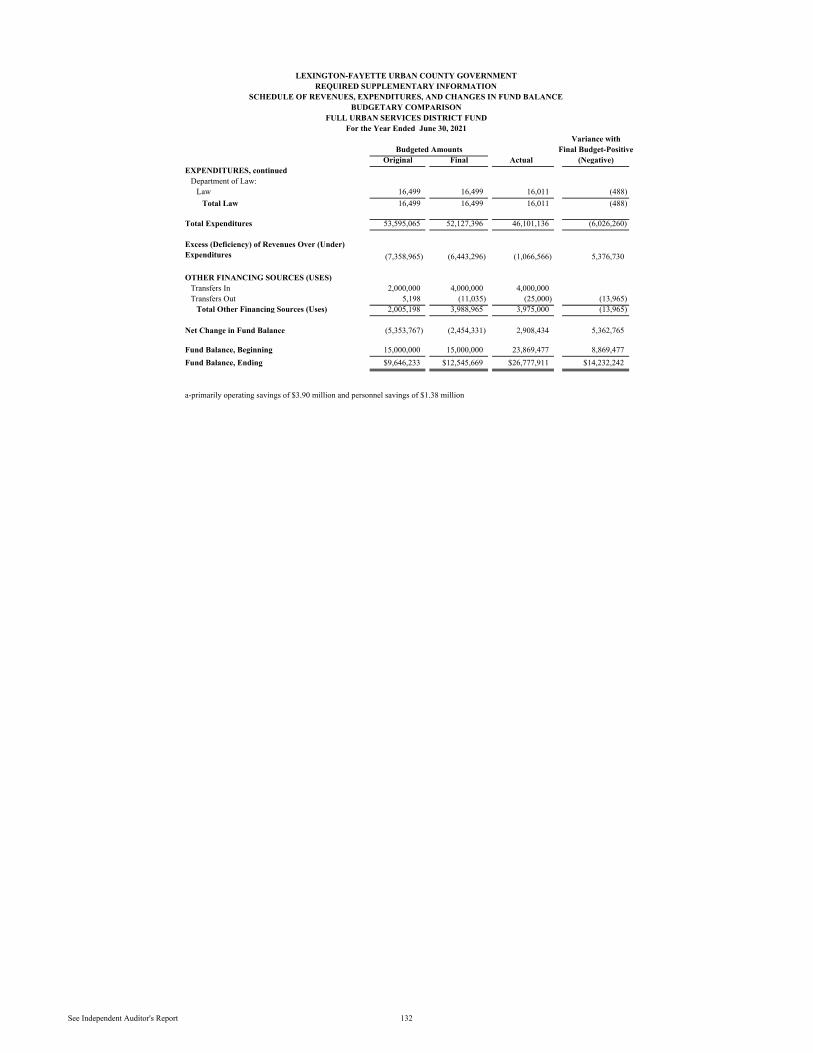
Variance withFinal Budget-Positive
Original Final Actual (Negative)
LEXINGTON-FAYETTE URBAN COUNTY GOVERNMENT
SCHEDULE OF REVENUES, EXPENDITURES, AND CHANGES IN FUND BALANCEBUDGETARY COMPARISON
FULL URBAN SERVICES DISTRICT FUNDFor the Year Ended June 30, 2021
Budgeted Amounts
REQUIRED SUPPLEMENTARY INFORMATION
EXPENDITURES, continuedDepartment of Law:
Law 16,499 16,499 16,011 (488)Total Law 16,499 16,499 16,011 (488)
Total Expenditures 53,595,065 52,127,396 46,101,136 (6,026,260)
Excess (Deficiency) of Revenues Over (Under) Expenditures (7,358,965) (6,443,296) (1,066,566) 5,376,730
OTHER FINANCING SOURCES (USES)Transfers In 2,000,000 4,000,000 4,000,000 Transfers Out 5,198 (11,035) (25,000) (13,965)
Total Other Financing Sources (Uses) 2,005,198 3,988,965 3,975,000 (13,965)
Net Change in Fund Balance (5,353,767) (2,454,331) 2,908,434 5,362,765
Fund Balance, Beginning 15,000,000 15,000,000 23,869,477 8,869,477Fund Balance, Ending $9,646,233 $12,545,669 $26,777,911 $14,232,242
a-primarily operating savings of $3.90 million and personnel savings of $1.38 million
See Independent Auditor's Report 132
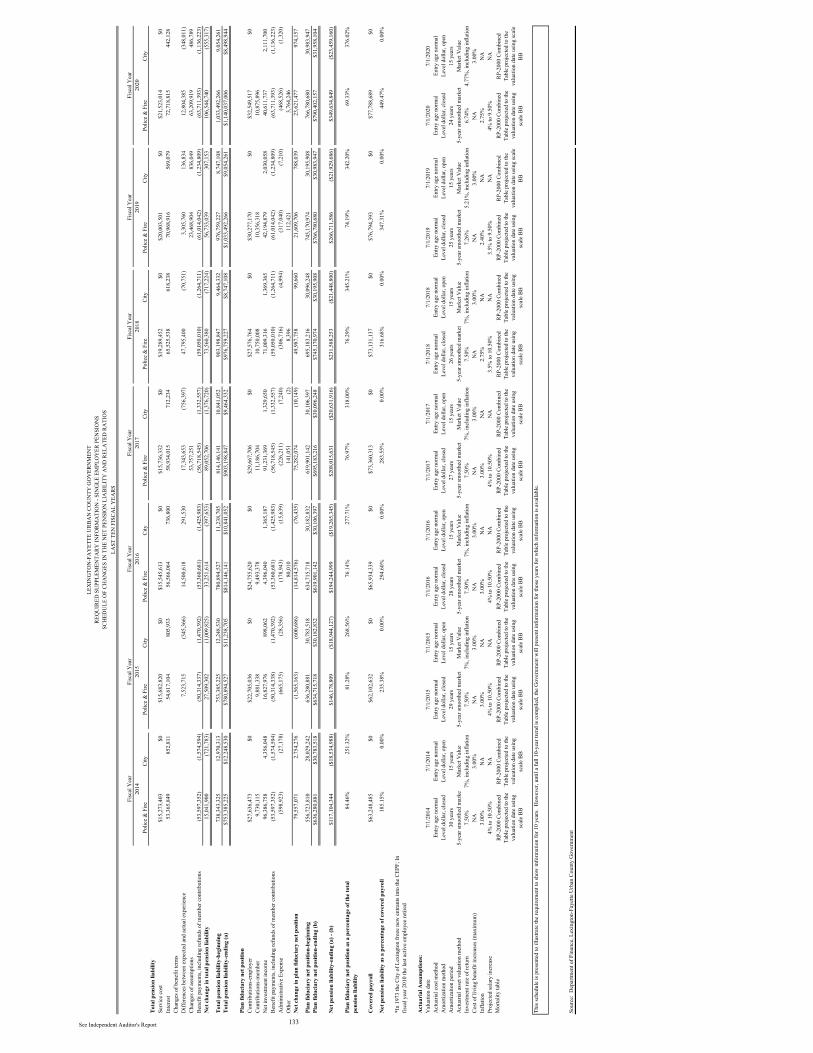
Polic
e &
Fire
City
Polic
e &
Fire
City
Polic
e &
Fire
City
Polic
e &
Fire
City
Polic
e &
Fire
City
Polic
e &
Fire
City
Polic
e &
Fire
City
Tota
l pen
sion
liabi
lity
Serv
ice
cost
$15,
273,
403
$0$1
5,68
2,82
0$0
$15,
545,
613
$0$1
5,73
6,33
2$0
$19,
289,
452
$0$2
0,00
3,50
1$0
$21,
523,
014
$0In
tere
st53
,365
,849
852,
811
54,6
17,1
0480
5,93
356
,566
,064
736,
800
58,9
34,0
1571
2,23
465
,525
,538
618,
238
70,9
68,9
1656
9,07
972
,718
,815
442,
128
Chan
ges o
f ben
efit
term
sD
iffer
ence
s bet
wee
n ex
pect
ed a
nd a
ctua
l exp
erie
nce
7,52
3,71
5(3
45,3
66)
14,5
00,6
1829
1,53
017
,343
,653
(756
,397
)47
,795
,400
(70,
751)
3,30
5,76
013
6,83
412
,804
,385
(348
,011
)Ch
ange
s of a
ssum
ptio
ns53
,757
,251
23,4
68,9
0483
6,04
963
,209
,919
486,
789
Bene
fit p
aym
ents,
incl
udin
g re
fund
s of m
embe
r con
tribu
tions
(53,
597,
352)
(1,5
74,5
94)
(50,
314,
337)
(1,4
70,3
92)
(53,
360,
681)
(1,4
25,9
83)
(56,
718,
545)
(1,3
32,5
57)
(59,
050,
010)
(1,2
64,7
11)
(61,
014,
042)
(1,2
34,8
09)
(63,
711,
393)
(1,1
36,2
23)
Net
cha
nge
in to
tal p
ensio
n lia
bilit
y15
,041
,900
(721
,783
)27
,509
,302
(1,0
09,8
25)
33,2
51,6
14(3
97,6
53)
89,0
52,7
06(1
,376
,720
)73
,560
,380
(717
,224
)56
,733
,039
307,
153
106,
544,
740
(555
,317
)
Tota
l pen
sion
liabi
lity-
begi
nnin
g73
8,34
3,32
512
,970
,313
753,
385,
225
12,2
48,5
3078
0,89
4,52
711
,238
,705
814,
146,
141
10,8
41,0
5290
3,19
8,84
79,
464,
332
976,
759,
227
8,74
7,10
81,
033,
492,
266
9,05
4,26
1To
tal p
ensio
n lia
bilit
y-en
ding
(a)
$753
,385
,225
$12,
248,
530
$780
,894
,527
$11,
238,
705
$814
,146
,141
$10,
841,
052
$903
,198
,847
$9,4
64,3
32$9
76,7
59,2
27$8
,747
,108
$1,0
33,4
92,2
66$9
,054
,261
$1,1
40,0
37,0
06$8
,498
,944
Plan
fidu
ciar
y ne
t pos
ition
Cont
ribut
ions
-em
ploy
er$2
7,63
6,47
3$0
$22,
705,
036
$0$2
4,75
5,62
0$0
$29,
667,
706
$0$2
7,57
6,76
4$0
$30,
277,
170
$0$3
2,54
9,51
7$0
Cont
ribut
ions
-mem
ber
9,73
0,11
59,
881,
338
9,49
3,37
811
,186
,704
10,7
50,0
0810
,356
,318
10,8
75,8
96N
et in
vestm
ent i
ncom
e96
,386
,758
4,35
6,04
816
,827
,976
898,
062
4,39
6,04
01,
365,
187
91,2
31,3
691,
329,
650
71,0
09,3
161,
369,
365
42,1
94,8
792,
030,
058
40,6
11,7
372,
111,
700
Bene
fit p
aym
ents,
incl
udin
g re
fund
s of m
embe
r con
tribu
tions
(53,
597,
352)
(1,5
74,5
94)
(50,
314,
338)
(1,4
70,3
92)
(53,
360,
681)
(1,4
25,9
83)
(56,
718,
545)
(1,3
32,5
57)
(59,
050,
010)
(1,2
64,7
11)
(61,
014,
042)
(1,2
34,8
09)
(63,
711,
393)
(1,1
36,2
23)
Adm
inist
rativ
e Ex
pens
e(5
98,9
23)
(27,
178)
(665
,175
)(2
8,35
6)(1
78,9
43)
(15,
639)
(226
,211
)(7
,240
)(3
06,7
16)
(4,9
94)
(317
,040
)(7
,210
)(4
68,5
26)
(1,3
20)
Oth
er80
,010
141,
051
(2)
8,39
611
2,42
13,
764,
246
Net
cha
nge
in p
lan
fiduc
iary
net
pos
ition
79,5
57,0
712,
754,
276
(1,5
65,1
63)
(600
,686
)(1
4,81
4,57
6)(7
6,43
5)75
,282
,074
(10,
149)
49,9
87,7
5899
,660
21,6
09,7
0678
8,03
923
,621
,477
974,
157
Plan
fidu
ciar
y ne
t pos
ition
-beg
inni
ng55
6,72
3,81
028
,029
,242
636,
280,
881
30,7
83,5
1863
4,71
5,71
830
,182
,832
619,
901,
142
30,1
06,3
9769
5,18
3,21
630
,096
,248
745,
170,
974
30,1
95,9
0876
6,78
0,68
030
,983
,947
Plan
fidu
ciar
y ne
t pos
ition
-end
ing
(b)
$636
,280
,881
$30,
783,
518
$634
,715
,718
$30,
182,
832
$619
,901
,142
$30,
106,
397
$695
,183
,216
$30,
096,
248
$745
,170
,974
$30,
195,
908
$766
,780
,680
$30,
983,
947
$790
,402
,157
$31,
958,
104
Net
pen
sion
liabi
lity-
endi
ng (a
) - (b
)$1
17,1
04,3
44($
18,5
34,9
88)
$146
,178
,809
($18
,944
,127
)$1
94,2
44,9
99($
19,2
65,3
45)
$208
,015
,631
($20
,631
,916
)$2
31,5
88,2
53($
21,4
48,8
00)
$266
,711
,586
($21
,929
,686
)$3
49,6
34,8
49($
23,4
59,1
60)
Plan
fidu
ciar
y ne
t pos
ition
as a
per
cent
age
of th
e to
tal
84.4
6%25
1.32
%81
.28%
268.
56%
76.1
4%27
7.71
%76
.97%
318.
00%
76.2
9%34
5.21
%74
.19%
342.
20%
69.3
3%37
6.02
%pe
nsio
n lia
bilit
y
Cov
ered
pay
roll
$63,
248,
485
$0$6
2,10
2,63
2$0
$65,
934,
339
$0$7
3,36
0,31
3$0
$73,
131,
137
$0$7
6,79
4,39
3$0
$77,
788,
689
$0
Net
pen
sion
liabi
lity
as a
per
cent
age
of c
over
ed p
ayro
ll18
5.15
%0.
00%
235.
38%
0.00
%29
4.60
%0.
00%
283.
55%
0.00
%31
6.68
%0.
00%
347.
31%
0.00
%44
9.47
%0.
00%
*In
1973
the
City
of L
exin
gton
froz
e ne
w e
ntra
nts i
nto
the
CEPF
; In
fisca
l yea
r 201
0 th
e la
st ac
tive
empl
oyee
retir
ed
Act
uari
al A
ssum
ptio
ns:
Val
uatio
n da
te7/
1/20
147/
1/20
147/
1/20
157/
1/20
157/
1/20
167/
1/20
167/
1/20
177/
1/20
177/
1/20
187/
1/20
187/
1/20
197/
1/20
197/
1/20
207/
1/20
20A
ctua
rial c
ost m
etho
dEn
try a
ge n
orm
alEn
try a
ge n
orm
alEn
try a
ge n
orm
alEn
try a
ge n
orm
alEn
try a
ge n
orm
alEn
try a
ge n
orm
alEn
try a
ge n
orm
alEn
try a
ge n
orm
alEn
try a
ge n
orm
alEn
try a
ge n
orm
alEn
try a
ge n
orm
alEn
try a
ge n
orm
alEn
try a
ge n
orm
alEn
try a
ge n
orm
alA
mor
tizat
ion
met
hod
Leve
l dol
lar,
clos
edLe
vel d
olla
r, op
enLe
vel d
olla
r, cl
osed
Leve
l dol
lar,
open
Leve
l dol
lar,
clos
edLe
vel d
olla
r, op
enLe
vel d
olla
r, cl
osed
Leve
l dol
lar,
open
Leve
l dol
lar,
clos
edLe
vel d
olla
r, op
enLe
vel d
olla
r, cl
osed
Leve
l dol
lar,
open
Leve
l dol
lar,
clos
edLe
vel d
olla
r, op
enA
mor
tizai
ton
perio
d30
yea
rs15
yea
rs29
yea
rs15
yea
rs28
yea
rs15
yea
rs27
yea
rs15
yea
rs26
yea
rs15
yea
rs25
yea
rs15
yea
rs24
yea
rs15
yea
rsA
ctua
rial a
sset
val
uatio
n m
etho
d5-
year
smoo
thed
mar
ket
Mar
ket V
alue
5-ye
ar sm
ooth
ed m
arke
tM
arke
t Val
ue5-
year
smoo
thed
mar
ket
Mar
ket V
alue
5-ye
ar sm
ooth
ed m
arke
tM
arke
t Val
ue5-
year
smoo
thed
mar
ket
Mar
ket V
alue
5-ye
ar sm
ooth
ed m
arke
tM
arke
t Val
ue5-
year
smoo
thed
mar
ket
Mar
ket V
alue
Inve
stmen
t rat
e of
retu
rn7.
50%
7%, i
nclu
ding
infla
tion
7.50
%7%
, inc
ludi
ng in
flatio
n7.
50%
7%, i
nclu
ding
infla
tion
7.50
%7%
, inc
ludi
ng in
flatio
n7.
50%
7%, i
nclu
ding
infla
tion
7.26
%5.
21%
, inc
ludi
ng in
flatio
n6.
74%
4.77
%, i
nclu
ding
infla
tion
Cost
of li
ving
ben
efit
incr
ease
s (m
axim
um)
NA
3.00
%N
A3.
00%
NA
3.00
%N
A3.
00%
NA
3.00
%N
A3.
00%
NA
3.00
%In
flatio
n3.
00%
NA
3.00
%N
A3.
00%
NA
3.00
%N
A2.
75%
NA
2.40
%N
A2.
75%
NA
Proj
ecte
d sa
lary
incr
ease
4% to
10.
50%
NA
4% to
10.
50%
NA
4% to
10.
50%
NA
4% to
10.
50%
NA
3.5%
to 1
0.50
%N
A3.
5% to
9.5
0%N
A4%
to 9
.50%
NA
Mor
talit
y ta
ble
RP-2
000
Com
bine
d Ta
ble
proj
ecte
d to
the
valu
atio
n da
te u
sing
scal
e BB
RP-2
000
Com
bine
d Ta
ble
proj
ecte
d to
the
valu
atio
n da
te u
sing
scal
e BB
RP-2
000
Com
bine
d Ta
ble
proj
ecte
d to
the
valu
atio
n da
te u
sing
scal
e BB
RP-2
000
Com
bine
d Ta
ble
proj
ecte
d to
the
valu
atio
n da
te u
sing
scal
e BB
RP-2
000
Com
bine
d Ta
ble
proj
ecte
d to
the
valu
atio
n da
te u
sing
scal
e BB
RP-2
000
Com
bine
d Ta
ble
proj
ecte
d to
the
valu
atio
n da
te u
sing
scal
e BB
RP-2
000
Com
bine
d Ta
ble
proj
ecte
d to
the
valu
atio
n da
te u
sing
scal
e BB
RP-2
000
Com
bine
d Ta
ble
proj
ecte
d to
the
valu
atio
n da
te u
sing
scal
e BB
RP-2
000
Com
bine
d Ta
ble
proj
ecte
d to
the
valu
atio
n da
te u
sing
scal
e BB
RP-2
000
Com
bine
d Ta
ble
proj
ecte
d to
the
valu
atio
n da
te u
sing
scal
e BB
RP-2
000
Com
bine
d Ta
ble
proj
ecte
d to
the
valu
atio
n da
te u
sing
scal
e BB
RP-2
000
Com
bine
d Ta
ble
proj
ecte
d to
the
valu
atio
n da
te u
sing
scal
e BB
RP-2
000
Com
bine
d Ta
ble
proj
ecte
d to
the
valu
atio
n da
te u
sing
scal
e BB
RP-2
000
Com
bine
d Ta
ble
proj
ecte
d to
the
valu
atio
n da
te u
sing
scal
e BB
Sour
ce:
Dep
artm
ent o
f Fin
ance
, Lex
ingt
on-F
ayet
te U
rban
Cou
nty
Gov
ernm
ent
Fisc
al Y
ear
2018
Fisc
al Y
ear
2016
133
2014
See Independent Auditor's Report
Fisc
al Y
ear
Fisc
al Y
ear
2020
This
sche
dule
is p
rese
nted
to il
lustr
ate
the
requ
irem
ent t
o sh
ow in
form
atio
n fo
r 10
year
s. H
owev
er, u
ntil
a fu
ll 10
-yea
r tre
nd is
com
pile
d, th
e G
over
nmen
t will
pre
sent
info
rmat
ion
for t
hose
yea
rs fo
r whi
ch in
form
atio
n is
avai
labl
e.
LAST
TEN
FIS
CAL
YEA
RS
LEX
ING
TON
-FA
YET
TE U
RBA
N C
OU
NTY
GO
VER
NM
ENT
REQ
UIR
ED S
UPP
LEM
ENTA
RY IN
FORM
ATI
ON
- SI
NG
LE E
MPL
OY
ER P
ENSI
ON
SSC
HED
ULE
OF
CHA
NG
ES IN
TH
E N
ET P
ENSI
ON
LIA
BILI
TY A
ND
REL
ATE
D R
ATI
OS
Fisc
al Y
ear
2017
Fisc
al Y
ear
2019
Fisc
al Y
ear
2015
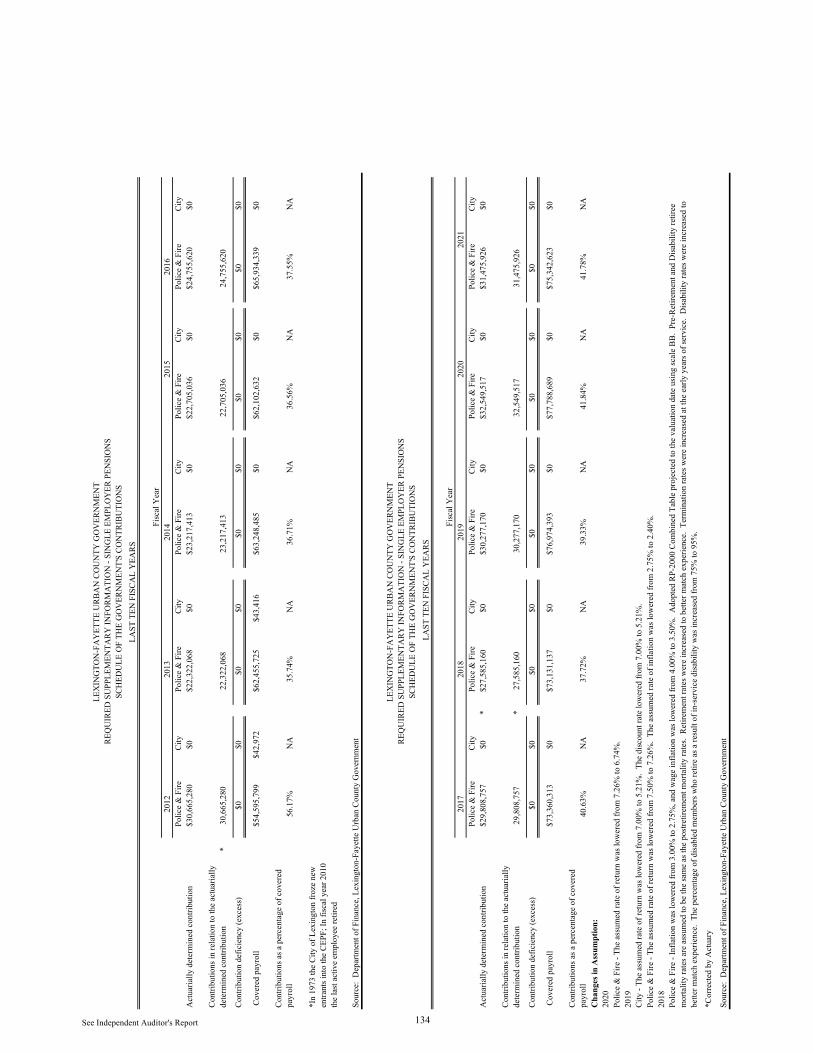
2012
2013
2014
2016
Polic
e &
Fire
City
Polic
e &
Fire
City
Polic
e &
Fire
City
Polic
e &
Fire
City
Polic
e &
Fire
City
Act
uaria
lly d
eter
min
ed c
ontri
butio
n$3
0,66
5,28
0$0
$22,
322,
068
$0$2
3,21
7,41
3$0
$22,
705,
036
$0$2
4,75
5,62
0$0
Cont
ribut
ions
in re
latio
n to
the
actu
aria
llyde
term
ined
con
tribu
tion
*30
,665
,280
22,3
22,0
6823
,217
,413
22,7
05,0
3624
,755
,620
Cont
ribut
ion
defic
ienc
y (e
xces
s)$0
$0$0
$0$0
$0$0
$0$0
$0
Cov
ered
pay
roll
$54,
595,
799
$42,
972
$62,
455,
725
$43,
416
$63,
248,
485
$0$6
2,10
2,63
2$0
$65,
934,
339
$0
Cont
ribut
ions
as a
per
cent
age
of c
over
ed
payr
oll
56.1
7%N
A35
.74%
NA
36.7
1%N
A36
.56%
NA
37.5
5%N
A
*In
1973
the
City
of L
exin
gton
froz
e ne
w
entra
nts i
nto
the
CEPF
; In
fisca
l yea
r 201
0 th
e la
st ac
tive
empl
oyee
retir
ed
Sour
ce:
Dep
artm
ent o
f Fin
ance
, Lex
ingt
on-F
ayet
te U
rban
Cou
nty
Gov
ernm
ent
2017
2018
2019
Polic
e &
Fire
City
Polic
e &
Fire
City
Polic
e &
Fire
City
Polic
e &
Fire
City
Polic
e &
Fire
City
Act
uaria
lly d
eter
min
ed c
ontri
butio
n$2
9,80
8,75
7$0
*$2
7,58
5,16
0$0
$30,
277,
170
$0$3
2,54
9,51
7$0
$31,
475,
926
$0
Cont
ribut
ions
in re
latio
n to
the
actu
aria
llyde
term
ined
con
tribu
tion
29,8
08,7
57*
27,5
85,1
6030
,277
,170
32,5
49,5
1731
,475
,926
Cont
ribut
ion
defic
ienc
y (e
xces
s)$0
$0$0
$0$0
$0$0
$0$0
$0
Cov
ered
pay
roll
$7
3,36
0,31
3$0
$73,
131,
137
$0$7
6,97
4,39
3$0
$77,
788,
689
$0$7
5,34
2,62
3$0
Cont
ribut
ions
as a
per
cent
age
of c
over
ed
payr
oll
40.6
3%N
A37
.72%
NA
39.3
3%N
A41
.84%
NA
41.7
8%N
AC
hang
es in
Ass
umpt
ion:
2020
Polic
e &
Fire
- Th
e as
sum
ed ra
te o
f ret
urn
was
low
ered
from
7.5
0% to
7.2
6%.
The
assu
med
rate
of i
nfla
tion
was
low
ered
from
2.7
5% to
2.4
0%.
*Cor
rect
ed b
y A
ctua
ry
Sour
ce:
Dep
artm
ent o
f Fin
ance
, Lex
ingt
on-F
ayet
te U
rban
Cou
nty
Gov
ernm
ent
2018
Polic
e &
Fire
- In
flatio
n w
as lo
wer
ed fr
om 3
.00%
to 2
.75%
, and
wag
e in
flatio
n w
as lo
wer
ed fr
om 4
.00%
to 3
.50%
. A
dopt
ed R
P-20
00 C
ombi
ned
Tabl
e pr
ojec
ted
to th
e va
luat
ion
date
usin
g sc
ale
BB.
Pre-
Retir
emen
t and
Disa
bilit
y re
tiree
m
orta
lity
rate
s are
ass
umed
to b
e th
e sa
me
as th
e po
stret
irem
ent m
orta
lity
rate
s. R
etire
men
t rat
es w
ere
incr
ease
d to
bet
ter m
atch
exp
erie
nce.
Ter
min
atio
n ra
tes w
ere
incr
ease
d at
the
early
yea
rs o
f ser
vice
. D
isabi
lity
rate
s wer
e in
crea
sed
to
bette
r mat
ch e
xper
ienc
e. T
he p
erce
ntag
e of
disa
bled
mem
bers
who
retir
e as
a re
sult
of in
-ser
vice
disa
bilit
y w
as in
crea
sed
from
75%
to 9
5%.
134
2019
City
- Th
e as
sum
ed ra
te o
f ret
urn
was
low
ered
from
7.0
0% to
5.2
1%.
The
disc
ount
rate
low
ered
from
7.0
0% to
5.2
1%.
Polic
e &
Fire
- Th
e as
sum
ed ra
te o
f ret
urn
was
low
ered
from
7.2
6% to
6.7
4%.
See Independent Auditor's Report
LEX
ING
TON
-FA
YET
TE U
RBA
N C
OU
NTY
GO
VER
NM
ENT
REQ
UIR
ED S
UPP
LEM
ENTA
RY IN
FORM
ATI
ON
- SI
NG
LE E
MPL
OY
ER P
ENSI
ON
S
2020
2021
SCH
EDU
LE O
F TH
E G
OV
ERN
MEN
T'S
CON
TRIB
UTI
ON
SLA
ST T
EN F
ISCA
L Y
EARS
Fisc
al Y
ear
LAST
TEN
FIS
CAL
YEA
RSSC
HED
ULE
OF
THE
GO
VER
NM
ENT'
S CO
NTR
IBU
TIO
NS
REQ
UIR
ED S
UPP
LEM
ENTA
RY IN
FORM
ATI
ON
- SI
NG
LE E
MPL
OY
ER P
ENSI
ON
SLE
XIN
GTO
N-F
AY
ETTE
URB
AN
CO
UN
TY G
OV
ERN
MEN
T
Fisc
al Y
ear
2015
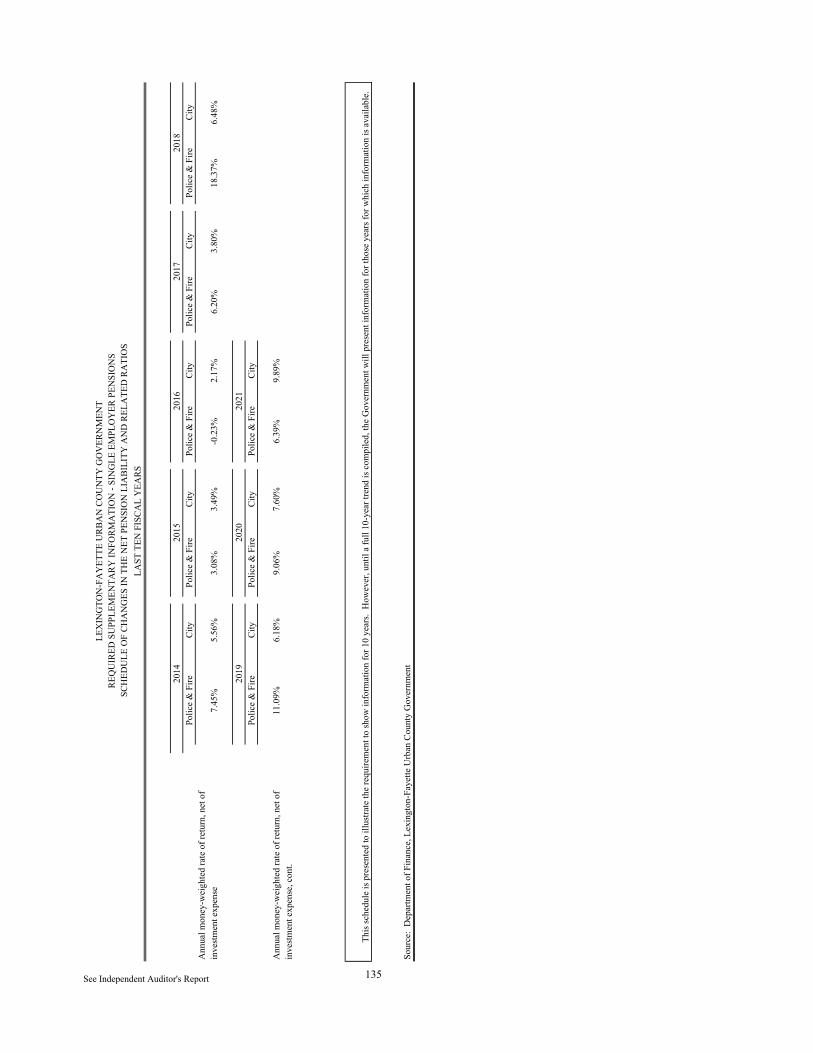
Polic
e &
Fire
City
Polic
e &
Fire
City
Polic
e &
Fire
City
Polic
e &
Fire
City
Polic
e &
Fire
City
Ann
ual m
oney
-wei
ghte
d ra
te o
f ret
urn,
net
of
inve
stmen
t exp
ense
7.45
%5.
56%
3.08
%3.
49%
-0.2
3%2.
17%
6.20
%3.
80%
18.3
7%6.
48%
Polic
e &
Fire
City
Polic
e &
Fire
City
Polic
e &
Fire
City
Ann
ual m
oney
-wei
ghte
d ra
te o
f ret
urn,
net
of
11.0
9%6.
18%
9.06
%7.
60%
6.39
%9.
89%
inve
stmen
t exp
ense
, con
t.
Sour
ce:
Dep
artm
ent o
f Fin
ance
, Lex
ingt
on-F
ayet
te U
rban
Cou
nty
Gov
ernm
ent
2020
2019
2017
2018
135 See Independent Auditor's Report
LEX
ING
TON
-FA
YET
TE U
RBA
N C
OU
NTY
GO
VER
NM
ENT
REQ
UIR
ED S
UPP
LEM
ENTA
RY IN
FORM
ATI
ON
- SI
NG
LE E
MPL
OY
ER P
ENSI
ON
SSC
HED
ULE
OF
CHA
NG
ES IN
TH
E N
ET P
ENSI
ON
LIA
BILI
TY A
ND
REL
ATE
D R
ATI
OS
LAST
TEN
FIS
CAL
YEA
RS
This
sche
dule
is p
rese
nted
to il
lustr
ate
the
requ
irem
ent t
o sh
ow in
form
atio
n fo
r 10
year
s. H
owev
er, u
ntil
a fu
ll 10
-yea
r tre
nd is
com
pile
d, th
e G
over
nmen
t will
pre
sent
info
rmat
ion
for t
hose
yea
rs fo
r whi
ch in
form
atio
n is
avai
labl
e.
2014
2015
2021
2016
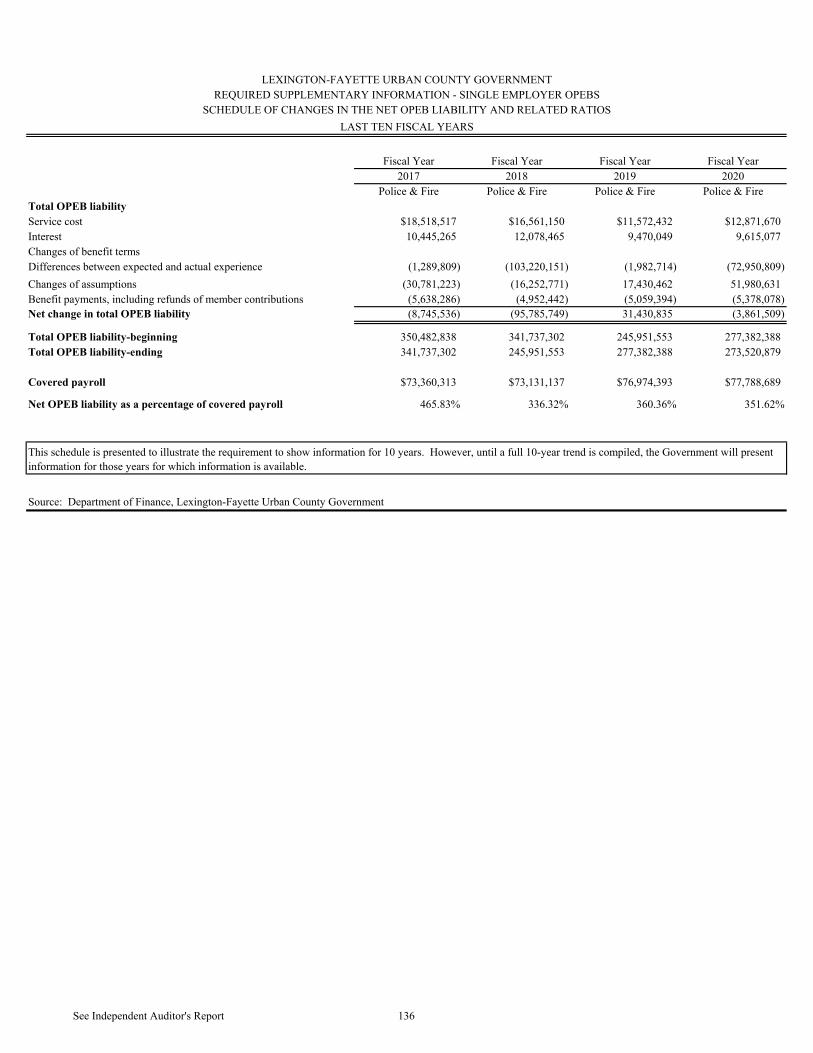
Fiscal Year Fiscal Year Fiscal Year Fiscal Year2017 2018 2019 2020
Police & Fire Police & Fire Police & Fire Police & FireTotal OPEB liabilityService cost $18,518,517 $16,561,150 $11,572,432 $12,871,670Interest 10,445,265 12,078,465 9,470,049 9,615,077Changes of benefit termsDifferences between expected and actual experience (1,289,809) (103,220,151) (1,982,714) (72,950,809)Changes of assumptions (30,781,223) (16,252,771) 17,430,462 51,980,631Benefit payments, including refunds of member contributions (5,638,286) (4,952,442) (5,059,394) (5,378,078)Net change in total OPEB liability (8,745,536) (95,785,749) 31,430,835 (3,861,509)
Total OPEB liability-beginning 350,482,838 341,737,302 245,951,553 277,382,388Total OPEB liability-ending 341,737,302 245,951,553 277,382,388 273,520,879
Covered payroll $73,360,313 $73,131,137 $76,974,393 $77,788,689
Net OPEB liability as a percentage of covered payroll 465.83% 336.32% 360.36% 351.62%
Source: Department of Finance, Lexington-Fayette Urban County Government
This schedule is presented to illustrate the requirement to show information for 10 years. However, until a full 10-year trend is compiled, the Government will present information for those years for which information is available.
LEXINGTON-FAYETTE URBAN COUNTY GOVERNMENTREQUIRED SUPPLEMENTARY INFORMATION - SINGLE EMPLOYER OPEBS
SCHEDULE OF CHANGES IN THE NET OPEB LIABILITY AND RELATED RATIOSLAST TEN FISCAL YEARS
See Independent Auditor's Report 136
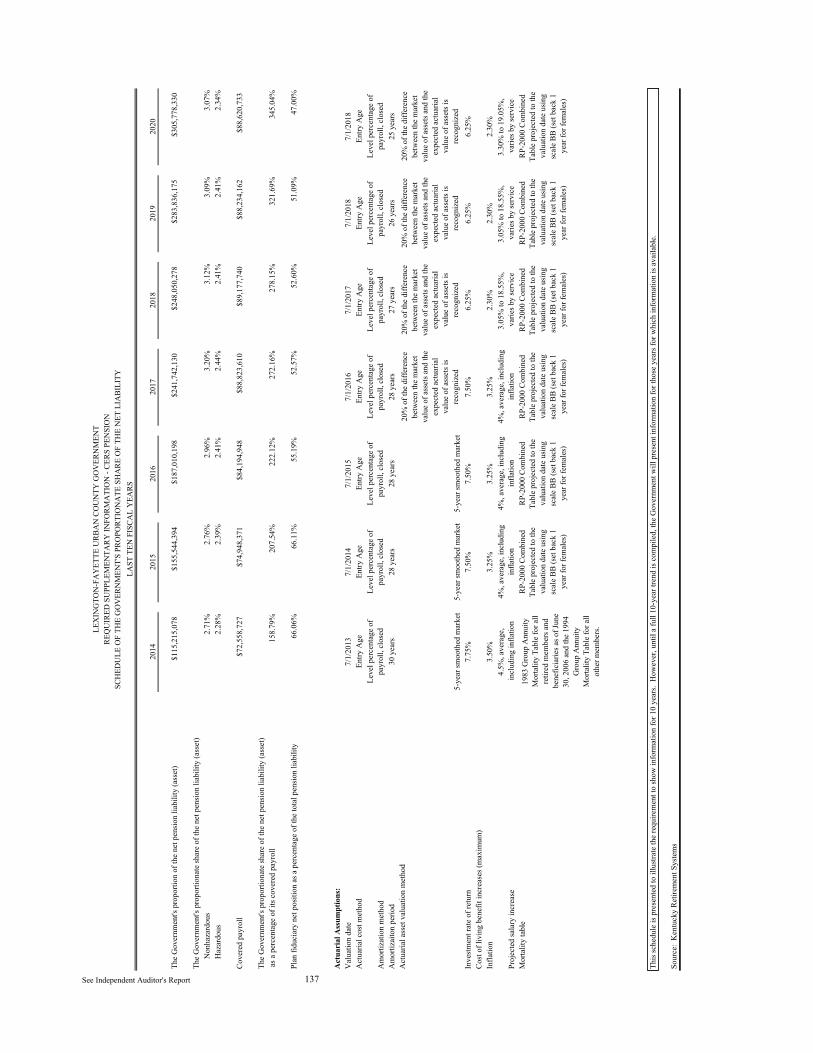
2014
2015
2016
2017
2018
2019
2020
The
Gov
ernm
ent's
pro
porti
on o
f the
net
pen
sion
liabi
lity
(ass
et)
$115
,215
,078
$155
,544
,394
$187
,010
,198
$241
,742
,130
$248
,050
,278
$283
,836
,175
$305
,778
,330
The
Gov
ernm
ent's
pro
porti
onat
e sh
are
of th
e ne
t pen
sion
liabi
lity
(ass
et)
Non
haza
rdou
s2.
71%
2.76
%2.
96%
3.20
%3.
12%
3.09
%3.
07%
Haz
ardo
us2.
28%
2.39
%2.
41%
2.44
%2.
41%
2.41
%2.
34%
Cove
red
payr
oll
$72,
558,
727
$74,
948,
371
$84,
194,
948
$88,
823,
610
$89,
177,
740
$88,
234,
162
$88,
620,
733
The
Gov
ernm
ent's
pro
porti
onat
e sh
are
of th
e ne
t pen
sion
liabi
lity
(ass
et)
as a
per
cent
age
of it
s cov
ered
pay
roll
158.
79%
207.
54%
222.
12%
272.
16%
278.
15%
321.
69%
345.
04%
Plan
fidu
ciar
y ne
t pos
ition
as a
per
cent
age
of th
e to
tal p
ensio
n lia
bilit
y66
.06%
66.1
1%55
.19%
52.5
7%52
.60%
51.0
9%47
.00%
Act
uari
al A
ssum
ptio
ns:
Val
uatio
n da
te7/
1/20
137/
1/20
147/
1/20
157/
1/20
167/
1/20
177/
1/20
187/
1/20
18A
ctua
rial c
ost m
etho
dEn
try A
geEn
try A
geEn
try A
geEn
try A
geEn
try A
geEn
try A
geEn
try A
ge
Am
ortiz
atio
n m
etho
dLe
vel p
erce
ntag
e of
pa
yrol
l, cl
osed
Leve
l per
cent
age
of
payr
oll,
clos
edLe
vel p
erce
ntag
e of
pa
yrol
l, cl
osed
Leve
l per
cent
age
of
payr
oll,
clos
edLe
vel p
erce
ntag
e of
pa
yrol
l, cl
osed
Leve
l per
cent
age
of
payr
oll,
clos
edLe
vel p
erce
ntag
e of
pa
yrol
l, cl
osed
Am
ortiz
aito
n pe
riod
30 y
ears
28 y
ears
28 y
ears
28 y
ears
27 y
ears
26 y
ears
25 y
ears
Act
uaria
l ass
et v
alua
tion
met
hod
5-ye
ar sm
ooth
ed m
arke
t5-
year
smoo
thed
mar
ket
5-ye
ar sm
ooth
ed m
arke
t
20%
of t
he d
iffer
ence
be
twee
n th
e m
arke
t va
lue
of a
sset
s and
the
expe
cted
act
uaria
l va
lue
of a
sset
s is
reco
gniz
ed
20%
of t
he d
iffer
ence
be
twee
n th
e m
arke
t va
lue
of a
sset
s and
the
expe
cted
act
uaria
l va
lue
of a
sset
s is
reco
gniz
ed
20%
of t
he d
iffer
ence
be
twee
n th
e m
arke
t va
lue
of a
sset
s and
the
expe
cted
act
uaria
l va
lue
of a
sset
s is
reco
gniz
ed
20%
of t
he d
iffer
ence
be
twee
n th
e m
arke
t va
lue
of a
sset
s and
the
expe
cted
act
uaria
l va
lue
of a
sset
s is
reco
gniz
ed
Inve
stmen
t rat
e of
retu
rn7.
75%
7.50
%7.
50%
7.50
%6.
25%
6.25
%6.
25%
Cost
of li
ving
ben
efit
incr
ease
s (m
axim
um)
Infla
tion
3.50
%3.
25%
3.25
%3.
25%
2.30
%2.
30%
2.30
%
Proj
ecte
d sa
lary
incr
ease
4.5%
, ave
rage
, in
clud
ing
infla
tion
4%, a
vera
ge, i
nclu
ding
in
flatio
n4%
, ave
rage
, inc
ludi
ng
infla
tion
4%, a
vera
ge, i
nclu
ding
in
flatio
n3.
05%
to 1
8.55
%,
varie
s by
serv
ice
3.05
% to
18.
55%
, va
ries b
y se
rvic
e3.
30%
to 1
9.05
%,
varie
s by
serv
ice
Mor
talit
y ta
ble
1983
Gro
up A
nnui
ty
Mor
talit
y Ta
ble
for a
ll re
tired
mem
bers
and
be
nefic
iarie
s as o
f Jun
e 30
, 200
6 an
d th
e 19
94
Gro
up A
nnui
ty
Mor
talit
y Ta
ble
for a
ll ot
her m
embe
rs.
RP-2
000
Com
bine
d Ta
ble
proj
ecte
d to
the
valu
atio
n da
te u
sing
scal
e BB
(set
bac
k 1
year
for f
emal
es)
RP-2
000
Com
bine
d Ta
ble
proj
ecte
d to
the
valu
atio
n da
te u
sing
scal
e BB
(set
bac
k 1
year
for f
emal
es)
RP-2
000
Com
bine
d Ta
ble
proj
ecte
d to
the
valu
atio
n da
te u
sing
scal
e BB
(set
bac
k 1
year
for f
emal
es)
RP-2
000
Com
bine
d Ta
ble
proj
ecte
d to
the
valu
atio
n da
te u
sing
scal
e BB
(set
bac
k 1
year
for f
emal
es)
RP-2
000
Com
bine
d Ta
ble
proj
ecte
d to
the
valu
atio
n da
te u
sing
scal
e BB
(set
bac
k 1
year
for f
emal
es)
RP-2
000
Com
bine
d Ta
ble
proj
ecte
d to
the
valu
atio
n da
te u
sing
scal
e BB
(set
bac
k 1
year
for f
emal
es)
Sour
ce:
Ken
tuck
y Re
tirem
ent S
yste
ms
137 See Independent Auditor's Report
LEX
ING
TON
-FA
YET
TE U
RBA
N C
OU
NTY
GO
VER
NM
ENT
REQ
UIR
ED S
UPP
LEM
ENTA
RY IN
FORM
ATI
ON
- CE
RS P
ENSI
ON
SCH
EDU
LE O
F TH
E G
OV
ERN
MEN
T'S
PRO
PORT
ION
ATE
SH
ARE
OF
THE
NET
LIA
BILI
TYLA
ST T
EN F
ISCA
L Y
EARS
This
sche
dule
is p
rese
nted
to il
lustr
ate
the
requ
irem
ent t
o sh
ow in
form
atio
n fo
r 10
year
s. H
owev
er, u
ntil
a fu
ll 10
-yea
r tre
nd is
com
pile
d, th
e G
over
nmen
t will
pre
sent
info
rmat
ion
for t
hose
yea
rs fo
r whi
ch in
form
atio
n is
avai
labl
e.
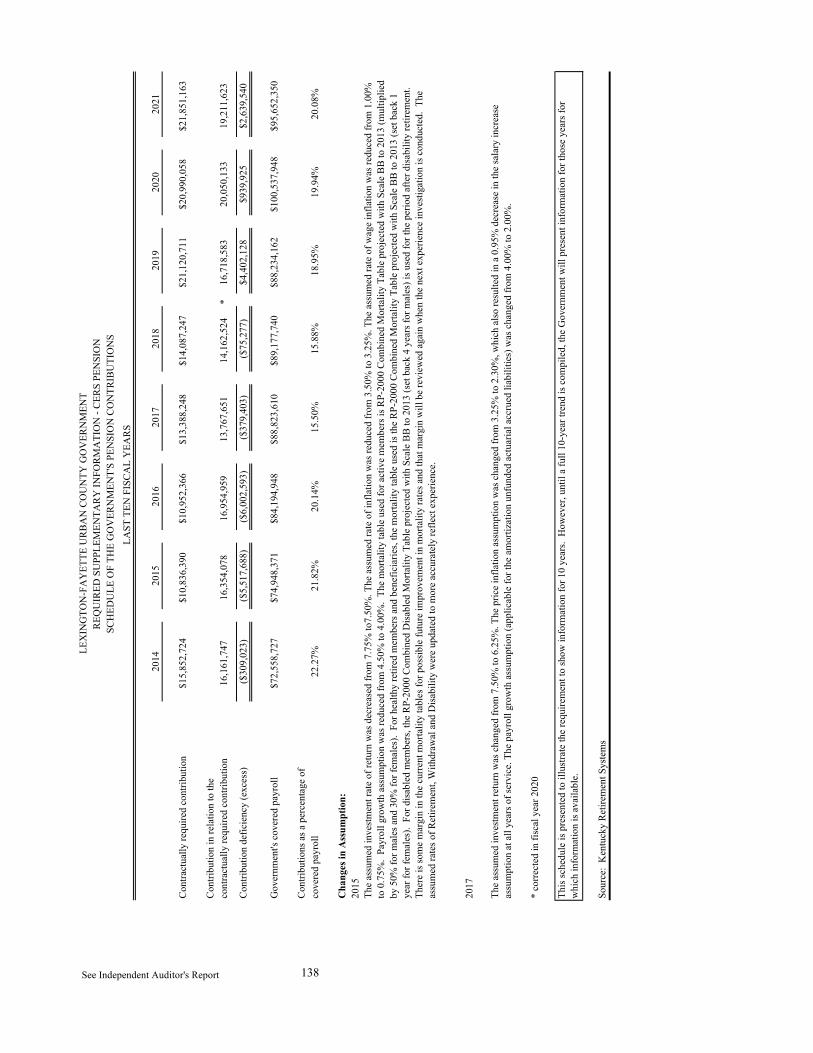
2014
2015
2016
2017
2018
2019
2020
2021
Cont
ract
ually
requ
ired
cont
ribut
ion
$15,
852,
724
$10,
836,
390
$10,
952,
366
$13,
388,
248
$14,
087,
247
$21,
120,
711
$20,
990,
058
$21,
851,
163
Cont
ribut
ion
in re
latio
n to
the
cont
ract
ually
requ
ired
cont
ribut
ion
16,1
61,7
4716
,354
,078
16,9
54,9
5913
,767
,651
14,1
62,5
24*
16,7
18,5
8320
,050
,133
19,2
11,6
23
Cont
ribut
ion
defic
ienc
y (e
xces
s)($
309,
023)
($5,
517,
688)
($6,
002,
593)
($37
9,40
3)($
75,2
77)
$4,4
02,1
28$9
39,9
25$2
,639
,540
Gov
ernm
ent's
cov
ered
pay
roll
$72,
558,
727
$74,
948,
371
$84,
194,
948
$88,
823,
610
$89,
177,
740
$88,
234,
162
$100
,537
,948
$95,
652,
350
Cont
ribut
ions
as a
per
cent
age
ofco
vere
d pa
yrol
l22
.27%
21.8
2%20
.14%
15.5
0%15
.88%
18.9
5%19
.94%
20.0
8%
Cha
nges
in A
ssum
ptio
n:
2017
* co
rrect
ed in
fisc
al y
ear 2
020
138
Sour
ce:
Ken
tuck
y Re
tirem
ent S
yste
ms
See Independent Auditor's Report
LEX
ING
TON
-FA
YET
TE U
RBA
N C
OU
NTY
GO
VER
NM
ENT
2015
The
assu
med
inve
stmen
t rat
e of
retu
rn w
as d
ecre
ased
from
7.7
5% to
7.50
%. T
he a
ssum
ed ra
te o
f inf
latio
n w
as re
duce
d fro
m 3
.50%
to 3
.25%
. The
ass
umed
rate
of w
age
infla
tion
was
redu
ced
from
1.0
0%
to 0
.75%
. Pa
yrol
l gro
wth
ass
umpt
ion
was
redu
ced
from
4.5
0% to
4.0
0%.
The
mor
talit
y ta
ble
used
for a
ctiv
e m
embe
rs is
RP-
2000
Com
bine
d M
orta
lity
Tabl
e pr
ojec
ted
with
Sca
le B
B to
201
3 (m
ultip
lied
by 5
0% fo
r mal
es a
nd 3
0% fo
r fem
ales
). F
or h
ealth
y re
tired
mem
bers
and
ben
efic
iarie
s, th
e m
orta
lity
tabl
e us
ed is
the
RP-2
000
Com
bine
d M
orta
lity
Tabl
e pr
ojec
ted
with
Sca
le B
B to
201
3 (s
et b
ack
1 ye
ar fo
r fem
ales
). F
or d
isabl
ed m
embe
rs, t
he R
P-20
00 C
ombi
ned
Disa
bled
Mor
talit
y Ta
ble
proj
ecte
d w
ith S
cale
BB
to 2
013
(set
bac
k 4
year
s for
mal
es) i
s use
d fo
r the
per
iod
afte
r disa
bilit
y re
tirem
ent.
Ther
e is
som
e m
argi
n in
the
curre
nt m
orta
lity
tabl
es fo
r pos
sible
futu
re im
prov
emen
t in
mor
talit
y ra
tes a
nd th
at m
argi
n w
ill b
e re
view
ed a
gain
whe
n th
e ne
xt e
xper
ienc
e in
vesti
gatio
n is
cond
ucte
d. T
he
assu
med
rate
s of R
etire
men
t, W
ithdr
awal
and
Disa
bilit
y w
ere
upda
ted
to m
ore
accu
rate
ly re
flect
exp
erie
nce.
The
assu
med
inve
stmen
t ret
urn
was
cha
nged
from
7.5
0% to
6.2
5%. T
he p
rice
infla
tion
assu
mpt
ion
was
cha
nged
from
3.2
5% to
2.3
0%, w
hich
also
resu
lted
in a
0.9
5% d
ecre
ase
in th
e sa
lary
incr
ease
as
sum
ptio
n at
all
year
s of s
ervi
ce. T
he p
ayro
ll gr
owth
ass
umpt
ion
(app
licab
le fo
r the
am
ortiz
atio
n un
fund
ed a
ctua
rial a
ccru
ed li
abili
ties)
was
cha
nged
from
4.0
0% to
2.0
0%.
This
sche
dule
is p
rese
nted
to il
lustr
ate
the
requ
irem
ent t
o sh
ow in
form
atio
n fo
r 10
year
s. H
owev
er, u
ntil
a fu
ll 10
-yea
r tre
nd is
com
pile
d, th
e G
over
nmen
t will
pre
sent
info
rmat
ion
for t
hose
yea
rs fo
r w
hich
info
rmat
ion
is av
aila
ble.
REQ
UIR
ED S
UPP
LEM
ENTA
RY IN
FORM
ATI
ON
- CE
RS P
ENSI
ON
SCH
EDU
LE O
F TH
E G
OV
ERN
MEN
T'S
PEN
SIO
N C
ON
TRIB
UTI
ON
SLA
ST T
EN F
ISCA
L Y
EARS
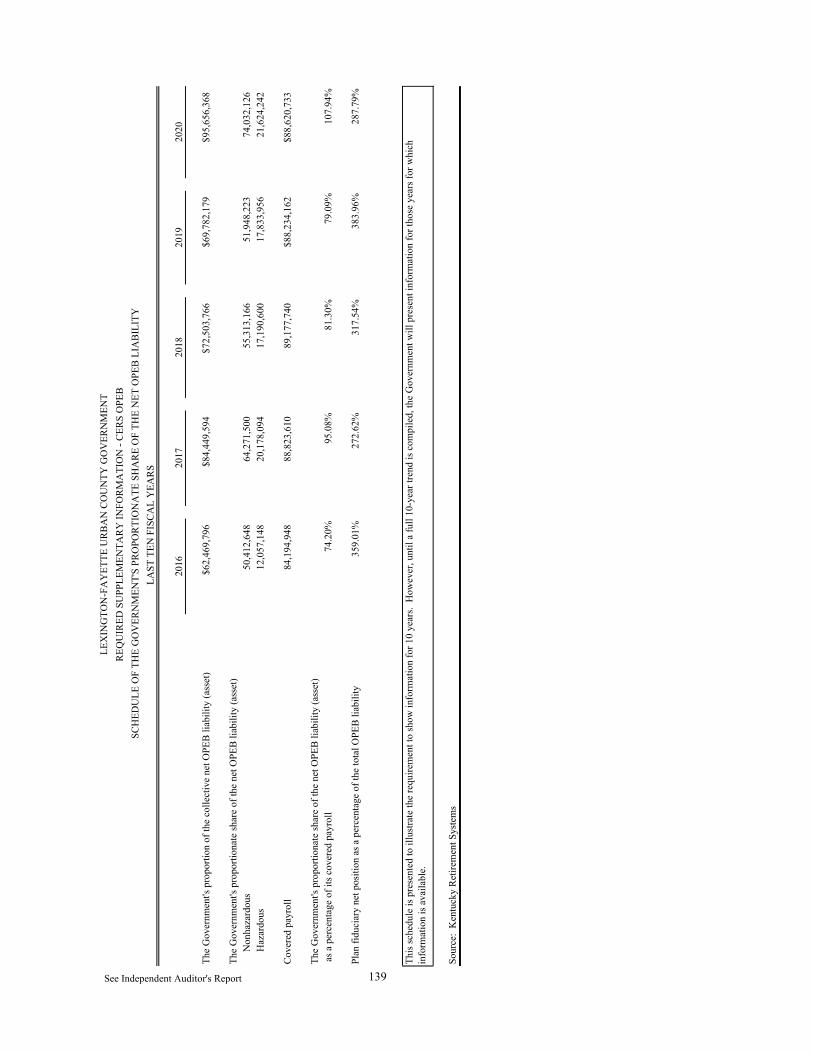
2016
2017
2018
2019
2020
The
Gov
ernm
ent's
pro
porti
on o
f the
col
lect
ive
net O
PEB
liabi
lity
(ass
et)
$62,
469,
796
$84,
449,
594
$72,
503,
766
$69,
782,
179
$95,
656,
368
The
Gov
ernm
ent's
pro
porti
onat
e sh
are
of th
e ne
t OPE
B lia
bilit
y (a
sset
)N
onha
zard
ous
50,4
12,6
4864
,271
,500
55,3
13,1
6651
,948
,223
74,0
32,1
26H
azar
dous
12,0
57,1
4820
,178
,094
17,1
90,6
0017
,833
,956
21,6
24,2
42
Cove
red
payr
oll
84,1
94,9
4888
,823
,610
89,1
77,7
40$8
8,23
4,16
2$8
8,62
0,73
3
The
Gov
ernm
ent's
pro
porti
onat
e sh
are
of th
e ne
t OPE
B lia
bilit
y (a
sset
) a
s a p
erce
ntag
e of
its c
over
ed p
ayro
ll74
.20%
95.0
8%81
.30%
79.0
9%10
7.94
%
Plan
fidu
ciar
y ne
t pos
ition
as a
per
cent
age
of th
e to
tal O
PEB
liabi
lity
359.
01%
272.
62%
317.
54%
383.
96%
287.
79%
Sour
ce:
Ken
tuck
y Re
tirem
ent S
yste
ms
This
sche
dule
is p
rese
nted
to il
lustr
ate
the
requ
irem
ent t
o sh
ow in
form
atio
n fo
r 10
year
s. H
owev
er, u
ntil
a fu
ll 10
-yea
r tre
nd is
com
pile
d, th
e G
over
nmen
t will
pre
sent
info
rmat
ion
for t
hose
yea
rs fo
r whi
ch
info
rmat
ion
is av
aila
ble.
See Independent Auditor's Report 139
LEX
ING
TON
-FA
YET
TE U
RBA
N C
OU
NTY
GO
VER
NM
ENT
REQ
UIR
ED S
UPP
LEM
ENTA
RY IN
FORM
ATI
ON
- CE
RS O
PEB
SCH
EDU
LE O
F TH
E G
OV
ERN
MEN
T'S
PRO
PORT
ION
ATE
SH
ARE
OF
THE
NET
OPE
B LI
ABI
LITY
LAST
TEN
FIS
CAL
YEA
RS
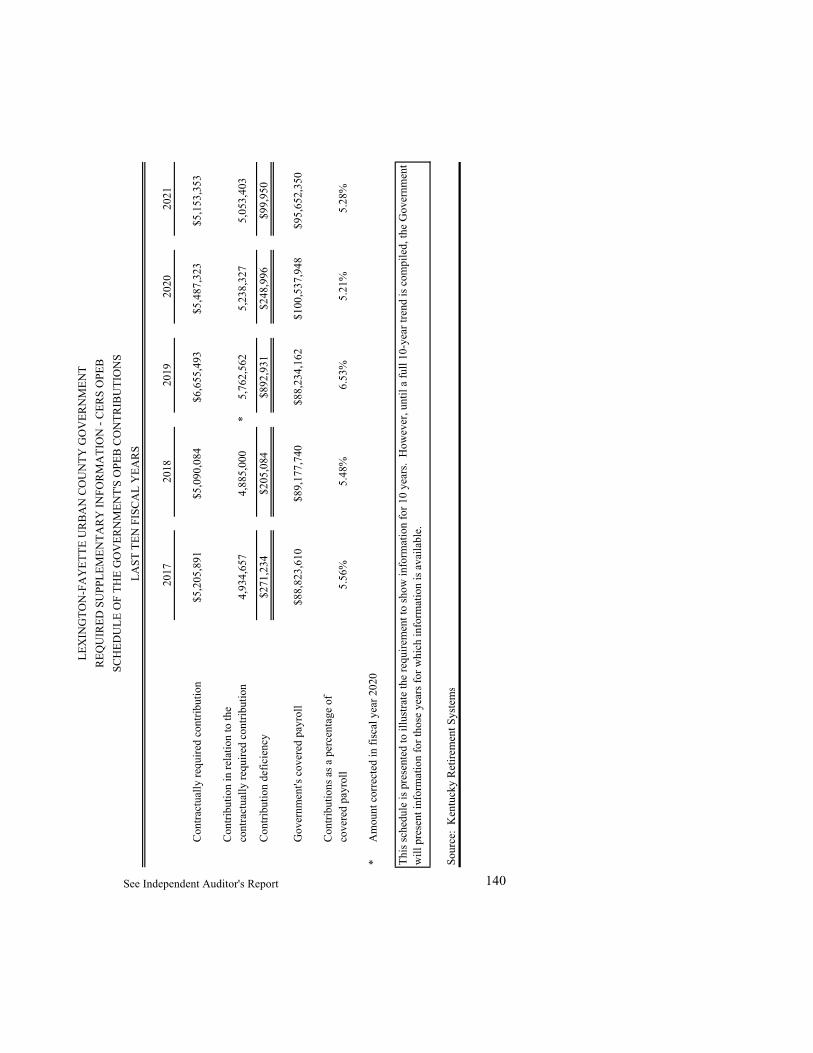
2017
2018
2019
2020
2021
Cont
ract
ually
requ
ired
cont
ribut
ion
$5,2
05,8
91$5
,090
,084
$6,6
55,4
93$5
,487
,323
$5,1
53,3
53
Cont
ribut
ion
in re
latio
n to
the
cont
ract
ually
requ
ired
cont
ribut
ion
4,93
4,65
74,
885,
000
*5,
762,
562
5,23
8,32
75,
053,
403
Cont
ribut
ion
defic
ienc
y$2
71,2
34$2
05,0
84$8
92,9
31$2
48,9
96$9
9,95
0
Gov
ernm
ent's
cov
ered
pay
roll
$88,
823,
610
$89,
177,
740
$88,
234,
162
$100
,537
,948
$95,
652,
350
Cont
ribut
ions
as a
per
cent
age
ofco
vere
d pa
yrol
l5.
56%
5.48
%6.
53%
5.21
%5.
28%
*A
mou
nt c
orre
cted
in fi
scal
yea
r 202
0
Sour
ce:
Ken
tuck
y Re
tirem
ent S
yste
ms
140
LEX
ING
TON
-FA
YET
TE U
RBA
N C
OU
NTY
GO
VER
NM
ENT
REQ
UIR
ED S
UPP
LEM
ENTA
RY IN
FORM
ATI
ON
- CE
RS O
PEB
SCH
EDU
LE O
F TH
E G
OV
ERN
MEN
T'S
OPE
B CO
NTR
IBU
TIO
NS
LAST
TEN
FIS
CAL
YEA
RS
This
sche
dule
is p
rese
nted
to il
lustr
ate
the
requ
irem
ent t
o sh
ow in
form
atio
n fo
r 10
year
s. H
owev
er, u
ntil
a fu
ll 10
-yea
r tre
nd is
com
pile
d, th
e G
over
nmen
t w
ill p
rese
nt in
form
atio
n fo
r tho
se y
ears
for w
hich
info
rmat
ion
is av
aila
ble.
See Independent Auditor's Report
141
NONMAJOR GOVERNMENTAL FUNDS
SPECIAL REVENUE FUNDS
The Special Revenue Funds are used to account for specific revenues that are legally restricted to expenditure for particular purposes. The County Aid Program Fund accounts for the allocation of county road funds from the Commonwealth of Kentucky as provided by HB 973 and adopted by the 1980 General Assembly based upon the motor fuels taxes collected. The Municipal Aid Program Fund accounts for the allocation from the Commonwealth of Kentucky as provided by KRS 174 for design, right-of-way acquisitions, utilities, construction, and other municipal road expenditures. The Industrial Revenue Bond Fund accounts for receipts and disbursements of IRB issuance fees. The Mineral Severance Fund and Coal Severance Fund account for receipts and disbursements of the Coal and Mineral Severance Tax received from the Commonwealth of Kentucky. The Police Confiscated Fund accounts for recoveries from federal criminal case settlements awarded to the LFUCG Division of Police. Expenditures are restricted to police law enforcement programs. The Police Confiscated State Fund accounts for recoveries from state criminal case settlements awarded to the Government’s Division of Police. Expenditures are restricted to police law enforcement programs. The Public Safety Fund accounts for revenues and disbursements of the House Bill 413 fees received from the Commonwealth of Kentucky.
CAPITAL PROJECTS FUNDS
Capital Projects Funds are used to account for the acquisition and construction of major capital facilities and equipment other than those financed by proprietary funds. The Lexington Cultural Center is a project to construct a performing arts and exhibit facility in downtown Lexington. The 2003 Bond Projects are for acquisition of vehicles, equipment, the next phase of replacement of the Government Center HVAC system, and fire trucks. The 2007, 2008, & 2009 Bond Projects are for park projects, computer equipment, and building renovations and improvements. The 2010 Bond Projects are to finance various projects for departments within the Government, including acquisition of equipment, infrastructure projects, and the Purchase of Development Rights program. The 2011 & 2012 Bond Projects are to finance the acquisition of various equipment for departments within the Government including but not limited to Computer Services, Public Safety, Parks and Recreation, Solid Waste, Purchase of Development Rights, Recycling Center, and Public Works utility design. The 2013 Bond Projects are to finance the acquisition of vehicles and equipment, various parks projects, and complete renovation of the Emergency Operations Center.

142
The 2014 Bond Projects will fund projects for Purchase of Development Rights, conservation easements, Public Safety radios, renovation and construction of Parks, and funding for the Arena, Arts, and Entertainment District. The 2015 Bond Projects will fund projects for Purchase of Development Rights, conservation easements, Public Safety, traffic signal upgrades, renovation and construction of Parks, Facilities and Fleet Management vehicle replacement and repairs, and a new senior citizens center. The 2016 Bond Projects will fund projects and infrastructure improvements for departments within the Government including but not limited to Chief Information Officer, General Services, Public Safety, and Planning, Preservation, & Development. Additional projects include a greenway that will link two regional trail systems, the Legacy Trail and Town Branch Trail; streetscape improvements on the Versailles Road Corridor; and paving. A taxable bond portion will finance the restoration and rehabilitation of the historic Fayette County Courthouse in order to preserve the history and architecture of Lexington. The 2017 Bond Projects will fund projects including, but not limited to, (i) the construction, installation and equipping of a new fire station, software system upgrades, safety operations and other safety related projects, road resurfacing, road maintenance, road upgrades, streetscapes and sidewalk improvements, renovations, repairs and upgrades related to public buildings, renovations, repairs and upgrades related to park projects, and (ii) providing funding for a program to preserve and manage agricultural, rural and natural lands, including the purchase of conservation easements or development rights. The 2018 Bond Projects will fund projects for Public Safety, software upgrades, infrastructure improvements, parks projects, and building improvements. In addition it will provide funding for a program to preserve and manage agricultural, rural and natural lands, including the purchase of conservation easements or development rights. The 2019 Bond Projects will fund projects for Public Safety, software upgrades, infrastructure improvements, parks projects, and building improvements, fleet replacement, and the Lexington Convention Center renovations. The 2020 Bond Projects will fund projects for Public Safety, voting machine replacement, road and paving maintenance, and fleet replacement. In addition it will provide funding for a program to preserve and manage agricultural, rural and natural lands, including the purchase of conservation easements or development rights. The 2021 Bond Projects will fund projects for road and paving maintenance, traffic improvements, software, public safety vehicle replacement, and building improvements. The Public Library Corporation is for the acquisition, construction, equipping, and financing of public projects to be used for public library purposes. The Roads, Parks, Open Space, Storm Water Exactions are for improvements necessary to provide roads, parks, open space, and storm water management in the Expansion Area Master Plan funded by developer and property owner exaction fees.
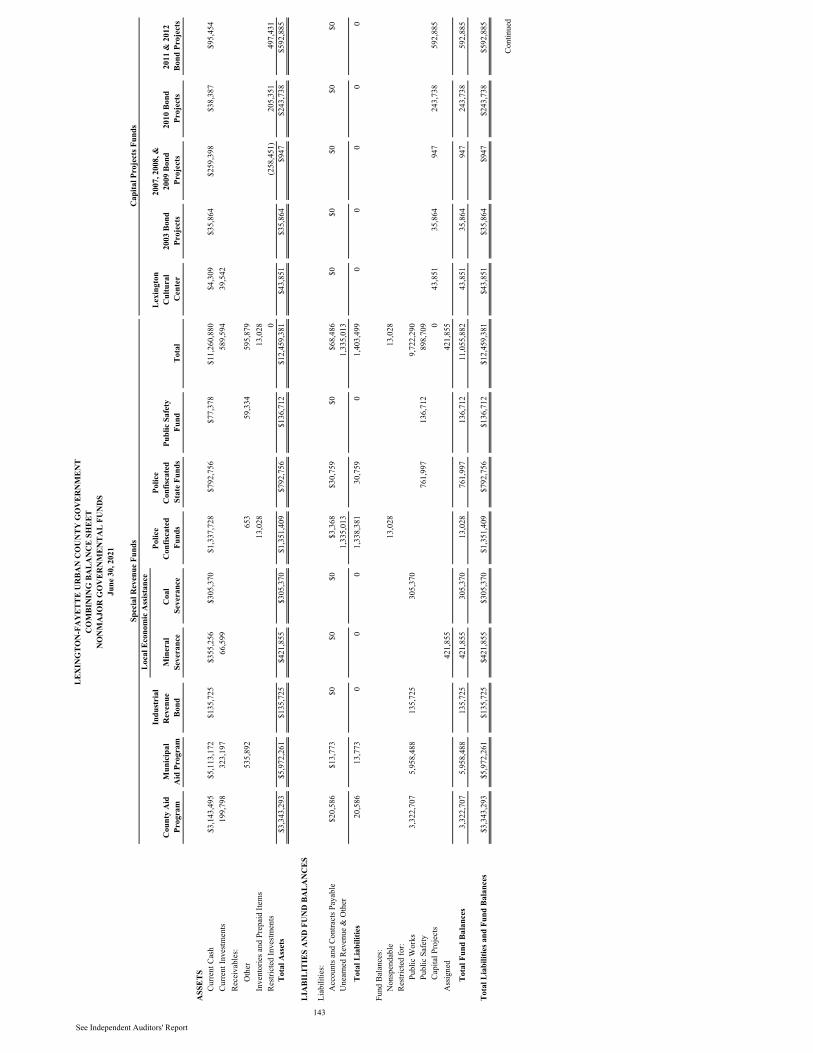
C
ount
y A
id
Prog
ram
M
unic
ipal
A
id P
rogr
am
Indu
stri
al
Rev
enue
Bo
nd
Min
eral
Se
vera
nce
Coa
l Se
vera
nce
Polic
e C
onfis
cate
d Fu
nds
Polic
e C
onfis
cate
d St
ate
Fund
sPu
blic
Saf
ety
Fund
Tota
l
Lexi
ngto
n C
ultu
ral
Cen
ter
200
3 Bo
nd
Proj
ects
2007
, 200
8, &
20
09 B
ond
Proj
ects
2010
Bon
d Pr
ojec
ts20
11 &
201
2 Bo
nd P
roje
cts
ASS
ETS
Curre
nt C
ash
$3,1
43,4
95$5
,113
,172
$135
,725
$355
,256
$305
,370
$1,3
37,7
28$7
92,7
56$7
7,37
8$1
1,26
0,88
0$4
,309
$35,
864
$259
,398
$38,
387
$95,
454
Curre
nt In
vestm
ents
199,
798
323,
197
66
,599
58
9,59
439
,542
Rece
ivab
les:
Oth
er
535,
892
65
3
59,3
3459
5,87
9
In
vent
orie
s and
Pre
paid
Item
s13
,028
13,0
28Re
stric
ted
Inve
stmen
ts0
(2
58,4
51)
205,
351
497,
431
Tota
l Ass
ets
$3,3
43,2
93$5
,972
,261
$135
,725
$421
,855
$305
,370
$1,3
51,4
09$7
92,7
56$1
36,7
12$1
2,45
9,38
1$4
3,85
1$3
5,86
4$9
47$2
43,7
38$5
92,8
85
LIA
BILI
TIES
AN
D F
UN
D B
ALA
NC
ES
143
Liab
ilitie
s:A
ccou
nts a
nd C
ontra
cts P
ayab
le$2
0,58
6$1
3,77
3$0
$0$0
$3,3
68$3
0,75
9$0
$68,
486
$0$0
$0$0
$0U
near
ned
Reve
nue
& O
ther
1,33
5,01
31,
335,
013
Tota
l Lia
bilit
ies
20,5
8613
,773
00
01,
338,
381
30,7
590
1,40
3,49
90
00
00
Fund
Bal
ance
s:N
onsp
enda
ble
13,0
28
13,0
28Re
stric
ted
for:
3,32
2,70
75,
958,
488
135,
725
305,
370
9,72
2,29
0
761,
997
136,
712
898,
709 0
43,8
5135
,864
947
243,
738
592,
885
Ass
igne
d42
1,85
542
1,85
5
Tota
l Fun
d Ba
lanc
es3,
322,
707
5,95
8,48
813
5,72
542
1,85
530
5,37
013
,028
761,
997
136,
712
11,0
55,8
8243
,851
35,8
6494
724
3,73
859
2,88
5
Tota
l Lia
bilit
ies a
nd F
und
Bala
nces
$3,3
43,2
93$5
,972
,261
$135
,725
$421
,855
$305
,370
$1,3
51,4
09$7
92,7
56$1
36,7
12$1
2,45
9,38
1$4
3,85
1$3
5,86
4$9
47$2
43,7
38$5
92,8
85
Cont
inue
d
Cap
ital P
roje
cts
Cap
ital P
roje
cts F
unds
See Independent Auditors' Report
Spec
ial R
even
ue F
unds
LEX
ING
TON
-FA
YET
TE U
RBA
N C
OU
NTY
GO
VER
NM
ENT
CO
MBI
NIN
G B
ALA
NC
E SH
EET
NO
NM
AJO
R G
OV
ERN
MEN
TAL
FUN
DS
June
30,
202
1
Loca
l Eco
nom
ic A
ssist
ance
Pub
lic W
orks
Pub
lic S
afet
y
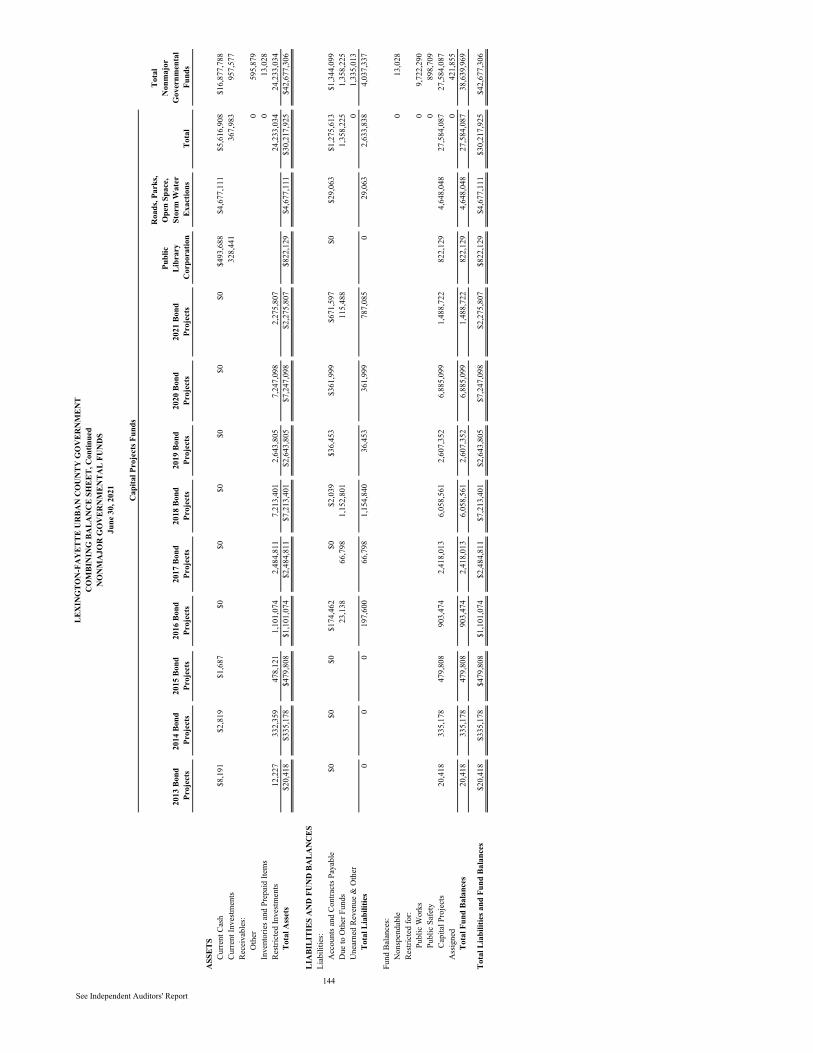
20
13 B
ond
Proj
ects
2014
Bon
d Pr
ojec
ts 2
015
Bond
Pr
ojec
ts
201
6 Bo
nd
Proj
ects
2
017
Bond
Pr
ojec
ts
201
8 Bo
nd
Proj
ects
2
019
Bond
Pr
ojec
ts
202
0 Bo
nd
Proj
ects
2
021
Bond
Pr
ojec
ts
Publ
ic
Libr
ary
Cor
pora
tion
Roa
ds, P
arks
, O
pen
Spac
e,
Stor
m W
ater
Ex
actio
nsTo
tal
Tota
l N
onm
ajor
G
over
nmen
tal
Fund
s
ASS
ETS
Curre
nt C
ash
$8,1
91$2
,819
$1,6
87$0
$0$0
$0$0
$0$4
93,6
88$4
,677
,111
$5,6
16,9
08$1
6,87
7,78
8Cu
rrent
Inve
stmen
ts32
8,44
1
367,
983
957,
577
Rece
ivab
les:
Oth
er0
595,
879
Inve
ntor
ies a
nd P
repa
id It
ems
0
13,0
28Re
stric
ted
Inve
stmen
ts12
,227
332,
359
478,
121
1,10
1,07
42,
484,
811
7,21
3,40
12,
643,
805
7,24
7,09
82,
275,
807
24,2
33,0
3424
,233
,034
Tota
l Ass
ets
$20,
418
$335
,178
$479
,808
$1,1
01,0
74$2
,484
,811
$7,2
13,4
01$2
,643
,805
$7,2
47,0
98$2
,275
,807
$822
,129
$4,6
77,1
11$3
0,21
7,92
5$4
2,67
7,30
6
LIA
BILI
TIES
AN
D F
UN
D B
ALA
NC
ESLi
abili
ties:
Acc
ount
s and
Con
tract
s Pay
able
$0$0
$0$1
74,4
62$0
$2,0
39$3
6,45
3$3
61,9
99$6
71,5
97$0
$29,
063
$1,2
75,6
13$1
,344
,099
Due
to O
ther
Fun
ds23
,138
66,7
98
1,
152,
801
11
5,48
8
1,
358,
225
1,35
8,22
5U
near
ned
Reve
nue
& O
ther
01,
335,
013
Tota
l Lia
bilit
ies
00
019
7,60
066
,798
1,15
4,84
036
,453
361,
999
787,
085
029
,063
2,63
3,83
84,
037,
337
Fund
Bal
ance
s:N
onsp
enda
ble
0
13,0
28Re
stric
ted
for:
09,
722,
290
089
8,70
920
,418
335,
178
479,
808
903,
474
2,41
8,01
36,
058,
561
2,60
7,35
26,
885,
099
1,48
8,72
282
2,12
94,
648,
048
27,5
84,0
8727
,584
,087
Ass
igne
d0
421,
855
Tota
l Fun
d Ba
lanc
e s20
,418
335,
178
479,
808
903,
474
2,41
8,01
36,
058,
561
2,60
7,35
26,
885,
099
1,48
8,72
282
2,12
94,
648,
048
27,5
84,0
8738
,639
,969
Tota
l Lia
bilit
ies a
nd F
und
Bala
nces
$20,
418
$335
,178
$479
,808
$1,1
01,0
74$2
,484
,811
$7,2
13,4
01$2
,643
,805
$7,2
47,0
98$2
,275
,807
$822
,129
$4,6
77,1
11$3
0,21
7,92
5$4
2,67
7,30
6
LEX
ING
TON
-FA
YET
TE U
RBA
N C
OU
NTY
GO
VER
NM
ENT
CO
MBI
NIN
G B
ALA
NC
E SH
EET,
Con
tinue
dN
ON
MA
JOR
GO
VER
NM
ENTA
L FU
ND
SJu
ne 3
0, 2
021
See Independent Auditors' Report
Cap
ital P
roje
cts F
unds
144
Cap
ital P
roje
cts
Pub
lic W
orks
Pub
lic S
afet
y
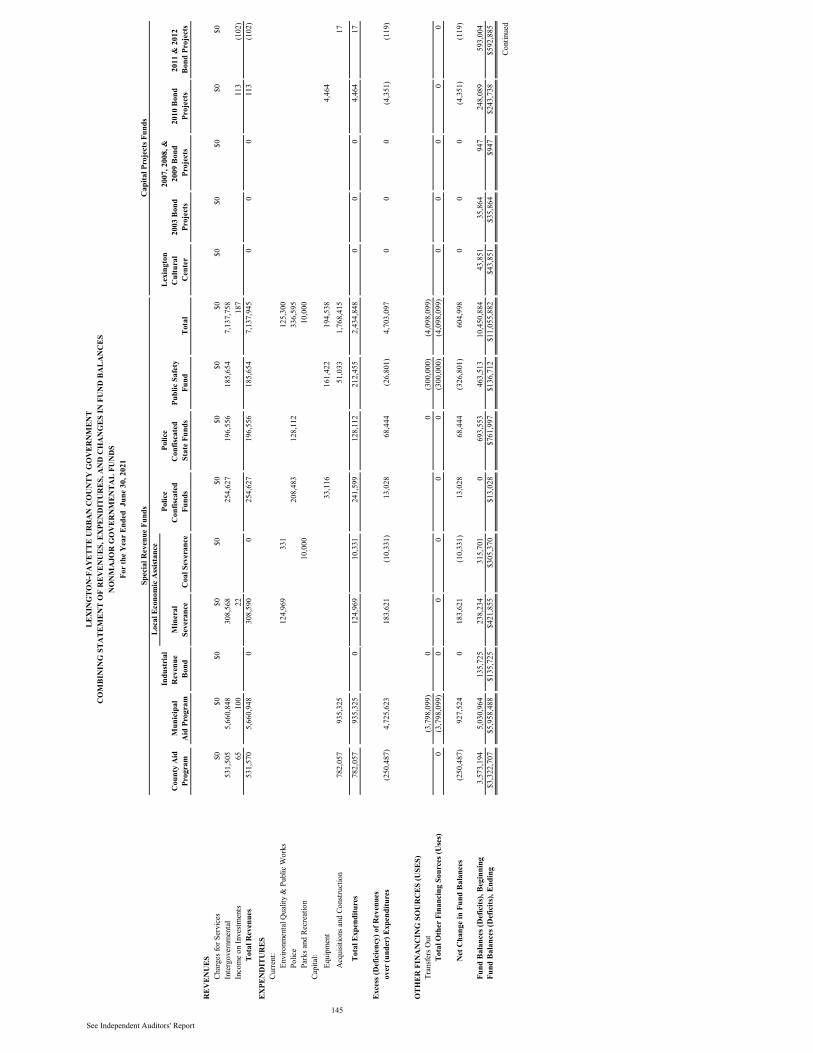
Cou
nty
Aid
Pr
ogra
m
Mun
icip
al
Aid
Pro
gram
Indu
stri
al
Rev
enue
Bo
nd
Min
eral
Se
vera
nce
Coa
l Sev
eran
ce
Pol
ice
Con
fisca
ted
Fund
s
Pol
ice
Con
fisca
ted
Stat
e Fu
nds
Pub
lic S
afet
y Fu
nd
Tota
l
Lex
ingt
on
Cul
tura
l C
ente
r 2
003
Bond
Pr
ojec
ts
2007
, 200
8, &
20
09 B
ond
Proj
ects
201
0 Bo
nd
Proj
ects
2011
& 2
012
Bond
Pro
ject
s
REV
ENU
ESCh
arge
s for
Ser
vice
s$0
$0$0
$0$0
$0$0
$0$0
$0$0
$0$0
$0In
terg
over
nmen
tal
531,
505
5,66
0,84
8
30
8,56
8
25
4,62
719
6,55
618
5,65
47,
137,
758
Inco
me
on In
vest
men
ts65
100
22
187
11
3(1
02)
Tota
l Rev
enue
s53
1,57
05,
660,
948
030
8,59
00
254,
627
196,
556
185,
654
7,13
7,94
50
00
113
(102
)EX
PEN
DIT
UR
ESCu
rren
t:En
viro
nmen
tal Q
ualit
y &
Pub
lic W
orks
12
4,96
933
1
125,
300
Polic
e
20
8,48
312
8,11
2
336,
595
Park
s and
Rec
reat
ion
10,0
00
10
,000
Ca
pita
l:Eq
uipm
ent
33,1
16
16
1,42
219
4,53
8
4,46
4
Acq
uisit
ions
and
Con
stru
ctio
n78
2,05
793
5,32
5
51,0
331,
768,
415
17
Tota
l Exp
endi
ture
s78
2,05
793
5,32
50
124,
969
10,3
3124
1,59
912
8,11
221
2,45
52,
434,
848
00
04,
464
17
Exce
ss (D
efic
ienc
y) o
f Rev
enue
sov
er (u
nder
) Exp
endi
ture
s(2
50,4
87)
4,72
5,62
3
18
3,62
1(1
0,33
1)13
,028
68,4
44(2
6,80
1)4,
703,
097
00
0(4
,351
)(1
19)
OTH
ER F
INA
NC
ING
SO
UR
CES
(USE
S)Tr
ansf
ers O
ut
(3
,798
,099
)0
0
(300
,000
)(4
,098
,099
)
To
tal O
ther
Fin
anci
ng S
ourc
es (U
ses)
0(3
,798
,099
)0
00
00
(300
,000
)(4
,098
,099
)0
00
00
Net
Cha
nge
in F
und
Bala
nces
(250
,487
)92
7,52
40
183,
621
(10,
331)
13,0
2868
,444
(326
,801
)60
4,99
80
00
(4,3
51)
(119
)
Fund
Bal
ance
s (D
efic
its),
Begi
nnin
g3,
573,
194
5,03
0,96
413
5,72
523
8,23
431
5,70
10
693,
553
463,
513
10,4
50,8
8443
,851
35,8
6494
724
8,08
959
3,00
4Fu
nd B
alan
ces (
Def
icits
), En
ding
$3,3
22,7
07$5
,958
,488
$135
,725
$421
,855
$305
,370
$13,
028
$761
,997
$136
,712
$11,
055,
882
$43,
851
$35,
864
$947
$243
,738
$592
,885
Cont
inue
d
See Independent Auditors' Report
Loc
al E
cono
mic
Ass
istan
ce
145
Spec
ial R
even
ue F
unds
For t
he Y
ear E
nded
Jun
e 30
, 202
1
LEX
ING
TON
-FA
YET
TE U
RBA
N C
OU
NTY
GO
VER
NM
ENT
CO
MBI
NIN
G S
TATE
MEN
T O
F R
EVEN
UES
, EX
PEN
DIT
UR
ES, A
ND
CH
AN
GES
IN F
UN
D B
ALA
NC
ESN
ON
MA
JOR
GO
VER
NM
ENTA
L FU
ND
S
Cap
ital P
roje
cts F
unds
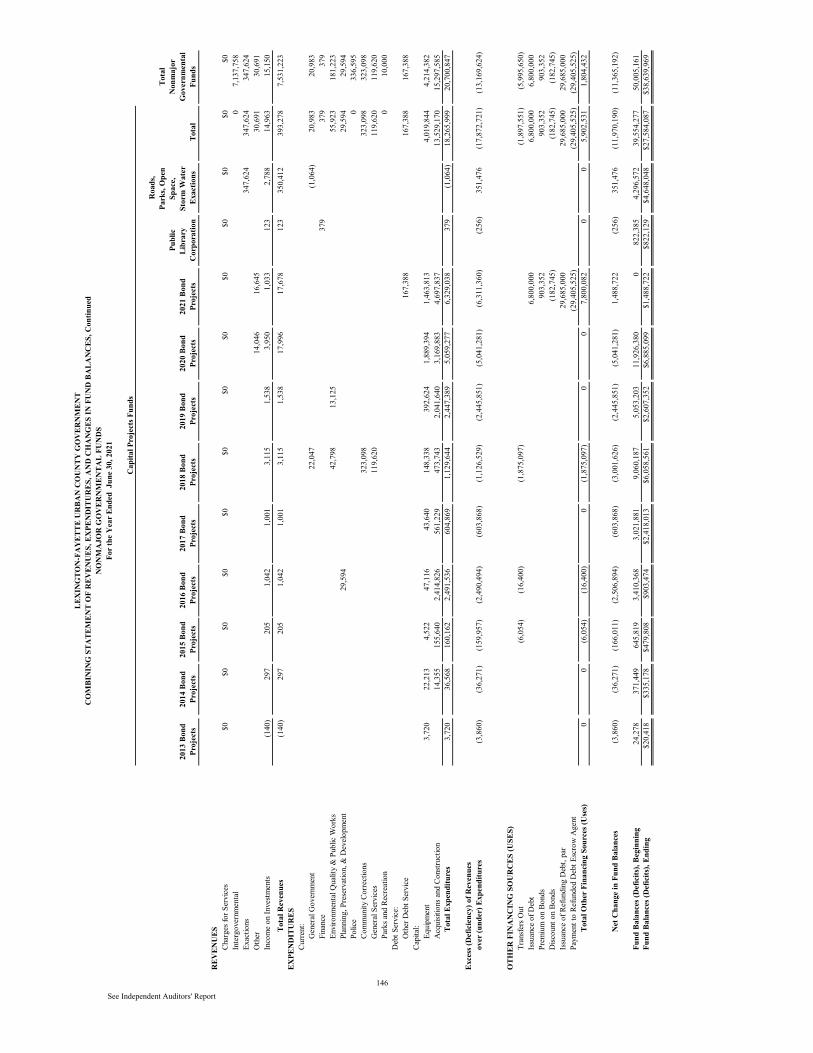
201
3 Bo
nd
Proj
ects
2
014
Bond
Pr
ojec
ts
201
5 Bo
nd
Proj
ects
2
016
Bond
Pr
ojec
ts
201
7 Bo
nd
Proj
ects
2
018
Bond
Pr
ojec
ts
201
9 Bo
nd
Proj
ects
2
020
Bond
Pr
ojec
ts
202
1 Bo
nd
Proj
ects
Pub
lic
Libr
ary
Cor
pora
tion
Roa
ds,
Park
s, O
pen
Spac
e,
Stor
m W
ater
Ex
actio
ns
Tot
al
Tot
al
Non
maj
orG
over
nmen
tal
Fund
s
REV
ENU
ESCh
arge
s for
Ser
vice
s$0
$0$0
$0$0
$0$0
$0$0
$0$0
$0$0
Inte
rgov
ernm
enta
l
0
7,13
7,75
8Ex
actio
ns
34
7,62
434
7,62
434
7,62
4O
ther
14
,046
16,6
45
30,6
9130
,691
Inco
me
on In
vest
men
ts(1
40)
297
205
1,04
21,
001
3,11
51,
538
3,95
01,
033
123
2,78
814
,963
15,1
50To
tal R
even
ues
(140
)29
720
51,
042
1,00
13,
115
1,53
817
,996
17,6
7812
335
0,41
239
3,27
87,
531,
223
EXPE
ND
ITU
RES
Curr
ent:
Gen
eral
Gov
ernm
ent
22,0
47
(1,0
64)
20,9
8320
,983
Fina
nce
37
9
379
379
Envi
ronm
enta
l Qua
lity
& P
ublic
Wor
ks
42
,798
13
,125
55
,923
181,
223
Plan
ning
, Pre
serv
atio
n, &
Dev
elop
men
t
29,5
94
29,5
9429
,594
Polic
e
033
6,59
5Co
mm
unity
Cor
rect
ions
323,
098
32
3,09
832
3,09
8G
ener
al S
ervi
ces
119,
620
11
9,62
011
9,62
0Pa
rks a
nd R
ecre
atio
n
010
,000
Deb
t Ser
vice
:O
ther
Deb
t Ser
vice
16
7,38
8
16
7,38
816
7,38
8Ca
pita
l:Eq
uipm
ent
3,72
022
,213
4,52
247
,116
43,6
4014
8,33
839
2,62
41,
889,
394
1,46
3,81
3
4,
019,
844
4,21
4,38
2A
cqui
sitio
ns a
nd C
onst
ruct
ion
14,3
5515
5,64
0
2,
414,
826
561,
229
473,
743
2,04
1,64
03,
169,
883
4,69
7,83
7
13
,529
,170
15,2
97,5
85To
tal E
xpen
ditu
res
3,72
036
,568
160,
162
2,49
1,53
660
4,86
91,
129,
644
2,44
7,38
95,
059,
277
6,32
9,03
837
9(1
,064
)18
,265
,999
20,7
00,8
47
Exce
ss (D
efic
ienc
y) o
f Rev
enue
sov
er (u
nder
) Exp
endi
ture
s(3
,860
)(3
6,27
1)(1
59,9
57)
(2,4
90,4
94)
(603
,868
)(1
,126
,529
)(2
,445
,851
)(5
,041
,281
)(6
,311
,360
)(2
56)
351,
476
(17,
872,
721)
(13,
169,
624)
OTH
ER F
INA
NC
ING
SO
UR
CES
(USE
S)Tr
ansf
ers O
ut
(6,0
54)
(1
6,40
0)
(1
,875
,097
)
(1
,897
,551
)(5
,995
,650
)Is
suan
ce o
f Deb
t
6,80
0,00
0
6,
800,
000
6,80
0,00
0Pr
emiu
m o
n Bo
nds
90
3,35
2
90
3,35
290
3,35
2D
iscou
nt o
n Bo
nds
(1
82,7
45)
(182
,745
)(1
82,7
45)
Issu
ance
of R
efun
ding
Deb
t, pa
r
29
,685
,000
29,6
85,0
0029
,685
,000
Paym
ent t
o Re
fund
ed D
ebt E
scro
w A
gent
(29,
405,
525)
(29,
405,
525)
(29,
405,
525)
Tota
l Oth
er F
inan
cing
Sou
rces
(Use
s)0
0(6
,054
)(1
6,40
0)0
(1,8
75,0
97)
00
7,80
0,08
20
05,
902,
531
1,80
4,43
2
Net
Cha
nge
in F
und
Bala
nces
(3,8
60)
(36,
271)
(166
,011
)(2
,506
,894
)(6
03,8
68)
(3,0
01,6
26)
(2,4
45,8
51)
(5,0
41,2
81)
1,48
8,72
2(2
56)
351,
476
(11,
970,
190)
(11,
365,
192)
Fund
Bal
ance
s (D
efic
its),
Begi
nnin
g24
,278
371,
449
645,
819
3,41
0,36
83,
021,
881
9,06
0,18
75,
053,
203
11,9
26,3
800
822,
385
4,29
6,57
239
,554
,277
50,0
05,1
61Fu
nd B
alan
ces (
Def
icits
), En
ding
$20,
418
$335
,178
$479
,808
$903
,474
$2,4
18,0
13$6
,058
,561
$2,6
07,3
52$6
,885
,099
$1,4
88,7
22$8
22,1
29$4
,648
,048
$27,
584,
087
$38,
639,
969
See Independent Auditors' Report
Cap
ital P
roje
cts F
unds
146
LEX
ING
TON
-FA
YET
TE U
RBA
N C
OU
NTY
GO
VER
NM
ENT
CO
MBI
NIN
G S
TATE
MEN
T O
F R
EVEN
UES
, EX
PEN
DIT
UR
ES, A
ND
CH
AN
GES
IN F
UN
D B
ALA
NC
ES, C
ontin
ued
NO
NM
AJO
R G
OV
ERN
MEN
TAL
FUN
DS
For t
he Y
ear E
nded
Jun
e 30
, 202
1
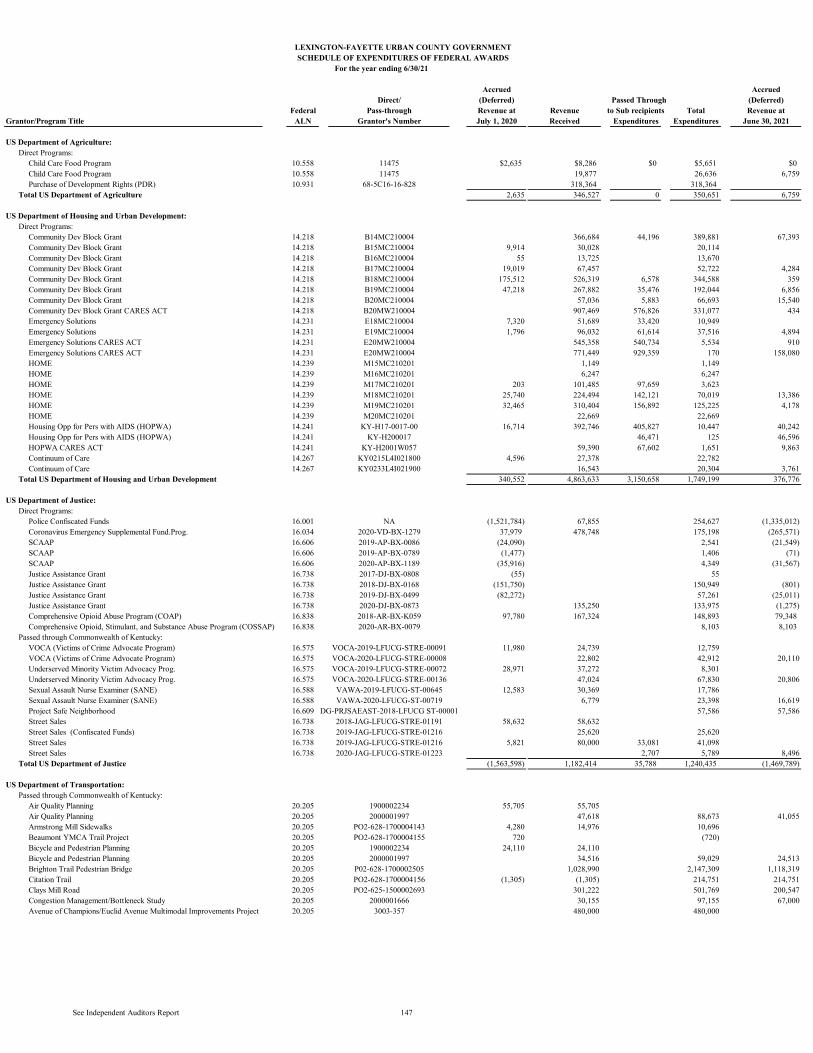
LEXINGTON-FAYETTE URBAN COUNTY GOVERNMENTSCHEDULE OF EXPENDITURES OF FEDERAL AWARDS
For the year ending 6/30/21
Accrued AccruedDirect/ (Deferred) Passed Through (Deferred)
Federal Pass-through Revenue at Revenue to Sub recipients Total Revenue atGrantor/Program Title ALN Grantor's Number July 1, 2020 Received Expenditures Expenditures June 30, 2021
US Department of Agriculture:Direct Programs:
Child Care Food Program 10.558 11475 $2,635 $8,286 $0 $5,651 $0Child Care Food Program 10.558 11475 19,877 26,636 6,759Purchase of Development Rights (PDR) 10.931 68-5C16-16-828 318,364 318,364
Total US Department of Agriculture 2,635 346,527 0 350,651 6,759
US Department of Housing and Urban Development:Direct Programs:
Community Dev Block Grant 14.218 B14MC210004 366,684 44,196 389,881 67,393Community Dev Block Grant 14.218 B15MC210004 9,914 30,028 20,114Community Dev Block Grant 14.218 B16MC210004 55 13,725 13,670Community Dev Block Grant 14.218 B17MC210004 19,019 67,457 52,722 4,284Community Dev Block Grant 14.218 B18MC210004 175,512 526,319 6,578 344,588 359Community Dev Block Grant 14.218 B19MC210004 47,218 267,882 35,476 192,044 6,856Community Dev Block Grant 14.218 B20MC210004 57,036 5,883 66,693 15,540Community Dev Block Grant CARES ACT 14.218 B20MW210004 907,469 576,826 331,077 434Emergency Solutions 14.231 E18MC210004 7,320 51,689 33,420 10,949Emergency Solutions 14.231 E19MC210004 1,796 96,032 61,614 37,516 4,894Emergency Solutions CARES ACT 14.231 E20MW210004 545,358 540,734 5,534 910Emergency Solutions CARES ACT 14.231 E20MW210004 771,449 929,359 170 158,080HOME 14.239 M15MC210201 1,149 1,149HOME 14.239 M16MC210201 6,247 6,247HOME 14.239 M17MC210201 203 101,485 97,659 3,623HOME 14.239 M18MC210201 25,740 224,494 142,121 70,019 13,386HOME 14.239 M19MC210201 32,465 310,404 156,892 125,225 4,178HOME 14.239 M20MC210201 22,669 22,669Housing Opp for Pers with AIDS (HOPWA) 14.241 KY-H17-0017-00 16,714 392,746 405,827 10,447 40,242Housing Opp for Pers with AIDS (HOPWA) 14.241 KY-H200017 46,471 125 46,596HOPWA CARES ACT 14.241 KY-H2001W057 59,390 67,602 1,651 9,863Continuum of Care 14.267 KY0215L4I021800 4,596 27,378 22,782Continuum of Care 14.267 KY0233L4I021900 16,543 20,304 3,761
Total US Department of Housing and Urban Development 340,552 4,863,633 3,150,658 1,749,199 376,776
US Department of Justice:Direct Programs:
Police Confiscated Funds 16.001 NA (1,521,784) 67,855 254,627 (1,335,012)Coronavirus Emergency Supplemental Fund.Prog. 16.034 2020-VD-BX-1279 37,979 478,748 175,198 (265,571)SCAAP 16.606 2019-AP-BX-0086 (24,090) 2,541 (21,549)SCAAP 16.606 2019-AP-BX-0789 (1,477) 1,406 (71)SCAAP 16.606 2020-AP-BX-1189 (35,916) 4,349 (31,567)Justice Assistance Grant 16.738 2017-DJ-BX-0808 (55) 55Justice Assistance Grant 16.738 2018-DJ-BX-0168 (151,750) 150,949 (801)Justice Assistance Grant 16.738 2019-DJ-BX-0499 (82,272) 57,261 (25,011)Justice Assistance Grant 16.738 2020-DJ-BX-0873 135,250 133,975 (1,275)Comprehensive Opioid Abuse Program (COAP) 16.838 2018-AR-BX-K059 97,780 167,324 148,893 79,348Comprehensive Opioid, Stimulant, and Substance Abuse Program (COSSAP) 16.838 2020-AR-BX-0079 8,103 8,103
Passed through Commonwealth of Kentucky:VOCA (Victims of Crime Advocate Program) 16.575 VOCA-2019-LFUCG-STRE-00091 11,980 24,739 12,759VOCA (Victims of Crime Advocate Program) 16.575 VOCA-2020-LFUCG-STRE-00008 22,802 42,912 20,110Underserved Minority Victim Advocacy Prog. 16.575 VOCA-2019-LFUCG-STRE-00072 28,971 37,272 8,301Underserved Minority Victim Advocacy Prog. 16.575 VOCA-2020-LFUCG-STRE-00136 47,024 67,830 20,806Sexual Assault Nurse Examiner (SANE) 16.588 VAWA-2019-LFUCG-ST-00645 12,583 30,369 17,786Sexual Assault Nurse Examiner (SANE) 16.588 VAWA-2020-LFUCG-ST-00719 6,779 23,398 16,619Project Safe Neighborhood 16.609 DG-PRJSAEAST-2018-LFUCG ST-00001 57,586 57,586Street Sales 16.738 2018-JAG-LFUCG-STRE-01191 58,632 58,632Street Sales (Confiscated Funds) 16.738 2019-JAG-LFUCG-STRE-01216 25,620 25,620Street Sales 16.738 2019-JAG-LFUCG-STRE-01216 5,821 80,000 33,081 41,098Street Sales 16.738 2020-JAG-LFUCG-STRE-01223 2,707 5,789 8,496
Total US Department of Justice (1,563,598) 1,182,414 35,788 1,240,435 (1,469,789)
US Department of Transportation: Passed through Commonwealth of Kentucky:
Air Quality Planning 20.205 1900002234 55,705 55,705Air Quality Planning 20.205 2000001997 47,618 88,673 41,055Armstrong Mill Sidewalks 20.205 PO2-628-1700004143 4,280 14,976 10,696Beaumont YMCA Trail Project 20.205 PO2-628-1700004155 720 (720)Bicycle and Pedestrian Planning 20.205 1900002234 24,110 24,110Bicycle and Pedestrian Planning 20.205 2000001997 34,516 59,029 24,513Brighton Trail Pedestrian Bridge 20.205 P02-628-1700002505 1,028,990 2,147,309 1,118,319Citation Trail 20.205 PO2-628-1700004156 (1,305) (1,305) 214,751 214,751Clays Mill Road 20.205 PO2-625-1500002693 301,222 501,769 200,547Congestion Management/Bottleneck Study 20.205 2000001666 30,155 97,155 67,000Avenue of Champions/Euclid Avenue Multimodal Improvements Project 20.205 3003-357 480,000 480,000
See Independent Auditors Report 147
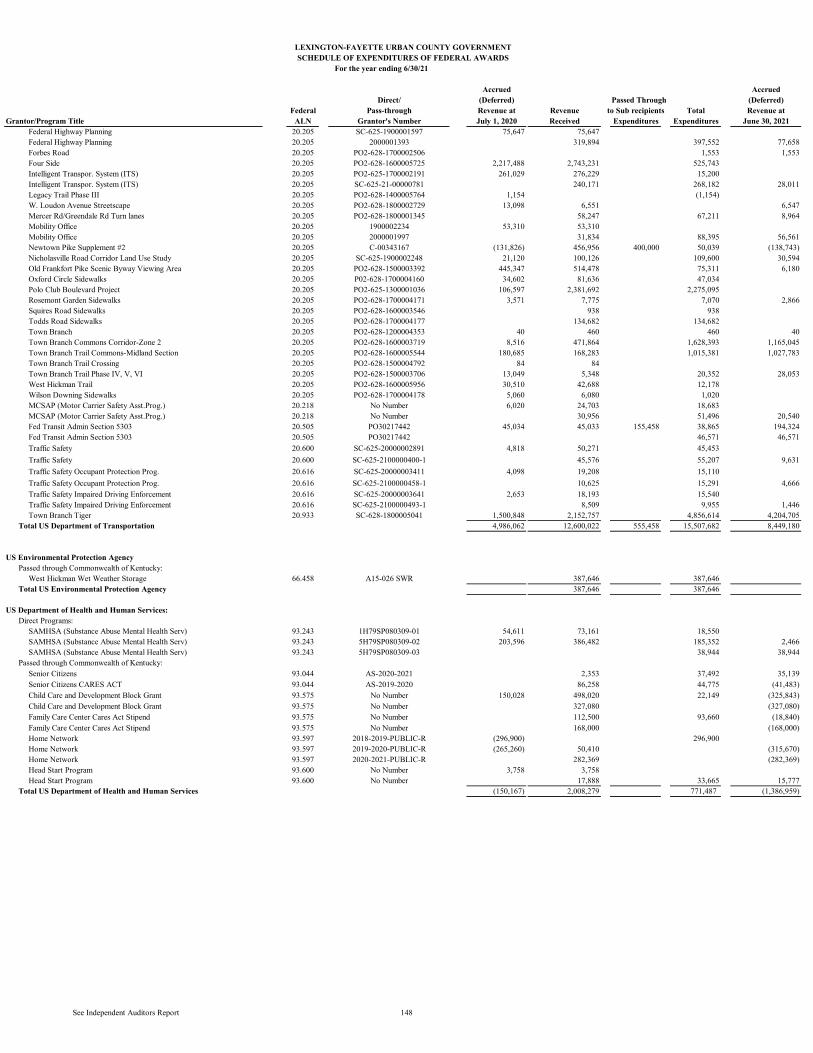
LEXINGTON-FAYETTE URBAN COUNTY GOVERNMENTSCHEDULE OF EXPENDITURES OF FEDERAL AWARDS
For the year ending 6/30/21
Accrued AccruedDirect/ (Deferred) Passed Through (Deferred)
Federal Pass-through Revenue at Revenue to Sub recipients Total Revenue atGrantor/Program Title ALN Grantor's Number July 1, 2020 Received Expenditures Expenditures June 30, 2021
Federal Highway Planning 20.205 SC-625-1900001597 75,647 75,647Federal Highway Planning 20.205 2000001393 319,894 397,552 77,658Forbes Road 20.205 PO2-628-1700002506 1,553 1,553Four Side 20.205 PO2-628-1600005725 2,217,488 2,743,231 525,743Intelligent Transpor. System (ITS) 20.205 PO2-625-1700002191 261,029 276,229 15,200Intelligent Transpor. System (ITS) 20.205 SC-625-21-00000781 240,171 268,182 28,011Legacy Trail Phase III 20.205 PO2-628-1400005764 1,154 (1,154)W. Loudon Avenue Streetscape 20.205 PO2-628-1800002729 13,098 6,551 6,547Mercer Rd/Greendale Rd Turn lanes 20.205 PO2-628-1800001345 58,247 67,211 8,964Mobility Office 20.205 1900002234 53,310 53,310Mobility Office 20.205 2000001997 31,834 88,395 56,561Newtown Pike Supplement #2 20.205 C-00343167 (131,826) 456,956 400,000 50,039 (138,743)Nicholasville Road Corridor Land Use Study 20.205 SC-625-1900002248 21,120 100,126 109,600 30,594Old Frankfort Pike Scenic Byway Viewing Area 20.205 PO2-628-1500003392 445,347 514,478 75,311 6,180Oxford Circle Sidewalks 20.205 P02-628-1700004160 34,602 81,636 47,034Polo Club Boulevard Project 20.205 PO2-625-1300001036 106,597 2,381,692 2,275,095Rosemont Garden Sidewalks 20.205 PO2-628-1700004171 3,571 7,775 7,070 2,866Squires Road Sidewalks 20.205 PO2-628-1600003546 938 938Todds Road Sidewalks 20.205 PO2-628-1700004177 134,682 134,682Town Branch 20.205 PO2-628-1200004353 40 460 460 40Town Branch Commons Corridor-Zone 2 20.205 PO2-628-1600003719 8,516 471,864 1,628,393 1,165,045Town Branch Trail Commons-Midland Section 20.205 PO2-628-1600005544 180,685 168,283 1,015,381 1,027,783Town Branch Trail Crossing 20.205 PO2-628-1500004792 84 84Town Branch Trail Phase IV, V, VI 20.205 PO2-628-1500003706 13,049 5,348 20,352 28,053West Hickman Trail 20.205 PO2-628-1600005956 30,510 42,688 12,178Wilson Downing Sidewalks 20.205 PO2-628-1700004178 5,060 6,080 1,020MCSAP (Motor Carrier Safety Asst.Prog.) 20.218 No Number 6,020 24,703 18,683MCSAP (Motor Carrier Safety Asst.Prog.) 20.218 No Number 30,956 51,496 20,540Fed Transit Admin Section 5303 20.505 PO30217442 45,034 45,033 155,458 38,865 194,324Fed Transit Admin Section 5303 20.505 PO30217442 46,571 46,571Traffic Safety 20.600 SC-625-20000002891 4,818 50,271 45,453Traffic Safety 20.600 SC-625-2100000400-1 45,576 55,207 9,631Traffic Safety Occupant Protection Prog. 20.616 SC-625-20000003411 4,098 19,208 15,110Traffic Safety Occupant Protection Prog. 20.616 SC-625-2100000458-1 10,625 15,291 4,666Traffic Safety Impaired Driving Enforcement 20.616 SC-625-20000003641 2,653 18,193 15,540Traffic Safety Impaired Driving Enforcement 20.616 SC-625-2100000493-1 8,509 9,955 1,446Town Branch Tiger 20.933 SC-628-1800005041 1,500,848 2,152,757 4,856,614 4,204,705
Total US Department of Transportation 4,986,062 12,600,022 555,458 15,507,682 8,449,180
US Environmental Protection AgencyPassed through Commonwealth of Kentucky:
West Hickman Wet Weather Storage 66.458 A15-026 SWR 387,646 387,646Total US Environmental Protection Agency 387,646 387,646
US Department of Health and Human Services:Direct Programs:
SAMHSA (Substance Abuse Mental Health Serv) 93.243 1H79SP080309-01 54,611 73,161 18,550SAMHSA (Substance Abuse Mental Health Serv) 93.243 5H79SP080309-02 203,596 386,482 185,352 2,466SAMHSA (Substance Abuse Mental Health Serv) 93.243 5H79SP080309-03 38,944 38,944
Passed through Commonwealth of Kentucky:Senior Citizens 93.044 AS-2020-2021 2,353 37,492 35,139Senior Citizens CARES ACT 93.044 AS-2019-2020 86,258 44,775 (41,483)Child Care and Development Block Grant 93.575 No Number 150,028 498,020 22,149 (325,843)Child Care and Development Block Grant 93.575 No Number 327,080 (327,080)Family Care Center Cares Act Stipend 93.575 No Number 112,500 93,660 (18,840)Family Care Center Cares Act Stipend 93.575 No Number 168,000 (168,000)Home Network 93.597 2018-2019-PUBLIC-R (296,900) 296,900Home Network 93.597 2019-2020-PUBLIC-R (265,260) 50,410 (315,670)Home Network 93.597 2020-2021-PUBLIC-R 282,369 (282,369)Head Start Program 93.600 No Number 3,758 3,758Head Start Program 93.600 No Number 17,888 33,665 15,777
Total US Department of Health and Human Services (150,167) 2,008,279 771,487 (1,386,959)
See Independent Auditors Report 148
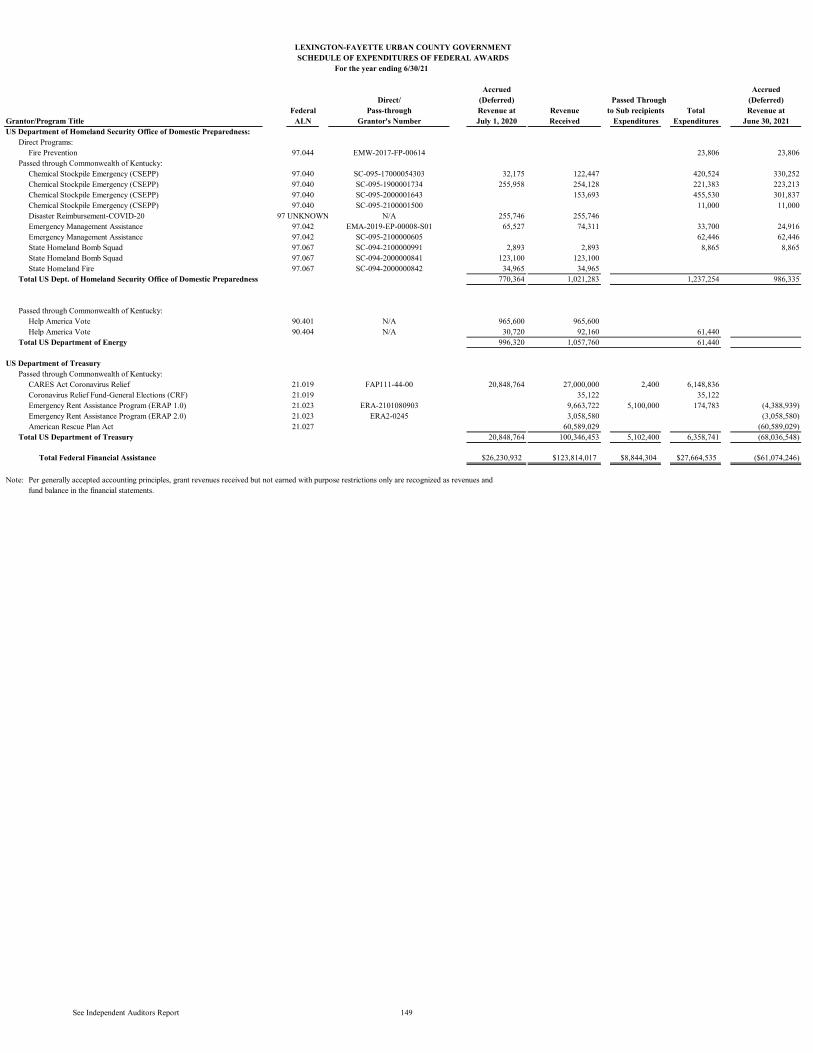
LEXINGTON-FAYETTE URBAN COUNTY GOVERNMENTSCHEDULE OF EXPENDITURES OF FEDERAL AWARDS
For the year ending 6/30/21
Accrued AccruedDirect/ (Deferred) Passed Through (Deferred)
Federal Pass-through Revenue at Revenue to Sub recipients Total Revenue atGrantor/Program Title ALN Grantor's Number July 1, 2020 Received Expenditures Expenditures June 30, 2021US Department of Homeland Security Office of Domestic Preparedness:
Direct Programs:Fire Prevention 97.044 EMW-2017-FP-00614 23,806 23,806
Passed through Commonwealth of Kentucky:Chemical Stockpile Emergency (CSEPP) 97.040 SC-095-17000054303 32,175 122,447 420,524 330,252Chemical Stockpile Emergency (CSEPP) 97.040 SC-095-1900001734 255,958 254,128 221,383 223,213Chemical Stockpile Emergency (CSEPP) 97.040 SC-095-2000001643 153,693 455,530 301,837Chemical Stockpile Emergency (CSEPP) 97.040 SC-095-2100001500 11,000 11,000Disaster Reimbursement-COVID-20 97 UNKNOWN N/A 255,746 255,746Emergency Management Assistance 97.042 EMA-2019-EP-00008-S01 65,527 74,311 33,700 24,916Emergency Management Assistance 97.042 SC-095-2100000605 62,446 62,446State Homeland Bomb Squad 97.067 SC-094-2100000991 2,893 2,893 8,865 8,865State Homeland Bomb Squad 97.067 SC-094-2000000841 123,100 123,100State Homeland Fire 97.067 SC-094-2000000842 34,965 34,965
Total US Dept. of Homeland Security Office of Domestic Preparedness 770,364 1,021,283 1,237,254 986,335
Passed through Commonwealth of Kentucky:
Help America Vote 90.401 N/A 965,600 965,600Help America Vote 90.404 N/A 30,720 92,160 61,440
Total US Department of Energy 996,320 1,057,760 61,440
US Department of TreasuryPassed through Commonwealth of Kentucky:
CARES Act Coronavirus Relief 21.019 FAP111-44-00 20,848,764 27,000,000 2,400 6,148,836Coronavirus Relief Fund-General Elections (CRF) 21.019 35,122 35,122Emergency Rent Assistance Program (ERAP 1.0) 21.023 ERA-2101080903 9,663,722 5,100,000 174,783 (4,388,939)Emergency Rent Assistance Program (ERAP 2.0) 21.023 ERA2-0245 3,058,580 (3,058,580)American Rescue Plan Act 21.027 60,589,029 (60,589,029)
Total US Department of Treasury 20,848,764 100,346,453 5,102,400 6,358,741 (68,036,548)
Total Federal Financial Assistance $26,230,932 $123,814,017 $8,844,304 $27,664,535 ($61,074,246)
Note: Per generally accepted accounting principles, grant revenues received but not earned with purpose restrictions only are recognized as revenues and fund balance in the financial statements.
See Independent Auditors Report 149
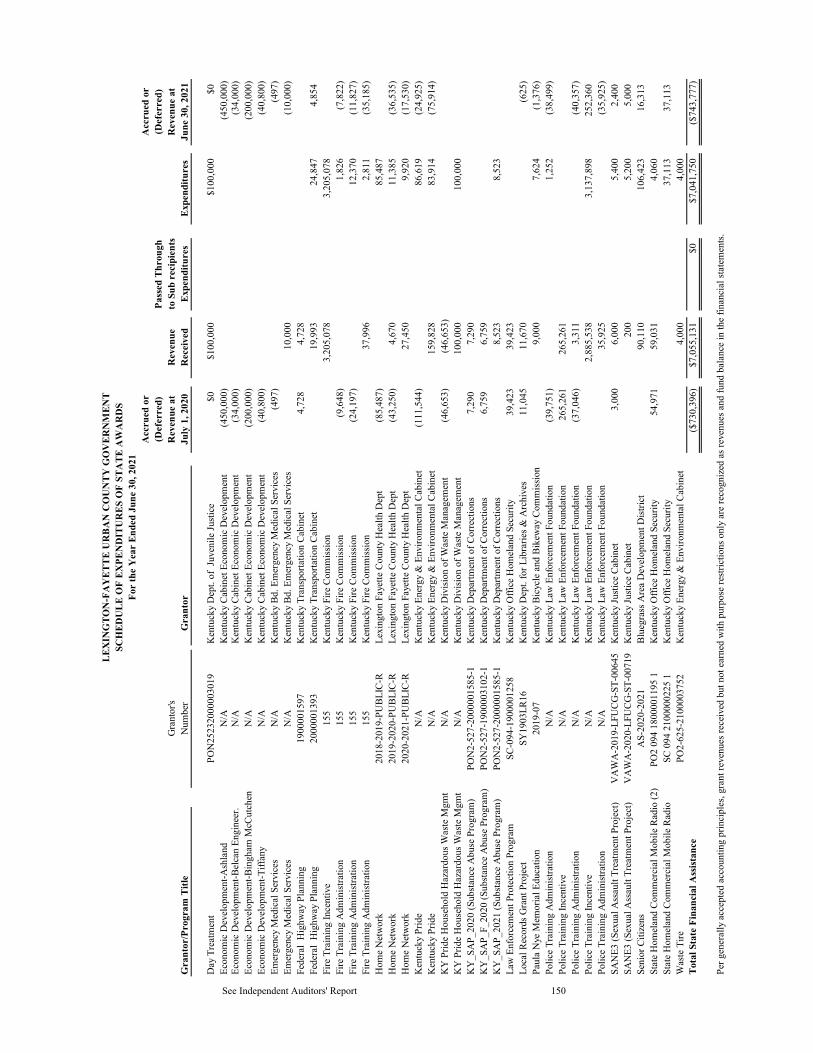
LEX
ING
TON
-FA
YET
TE U
RBA
N C
OU
NTY
GO
VER
NM
ENT
SCH
EDU
LE O
F EX
PEN
DIT
UR
ES O
F ST
ATE
AW
AR
DS
For
the
Yea
r En
ded
June
30,
202
1A
ccru
ed o
rA
ccru
ed o
r(D
efer
red)
Pass
ed T
hrou
gh(D
efer
red)
Gra
ntor
'sR
even
ue a
tR
even
ueto
Sub
rec
ipie
nts
Rev
enue
at
Gra
ntor
/Pro
gram
Titl
eN
umbe
r
Gra
ntor
July
1, 2
020
Rec
eive
dEx
pend
iture
sEx
pend
iture
sJu
ne 3
0, 2
021
Day
Tre
atm
ent
PON
2523
2000
0030
19K
entu
cky
Dep
t. of
Juv
enile
Justi
ce$0
$100
,000
$100
,000
$0Ec
onom
ic D
evel
opm
ent-A
shla
ndN
/AK
entu
cky
Cabi
net E
cono
mic
Dev
elop
men
t(4
50,0
00)
(450
,000
)Ec
onom
ic D
evel
opm
ent-B
elca
n En
gine
er.
N/A
Ken
tuck
y Ca
bine
t Eco
nom
ic D
evel
opm
ent
(34,
000)
(34,
000)
Econ
omic
Dev
elop
men
t-Bin
gham
McC
utch
enN
/AK
entu
cky
Cabi
net E
cono
mic
Dev
elop
men
t(2
00,0
00)
(200
,000
)Ec
onom
ic D
evel
opm
ent-T
iffan
y N
/AK
entu
cky
Cabi
net E
cono
mic
Dev
elop
men
t(4
0,80
0)(4
0,80
0)Em
erge
ncy
Med
ical
Ser
vice
sN
/AK
entu
cky
Bd. E
mer
genc
y M
edic
al S
ervi
ces
(497
)(4
97)
Emer
genc
y M
edic
al S
ervi
ces
N/A
Ken
tuck
y Bd
. Em
erge
ncy
Med
ical
Ser
vice
s10
,000
(10,
000)
Fede
ral
Hig
hway
Pla
nnin
g19
0000
1597
Ken
tuck
y Tr
ansp
orta
tion
Cabi
net
4,72
84,
728
Fede
ral
Hig
hway
Pla
nnin
g20
0000
1393
Ken
tuck
y Tr
ansp
orta
tion
Cabi
net
19,9
9324
,847
4,85
4Fi
re T
rain
ing
Ince
ntiv
e15
5K
entu
cky
Fire
Com
miss
ion
3,20
5,07
83,
205,
078
Fire
Tra
inin
g A
dmin
istra
tion
155
Ken
tuck
y Fi
re C
omm
issio
n(9
,648
)1,
826
(7,8
22)
Fire
Tra
inin
g A
dmin
istra
tion
155
Ken
tuck
y Fi
re C
omm
issio
n(2
4,19
7)12
,370
(11,
827)
Fire
Tra
inin
g A
dmin
istra
tion
155
Ken
tuck
y Fi
re C
omm
issio
n37
,996
2,81
1(3
5,18
5)H
ome
Net
wor
k20
18-2
019-
PUBL
IC-R
Lexi
ngto
n Fa
yette
Cou
nty
Hea
lth D
ept
(85,
487)
85,4
87H
ome
Net
wor
k20
19-2
020-
PUBL
IC-R
Lexi
ngto
n Fa
yette
Cou
nty
Hea
lth D
ept
(43,
250)
4,67
011
,385
(36,
535)
Hom
e N
etw
ork
2020
-202
1-PU
BLIC
-RLe
ton
Faye
tte C
ount
y H
ealth
Dep
t27
,450
9,92
0(1
7,53
0)K
entu
cky
Prid
e N
/AK
entu
cky
Ener
gy &
Env
ironm
enta
l Cab
inet
(111
,544
)86
,619
(24,
925)
Ken
tuck
y Pr
ide
N/A
Ken
tuck
y En
ergy
& E
nviro
nmen
tal C
abin
et15
9,82
883
,914
(75,
914)
KY
Prid
e H
ouse
hold
Haz
ardo
us W
aste
Mgm
tN
/AK
entu
cky
Div
ision
of W
aste
Man
agem
ent
(46,
653)
(46,
653)
KY
Prid
e H
ouse
hold
Haz
ardo
us W
aste
Mgm
tN
/AK
entu
cky
Div
ision
of W
aste
Man
agem
ent
100,
000
100,
000
KY
_SA
P_20
20 (S
ubsta
nce
Abu
se P
rogr
am)
PON
2-52
7-20
0000
1585
-1K
entu
cky
Dep
artm
ent o
f Cor
rect
ions
7,29
07,
290
KY
_SA
P_F_
2020
(Sub
stanc
e A
buse
Pro
gram
)PO
N2-
527-
1900
0031
02-1
Ken
tuck
y D
epar
tmen
t of C
orre
ctio
ns6,
759
6,75
9K
Y_S
AP_
2021
(Sub
stanc
e A
buse
Pro
gram
)PO
N2-
527-
2000
0015
85-1
Ken
tuck
y D
epar
tmen
t of C
orre
ctio
ns8,
523
8,52
3La
w E
nfor
cem
ent P
rote
ctio
n Pr
ogra
mSC
-094
-190
0001
258
Ken
tuck
y O
ffice
Hom
elan
d Se
curit
y39
,423
39,4
23Lo
cal R
ecor
ds G
rant
Pro
ject
SY19
03LR
16K
entu
cky
Dep
t. fo
r Lib
rarie
s & A
rchi
ves
11,0
4511
,670
(625
)Pa
ula
Nye
Mem
oria
l Edu
catio
n20
19-0
7K
entu
cky
Bicy
cle
and
Bike
way
Com
miss
ion
9,00
07,
624
(1,3
76)
Polic
e Tr
aini
ng A
dmin
istra
tion
N/A
Ken
tuck
y La
w E
nfor
cem
ent F
ound
atio
n(3
9,75
1)1,
252
(38,
499)
Polic
e Tr
aini
ng In
cent
ive
N/A
Ken
tuck
y La
w E
nfor
cem
ent F
ound
atio
n26
5,26
126
5,26
1Po
lice
Trai
ning
Adm
inist
ratio
nN
/AK
entu
cky
Law
Enf
orce
men
t Fou
ndat
ion
(37,
046)
3,31
1(4
0,35
7)Po
lice
Trai
ning
Ince
ntiv
e N
/AK
entu
cky
Law
Enf
orce
men
t Fou
ndat
ion
2,88
5,53
83,
137,
898
252,
360
Polic
e Tr
aini
ng A
dmin
istra
tion
N/A
Ken
tuck
y La
w E
nfor
cem
ent F
ound
atio
n35
,925
(35,
925)
SAN
E3 (S
exua
l Ass
ault
Trea
tmen
t Pro
ject
) V
AW
A-2
019-
LFU
CG-S
T-00
645
Ken
tuck
y Ju
stice
Cab
inet
3,00
06,
000
5,40
02,
400
SAN
E3 (S
exua
l Ass
ault
Trea
tmen
t Pro
ject
) V
AW
A-2
020-
LFU
CG-S
T-00
719
Ken
tuck
y Ju
stice
Cab
inet
200
5,20
05,
000
Seni
or C
itize
nsA
S-20
20-2
021
Blue
gras
s Are
a D
evel
opm
ent D
istric
t90
,110
106,
423
16,3
13St
ate
Hom
elan
d Co
mm
erci
al M
obile
Rad
io (2
)PO
2 09
4 18
0000
1195
1
Ken
tuck
y O
ffice
Hom
elan
d Se
curit
y54
,971
59,0
314,
060
Stat
e H
omel
and
Com
mer
cial
Mob
ile R
adio
SC 0
94 2
1000
0022
5 1
Ken
tuck
y O
ffice
Hom
elan
d Se
curit
y37
,113
37,1
13W
aste
Tire
PO2-
625-
2100
0037
52K
entu
cky
Ener
gy &
Env
ironm
enta
l Cab
inet
4,00
04,
000
Tota
l Sta
te F
inan
cial
Ass
istan
ce($
730,
396)
$7,0
55,1
31$0
$7,0
41,7
50($
743,
777)
Per g
ener
ally
acc
epte
d ac
coun
ting
prin
cipl
es, g
rant
reve
nues
rece
ived
but
not
ear
ned
with
pur
pose
restr
ictio
ns o
nly
are
reco
gniz
ed a
s rev
enue
s and
fund
bal
ance
in th
e fin
anci
al st
atem
ents.
See Independent Auditors' Report 150
151
NONMAJOR ENTERPRISE FUNDS
Enterprise Funds are established to account for the acquisition, operation, and maintenance of the Government's facilities and services which are entirely or predominantly self-supported by user charges or where the Government has decided that periodic determination of revenues earned, expenses incurred, and net income is appropriate for capital maintenance, public policy, management control, accountability, and other purposes. The Right of Way program was established in 2003 to account for fees levied to monitor and manage public facilities located in public rights-of-way. The Extended School Program was established in 1994 to provide before and after school care for children in participating elementary and middle schools. The Enhanced 911 Fund was established in 1996 to account for the revenues and expenses of developing and operating an enhanced 911 system. The Central Kentucky Network Fund was established in 2014 to ensure the appropriate treatment of revenues or other monies received from jurisdictions participating in the Central Kentucky 911 Network. The Small Business Development Fund was established in 2000 to promote and assist the growth and development of business concerns. This program was previously administered by the Urban County Development Corporation, a component unit of the Government, which was dissolved in March 2000. The Public Parking Corporation was established in 1984 to account for the construction and operation of government-owned parking facilities.
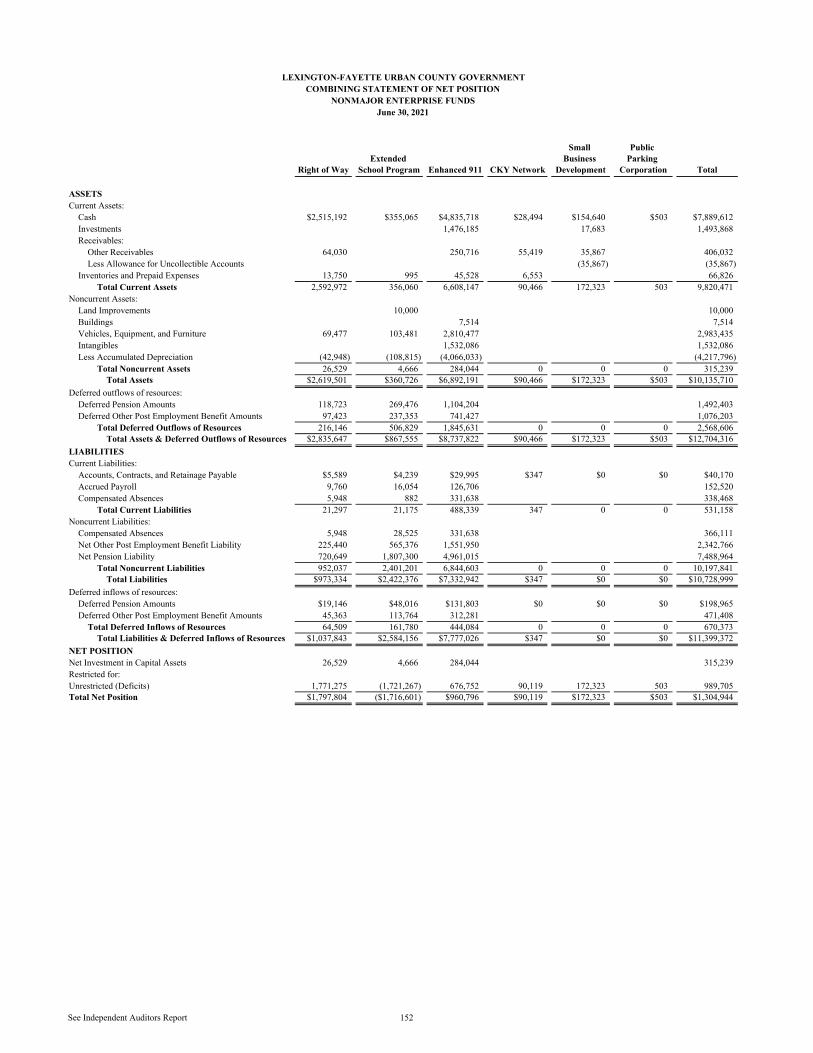
Right of WayExtended
School Program Enhanced 911 CKY Network
Small Business
Development
Public Parking
Corporation Total
ASSETSCurrent Assets:
Cash $2,515,192 $355,065 $4,835,718 $28,494 $154,640 $503 $7,889,612Investments 1,476,185 17,683 1,493,868Receivables:
Other Receivables 64,030 250,716 55,419 35,867 406,032Less Allowance for Uncollectible Accounts (35,867) (35,867)
Inventories and Prepaid Expenses 13,750 995 45,528 6,553 66,826Total Current Assets 2,592,972 356,060 6,608,147 90,466 172,323 503 9,820,471
Noncurrent Assets:Land Improvements 10,000 10,000Buildings 7,514 7,514Vehicles, Equipment, and Furniture 69,477 103,481 2,810,477 2,983,435Intangibles 1,532,086 1,532,086Less Accumulated Depreciation (42,948) (108,815) (4,066,033) (4,217,796)
Total Noncurrent Assets 26,529 4,666 284,044 0 0 0 315,239Total Assets $2,619,501 $360,726 $6,892,191 $90,466 $172,323 $503 $10,135,710
Deferred outflows of resources:Deferred Pension Amounts 118,723 269,476 1,104,204 1,492,403Deferred Other Post Employment Benefit Amounts 97,423 237,353 741,427 1,076,203
Total Deferred Outflows of Resources 216,146 506,829 1,845,631 0 0 0 2,568,606Total Assets & Deferred Outflows of Resources $2,835,647 $867,555 $8,737,822 $90,466 $172,323 $503 $12,704,316
LIABILITIESCurrent Liabilities:
Accounts, Contracts, and Retainage Payable $5,589 $4,239 $29,995 $347 $0 $0 $40,170Accrued Payroll 9,760 16,054 126,706 152,520Compensated Absences 5,948 882 331,638 338,468
Total Current Liabilities 21,297 21,175 488,339 347 0 0 531,158Noncurrent Liabilities:
Compensated Absences 5,948 28,525 331,638 366,111Net Other Post Employment Benefit Liability 225,440 565,376 1,551,950 2,342,766Net Pension Liability 720,649 1,807,300 4,961,015 7,488,964
Total Noncurrent Liabilities 952,037 2,401,201 6,844,603 0 0 0 10,197,841Total Liabilities $973,334 $2,422,376 $7,332,942 $347 $0 $0 $10,728,999
Deferred inflows of resources:Deferred Pension Amounts $19,146 $48,016 $131,803 $0 $0 $0 $198,965Deferred Other Post Employment Benefit Amounts 45,363 113,764 312,281 471,408
Total Deferred Inflows of Resources 64,509 161,780 444,084 0 0 0 670,373Total Liabilities & Deferred Inflows of Resources $1,037,843 $2,584,156 $7,777,026 $347 $0 $0 $11,399,372
NET POSITIONNet Investment in Capital Assets 26,529 4,666 284,044 315,239Restricted for:Unrestricted (Deficits) 1,771,275 (1,721,267) 676,752 90,119 172,323 503 989,705Total Net Position $1,797,804 ($1,716,601) $960,796 $90,119 $172,323 $503 $1,304,944
LEXINGTON-FAYETTE URBAN COUNTY GOVERNMENTCOMBINING STATEMENT OF NET POSITION
NONMAJOR ENTERPRISE FUNDSJune 30, 2021
See Independent Auditors Report 152
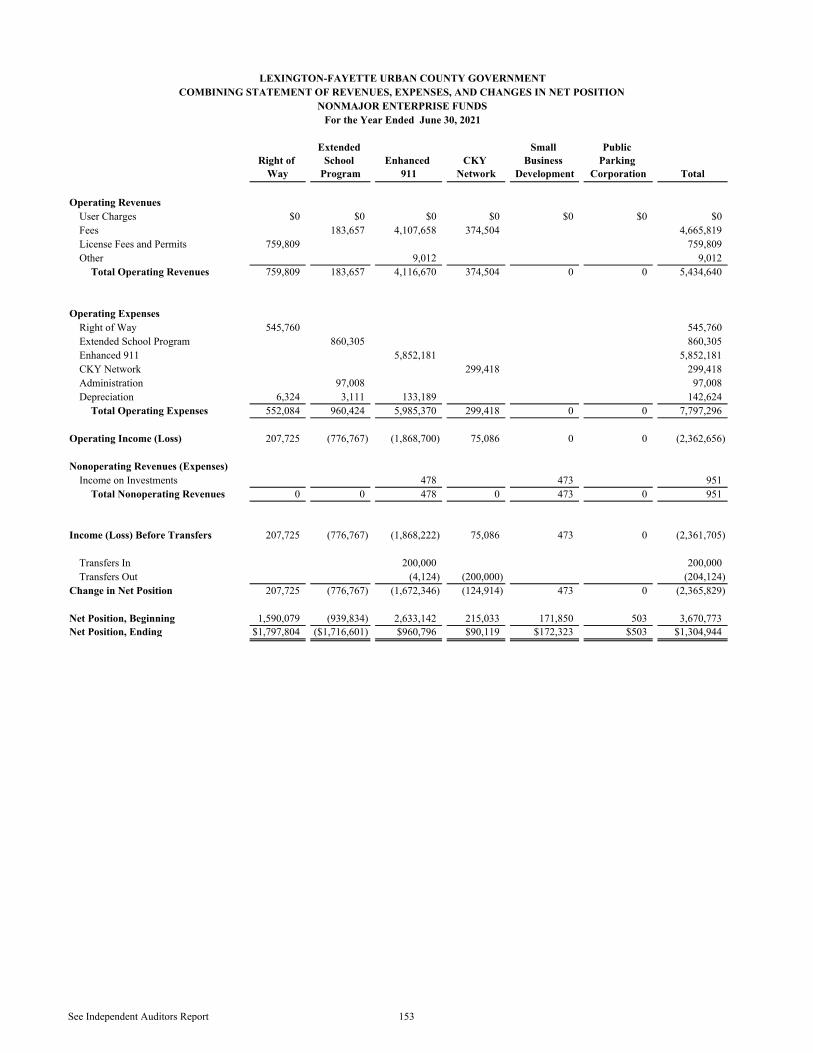
Right of Way
Extended School
ProgramEnhanced
911CKY
Network
Small Business
Development
Public Parking
Corporation Total
Operating RevenuesUser Charges $0 $0 $0 $0 $0 $0 $0Fees 183,657 4,107,658 374,504 4,665,819License Fees and Permits 759,809 759,809Other 9,012 9,012
Total Operating Revenues 759,809 183,657 4,116,670 374,504 0 0 5,434,640
Operating ExpensesRight of Way 545,760 545,760Extended School Program 860,305 860,305Enhanced 911 5,852,181 5,852,181CKY Network 299,418 299,418Administration 97,008 97,008Depreciation 6,324 3,111 133,189 142,624
Total Operating Expenses 552,084 960,424 5,985,370 299,418 0 0 7,797,296
Operating Income (Loss) 207,725 (776,767) (1,868,700) 75,086 0 0 (2,362,656)
Nonoperating Revenues (Expenses)Income on Investments 478 473 951
Total Nonoperating Revenues 0 0 478 0 473 0 951
207,725 (776,767) (1,868,222) 75,086 473 0 (2,361,705)
Transfers In 200,000 200,000Transfers Out (4,124) (200,000) (204,124)
Change in Net Position 207,725 (776,767) (1,672,346) (124,914) 473 0 (2,365,829)
Net Position, Beginning 1,590,079 (939,834) 2,633,142 215,033 171,850 503 3,670,773Net Position, Ending $1,797,804 ($1,716,601) $960,796 $90,119 $172,323 $503 $1,304,944
Income (Loss) Before Transfers
LEXINGTON-FAYETTE URBAN COUNTY GOVERNMENTCOMBINING STATEMENT OF REVENUES, EXPENSES, AND CHANGES IN NET POSITION
NONMAJOR ENTERPRISE FUNDSFor the Year Ended June 30, 2021
See Independent Auditors Report 153
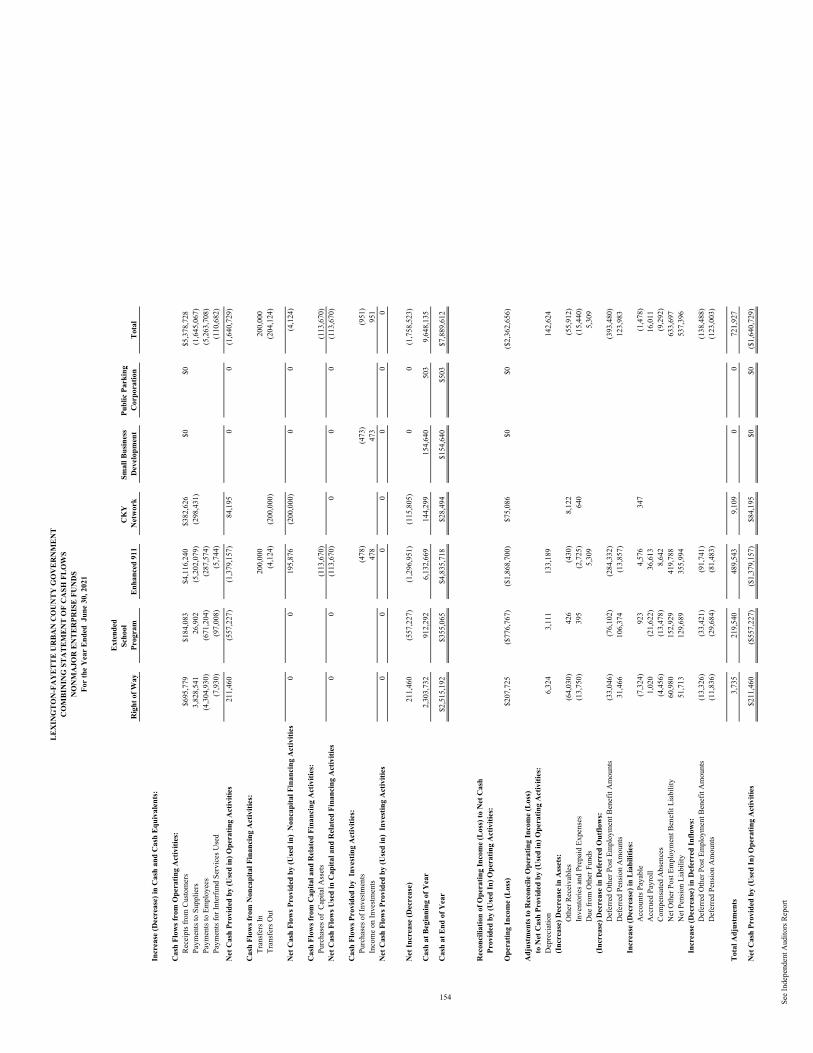
Rig
ht o
f Way
Ext
ende
d Sc
hool
Pr
ogra
m
Enha
nced
911
CK
Y
Net
wor
kSm
all B
usin
ess
Dev
elop
men
tPu
blic
Par
king
C
orpo
ratio
nTo
tal
Incr
ease
(Dec
reas
e) in
Cas
h an
d C
ash
Equi
vale
nts:
Cas
h Fl
ows f
rom
Ope
ratin
g A
ctiv
ities
:Re
ceip
ts fro
m C
usto
mer
s$6
95,7
79$1
84,0
83$4
,116
,240
$382
,626
$0$0
$5,3
78,7
28Pa
ymen
ts to
Sup
plie
rs3,
828,
541
26,9
02(5
,202
,079
)(2
98,4
31)
(1,6
45,0
67)
Paym
ents
to E
mpl
oyee
s(4
,304
,930
)(6
71,2
04)
(287
,574
)
(5
,263
,708
)Pa
ymen
ts fo
r Int
erfu
nd S
ervi
ces U
sed
(7,9
30)
(97,
008)
(5,7
44)
(110
,682
)N
et C
ash
Prov
ided
by
(Use
d in
) Ope
ratin
g A
ctiv
ities
211,
460
(557
,227
)(1
,379
,157
)84
,195
00
(1,6
40,7
29)
Cas
h Fl
ows f
rom
Non
capi
tal F
inan
cing
Act
iviti
es:
Tran
sfer
s In
200,
000
200,
000
Tran
sfer
s Out
(4
,124
)(2
00,0
00)
(204
,124
)
Net
Cas
h Fl
ows P
rovi
ded
by (U
sed
in)
Non
capi
tal F
inan
cing
Act
iviti
es0
019
5,87
6(2
00,0
00)
00
(4,1
24)
Cas
h Fl
ows f
rom
Cap
ital a
nd R
elat
ed F
inan
cing
Act
iviti
es:
Purc
hase
s of
Capi
tal A
sset
s
(113
,670
)
(1
13,6
70)
Net
Cas
h Fl
ows U
sed
in C
apita
l and
Rel
ated
Fin
anci
ng A
ctiv
ities
00
(113
,670
)0
00
(113
,670
)
Cas
h Fl
ows P
rovi
ded
by I
nves
ting
Act
iviti
es:
Purc
hase
s of I
nves
tmen
ts(4
78)
(473
)(9
51)
Inco
me
on In
vestm
ents
47
8
47
3
95
1N
et C
ash
Flow
s Pro
vide
d by
(Use
d in
) In
vest
ing
Act
iviti
es0
00
00
00
Net
Incr
ease
(Dec
reas
e)21
1,46
0(5
57,2
27)
(1,2
96,9
51)
(115
,805
)0
0(1
,758
,523
)
Cas
h at
Beg
inni
ng o
f Yea
r2,
303,
732
912,
292
6,13
2,66
914
4,29
915
4,64
050
39,
648,
135
Cas
h at
End
of Y
ear
$2,5
15,1
92$3
55,0
65$4
,835
,718
$28,
494
$154
,640
$503
$7,8
89,6
12
Rec
onci
liatio
n of
Ope
ratin
g In
com
e (L
oss)
to N
et C
ash
Prov
ided
by
(Use
d In
) Ope
ratin
g A
ctiv
ities
:
Ope
ratin
g In
com
e (L
oss)
$207
,725
($77
6,76
7)($
1,86
8,70
0)$7
5,08
6$0
$0($
2,36
2,65
6)
Adj
ustm
ents
to R
econ
cile
Ope
ratin
g In
com
e (L
oss)
to N
et C
ash
Prov
ided
by
(Use
d in
) Ope
ratin
g A
ctiv
ities
:D
epre
ciat
ion
6,32
43,
111
133,
189
142,
624
(Inc
reas
e) D
ecre
ase
in A
sset
s:O
ther
Rec
eiva
bles
(64,
030)
426
(430
)8,
122
(55,
912)
Inve
ntor
ies a
nd P
repa
id E
xpen
ses
(13,
750)
395
(2,7
25)
640
(15,
440)
Due
from
Oth
er F
unds
5,
309
5,30
9(I
ncre
ase)
Dec
reas
e in
Def
erre
d O
utflo
ws:
Def
erre
d O
ther
Pos
t Em
ploy
men
t Ben
efit
Am
ount
s(3
3,04
6)(7
6,10
2)(2
84,3
32)
(393
,480
)D
efer
red
Pens
ion
Am
ount
s31
,466
106,
374
(13,
857)
123,
983
Incr
ease
(Dec
reas
e) in
Lia
bilit
ies:
Acc
ount
s Pay
able
(7,3
24)
923
4,57
634
7
(1
,478
)A
ccru
ed P
ayro
ll1,
020
(21,
622)
36,6
13
16
,011
Com
pens
ated
Abs
ence
s(4
,456
)(1
3,47
8)8,
642
(9,2
92)
Net
Oth
er P
ost E
mpl
oym
ent B
enef
it Li
abili
ty60
,980
152,
929
419,
788
633,
697
Net
Pen
sion
Liab
ility
51,7
1312
9,68
935
5,99
4
53
7,39
6In
crea
se (D
ecre
ase)
in D
efer
red
Inflo
ws:
Def
erre
d O
ther
Pos
t Em
ploy
men
t Ben
efit
Am
ount
s(1
3,32
6)(3
3,42
1)(9
1,74
1)(1
38,4
88)
Def
erre
d Pe
nsio
n A
mou
nts
(11,
836)
(29,
684)
(81,
483)
(123
,003
)
Tota
l Adj
ustm
ents
3,73
521
9,54
048
9,54
39,
109
00
721,
927
Net
Cas
h Pr
ovid
ed b
y (U
sed
In) O
pera
ting
Act
iviti
es$2
11,4
60($
557,
227)
($1,
379,
157)
$84,
195
$0$0
($1,
640,
729)
LEX
ING
TON
-FA
YET
TE U
RBA
N C
OU
NTY
GO
VER
NM
ENT
CO
MBI
NIN
G S
TATE
MEN
T O
F C
ASH
FLO
WS
NO
NM
AJO
R E
NTE
RPR
ISE
FUN
DS
For
the
Yea
r En
ded
Jun
e 30
, 202
1
154 See
Inde
pend
ent A
udito
rs R
epor
t
155
INTERNAL SERVICE FUNDS Internal Service Funds are used to account for the financing on a cost-reimbursement basis of services provided by one department to other departments within the Government and outside agencies associated with the Government. Individual funds included in this fund type are as follows: The Health, Dental, and Vision Care Insurance Fund accounts for the Government’s self-insurance programs for employee medical, dental, and vision care benefits. The Insurance and Risk Management Fund accounts for the Government's self-insurance programs for workers' compensation, vehicle liability and physical, general liability and property damage coverage.
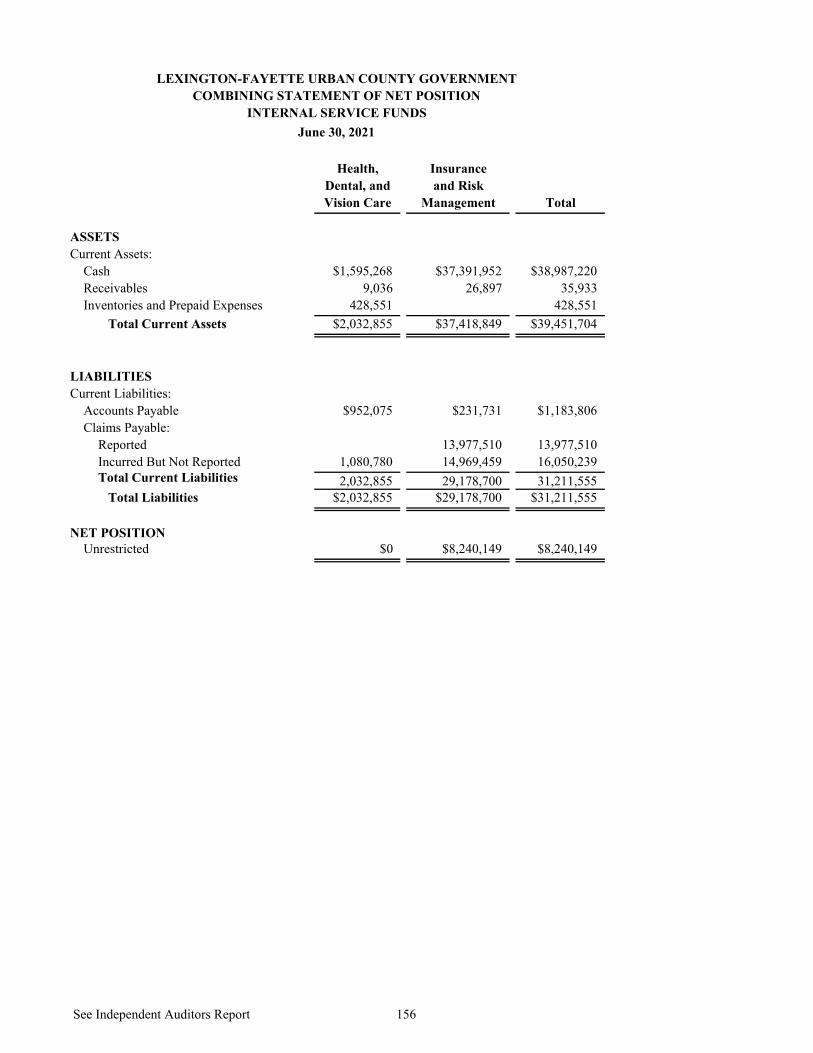
Health, InsuranceDental, and and RiskVision Care Management Total
ASSETSCurrent Assets:
Cash $1,595,268 $37,391,952 $38,987,220Receivables 9,036 26,897 35,933Inventories and Prepaid Expenses 428,551 428,551
Total Current Assets $2,032,855 $37,418,849 $39,451,704
LIABILITIESCurrent Liabilities:
Accounts Payable $952,075 $231,731 $1,183,806Claims Payable:
Reported 13,977,510 13,977,510Incurred But Not Reported 1,080,780 14,969,459 16,050,239Total Current Liabilities 2,032,855 29,178,700 31,211,555 Total Liabilities $2,032,855 $29,178,700 $31,211,555
NET POSITIONUnrestricted $0 $8,240,149 $8,240,149
LEXINGTON-FAYETTE URBAN COUNTY GOVERNMENTCOMBINING STATEMENT OF NET POSITION
INTERNAL SERVICE FUNDSJune 30, 2021
See Independent Auditors Report 156
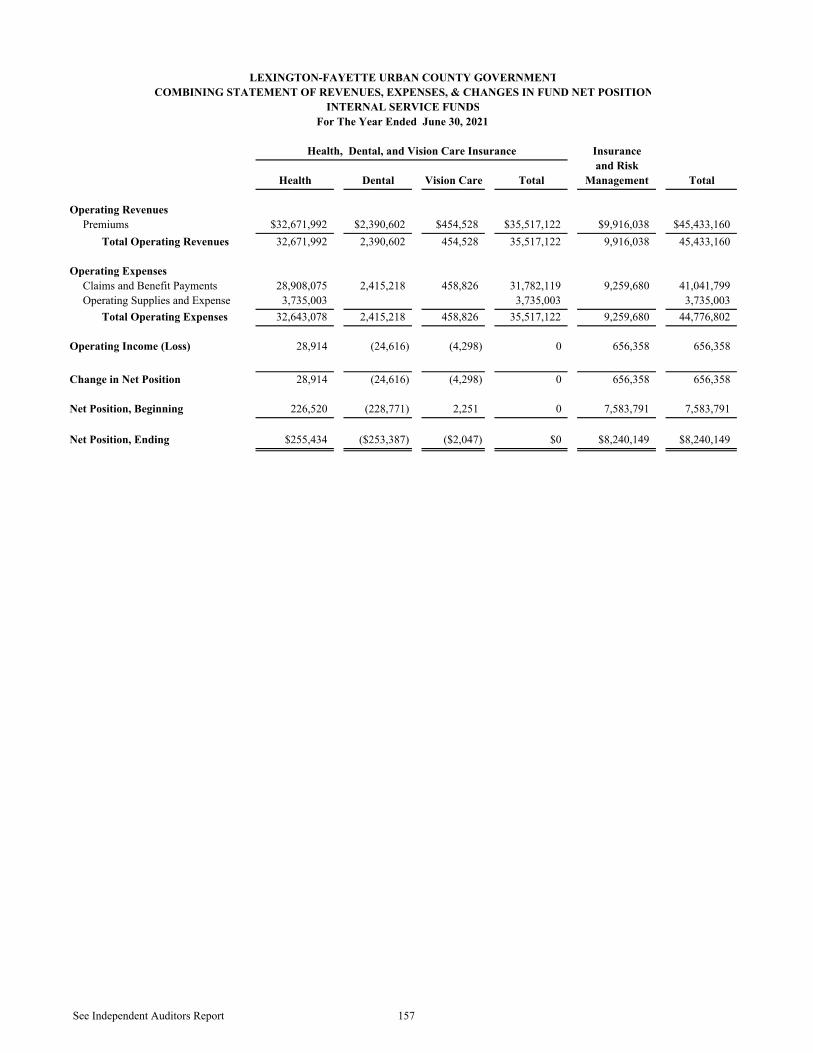
Insuranceand Risk
Health Dental Vision Care Total Management Total
Operating RevenuesPremiums $32,671,992 $2,390,602 $454,528 $35,517,122 $9,916,038 $45,433,160
Total Operating Revenues 32,671,992 2,390,602 454,528 35,517,122 9,916,038 45,433,160
Operating ExpensesClaims and Benefit Payments 28,908,075 2,415,218 458,826 31,782,119 9,259,680 41,041,799Operating Supplies and Expense 3,735,003 3,735,003 3,735,003
Total Operating Expenses 32,643,078 2,415,218 458,826 35,517,122 9,259,680 44,776,802
Operating Income (Loss) 28,914 (24,616) (4,298) 0 656,358 656,358
Change in Net Position 28,914 (24,616) (4,298) 0 656,358 656,358
Net Position, Beginning 226,520 (228,771) 2,251 0 7,583,791 7,583,791
Net Position, Ending $255,434 ($253,387) ($2,047) $0 $8,240,149 $8,240,149
LEXINGTON-FAYETTE URBAN COUNTY GOVERNMENTCOMBINING STATEMENT OF REVENUES, EXPENSES, & CHANGES IN FUND NET POSITION
INTERNAL SERVICE FUNDSFor The Year Ended June 30, 2021
Health, Dental, and Vision Care Insurance
See Independent Auditors Report 157
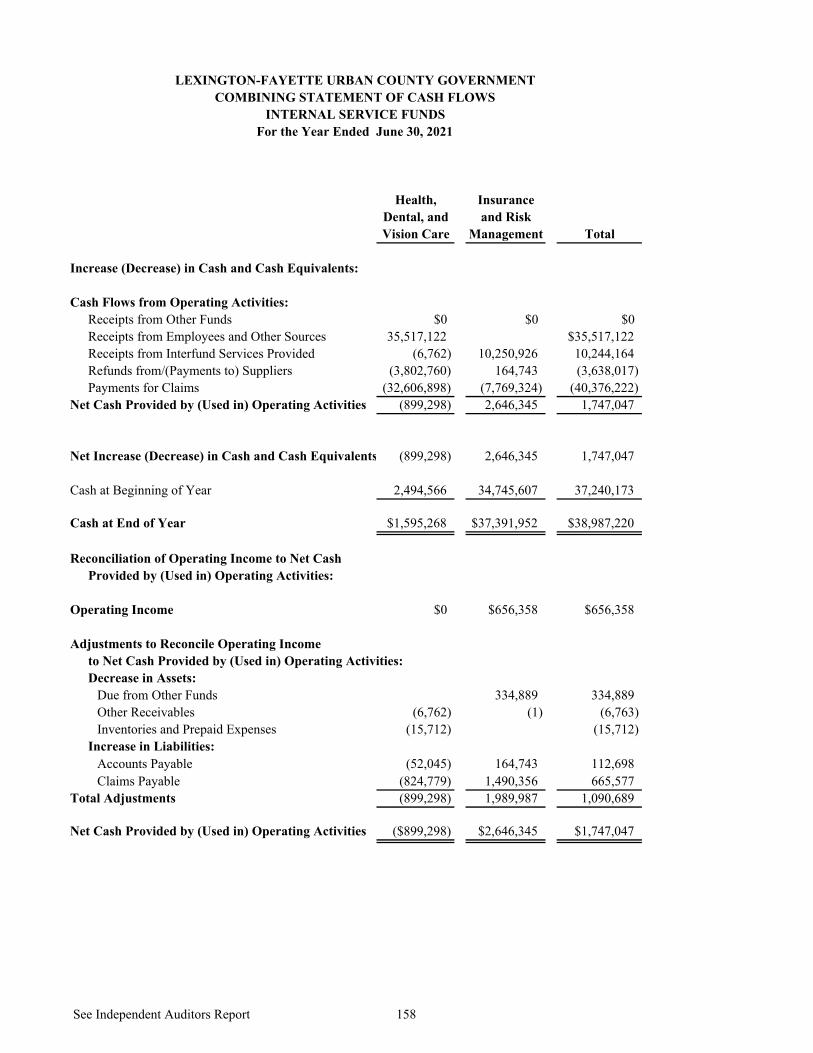
Health, InsuranceDental, and and RiskVision Care Management Total
Increase (Decrease) in Cash and Cash Equivalents:
Cash Flows from Operating Activities:Receipts from Other Funds $0 $0 $0Receipts from Employees and Other Sources 35,517,122 $35,517,122Receipts from Interfund Services Provided (6,762) 10,250,926 10,244,164Refunds from/(Payments to) Suppliers (3,802,760) 164,743 (3,638,017)Payments for Claims (32,606,898) (7,769,324) (40,376,222)
Net Cash Provided by (Used in) Operating Activities (899,298) 2,646,345 1,747,047
Net Increase (Decrease) in Cash and Cash Equivalents (899,298) 2,646,345 1,747,047
Cash at Beginning of Year 2,494,566 34,745,607 37,240,173
Cash at End of Year $1,595,268 $37,391,952 $38,987,220
Reconciliation of Operating Income to Net CashProvided by (Used in) Operating Activities:
Operating Income $0 $656,358 $656,358
Adjustments to Reconcile Operating Incometo Net Cash Provided by (Used in) Operating Activities:Decrease in Assets:
Due from Other Funds 334,889 334,889Other Receivables (6,762) (1) (6,763)Inventories and Prepaid Expenses (15,712) (15,712)
Increase in Liabilities:Accounts Payable (52,045) 164,743 112,698Claims Payable (824,779) 1,490,356 665,577
Total Adjustments (899,298) 1,989,987 1,090,689
Net Cash Provided by (Used in) Operating Activities ($899,298) $2,646,345 $1,747,047
LEXINGTON-FAYETTE URBAN COUNTY GOVERNMENTCOMBINING STATEMENT OF CASH FLOWS
INTERNAL SERVICE FUNDSFor the Year Ended June 30, 2021
See Independent Auditors Report 158
159
FIDUCIARY FUNDS
Fiduciary Funds are used to account for assets held by the Government in a trustee capacity or as an agent for individuals, private organizations, other governmental units or other funds. These include pension trust, expendable trust, and agency funds. Individual funds included in this fund type are as follows:
INVESTMENT TRUST FUND
The Sanitary Sewer Investment Trust is an investment trust fund. In fiscal year 2014, the Government defeased all outstanding debt and entered into a new Sewer indenture agreement. The new indenture provides that the gross income and revenues of the System first be used to pay operating and maintenance expenses of the System. Net Revenues of the System are deposited into the Bond Account, which is held by a Trustee.
CUSTODIAL FUNDS
The Neighborhood Sewer Projects Fund is a custodial fund that accounts for the collection of special assessments and debt service payments on financing for neighborhood capital projects. The Juvenile & Adult Probation Fund accounts for funds collected by the divisions of Youth Services and Detention Services from juvenile and adult offenders and disbursed to victims in accordance with court decrees and funds collected from and disbursed for inmates on work release. The Property & Evidence Fund accounts for monies collected from prisoners. Once the case has been adjudicated through the court system, money is distributed as ordered. The Domestic Relations Fund accounts for the child support payments collected by the Government from non-custodial parents and disbursed to custodial parents. The Representative Payee Fund accounts for funds managed by the Government on behalf of adults who are unable to manage their own money in order to prevent the exploitation, abuse, and neglect of these citizens. The Prisoners’ Account System was transferred to the Government in 1994 and accounts for the operations of the commissary at the Fayette County Detention Center.
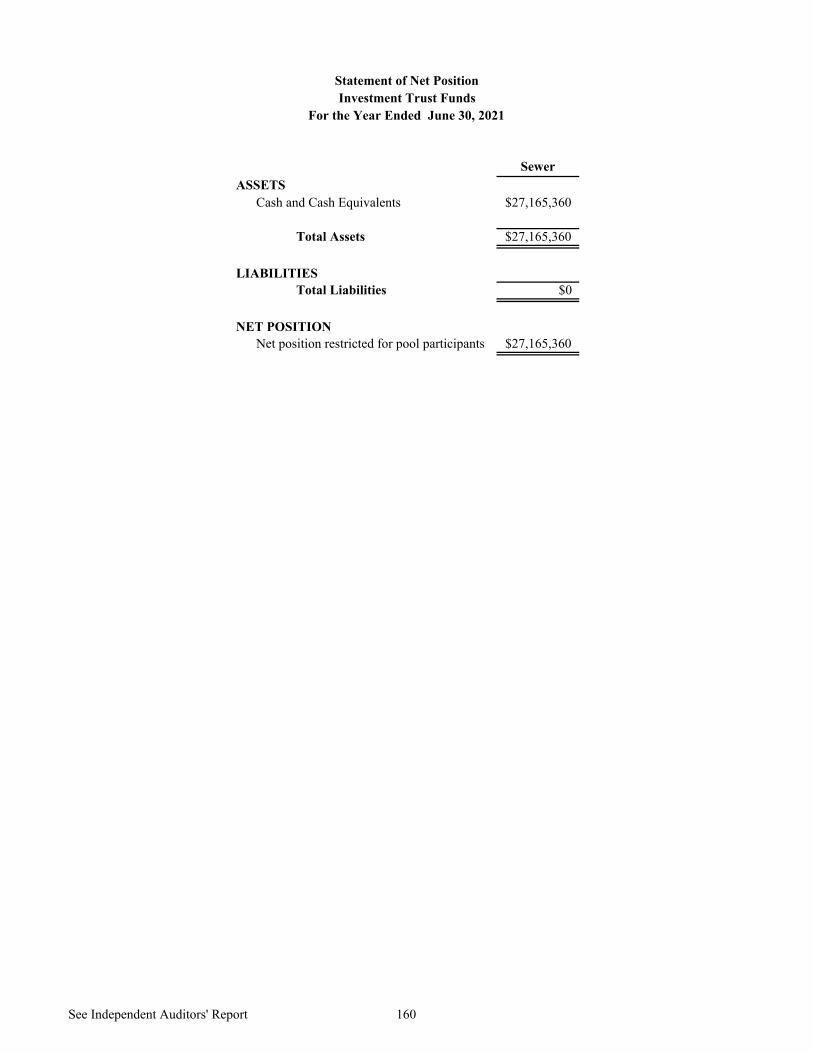
SewerASSETS
Cash and Cash Equivalents $27,165,360
Total Assets $27,165,360
LIABILITIESTotal Liabilities $0
NET POSITIONNet position restricted for pool participants $27,165,360
For the Year Ended June 30, 2021Investment Trust Funds
Statement of Net Position
See Independent Auditors' Report 160
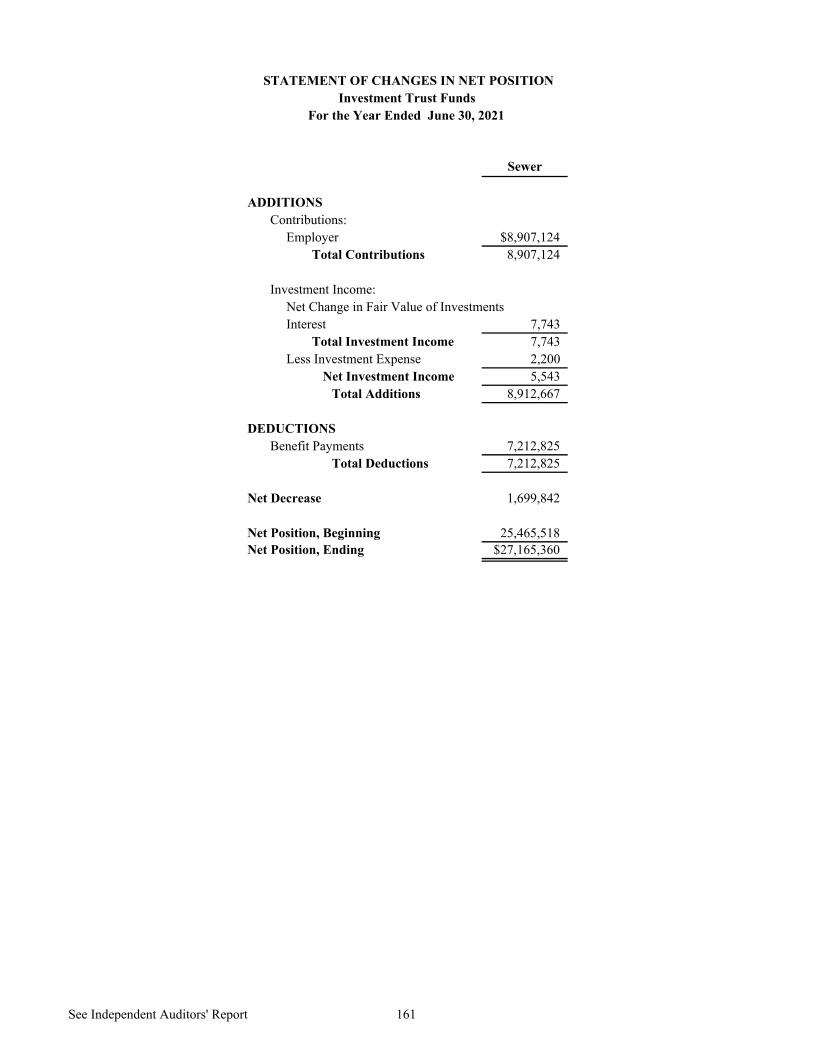
Sewer
ADDITIONSContributions:
Employer $8,907,124Total Contributions 8,907,124
Investment Income:Net Change in Fair Value of InvestmentsInterest 7,743
Total Investment Income 7,743Less Investment Expense 2,200
Net Investment Income 5,543Total Additions 8,912,667
DEDUCTIONSBenefit Payments 7,212,825
Total Deductions 7,212,825
Net Decrease 1,699,842
Net Position, Beginning 25,465,518Net Position, Ending $27,165,360
STATEMENT OF CHANGES IN NET POSITIONInvestment Trust Funds
For the Year Ended June 30, 2021
See Independent Auditors' Report 161
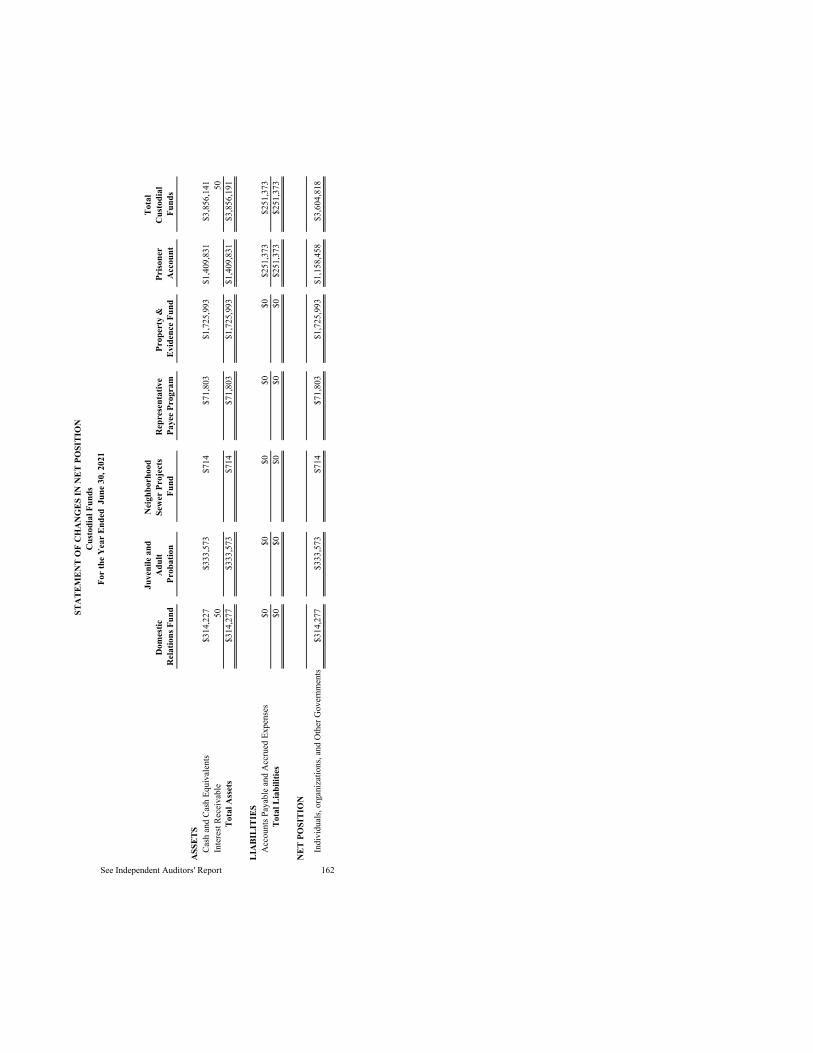
Dom
estic
R
elat
ions
Fun
d
Juve
nile
and
A
dult
Prob
atio
n
Nei
ghbo
rhoo
d Se
wer
Pro
ject
s Fu
ndR
epre
sent
ativ
e Pa
yee
Prog
ram
Prop
erty
&
Evid
ence
Fun
dPr
isone
r A
ccou
nt
Tota
l C
usto
dial
Fu
nds
ASS
ETS
Cash
and
Cas
h Eq
uiva
lent
s$3
14,2
27$3
33,5
73$7
14$7
1,80
3$1
,725
,993
$1,4
09,8
31$3
,856
,141
Inte
rest
Rece
ivab
le50
50
Tota
l Ass
ets
$314
,277
$333
,573
$714
$71,
803
$1,7
25,9
93$1
,409
,831
$3,8
56,1
91
LIA
BILI
TIES
Acc
ount
s Pay
able
and
Acc
rued
Exp
ense
s$0
$0$0
$0$0
$251
,373
$251
,373
Tota
l Lia
bilit
ies
$0$0
$0$0
$0$2
51,3
73$2
51,3
73
NET
PO
SITI
ON
Indi
vidu
als,
orga
niza
tions
, and
Oth
er G
over
nmen
ts$3
14,2
77$3
33,5
73$7
14$7
1,80
3$1
,725
,993
$1,1
58,4
58$3
,604
,818
STA
TEM
ENT
OF
CH
AN
GES
IN N
ET P
OSI
TIO
NC
usto
dial
Fun
dsFo
r th
e Y
ear
Ende
d J
une
30, 2
021
162 See Independent Auditors' Report
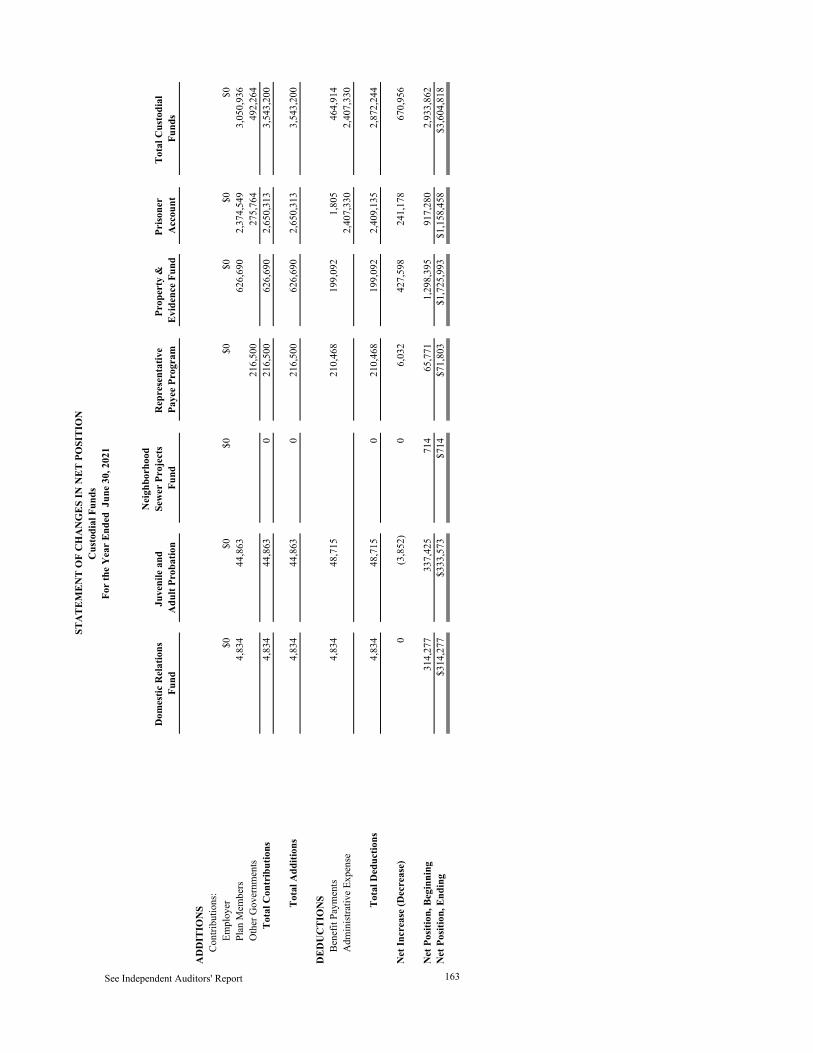
Dom
estic
Rel
atio
ns
Fund
Juve
nile
and
A
dult
Prob
atio
n
Nei
ghbo
rhoo
d Se
wer
Pro
ject
s Fu
ndR
epre
sent
ativ
e Pa
yee
Prog
ram
Prop
erty
&
Evid
ence
Fun
dPr
isone
r A
ccou
ntTo
tal C
usto
dial
Fu
nds
AD
DIT
ION
SCo
ntrib
utio
ns:
Empl
oyer
$0
$0$0
$0$0
$0$0
Plan
Mem
bers
4,
834
44,8
63
62
6,69
02,
374,
549
3,05
0,93
6O
ther
Gov
ernm
ents
216,
500
275,
764
492,
264
Tota
l Con
trib
utio
ns4,
834
44,8
630
216,
500
626,
690
2,65
0,31
33,
543,
200
Tota
l Add
ition
s4,
834
44,8
630
216,
500
626,
690
2,65
0,31
33,
543,
200
DED
UC
TIO
NS
Bene
fit P
aym
ents
4,83
448
,715
210,
468
199,
092
1,80
546
4,91
4A
dmin
istra
tive
Expe
nse
2,
407,
330
2,40
7,33
0
Tota
l Ded
uctio
ns4,
834
48,7
150
210,
468
199,
092
2,40
9,13
52,
872,
244
Net
Incr
ease
(Dec
reas
e)0
(3,8
52)
06,
032
427,
598
241,
178
670,
956
Net
Pos
ition
, Beg
inni
ng31
4,27
733
7,42
571
465
,771
1,29
8,39
591
7,28
02,
933,
862
Net
Pos
ition
, End
ing
$314
,277
$333
,573
$714
$71,
803
$1,7
25,9
93$1
,158
,458
$3,6
04,8
18
See Independent Auditors' Report
STA
TEM
ENT
OF
CH
AN
GES
IN N
ET P
OSI
TIO
NC
usto
dial
Fun
dsFo
r th
e Y
ear
Ende
d J
une
30, 2
021
163
164
NONMAJOR COMPONENT UNITS The Lexington Transit Authority is authorized to promote and develop mass transportation, including acquisition, operation, and extension of the existing mass transit system. The Lexington Public Library provides educational, informational, and recreational services to Lexington and Fayette County through circulating and reference materials. The Lexington Convention and Visitors Bureau promote recreational, convention, and tourist activity in Lexington and Fayette County.
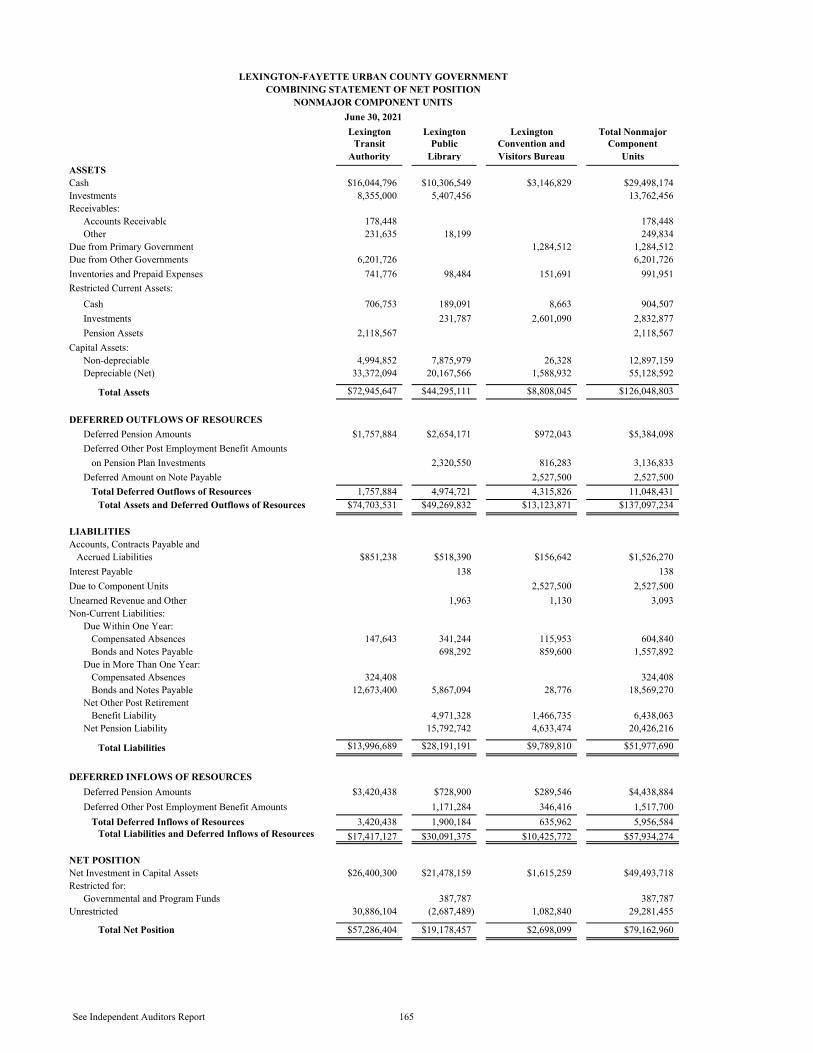
Lexington Lexington Lexington Total NonmajorTransit Public Convention and Component
Authority Library Visitors Bureau UnitsASSETSCash $16,044,796 $10,306,549 $3,146,829 $29,498,174Investments 8,355,000 5,407,456 13,762,456Receivables:
Accounts Receivable 178,448 178,448Other 231,635 18,199 249,834
Due from Primary Government 1,284,512 1,284,512Due from Other Governments 6,201,726 6,201,726Inventories and Prepaid Expenses 741,776 98,484 151,691 991,951Restricted Current Assets:
Cash 706,753 189,091 8,663 904,507Investments 231,787 2,601,090 2,832,877Pension Assets 2,118,567 2,118,567
Capital Assets:Non-depreciable 4,994,852 7,875,979 26,328 12,897,159Depreciable (Net) 33,372,094 20,167,566 1,588,932 55,128,592
Total Assets $72,945,647 $44,295,111 $8,808,045 $126,048,803
DEFERRED OUTFLOWS OF RESOURCESDeferred Pension Amounts $1,757,884 $2,654,171 $972,043 $5,384,098Deferred Other Post Employment Benefit Amounts
on Pension Plan Investments 2,320,550 816,283 3,136,833Deferred Amount on Note Payable 2,527,500 2,527,500
Total Deferred Outflows of Resources 1,757,884 4,974,721 4,315,826 11,048,431Total Assets and Deferred Outflows of Resources $74,703,531 $49,269,832 $13,123,871 $137,097,234
LIABILITIESAccounts, Contracts Payable and Accrued Liabilities $851,238 $518,390 $156,642 $1,526,270Interest Payable 138 138Due to Component Units 2,527,500 2,527,500Unearned Revenue and Other 1,963 1,130 3,093Non-Current Liabilities:
Due Within One Year:Compensated Absences 147,643 341,244 115,953 604,840Bonds and Notes Payable 698,292 859,600 1,557,892
Due in More Than One Year:Compensated Absences 324,408 324,408Bonds and Notes Payable 12,673,400 5,867,094 28,776 18,569,270
Net Other Post Retirement Benefit Liability 4,971,328 1,466,735 6,438,063
Net Pension Liability 15,792,742 4,633,474 20,426,216
Total Liabilities $13,996,689 $28,191,191 $9,789,810 $51,977,690
DEFERRED INFLOWS OF RESOURCESDeferred Pension Amounts $3,420,438 $728,900 $289,546 $4,438,884Deferred Other Post Employment Benefit Amounts 1,171,284 346,416 1,517,700
Total Deferred Inflows of Resources 3,420,438 1,900,184 635,962 5,956,584Total Liabilities and Deferred Inflows of Resources $17,417,127 $30,091,375 $10,425,772 $57,934,274
NET POSITIONNet Investment in Capital Assets $26,400,300 $21,478,159 $1,615,259 $49,493,718Restricted for:
Governmental and Program Funds 387,787 387,787Unrestricted 30,886,104 (2,687,489) 1,082,840 29,281,455
Total Net Position $57,286,404 $19,178,457 $2,698,099 $79,162,960
LEXINGTON-FAYETTE URBAN COUNTY GOVERNMENTCOMBINING STATEMENT OF NET POSITION
NONMAJOR COMPONENT UNITSJune 30, 2021
See Independent Auditors Report 165
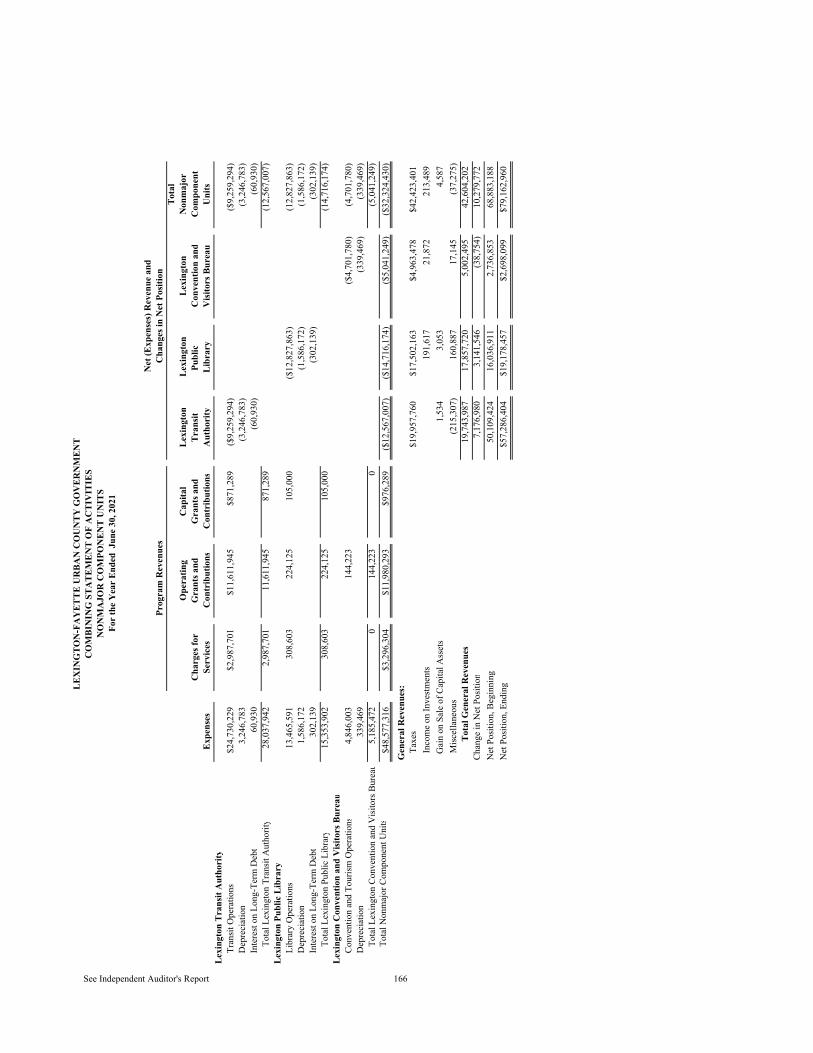
Tota
lO
pera
ting
Cap
ital
Lexi
ngto
nLe
ton
Lexi
ngto
nN
onm
ajor
Cha
rges
for
Gra
nts a
ndG
rant
s and
Tran
sitPu
blic
C
onve
ntio
n an
dC
ompo
nent
Expe
nses
Serv
ices
Con
trib
utio
nsC
ontr
ibut
ions
Aut
hori
tyLi
brar
yV
isito
rs B
urea
uU
nits
Lexi
ngto
n Tr
ansit
Aut
hori
tyTr
ansit
Ope
ratio
ns$2
4,73
0,22
9$2
,987
,701
$11,
611,
945
$871
,289
($9,
259,
294)
($9,
259,
294)
Dep
reci
atio
n3,
246,
783
(3,2
46,7
83)
(3,2
46,7
83)
Inte
rest
on L
ong-
Term
Deb
t60
,930
(60,
930)
(60,
930)
Tota
l Lex
ingt
on T
rans
it A
utho
rity
28,0
37,9
422,
987,
701
11,6
11,9
4587
1,28
9(1
2,56
7,00
7)Le
ton
Publ
ic L
ibra
ryLi
brar
y O
pera
tions
13,4
65,5
9130
8,60
322
4,12
510
5,00
0($
12,8
27,8
63)
(12,
827,
863)
Dep
reci
atio
n1,
586,
172
(1,5
86,1
72)
(1,5
86,1
72)
Inte
rest
on L
ong-
Term
Deb
t30
2,13
9(3
02,1
39)
(302
,139
)To
tal L
exin
gton
Pub
lic L
ibra
ry15
,353
,902
308,
603
224,
125
105,
000
(14,
716,
174)
Lexi
ngto
n C
onve
ntio
n an
d V
isito
rs B
urea
uCo
nven
tion
and
Tour
ism O
pera
tions
4,84
6,00
314
4,22
3($
4,70
1,78
0)(4
,701
,780
)D
epre
ciat
ion
339,
469
(339
,469
)(3
39,4
69)
Tota
l Lex
ingt
on C
onve
ntio
n an
d V
isito
rs B
urea
u5,
185,
472
014
4,22
30
(5,0
41,2
49)
Tota
l Non
maj
or C
ompo
nent
Uni
ts$4
8,57
7,31
6$3
,296
,304
$11,
980,
293
$976
,289
($12
,567
,007
)($
14,7
16,1
74)
($5,
041,
249)
($32
,324
,430
)
166
Gen
eral
Rev
enue
s:
Taxe
s$1
9,95
7,76
0$1
7,50
2,16
3$4
,963
,478
$42,
423,
401
In
com
e on
Inve
stmen
ts19
1,61
721
,872
213,
489
Gai
n on
Sal
e of
Cap
ital A
sset
s1,
534
3,05
34,
587
M
iscel
lane
ous
(215
,307
)16
0,88
717
,145
(37,
275)
Tot
al G
ener
al R
even
ues
19,7
43,9
8717
,857
,720
5,00
2,49
542
,604
,202
Chan
ge in
Net
Pos
ition
7,17
6,98
03,
141,
546
(38,
754)
10,2
79,7
72N
et P
ositi
on, B
egin
ning
50,1
09,4
2416
,036
,911
2,73
6,85
368
,883
,188
Net
Pos
ition
, End
ing
$57,
286,
404
$19,
178,
457
$2,6
98,0
99$7
9,16
2,96
0
See Independent Auditor's Report
Prog
ram
Rev
enue
sC
hang
es in
Net
Pos
ition
Net
(Exp
ense
s) R
even
ue a
nd
LEX
ING
TON
-FA
YET
TE U
RBA
N C
OU
NTY
GO
VER
NM
ENT
CO
MBI
NIN
G S
TATE
MEN
T O
F A
CTI
VIT
IES
NO
NM
AJO
R C
OM
PON
ENT
UN
ITS
For
the
Yea
r En
ded
Jun
e 30
, 202
1

This page intentionally left blank.

STATISTICAL SECTION
167
The Lexington-Fayette Urban County Government’s Comprehensive Annual Financial Report presents detailed information as a context for understanding what the information in the financial statements, note disclosures and required supplementary information says about the Government’s overall financial health. Financial Trends: Tables 1 – 6
These schedules contain trend information to help the reader understand how the Government’s financial performance and well-being have changed over time.
Revenue Capacity: Tables 7 – 12
These schedules contain information to help the reader assess the Government’s most significant local revenue sources.
Debt Capacity: Tables 13 – 17
These schedules present information to help the reader assess the affordability of the Government’s current level of outstanding debt and the Government’s ability to issue additional debt in the future.
Demographic & Economic Indicators: Tables 18 – 21
These schedules offer demographic and economic indicators to help the reader understand the environment within which the Government’s financial activity takes place.
Operating Information: Tables 22 – 24
These schedules contain service and infrastructure data to help the reader understand how the information in the Government’s financial report relates to the services the government provides and the activities it performs.
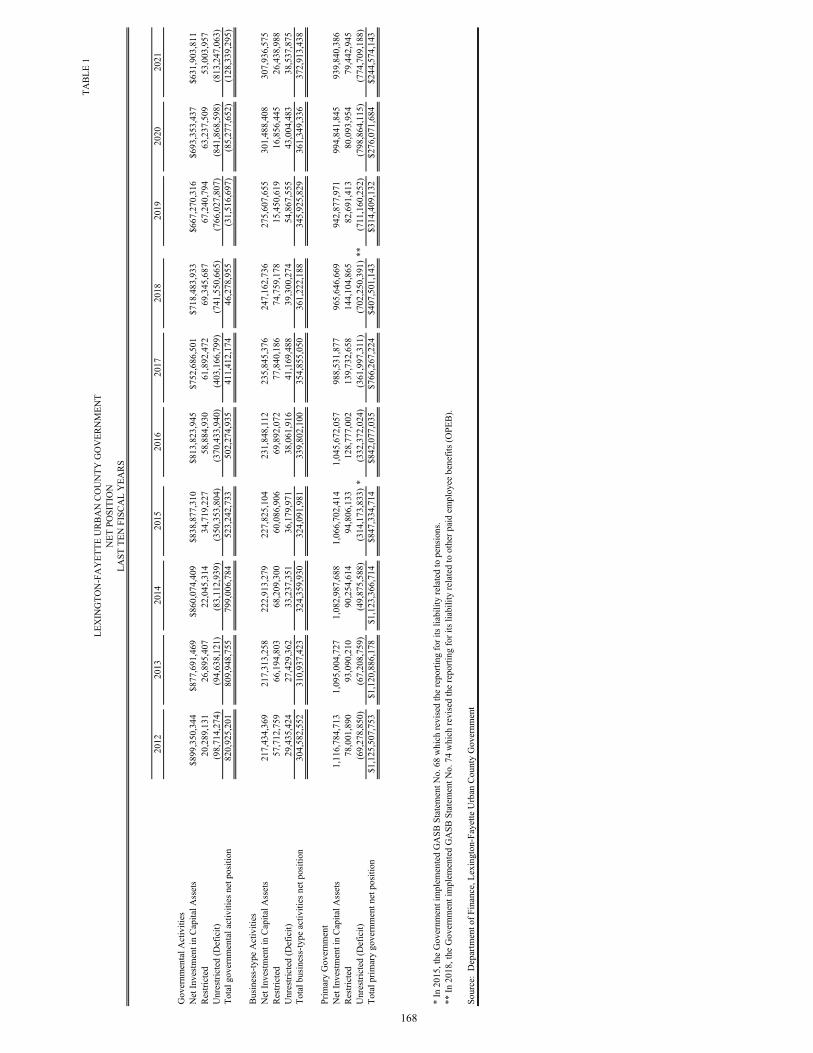
TABL
E 1
2012
2013
2014
2015
2016
2017
2018
2019
2020
2021
Gov
ernm
enta
l Act
iviti
esN
et In
vestm
ent i
n Ca
pita
l Ass
ets
$899
,350
,344
$877
,691
,469
$860
,074
,409
$838
,877
,310
$813
,823
,945
$752
,686
,501
$718
,483
,933
$667
,270
,316
$693
,353
,437
$631
,903
,811
Restr
icte
d20
,289
,131
26,8
95,4
0722
,045
,314
34,7
19,2
2758
,884
,930
61,8
92,4
7269
,345
,687
67,2
40,7
9463
,237
,509
53,0
03,9
57U
nres
trict
ed (D
efic
it)(9
8,71
4,27
4)(9
4,63
8,12
1)(8
3,11
2,93
9)(3
50,3
53,8
04)
(370
,433
,940
)(4
03,1
66,7
99)
(741
,550
,665
)(7
66,0
27,8
07)
(841
,868
,598
)(8
13,2
47,0
63)
Tota
l gov
ernm
enta
l act
iviti
es n
et p
ositi
on82
0,92
5,20
180
9,94
8,75
579
9,00
6,78
452
3,24
2,73
350
2,27
4,93
541
1,41
2,17
446
,278
,955
(31,
516,
697)
(85,
277,
652)
(128
,339
,295
)
Busin
ess-
type
Act
iviti
esN
et In
vestm
ent i
n Ca
pita
l Ass
ets
217,
434,
369
217,
313,
258
222,
913,
279
227,
825,
104
231,
848,
112
235,
845,
376
247,
162,
736
275,
607,
655
301,
488,
408
307,
936,
575
Restr
icte
d57
,712
,759
66,1
94,8
0368
,209
,300
60,0
86,9
0669
,892
,072
77,8
40,1
8674
,759
,178
15,4
50,6
1916
,856
,445
26,4
38,9
88U
nres
trict
ed (D
efic
it)29
,435
,424
27,4
29,3
6233
,237
,351
36,1
79,9
7138
,061
,916
41,1
69,4
8839
,300
,274
54,8
67,5
5543
,004
,483
38,5
37,8
75To
tal b
usin
ess-
type
act
iviti
es n
et p
ositi
on30
4,58
2,55
231
0,93
7,42
332
4,35
9,93
032
4,09
1,98
133
9,80
2,10
035
4,85
5,05
036
1,22
2,18
834
5,92
5,82
936
1,34
9,33
637
2,91
3,43
8
Prim
ary
Gov
ernm
ent
Net
Inve
stmen
t in
Capi
tal A
sset
s1,
116,
784,
713
1,09
5,00
4,72
71,
082,
987,
688
1,06
6,70
2,41
41,
045,
672,
057
988,
531,
877
965,
646,
669
942,
877,
971
994,
841,
845
939,
840,
386
Restr
icte
d78
,001
,890
93,0
90,2
1090
,254
,614
94,8
06,1
3312
8,77
7,00
213
9,73
2,65
814
4,10
4,86
582
,691
,413
80,0
93,9
5479
,442
,945
Unr
estri
cted
(Def
icit)
(69,
278,
850)
(67,
208,
759)
(49,
875,
588)
(314
,173
,833
)*
(332
,372
,024
)(3
61,9
97,3
11)
(702
,250
,391
)**
(711
,160
,252
)(7
98,8
64,1
15)
(774
,709
,188
)To
tal p
rimar
y go
vern
men
t net
pos
ition
$1,1
25,5
07,7
53$1
,120
,886
,178
$1,1
23,3
66,7
14$8
47,3
34,7
14$8
42,0
77,0
35$7
66,2
67,2
24$4
07,5
01,1
43$3
14,4
09,1
32$2
76,0
71,6
84$2
44,5
74,1
43
* In
201
5, th
e G
over
nmen
t im
plem
ente
d G
ASB
Sta
tem
ent N
o. 6
8 w
hich
revi
sed
the
repo
rting
for i
ts lia
bilit
y re
late
d to
pen
sions
. **
In 2
018,
the
Gov
ernm
ent i
mpl
emen
ted
GA
SB S
tate
men
t No.
74
whi
ch re
vise
d th
e re
porti
ng fo
r its
liabi
lity
rela
ted
to o
ther
pai
d em
ploy
ee b
enef
its (O
PEB)
.
168
Sour
ce:
Dep
artm
ent o
f Fin
ance
, Lex
ingt
on-F
ayet
te U
rban
Cou
nty
Gov
ernm
ent
LEX
ING
TON
-FA
YET
TE U
RBA
N C
OU
NTY
GO
VER
NM
ENT
NET
PO
SITI
ON
LAST
TEN
FIS
CAL
YEA
RS
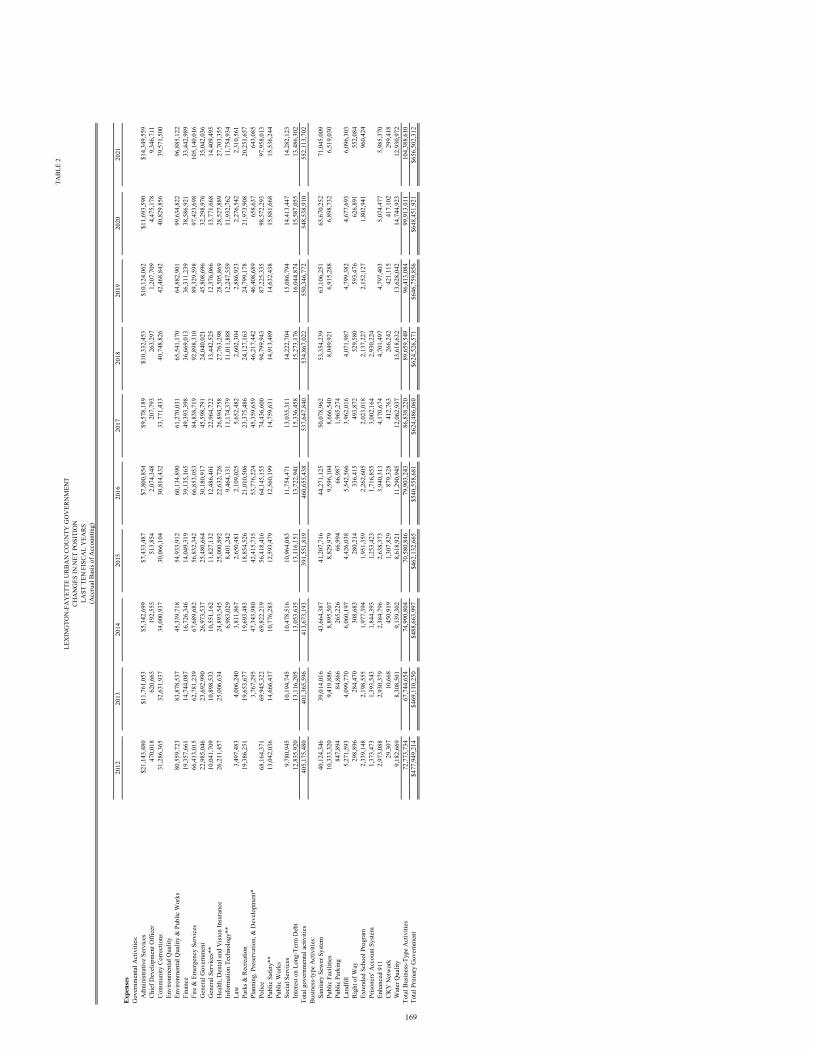
TABL
E 2
2012
2013
2014
2015
2016
2017
2018
2019
2020
2021
Expe
nses
Gov
ernm
enta
l Act
iviti
es:
Adm
inist
rativ
e Se
rvic
es$2
1,14
3,48
0$1
1,76
1,05
3$5
,342
,699
$7,4
33,4
87$7
,800
,854
$9,5
78,1
89$1
0,33
2,45
3$1
0,12
4,06
2$1
1,69
3,59
0$1
4,34
9,55
9Ch
ief D
evel
opm
ent O
ffice
r47
0,01
862
0,66
519
2,55
551
3,85
42,
074,
348
207,
793
263,
297
1,20
7,70
94,
475,
178
9,34
6,71
1Co
mm
unity
Cor
rect
ions
31,2
86,3
6532
,631
,937
34,0
00,9
3730
,066
,104
30,8
14,4
3233
,771
,433
40,7
48,8
2642
,468
,842
40,8
29,8
5639
,571
,500
Envi
ronm
enta
l Qua
lity
Envi
ronm
enta
l Qua
lity
& P
ublic
Wor
ks80
,559
,723
83,8
78,5
3745
,339
,718
54,9
33,9
1260
,134
,890
61,2
70,0
3165
,541
,170
64,8
82,9
0199
,634
,822
96,8
85,1
22Fi
nanc
e19
,357
,661
14,7
44,0
8716
,726
,346
14,0
49,3
1939
,135
,165
49,3
93,3
9836
,669
,013
36,3
11,2
3938
,586
,921
33,4
42,9
89Fi
re &
Em
erge
ncy
Serv
ices
66,4
13,0
1562
,781
,239
67,6
89,6
8256
,832
,342
66,8
53,0
5384
,838
,719
92,8
98,3
1089
,329
,598
97,4
23,6
9810
5,14
0,01
6G
ener
al G
over
nmen
t22
,985
,046
23,6
92,9
9026
,973
,537
25,4
80,6
6430
,180
,917
45,5
98,7
9124
,040
,021
45,8
08,6
9632
,298
,976
35,0
42,0
36G
ener
al S
ervi
ces*
*10
,041
,709
10,8
98,5
3310
,551
,162
11,8
27,1
3212
,486
,401
22,9
64,7
2213
,442
,525
12,3
76,0
6613
,771
,668
14,4
09,4
95H
ealth
, Den
tal a
nd V
ision
Insu
ranc
e26
,211
,457
25,0
06,6
3424
,893
,545
25,0
00,8
9222
,632
,726
26,8
94,7
5827
,763
,298
28,5
05,8
6928
,527
,889
27,7
03,3
55In
form
atio
n Te
chno
logy
**6,
983,
029
8,40
1,24
29,
464,
131
11,1
74,3
7911
,011
,888
12,2
47,5
5911
,932
,762
11,7
54,9
34La
w3,
497,
483
4,00
6,24
03,
811,
867
2,65
0,48
12,
109,
025
5,65
2,48
22,
602,
304
2,88
6,92
32,
276,
542
2,31
0,56
1Pa
rks &
Rec
reat
ion
19,3
86,2
5119
,653
,677
19,6
93,4
8318
,854
,526
21,0
10,5
0623
,375
,486
24,1
27,1
6324
,799
,178
21,9
73,9
0820
,251
,657
Pl
anni
ng, P
rese
rvat
ion,
& D
evel
opm
ent*
3,76
7,29
547
,343
,980
42,4
15,7
3553
,776
,224
45,3
59,6
5946
,217
,442
46,4
08,6
8965
8,63
764
3,08
5Po
lice
68,1
64,3
7169
,945
,322
69,8
22,2
1956
,418
,416
64,1
45,1
5574
,436
,600
94,7
99,9
4387
,225
,335
98,5
72,2
9397
,958
,013
Publ
ic S
afet
y**
13,0
42,0
3614
,666
,437
10,7
76,2
8312
,593
,479
12,5
60,1
9914
,759
,631
14,9
13,4
8914
,632
,438
15,8
81,6
6815
,536
,244
Publ
ic W
orks
Soci
al S
ervi
ces
9,78
0,94
510
,194
,745
10,4
78,5
1610
,964
,083
11,7
54,4
7113
,035
,311
14,2
22,7
0415
,086
,794
14,4
13,4
4714
,282
,123
Inte
rest
on L
ong-
Term
Deb
t12
,835
,920
13,1
16,2
0513
,053
,635
13,1
16,1
5113
,722
,941
15,3
36,4
5815
,273
,176
16,0
44,8
7415
,587
,055
13,4
86,3
02To
tal g
over
nmen
tal a
ctiv
ities
405,
175,
480
401,
365,
596
413,
673,
193
391,
551,
819
460,
655,
438
537,
647,
840
534,
867,
022
550,
346,
772
548,
538,
910
552,
113,
702
Busin
ess-
type
Act
iviti
es:
Sani
tary
Sew
er S
yste
m40
,124
,346
39,0
14,0
1643
,664
,387
41,2
07,7
1644
,271
,125
50,0
78,9
6253
,354
,239
63,1
06,2
5165
,670
,252
71,0
45,0
09Pu
blic
Fac
ilitie
s10
,333
,320
9,41
9,88
68,
895,
507
8,82
9,97
99,
596,
104
8,66
6,54
08,
049,
921
6,91
5,28
86,
898,
732
6,51
9,03
0Pu
blic
Par
king
847,
894
84,8
6626
5,22
666
,994
66,9
871,
965,
274
Land
fill
5,27
1,59
34,
099,
770
6,06
0,19
74,
426,
038
5,54
2,56
63,
962,
016
4,07
1,98
74,
799,
382
4,67
7,69
36,
096,
303
Righ
t of W
ay29
8,89
628
4,47
030
8,68
328
0,21
433
6,41
549
3,87
252
9,58
059
3,47
662
6,89
155
2,08
4Ex
tend
ed S
choo
l Pro
gram
2,33
9,14
82,
198,
555
1,97
7,39
41,
951,
359
2,26
2,60
52,
023,
018
2,13
7,22
72,
152,
127
1,80
2,94
196
0,42
4Pr
isone
rs' A
ccou
nt S
yste
m1,
373,
473
1,39
3,54
31,
844,
393
1,25
3,42
31,
716,
855
3,00
2,16
42,
930,
224
En
hanc
ed 9
112,
973,
088
2,93
0,37
92,
384,
796
2,63
8,37
33,
940,
313
4,17
0,67
44,
701,
497
4,79
7,40
35,
074,
477
5,98
5,37
0CK
Y N
etw
ork
29,3
0710
,668
450,
919
1,30
7,82
987
9,32
841
2,76
326
6,24
242
1,11
541
7,10
229
9,41
8W
ater
Qua
lity
9,18
2,66
98,
308,
501
9,13
9,30
28,
618,
921
11,2
90,9
4512
,062
,937
13,6
18,6
3213
,628
,042
14,7
44,9
2312
,930
,972
Tota
l Bus
ines
s-Ty
pe A
ctiv
ities
72,7
73,7
3467
,744
,654
74,9
90,8
0470
,580
,846
79,9
03,2
4386
,838
,220
89,6
59,5
4996
,413
,084
99,9
13,0
1110
4,38
8,61
0To
tal P
rimar
y G
over
nmen
t$4
77,9
49,2
14$4
69,1
10,2
50$4
88,6
63,9
97$4
62,1
32,6
65$5
40,5
58,6
81$6
24,4
86,0
60$6
24,5
26,5
71$6
46,7
59,8
56$6
48,4
51,9
21$6
56,5
02,3
12
LEX
ING
TON
-FA
YET
TE U
RBA
N C
OU
NTY
GO
VER
NM
ENT
CHA
NG
ES IN
NET
PO
SITI
ON
LAST
TEN
FIS
CAL
YEA
RS(A
ccru
al B
asis
of A
ccou
ntin
g)
169
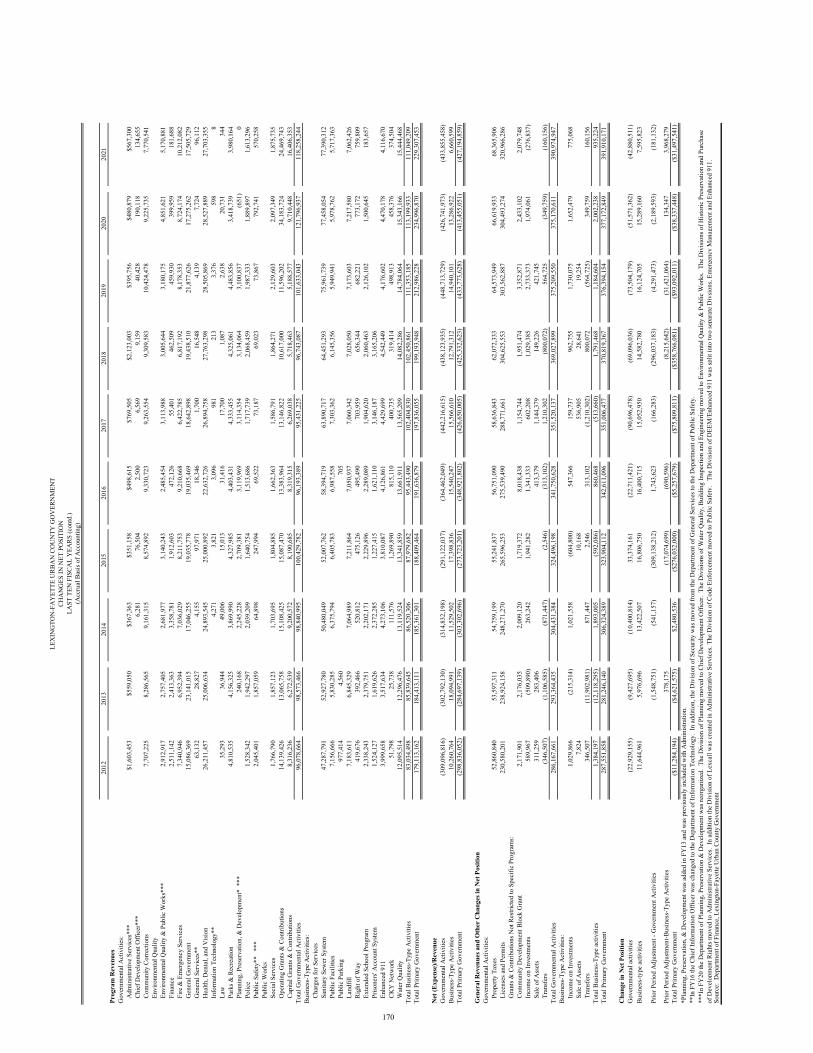
2012
2013
2014
2015
2016
2017
2018
2019
2020
2021
Prog
ram
Rev
enue
sG
over
nmen
tal A
ctiv
ities
:A
dmin
istra
tive
Serv
ices
***
$1,6
03,4
53$5
59,0
50$3
67,3
63$3
51,1
58$4
98,6
15$7
69,5
05$2
,123
,003
$395
,756
$480
,879
$567
,300
Chie
f Dev
elop
men
t Offi
cer*
**6,
281
76,5
042,
500
6,56
99,
159
40,4
2819
0,11
813
4,65
5Co
mm
unity
Cor
rect
ions
7,70
7,22
58,
286,
565
9,16
1,31
58,
574,
892
9,33
0,72
39,
263,
554
9,30
9,58
310
,424
,478
9,22
5,73
57,
770,
541
Envi
ronm
enta
l Qua
lity
Envi
ronm
enta
l Qua
lity
& P
ublic
Wor
ks**
*2,
912,
917
2,75
7,40
52,
681,
977
3,14
0,24
32,
485,
454
3,11
3,98
83,
005,
644
3,18
0,17
54,
851,
621
5,17
0,88
1Fi
nanc
e2,
511,
142
2,41
3,36
33,
358,
781
1,91
2,60
347
2,12
655
,401
462,
509
459,
930
399,
959
181,
688
Fire
& E
mer
genc
y Se
rvic
es7,
340,
946
6,95
2,39
47,
036,
029
8,21
1,75
39,
210,
668
6,42
2,78
56,
817,
192
8,17
8,35
38,
724,
174
10,2
12,0
82G
ener
al G
over
nmen
t15
,086
,369
23,1
41,0
1517
,046
,255
19,0
35,7
7819
,035
,469
18,6
42,8
9819
,438
,510
21,8
77,6
2617
,275
,262
17,5
05,7
29G
ener
al S
ervi
ces*
*63
,132
28,8
274,
155
97,9
7118
,346
1,70
016
,548
4,13
97,
724
96,1
12H
ealth
, Den
tal,
and
Visi
on26
,211
,457
25,0
06,6
3424
,893
,545
25,0
00,8
9222
,632
,726
26,8
94,7
5827
,763
,298
28,5
05,8
6928
,527
,889
27,7
03,3
55In
form
atio
n Te
chno
logy
**4,
271
3,82
13,
096
981
213
3,37
659
88
Law
35,2
9336
,944
49,0
0615
,013
31,4
1617
,700
1,08
72,
638
20,7
3134
4Pa
rks &
Rec
reat
ion
4,81
0,53
54,
156,
325
3,86
9,99
04,
327,
985
4,40
3,43
14,
333,
455
4,32
5,06
14,
483,
856
3,41
8,73
93,
980,
164
Pl
anni
ng, P
rese
rvat
ion,
& D
evel
opm
ent*
***
240,
168
2,24
5,22
82,
709,
381
3,11
9,96
93,
114,
354
3,13
4,06
43,
100,
837
(651
)0
Polic
e1,
528,
342
1,94
2,29
72,
039,
209
1,64
0,75
41,
513,
686
1,71
7,73
92,
068,
459
1,98
7,33
31,
889,
897
1,61
3,29
6Pu
blic
Saf
ety*
* *
**2,
045,
401
1,85
7,05
964
,898
247,
994
69,5
2273
,187
69,0
2373
,867
792,
741
570,
258
Publ
ic W
orks
Soci
al S
ervi
ces
1,76
6,79
01,
857,
123
1,70
3,69
51,
804,
885
1,66
2,36
31,
586,
791
1,86
4,27
12,
129,
603
2,09
7,34
91,
875,
735
Ope
ratin
g G
rant
s & C
ontri
butio
ns14
,139
,426
13,0
65,7
5815
,108
,425
15,0
87,4
7013
,383
,964
13,1
46,8
2210
,617
,000
11,5
96,2
0234
,183
,724
24,4
69,7
43Ca
pita
l Gra
nts &
Con
tribu
tions
8,31
6,23
66,
272,
539
9,20
0,57
28,
190,
685
8,31
9,31
56,
269,
038
5,71
8,46
35,
188,
577
9,71
0,44
816
,406
,353
Tota
l Gov
ernm
enta
l Act
iviti
es96
,078
,664
98,5
73,4
6698
,840
,995
100,
429,
782
96,1
93,3
8995
,431
,225
96,7
43,0
8710
1,63
3,04
312
1,79
6,93
711
8,25
8,24
4Bu
sines
s-Ty
pe A
ctiv
ities
:Ch
arge
s for
Ser
vice
sSa
nita
ry S
ewer
Sys
tem
47,2
87,7
9152
,927
,780
50,4
80,0
4952
,007
,762
58,3
94,7
1963
,890
,717
64,4
51,2
9375
,961
,739
77,4
58,0
5477
,390
,312
Publ
ic F
acili
ties
7,15
6,66
65,
830,
285
6,37
5,79
46,
405,
783
6,98
7,55
87,
303,
362
6,14
5,35
65,
949,
941
5,97
8,76
25,
717,
363
Publ
ic P
arki
ng97
7,41
44,
560
705
La
ndfil
l7,
183,
611
6,84
5,32
97,
064,
989
7,21
1,86
47,
050,
937
7,06
0,34
27,
028,
050
7,17
3,60
37,
217,
580
7,06
2,42
6Ri
ght o
f Way
419,
676
392,
466
520,
812
475,
126
495,
490
703,
959
656,
344
682,
221
773,
172
759,
809
Exte
nded
Sch
ool P
rogr
am2,
338,
243
2,37
9,75
12,
202,
171
2,22
9,89
62,
289,
089
1,90
4,62
02,
060,
463
2,12
6,10
21,
500,
645
183,
657
Priso
ners
' Acc
ount
Sys
tem
1,52
4,12
71,
619,
626
2,37
2,28
51,
227,
415
1,62
1,11
03,
146,
187
3,16
5,20
6
Enha
nced
911
3,99
9,65
83,
517,
634
4,27
3,10
63,
810,
087
4,12
6,86
14,
429,
699
4,54
2,44
94,
176,
602
4,47
0,17
84,
116,
670
CKY
Net
wor
k51
,798
25,7
3811
1,57
61,
269,
890
815,
110
400,
735
319,
414
498,
913
458,
376
374,
504
Wat
er Q
ualit
y12
,095
,514
12,2
96,4
7613
,119
,524
13,3
41,8
5913
,661
,911
13,5
65,2
0914
,082
,286
14,7
84,0
6415
,343
,166
15,4
44,4
68To
tal B
usin
ess-
Type
Act
iviti
es83
,034
,498
85,8
39,6
4586
,520
,306
87,9
79,6
8295
,443
,490
102,
404,
830
102,
450,
861
111,
353,
185
113,
199,
933
111,
049,
209
Tota
l Prim
ary
Gov
ernm
ent
179,
113,
162
184,
413,
111
185,
361,
301
188,
409,
464
191,
636,
879
197,
836,
055
199,
193,
948
212,
986,
228
234,
996,
870
229,
307,
453
Net
(Exp
ense
)/Rev
enue
Gov
ernm
enta
l Act
iviti
es(3
09,0
96,8
16)
(302
,792
,130
)(3
14,8
32,1
98)
(291
,122
,037
)(3
64,4
62,0
49)
(442
,216
,615
)(4
38,1
23,9
35)
(448
,713
,729
)(4
26,7
41,9
73)
(433
,855
,458
)Bu
sines
s-Ty
pe A
ctiv
ities
10,2
60,7
6418
,094
,991
11,5
29,5
0217
,398
,836
15,5
40,2
4715
,566
,610
12,7
91,3
1214
,940
,101
13,2
86,9
226,
660,
599
Tota
l Prim
ary
Gov
ernm
ent
(298
,836
,052
)(2
84,6
97,1
39)
(303
,302
,696
)(2
73,7
23,2
01)
(348
,921
,802
)(4
26,6
50,0
05)
(425
,332
,623
)(4
33,7
73,6
28)
(413
,455
,051
)(4
27,1
94,8
59)
Gen
eral
Rev
enue
s and
Oth
er C
hang
es in
Net
Pos
ition
Gov
ernm
enta
l Act
iviti
es:
Prop
erty
Tax
es52
,860
,840
53,5
97,3
1154
,759
,199
55,2
41,8
3756
,751
,090
58,6
36,8
4362
,072
,333
64,5
73,9
4966
,619
,933
68,3
65,9
06Li
cens
es a
nd P
erm
its23
0,58
0,20
123
8,92
4,15
824
8,27
1,27
026
5,59
6,25
327
5,53
9,49
028
8,77
1,66
130
4,62
5,55
330
3,56
2,88
730
4,49
3,27
432
0,96
6,28
6G
rant
s & C
ontri
butio
ns N
ot R
estri
cted
to S
peci
fic P
rogr
ams:
Com
mun
ity D
evel
opm
ent B
lock
Gra
nt2,
171,
901
2,17
6,03
52,
009,
120
1,71
9,37
28,
018,
438
1,15
4,74
41,
951,
474
3,35
2,87
12,
433,
102
2,07
9,74
8In
com
e on
Inve
stmen
ts58
9,96
7(5
09,8
90)
263,
242
1,94
1,28
21,
341,
333
602,
208
1,02
9,38
52,
733,
373
1,97
4,06
1(2
76,8
37)
Sale
of A
sset
s31
1,25
928
3,40
641
3,37
91,
144,
379
149,
226
421,
745
Tran
sfer
s(3
46,5
07)
(1,1
06,5
85)
(871
,447
)(2
,546
)(3
13,1
02)
1,21
0,30
2(8
00,0
72)
564,
725
(349
,759
)(1
60,1
56)
Tota
l Gov
ernm
enta
l Act
iviti
es28
6,16
7,66
129
3,36
4,43
530
4,43
1,38
432
4,49
6,19
834
1,75
0,62
835
1,52
0,13
736
9,02
7,89
937
5,20
9,55
037
5,17
0,61
139
0,97
4,94
7Bu
sines
s-Ty
pe A
ctiv
ities
:In
com
e on
Inve
stmen
ts1,
029,
866
(215
,314
)1,
021,
558
(604
,800
)54
7,36
615
9,73
796
2,75
51,
730,
075
1,65
2,47
977
5,06
8Sa
le o
f Ass
ets
7,82
410
,168
53
6,90
5
28,6
41
19
,254
Tran
sfer
s34
6,50
7(1
1,90
2,98
1)87
1,44
72,
546
313,
102
(1,2
10,3
02)
800,
072
(564
,725
)34
9,75
916
0,15
6To
tal B
usin
ess-
Type
act
iviti
es1,
384,
197
(12,
118,
295)
1,89
3,00
5(5
92,0
86)
860,
468
(513
,660
)1,
791,
468
1,18
4,60
42,
002,
238
935,
224
Tota
l Prim
ary
Gov
ernm
ent
287,
551,
858
281,
246,
140
306,
324,
389
323,
904,
112
342,
611,
096
351,
006,
477
370,
819,
367
376,
394,
154
377,
172,
849
391,
910,
171
Cha
nge
in N
et P
ositi
onG
over
nmen
tal a
ctiv
ities
(22,
929,
155)
(9,4
27,6
95)
(10,
400,
814)
33,3
74,1
61(2
2,71
1,42
1)(9
0,69
6,47
8)(6
9,09
6,03
6)(7
3,50
4,17
9)(5
1,57
1,36
2)(4
2,88
0,51
1)Bu
sines
s-ty
pe a
ctiv
ities
11,6
44,9
615,
976,
696
13,4
22,5
0716
,806
,750
16,4
00,7
1515
,052
,950
14,5
82,7
8016
,124
,705
15,2
89,1
607,
595,
823
Prio
r Per
iod
Adj
ustm
ent -
Gov
ernm
ent A
ctiv
ities
(1
,548
,751
)(5
41,1
57)
(309
,138
,212
)1,
743,
623
(166
,283
)(2
96,0
37,1
83)
(4,2
91,4
73)
(2,1
89,5
93)
(181
,132
)
Prio
r Per
iod
Adj
ustm
ent-B
usin
ess-
Type
Act
iviti
es37
8,17
5
(17,
074,
699)
(6
90,5
96)
(8,2
15,6
42)
(31,
421,
064)
13
4,34
7
3,96
8,27
9
To
tal P
rimar
y G
over
nmen
t($
11,2
84,1
94)
($4,
621,
575)
$2,4
80,5
36($
276,
032,
000)
($5,
257,
679)
($75
,809
,811
)($
358,
766,
081)
($93
,092
,011
)($
38,3
37,4
48)
($31
,497
,541
)*P
lann
ing,
Pre
serv
atio
n, &
Dev
elop
men
t was
add
ed in
FY
13 a
nd w
as p
revi
ously
incl
uded
with
Adm
inist
ratio
n.**
In F
Y16
the
Chie
f Inf
orm
atio
n O
ffice
r was
cha
nged
to th
e D
epar
tmen
t of I
nfor
mat
ion
Tech
nolo
gy.
In a
dditi
on, t
he D
ivisi
on o
f Sec
urity
was
mov
ed fr
om th
e D
epar
tmen
t of G
ener
al S
ervi
ces t
o th
e D
epar
tmen
t of P
ublic
Saf
ety.
170
(Acc
rual
Bas
is of
Acc
ount
ing)
Sour
ce:
Dep
artm
ent o
f Fin
ance
, Lex
ingt
on-F
ayet
te U
rban
Cou
nty
Gov
ernm
ent
LEX
ING
TON
-FA
YET
TE U
RBA
N C
OU
NTY
GO
VER
NM
ENT
CHA
NG
ES IN
NET
PO
SITI
ON
LAST
TEN
FIS
CAL
YEA
RS (c
ontd
.)
***I
n FY
20 th
e D
epar
tmen
t of P
lann
ing,
Pre
serv
atio
n &
Dev
elop
men
t was
reor
gani
zed.
The
Div
ision
of P
lann
ing
mov
ed to
Chi
ef D
evel
opm
ent O
ffice
r. T
he D
ivisi
ons o
f Wat
er Q
ualit
y, B
uild
ing
Insp
ectio
n an
d En
gine
erin
g m
oved
to E
nviro
nmen
tal Q
ualit
y &
Pub
lic W
orks
. Th
e D
ivisi
ons o
f Hist
oric
Pre
serv
atio
n an
d Pu
rcha
se
of D
evel
o pm
ent R
ight
s mov
ed to
Adm
inist
rativ
e Se
rvic
es.
In a
dditi
on th
e D
ivisi
on o
f Lex
call
was
cre
ated
in A
dmin
istra
tive
Serv
ices
. The
Div
ision
of C
ode
Enfo
rcem
ent m
oved
to P
ublic
Saf
ety.
Th
e D
ivisi
on o
f DEE
M/E
nhan
ced
911
was
split
into
two
sepa
rate
Div
sions
, Em
erge
ncy
Man
agem
ent a
nd E
nhan
ced
911.
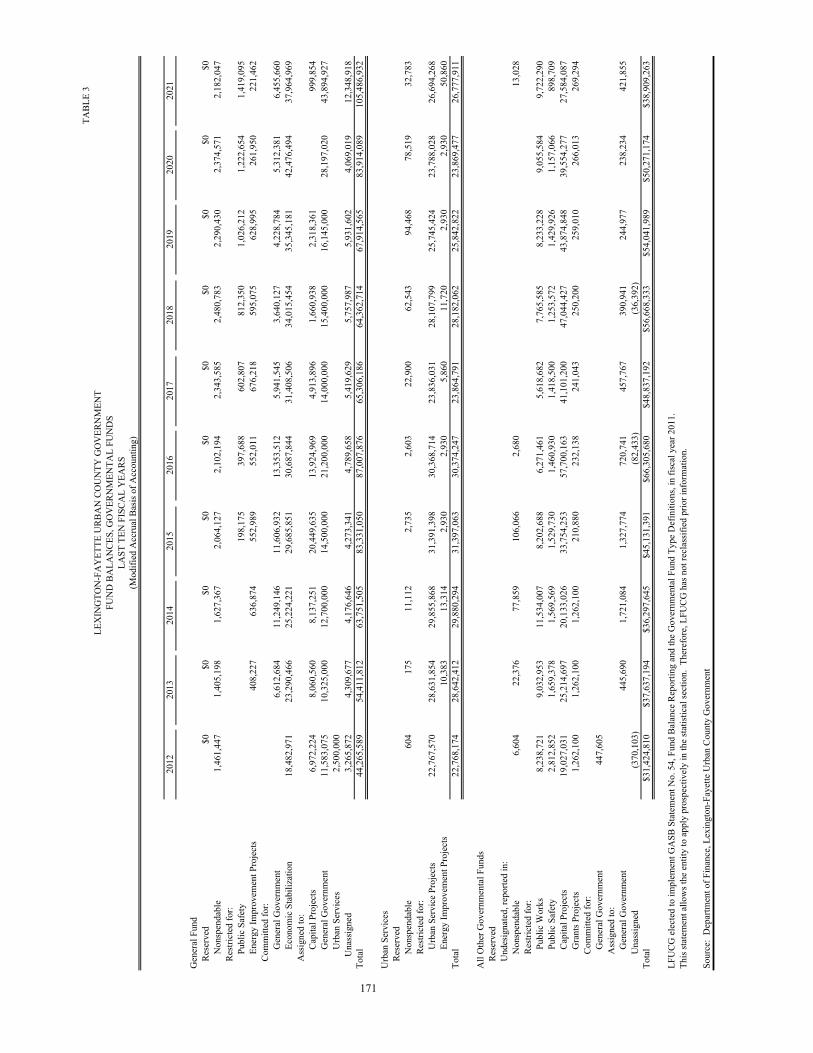
TABL
E 3
2012
2013
2014
2015
2016
2017
2018
2019
2020
2021
Gen
eral
Fun
dRe
serv
ed$0
$0$0
$0$0
$0$0
$0$0
$0N
onsp
enda
ble
1,46
1,44
71,
405,
198
1,62
7,36
72,
064,
127
2,10
2,19
42,
343,
585
2,48
0,78
32,
290,
430
2,37
4,57
12,
182,
047
Restr
icte
d fo
r:Pu
blic
Saf
ety
198,
175
397,
688
602,
807
812,
350
1,02
6,21
21,
222,
654
1,41
9,09
5En
ergy
Impr
ovem
ent P
roje
cts
408,
227
636,
874
552,
989
552,
011
676,
218
595,
075
628,
995
261,
950
221,
462
Com
mitt
ed fo
r: G
ener
al G
over
nmen
t6,
612,
684
11,2
49,1
4611
,606
,932
13,3
53,5
125,
941,
545
3,64
0,12
74,
228,
784
5,31
2,38
1
6,
455,
660
Eco
nom
ic S
tabi
lizat
ion
18,4
82,9
7123
,290
,466
25,2
24,2
2129
,685
,851
30,6
87,8
4431
,408
,506
34,0
15,4
5435
,345
,181
42,4
76,4
9437
,964
,969
Ass
igne
d to
: C
apita
l Pro
ject
s6,
972,
224
8,06
0,56
08,
137,
251
20,4
49,6
3513
,924
,969
4,
913,
896
1,66
0,93
8
2,
318,
361
999,
854
G
ener
al G
over
nmen
t11
,583
,075
10,3
25,0
0012
,700
,000
14,5
00,0
0021
,200
,000
14
,000
,000
15
,400
,000
16
,145
,000
28
,197
,020
43
,894
,927
U
rban
Ser
vice
s2,
500,
000
Una
ssig
ned
3,26
5,87
24,
309,
677
4,17
6,64
64,
273,
341
4,78
9,65
85,
419,
629
5,75
7,98
75,
931,
602
4,06
9,01
912
,348
,918
Tota
l44
,265
,589
54,4
11,8
1263
,751
,505
83,3
31,0
5087
,007
,876
65,3
06,1
8664
,362
,714
67,9
14,5
6583
,914
,089
105,
486,
932
Urb
an S
ervi
ces
Rese
rve d
Non
spen
dabl
e60
417
511
,112
2,73
52,
603
22,9
0062
,543
94,4
6878
,519
32,7
83Re
stric
ted
for:
Urb
an S
ervi
ce P
roje
cts
22,7
67,5
7028
,631
,854
29,8
55,8
6831
,391
,398
30,3
68,7
1423
,836
,031
28,1
07,7
9925
,745
,424
23,7
88,0
2826
,694
,268
Ene
rgy
Impr
ovem
ent P
roje
cts
10,3
8313
,314
2,93
02,
930
5,86
011
,720
2,93
02,
930
50,8
60To
tal
22,7
68,1
7428
,642
,412
29,8
80,2
9431
,397
,063
30,3
74,2
4723
,864
,791
28,1
82,0
6225
,842
,822
23,8
69,4
7726
,777
,911
All
Oth
er G
over
nmen
tal F
unds
Rese
rved
Und
esig
nate
d, re
porte
d in
:N
onsp
enda
ble
6,60
422
,376
77,8
5910
6,06
62,
680
13,0
28
Restr
icte
d fo
r: P
ublic
Wor
ks8,
238,
721
9,03
2,95
311
,534
,007
8,20
2,68
86,
271,
461
5,61
8,68
27,
765,
585
8,23
3,22
89,
055,
584
9,72
2,29
0 P
ublic
Saf
ety
2,81
2,85
21,
659,
378
1,56
9,56
91,
529,
730
1,46
0,93
01,
418,
500
1,25
3,57
21,
429,
926
1,15
7,06
689
8,70
9 C
apita
l Pro
ject
s 19
,027
,031
25,2
14,6
9720
,133
,026
33,7
54,2
5357
,700
,163
41,1
01,2
0047
,044
,427
43,8
74,8
4839
,554
,277
27,5
84,0
87 G
rant
s Pro
ject
s1,
262,
100
1,26
2,10
01,
262,
100
210,
880
232,
138
241,
043
250,
200
259,
010
266,
013
269,
294
Com
mitt
ed fo
r: G
ener
al G
over
nmen
t44
7,60
5A
ssig
ned
to:
Gen
eral
Gov
ernm
ent
445,
690
1,72
1,08
41,
327,
774
720,
741
457,
767
390,
941
244,
977
238,
234
421,
855
Una
ssig
ned
(370
,103
)
(8
2,43
3)
(3
6,39
2)
Tota
l$3
1,42
4,81
0$3
7,63
7,19
4$3
6,29
7,64
5$4
5,13
1,39
1$6
6,30
5,68
0$4
8,83
7,19
2$5
6,66
8,33
3$5
4,04
1,98
9$5
0,27
1,17
4$3
8,90
9,26
3
LFU
CG e
lect
ed to
impl
emen
t GA
SB S
tate
men
t No.
54,
Fun
d Ba
lanc
e Re
porti
ng a
nd th
e G
over
nmen
tal F
und
Type
Def
initi
ons,
in fi
scal
yea
r 201
1.
This
state
men
t allo
ws t
he e
ntity
to a
pply
pro
spec
tivel
y in
the
statis
tical
sect
ion.
The
refo
re, L
FUCG
has
not
recl
assif
ied
prio
r inf
orm
atio
n.
171
Sour
ce:
Dep
artm
ent o
f Fin
ance
, Lex
ingt
on-F
ayet
te U
rban
Cou
nty
Gov
ernm
ent
LEX
ING
TON
-FA
YET
TE U
RBA
N C
OU
NTY
GO
VER
NM
ENT
FUN
D B
ALA
NCE
S, G
OV
ERN
MEN
TAL
FUN
DS
LAST
TEN
FIS
CAL
YEA
RS(M
odifi
ed A
ccru
al B
asis
of A
ccou
ntin
g)
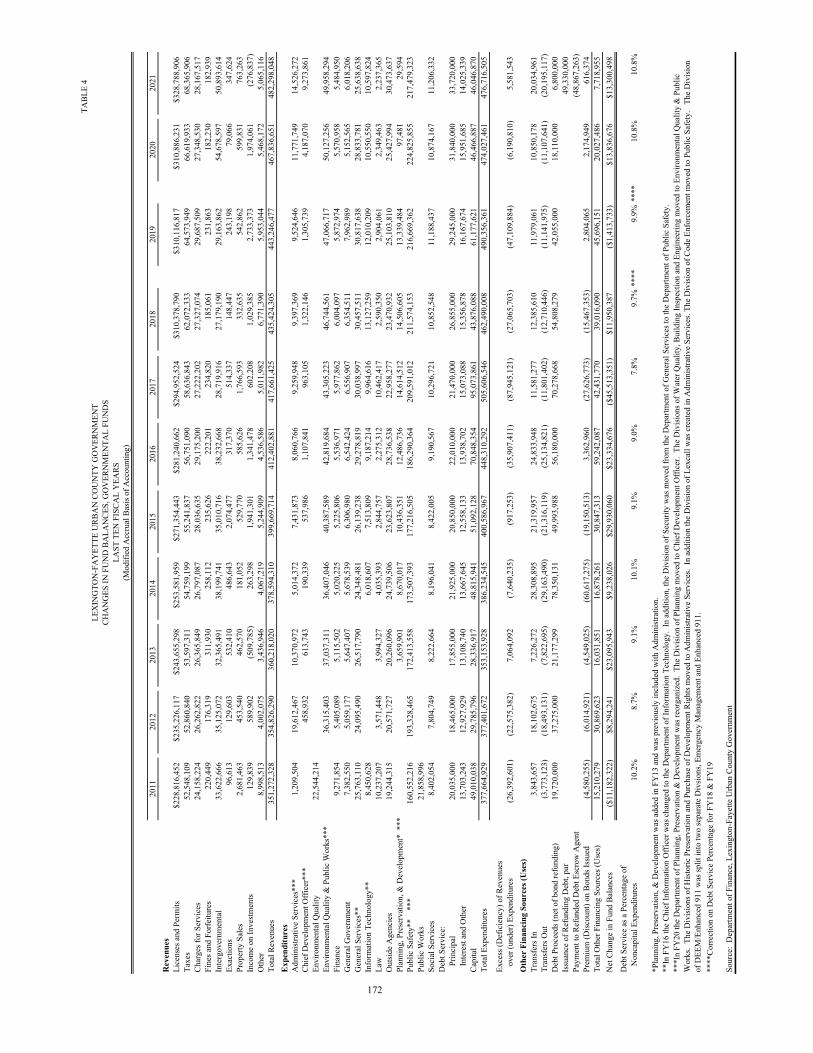
TABL
E 4
2011
2012
2013
2014
2015
2016
2017
2018
2019
2020
2021
Rev
enue
sLi
cens
es a
nd P
erm
its$2
28,8
16,4
52$2
35,2
26,1
17$2
43,6
55,2
98$2
53,5
81,9
59$2
71,3
54,4
43$2
81,2
40,6
62$2
94,9
52,5
24$3
10,3
78,7
90$3
10,1
16,8
17$3
10,8
86,2
31$3
28,7
88,9
06Ta
xes
52,5
48,1
0952
,860
,840
53,5
97,3
1154
,759
,199
55,2
41,8
3756
,751
,090
58,6
36,8
4362
,072
,333
64,5
73,9
4966
,619
,933
68,3
65,9
06Ch
arge
s for
Ser
vice
s24
,158
,224
26,2
62,8
2226
,365
,849
26,7
97,0
8728
,036
,635
29,1
75,2
0027
,222
,202
27,3
27,0
7429
,687
,509
27,3
48,5
3028
,167
,517
Fine
s and
For
feitu
res
220,
449
176,
319
311,
930
258,
112
235,
626
222,
201
234,
820
185,
061
231,
863
182,
230
182,
939
Inte
rgov
ernm
enta
l33
,622
,666
35,1
25,0
7232
,365
,491
38,1
99,7
4135
,010
,716
38,2
32,6
6828
,719
,916
27,1
79,1
9029
,163
,862
54,6
78,5
9750
,893
,614
Exac
tions
96,6
1312
9,60
353
2,41
048
6,64
32,
074,
477
317,
370
514,
337
148,
447
243,
198
79,0
6634
7,62
4Pr
oper
ty S
ales
2,68
1,46
345
3,54
046
2,57
018
1,05
252
9,77
058
5,62
61,
766,
593
332,
635
542,
862
599,
831
763,
263
Inco
me
on In
vestm
ents
129,
839
589,
902
(509
,785
)26
3,29
81,
941,
301
1,34
1,47
860
2,20
81,
029,
385
2,73
3,37
31,
974,
061
(276
,837
)O
ther
8,99
8,51
34,
002,
075
3,43
6,94
64,
067,
219
5,24
4,90
94,
536,
586
5,01
1,98
26,
771,
390
5,95
3,04
45,
468,
172
5,06
5,11
6To
tal R
even
ues
351,
272,
328
354,
826,
290
360,
218,
020
378,
594,
310
399,
669,
714
412,
402,
881
417,
661,
425
435,
424,
305
443,
246,
477
467,
836,
651
482,
298,
048
Expe
nditu
res
Adm
inist
rativ
e Se
rvic
es**
*1,
209,
504
19,6
12,4
6710
,370
,972
5,01
4,37
27,
431,
873
8,06
0,76
69,
259,
948
9,39
7,36
99,
524,
646
11,7
71,7
4914
,526
,272
Chie
f Dev
elop
men
t Offi
cer*
**45
8,93
261
3,74
319
0,33
953
7,98
61,
107,
841
963,
105
1,32
2,14
61,
305,
739
4,18
7,07
09,
273,
861
Envi
ronm
enta
l Qua
lity
22,5
44,2
14En
viro
nmen
tal Q
ualit
y &
Pub
lic W
orks
***
36,3
15,4
0337
,037
,311
36,4
07,0
4640
,387
,589
42,8
19,6
8443
,305
,223
46,7
44,5
6147
,066
,717
50,1
27,2
5649
,958
,294
Fina
nce
9,27
1,85
45,
405,
089
5,11
5,50
25,
020,
225
5,22
5,80
65,
536,
971
5,97
7,86
26,
004,
097
5,87
2,97
45,
570,
958
5,48
4,95
0G
ener
al G
over
nmen
t7,
382,
550
5,05
9,17
75,
647,
407
5,67
8,53
96,
306,
980
6,54
2,42
46,
556,
907
6,35
4,51
17,
962,
989
5,15
2,56
56,
018,
206
Gen
eral
Ser
vice
s**
25,7
63,1
1024
,095
,490
26,5
17,7
9024
,348
,481
26,1
39,2
3829
,278
,819
30,0
38,9
9730
,457
,511
30,8
17,6
3828
,833
,781
25,6
38,6
38In
form
atio
n Te
chno
logy
**8,
450,
628
6,01
8,60
77,
513,
809
9,18
7,21
49,
964,
616
13,1
27,2
5912
,010
,209
10,5
50,5
5010
,597
,824
Law
10,2
37,2
073,
571,
448
3,99
4,32
74,
035,
393
2,84
4,75
72,
275,
312
10,4
62,4
172,
590,
350
2,90
4,06
12,
349,
463
2,23
7,36
5O
utsid
e A
genc
ies
19,2
44,3
1520
,571
,727
20,2
60,0
9624
,739
,506
23,6
23,8
0728
,736
,538
22,9
58,2
7723
,470
,932
25,1
03,8
1025
,427
,994
30,4
73,6
37Pl
anni
ng, P
rese
rvat
ion,
& D
evel
opm
ent*
***
3,65
9,90
18,
670,
017
10,4
36,3
5112
,486
,736
14,6
14,5
1214
,506
,605
13,3
39,4
8497
,481
29,5
94Pu
blic
Saf
ety*
*
***
160,
552,
216
193,
328,
465
172,
413,
558
173,
507,
393
177,
216,
505
186,
290,
364
209,
591,
012
211,
574,
153
216,
669,
362
224,
825,
855
217,
479,
323
Publ
ic W
orks
21,8
58,9
96So
cial
Ser
vice
s8,
402,
054
7,80
4,74
98,
222,
664
8,19
6,04
18,
422,
005
9,19
0,56
710
,296
,721
10,8
52,5
4811
,188
,437
10,8
74,1
6711
,206
,332
Deb
t Ser
vice
:Pr
inci
pal
20,0
35,0
0018
,465
,000
17,8
55,0
0021
,925
,000
20,8
50,0
0022
,010
,000
21,4
70,0
0026
,855
,000
29,2
45,0
0031
,840
,000
33,7
20,0
00In
tere
st an
d O
ther
13,7
03,2
4312
,927
,929
13,1
08,7
4013
,667
,645
12,5
58,1
3313
,938
,702
15,0
73,0
8815
,356
,878
16,1
67,6
7415
,951
,685
14,0
25,3
39Ca
pita
l49
,010
,038
29,7
85,7
9628
,336
,917
48,8
15,9
4151
,092
,128
70,8
48,3
5495
,073
,861
43,8
76,0
8861
,177
,621
46,4
66,8
8746
,046
,870
Tota
l Exp
endi
ture
s37
7,66
4,92
937
7,40
1,67
235
3,15
3,92
838
6,23
4,54
540
0,58
6,96
744
8,31
0,29
250
5,60
6,54
646
2,49
0,00
849
0,35
6,36
147
4,02
7,46
147
6,71
6,50
5
Exce
ss (D
efic
ienc
y) o
f Rev
enue
sov
er (u
nder
) Exp
endi
ture
s(2
6,39
2,60
1)(2
2,57
5,38
2)7,
064,
092
(7,6
40,2
35)
(917
,253
)(3
5,90
7,41
1)(8
7,94
5,12
1)(2
7,06
5,70
3)(4
7,10
9,88
4)(6
,190
,810
)5,
581,
543
Oth
er F
inan
cing
Sou
rces
(Use
s)Tr
ansf
ers I
n3,
843,
657
18,1
02,6
757,
226,
272
28,3
08,8
9521
,319
,957
24,8
33,9
4811
,581
,277
12,3
85,6
1011
,979
,061
10,8
50,1
7820
,034
,961
Tran
sfer
s Out
(3,7
73,1
23)
(18,
493,
131)
(7,8
22,6
95)
(29,
163,
490)
(21,
316,
119)
(25,
134,
821)
(11,
801,
402)
(12,
710,
446)
(11,
141,
975)
(11,
107,
641)
(20,
195,
117)
Deb
t Pro
ceed
s (ne
t of b
ond
refu
ndin
g)19
,720
,000
37,2
75,0
0021
,177
,299
78,3
50,1
3149
,993
,988
56,1
80,0
0070
,278
,668
54,8
08,2
7942
,055
,000
18,1
10,0
006,
800,
000
Issu
ance
of R
efun
ding
Deb
t, pa
r49
,330
,000
Paym
ent t
o Re
fund
ed D
ebt E
scro
w A
gent
(48,
867,
263)
Prem
ium
(Disc
ount
) on
Bond
s Iss
ued
(4,5
80,2
55)
(6,0
14,9
21)
(4,5
49,0
25)
(60,
617,
275)
(19,
150,
513)
3,36
2,96
0(2
7,62
6,77
3)(1
5,46
7,35
3)2,
804,
065
2,17
4,94
961
6,37
4To
tal O
ther
Fin
anci
ng S
ourc
es (U
ses)
15,2
10,2
7930
,869
,623
16,0
31,8
5116
,878
,261
30,8
47,3
1359
,242
,087
42,4
31,7
7039
,016
,090
45,6
96,1
5120
,027
,486
7,71
8,95
5N
et C
hang
e in
Fun
d Ba
lanc
es($
11,1
82,3
22)
$8,2
94,2
41$2
3,09
5,94
3$9
,238
,026
$29,
930,
060
$23,
334,
676
($45
,513
,351
)$1
1,95
0,38
7($
1,41
3,73
3)$1
3,83
6,67
6$1
3,30
0,49
8
Deb
t Ser
vice
as a
Per
cent
age
of
Non
capi
tal E
xpen
ditu
res
10.2
%8.
7%9.
1%10
.1%
9.1%
9.0%
7.8%
9.7%
****
9.9%
****
10.8
%10
.8%
*Pla
nnin
g, P
rese
rvat
ion,
& D
evel
opm
ent w
as a
dded
in F
Y13
and
was
pre
viou
sly in
clud
ed w
ith A
dmin
istra
tion.
**In
FY
16 th
e Ch
ief I
nfor
mat
ion
Offi
cer w
as c
hang
ed to
the
Dep
artm
ent o
f Inf
orm
atio
n Te
chno
logy
. In
add
ition
, the
Div
ision
of S
ecur
ity w
as m
oved
from
the
Dep
artm
ent o
f Gen
eral
Ser
vice
s to
the
Dep
artm
ent o
f Pub
lic S
afet
y.
****
Corre
ctio
n on
Deb
t Ser
vice
Per
cent
age
for F
Y18
& F
Y19
172
Sour
ce:
Dep
artm
ent o
f Fin
ance
, Lex
ingt
on-F
ayet
te U
rban
Cou
nty
Gov
ernm
ent
LEX
ING
TON
-FA
YET
TE U
RBA
N C
OU
NTY
GO
VER
NM
ENT
CHA
NG
ES IN
FU
ND
BA
LAN
CES,
GO
VER
NM
ENTA
L FU
ND
SLA
ST T
EN F
ISCA
L Y
EARS
(Mod
ified
Acc
rual
Bas
is of
Acc
ount
ing)
***I
n FY
20 th
e D
epar
tmen
t of P
lann
ing,
Pre
serv
atio
n &
Dev
elop
men
t was
reor
gani
zed.
The
Div
ision
of P
lann
ing
mov
ed to
Chi
ef D
evel
opm
ent O
ffice
r. T
he D
ivisi
ons o
f Wat
er Q
ualit
y, B
uild
ing
Insp
ectio
n an
d En
gine
erin
g m
oved
to E
nviro
nmen
tal Q
ualit
y &
Pub
lic
Wor
ks.
The
Div
ision
s of H
istor
ic P
rese
rvat
ion
and
Purc
hase
of D
evel
opm
ent R
ight
s mov
ed to
Adm
inist
rativ
e Se
rvic
es.
In a
dditi
on th
e D
ivisi
on o
f Lex
call
was
cre
ated
in A
dmin
istra
tive
Serv
ices
. The
Div
ision
of C
ode
Enfo
rcem
ent m
oved
to P
ublic
Saf
ety.
Th
e D
ivisi
on
of D
EEM
/Enh
ance
d 91
1 w
as sp
lit in
to tw
o se
para
te D
ivsio
ns, E
mer
genc
y M
anag
emen
t and
Enh
ance
d 91
1.
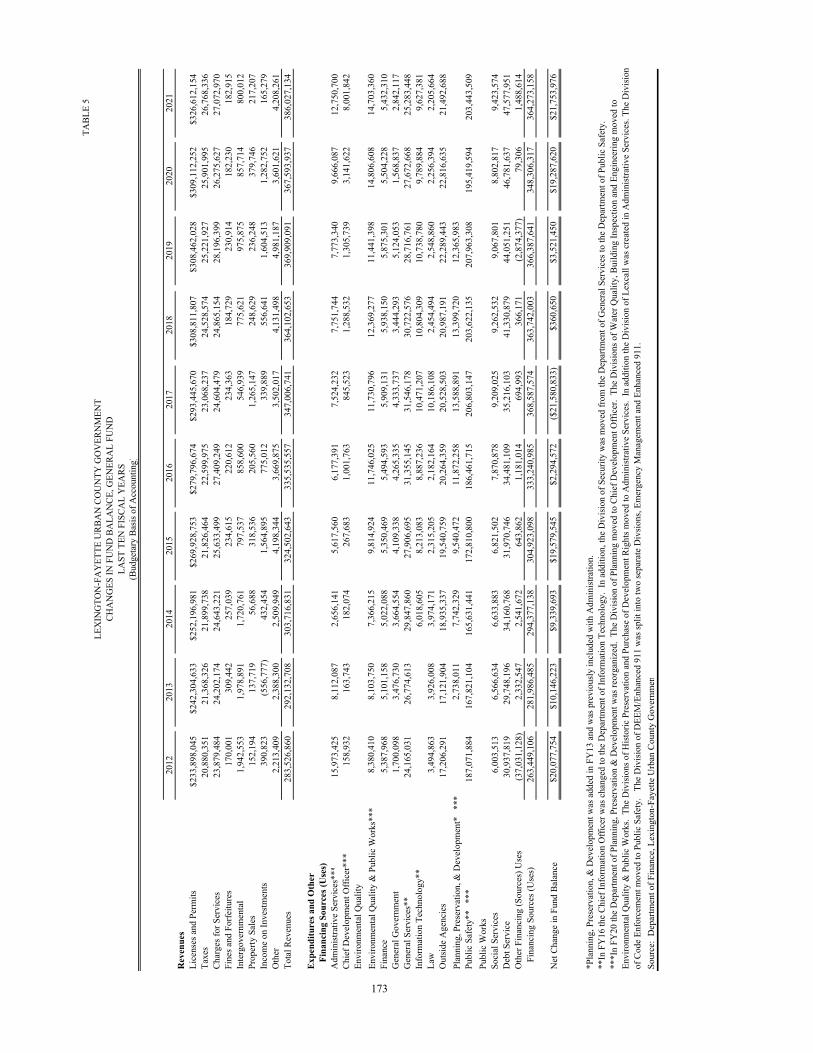
TABL
E 5
2012
2013
2014
2015
2016
2017
2018
2019
2020
2021
Rev
enue
sLi
cens
es a
nd P
erm
its$2
33,8
98,0
45$2
42,3
04,6
33$2
52,1
96,9
81$2
69,9
28,7
53$2
79,7
96,6
74$2
93,4
45,6
70$3
08,8
11,8
07$3
08,4
62,0
28$3
09,1
12,2
52$3
26,6
12,1
54Ta
xes
20,8
80,3
5121
,368
,326
21,8
99,7
3821
,826
,464
22,5
99,9
7523
,068
,237
24,5
28,5
7425
,221
,927
25,9
01,9
9526
,768
,336
Char
ges f
or S
ervi
ces
23,8
79,4
8424
,202
,174
24,6
43,2
2125
,633
,499
27,4
09,2
4924
,604
,479
24,8
65,1
5428
,196
,399
26,2
75,6
2727
,072
,970
Fine
s and
For
feitu
res
170,
001
309,
442
257,
039
234,
615
220,
612
234,
363
184,
729
230,
914
182,
230
182,
915
Inte
rgov
ernm
enta
l1,
942,
553
1,97
8,89
11,
720,
761
797,
537
858,
600
546,
939
775,
621
975,
875
857,
714
800,
012
Prop
erty
Sal
es15
2,19
413
7,71
956
,688
318,
536
205,
560
1,26
5,14
724
8,62
923
6,24
837
9,74
621
7,20
7In
com
e on
Inve
stmen
ts39
0,82
3(5
56,7
77)
432,
454
1,56
4,89
577
5,01
233
9,88
955
6,64
11,
604,
513
1,28
2,75
216
5,27
9O
ther
2,21
3,40
92,
388,
300
2,50
9,94
94,
198,
344
3,66
9,87
53,
502,
017
4,13
1,49
84,
981,
187
3,60
1,62
14,
208,
261
Tota
l Rev
enue
s28
3,52
6,86
029
2,13
2,70
830
3,71
6,83
132
4,50
2,64
333
5,53
5,55
734
7,00
6,74
136
4,10
2,65
336
9,90
9,09
136
7,59
3,93
738
6,02
7,13
4
Expe
nditu
res a
nd O
ther
Fina
ncin
g So
urce
s (U
ses)
Adm
inist
rativ
e Se
rvic
es**
*15
,973
,425
8,11
2,08
72,
656,
141
5,61
7,56
06,
177,
391
7,52
4,23
27,
751,
744
7,77
3,34
09,
666,
087
12,7
50,7
00Ch
ief D
evel
opm
ent O
ffice
r***
158,
932
163,
743
182,
074
267,
683
1,00
1,76
384
5,52
31,
288,
532
1,30
5,73
93,
141,
622
8,00
1,84
2En
viro
nmen
tal Q
ualit
yEn
viro
nmen
tal Q
ualit
y &
Pub
lic W
orks
***
8,38
0,41
08,
103,
750
7,36
6,21
59,
814,
924
11,7
46,0
2511
,730
,796
12,3
69,2
7711
,441
,398
14,8
06,6
0814
,703
,360
Fina
nce
5,38
7,96
85,
101,
158
5,02
2,08
85,
350,
469
5,49
4,59
35,
909,
131
5,93
8,15
05,
875,
301
5,50
4,22
85,
432,
310
Gen
eral
Gov
ernm
ent
1,70
0,09
83,
476,
730
3,66
4,55
44,
109,
338
4,26
5,33
54,
333,
737
3,44
4,29
35,
124,
053
1,56
8,83
72,
842,
117
Gen
eral
Ser
vice
s**
24,1
65,0
3126
,774
,613
29,8
47,8
6027
,906
,695
31,3
55,1
4531
,546
,178
30,7
22,5
7628
,716
,761
27,6
72,6
6825
,283
,448
Info
rmat
ion
Tech
nolo
gy**
6,01
8,60
58,
213,
083
8,88
7,23
610
,471
,207
10,8
04,3
0910
,738
,780
9,78
9,88
49,
627,
381
Law
3,49
4,86
33,
926,
008
3,97
4,17
12,
315,
205
2,18
2,16
410
,186
,108
2,45
4,49
42,
548,
860
2,25
6,39
42,
205,
664
Out
side
Age
ncie
s17
,206
,291
17,1
21,9
0418
,935
,337
19,5
40,7
5920
,264
,359
20,5
28,5
0320
,987
,191
22,2
89,4
4322
,816
,635
21,4
92,6
88Pl
anni
ng, P
rese
rvat
ion,
& D
evel
opm
ent*
**
*2,
738,
011
7,74
2,32
99,
540,
472
11,8
72,2
5813
,588
,891
13,3
99,7
2012
,365
,983
Publ
ic S
afet
y**
***
187,
071,
884
167,
821,
104
165,
631,
441
172,
810,
800
186,
461,
715
206,
803,
147
203,
622,
135
207,
963,
308
195,
419,
594
203,
443,
509
Publ
ic W
orks
Soci
al S
ervi
ces
6,00
3,51
36,
566,
634
6,63
3,88
36,
821,
502
7,87
0,87
89,
209,
025
9,26
2,53
29,
067,
801
8,80
2,81
79,
423,
574
Deb
t Ser
vice
30,9
37,8
1929
,748
,196
34,1
60,7
6831
,970
,746
34,4
81,1
0935
,216
,103
41,3
30,8
7944
,051
,251
46,7
81,6
3747
,577
,951
Oth
er F
inan
cing
(Sou
rces
) Use
s(3
7,03
1,12
8)2,
332,
547
2,54
1,67
264
3,86
21,
181,
014
694,
993
366,
171
(2,8
74,3
77)
79
,306
1,
488,
614
Fi
nanc
ing
Sour
ces (
Use
s)26
3,44
9,10
628
1,98
6,48
529
4,37
7,13
830
4,92
3,09
833
3,24
0,98
536
8,58
7,57
436
3,74
2,00
336
6,38
7,64
134
8,30
6,31
736
4,27
3,15
8
Net
Cha
nge
in F
und
Bala
nce
$20,
077,
754
$10,
146,
223
$9,3
39,6
93$1
9,57
9,54
5$2
,294
,572
($21
,580
,833
)$3
60,6
50$3
,521
,450
$19,
287,
620
$21,
753,
976
*Pla
nnin
g, P
rese
rvat
ion,
& D
evel
opm
ent w
as a
dded
in F
Y13
and
was
pre
viou
sly in
clud
ed w
ith A
dmin
istra
tion.
**In
FY
16 th
e Ch
ief I
nfor
mat
ion
Offi
cer w
as c
hang
ed to
the
Dep
artm
ent o
f Inf
orm
atio
n Te
chno
logy
. In
add
ition
, the
Div
ision
of S
ecur
ity w
as m
oved
from
the
Dep
artm
ent o
f Gen
eral
Ser
vice
s to
the
Dep
artm
ent o
f Pub
lic S
afet
y.
173
Sour
ce:
Dep
artm
ent o
f Fin
ance
, Lex
ingt
on-F
ayet
te U
rban
Cou
nty
Gov
ernm
en
LEX
ING
TON
-FA
YET
TE U
RBA
N C
OU
NTY
GO
VER
NM
ENT
CHA
NG
ES IN
FU
ND
BA
LAN
CE, G
ENER
AL
FUN
DLA
ST T
EN F
ISCA
L Y
EARS
(Bud
geta
ry B
asis
of A
ccou
ntin
g)
***I
n FY
20 th
e D
epar
tmen
t of P
lann
ing,
Pre
serv
atio
n &
Dev
elop
men
t was
reor
gani
zed.
The
Div
ision
of P
lann
ing
mov
ed to
Chi
ef D
evel
opm
ent O
ffice
r. T
he D
ivisi
ons o
f Wat
er Q
ualit
y, B
uild
ing
Insp
ectio
n an
d En
gine
erin
g m
oved
to
Envi
ronm
enta
l Qua
lity
& P
ublic
Wor
ks.
The
Div
ision
s of H
istor
ic P
rese
rvat
ion
and
Purc
hase
of D
evel
opm
ent R
ight
s mov
ed to
Adm
inist
rativ
e Se
rvic
es.
In a
dditi
on th
e D
ivisi
on o
f Lex
call
was
cre
ated
in A
dmin
istra
tive
Serv
ices
. The
Div
ision
of
Cod
e En
forc
emen
t mov
ed to
Pub
lic S
afet
y.
The
Div
ision
of D
EEM
/Enh
ance
d 91
1 w
as sp
lit in
to tw
o se
para
te D
ivsio
ns, E
mer
genc
y M
anag
emen
t and
Enh
ance
d 91
1.
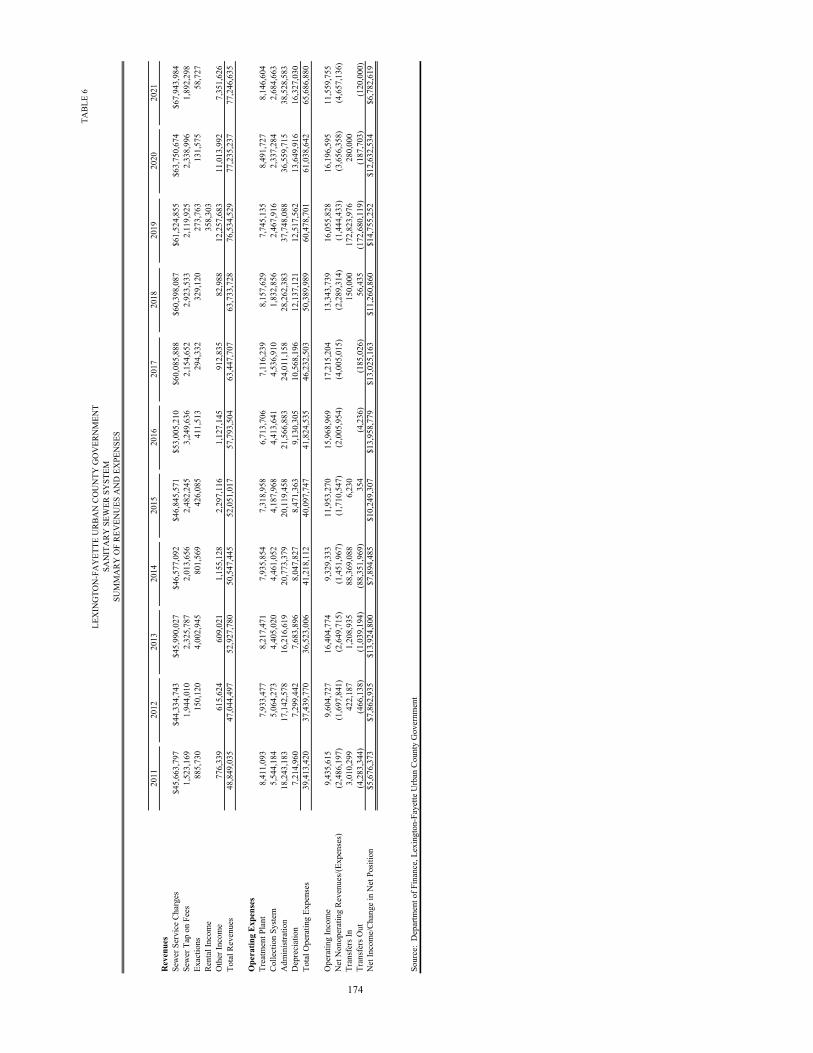
TABL
E 6
2011
2012
2013
2014
2015
2016
2017
2018
2019
2020
2021
Rev
enue
sSe
wer
Ser
vice
Cha
rges
$45,
663,
797
$44,
334,
743
$45,
990,
027
$46,
577,
092
$46,
845,
571
$53,
005,
210
$60,
085,
888
$60,
398,
087
$61,
524,
855
$63,
750,
674
$67,
943,
984
Sew
er T
ap o
n Fe
es1,
523,
169
1,94
4,01
02,
325,
787
2,01
3,65
62,
482,
245
3,24
9,63
62,
154,
652
2,92
3,53
32,
119,
925
2,33
8,99
61,
892,
298
Exac
tions
885,
730
150,
120
4,00
2,94
580
1,56
942
6,08
541
1,51
329
4,33
232
9,12
027
3,76
313
1,57
558
,727
Rent
al In
com
e35
8,30
3
O
ther
Inco
me
776,
339
615,
624
609,
021
1,15
5,12
82,
297,
116
1,12
7,14
591
2,83
582
,988
12,2
57,6
8311
,013
,992
7,35
1,62
6To
tal R
even
ues
48,8
49,0
3547
,044
,497
52,9
27,7
8050
,547
,445
52,0
51,0
1757
,793
,504
63,4
47,7
0763
,733
,728
76,5
34,5
2977
,235
,237
77,2
46,6
35
Ope
ratin
g Ex
pens
e sTr
eatm
ent P
lant
8,41
1,09
37,
933,
477
8,21
7,47
17,
935,
854
7,31
8,95
86,
713,
706
7,11
6,23
98,
157,
629
7,74
5,13
58,
491,
727
8,14
6,60
4Co
llect
ion
Syste
m5,
544,
184
5,06
4,27
34,
405,
020
4,46
1,05
24,
187,
968
4,41
3,64
14,
536,
910
1,83
2,85
62,
467,
916
2,33
7,28
42,
684,
663
Adm
inist
ratio
n18
,243
,183
17,1
42,5
7816
,216
,619
20,7
73,3
7920
,119
,458
21,5
66,8
8324
,011
,158
28,2
62,3
8337
,748
,088
36,5
59,7
1538
,528
,583
Dep
reci
atio
n7,
214,
960
7,29
9,44
27,
683,
896
8,04
7,82
78,
471,
363
9,13
0,30
510
,568
,196
12,1
37,1
2112
,517
,562
13,6
49,9
1616
,327
,030
Tota
l Ope
ratin
g Ex
pens
es39
,413
,420
37,4
39,7
7036
,523
,006
41,2
18,1
1240
,097
,747
41,8
24,5
3546
,232
,503
50,3
89,9
8960
,478
,701
61,0
38,6
4265
,686
,880
Ope
ratin
g In
com
e9,
435,
615
9,60
4,72
716
,404
,774
9,32
9,33
311
,953
,270
15,9
68,9
6917
,215
,204
13,3
43,7
3916
,055
,828
16,1
96,5
9511
,559
,755
Net
Non
oper
atin
g Re
venu
es/(E
xpen
ses)
(2,4
86,1
97)
(1,6
97,8
41)
(2,6
49,7
15)
(1,4
51,9
67)
(1,7
10,5
47)
(2,0
05,9
54)
(4,0
05,0
15)
(2,2
89,3
14)
(1,4
44,4
33)
(3,6
56,3
58)
(4,6
57,1
36)
Tran
sfer
s In
3,01
0,29
942
2,18
71,
208,
935
88,3
69,0
886,
230
150,
000
17
2,82
3,97
6
28
0,00
0
Tran
sfer
s Out
(4,2
83,3
44)
(466
,138
)(1
,039
,194
)(8
8,35
1,96
9)35
4(4
,236
)(1
85,0
26)
56,4
35(1
72,6
80,1
19)
(187
,703
)(1
20,0
00)
Net
Inco
me/
Chan
ge in
Net
Pos
itio n
$5,6
76,3
73$7
,862
,935
$13,
924,
800
$7,8
94,4
85$1
0,24
9,30
7$1
3,95
8,77
9$1
3,02
5,16
3$1
1,26
0,86
0$1
4,75
5,25
2$1
2,63
2,53
4$6
,782
,619
Sour
ce:
Dep
artm
ent o
f Fin
ance
, Lex
ingt
on-F
ayet
te U
rban
Cou
nty
Gov
ernm
ent
LEX
ING
TON
-FA
YET
TE U
RBA
N C
OU
NTY
GO
VER
NM
ENT
SAN
ITA
RY S
EWER
SY
STEM
SUM
MA
RY O
F RE
VEN
UES
AN
D E
XPE
NSE
S
174
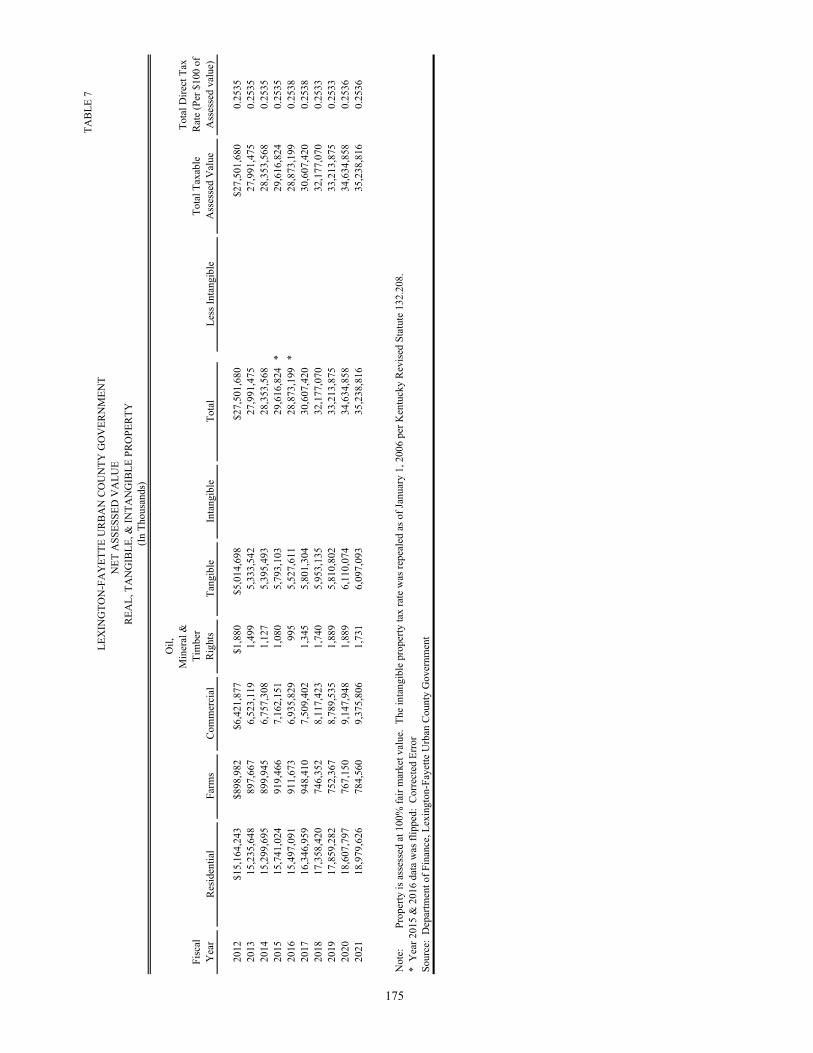
TABL
E 7
Fisc
al
Yea
rRe
siden
tial
Farm
sCo
mm
erci
al
Oil,
M
iner
al &
Ti
mbe
r Ri
ghts
Tang
ible
Inta
ngib
leTo
tal
Less
Inta
ngib
leTo
tal T
axab
le
Ass
esse
d V
alue
Tota
l Dire
ct T
ax
Rate
(Per
$10
0 of
A
sses
sed
valu
e)
2012
$15,
164,
243
$898
,982
$6,4
21,8
77$1
,880
$5,0
14,6
98$2
7,50
1,68
0$2
7,50
1,68
00.
2535
2013
15,2
35,6
4889
7,66
76,
523,
119
1,49
95,
333,
542
27,9
91,4
7527
,991
,475
0.25
3520
1415
,299
,695
899,
945
6,75
7,30
81,
127
5,39
5,49
328
,353
,568
28,3
53,5
680.
2535
2015
15,7
41,0
2491
9,46
67,
162,
151
1,08
05,
793,
103
29,6
16,8
24*
29,6
16,8
240.
2535
2016
15,4
97,0
9191
1,67
36,
935,
829
995
5,52
7,61
128
,873
,199
*28
,873
,199
0.25
3820
1716
,346
,959
948,
410
7,50
9,40
21,
345
5,80
1,30
430
,607
,420
30,6
07,4
200.
2538
2018
17,3
58,4
2074
6,35
28,
117,
423
1,74
05,
953,
135
32,1
77,0
7032
,177
,070
0.25
3320
1917
,859
,282
752,
367
8,78
9,53
51,
889
5,81
0,80
233
,213
,875
33,2
13,8
750.
2533
2020
18,6
07,7
9776
7,15
09,
147,
948
1,88
96,
110,
074
34,6
34,8
5834
,634
,858
0.25
3620
2118
,979
,626
784,
560
9,37
5,80
61,
731
6,09
7,09
335
,238
,816
35,2
38,8
160.
2536
Not
e:*
Yea
r 201
5 &
201
6 da
ta w
as fl
ippe
d: C
orre
cted
Erro
r
175
Prop
erty
is a
sses
sed
at 1
00%
fair
mar
ket v
alue
. Th
e in
tang
ible
pro
perty
tax
rate
was
repe
aled
as o
f Jan
uary
1, 2
006
per K
entu
cky
Revi
sed
Stat
ute
132.
208.
Sour
ce:
Dep
artm
ent o
f Fin
ance
, Lex
ingt
on-F
ayet
te U
rban
Cou
nty
Gov
ernm
ent
LEX
ING
TON
-FA
YET
TE U
RBA
N C
OU
NTY
GO
VER
NM
ENT
NET
ASS
ESSE
D V
ALU
E
REA
L, T
AN
GIB
LE, &
INTA
NG
IBLE
PRO
PERT
Y(In
Tho
usan
ds)
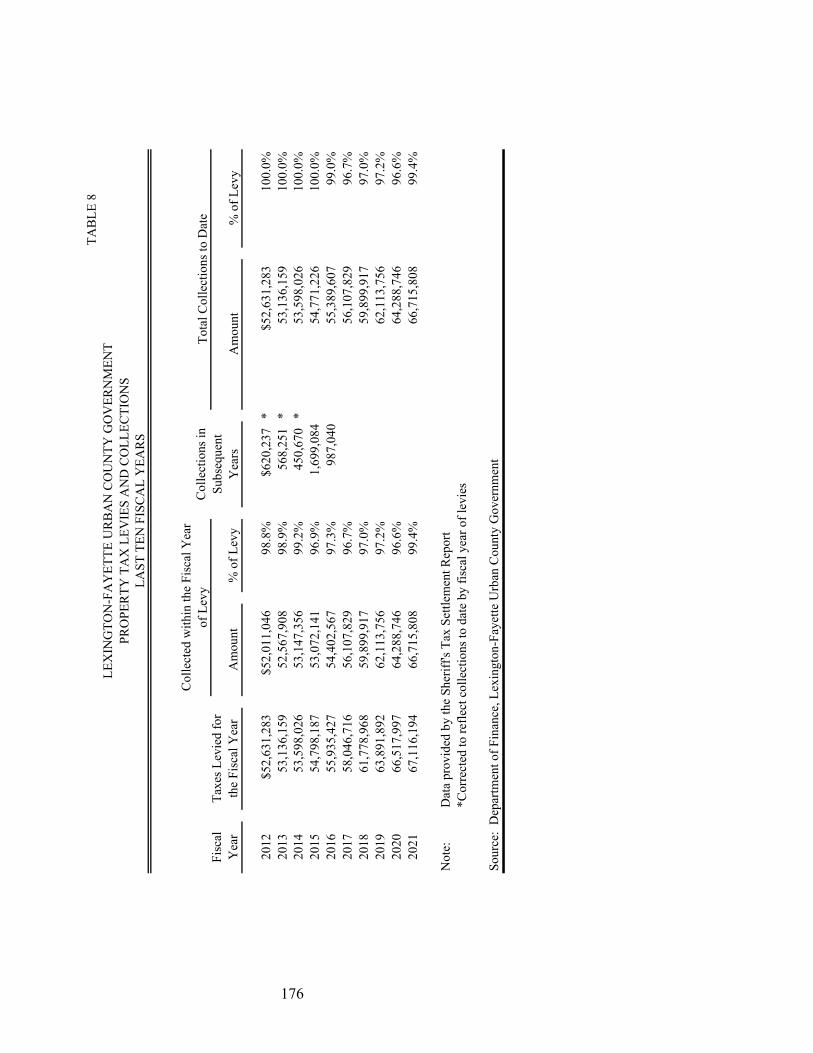
TABL
E 8
Fisc
al
Yea
rTa
xes L
evie
d fo
r th
e Fi
scal
Yea
rA
mou
nt%
of L
evy
Am
ount
% o
f Lev
y
2012
$52,
631,
283
$52,
011,
046
98.8
%$6
20,2
37*
$52,
631,
283
100.
0%20
1353
,136
,159
52,5
67,9
0898
.9%
568,
251
*53
,136
,159
100.
0%20
1453
,598
,026
53,1
47,3
5699
.2%
450,
670
*53
,598
,026
100.
0%20
1554
,798
,187
53,0
72,1
4196
.9%
1,69
9,08
454
,771
,226
100.
0%20
1655
,935
,427
54,4
02,5
6797
.3%
987,
040
55,3
89,6
0799
.0%
2017
58,0
46,7
1656
,107
,829
96.7
%56
,107
,829
96.7
%20
1861
,778
,968
59,8
99,9
1797
.0%
59,8
99,9
1797
.0%
2019
63,8
91,8
9262
,113
,756
97.2
%62
,113
,756
97.2
%20
2066
,517
,997
64,2
88,7
4696
.6%
64,2
88,7
4696
.6%
2021
67,1
16,1
9466
,715
,808
99.4
%66
,715
,808
99.4
%
Not
e:D
ata
prov
ided
by
the
Sher
iff's
Tax
Settl
emen
t Rep
ort
*Cor
rect
ed to
refle
ct c
olle
ctio
ns to
dat
e by
fisc
al y
ear o
f lev
ies
Sour
ce:
Dep
artm
ent o
f Fin
ance
, Lex
ingt
on-F
ayet
te U
rban
Cou
nty
Gov
ernm
ent
Colle
ctio
ns in
Su
bseq
uent
Y
ears
LEX
ING
TON
-FA
YET
TE U
RBA
N C
OU
NTY
GO
VER
NM
ENT
PRO
PERT
Y T
AX
LEV
IES
AN
D C
OLL
ECTI
ON
SLA
ST T
EN F
ISCA
L Y
EARS
176
Colle
cted
with
in th
e Fi
scal
Yea
r of
Lev
yTo
tal C
olle
ctio
ns to
Dat
e
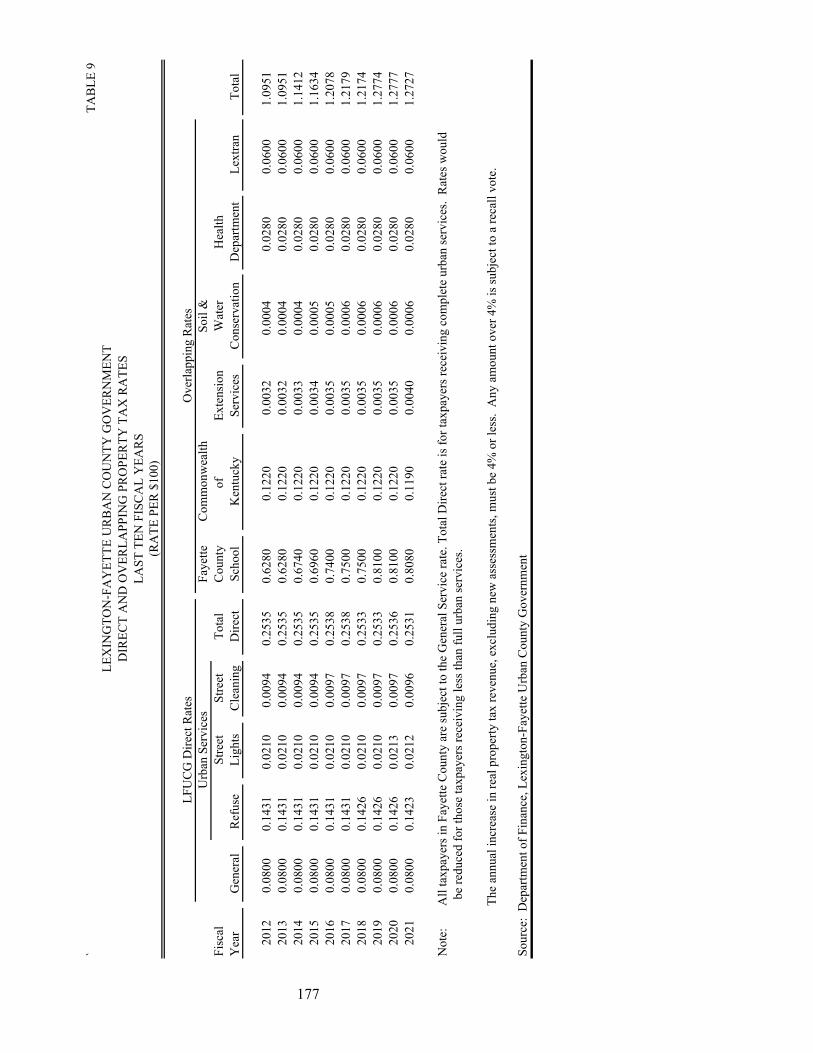
`TA
BLE
9
Faye
tteCo
mm
onw
ealt h
Soil
&St
reet
Stre
etTo
tal
Coun
tyof
Ex
tens
ion
Wat
erH
ealth
Gen
eral
Refu
seLi
ghts
Clea
ning
Dire
ctSc
hool
Ken
tuck
ySe
rvic
esCo
nser
vatio
nD
epar
tmen
tLe
xtra
nTo
tal
2012
0.08
000.
1431
0.02
100.
0094
0.25
350.
6280
0.12
200.
0032
0.00
040.
0280
0.06
001.
0951
2013
0.08
000.
1431
0.02
100.
0094
0.25
350.
6280
0.12
200.
0032
0.00
040.
0280
0.06
001.
0951
2014
0.08
000.
1431
0.02
100.
0094
0.25
350.
6740
0.12
200.
0033
0.00
040.
0280
0.06
001.
1412
2015
0.08
000.
1431
0.02
100.
0094
0.25
350.
6960
0.12
200.
0034
0.00
050.
0280
0.06
001.
1634
2016
0.08
000.
1431
0.02
100.
0097
0.25
380.
7400
0.12
200.
0035
0.00
050.
0280
0.06
001.
2078
2017
0.08
000.
1431
0.02
100.
0097
0.25
380.
7500
0.12
200.
0035
0.00
060.
0280
0.06
001.
2179
2018
0.08
000.
1426
0.02
100.
0097
0.25
330.
7500
0.12
200.
0035
0.00
060.
0280
0.06
001.
2174
2019
0.08
000.
1426
0.02
100.
0097
0.25
330.
8100
0.12
200.
0035
0.00
060.
0280
0.06
001.
2774
2020
0.08
000.
1426
0.02
130.
0097
0.25
360.
8100
0.12
200.
0035
0.00
060.
0280
0.06
001.
2777
2021
0.08
000.
1423
0.02
120.
0096
0.25
310.
8080
0.11
900.
0040
0.00
060.
0280
0.06
001.
2727
Not
e:be
redu
ced
for t
hose
taxp
ayer
s rec
eivi
ng le
ss th
an fu
ll ur
ban
serv
ices
.
Ove
rlapp
ing
Rate
s
All
taxp
ayer
s in
Faye
tte C
ount
y ar
e su
bjec
t to
the
Gen
eral
Ser
vice
rate
. Tot
al D
irect
rate
is fo
r tax
paye
rs re
ceiv
ing
com
plet
e ur
ban
serv
ices
. Ra
tes w
ould
The
annu
al in
crea
se in
real
pro
perty
tax
reve
nue,
exc
ludi
ng n
ew a
sses
smen
ts, m
ust b
e 4%
or l
ess.
Any
am
ount
ove
r 4%
is su
bjec
t to
a re
call
vote
.
177
Sour
ce:
Dep
artm
ent o
f Fin
ance
, Lex
ingt
on-F
ayet
te U
rban
Cou
nty
Gov
ernm
ent
LEX
ING
TON
-FA
YET
TE U
RBA
N C
OU
NTY
GO
VER
NM
ENT
LFU
CG D
irect
Rat
esU
rban
Ser
vice
sFi
scal
Y
ear
DIR
ECT
AN
D O
VER
LAPP
ING
PRO
PERT
Y T
AX
RA
TES
LAST
TEN
FIS
CAL
YEA
RS(R
ATE
PER
$10
0)
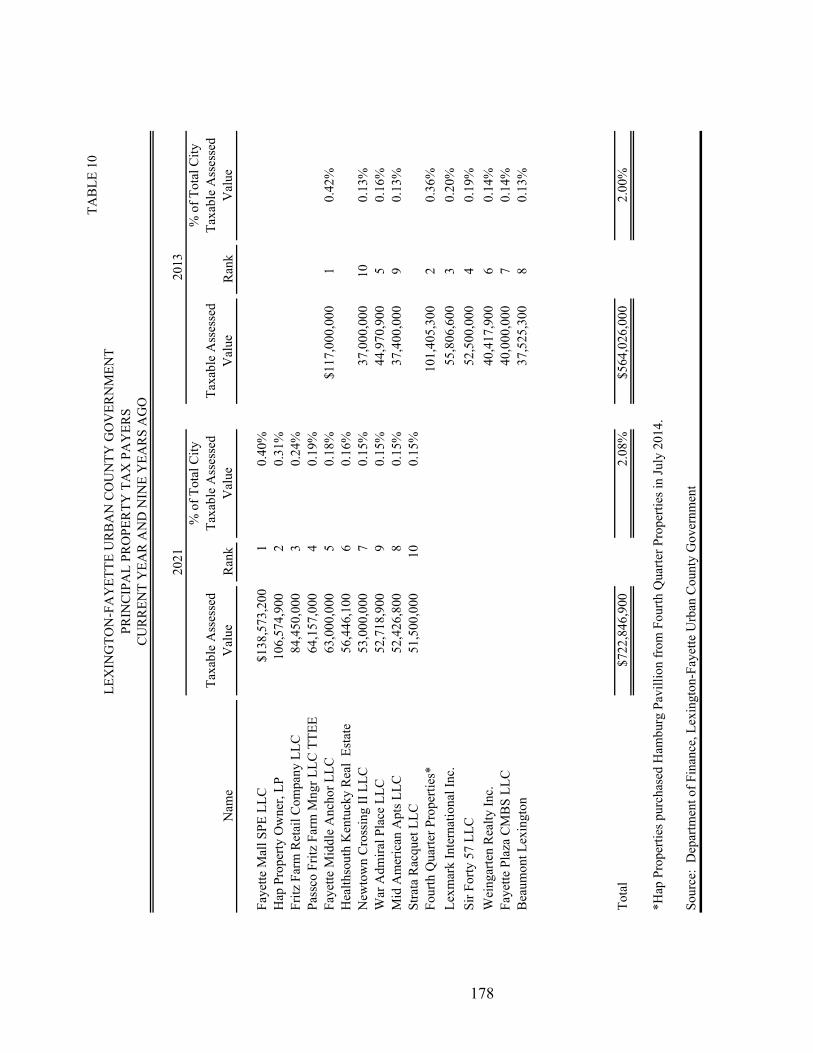
TABL
E 10
Nam
eTa
xabl
e A
sses
sed
Val
ueRa
nk
% o
f Tot
al C
ity
Taxa
ble
Ass
esse
d V
alue
Taxa
ble
Ass
esse
d V
alue
Rank
% o
f Tot
al C
ity
Taxa
ble
Ass
esse
d V
alue
Faye
tte M
all S
PE L
LC
$138
,573
,200
10.
40%
Hap
Pro
perty
Ow
ner,
LP10
6,57
4,90
0
20.
31%
Fritz
Far
m R
etai
l Com
pany
LLC
84,4
50,0
003
0.24
%Pa
ssco
Frit
z Fa
rm M
ngr L
LC T
TEE
64,1
57,0
004
0.19
%Fa
yette
Mid
dle
Anc
hor L
LC63
,000
,000
50.
18%
$117
,000
,000
10.
42%
Hea
lthso
uth
Ken
tuck
y Re
al E
state
56,4
46,1
006
0.16
%N
ewto
wn
Cros
sing
II LL
C53
,000
,000
70.
15%
37,0
00,0
0010
0.13
%W
ar A
dmira
l Pla
ce L
LC52
,718
,900
90.
15%
44,9
70,9
005
0.16
%M
id A
mer
ican
Apt
s LLC
52,4
26,8
008
0.15
%37
,400
,000
90.
13%
Stra
ta R
acqu
et L
LC51
,500
,000
100.
15%
Four
th Q
uarte
r Pro
perti
es*
101,
405,
300
20.
36%
Lexm
ark
Inte
rnat
iona
l Inc
.55
,806
,600
30.
20%
Sir F
orty
57
LLC
52,5
00,0
004
0.19
%W
eing
arte
n Re
alty
Inc.
40,4
17,9
006
0.14
%Fa
yette
Pla
za C
MBS
LLC
40,0
00,0
007
0.14
%Be
aum
ont L
exin
gton
37,5
25,3
008
0.13
%
Tota
l$7
22,8
46,9
002.
08%
$564
,026
,000
2.00
%
*Hap
Pro
perti
es p
urch
ased
Ham
burg
Pav
illio
n fro
m F
ourth
Qua
rter P
rope
rties
in Ju
ly 2
014.
178
LEX
ING
TON
-FA
YET
TE U
RBA
N C
OU
NTY
GO
VER
NM
ENT
PRIN
CIPA
L PR
OPE
RTY
TA
X P
AY
ERS
Sour
ce:
Dep
artm
ent o
f Fin
ance
, Lex
ingt
on-F
ayet
te U
rban
Cou
nty
Gov
ernm
ent
2013
2021
CURR
ENT
YEA
R A
ND
NIN
E Y
EARS
AG
O
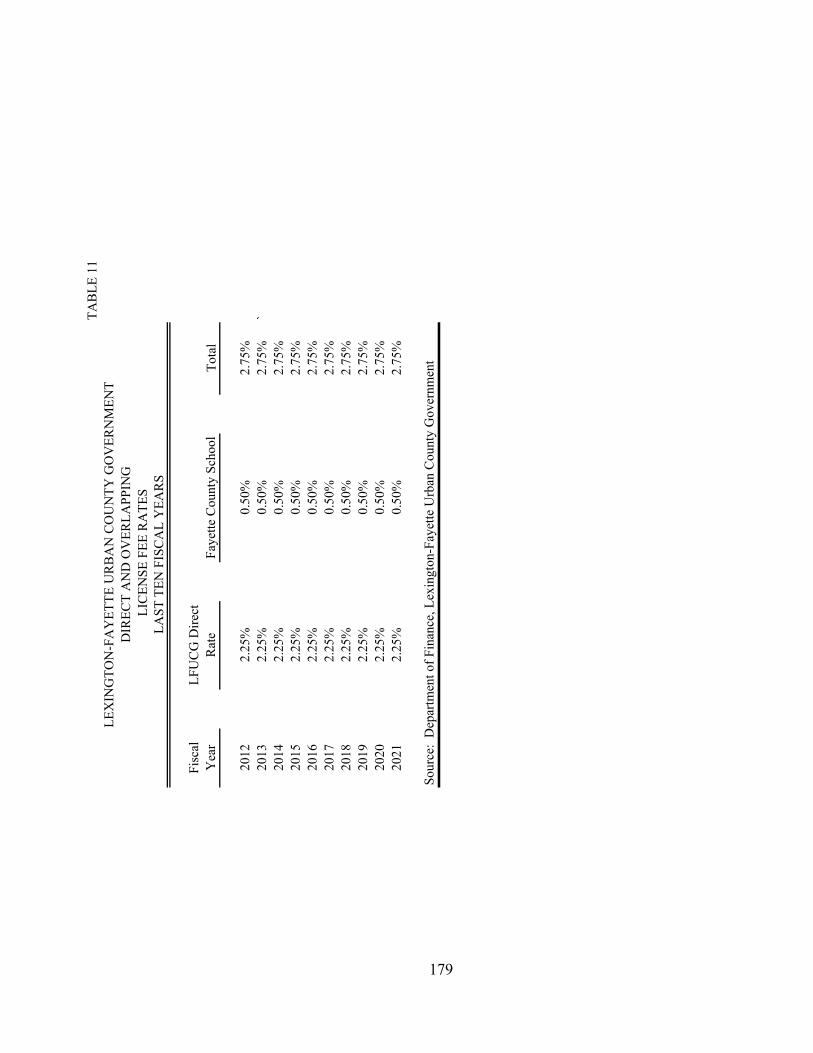
TABL
E 11
Fisc
al
Yea
rLF
UCG
Dire
ct
Rate
Faye
tte C
ount
y Sc
hool
Tota
l
2012
2.25
%0.
50%
2.75
%20
132.
25%
0.50
%2.
75%
`20
142.
25%
0.50
%2.
75%
2015
2.25
%0.
50%
2.75
%20
162.
25%
0.50
%2.
75%
2017
2.25
%0.
50%
2.75
%20
182.
25%
0.50
%2.
75%
2019
2.25
%0.
50%
2.75
%20
202.
25%
0.50
%2.
75%
2021
2.25
%0.
50%
2.75
%
179
LIC
ENSE
FEE
RA
TES
LEX
ING
TON
-FA
YET
TE U
RBA
N C
OU
NTY
GO
VER
NM
ENT
DIR
ECT
AN
D O
VER
LAPP
ING
LAST
TEN
FIS
CAL
YEA
RS
Sour
ce:
Dep
artm
ent o
f Fin
ance
, Lex
ingt
on-F
ayet
te U
rban
Cou
nty
Gov
ernm
ent
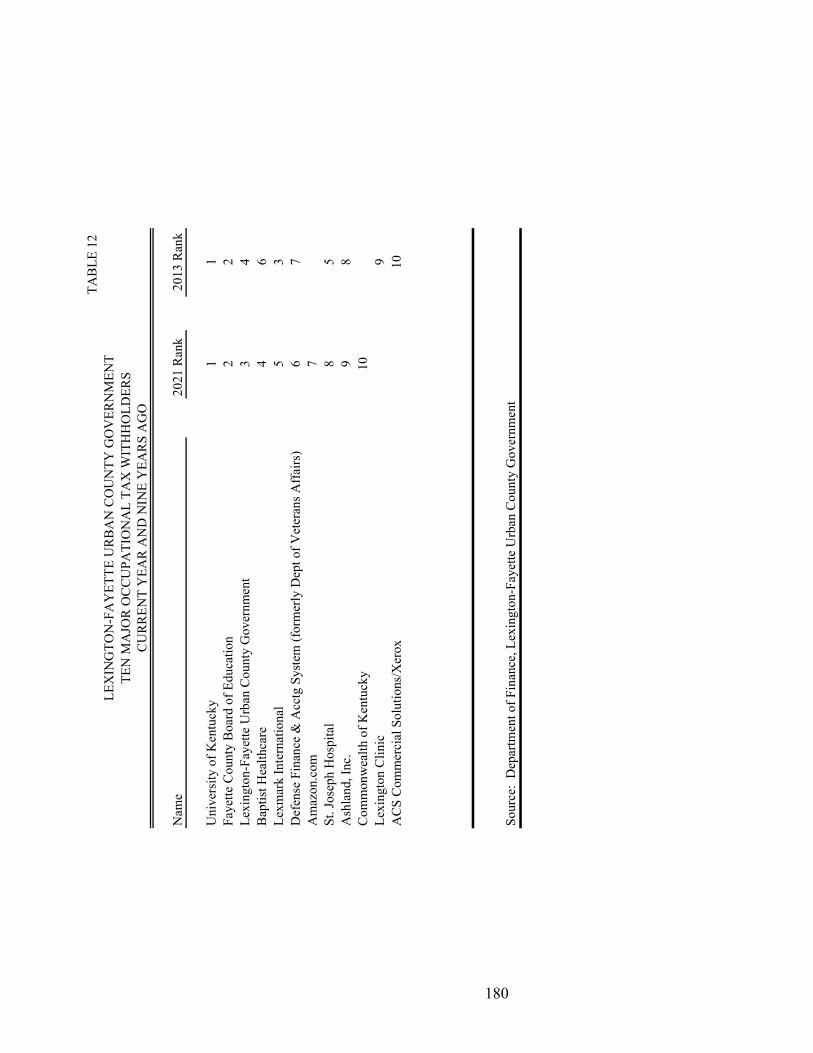
TABL
E 12
Nam
e20
21 R
ank
2013
Ran
k
Uni
vers
ity o
f Ken
tuck
y1
1Fa
yette
Cou
nty
Boar
d of
Edu
catio
n2
2Le
ton-
Faye
tte U
rban
Cou
nty
Gov
ernm
ent
34
Bapt
ist H
ealth
care
46
Lexm
ark
Inte
rnat
iona
l5
3D
efen
se F
inan
ce &
Acc
tg S
yste
m (f
orm
erly
Dep
t of V
eter
ans A
ffairs
)6
7A
maz
on.c
om7
St. J
osep
h H
ospi
tal
85
Ash
land
, Inc
. 9
8Co
mm
onw
ealth
of K
entu
cky
10Le
ton
Clin
ic9
ACS
Com
mer
cial
Sol
utio
ns/X
erox
10
Sour
ce:
Dep
artm
ent o
f Fin
ance
, Lex
ingt
on-F
ayet
te U
rban
Cou
nty
Gov
ernm
ent
LEX
ING
TON
-FA
YET
TE U
RBA
N C
OU
NTY
GO
VER
NM
ENT
TEN
MA
JOR
OCC
UPA
TIO
NA
L TA
X W
ITH
HO
LDER
SCU
RREN
T Y
EAR
AN
D N
INE
YEA
RS A
GO
180
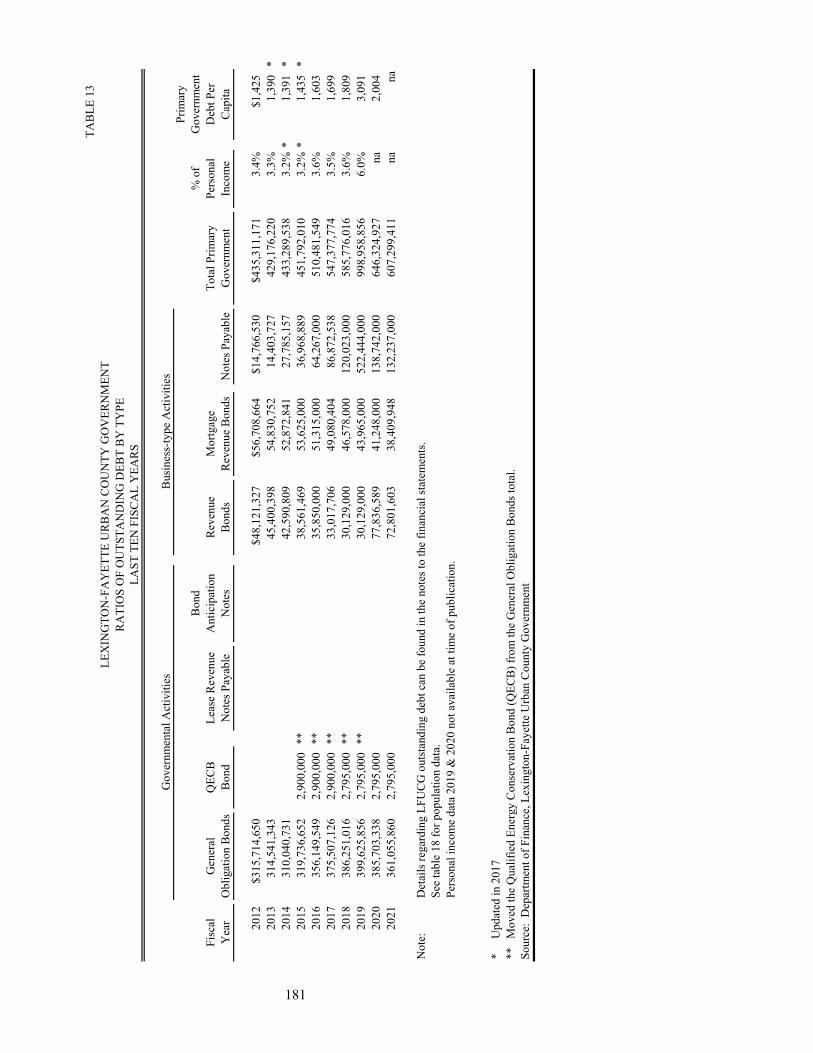
TABL
E 13
Fisc
al
Yea
rG
ener
al
Obl
igat
ion
Bond
sQ
ECB
Bond
Leas
e Re
venu
e N
otes
Pay
able
Bond
A
ntic
ipat
ion
Not
esRe
venu
e Bo
nds
Mor
tgag
e Re
venu
e Bo
nds
Not
es P
ayab
leTo
tal P
rimar
y G
over
nmen
t
% o
f Pe
rson
al
Inco
me
Prim
ary
Gov
ernm
ent
Deb
t Per
Ca
pita
2012
$315
,714
,650
$48,
121,
327
$56,
708,
664
$14,
766,
530
$435
,311
,171
3.4%
$1,4
2520
1331
4,54
1,34
345
,400
,398
54,8
30,7
5214
,403
,727
429,
176,
220
3.3%
1,39
0*
2014
310,
040,
731
42
,590
,809
52,8
72,8
4127
,785
,157
433,
289,
538
3.2%
*1,
391
*20
1531
9,73
6,65
22,
900,
000
**38
,561
,469
53,6
25,0
0036
,968
,889
451,
792,
010
3.2%
*1,
435
*20
1635
6,14
9,54
92,
900,
000
**35
,850
,000
51,3
15,0
0064
,267
,000
510,
481,
549
3.6%
1,60
320
1737
5,50
7,12
62,
900,
000
**33
,017
,706
49,0
80,4
0486
,872
,538
547,
377,
774
3.5%
1,69
920
1838
6,25
1,01
62,
795,
000
**30
,129
,000
46,5
78,0
0012
0,02
3,00
058
5,77
6,01
63.
6%1,
809
2019
399,
625,
856
2,79
5,00
0**
30,1
29,0
0043
,965
,000
522,
444,
000
998,
958,
856
6.0%
3,09
120
2038
5,70
3,33
82,
795,
000
77,8
36,5
8941
,248
,000
138,
742,
000
646,
324,
927
na2,
004
2021
361,
055,
860
2,79
5,00
072
,801
,603
38,4
09,9
4813
2,23
7,00
060
7,29
9,41
1na
na
Not
e:
Det
ails
rega
rdin
g LF
UCG
out
stand
ing
debt
can
be
foun
d in
the
note
s to
the
finan
cial
stat
emen
ts.Se
e ta
ble
18 fo
r pop
ulat
ion
data
.Pe
rson
al in
com
e da
ta 2
019
& 2
020
not a
vaila
ble
at ti
me
of p
ublic
atio
n.
*
Upd
ated
in 2
017
**
Mov
ed th
e Q
ualif
ied
Ener
gy C
onse
rvat
ion
Bond
(QEC
B) fr
om th
e G
ener
al O
blig
atio
n Bo
nds t
otal
.
181
Sour
ce:
Dep
artm
ent o
f Fin
ance
, Lex
ingt
on-F
ayet
te U
rban
Cou
nty
Gov
ernm
ent
LEX
ING
TON
-FA
YET
TE U
RBA
N C
OU
NTY
GO
VER
NM
ENT
RATI
OS
OF
OU
TSTA
ND
ING
DEB
T BY
TY
PELA
ST T
EN F
ISCA
L Y
EARS
Busin
ess-
type
Act
iviti
esG
over
nmen
tal A
ctiv
ities
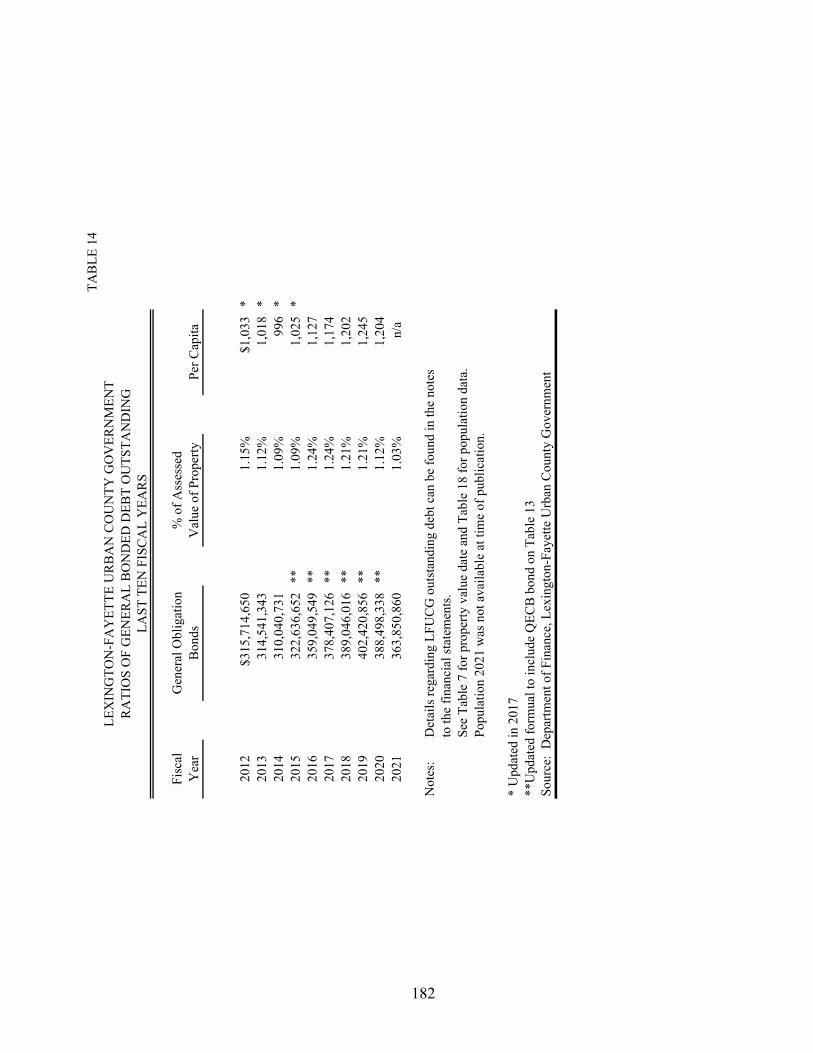
TABL
E 14
Fisc
al
Yea
rG
ener
al O
blig
atio
n Bo
nds
% o
f Ass
esse
d V
alue
of P
rope
rty
Per C
apita
2012
$315
,714
,650
1.15
%$1
,033
*20
1331
4,54
1,34
31.
12%
1,01
8*
2014
310,
040,
731
1.09
%99
6*
2015
322,
636,
652
**1.
09%
1,02
5*
2016
359,
049,
549
**1.
24%
1,12
720
1737
8,40
7,12
6**
1.24
%1,
174
2018
389,
046,
016
**1.
21%
1,20
220
1940
2,42
0,85
6**
1.21
%1,
245
2020
388,
498,
338
**1.
12%
1,20
420
2136
3,85
0,86
01.
03%
n/a
Not
es:
to th
e fin
anci
al st
atem
ents.
Popu
latio
n 20
21 w
as n
ot a
vaila
ble
at ti
me
of p
ublic
atio
n.
* U
pdat
ed in
201
7**
Upd
ated
form
ual t
o in
clud
e Q
ECB
bond
on
Tabl
e 13
182
Sour
ce:
Dep
artm
ent o
f Fin
ance
, Lex
ingt
on-F
ayet
te U
rban
Cou
nty
Gov
ernm
ent
See
Tabl
e 7
for p
rope
rty v
alue
dat
e an
d Ta
ble
18 fo
r pop
ulat
ion
data
.
LEX
ING
TON
-FA
YET
TE U
RBA
N C
OU
NTY
GO
VER
NM
ENT
RATI
OS
OF
GEN
ERA
L BO
ND
ED D
EBT
OU
TSTA
ND
ING
LAST
TEN
FIS
CAL
YEA
RS
Det
ails
rega
rdin
g LF
UCG
out
stand
ing
debt
can
be
foun
d in
the
note
s
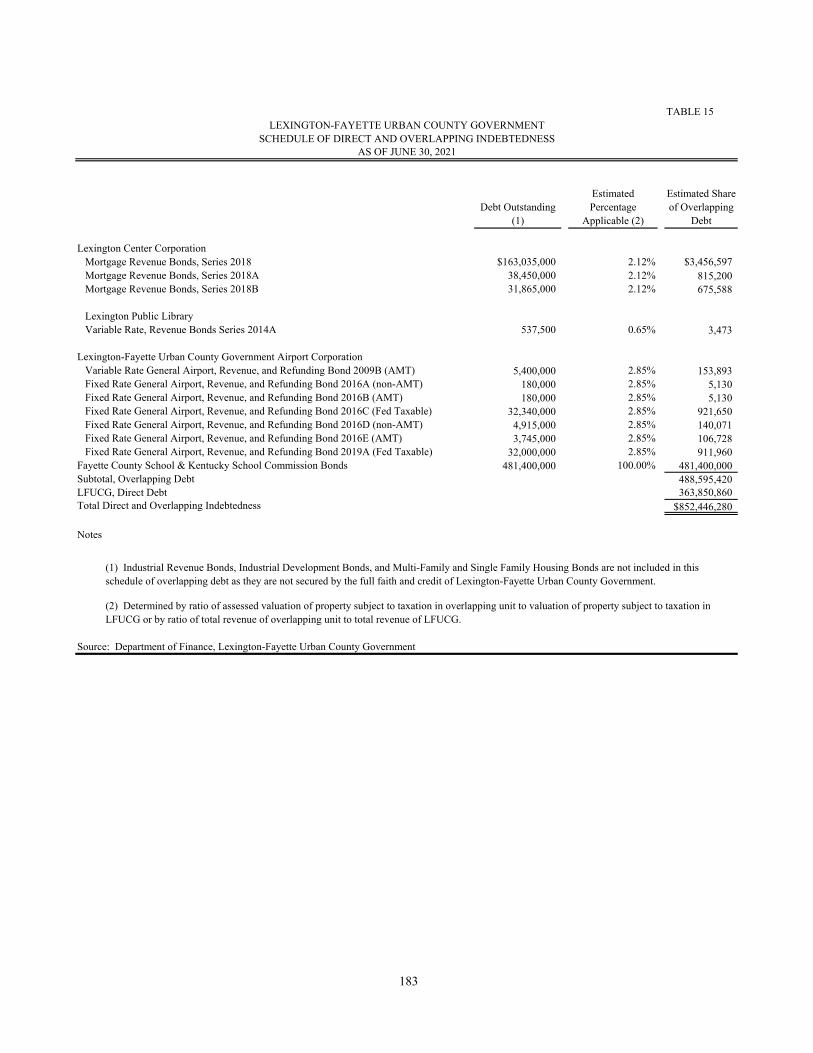
TABLE 15
Debt Outstanding (1)
Estimated Percentage
Applicable (2)
Estimated Share of Overlapping
Debt
$163,035,000 2.12% $3,456,597Mortgage Revenue Bonds, Series 2018A 38,450,000 2.12% 815,200Mortgage Revenue Bonds, Series 2018B 31,865,000 2.12% 675,588
Lexington Public Library537,500 0.65% 3,473
5,400,000 2.85% 153,893Fixed Rate General Airport, Revenue, and Refunding Bond 2016A (non-AMT) 180,000 2.85% 5,130Fixed Rate General Airport, Revenue, and Refunding Bond 2016B (AMT) 180,000 2.85% 5,130Fixed Rate General Airport, Revenue, and Refunding Bond 2016C (Fed Taxable) 32,340,000 2.85% 921,650Fixed Rate General Airport, Revenue, and Refunding Bond 2016D (non-AMT) 4,915,000 2.85% 140,071Fixed Rate General Airport, Revenue, and Refunding Bond 2016E (AMT) 3,745,000 2.85% 106,728Fixed Rate General Airport, Revenue, and Refunding Bond 2019A (Fed Taxable) 32,000,000 2.85% 911,960
481,400,000 100.00% 481,400,000488,595,420363,850,860
$852,446,280
Notes
LEXINGTON-FAYETTE URBAN COUNTY GOVERNMENTSCHEDULE OF DIRECT AND OVERLAPPING INDEBTEDNESS
AS OF JUNE 30, 2021
(1) Industrial Revenue Bonds, Industrial Development Bonds, and Multi-Family and Single Family Housing Bonds are not included in this schedule of overlapping debt as they are not secured by the full faith and credit of Lexington-Fayette Urban County Government.
Mortgage Revenue Bonds, Series 2018Lexington Center Corporation
Variable Rate, Revenue Bonds Series 2014A
Source: Department of Finance, Lexington-Fayette Urban County Government
(2) Determined by ratio of assessed valuation of property subject to taxation in overlapping unit to valuation of property subject to taxation in LFUCG or by ratio of total revenue of overlapping unit to total revenue of LFUCG.
Fayette County School & Kentucky School Commission BondsSubtotal, Overlapping Debt
Lexington-Fayette Urban County Government Airport CorporationVariable Rate General Airport, Revenue, and Refunding Bond 2009B (AMT)
LFUCG, Direct DebtTotal Direct and Overlapping Indebtedness
183
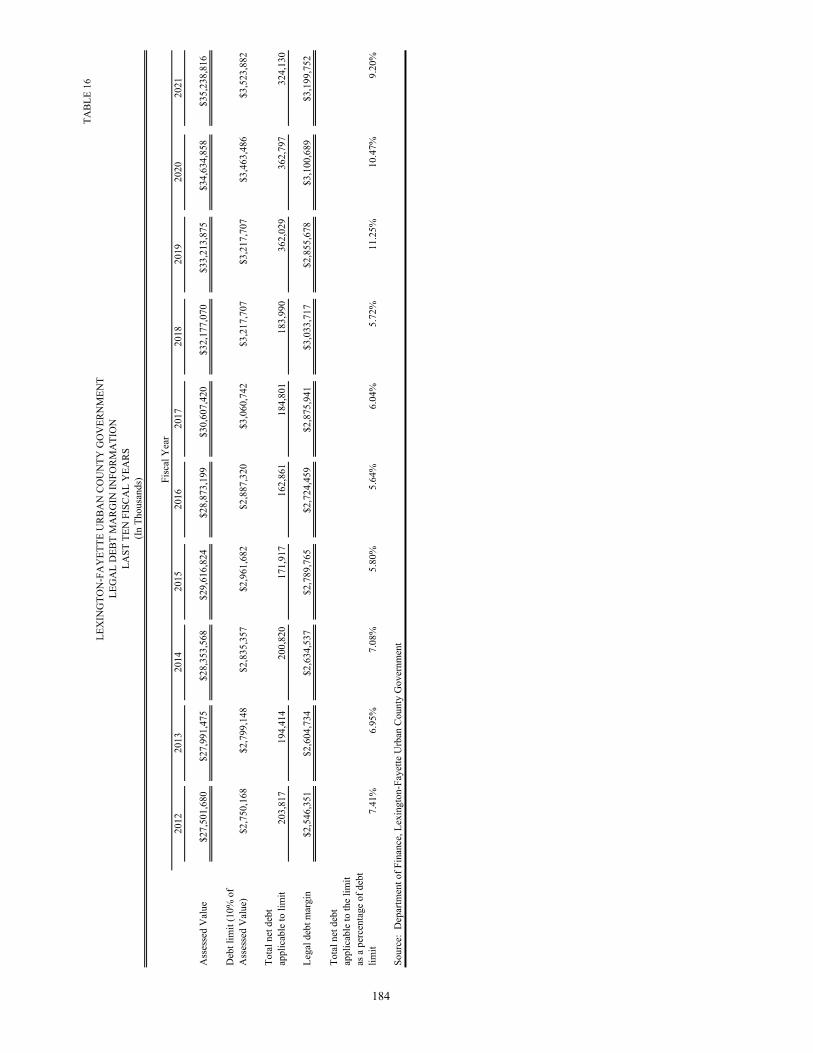
TABL
E 16
2012
2013
2014
2015
2016
2017
2018
2019
2020
2021
Ass
esse
d V
alue
$27,
501,
680
$27,
991,
475
$28,
353,
568
$29,
616,
824
$28,
873,
199
$30,
607,
420
$32,
177,
070
$33,
213,
875
$34,
634,
858
$35,
238,
816
Deb
t lim
it (1
0% o
f A
sses
sed
Val
ue)
$2,7
50,1
68$2
,799
,148
$2,8
35,3
57$2
,961
,682
$2,8
87,3
20$3
,060
,742
$3,2
17,7
07$3
,217
,707
$3,4
63,4
86$3
,523
,882
Tota
l net
deb
t ap
plic
able
to li
mit
203,
817
194,
414
200,
820
171,
917
162,
861
184,
801
183,
990
362,
029
362,
797
324,
130
Lega
l deb
t mar
gin
$2,5
46,3
51$2
,604
,734
$2,6
34,5
37$2
,789
,765
$2,7
24,4
59$2
,875
,941
$3,0
33,7
17$2
,855
,678
$3,1
00,6
89$3
,199
,752
Tota
l net
deb
t ap
plic
able
to th
e lim
it as
a p
erce
ntag
e of
deb
t lim
it7.
41%
6.95
%7.
08%
5.80
%5.
64%
6.04
%5.
72%
11.2
5%10
.47%
9.20
%
Sour
ce:
Dep
artm
ent o
f Fin
ance
, Lex
ingt
on-F
ayet
te U
rban
Cou
nty
Gov
ernm
ent
184
LEX
ING
TON
-FA
YET
TE U
RBA
N C
OU
NTY
GO
VER
NM
ENT
LEG
AL
DEB
T M
ARG
IN IN
FORM
ATI
ON
LAST
TEN
FIS
CAL
YEA
RS(In
Tho
usan
ds) Fi
scal
Yea
r
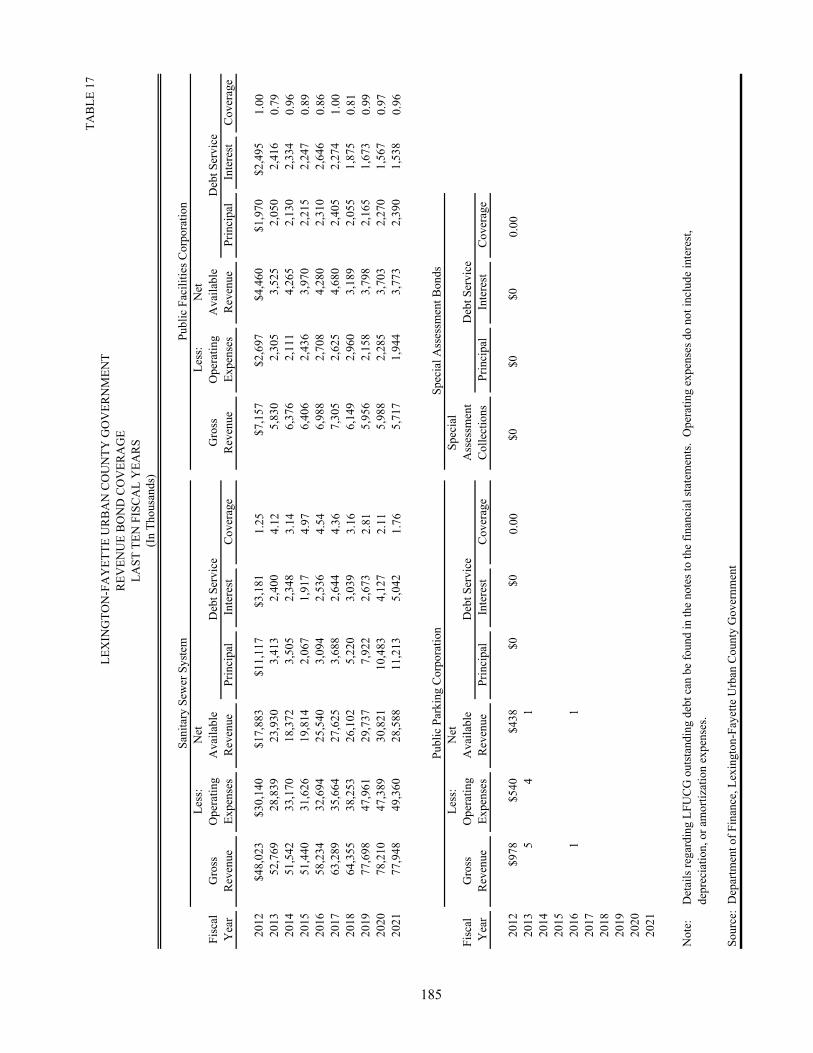
TABL
E 17
Less
:N
etLe
ss:
Net
Fisc
alG
ross
Ope
ratin
gA
vaila
ble
Gro
ssO
pera
ting
Ava
ilabl
eY
ear
Reve
nue
Expe
nses
Reve
nue
Prin
cipa
lIn
tere
stCo
vera
geRe
venu
eEx
pens
esRe
venu
ePr
inci
pal
Inte
rest
Cove
rage
2012
$48,
023
$30,
140
$17,
883
$11,
117
$3,1
811.
25$7
,157
$2,6
97$4
,460
$1,9
70$2
,495
1.00
2013
52,7
6928
,839
23,9
303,
413
2,40
04.
125,
830
2,30
53,
525
2,05
02,
416
0.79
2014
51,5
4233
,170
18,3
723,
505
2,34
83.
146,
376
2,11
14,
265
2,13
02,
334
0.96
2015
51,4
4031
,626
19,8
142,
067
1,91
74.
976,
406
2,43
63,
970
2,21
52,
247
0.89
2016
58,2
3432
,694
25,5
403,
094
2,53
64.
546,
988
2,70
84,
280
2,31
02,
646
0.86
2017
63,2
8935
,664
27,6
253,
688
2,64
44.
367,
305
2,62
54,
680
2,40
52,
274
1.00
2018
64,3
5538
,253
26,1
025,
220
3,03
93.
166,
149
2,96
03,
189
2,05
51,
875
0.81
2019
77,6
9847
,961
29,7
377,
922
2,67
32.
815,
956
2,15
83,
798
2,16
51,
673
0.99
2020
78,2
1047
,389
30,8
2110
,483
4,12
72.
115,
988
2,28
53,
703
2,27
01,
567
0.97
2021
77,9
4849
,360
28,5
8811
,213
5,04
21.
765,
717
1,94
43,
773
2,39
01,
538
0.96
Less
:N
etSp
ecia
lFi
scal
Gro
ssO
pera
ting
Ava
ilabl
eA
sses
smen
tY
ear
Reve
nue
Expe
nses
Reve
nue
Prin
cipa
lIn
tere
stCo
vera
geCo
llect
ions
Prin
cipa
lIn
tere
stCo
vera
ge
2012
$978
$540
$438
$0$0
0.00
$0$0
$00.
0020
135
41
20
14
20
15
20
161
1
20
17
20
18
20
1920
20
20
21
Not
e:de
prec
iatio
n, o
r am
ortiz
atio
n ex
pens
es.
185
Deb
t Ser
vice
Sani
tary
Sew
er S
yste
m
LEX
ING
TON
-FA
YET
TE U
RBA
N C
OU
NTY
GO
VER
NM
ENT
REV
ENU
E BO
ND
CO
VER
AG
ELA
ST T
EN F
ISCA
L Y
EARS
(In T
hous
ands
)
Publ
ic F
acili
ties C
orpo
ratio
n
Deb
t Ser
vice
Sour
ce:
Dep
artm
ent o
f Fin
ance
, Lex
ingt
on-F
ayet
te U
rban
Cou
nty
Gov
ernm
ent
Spec
ial A
sses
smen
t Bon
ds
Deb
t Ser
vice
Det
ails
rega
rdin
g LF
UCG
out
stand
ing
debt
can
be
foun
d in
the
note
s to
the
finan
cial
stat
emen
ts. O
pera
ting
expe
nses
do
not i
nclu
de in
tere
st,
Publ
ic P
arki
ng C
orpo
ratio
n
Deb
t Ser
vice
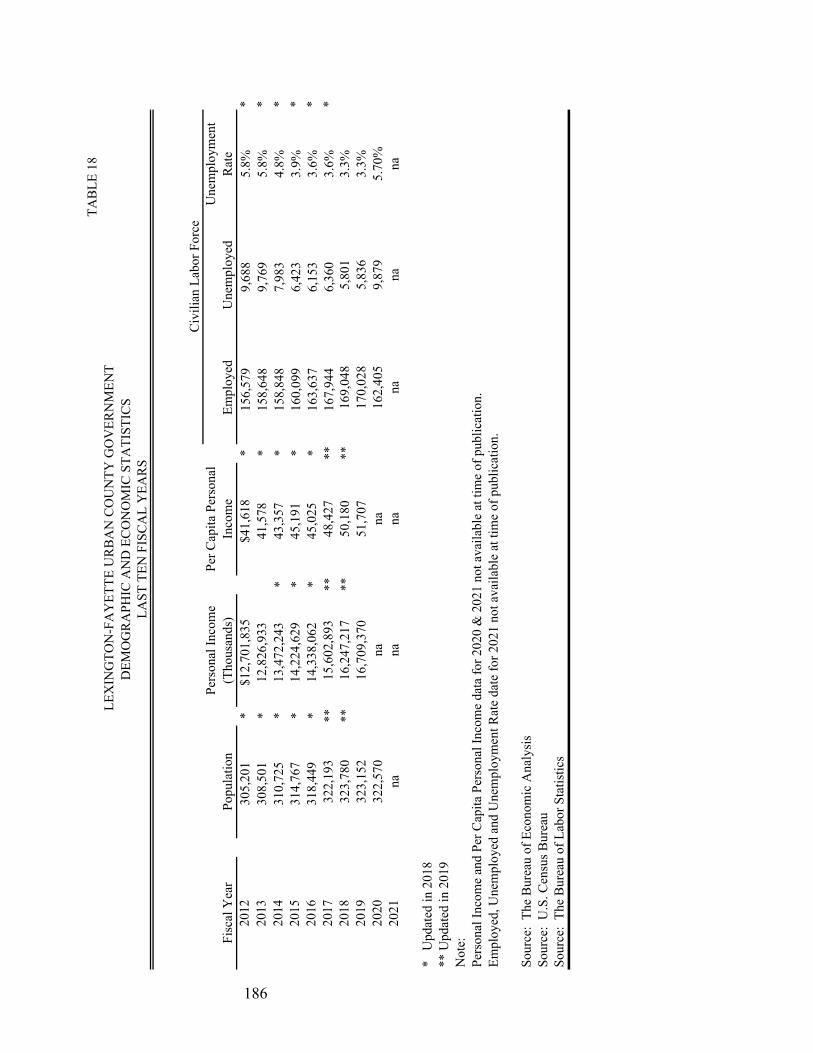
TABL
E 18
Fisc
al Y
ear
Popu
latio
nPe
rson
al In
com
e (T
hous
ands
)Pe
r Cap
ita P
erso
nal
Inco
me
Empl
oyed
Une
mpl
oyed
Une
mpl
oym
ent
Rate
2012
305,
201
*$1
2,70
1,83
5$4
1,61
8*
156,
579
9,68
85.
8%*
2013
308,
501
*12
,826
,933
41,5
78*
158,
648
9,76
95.
8%*
2014
310,
725
*13
,472
,243
*43
,357
*15
8,84
87,
983
4.8%
*20
1531
4,76
7*
14,2
24,6
29*
45,1
91*
160,
099
6,42
33.
9%*
2016
318,
449
*14
,338
,062
*45
,025
*16
3,63
76,
153
3.6%
*20
1732
2,19
3**
15,6
02,8
93**
48,4
27**
167,
944
6,36
03.
6%*
2018
323,
780
**16
,247
,217
**50
,180
**16
9,04
85,
801
3.3%
2019
323,
152
16,7
09,3
7051
,707
170,
028
5,83
63.
3%20
2032
2,57
0na
na16
2,40
59,
879
5.70
%20
21na
nana
nana
na
* U
pdat
ed in
201
8**
Upd
ated
in 2
019
Not
e:
Pers
onal
Inco
me
and
Per C
apita
Per
sona
l Inc
ome
data
for 2
020
& 2
021
not a
vaila
ble
at ti
me
of p
ublic
atio
n.Em
ploy
ed, U
nem
ploy
ed a
nd U
nem
ploy
men
t Rat
e da
te fo
r 202
1 no
t ava
ilabl
e at
tim
e of
pub
licat
ion.
Sour
ce:
The
Bure
au o
f Eco
nom
ic A
naly
sisSo
urce
: U
.S. C
ensu
s Bur
eau
186
Sour
ce:
The
Bure
au o
f Lab
or S
tatis
tics
LEX
ING
TON
-FA
YET
TE U
RBA
N C
OU
NTY
GO
VER
NM
ENT
DEM
OG
RAPH
IC A
ND
ECO
NO
MIC
STA
TIST
ICS
LAST
TEN
FIS
CAL
YEA
RS
Civi
lian
Labo
r For
ce
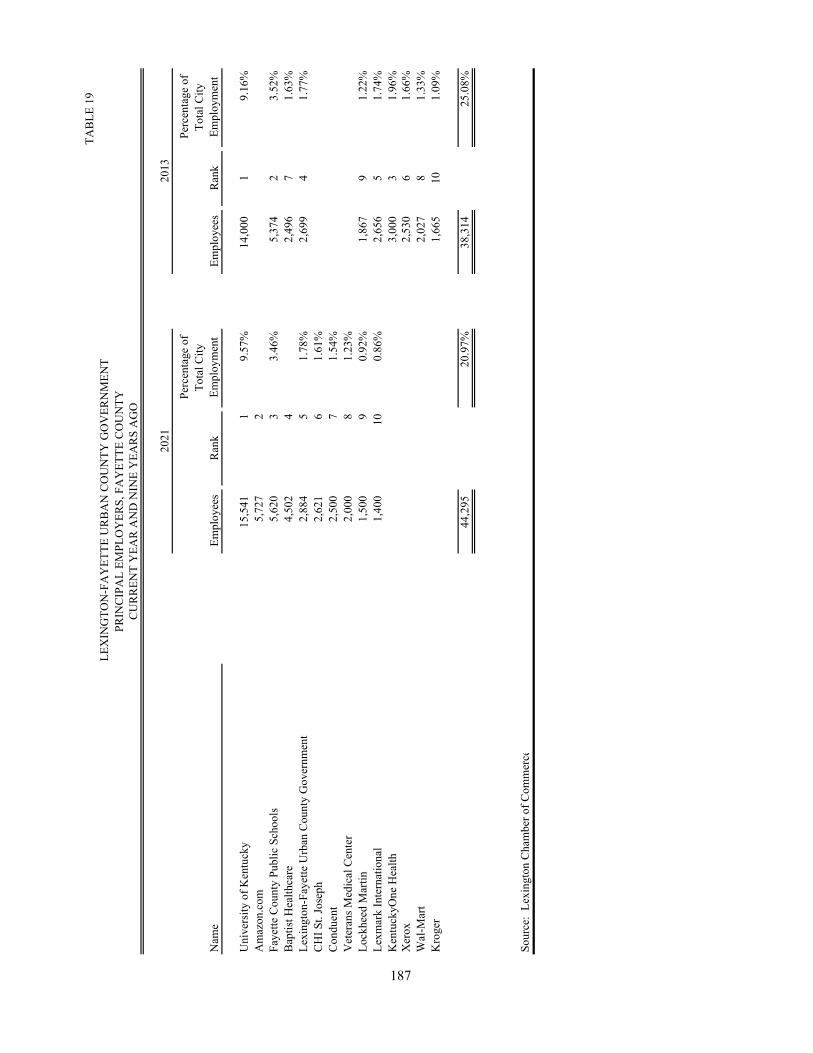
TABL
E 19
Nam
eEm
ploy
ees
Rank
Perc
enta
ge o
f To
tal C
ity
Empl
oym
ent
Empl
oyee
sRa
nk
Perc
enta
ge o
f To
tal C
ity
Empl
oym
ent
Uni
vers
ity o
f Ken
tuck
y15
,541
19.
57%
14,0
00
19.
16%
Am
azon
.com
5,72
72
Faye
tte C
ount
y Pu
blic
Sch
ools
5,62
03
3.46
%5,
374
23.
52%
Bapt
ist H
ealth
care
4,50
24
2,49
6
7
1.63
%Le
ton-
Faye
tte U
rban
Cou
nty
Gov
ernm
ent
2,88
45
1.78
%2,
699
41.
77%
CHI S
t. Jo
seph
2,62
16
1.61
%Co
ndue
nt2,
500
71.
54%
Vet
eran
s Med
ical
Cen
ter
2,00
08
1.23
%Lo
ckhe
ed M
artin
1,50
09
0.92
%1,
867
91.
22%
Lexm
ark
Inte
rnat
iona
l 1,
400
100.
86%
2,65
6
5
1.74
%K
entu
ckyO
ne H
ealth
3,00
0
3
1.96
%X
erox
2,53
0
6
1.66
%W
al-M
art
2,02
7
8
1.33
%K
roge
r1,
665
101.
09%
44,2
9520
.97%
38,3
1425
.08%
187
Sour
ce:
Lexi
ngto
n Ch
ambe
r of C
omm
erce
LEX
ING
TON
-FA
YET
TE U
RBA
N C
OU
NTY
GO
VER
NM
ENT
PRIN
CIPA
L EM
PLO
YER
S, F
AY
ETTE
CO
UN
TYCU
RREN
T Y
EAR
AN
D N
INE
YEA
RS A
GO
2021
2013
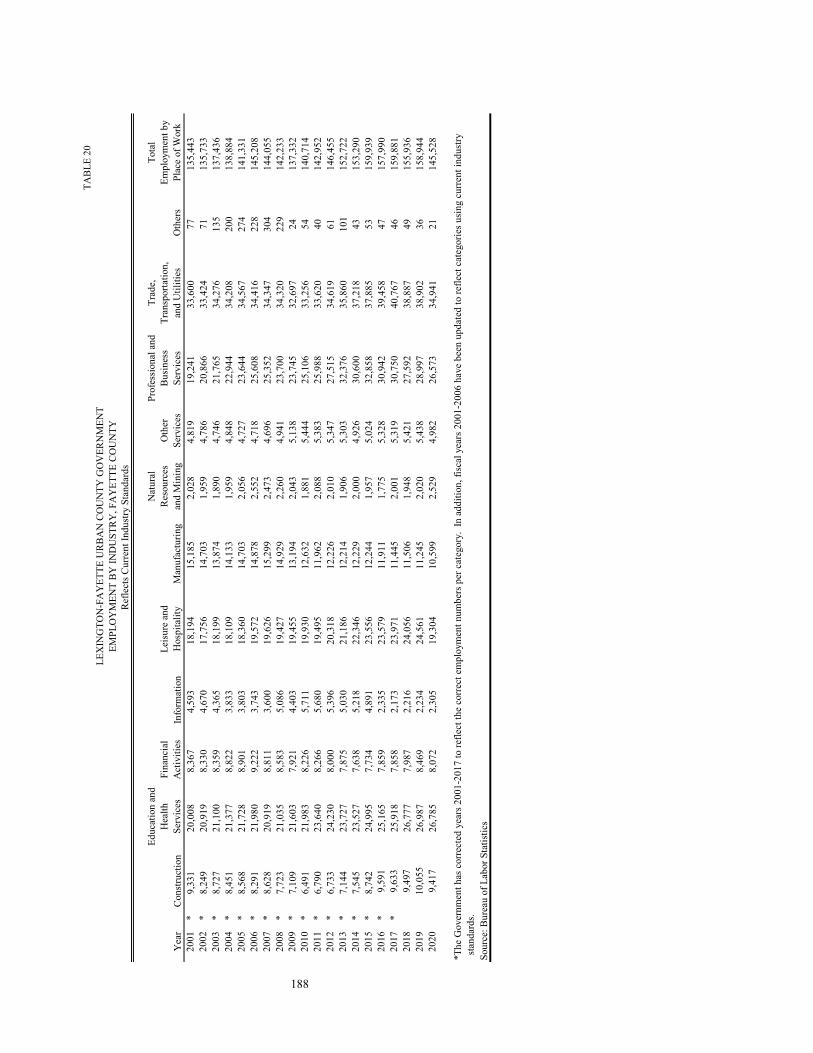
TABL
E 20
Yea
rCo
nstru
ctio
n
Educ
atio
n an
d H
ealth
Se
rvic
esFi
nanc
ial
Act
iviti
esIn
form
atio
nLe
isur
e an
d H
ospi
talit
yM
anuf
actu
ring
Nat
ural
Re
sour
ces
and
Min
ing
Oth
er
Serv
ices
Prof
essi
onal
and
Bu
sine
ss
Serv
ices
Trad
e,
Tran
spor
tatio
n,
and
Util
ities
Oth
ers
Tota
l Em
ploy
men
t by
Plac
e of
Wor
k20
01*
9,33
120
,008
8,36
74,
593
18,1
9415
,185
2,02
84,
819
19,2
4133
,600
7713
5,44
320
02*
8,24
920
,919
8,33
04,
670
17,7
5614
,703
1,95
94,
786
20,8
6633
,424
7113
5,73
320
03*
8,72
721
,100
8,35
94,
365
18,1
9913
,874
1,89
04,
746
21,7
6534
,276
135
137,
436
2004
*8,
451
21,3
778,
822
3,83
318
,109
14,1
331,
959
4,84
822
,944
34,2
0820
013
8,88
420
05*
8,56
821
,728
8,90
13,
803
18,3
6014
,703
2,05
64,
727
23,6
4434
,567
274
141,
331
2006
*8,
291
21,9
809,
222
3,74
319
,572
14,8
782,
552
4,71
825
,608
34,4
1622
814
5,20
820
07*
8,62
820
,919
8,81
13,
600
19,6
2615
,299
2,47
34,
696
25,3
5234
,347
304
144,
055
2008
*7,
723
21,0
358,
583
5,08
619
,427
14,9
292,
260
4,94
123
,700
34,3
2022
914
2,23
320
09*
7,10
921
,603
7,92
14,
403
19,4
5513
,194
2,04
35,
138
23,7
4532
,697
2413
7,33
220
10*
6,49
121
,983
8,22
65,
711
19,9
3012
,632
1,88
15,
444
25,1
0633
,256
5414
0,71
420
11*
6,79
023
,640
8,26
65,
680
19,4
9511
,962
2,08
85,
383
25,9
8833
,620
4014
2,95
220
12*
6,73
324
,230
8,00
05,
396
20,3
1812
,226
2,01
05,
347
27,5
1534
,619
6114
6,45
520
13*
7,14
423
,727
7,87
55,
030
21,1
8612
,214
1,90
65,
303
32,3
7635
,860
101
152,
722
2014
*7,
545
23,5
277,
638
5,21
822
,346
12,2
292,
000
4,92
630
,600
37,2
1843
153,
290
2015
*8,
742
24,9
957,
734
4,89
123
,556
12,2
441,
957
5,02
432
,858
37,8
8553
159,
939
2016
*9,
591
25,1
657,
859
2,33
523
,579
11,9
111,
775
5,32
830
,942
39,4
5847
157,
990
2017
*9,
633
25,9
187,
858
2,17
323
,971
11,4
452,
001
5,31
930
,750
40,7
6746
159,
881
2018
9,49
726
,777
7,98
72,
216
24,0
5611
,506
1,94
85,
421
27,5
9238
,887
4915
5,93
620
1910
,055
26,9
878,
469
2,23
424
,561
11,2
452,
020
5,43
828
,997
38,9
0236
158,
944
2020
9,41
726
,785
8,07
22,
305
19,3
0410
,599
2,52
94,
982
26,5
7334
,941
2114
5,52
8
*The
Gov
ernm
ent h
as c
orre
cted
yea
rs 2
001-
2017
to re
flect
the
corre
ct e
mpl
oym
ent n
umbe
rs p
er c
ateg
ory.
In
addi
tion,
fisc
al y
ears
200
1-20
06 h
ave
been
upd
ated
to re
flect
cat
egor
ies u
sing
cur
rent
indu
stry
sta
ndar
ds.
Sour
ce: B
urea
u of
Lab
or S
tatis
tics
188
Refle
cts C
urre
nt In
dust
ry S
tand
ards
EM
PLO
YM
ENT
BY IN
DU
STRY
, FA
YET
TE C
OU
NTY
LEX
ING
TON
-FA
YET
TE U
RBA
N C
OU
NTY
GO
VER
NM
ENT
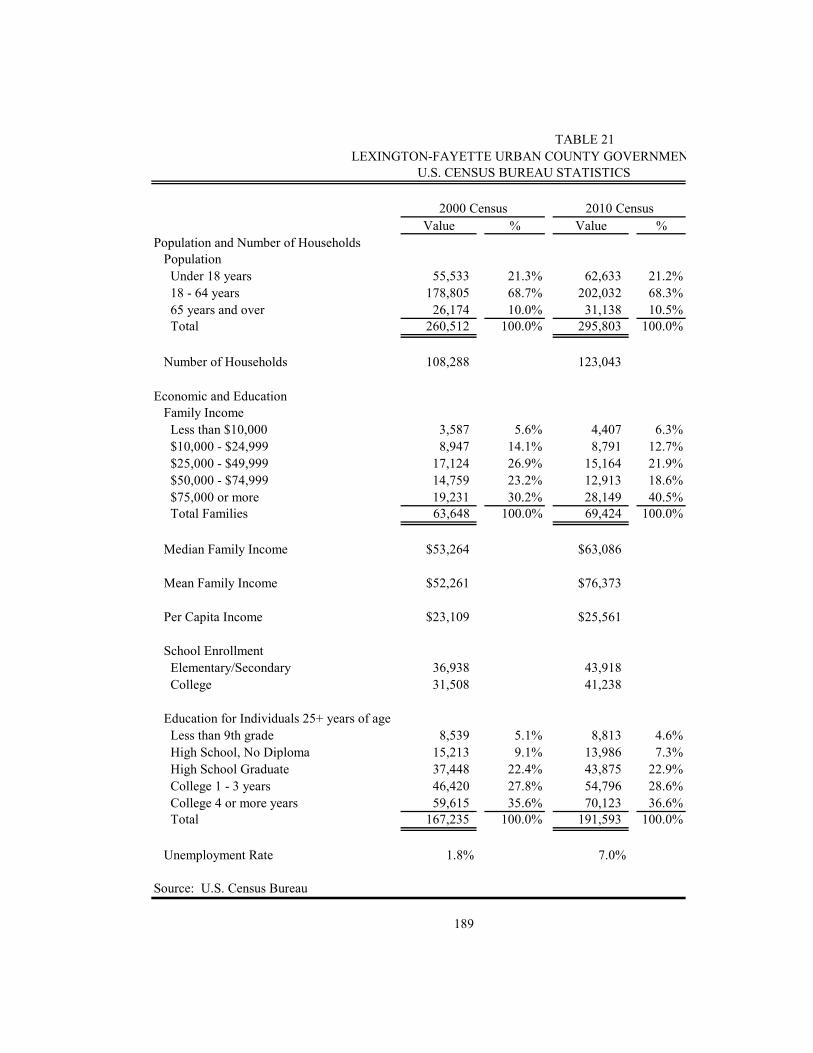
TABLE 21
Value % Value %Population and Number of Households
Population Under 18 years 55,533 21.3% 62,633 21.2% 18 - 64 years 178,805 68.7% 202,032 68.3% 65 years and over 26,174 10.0% 31,138 10.5% Total 260,512 100.0% 295,803 100.0%
Number of Households 108,288 123,043
Economic and Education Family Income Less than $10,000 3,587 5.6% 4,407 6.3% $10,000 - $24,999 8,947 14.1% 8,791 12.7% $25,000 - $49,999 17,124 26.9% 15,164 21.9% $50,000 - $74,999 14,759 23.2% 12,913 18.6% $75,000 or more 19,231 30.2% 28,149 40.5% Total Families 63,648 100.0% 69,424 100.0%
Median Family Income $53,264 $63,086
Mean Family Income $52,261 $76,373
Per Capita Income $23,109 $25,561
School Enrollment Elementary/Secondary 36,938 43,918 College 31,508 41,238
Education for Individuals 25+ years of age Less than 9th grade 8,539 5.1% 8,813 4.6% High School, No Diploma 15,213 9.1% 13,986 7.3% High School Graduate 37,448 22.4% 43,875 22.9% College 1 - 3 years 46,420 27.8% 54,796 28.6% College 4 or more years 59,615 35.6% 70,123 36.6% Total 167,235 100.0% 191,593 100.0%
Unemployment Rate 1.8% 7.0%
189
LEXINGTON-FAYETTE URBAN COUNTY GOVERNMEN
Source: U.S. Census Bureau
2000 Census 2010 Census
U.S. CENSUS BUREAU STATISTICS
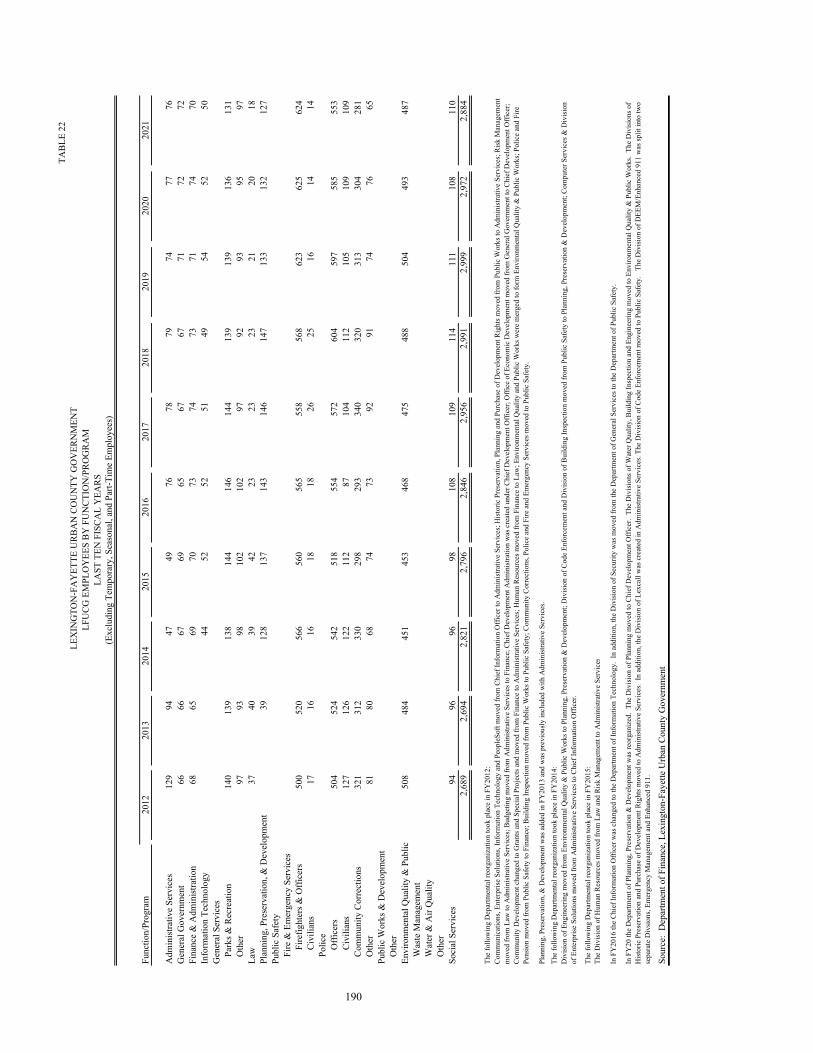
TABL
E 22
Func
tion/
Prog
ram
2012
2013
2014
2015
2016
2017
2018
2019
2020
2021
Adm
inist
rativ
e Se
rvic
es12
9
94
47
49
76
78
79
74
77
76
G
ener
al G
over
nmen
t66
66
67
69
65
67
67
71
72
72
Fi
nanc
e &
Adm
inist
ratio
n68
65
69
70
73
74
73
71
74
70
In
form
atio
n Te
chno
logy
44
52
52
51
49
54
52
50
Gen
eral
Ser
vice
sPa
rks &
Rec
reat
ion
140
13
9
138
14
4
146
14
4
139
13
9
136
13
1
Oth
er97
93
98
102
10
2
97
92
93
95
97
La
w37
40
39
42
23
23
23
21
20
18
Pl
anni
ng, P
rese
rvat
ion,
& D
evel
opm
ent
39
12
8
137
14
3
146
14
7
133
13
2
127
Pu
blic
Saf
ety
Fire
& E
mer
genc
y Se
rvic
esFi
refig
hter
s & O
ffice
rs50
0
520
56
6
560
56
5
558
56
8
623
62
5
624
Ci
vilia
ns17
16
16
18
18
26
25
16
14
14
Po
lice
Offi
cers
504
52
4
542
51
8
554
57
2
604
59
7
585
55
3
Civi
lians
127
12
6
122
11
2
87
10
4
112
10
5
109
10
9
Com
mun
ity C
orre
ctio
ns32
1
312
33
0
298
29
3
340
32
0
313
30
4
281
O
ther
81
80
68
74
73
92
91
74
76
65
Publ
ic W
orks
& D
evel
opm
ent
Oth
erEn
viro
nmen
tal Q
ualit
y &
Pub
lic
508
48
4
451
45
3
468
47
5
488
50
4
493
48
7
Was
te M
anag
emen
tW
ater
& A
ir Q
ualit
yO
ther
Soci
al S
ervi
ces
94
96
96
98
108
10
9
114
11
1
108
11
0
2,68
9
2,
694
2,82
1
2,
796
2,84
6
2,
956
2,99
1
2,
999
2,97
2
2,
884
The
follo
win
g D
epar
tmen
tal r
eorg
aniz
atio
n to
ok p
lace
in F
Y20
12:
Plan
ning
, Pre
serv
atio
n, &
Dev
elop
men
t was
add
ed in
FY
2013
and
was
pre
viou
sly in
clud
ed w
ith A
dmin
istra
tive
Serv
ices
.Th
e fo
llow
ing
Dep
artm
enta
l reo
rgan
izat
ion
took
pla
ce in
FY
2014
:
The
follo
win
g D
epar
tmen
tal r
eorg
aniz
atio
n to
ok p
lace
in F
Y20
15:
The
Div
ision
of H
uman
Res
ourc
es m
oved
from
Law
and
Risk
Man
agem
ent t
o A
dmin
istra
tive
Serv
ices
In F
Y20
16 th
e Ch
ief I
nfor
mat
ion
Offi
cer w
as c
hang
ed to
the
Dep
artm
ent o
f Inf
orm
atio
n Te
chno
logy
. In
add
ition
, the
Div
ision
of S
ecur
ity w
as m
oved
from
the
Dep
artm
ent o
f Gen
eral
Ser
vice
s to
the
Dep
artm
ent o
f Pub
lic S
afet
y.
Sour
ce:
Dep
artm
ent o
f Fin
ance
, Lex
ingt
on-F
ayet
te U
rban
Cou
nty
Gov
ernm
ent
In F
Y20
the
Dep
artm
ent o
f Pla
nnin
g, P
rese
rvat
ion
& D
evel
opm
ent w
as re
orga
nize
d. T
he D
ivisi
on o
f Pla
nnin
g m
oved
to C
hief
Dev
elop
men
t Offi
cer.
The
Div
ision
s of W
ater
Qua
lity,
Bui
ldin
g In
spec
tion
and
Engi
neer
ing
mov
ed to
Env
ironm
enta
l Qua
lity
& P
ublic
Wor
ks.
The
Div
ision
s of
Hist
oric
Pre
serv
atio
n an
d Pu
rcha
se o
f Dev
elop
men
t Rig
hts m
oved
to A
dmin
istra
tive
Serv
ices
. In
add
ition
, the
Div
ision
of L
exca
ll w
as c
reat
ed in
Adm
inist
rativ
e Se
rvic
es. T
he D
ivisi
on o
f Cod
e En
forc
emen
t mov
ed to
Pub
lic S
afet
y.
The
Div
ision
of D
EEM
/Enh
ance
d 91
1 w
as sp
lit in
to tw
o se
para
te D
ivsio
ns, E
mer
genc
y M
anag
emen
t and
Enh
ance
d 91
1.
Com
mun
icat
ions
, Ent
erpr
ise S
olut
ions
, Inf
orm
atio
n Te
chno
logy
and
Peo
pleS
oft m
oved
from
Chi
ef In
form
atio
n O
ffice
r to
Adm
inist
rativ
e Se
rvic
es; H
istor
ic P
rese
rvat
ion,
Pla
nnin
g an
d Pu
rcha
se o
f Dev
elop
men
t Rig
hts m
oved
from
Pub
lic W
orks
to A
dmin
istra
tive
Serv
ices
; Risk
Man
agem
ent
mov
ed fr
om L
aw to
Adm
inist
rativ
e Se
rvic
es; B
udge
ting
mov
ed fr
om A
dmin
istra
tive
Serv
ices
to F
inan
ce; C
hief
Dev
elop
men
t Adm
inist
ratio
n w
as c
reat
ed u
nder
Chi
ef D
evel
opm
ent O
ffice
r; O
ffice
of E
cono
mic
Dev
elop
men
t mov
ed fr
om G
ener
al G
over
nmen
t to
Chie
f Dev
elop
men
t Offi
cer;
Com
mun
ity D
evel
opm
ent c
hang
ed to
Gra
nts a
nd S
peci
al P
roje
cts a
nd m
oved
from
Fin
ance
to A
dmin
istra
tive
Serv
ices
; Hum
an R
esou
rces
mov
ed fr
om F
inan
ce to
Law
; Env
ironm
enta
l Qua
lity
and
Publ
ic W
orks
wer
e m
erge
d to
form
Env
ironm
enta
l Qua
lity
& P
ublic
Wor
ks; P
olic
e an
d Fi
re
Pens
ion
mov
ed fr
om P
ublic
Saf
ety
to F
inan
ce; B
uild
ing
Insp
ectio
n m
oved
from
Pub
lic W
orks
to P
ublic
Saf
ety;
Com
mun
ity C
orre
ctio
ns, P
olic
e an
d Fi
re a
nd E
mer
genc
y Se
rvic
es m
oved
to P
ublic
Saf
ety.
Div
ision
of E
ngin
eerin
g m
oved
from
Env
ironm
enta
l Qua
lity
& P
ublic
Wor
ks to
Pla
nnin
g, P
rese
rvat
ion
& D
evel
opm
ent;
Div
ision
of C
ode
Enfo
rcem
ent a
nd D
ivisi
on o
f Bui
ldin
g In
spec
tion
mov
ed fr
om P
ublic
Saf
ety
to P
lann
ing,
Pre
serv
atio
n &
Dev
elop
men
t; Co
mpu
ter S
ervi
ces &
Div
ision
of
Ent
erpr
ise S
olut
ions
mov
ed fr
om A
dmin
istra
tive
Serv
ices
to C
hief
Info
rmat
ion
Offi
cer.
LFU
CG E
MPL
OY
EES
BY F
UN
CTIO
N/P
ROG
RAM
LEX
ING
TON
-FA
YET
TE U
RBA
N C
OU
NTY
GO
VER
NM
ENT
190
(Exc
ludi
ng T
empo
rary
, Sea
sona
l, an
d Pa
rt-Ti
me
Empl
oyee
s)LA
ST T
EN F
ISCA
L Y
EARS
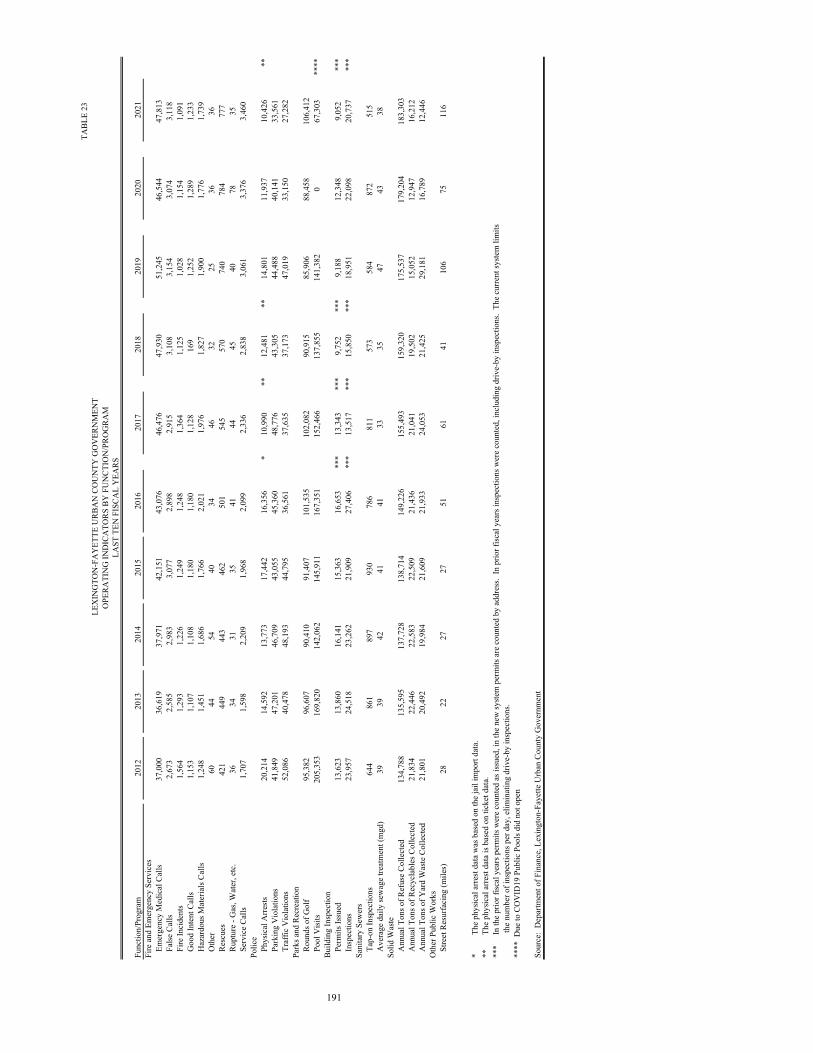
TABL
E 23
Func
tion/
Prog
ram
2012
2013
2014
2015
2016
2017
2018
2019
2020
2021
Fire
and
Em
erge
ncy
Serv
ices
Emer
genc
y M
edic
al C
alls
37,0
0036
,619
37,9
7142
,151
43,0
7646
,476
47,9
3051
,245
46,5
4447
,813
False
Cal
ls2,
673
2,58
52,
983
3,07
72,
898
2,91
53,
108
3,15
4 3,
074
3,11
8Fi
re In
cide
nts
1,56
41,
293
1,22
61,
249
1,24
81,
364
1,12
51,
028
1,15
41,
091
Goo
d In
tent
Cal
ls1,
153
1,10
71,
108
1,18
01,
180
1,12
816
91,
252
1,28
91,
233
Haz
ardo
us M
ater
ials
Calls
1,24
81,
451
1,68
61,
766
2,02
11,
976
1,82
71,
900
1,77
61,
739
Oth
er60
4454
4034
4632
25
3636
Resc
ues
421
449
443
462
501
545
570
740
784
777
Rupt
ure
- Gas
, Wat
er, e
tc.
3634
3135
4144
4540
7835
Serv
ice
Calls
1,70
71,
598
2,20
91,
968
2,09
92,
336
2,83
83,
061
3,37
63,
460
Polic
ePh
ysic
al A
rrests
20
,214
14,5
9213
,773
17,4
4216
,356
*10
,990
**12
,481
**14
,801
11,9
3710
,426
**Pa
rkin
g V
iola
tions
41,8
4947
,201
46,7
0943
,055
45,3
6048
,776
43,3
0544
,488
40,1
4133
,561
Traf
fic V
iola
tions
52,0
8640
,478
48,1
9344
,795
36,5
6137
,635
37,1
7347
,019
33,1
5027
,282
Park
s and
Rec
reat
ion
Roun
ds o
f Gol
f95
,382
96,6
0790
,410
91,4
0710
1,53
510
2,08
290
,915
85,9
0688
,458
106,
412
Pool
Visi
ts20
5,35
316
9,82
014
2,06
214
5,91
116
7,35
115
2,46
613
7,85
514
1,38
20
67,3
03**
**Bu
ildin
g In
spec
tion
Perm
its Is
sued
13,6
2313
,860
16,1
4115
,363
16,6
53**
*13
,343
***
9,75
2**
*9,
188
12,3
489,
052
***
Insp
ectio
ns23
,957
24,5
1823
,262
21,9
0927
,406
***
13,5
17**
*15
,850
***
18,9
5122
,098
20,7
37**
*Sa
nita
ry S
ewer
sTa
p-on
Insp
ectio
ns
644
861
897
930
786
811
573
584
872
515
Ave
rage
dai
ly se
wag
e tre
atm
ent (
mgd
)39
3942
4141
3335
4743
38So
lid W
aste
Ann
ual T
ons o
f Ref
use
Colle
cted
134,
788
135,
595
137,
728
138,
714
149,
226
155,
493
159,
320
175,
537
179,
204
183,
303
Ann
ual T
ons o
f Rec
ycla
bles
Col
lect
ed21
,834
22,4
4622
,583
22,5
0921
,436
21,0
4119
,502
15,0
5212
,947
16,2
12A
nnua
l Ton
s of Y
ard
Was
te C
olle
cted
21,8
0120
,492
19,9
8421
,609
21,9
3324
,053
21,4
2529
,181
16,7
8912
,446
Oth
er P
ublic
Wor
ksSt
reet
Res
urfa
cing
(mile
s)28
2227
2751
6141
106
7511
6
*
T
he p
hysic
al a
rrest
data
was
bas
ed o
n th
e ja
il im
port
data
.**
The
phy
sical
arre
st da
ta is
bas
ed o
n tic
ket d
ata.
***
In
the
prio
r fisc
al y
ears
per
mits
wer
e co
unte
d as
issu
ed, i
n th
e ne
w sy
stem
per
mits
are
cou
nted
by
addr
ess.
In p
rior f
iscal
yea
rs in
spec
tions
wer
e co
unte
d, in
clud
ing
driv
e-by
insp
ectio
ns.
The
curre
nt sy
stem
lim
its
the
num
ber o
f ins
pect
ions
per
day
, elim
inat
ing
driv
e-by
insp
ectio
ns.
****
Due
to C
OV
ID19
Pub
lic P
ools
did
not o
pen
LEX
ING
TON
-FA
YET
TE U
RBA
N C
OU
NTY
GO
VER
NM
ENT
OPE
RATI
NG
IND
ICA
TORS
BY
FU
NCT
ION
/PRO
GRA
MLA
ST T
EN F
ISCA
L Y
EARS
Sour
ce:
Dep
artm
ent o
f Fin
ance
, Lex
ingt
on-F
ayet
te U
rban
Cou
nty
Gov
ernm
ent
191
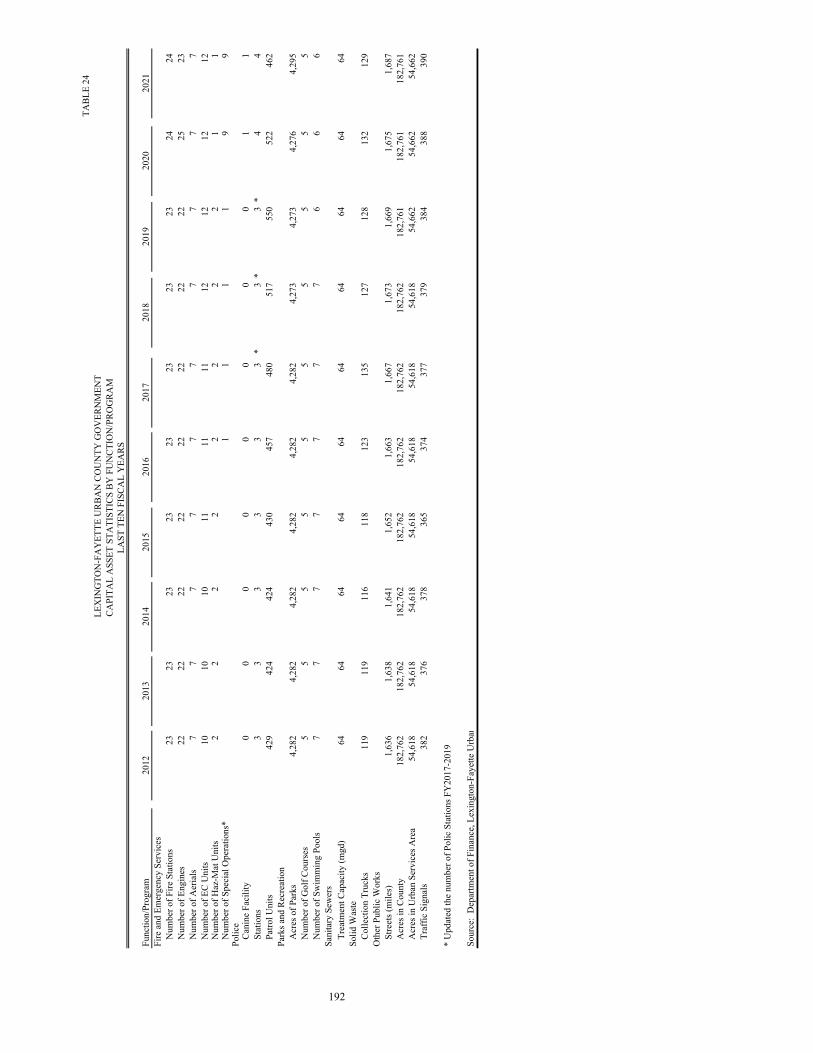
TABL
E 24
Func
tion/
Prog
ram
2012
2013
2014
2015
2016
2017
2018
2019
2020
2021
Fire
and
Em
erge
ncy
Serv
ices
Num
ber o
f Fire
Sta
tions
2323
2323
2323
2323
2424
Num
ber o
f Eng
ines
2222
2222
2222
2222
2523
Num
ber o
f Aer
ials
77
77
77
77
77
Num
ber o
f EC
Uni
ts10
1010
1111
1112
1212
12N
umbe
r of H
az-M
at U
nits
22
22
22
22
11
Num
ber o
f Spe
cial
Ope
ratio
ns*
11
11
99
Polic
e
Cani
ne F
acili
ty0
00
00
00
01
1St
atio
ns3
33
33
3*
3*
3*
44
Patro
l Uni
ts42
942
442
443
045
748
051
755
052
246
2Pa
rks a
nd R
ecre
atio
nA
cres
of P
arks
4,28
24,
282
4,28
24,
282
4,28
24,
282
4,27
34,
273
4,27
64,
295
Num
ber o
f Gol
f Cou
rses
55
55
55
55
55
Num
ber o
f Sw
imm
ing
Pool
s7
77
77
77
66
6Sa
nita
ry S
ewer
sTr
eatm
ent C
apac
ity (m
gd)
6464
6464
6464
6464
6464
Solid
Was
teCo
llect
ion
Truc
ks11
911
911
611
812
313
512
712
813
212
9O
ther
Pub
lic W
orks
Stre
ets (
mile
s)1,
636
1,63
81,
641
1,65
21,
663
1,66
71,
673
1,66
91,
675
1,68
7A
cres
in C
ount
y18
2,76
218
2,76
218
2,76
218
2,76
218
2,76
218
2,76
218
2,76
218
2,76
118
2,76
118
2,76
1A
cres
in U
rban
Ser
vice
s Are
a54
,618
54,6
1854
,618
54,6
1854
,618
54,6
1854
,618
54,6
6254
,662
54,6
62Tr
affic
Sig
nals
382
376
378
365
374
377
379
384
388
390
* U
pdat
ed th
e nu
mbe
r of P
olic
Sta
tions
FY
2017
-201
9
LEX
ING
TON
-FA
YET
TE U
RBA
N C
OU
NTY
GO
VER
NM
ENT
CAPI
TAL
ASS
ET S
TATI
STIC
S BY
FU
NCT
ION
/PRO
GRA
MLA
ST T
EN F
ISCA
L Y
EARS
Sour
ce:
Dep
artm
ent o
f Fin
ance
, Lex
ingt
on-F
ayet
te U
rban
192