Embed Size (px)
Citation preview
CIT
Y O
F SA
CR
AM
EN
TO
, CA
LIFO
RN
IA | 2
015
CO
MP
RE
HE
NS
IVE
AN
NU
AL FIN
AN
CIA
L RE
PO
RT
The City of Sacramento was founded in 1849 and is the
oldest incorporated city in California.
In 1920, city voters adopted a Charter (municipal
constitution) and a City Council/City Manager form of
government.
The City is divided into eight districts.
Elected members of the City Council serve
four-year terms.
The Mayor is elected by all voters in the City. In 2002,
voters approved a measure for the Mayor to serve full-
time. All other Councilmembers are elected by district
and serve part-time.
The Mayor and other Councilmembers have an equal
vote in all matters.
The City of Sacramento currently encompasses
approximately 100 square miles.
The current estimated population is 480,105.
CITY OF SACRAMENTO FACTSKEVIN JOHNSON Mayor
ANGELIQUE ASHBY Mayor Pro Tem, District 1
ALLEN WARREN Vice Mayor, District 2
JEFF HARRIS Councilmember, District 3
STEVE HANSEN Councilmember, District 4
JAY SCHENIRER Councilmember, District 5
ERIC GUERRA Councilmember, District 6
RICK JENNINGS, II Councilmember, District 7
LARRY CARR Councilmember, District 8
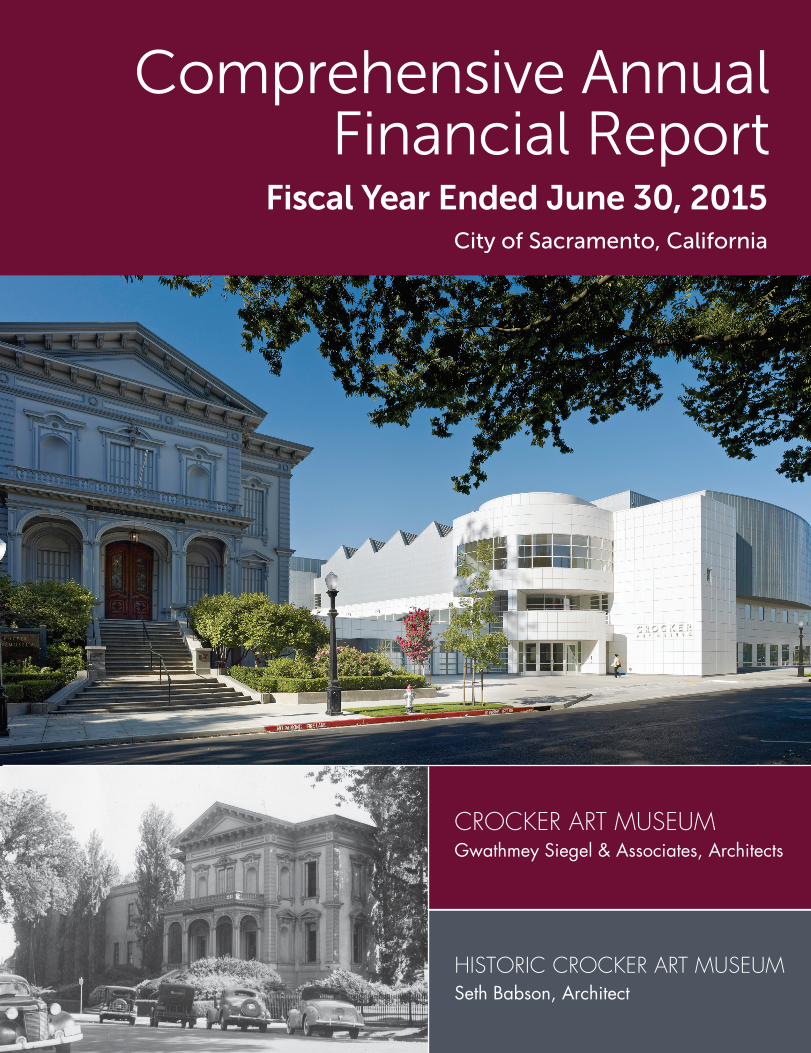
CROCKER ART MUSEUM Gwathmey Siegel & Associates, Architects
www.CityofSacramento.org
Historic Crocker Art Museum (1942) image courtesy of the Center for Sacramento History
New Crocker Art Museum (2014) image courtesy of photographer Bruce Damonte
Fiscal Year Ended June 30, 2015City of Sacramento, California
Comprehensive Annual Financial Report
HISTORIC CROCKER ART MUSEUMSeth Babson, Architect
City of Sacramento
California
Comprehensive Annual Financial Report
Fiscal Year Ended June 30, 2015
Prepared by the Department of Finance, Accounting Division
Leyne Milstein, Director of Finance Dennis Kauffman, Finance Operations Manager
Russ Robertson, Accounting Manager
CITY OF SACRAMENTO, CALIFORNIA COMPREHENSIVE ANNUAL FINANCIAL REPORT
For the Fiscal Year Ended June 30, 2015
TABLE OF CONTENTS
INTRODUCTORY SECTION PAGE
Letter of Transmittal .............................................................................................................................................. i Organization Chart ............................................................................................................................................... v Directory of City Officials ..................................................................................................................................... vi GFOA Certificate ................................................................................................................................................. vii
FINANCIAL SECTION
Independent Auditor’s Report .............................................................................................................................. 1 Management’s Discussion and Analysis (Required Supplementary Information) ............................................ 5
BASIC FINANCIAL STATEMENTS
Government-wide Financial Statements: Statement of Net Position ............................................................................................................................. 19 Statement of Activities ................................................................................................................................... 20
Fund Financial Statements: Balance Sheet - Governmental Funds ......................................................................................................... 24 Reconciliation of the Balance Sheet to the Statement of Net Position –
Governmental Funds ............................................................................................................................... 26 Statement of Revenues, Expenditures and Changes in Fund Balances – Governmental Funds ............. 28 Reconciliation of the Statement of Revenues, Expenditures and Changes
in Fund Balances to the Statement of Activities - Governmental Funds................................................ 30 Statement of Revenues, Expenditures and Change in Fund Balance –
Budget and Actual (Non-GAAP Budgetary Basis) with Budget to GAAP Reconciliation – General Fund .......................................................................................................................................... 32
Statement of Revenues, Expenditures and Change in Fund Balance – Budget and Actual (Non-GAAP Budgetary Basis) with Budget to GAAP Reconciliation – Measure U Fund ...................................................................................................................................... 33
Statement of Net Position – Proprietary Funds ............................................................................................ 34 Statement of Revenues, Expenses and Changes in Net Position – Proprietary Funds ............................ 38 Statement of Cash Flows – Proprietary Funds ............................................................................................ 40 Statement of Fiduciary Net Position – Fiduciary Funds ............................................................................... 44
Statement of Changes in Fiduciary Net Position – Fiduciary Funds ........................................................... 45 Notes to the Financial Statements ..................................................................................................................... 47
REQUIRED SUPPLEMENTARY INFORMATION
Schedule of Changes in Net Pension Liability and Related Ratios – CalPERS Miscellaneous Plan ........... 107 Schedule of Contributions – CalPERS Miscellaneous Plan…………………………………………………… 108 Schedule of Changes in Net Pension Liability and Related Ratios – CalPERS Safety Plan……………… 109 Schedule of Contributions – CalPERS Safety Plan ........................................................................................ 110 Schedule of Changes in Net Pension Liability and Related Ratios – SCERS ............................................... 111 Schedule of Contributions – SCERS ............................................................................................................... 112 Schedule of Funding Progress – Other Post Employment Benefits .............................................................. 113
CITY OF SACRAMENTO, CALIFORNIA COMPREHENSIVE ANNUAL FINANCIAL REPORT
For the Fiscal Year Ended June 30, 2015
TABLE OF CONTENTS, Continued
COMBINING FUND FINANCIAL STATEMENTS PAGE
Other Governmental Funds
Combining Balance Sheet……………………………………………………………….………….……………..115 Combining Statement of Revenues, Expenditures and Changes in Fund Balances………….……………..116
Other Special Revenue Funds: Combining Balance Sheet .................................................................................................... 118 Combining Statement of Revenues, Expenditures and Changes in Fund Balances ......... 120 Schedule of Revenues, Expenditures and Change in Fund Balance –
Budget and Actual, Transportation and Development Special Revenue Fund ..... 122 Schedule of Revenues, Expenditures and Change in Fund Balance –
Budget and Actual, Culture and Leisure Special Revenue Fund .......................... 123 Schedule of Revenues, Expenditures and Change in Fund Balance –
Budget and Actual, Parks and Recreation Special Revenue Fund ....................... 124 Schedule of Revenues, Expenditures and Change in Fund Balance –
Budget and Actual, CCOMWP Special Revenue Fund ......................................... 125 Schedule of Revenues, Expenditures and Change in Fund Balance –
Budget and Actual, Special Districts Special Revenue Fund ................................ 126 Schedule of Revenues, Expenditures and Change in Fund Balance –
Budget and Actual, Cal EPA Special Revenue Fund ............................................. 127
Other Debt Service Funds: Combining Balance Sheet .................................................................................................... 129 Combining Statement of Revenues, Expenditures and Changes in Fund Balances ......... 132
Other Capital Projects Funds: Combining Balance Sheet .................................................................................................... 138 Combining Statement of Revenues, Expenditures and Changes in Fund Balances ......... 140
Permanent Funds: Combining Balance Sheet .................................................................................................... 144 Combining Statement of Revenues, Expenditures and Changes in Fund Balances ......... 146
Other Proprietary Funds
Other Enterprise Funds: Combining Statement of Net Position .................................................................................. 150 Combining Statement of Revenues, Expenses and Changes in Net Position ................... 153 Combining Statement of Cash Flows ................................................................................... 154
CITY OF SACRAMENTO, CALIFORNIA COMPREHENSIVE ANNUAL FINANCIAL REPORT
For the Fiscal Year Ended June 30, 2015
TABLE OF CONTENTS, Continued
Other Proprietary Funds PAGE
Water Fund: Combining Schedule of Net Position .................................................................................... 158 Combining Schedule of Revenues, Expenses and Changes in Net Position .................... 161 Combining Schedule of Cash Flows .................................................................................... 162
Wastewater Fund: Combining Schedule of Net Position .................................................................................... 166 Combining Schedule of Revenues, Expenses and Changes in Net Position .................... 169 Combining Schedule of Cash Flows .................................................................................... 170
Internal Service Funds: Combining Statement of Net Position .................................................................................. 174 Combining Statement of Revenues, Expenses and Changes in Net Position ................... 177 Combining Statement of Cash Flows ................................................................................... 178
Fiduciary Funds
Investment Trust Funds: Combining Statement of Fiduciary Net Position .................................................................. 181 Combining Statement of Changes in Fiduciary Net Position .............................................. 182
Agency Funds: Combining Statement of Changes in Fiduciary Assets and Liabilities ................................ 183
Component Unit
Sacramento Regional Arts Facilities Financing Authority Statement of Net Position………………………………………………………………………185 Statement of Revenues, Expenses and Changes in Net Position………………………….186 Statement of Cash Flows……………………………………………………………………….187
CITY OF SACRAMENTO, CALIFORNIA COMPREHENSIVE ANNUAL FINANCIAL REPORT
For the Fiscal Year Ended June 30, 2015
TABLE OF CONTENTS, Continued
STATISTICAL SECTION (Unaudited) PAGE
Net Position by Component - Last Ten Fiscal Years ........................................................................ 190 Changes in Net Position - Last Ten Fiscal Years .............................................................................. 192 Fund Balances, Governmental Funds - Last Ten Fiscal Years ........................................................ 198 Changes in Fund Balances, Governmental Funds - Last Ten Fiscal Years .................................... 200 Tax Revenues by Source, Governmental Funds - Last Ten Fiscal Years ....................................... 202 Assessed Value and Estimated Actual Value of Taxable Property - Last Ten Fiscal Years ........... 203 Direct and Overlapping Property Tax Rates - Last Ten Fiscal Years ............................................... 204 Principal Property Taxpayers - Current Fiscal Year and Nine Years Ago ........................................ 205 Property Tax Levies and Collections - Last Ten Fiscal Years .......................................................... 207 Ratios of Outstanding Debt by Type - Last Ten Fiscal Years ........................................................... 208 Direct and Overlapping Governmental Activities Debt - As of June 30, 2015 .................................. 210 Legal Debt Margin - Last Ten Fiscal Years ....................................................................................... 211 Demographic and Economic Statistics - Last Ten Calendar Years .................................................. 212 Principal Employers - Current Fiscal Year and Nine Years Ago ...................................................... 213 Successor Agency Trust Fund – Assessed Value of Taxable Property -
Last Ten Fiscal Years .......................................................................................................... 214 Successor Agency Trust Fund – Top 10 Parcels Appealing Assessed Valuation -
At Risk of Reduction - As of June 30, 2015 ........................................................................ 218 Successor Agency Trust Fund – Principal Property Taxpayers -
Current Fiscal Year and Nine Years Ago ............................................................................ 229 Successor Agency Trust Fund – Debt Coverage Analysis -
Last Ten Fiscal Years .......................................................................................................... 240 Full-time Equivalent Employees by Function/Program - Last Ten Fiscal Years .............................. 245 Operating Indicators by Function/Program - Last Ten Fiscal Years ................................................ 246 Capital Asset Statistics by Function/Program - Last Ten Fiscal Years ........................................... 247 Miscellaneous Statistics - Current Fiscal Year and Nine Years Ago ................................................ 248

Introductory Section
John F. Shirey City Manager
City Hall 915 I Street, Fifth Floor
Sacramento, CA 95814-2604 916-808-5704
December 24, 2015
Honorable Mayor and City Council City of Sacramento, California:
Dear Mayor and Members of the City Council:
We are pleased to transmit to you the Comprehensive Annual Financial Report (CAFR) for the City of Sacramento (City) for the fiscal year ended June 30, 2015. Article IX of the City Charter, federal and state law requires that the City issue an annual report on its financial position and activity, and that the report be audited by an independent firm of certified public accountants. Vavrinek, Trine, Day & Co., LLP, a statewide certified public accounting firm, performed the audit for the fiscal year ended June 30, 2015. Their unmodified (“clean”) opinion has been included as the first component of the financial section of the CAFR.
Management assumes full responsibility for the completeness and reliability of the information contained in this report, based upon a comprehensive framework of internal control that has been established for this purpose. Because the cost of internal control should not exceed anticipated benefits, the objective is to provide reasonable rather than absolute assurance that the financial statements are free of any material misstatements.
Management’s discussion and analysis (MD&A) immediately follows the independent auditor’s report and provides a narrative introduction, overview, and analysis of the basic financial statements. MD&A complements this letter of transmittal and should be read in conjunction with it.
PROFILE OF THE CITY
The City of Sacramento, capital of the State of California, was established in 1849. The sixth largest city in California based on population, Sacramento also serves as the seat of Sacramento County government. The State of California Department of Finance estimates the population on January 1, 2015 at 480,105 for the City and 1,470,912 for the County of Sacramento. Encompassing 99 square miles, Sacramento is located in the northern section of California’s Central Valley at the confluence of the Sacramento and American rivers.
Sacramento is a charter city operating under a Council-Manager form of government. The City provides a full range of municipal services including police, fire, emergency medical response, water, wastewater, storm drainage, solid waste, construction and maintenance of streets and parks, community development, recreational and cultural activities, economic development, and administrative services.
i
REPORTING ENTITY
This CAFR presents the financial status of the City and its five component units:
Sacramento City Financing Authority (SCFA) Sacramento Public Financing Authority (SPFA) Sacramento City Employees’ Retirement System (SCERS) Successor Agency to the Redevelopment Agency of the City of Sacramento (RASA) Sacramento Regional Arts Facilities Financing Authority (SRAFFA)
Component units are separate legal entities included in this report due to significant operational or financial relationships with the City as defined below:
SCFA and SPFA are entities created to issue debt to finance City projects. Both are reported on a blended basis as part of the primary government because the boards are composed of all City Council members.
SCERS, a single employer pension plan for certain City employees and retirees, is reported as a fiduciary-type component unit. The SCERS pension plan was closed to new enrollment of employees in 1978.
RASA was created to serve as the custodian for the assets and to wind down the affairs of the former Redevelopment Agency of the City of Sacramento. RASA is reported as a fiduciary-type component unit.
SRAFFA was created for the purpose of financing the expansion of the H Street Theater complex and is a discretely presented component unit. Discretely presented component units do not function as an integral part of the primary government. As such, SRAFFA is reported in a separate column in the government-wide financial statements to differentiate its financial position and operational results from those of the City.
BUDGET INFORMATION
The City Charter requires that the City Manager submit a proposed budget to the City Council at least 60 days prior to the start of each fiscal year. Once approved by City Council, the annual budget serves as the foundation for the City‘s financial planning, control and reporting. Budgetary control is maintained at the department level by fund. Budgetary control for multi-year projects is maintained at the individual project level by fund. Additional budgetary information can be found in Note 1 to the financial statements and on the City’s website.
LOCAL ECONOMY
The regional economy and employment base continues its long-term transition from a state government concentration to a diverse economic base including health care providers, high-tech manufacturers, software development companies, biotechnology and medical research laboratories, food processors, and medical equipment manufacturers. The region is also a transportation hub served by air cargo airports, an international airport, a deep water shipping
ii
port, two major interstate freeways, freight and passenger rail lines, and an extensive regional commuter bus and light-rail system. These key industries interface with Sacramento’s service, hospitality and government employers.
Like most cities in the country, Sacramento continued its economic recovery in 2015. As of June 2015, unemployment for the Sacramento metropolitan area and Sacramento County was 5.6% and 5.8%, respectively, compared to 6.9% and 7.1%, respectively, as of June 30, 2014. According to the latest University of California, Los Angeles Economic Forecast, growth in employment in California is expected to continue in 2016.
The long-term forecast for the City’s secured property taxes continues to be positive with the addition of the Golden 1 Center in the downtown area, lifting of the building moratorium in North Natomas and other development projects underway throughout the city. The new Golden 1 Center is expected to transform the former Downtown Plaza area, now known as Downtown Commons, into a center of entertainment and activity providing Sacramento with a first-class venue for sports, entertainment and cultural events.
While there is an expectation of continued economic growth, recent economic data indicates that economic growth in the Sacramento region will be slow, and will continue to generally lag behind national trends and other areas of California. It is encouraging that the most recent edition of the Brookings Institution Metro Monitor (July 2015) showed growth in employment in the first quarter of 2015 along with higher housing values and a slight increase of total value of goods and services produced in the metro area.
BUDGET INITIATIVES AND LONG-TERM FINANCIAL PLANNING
While revenues have improved, the City continues to carefully prioritize spending going forward to meet the critical needs over the long-term. Measure U, a voter approved 1/2 cent sales and use tax, continues to provide resources to protect and restore vital City programs and services. However, given the temporary nature of these resources, it remains critical that we continue to reevaluate not only how we deliver services and meet citizen needs, but also which programs and services the City can afford to deliver if expenditure growth continues to outpace that of revenue. The City’s management team continues to look for ways to build a stronger, more sustainable fiscal framework and to provide the leadership and discipline needed to ensure that we are implementing long-term solutions to address the City’s financial challenges.
RELEVANT FINANCIAL POLICIES
The City maintains a General Fund Economic Uncertainty Reserve (EUR) for the purpose of bridging a gap between projected revenue and expenditures during periods of significant revenue declines and/or expenditure growth and to ensure the City has adequate resources in case of an emergency or unforeseen events. The City Council’s stated goal is to gradually achieve a reserve balance equal to 10% of annual General Fund revenue. The City Council added $0.4 million to the EUR in the approved budget for fiscal year 2014/15. The Council also directed that unbudgeted one-time general revenue received in a fiscal year, not required to balance the budget as part of the midyear review or year-end close for that fiscal year, be added to the EUR. Unbudgeted one-time general revenue of $4.85 million was added to the EUR during year-end close bringing the balance to $38.9 million, approximately 9.7% of estimated
iii
iv
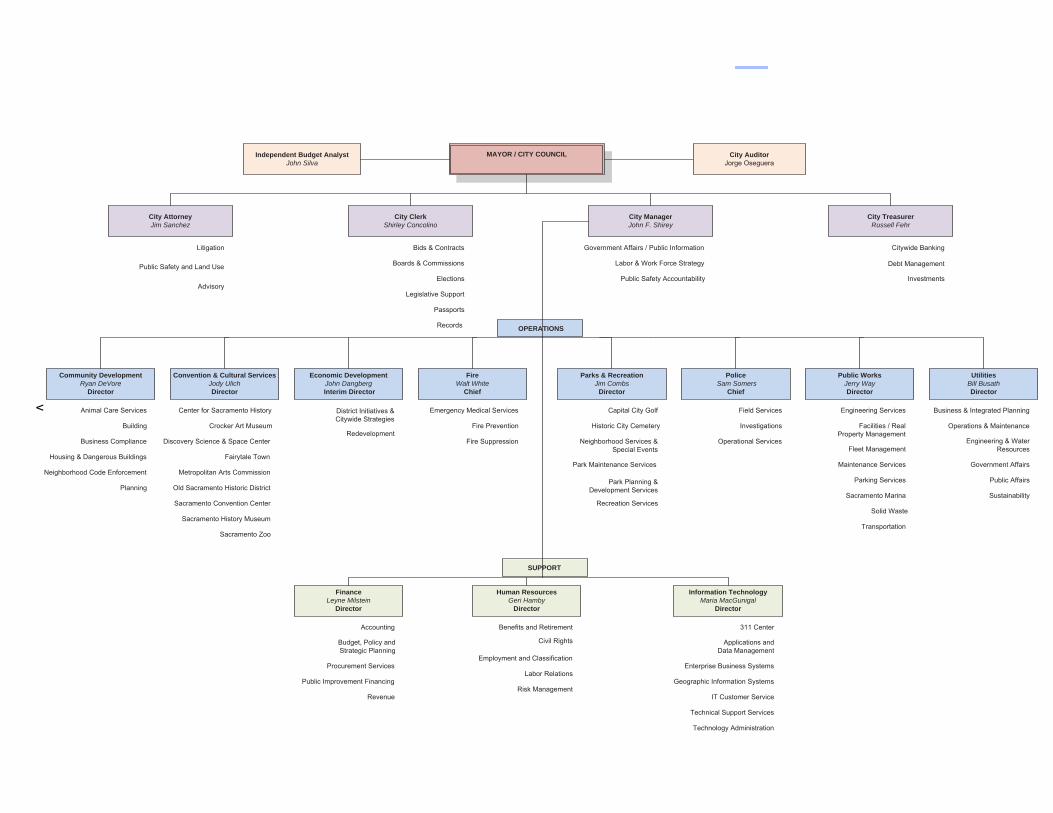
MAYOR / CITY COUNCIL
City ClerkShirley Concolino
City ManagerJohn F. Shirey
City AttorneyJim Sanchez
City TreasurerRussell Fehr
PoliceSam Somers
Chief
FireWalt White
Chief
Parks & RecreationJim Combs
Director
Convention & Cultural ServicesJody UlichDirector
Public WorksJerry WayDirector
Information TechnologyMaria MacGunigal
Director
Finance Leyne Milstein
Director
Human ResourcesGeri Hamby
Director
Economic DevelopmentJohn DangbergInterim Director
UtilitiesBill BusathDirector
Independent Budget AnalystJohn Silva
Community DevelopmentRyan DeVore
Director
OPERATIONS
SUPPORT
City Auditor
v
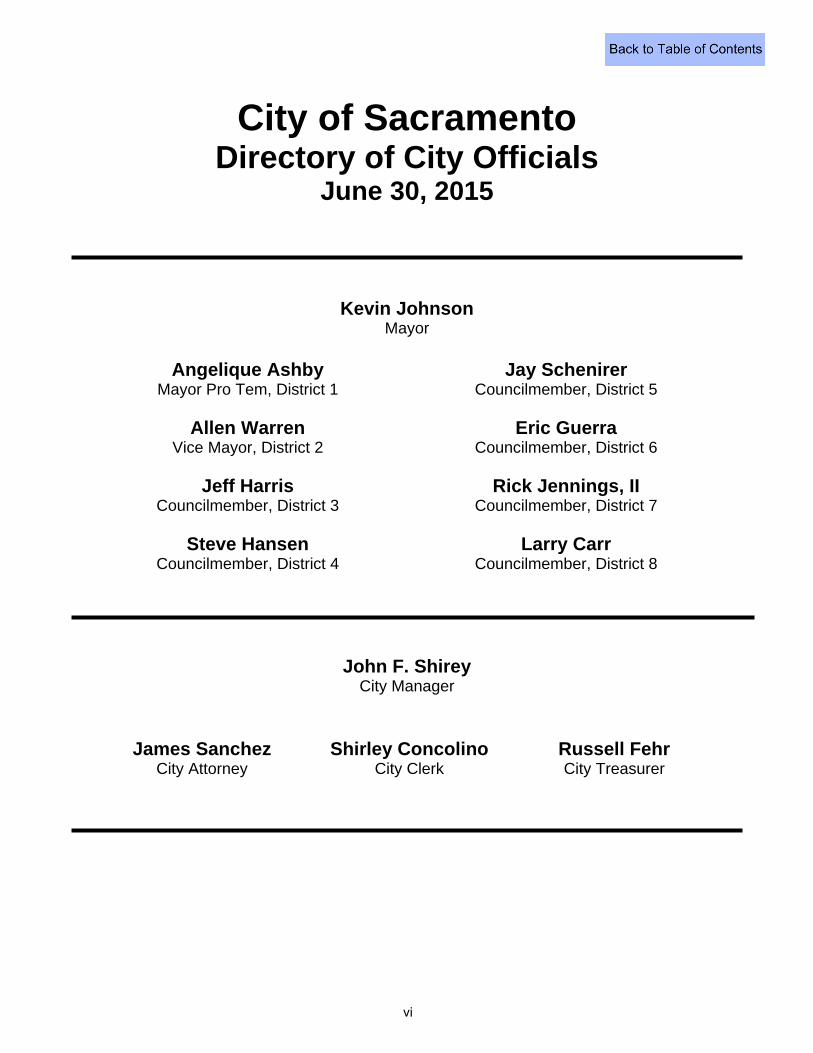
City of Sacramento Directory of City Officials
June 30, 2015
Kevin Johnson Mayor
Angelique Ashby Mayor Pro Tem, District 1
Jay Schenirer Councilmember, District 5
Allen Warren Vice Mayor, District 2
Eric Guerra Councilmember, District 6
Jeff Harris Councilmember, District 3
Rick Jennings, II Councilmember, District 7
Steve Hansen Councilmember, District 4
Larry Carr Councilmember, District 8
John F. Shirey City Manager
James Sanchez City Attorney
Shirley Concolino City Clerk
Russell Fehr City Treasurer
vi
vii

THIS PAGE INTENTIONALLY LEFT BLANK
viii

Financial Section
1
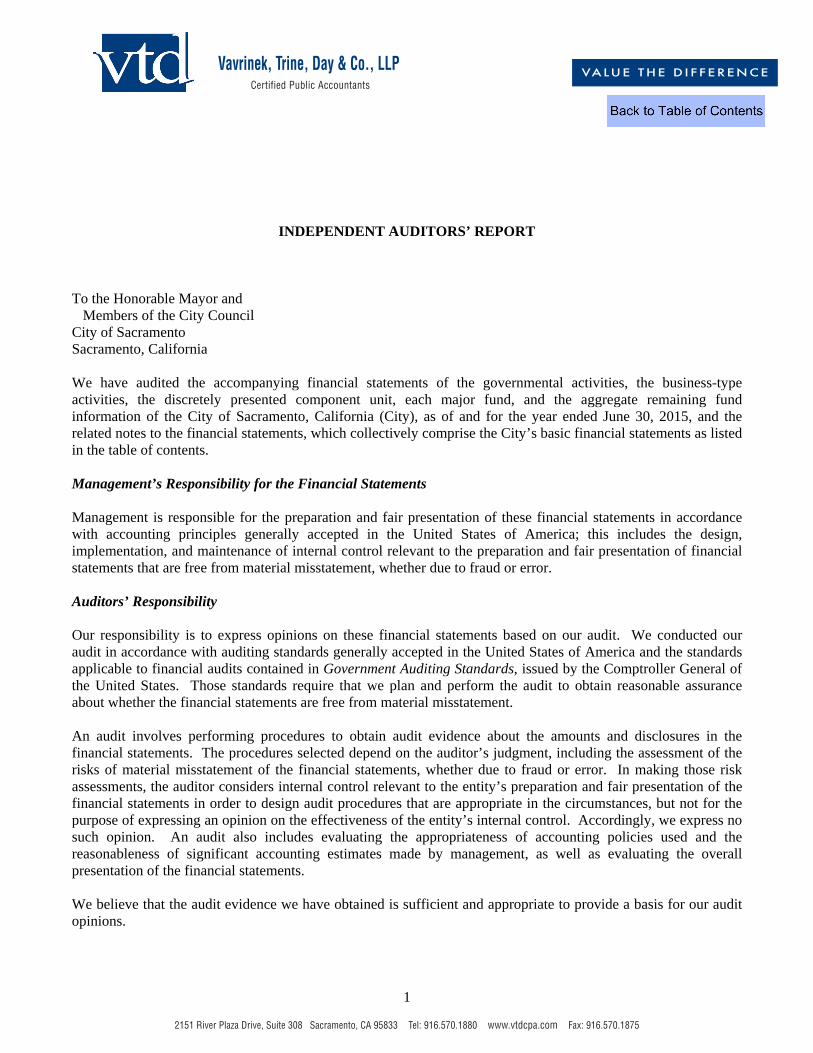
INDEPENDENT AUDITORS’ REPORT
To the Honorable Mayor and Members of the City Council City of Sacramento Sacramento, California
We have audited the accompanying financial statements of the governmental activities, the business-type activities, the discretely presented component unit, each major fund, and the aggregate remaining fund information of the City of Sacramento, California (City), as of and for the year ended June 30, 2015, and the related notes to the financial statements, which collectively comprise the City’s basic financial statements as listed in the table of contents.
Management’s Responsibility for the Financial Statements
Management is responsible for the preparation and fair presentation of these financial statements in accordance with accounting principles generally accepted in the United States of America; this includes the design, implementation, and maintenance of internal control relevant to the preparation and fair presentation of financial statements that are free from material misstatement, whether due to fraud or error.
Auditors’ Responsibility
Our responsibility is to express opinions on these financial statements based on our audit. We conducted our audit in accordance with auditing standards generally accepted in the United States of America and the standards applicable to financial audits contained in Government Auditing Standards, issued by the Comptroller General of the United States. Those standards require that we plan and perform the audit to obtain reasonable assurance about whether the financial statements are free from material misstatement.
An audit involves performing procedures to obtain audit evidence about the amounts and disclosures in the financial statements. The procedures selected depend on the auditor’s judgment, including the assessment of the risks of material misstatement of the financial statements, whether due to fraud or error. In making those risk assessments, the auditor considers internal control relevant to the entity’s preparation and fair presentation of the financial statements in order to design audit procedures that are appropriate in the circumstances, but not for the purpose of expressing an opinion on the effectiveness of the entity’s internal control. Accordingly, we express no such opinion. An audit also includes evaluating the appropriateness of accounting policies used and the reasonableness of significant accounting estimates made by management, as well as evaluating the overall presentation of the financial statements.
We believe that the audit evidence we have obtained is sufficient and appropriate to provide a basis for our audit opinions.
2151 River Plaza Drive, Suite 308 Sacramento, CA 95833 Tel: 916.570.1880 www.vtdcpa.com Fax: 916.570.1875
Vavrinek, Trine, Day & Co., LLPCertified Public Accountants
VALUE THE D IFFERENCE
2
Opinions
In our opinion, the financial statements referred to above present fairly, in all material respects, the respective financial position of the governmental activities, the business-type activities, the discretely presented component unit, each major fund, and the aggregate remaining fund information of the City as of June 30, 2015, and the respective changes in financial position and, where applicable, cash flows thereof and the respective budgetary comparisons for the General Fund and the Measure U Special Revenue Fund for the year then ended in accordance with accounting principles generally accepted in the United States of America.
Emphasis of Matter
Implementation of New Accounting Standards
As described in Note 1 to the financial statements, the City adopted new accounting guidance, Governmental Accounting Standards Board (GASB) Statements No. 68, Accounting and Financial Reporting for Pensions – an amendment of GASB Statement No. 27 and No. 71, Pension Transition For Contributions Made Subsequent to the Measurement Date - an amendment of GASB Statement No. 68, effective July 1, 2014. Our opinion is not modified with respect to this matter.
Other Matters
Required Supplementary Information
Accounting principles generally accepted in the United States of America require that the management’s discussion and analysis, schedule of funding progress and pension schedules as listed in the table of contents be presented to supplement the basic financial statements. Such information, although not a part of the basic financial statements, is required by the Governmental Accounting Standards Board who considers it to be an essential part of financial reporting for placing the basic financial statements in an appropriate operational, economic, or historical context. We have applied certain limited procedures to the required supplementary information in accordance with auditing standards generally accepted in the United States of America, which consisted of inquiries of management about the methods of preparing the information and comparing the information for consistency with management’s responses to our inquiries, the basic financial statements, and other knowledge we obtained during our audit of the basic financial statements. We do not express an opinion or provide any assurance on the information because the limited procedures do not provide us with sufficient evidence to express an opinion or provide any assurance.
Other Information
Our audit was conducted for the purpose of forming opinions on the financial statements that collectively comprise the City’s basic financial statements. The introductory section, combining and individual nonmajor fund financial statements and schedules, and statistical section are presented for purposes of additional analysis and are not a required part of the basic financial statements.
The combining and individual nonmajor fund financial statements and schedules are the responsibility of management and were derived from and relate directly to the underlying accounting and other records used to prepare the basic financial statements. Such information has been subjected to the auditing procedures applied in the audit of the basic financial statements and certain additional procedures, including comparing and reconciling such information directly to the underlying accounting and other records used to prepare the basic financial statements or to the basic financial statements themselves, and other additional procedures in accordance with auditing standards generally accepted in the United States of America. In our opinion, the combining and individual nonmajor fund financial statements and schedules are fairly stated, in all material respects, in relation to the basic financial statements as a whole.
The introductory and statistical sections have not been subjected to the auditing procedures applied in the audit of the basic financial statements and, accordingly, we do not express an opinion or provide any assurance on them.
3
Other Reporting Required by Government Auditing Standards
In accordance with Government Auditing Standards, we have also issued our report dated December 24, 2015, on our consideration of the City’s internal control over financial reporting and on our tests of its compliance with certain provisions of laws, regulations, contracts, and grant agreements and other matters. The purpose of that report is to describe the scope of our testing of internal control over financial reporting and compliance and the results of that testing, and not to provide an opinion on internal control over financial reporting or on compliance. That report is an integral part of an audit performed in accordance with Government Auditing Standards in considering the City’s internal control over financial reporting and compliance.
Sacramento, California December 24, 2015

THIS PAGE INTENTIONALLY LEFT BLANK
4
City of Sacramento Management’s Discussion and Analysis (Required Supplementary Information - Unaudited) For the Fiscal Year Ended June 30, 2015
This section of the City’s CAFR presents a narrative overview and analysis of the City’s financial activities for the fiscal year ended June 30, 2015. City management recommends this information be read in conjunction with the transmittal letter located in the introductory section, and with the City’s financial statements which follow this discussion.
FINANCIAL HIGHLIGHTS
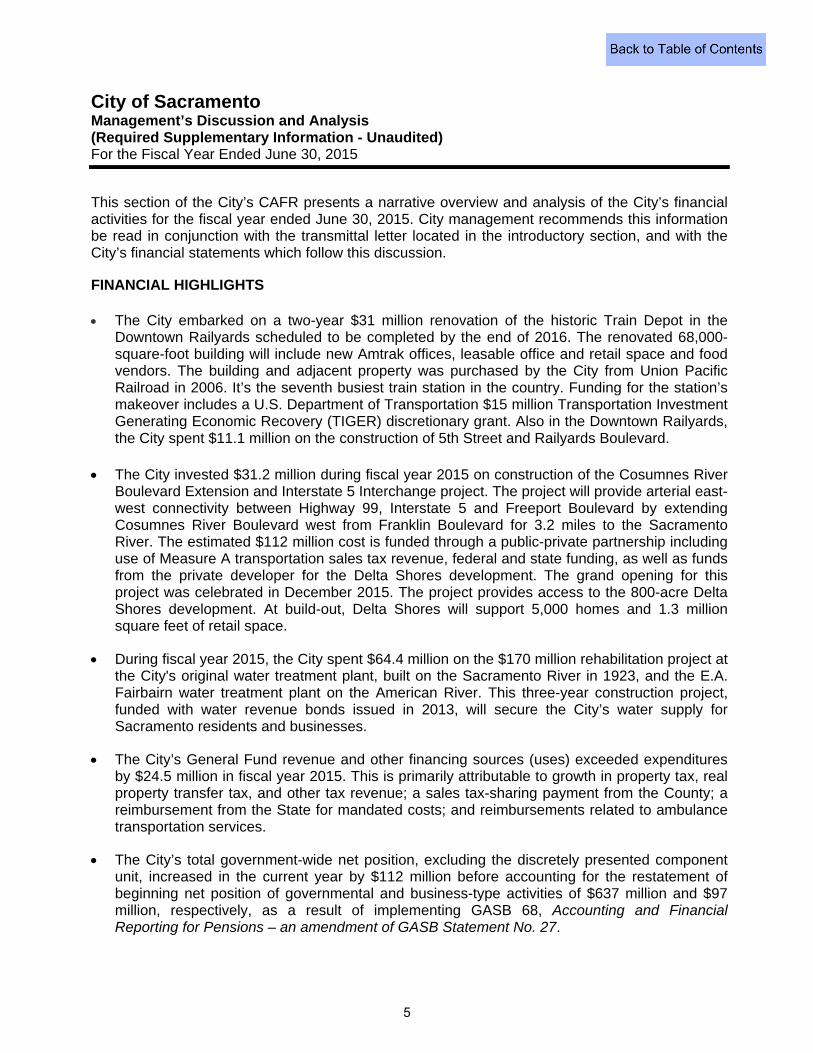
The City embarked on a two-year $31 million renovation of the historic Train Depot in theDowntown Railyards scheduled to be completed by the end of 2016. The renovated 68,000-square-foot building will include new Amtrak offices, leasable office and retail space and foodvendors. The building and adjacent property was purchased by the City from Union PacificRailroad in 2006. It’s the seventh busiest train station in the country. Funding for the station’smakeover includes a U.S. Department of Transportation $15 million Transportation InvestmentGenerating Economic Recovery (TIGER) discretionary grant. Also in the Downtown Railyards,the City spent $11.1 million on the construction of 5th Street and Railyards Boulevard.
The City invested $31.2 million during fiscal year 2015 on construction of the Cosumnes RiverBoulevard Extension and Interstate 5 Interchange project. The project will provide arterial east-west connectivity between Highway 99, Interstate 5 and Freeport Boulevard by extendingCosumnes River Boulevard west from Franklin Boulevard for 3.2 miles to the SacramentoRiver. The estimated $112 million cost is funded through a public-private partnership includinguse of Measure A transportation sales tax revenue, federal and state funding, as well as fundsfrom the private developer for the Delta Shores development. The grand opening for thisproject was celebrated in December 2015. The project provides access to the 800-acre DeltaShores development. At build-out, Delta Shores will support 5,000 homes and 1.3 millionsquare feet of retail space.
During fiscal year 2015, the City spent $64.4 million on the $170 million rehabilitation project atthe City's original water treatment plant, built on the Sacramento River in 1923, and the E.A.Fairbairn water treatment plant on the American River. This three-year construction project,funded with water revenue bonds issued in 2013, will secure the City’s water supply forSacramento residents and businesses.
The City’s General Fund revenue and other financing sources (uses) exceeded expendituresby $24.5 million in fiscal year 2015. This is primarily attributable to growth in property tax, realproperty transfer tax, and other tax revenue; a sales tax-sharing payment from the County; areimbursement from the State for mandated costs; and reimbursements related to ambulancetransportation services.
The City’s total government-wide net position, excluding the discretely presented componentunit, increased in the current year by $112 million before accounting for the restatement ofbeginning net position of governmental and business-type activities of $637 million and $97million, respectively, as a result of implementing GASB 68, Accounting and FinancialReporting for Pensions – an amendment of GASB Statement No. 27.
5
City of Sacramento Management’s Discussion and Analysis (Continued) (Required Supplementary Information - Unaudited) For the Fiscal Year Ended June 30, 2015
OVERVIEW OF THE FINANCIAL STATEMENTS
The City’s CAFR consists of four main components: (1) MD&A, (2) the basic financial statements, (3) required supplementary information, and (4) combining non-major fund financial statements.The basic financial statements include two kinds of statements that present different views of theCity, the government-wide and the fund financial statements.
The government-wide financial statements provide both long-term and short-term informationabout the City’s overall financial status.
The fund financial statements focus on individual parts of the City government, reporting theCity’s operations in more detail than the government-wide statements.
The basic financial statements also include notes that provide additional information essential to understanding the data contained in the government-wide and fund financial statements. The statements and notes are followed by required supplementary information: the Schedule of Changes in Net Pension Liability and Related Ratios, the Schedule of Contributions for the City’s pension plans, and the Schedule of Funding Progress for the City’s other post-employment benefit plan. In addition to these required elements, we have included combining statements and schedules that provide details about the City’s other governmental funds, the Water enterprise fund, the Wastewater enterprise fund, other enterprise funds, internal service funds, investment trust funds, agency funds, and the discretely-presented component unit, each of which is presented in a column in the basic financial statements.
Government-wide Financial Statements
The government-wide statements report information about the City as a whole using accounting methods similar to those used by private-sector companies. The statement of net position includes all of the City’s assets and liabilities, as well as any deferred outflows or inflows of resources. The statement of activities includes all current year revenues and expenses regardless of when cash is received or paid. These government-wide statements report the City’s net position and how the City’s net position has changed during the fiscal year. Over time, increases or decreases in net position may serve as a useful indicator of whether the financial health of the City is improving or deteriorating.
The government-wide financial statements of the City are divided as follows:
Governmental activities - Most of the City’s basic services are included here, such as police,fire, public works, community development, parks and recreation, and general government.Taxes and state and federal grants finance most of these activities.
Business-type activities - Certain services provided by the City are funded by customer fees.Among these are the City’s utility services, convention center, and off-street parking facilities.
Component unit - The City includes the Sacramento Regional Arts Facilities FinancingAuthority in its basic financial statements because, although legally separate, the City isfinancially accountable for it.
6
City of Sacramento Management’s Discussion and Analysis (Continued) (Required Supplementary Information - Unaudited) For the Fiscal Year Ended June 30, 2015
Fund Financial Statements
A fund is a group of related accounts that is used to maintain control over resources that have been segregated for specific activities or objectives. Fund financial statements provide more detailed information about the City’s largest funds, not the City as a whole.
The City has three types of fund financial statements:
Governmental funds - Governmental fund statements tell how general government servicessuch as police, fire and public works were financed in the short-term as well as what remainsfor future spending. Most of the City’s basic services are included in governmental funds,which focus on (1) short-term inflows and outflows of spendable resources, and (2) theremaining year-end balances available for spending. Because this information does notencompass the additional long-term focus of the government-wide statements, reconciliationsthat explain the relationship (or differences) between governmental funds and governmentalactivities follow the governmental fund statements.
Proprietary funds - Services for which customer fees are intended to finance the costs ofoperations are generally reported in proprietary funds. Proprietary fund statements, like thegovernment-wide statements, provide short-term and long-term financial information about theactivities the City operates like businesses, such as utility services.
Fiduciary funds - Fiduciary fund statements provide information about the financialrelationships in which the City acts solely as a trustee or agent for the benefit of others, towhom the resources belong. The City is the trustee, or fiduciary, for a closed pension plan. Itis also responsible for other assets, reported in an investment trust fund, which because oftrust agreements, can be used only for the trust beneficiaries. The City elected to serve as thesuccessor agency for its former redevelopment agency which was dissolved by state law. Thesuccessor agency activity is accounted for in a private purpose trust fund.
The City is responsible for ensuring that the assets reported in these funds are used for theirintended purposes. All of the City’s fiduciary activities are reported in a separate statement offiduciary net position and a statement of changes in fiduciary net position. We exclude theseactivities from the City’s government-wide financial statements because the City cannot usethese resources to finance its operations.
FINANCIAL ANALYSIS OF THE GOVERNMENT-WIDE STATEMENTS
This section provides analysis of the government-wide financial statements including long-term and short-term information about the City’s overall financial condition. The following tables address the financial results of the City as a whole.
7
City of Sacramento Management’s Discussion and Analysis (Continued) (Required Supplementary Information - Unaudited) For the Fiscal Year Ended June 30, 2015
TotalPercent
2015 2014 2015 2014 2015 2014 Change
Current and other assets 697$ 647$ 466$ 528$ 1,163$ 1,175$ -1.0%
Capital assets 1,783 1,747 1,148 1,064 2,931 2,811 4.3%
Total assets 2,480 2,394 1,614 1,592 4,094 3,986 2.7%
Deferred outflows of resources 68 15 21 13 89 28 217.9%
Long-term liabilities 1,309 728 681 614 1,990 1,342 48.3%
Other liabilities 73 62 45 45 118 107 10.3%
Total Liabilities 1,382 790 726 659 2,108 1,449 45.5%
Deferred inflows of resources 122 8 18 - 140 8 1650.0%
Net positionNet investment in
capital assets 1,445 1,394 748 734 2,193 2,128 3.1%
Restricted 191 187 36 34 227 221 2.7%
Unrestricted (592) 30 107 178 (485) 208 -333.2%
Total net position 1,044$ 1,611$ 891$ 946$ 1,935$ 2,557$ -24.3%
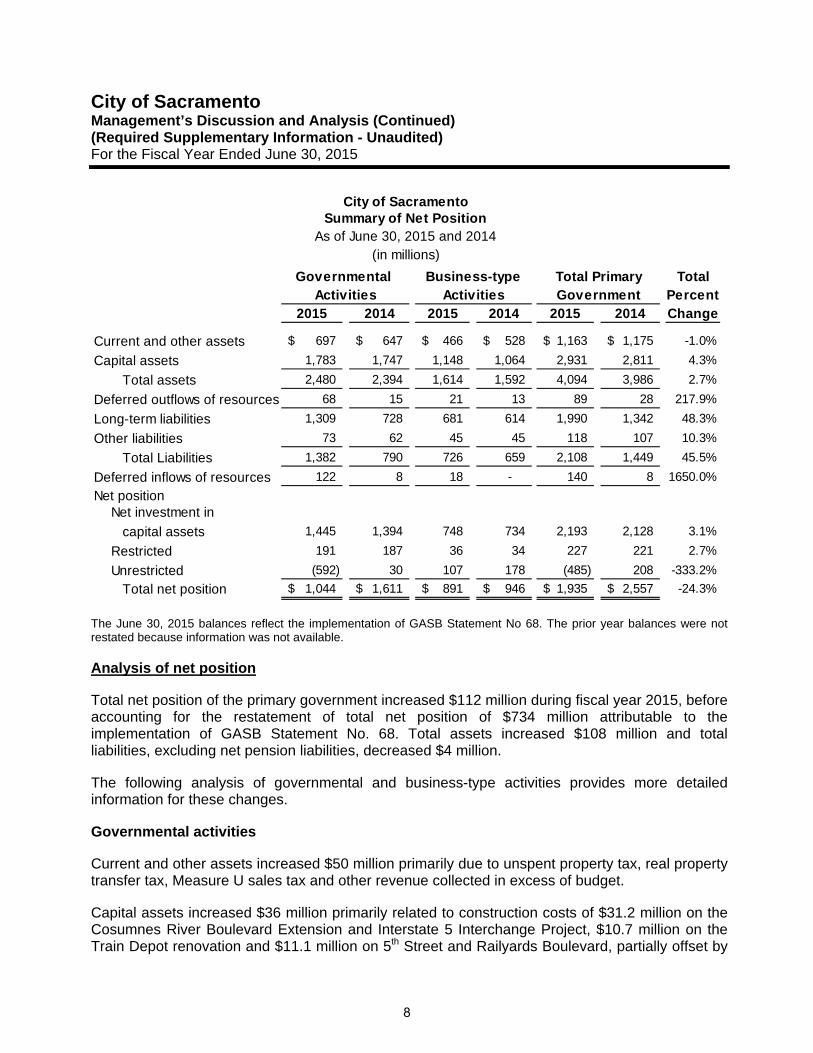
Activities Activities Government
City of SacramentoSummary of Net Position
As of June 30, 2015 and 2014(in millions)
Governmental Business-type Total Primary
The June 30, 2015 balances reflect the implementation of GASB Statement No 68. The prior year balances were not restated because information was not available.
Analysis of net position
Total net position of the primary government increased $112 million during fiscal year 2015, before accounting for the restatement of total net position of $734 million attributable to the implementation of GASB Statement No. 68. Total assets increased $108 million and total liabilities, excluding net pension liabilities, decreased $4 million.
The following analysis of governmental and business-type activities provides more detailed information for these changes.
Governmental activities
Current and other assets increased $50 million primarily due to unspent property tax, real property transfer tax, Measure U sales tax and other revenue collected in excess of budget.
Capital assets increased $36 million primarily related to construction costs of $31.2 million on the Cosumnes River Boulevard Extension and Interstate 5 Interchange Project, $10.7 million on the Train Depot renovation and $11.1 million on 5th Street and Railyards Boulevard, partially offset by
8
City of Sacramento Management’s Discussion and Analysis (Continued) (Required Supplementary Information - Unaudited) For the Fiscal Year Ended June 30, 2015
depreciation expense. More detailed capital asset information is located in the Capital Assets section of this MD&A and in Note 4 to the financial statements.
Implementation of GASB Statement No. 68 resulted in significant balances reported in the government-wide financial statements. In addition to the required reporting of the net pension liabilities, the City is required to report deferred outflows of resources for the recognition of pension contributions subsequent to the actuarial valuation measurement date and deferred inflows of resources for the recognition of the net differences between projected and actual earnings on plan investments. Changes in the deferred outflows of resources and deferred inflows of resources are reported as a component of pension expense. Recognition of the City’s net pension liabilities for governmental activities in the government-wide financial statements resulted in a deficit balance in unrestricted net position of $592 million.
Net investments in capital assets increased $51 million due to capital asset additions and retirement of capital-related debt, partially offset by depreciation expense.
Business-type activities
Current and other assets of business-type activities decreased $62 million compared to the prior year primarily due to water and wastewater capital project spending of 2013 bond proceeds.
Capital assets increased $84 million due to capital asset additions including rehabilitation of the water treatment plants, partially offset by current year depreciation. More detailed capital asset information is located in the Capital Assets section of this MD&A and in Note 4 to the financial statements.
Long-term liabilities, excluding net pension liabilities, decreased $23 million primarily due to retirement of existing debt. More detailed information about long-term liabilities can be found in Note 7 to the financial statements.
Net investments in capital assets increased $14 million due to capital asset additions and retirement of capital-related debt, partially offset by depreciation expense.
Recognition of the City’s net pension liabilities for business-type activities, partially offset by positive fiscal year 2015 operating results, led to the $71 million reduction in unrestricted net position compared to the prior year.
9
City of Sacramento Management’s Discussion and Analysis (Continued) (Required Supplementary Information - Unaudited) For the Fiscal Year Ended June 30, 2015
TotalPercent
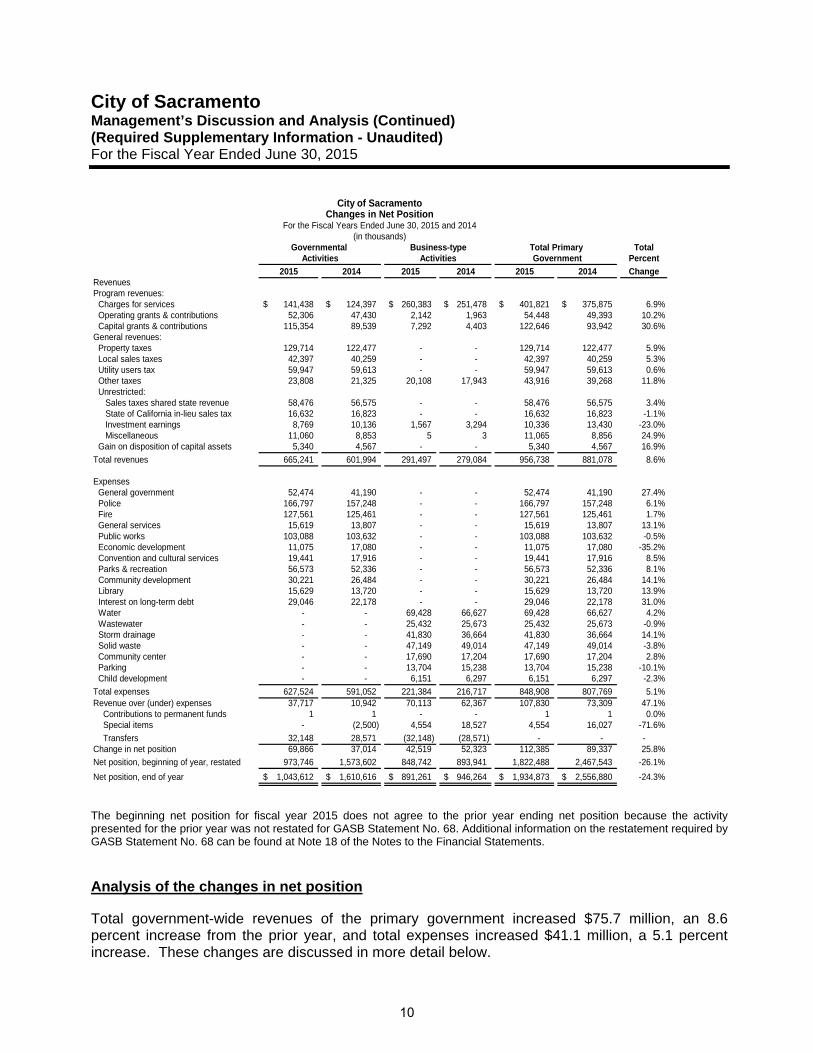
2015 2014 2015 2014 2015 2014 ChangeRevenuesProgram revenues:
Charges for services 141,438$ 124,397$ 260,383$ 251,478$ 401,821$ 375,875$ 6.9%Operating grants & contributions 52,306 47,430 2,142 1,963 54,448 49,393 10.2%Capital grants & contributions 115,354 89,539 7,292 4,403 122,646 93,942 30.6%
General revenues:Property taxes 129,714 122,477 - - 129,714 122,477 5.9%Local sales taxes 42,397 40,259 - - 42,397 40,259 5.3%Utility users tax 59,947 59,613 - - 59,947 59,613 0.6%Other taxes 23,808 21,325 20,108 17,943 43,916 39,268 11.8%Unrestricted: Sales taxes shared state revenue 58,476 56,575 - - 58,476 56,575 3.4% State of California in-lieu sales tax 16,632 16,823 - - 16,632 16,823 -1.1% Investment earnings 8,769 10,136 1,567 3,294 10,336 13,430 -23.0% Miscellaneous 11,060 8,853 5 3 11,065 8,856 24.9%Gain on disposition of capital assets 5,340 4,567 - - 5,340 4,567 16.9%
Total revenues 665,241 601,994 291,497 279,084 956,738 881,078 8.6%
ExpensesGeneral government 52,474 41,190 - - 52,474 41,190 27.4%Police 166,797 157,248 - - 166,797 157,248 6.1%Fire 127,561 125,461 - - 127,561 125,461 1.7%General services 15,619 13,807 - - 15,619 13,807 13.1%Public works 103,088 103,632 - - 103,088 103,632 -0.5%Economic development 11,075 17,080 - - 11,075 17,080 -35.2%Convention and cultural services 19,441 17,916 - - 19,441 17,916 8.5%Parks & recreation 56,573 52,336 - - 56,573 52,336 8.1%Community development 30,221 26,484 - - 30,221 26,484 14.1%Library 15,629 13,720 - - 15,629 13,720 13.9%Interest on long-term debt 29,046 22,178 - - 29,046 22,178 31.0%Water - - 69,428 66,627 69,428 66,627 4.2%Wastewater - - 25,432 25,673 25,432 25,673 -0.9%Storm drainage - - 41,830 36,664 41,830 36,664 14.1%Solid waste - - 47,149 49,014 47,149 49,014 -3.8%Community center - - 17,690 17,204 17,690 17,204 2.8%Parking - - 13,704 15,238 13,704 15,238 -10.1%Child development - - 6,151 6,297 6,151 6,297 -2.3%
Total expenses 627,524 591,052 221,384 216,717 848,908 807,769 5.1%Revenue over (under) expenses 37,717 10,942 70,113 62,367 107,830 73,309 47.1%
Contributions to permanent funds 1 1 - - 1 1 0.0%Special items - (2,500) 4,554 18,527 4,554 16,027 -71.6%
Transfers 32,148 28,571 (32,148) (28,571) - - -Change in net position 69,866 37,014 42,519 52,323 112,385 89,337 25.8%
Net position, beginning of year, restated 973,746 1,573,602 848,742 893,941 1,822,488 2,467,543 -26.1%
Net position, end of year 1,043,612$ 1,610,616$ 891,261$ 946,264$ 1,934,873$ 2,556,880$ -24.3%
Activities Activities Government
City of SacramentoChanges in Net Position
For the Fiscal Years Ended June 30, 2015 and 2014(in thousands)
Governmental Business-type Total Primary
The beginning net position for fiscal year 2015 does not agree to the prior year ending net position because the activity presented for the prior year was not restated for GASB Statement No. 68. Additional information on the restatement required by GASB Statement No. 68 can be found at Note 18 of the Notes to the Financial Statements.
Analysis of the changes in net position
Total government-wide revenues of the primary government increased $75.7 million, an 8.6 percent increase from the prior year, and total expenses increased $41.1 million, a 5.1 percent increase. These changes are discussed in more detail below.
10
City of Sacramento Management’s Discussion and Analysis (Continued) (Required Supplementary Information - Unaudited) For the Fiscal Year Ended June 30, 2015
Governmental activities
Total revenues for governmental activities increased $63.2 million from the prior year, a 10.5 percent increase. Total expenses increased $36.5 million, a 6.2 percent increase, and net transfers from business-type activities increased $3.6 million, a 12.5 percent increase from the prior year. Transfers in primarily consist of payments in lieu of taxes paid by the business-type activities to the General Fund. Transfers out primarily consist of capital assets transferred from governmental activities to business-type activities. Net transfers in were higher in 2015 because of transfers from the Community Center Fund and Parking Fund for debt service and more capital assets transferred from governmental activities to business-type activities.
Revenue
Capital grants and contributions revenue increased $25.8 million from the prior year largely due to land dedications of $7 million, RASA contributions of $3.3 million, developer dedications of $2 million and a $4.9 million contribution for public art to be located at the Golden 1 Center. Operating grants and contributions increased $4.9 million compared to the prior year primarily due to pre-development cost reimbursements related to the Golden 1 Center.
Property tax revenue in 2015 increased $7.2 million compared to 2014 due to the continued recovering of the Sacramento area commercial and residential real estate assessed valuations. Measure U local sales tax revenue increased $2.1 million due to increased sales activity. Other tax revenues, including utility users tax, state shared sales taxes, and in lieu sales taxes, increased a net $4.5 million in 2015.
Expenses
As indicated above, total governmental expenses increased by $36.5 million. This increase is attributable to general government (up $11.3 million), police (up $9.5 million), interest on long-term debt (up $6.9 million), parks and recreation (up $4.2 million), community development (up $3.7 million) and library (up $1.9 million).
General government expense increases resulted from rising labor costs and costs associated with litigation and the financing of the Golden 1 Center. Police and parks and recreation expense increases resulted from rising labor costs as well as one-time labor grievance settlements. In addition, police expenses increased $5 million as a result of filling positions funded by Measure U.
Community development expenses increased during the year as a result of new development projects throughout the City. The library increase is a result of an additional library services parcel tax assessed on property owners by the City and remitted to the Sacramento Public Library Authority. Interest on long-term debt increased for the forward bond purchase agreement for the Golden 1 Center financing and inflation adjustments on the North Natomas development impact fee credits.
11
City of Sacramento Management’s Discussion and Analysis (Continued) (Required Supplementary Information - Unaudited) For the Fiscal Year Ended June 30, 2015
Business-type activities
Total revenues for business-type activities increased $12.4 million from the prior year, a 4.4 percent increase. Total expenses for business-type activities increased $4.7 million from the prior year, a 2.2 percent increase. Net transfers to governmental activities increased $3.6 million as a result of transfers from the Community Center Fund and Parking Fund for debt service.
Revenue
Charges for services increased $8.9 million as a result of water and wastewater rate increases in fiscal year 2015 of 10 and 15 percent, respectively.
Capital grants and contribution revenue increased by $2.9 million mostly due to an increase in wastewater capital grants from the State Department of Water Resources for the 7th Street Sewer Replacement and 9th Street Sewer Improvement projects.
Expenses
Water expenses increased $2.8 million compared to the prior year primarily due to programs implemented to address the drought totaling $1.6 million and additional depreciation expense of $0.5 million related to new capital assets.
Storm drainage expenses increased $5.2 million mainly due to labor cost increases of $3.9 million and contributions to the Fleet Fund for the purchase of 7 vehicles totaling $0.9 million.
Solid Waste expenses decreased by $1.9 million primarily due to lower contributions to the Fleet Fund as a result of fewer vehicles purchased during 2015 compared to 2014, which accounted for a decrease of about $4 million, offset by an increase in labor costs of about $1.3 million.
Parking expenses decreased $1.4 million compared to the prior year as a result of various projects completed during fiscal year 2014.
FINANCIAL ANALYSIS OF THE FUND STATEMENTS
Funds are accounting devices that the City uses to keep track of specific sources of funding and spending for particular purposes. The fund financial statements focus on individual parts of City government, reporting City operations in more detail than the government-wide statements.
Governmental Funds
The City’s governmental funds provide information on near-term inflows, outflows and balances of spendable resources. Total fund balance for governmental funds increased by $43.8 million in fiscal year 2015. For the fiscal year ended June 30, 2015, compared to the prior year, total revenues for governmental funds increased by $40.8 million, total expenditures increased $54.9 million, and net other financing sources and uses increased $12.3 million. Reasons for these changes are discussed in more detail below.
12
City of Sacramento Management’s Discussion and Analysis (Continued) (Required Supplementary Information - Unaudited) For the Fiscal Year Ended June 30, 2015
General Fund
Total General Fund revenues increased $23 million in the current year mostly due to increases in tax revenues of $12 million, charges for services revenues of $7 million, and intergovernmental revenue of $4 million. Tax revenue increases were mainly due to increases in property tax of $7.2 million, sales and use tax of $2.3 million, real property transfer tax of $1.2 million, business operations tax of $0.7 million, and other taxes $0.7 million. The increase in charges for services was primarily attributable to construction permits and ambulance service fees and reimbursements. The increase in intergovernmental resulted partly from a one-time $1.7 million State reimbursement for mandated cost claims and $1.5 million payment from a fire district received in fiscal year 2015 for services provided in fiscal year 2014.
Total General Fund expenditures increased by $14.2 million during fiscal year 2015. There were expenditure increases in the police and fire Departments of $5.0 million and $2.8 million, respectively. General government and parks and recreation had expenditure increases of $2.2 million and $2.8 million, respectively. The increase in police and fire expenditures was primarily attributable to labor costs. The $2.2 million increase in general government was mostly due to costs of Golden 1 Center litigation. The $2.8 million increase in parks and recreation was primarily due to a labor grievance settlement.
General Fund net other financing sources and uses decreased $3.4 million from the prior year, mainly due to prior year capital lease proceeds of $3.1 million for parking meters.
General Fund Budgetary Highlights - The City Council revised the budget throughout the fiscal year with midyear revenue and appropriation adjustments, changes made to appropriations for the use of committed fund balance, and other revenue and appropriation adjustments after the original budget was adopted.
After taking into account these adjustments, actual expenditures were $36.9 million lower than final budget amounts. Capital outlay expenditures were less than budgeted amounts by $29.9 million because of the multi-year nature of most capital projects. Unspent multi-year project budgets, as well as other unspent Council-approved program budgets, are carried over to the subsequent fiscal year. Most General Fund departments reported favorable operating expenditure budget variances primarily as a result of salary savings from vacant positions. The Police and Parks and Recreation departments reported unfavorable operating expenditure variances due largely to one-time unbudgeted labor costs associated with grievance settlements.
General Fund revenues were $21.3 million higher than final budgeted amounts. Property tax and real property transfer tax collections exceeded the budgeted amounts by $2.7 million and $3.7 million respectively. Charges for services and intergovernmental revenue exceeded budgeted amounts by $7.6 million and $2.4 million, respectively. The City collected unbudgeted revenue of $1.7 million in State SB90 Mandated Cost Reimbursements and a $2.6 million sales tax-sharing payment from the County.
13
City of Sacramento Management’s Discussion and Analysis (Continued) (Required Supplementary Information - Unaudited) For the Fiscal Year Ended June 30, 2015
Measure U Fund
Measure U Fund revenue and expenditures were higher in fiscal year 2015 compared to fiscal year 2014 by $0.8 million and $9.3 million, respectively. Expenditures are higher in fiscal year 2015 as a result of funding additional police officer and sergeant positions as well as filling most other Measure U-funded positions. Measure U resources are being used to restore police, fire, and parks and recreation services.
Capital Grants Fund
Capital Grant Fund revenue and expenditures increased $2.3 million and $9.3 million, respectively. Significant projects funded by capital grants in fiscal year 2015 included the Train Depot Renovation, 5th Street and Railyards Boulevard, the Sacramento City College Pedestrian and Bicycle Bridge, and the R Street Market Plaza.
1997 Lease Revenue Bond Fund
The lease receivable and associated revenue from the Sacramento Kings ownership group for debt service on the 1997 lease revenue bonds decreased in accordance with the bond payment schedule as described in Note 7 to the financial statements.
Other Governmental Funds
Total other governmental fund revenues increased $14.4 million due largely to the following fluctuations:
$7.1 million increase in charges for service in plan check fees, construction permits,special use permits, planning technology fees, and planning operations resulting fromincreased development activity
$3.3 million contribution from RASA bond proceeds to fund various City projects
Total other governmental fund expenditures increased $21.9 million due largely to the following fluctuations:
$12.1 million increase in capital outlay due to construction and infrastructure improvementprojects funded by special districts, financing plans, and bond proceeds
$7.8 million one-time costs related to the forward bond purchase agreement for thefinancing of the City’s contribution to the Golden 1 Center
$3.7 million inflation adjustment to North Natomas development impact fee credits
Other financing sources in other governmental funds increased $15.7 million primarily from proceeds of the sale of the Army Depot for $9.4 million and 3.12 acres of land on the southwest corner of Fair Oaks Boulevard and Howe Avenue for $3.1 million.
14
City of Sacramento Management’s Discussion and Analysis (Continued) (Required Supplementary Information - Unaudited) For the Fiscal Year Ended June 30, 2015
Enterprise Funds
The City’s enterprise fund financial statements provide the same type of information as the government-wide financial statements but in greater detail. Total operating revenues increased $8.9 million and operating expenses increased $5.1 million. Net non-operating revenues increased $1.1 million and capital contributions increased $6.2 million. Reasons for these changes are discussed in more detail below.
Water Fund
Water Fund operating revenue increased $6.1 million compared to the prior year because of a 10 percent rate increase. Operating expenses increased $2.6 million compared to the prior year primarily due to programs implemented to address the drought totaling $1.6 million and additional depreciation expense of $0.5 million related to new capital assets. The Water Fund also recognized a $4.6 million special item revenue in fiscal year 2015 for a settlement with a vendor regarding defective water meters.
Wastewater Fund
Wastewater Fund operating revenue increased $3.7 million compared to the prior year because of a 15 percent rate increase. Operating expenses in the current year did not change significantly compared to the previous year. Wastewater capital contributions increased $3.8 million due to additional capital grant revenue and developer impact fees.
Storm Drainage Fund
Storm Drainage Fund operating expenses increased $5.2 million compared to the prior year primarily due to increases in employee labor costs of $3.9 million and contributions to the Fleet Fund to purchase seven vehicles totaling $0.9 million. Operating revenues remained flat compared to the previous year. Storm drainage fees cannot be increased under Proposition 218 without the approval of a majority of property owners subject to the fee or two-thirds of voters.
Solid Waste Fund
Solid Waste Fund operating revenue increased by $0.6 million compared to the prior year due to collection of receivable for delinquent rent written off in the prior year. Operating expenses decreased $1.8 million due to lower contributions to the Fleet Fund for vehicle purchases compared to the prior year, partially offset by higher labor costs.
Parking Fund
Parking Fund operating revenue decreased $2 million compared to the prior year mainly due to the loss of 1,612 parking spaces at the Downtown Plaza for the construction of the Golden 1 Center. Total operating expenses decreased $1.4 million compared to the prior year as a result of the loss of the downtown parking spaces and various projects that were completed during 2014.
15
City of Sacramento Management’s Discussion and Analysis (Continued) (Required Supplementary Information - Unaudited) For the Fiscal Year Ended June 30, 2015
Community Center Fund
Community Center Fund transient occupancy tax revenue increased $2.2 million due to a continuing upward trend in Sacramento area hotel room occupancy and room rates. Additionally, the first of three $2 million transfers to the Golden 1 Center debt service fund to establish the liquidity reserve was made in fiscal year 2015.
CAPITAL ASSETS AND LONG-TERM DEBT
Capital Assets
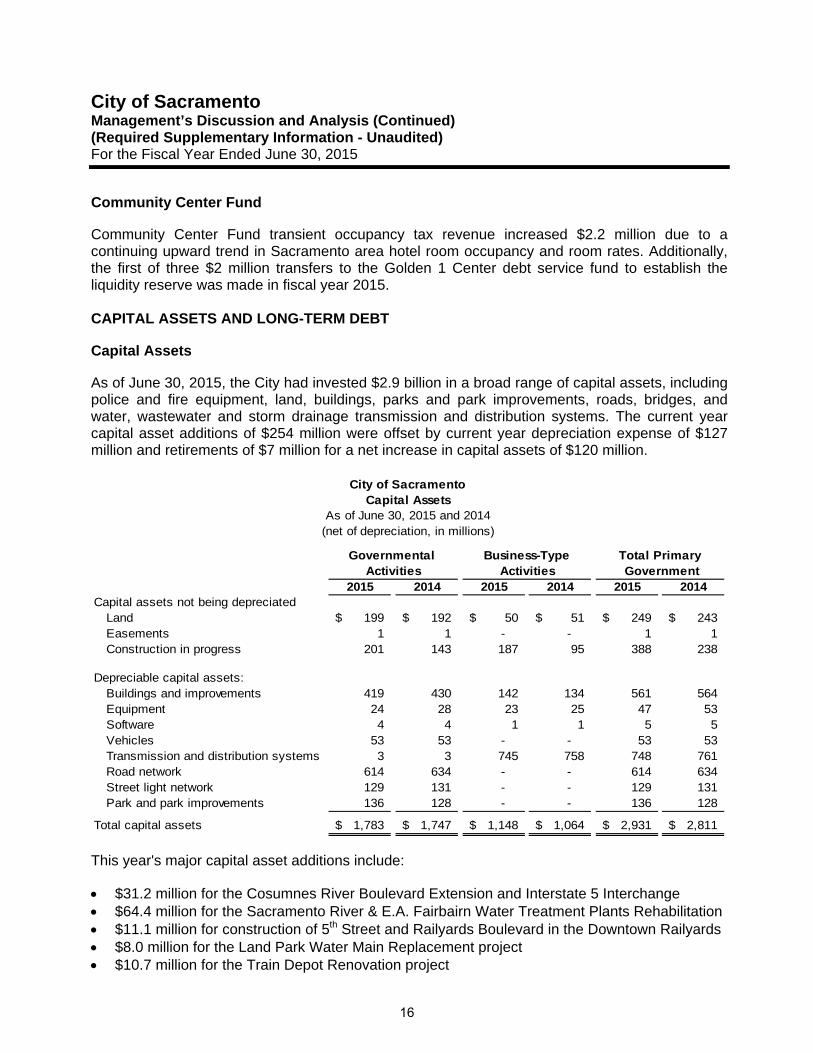
As of June 30, 2015, the City had invested $2.9 billion in a broad range of capital assets, including police and fire equipment, land, buildings, parks and park improvements, roads, bridges, and water, wastewater and storm drainage transmission and distribution systems. The current year capital asset additions of $254 million were offset by current year depreciation expense of $127 million and retirements of $7 million for a net increase in capital assets of $120 million.
2015 2014 2015 2014 2015 2014Capital assets not being depreciated
Land 199$ 192$ 50$ 51$ 249$ 243$ Easements 1 1 - - 1 1 Construction in progress 201 143 187 95 388 238
Depreciable capital assets:Buildings and improvements 419 430 142 134 561 564 Equipment 24 28 23 25 47 53 Software 4 4 1 1 5 5 Vehicles 53 53 - - 53 53 Transmission and distribution systems 3 3 745 758 748 761 Road network 614 634 - - 614 634 Street light network 129 131 - - 129 131 Park and park improvements 136 128 - - 136 128
Total capital assets 1,783$ 1,747$ 1,148$ 1,064$ 2,931$ 2,811$
Activities ActivitiesTotal Primary
City of SacramentoCapital Assets
As of June 30, 2015 and 2014(net of depreciation, in millions)
Governmental Business-Type Government
This year's major capital asset additions include:
$31.2 million for the Cosumnes River Boulevard Extension and Interstate 5 Interchange $64.4 million for the Sacramento River & E.A. Fairbairn Water Treatment Plants Rehabilitation $11.1 million for construction of 5th Street and Railyards Boulevard in the Downtown Railyards $8.0 million for the Land Park Water Main Replacement project $10.7 million for the Train Depot Renovation project
16
City of Sacramento Management’s Discussion and Analysis (Continued) (Required Supplementary Information - Unaudited) For the Fiscal Year Ended June 30, 2015
Other capital projects in progress include the LED Streetlight conversion, 7th Street Combined Sewer System Replacement, and the Oak Park and Colonial Manor Water Main Replacement projects. Many other capital projects were completed during fiscal year 2015 and transferred from construction in progress to the appropriate capital asset categories.
More detailed information about the City's capital assets is presented in Note 4 to the financial statements.
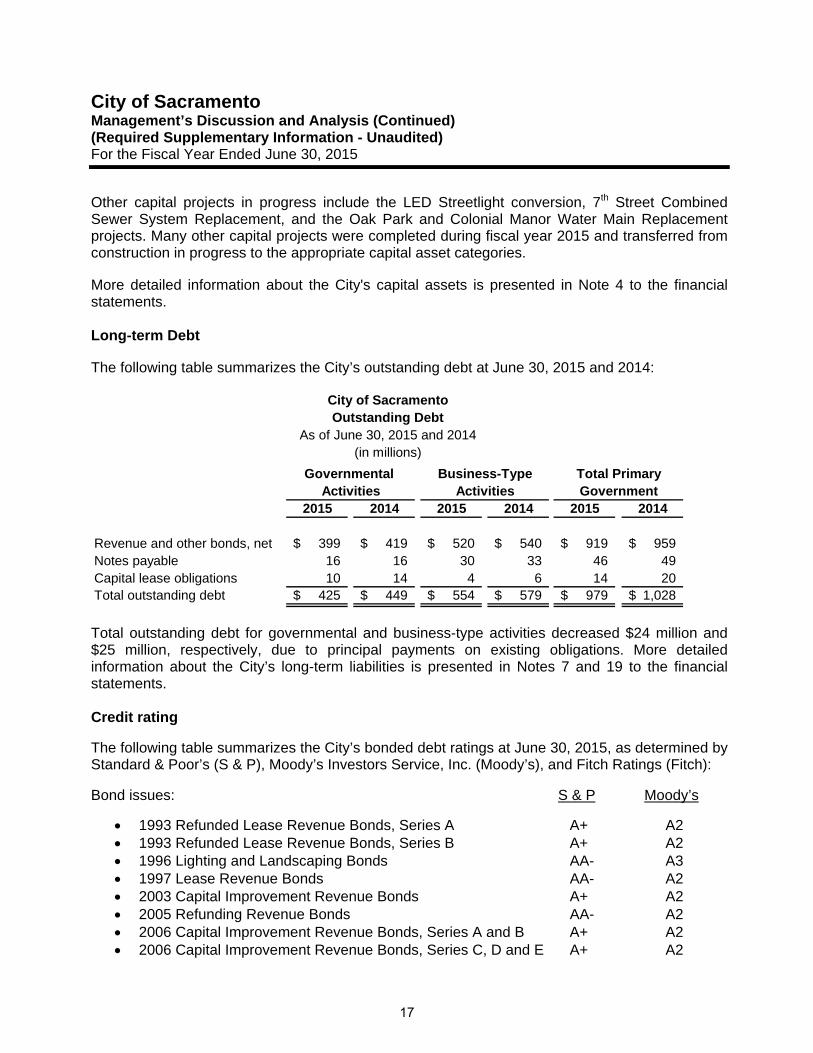
Long-term Debt
The following table summarizes the City’s outstanding debt at June 30, 2015 and 2014:
2015 2014 2015 2014 2015 2014
Revenue and other bonds, net 399$ 419$ 520$ 540$ 919$ 959$ Notes payable 16 16 30 33 46 49 Capital lease obligations 10 14 4 6 14 20 Total outstanding debt 425$ 449$ 554$ 579$ 979$ 1,028$
City of SacramentoOutstanding Debt
As of June 30, 2015 and 2014(in millions)
Activities Activities GovernmentGovernmental Business-Type Total Primary
Total outstanding debt for governmental and business-type activities decreased $24 million and $25 million, respectively, due to principal payments on existing obligations. More detailed information about the City’s long-term liabilities is presented in Notes 7 and 19 to the financial statements.
Credit rating
The following table summarizes the City’s bonded debt ratings at June 30, 2015, as determined by Standard & Poor’s (S & P), Moody’s Investors Service, Inc. (Moody’s), and Fitch Ratings (Fitch):
Bond issues: S & P Moody’s
1993 Refunded Lease Revenue Bonds, Series A A+ A2 1993 Refunded Lease Revenue Bonds, Series B A+ A2 1996 Lighting and Landscaping Bonds AA- A3 1997 Lease Revenue Bonds AA- A2 2003 Capital Improvement Revenue Bonds A+ A2 2005 Refunding Revenue Bonds AA- A2 2006 Capital Improvement Revenue Bonds, Series A and B A+ A2 2006 Capital Improvement Revenue Bonds, Series C, D and E A+ A2
17
City of Sacramento Management’s Discussion and Analysis (Continued) (Required Supplementary Information - Unaudited) For the Fiscal Year Ended June 30, 2015
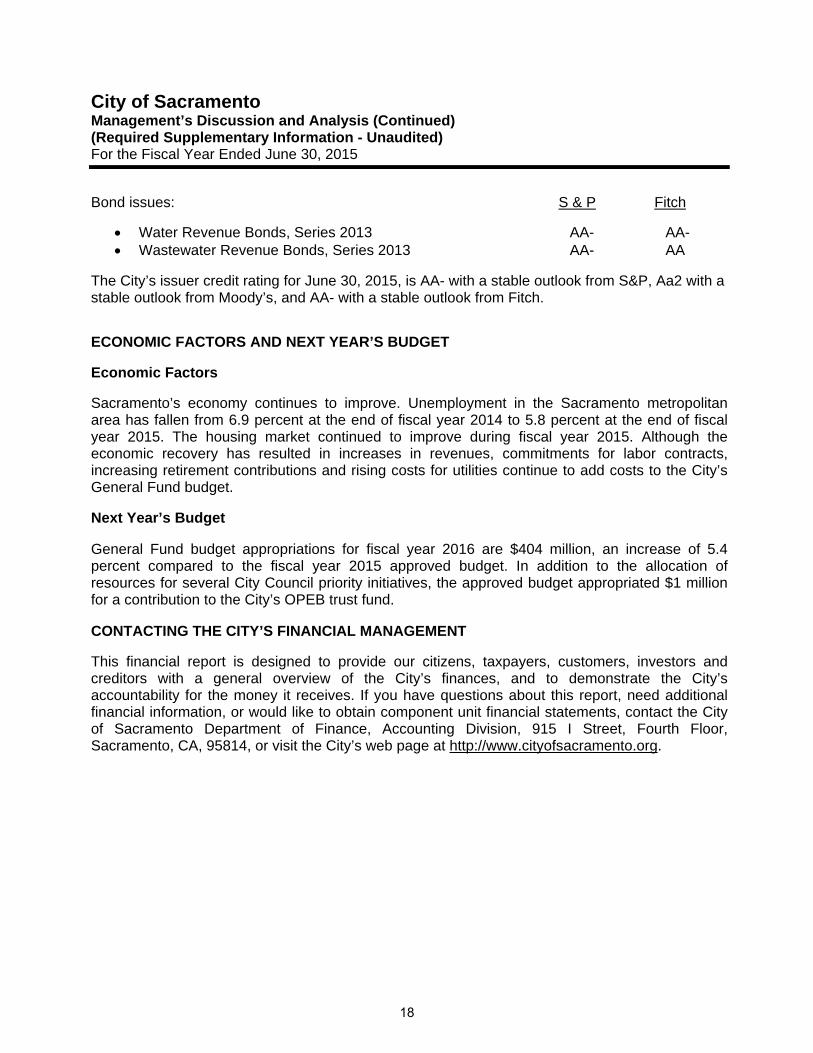
Bond issues: S & P Fitch
Water Revenue Bonds, Series 2013 AA- AA- Wastewater Revenue Bonds, Series 2013 AA- AA
The City’s issuer credit rating for June 30, 2015, is AA- with a stable outlook from S&P, Aa2 with a stable outlook from Moody’s, and AA- with a stable outlook from Fitch.
ECONOMIC FACTORS AND NEXT YEAR’S BUDGET
Economic Factors
Sacramento’s economy continues to improve. Unemployment in the Sacramento metropolitan area has fallen from 6.9 percent at the end of fiscal year 2014 to 5.8 percent at the end of fiscal year 2015. The housing market continued to improve during fiscal year 2015. Although the economic recovery has resulted in increases in revenues, commitments for labor contracts, increasing retirement contributions and rising costs for utilities continue to add costs to the City’s General Fund budget.
Next Year’s Budget
General Fund budget appropriations for fiscal year 2016 are $404 million, an increase of 5.4 percent compared to the fiscal year 2015 approved budget. In addition to the allocation of resources for several City Council priority initiatives, the approved budget appropriated $1 million for a contribution to the City’s OPEB trust fund.
CONTACTING THE CITY’S FINANCIAL MANAGEMENT
This financial report is designed to provide our citizens, taxpayers, customers, investors and creditors with a general overview of the City’s finances, and to demonstrate the City’s accountability for the money it receives. If you have questions about this report, need additional financial information, or would like to obtain component unit financial statements, contact the City of Sacramento Department of Finance, Accounting Division, 915 I Street, Fourth Floor, Sacramento, CA, 95814, or visit the City’s web page at http://www.cityofsacramento.org.
18

Government-wide Financial
Statements
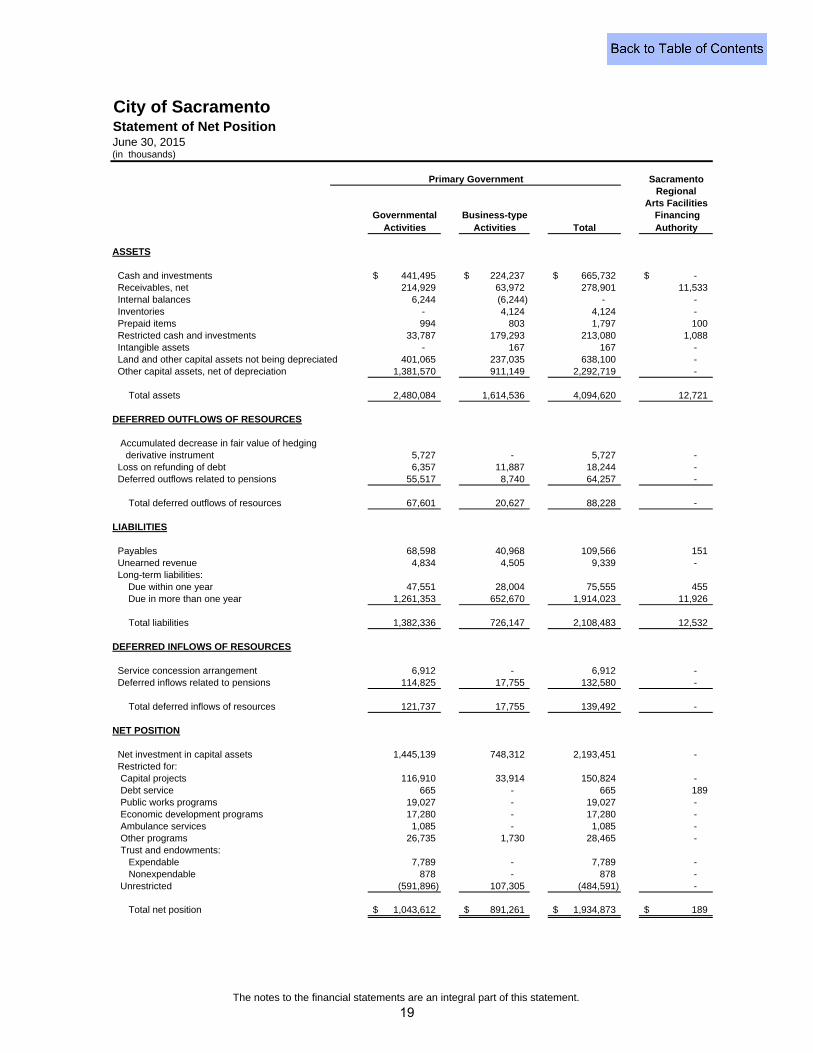
City of SacramentoStatement of Net PositionJune 30, 2015(in thousands)
SacramentoRegional
Arts FacilitiesGovernmental Business-type Financing
Activities Activities Total Authority
ASSETS
Cash and investments 441,495$ 224,237$ 665,732$ -$ Receivables, net 214,929 63,972 278,901 11,533 Internal balances 6,244 (6,244) - - Inventories - 4,124 4,124 - Prepaid items 994 803 1,797 100 Restricted cash and investments 33,787 179,293 213,080 1,088 Intangible assets - 167 167 - Land and other capital assets not being depreciated 401,065 237,035 638,100 - Other capital assets, net of depreciation 1,381,570 911,149 2,292,719 -
Total assets 2,480,084 1,614,536 4,094,620 12,721
DEFERRED OUTFLOWS OF RESOURCES
Accumulated decrease in fair value of hedging derivative instrument 5,727 - 5,727 - Loss on refunding of debt 6,357 11,887 18,244 - Deferred outflows related to pensions 55,517 8,740 64,257 -
Total deferred outflows of resources 67,601 20,627 88,228 -
LIABILITIES
Payables 68,598 40,968 109,566 151 Unearned revenue 4,834 4,505 9,339 - Long-term liabilities: Due within one year 47,551 28,004 75,555 455 Due in more than one year 1,261,353 652,670 1,914,023 11,926
Total liabilities 1,382,336 726,147 2,108,483 12,532
DEFERRED INFLOWS OF RESOURCES
Service concession arrangement 6,912 - 6,912 - Deferred inflows related to pensions 114,825 17,755 132,580 -
Total deferred inflows of resources 121,737 17,755 139,492 -
NET POSITION
Net investment in capital assets 1,445,139 748,312 2,193,451 - Restricted for:
Capital projects 116,910 33,914 150,824 - Debt service 665 - 665 189 Public works programs 19,027 - 19,027 - Economic development programs 17,280 - 17,280 - Ambulance services 1,085 - 1,085 - Other programs 26,735 1,730 28,465 - Trust and endowments:
Expendable 7,789 - 7,789 - Nonexpendable 878 - 878 -
Unrestricted (591,896) 107,305 (484,591) -
Total net position 1,043,612$ 891,261$ 1,934,873$ 189$
Primary Government
The notes to the financial statements are an integral part of this statement.
19
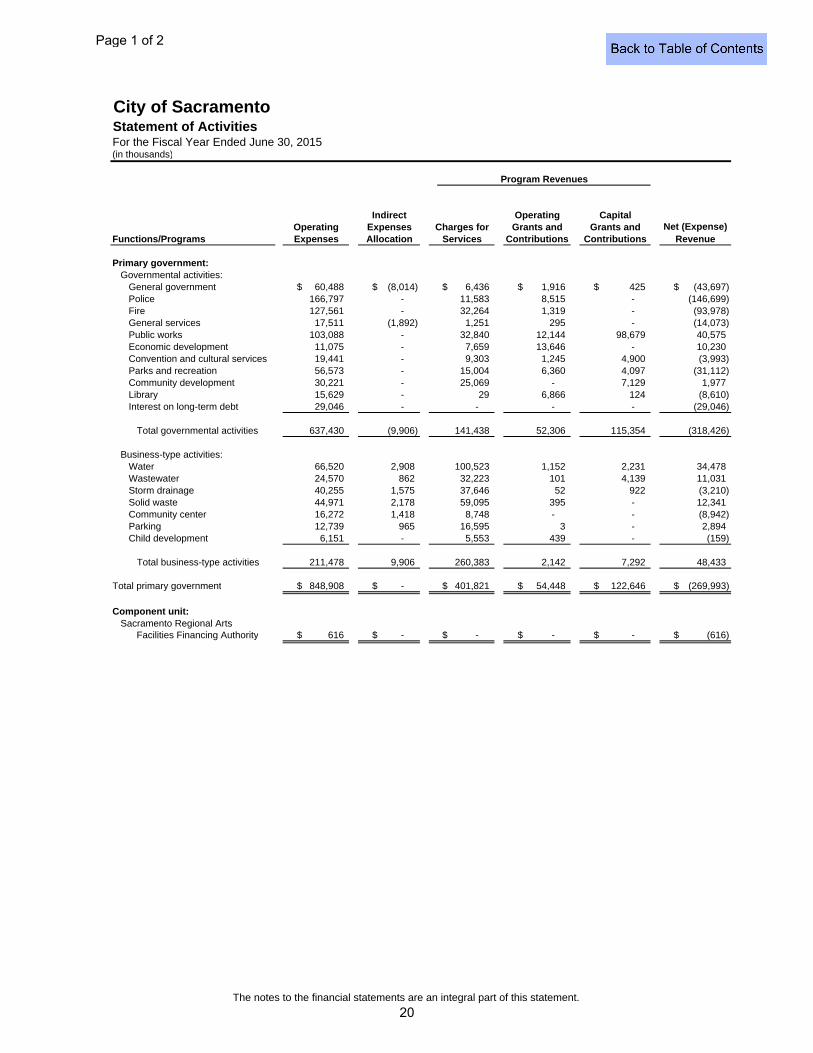
City of SacramentoStatement of ActivitiesFor the Fiscal Year Ended June 30, 2015(in thousands)
Functions/Programs
Primary government:Governmental activities:
General government 60,488$ (8,014)$ 6,436$ 1,916$ 425$ (43,697)$ Police 166,797 - 11,583 8,515 - (146,699)Fire 127,561 - 32,264 1,319 - (93,978)General services 17,511 (1,892) 1,251 295 - (14,073)Public works 103,088 - 32,840 12,144 98,679 40,575Economic development 11,075 - 7,659 13,646 - 10,230Convention and cultural services 19,441 - 9,303 1,245 4,900 (3,993)Parks and recreation 56,573 - 15,004 6,360 4,097 (31,112)Community development 30,221 - 25,069 - 7,129 1,977Library 15,629 - 29 6,866 124 (8,610)Interest on long-term debt 29,046 - - - - (29,046)
Total governmental activities 637,430 (9,906) 141,438 52,306 115,354 (318,426)
Business-type activities:Water 66,520 2,908 100,523 1,152 2,231 34,478Wastewater 24,570 862 32,223 101 4,139 11,031Storm drainage 40,255 1,575 37,646 52 922 (3,210)Solid waste 44,971 2,178 59,095 395 - 12,341Community center 16,272 1,418 8,748 - - (8,942)Parking 12,739 965 16,595 3 - 2,894Child development 6,151 - 5,553 439 - (159)
Total business-type activities 211,478 9,906 260,383 2,142 7,292 48,433
Total primary government 848,908$ -$ 401,821$ 54,448$ 122,646$ (269,993)$
Component unit:Sacramento Regional Arts
Facilities Financing Authority 616$ -$ -$ -$ -$ (616)$
Program Revenues
OperatingGrants and
Contributions
CapitalCharges for
ServicesExpensesOperating Grants and
ContributionsNet (Expense)
Revenue
Indirect
AllocationExpenses
The notes to the financial statements are an integral part of this statement.
Page 1 of 2
20
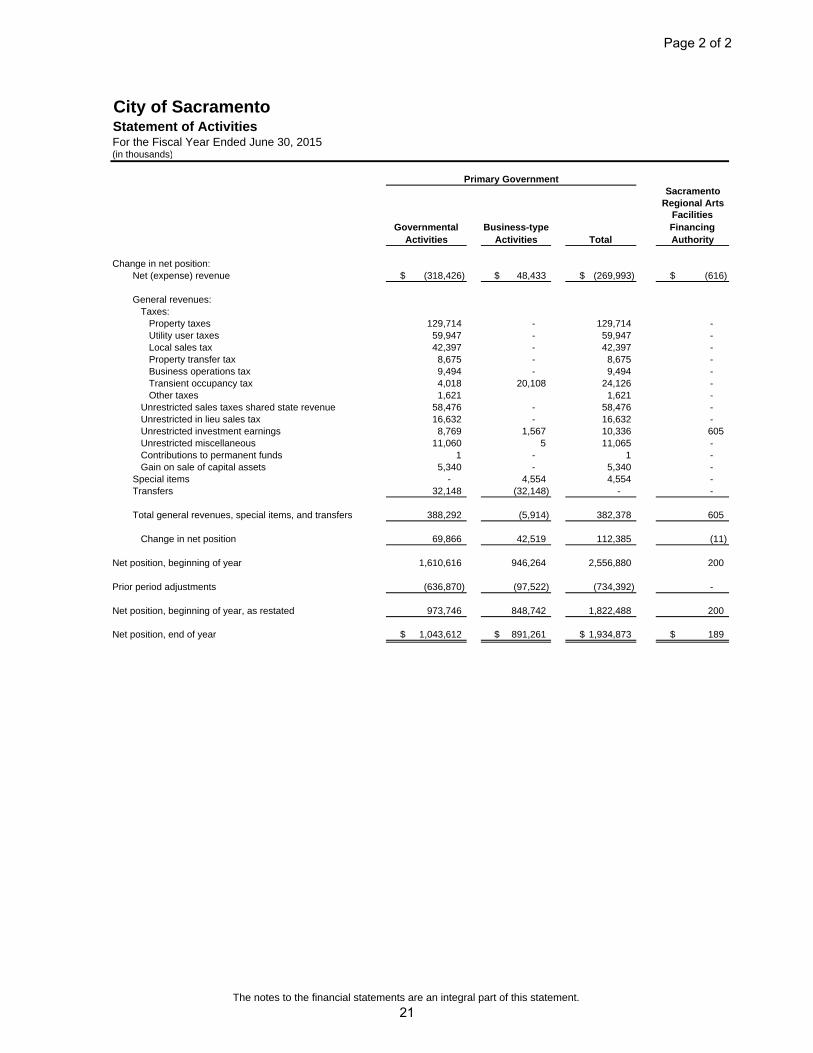
City of SacramentoStatement of ActivitiesFor the Fiscal Year Ended June 30, 2015(in thousands)
Change in net position:Net (expense) revenue (318,426)$ 48,433$ (269,993)$ (616)$
General revenues:Taxes:
Property taxes 129,714 - 129,714 -Utility user taxes 59,947 - 59,947 -Local sales tax 42,397 - 42,397 -Property transfer tax 8,675 - 8,675 -Business operations tax 9,494 - 9,494 -Transient occupancy tax 4,018 20,108 24,126 -Other taxes 1,621 1,621 -
Unrestricted sales taxes shared state revenue 58,476 - 58,476 -Unrestricted in lieu sales tax 16,632 - 16,632 -Unrestricted investment earnings 8,769 1,567 10,336 605Unrestricted miscellaneous 11,060 5 11,065 -Contributions to permanent funds 1 - 1 -Gain on sale of capital assets 5,340 - 5,340 -
Special items - 4,554 4,554 -Transfers 32,148 (32,148) - -
Total general revenues, special items, and transfers 388,292 (5,914) 382,378 605
Change in net position 69,866 42,519 112,385 (11)
Net position, beginning of year 1,610,616 946,264 2,556,880 200
Prior period adjustments (636,870) (97,522) (734,392) -
Net position, beginning of year, as restated 973,746 848,742 1,822,488 200
Net position, end of year 1,043,612$ 891,261$ 1,934,873$ 189$
Facilities Financing Authority
Regional Arts
Primary Government
Business-type Activities
Governmental Activities Total
Sacramento
The notes to the financial statements are an integral part of this statement.
Page 2 of 2
21

THIS PAGE INTENTIONALLY LEFT BLANK
22

Fund Financial Statements

THIS PAGE INTENTIONALLY LEFT BLANK
23
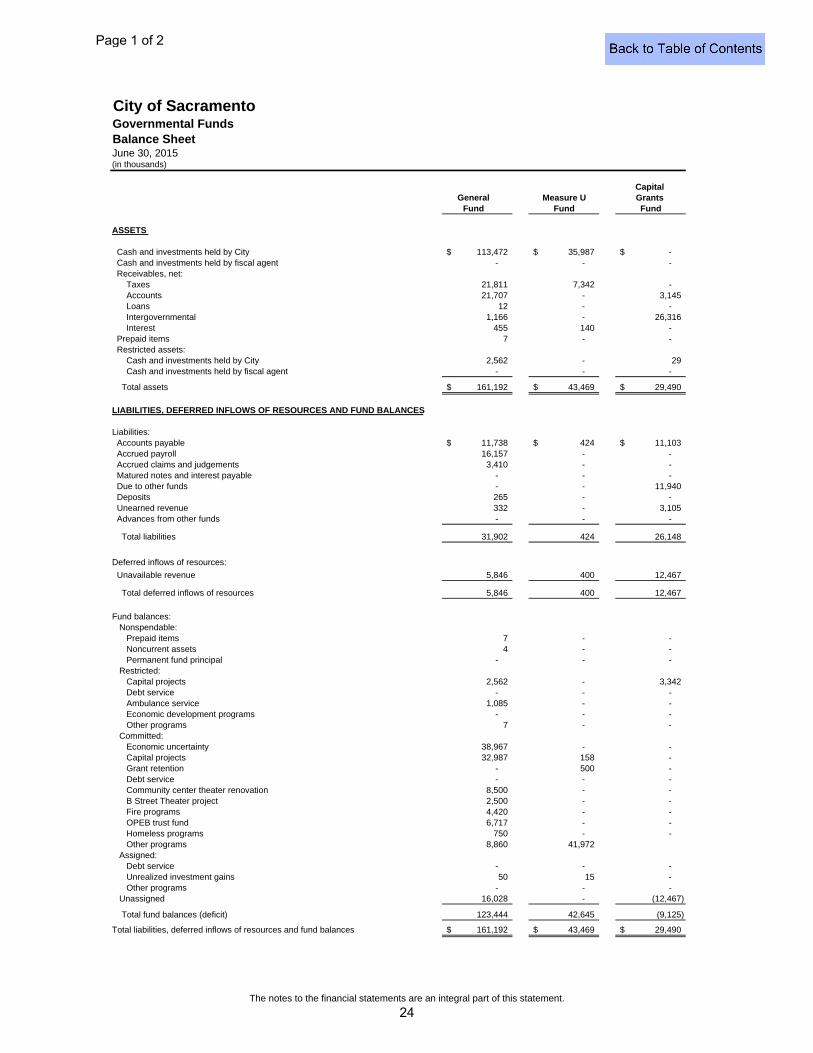
City of SacramentoGovernmental FundsBalance SheetJune 30, 2015(in thousands)
Capital Measure U Grants
Fund Fund
ASSETS
Cash and investments held by City 113,472$ 35,987$ -$ Cash and investments held by fiscal agent - - - Receivables, net: Taxes 21,811 7,342 - Accounts 21,707 - 3,145 Loans 12 - - Intergovernmental 1,166 - 26,316 Interest 455 140 - Prepaid items 7 - - Restricted assets: Cash and investments held by City 2,562 - 29 Cash and investments held by fiscal agent - - -
Total assets 161,192$ 43,469$ 29,490$
LIABILITIES, DEFERRED INFLOWS OF RESOURCES AND FUND BALANCES
Liabilities: Accounts payable 11,738$ 424$ 11,103$ Accrued payroll 16,157 - - Accrued claims and judgements 3,410 - - Matured notes and interest payable - - - Due to other funds - - 11,940 Deposits 265 - - Unearned revenue 332 - 3,105 Advances from other funds - - -
Total liabilities 31,902 424 26,148
Deferred inflows of resources:
Unavailable revenue 5,846 400 12,467
Total deferred inflows of resources 5,846 400 12,467
Fund balances: Nonspendable:
Prepaid items 7 - - Noncurrent assets 4 - - Permanent fund principal - - -
Restricted:Capital projects 2,562 - 3,342Debt service - - - Ambulance service 1,085 - - Economic development programs - - - Other programs 7 - -
Committed:Economic uncertainty 38,967 - - Capital projects 32,987 158 - Grant retention - 500 - Debt service - - - Community center theater renovation 8,500 - - B Street Theater project 2,500 - - Fire programs 4,420 - - OPEB trust fund 6,717 - - Homeless programs 750 - - Other programs 8,860 41,972
Assigned:Debt service - - - Unrealized investment gains 50 15 - Other programs - - -
Unassigned 16,028 - (12,467)
Total fund balances (deficit) 123,444 42,645 (9,125)
Total liabilities, deferred inflows of resources and fund balances 161,192$ 43,469$ 29,490$
FundGeneral
The notes to the financial statements are an integral part of this statement.
Page 1 of 2
24
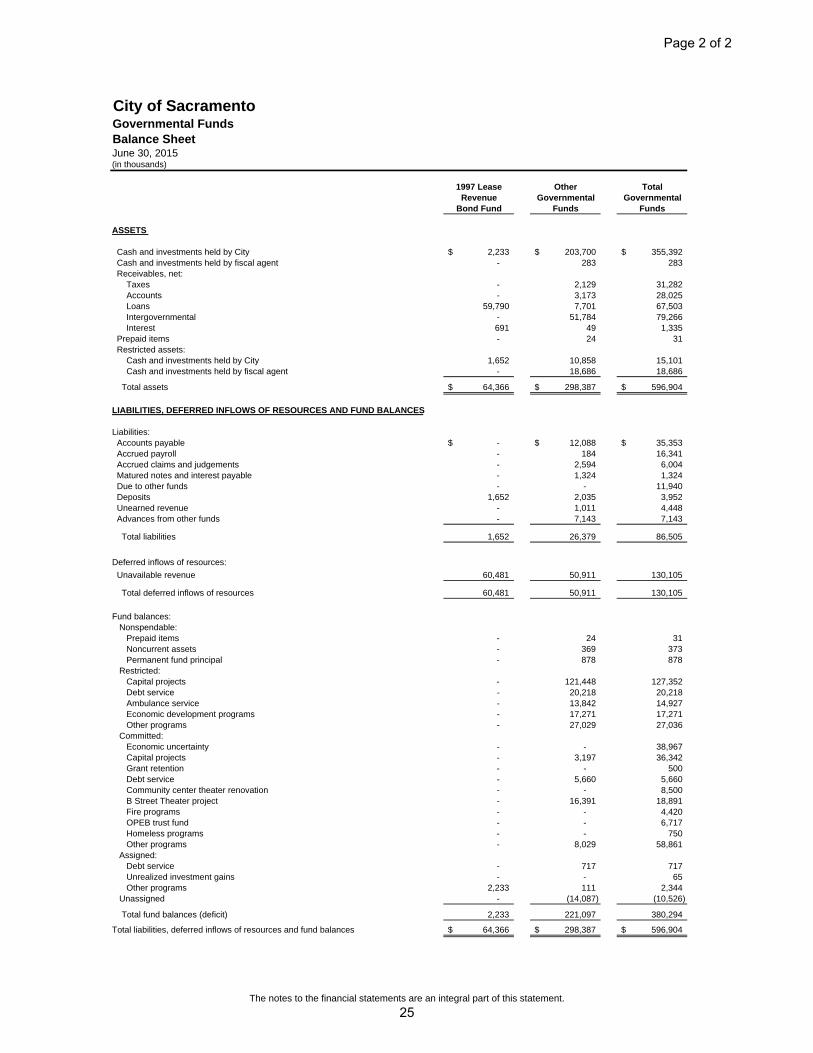
City of SacramentoGovernmental FundsBalance SheetJune 30, 2015(in thousands)
ASSETS
Cash and investments held by City Cash and investments held by fiscal agent Receivables, net: Taxes Accounts Loans Intergovernmental Interest Prepaid items Restricted assets: Cash and investments held by City Cash and investments held by fiscal agent
Total assets
LIABILITIES, DEFERRED INFLOWS OF RESOURCES AND FUND BALANCES
Liabilities: Accounts payable Accrued payroll Accrued claims and judgements Matured notes and interest payable Due to other funds Deposits Unearned revenue Advances from other funds
Total liabilities
Deferred inflows of resources:
Unavailable revenue
Total deferred inflows of resources
Fund balances: Nonspendable:
Prepaid itemsNoncurrent assetsPermanent fund principal
Restricted:Capital projectsDebt serviceAmbulance serviceEconomic development programsOther programs
Committed:Economic uncertaintyCapital projectsGrant retentionDebt serviceCommunity center theater renovationB Street Theater projectFire programsOPEB trust fundHomeless programsOther programs
Assigned:Debt service Unrealized investment gainsOther programs
Unassigned
Total fund balances (deficit)
Total liabilities, deferred inflows of resources and fund balances
1997 Lease Other TotalRevenue Governmental Governmental
Bond Fund Funds Funds
2,233$ 203,700$ 355,392$ - 283 283
- 2,129 31,282- 3,173 28,025
59,790 7,701 67,503- 51,784 79,266691 49 1,335- 24 31
1,652 10,858 15,101- 18,686 18,686
64,366$ 298,387$ 596,904$
-$ 12,088$ 35,353$ - 184 16,341- 2,594 6,004- 1,324 1,324- - 11,940
1,652 2,035 3,952- 1,011 4,448- 7,143 7,143
1,652 26,379 86,505
60,481 50,911 130,105
60,481 50,911 130,105
- 24 31- 369 373- 878 878
- 121,448 127,352 - 20,218 20,218- 13,842 14,927- 17,271 17,271- 27,029 27,036
- - 38,967- 3,197 36,342- - 500- 5,660 5,660- - 8,500- 16,391 18,891- - 4,420- - 6,717- - 750- 8,029 58,861
- 717 717- - 65
2,233 111 2,344- (14,087) (10,526)
2,233 221,097 380,294
64,366$ 298,387$ 596,904$
The notes to the financial statements are an integral part of this statement.
Page 2 of 2
25
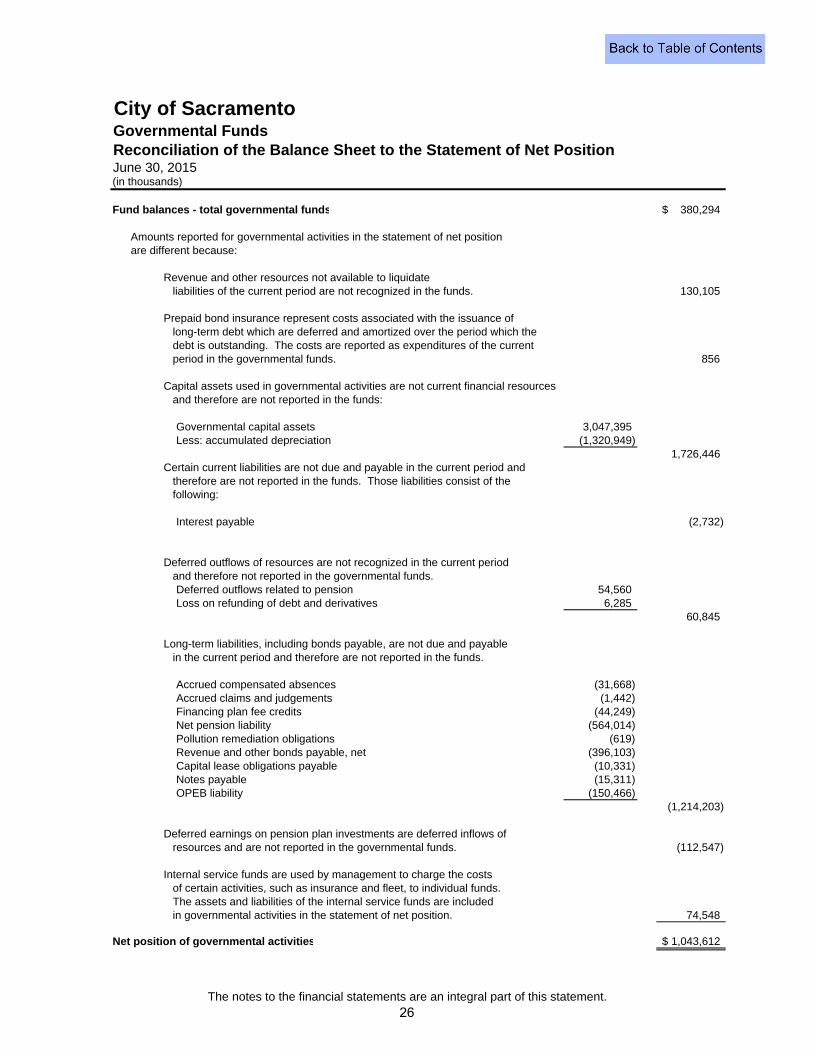
City of SacramentoGovernmental FundsReconciliation of the Balance Sheet to the Statement of Net PositionJune 30, 2015(in thousands)
Fund balances - total governmental funds 380,294$
Amounts reported for governmental activities in the statement of net positionare different because:
Revenue and other resources not available to liquidateliabilities of the current period are not recognized in the funds. 130,105
Prepaid bond insurance represent costs associated with the issuance oflong-term debt which are deferred and amortized over the period which thedebt is outstanding. The costs are reported as expenditures of the currentperiod in the governmental funds. 856
Capital assets used in governmental activities are not current financial resourcesand therefore are not reported in the funds:
Governmental capital assets 3,047,395 Less: accumulated depreciation (1,320,949)
1,726,446 Certain current liabilities are not due and payable in the current period and
therefore are not reported in the funds. Those liabilities consist of thefollowing:
Interest payable (2,732)
Deferred outflows of resources are not recognized in the current period and therefore not reported in the governmental funds.Deferred outflows related to pension 54,560Loss on refunding of debt and derivatives 6,285
60,845
Long-term liabilities, including bonds payable, are not due and payable in the current period and therefore are not reported in the funds.
Accrued compensated absences (31,668) Accrued claims and judgements (1,442) Financing plan fee credits (44,249) Net pension liability (564,014) Pollution remediation obligations (619) Revenue and other bonds payable, net (396,103) Capital lease obligations payable (10,331) Notes payable (15,311) OPEB liability (150,466)
(1,214,203)
Deferred earnings on pension plan investments are deferred inflows of resources and are not reported in the governmental funds. (112,547)
Internal service funds are used by management to charge the costsof certain activities, such as insurance and fleet, to individual funds.The assets and liabilities of the internal service funds are includedin governmental activities in the statement of net position. 74,548
Net position of governmental activities 1,043,612$
The notes to the financial statements are an integral part of this statement.26

THIS PAGE INTENTIONALLY LEFT BLANK
27
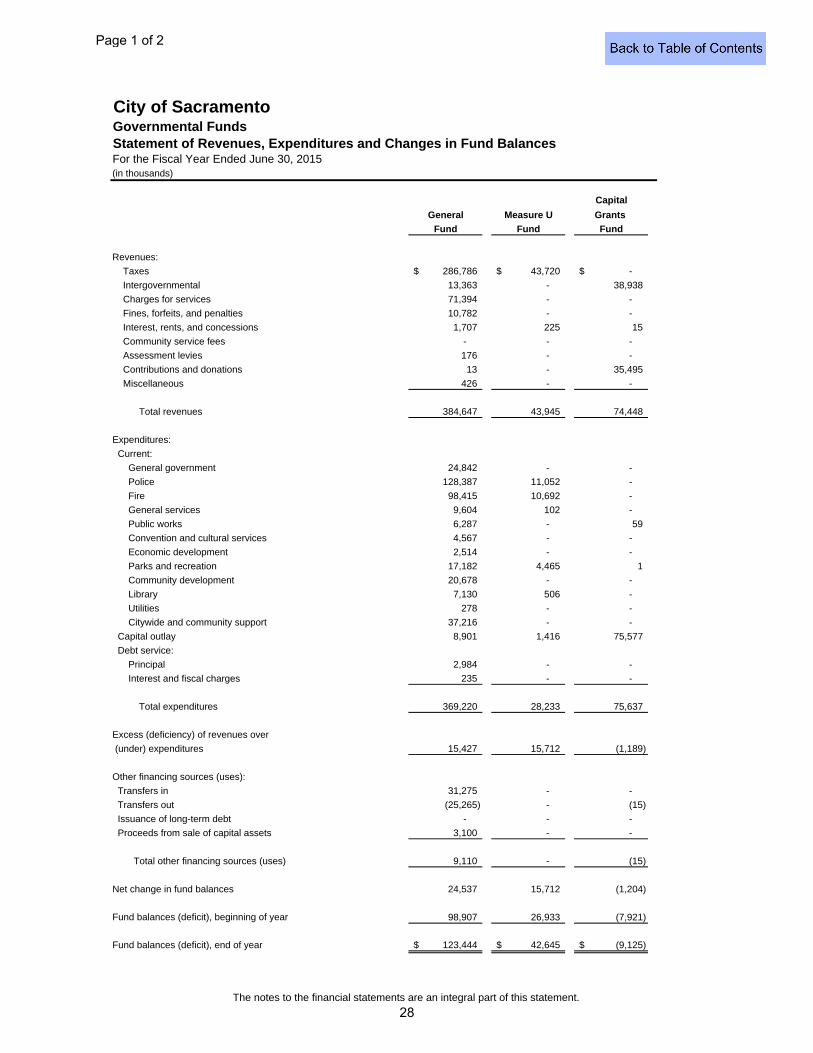
City of SacramentoGovernmental FundsStatement of Revenues, Expenditures and Changes in Fund BalancesFor the Fiscal Year Ended June 30, 2015(in thousands)
Capital
General Measure U Grants
Fund Fund Fund
Revenues:
Taxes 286,786$ 43,720$ -$
Intergovernmental 13,363 - 38,938
Charges for services 71,394 - -
Fines, forfeits, and penalties 10,782 - -
Interest, rents, and concessions 1,707 225 15
Community service fees - - -
Assessment levies 176 - -
Contributions and donations 13 - 35,495
Miscellaneous 426 - -
Total revenues 384,647 43,945 74,448
Expenditures:
Current:
General government 24,842 - -
Police 128,387 11,052 -
Fire 98,415 10,692 -
General services 9,604 102 -
Public works 6,287 - 59
Convention and cultural services 4,567 - -
Economic development 2,514 - -
Parks and recreation 17,182 4,465 1
Community development 20,678 - -
Library 7,130 506 -
Utilities 278 - -
Citywide and community support 37,216 - -
Capital outlay 8,901 1,416 75,577
Debt service:
Principal 2,984 - -
Interest and fiscal charges 235 - -
Total expenditures 369,220 28,233 75,637
Excess (deficiency) of revenues over
(under) expenditures 15,427 15,712 (1,189)
Other financing sources (uses):
Transfers in 31,275 - -
Transfers out (25,265) - (15)
Issuance of long-term debt - - -
Proceeds from sale of capital assets 3,100 - -
Total other financing sources (uses) 9,110 - (15)
Net change in fund balances 24,537 15,712 (1,204)
Fund balances (deficit), beginning of year 98,907 26,933 (7,921)
Fund balances (deficit), end of year 123,444$ 42,645$ (9,125)$
The notes to the financial statements are an integral part of this statement.
Page 1 of 2
28
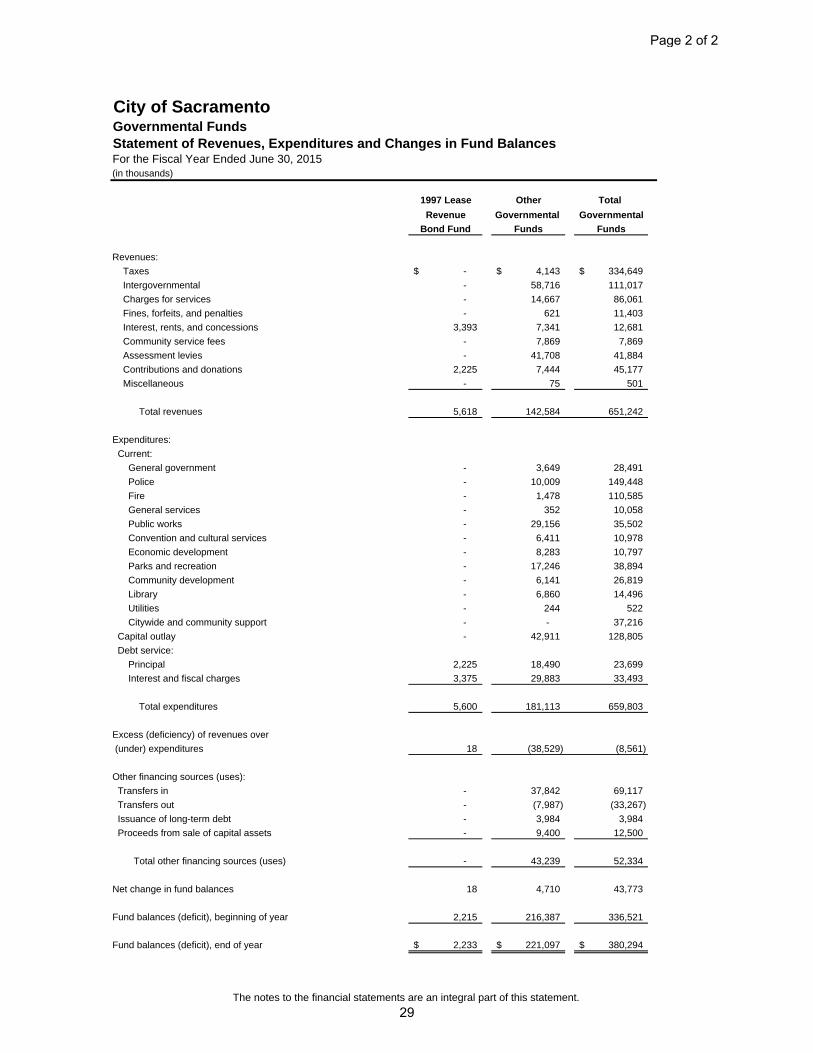
City of SacramentoGovernmental FundsStatement of Revenues, Expenditures and Changes in Fund BalancesFor the Fiscal Year Ended June 30, 2015(in thousands)
1997 Lease Other Total
Revenue Governmental Governmental
Bond Fund Funds Funds
Revenues:
Taxes -$ 4,143$ 334,649$
Intergovernmental - 58,716 111,017
Charges for services - 14,667 86,061
Fines, forfeits, and penalties - 621 11,403
Interest, rents, and concessions 3,393 7,341 12,681
Community service fees - 7,869 7,869
Assessment levies - 41,708 41,884
Contributions and donations 2,225 7,444 45,177
Miscellaneous - 75 501
Total revenues 5,618 142,584 651,242
Expenditures:
Current:
General government - 3,649 28,491
Police - 10,009 149,448
Fire - 1,478 110,585
General services - 352 10,058
Public works - 29,156 35,502
Convention and cultural services - 6,411 10,978
Economic development - 8,283 10,797
Parks and recreation - 17,246 38,894
Community development - 6,141 26,819
Library - 6,860 14,496
Utilities - 244 522
Citywide and community support - - 37,216
Capital outlay - 42,911 128,805
Debt service:
Principal 2,225 18,490 23,699
Interest and fiscal charges 3,375 29,883 33,493
Total expenditures 5,600 181,113 659,803
Excess (deficiency) of revenues over
(under) expenditures 18 (38,529) (8,561)
Other financing sources (uses):
Transfers in - 37,842 69,117
Transfers out - (7,987) (33,267)
Issuance of long-term debt - 3,984 3,984
Proceeds from sale of capital assets - 9,400 12,500
Total other financing sources (uses) - 43,239 52,334
Net change in fund balances 18 4,710 43,773
Fund balances (deficit), beginning of year 2,215 216,387 336,521
Fund balances (deficit), end of year 2,233$ 221,097$ 380,294$
The notes to the financial statements are an integral part of this statement.
Page 2 of 2
29
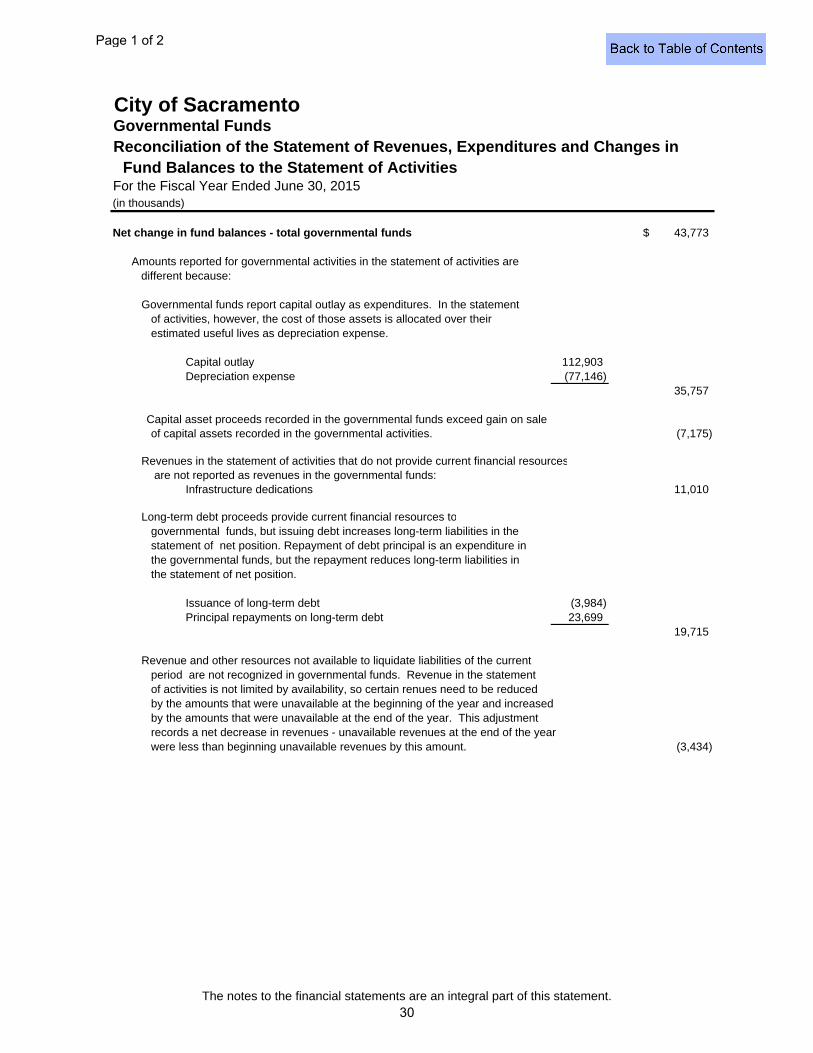
City of SacramentoGovernmental FundsReconciliation of the Statement of Revenues, Expenditures and Changes in
Fund Balances to the Statement of ActivitiesFor the Fiscal Year Ended June 30, 2015(in thousands)
Net change in fund balances - total governmental funds 43,773$
Amounts reported for governmental activities in the statement of activities are different because:
Governmental funds report capital outlay as expenditures. In the statementof activities, however, the cost of those assets is allocated over theirestimated useful lives as depreciation expense.
Capital outlay 112,903 Depreciation expense (77,146)
35,757
Capital asset proceeds recorded in the governmental funds exceed gain on saleof capital assets recorded in the governmental activities. (7,175)
Revenues in the statement of activities that do not provide current financial resources are not reported as revenues in the governmental funds:
Infrastructure dedications 11,010
Long-term debt proceeds provide current financial resources togovernmental funds, but issuing debt increases long-term liabilities in thestatement of net position. Repayment of debt principal is an expenditure in the governmental funds, but the repayment reduces long-term liabilities in the statement of net position.
Issuance of long-term debt (3,984) Principal repayments on long-term debt 23,699
19,715
Revenue and other resources not available to liquidate liabilities of the currentperiod are not recognized in governmental funds. Revenue in the statementof activities is not limited by availability, so certain renues need to be reducedby the amounts that were unavailable at the beginning of the year and increasedby the amounts that were unavailable at the end of the year. This adjustmentrecords a net decrease in revenues - unavailable revenues at the end of the yearwere less than beginning unavailable revenues by this amount. (3,434)
The notes to the financial statements are an integral part of this statement.
Page 1 of 2
30
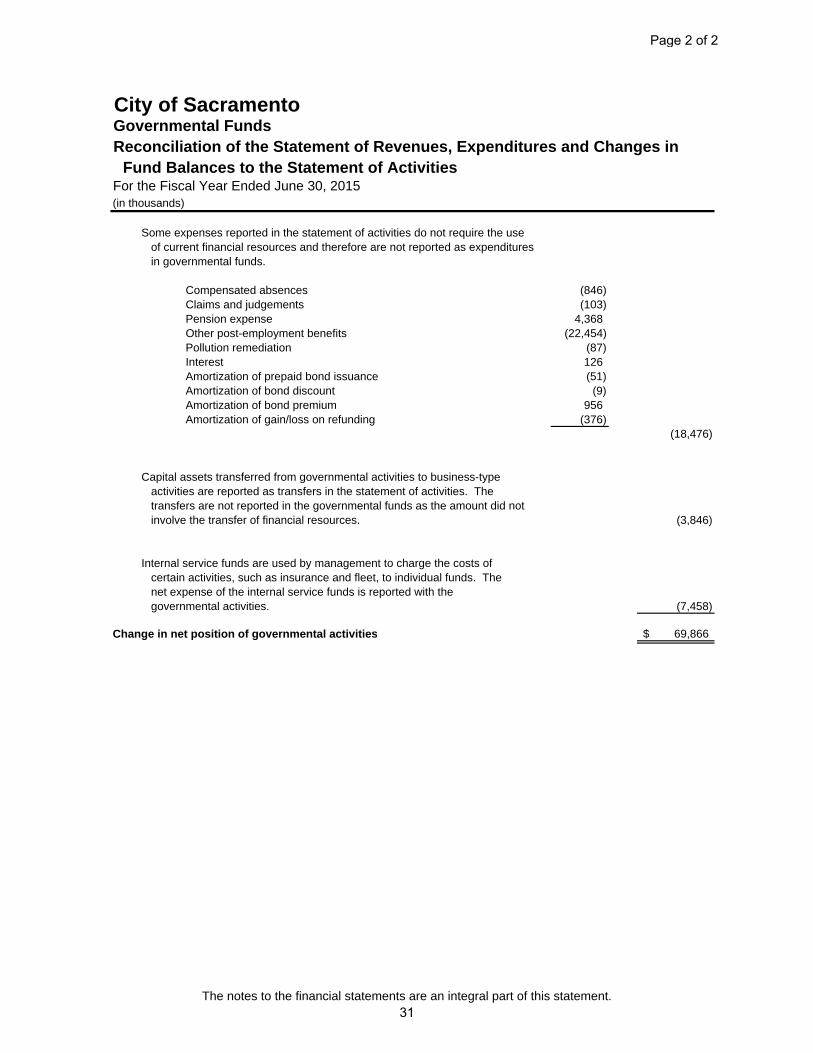
City of SacramentoGovernmental FundsReconciliation of the Statement of Revenues, Expenditures and Changes in
Fund Balances to the Statement of ActivitiesFor the Fiscal Year Ended June 30, 2015(in thousands)
Some expenses reported in the statement of activities do not require the useof current financial resources and therefore are not reported as expendituresin governmental funds.
Compensated absences (846) Claims and judgements (103) Pension expense 4,368 Other post-employment benefits (22,454) Pollution remediation (87) Interest 126 Amortization of prepaid bond issuance (51) Amortization of bond discount (9) Amortization of bond premium 956 Amortization of gain/loss on refunding (376)
(18,476)
Capital assets transferred from governmental activities to business-typeactivities are reported as transfers in the statement of activities. Thetransfers are not reported in the governmental funds as the amount did notinvolve the transfer of financial resources. (3,846)
Internal service funds are used by management to charge the costs ofcertain activities, such as insurance and fleet, to individual funds. Thenet expense of the internal service funds is reported with thegovernmental activities. (7,458)
Change in net position of governmental activities 69,866$
The notes to the financial statements are an integral part of this statement.
Page 2 of 2
31
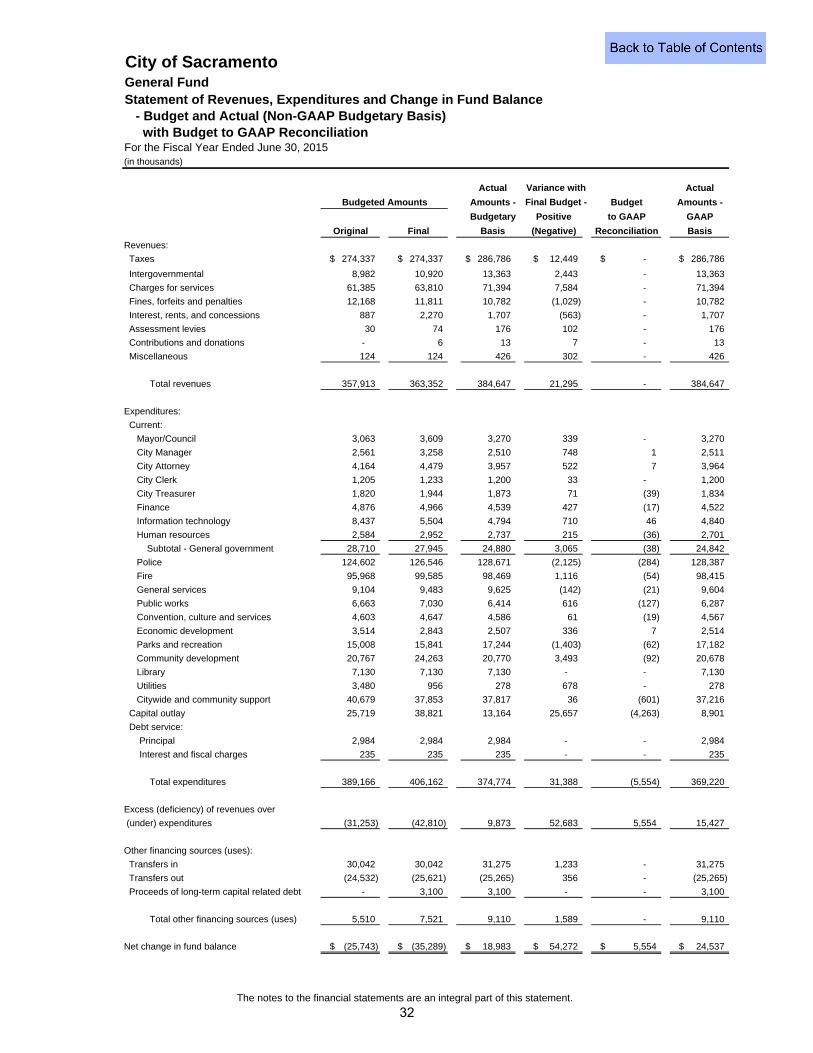
City of SacramentoGeneral FundStatement of Revenues, Expenditures and Change in Fund Balance
- Budget and Actual (Non-GAAP Budgetary Basis)with Budget to GAAP Reconciliation
For the Fiscal Year Ended June 30, 2015(in thousands)
Variance with
Final Budget -
Revenues:
Taxes 274,337$ 274,337$ 286,786$ 12,449$ -$ 286,786$
Intergovernmental 8,982 10,920 13,363 2,443 - 13,363
Charges for services 61,385 63,810 71,394 7,584 - 71,394
Fines, forfeits and penalties 12,168 11,811 10,782 (1,029) - 10,782
Interest, rents, and concessions 887 2,270 1,707 (563) - 1,707
Assessment levies 30 74 176 102 - 176
Contributions and donations - 6 13 7 - 13
Miscellaneous 124 124 426 302 - 426
Total revenues 357,913 363,352 384,647 21,295 - 384,647
Expenditures:
Current:
Mayor/Council 3,063 3,609 3,270 339 - 3,270
City Manager 2,561 3,258 2,510 748 1 2,511
City Attorney 4,164 4,479 3,957 522 7 3,964
City Clerk 1,205 1,233 1,200 33 - 1,200
City Treasurer 1,820 1,944 1,873 71 (39) 1,834
Finance 4,876 4,966 4,539 427 (17) 4,522
Information technology 8,437 5,504 4,794 710 46 4,840
Human resources 2,584 2,952 2,737 215 (36) 2,701
Subtotal - General government 28,710 27,945 24,880 3,065 (38) 24,842
Police 124,602 126,546 128,671 (2,125) (284) 128,387
Fire 95,968 99,585 98,469 1,116 (54) 98,415
General services 9,104 9,483 9,625 (142) (21) 9,604
Public works 6,663 7,030 6,414 616 (127) 6,287
Convention, culture and services 4,603 4,647 4,586 61 (19) 4,567
Economic development 3,514 2,843 2,507 336 7 2,514
Parks and recreation 15,008 15,841 17,244 (1,403) (62) 17,182
Community development 20,767 24,263 20,770 3,493 (92) 20,678
Library 7,130 7,130 7,130 - - 7,130
Utilities 3,480 956 278 678 - 278
Citywide and community support 40,679 37,853 37,817 36 (601) 37,216
Capital outlay 25,719 38,821 13,164 25,657 (4,263) 8,901
Debt service:
Principal 2,984 2,984 2,984 - - 2,984
Interest and fiscal charges 235 235 235 - - 235
Total expenditures 389,166 406,162 374,774 31,388 (5,554) 369,220
Excess (deficiency) of revenues over
(under) expenditures (31,253) (42,810) 9,873 52,683 5,554 15,427
Other financing sources (uses):
Transfers in 30,042 30,042 31,275 1,233 - 31,275
Transfers out (24,532) (25,621) (25,265) 356 - (25,265)
Proceeds of long-term capital related debt - 3,100 3,100 - - 3,100
Total other financing sources (uses) 5,510 7,521 9,110 1,589 - 9,110
Net change in fund balance (25,743)$ (35,289)$ 18,983$ 54,272$ 5,554$ 24,537$
Actual
Amounts -
Budgetary
Basis
Actual
Amounts -
GAAP
Basis
Budget
to GAAP
(Negative)
Budgeted Amounts
Original Final Reconciliation
Positive
The notes to the financial statements are an integral part of this statement.
32
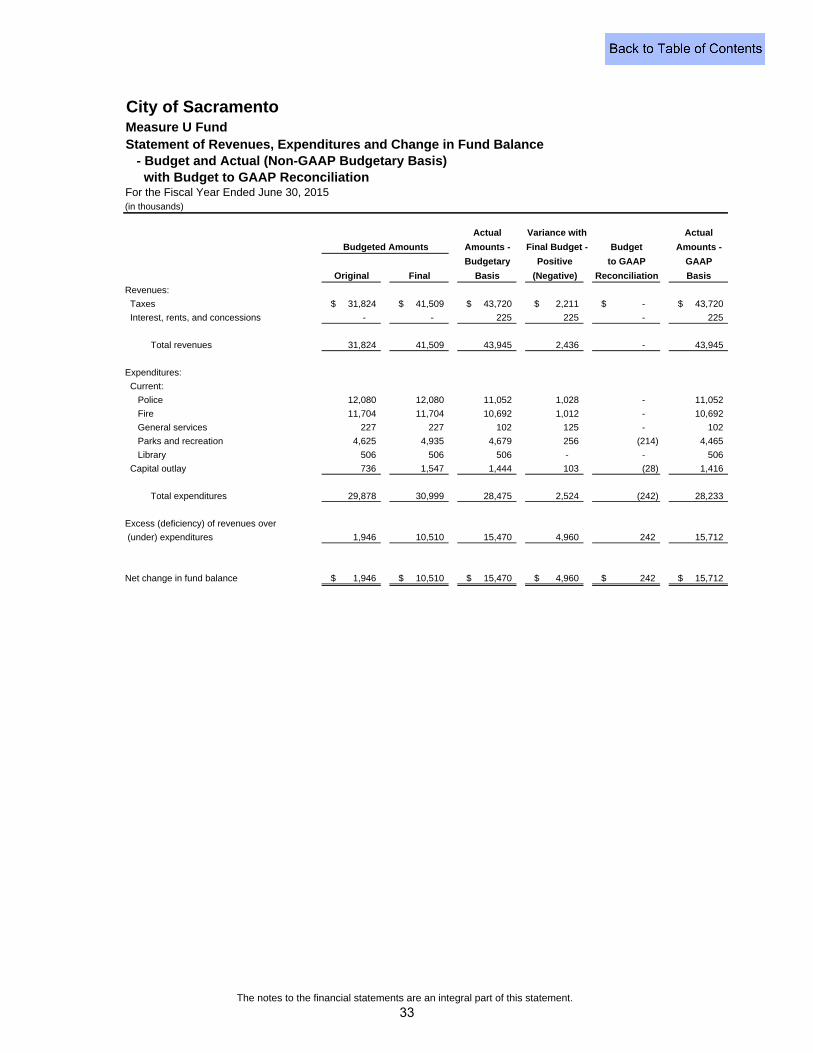
City of SacramentoMeasure U FundStatement of Revenues, Expenditures and Change in Fund Balance
- Budget and Actual (Non-GAAP Budgetary Basis)with Budget to GAAP Reconciliation
For the Fiscal Year Ended June 30, 2015(in thousands)
Variance with
Final Budget -
Revenues:
Taxes 31,824$ 41,509$ 43,720$ 2,211$ -$ 43,720$
Interest, rents, and concessions - - 225 225 - 225
Total revenues 31,824 41,509 43,945 2,436 - 43,945
Expenditures:
Current:
Police 12,080 12,080 11,052 1,028 - 11,052
Fire 11,704 11,704 10,692 1,012 - 10,692
General services 227 227 102 125 - 102
Parks and recreation 4,625 4,935 4,679 256 (214) 4,465
Library 506 506 506 - - 506
Capital outlay 736 1,547 1,444 103 (28) 1,416
Total expenditures 29,878 30,999 28,475 2,524 (242) 28,233
Excess (deficiency) of revenues over
(under) expenditures 1,946 10,510 15,470 4,960 242 15,712
Net change in fund balance 1,946$ 10,510$ 15,470$ 4,960$ 242$ 15,712$
Actual Actual
Budgeted Amounts Amounts - Budget Amounts -
Budgetary Positive to GAAP GAAP
Original Final Basis (Negative) Reconciliation Basis
The notes to the financial statements are an integral part of this statement.
33
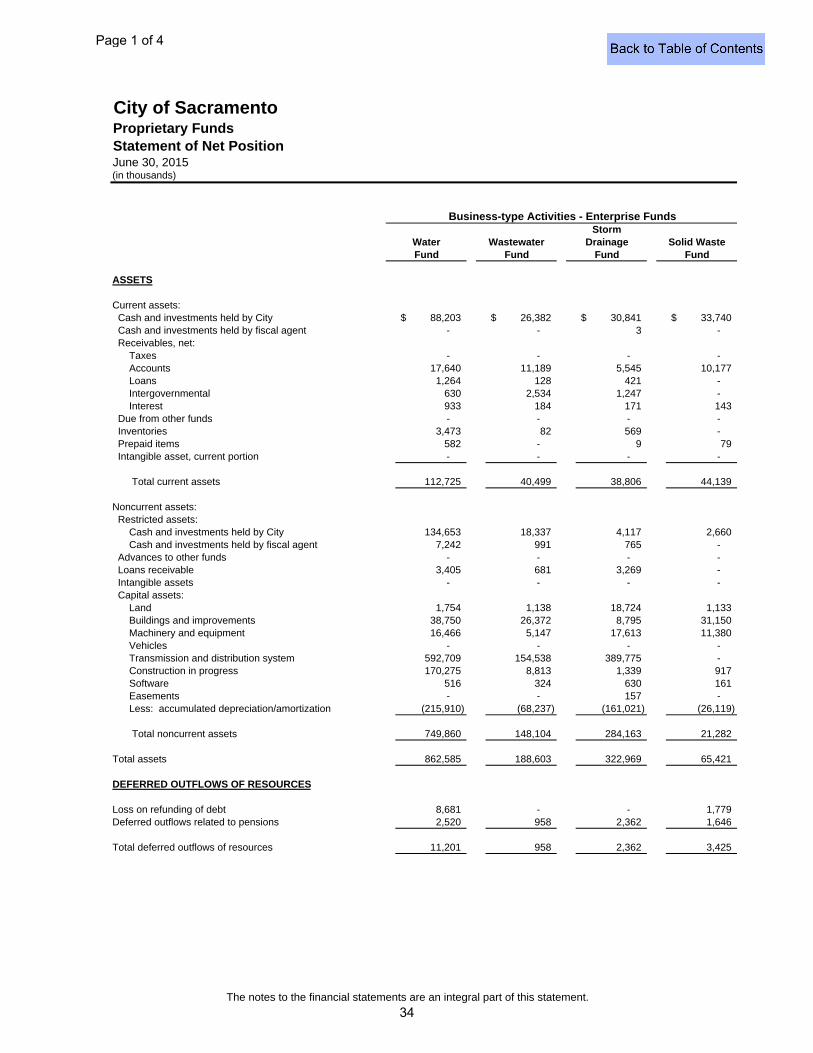
City of SacramentoProprietary FundsStatement of Net PositionJune 30, 2015(in thousands)
ASSETS
Current assets: Cash and investments held by City 88,203$ 26,382$ 30,841$ 33,740$ Cash and investments held by fiscal agent - - 3 - Receivables, net: Taxes - - - - Accounts 17,640 11,189 5,545 10,177 Loans 1,264 128 421 - Intergovernmental 630 2,534 1,247 - Interest 933 184 171 143 Due from other funds - - - - Inventories 3,473 82 569 - Prepaid items 582 - 9 79 Intangible asset, current portion - - - -
Total current assets 112,725 40,499 38,806 44,139
Noncurrent assets: Restricted assets: Cash and investments held by City 134,653 18,337 4,117 2,660 Cash and investments held by fiscal agent 7,242 991 765 - Advances to other funds - - - - Loans receivable 3,405 681 3,269 - Intangible assets - - - - Capital assets: Land 1,754 1,138 18,724 1,133 Buildings and improvements 38,750 26,372 8,795 31,150 Machinery and equipment 16,466 5,147 17,613 11,380 Vehicles - - - - Transmission and distribution system 592,709 154,538 389,775 - Construction in progress 170,275 8,813 1,339 917 Software 516 324 630 161 Easements - - 157 - Less: accumulated depreciation/amortization (215,910) (68,237) (161,021) (26,119)
Total noncurrent assets 749,860 148,104 284,163 21,282
Total assets 862,585 188,603 322,969 65,421
DEFERRED OUTFLOWS OF RESOURCES
Loss on refunding of debt 8,681 - - 1,779 Deferred outflows related to pensions 2,520 958 2,362 1,646
Total deferred outflows of resources 11,201 958 2,362 3,425
Water WastewaterStorm
Drainage Solid WasteFund
Business-type Activities - Enterprise Funds
FundFund Fund
The notes to the financial statements are an integral part of this statement.
Page 1 of 4
34
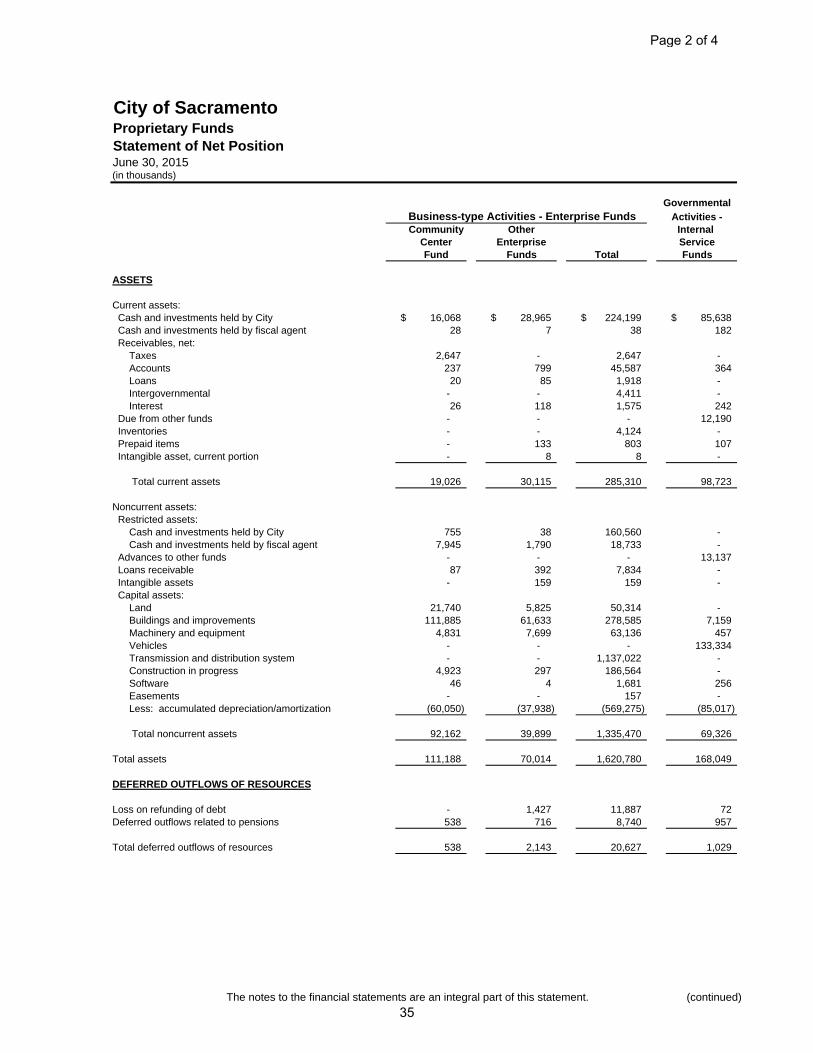
City of SacramentoProprietary FundsStatement of Net PositionJune 30, 2015(in thousands)
ASSETS
Current assets: Cash and investments held by City Cash and investments held by fiscal agent Receivables, net: Taxes Accounts Loans Intergovernmental Interest Due from other funds Inventories Prepaid items Intangible asset, current portion
Total current assets
Noncurrent assets: Restricted assets: Cash and investments held by City Cash and investments held by fiscal agent Advances to other funds Loans receivable Intangible assets Capital assets: Land Buildings and improvements Machinery and equipment Vehicles Transmission and distribution system Construction in progress Software Easements Less: accumulated depreciation/amortization
Total noncurrent assets
Total assets
DEFERRED OUTFLOWS OF RESOURCES
Loss on refunding of debtDeferred outflows related to pensions
Total deferred outflows of resources
OtherEnterprise
Funds
16,068$ 28,965$ 224,199$ 85,638$ 28 7 38 182
2,647 - 2,647 - 237 799 45,587 364
20 85 1,918 - - - 4,411 - 26 118 1,575 242
- - - 12,190 - - 4,124 - - 133 803 107 - 8 8 -
19,026 30,115 285,310 98,723
755 38 160,560 - 7,945 1,790 18,733 -
- - - 13,137 87 392 7,834 -
- 159 159 -
21,740 5,825 50,314 - 111,885 61,633 278,585 7,159
4,831 7,699 63,136 457 - - - 133,334 - - 1,137,022 -
4,923 297 186,564 - 46 4 1,681 256
- - 157 - (60,050) (37,938) (569,275) (85,017)
92,162 39,899 1,335,470 69,326
111,188 70,014 1,620,780 168,049
- 1,427 11,887 72 538 716 8,740 957
538 2,143 20,627 1,029
Funds
Community
Fund
Activities -Internal Service
Business-type Activities - Enterprise FundsGovernmental
CenterTotal
The notes to the financial statements are an integral part of this statement. (continued)
Page 2 of 4
35
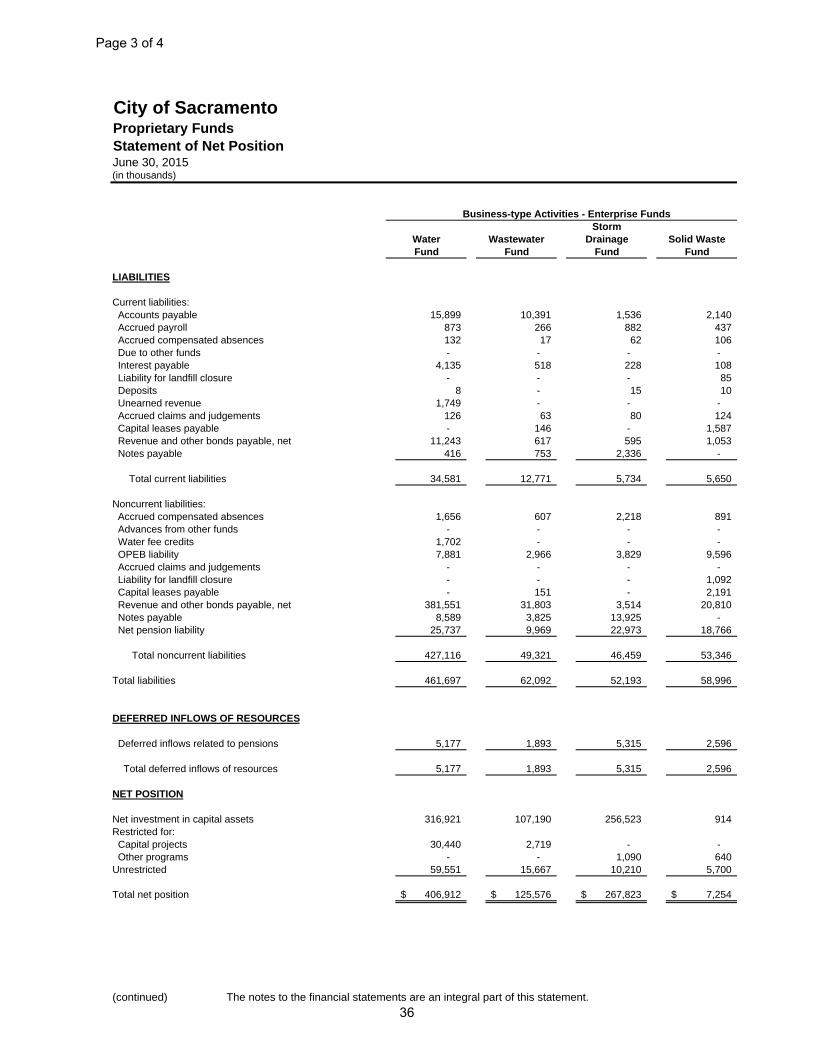
City of SacramentoProprietary FundsStatement of Net PositionJune 30, 2015(in thousands)
LIABILITIES
Current liabilities: Accounts payable 15,899 10,391 1,536 2,140 Accrued payroll 873 266 882 437 Accrued compensated absences 132 17 62 106 Due to other funds - - - - Interest payable 4,135 518 228 108 Liability for landfill closure - - - 85 Deposits 8 - 15 10 Unearned revenue 1,749 - - - Accrued claims and judgements 126 63 80 124 Capital leases payable - 146 - 1,587 Revenue and other bonds payable, net 11,243 617 595 1,053 Notes payable 416 753 2,336 -
Total current liabilities 34,581 12,771 5,734 5,650
Noncurrent liabilities: Accrued compensated absences 1,656 607 2,218 891 Advances from other funds - - - - Water fee credits 1,702 - - - OPEB liability 7,881 2,966 3,829 9,596 Accrued claims and judgements - - - - Liability for landfill closure - - - 1,092 Capital leases payable - 151 - 2,191 Revenue and other bonds payable, net 381,551 31,803 3,514 20,810 Notes payable 8,589 3,825 13,925 - Net pension liability 25,737 9,969 22,973 18,766
Total noncurrent liabilities 427,116 49,321 46,459 53,346
Total liabilities 461,697 62,092 52,193 58,996
DEFERRED INFLOWS OF RESOURCES
Deferred inflows related to pensions 5,177 1,893 5,315 2,596
Total deferred inflows of resources 5,177 1,893 5,315 2,596
NET POSITION
Net investment in capital assets 316,921 107,190 256,523 914 Restricted for: Capital projects 30,440 2,719 - - Other programs - - 1,090 640 Unrestricted 59,551 15,667 10,210 5,700
Total net position 406,912$ 125,576$ 267,823$ 7,254$
Business-type Activities - Enterprise Funds
DrainageFund Fund FundWater Wastewater
Storm
FundSolid Waste
(continued) The notes to the financial statements are an integral part of this statement.
Page 3 of 4
36
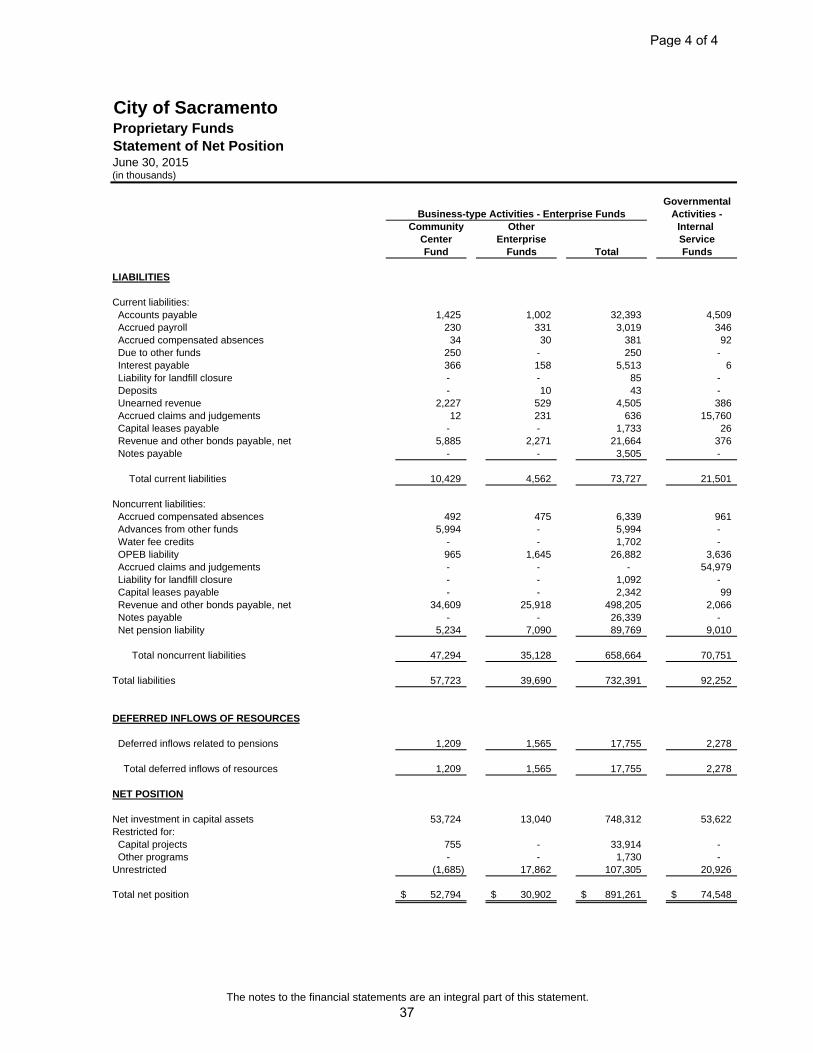
City of SacramentoProprietary FundsStatement of Net PositionJune 30, 2015(in thousands)
LIABILITIES
Current liabilities: Accounts payable Accrued payroll Accrued compensated absences Due to other funds Interest payable Liability for landfill closure Deposits Unearned revenue Accrued claims and judgements Capital leases payable Revenue and other bonds payable, net Notes payable
Total current liabilities
Noncurrent liabilities: Accrued compensated absences Advances from other funds Water fee credits OPEB liability Accrued claims and judgements Liability for landfill closure Capital leases payable Revenue and other bonds payable, net Notes payable Net pension liability
Total noncurrent liabilities
Total liabilities
DEFERRED INFLOWS OF RESOURCES
Deferred inflows related to pensions
Total deferred inflows of resources
NET POSITION
Net investment in capital assetsRestricted for: Capital projects Other programsUnrestricted
Total net position
OtherEnterprise
Funds
1,425 1,002 32,393 4,509 230 331 3,019 346
34 30 381 92 250 - 250 - 366 158 5,513 6 - - 85 - - 10 43 -
2,227 529 4,505 386 12 231 636 15,760
- - 1,733 26 5,885 2,271 21,664 376
- - 3,505 -
10,429 4,562 73,727 21,501
492 475 6,339 961 5,994 - 5,994 -
- - 1,702 - 965 1,645 26,882 3,636 - - - 54,979 - - 1,092 - - - 2,342 99
34,609 25,918 498,205 2,066 - - 26,339 -
5,234 7,090 89,769 9,010
47,294 35,128 658,664 70,751
57,723 39,690 732,391 92,252
1,209 1,565 17,755 2,278
1,209 1,565 17,755 2,278
53,724 13,040 748,312 53,622
755 - 33,914 - - - 1,730 -
(1,685) 17,862 107,305 20,926
52,794$ 30,902$ 891,261$ 74,548$
CenterFund Funds
Activities -Internal Service
Community
GovernmentalBusiness-type Activities - Enterprise Funds
Total
The notes to the financial statements are an integral part of this statement.
Page 4 of 4
37
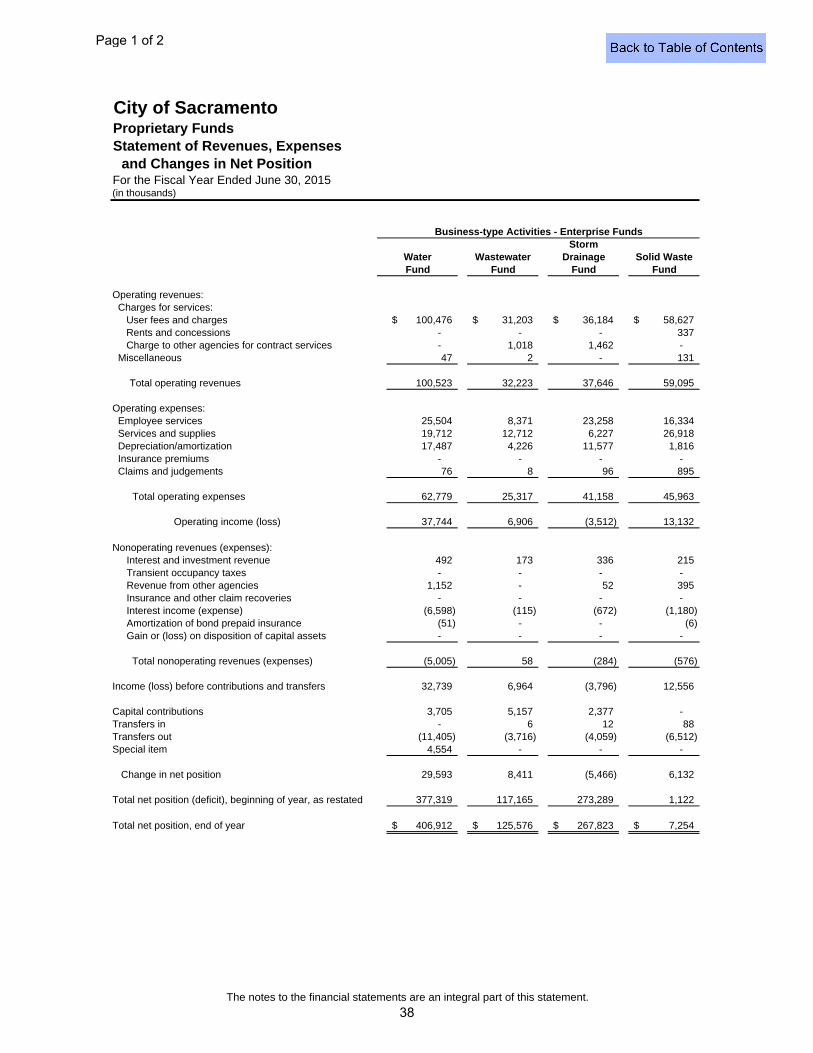
City of SacramentoProprietary FundsStatement of Revenues, Expenses
and Changes in Net PositionFor the Fiscal Year Ended June 30, 2015(in thousands)
StormWastewater Drainage Solid Waste
Fund Fund Fund
Operating revenues: Charges for services: User fees and charges 100,476$ 31,203$ 36,184$ 58,627$ Rents and concessions - - - 337 Charge to other agencies for contract services - 1,018 1,462 - Miscellaneous 47 2 - 131
Total operating revenues 100,523 32,223 37,646 59,095
Operating expenses: Employee services 25,504 8,371 23,258 16,334 Services and supplies 19,712 12,712 6,227 26,918 Depreciation/amortization 17,487 4,226 11,577 1,816 Insurance premiums - - - - Claims and judgements 76 8 96 895
Total operating expenses 62,779 25,317 41,158 45,963
Operating income (loss) 37,744 6,906 (3,512) 13,132
Nonoperating revenues (expenses): Interest and investment revenue 492 173 336 215 Transient occupancy taxes - - - - Revenue from other agencies 1,152 - 52 395 Insurance and other claim recoveries - - - - Interest income (expense) (6,598) (115) (672) (1,180) Amortization of bond prepaid insurance (51) - - (6) Gain or (loss) on disposition of capital assets - - - -
Total nonoperating revenues (expenses) (5,005) 58 (284) (576)
Income (loss) before contributions and transfers 32,739 6,964 (3,796) 12,556
Capital contributions 3,705 5,157 2,377 - Transfers in - 6 12 88 Transfers out (11,405) (3,716) (4,059) (6,512) Special item 4,554 - - -
Change in net position 29,593 8,411 (5,466) 6,132
Total net position (deficit), beginning of year, as restated 377,319 117,165 273,289 1,122
Total net position, end of year 406,912$ 125,576$ 267,823$ 7,254$
Business-type Activities - Enterprise Funds
FundWater
The notes to the financial statements are an integral part of this statement.
Page 1 of 2
38
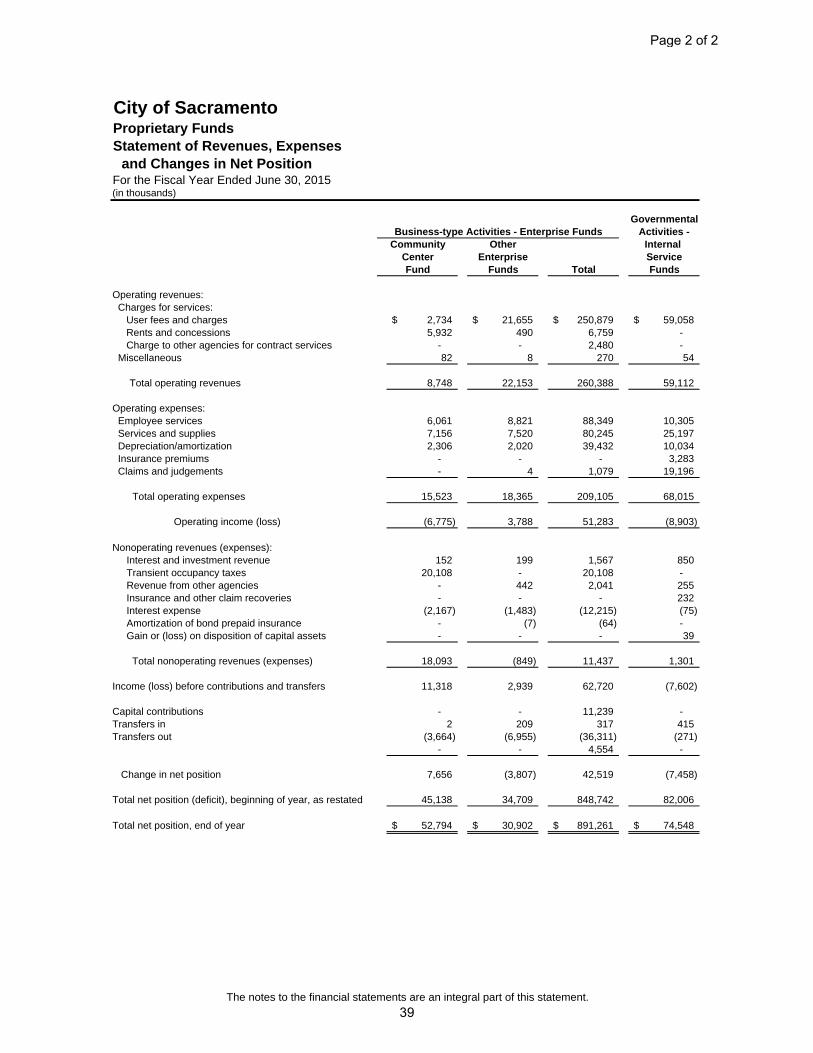
City of SacramentoProprietary FundsStatement of Revenues, Expenses
and Changes in Net PositionFor the Fiscal Year Ended June 30, 2015(in thousands)
GovernmentalActivities -
Other Internal Enterprise Service
Funds Total Funds
Operating revenues: Charges for services: User fees and charges 2,734$ 21,655$ 250,879$ 59,058$ Rents and concessions 5,932 490 6,759 - Charge to other agencies for contract services - - 2,480 - Miscellaneous 82 8 270 54
Total operating revenues 8,748 22,153 260,388 59,112
Operating expenses: Employee services 6,061 8,821 88,349 10,305 Services and supplies 7,156 7,520 80,245 25,197 Depreciation/amortization 2,306 2,020 39,432 10,034 Insurance premiums - - - 3,283 Claims and judgements - 4 1,079 19,196
Total operating expenses 15,523 18,365 209,105 68,015
Operating income (loss) (6,775) 3,788 51,283 (8,903)
Nonoperating revenues (expenses): Interest and investment revenue 152 199 1,567 850 Transient occupancy taxes 20,108 - 20,108 - Revenue from other agencies - 442 2,041 255 Insurance and other claim recoveries - - - 232 Interest expense (2,167) (1,483) (12,215) (75) Amortization of bond prepaid insurance - (7) (64) - Gain or (loss) on disposition of capital assets - - - 39
Total nonoperating revenues (expenses) 18,093 (849) 11,437 1,301
Income (loss) before contributions and transfers 11,318 2,939 62,720 (7,602)
Capital contributions - - 11,239 - Transfers in 2 209 317 415 Transfers out (3,664) (6,955) (36,311) (271)
- - 4,554 -
Change in net position 7,656 (3,807) 42,519 (7,458)
Total net position (deficit), beginning of year, as restated 45,138 34,709 848,742 82,006
Total net position, end of year 52,794$ 30,902$ 891,261$ 74,548$
CommunityCenterFund
Business-type Activities - Enterprise Funds
The notes to the financial statements are an integral part of this statement.
Page 2 of 2
39
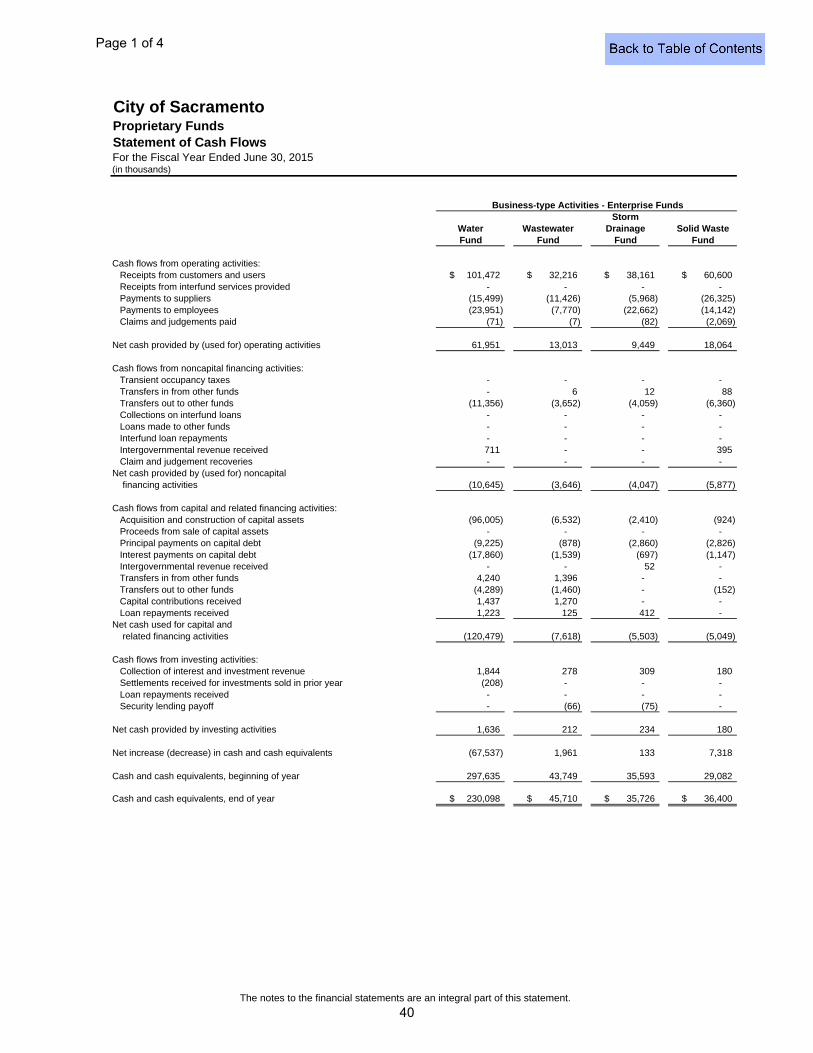
City of SacramentoProprietary FundsStatement of Cash FlowsFor the Fiscal Year Ended June 30, 2015(in thousands)
Cash flows from operating activities:Receipts from customers and users 101,472$ 32,216$ 38,161$ 60,600$ Receipts from interfund services provided - - - - Payments to suppliers (15,499) (11,426) (5,968) (26,325) Payments to employees (23,951) (7,770) (22,662) (14,142) Claims and judgements paid (71) (7) (82) (2,069)
Net cash provided by (used for) operating activities 61,951 13,013 9,449 18,064
Cash flows from noncapital financing activities:Transient occupancy taxes - - - - Transfers in from other funds - 6 12 88 Transfers out to other funds (11,356) (3,652) (4,059) (6,360) Collections on interfund loans - - - - Loans made to other funds - - - - Interfund loan repayments - - - - Intergovernmental revenue received 711 - - 395 Claim and judgement recoveries - - - -
Net cash provided by (used for) noncapital financing activities (10,645) (3,646) (4,047) (5,877)
Cash flows from capital and related financing activities:Acquisition and construction of capital assets (96,005) (6,532) (2,410) (924) Proceeds from sale of capital assets - - - - Principal payments on capital debt (9,225) (878) (2,860) (2,826) Interest payments on capital debt (17,860) (1,539) (697) (1,147) Intergovernmental revenue received - - 52 - Transfers in from other funds 4,240 1,396 - - Transfers out to other funds (4,289) (1,460) - (152) Capital contributions received 1,437 1,270 - -Loan repayments received 1,223 125 412 -
Net cash used for capital and related financing activities (120,479) (7,618) (5,503) (5,049)
Cash flows from investing activities:Collection of interest and investment revenue 1,844 278 309 180 Settlements received for investments sold in prior year (208) - - - Loan repayments received - - - - Security lending payoff - (66) (75) -
Net cash provided by investing activities 1,636 212 234 180
Net increase (decrease) in cash and cash equivalents (67,537) 1,961 133 7,318
Cash and cash equivalents, beginning of year 297,635 43,749 35,593 29,082
Cash and cash equivalents, end of year 230,098$ 45,710$ 35,726$ 36,400$
Solid WasteDrainageStorm
Business-type Activities - Enterprise Funds
WastewaterWaterFund FundFundFund
The notes to the financial statements are an integral part of this statement.
Page 1 of 4
40
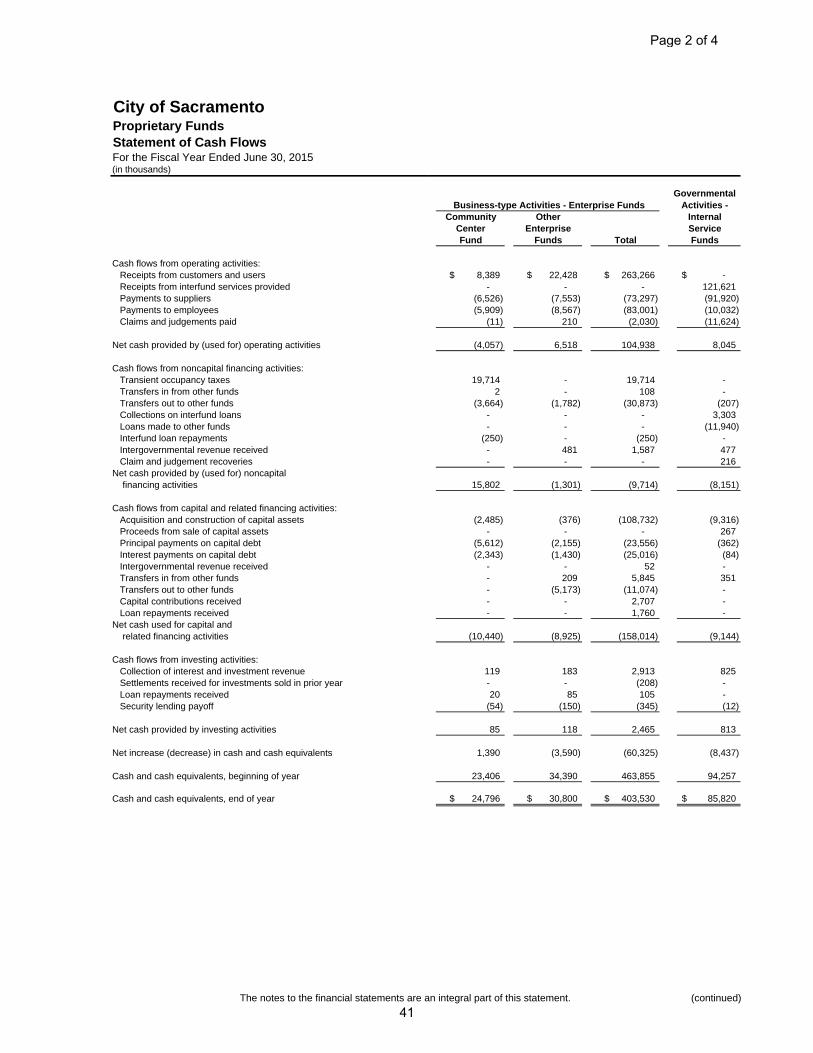
City of SacramentoProprietary FundsStatement of Cash FlowsFor the Fiscal Year Ended June 30, 2015(in thousands)
Cash flows from operating activities:Receipts from customers and usersReceipts from interfund services providedPayments to suppliersPayments to employeesClaims and judgements paid
Net cash provided by (used for) operating activities
Cash flows from noncapital financing activities:Transient occupancy taxesTransfers in from other fundsTransfers out to other fundsCollections on interfund loansLoans made to other fundsInterfund loan repaymentsIntergovernmental revenue receivedClaim and judgement recoveries
Net cash provided by (used for) noncapital financing activities
Cash flows from capital and related financing activities:Acquisition and construction of capital assetsProceeds from sale of capital assetsPrincipal payments on capital debtInterest payments on capital debtIntergovernmental revenue receivedTransfers in from other fundsTransfers out to other fundsCapital contributions receivedLoan repayments received
Net cash used for capital and related financing activities
Cash flows from investing activities:Collection of interest and investment revenueSettlements received for investments sold in prior yearLoan repayments receivedSecurity lending payoff
Net cash provided by investing activities
Net increase (decrease) in cash and cash equivalents
Cash and cash equivalents, beginning of year
Cash and cash equivalents, end of year
8,389$ 22,428$ 263,266$ -$ - - - 121,621
(6,526) (7,553) (73,297) (91,920) (5,909) (8,567) (83,001) (10,032)
(11) 210 (2,030) (11,624)
(4,057) 6,518 104,938 8,045
19,714 - 19,714 - 2 - 108 -
(3,664) (1,782) (30,873) (207) - - - 3,303 - - - (11,940)
(250) - (250) - - 481 1,587 477 - - - 216
15,802 (1,301) (9,714) (8,151)
(2,485) (376) (108,732) (9,316) - - - 267
(5,612) (2,155) (23,556) (362) (2,343) (1,430) (25,016) (84)
- - 52 - - 209 5,845 351 - (5,173) (11,074) - - - 2,707 - - - 1,760 -
(10,440) (8,925) (158,014) (9,144)
119 183 2,913 825 - - (208) - 20 85 105 -
(54) (150) (345) (12)
85 118 2,465 813
1,390 (3,590) (60,325) (8,437)
23,406 34,390 463,855 94,257
24,796$ 30,800$ 403,530$ 85,820$
Business-type Activities - Enterprise FundsOther
EnterpriseCommunity
CenterFundsFund Total
Governmental Activities -
InternalServiceFunds
The notes to the financial statements are an integral part of this statement. (continued)
Page 2 of 4
41
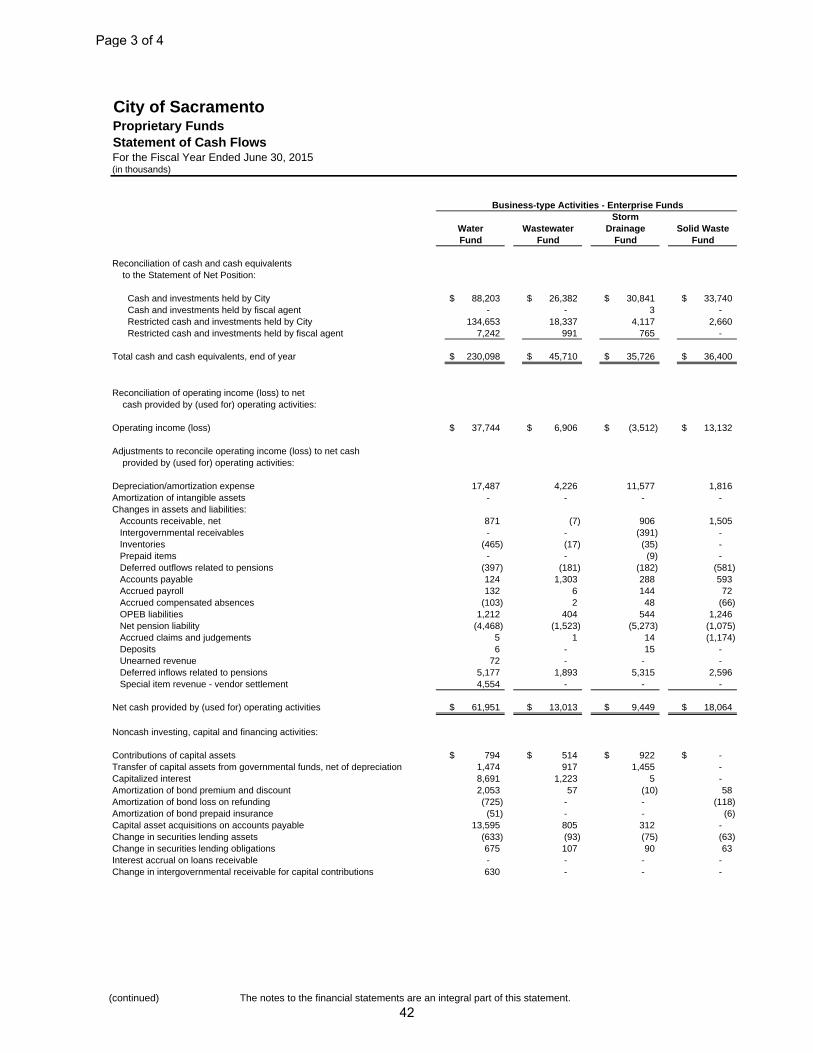
City of SacramentoProprietary FundsStatement of Cash FlowsFor the Fiscal Year Ended June 30, 2015(in thousands)
Reconciliation of cash and cash equivalents to the Statement of Net Position:
Cash and investments held by City 88,203$ 26,382$ 30,841$ 33,740$ Cash and investments held by fiscal agent - - 3 - Restricted cash and investments held by City 134,653 18,337 4,117 2,660 Restricted cash and investments held by fiscal agent 7,242 991 765 -
Total cash and cash equivalents, end of year 230,098$ 45,710$ 35,726$ 36,400$
Reconciliation of operating income (loss) to net cash provided by (used for) operating activities:
Operating income (loss) 37,744$ 6,906$ (3,512)$ 13,132$
Adjustments to reconcile operating income (loss) to net cash provided by (used for) operating activities:
Depreciation/amortization expense 17,487 4,226 11,577 1,816Amortization of intangible assets - - - -Changes in assets and liabilities:
Accounts receivable, net 871 (7) 906 1,505 Intergovernmental receivables - - (391) - Inventories (465) (17) (35) - Prepaid items - - (9) - Deferred outflows related to pensions (397) (181) (182) (581) Accounts payable 124 1,303 288 593 Accrued payroll 132 6 144 72 Accrued compensated absences (103) 2 48 (66) OPEB liabilities 1,212 404 544 1,246 Net pension liability (4,468) (1,523) (5,273) (1,075) Accrued claims and judgements 5 1 14 (1,174) Deposits 6 - 15 - Unearned revenue 72 - - - Deferred inflows related to pensions 5,177 1,893 5,315 2,596 Special item revenue - vendor settlement 4,554 - - -
Net cash provided by (used for) operating activities 61,951$ 13,013$ 9,449$ 18,064$
Noncash investing, capital and financing activities:
Contributions of capital assets 794$ 514$ 922$ -$ Transfer of capital assets from governmental funds, net of depreciation 1,474 917 1,455 - Capitalized interest 8,691 1,223 5 - Amortization of bond premium and discount 2,053 57 (10) 58 Amortization of bond loss on refunding (725) - - (118) Amortization of bond prepaid insurance (51) - - (6) Capital asset acquisitions on accounts payable 13,595 805 312 - Change in securities lending assets (633) (93) (75) (63) Change in securities lending obligations 675 107 90 63 Interest accrual on loans receivable - - - - Change in intergovernmental receivable for capital contributions 630 - - -
StormBusiness-type Activities - Enterprise Funds
Water Wastewater Drainage Solid WasteFund Fund Fund Fund
(continued) The notes to the financial statements are an integral part of this statement.
Page 3 of 4
42
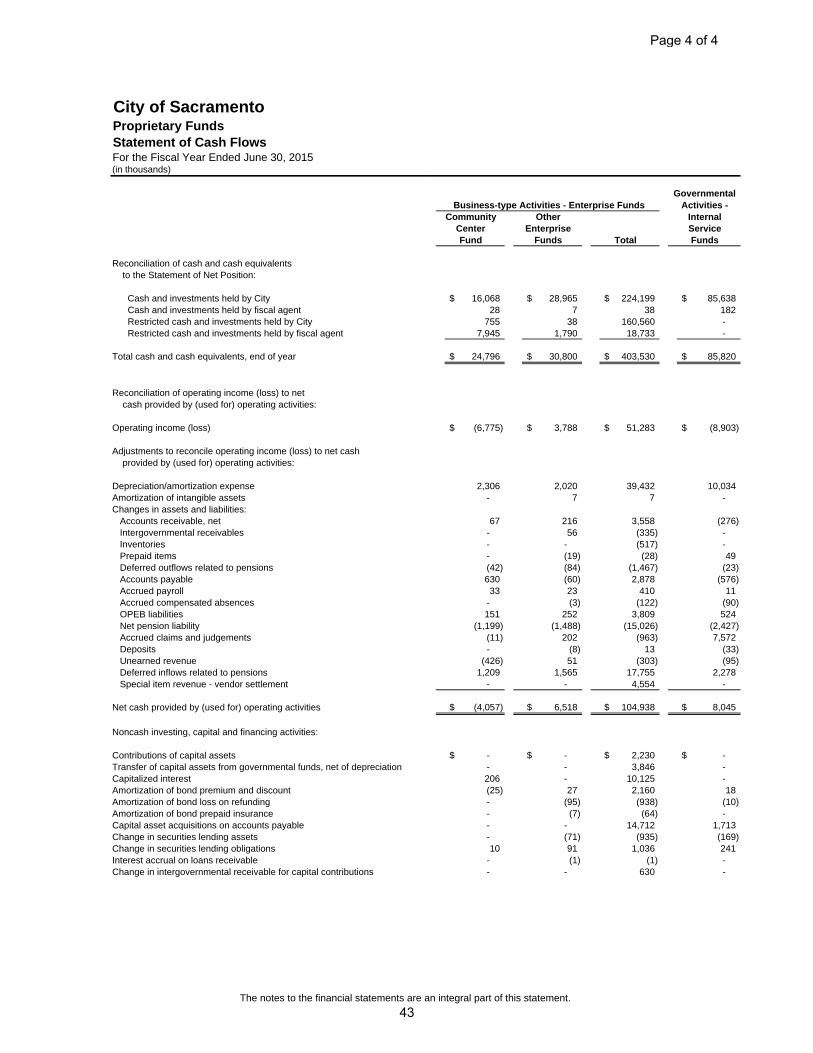
City of SacramentoProprietary FundsStatement of Cash FlowsFor the Fiscal Year Ended June 30, 2015(in thousands)
Reconciliation of cash and cash equivalents to the Statement of Net Position:
Cash and investments held by City Cash and investments held by fiscal agent Restricted cash and investments held by City Restricted cash and investments held by fiscal agent
Total cash and cash equivalents, end of year
Reconciliation of operating income (loss) to net cash provided by (used for) operating activities:
Operating income (loss)
Adjustments to reconcile operating income (loss) to net cash provided by (used for) operating activities:
Depreciation/amortization expenseAmortization of intangible assetsChanges in assets and liabilities:
Accounts receivable, netIntergovernmental receivablesInventoriesPrepaid itemsDeferred outflows related to pensionsAccounts payable Accrued payroll Accrued compensated absencesOPEB liabilitiesNet pension liabilityAccrued claims and judgementsDepositsUnearned revenueDeferred inflows related to pensionsSpecial item revenue - vendor settlement
Net cash provided by (used for) operating activities
Noncash investing, capital and financing activities:
Contributions of capital assetsTransfer of capital assets from governmental funds, net of depreciationCapitalized interestAmortization of bond premium and discountAmortization of bond loss on refundingAmortization of bond prepaid insuranceCapital asset acquisitions on accounts payableChange in securities lending assetsChange in securities lending obligationsInterest accrual on loans receivableChange in intergovernmental receivable for capital contributions
16,068$ 28,965$ 224,199$ 85,638$ 28 7 38 182
755 38 160,560 - 7,945 1,790 18,733 -
24,796$ 30,800$ 403,530$ 85,820$
(6,775)$ 3,788$ 51,283$ (8,903)$
2,306 2,020 39,432 10,034 - 7 7 -
67 216 3,558 (276) - 56 (335) - - - (517) - - (19) (28) 49 (42) (84) (1,467) (23) 630 (60) 2,878 (576) 33 23 410 11
- (3) (122) (90) 151 252 3,809 524
(1,199) (1,488) (15,026) (2,427) (11) 202 (963) 7,572 - (8) 13 (33)
(426) 51 (303) (95) 1,209 1,565 17,755 2,278
- - 4,554 -
(4,057)$ 6,518$ 104,938$ 8,045$
-$ -$ 2,230$ -$ - - 3,846 - 206 - 10,125 - (25) 27 2,160 18 - (95) (938) (10) - (7) (64) - - - 14,712 1,713 - (71) (935) (169) 10 91 1,036 241
- (1) (1) - - - 630 -
Business-type Activities - Enterprise FundsCommunity Other
ServiceTotal
Center EnterpriseFund Funds Funds
Internal
Governmental Activities -
The notes to the financial statements are an integral part of this statement.
Page 4 of 4
43
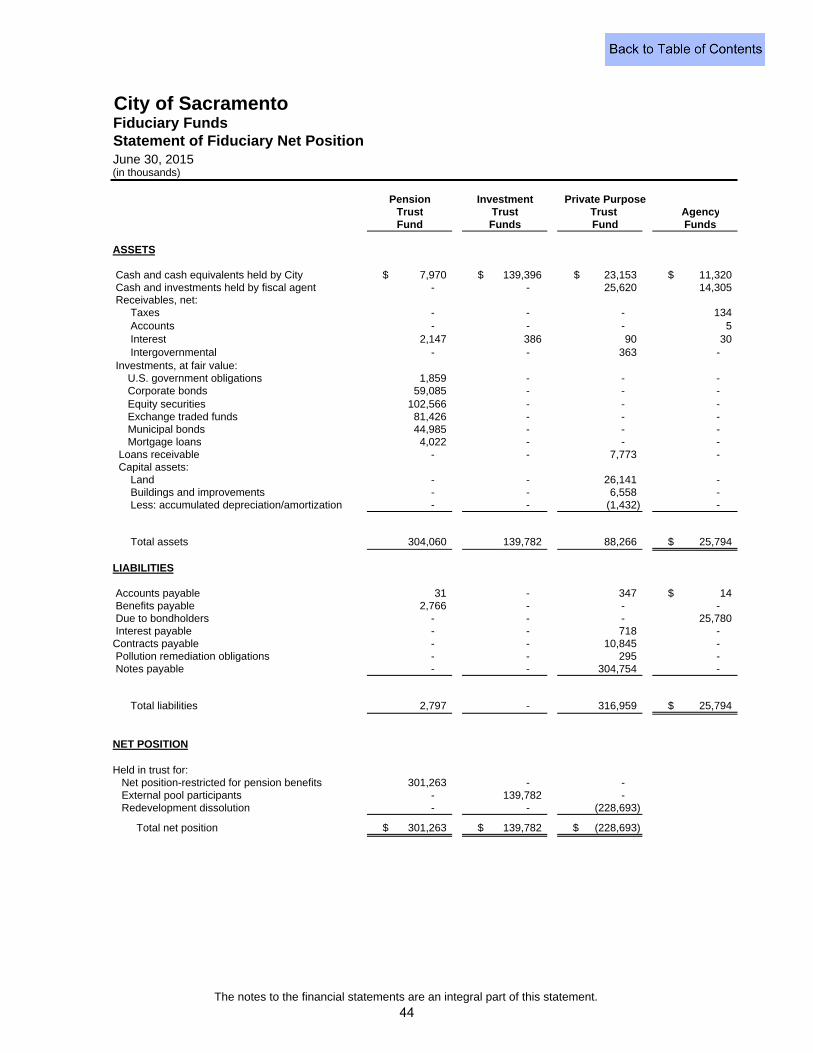
City of SacramentoFiduciary FundsStatement of Fiduciary Net PositionJune 30, 2015(in thousands)
Private PurposeTrust AgencyFund Funds
ASSETS
Cash and cash equivalents held by City 7,970$ 139,396$ 23,153$ 11,320$ Cash and investments held by fiscal agent - - 25,620 14,305 Receivables, net: Taxes - - - 134 Accounts - - - 5 Interest 2,147 386 90 30 Intergovernmental - - 363 - Investments, at fair value:
U.S. government obligations 1,859 - - - Corporate bonds 59,085 - - - Equity securities 102,566 - - - Exchange traded funds 81,426 - - - Municipal bonds 44,985 - - - Mortgage loans 4,022 - - -
Loans receivable - - 7,773 - Capital assets: Land - - 26,141 - Buildings and improvements - - 6,558 - Less: accumulated depreciation/amortization - - (1,432) -
Total assets 304,060 139,782 88,266 25,794$
LIABILITIES
Accounts payable 31 - 347 14$ Benefits payable 2,766 - - - Due to bondholders - - - 25,780 Interest payable - - 718 -Contracts payable - - 10,845 - Pollution remediation obligations - - 295 - Notes payable - - 304,754 -
Total liabilities 2,797 - 316,959 25,794$
NET POSITION
Held in trust for: Net position-restricted for pension benefits 301,263 - - External pool participants - 139,782 - Redevelopment dissolution - - (228,693)
Total net position 301,263$ 139,782$ (228,693)$
PensionTrustFund
InvestmentTrustFunds
The notes to the financial statements are an integral part of this statement.
44
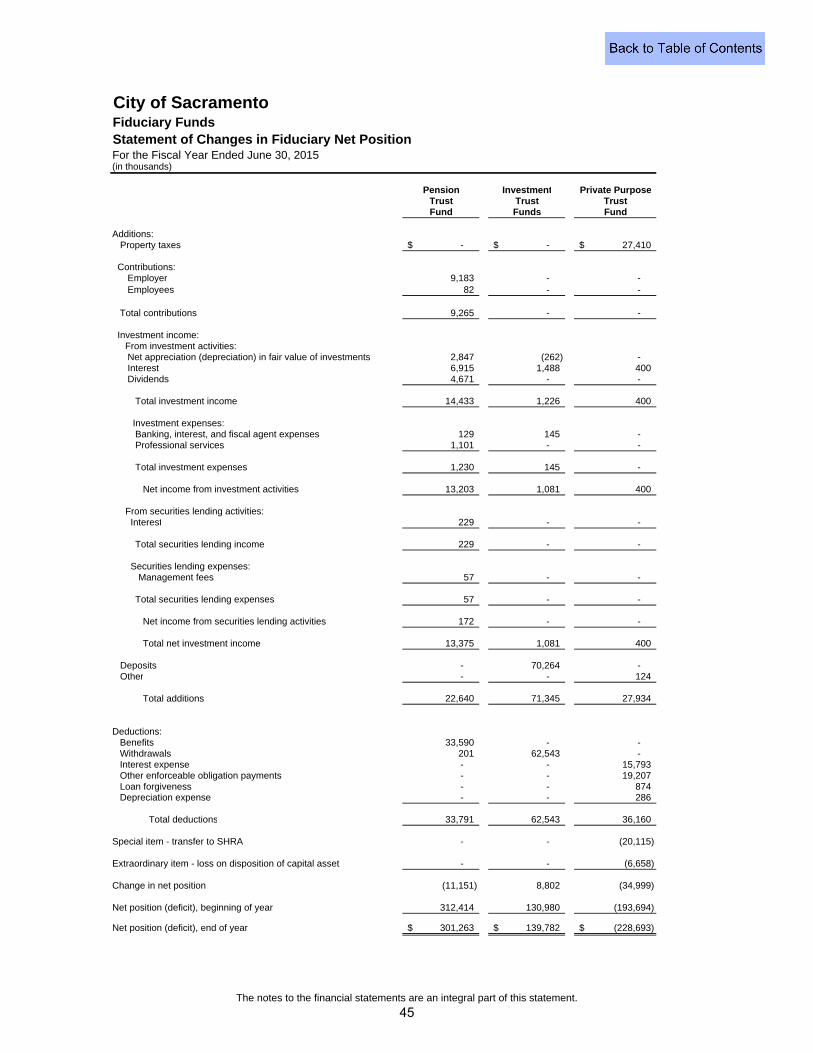
City of SacramentoFiduciary FundsStatement of Changes in Fiduciary Net PositionFor the Fiscal Year Ended June 30, 2015(in thousands)
Pension Investment Private PurposeTrust Trust TrustFund Funds Fund
Additions: Property taxes -$ -$ 27,410$
Contributions:Employer 9,183 - - Employees 82 - -
Total contributions 9,265 - -
Investment income: From investment activities:
Net appreciation (depreciation) in fair value of investments 2,847 (262) - Interest 6,915 1,488 400 Dividends 4,671 - -
Total investment income 14,433 1,226 400
Investment expenses:Banking, interest, and fiscal agent expenses 129 145 - Professional services 1,101 - -
Total investment expenses 1,230 145 -
Net income from investment activities 13,203 1,081 400
From securities lending activities: Interest 229 - -
Total securities lending income 229 - -
Securities lending expenses: Management fees 57 - -
Total securities lending expenses 57 - -
Net income from securities lending activities 172 - -
Total net investment income 13,375 1,081 400
Deposits - 70,264 - Other - - 124
Total additions 22,640 71,345 27,934
Deductions:Benefits 33,590 - - Withdrawals 201 62,543 - Interest expense - - 15,793 Other enforceable obligation payments - - 19,207 Loan forgiveness - - 874 Depreciation expense - - 286
Total deductions 33,791 62,543 36,160
Special item - transfer to SHRA - - (20,115)
Extraordinary item - loss on disposition of capital asset - - (6,658)
Change in net position (11,151) 8,802 (34,999)
Net position (deficit), beginning of year 312,414 130,980 (193,694)
Net position (deficit), end of year 301,263$ 139,782$ (228,693)$
The notes to the financial statements are an integral part of this statement.
45

THIS PAGE INTENTIONALLY LEFT BLANK
46

Notes to the Financial
Statements
City of Sacramento Notes to the Financial Statements For the Fiscal Year Ended June 30, 2015 (dollar amounts expressed in thousands)
NOTE 1 – SUMMARY OF SIGNIFICANT ACCOUNTING POLICIES
DEFINITION OF REPORTING ENTITY
The City of Sacramento (City) was incorporated in 1849 under the laws of the State of California. Sacramento is a charter city and operates under a City Council – City Manager form of government. The City provides a full range of municipal services including police, fire, water, wastewater, storm drainage, solid waste, construction and maintenance of streets, planning and zoning, code enforcement, parks, recreation programs, and cultural activities.
These basic financial statements present the financial status of the City and its component units, which are included in the City’s reporting entity because of the significance of their operational or financial relationships with the City. Component unit financial statements may be obtained from the City’s Department of Finance.
Blended Component Unit
The Sacramento City Financing Authority (SCFA) is a joint exercise of powers entity created by the City and the former Redevelopment Agency of the City of Sacramento to facilitate the financing and refinancing of public capital facilities. Most of the debt by the SCFA is backed by the City’s General Fund. The SCFA is governed by the City Council.
The Sacramento Public Financing Authority (SPFA) is a joint exercise of powers entity created by the City and the Sacramento City Housing Authority to facilitate the financing and refinancing of public capital facilities. The SPFA is governed by the City Council.
Fiduciary-type Component Units
Sacramento City Employees’ Retirement System (SCERS) is a single employer pension plan sponsored and administered by the City for City employees, except public safety employees, hired before January 29, 1977 and public safety employees who retired with SCERS benefits before December 30, 1989. Under provisions of the City Charter, SCERS is managed by the Administration, Investment and Fiscal Management Board (the Board), consisting of the City Manager, City Director of Finance, City Treasurer and two residents of the City appointed by the City Council. Duties of the Board include the adoption of investment standards for SCERS, the establishment of contribution rates, the administration and investment of funds, the selection of investment advisors, the crediting of interest and any action relating to the fiscal management of SCERS. Complete stand-alone financial statements may be obtained by writing the City of Sacramento Department of Finance, 915 I Street, 4th Floor, Sacramento, CA 95814.
The Successor Agency to the Redevelopment Agency of the City of Sacramento (Successor Agency) was created to serve as a custodian for the assets and to wind down the affairs of the former Redevelopment Agency of the City of Sacramento. The City was designated to serve as the Successor Agency subject to control of an Oversight Board. The Oversight Board is comprised of seven member representatives from local government bodies: two appointed by the Mayor, two County of Sacramento (County) representatives, the County Superintendent of Education, the Chancellor of California Community Colleges, and the largest special district taxing entity. Based upon the nature of the Successor Agency’s custodial role, it is reported as a fiduciary fund (private purpose trust fund).
Discretely Presented Component Unit
The Sacramento Regional Arts Facilities Financing Authority (SRAFFA) is reported in a separate column in the government-wide financial statements to emphasize its legal separation from the City. The SRAFFA is a joint powers agency between the City and County created for the purpose of financing the expansion of the theater complex located on H Street. The authority is governed by a board of five directors whose members are three designees of the City Council and two designees of the County Board of Supervisors. The members of the board serve at the pleasure of their respective legislative bodies and may be removed at will. Upon future dissolution, any remaining assets revert to the City and County of Sacramento in such manner as determined by the board. The SRAFFA is presented as a business-type activity in the component unit column of the government-wide statements. The SRAFFA does not issue separate financial statements.
47
City of Sacramento Notes to the Financial Statements For the Fiscal Year Ended June 30, 2015 (dollar amounts expressed in thousands)
NOTE 1 – SUMMARY OF SIGNIFICANT ACCOUNTING POLICIES (Continued)
ACCOUNTING POLICIES
The financial statements of the City have been prepared in conformity with accounting principles generally accepted in the United States of America as applied to governmental agencies. The Governmental Accounting Standards Board (GASB) is the accepted standard-setting body for establishing governmental accounting and financial reporting principles. The more significant accounting policies of the City are described below.
New Pronouncements
GASB Statement No. 68 – In June 2012, the GASB issued Statement No. 68, Accounting and Financial Reporting for Pensions – an amendment of GASB Statement No. 27. The objective of this Statement is to improve accounting and financial reporting by state and local government for pensions. It also improves information provided by state and local governmental employers about financial support for pensions that is provided by other entities. This Statement results from a comprehensive review of the effectiveness of existing standards of accounting and financial reporting for pensions with regard to providing decision-useful information, supporting assessments of accountability and inter-period equity, and creating additional transparency. The Statement is effective for periods beginning after June 15, 2014. As a result of implementing this statement, the City has restated beginning net position for certain City funds, as well as, governmental and business-type activities. See Note 18 for more information.
GASB Statement No. 71 – In November 2013, the GASB issued Statement No. 71, Pension Transition for Contributions Made Subsequent to the Measurement Date – an amendment of GASB 68. The objective of this Statement is to address an issue regarding application of the transition provisions of Statement 68, Accounting and Financial Reporting for Pensions. The issue relates to amounts associated with contributions, if any, made by a state or local government employer or non-employer contributing entity to a defined benefit pension plan after the measurement date of the government’s beginning net pension liability. As a result of implementing this statement, the City has restated beginning net position for certain City funds, as well as, governmental and business-type activities. See Note 18 for more information.
The City is currently analyzing its accounting and financial reporting practices to determine the potential impact on the financial statements of the following GASB Statements:
GASB Statement No. 72 – In February 2015, GASB issued Statement No. 72, Fair Value Measurement and Application. This Statement requires disclosures to be made about fair value measurements, the level of fair value hierarchy, and valuation techniques. These disclosures should be organized by type of asset or liability reported at fair value. It also requires additional disclosures regarding investments in certain entities that calculate net asset value per share (or its equivalent). The requirements of this Statement are effective for financial statements for periods beginning after June 15, 2015. The City has not determined its effect on the financial statements.
GASB Statement No. 73 – In June 2015, GASB issued Statement No. 73, Accounting and Financial Reporting for Pensions and Related Assets That Are Not within the Scope of GASB Statement 68, and Amendments to Certain Provisions of GASB Statements 67 and 68. The provisions in Statement 73 are effective for fiscal years beginning after June 15, 2015 – except those provisions that address employers and governmental nonemployer contributing entities for pensions that are not within the scope of Statement 68, which are effective for fiscal years beginning after June 15, 2016. The City has not determined its effect on the financial statements.
48
City of Sacramento Notes to the Financial Statements For the Fiscal Year Ended June 30, 2015 (dollar amounts expressed in thousands)
NOTE 1 – SUMMARY OF SIGNIFICANT ACCOUNTING POLICIES (Continued)
New Pronouncements (Continued)
GASB Statement No. 74 – In June 2015, GASB issued Statement No. 74, Financial Reporting for Postemployment Benefit Plans Other Than Pension Plans. Statement No. 74 replaces Statements No. 43, Financial Reporting for Postemployment Benefit Plans Other Than Pension Plans, as amended, and No. 57, OPEB Measurements by Agent Employers and Agent Multiple - Employer Plans. It also includes requirements for defined contribution OPEB plans that replace the requirements for those OPEB plans in Statement No. 25, Financial Reporting for Defined Benefit Pension Plans and Note Disclosures for Defined Contribution Plans, as amended, Statement 43, and Statement No. 50, Pension Disclosures. The provisions in Statement 74 are effective for fiscal years beginning after June 15, 2016. The City has not determined its effect on the financial statements.
GASB Statement No. 75 – In June 2015, GASB issued Statement No. 75, Accounting and Financial Reporting for Postemployment Benefits Other Than Pensions. Statement 75 establishes new accounting and financial reporting requirements for governments whose employees are provided with OPEB, as well as for certain nonemployer governments that have a legal obligation to provide financial support for OPEB provided to the employees of other entities. The provisions in Statement 75 are effective for fiscal years beginning after June 15, 2017. The City has not determined its effect on the financial statements.
GASB Statement No. 76 – In June 2015, GASB issues Statement No. 76, The Hierarchy of Generally Accepted Accounting Principles for State and Local Governments. The objective of this Statement is to identify – in the context of the current governmental financial reporting environment – the hierarchy of generally accepted accounting principles (GAAP). This Statement supersedes Statement No. 55, The Hierarchy of Generally Accepted Accounting Principles for State and Local Governments. This statement is not effective until the fiscal year ending June 30, 2016. The City has not determined the effect of this statement.
GASB Statement No. 77 – In August 2015, GASB issued Statement No. 77, Tax Abatement Disclosures. The objective of this Statement is to provide financial statement users with essential information about the nature and magnitude of the reduction in tax revenues through tax abatement programs. This statement is not effective until the fiscal year ending June 30, 2017. The City has not determined the effect of this statement.
Government-wide and Fund Financial Statements
The government-wide financial statements (i.e., the statement of net position and the statement of activities) report information on all of the nonfiduciary activities of the primary government and its component units. Governmental activities, which normally are supported by taxes and intergovernmental revenues, are reported separately from business-type activities, which rely to a significant extent on fees and charges for support. Likewise, the primary government is reported separately from certain legally separate component units for which the City is financially accountable.
The statement of activities demonstrates the degree to which the direct expenses of a given function or segment are offset by program revenues. Direct expenses are those that are clearly identifiable with a specific function or segment. Certain indirect costs are allocated to expenses and capital assets of governmental and business-type activities. Program revenues include 1) charges to customers or applicants who purchase, use, or directly benefit from goods, services, or privileges provided by a given function or segment and 2) grants and contributions that are restricted to meeting the operational or capital requirements of a particular function or segment. Taxes and other items not properly included among program revenues are reported instead as general revenues.
As a general rule the effect of interfund activity has been removed from the government-wide financial statements. Internal service fund activity has been eliminated from the statement of activities. The effect of interfund services provided and used between functions, such as the sale of water from the Water Fund to the General Fund, has not been eliminated in the statement of activities. The City’s payments in lieu of taxes from its enterprise funds to the General Fund are reported as interfund transfers.
49
City of Sacramento Notes to the Financial Statements For the Fiscal Year Ended June 30, 2015 (dollar amounts expressed in thousands)
NOTE 1 – SUMMARY OF SIGNIFICANT ACCOUNTING POLICIES (Continued)
Government-wide and Fund Financial Statements (Continued)
The accounts of the City are organized on the basis of funds. A fund is a separate accounting entity with a self-balancing set of accounts. Each fund was established for the purpose of accounting for specific activities in accordance with applicable regulations, restrictions or limitations. Separate financial statements are provided for governmental funds, proprietary funds, and fiduciary funds, even though fiduciary funds are excluded from the government-wide financial statements. Major individual governmental funds and major individual enterprise funds are reported as separate columns in the fund financial statements.
Measurement Focus, Basis of Accounting, and Financial Statement Presentation
The government-wide financial statements are reported using the economic resources measurement focus and the accrual basis of accounting, as are the proprietary fund and fiduciary trust fund financial statements. Agency funds, included in the fiduciary fund financial statements, are also reported using the accrual basis of accounting, however they are not reported using a measurement focus because only assets and liabilities are presented. Revenues are recorded when earned and expenses are recorded when a liability is incurred, regardless of the timing of related cash flows. Property taxes are recognized as revenues in the year for which they are levied. Grants and similar items are recognized as revenue as soon as all eligibility requirements have been met.
Governmental fund financial statements are reported using the current financial resources measurement focus and the modified accrual basis of accounting. Revenues are recognized as soon as they are both measurable and available. Revenues are considered to be available when they are collectible within the current period or soon enough thereafter to pay liabilities of the current period. For this purpose, the City considers revenues to be available if they are collected within 60 days of the end of the current fiscal period. Expenditures generally are recorded when a liability is incurred, as under accrual accounting. However, debt service expenditures, as well as expenditures related to compensated absences and claims and judgments, are recorded only when payment is due.
Property taxes, sales taxes, utility users taxes, intergovernmental revenue, special assessments, charges for services, and interest associated with the current fiscal period are all considered to be susceptible to accrual and so have been recognized as revenues of the current fiscal period. All other revenue items are considered to be measurable and available only when cash is received by the government.
The City reports the following major governmental funds:
The General Fund is the City’s primary operating fund and accounts for all financial resources of the general government, except those required to be accounted for in another fund.
The Measure U Special Revenue Fund was established to account for the temporary half-cent sales tax approved by voters on November 6, 2012.
The Capital Grants Fund is used to account for capital improvement program projects that are funded by parties outside of the City including the State and Federal governments.
The 1997 Lease Revenue Bond Fund accounts for the loan receivable, debt service activities and related transactions concerning the acquisition and lease back of a sports and entertainment arena.
50
City of Sacramento Notes to the Financial Statements For the Fiscal Year Ended June 30, 2015 (dollar amounts expressed in thousands)
NOTE 1 – SUMMARY OF SIGNIFICANT ACCOUNTING POLICIES (Continued)
Measurement Focus, Basis of Accounting, and Financial Statement Presentation (Continued)
The City reports the following major enterprise funds:
The Water Fund accounts for the operation and maintenance of the City’s water treatment and water transmission and distribution systems.
The Wastewater Fund accounts for the operation and maintenance of the City’s wastewater system.
The Storm Drainage Fund accounts for the operation and maintenance of the City’s surface drainage system.
The Solid Waste Fund accounts for the collection and disposal of refuse throughout the City and for landfill closure.
The Community Center Fund accounts for the operation and maintenance of the City’s Community Center, including the theater and exhibit halls.
Additionally, the City reports the following fund types:
Internal service funds account for the financing of fleet and risk management services to other departments on a cost reimbursement basis.
The Pension Trust Fund accounts for the assets held on behalf of the Sacramento City Employees’ Retirement System (SCERS) for pension benefit payments to qualified employees.
Investment trust funds account for the net position held on behalf of investors, in the City’s investment pool and individual accounts, who are not part of the City’s financial reporting entity.
The Private Purpose Trust Fund accounts for the assets received by the Successor Agency from the City’s former redevelopment agency in order to liquidate its enforceable obligations, pursuant to Assembly Bill X1 26 which dissolved redevelopment agencies in California.
Agency funds account for assets held by the City as an agent for bonded assessment and community facilities districts.
Amounts reported as program revenues include 1) charges to customers or applicants for goods, services, or privileges provided, including fees, fines and forfeitures, 2) operating grants and contributions, and 3) capital grants and contributions, including special assessments. Program revenues also include earnings on investments that are legally restricted for a specific program. Internally dedicated resources are reported as general revenues rather than as program revenue. Likewise, general revenues include all taxes.
Proprietary funds distinguish operating revenues and expenses from nonoperating items. Operating revenues and expenses generally result from providing services and producing and delivering goods in connection with a proprietary fund’s principal ongoing operations. The principal operating revenues of the City’s enterprise funds and internal service funds are charges to customers for sales and services. Operating expenses for enterprise funds and internal service funds include the cost of sales and services, administrative expenses, and depreciation on capital assets. All revenues and expenses not meeting this definition are reported as nonoperating revenues and expenses.
When both restricted and unrestricted net position are available for use, it is the City’s practice to use restricted resources first followed by unrestricted resources as they are needed. When all fund balance types are available, it is the City’s practice to use restricted resources first, followed by committed, assigned and unassigned resources as they are needed.
51
City of Sacramento Notes to the Financial Statements For the Fiscal Year Ended June 30, 2015 (dollar amounts expressed in thousands)
NOTE 1 – SUMMARY OF SIGNIFICANT ACCOUNTING POLICIES (Continued)
Budget Information
The City Manager submits a proposed budget to the City Council no later than 60 days prior to the commencement of the fiscal year. The City Council holds public hearings, modifies the City Manager’s recommendations, and adopts a final budget in June. The budget adoption resolution specifies that budgets will be controlled at the department level (e.g., police, fire, public works, parks and recreation etc.) by fund.
Annual budgets are adopted for the General Fund, Measure U Fund, the City/County Office of Metropolitan Water Planning (CCOMWP) Fund, the Cal EPA Fund, as well as certain activities within the Transportation and Development Fund, the Culture and Leisure Fund, and the Parks and Recreation Fund, and the Special Districts Fund. Annual budgets are also adopted for the enterprise and internal service funds, although they are not legally required. Multi-year project-length budgets are adopted for the General Fund, capital projects funds, and the Operating Grants special revenue fund where appropriations remain authorized for each project until closed, irrespective of fiscal year. Expenditures are appropriated on a modified accrual basis, except that commitments related to purchase orders are treated as expenditures in the year of commitment.
Budgets are modified throughout the year when the tax base changes, fees are modified, new revenue sources are identified, or programs are changed. The City Manager is authorized to administratively amend the budget during the year for transactions up to $100 without City Council approval. All other appropriation adjustments during the year require City Council approval. Significant appropriation adjustments were not required during the year ended June 30, 2015. Unencumbered annual budget appropriations lapse at fiscal year-end. The City honors contracts represented by year-end encumbrances and the appropriations carried over provide authority to complete these transactions in future years. Multi-year project-length budget appropriations are automatically carried over into the next fiscal year.
Financial Statement Elements
Investments - City investments are recorded at fair value, except real estate mortgages, which are recorded at cost. The estimated fair value of all investments is the quoted market price. Certain bond covenants require that interest earned on assessment district construction proceeds, which are reported in other governmental funds, be credited to reserve accounts, which are reported in Agency funds. Interest earned on all other cash and investments is credited to the fund which holds the investment.
Property Taxes - Article XIII of the California Constitution (Proposition 13) limits ad valorem taxes on real property to one percent of value plus taxes necessary to pay indebtedness approved by voters prior to July 1, 1978. The Article also established the 1975/76 assessed valuation as the base and limits annual increases to the cost of living, not to exceed two percent, for each year thereafter. Property may also be reassessed to full market value after a sale, transfer of ownership, or completion of new construction. The State is prohibited under the Article from imposing new ad valorem, sales, or transactions taxes on real property. Local governments may impose special taxes (except on real property) with the approval of two-thirds of the qualified electors.
Property taxes are levied annually by the Sacramento County Assessor on July 1 and become a lien on property on the preceding January 1. Taxes are due November 1 and February 1 and are delinquent if not paid by December 10 and April 10, respectively.
The City participates in an alternative method of distribution of property tax levies and assessments known as the “Teeter Plan”. The State Revenue and Taxation Code allow counties to distribute secured real property, assessment and supplemental property taxes on an accrual basis resulting in full payment to cities each fiscal year. Any subsequent delinquent payments and related penalties and interest during a fiscal year will revert to Sacramento County. The Teeter Plan payment, which includes 95% of the outstanding accumulated delinquency, is included in property tax revenue. Under the Teeter Plan code, 5% of the delinquency must remain with the County as a reserve for Teeter Plan funding.
52
City of Sacramento Notes to the Financial Statements For the Fiscal Year Ended June 30, 2015 (dollar amounts expressed in thousands)
NOTE 1 – SUMMARY OF SIGNIFICANT ACCOUNTING POLICIES (Continued)
Financial Statement Elements (Continued)
Receivables and Payables – Property taxes, sales taxes, and utility user taxes, and other taxes, related to the current fiscal year are accrued as revenue and accounts receivable and considered available if received within 60 days of year end.
Federal and State grants are considered receivable and accrued as revenue when all eligibility requirements have been met under the accrual basis of accounting in the government-wide statement of net position. The amount recognized as revenue under the modified accrual basis of accounting is limited to the amount that is deemed measurable and available as described above.
Long-term loans receivable reported in the governmental fund statements are recorded with offsetting unavailable revenue or nonspendable fund balance for noncurrent assets because the resources cannot be spent. Long-term loans receivable reported in the proprietary fund statements, as well as long-term loans reported in the government-wide statements, are not offset by unavailable revenue. Unbilled utility revenue earned is recognized as revenue and accounts receivable in the enterprise funds.
Activity between funds that is representative of lending/borrowing arrangements outstanding at the end of the fiscal year is referred to as either “due to/from other funds” (i.e., the current portion of interfund loans) or “advances to/from other funds” (i.e., the non-current portion of interfund loans). All other outstanding balances between funds are reported as “due to/from other funds.” Any residual balances outstanding between the governmental activities and business-type activities are reported in the government-wide financial statements as “internal balances.”
Inventories and Prepaid Items - Inventories in the proprietary funds are stated at the lower of average cost or market and consist of expendable materials and supplies.
Certain payments to vendors reflect costs applicable to future accounting periods and are recorded as prepaid items in both government-wide and fund financial statements.
Restricted Assets - Certain proceeds of debt issues, as well as certain resources set aside for their repayment, are classified as restricted assets on the statements of net position and balance sheets because their use is limited by applicable bond covenants. Unspent developer impact fees are classified as restricted assets on the statements of net position for the Water and Wastewater enterprise funds.
Capital Assets - Capital assets are reported in the applicable governmental or business-type activities column in the government-wide financial statements. Capital assets are recorded at the lower of actual historical cost or fair value (as of the date donated for contributed assets) although for certain older assets estimated historical costs are used.
Capital assets are depreciated using the straight-line method over the following estimated useful lives:
Building and improvements Primarily 15 to 70 yearsTransmission and distribution systems Primarily 15 to 100 yearsMachinery, vehicles and equipment Primarily 5 to 30 yearsSoftware Primarily 5 to 20 yearsRoadway network Primarily 20 to 70 yearsStreet light network Primarily 40 to 50 yearsParks and park improvements Primarily 15 to 30 years
53
City of Sacramento Notes to the Financial Statements For the Fiscal Year Ended June 30, 2015 (dollar amounts expressed in thousands)
NOTE 1 – SUMMARY OF SIGNIFICANT ACCOUNTING POLICIES (Continued)
Financial Statement Elements (Continued)
It is the policy of the City to capitalize all land, buildings and improvements, equipment, and infrastructure assets, except assets costing less than $20, unless a federal funding source is utilized. The City also capitalizes all intangible capital assets, primarily easements and software, except assets costing less than $100, unless a federal funding source is utilized. All capital assets in excess of $5 financed by a federal funding source are capitalized. Costs of capital assets sold or retired (and related amounts of accumulated depreciation/amortization) are eliminated from the accounts in the year of sale or retirement and the resulting gain or loss is included in the operating statement of the related proprietary fund, governmental activities, and business-type activities. In governmental funds, the sale of general capital assets is included in the statement of revenues, expenditures and changes in fund balances as proceeds from sale.
Major outlays for capital assets are capitalized as projects are constructed. Interest incurred during the construction phase of capital assets of business-type activities is included as part of the capitalized value of the assets constructed. When the asset constructed in business-type activites is financed by a specific bond issue, the interest included is net of interest earned on the invested bond proceeds over the same period. The total interest cost incurred by the City during the current fiscal year was $56,495. Of this amount, $10,125, consisting of interest cost of $11,399 net of interest earned of $1,274, was included as part of the cost of capital assets under construction.
The Crocker Art Museum’s collection of works of art, held in trust by the City, has not been reported in these financial statements. The City has elected not to report the collection because it meets the three criteria for waiving capitalization: the collection is held for reasons other than financial gain; the collection is protected, kept unencumbered, cared for, and preserved; and the collection is subject to an organizational policy requiring that the proceeds from sales of collection items be used to acquire other items for the collection.
Deferred Outflows/Inflows of Resources - In addition to assets, the statement of net position reports a separate section for deferred outflows of resources. This separate financial statement element represents a consumption of net position that applies to a future period(s) and so will not be recognized as an expense/expenditure until then. The City has three items, loss on refunding of debt, accumulated decrease in fair-value of hedging derivative instrument and deferred outflows related to pensions, which qualifies for reporting in this category.
In addition to liabilities, the statement of net position reports a separate section for deferred inflows of resources. This separate financial statement element represents an acquisition of net position and fund balance that applies to a future period(s) and so will not be recognized as revenue until then. The City has two items recognized in the statement of net position, deferred service concession arrangement revenue and deferred inflows related to pensions. In addition, there is one item recognized in the governmental funds, unavailable revenue, which qualifies for reporting in this category.
Compensated Absences - Benefit qualified employees accrue vacation, sick, and holiday benefits. A full time employee may accumulate up to sixty days of vacation. Sick leave vests and may be accumulated until retirement. An employee with sixty or more days of accumulated sick leave at the end of a calendar year may elect to receive a 25% payment of any unused sick leave earned in the previous calendar year. The amount of sick leave paid is deducted from the employee’s total accumulation. Upon retirement, employees with a minimum of 20 years of City service, excluding SCERS employees, have the option of converting their sick leave accumulation into CalPERS service credit hours, or receiving a cash payment of one-third of the accumulated sick leave. The City accrues expected cash payments of accumulated sick leave at fiscal year end. Employees who leave the City and are not retiring forfeit any remaining sick leave.
54
City of Sacramento Notes to the Financial Statements For the Fiscal Year Ended June 30, 2015 (dollar amounts expressed in thousands)
NOTE 1 – SUMMARY OF SIGNIFICANT ACCOUNTING POLICIES (Continued)
Financial Statement Elements (Continued)
Employees receive 14 holidays per calendar year. Employees accrue all or a portion of these 14 days during the year depending on their job classification. Classifications that accrue all 14 days get paid in cash throughout the year whenever their holiday leave balances exceed the 14 day total. All other employees accrue one or two days of “floating” holiday time, depending on the bargaining unit, throughout the year in conjunction with their remaining twelve holidays. Employees who accrue “floating” holiday time get paid annually in January for any calendar year-end balance greater than eight hours.
All hourly employees have the option of being compensated for their overtime pay with compensatory time off (CTO). Depending on the employee’s CTO plan, the employee may accrue a maximum of 80, 120 or 160 hours of CTO. The employee’s applicable labor agreement or the City Council’s resolution for unrepresented employees determines the maximum accruable number of CTO hours.
All compensated absences are accrued when earned in the government-wide and proprietary fund financial statements. A liability for these amounts is reported in governmental funds only if they have matured, for example, as a result of employee resignations and retirements.
Unavailable Revenue / Unearned Revenue - Unavailable revenue in governmental funds arise when potential revenue does not meet the “available” criteria for recognition in the current period. Unearned revenue in accrual based statements arises when resources are received by the City before it has a legal claim to them (i.e., when grant monies are received prior to the incurrence of qualifying expenditures).
Long-term Obligations - In the government-wide and proprietary fund financial statements, long-term debt and other long-term obligations are reported as liabilities in the applicable statement of net position. Bond premiums and discounts are deferred and amortized over the life of the bonds using the effective interest method. Gains and losses on debt refunding are deferred and amortized over the shorter of the remaining life of the old debt or the life of the new debt using the straight-line method. Bonds payable are reported net of bond premium or discount and net of gains and losses on debt refunding. Bond issuance costs are reported as expenditures when incurred.
In the fund financial statements, governmental fund types recognize bond premiums and discounts, as well as bond issuance costs, during the current period. The face amount of debt issued is reported as other financing sources. Premiums received on debt issuances are reported as other financing sources while discounts on debt issuances are reported as other financing uses. Issuance costs, whether or not withheld from the actual debt proceeds received, are reported as debt service expenditures.
Fund Balance - In the fund financial statements, governmental funds report fund classifications that comprise a hierarchy based primarily on the extent to which the City is bound to honor constraints on the specific purposes for which amounts in those funds can be spent. Nonspendable fund balances include amounts that cannot be spent because they are either (a) not in spendable form or (b) legally or contractually required to be maintained intact. Amounts that are restricted to specific purposes, either by a) constraints placed on the use of resources by creditors, grantors, contributors, or laws or regulations of other governments or b) imposed by law through constitutional provisions or enabling legislation, are classified as restricted fund balances. Amounts that can only be used for specific purposes pursuant to constraints imposed by the City Council through a resolution, which is the highest form of decision authority, are classified as committed fund balances. Amounts that are constrained by the City Council’s intent to be used for specific purposes through a resolution, but are neither restricted nor committed, are classified as assigned fund balances. Negative fund balance in governmental funds, after determining the fund balance classifications described above, is reported as unassigned fund balance.
55
City of Sacramento Notes to the Financial Statements For the Fiscal Year Ended June 30, 2015 (dollar amounts expressed in thousands)
NOTE 1 – SUMMARY OF SIGNIFICANT ACCOUNTING POLICIES (Continued)
Financial Statement Elements (Continued)
The City’s Economic Uncertainty Reserve (Reserve) is a stabilization arrangement in the General Fund reported as committed fund balance. The City Council reaffirmed its policy goal for the Reserve in its resolution number 2015-0169 adopted with the fiscal year 2015/16 annual budget. The adopted Reserve goal is to achieve a reserve equal to 10% of annual General Fund revenue. The City Manager may recommend a release from the Reserve when the gap between projected revenue and expenditures is greater than $1,000 in the proposed budget. Additions and releases from the Reserve must be approved by City Council by resolution.
Statement of Cash Flows - For purposes of the statement of cash flows, cash equivalents are defined as investments with original maturities of 90 days or less, which are readily convertible to known amounts of cash. The City considers all pooled cash and investments (consisting of cash and investments and restricted cash and investments) held by the City as cash and cash equivalents because the pool is used essentially as a demand deposit account from the standpoint of the funds. The City also considers all non-pooled cash and investments (consisting of cash with fiscal agent and restricted cash and investments held by fiscal agent) as cash and cash equivalents because investments meet the criteria for cash equivalents defined above.
Use of Estimates - The preparation of financial statements in conformity with accounting principles generally accepted in the United States of America requires management to make estimates and assumptions that affect certain reported amounts and disclosures. Actual results could differ from those estimates.
Pensions - For purposes of measuring the net pension liability and deferred outflows/inflows of resources related to pensions, and pension expense, information about the fiduciary net position of the City’s California Public Employees Retirement System (CalPERS) and Sacramento Employee’s Retirement System (SCERS) Plans and additions to/deductions from the Plan’s fiduciary net position have been determined on the same basis as they are reported by CalPERS and SCERS, respectively. For this purpose, benefit payments (including refunds of employee contributions) are recognized when due and payable in accordance with the benefit terms. Investments are reported at fair value.
56
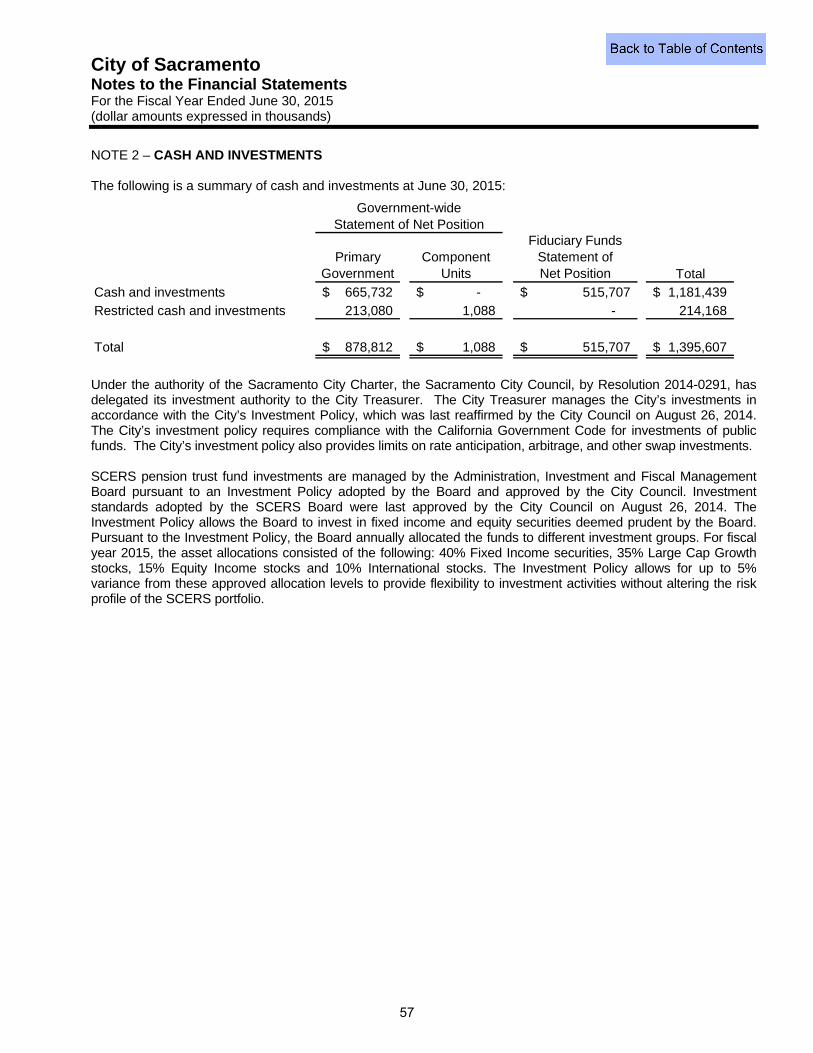
City of Sacramento Notes to the Financial Statements For the Fiscal Year Ended June 30, 2015 (dollar amounts expressed in thousands)
NOTE 2 – CASH AND INVESTMENTS
The following is a summary of cash and investments at June 30, 2015:
PrimaryGovernment
ComponentUnits
Fiduciary FundsStatement ofNet Position Total
Cash and investments 665,732$ -$ 515,707$ 1,181,439$ Restricted cash and investments 213,080 1,088 - 214,168
Total 878,812$ 1,088$ 515,707$ 1,395,607$
Government-wideStatement of Net Position
Under the authority of the Sacramento City Charter, the Sacramento City Council, by Resolution 2014-0291, has delegated its investment authority to the City Treasurer. The City Treasurer manages the City’s investments in accordance with the City’s Investment Policy, which was last reaffirmed by the City Council on August 26, 2014. The City’s investment policy requires compliance with the California Government Code for investments of public funds. The City’s investment policy also provides limits on rate anticipation, arbitrage, and other swap investments.
SCERS pension trust fund investments are managed by the Administration, Investment and Fiscal Management Board pursuant to an Investment Policy adopted by the Board and approved by the City Council. Investment standards adopted by the SCERS Board were last approved by the City Council on August 26, 2014. The Investment Policy allows the Board to invest in fixed income and equity securities deemed prudent by the Board. Pursuant to the Investment Policy, the Board annually allocated the funds to different investment groups. For fiscal year 2015, the asset allocations consisted of the following: 40% Fixed Income securities, 35% Large Cap Growth stocks, 15% Equity Income stocks and 10% International stocks. The Investment Policy allows for up to 5% variance from these approved allocation levels to provide flexibility to investment activities without altering the risk profile of the SCERS portfolio.
57
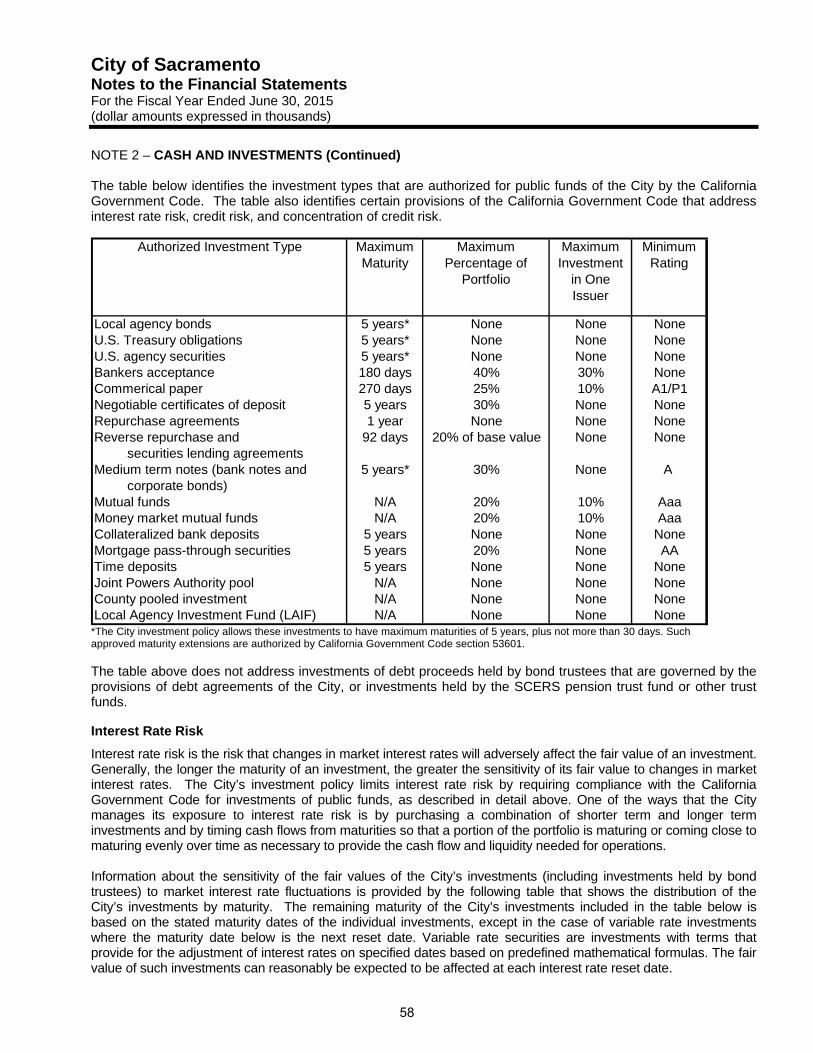
City of Sacramento Notes to the Financial Statements For the Fiscal Year Ended June 30, 2015 (dollar amounts expressed in thousands)
NOTE 2 – CASH AND INVESTMENTS (Continued)
The table below identifies the investment types that are authorized for public funds of the City by the California Government Code. The table also identifies certain provisions of the California Government Code that address interest rate risk, credit risk, and concentration of credit risk.
Authorized Investment Type MaximumMaturity
MaximumPercentage of
Portfolio
MaximumInvestment
in OneIssuer
MinimumRating
Local agency bonds 5 years* None None NoneU.S. Treasury obligations 5 years* None None NoneU.S. agency securities 5 years* None None NoneBankers acceptance 180 days 40% 30% NoneCommerical paper 270 days 25% 10% A1/P1Negotiable certificates of deposit 5 years 30% None NoneRepurchase agreements 1 year None None NoneReverse repurchase and 92 days 20% of base value None None securities lending agreementsMedium term notes (bank notes and 5 years* 30% None A corporate bonds)Mutual funds N/A 20% 10% AaaMoney market mutual funds N/A 20% 10% AaaCollateralized bank deposits 5 years None None NoneMortgage pass-through securities 5 years 20% None AATime deposits 5 years None None NoneJoint Powers Authority pool N/A None None NoneCounty pooled investment N/A None None NoneLocal Agency Investment Fund (LAIF) N/A None None None
*The City investment policy allows these investments to have maximum maturities of 5 years, plus not more than 30 days. Suchapproved maturity extensions are authorized by California Government Code section 53601.
The table above does not address investments of debt proceeds held by bond trustees that are governed by the provisions of debt agreements of the City, or investments held by the SCERS pension trust fund or other trust funds.
Interest Rate Risk
Interest rate risk is the risk that changes in market interest rates will adversely affect the fair value of an investment. Generally, the longer the maturity of an investment, the greater the sensitivity of its fair value to changes in market interest rates. The City’s investment policy limits interest rate risk by requiring compliance with the California Government Code for investments of public funds, as described in detail above. One of the ways that the City manages its exposure to interest rate risk is by purchasing a combination of shorter term and longer term investments and by timing cash flows from maturities so that a portion of the portfolio is maturing or coming close to maturing evenly over time as necessary to provide the cash flow and liquidity needed for operations.
Information about the sensitivity of the fair values of the City’s investments (including investments held by bond trustees) to market interest rate fluctuations is provided by the following table that shows the distribution of the City’s investments by maturity. The remaining maturity of the City’s investments included in the table below is based on the stated maturity dates of the individual investments, except in the case of variable rate investments where the maturity date below is the next reset date. Variable rate securities are investments with terms that provide for the adjustment of interest rates on specified dates based on predefined mathematical formulas. The fair value of such investments can reasonably be expected to be affected at each interest rate reset date.
58
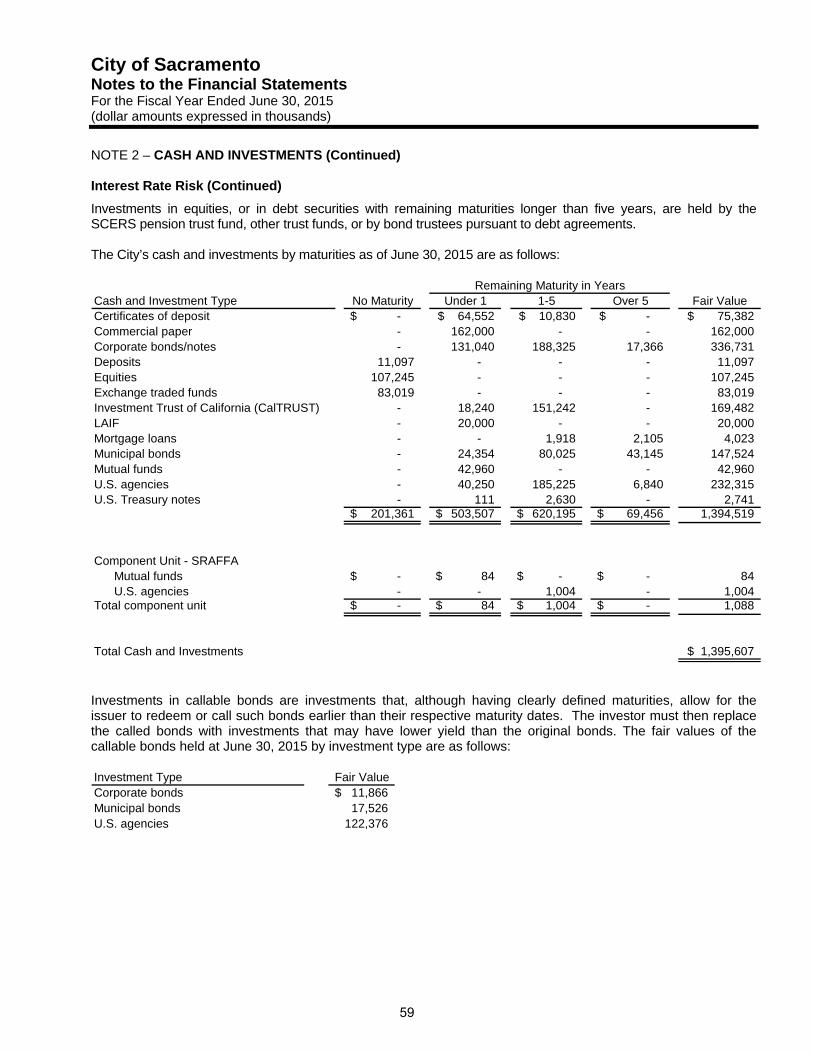
City of Sacramento Notes to the Financial Statements For the Fiscal Year Ended June 30, 2015 (dollar amounts expressed in thousands)
NOTE 2 – CASH AND INVESTMENTS (Continued)
Interest Rate Risk (Continued)
Investments in equities, or in debt securities with remaining maturities longer than five years, are held by the SCERS pension trust fund, other trust funds, or by bond trustees pursuant to debt agreements.
The City’s cash and investments by maturities as of June 30, 2015 are as follows:
Cash and Investment Type No Maturity Under 1 1-5 Over 5 Fair ValueCertificates of deposit -$ 64,552$ 10,830$ -$ 75,382$ Commercial paper - 162,000 - - 162,000 Corporate bonds/notes - 131,040 188,325 17,366 336,731 Deposits 11,097 - - - 11,097 Equities 107,245 - - - 107,245 Exchange traded funds 83,019 - - - 83,019 Investment Trust of California (CalTRUST) - 18,240 151,242 - 169,482 LAIF - 20,000 - - 20,000 Mortgage loans - - 1,918 2,105 4,023 Municipal bonds - 24,354 80,025 43,145 147,524 Mutual funds - 42,960 - - 42,960 U.S. agencies - 40,250 185,225 6,840 232,315 U.S. Treasury notes - 111 2,630 - 2,741
201,361$ 503,507$ 620,195$ 69,456$ 1,394,519
Component Unit - SRAFFA Mutual funds -$ 84$ -$ -$ 84
U.S. agencies - - 1,004 - 1,004 Total component unit -$ 84$ 1,004$ -$ 1,088
Total Cash and Investments 1,395,607$
Remaining Maturity in Years
Investments in callable bonds are investments that, although having clearly defined maturities, allow for the issuer to redeem or call such bonds earlier than their respective maturity dates. The investor must then replace the called bonds with investments that may have lower yield than the original bonds. The fair values of the callable bonds held at June 30, 2015 by investment type are as follows:
Investment Type Fair ValueCorporate bonds 11,866$ Municipal bonds 17,526 U.S. agencies 122,376
59
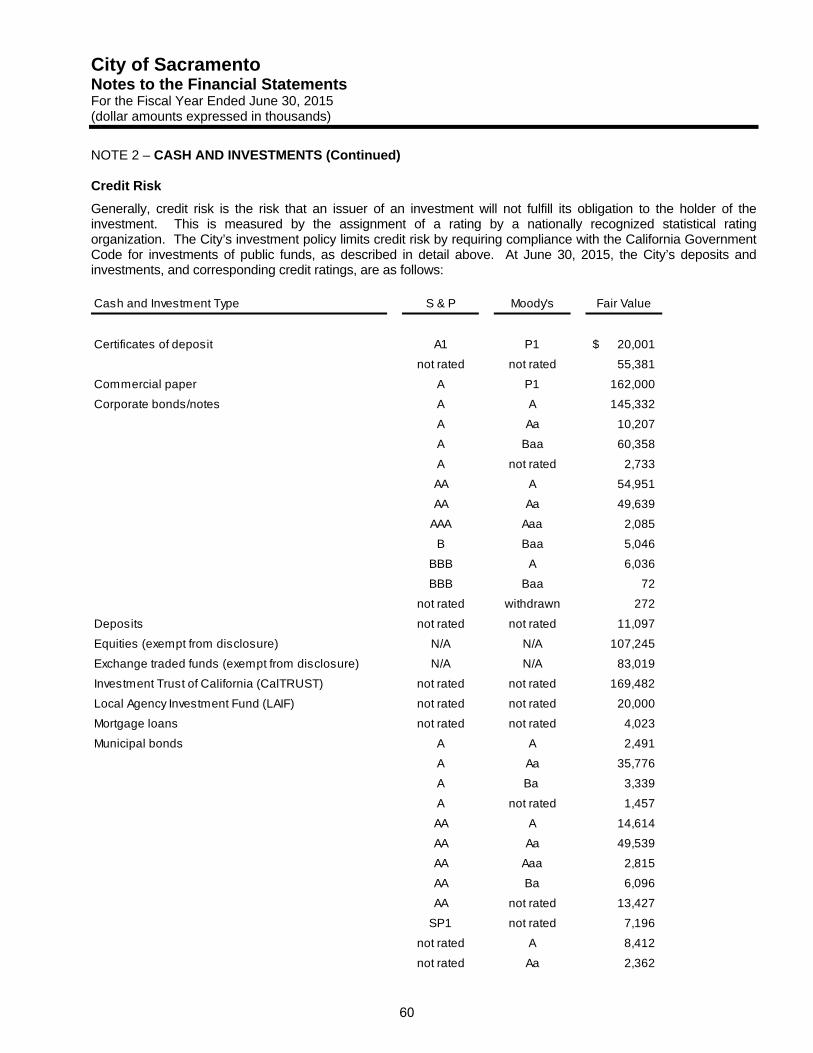
City of Sacramento Notes to the Financial Statements For the Fiscal Year Ended June 30, 2015 (dollar amounts expressed in thousands)
NOTE 2 – CASH AND INVESTMENTS (Continued)
Credit Risk
Generally, credit risk is the risk that an issuer of an investment will not fulfill its obligation to the holder of the investment. This is measured by the assignment of a rating by a nationally recognized statistical rating organization. The City’s investment policy limits credit risk by requiring compliance with the California Government Code for investments of public funds, as described in detail above. At June 30, 2015, the City’s deposits and investments, and corresponding credit ratings, are as follows:
Cash and Investment Type S & P Moody's Fair Value
Certificates of deposit A1 P1 20,001$
not rated not rated 55,381
Commercial paper A P1 162,000
Corporate bonds/notes A A 145,332
A Aa 10,207
A Baa 60,358
A not rated 2,733
AA A 54,951
AA Aa 49,639
AAA Aaa 2,085
B Baa 5,046
BBB A 6,036
BBB Baa 72
not rated withdrawn 272
Deposits not rated not rated 11,097
Equities (exempt from disclosure) N/A N/A 107,245
Exchange traded funds (exempt from disclosure) N/A N/A 83,019
Investment Trust of California (CalTRUST) not rated not rated 169,482
Local Agency Investment Fund (LAIF) not rated not rated 20,000
Mortgage loans not rated not rated 4,023
Municipal bonds A A 2,491
A Aa 35,776
A Ba 3,339
A not rated 1,457
AA A 14,614
AA Aa 49,539
AA Aaa 2,815
AA Ba 6,096
AA not rated 13,427
SP1 not rated 7,196
not rated A 8,412
not rated Aa 2,362
60
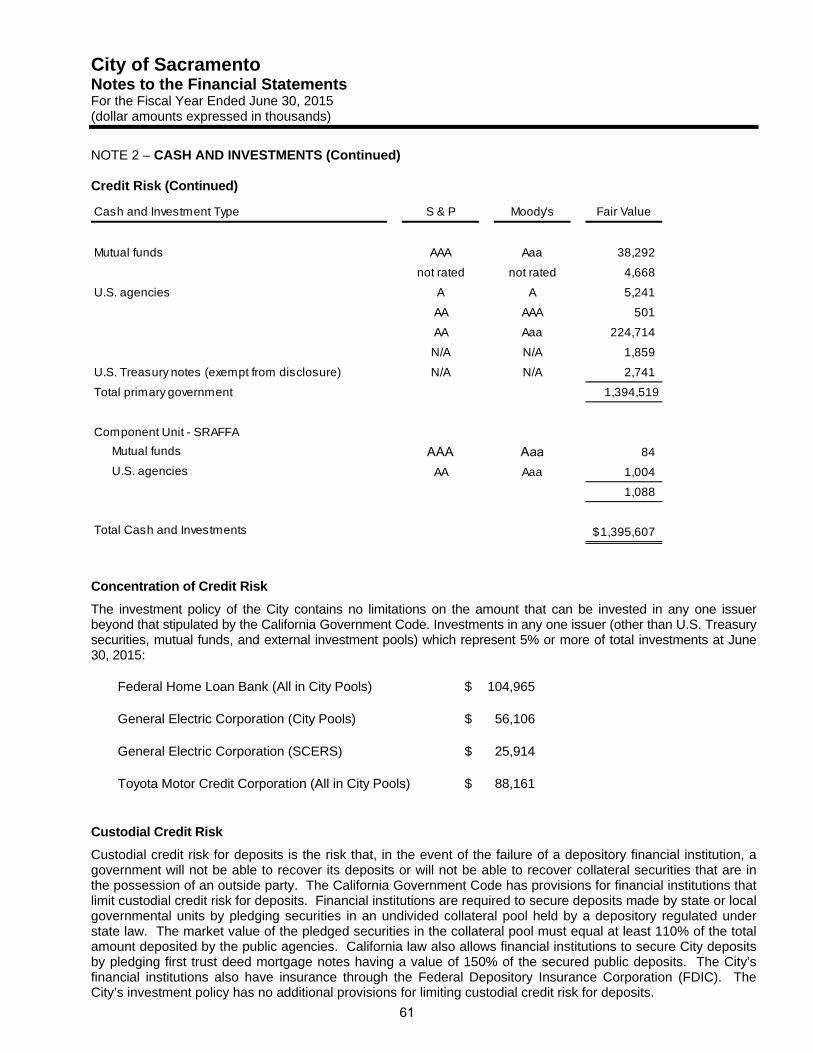
City of Sacramento Notes to the Financial Statements For the Fiscal Year Ended June 30, 2015 (dollar amounts expressed in thousands)
NOTE 2 – CASH AND INVESTMENTS (Continued)
Credit Risk (Continued)
Concentration of Credit Risk
The investment policy of the City contains no limitations on the amount that can be invested in any one issuer beyond that stipulated by the California Government Code. Investments in any one issuer (other than U.S. Treasury securities, mutual funds, and external investment pools) which represent 5% or more of total investments at June 30, 2015:
Federal Home Loan Bank (All in City Pools) 104,965$
General Electric Corporation (City Pools) 56,106$
General Electric Corporation (SCERS) 25,914$
Toyota Motor Credit Corporation (All in City Pools) 88,161$
Custodial Credit Risk
Custodial credit risk for deposits is the risk that, in the event of the failure of a depository financial institution, a government will not be able to recover its deposits or will not be able to recover collateral securities that are in the possession of an outside party. The California Government Code has provisions for financial institutions that limit custodial credit risk for deposits. Financial institutions are required to secure deposits made by state or local governmental units by pledging securities in an undivided collateral pool held by a depository regulated under state law. The market value of the pledged securities in the collateral pool must equal at least 110% of the total amount deposited by the public agencies. California law also allows financial institutions to secure City deposits by pledging first trust deed mortgage notes having a value of 150% of the secured public deposits. The City’s financial institutions also have insurance through the Federal Depository Insurance Corporation (FDIC). The City’s investment policy has no additional provisions for limiting custodial credit risk for deposits.
Cash and Investment Type S & P Moody's Fair Value
Mutual funds AAA Aaa 38,292
not rated not rated 4,668
U.S. agencies A A 5,241
AA AAA 501
AA Aaa 224,714
N/A N/A 1,859
U.S. Treasury notes (exempt from disclosure) N/A N/A 2,741
Total primary government 1,394,519
Component Unit - SRAFFA
Mutual funds AAA Aaa 84
U.S. agencies AA Aaa 1,004
1,088
Total Cash and Investments 1,395,607$
61
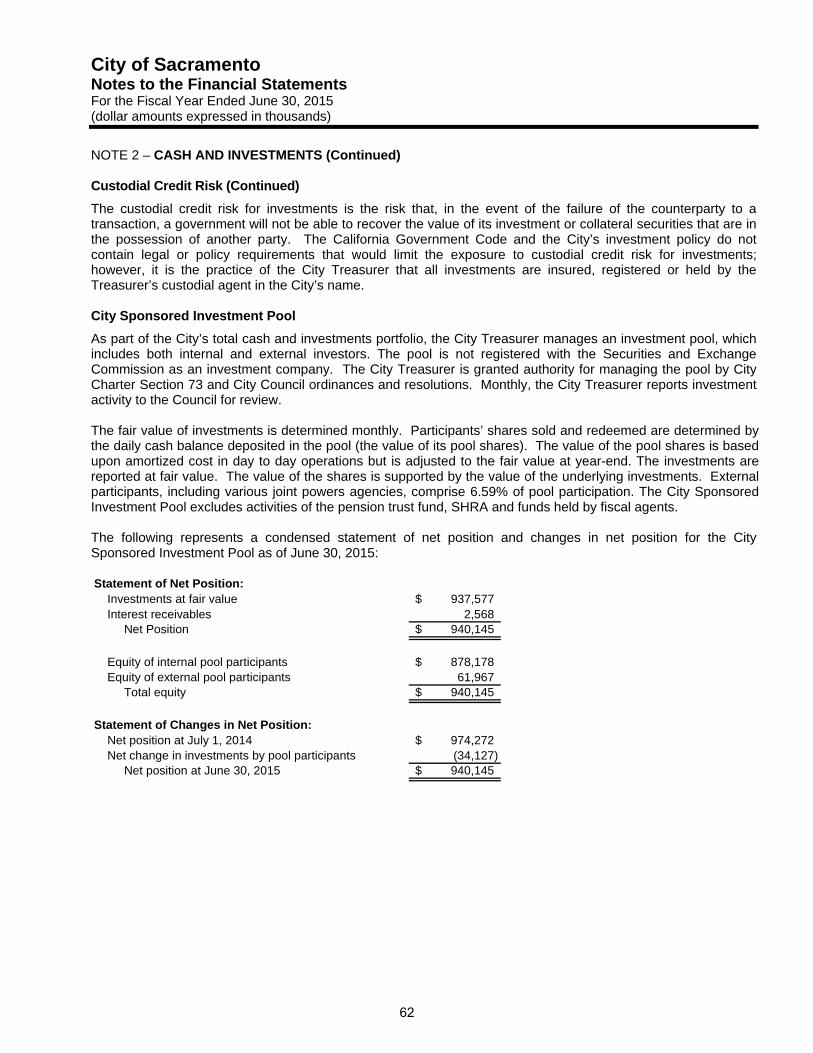
City of Sacramento Notes to the Financial Statements For the Fiscal Year Ended June 30, 2015 (dollar amounts expressed in thousands)
NOTE 2 – CASH AND INVESTMENTS (Continued)
Custodial Credit Risk (Continued)
The custodial credit risk for investments is the risk that, in the event of the failure of the counterparty to a transaction, a government will not be able to recover the value of its investment or collateral securities that are in the possession of another party. The California Government Code and the City’s investment policy do not contain legal or policy requirements that would limit the exposure to custodial credit risk for investments; however, it is the practice of the City Treasurer that all investments are insured, registered or held by the Treasurer’s custodial agent in the City’s name.
City Sponsored Investment Pool
As part of the City’s total cash and investments portfolio, the City Treasurer manages an investment pool, which includes both internal and external investors. The pool is not registered with the Securities and Exchange Commission as an investment company. The City Treasurer is granted authority for managing the pool by City Charter Section 73 and City Council ordinances and resolutions. Monthly, the City Treasurer reports investment activity to the Council for review.
The fair value of investments is determined monthly. Participants’ shares sold and redeemed are determined by the daily cash balance deposited in the pool (the value of its pool shares). The value of the pool shares is based upon amortized cost in day to day operations but is adjusted to the fair value at year-end. The investments are reported at fair value. The value of the shares is supported by the value of the underlying investments. External participants, including various joint powers agencies, comprise 6.59% of pool participation. The City Sponsored Investment Pool excludes activities of the pension trust fund, SHRA and funds held by fiscal agents.
The following represents a condensed statement of net position and changes in net position for the City Sponsored Investment Pool as of June 30, 2015:
Statement of Net Position: Investments at fair value 937,577$ Interest receivables 2,568
Net Position 940,145$
Equity of internal pool participants 878,178$ Equity of external pool participants 61,967
Total equity 940,145$
Statement of Changes in Net Position: Net position at July 1, 2014 974,272$ Net change in investments by pool participants (34,127)
Net position at June 30, 2015 940,145$
62
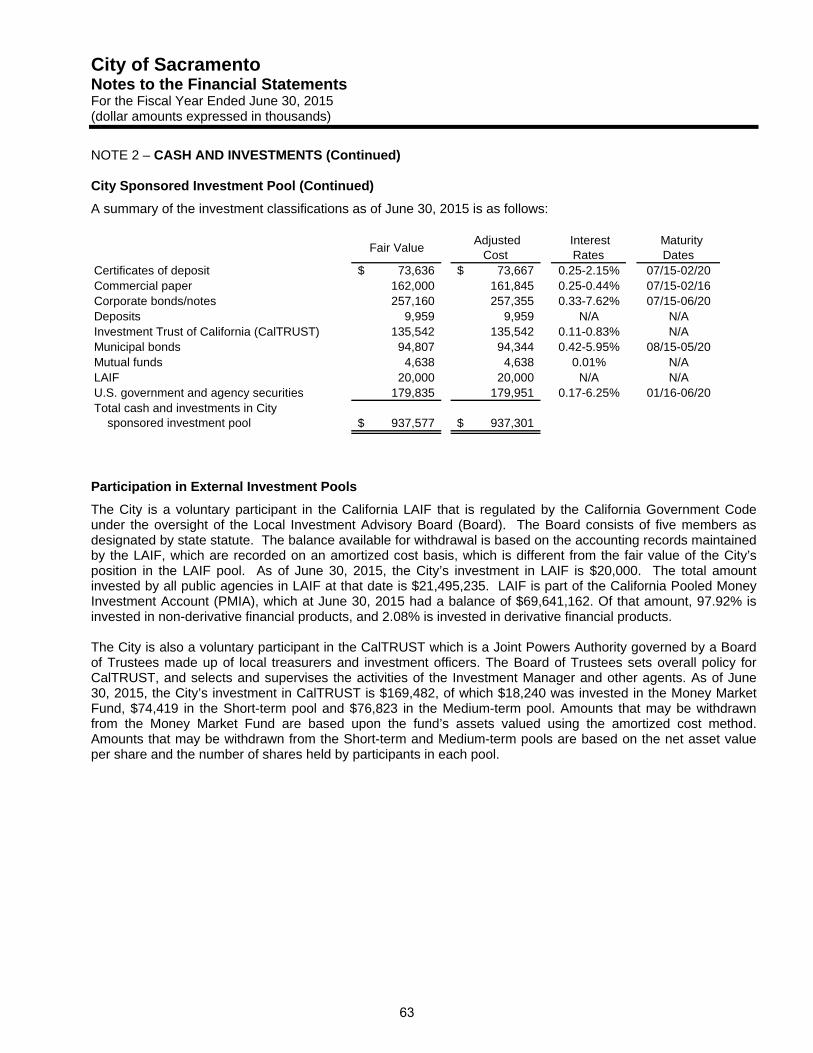
City of Sacramento Notes to the Financial Statements For the Fiscal Year Ended June 30, 2015 (dollar amounts expressed in thousands)
NOTE 2 – CASH AND INVESTMENTS (Continued)
City Sponsored Investment Pool (Continued)
A summary of the investment classifications as of June 30, 2015 is as follows:
Fair Value Adjusted
Cost Interest Rates
Maturity Dates
Certificates of deposit 73,636$ 73,667$ 0.25-2.15% 07/15-02/20Commercial paper 162,000 161,845 0.25-0.44% 07/15-02/16Corporate bonds/notes 257,160 257,355 0.33-7.62% 07/15-06/20Deposits 9,959 9,959 N/A N/AInvestment Trust of California (CalTRUST) 135,542 135,542 0.11-0.83% N/AMunicipal bonds 94,807 94,344 0.42-5.95% 08/15-05/20Mutual funds 4,638 4,638 0.01% N/ALAIF 20,000 20,000 N/A N/AU.S. government and agency securities 179,835 179,951 0.17-6.25% 01/16-06/20Total cash and investments in City sponsored investment pool 937,577$ 937,301$
Participation in External Investment Pools
The City is a voluntary participant in the California LAIF that is regulated by the California Government Code under the oversight of the Local Investment Advisory Board (Board). The Board consists of five members as designated by state statute. The balance available for withdrawal is based on the accounting records maintained by the LAIF, which are recorded on an amortized cost basis, which is different from the fair value of the City’s position in the LAIF pool. As of June 30, 2015, the City’s investment in LAIF is $20,000. The total amount invested by all public agencies in LAIF at that date is $21,495,235. LAIF is part of the California Pooled Money Investment Account (PMIA), which at June 30, 2015 had a balance of $69,641,162. Of that amount, 97.92% is invested in non-derivative financial products, and 2.08% is invested in derivative financial products.
The City is also a voluntary participant in the CalTRUST which is a Joint Powers Authority governed by a Board of Trustees made up of local treasurers and investment officers. The Board of Trustees sets overall policy for CalTRUST, and selects and supervises the activities of the Investment Manager and other agents. As of June 30, 2015, the City’s investment in CalTRUST is $169,482, of which $18,240 was invested in the Money Market Fund, $74,419 in the Short-term pool and $76,823 in the Medium-term pool. Amounts that may be withdrawn from the Money Market Fund are based upon the fund’s assets valued using the amortized cost method. Amounts that may be withdrawn from the Short-term and Medium-term pools are based on the net asset value per share and the number of shares held by participants in each pool.
63
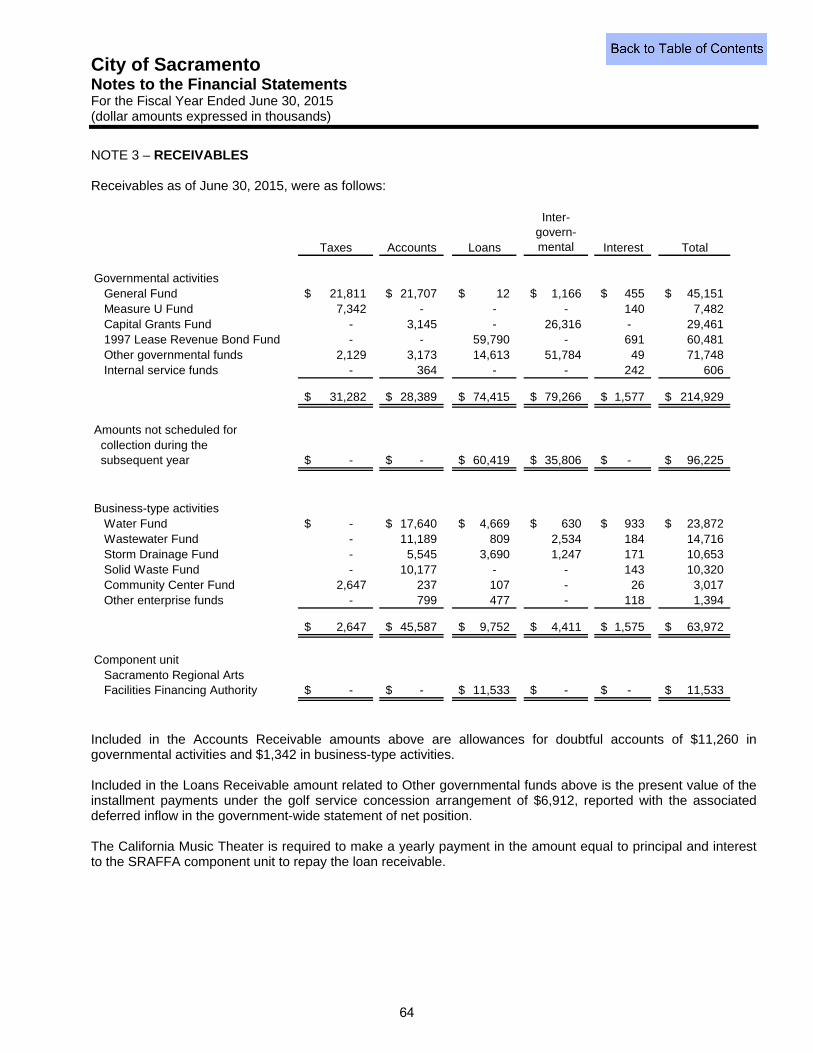
City of Sacramento Notes to the Financial Statements For the Fiscal Year Ended June 30, 2015 (dollar amounts expressed in thousands)
NOTE 3 – RECEIVABLES
Receivables as of June 30, 2015, were as follows:
Taxes Accounts Loans
Inter-govern-mental Interest Total
Governmental activities General Fund 21,811$ 21,707$ 12$ 1,166$ 455$ 45,151$ Measure U Fund 7,342 - - - 140 7,482 Capital Grants Fund - 3,145 - 26,316 - 29,461 1997 Lease Revenue Bond Fund - - 59,790 - 691 60,481 Other governmental funds 2,129 3,173 14,613 51,784 49 71,748 Internal service funds - 364 - - 242 606
31,282$ 28,389$ 74,415$ 79,266$ 1,577$ 214,929$
Amounts not scheduled for collection during the subsequent year -$ -$ 60,419$ 35,806$ -$ 96,225$
Business-type activities Water Fund -$ 17,640$ 4,669$ 630$ 933$ 23,872$ Wastewater Fund - 11,189 809 2,534 184 14,716 Storm Drainage Fund - 5,545 3,690 1,247 171 10,653 Solid Waste Fund - 10,177 - - 143 10,320 Community Center Fund 2,647 237 107 - 26 3,017 Other enterprise funds - 799 477 - 118 1,394
2,647$ 45,587$ 9,752$ 4,411$ 1,575$ 63,972$
Component unit Sacramento Regional Arts Facilities Financing Authority -$ -$ 11,533$ -$ -$ 11,533$
Included in the Accounts Receivable amounts above are allowances for doubtful accounts of $11,260 in governmental activities and $1,342 in business-type activities.
Included in the Loans Receivable amount related to Other governmental funds above is the present value of the installment payments under the golf service concession arrangement of $6,912, reported with the associated deferred inflow in the government-wide statement of net position.
The California Music Theater is required to make a yearly payment in the amount equal to principal and interest to the SRAFFA component unit to repay the loan receivable.
64
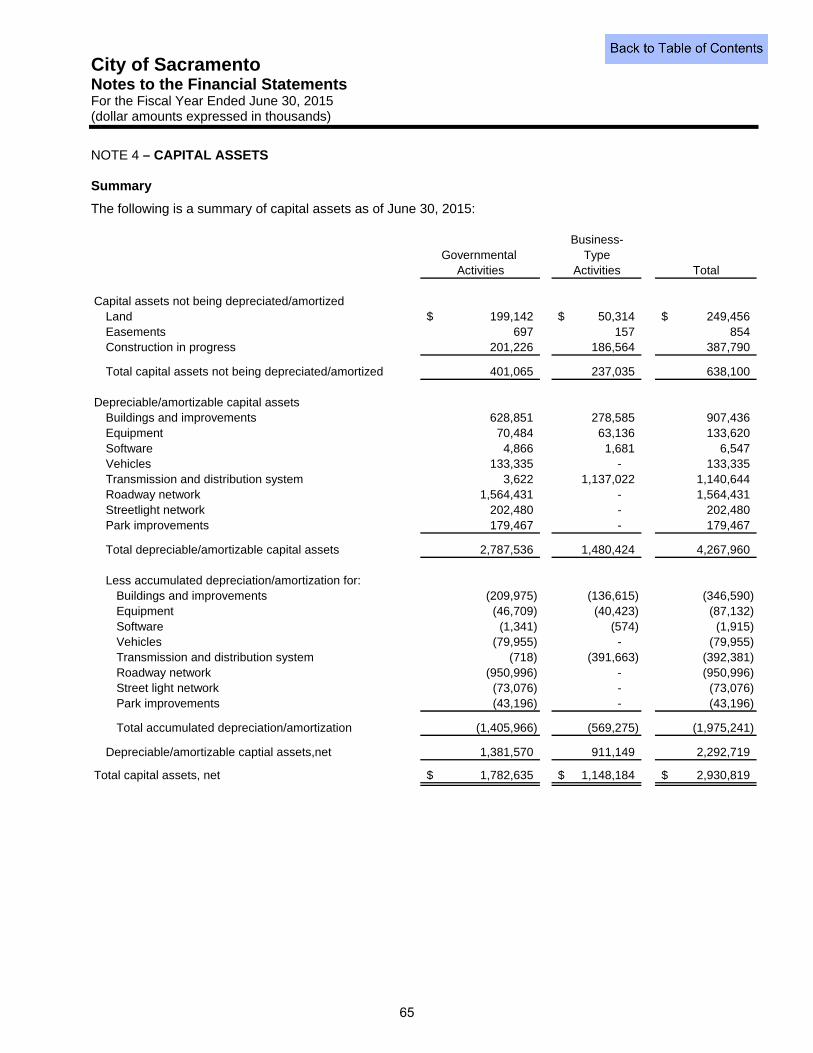
City of Sacramento Notes to the Financial Statements For the Fiscal Year Ended June 30, 2015 (dollar amounts expressed in thousands)
NOTE 4 – CAPITAL ASSETS
Summary
The following is a summary of capital assets as of June 30, 2015:
Business-Governmental Type
Activities Activities Total
Capital assets not being depreciated/amortizedLand 199,142$ 50,314$ 249,456$ Easements 697 157 854 Construction in progress 201,226 186,564 387,790
Total capital assets not being depreciated/amortized 401,065 237,035 638,100
Depreciable/amortizable capital assetsBuildings and improvements 628,851 278,585 907,436 Equipment 70,484 63,136 133,620 Software 4,866 1,681 6,547 Vehicles 133,335 - 133,335Transmission and distribution system 3,622 1,137,022 1,140,644Roadway network 1,564,431 - 1,564,431Streetlight network 202,480 - 202,480Park improvements 179,467 - 179,467
Total depreciable/amortizable capital assets 2,787,536 1,480,424 4,267,960
Less accumulated depreciation/amortization for:Buildings and improvements (209,975) (136,615) (346,590) Equipment (46,709) (40,423) (87,132) Software (1,341) (574) (1,915) Vehicles (79,955) - (79,955) Transmission and distribution system (718) (391,663) (392,381) Roadway network (950,996) - (950,996) Street light network (73,076) - (73,076) Park improvements (43,196) - (43,196)
Total accumulated depreciation/amortization (1,405,966) (569,275) (1,975,241)
Depreciable/amortizable captial assets,net 1,381,570 911,149 2,292,719
Total capital assets, net 1,782,635$ 1,148,184$ 2,930,819$
65
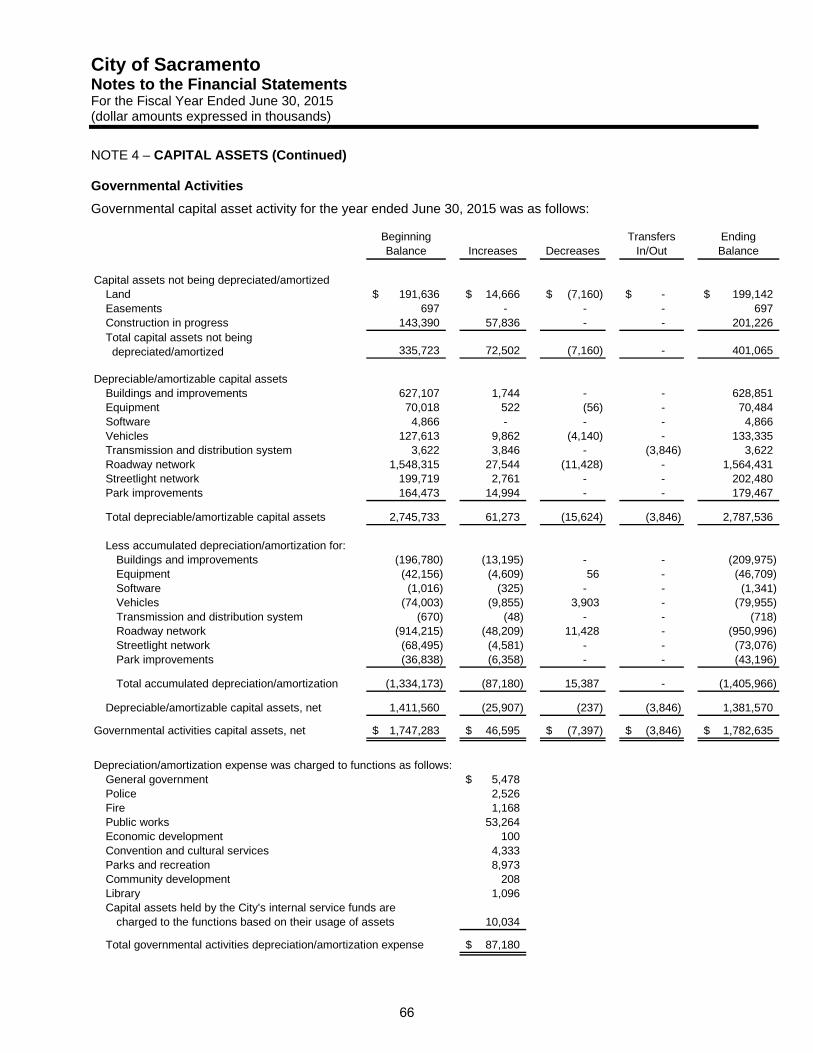
City of Sacramento Notes to the Financial Statements For the Fiscal Year Ended June 30, 2015 (dollar amounts expressed in thousands)
NOTE 4 – CAPITAL ASSETS (Continued)
Governmental Activities
Governmental capital asset activity for the year ended June 30, 2015 was as follows:
Beginning Balance Increases Decreases
Transfers In/Out
Ending Balance
Capital assets not being depreciated/amortizedLand 191,636$ 14,666$ (7,160)$ -$ 199,142$ Easements 697 - - - 697Construction in progress 143,390 57,836 - - 201,226
335,723 72,502 (7,160) - 401,065
Depreciable/amortizable capital assetsBuildings and improvements 627,107 1,744 - - 628,851 Equipment 70,018 522 (56) - 70,484 Software 4,866 - - - 4,866 Vehicles 127,613 9,862 (4,140) - 133,335Transmission and distribution system 3,622 3,846 - (3,846) 3,622Roadway network 1,548,315 27,544 (11,428) - 1,564,431Streetlight network 199,719 2,761 - - 202,480Park improvements 164,473 14,994 - - 179,467
Total depreciable/amortizable capital assets 2,745,733 61,273 (15,624) (3,846) 2,787,536
Less accumulated depreciation/amortization for:Buildings and improvements (196,780) (13,195) - - (209,975) Equipment (42,156) (4,609) 56 - (46,709)Software (1,016) (325) - - (1,341)Vehicles (74,003) (9,855) 3,903 - (79,955)Transmission and distribution system (670) (48) - - (718)Roadway network (914,215) (48,209) 11,428 - (950,996)Streetlight network (68,495) (4,581) - - (73,076)Park improvements (36,838) (6,358) - - (43,196)
Total accumulated depreciation/amortization (1,334,173) (87,180) 15,387 - (1,405,966)
Depreciable/amortizable capital assets, net 1,411,560 (25,907) (237) (3,846) 1,381,570
Governmental activities capital assets, net 1,747,283$ 46,595$ (7,397)$ (3,846)$ 1,782,635$
Depreciation/amortization expense was charged to functions as follows:General government 5,478$ Police 2,526 Fire 1,168 Public works 53,264 Economic development 100 Convention and cultural services 4,333 Parks and recreation 8,973 Community development 208 Library 1,096 Capital assets held by the City's internal service funds are
charged to the functions based on their usage of assets 10,034
Total governmental activities depreciation/amortization expense 87,180$
Total capital assets not being depreciated/amortized
66
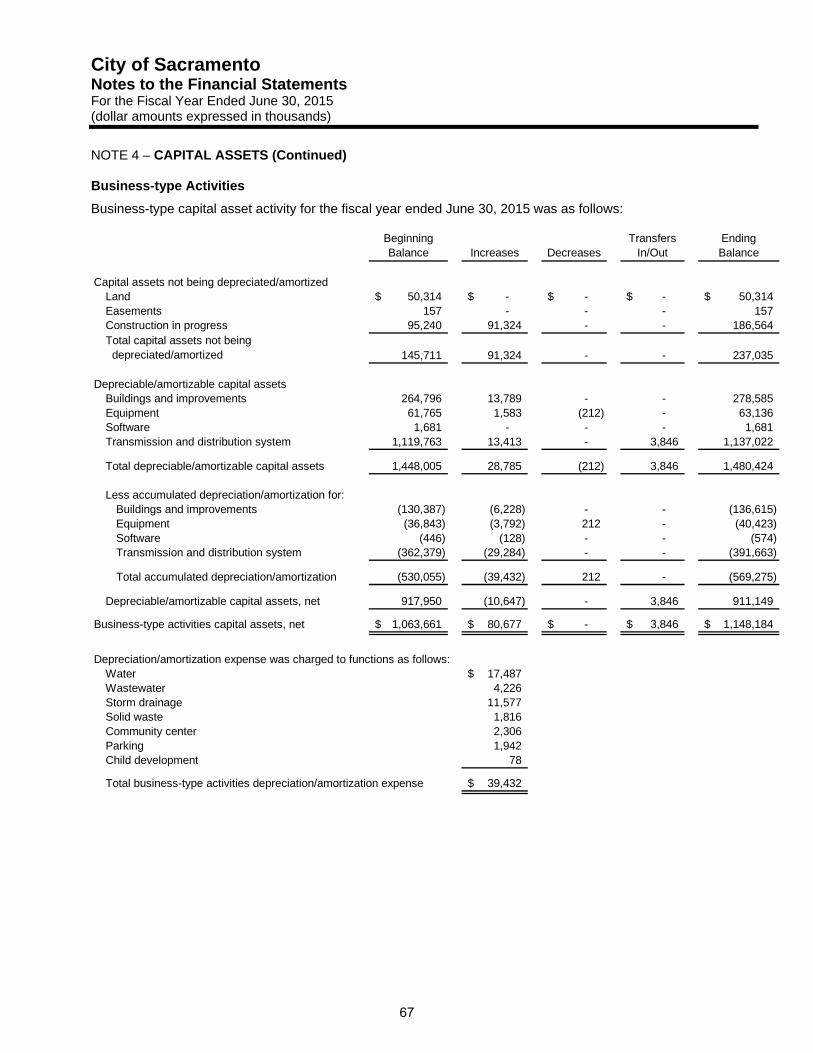
City of Sacramento Notes to the Financial Statements For the Fiscal Year Ended June 30, 2015 (dollar amounts expressed in thousands)
NOTE 4 – CAPITAL ASSETS (Continued)
Business-type Activities
Business-type capital asset activity for the fiscal year ended June 30, 2015 was as follows:
Beginning Balance Increases Decreases
Transfers In/Out
Ending Balance
Capital assets not being depreciated/amortizedLand 50,314$ -$ -$ -$ 50,314$ Easements 157 - - - 157 Construction in progress 95,240 91,324 - - 186,564
145,711 91,324 - - 237,035
Depreciable/amortizable capital assetsBuildings and improvements 264,796 13,789 - - 278,585 Equipment 61,765 1,583 (212) - 63,136 Software 1,681 - - - 1,681 Transmission and distribution system 1,119,763 13,413 - 3,846 1,137,022
Total depreciable/amortizable capital assets 1,448,005 28,785 (212) 3,846 1,480,424
Less accumulated depreciation/amortization for:Buildings and improvements (130,387) (6,228) - - (136,615) Equipment (36,843) (3,792) 212 - (40,423)Software (446) (128) - - (574) Transmission and distribution system (362,379) (29,284) - - (391,663)
Total accumulated depreciation/amortization (530,055) (39,432) 212 - (569,275)
Depreciable/amortizable capital assets, net 917,950 (10,647) - 3,846 911,149
Business-type activities capital assets, net 1,063,661$ 80,677$ -$ 3,846$ 1,148,184$
Depreciation/amortization expense was charged to functions as follows:Water 17,487$ Wastewater 4,226 Storm drainage 11,577 Solid waste 1,816 Community center 2,306 Parking 1,942 Child development 78
Total business-type activities depreciation/amortization expense 39,432$
Total capital assets not being depreciated/amortized
67
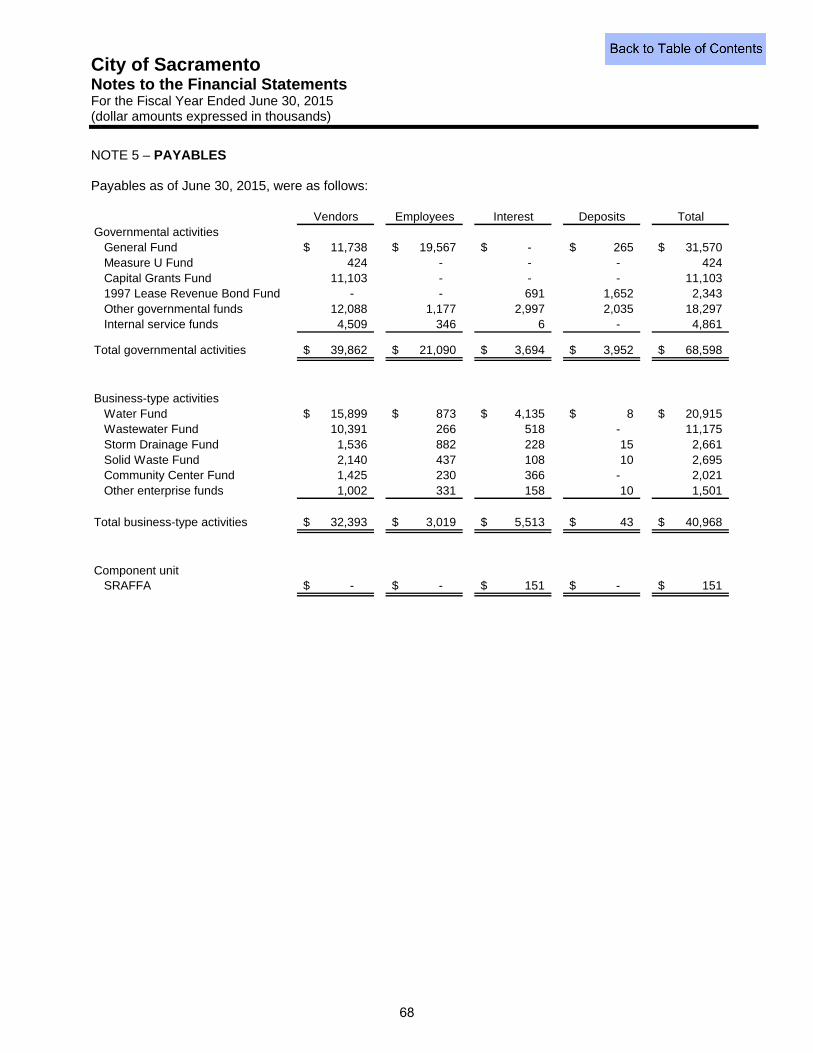
City of Sacramento Notes to the Financial Statements For the Fiscal Year Ended June 30, 2015 (dollar amounts expressed in thousands)
NOTE 5 – PAYABLES
Payables as of June 30, 2015, were as follows:
Vendors Employees Interest Deposits TotalGovernmental activities General Fund 11,738$ 19,567$ -$ 265$ 31,570$ Measure U Fund 424 - - - 424 Capital Grants Fund 11,103 - - - 11,103 1997 Lease Revenue Bond Fund - - 691 1,652 2,343 Other governmental funds 12,088 1,177 2,997 2,035 18,297 Internal service funds 4,509 346 6 - 4,861
Total governmental activities 39,862$ 21,090$ 3,694$ 3,952$ 68,598$
Business-type activities Water Fund 15,899$ 873$ 4,135$ 8$ 20,915$ Wastewater Fund 10,391 266 518 - 11,175 Storm Drainage Fund 1,536 882 228 15 2,661 Solid Waste Fund 2,140 437 108 10 2,695 Community Center Fund 1,425 230 366 - 2,021 Other enterprise funds 1,002 331 158 10 1,501
Total business-type activities 32,393$ 3,019$ 5,513$ 43$ 40,968$
Component unit SRAFFA -$ -$ 151$ -$ 151$
68
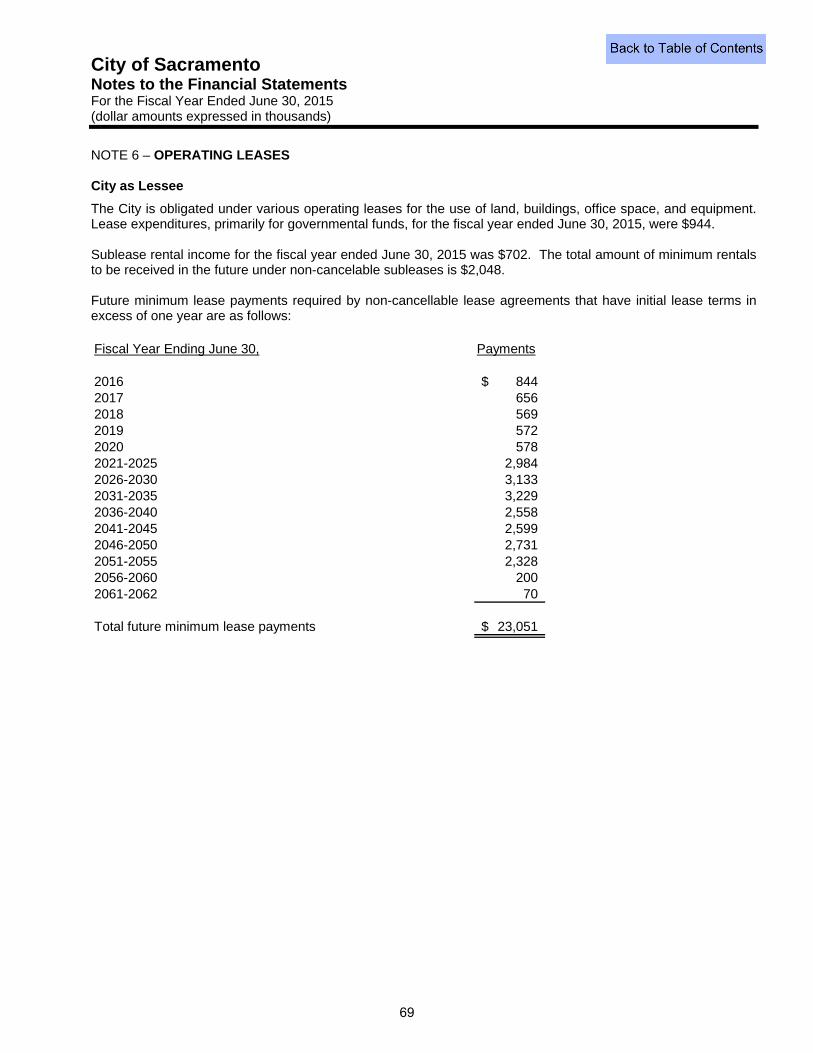
City of Sacramento Notes to the Financial Statements For the Fiscal Year Ended June 30, 2015 (dollar amounts expressed in thousands)
NOTE 6 – OPERATING LEASES
City as Lessee
The City is obligated under various operating leases for the use of land, buildings, office space, and equipment. Lease expenditures, primarily for governmental funds, for the fiscal year ended June 30, 2015, were $944.
Sublease rental income for the fiscal year ended June 30, 2015 was $702. The total amount of minimum rentals to be received in the future under non-cancelable subleases is $2,048.
Future minimum lease payments required by non-cancellable lease agreements that have initial lease terms in excess of one year are as follows:
Fiscal Year Ending June 30, Payments
2016 844$ 2017 656 2018 569 2019 572 2020 578 2021-2025 2,984 2026-2030 3,133 2031-2035 3,229 2036-2040 2,558 2041-2045 2,599 2046-2050 2,731 2051-2055 2,328 2056-2060 200 2061-2062 70
Total future minimum lease payments 23,051$
69
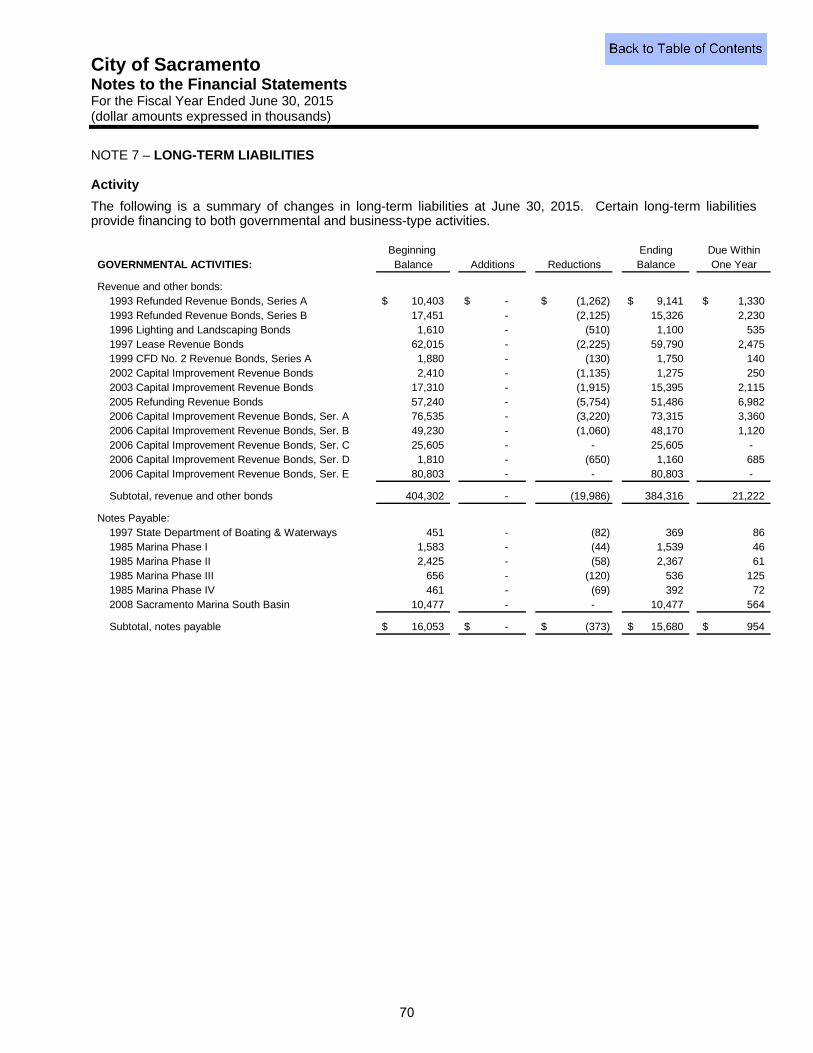
City of Sacramento Notes to the Financial Statements For the Fiscal Year Ended June 30, 2015 (dollar amounts expressed in thousands)
NOTE 7 – LONG-TERM LIABILITIES
Activity
The following is a summary of changes in long-term liabilities at June 30, 2015. Certain long-term liabilities provide financing to both governmental and business-type activities.
Beginning Ending Due WithinGOVERNMENTAL ACTIVITIES: Balance Additions Reductions Balance One Year
Revenue and other bonds: 1993 Refunded Revenue Bonds, Series A 10,403$ -$ (1,262)$ 9,141$ 1,330$ 1993 Refunded Revenue Bonds, Series B 17,451 - (2,125) 15,326 2,230 1996 Lighting and Landscaping Bonds 1,610 - (510) 1,100 535 1997 Lease Revenue Bonds 62,015 - (2,225) 59,790 2,475 1999 CFD No. 2 Revenue Bonds, Series A 1,880 - (130) 1,750 140 2002 Capital Improvement Revenue Bonds 2,410 - (1,135) 1,275 250 2003 Capital Improvement Revenue Bonds 17,310 - (1,915) 15,395 2,115 2005 Refunding Revenue Bonds 57,240 - (5,754) 51,486 6,982 2006 Capital Improvement Revenue Bonds, Ser. A 76,535 - (3,220) 73,315 3,360 2006 Capital Improvement Revenue Bonds, Ser. B 49,230 - (1,060) 48,170 1,120 2006 Capital Improvement Revenue Bonds, Ser. C 25,605 - - 25,605 - 2006 Capital Improvement Revenue Bonds, Ser. D 1,810 - (650) 1,160 685 2006 Capital Improvement Revenue Bonds, Ser. E 80,803 - - 80,803 -
Subtotal, revenue and other bonds 404,302 - (19,986) 384,316 21,222
Notes Payable: 1997 State Department of Boating & Waterways 451 - (82) 369 86 1985 Marina Phase I 1,583 - (44) 1,539 46 1985 Marina Phase II 2,425 - (58) 2,367 61 1985 Marina Phase III 656 - (120) 536 125 1985 Marina Phase IV 461 - (69) 392 72 2008 Sacramento Marina South Basin 10,477 - - 10,477 564
Subtotal, notes payable 16,053$ -$ (373)$ 15,680$ 954$
70
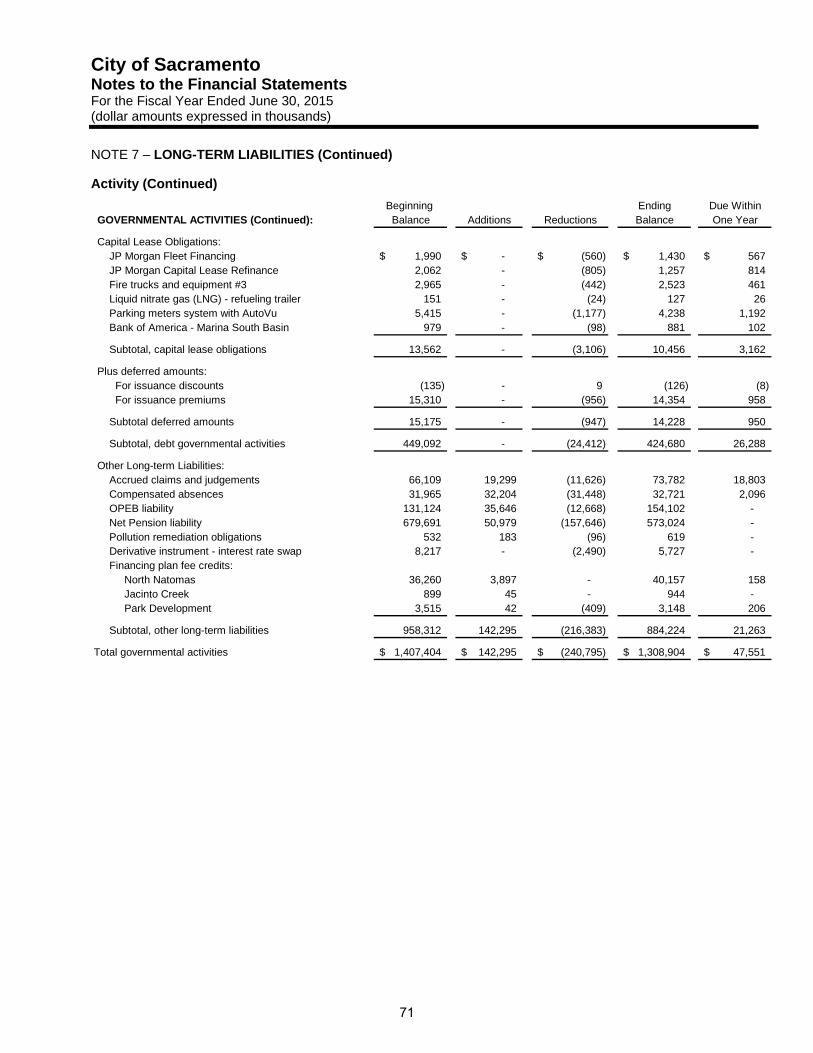
City of Sacramento Notes to the Financial Statements For the Fiscal Year Ended June 30, 2015 (dollar amounts expressed in thousands)
NOTE 7 – LONG-TERM LIABILITIES (Continued)
Activity (Continued)
Beginning Ending Due WithinGOVERNMENTAL ACTIVITIES (Continued): Balance Additions Reductions Balance One Year
Capital Lease Obligations: JP Morgan Fleet Financing 1,990$ -$ (560)$ 1,430$ 567$ JP Morgan Capital Lease Refinance 2,062 - (805) 1,257 814 Fire trucks and equipment #3 2,965 - (442) 2,523 461 Liquid nitrate gas (LNG) - refueling trailer 151 - (24) 127 26 Parking meters system with AutoVu 5,415 - (1,177) 4,238 1,192 Bank of America - Marina South Basin 979 - (98) 881 102
Subtotal, capital lease obligations 13,562 - (3,106) 10,456 3,162
Plus deferred amounts: For issuance discounts (135) - 9 (126) (8) For issuance premiums 15,310 - (956) 14,354 958
Subtotal deferred amounts 15,175 - (947) 14,228 950
Subtotal, debt governmental activities 449,092 - (24,412) 424,680 26,288
Other Long-term Liabilities: Accrued claims and judgements 66,109 19,299 (11,626) 73,782 18,803 Compensated absences 31,965 32,204 (31,448) 32,721 2,096 OPEB liability 131,124 35,646 (12,668) 154,102 - Net Pension liability 679,691 50,979 (157,646) 573,024 - Pollution remediation obligations 532 183 (96) 619 - Derivative instrument - interest rate swap 8,217 - (2,490) 5,727 - Financing plan fee credits:
North Natomas 36,260 3,897 - 40,157 158 Jacinto Creek 899 45 - 944 - Park Development 3,515 42 (409) 3,148 206
Subtotal, other long-term liabilities 958,312 142,295 (216,383) 884,224 21,263
Total governmental activities 1,407,404$ 142,295$ (240,795)$ 1,308,904$ 47,551$
71
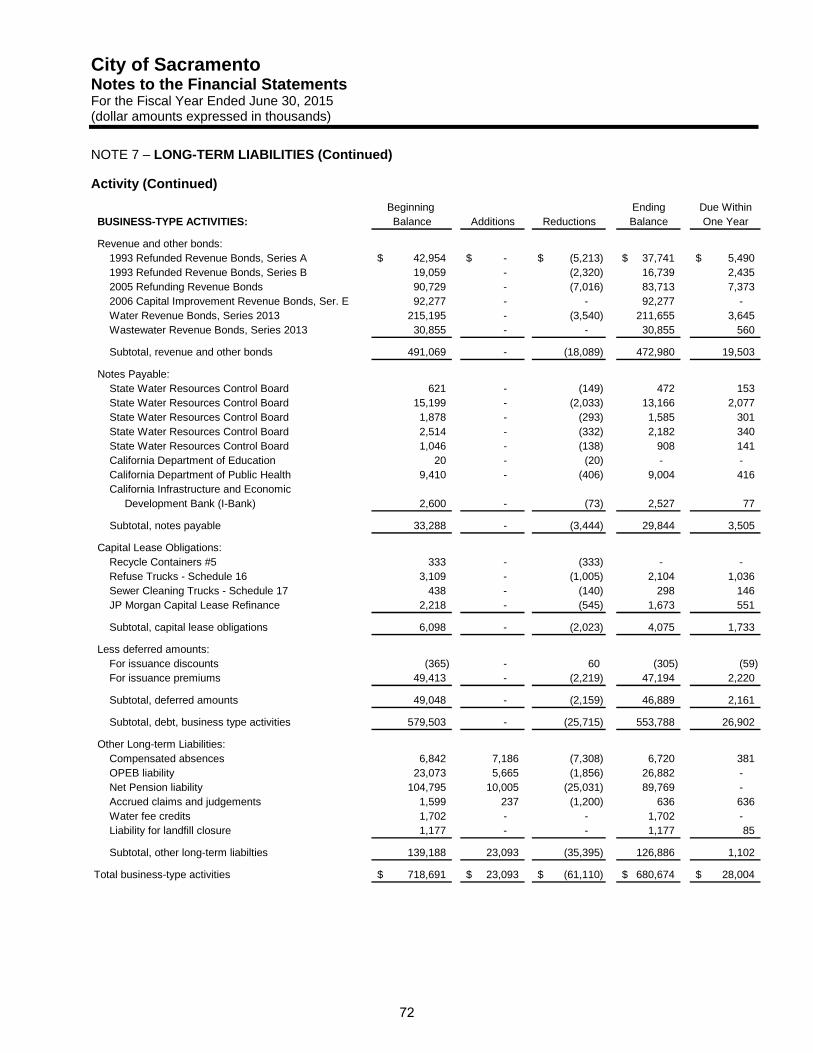
City of Sacramento Notes to the Financial Statements For the Fiscal Year Ended June 30, 2015 (dollar amounts expressed in thousands)
NOTE 7 – LONG-TERM LIABILITIES (Continued)
Activity (Continued)
Beginning Ending Due WithinBUSINESS-TYPE ACTIVITIES: Balance Additions Reductions Balance One Year
Revenue and other bonds: 1993 Refunded Revenue Bonds, Series A 42,954$ -$ (5,213)$ 37,741$ 5,490$ 1993 Refunded Revenue Bonds, Series B 19,059 - (2,320) 16,739 2,435 2005 Refunding Revenue Bonds 90,729 - (7,016) 83,713 7,373 2006 Capital Improvement Revenue Bonds, Ser. E 92,277 - - 92,277 - Water Revenue Bonds, Series 2013 215,195 - (3,540) 211,655 3,645 Wastewater Revenue Bonds, Series 2013 30,855 - - 30,855 560
Subtotal, revenue and other bonds 491,069 - (18,089) 472,980 19,503
Notes Payable: State Water Resources Control Board 621 - (149) 472 153 State Water Resources Control Board 15,199 - (2,033) 13,166 2,077 State Water Resources Control Board 1,878 - (293) 1,585 301 State Water Resources Control Board 2,514 - (332) 2,182 340 State Water Resources Control Board 1,046 - (138) 908 141 California Department of Education 20 - (20) - - California Department of Public Health 9,410 - (406) 9,004 416 California Infrastructure and Economic Development Bank (I-Bank) 2,600 - (73) 2,527 77
Subtotal, notes payable 33,288 - (3,444) 29,844 3,505
Capital Lease Obligations: Recycle Containers #5 333 - (333) - - Refuse Trucks - Schedule 16 3,109 - (1,005) 2,104 1,036 Sewer Cleaning Trucks - Schedule 17 438 - (140) 298 146 JP Morgan Capital Lease Refinance 2,218 - (545) 1,673 551
Subtotal, capital lease obligations 6,098 - (2,023) 4,075 1,733
Less deferred amounts: For issuance discounts (365) - 60 (305) (59) For issuance premiums 49,413 - (2,219) 47,194 2,220
Subtotal, deferred amounts 49,048 - (2,159) 46,889 2,161
Subtotal, debt, business type activities 579,503 - (25,715) 553,788 26,902
Other Long-term Liabilities: Compensated absences 6,842 7,186 (7,308) 6,720 381 OPEB liability 23,073 5,665 (1,856) 26,882 - Net Pension liability 104,795 10,005 (25,031) 89,769 - Accrued claims and judgements 1,599 237 (1,200) 636 636 Water fee credits 1,702 - - 1,702 - Liability for landfill closure 1,177 - - 1,177 85
Subtotal, other long-term liabilties 139,188 23,093 (35,395) 126,886 1,102
Total business-type activities 718,691$ 23,093$ (61,110)$ 680,674$ 28,004$
72
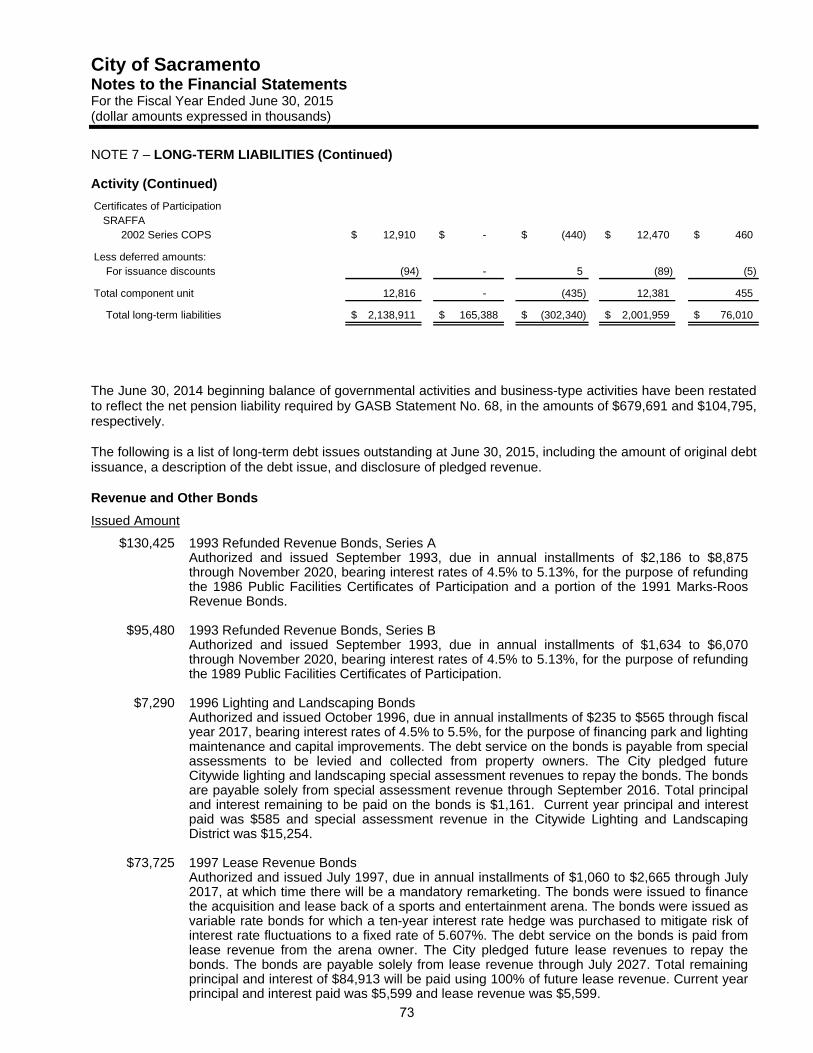
City of Sacramento Notes to the Financial Statements For the Fiscal Year Ended June 30, 2015 (dollar amounts expressed in thousands)
NOTE 7 – LONG-TERM LIABILITIES (Continued)
Activity (Continued)
Certificates of Participation SRAFFA 2002 Series COPS 12,910$ -$ (440)$ 12,470$ 460$
Less deferred amounts: For issuance discounts (94) - 5 (89) (5)
Total component unit 12,816 - (435) 12,381 455
Total long-term liabilities 2,138,911$ 165,388$ (302,340)$ 2,001,959$ 76,010$
The June 30, 2014 beginning balance of governmental activities and business-type activities have been restated to reflect the net pension liability required by GASB Statement No. 68, in the amounts of $679,691 and $104,795, respectively.
The following is a list of long-term debt issues outstanding at June 30, 2015, including the amount of original debt issuance, a description of the debt issue, and disclosure of pledged revenue.
Revenue and Other Bonds
Issued Amount
$130,425 1993 Refunded Revenue Bonds, Series A
$95,480
$7,290
$73,725
Authorized and issued September 1993, due in annual installments of $2,186 to $8,875 through November 2020, bearing interest rates of 4.5% to 5.13%, for the purpose of refunding the 1986 Public Facilities Certificates of Participation and a portion of the 1991 Marks-Roos Revenue Bonds.
1993 Refunded Revenue Bonds, Series B Authorized and issued September 1993, due in annual installments of $1,634 to $6,070 through November 2020, bearing interest rates of 4.5% to 5.13%, for the purpose of refunding the 1989 Public Facilities Certificates of Participation.
1996 Lighting and Landscaping Bonds Authorized and issued October 1996, due in annual installments of $235 to $565 through fiscal year 2017, bearing interest rates of 4.5% to 5.5%, for the purpose of financing park and lighting maintenance and capital improvements. The debt service on the bonds is payable from special assessments to be levied and collected from property owners. The City pledged future Citywide lighting and landscaping special assessment revenues to repay the bonds. The bonds are payable solely from special assessment revenue through September 2016. Total principal and interest remaining to be paid on the bonds is $1,161. Current year principal and interest paid was $585 and special assessment revenue in the Citywide Lighting and Landscaping District was $15,254.
1997 Lease Revenue Bonds Authorized and issued July 1997, due in annual installments of $1,060 to $2,665 through July 2017, at which time there will be a mandatory remarketing. The bonds were issued to finance the acquisition and lease back of a sports and entertainment arena. The bonds were issued as variable rate bonds for which a ten-year interest rate hedge was purchased to mitigate risk of interest rate fluctuations to a fixed rate of 5.607%. The debt service on the bonds is paid from lease revenue from the arena owner. The City pledged future lease revenues to repay the bonds. The bonds are payable solely from lease revenue through July 2027. Total remaining principal and interest of $84,913 will be paid using 100% of future lease revenue. Current year principal and interest paid was $5,599 and lease revenue was $5,599.
73
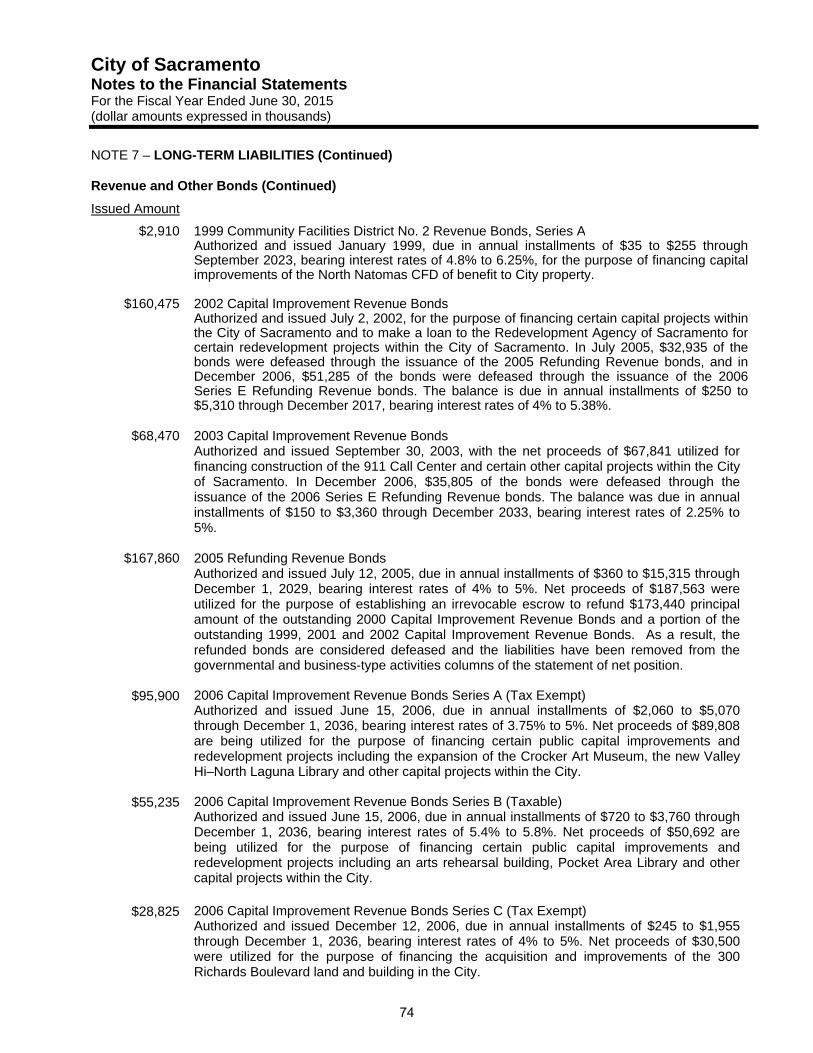
City of Sacramento Notes to the Financial Statements For the Fiscal Year Ended June 30, 2015 (dollar amounts expressed in thousands)
NOTE 7 – LONG-TERM LIABILITIES (Continued)
Revenue and Other Bonds (Continued)
Issued Amount
$2,910 1999 Community Facilities District No. 2 Revenue Bonds, Series A Authorized and issued January 1999, due in annual installments of $35 to $255 through September 2023, bearing interest rates of 4.8% to 6.25%, for the purpose of financing capital improvements of the North Natomas CFD of benefit to City property.
$160,475 2002 Capital Improvement Revenue BondsAuthorized and issued July 2, 2002, for the purpose of financing certain capital projects within the City of Sacramento and to make a loan to the Redevelopment Agency of Sacramento for certain redevelopment projects within the City of Sacramento. In July 2005, $32,935 of the bonds were defeased through the issuance of the 2005 Refunding Revenue bonds, and in December 2006, $51,285 of the bonds were defeased through the issuance of the 2006 Series E Refunding Revenue bonds. The balance is due in annual installments of $250 to $5,310 through December 2017, bearing interest rates of 4% to 5.38%.
$68,470 2003 Capital Improvement Revenue Bonds Authorized and issued September 30, 2003, with the net proceeds of $67,841 utilized for financing construction of the 911 Call Center and certain other capital projects within the City of Sacramento. In December 2006, $35,805 of the bonds were defeased through the issuance of the 2006 Series E Refunding Revenue bonds. The balance was due in annual installments of $150 to $3,360 through December 2033, bearing interest rates of 2.25% to 5%.
$167,860 2005 Refunding Revenue Bonds Authorized and issued July 12, 2005, due in annual installments of $360 to $15,315 through December 1, 2029, bearing interest rates of 4% to 5%. Net proceeds of $187,563 were utilized for the purpose of establishing an irrevocable escrow to refund $173,440 principal amount of the outstanding 2000 Capital Improvement Revenue Bonds and a portion of the outstanding 1999, 2001 and 2002 Capital Improvement Revenue Bonds. As a result, the refunded bonds are considered defeased and the liabilities have been removed from the governmental and business-type activities columns of the statement of net position.
$95,900 2006 Capital Improvement Revenue Bonds Series A (Tax Exempt) Authorized and issued June 15, 2006, due in annual installments of $2,060 to $5,070 through December 1, 2036, bearing interest rates of 3.75% to 5%. Net proceeds of $89,808 are being utilized for the purpose of financing certain public capital improvements and redevelopment projects including the expansion of the Crocker Art Museum, the new Valley Hi–North Laguna Library and other capital projects within the City.
$55,235 2006 Capital Improvement Revenue Bonds Series B (Taxable)Authorized and issued June 15, 2006, due in annual installments of $720 to $3,760 through December 1, 2036, bearing interest rates of 5.4% to 5.8%. Net proceeds of $50,692 are being utilized for the purpose of financing certain public capital improvements and redevelopment projects including an arts rehearsal building, Pocket Area Library and other capital projects within the City.
$28,825 2006 Capital Improvement Revenue Bonds Series C (Tax Exempt) Authorized and issued December 12, 2006, due in annual installments of $245 to $1,955 through December 1, 2036, bearing interest rates of 4% to 5%. Net proceeds of $30,500 were utilized for the purpose of financing the acquisition and improvements of the 300 Richards Boulevard land and building in the City.
74
City of Sacramento Notes to the Financial Statements For the Fiscal Year Ended June 30, 2015 (dollar amounts expressed in thousands)
NOTE 7 – LONG-TERM LIABILITIES (Continued)
Revenue and Other Bonds (Continued)
Issued Amount
$2,430 2006 Capital Improvement Revenue Bonds Series D (Tax Exempt) Authorized and issued December 12, 2006, due in annual installments of $475 to $685 through December 1, 2016, bearing an interest rate of 5.16%. Net proceeds of $2,400 were utilized for the purpose of financing the acquisition and improvements of the 300 Richards Boulevard land and building in the City.
$186,950 2006 Capital Improvement Revenue Bonds Series E (Refunding) Authorized and issued December 12, 2006, due in annual installments of $402 to $8,570 through December 1, 2033, bearing interest rates of 4% to 5.25%. Net proceeds of $216,661 plus cash of $13,441 have been utilized for the purpose of establishing an irrevocable escrow to defease $218,000 principal amount of the outstanding 2001 Capital Improvement Revenue Bonds and a portion of the outstanding 2002 and 2003 Capital Improvement Revenue Bonds, and the associated liabilities have been removed from the governmental and business-type activities columns of the statement of net position.
$215,195 Water Revenue Bonds, Series 2013Authorized and issued March 2013, due in annual installments of $9,731 to $14,018 through fiscal year 2043, bearing interest rates of 1% to 5%, for the purpose of financing the costs of improvements to the City’s municipal water system. The debt service on the bonds is secured by the pledge of, and payable solely from, the Trust Estate, which consist primarily of all system net revenues and trustee accounts held under the indenture. Total principal and interest remaining to be paid on the bonds is $392,442 as of June 30, 2015. Current year principal and interest paid was $14,011 and Water Fund system revenue was $100,476.
$30,855 Wastewater Revenue Bonds, Series 2013Authorized and issued June 2013, due in annual installments of $951 to $1,958 through fiscal year 2043, bearing interest rates of 3% to 5%, for the purpose of financing the costs of improvements to the City’s wastewater system. The debt service on the bonds is secured by a pledge of, and payable solely from, the Trust Estate, which consists primarily of all system net revenues and trustee accounts held under the indenture. Total principal and interest remaining to be paid on the bonds is $54,752 as of June 30, 2015. Current year principal and interest paid was $1,404 and Wastewater Fund system revenue was $31,203.
Certificates of Participation
$16,580 Sacramento Regional Arts Facilities 2002 Series Certificates of Participation (COPs) Authorized and issued in August 2002, due in annual principal and interest installments of $754 to $1,063 through September 2032, bearing interest rates of 2% to 5%. Net proceeds of $16,428 were utilized for the purpose of financing and refinancing the acquisition, renovation and construction of the H Street Theatre facilities. The COPs are payable solely from lease revenue received by the City through September 2032. Total remaining principal and interest of $18,785 will be paid using 100% of future lease revenue. Current year principal and interest paid was $1,050 and lease payments received were $1,050.
Notes Payable
$2,220 1985 Sacramento Marina Note Payable, Phase I Authorized July 1985, issued November 1985, refinanced August 1998, to the California Department of Boating and Waterways, due in annual installments of $20 to $82 through August 2030, bearing an interest rate of 4.5%, for the purpose of financing the expansion of the Sacramento Marina.
75
City of Sacramento Notes to the Financial Statements For the Fiscal Year Ended June 30, 2015 (dollar amounts expressed in thousands)
NOTE 7 – LONG-TERM LIABILITIES (Continued)
Notes Payable (Continued)
Issued Amount
$3,229 1985 Sacramento Marina Note Payable, Phase II Authorized July 1985, issued September 1987, refinanced August 1998, to the California Department of Boating and Waterways, due in annual installments of $27 to $150 through August 2037, bearing an interest rate of 4.5%, for the purpose of financing the expansion of the Sacramento Marina.
$1,829 1985 Sacramento Marina Note Payable, Phase III Authorized July 1985, issued March 1988, refinanced August 1998, to the California Department of Boating and Waterways, due in annual installments of $50 to $120 through August 2018, bearing an interest rate of 4.5%, for the purpose of financing the expansion of the Sacramento Marina.
$1,117 1985 Sacramento Marina Note Payable, Phase IV Authorized July 1985, issued February 1989, refinanced August 1998, to the California Department of Boating and Waterways, due in annual installments of $29 to $73 through August 2019, bearing an interest rate of 4.5%, for the purpose of financing the expansion of the Sacramento Marina.
$10,477 2008 Sacramento Marina Note Payable, South Basin Authorized February 2005, the City has made loan draws of $9,000 plus accrued interest of $1,477 through June 30, 2013, from the California Department of Boating and Waterways, for the purpose of constructing the South Basin Improvements at the Sacramento Marina. Principal and interest is due in 30 annual installments of $204 to $662, through August 2041, bearing an interest rate of 4.603%. The City has made no principal or interest payments on this loan since 2013, and is working with DB&W on a loan restructure. As of June 30, 2015, the DB&W and the City have not executed a formal agreement to restructure this loan.
$1,380 1997 State Department of Boating and Waterways Note Payable Authorized January 1997, issued May 1999, due in annual installments of $89 to $98 through 2018, for the purpose of financing a visitor dock at Old Sacramento.
$2,619 State Water Resources Control Board Note Payable Authorized July 1998, issued September 1998, due in annual installments of $166 through March 2018, bearing an interest rate of 2.6% for the purpose of financing the City’s reservoir rehabilitation project. The City pledged future wastewater and storm drainage fee revenue to repay the note. The note is payable solely from the wastewater and storm drainage fee revenue through March 2018. Total principal and interest remaining to be paid on the note is $497. Current year principal and interest paid was $166 and wastewater and storm drain fee revenue was $67,387.
$37,016 State Water Resources Control Board Note Payable Authorized March 1999, issued beginning July 1999, due in annual installments of $2,373 through November 2020, bearing an interest rate of 2.2%, for the purpose of financing various wastewater projects. The City pledged future wastewater and storm drainage fee revenue to repay the note. The note is payable solely from the wastewater and storm drainage fee revenue through November 2020. Total principal and interest remaining to be paid on the note is $14,203. Current year principal and interest paid was $2,367 and wastewater and storm drain fee revenue was $67,387.
76
City of Sacramento Notes to the Financial Statements For the Fiscal Year Ended June 30, 2015 (dollar amounts expressed in thousands)
NOTE 7 – LONG-TERM LIABILITIES (Continued)
Notes Payable (Continued)
Issued Amount
$5,177 State Water Resources Control Board Note Payable Authorized March 2001, issued July 2001, due in annual installments of $342 through September 2019, bearing an interest rate of 2.6%, for the purpose of financing the construction of underground storage and pumping facilities. The City pledged future wastewater and storm drainage fee revenue to repay the note. The note is payable solely from the wastewater and storm drainage fee revenue through September 2019. Total principal and interest remaining to be paid on the note is $1,710. Current year principal and interest paid was $342 and wastewater and storm drain fee revenue was $67,387.
$2,603 State Water Resources Control Board Note Payable Authorized June 2001, issued beginning May 2002, due in annual installments of $149 through May 2021, bearing an interest rate of 2.6%, for the purpose of financing the replacement of sewer lines. In fiscal year 2003 there was an additional draw of $250. The City pledged future wastewater and storm drainage fee revenue to repay the note. The note is payable solely from the wastewater and storm drainage fee revenue through May 2021. Total principal and interest remaining to be paid on the note is $990. Current year principal and interest paid was $165 and wastewater and storm drain fee revenue was $67,387.
$5,672 State Water Resources Control Board Note Payable Authorized February 2002, issued beginning February 2002, due in annual installments of $397 through February 2021, bearing an interest rate of 2.6%, for the purpose of financing the replacement of sewer lines. The City pledged future wastewater and storm drainage fee revenue to repay the note. The note is payable solely from the wastewater and storm drainage fee revenue through February 2021. Total principal and interest remaining to be paid on the note is $2,383. Current year principal and interest paid was $397 and wastewater and storm drain fee revenue was $67,387.
$10,000 California Department of Public Health Authorized September 2009 for the installation of approximately 13,000 water meters. The note, with a 2.5% interest rate, will be repaid over 20 years with annual principal and interest payments of approximately $639. The City pledged future water enterprise fund revenue to repay the note. Water Fund system revenue was $100,476. The note is payable solely from water enterprise fund revenue through 2033.
$2,975 California Infrastructure and Economic Development Bank (I-Bank) Authorized in December 2007, due in annual principal and interest installments from $187 to $196 through August 2032, bearing an interest rate of 3.17%, for the purpose of financing the purchase and construction of the Basin 31 Detention Basin. The City pledged future storm drainage fee revenue to repay the note. The note is payable solely from the storm drainage fee revenue through August 2032. Total principal and interest remaining to be paid on the note is $3,654. Current year principal and interest paid was $163 and storm drainage fee revenue was $36,184.
77
City of Sacramento Notes to the Financial Statements For the Fiscal Year Ended June 30, 2015 (dollar amounts expressed in thousands)
NOTE 7 – LONG-TERM LIABILITIES (Continued)
Capital Lease Obligations
The City has entered into several long-term leases to finance the acquisition of building improvements and equipment. The leases qualify as capital leases for accounting purposes as defined under the GASB Statement No. 62 and have been recorded at the present value of the future minimum lease payments. As of June 30, 2015, future minimum lease payments to be made by the City’s General, Solid Waste, Wastewater and Culture and Leisure Funds are as follows:
Fiscal Year Ending June 30, Governmental
ActivitiesBusiness-Type
Activities Total2016 3,388$ 1,817$ 5,205$ 2017 3,006 1,818 4,824 2018 2,271 569 2,840 2019 1,358 - 1,358 2020 722 - 722 2021 - 2025 349 - 349
Total minimum lease payments 11,094 4,204 15,298 Less amounts representing interest (638) (129) (767)
Net present value of minimum lease payments 10,456$ 4,075$ 14,531$
The following is a schedule of property under capital leases by major classes at June 30, 2015:
GovernmentalActivities
Business-TypeActivities Total
Builidings and improvements 1,523$ -$ 1,523$ Equipment 20,006 13,166 33,172 Less: accumulated depreciation (7,317) (8,089) (15,406)
Total 14,212$ 5,077$ 19,289$
Other Long-term Liabilities
Accrued claims and judgements – Estimated liabilities of the City’s workers’ compensation, auto, and general liability self-insurance programs administered through the Risk Management Internal Service Fund. The first year of salary continuation in the City’s workers compensation program is accrued and paid by the City’s General Fund, enterprise funds, and internal service funds.
Compensated absences – Estimated amounts due to employees for earned, but unused, compensated absence accounts, including leave balances for vacation, sick, holiday and compensated time off. Compensated absences are generally liquidated by the City’s General Fund, enterprise funds, and internal service funds.
OPEB liability (other post-employment benefits) – Actuarially determined obligation for retiree medical benefits. The City established its OPEB liability at zero as of June 30, 2007. This liability reflects six years of contributing less than the annual required contribution. OPEB liabilities are generally liquidated by the City’s General Fund, internal service funds and enterprise funds. See note 9 for more information.
Pollution remediation obligations – Estimated liabilities to address the current or potential detrimental effects of existing pollution by participating in pollution remediation activities.
Derivative instrument - interest rate swap – Amount represents the fair value of the interest rate swap associated with the 1997 Lease Revenue bonds. See additional disclosures regarding interest rate swap below.
78
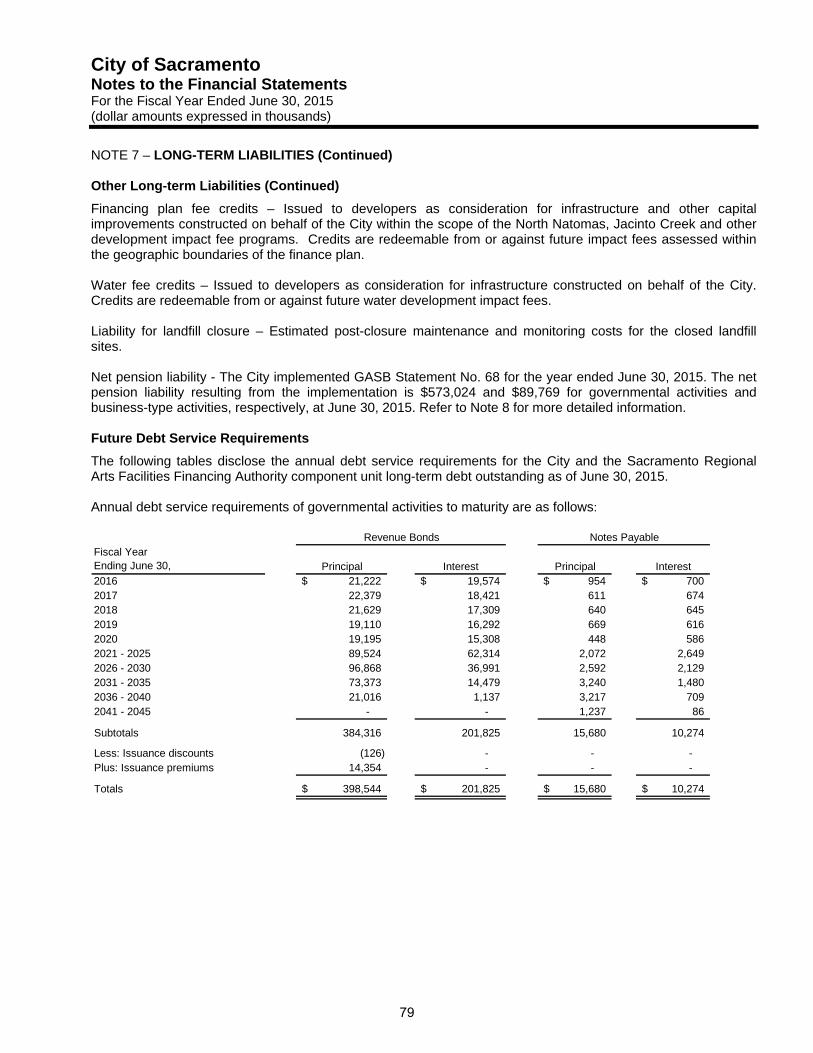
City of Sacramento Notes to the Financial Statements For the Fiscal Year Ended June 30, 2015 (dollar amounts expressed in thousands)
NOTE 7 – LONG-TERM LIABILITIES (Continued)
Other Long-term Liabilities (Continued)
Financing plan fee credits – Issued to developers as consideration for infrastructure and other capital improvements constructed on behalf of the City within the scope of the North Natomas, Jacinto Creek and other development impact fee programs. Credits are redeemable from or against future impact fees assessed within the geographic boundaries of the finance plan.
Water fee credits – Issued to developers as consideration for infrastructure constructed on behalf of the City. Credits are redeemable from or against future water development impact fees.
Liability for landfill closure – Estimated post-closure maintenance and monitoring costs for the closed landfill sites.
Net pension liability - The City implemented GASB Statement No. 68 for the year ended June 30, 2015. The net pension liability resulting from the implementation is $573,024 and $89,769 for governmental activities and business-type activities, respectively, at June 30, 2015. Refer to Note 8 for more detailed information.
Future Debt Service Requirements
The following tables disclose the annual debt service requirements for the City and the Sacramento Regional Arts Facilities Financing Authority component unit long-term debt outstanding as of June 30, 2015.
Annual debt service requirements of governmental activities to maturity are as follows:
Fiscal YearEnding June 30, Principal Interest Principal Interest2016 21,222$ 19,574$ 954$ 700$ 2017 22,379 18,421 611 674 2018 21,629 17,309 640 645 2019 19,110 16,292 669 616 2020 19,195 15,308 448 586 2021 - 2025 89,524 62,314 2,072 2,649 2026 - 2030 96,868 36,991 2,592 2,129 2031 - 2035 73,373 14,479 3,240 1,480 2036 - 2040 21,016 1,137 3,217 709 2041 - 2045 - - 1,237 86
Subtotals 384,316 201,825 15,680 10,274
Less: Issuance discounts (126) - - - Plus: Issuance premiums 14,354 - - -
Totals 398,544$ 201,825$ 15,680$ 10,274$
Revenue Bonds Notes Payable
79
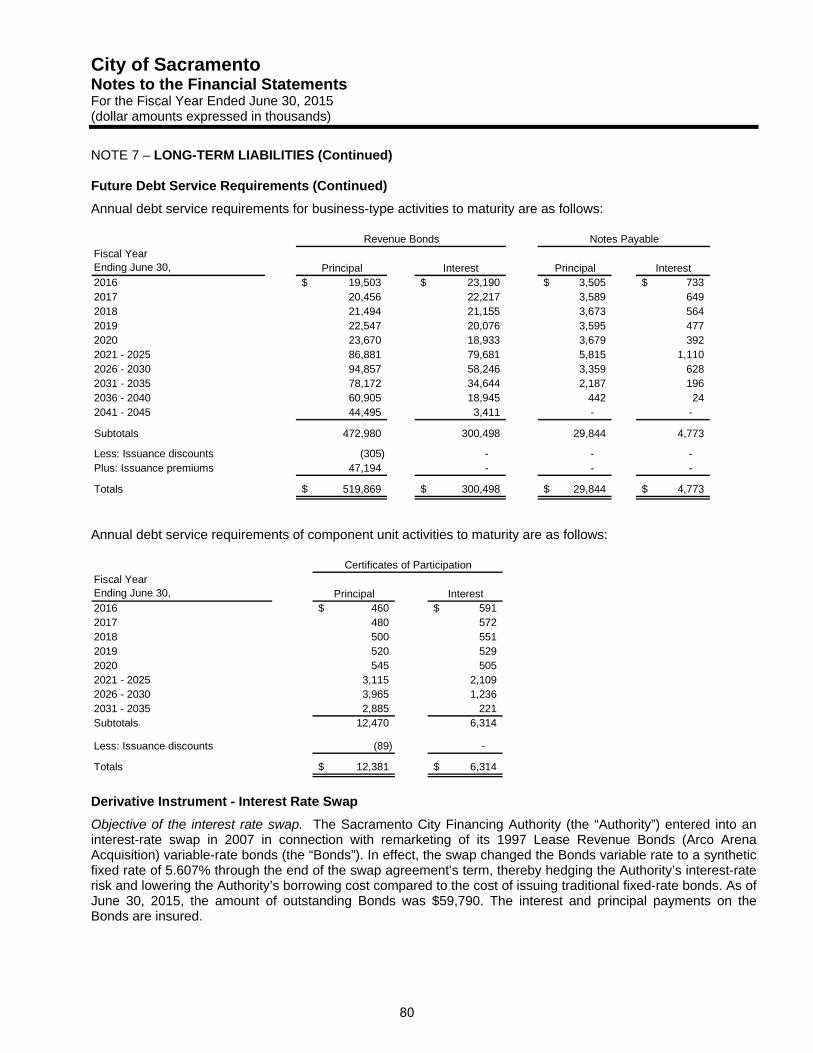
City of Sacramento Notes to the Financial Statements For the Fiscal Year Ended June 30, 2015 (dollar amounts expressed in thousands)
NOTE 7 – LONG-TERM LIABILITIES (Continued)
Future Debt Service Requirements (Continued)
Annual debt service requirements for business-type activities to maturity are as follows:
Fiscal YearEnding June 30, Principal Interest Principal Interest2016 19,503$ 23,190$ 3,505$ 733$ 2017 20,456 22,217 3,589 649 2018 21,494 21,155 3,673 564 2019 22,547 20,076 3,595 477 2020 23,670 18,933 3,679 392 2021 - 2025 86,881 79,681 5,815 1,110 2026 - 2030 94,857 58,246 3,359 628 2031 - 2035 78,172 34,644 2,187 196 2036 - 2040 60,905 18,945 442 24 2041 - 2045 44,495 3,411 - -
Subtotals 472,980 300,498 29,844 4,773
Less: Issuance discounts (305) - - - Plus: Issuance premiums 47,194 - - -
Totals 519,869$ 300,498$ 29,844$ 4,773$
Revenue Bonds Notes Payable
Annual debt service requirements of component unit activities to maturity are as follows:
Fiscal YearEnding June 30, Principal Interest2016 460$ 591$ 2017 480 572 2018 500 551 2019 520 529 2020 545 505 2021 - 2025 3,115 2,109 2026 - 2030 3,965 1,236 2031 - 2035 2,885 221 Subtotals 12,470 6,314
Less: Issuance discounts (89) -
Totals 12,381$ 6,314$
Certificates of Participation
Derivative Instrument - Interest Rate Swap
Objective of the interest rate swap. The Sacramento City Financing Authority (the “Authority”) entered into an interest-rate swap in 2007 in connection with remarketing of its 1997 Lease Revenue Bonds (Arco Arena Acquisition) variable-rate bonds (the “Bonds”). In effect, the swap changed the Bonds variable rate to a synthetic fixed rate of 5.607% through the end of the swap agreement’s term, thereby hedging the Authority’s interest-rate risk and lowering the Authority’s borrowing cost compared to the cost of issuing traditional fixed-rate bonds. As of June 30, 2015, the amount of outstanding Bonds was $59,790. The interest and principal payments on the Bonds are insured.
80
City of Sacramento Notes to the Financial Statements For the Fiscal Year Ended June 30, 2015 (dollar amounts expressed in thousands)
NOTE 7 – LONG-TERM LIABILITIES (Continued)
Derivative Instrument - Interest Rate Swap (Continued)
Terms. The Bonds mature on July 15, 2027; are subject to remarketing on July 19, 2017; and carry an interest rate equal to 3-month London Interbank Offered Rate (“LIBOR”) plus 0.25% (total rate not to exceed 14%), payable quarterly, until July 19, 2017. The swap was entered at the same time the Bonds were remarketed in July 2007. The swap agreement terminates on July 19, 2017, and has a notional amount as of June 30, 2015, of $59,790. The notional amount of the swap and the par amount of the Bonds each decline according to the same schedule through 2017. Under the swap, the Authority pays the swap provider a fixed interest payment of 5.607% and receives a variable-interest payment of LIBOR plus 0.25% (total rate not to exceed 14%). The Authority’s payments to the swap provider are insured.
Fair value. As of June 30, 2015, the swap had a negative value to the Authority of $5,727, which reflects the decline in interest rates since 2007. (Because the interest rates on the Bonds adjust as LIBOR adjusts, the Bonds do not have a corresponding value increase.) The swap’s value was estimated using the zero-coupon method, which calculates the future net-settlement payments required by the swap, assuming that the current forward rates implied by the yield curve correctly anticipate future spot-interest rates. These payments are then discounted using the spot rates implied by the current yield curve for hypothetical zero-coupon bonds due on the date of each future net settlement on the swap.
Provider credit risk. The value of the swap to the Authority depends on the “provider credit risk,” which is the swap provider’s ability to meet its payment obligations under the swap. Often this risk is addressed by requiring the swap provider to enter into a “collateral agreement” if its credit rating falls below specified levels. Such an agreement provides for the collateralization of the swap provider’s obligations under the swap, as measured by the estimated “settlement amount” if the swap is terminated. But when the Authority entered into this swap, the swap provider, Goldman Sachs Capital Markets, L.P., was not rated by credit rating agencies, so a rated affiliate of the swap provider, The Goldman Sachs Group, Inc., provided credit support. Goldman Sachs Capital Markets, L.P. was subsequently replaced by a rated swap provider, Goldman Sachs Bank USA. The swap agreementrequires the swap provider to enter into a collateral agreement if the credit support provider is rated A3 or lowerby Moody’s Investor Service or A- or lower by Standard & Poor’s. As of June 30, 2015, the swap provider wasrated A1 by Moody’s Investors Services and A by Standard & Poor’s, the credit support provider was rated A3 byMoody’s Investors Service and A- by Standard & Poor’s, and the swap provider and the Authority had notentered into a collateral agreement.
Basis risk. The swap agreement provides that the payment received by the Authority must be at LIBOR plus 0.25% (total rate not to exceed 14%), which is identical to the interest rate on the Bonds. This mitigates the Authority’s exposure to basis risk.
Termination risk. Under certain circumstances, either the swap provider or the Authority may terminate the swap. If the swap is terminated, then the Authority would no longer pay a synthetic fixed-interest rate on the Bonds but would instead pay the variable rate. And if, at the time of termination, the swap has a negative value, then the Authority would be liable to the swap provider for a payment equal to the swap’s value.
Rollover Risk. The Authority is exposed to rollover risk on the swap because the maturity date of the swap agreement is July 2017 whereas the Bonds mature in July 2027.
81
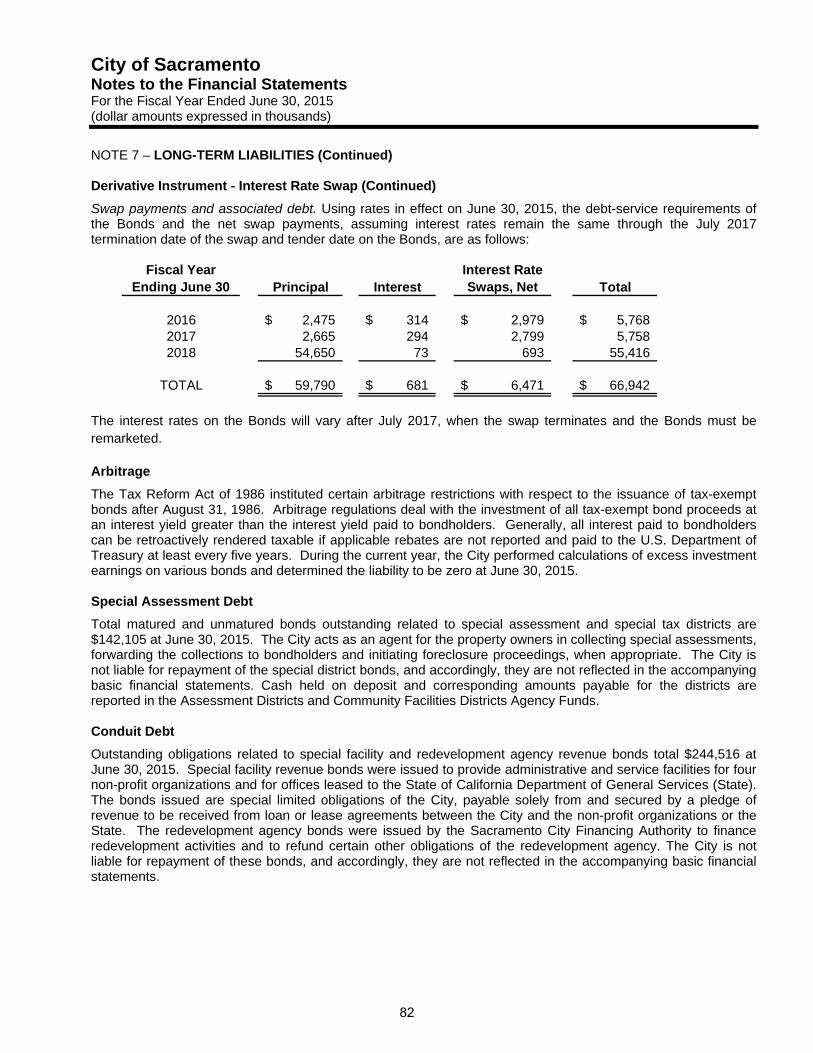
City of Sacramento Notes to the Financial Statements For the Fiscal Year Ended June 30, 2015 (dollar amounts expressed in thousands)
NOTE 7 – LONG-TERM LIABILITIES (Continued)
Derivative Instrument - Interest Rate Swap (Continued)
Swap payments and associated debt. Using rates in effect on June 30, 2015, the debt-service requirements of the Bonds and the net swap payments, assuming interest rates remain the same through the July 2017 termination date of the swap and tender date on the Bonds, are as follows:
Fiscal YearEnding June 30 Principal Interest
Interest RateSwaps, Net Total
2016 2,475$ 314$ 2,979$ 5,768$ 2017 2,665 294 2,799 5,758 2018 54,650 73 693 55,416
TOTAL 59,790$ 681$ 6,471$ 66,942$
The interest rates on the Bonds will vary after July 2017, when the swap terminates and the Bonds must be remarketed.
Arbitrage
The Tax Reform Act of 1986 instituted certain arbitrage restrictions with respect to the issuance of tax-exempt bonds after August 31, 1986. Arbitrage regulations deal with the investment of all tax-exempt bond proceeds at an interest yield greater than the interest yield paid to bondholders. Generally, all interest paid to bondholders can be retroactively rendered taxable if applicable rebates are not reported and paid to the U.S. Department of Treasury at least every five years. During the current year, the City performed calculations of excess investment earnings on various bonds and determined the liability to be zero at June 30, 2015.
Special Assessment Debt
Total matured and unmatured bonds outstanding related to special assessment and special tax districts are $142,105 at June 30, 2015. The City acts as an agent for the property owners in collecting special assessments, forwarding the collections to bondholders and initiating foreclosure proceedings, when appropriate. The City is not liable for repayment of the special district bonds, and accordingly, they are not reflected in the accompanying basic financial statements. Cash held on deposit and corresponding amounts payable for the districts are reported in the Assessment Districts and Community Facilities Districts Agency Funds.
Conduit Debt
Outstanding obligations related to special facility and redevelopment agency revenue bonds total $244,516 at June 30, 2015. Special facility revenue bonds were issued to provide administrative and service facilities for four non-profit organizations and for offices leased to the State of California Department of General Services (State). The bonds issued are special limited obligations of the City, payable solely from and secured by a pledge of revenue to be received from loan or lease agreements between the City and the non-profit organizations or the State. The redevelopment agency bonds were issued by the Sacramento City Financing Authority to finance redevelopment activities and to refund certain other obligations of the redevelopment agency. The City is not liable for repayment of these bonds, and accordingly, they are not reflected in the accompanying basic financial statements.
82
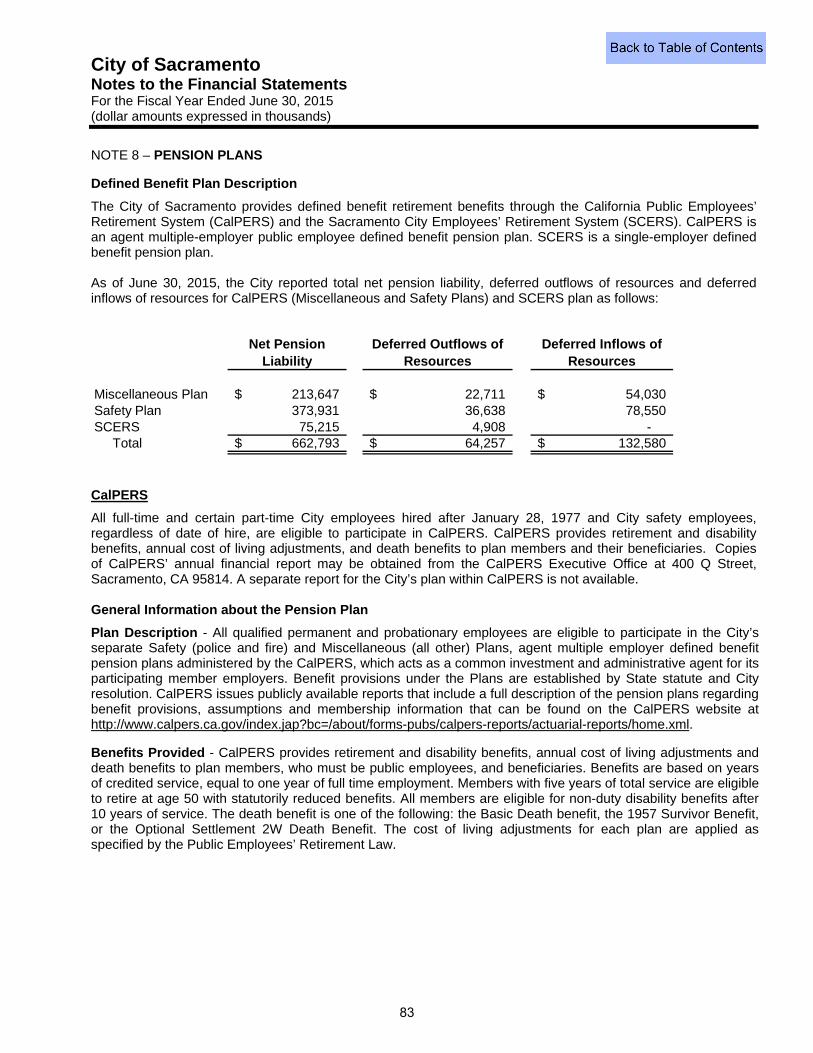
City of Sacramento Notes to the Financial Statements For the Fiscal Year Ended June 30, 2015 (dollar amounts expressed in thousands)
NOTE 8 – PENSION PLANS
Defined Benefit Plan Description
The City of Sacramento provides defined benefit retirement benefits through the California Public Employees’ Retirement System (CalPERS) and the Sacramento City Employees’ Retirement System (SCERS). CalPERS is an agent multiple-employer public employee defined benefit pension plan. SCERS is a single-employer defined benefit pension plan.
As of June 30, 2015, the City reported total net pension liability, deferred outflows of resources and deferred inflows of resources for CalPERS (Miscellaneous and Safety Plans) and SCERS plan as follows:
Net Pension Liability
Deferred Outflows of Resources
Deferred Inflows of Resources
Miscellaneous Plan 213,647$ 22,711$ 54,030$ Safety Plan 373,931 36,638 78,550 SCERS 75,215 4,908 - Total 662,793$ 64,257$ 132,580$
CalPERS
All full-time and certain part-time City employees hired after January 28, 1977 and City safety employees, regardless of date of hire, are eligible to participate in CalPERS. CalPERS provides retirement and disability benefits, annual cost of living adjustments, and death benefits to plan members and their beneficiaries. Copies of CalPERS’ annual financial report may be obtained from the CalPERS Executive Office at 400 Q Street, Sacramento, CA 95814. A separate report for the City’s plan within CalPERS is not available.
General Information about the Pension Plan
Plan Description - All qualified permanent and probationary employees are eligible to participate in the City’s separate Safety (police and fire) and Miscellaneous (all other) Plans, agent multiple employer defined benefit pension plans administered by the CalPERS, which acts as a common investment and administrative agent for its participating member employers. Benefit provisions under the Plans are established by State statute and City resolution. CalPERS issues publicly available reports that include a full description of the pension plans regarding benefit provisions, assumptions and membership information that can be found on the CalPERS website at http://www.calpers.ca.gov/index.jap?bc=/about/forms-pubs/calpers-reports/actuarial-reports/home.xml.
Benefits Provided - CalPERS provides retirement and disability benefits, annual cost of living adjustments and death benefits to plan members, who must be public employees, and beneficiaries. Benefits are based on years of credited service, equal to one year of full time employment. Members with five years of total service are eligible to retire at age 50 with statutorily reduced benefits. All members are eligible for non-duty disability benefits after 10 years of service. The death benefit is one of the following: the Basic Death benefit, the 1957 Survivor Benefit, or the Optional Settlement 2W Death Benefit. The cost of living adjustments for each plan are applied as specified by the Public Employees’ Retirement Law.
83
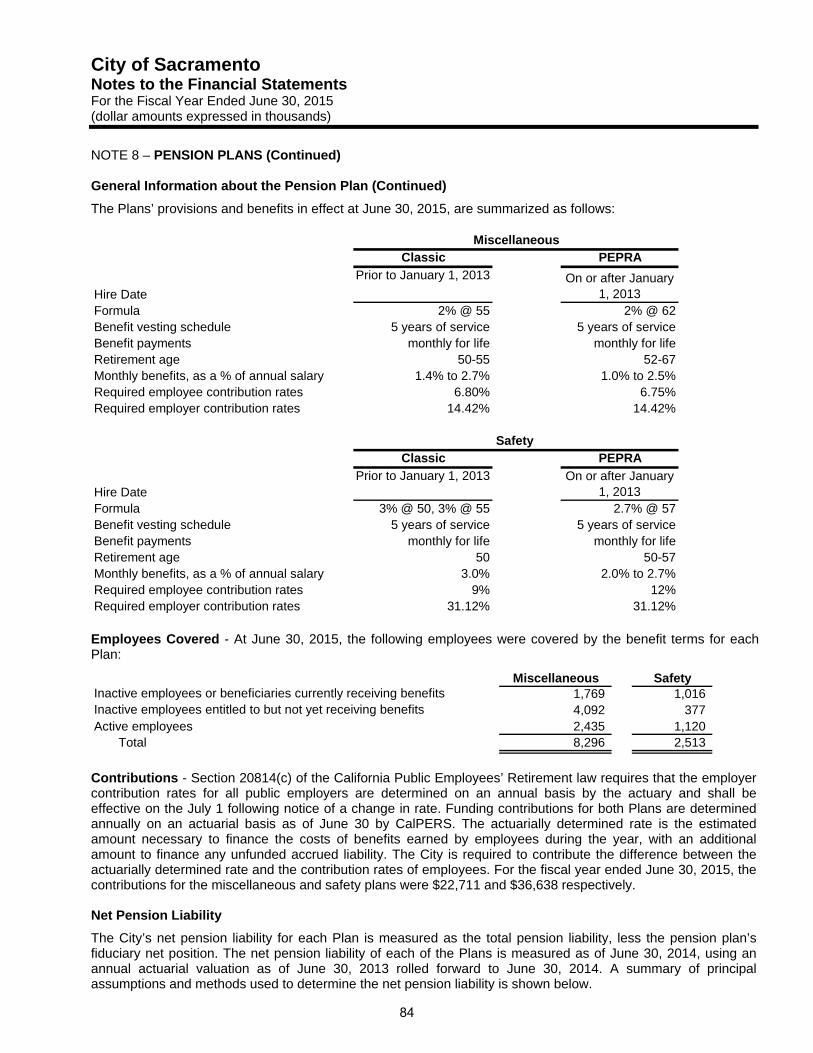
City of Sacramento Notes to the Financial Statements For the Fiscal Year Ended June 30, 2015 (dollar amounts expressed in thousands)
NOTE 8 – PENSION PLANS (Continued)
General Information about the Pension Plan (Continued)
The Plans’ provisions and benefits in effect at June 30, 2015, are summarized as follows:
Classic PEPRA
Hire Date
Prior to January 1, 2013 On or after January 1, 2013
Formula 2% @ 55 2% @ 62Benefit vesting schedule 5 years of service 5 years of serviceBenefit payments monthly for life monthly for lifeRetirement age 50-55 52-67Monthly benefits, as a % of annual salary 1.4% to 2.7% 1.0% to 2.5%Required employee contribution rates 6.80% 6.75%Required employer contribution rates 14.42% 14.42%
Classic PEPRA
Hire DatePrior to January 1, 2013 On or after January
1, 2013Formula 3% @ 50, 3% @ 55 2.7% @ 57Benefit vesting schedule 5 years of service 5 years of serviceBenefit payments monthly for life monthly for lifeRetirement age 50 50-57Monthly benefits, as a % of annual salary 3.0% 2.0% to 2.7%Required employee contribution rates 9% 12%Required employer contribution rates 31.12% 31.12%
Miscellaneous
Safety
Employees Covered - At June 30, 2015, the following employees were covered by the benefit terms for each Plan:
Miscellaneous SafetyInactive employees or beneficiaries currently receiving benefits 1,769 1,016 Inactive employees entitled to but not yet receiving benefits 4,092 377 Active employees 2,435 1,120
Total 8,296 2,513
Contributions - Section 20814(c) of the California Public Employees’ Retirement law requires that the employer contribution rates for all public employers are determined on an annual basis by the actuary and shall be effective on the July 1 following notice of a change in rate. Funding contributions for both Plans are determined annually on an actuarial basis as of June 30 by CalPERS. The actuarially determined rate is the estimated amount necessary to finance the costs of benefits earned by employees during the year, with an additional amount to finance any unfunded accrued liability. The City is required to contribute the difference between the actuarially determined rate and the contribution rates of employees. For the fiscal year ended June 30, 2015, the contributions for the miscellaneous and safety plans were $22,711 and $36,638 respectively.
Net Pension Liability
The City’s net pension liability for each Plan is measured as the total pension liability, less the pension plan’s fiduciary net position. The net pension liability of each of the Plans is measured as of June 30, 2014, using an annual actuarial valuation as of June 30, 2013 rolled forward to June 30, 2014. A summary of principal assumptions and methods used to determine the net pension liability is shown below.
84
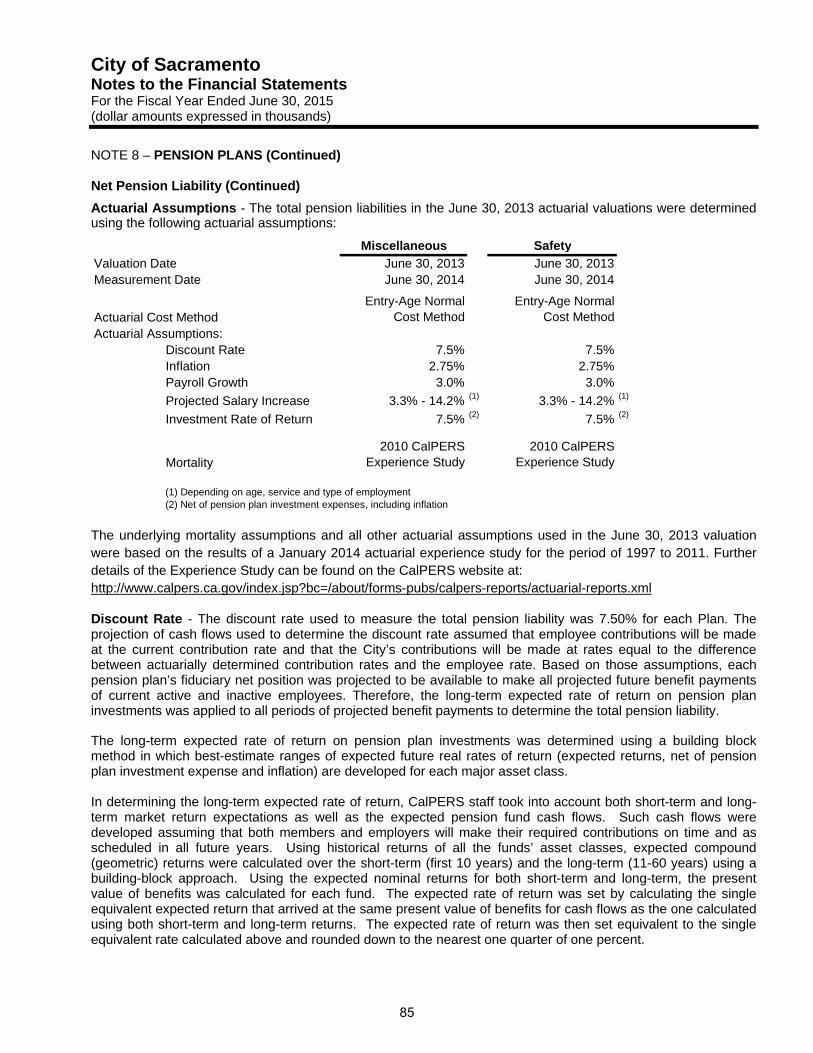
City of Sacramento Notes to the Financial Statements For the Fiscal Year Ended June 30, 2015 (dollar amounts expressed in thousands)
NOTE 8 – PENSION PLANS (Continued)
Net Pension Liability (Continued)
Actuarial Assumptions - The total pension liabilities in the June 30, 2013 actuarial valuations were determined using the following actuarial assumptions:
Miscellaneous Safety
Valuation Date June 30, 2013 June 30, 2013Measurement Date June 30, 2014 June 30, 2014
Actuarial Cost MethodEntry-Age Normal
Cost MethodEntry-Age Normal
Cost MethodActuarial Assumptions:
Discount Rate 7.5% 7.5%Inflation 2.75% 2.75%Payroll Growth 3.0% 3.0%
Projected Salary Increase 3.3% - 14.2% (1) 3.3% - 14.2% (1)
Investment Rate of Return 7.5% (2) 7.5% (2)
Mortality2010 CalPERS
Experience Study2010 CalPERS
Experience Study
(1) Depending on age, service and type of employment(2) Net of pension plan investment expenses, including inflation
The underlying mortality assumptions and all other actuarial assumptions used in the June 30, 2013 valuation were based on the results of a January 2014 actuarial experience study for the period of 1997 to 2011. Further details of the Experience Study can be found on the CalPERS website at: http://www.calpers.ca.gov/index.jsp?bc=/about/forms-pubs/calpers-reports/actuarial-reports.xml
Discount Rate - The discount rate used to measure the total pension liability was 7.50% for each Plan. The projection of cash flows used to determine the discount rate assumed that employee contributions will be made at the current contribution rate and that the City’s contributions will be made at rates equal to the difference between actuarially determined contribution rates and the employee rate. Based on those assumptions, each pension plan’s fiduciary net position was projected to be available to make all projected future benefit payments of current active and inactive employees. Therefore, the long-term expected rate of return on pension plan investments was applied to all periods of projected benefit payments to determine the total pension liability.
The long-term expected rate of return on pension plan investments was determined using a building block method in which best-estimate ranges of expected future real rates of return (expected returns, net of pension plan investment expense and inflation) are developed for each major asset class.
In determining the long-term expected rate of return, CalPERS staff took into account both short-term and long-term market return expectations as well as the expected pension fund cash flows. Such cash flows were developed assuming that both members and employers will make their required contributions on time and as scheduled in all future years. Using historical returns of all the funds’ asset classes, expected compound (geometric) returns were calculated over the short-term (first 10 years) and the long-term (11-60 years) using a building-block approach. Using the expected nominal returns for both short-term and long-term, the present value of benefits was calculated for each fund. The expected rate of return was set by calculating the single equivalent expected return that arrived at the same present value of benefits for cash flows as the one calculated using both short-term and long-term returns. The expected rate of return was then set equivalent to the single equivalent rate calculated above and rounded down to the nearest one quarter of one percent.
85
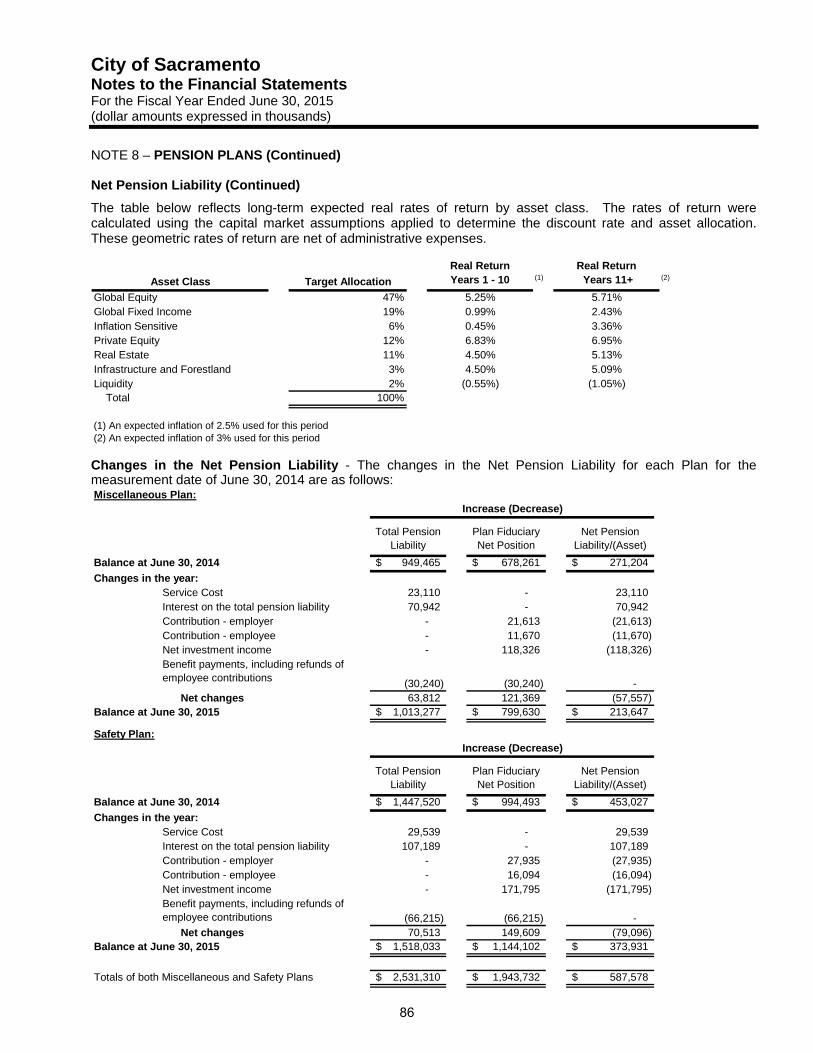
City of Sacramento Notes to the Financial Statements For the Fiscal Year Ended June 30, 2015 (dollar amounts expressed in thousands)
NOTE 8 – PENSION PLANS (Continued)
Net Pension Liability (Continued)
The table below reflects long-term expected real rates of return by asset class. The rates of return were calculated using the capital market assumptions applied to determine the discount rate and asset allocation. These geometric rates of return are net of administrative expenses.
Asset Class Target Allocation
Real ReturnYears 1 - 10 (1)
Real Return Years 11+ (2)
Global Equity 47% 5.25% 5.71%Global Fixed Income 19% 0.99% 2.43%Inflation Sensitive 6% 0.45% 3.36%Private Equity 12% 6.83% 6.95%Real Estate 11% 4.50% 5.13%Infrastructure and Forestland 3% 4.50% 5.09%Liquidity 2% (0.55%) (1.05%) Total 100%
(1) An expected inflation of 2.5% used for this period(2) An expected inflation of 3% used for this period
Changes in the Net Pension Liability - The changes in the Net Pension Liability for each Plan for the measurement date of June 30, 2014 are as follows: Miscellaneous Plan:
Total Pension Liability
Plan Fiduciary Net Position
Net Pension Liability/(Asset)
Balance at June 30, 2014 949,465$ 678,261$ 271,204$
Changes in the year:Service Cost 23,110 - 23,110 Interest on the total pension liability 70,942 - 70,942 Contribution - employer - 21,613 (21,613) Contribution - employee - 11,670 (11,670) Net investment income - 118,326 (118,326)
(30,240) (30,240) - Net changes 63,812 121,369 (57,557)
Balance at June 30, 2015 1,013,277$ 799,630$ 213,647$
Safety Plan:
Total Pension Liability
Plan Fiduciary Net Position
Net Pension Liability/(Asset)
Balance at June 30, 2014 1,447,520$ 994,493$ 453,027$
Changes in the year:Service Cost 29,539 - 29,539 Interest on the total pension liability 107,189 - 107,189Contribution - employer - 27,935 (27,935) Contribution - employee - 16,094 (16,094) Net investment income - 171,795 (171,795)
(66,215) (66,215) - Net changes 70,513 149,609 (79,096)
Balance at June 30, 2015 1,518,033$ 1,144,102$ 373,931$
Totals of both Miscellaneous and Safety Plans 2,531,310$ 1,943,732$ 587,578$
Increase (Decrease)
Benefit payments, including refunds of employee contributions
Increase (Decrease)
Benefit payments, including refunds of employee contributions
86
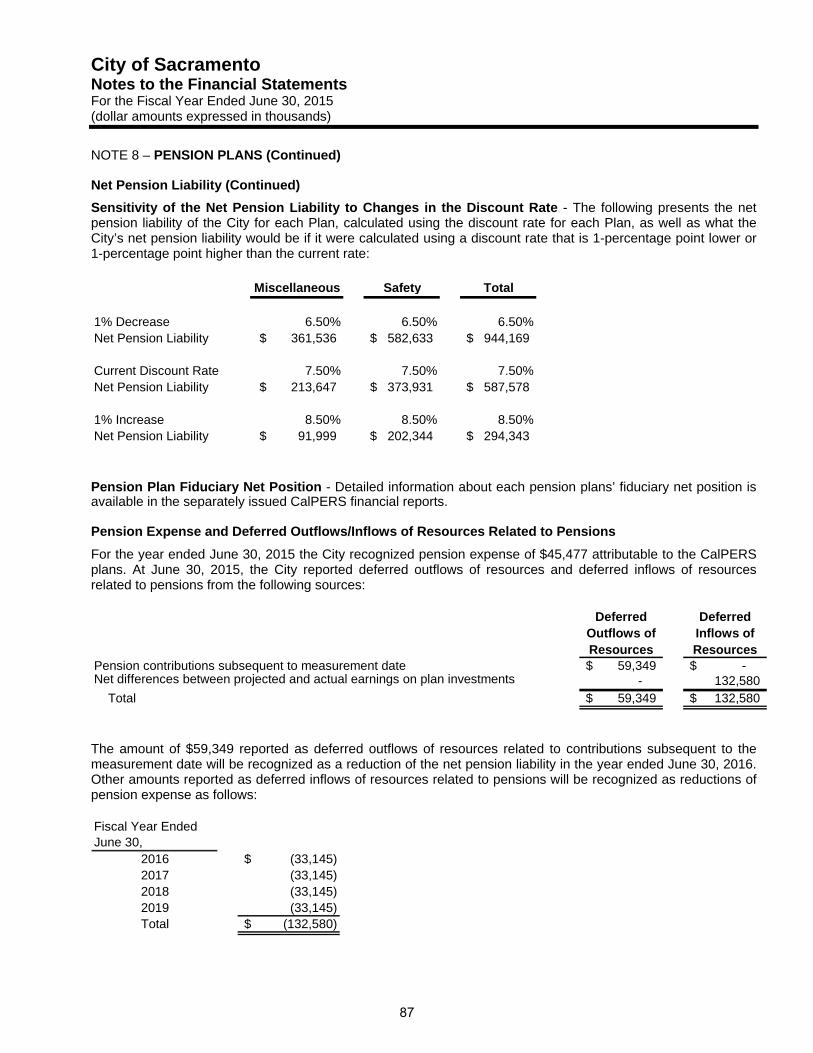
City of Sacramento Notes to the Financial Statements For the Fiscal Year Ended June 30, 2015 (dollar amounts expressed in thousands)
NOTE 8 – PENSION PLANS (Continued)
Net Pension Liability (Continued)
Sensitivity of the Net Pension Liability to Changes in the Discount Rate - The following presents the net pension liability of the City for each Plan, calculated using the discount rate for each Plan, as well as what the City’s net pension liability would be if it were calculated using a discount rate that is 1-percentage point lower or 1-percentage point higher than the current rate:
Miscellaneous Safety Total
1% Decrease 6.50% 6.50% 6.50%Net Pension Liability 361,536$ 582,633$ 944,169$
Current Discount Rate 7.50% 7.50% 7.50%Net Pension Liability 213,647$ 373,931$ 587,578$
1% Increase 8.50% 8.50% 8.50%Net Pension Liability 91,999$ 202,344$ 294,343$
Pension Plan Fiduciary Net Position - Detailed information about each pension plans’ fiduciary net position is available in the separately issued CalPERS financial reports.
Pension Expense and Deferred Outflows/Inflows of Resources Related to Pensions
For the year ended June 30, 2015 the City recognized pension expense of $45,477 attributable to the CalPERS plans. At June 30, 2015, the City reported deferred outflows of resources and deferred inflows of resources related to pensions from the following sources:
Deferred Outflows of Resources
Deferred Inflows of Resources
Pension contributions subsequent to measurement date 59,349$ -$ Net differences between projected and actual earnings on plan investments - 132,580 Total 59,349$ 132,580$
The amount of $59,349 reported as deferred outflows of resources related to contributions subsequent to the measurement date will be recognized as a reduction of the net pension liability in the year ended June 30, 2016. Other amounts reported as deferred inflows of resources related to pensions will be recognized as reductions of pension expense as follows:
Fiscal Year Ended June 30,
2016 (33,145)$ 2017 (33,145) 2018 (33,145) 2019 (33,145) Total (132,580)$
87
City of Sacramento Notes to the Financial Statements For the Fiscal Year Ended June 30, 2015 (dollar amounts expressed in thousands)
NOTE 8 – PENSION PLANS (Continued)
SCERS
The City reports SCERS as a pension trust fund. SCERS issues a publicly available financial report that includes financial statements and required supplementary information. The financial report may be obtained by writing the City of Sacramento Department of Finance, 915 I Street, 4th Floor, Sacramento, CA 95814. The following is a summary of significant accounting policies:
Basis of Accounting – SCERS’ financial statements are prepared using the accrual basis of accounting. Member contributions are recognized in the period in which the contributions are due. Benefits and refunds are recognized when due and payable in accordance with the terms of the plan.
Method Used to Value Investments – Investments are reported at fair value, except mortgage loans which are recorded at amortized cost. Securities traded on a national or international exchange are valued at the last reported sales price at current exchange rates.
General Information about the Pension Plan
Plan Description - The SCERS is a closed defined benefit pension plan. It has not accepted new members since January 28, 1977. All full-time, non-safety employees hired before January 29, 1977, are eligible to participate in SCERS.
Benefits Provided - SCERS provides retirement and disability benefits, annual cost of living adjustments, and death benefits to plan members and beneficiaries based on the plan that they belong. SCERS have the following plans:
Charter Section 399 Plan - This defined benefit plan was established effective January 1, 1977 to provide retirement, disability and death benefits. Active members contribute at a rate based upon entry age and type of employment. The benefits for this plan are based on the average monthly compensation times years of service times benefit factor, but no larger than 75% of final average earnings. Employees may retire at age 70, or age 50 and 5 years of service.
Equal Shares Plan - This defined benefit plan was established July 1, 1970 to provide retirement, disability and death benefits to all City employees electing coverage at that date and to all employees who were hired from that date through January 1, 1977. The benefits for this plan are based on the average monthly compensation times years of service times benefit factor, but no larger than 75% of final average earnings. Employees may retire at age 70, or age 50 and 5 years of service.
Charter Section 175 Plan – This defined benefit plan was established in 1953 to provide for retirement, disability and death benefits at a lower amount than the successor Equal Shares Plan. The benefits for this plan are based on the average monthly compensation times years of service times benefit factor. For retirement after age 65 with 20 years of service, benefit is minimum of $60 per month. Employees may retire at age 70, or age 55 and 20 years of service.
An employee who leaves the City service may withdraw his or her contributions, plus any accumulated interest, under all the retirement and disability benefit plans described above.
88
City of Sacramento Notes to the Financial Statements For the Fiscal Year Ended June 30, 2015 (dollar amounts expressed in thousands)
NOTE 8 – PENSION PLANS (Continued)
General Information about the Pension Plan (Continued)
Benefit factors at sample ages for the benefit plans described above are following:
Retirement Age Section 175Section 399 and
Equal Share50 N/A 1.10%55 1.10% 1.75%60 1.67% 2.40%65 2.44% 2.40%
Employees Covered - At June 30, 2015 the following employees were covered by the benefit terms for each plan:
Section 399
Equal Shares
Section 175 Total
Inactive members or beneficiaries receiving benefits 997 74 70 1,141 Inactive members entitled to but not yet receiving benefits 12 - 2 14 Active plan members 19 - - 19 Total plan members 1,028 74 72 1,174
Cost-of-living Adjustment - This adjustment, established in 1969, provides for annual retirement benefit increases of up to 3% of normal benefits based on a corresponding rise in the consumer price index. Cost-of-living benefits are payable to retirees and beneficiaries of all of the above plans after one year of retirement. The cost-of-living adjustment was 3.0% for fiscal year 2015. Members contribute to this adjustment at a rate of 1% of their normal retirement contributions. The City is required to fund all costs in excess of members’ contributions and investment earnings.
Social Security Reductions - For members participating in Social Security, their benefit will be reduced at the later of age 62 or actual retirement age. The amount of the reduction is one half of the primary insurance amount (PIA) from Social Security, multiplied by the ratio of the sum of salary earned from the City to the sum of salary from all sources used in the calculation of the Social Security amount. The member’s benefit under the System plus the amount received from Social Security cannot be less than the member’s benefit under the System calculated with no reductions as of this retirement age. The City applies this offset to service retirees, not to disabled retirees.
Contributions - The City Charter grants the authority to establish and amend the contribution requirements of the City and active employees to the SCERS Board. The Board establishes rates based on actuarially determined rate recommended by an independent actuary. The actuarially determined rate is the estimated amount necessary to finance the costs of benefits earned by employees during the year, with an additional amount to finance any unfunded accrual liability. The City is required to contribute the difference between the actuarially determined rate and the contribution rate of employees. For the year ended June 30, 2015, the average active employee contribution rate was 5.76 percent of annual pay, and the City’s average contribution rate was 2.9 percent of annual payroll. For the fiscal year ended June 30, 2015, the contributions for the SCERS plan were $9,183.
89
City of Sacramento Notes to the Financial Statements For the Fiscal Year Ended June 30, 2015 (dollar amounts expressed in thousands)
NOTE 8 – PENSION PLANS (Continued)
Net Pension Liability
The City’s net pension liability for SCERS was measured as of June 30, 2015 and the total pension liability used to calculate the net pension liability was determined by an actuarial valuation as of that date.
Actuarial Assumption - The total pension liability in the June 30, 2015 actuarial valuation was determined using the following actuarial assumptions applied to all periods included in the measurement:
Inflation 3.0%Salary increase 3.0% CPI Plus 0.5% merit, averageInvestment rate of return 6.5% percent, net of pension plan investment
expense, including inflation
Mortality rates for service retirements and beneficiaries were based on the CalPERS 1997-2007 Mortality Table projected for future mortality improvement utilizing Society of Actuaries Scale AA. Mortality rates for disability retirements were based on the CalPERS 1997-2007 Mortality Table for non-work Disabled Retirees for Miscellaneous and CalPERS 1997-2007 Mortality Table for work-related Disabled Retirees for Safety. Both tables were projected for future mortality improvement utilizing Society of Actuaries Scale AA.
The actuarial assumption used in the June 30, 2015 valuation were based on the results from the CalPERS 1997-2007 Experience Study, projected with fully generational Scale AA.
The long-term expected rate of return on pension plan investments was determined using a building block method in which best-estimate ranges of expected future real rates of return (expected returns, net of pension plan investment expense and inflation) are developed for each major asset class. These ranges are combined to produce the long-term expected rate of return by weighting the expected future real rates of return by the target asset allocation percentage and by adding expected inflation. The target allocation and best estimates of arithmetic real rates of return for each major asset class are summarized in the following table:
Asset Class Target Allocation
Long-Term Expected Real Rate of Return
Fixed Income 40% 1.55%Large Cap Growth 35% 5.35%Equity Income 15% 5.35%International 10% 5.35% Total 100%
An expected inflation of 3% was used for this period.
Discount Rate – The discount rate used to measure the total pension liability was 6.5 percent. The projection of cash flows used to determine the discount rate assumed that employee contributions will be made at the current contribution rate and that City contributions will be made at rates equal to the difference between actuarially determined contributions rates and the employee rate. Based on those assumptions, the pension plan’s fiduciary net position was projected to be available to make all projected future benefit payments of current active and inactive employees. Therefore, the long-term expected rate of return on pension plan investments was applied to all periods of projected benefit payments to determine the total pension liability.
90
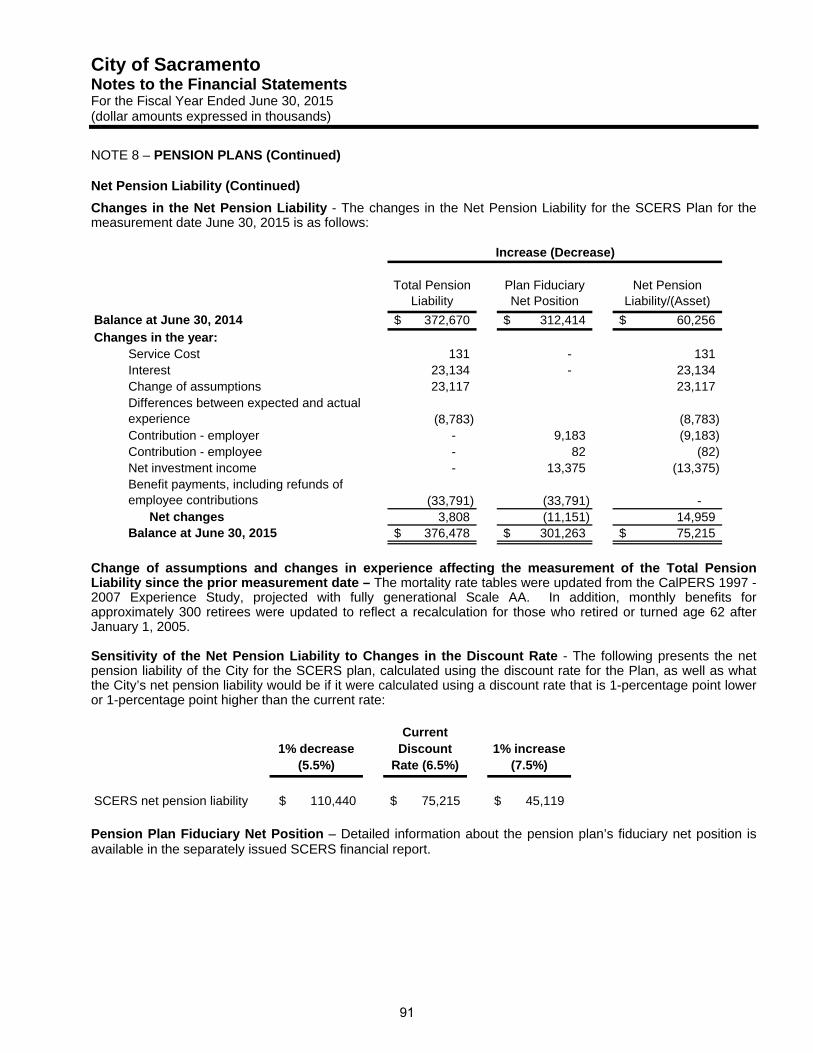
City of Sacramento Notes to the Financial Statements For the Fiscal Year Ended June 30, 2015 (dollar amounts expressed in thousands)
NOTE 8 – PENSION PLANS (Continued)
Net Pension Liability (Continued)
Changes in the Net Pension Liability - The changes in the Net Pension Liability for the SCERS Plan for the measurement date June 30, 2015 is as follows:
Total Pension Liability
Plan Fiduciary Net Position
Net Pension Liability/(Asset)
Balance at June 30, 2014 372,670$ 312,414$ 60,256$ Changes in the year:
Service Cost 131 - 131 Interest 23,134 - 23,134 Change of assumptions 23,117 23,117 Differences between expected and actual experience (8,783) (8,783) Contribution - employer - 9,183 (9,183) Contribution - employee - 82 (82) Net investment income - 13,375 (13,375) Benefit payments, including refunds of employee contributions (33,791) (33,791) - Net changes 3,808 (11,151) 14,959 Balance at June 30, 2015 376,478$ 301,263$ 75,215$
Increase (Decrease)
Change of assumptions and changes in experience affecting the measurement of the Total Pension Liability since the prior measurement date – The mortality rate tables were updated from the CalPERS 1997 -2007 Experience Study, projected with fully generational Scale AA. In addition, monthly benefits for approximately 300 retirees were updated to reflect a recalculation for those who retired or turned age 62 after January 1, 2005.
Sensitivity of the Net Pension Liability to Changes in the Discount Rate - The following presents the net pension liability of the City for the SCERS plan, calculated using the discount rate for the Plan, as well as what the City’s net pension liability would be if it were calculated using a discount rate that is 1-percentage point lower or 1-percentage point higher than the current rate:
1% decrease (5.5%)
Current Discount
Rate (6.5%)1% increase
(7.5%)
SCERS net pension liability 110,440$ 75,215$ 45,119$
Pension Plan Fiduciary Net Position – Detailed information about the pension plan’s fiduciary net position is available in the separately issued SCERS financial report.
91
City of Sacramento Notes to the Financial Statements For the Fiscal Year Ended June 30, 2015 (dollar amounts expressed in thousands)
NOTE 8 – PENSION PLANS (Continued)
Pension Expense and Deferred Outflows/Inflows of Resources Related to Pensions
For the year ended June 30, 2015, the City recognized pension expense of $19,235 attributable to the SCERS plans. At June 30, 2015, the City reported deferred outflows of resources related to pensions from the following sources:
Deferred Outflows of Resources
Net differences between projected and actual earnings on plan investments 4,908$ Total 4,908$
Amounts reported as deferred outflows of resources related to pensions will be recognized as pension expense as follows:
Fiscal Year Ended June 30,
2016 1,227$ 2017 1,227 2018 1,227 2019 1,227 Total 4,908$
Defined Contribution Plan
The City also provides defined contribution retirement benefits through the City’s 401(a) Money Purchase Plan (the 401(a)). The 401(a) is administered by the International City Management Association Retirement Corporation. 401(a) provisions and contribution requirements are established and may be amended by City Council. Unrepresented exempt and certain represented employees may elect to participate. Participating employees of the aforementioned groups are required to contribute 5% and 2%, and the City contributes 4% and 2%, respectively, of covered salary. For the year ended June 30, 2015, employees contributed $3,102 and the City contributed $2,622 to the 401(a).
NOTE 9 – POST-EMPLOYMENT HEALTH AND DENTAL CARE BENEFITS
Plan Description
The City provides contributions for post-employment medical, dental and vision benefits to employees who retire directly from the City and their dependents through a single-employer defined benefit OPEB plan (the plan). Participants have the choice of enrolling in one of several health plans, one of two dental plans and one vision plan. To be eligible for the City paid benefits, the employee must retire with a minimum of ten full years of active service and be 55 or 50 years of age for miscellaneous and safety employees, respectively. Participants with a minimum of twenty years of service are eligible for 100% of the maximum benefit. Participants with more than fifteen years but less than twenty years of service are eligible for 75% of the maximum benefit. Participants with more than ten years but less than fifteen years of service are eligible for 50% of the maximum benefit. The post-retirement health care and dental care employer contributions range from $0 and $774 per month per participant, which covers between 0% and 100% of the benefit cost, depending on the choice of plan and number of dependents. The post employment health, dental and vision care contributions are defined by labor agreements and resolutions approved by the City Council. The City does not issue a separate stand-alone financial report for its OPEB plan.
92
City of Sacramento Notes to the Financial Statements For the Fiscal Year Ended June 30, 2015 (dollar amounts expressed in thousands)
NOTE 9 – POST-EMPLOYMENT HEALTH AND DENTAL CARE BENEFITS (Continued)
Funding Policy
The City is currently funding the OPEB plan on a pay-as-you-go basis. However, the City Council authorized the City Manager to establish an OPEB trust fund with CalPERS in the California Employers’ Retiree Benefit Trust (CERBT) fund program. As of June 30, 2015, the City had deposited a total of $5,000 to the trust fund from the General Fund. Additional deposits may be made in the future. Separate financial statements for the CERBT may be obtained by writing to CalPERS at Lincoln Plaza North 400 Q Street, Sacramento, California 95814 or by visiting the CalPERS website at www.calpers.ca.gov.
Annual OPEB Cost and Net OPEB Obligation
The City’s annual OPEB cost is calculated based on the annual required contribution (ARC) of the City, an amount that is actuarially determined in accordance with the parameters of GASB Statement No. 45. The ARC represents a level of funding that, if paid on an ongoing basis, is projected to cover the normal cost each year and amortize any unfunded actuarial liabilities (or funding excess) of the plan over a period not to exceed thirty years. The current ARC rate is 16.3 percent of annual covered payroll. The following table shows the components of the City’s annual OPEB cost for the year, the amount contributed to the plan, and the changes in the City’s net OPEB obligation.
Annual required contribution (ARC) 43,383$ Interest on beginning OPEB liability 6,939 Adjustment to the ARC (9,011) Annual OPEB cost 41,311 Contributions made (13,524) Trust prefunding (1,000) Increase in net OPEB obligation 26,787 Net OPEB obligation - Beginning of year 154,197 Net OPEB obligation - End of year 180,984$
Covered payroll (active plan members) 257,498$ UAAL as a percentage of covered payroll 168.4%
The City’s annual OPEB cost, the percentage of annual OPEB cost contributed to the plan, and the net OPEB obligation for the current fiscal year and the two preceding years were as follows:
Fiscal year ended Annual OPEB Cost Contribution
Percentage ofOPEB CostContributed
Net OPEB Obligation
6/30/2013 39,379$ 12,843$ 33% 131,739$ 6/30/2014 39,930 17,473 43 154,197 6/30/2015 41,311 14,524 35 180,984
Funding Status and Progress
As of June 30, 2013, the most recent actuarial valuation date of the plan was 0% funded. The actuarial accrued liability was $433,695 and the actuarial value of assets was $0 resulting in an unfunded actuarial accrued liability (UAAL) of $433,695. The annual covered payroll was $257,498 and the ratio of the unfunded actuarial accrued liability to the annual covered payroll was 168.4%. The Schedule of Funding Progress is presented as RSI following the notes to the financial statements.
Actuarial valuations of an ongoing plan involve estimates of the value of reported amounts and assumptions about the probability of occurrence of events far into future. Examples of these estimates and assumptions include future employment trends, mortality and the health care cost trend. Amounts are determined regarding
93
City of Sacramento Notes to the Financial Statements For the Fiscal Year Ended June 30, 2015 (dollar amounts expressed in thousands)
NOTE 9 – POST-EMPLOYMENT HEALTH AND DENTAL CARE BENEFITS (Continued)
the funded status of the plan, and the annual required contribution of the employer are subject to the continual revision as actual results are compared with past expectations and new estimates are made about the future.
Actuarial Methods and Assumptions
Projections of benefits for financial reporting purposes are based on the substantive plan (the plan as understood by the employer and the plan members) and include the types of benefits provided at the time of each valuation and the historical pattern of sharing benefits costs between the employer and the plan members to that point. The actuarial methods and assumptions used include techniques that are designed to reduce the effects of short-term volatility in actuarial accrued liabilities and the actuarial value of assets, consistent with the long-term perspective of calculations.
In the June 30, 2013, actuarial valuation, the entry age normal actuarial cost method was used. The actuarial assumptions utilized a 3% inflation rate, a 4.5% discount rate and a medical trend rate of 8.2% for fiscal year 2015, reduced by decrements of 0.5% each year to an ultimate rate of 5%. The UAAL is being amortized as a level percentage of projected payrolls on an open basis. The remaining amortization period at June 30, 2013 was 23 years.
NOTE 10 – FUND EQUITY AND EXCESS OF EXPENDITURES OVER APPROPRIATIONS
At June 30, 2015, the government-wide statement of net position reported restricted net position of $190,369 in governmental activities. Of this amount, $14,330 is restricted for enabling legislation.
The Culture and Leisure Fund, a special revenue fund, had a deficit fund balance of $3,073 as of June 30, 2015. Both the Golf and Marina programs within this fund had deficit fund balances of $5,821 and $715, respectively. It is anticipated that this deficit will be funded by future operating subsidies and surpluses.
The 4th R Child Development Fund, an enterprise fund, had a deficit net positioin of $3,658 as of June 30, 2015. It is anticipated that this deficit will be funded by future operating subsidies.
For the fiscal year ended June 30, 2015, General Fund expenditures for police, general services, and parks and recreation exceeded appropriations by $2,100, $142, and $1,403 respectively and overspending was funded by revenue collected in excess of budgeted amounts.
For the fiscal year ended June 30, 2015, expenditures exceeded appropriations in the Transportation and Development special revenue funds by $75. This overspending was funded by revenue collected in excess of budgeted amounts.
94
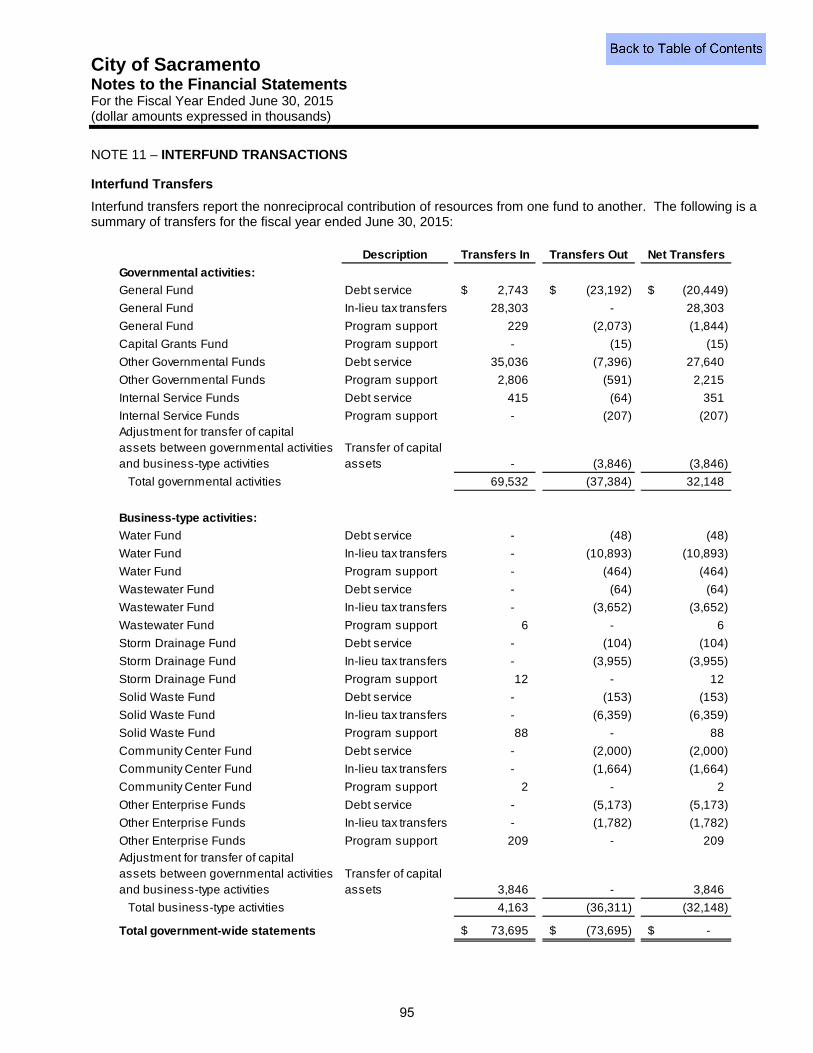
City of Sacramento Notes to the Financial Statements For the Fiscal Year Ended June 30, 2015 (dollar amounts expressed in thousands)
NOTE 11 – INTERFUND TRANSACTIONS Interfund Transfers
Interfund transfers report the nonreciprocal contribution of resources from one fund to another. The following is a summary of transfers for the fiscal year ended June 30, 2015:
Description Transfers In Transfers Out Net Transfers
Governmental activities:
General Fund Debt service 2,743$ (23,192)$ (20,449)$
General Fund In-lieu tax transfers 28,303 - 28,303
General Fund Program support 229 (2,073) (1,844)
Capital Grants Fund Program support - (15) (15)
Other Governmental Funds Debt service 35,036 (7,396) 27,640
Other Governmental Funds Program support 2,806 (591) 2,215
Internal Service Funds Debt service 415 (64) 351
Internal Service Funds Program support - (207) (207) Adjustment for transfer of capital assets between governmental activities and business-type activities
Transfer of capital assets - (3,846) (3,846)
Total governmental activities 69,532 (37,384) 32,148
Business-type activities:
Water Fund Debt service - (48) (48)
Water Fund In-lieu tax transfers - (10,893) (10,893)
Water Fund Program support - (464) (464)
Wastewater Fund Debt service - (64) (64)
Wastewater Fund In-lieu tax transfers - (3,652) (3,652)
Wastewater Fund Program support 6 - 6
Storm Drainage Fund Debt service - (104) (104)
Storm Drainage Fund In-lieu tax transfers - (3,955) (3,955)
Storm Drainage Fund Program support 12 - 12
Solid Waste Fund Debt service - (153) (153)
Solid Waste Fund In-lieu tax transfers - (6,359) (6,359)
Solid Waste Fund Program support 88 - 88
Community Center Fund Debt service - (2,000) (2,000)
Community Center Fund In-lieu tax transfers - (1,664) (1,664)
Community Center Fund Program support 2 - 2
Other Enterprise Funds Debt service - (5,173) (5,173)
Other Enterprise Funds In-lieu tax transfers - (1,782) (1,782)
Other Enterprise Funds Program support 209 - 209
Adjustment for transfer of capital assets between governmental activities and business-type activities
Transfer of capital assets 3,846 - 3,846
Total business-type activities 4,163 (36,311) (32,148)
Total government-wide statements 73,695$ (73,695)$ -$
95
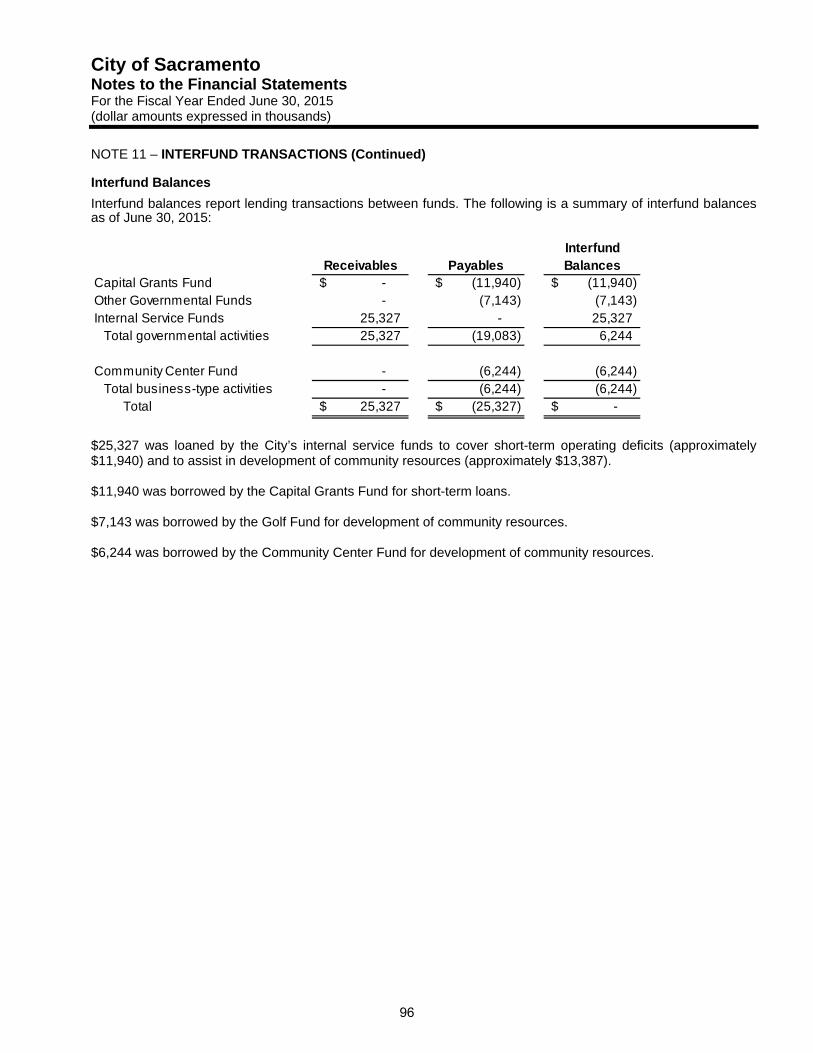
City of Sacramento Notes to the Financial Statements For the Fiscal Year Ended June 30, 2015 (dollar amounts expressed in thousands)
NOTE 11 – INTERFUND TRANSACTIONS (Continued) Interfund Balances
Interfund balances report lending transactions between funds. The following is a summary of interfund balances as of June 30, 2015:
InterfundReceivables Payables Balances
Capital Grants Fund -$ (11,940)$ (11,940)$ Other Governmental Funds - (7,143) (7,143) Internal Service Funds 25,327 - 25,327
Total governmental activities 25,327 (19,083) 6,244
Community Center Fund - (6,244) (6,244) Total business-type activities - (6,244) (6,244)
Total 25,327$ (25,327)$ -$
$25,327 was loaned by the City’s internal service funds to cover short-term operating deficits (approximately $11,940) and to assist in development of community resources (approximately $13,387). $11,940 was borrowed by the Capital Grants Fund for short-term loans. $7,143 was borrowed by the Golf Fund for development of community resources. $6,244 was borrowed by the Community Center Fund for development of community resources.
96
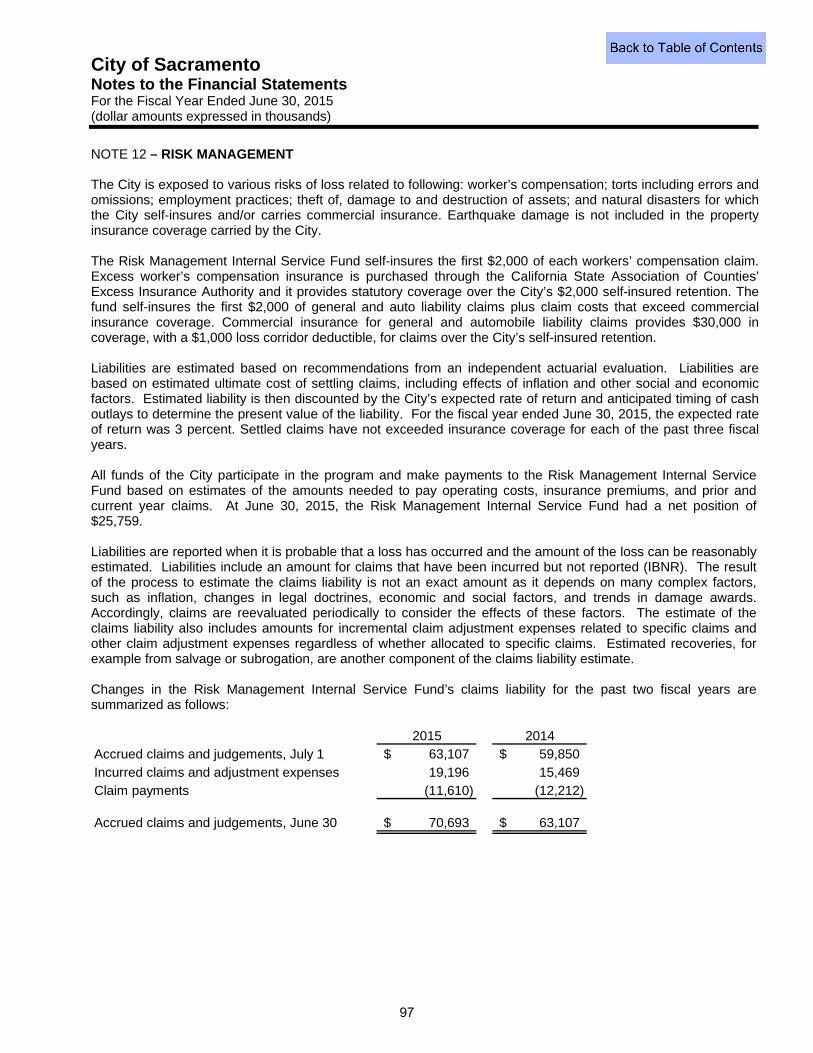
City of Sacramento Notes to the Financial Statements For the Fiscal Year Ended June 30, 2015 (dollar amounts expressed in thousands)
NOTE 12 – RISK MANAGEMENT The City is exposed to various risks of loss related to following: worker’s compensation; torts including errors and omissions; employment practices; theft of, damage to and destruction of assets; and natural disasters for which the City self-insures and/or carries commercial insurance. Earthquake damage is not included in the property insurance coverage carried by the City. The Risk Management Internal Service Fund self-insures the first $2,000 of each workers’ compensation claim. Excess worker’s compensation insurance is purchased through the California State Association of Counties’ Excess Insurance Authority and it provides statutory coverage over the City’s $2,000 self-insured retention. The fund self-insures the first $2,000 of general and auto liability claims plus claim costs that exceed commercial insurance coverage. Commercial insurance for general and automobile liability claims provides $30,000 in coverage, with a $1,000 loss corridor deductible, for claims over the City’s self-insured retention. Liabilities are estimated based on recommendations from an independent actuarial evaluation. Liabilities are based on estimated ultimate cost of settling claims, including effects of inflation and other social and economic factors. Estimated liability is then discounted by the City’s expected rate of return and anticipated timing of cash outlays to determine the present value of the liability. For the fiscal year ended June 30, 2015, the expected rate of return was 3 percent. Settled claims have not exceeded insurance coverage for each of the past three fiscal years. All funds of the City participate in the program and make payments to the Risk Management Internal Service Fund based on estimates of the amounts needed to pay operating costs, insurance premiums, and prior and current year claims. At June 30, 2015, the Risk Management Internal Service Fund had a net position of $25,759. Liabilities are reported when it is probable that a loss has occurred and the amount of the loss can be reasonably estimated. Liabilities include an amount for claims that have been incurred but not reported (IBNR). The result of the process to estimate the claims liability is not an exact amount as it depends on many complex factors, such as inflation, changes in legal doctrines, economic and social factors, and trends in damage awards. Accordingly, claims are reevaluated periodically to consider the effects of these factors. The estimate of the claims liability also includes amounts for incremental claim adjustment expenses related to specific claims and other claim adjustment expenses regardless of whether allocated to specific claims. Estimated recoveries, for example from salvage or subrogation, are another component of the claims liability estimate. Changes in the Risk Management Internal Service Fund’s claims liability for the past two fiscal years are summarized as follows:
2015 2014Accrued claims and judgements, July 1 63,107$ 59,850$ Incurred claims and adjustment expenses 19,196 15,469 Claim payments (11,610) (12,212)
Accrued claims and judgements, June 30 70,693$ 63,107$
97
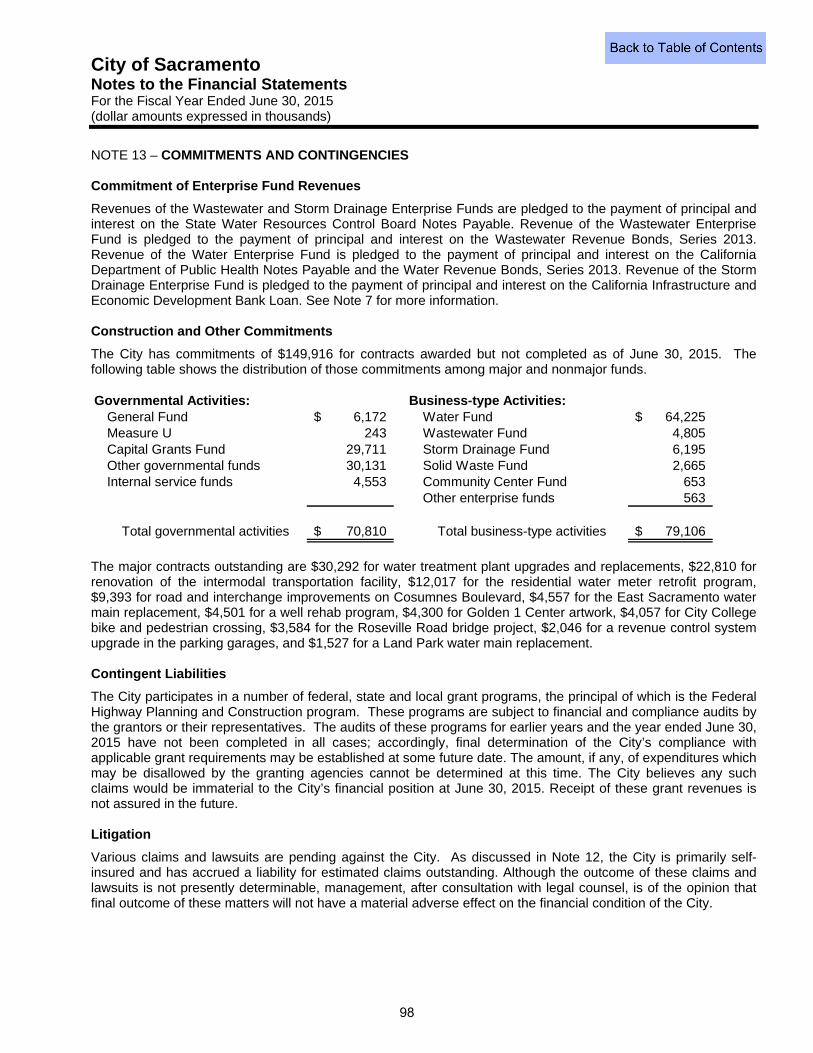
City of Sacramento Notes to the Financial Statements For the Fiscal Year Ended June 30, 2015 (dollar amounts expressed in thousands)
NOTE 13 – COMMITMENTS AND CONTINGENCIES Commitment of Enterprise Fund Revenues
Revenues of the Wastewater and Storm Drainage Enterprise Funds are pledged to the payment of principal and interest on the State Water Resources Control Board Notes Payable. Revenue of the Wastewater Enterprise Fund is pledged to the payment of principal and interest on the Wastewater Revenue Bonds, Series 2013. Revenue of the Water Enterprise Fund is pledged to the payment of principal and interest on the California Department of Public Health Notes Payable and the Water Revenue Bonds, Series 2013. Revenue of the Storm Drainage Enterprise Fund is pledged to the payment of principal and interest on the California Infrastructure and Economic Development Bank Loan. See Note 7 for more information. Construction and Other Commitments
The City has commitments of $149,916 for contracts awarded but not completed as of June 30, 2015. The following table shows the distribution of those commitments among major and nonmajor funds. Governmental Activities: Business-type Activities: General Fund 6,172$ Water Fund 64,225$
Measure U 243 Wastewater Fund 4,805 Capital Grants Fund 29,711 Storm Drainage Fund 6,195 Other governmental funds 30,131 Solid Waste Fund 2,665 Internal service funds 4,553 Community Center Fund 653
Other enterprise funds 563
Total governmental activities 70,810$ Total business-type activities 79,106$
The major contracts outstanding are $30,292 for water treatment plant upgrades and replacements, $22,810 for renovation of the intermodal transportation facility, $12,017 for the residential water meter retrofit program, $9,393 for road and interchange improvements on Cosumnes Boulevard, $4,557 for the East Sacramento water main replacement, $4,501 for a well rehab program, $4,300 for Golden 1 Center artwork, $4,057 for City College bike and pedestrian crossing, $3,584 for the Roseville Road bridge project, $2,046 for a revenue control system upgrade in the parking garages, and $1,527 for a Land Park water main replacement. Contingent Liabilities
The City participates in a number of federal, state and local grant programs, the principal of which is the Federal Highway Planning and Construction program. These programs are subject to financial and compliance audits by the grantors or their representatives. The audits of these programs for earlier years and the year ended June 30, 2015 have not been completed in all cases; accordingly, final determination of the City’s compliance with applicable grant requirements may be established at some future date. The amount, if any, of expenditures which may be disallowed by the granting agencies cannot be determined at this time. The City believes any such claims would be immaterial to the City’s financial position at June 30, 2015. Receipt of these grant revenues is not assured in the future. Litigation
Various claims and lawsuits are pending against the City. As discussed in Note 12, the City is primarily self-insured and has accrued a liability for estimated claims outstanding. Although the outcome of these claims and lawsuits is not presently determinable, management, after consultation with legal counsel, is of the opinion that final outcome of these matters will not have a material adverse effect on the financial condition of the City.
98
City of Sacramento Notes to the Financial Statements For the Fiscal Year Ended June 30, 2015 (dollar amounts expressed in thousands)
NOTE 13 – COMMITMENTS AND CONTINGENCIES (Continued) Postclosure Care Cost
The City has several landfill sites which have stopped accepting waste, have been covered, and are closed. State and federal laws and regulations require that the City perform certain maintenance and monitoring functions at these sites after closure. A recent engineering report estimated that $1,177 is required for future postclosure monitoring costs as of June 30, 2015. The estimate is based on current cost and may change due to inflation or deflation, technology, or applicable laws and regulations. The City received approval from state regulators to fund the postclosure costs, along with cost increases due to inflation, with user charges for solid waste disposal. Pollution Remediation Obligations
A pollution remediation obligation is an obligation to address the current or potential detrimental effects of existing pollution by participating in pollution remediation activities. The City is responsible for pollution remediation activities at several sites that have soil contaminated with petroleum, hydrocarbons, and/or metals. Regulatory agencies providing oversight of the City’s pollution remediation obligations and activities include the State of California Regional Water Quality Control Board, the State of California Department of Toxic Substance Control, and the Sacramento County Department of Environmental Management. The estimated obligation was $532 at June 30, 2014 and $619 at June 30, 2015. Pollution remediation outlays totaled approximately $96 for the fiscal year ended June 30, 2015. Pollution remediation obligations are measured based on outlays expected to be incurred to settle all estimable remediation efforts. Pollution remediation obligations are measured at the current value of reasonable and supportable assumptions about future events that may affect the eventual settlement of the obligations. Pollution remediation obligations are measured using the expected cash flow technique, which measures the obligation as the sum of probability-weighted amounts in a range of possible cash flows. Estimates are based on all currently available information, as well as the facts and circumstances of each situation, but may change due to price changes, changes in laws or regulations, changes in remediation technologies, or as additional information become available. Estimated recoveries from other parties that are included in the calculation of the City’s pollution remediation obligations total $70. NOTE 14 – JOINT VENTURES AND JOINTLY GOVERNED ORGANIZATIONS JOINT VENTURES
Sacramento Housing and Redevelopment Agency
The City is a participant with the County of Sacramento in the Sacramento Housing and Redevelopment Agency (SHRA). SHRA is a stand-alone agency governed by the County Board of Supervisors over County housing activities and the City Council over City housing activities. Although the City does not have an equity interest in SHRA, it does have an ongoing financial interest. Based upon the approval process for activities of the Housing Authority of the City of Sacramento (Housing Authority), the City has the ability to directly influence SHRA to undertake projects for the citizenry of the City. Because the City’s primary government does not have an equity interest in SHRA, SHRA’s financial information is not included in these financial statements. Separately issued financial statement may be obtained from the Sacramento Housing and Redevelopment Agency, 801 12th Street, Sacramento, California, 95814. SHRA administered the redevelopment agencies of the City and County until February 1, 2012. In 2011 the California Legislature enacted AB 1x 26 which, coupled with a subsequent decision of the State Supreme Court, resulted in the dissolution of redevelopment agencies. Upon the dissolution of the redevelopment agency, the City elected to become the successor agency for the non-housing redevelopment agency activities. More information can be found in Note 15 – Successor Agency Trust Fund. The City designated the Housing Authority as the local authority to retain the housing assets and functions previously performed by the redevelopment agency, and the Housing Authority affirmatively elected pursuant to Health and Safety Code Section 34176 that it would serve as the “Successor Housing Agency” to the former redevelopment agency.
99
City of Sacramento Notes to the Financial Statements For the Fiscal Year Ended June 30, 2015 (dollar amounts expressed in thousands)
NOTE 14 – JOINTLY GOVERNED AND RELATED ORGANIZATIONS (Continued) Sacramento Public Library Authority
The City is a participant with the County of Sacramento and the cities of Citrus Heights, Elk Grove, Galt, Isleton and Rancho Cordova in the Sacramento Public Library Authority (Library), a joint powers agency created to provide library services to the residents of the participating municipalities. The Library is governed by a board made up of five County appointees and various numbers of appointees from each city, depending upon population. As of June 30, 2015, five of seventeen members of the Library board were appointed by the City. The current joint powers agreement was effective beginning July 1, 2007. After June 30, 2010, any party may withdraw from the Authority upon no less than one year’s written notice. Upon withdrawal a party shall retain ownership of those capital facilities to which it holds title. The City is committed to fund annual contributions to operate library branches in the City. The City’s General Fund and Measure U Fund contributions for the fiscal year ended June 30, 2015, were $7,636. The City also contributed the use of its library facilities to the Library. In order to provide funding for additional services and hours in City libraries, the City also levies and passes through to the Library two parcel taxes which totaled $6,860 for the fiscal year ended June 30, 2015. Financial statements may be obtained from the Sacramento Public Library Authority, 828 I Street, Sacramento, California, 95814. Sacramento Regional Fire/EMS Communication Center
The City is a participant with Sacramento Metropolitan Fire District and other local fire agencies in the Sacramento Regional Fire/EMS Communication Center (SRFECC), a fire dispatch center. SRFECC provides fire protection and emergency medical service dispatching for 1,000 square miles and 1.3 million residents in Sacramento and Placer Counties. The City provided $3,437 of support to SRFECC during the fiscal year ended June 30, 2015. Financial statements may be obtained from the Sacramento Regional Fire/EMS Communication Center, 10230 Systems Parkway, Sacramento, California, 95827. Northern California Regional Public Safety Training Authority
The City is a participant with the County of Sacramento, the Los Rios Community College District and the Regional Fire and Rescue Authority in the Northern California Regional Public Safety Training Authority (NCRPSTA) which operates the Northern California Regional Public Safety Training College located at McClellan Park. During the fiscal year ended June 30, 2015, the City provided $451 of annual support to the NCRPSTA. Rent payments during the fiscal year ended June 30, 2015 were $10. The City also paid $942 to provide upgrades to the firing ranges at NCRPSTA facilities and to reimburse costs for facility improvements. Financial statements may be obtained from the NCRPSTA Administrative Offices, 2409 Dean Street, Suite 119, McClellan, California, 95652. Regional Fire and Rescue Training Authority
The City is a participant with the Sacramento Metropolitan Fire District and the California Governor’s Office of Emergency Services in the Regional Fire and Rescue Training Authority which provides training for fire and rescue personnel throughout the region as well as operating the California Regional Fire Academy. During the fiscal year ended June 30, 2015, the City provided general support of $45, paid $293 for training courses for City staff and provided staff support. Financial statements may be obtained from the Regional Fire and Rescue Training Authority Business Office, 9320 Tech Center Drive, Sacramento, CA 95826.
100
City of Sacramento Notes to the Financial Statements For the Fiscal Year Ended June 30, 2015 (dollar amounts expressed in thousands)
NOTE 14 – JOINTLY GOVERNED AND RELATED ORGANIZATIONS (Continued) JOINTLY GOVERNED ORGANIZATIONS WITH RELATED PARTY TRANSACTIONS
The City participates in several jointly governed organizations for which it appoints a minority of board members. The City may also provide minor financial support or have other financial transactions with these organizations, but it does not have a financial interest in or responsibility to the organizations. The following organizations had financial transactions with the City during the fiscal year ended June 30, 2015:
The City provided $91 in annual support and $210 in project/program expenses to the Regional Water Authority. The City provided $99 in annual support to the Sacramento Area Council of Governments. The City processed payroll for the Sacramento Area Flood Control Agency (SAFCA) and received an administrative fee for the service. During FY15, the City also received $460 from SAFCA in reimbursement for levee maintenance costs. The City paid $48 for services provided related to safe neighborhood and gang violence reduction programs to the Sacramento Employment and Training Agency. The City provided $108 in annual support to the Sacramento Groundwater Authority.
NOTE 15 – SUCCESSOR AGENCY TRUST FUND On December 29, 2011, the California Supreme Court upheld Assembly Bill 1X 26 (“the Bill”) which dissolved all redevelopment agencies in the State of California. Successor agencies are allocated property tax revenue in an amount necessary to pay the estimated annual installment payments on enforceable obligations of the former redevelopment agency until all enforceable obligations of the prior redevelopment agency have been paid in full. In accordance with the timeline set forth in the Bill (as modified by the California Supreme Court on December 29, 2011), all redevelopment agencies in the State of California were dissolved and ceased to operate as legal entity as of February 1, 2012. On January 31, 2012, the City of Sacramento (City) elected to serve as the successor agency to the Redevelopment Agency of the City of Sacramento (Agency) for the Agency’s non-housing assets and liabilities pursuant to the provisions of AB 1x26 (Chapter 5, Statutes of 2011). Also on January 1, 2012, the City Council elected not to serve as the successor agency for the former redevelopment agency’s housing assets and functions, but instead designated the City’s Housing Authority to serve as the successor housing agency. Prior to February 1, 2012, California Redevelopment Law provided tax increment financing as a source of revenue to redevelopment agencies to fund redevelopment activities. Once a redevelopment area was adopted, the former Agency could only receive tax increment to the extent that it could show on an annual basis that it has incurred indebtedness that must be repaid with tax increment. Due to the nature of redevelopment financing, the former Agency liabilities exceeded its assets. Therefore, the Agency historically carried a deficit, which was expected to be reduced as future tax increment revenues were received and used to repay its outstanding long-term debt. This deficit was transferred to the successor agency on February 1, 2012. At June 30, 2015, the successor agency had a deficit of $228,693 which will be eliminated with future property tax revenue distributions from the Redevelopment Property Tax Trust Fund administered by the County Auditor-Controller. On June 27, 2012, Assembly Bill 1484 was enacted. Under AB 1484 (Chapter 16, Statutes of 2012; Health and Safety Code section 34173, subdivision (g)), the dissolution law was clarified to provide that the Agency is a separate legal entity from the City. Also, AB 1484 provided that the Agency’s bond fund assets can be expended in a manner consistent with the bonds covenants after compliance with certain requirements.
101
City of Sacramento Notes to the Financial Statements For the Fiscal Year Ended June 30, 2015 (dollar amounts expressed in thousands)
NOTE 15 – SUCCESSOR AGENCY TRUST FUND (Continued) On September 20, 2013, the Agency received its Finding of Completion from the State Department of Finance (DOF) and is now able to spend the Agency’s unencumbered bond funds in a manner consistent with the original bonds covenants. Pursuant to Health and Safety Code (HSC) section 34179.7, the DOF has verified that the Agency does not owe any amounts to the taxing entities as determined under HSC section 34179.6, subdivisions (d) or (e) and HSC section 34183.5. The Agency’s SERAF loan will be paid off in FY16. According to HSC section 34191.4 (b)(2)(A), the maximum annual repayment amount is limited to one-half of the increase between the amount distributed to the taxing entities in FY13-14 and the amount distributed to taxing entities in the FY12-13 base year. A bond expenditure agreement outlining the transfer of pre-2011 unexpended bond proceeds for a total of $5,880 in FY15 was approved by the Oversight Board and DOF. $4,330 of unexpended bond proceeds were transferred to the City to fund the Powerhouse Science Center, 700 Block of K Street, Lowell Street sidewalk, and 14th Avenue extension projects. The remaining $1,550 of unexpended bond proceeds was transferred to SHRA for 700 Block of K Street Project. These projects are an eligible use of the bond proceeds. The contracts payable reported in the private-purpose trust fund are allocations of the SHRA OPEB and pension unfunded liabilities for the former redevelopment agency employees. Capital Assets
The following is a summary of changes in capital assets:
Beginning Balance Increases Decreases
Ending Balance
Capital assets not being depreciated/amortizedLand 45,566$ -$ (19,425)$ (1) 26,141$
Depreciable/amortizable capital assetsBuildings and improvements 16,315 - (9,757) (1) 6,558
Less accumulated depreciation/amortization for:Buildings and improvements (2,824) (286) 1,678 (1) (1,432)
Depreciable/amortizable capital assets, net 13,491 (286) (8,079) 5,126
Total capital assets, net 59,057$ (286)$ (27,504)$ 31,267$
Note: (1) The 700 Block of K Street properties with a net book value of $20,488 at June 30, 2015 were transferred to the City to fulfill an enforceable obligation to 700 Block Investors, LP and 700 Block Commercial at no cost. Five of the twenty-five assets classified by the RASA Oversight Board and DOF as government purpose with a net book value of $7,016 wereconveyed to the City.
102
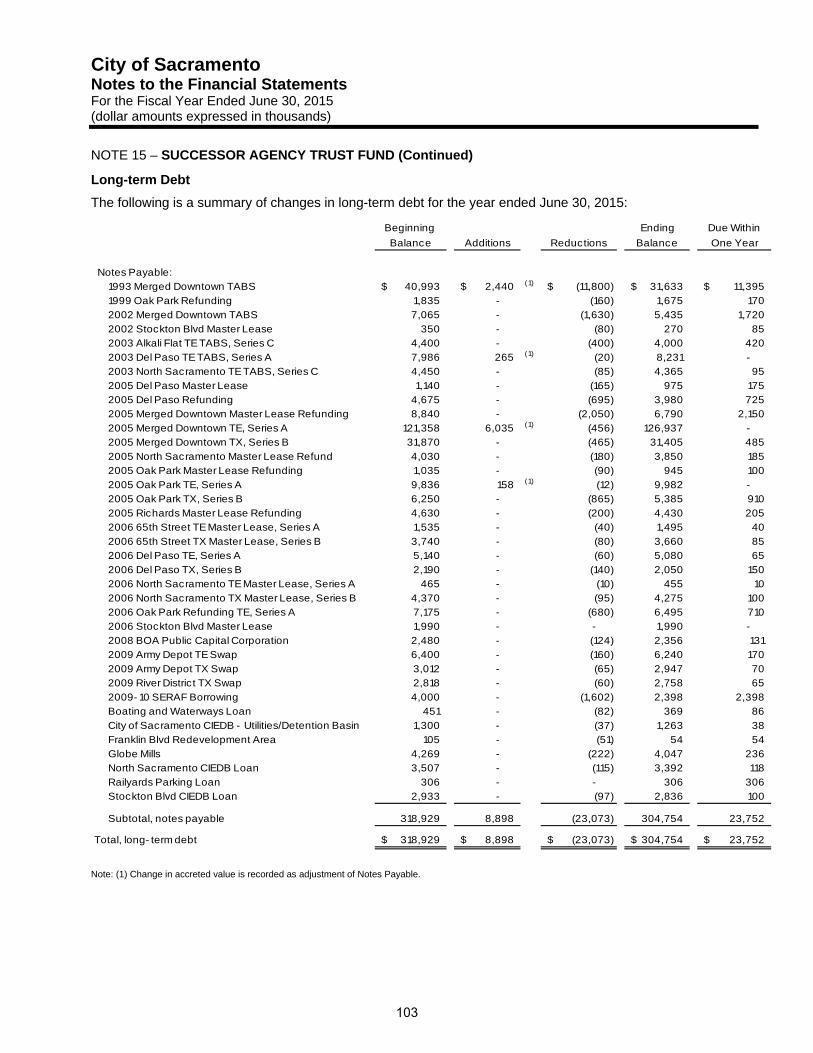
City of Sacramento Notes to the Financial Statements For the Fiscal Year Ended June 30, 2015 (dollar amounts expressed in thousands)
NOTE 15 – SUCCESSOR AGENCY TRUST FUND (Continued)
Long-term Debt
The following is a summary of changes in long-term debt for the year ended June 30, 2015:
Beginning Ending Due Within
Balance Additions Reductions Balance One Year
Notes Payable:
1993 Merged Downtown TABS 40,993$ 2,440$ (1) (11,800)$ 31,633$ 11,395$
1999 Oak Park Refunding 1,835 - (160) 1,675 170
2002 Merged Downtown TABS 7,065 - (1,630) 5,435 1,720
2002 Stockton Blvd Master Lease 350 - (80) 270 85
2003 Alkali Flat TE TABS, Series C 4,400 - (400) 4,000 420
2003 Del Paso TE TABS, Series A 7,986 265 (1) (20) 8,231 -
2003 North Sacramento TE TABS, Series C 4,450 - (85) 4,365 95
2005 Del Paso Master Lease 1,140 - (165) 975 175
2005 Del Paso Refunding 4,675 - (695) 3,980 725
2005 Merged Downtown Master Lease Refunding 8,840 - (2,050) 6,790 2,150
2005 Merged Downtown TE, Series A 121,358 6,035 (1) (456) 126,937 -
2005 Merged Downtown TX, Series B 31,870 - (465) 31,405 485
2005 North Sacramento Master Lease Refund 4,030 - (180) 3,850 185
2005 Oak Park Master Lease Refunding 1,035 - (90) 945 100
2005 Oak Park TE, Series A 9,836 158 (1) (12) 9,982 -
2005 Oak Park TX, Series B 6,250 - (865) 5,385 910
2005 Richards Master Lease Refunding 4,630 - (200) 4,430 205
2006 65th Street TE Master Lease, Series A 1,535 - (40) 1,495 40
2006 65th Street TX Master Lease, Series B 3,740 - (80) 3,660 85
2006 Del Paso TE, Series A 5,140 - (60) 5,080 65
2006 Del Paso TX, Series B 2,190 - (140) 2,050 150
2006 North Sacramento TE Master Lease, Series A 465 - (10) 455 10
2006 North Sacramento TX Master Lease, Series B 4,370 - (95) 4,275 100
2006 Oak Park Refunding TE, Series A 7,175 - (680) 6,495 710
2006 Stockton Blvd Master Lease 1,990 - - 1,990 -
2008 BOA Public Capital Corporation 2,480 - (124) 2,356 131
2009 Army Depot TE Swap 6,400 - (160) 6,240 170
2009 Army Depot TX Swap 3,012 - (65) 2,947 70
2009 River District TX Swap 2,818 - (60) 2,758 65
2009- 10 SERAF Borrowing 4,000 - (1,602) 2,398 2,398
Boating and Waterways Loan 451 - (82) 369 86
City of Sacramento CIEDB - Utilities/Detention Basin 1,300 - (37) 1,263 38
Franklin Blvd Redevelopment Area 105 - (51) 54 54
Globe Mills 4,269 - (222) 4,047 236
North Sacramento CIEDB Loan 3,507 - (115) 3,392 118
Railyards Parking Loan 306 - - 306 306
Stockton Blvd CIEDB Loan 2,933 - (97) 2,836 100
Subtotal, notes payable 318,929 8,898 (23,073) 304,754 23,752
Total, long- term debt 318,929$ 8,898$ (23,073)$ 304,754$ 23,752$
Note: (1) Change in accreted value is recorded as adjustment of Notes Payable.
103
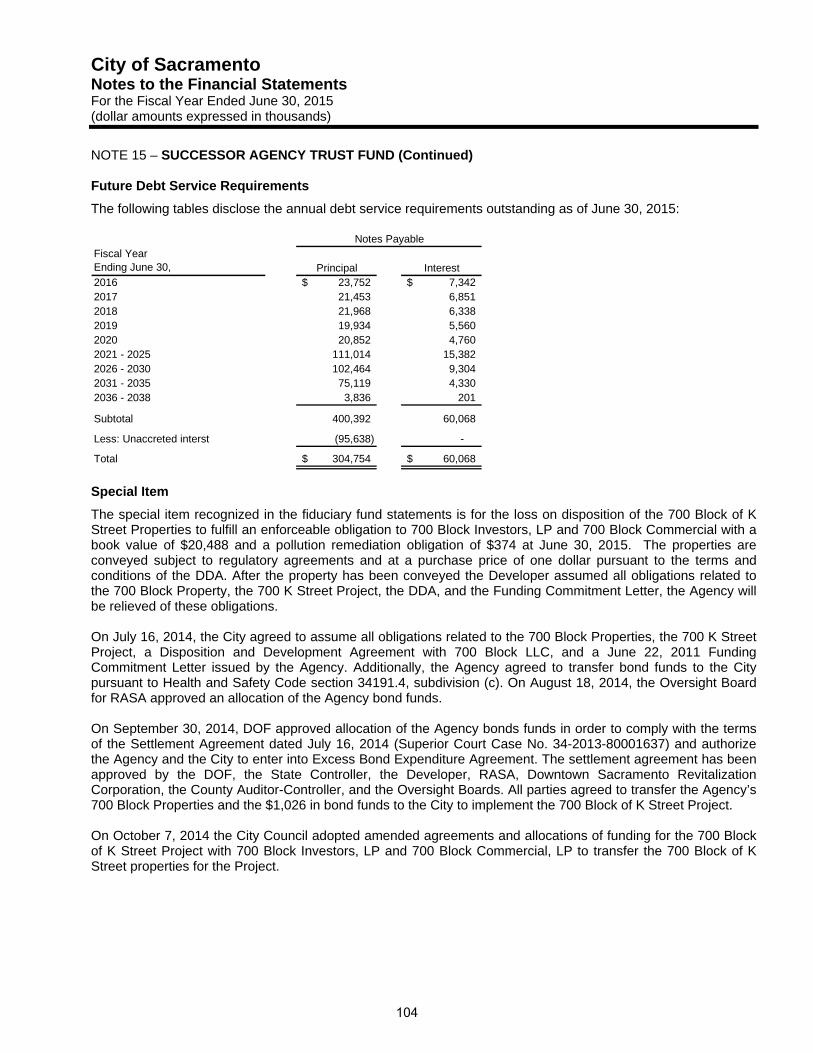
City of Sacramento Notes to the Financial Statements For the Fiscal Year Ended June 30, 2015 (dollar amounts expressed in thousands)
NOTE 15 – SUCCESSOR AGENCY TRUST FUND (Continued) Future Debt Service Requirements
The following tables disclose the annual debt service requirements outstanding as of June 30, 2015: Fiscal YearEnding June 30, Principal Interest2016 23,752$ 7,342$ 2017 21,453 6,851 2018 21,968 6,338 2019 19,934 5,560 2020 20,852 4,760 2021 - 2025 111,014 15,382 2026 - 2030 102,464 9,304 2031 - 2035 75,119 4,330 2036 - 2038 3,836 201
Subtotal 400,392 60,068
Less: Unaccreted interst (95,638) -
Total 304,754$ 60,068$
Notes Payable
Special Item
The special item recognized in the fiduciary fund statements is for the loss on disposition of the 700 Block of K Street Properties to fulfill an enforceable obligation to 700 Block Investors, LP and 700 Block Commercial with a book value of $20,488 and a pollution remediation obligation of $374 at June 30, 2015. The properties are conveyed subject to regulatory agreements and at a purchase price of one dollar pursuant to the terms and conditions of the DDA. After the property has been conveyed the Developer assumed all obligations related to the 700 Block Property, the 700 K Street Project, the DDA, and the Funding Commitment Letter, the Agency will be relieved of these obligations. On July 16, 2014, the City agreed to assume all obligations related to the 700 Block Properties, the 700 K Street Project, a Disposition and Development Agreement with 700 Block LLC, and a June 22, 2011 Funding Commitment Letter issued by the Agency. Additionally, the Agency agreed to transfer bond funds to the City pursuant to Health and Safety Code section 34191.4, subdivision (c). On August 18, 2014, the Oversight Board for RASA approved an allocation of the Agency bond funds. On September 30, 2014, DOF approved allocation of the Agency bonds funds in order to comply with the terms of the Settlement Agreement dated July 16, 2014 (Superior Court Case No. 34-2013-80001637) and authorize the Agency and the City to enter into Excess Bond Expenditure Agreement. The settlement agreement has been approved by the DOF, the State Controller, the Developer, RASA, Downtown Sacramento Revitalization Corporation, the County Auditor-Controller, and the Oversight Boards. All parties agreed to transfer the Agency’s 700 Block Properties and the $1,026 in bond funds to the City to implement the 700 Block of K Street Project. On October 7, 2014 the City Council adopted amended agreements and allocations of funding for the 700 Block of K Street Project with 700 Block Investors, LP and 700 Block Commercial, LP to transfer the 700 Block of K Street properties for the Project.
104
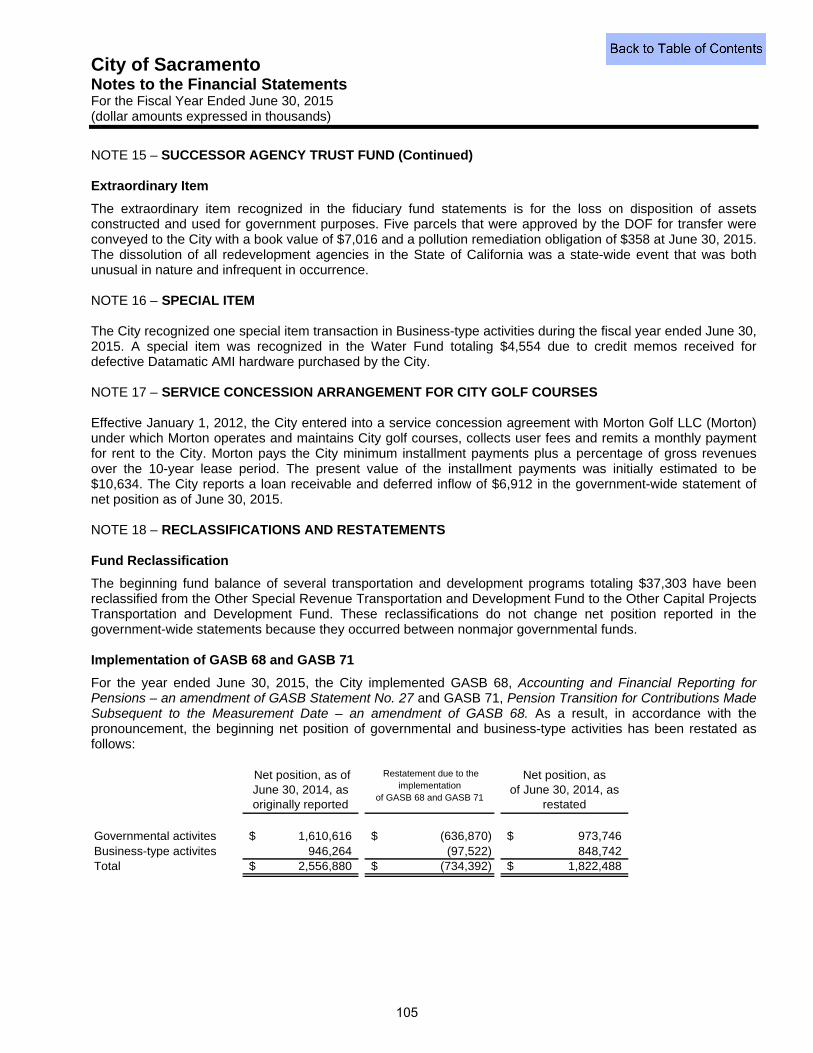
City of Sacramento Notes to the Financial Statements For the Fiscal Year Ended June 30, 2015 (dollar amounts expressed in thousands)
NOTE 15 – SUCCESSOR AGENCY TRUST FUND (Continued) Extraordinary Item
The extraordinary item recognized in the fiduciary fund statements is for the loss on disposition of assets constructed and used for government purposes. Five parcels that were approved by the DOF for transfer were conveyed to the City with a book value of $7,016 and a pollution remediation obligation of $358 at June 30, 2015. The dissolution of all redevelopment agencies in the State of California was a state-wide event that was both unusual in nature and infrequent in occurrence.
NOTE 16 – SPECIAL ITEM The City recognized one special item transaction in Business-type activities during the fiscal year ended June 30, 2015. A special item was recognized in the Water Fund totaling $4,554 due to credit memos received for defective Datamatic AMI hardware purchased by the City. NOTE 17 – SERVICE CONCESSION ARRANGEMENT FOR CITY GOLF COURSES Effective January 1, 2012, the City entered into a service concession agreement with Morton Golf LLC (Morton) under which Morton operates and maintains City golf courses, collects user fees and remits a monthly payment for rent to the City. Morton pays the City minimum installment payments plus a percentage of gross revenues over the 10-year lease period. The present value of the installment payments was initially estimated to be $10,634. The City reports a loan receivable and deferred inflow of $6,912 in the government-wide statement of net position as of June 30, 2015. NOTE 18 – RECLASSIFICATIONS AND RESTATEMENTS Fund Reclassification
The beginning fund balance of several transportation and development programs totaling $37,303 have been reclassified from the Other Special Revenue Transportation and Development Fund to the Other Capital Projects Transportation and Development Fund. These reclassifications do not change net position reported in the government-wide statements because they occurred between nonmajor governmental funds. Implementation of GASB 68 and GASB 71
For the year ended June 30, 2015, the City implemented GASB 68, Accounting and Financial Reporting for Pensions – an amendment of GASB Statement No. 27 and GASB 71, Pension Transition for Contributions Made Subsequent to the Measurement Date – an amendment of GASB 68. As a result, in accordance with the pronouncement, the beginning net position of governmental and business-type activities has been restated as follows:
Net position, as of June 30, 2014, as originally reported
Restatement due to the implementation
of GASB 68 and GASB 71
Net position, asof June 30, 2014, as
restated
Governmental activites 1,610,616$ (636,870)$ 973,746$ Business-type activites 946,264 (97,522) 848,742 Total 2,556,880$ (734,392)$ 1,822,488$
105
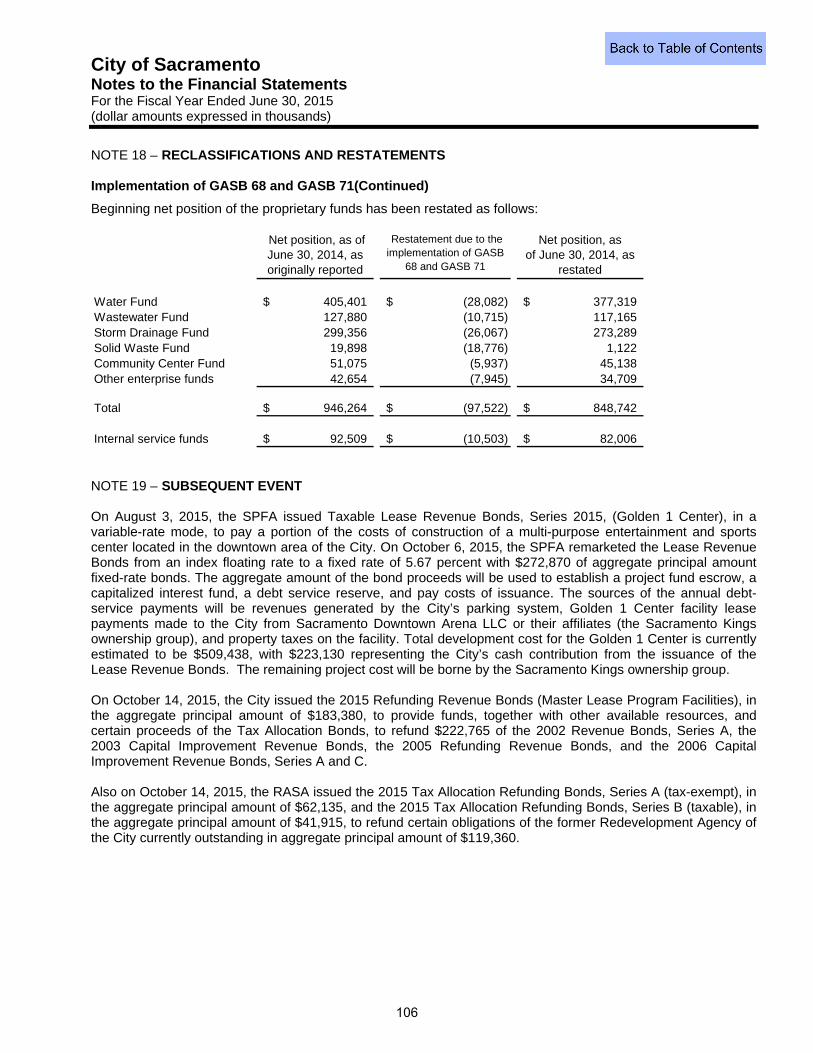
City of Sacramento Notes to the Financial Statements For the Fiscal Year Ended June 30, 2015 (dollar amounts expressed in thousands)
NOTE 18 – RECLASSIFICATIONS AND RESTATEMENTS Implementation of GASB 68 and GASB 71(Continued)
Beginning net position of the proprietary funds has been restated as follows:
Net position, as of June 30, 2014, as originally reported
Restatement due to the implementation of GASB
68 and GASB 71
Net position, asof June 30, 2014, as
restated
Water Fund 405,401$ (28,082)$ 377,319$ Wastewater Fund 127,880 (10,715) 117,165 Storm Drainage Fund 299,356 (26,067) 273,289 Solid Waste Fund 19,898 (18,776) 1,122 Community Center Fund 51,075 (5,937) 45,138 Other enterprise funds 42,654 (7,945) 34,709
Total 946,264$ (97,522)$ 848,742$
Internal service funds 92,509$ (10,503)$ 82,006$
NOTE 19 – SUBSEQUENT EVENT On August 3, 2015, the SPFA issued Taxable Lease Revenue Bonds, Series 2015, (Golden 1 Center), in a variable-rate mode, to pay a portion of the costs of construction of a multi-purpose entertainment and sports center located in the downtown area of the City. On October 6, 2015, the SPFA remarketed the Lease Revenue Bonds from an index floating rate to a fixed rate of 5.67 percent with $272,870 of aggregate principal amount fixed-rate bonds. The aggregate amount of the bond proceeds will be used to establish a project fund escrow, a capitalized interest fund, a debt service reserve, and pay costs of issuance. The sources of the annual debt-service payments will be revenues generated by the City’s parking system, Golden 1 Center facility lease payments made to the City from Sacramento Downtown Arena LLC or their affiliates (the Sacramento Kings ownership group), and property taxes on the facility. Total development cost for the Golden 1 Center is currently estimated to be $509,438, with $223,130 representing the City’s cash contribution from the issuance of the Lease Revenue Bonds. The remaining project cost will be borne by the Sacramento Kings ownership group. On October 14, 2015, the City issued the 2015 Refunding Revenue Bonds (Master Lease Program Facilities), in the aggregate principal amount of $183,380, to provide funds, together with other available resources, and certain proceeds of the Tax Allocation Bonds, to refund $222,765 of the 2002 Revenue Bonds, Series A, the 2003 Capital Improvement Revenue Bonds, the 2005 Refunding Revenue Bonds, and the 2006 Capital Improvement Revenue Bonds, Series A and C. Also on October 14, 2015, the RASA issued the 2015 Tax Allocation Refunding Bonds, Series A (tax-exempt), in the aggregate principal amount of $62,135, and the 2015 Tax Allocation Refunding Bonds, Series B (taxable), in the aggregate principal amount of $41,915, to refund certain obligations of the former Redevelopment Agency of the City currently outstanding in aggregate principal amount of $119,360.
106

Required Supplementary
Information
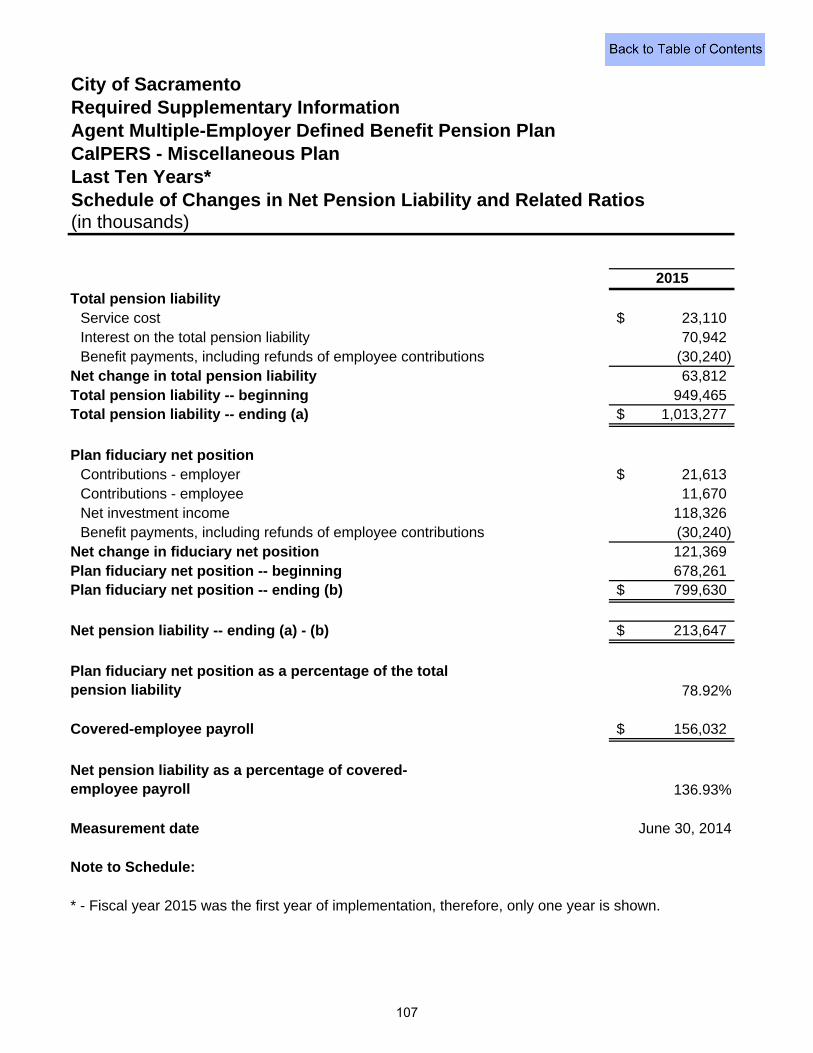
Required Supplementary InformationAgent Multiple-Employer Defined Benefit Pension Plan
2015
Total pension liabilityService cost 23,110$ Interest on the total pension liability 70,942 Benefit payments, including refunds of employee contributions (30,240)
Net change in total pension liability 63,812 Total pension liability -- beginning 949,465 Total pension liability -- ending (a) 1,013,277$
Plan fiduciary net positionContributions - employer 21,613$ Contributions - employee 11,670 Net investment income 118,326 Benefit payments, including refunds of employee contributions (30,240)
Net change in fiduciary net position 121,369 Plan fiduciary net position -- beginning 678,261 Plan fiduciary net position -- ending (b) 799,630$
Net pension liability -- ending (a) - (b) 213,647$
Plan fiduciary net position as a percentage of the total pension liability 78.92%
Covered-employee payroll 156,032$
Net pension liability as a percentage of covered-employee payroll 136.93%
Measurement date June 30, 2014
Note to Schedule:
* - Fiscal year 2015 was the first year of implementation, therefore, only one year is shown.
City of Sacramento
CalPERS - Miscellaneous PlanLast Ten Years*
(in thousands)Schedule of Changes in Net Pension Liability and Related Ratios
107
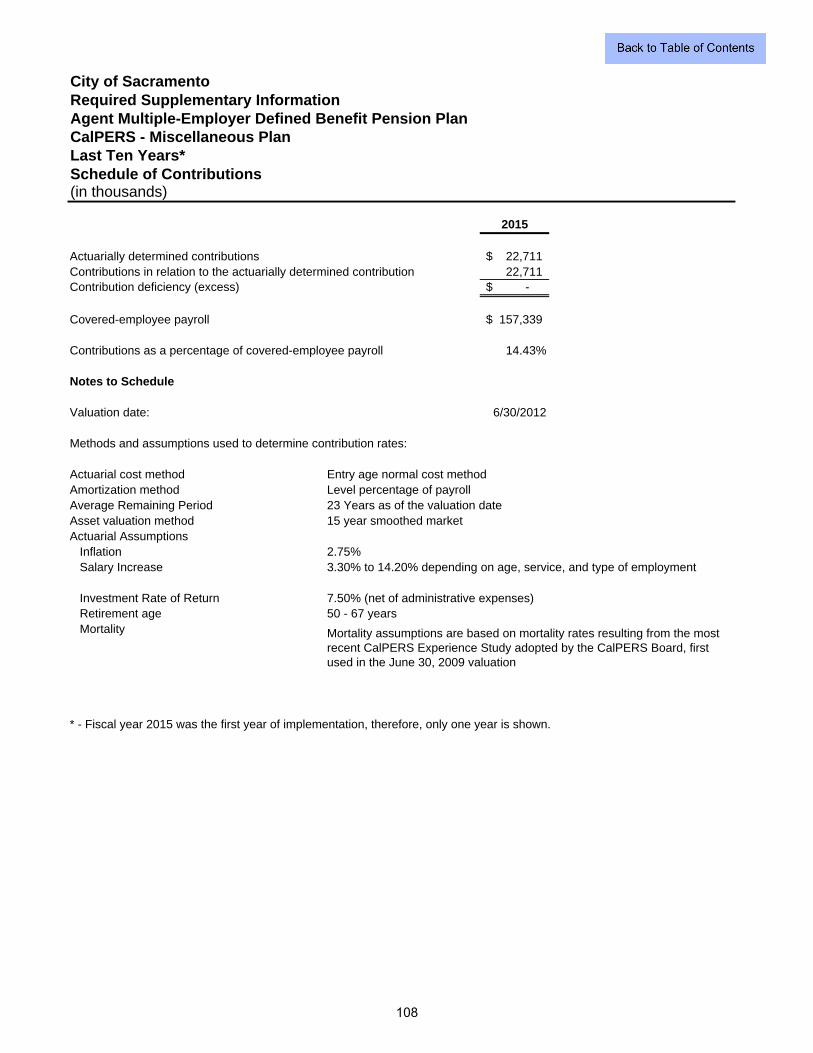
Required Supplementary InformationAgent Multiple-Employer Defined Benefit Pension Plan
Schedule of Contributions(in thousands)
2015
Actuarially determined contributions 22,711$ Contributions in relation to the actuarially determined contribution 22,711 Contribution deficiency (excess) -$
Covered-employee payroll 157,339$
Contributions as a percentage of covered-employee payroll 14.43%
Notes to Schedule
Valuation date: 6/30/2012
Methods and assumptions used to determine contribution rates:
Actuarial cost method Entry age normal cost methodAmortization method Level percentage of payrollAverage Remaining Period 23 Years as of the valuation date Asset valuation method 15 year smoothed marketActuarial Assumptions Inflation 2.75% Salary Increase 3.30% to 14.20% depending on age, service, and type of employment
Investment Rate of Return 7.50% (net of administrative expenses) Retirement age 50 - 67 years Mortality
* - Fiscal year 2015 was the first year of implementation, therefore, only one year is shown.
Mortality assumptions are based on mortality rates resulting from the most recent CalPERS Experience Study adopted by the CalPERS Board, first used in the June 30, 2009 valuation
City of Sacramento
CalPERS - Miscellaneous PlanLast Ten Years*
108
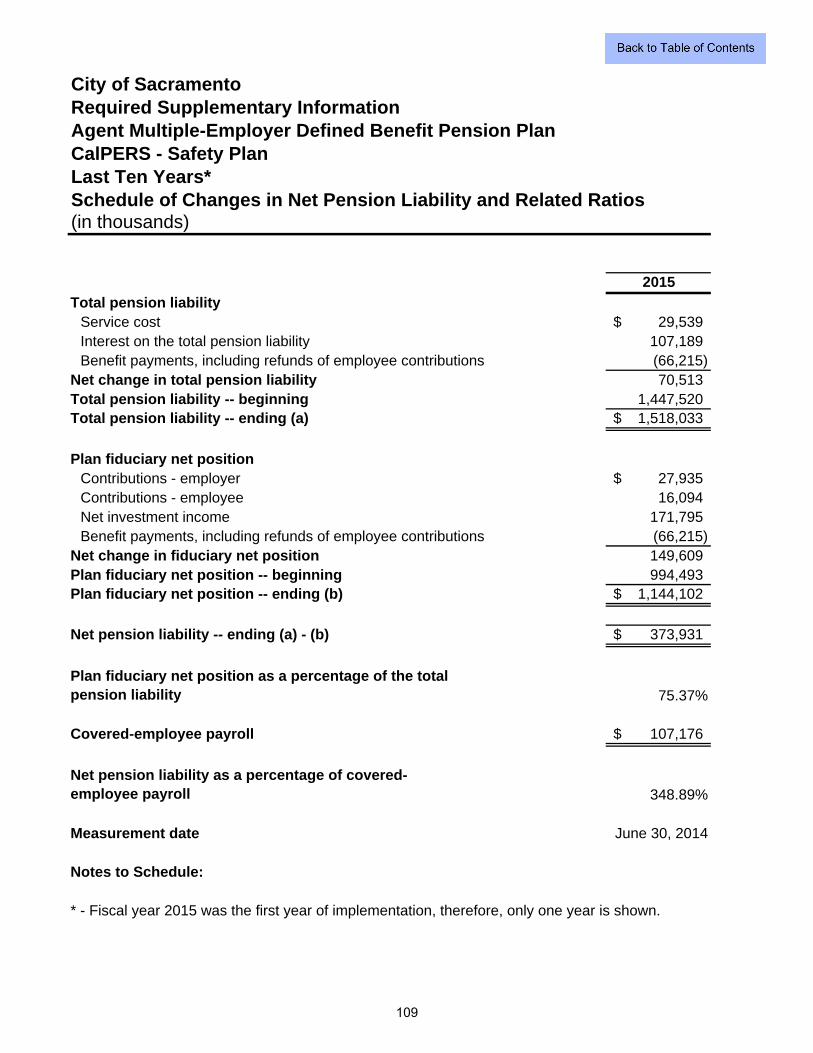
Required Supplementary InformationAgent Multiple-Employer Defined Benefit Pension Plan
2015
Total pension liabilityService cost 29,539$ Interest on the total pension liability 107,189 Benefit payments, including refunds of employee contributions (66,215)
Net change in total pension liability 70,513 Total pension liability -- beginning 1,447,520 Total pension liability -- ending (a) 1,518,033$
Plan fiduciary net positionContributions - employer 27,935$ Contributions - employee 16,094 Net investment income 171,795 Benefit payments, including refunds of employee contributions (66,215)
Net change in fiduciary net position 149,609 Plan fiduciary net position -- beginning 994,493 Plan fiduciary net position -- ending (b) 1,144,102$
Net pension liability -- ending (a) - (b) 373,931$
Plan fiduciary net position as a percentage of the total pension liability 75.37%
Covered-employee payroll 107,176$
Net pension liability as a percentage of covered-employee payroll 348.89%
Measurement date June 30, 2014
Notes to Schedule:
* - Fiscal year 2015 was the first year of implementation, therefore, only one year is shown.
City of Sacramento
(in thousands)
CalPERS - Safety PlanLast Ten Years*Schedule of Changes in Net Pension Liability and Related Ratios
109
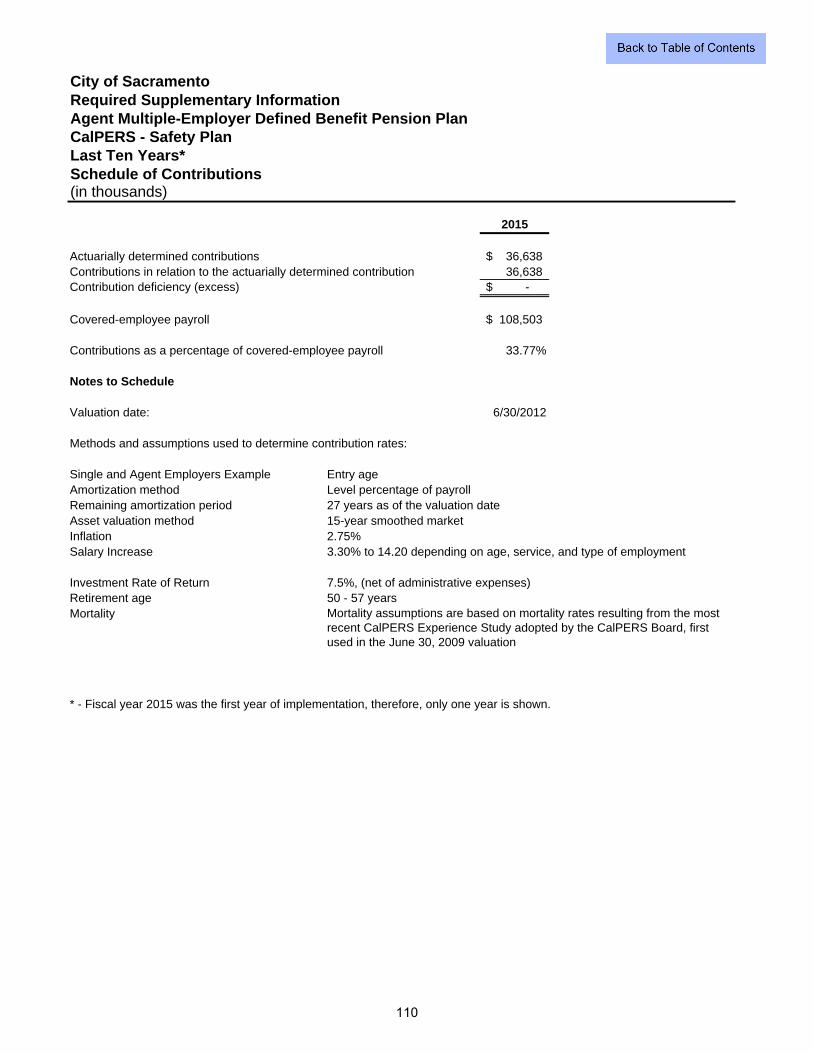
Required Supplementary InformationAgent Multiple-Employer Defined Benefit Pension Plan
Schedule of Contributions(in thousands)
2015
Actuarially determined contributions 36,638$ Contributions in relation to the actuarially determined contribution 36,638 Contribution deficiency (excess) -$
Covered-employee payroll 108,503$
Contributions as a percentage of covered-employee payroll 33.77%
Notes to Schedule
Valuation date: 6/30/2012
Methods and assumptions used to determine contribution rates:
Single and Agent Employers Example Entry age Amortization method Level percentage of payrollRemaining amortization period 27 years as of the valuation dateAsset valuation method 15-year smoothed marketInflation 2.75%Salary Increase 3.30% to 14.20 depending on age, service, and type of employment
Investment Rate of Return 7.5%, (net of administrative expenses)Retirement age 50 - 57 yearsMortality
* - Fiscal year 2015 was the first year of implementation, therefore, only one year is shown.
Mortality assumptions are based on mortality rates resulting from the most recent CalPERS Experience Study adopted by the CalPERS Board, first used in the June 30, 2009 valuation
City of Sacramento
CalPERS - Safety PlanLast Ten Years*
110
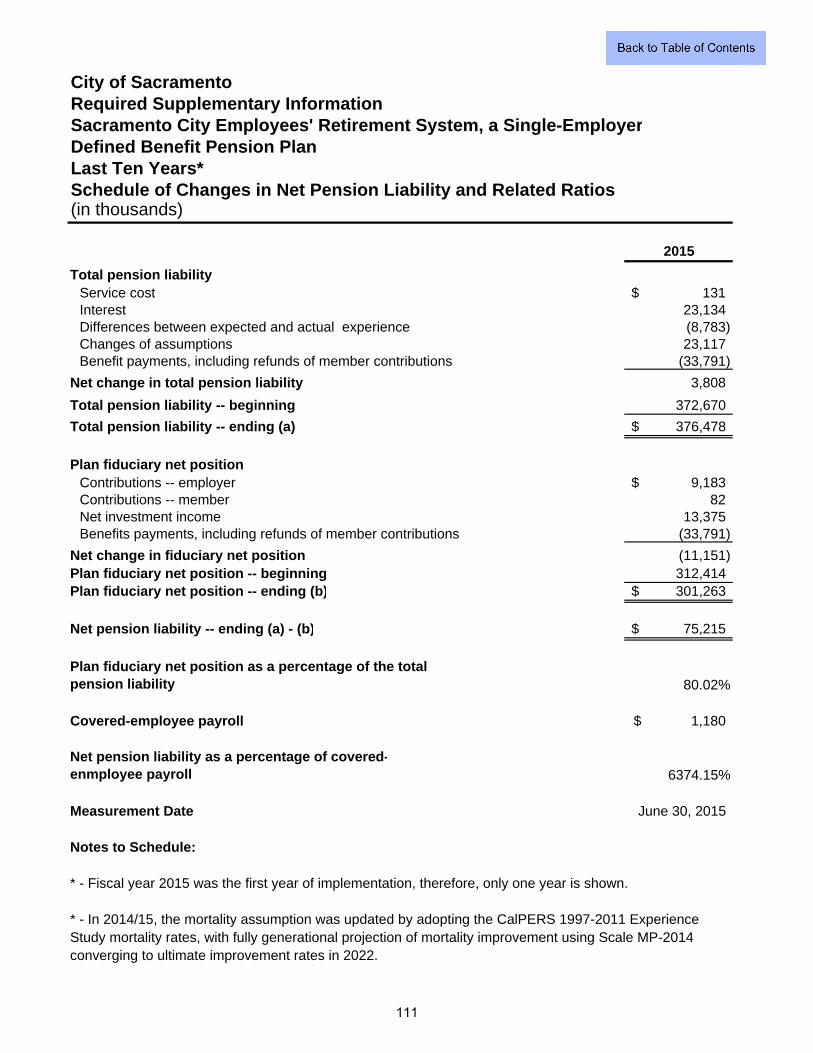
Required Supplementary InformationSacramento City Employees' Retirement System, a Single-Employer
2015
Total pension liabilityService cost 131$ Interest 23,134 Differences between expected and actual experience (8,783) Changes of assumptions 23,117 Benefit payments, including refunds of member contributions (33,791)
Net change in total pension liability 3,808
Total pension liability -- beginning 372,670
Total pension liability -- ending (a) 376,478$
Plan fiduciary net positionContributions -- employer 9,183$ Contributions -- member 82 Net investment income 13,375 Benefits payments, including refunds of member contributions (33,791)
Net change in fiduciary net position (11,151) Plan fiduciary net position -- beginning 312,414 Plan fiduciary net position -- ending (b) 301,263$
Net pension liability -- ending (a) - (b) 75,215$
Plan fiduciary net position as a percentage of the total pension liability 80.02%
Covered-employee payroll 1,180$
Net pension liability as a percentage of covered-enmployee payroll 6374.15%
Measurement Date June 30, 2015
Notes to Schedule:
* - Fiscal year 2015 was the first year of implementation, therefore, only one year is shown.
* - In 2014/15, the mortality assumption was updated by adopting the CalPERS 1997-2011 ExperienceStudy mortality rates, with fully generational projection of mortality improvement using Scale MP-2014converging to ultimate improvement rates in 2022.
City of Sacramento
Last Ten Years*
(in thousands)
Defined Benefit Pension Plan
Schedule of Changes in Net Pension Liability and Related Ratios
111
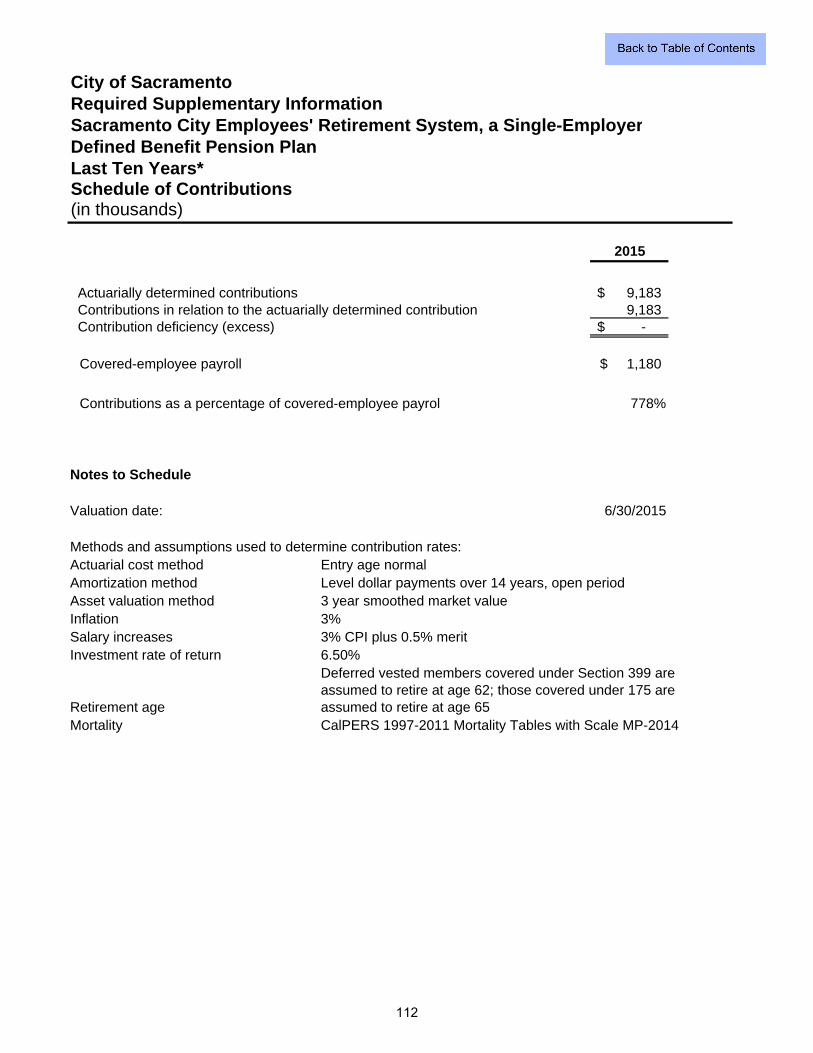
Required Supplementary InformationSacramento City Employees' Retirement System, a Single-Employer
Schedule of Contributions
2015
Actuarially determined contributions 9,183$ Contributions in relation to the actuarially determined contribution 9,183 Contribution deficiency (excess) -$
Covered-employee payroll 1,180$
Contributions as a percentage of covered-employee payrol 778%
Notes to Schedule
Valuation date: 6/30/2015
Methods and assumptions used to determine contribution rates:Actuarial cost method Entry age normalAmortization method Level dollar payments over 14 years, open periodAsset valuation method 3 year smoothed market valueInflation 3%Salary increases 3% CPI plus 0.5% meritInvestment rate of return 6.50%
Retirement ageMortality CalPERS 1997-2011 Mortality Tables with Scale MP-2014
(in thousands)
Deferred vested members covered under Section 399 are assumed to retire at age 62; those covered under 175 are assumed to retire at age 65
City of Sacramento
Defined Benefit Pension PlanLast Ten Years*
112
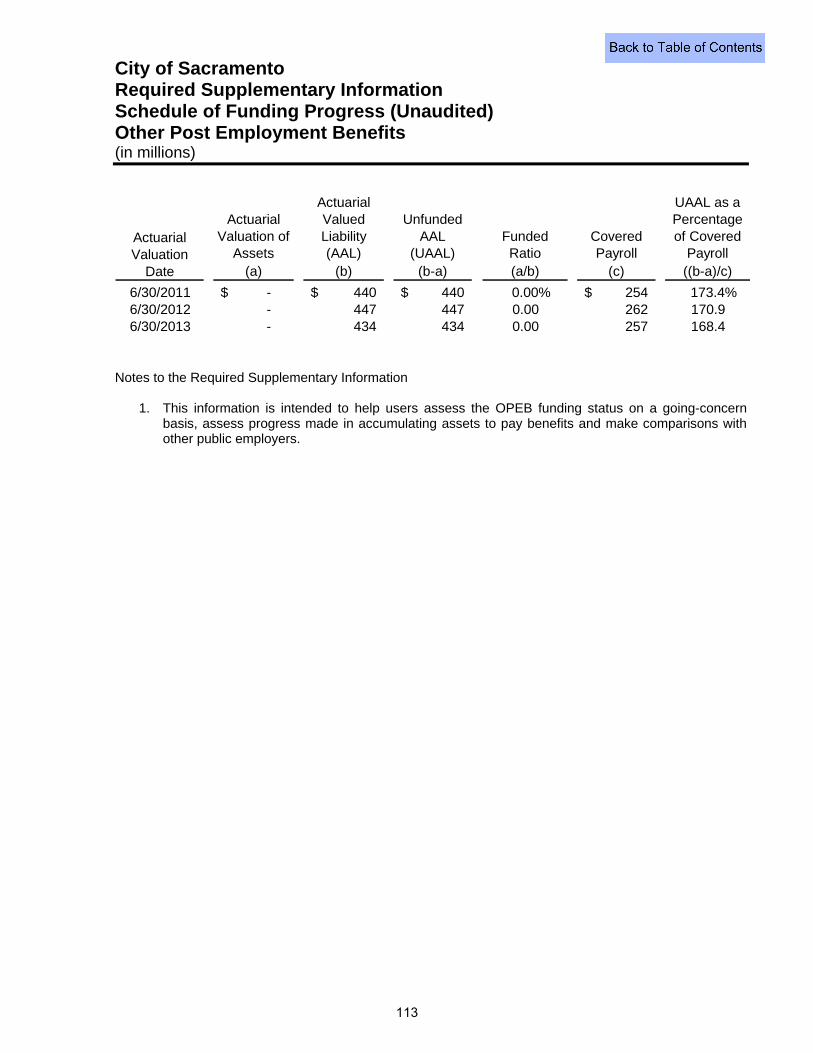
City of Sacramento Required Supplementary Information Schedule of Funding Progress (Unaudited) Other Post Employment Benefits (in millions)
Actuarial Valuation of
Assets
Actuarial Valued Liability (AAL)
Unfunded AAL
(UAAL)Funded Ratio
Covered Payroll
UAAL as a Percentage of Covered
Payroll(a) (b) (b-a) (a/b) (c) ((b-a)/c)
6/30/2011 -$ 440$ 440$ 0.00% 254$ 173.4%6/30/2012 - 447 447 0.00 262 170.96/30/2013 - 434 434 0.00 257 168.4
Actuarial Valuation
Date
Notes to the Required Supplementary Information
1. This information is intended to help users assess the OPEB funding status on a going-concern basis, assess progress made in accumulating assets to pay benefits and make comparisons with other public employers.
113

THIS PAGE INTENTIONALLY LEFT BLANK
114
OTHER GOVERNMENTAL FUNDS
Other governmental funds are nonmajor funds reported in the other governmental funds column of the governmental funds financial statements and include:
OTHER SPECIAL REVENUE FUNDS are used to account for and report the proceeds of specific revenue sources that are restricted or committed to expenditure for specified purposes other than debt service or capital projects. These funds are generally required by statute, charter or ordinance to finance specific governmental functions. The individual funds are listed in the other special revenue funds section of the CAFR.
OTHER DEBT SERVICE FUNDS are used to account for and report financial resources that are restricted, committed, or assigned to expenditure for principal and interest, or that are being accumulated for principal and interest maturing in future years. The individual funds are listed in the other debt service funds section of the CAFR.
OTHER CAPITAL PROJECTS FUNDS are used to account for and report financial resources that are restricted, committed, or assigned to expenditure for governmental capital assets. The individual funds are listed in the other capital projects funds section of the CAFR.
PERMANENT FUNDS are used to account for and report resources that are held by the City which are legally restricted to the extent that only earnings may be used for purposes that support City programs. The individual funds are listed in the permanent funds section of the CAFR.
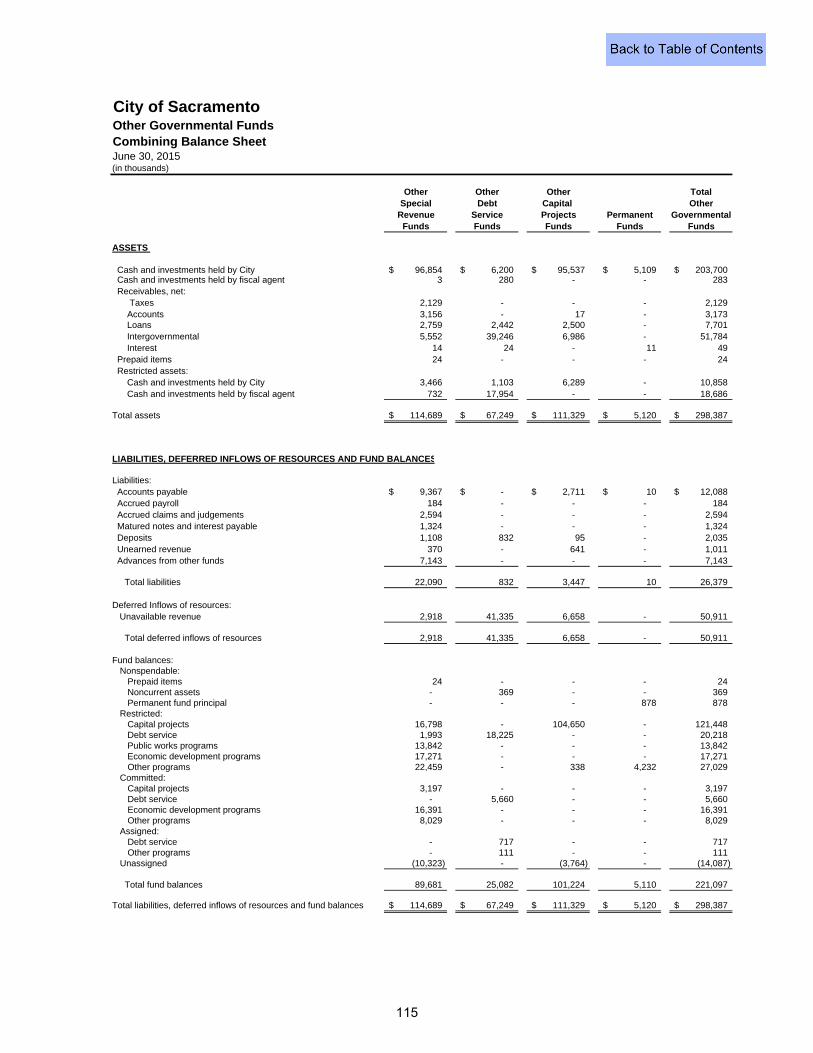
City of SacramentoOther Governmental FundsCombining Balance SheetJune 30, 2015(in thousands)
Other Other Other TotalSpecial Debt Capital Other
Revenue Service Projects Permanent GovernmentalFunds Funds Funds Funds Funds
ASSETS
Cash and investments held by City 96,854$ 6,200$ 95,537$ 5,109$ 203,700$ Cash and investments held by fiscal agent 3 280 - - 283 Receivables, net: Taxes 2,129 - - - 2,129 Accounts 3,156 - 17 - 3,173 Loans 2,759 2,442 2,500 - 7,701 Intergovernmental 5,552 39,246 6,986 - 51,784 Interest 14 24 - 11 49 Prepaid items 24 - - - 24 Restricted assets: Cash and investments held by City 3,466 1,103 6,289 - 10,858 Cash and investments held by fiscal agent 732 17,954 - - 18,686
Total assets 114,689$ 67,249$ 111,329$ 5,120$ 298,387$
LIABILITIES, DEFERRED INFLOWS OF RESOURCES AND FUND BALANCES
Liabilities: Accounts payable 9,367$ -$ 2,711$ 10$ 12,088$ Accrued payroll 184 - - - 184 Accrued claims and judgements 2,594 - - - 2,594 Matured notes and interest payable 1,324 - - - 1,324 Deposits 1,108 832 95 - 2,035 Unearned revenue 370 - 641 - 1,011 Advances from other funds 7,143 - - - 7,143
Total liabilities 22,090 832 3,447 10 26,379
Deferred Inflows of resources: Unavailable revenue 2,918 41,335 6,658 - 50,911
Total deferred inflows of resources 2,918 41,335 6,658 - 50,911
Fund balances: Nonspendable:
Prepaid items 24 - - - 24Noncurrent assets - 369 - - 369Permanent fund principal - - - 878 878
Restricted:Capital projects 16,798 - 104,650 - 121,448 Debt service 1,993 18,225 - - 20,218 Public works programs 13,842 - - - 13,842 Economic development programs 17,271 - - - 17,271 Other programs 22,459 - 338 4,232 27,029
Committed:Capital projects 3,197 - - - 3,197 Debt service - 5,660 - - 5,660 Economic development programs 16,391 - - - 16,391 Other programs 8,029 - - - 8,029
Assigned:Debt service - 717 - - 717Other programs - 111 - - 111
Unassigned (10,323) - (3,764) - (14,087)
Total fund balances 89,681 25,082 101,224 5,110 221,097
Total liabilities, deferred inflows of resources and fund balances 114,689$ 67,249$ 111,329$ 5,120$ 298,387$
115
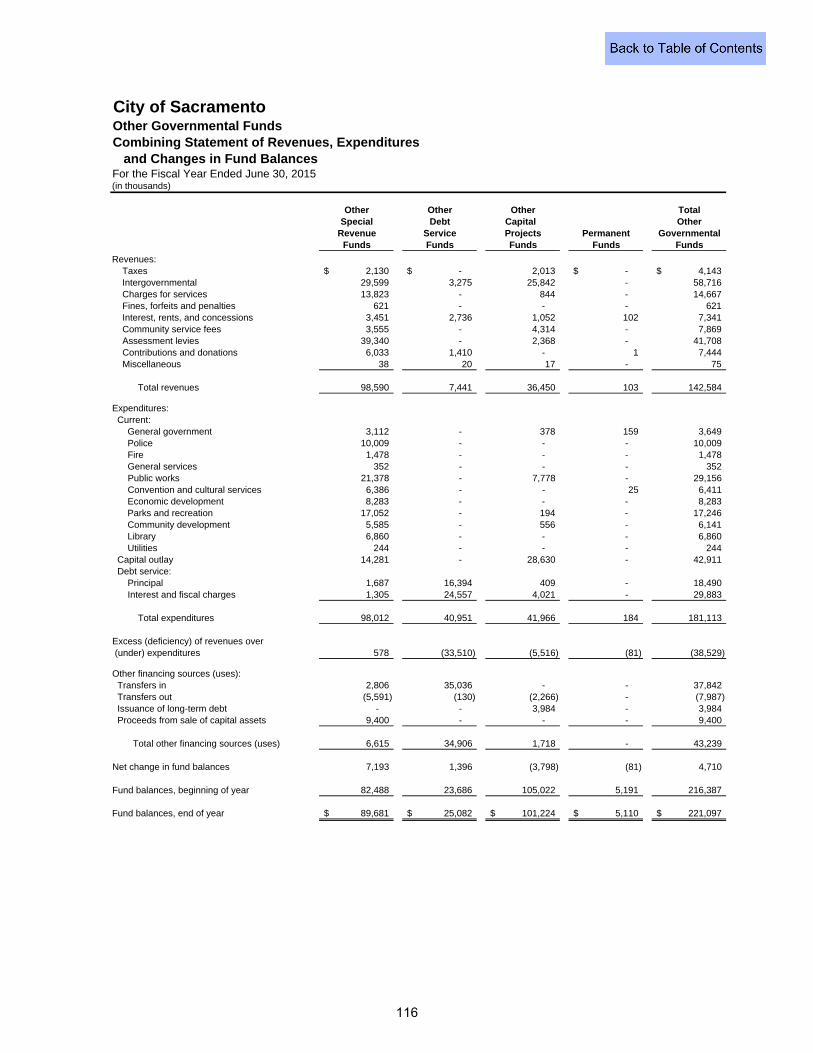
City of SacramentoOther Governmental FundsCombining Statement of Revenues, Expenditures and Changes in Fund BalancesFor the Fiscal Year Ended June 30, 2015(in thousands)
Other Other Other TotalSpecial Debt Capital Other
Revenue Service Projects Permanent GovernmentalFunds Funds Funds Funds Funds
Revenues: Taxes 2,130$ -$ 2,013 -$ 4,143$ Intergovernmental 29,599 3,275 25,842 - 58,716 Charges for services 13,823 - 844 - 14,667 Fines, forfeits and penalties 621 - - - 621 Interest, rents, and concessions 3,451 2,736 1,052 102 7,341 Community service fees 3,555 - 4,314 - 7,869 Assessment levies 39,340 - 2,368 - 41,708 Contributions and donations 6,033 1,410 - 1 7,444 Miscellaneous 38 20 17 - 75
Total revenues 98,590 7,441 36,450 103 142,584
Expenditures: Current: General government 3,112 - 378 159 3,649 Police 10,009 - - - 10,009 Fire 1,478 - - - 1,478 General services 352 - - - 352 Public works 21,378 - 7,778 - 29,156 Convention and cultural services 6,386 - - 25 6,411 Economic development 8,283 - - - 8,283 Parks and recreation 17,052 - 194 - 17,246 Community development 5,585 - 556 - 6,141 Library 6,860 - - - 6,860 Utilities 244 - - - 244 Capital outlay 14,281 - 28,630 - 42,911 Debt service: Principal 1,687 16,394 409 - 18,490 Interest and fiscal charges 1,305 24,557 4,021 - 29,883
Total expenditures 98,012 40,951 41,966 184 181,113
Excess (deficiency) of revenues over (under) expenditures 578 (33,510) (5,516) (81) (38,529)
Other financing sources (uses): Transfers in 2,806 35,036 - - 37,842 Transfers out (5,591) (130) (2,266) - (7,987) Issuance of long-term debt - - 3,984 - 3,984 Proceeds from sale of capital assets 9,400 - - - 9,400
Total other financing sources (uses) 6,615 34,906 1,718 - 43,239
Net change in fund balances 7,193 1,396 (3,798) (81) 4,710 Fund balances, beginning of year 82,488 23,686 105,022 5,191 216,387
Fund balances, end of year 89,681$ 25,082$ 101,224$ 5,110$ 221,097$
116
OTHER SPECIAL REVENUE FUNDS
Other Special revenue funds are used to account for and report the proceeds of specific revenue sources that are restricted or committed to expenditure for specified purposes other than debt service or capital projects. These funds are generally required by statute, charter or ordinance to finance specific government functions. The following other special revenue funds have been classified as nonmajor funds:
THE TRANSPORTATION AND DEVELOPMENT FUND is used to account for the receipts of taxes and fees which are used to maintain and repair streets, bridges and bikeways as well as for traffic safety and community development activities. THE CULTURE AND LEISURE FUND is used to account for a variety of cultural arts and leisure activities. Programs in the Culture and Leisure Fund include the Sacramento Zoo, Fairytale Town, Art in Public Places, Old Sacramento Market, H Street Theatre, Golf, Marina, the Crocker Master Trust and the Winchester G. and Mary Alice Felt Endowment. THE PARKS AND RECREATION FUND is used to account for a variety of parks programs and recreation activities. Programs in the Parks and Recreation Fund include START, Quimby, Special Recreation, Land Park, Sutter Park Sites, Special Program Donations and the Ethel MacLeod Hart Trust. THE ECONOMIC DEVELOPMENT FUND accounts for the receipts and disbursements of former redevelopment property tax revenues as well as the Brownfield Revolving Loan Program and the Sheraton Master Owner Participation Agreement (MOPA). THE OPERATING GRANTS FUND is used to account for federal, state and other agency grants received for various specific purposes. THE CCOMWP FUND is used to account for the revenue and expenditures associated with the City/County Office of Metropolitan Water Planning. The CCOMWP was formed to develop the Water Forum Agreement with objectives to provide a reliable water supply for planned development to the year 2030, and to preserve the region’s Lower American River.
OTHER SPECIAL REVENUE FUNDS (continued)
THE SPECIAL DISTRICTS SPECIAL REVENUE FUND is used to account for a variety of programs that provide infrastructure maintenance and other services for specific areas of the City where special assessments or special taxes are levied. The Special Districts Special Revenue Fund includes the Business Improvement Districts Program, the Landscaping and Lighting Districts Program, the Maintenance Benefit Area Program and the Assessment District Maintenance Program.
THE CAL EPA FUND is used to account for the expenditures associated with the maintenance of the Joe Serna, Jr. California EPA Headquarters Building.

THIS PAGE INTENTIONALLY LEFT BLANK
117
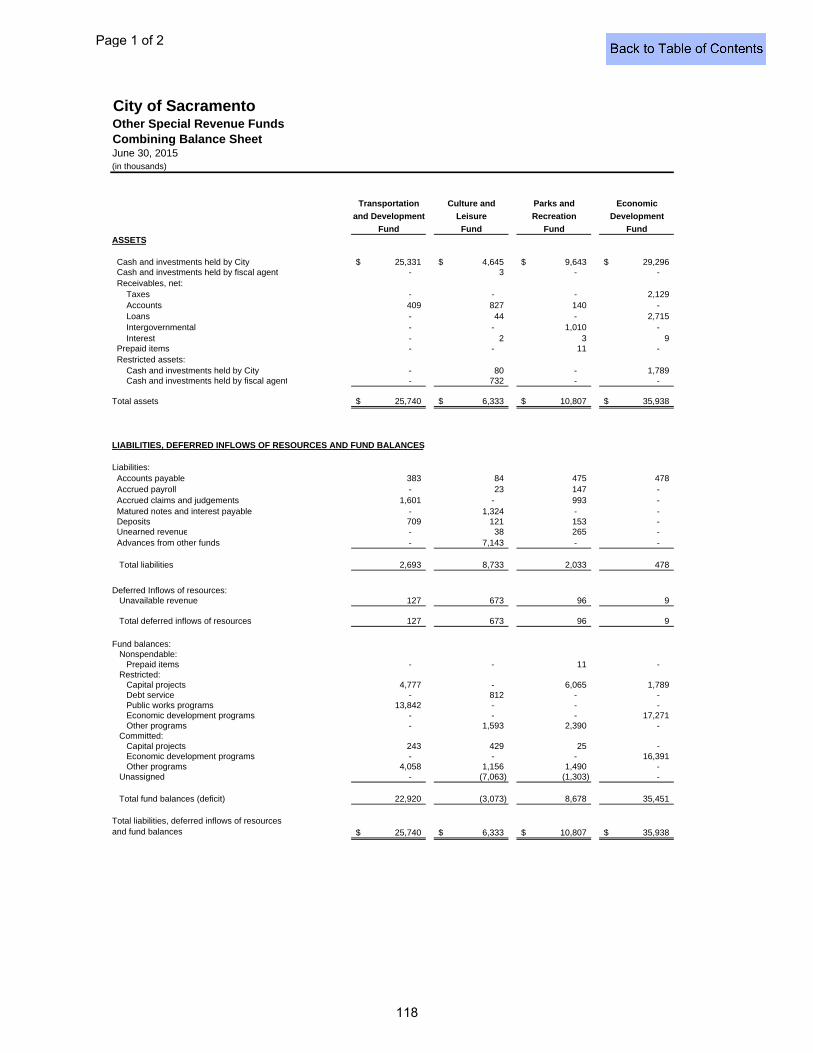
City of SacramentoOther Special Revenue FundsCombining Balance SheetJune 30, 2015(in thousands)
Transportation Culture and Parks and Economic
and Development Leisure Recreation Development
Fund Fund Fund FundASSETS
Cash and investments held by City 25,331$ 4,645$ 9,643$ 29,296$ Cash and investments held by fiscal agent - 3 - - Receivables, net: Taxes - - - 2,129 Accounts 409 827 140 - Loans - 44 - 2,715 Intergovernmental - - 1,010 - Interest - 2 3 9 Prepaid items - - 11 - Restricted assets: Cash and investments held by City - 80 - 1,789 Cash and investments held by fiscal agent - 732 - -
Total assets 25,740$ 6,333$ 10,807$ 35,938$
LIABILITIES, DEFERRED INFLOWS OF RESOURCES AND FUND BALANCES
Liabilities: Accounts payable 383 84 475 478 Accrued payroll - 23 147 - Accrued claims and judgements 1,601 - 993 - Matured notes and interest payable - 1,324 - - Deposits 709 121 153 - Unearned revenue - 38 265 - Advances from other funds - 7,143 - -
Total liabilities 2,693 8,733 2,033 478
Deferred Inflows of resources: Unavailable revenue 127 673 96 9
Total deferred inflows of resources 127 673 96 9
Fund balances:Nonspendable:
Prepaid items - - 11 - Restricted:
Capital projects 4,777 - 6,065 1,789 Debt service - 812 - - Public works programs 13,842 - - - Economic development programs - - - 17,271 Other programs - 1,593 2,390 -
Committed:Capital projects 243 429 25 - Economic development programs - - - 16,391 Other programs 4,058 1,156 1,490 -
Unassigned - (7,063) (1,303) -
Total fund balances (deficit) 22,920 (3,073) 8,678 35,451
Total liabilities, deferred inflows of resources and fund balances 25,740$ 6,333$ 10,807$ 35,938$
Page 1 of 2
118
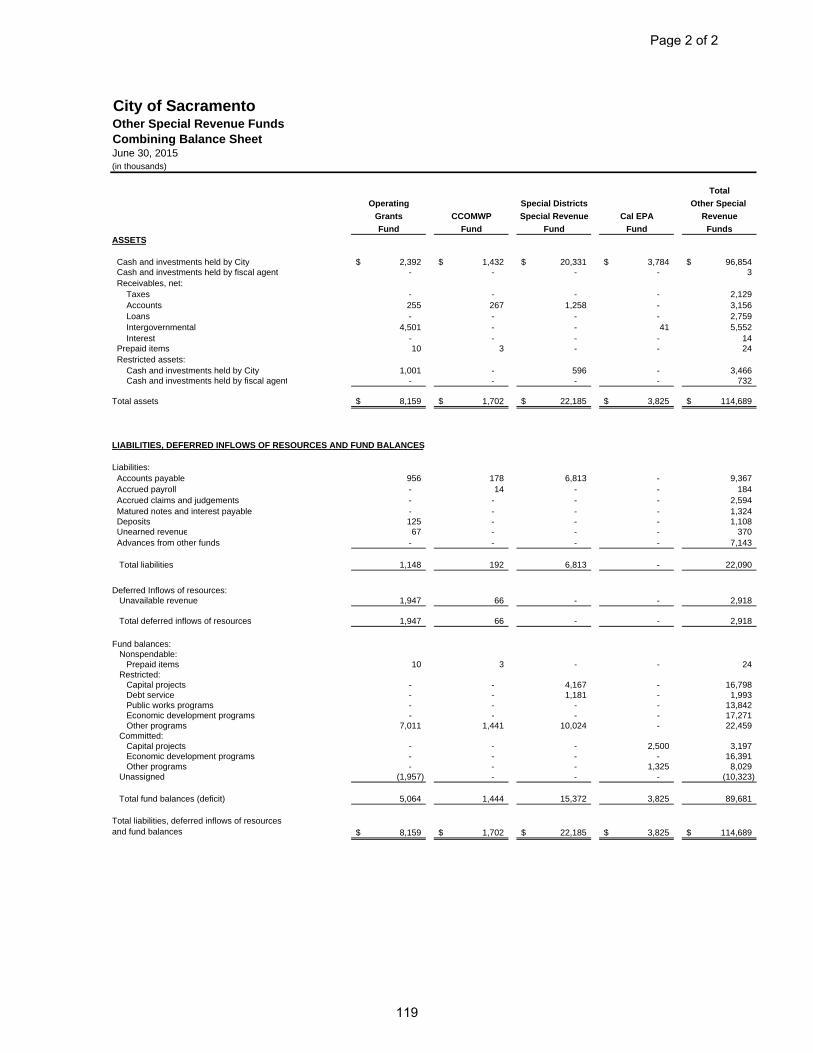
City of SacramentoOther Special Revenue FundsCombining Balance SheetJune 30, 2015(in thousands)
Total
Operating Special Districts Other Special
Grants CCOMWP Special Revenue Cal EPA Revenue
Fund Fund Fund Fund FundsASSETS
Cash and investments held by City 2,392$ 1,432$ 20,331$ 3,784$ 96,854$ Cash and investments held by fiscal agent - - - - 3 Receivables, net: Taxes - - - - 2,129 Accounts 255 267 1,258 - 3,156 Loans - - - - 2,759 Intergovernmental 4,501 - - 41 5,552 Interest - - - - 14 Prepaid items 10 3 - - 24 Restricted assets: Cash and investments held by City 1,001 - 596 - 3,466 Cash and investments held by fiscal agent - - - - 732
Total assets 8,159$ 1,702$ 22,185$ 3,825$ 114,689$
LIABILITIES, DEFERRED INFLOWS OF RESOURCES AND FUND BALANCES
Liabilities: Accounts payable 956 178 6,813 - 9,367 Accrued payroll - 14 - - 184 Accrued claims and judgements - - - - 2,594 Matured notes and interest payable - - - - 1,324 Deposits 125 - - - 1,108 Unearned revenue 67 - - - 370 Advances from other funds - - - - 7,143
Total liabilities 1,148 192 6,813 - 22,090
Deferred Inflows of resources: Unavailable revenue 1,947 66 - - 2,918
Total deferred inflows of resources 1,947 66 - - 2,918
Fund balances:Nonspendable:
Prepaid items 10 3 - - 24 Restricted:
Capital projects - - 4,167 - 16,798 Debt service - - 1,181 - 1,993 Public works programs - - - - 13,842 Economic development programs - - - - 17,271 Other programs 7,011 1,441 10,024 - 22,459
Committed:Capital projects - - - 2,500 3,197 Economic development programs - - - - 16,391 Other programs - - - 1,325 8,029
Unassigned (1,957) - - - (10,323)
Total fund balances (deficit) 5,064 1,444 15,372 3,825 89,681
Total liabilities, deferred inflows of resources and fund balances 8,159$ 1,702$ 22,185$ 3,825$ 114,689$
Page 2 of 2
119
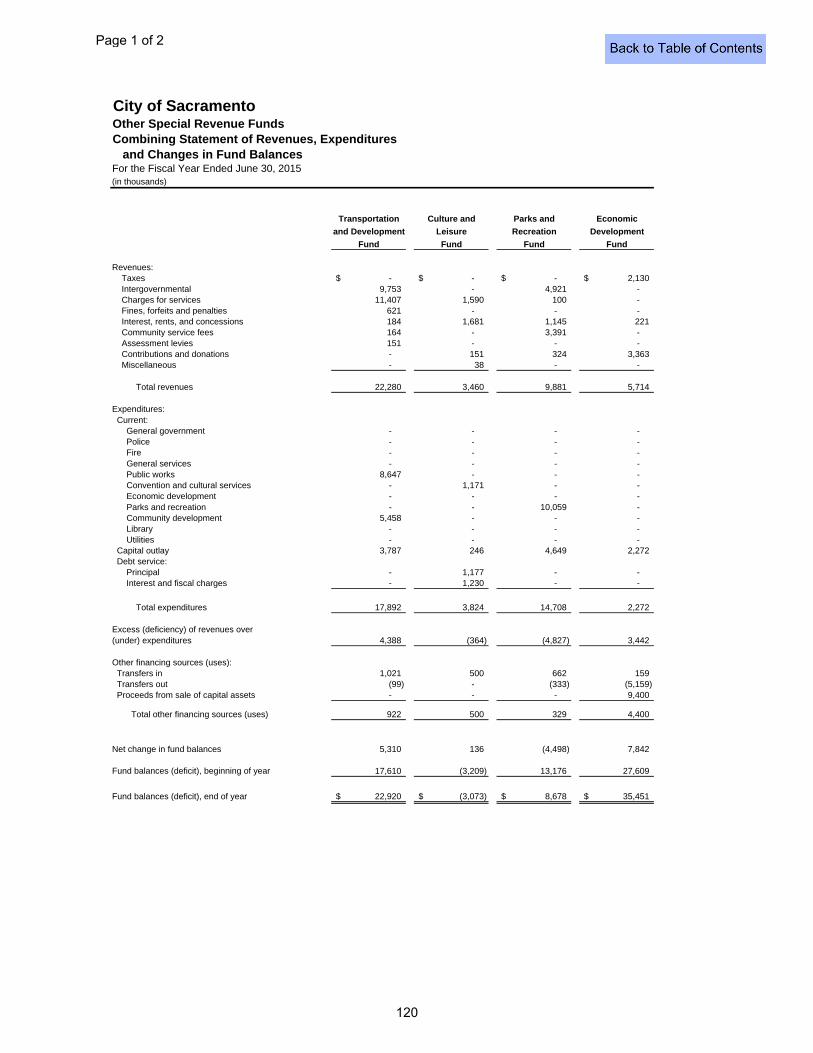
City of SacramentoOther Special Revenue FundsCombining Statement of Revenues, Expenditures and Changes in Fund BalancesFor the Fiscal Year Ended June 30, 2015(in thousands)
Transportation Culture and Parks and Economic
and Development Leisure Recreation Development
Fund Fund Fund Fund
Revenues: Taxes -$ -$ -$ 2,130$ Intergovernmental 9,753 - 4,921 - Charges for services 11,407 1,590 100 - Fines, forfeits and penalties 621 - - - Interest, rents, and concessions 184 1,681 1,145 221 Community service fees 164 - 3,391 - Assessment levies 151 - - - Contributions and donations - 151 324 3,363 Miscellaneous - 38 - -
Total revenues 22,280 3,460 9,881 5,714
Expenditures: Current: General government - - - - Police - - - - Fire - - - - General services - - - - Public works 8,647 - - - Convention and cultural services - 1,171 - - Economic development - - - - Parks and recreation - - 10,059 - Community development 5,458 - - - Library - - - - Utilities - - - - Capital outlay 3,787 246 4,649 2,272 Debt service: Principal - 1,177 - - Interest and fiscal charges - 1,230 - -
Total expenditures 17,892 3,824 14,708 2,272
Excess (deficiency) of revenues over(under) expenditures 4,388 (364) (4,827) 3,442
Other financing sources (uses): Transfers in 1,021 500 662 159 Transfers out (99) - (333) (5,159) Proceeds from sale of capital assets - - - 9,400
Total other financing sources (uses) 922 500 329 4,400
Net change in fund balances 5,310 136 (4,498) 7,842
Fund balances (deficit), beginning of year 17,610 (3,209) 13,176 27,609
Fund balances (deficit), end of year 22,920$ (3,073)$ 8,678$ 35,451$
Page 1 of 2
120
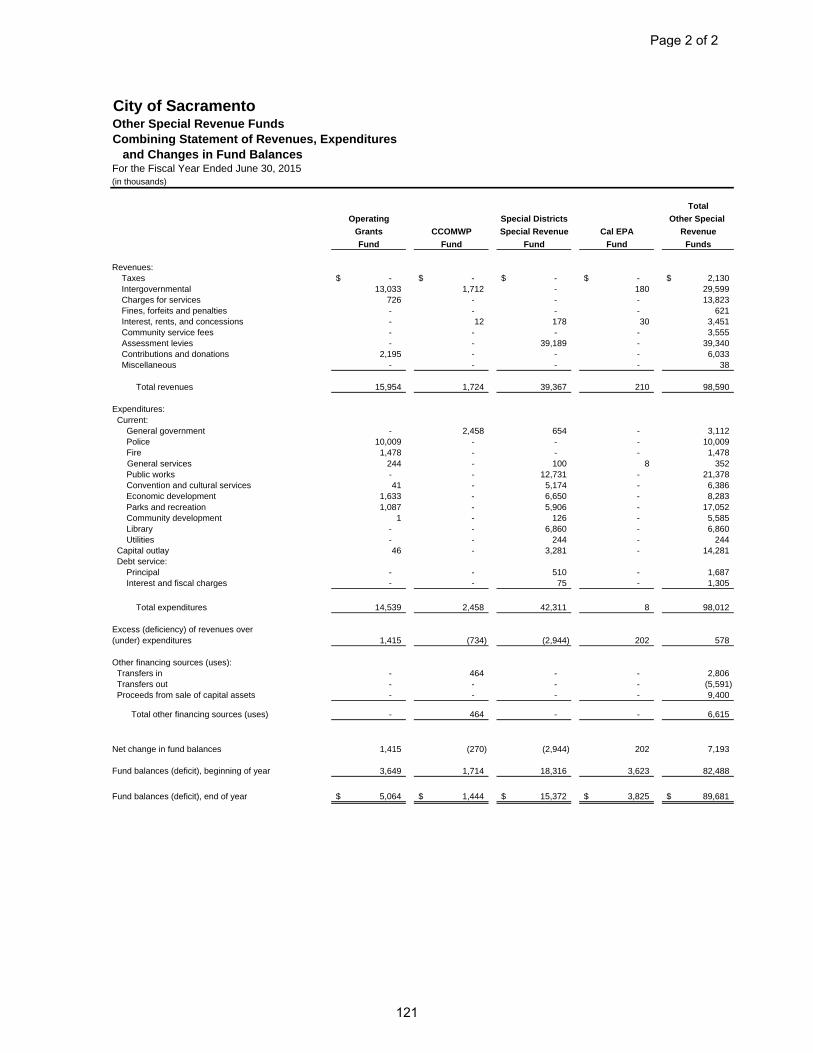
City of SacramentoOther Special Revenue FundsCombining Statement of Revenues, Expenditures and Changes in Fund BalancesFor the Fiscal Year Ended June 30, 2015(in thousands)
Total
Operating Special Districts Other Special
Grants CCOMWP Special Revenue Cal EPA Revenue
Fund Fund Fund Fund Funds
Revenues: Taxes -$ -$ -$ -$ 2,130$ Intergovernmental 13,033 1,712 - 180 29,599 Charges for services 726 - - - 13,823 Fines, forfeits and penalties - - - - 621 Interest, rents, and concessions - 12 178 30 3,451 Community service fees - - - - 3,555 Assessment levies - - 39,189 - 39,340 Contributions and donations 2,195 - - - 6,033 Miscellaneous - - - - 38
Total revenues 15,954 1,724 39,367 210 98,590
Expenditures: Current: General government - 2,458 654 - 3,112 Police 10,009 - - - 10,009 Fire 1,478 - - - 1,478 General services 244 - 100 8 352
Public works - - 12,731 - 21,378 Convention and cultural services 41 - 5,174 - 6,386 Economic development 1,633 - 6,650 - 8,283 Parks and recreation 1,087 - 5,906 - 17,052 Community development 1 - 126 - 5,585 Library - - 6,860 - 6,860 Utilities - - 244 - 244 Capital outlay 46 - 3,281 - 14,281 Debt service: Principal - - 510 - 1,687 Interest and fiscal charges - - 75 - 1,305
Total expenditures 14,539 2,458 42,311 8 98,012
Excess (deficiency) of revenues over(under) expenditures 1,415 (734) (2,944) 202 578
Other financing sources (uses): Transfers in - 464 - - 2,806 Transfers out - - - - (5,591) Proceeds from sale of capital assets - - - - 9,400
Total other financing sources (uses) - 464 - - 6,615
Net change in fund balances 1,415 (270) (2,944) 202 7,193
Fund balances (deficit), beginning of year 3,649 1,714 18,316 3,623 82,488
Fund balances (deficit), end of year 5,064$ 1,444$ 15,372$ 3,825$ 89,681$
Page 2 of 2
121
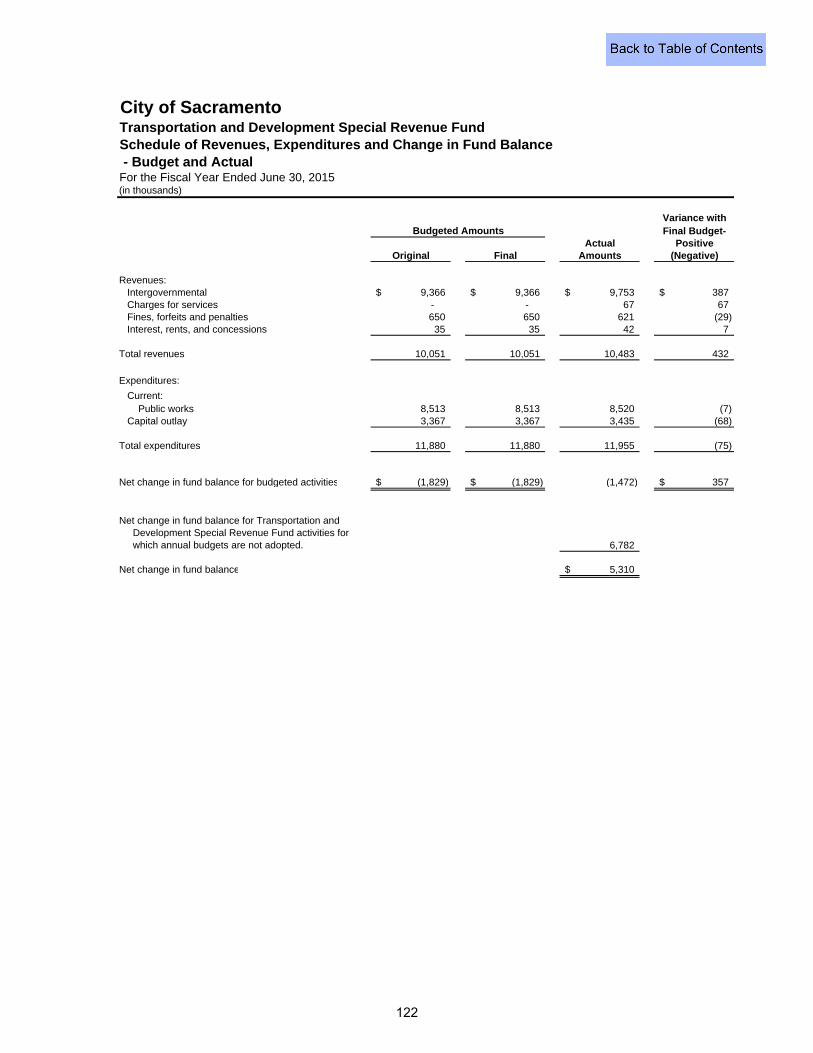
- Budget and Actual
Variance withFinal Budget-
Actual PositiveOriginal Final Amounts (Negative)
Revenues:Intergovernmental 9,366$ 9,366$ 9,753$ 387$ Charges for services - - 67 67 Fines, forfeits and penalties 650 650 621 (29) Interest, rents, and concessions 35 35 42 7
Total revenues 10,051 10,051 10,483 432
Expenditures:
Current: Public works 8,513 8,513 8,520 (7) Capital outlay 3,367 3,367 3,435 (68)
Total expenditures 11,880 11,880 11,955 (75)
Net change in fund balance for budgeted activities (1,829)$ (1,829)$ (1,472) 357$
Net change in fund balance for Transportation and Development Special Revenue Fund activities for which annual budgets are not adopted. 6,782
Net change in fund balance 5,310$
(in thousands)
Budgeted Amounts
City of Sacramento
Schedule of Revenues, Expenditures and Change in Fund Balance
For the Fiscal Year Ended June 30, 2015
Transportation and Development Special Revenue Fund
122

- Budget and Actual
Variance withFinal Budget-
Actual PositiveOriginal Final Amounts (Negative)
Revenues: Charges for services 1,663$ 1,695$ 1,590$ (105)$ Interest, rents and concessions 1,503 1,503 1,670 167 Contributions and donations 45 645 151 (494) Miscellaneous - 38 38 -
Total revenues 3,211 3,881 3,449 (432)
Expenditures: Current:
Convention and cultural services 1,154 1,935 1,155 780 Capital outlay 519 664 246 418 Debt service: Principal 1,230 1,086 1,177 (91)
Interest and fiscal charges 1,192 757 1,230 (473)
Total expenditures 4,095 4,442 3,808 634
Net change in fund balance for budgeted activities (884)$ (561)$ (359) 202$
Other financing sources (uses): Transfers in - 500 500 -
Net change in fund balance for budgeted activities (884)$ (61)$ 141$ 202$
Net change in fund balance for Culture and Leisure Special Revenue Fund activities for which annual budgets are not adopted. (5)
Net change in fund balance 136$
(in thousands)
Budgeted Amounts
City of Sacramento
Schedule of Revenues, Expenditures and Change in Fund Balance
For the Fiscal Year Ended June 30, 2015
Culture and Leisure Special Revenue Fund
123
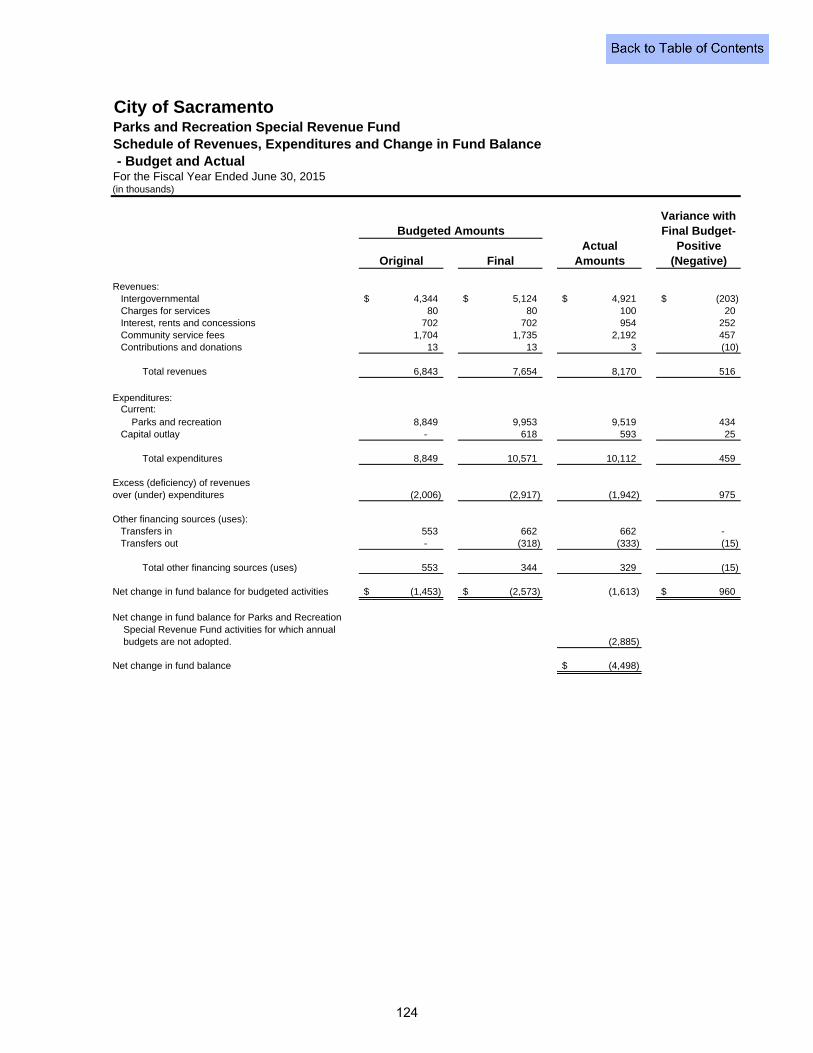
- Budget and Actual
Variance withFinal Budget-
Actual PositiveOriginal Final Amounts (Negative)
Revenues:Intergovernmental 4,344$ 5,124$ 4,921$ (203)$ Charges for services 80 80 100 20 Interest, rents and concessions 702 702 954 252 Community service fees 1,704 1,735 2,192 457 Contributions and donations 13 13 3 (10)
Total revenues 6,843 7,654 8,170 516
Expenditures: Current:
Parks and recreation 8,849 9,953 9,519 434 Capital outlay - 618 593 25
Total expenditures 8,849 10,571 10,112 459
Excess (deficiency) of revenuesover (under) expenditures (2,006) (2,917) (1,942) 975
Other financing sources (uses): Transfers in 553 662 662 - Transfers out - (318) (333) (15)
Total other financing sources (uses) 553 344 329 (15)
Net change in fund balance for budgeted activities (1,453)$ (2,573)$ (1,613) 960$
Net change in fund balance for Parks and Recreation Special Revenue Fund activities for which annual budgets are not adopted. (2,885)
Net change in fund balance (4,498)$
(in thousands)
Budgeted Amounts
City of Sacramento
Schedule of Revenues, Expenditures and Change in Fund Balance
For the Fiscal Year Ended June 30, 2015
Parks and Recreation Special Revenue Fund
124
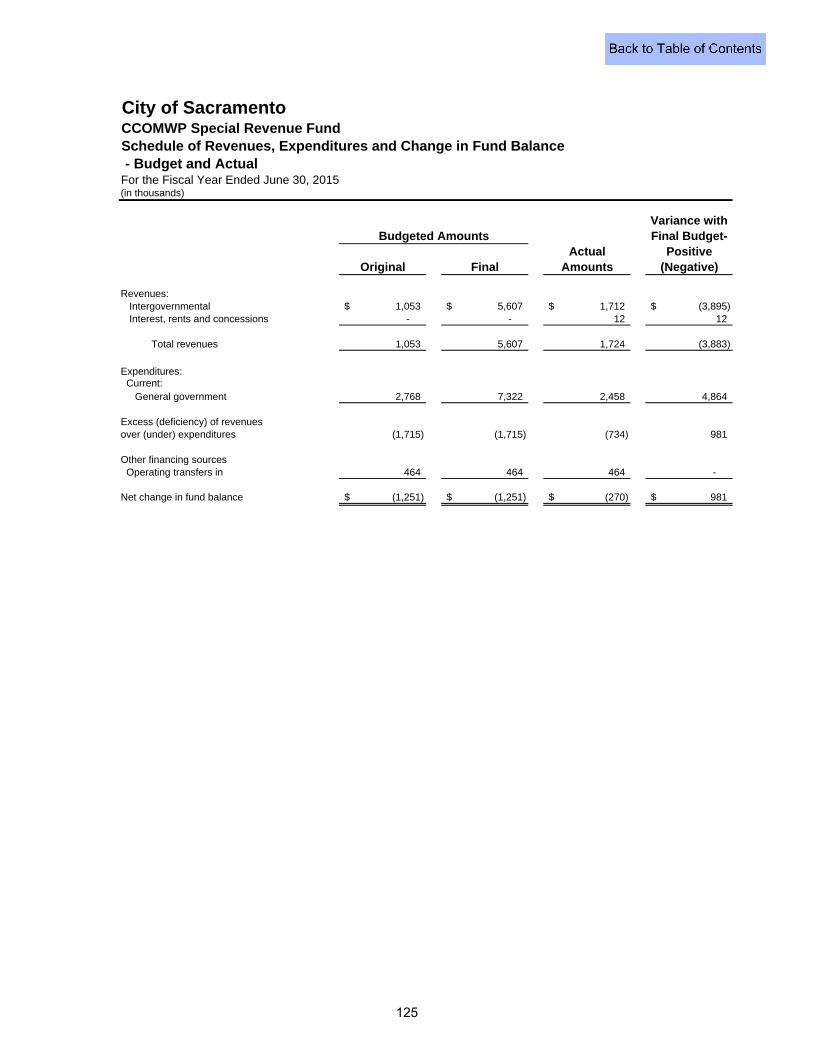
- Budget and Actual
Variance withFinal Budget-
Actual PositiveOriginal Final Amounts (Negative)
Revenues:Intergovernmental 1,053$ 5,607$ 1,712$ (3,895)$ Interest, rents and concessions - - 12 12
Total revenues 1,053 5,607 1,724 (3,883)
Expenditures: Current:
General government 2,768 7,322 2,458 4,864
Excess (deficiency) of revenuesover (under) expenditures (1,715) (1,715) (734) 981
Other financing sources Operating transfers in 464 464 464 -
Net change in fund balance (1,251)$ (1,251)$ (270)$ 981$
Budgeted Amounts
City of SacramentoCCOMWP Special Revenue FundSchedule of Revenues, Expenditures and Change in Fund Balance
For the Fiscal Year Ended June 30, 2015(in thousands)
125
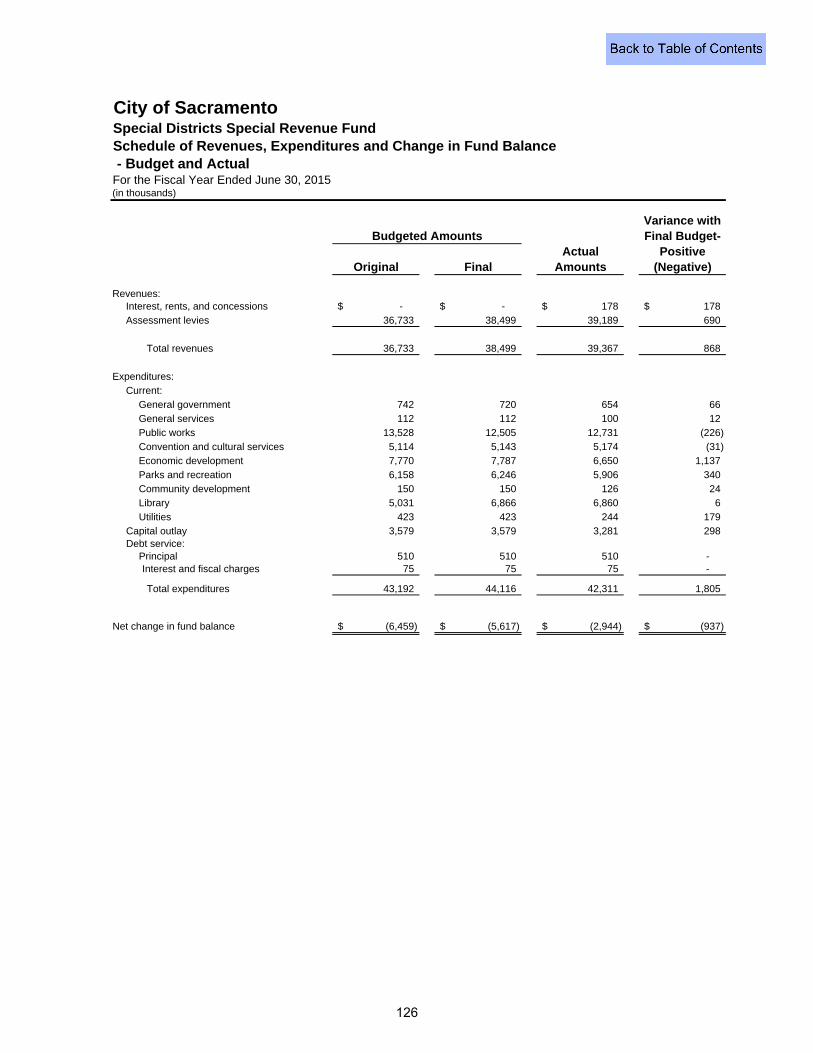
Schedule of Revenues, Expenditures and Change in Fund Balance - Budget and Actual
Variance withFinal Budget-
Actual PositiveOriginal Final Amounts (Negative)
Revenues:Interest, rents, and concessions -$ -$ 178$ 178$
Assessment levies 36,733 38,499 39,189 690
Total revenues 36,733 38,499 39,367 868
Expenditures:
Current:
General government 742 720 654 66
General services 112 112 100 12
Public works 13,528 12,505 12,731 (226)
Convention and cultural services 5,114 5,143 5,174 (31)
Economic development 7,770 7,787 6,650 1,137
Parks and recreation 6,158 6,246 5,906 340
Community development 150 150 126 24
Library 5,031 6,866 6,860 6
Utilities 423 423 244 179
Capital outlay 3,579 3,579 3,281 298 Debt service:
Principal 510 510 510 - Interest and fiscal charges 75 75 75 -
Total expenditures 43,192 44,116 42,311 1,805
Net change in fund balance (6,459)$ (5,617)$ (2,944)$ (937)$
Budgeted Amounts
City of Sacramento
For the Fiscal Year Ended June 30, 2015(in thousands)
Special Districts Special Revenue Fund
126
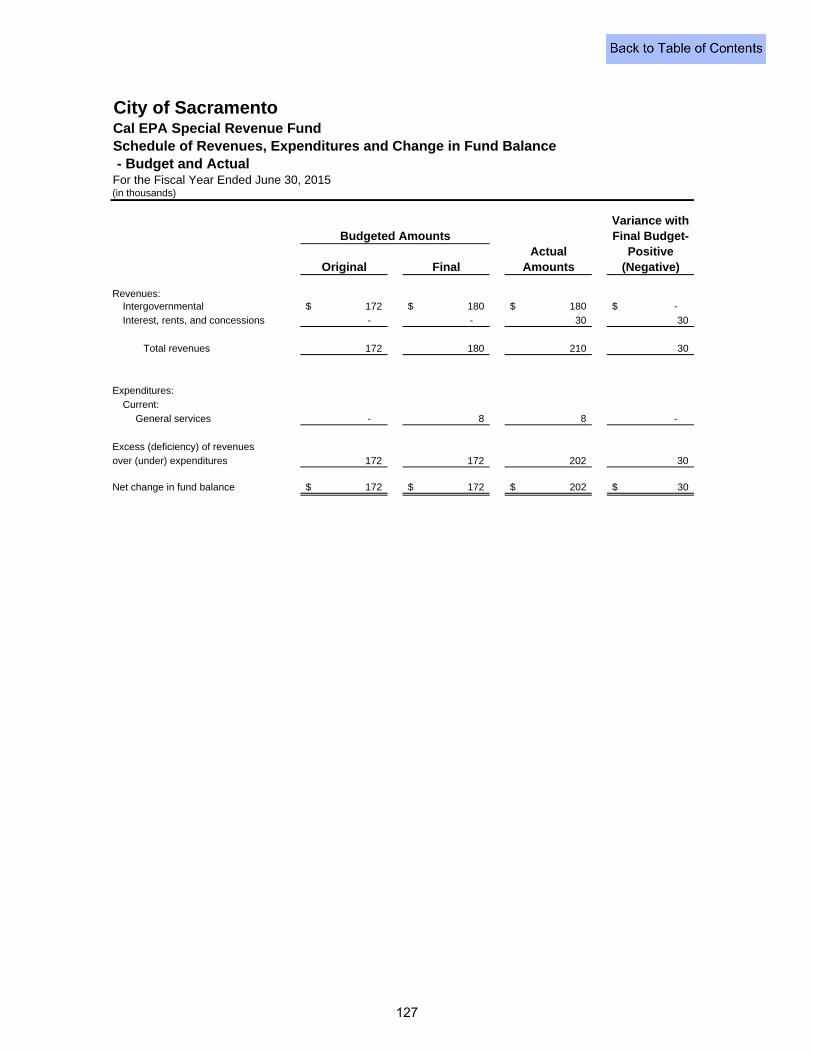
Schedule of Revenues, Expenditures and Change in Fund Balance - Budget and Actual
Variance withFinal Budget-
Actual PositiveOriginal Final Amounts (Negative)
Revenues:Intergovernmental 172$ 180$ 180$ -$
Interest, rents, and concessions - - 30 30
Total revenues 172 180 210 30
Expenditures:
Current:
General services - 8 8 -
Excess (deficiency) of revenues
over (under) expenditures 172 172 202 30
Net change in fund balance 172$ 172$ 202$ 30$
Budgeted Amounts
City of Sacramento
For the Fiscal Year Ended June 30, 2015(in thousands)
Cal EPA Special Revenue Fund
127

THIS PAGE INTENTIONALLY LEFT BLANK
128
OTHER DEBT SERVICE FUNDS
Other debt service funds are used to account for and report financial resources that are restricted, committed or assigned to expenditure for principal and interest, or that are being accumulated for principal and interest maturing in future years. The following debt service funds have been classified as nonmajor funds:
THE 1993 SERIES A REVENUE BOND FUND is used to account for refunded debt service activities related to the City of Sacramento’s 1986 COP issue and for the debt service activity related to the partial refunding of the City of Sacramento’s 1991 Marks-Roos Revenue Bond issuance.
THE 1993 SERIES B REVENUE BOND FUND is used to account for refunded debt service activities related to the City of Sacramento’s 1989 COP issuance. THE 2002 CAPITAL IMPROVEMENT REVENUE BOND FUND is used to account for debt service activities related to financing various capital improvements and redevelopment projects including the new Civic Center, I-5 Arena Interchange and certain fire trucks and fire stations. These bonds were partially refunded with the 2005 Refunding Revenue Bonds, and with the 2006 Series E Refunding Revenue Bonds. THE 2003 CAPITAL IMPROVEMENT REVENUE BOND FUND is used to account for debt service activities related to financing the acquisition and construction of the 911 Dispatch and Training Facility, a regional park, a corporation yard, a library, fire stations and other municipal projects. These bonds were partially refunded by the 2006 Series E Refunding Revenue Bonds. THE 2005 REFUNDING REVENUE BOND FUND is used to account for refunded debt service related to refinancing all of the 2000 Capital Improvement Revenue Bonds and a portion of the 1999, 2001 and 2002 Capital Improvement Revenue Bonds. THE 2006 SERIES A REVENUE BOND FUND is used to account for debt service activities related to financing the expansion of the Crocker Art Museum and other public capital improvements and redevelopment projects. THE 2006 SERIES B REVENUE BOND FUND is used to account for debt service activities related to financing an arts rehearsal facility and other public capital improvements and redevelopment projects. THE 2006 SERIES C REVENUE BOND FUND is used to account for debt service activities related to financing the City’s new Richards Boulevard building and improvements.
OTHER DEBT SERVICE FUNDS (continued)
THE 2006 SERIES D REVENUE BOND FUND is used to account for debt service activities related to financing the City’s new Richards Boulevard building and improvements. THE 2006 SERIES E REVENUE BOND FUND is used to account for refunding debt service related to refinancing all of the 2001 Capital Improvement Revenue Bonds and a portion of the 2002 and 2003 Capital Improvement Revenue Bonds. THE 2015 GOLDEN 1 CENTER REVENUE BOND FUND is used to account for debt service activities related to financing a portion of the costs of construction of a multi-purpose entertainment and sports center located in the downtown area of the City. THE OTHER CITY DEBT FUND is used to account for debt service activities related to financing equipment for street lighting and other programs of the City.
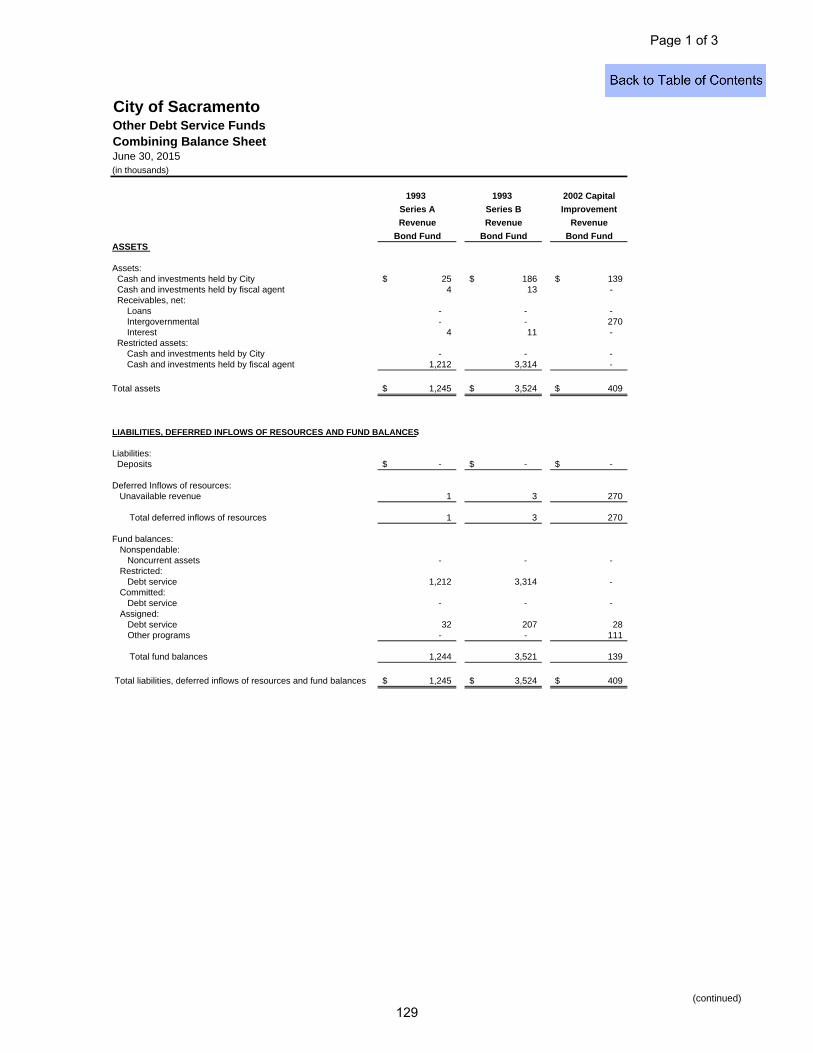
City of SacramentoOther Debt Service FundsCombining Balance SheetJune 30, 2015(in thousands)
1993 1993 2002 Capital
Series A Series B Improvement
Revenue Revenue Revenue
Bond Fund Bond Fund Bond FundASSETS
Assets: Cash and investments held by City 25$ 186$ 139$ Cash and investments held by fiscal agent 4 13 - Receivables, net: Loans - - - Intergovernmental - - 270 Interest 4 11 - Restricted assets: Cash and investments held by City - - - Cash and investments held by fiscal agent 1,212 3,314 -
Total assets 1,245$ 3,524$ 409$
Liabilities: Deposits -$ -$ -$
Deferred Inflows of resources: Unavailable revenue 1 3 270
Total deferred inflows of resources 1 3 270
Fund balances: Nonspendable:
Noncurrent assets - - - Restricted:
Debt service 1,212 3,314 - Committed:
Debt service - - - Assigned:
Debt service 32 207 28 Other programs - - 111
Total fund balances 1,244 3,521 139
Total liabilities, deferred inflows of resources and fund balances 1,245$ 3,524$ 409$
LIABILITIES, DEFERRED INFLOWS OF RESOURCES AND FUND BALANCES
(continued)
Page 1 of 3
129
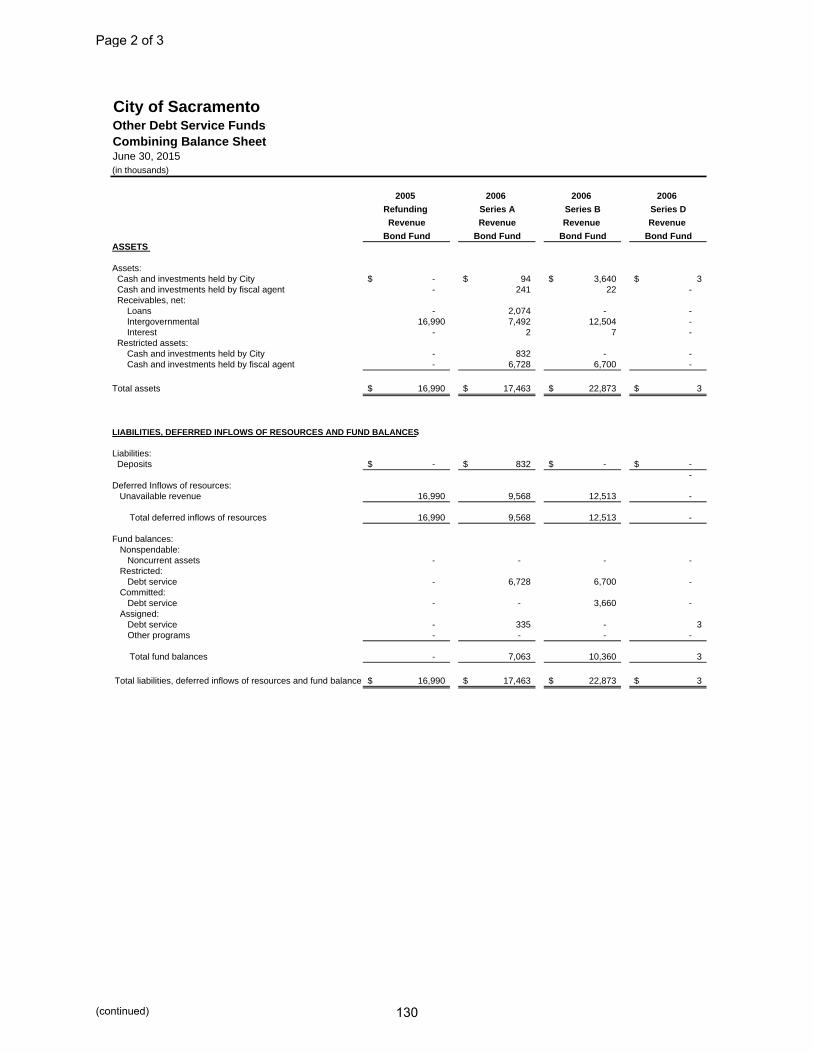
City of SacramentoOther Debt Service FundsCombining Balance SheetJune 30, 2015(in thousands)
2005 2006 2006 2006
Refunding Series A Series B Series D
Revenue Revenue Revenue Revenue
Bond Fund Bond Fund Bond Fund Bond FundASSETS
Assets: Cash and investments held by City -$ 94$ 3,640$ 3$ Cash and investments held by fiscal agent - 241 22 - Receivables, net: Loans - 2,074 - - Intergovernmental 16,990 7,492 12,504 - Interest - 2 7 - Restricted assets: Cash and investments held by City - 832 - - Cash and investments held by fiscal agent - 6,728 6,700 -
Total assets 16,990$ 17,463$ 22,873$ 3$
Liabilities: Deposits -$ 832$ -$ -$
-Deferred Inflows of resources: Unavailable revenue 16,990 9,568 12,513 -
Total deferred inflows of resources 16,990 9,568 12,513 -
Fund balances: Nonspendable:
Noncurrent assets - - - -Restricted:
Debt service - 6,728 6,700 -Committed:
Debt service - - 3,660 -Assigned:
Debt service - 335 - 3Other programs - - - -
Total fund balances - 7,063 10,360 3
Total liabilities, deferred inflows of resources and fund balances 16,990$ 17,463$ 22,873$ 3$
LIABILITIES, DEFERRED INFLOWS OF RESOURCES AND FUND BALANCES
Page 2 of 3
130(continued)
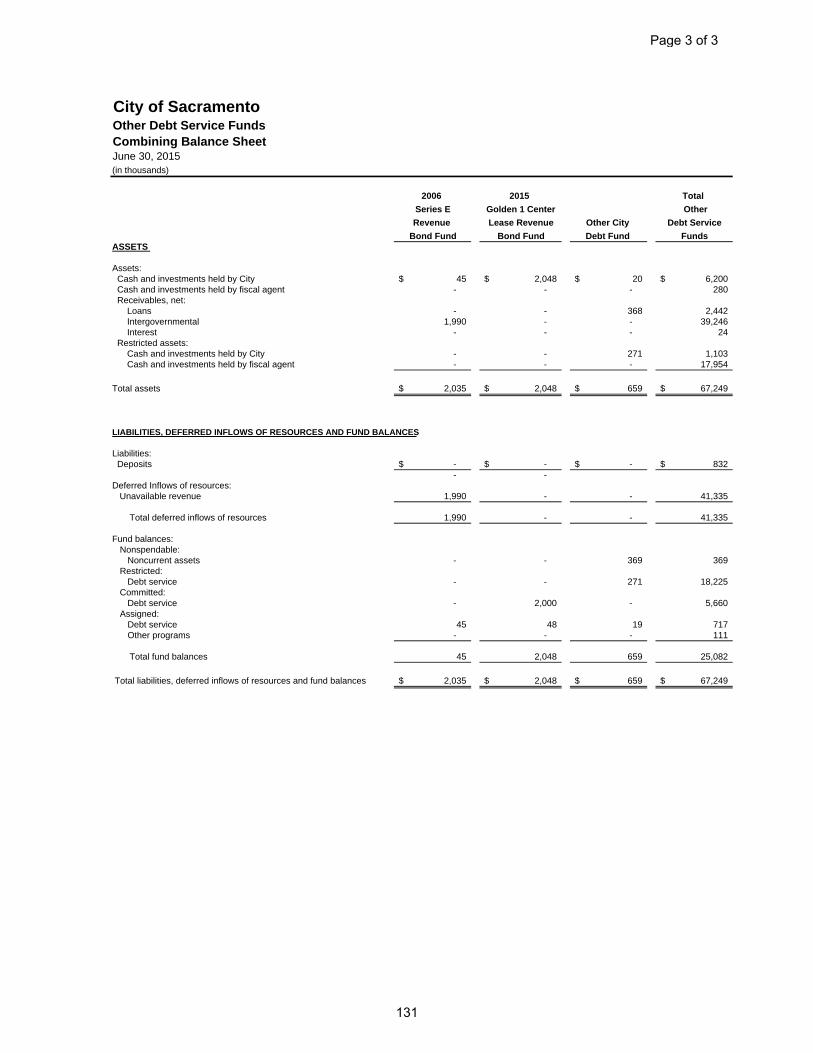
City of SacramentoOther Debt Service FundsCombining Balance SheetJune 30, 2015(in thousands)
2006 2015 Total
Series E Golden 1 Center Other
Revenue Lease Revenue Other City Debt Service
Bond Fund Bond Fund Debt Fund FundsASSETS
Assets: Cash and investments held by City 45$ 2,048$ 20$ 6,200$ Cash and investments held by fiscal agent - - - 280 Receivables, net: Loans - - 368 2,442 Intergovernmental 1,990 - - 39,246 Interest - - - 24 Restricted assets: Cash and investments held by City - - 271 1,103 Cash and investments held by fiscal agent - - - 17,954
Total assets 2,035$ 2,048$ 659$ 67,249$
Liabilities: Deposits -$ -$ -$ 832$
- -Deferred Inflows of resources: Unavailable revenue 1,990 - - 41,335
Total deferred inflows of resources 1,990 - - 41,335
Fund balances: Nonspendable:
Noncurrent assets - - 369 369Restricted:
Debt service - - 271 18,225Committed:
Debt service - 2,000 - 5,660Assigned:
Debt service 45 48 19 717Other programs - - - 111
Total fund balances 45 2,048 659 25,082
Total liabilities, deferred inflows of resources and fund balances 2,035$ 2,048$ 659$ 67,249$
LIABILITIES, DEFERRED INFLOWS OF RESOURCES AND FUND BALANCES
Page 3 of 3
131
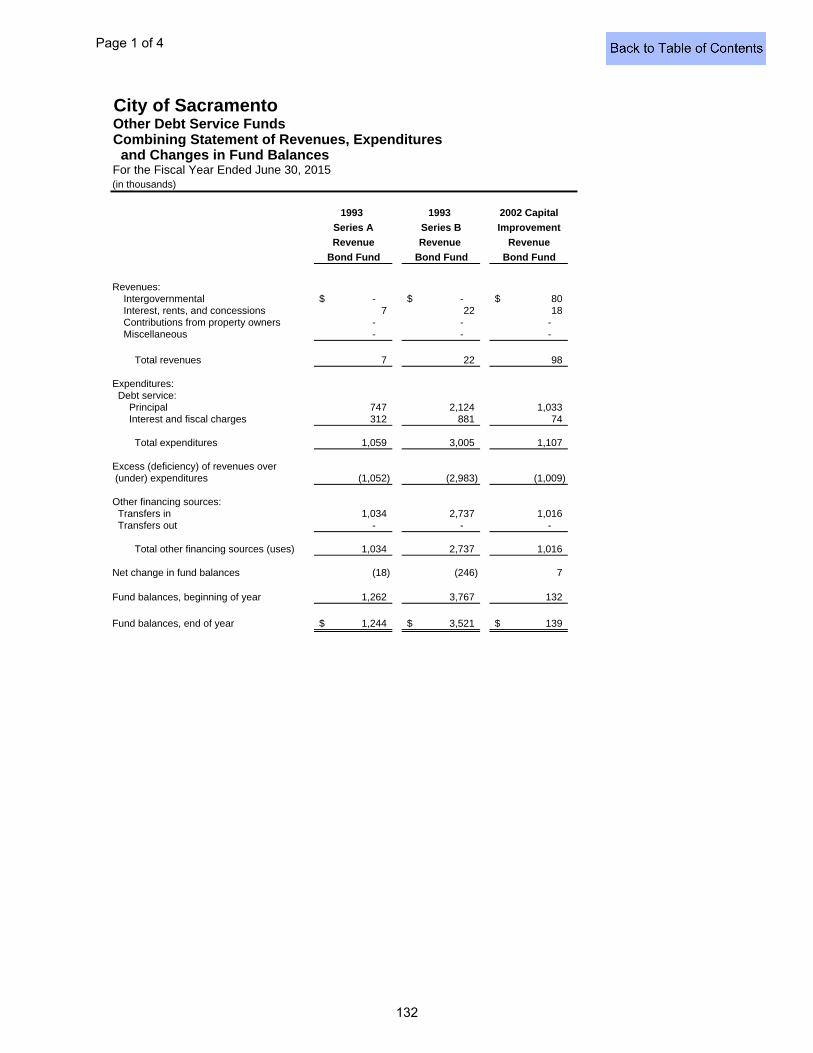
City of SacramentoOther Debt Service FundsCombining Statement of Revenues, Expenditures and Changes in Fund BalancesFor the Fiscal Year Ended June 30, 2015(in thousands)
1993 1993 2002 Capital
Series A Series B Improvement
Revenue Revenue Revenue
Bond Fund Bond Fund Bond Fund
Revenues: Intergovernmental -$ -$ 80$ Interest, rents, and concessions 7 22 18 Contributions from property owners - - - Miscellaneous - - -
Total revenues 7 22 98
Expenditures: Debt service: Principal 747 2,124 1,033 Interest and fiscal charges 312 881 74
Total expenditures 1,059 3,005 1,107
Excess (deficiency) of revenues over (under) expenditures (1,052) (2,983) (1,009)
Other financing sources: Transfers in 1,034 2,737 1,016 Transfers out - - -
Total other financing sources (uses) 1,034 2,737 1,016
Net change in fund balances (18) (246) 7
Fund balances, beginning of year 1,262 3,767 132
Fund balances, end of year 1,244$ 3,521$ 139$
Page 1 of 4
132
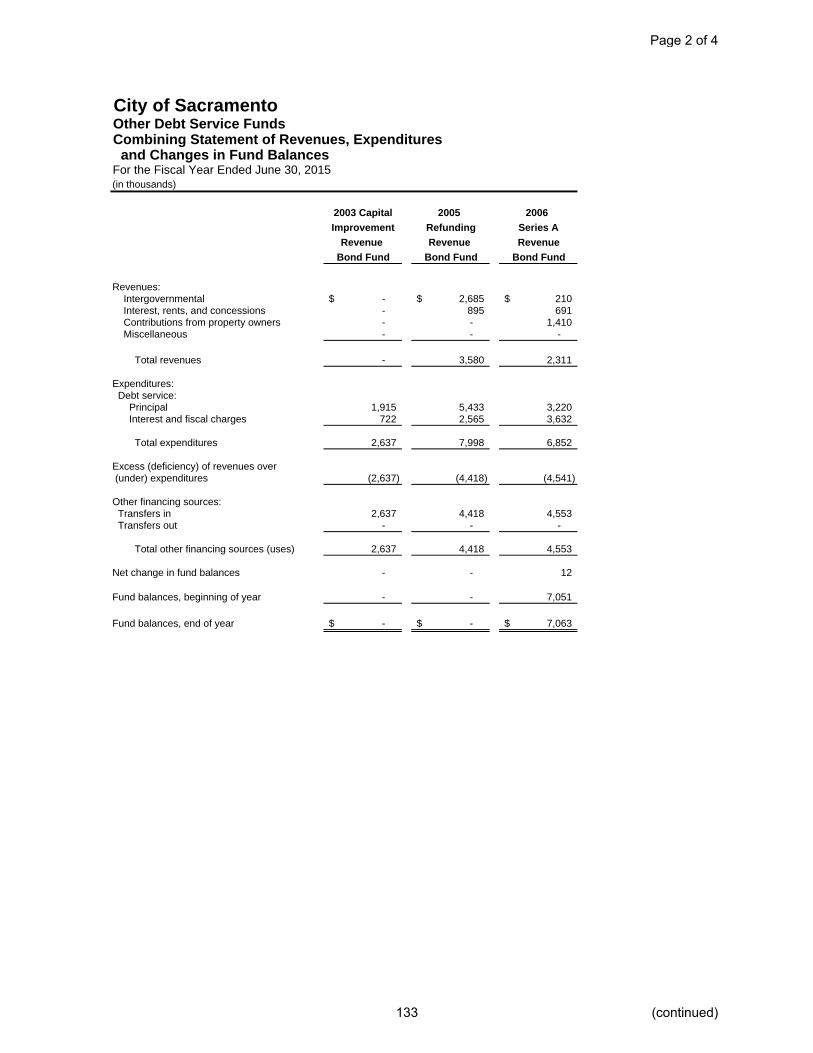
City of SacramentoOther Debt Service FundsCombining Statement of Revenues, Expenditures and Changes in Fund BalancesFor the Fiscal Year Ended June 30, 2015(in thousands)
2003 Capital 2005 2006
Improvement Refunding Series A
Revenue Revenue Revenue
Bond Fund Bond Fund Bond Fund
Revenues: Intergovernmental -$ 2,685$ 210$ Interest, rents, and concessions - 895 691 Contributions from property owners - - 1,410 Miscellaneous - - -
Total revenues - 3,580 2,311
Expenditures: Debt service: Principal 1,915 5,433 3,220 Interest and fiscal charges 722 2,565 3,632
Total expenditures 2,637 7,998 6,852
Excess (deficiency) of revenues over (under) expenditures (2,637) (4,418) (4,541)
Other financing sources: Transfers in 2,637 4,418 4,553 Transfers out - - -
Total other financing sources (uses) 2,637 4,418 4,553
Net change in fund balances - - 12
Fund balances, beginning of year - - 7,051
Fund balances, end of year -$ -$ 7,063$
(continued)
Page 2 of 4
133
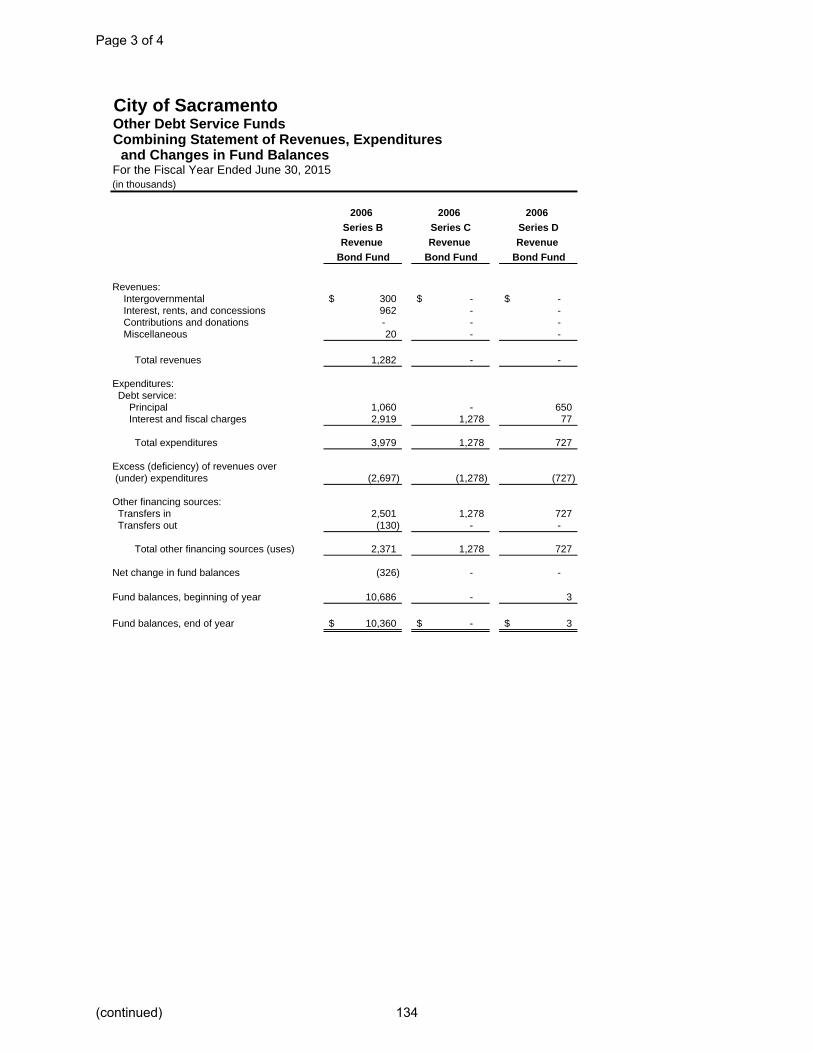
City of SacramentoOther Debt Service FundsCombining Statement of Revenues, Expenditures and Changes in Fund BalancesFor the Fiscal Year Ended June 30, 2015(in thousands)
2006 2006 2006
Series B Series C Series D
Revenue Revenue Revenue
Bond Fund Bond Fund Bond Fund
Revenues: Intergovernmental 300$ -$ -$ Interest, rents, and concessions 962 - - Contributions and donations - - - Miscellaneous 20 - -
Total revenues 1,282 - -
Expenditures: Debt service: Principal 1,060 - 650 Interest and fiscal charges 2,919 1,278 77
Total expenditures 3,979 1,278 727
Excess (deficiency) of revenues over (under) expenditures (2,697) (1,278) (727)
Other financing sources: Transfers in 2,501 1,278 727 Transfers out (130) - -
Total other financing sources (uses) 2,371 1,278 727
Net change in fund balances (326) - -
Fund balances, beginning of year 10,686 - 3
Fund balances, end of year 10,360$ -$ 3$
Page 3 of 4
(continued) 134
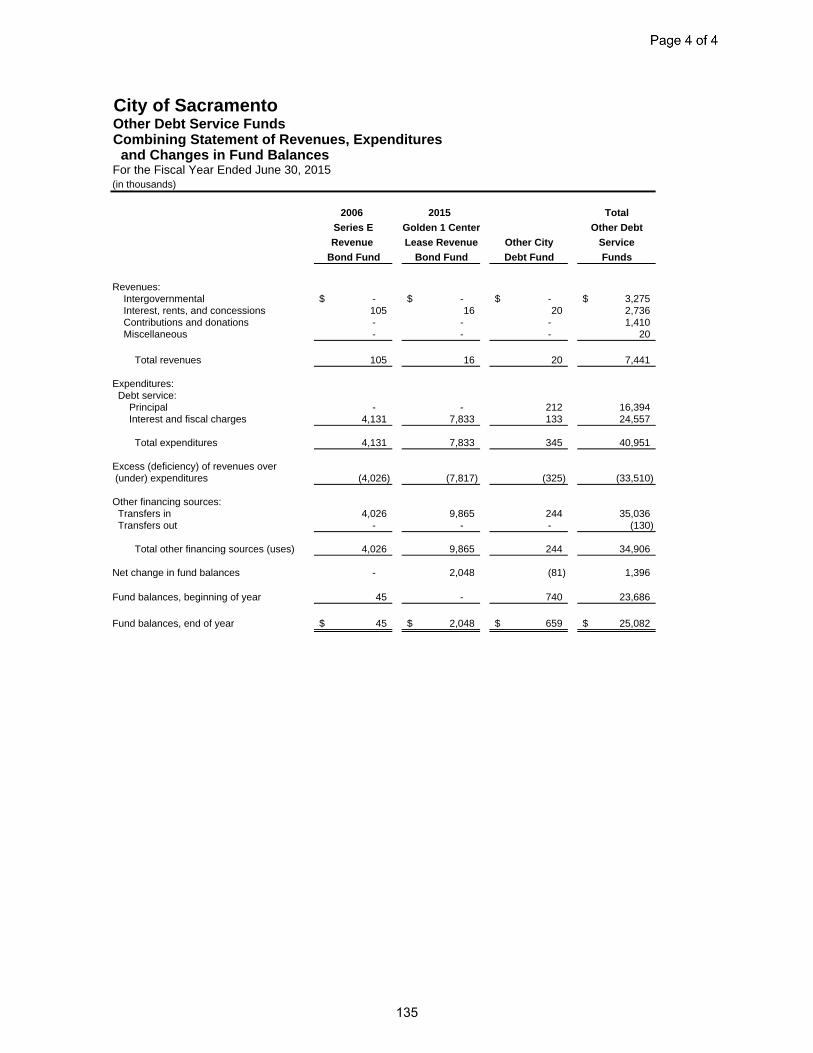
City of SacramentoOther Debt Service FundsCombining Statement of Revenues, Expenditures and Changes in Fund BalancesFor the Fiscal Year Ended June 30, 2015(in thousands)
2006 2015 Total
Series E Golden 1 Center Other Debt
Revenue Lease Revenue Other City Service
Bond Fund Bond Fund Debt Fund Funds
Revenues: Intergovernmental -$ -$ -$ 3,275$ Interest, rents, and concessions 105 16 20 2,736 Contributions and donations - - - 1,410 Miscellaneous - - - 20
Total revenues 105 16 20 7,441
Expenditures: Debt service: Principal - - 212 16,394 Interest and fiscal charges 4,131 7,833 133 24,557
Total expenditures 4,131 7,833 345 40,951
Excess (deficiency) of revenues over (under) expenditures (4,026) (7,817) (325) (33,510)
Other financing sources: Transfers in 4,026 9,865 244 35,036 Transfers out - - - (130)
Total other financing sources (uses) 4,026 9,865 244 34,906
Net change in fund balances - 2,048 (81) 1,396
Fund balances, beginning of year 45 - 740 23,686
Fund balances, end of year 45$ 2,048$ 659$ 25,082$
135

THIS PAGE INTENTIONALLY LEFT BLANK
136
OTHER CAPITAL PROJECTS FUNDS
Other capital projects funds are used to account for and report financial resources that are restricted, committed or assigned to expenditure for governmental capital assets. The following capital projects funds have been classified as nonmajor funds:
THE GENERAL FUND CAPITAL PROJECTS FUND is used to account for the proceeds of bond issues and associated capital projects.
THE TRANSPORTATION AND DEVELOPMENT CAPITAL PROJECTS FUND is used to account for the receipts of taxes and fees which are used to construct transportation-related capital projects. THE CROCKER ART MUSEUM EXPANSION FUND is used to account for contributions from the Crocker Art Museum Association (CAMA) and related expenditures for the museum expansion project. THE FINANCING PLANS FUND is used to account for the construction of public infrastructure funded by developer impact fees authorized under financing plans. THE SPECIAL DISTRICTS CAPITAL PROJECTS FUND is used to account for the proceeds of special assessment bond issues which are used in the construction of street lighting, curbs, gutters, sidewalks and drainage infrastructure.

THIS PAGE INTENTIONALLY LEFT BLANK
137
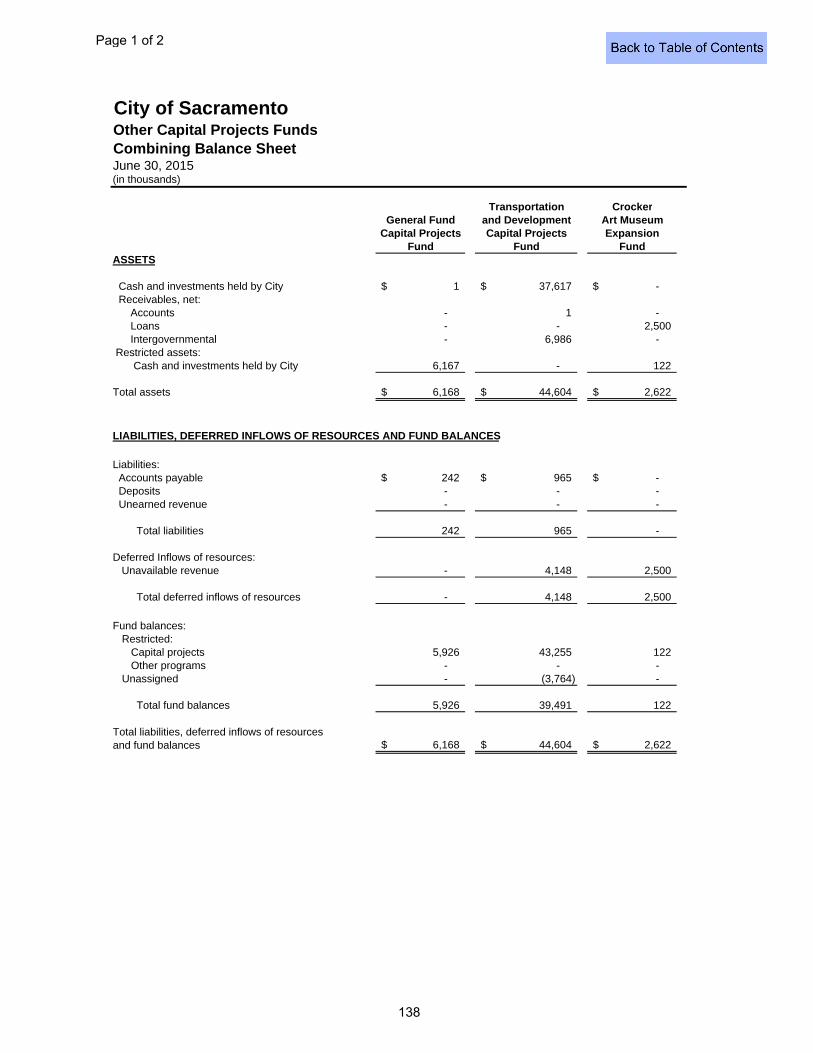
City of SacramentoOther Capital Projects FundsCombining Balance SheetJune 30, 2015(in thousands)
Transportation CrockerGeneral Fund and Development Art Museum
Capital Projects Capital Projects ExpansionFund Fund Fund
ASSETS
Cash and investments held by City 1$ 37,617$ -$ Receivables, net: Accounts - 1 - Loans - - 2,500 Intergovernmental - 6,986 - Restricted assets: Cash and investments held by City 6,167 - 122
Total assets 6,168$ 44,604$ 2,622$
LIABILITIES, DEFERRED INFLOWS OF RESOURCES AND FUND BALANCES
Liabilities: Accounts payable 242$ 965$ -$ Deposits - - - Unearned revenue - - -
Total liabilities 242 965 -
Deferred Inflows of resources: Unavailable revenue - 4,148 2,500
Total deferred inflows of resources - 4,148 2,500
Fund balances: Restricted:
Capital projects 5,926 43,255 122 Other programs - - -
Unassigned - (3,764) -
Total fund balances 5,926 39,491 122
Total liabilities, deferred inflows of resources and fund balances 6,168$ 44,604$ 2,622$
Page 1 of 2
138
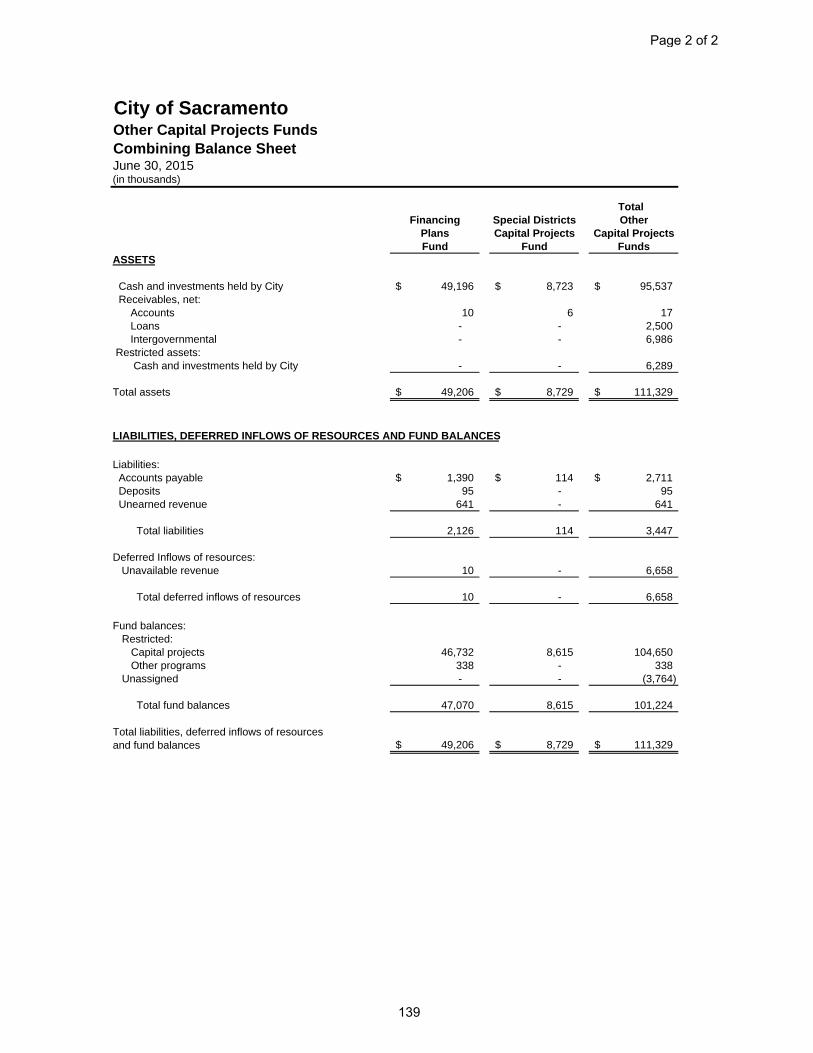
City of SacramentoOther Capital Projects FundsCombining Balance SheetJune 30, 2015(in thousands)
Total Financing Special Districts Other
Plans Capital Projects Capital ProjectsFund Fund Funds
ASSETS
Cash and investments held by City 49,196$ 8,723$ 95,537$ Receivables, net: Accounts 10 6 17 Loans - - 2,500 Intergovernmental - - 6,986 Restricted assets: Cash and investments held by City - - 6,289
Total assets 49,206$ 8,729$ 111,329$
LIABILITIES, DEFERRED INFLOWS OF RESOURCES AND FUND BALANCES
Liabilities: Accounts payable 1,390$ 114$ 2,711$ Deposits 95 - 95 Unearned revenue 641 - 641
Total liabilities 2,126 114 3,447
Deferred Inflows of resources: Unavailable revenue 10 - 6,658
Total deferred inflows of resources 10 - 6,658
Fund balances: Restricted:
Capital projects 46,732 8,615 104,650 Other programs 338 - 338
Unassigned - - (3,764)
Total fund balances 47,070 8,615 101,224
Total liabilities, deferred inflows of resources and fund balances 49,206$ 8,729$ 111,329$
Page 2 of 2
139
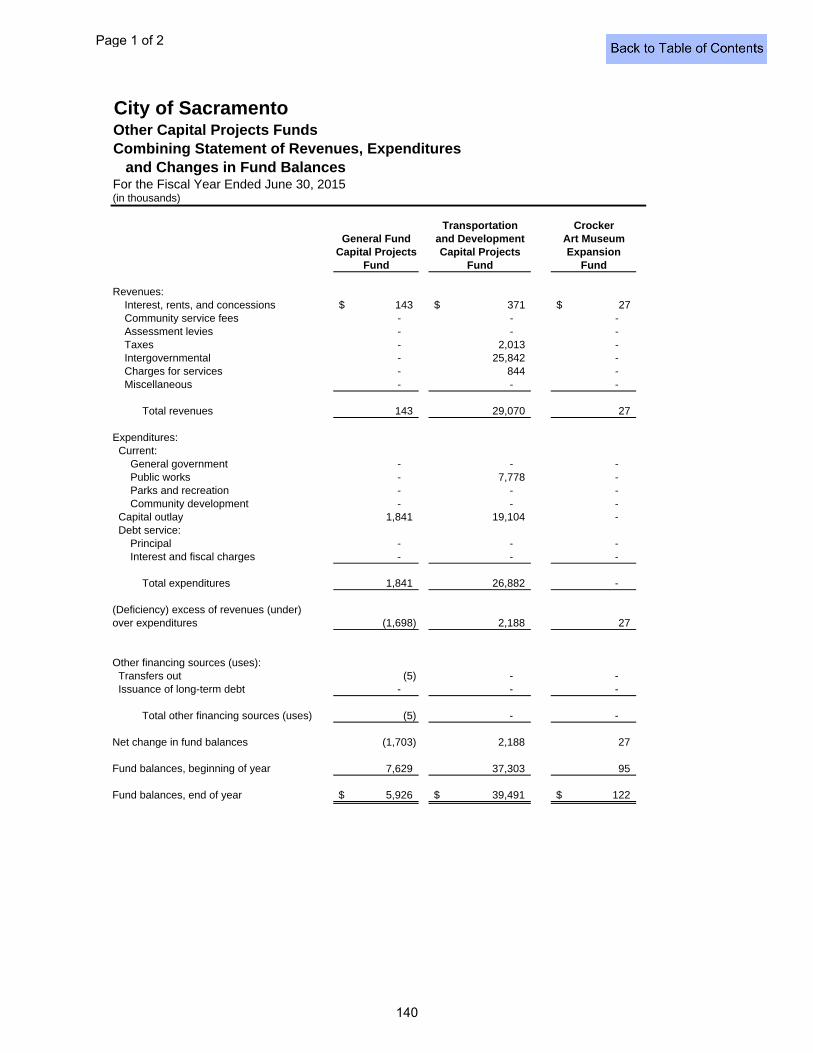
City of SacramentoOther Capital Projects FundsCombining Statement of Revenues, Expenditures and Changes in Fund BalancesFor the Fiscal Year Ended June 30, 2015(in thousands)
Transportation CrockerGeneral Fund and Development Art Museum
Capital Projects Capital Projects ExpansionFund Fund Fund
Revenues: Interest, rents, and concessions 143$ 371$ 27$ Community service fees - - - Assessment levies - - - Taxes - 2,013 - Intergovernmental - 25,842 - Charges for services - 844 - Miscellaneous - - -
Total revenues 143 29,070 27
Expenditures: Current: General government - - - Public works - 7,778 - Parks and recreation - - - Community development - - - Capital outlay 1,841 19,104 - Debt service: Principal - - - Interest and fiscal charges - - -
Total expenditures 1,841 26,882 -
(Deficiency) excess of revenues (under)over expenditures (1,698) 2,188 27
Other financing sources (uses): Transfers out (5) - - Issuance of long-term debt - - -
Total other financing sources (uses) (5) - -
Net change in fund balances (1,703) 2,188 27
Fund balances, beginning of year 7,629 37,303 95
Fund balances, end of year 5,926$ 39,491$ 122$
Page 1 of 2
140
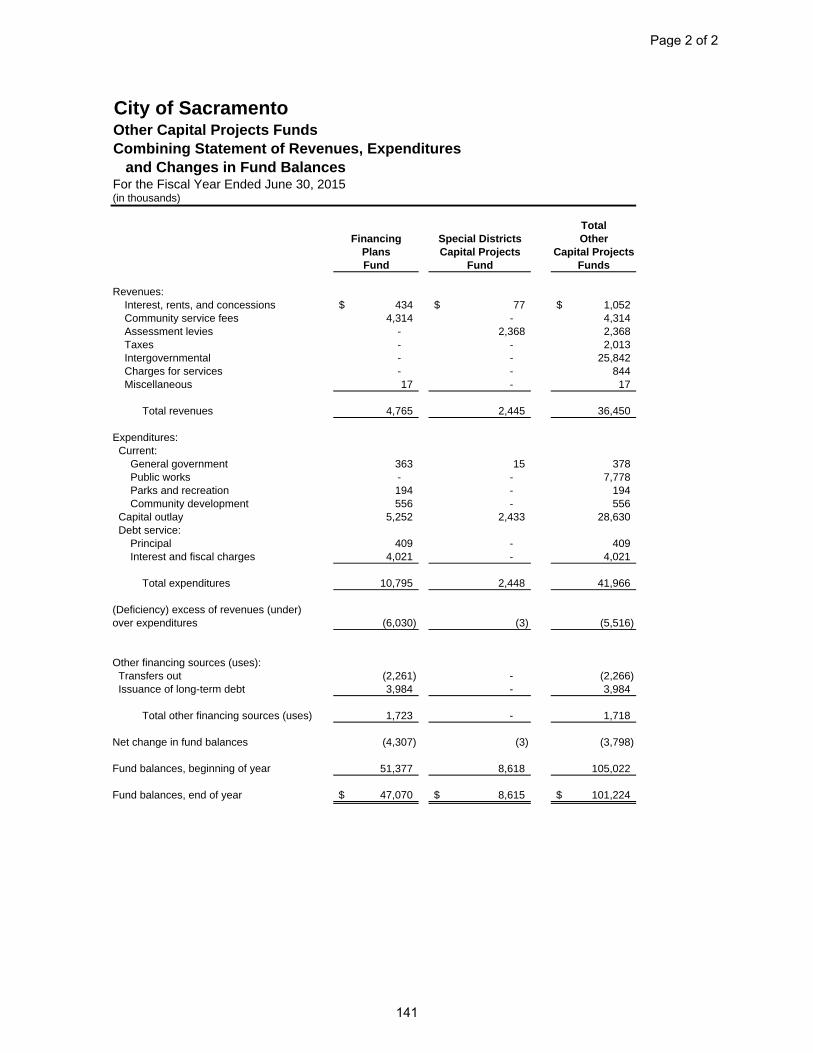
City of SacramentoOther Capital Projects FundsCombining Statement of Revenues, Expenditures and Changes in Fund BalancesFor the Fiscal Year Ended June 30, 2015(in thousands)
TotalFinancing Special Districts Other
Plans Capital Projects Capital ProjectsFund Fund Funds
Revenues: Interest, rents, and concessions 434$ 77$ 1,052$ Community service fees 4,314 - 4,314 Assessment levies - 2,368 2,368 Taxes - - 2,013 Intergovernmental - - 25,842 Charges for services - - 844 Miscellaneous 17 - 17
Total revenues 4,765 2,445 36,450
Expenditures: Current: General government 363 15 378 Public works - - 7,778 Parks and recreation 194 - 194 Community development 556 - 556 Capital outlay 5,252 2,433 28,630 Debt service: Principal 409 - 409 Interest and fiscal charges 4,021 - 4,021
Total expenditures 10,795 2,448 41,966
(Deficiency) excess of revenues (under)over expenditures (6,030) (3) (5,516)
Other financing sources (uses): Transfers out (2,261) - (2,266) Issuance of long-term debt 3,984 - 3,984
Total other financing sources (uses) 1,723 - 1,718
Net change in fund balances (4,307) (3) (3,798)
Fund balances, beginning of year 51,377 8,618 105,022
Fund balances, end of year 47,070$ 8,615$ 101,224$
Page 2 of 2
141

THIS PAGE INTENTIONALLY LEFT BLANK
142
PERMANENT FUNDS
Permanent funds are used to account for and report resources that are held by the City which are legally restricted to the extent that only earnings may be used for purposes that support City programs. The resources must be spent as provided in legal trust agreements and related state laws. The following permanent funds have been classified as nonmajor funds: THE ANN LAND FUND is used to account for gifts to the City. The
investment income is available to aid destitute persons in the City. THE BERTHA HENSCHEL FUND is used to account for gifts to the City.
The investment income is available to aid destitute persons in the City. THE GEORGE CLARK SCHOLARSHIP FUND is used to account for an
endowment established by George Clark, Mayor of Sacramento in 1900. The investment income is available to provide college scholarships for Sacramento high school seniors.
THE ALICE MILLER FUND is used to account for gifts to the City. The
investment income is available to care for a specific area of the Old City Cemetery.
THE SACRAMENTO HISTORY MUSEUM FUND is used to account for gifts to the Museum. The investment income is available to help pay the operating expenses of the Museum.

THIS PAGE INTENTIONALLY LEFT BLANK
143
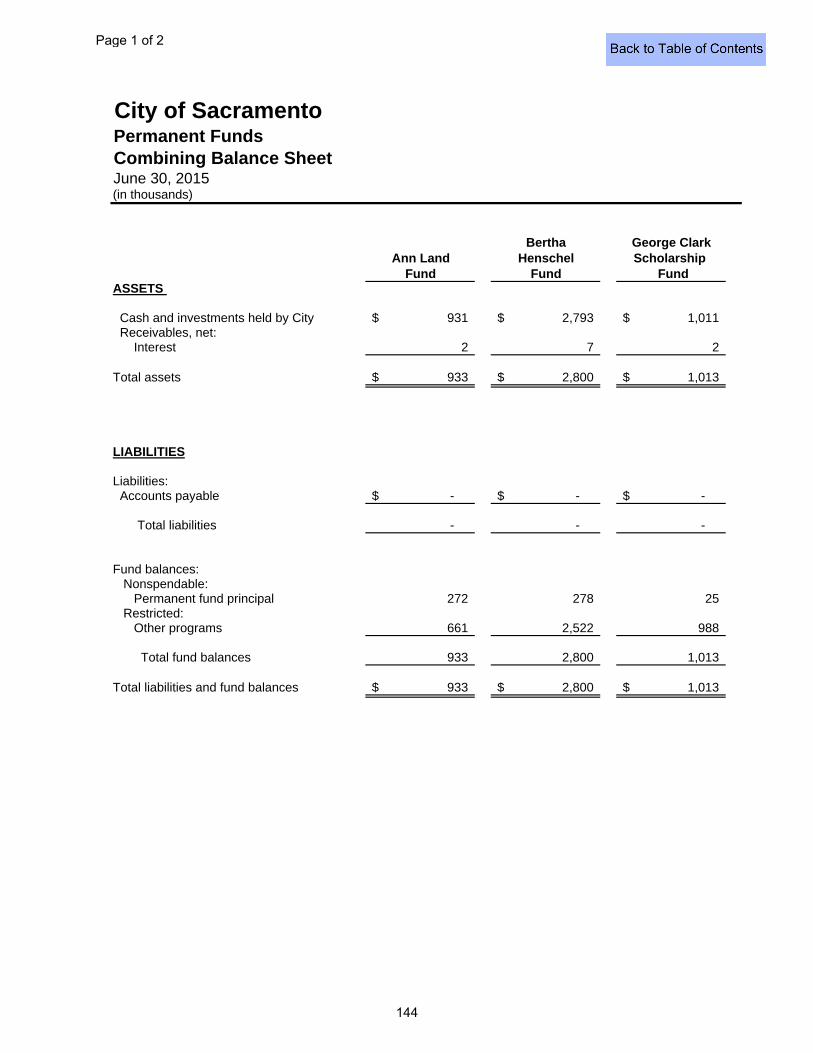
City of SacramentoPermanent FundsCombining Balance SheetJune 30, 2015(in thousands)
Bertha George ClarkAnn Land Henschel Scholarship
Fund Fund FundASSETS
Cash and investments held by City 931$ 2,793$ 1,011$ Receivables, net: Interest 2 7 2
Total assets 933$ 2,800$ 1,013$
LIABILITIES
Liabilities: Accounts payable -$ -$ -$
Total liabilities - - -
Fund balances: Nonspendable:
Permanent fund principal 272 278 25 Restricted:
Other programs 661 2,522 988
Total fund balances 933 2,800 1,013
Total liabilities and fund balances 933$ 2,800$ 1,013$
Page 1 of 2
144
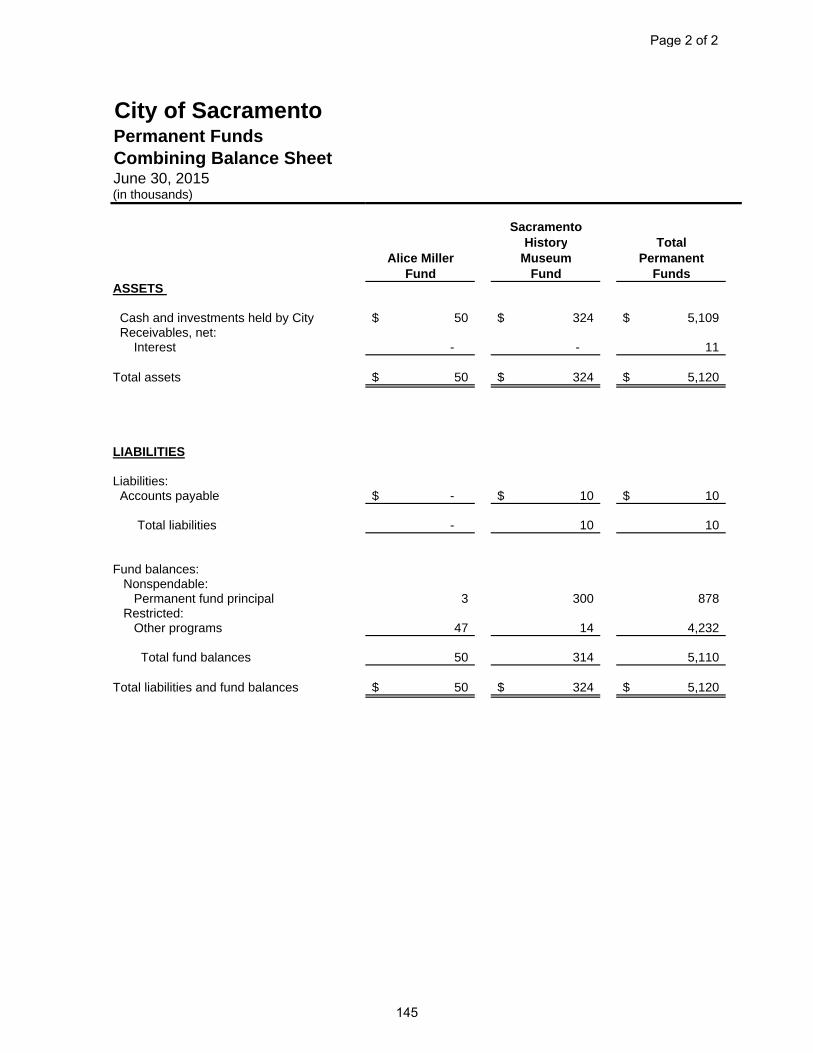
City of SacramentoPermanent FundsCombining Balance SheetJune 30, 2015(in thousands)
ASSETS
Cash and investments held by City Receivables, net: Interest
Total assets
LIABILITIES
Liabilities: Accounts payable
Total liabilities
Fund balances: Nonspendable:
Permanent fund principalRestricted:
Other programs
Total fund balances
Total liabilities and fund balances
SacramentoHistory Total
Alice Miller Museum PermanentFund Fund Funds
50$ 324$ 5,109$
- - 11
50$ 324$ 5,120$
-$ 10$ 10$
- 10 10
3 300 878
47 14 4,232
50 314 5,110
50$ 324$ 5,120$
Page 2 of 2
145
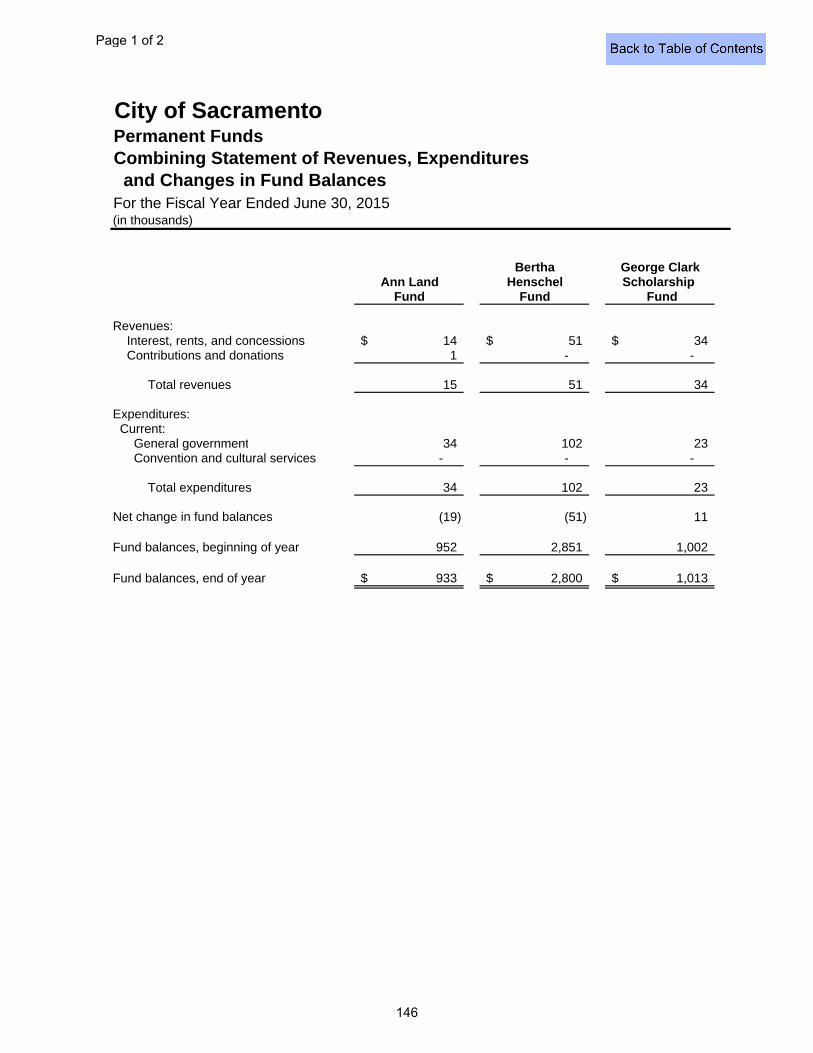
City of SacramentoPermanent FundsCombining Statement of Revenues, Expenditures and Changes in Fund BalancesFor the Fiscal Year Ended June 30, 2015(in thousands)
Bertha George ClarkAnn Land Henschel Scholarship
Fund Fund Fund
Revenues: Interest, rents, and concessions 14$ 51$ 34$ Contributions and donations 1 - -
Total revenues 15 51 34
Expenditures: Current: General government 34 102 23 Convention and cultural services - - -
Total expenditures 34 102 23
Net change in fund balances (19) (51) 11
Fund balances, beginning of year 952 2,851 1,002
Fund balances, end of year 933$ 2,800$ 1,013$
Page 1 of 2
146
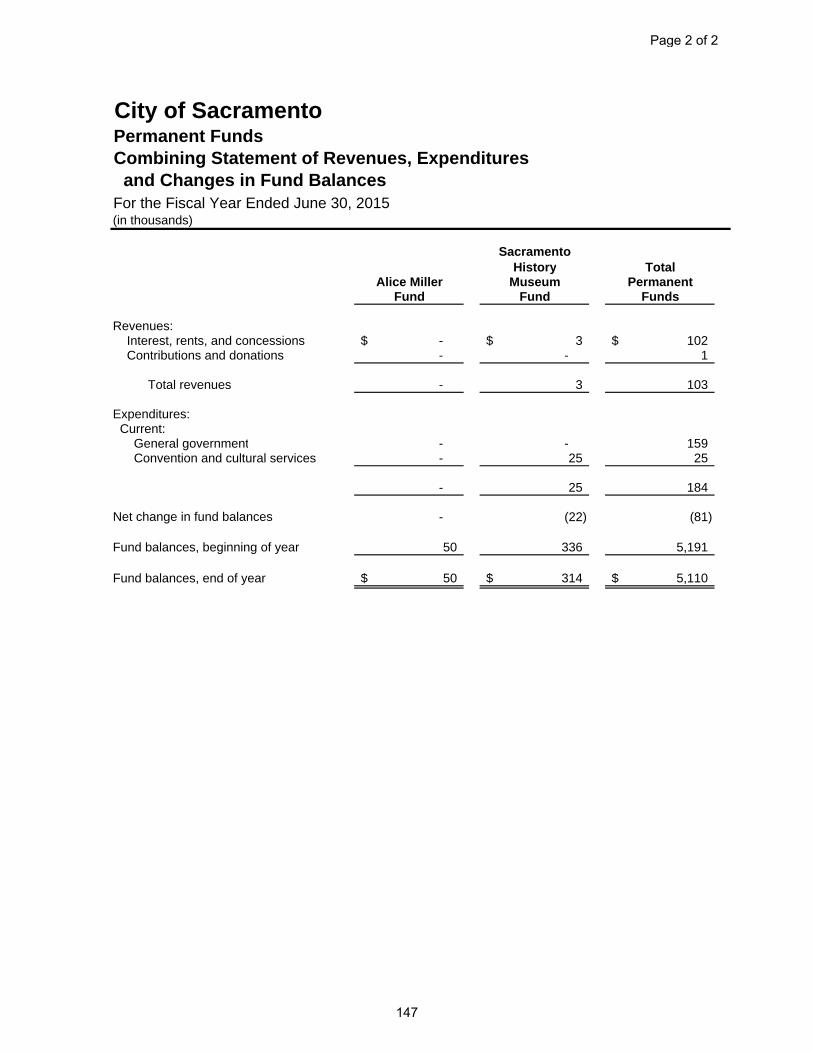
City of SacramentoPermanent FundsCombining Statement of Revenues, Expenditures and Changes in Fund BalancesFor the Fiscal Year Ended June 30, 2015(in thousands)
SacramentoHistory Total
Alice Miller Museum PermanentFund Fund Funds
Revenues: Interest, rents, and concessions -$ 3$ 102$ Contributions and donations - - 1
Total revenues - 3 103
Expenditures: Current: General government - - 159 Convention and cultural services - 25 25
- 25 184
Net change in fund balances - (22) (81)
Fund balances, beginning of year 50 336 5,191
Fund balances, end of year 50$ 314$ 5,110$
Page 2 of 2
147

THIS PAGE INTENTIONALLY LEFT BLANK
148
OTHER ENTERPRISE FUNDS
Enterprise funds are used to account for self-supporting City programs that provide services on a user-fee basis to the general public. The following enterprise funds have been classified as nonmajor funds: THE PARKING FUND is used to account for the operation and
maintenance of the City's off-street parking facilities throughout the City. THE 4th R CHILD DEVELOPMENT FUND is used to account for a program that provides school age child care services at various locations throughout the City.

THIS PAGE INTENTIONALLY LEFT BLANK
149
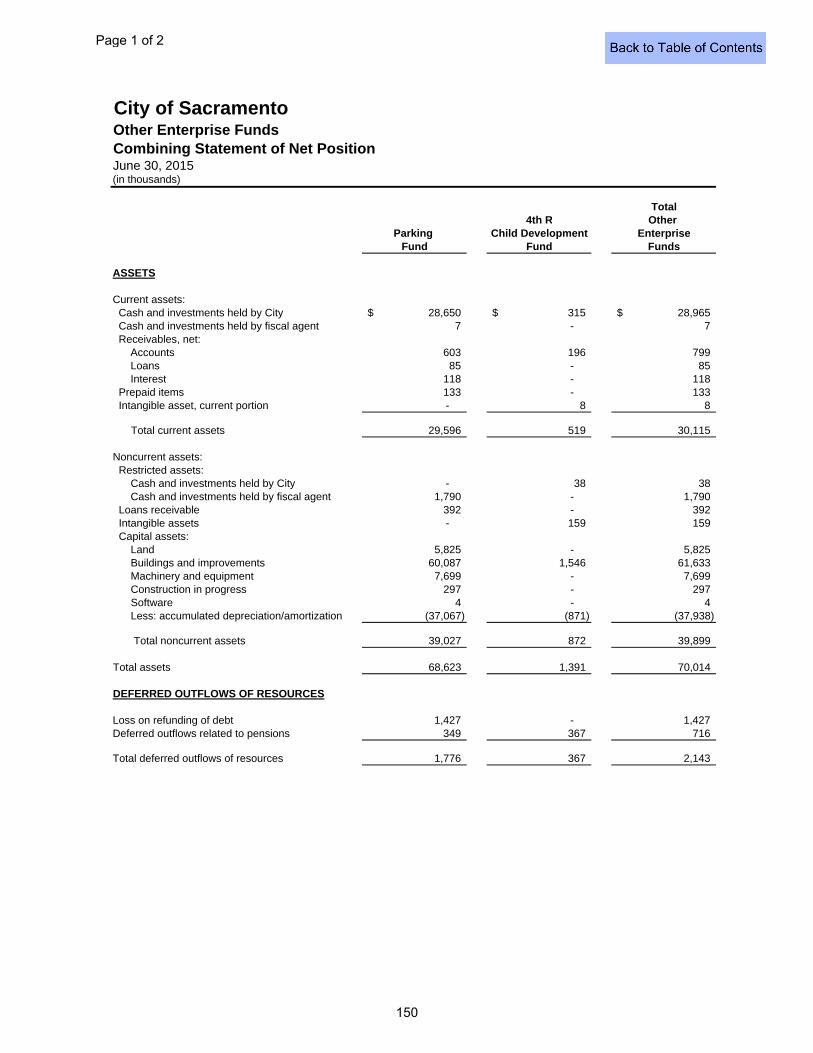
City of SacramentoOther Enterprise FundsCombining Statement of Net PositionJune 30, 2015(in thousands)
Total4th R Other
Parking Child Development EnterpriseFund Fund Funds
ASSETS
Current assets: Cash and investments held by City 28,650$ 315$ 28,965$ Cash and investments held by fiscal agent 7 - 7 Receivables, net: Accounts 603 196 799 Loans 85 - 85 Interest 118 - 118 Prepaid items 133 - 133 Intangible asset, current portion - 8 8
Total current assets 29,596 519 30,115
Noncurrent assets: Restricted assets: Cash and investments held by City - 38 38 Cash and investments held by fiscal agent 1,790 - 1,790 Loans receivable 392 - 392 Intangible assets - 159 159 Capital assets: Land 5,825 - 5,825 Buildings and improvements 60,087 1,546 61,633 Machinery and equipment 7,699 - 7,699 Construction in progress 297 - 297 Software 4 - 4 Less: accumulated depreciation/amortization (37,067) (871) (37,938)
Total noncurrent assets 39,027 872 39,899
Total assets 68,623 1,391 70,014
DEFERRED OUTFLOWS OF RESOURCES
Loss on refunding of debt 1,427 - 1,427 Deferred outflows related to pensions 349 367 716
Total deferred outflows of resources 1,776 367 2,143
Page 1 of 2
150
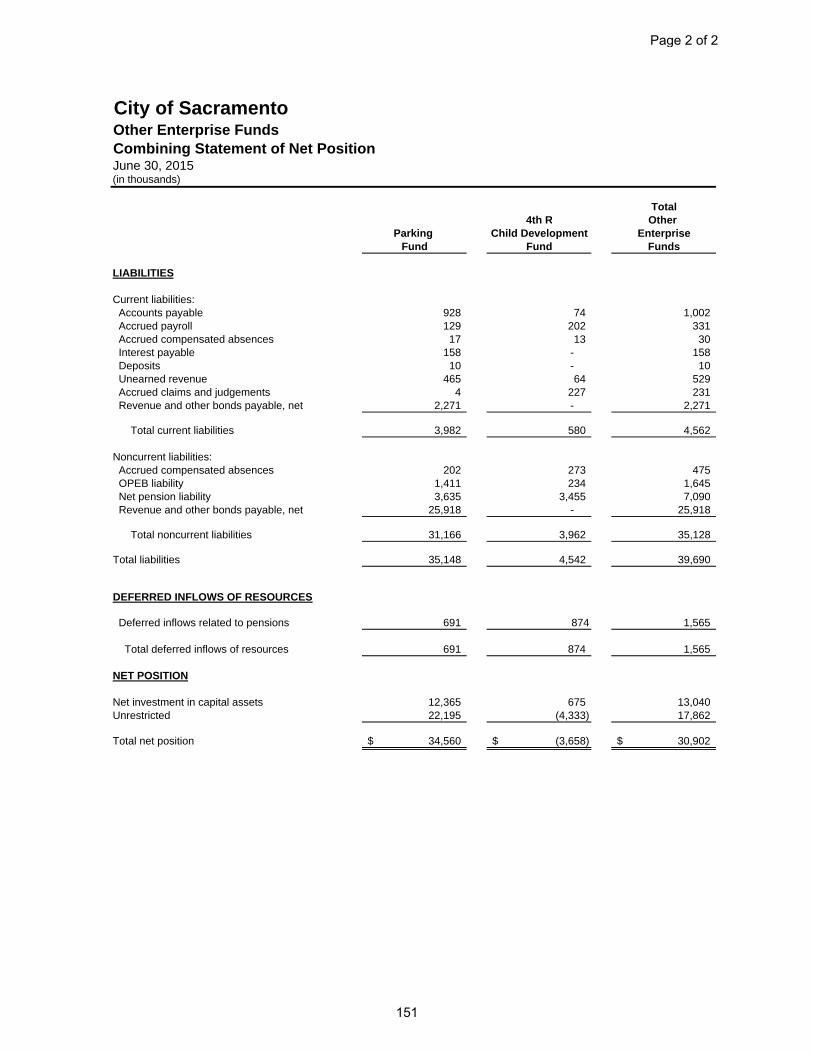
City of SacramentoOther Enterprise FundsCombining Statement of Net PositionJune 30, 2015(in thousands)
Total4th R Other
Parking Child Development EnterpriseFund Fund Funds
LIABILITIES
Current liabilities: Accounts payable 928 74 1,002 Accrued payroll 129 202 331 Accrued compensated absences 17 13 30 Interest payable 158 - 158 Deposits 10 - 10 Unearned revenue 465 64 529 Accrued claims and judgements 4 227 231 Revenue and other bonds payable, net 2,271 - 2,271
Total current liabilities 3,982 580 4,562
Noncurrent liabilities: Accrued compensated absences 202 273 475 OPEB liability 1,411 234 1,645 Net pension liability 3,635 3,455 7,090 Revenue and other bonds payable, net 25,918 - 25,918
Total noncurrent liabilities 31,166 3,962 35,128
Total liabilities 35,148 4,542 39,690
DEFERRED INFLOWS OF RESOURCES
Deferred inflows related to pensions 691 874 1,565
Total deferred inflows of resources 691 874 1,565
NET POSITION
Net investment in capital assets 12,365 675 13,040 Unrestricted 22,195 (4,333) 17,862
Total net position 34,560$ (3,658)$ 30,902$
Page 2 of 2
151

THIS PAGE INTENTIONALLY LEFT BLANK
152
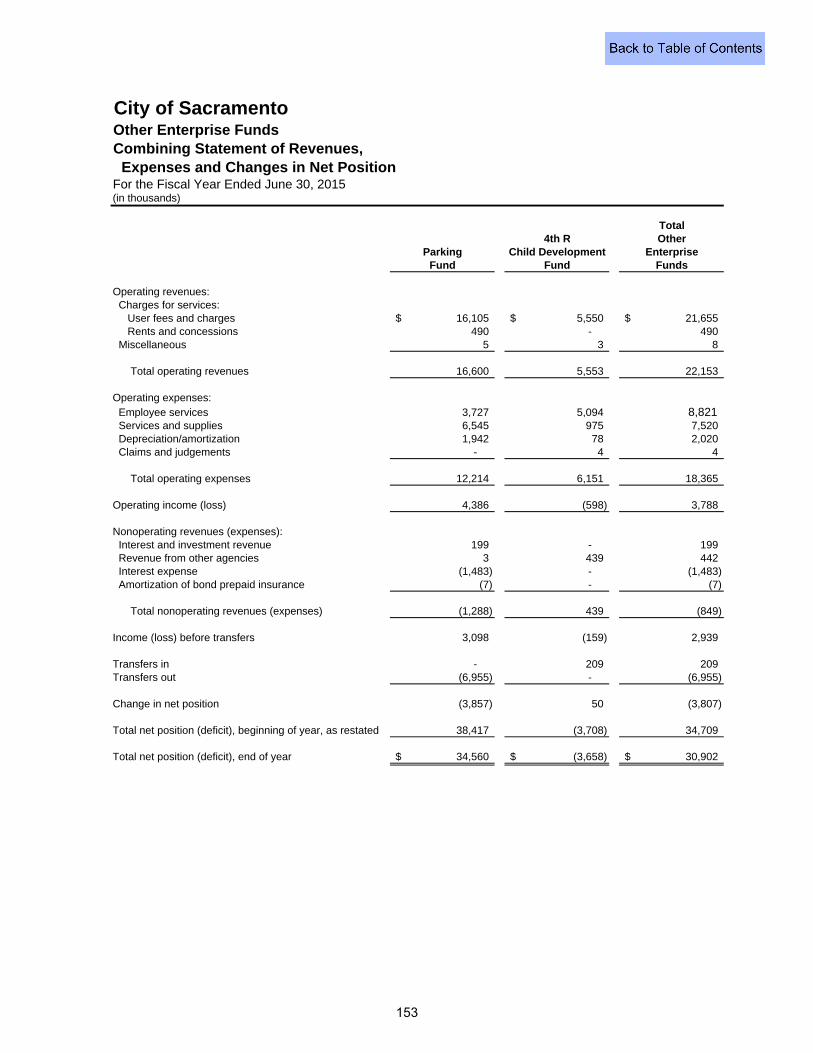
City of SacramentoOther Enterprise FundsCombining Statement of Revenues, Expenses and Changes in Net PositionFor the Fiscal Year Ended June 30, 2015(in thousands)
Total4th R Other
Parking Child Development EnterpriseFund Fund Funds
Operating revenues: Charges for services: User fees and charges 16,105$ 5,550$ 21,655$ Rents and concessions 490 - 490 Miscellaneous 5 3 8
Total operating revenues 16,600 5,553 22,153
Operating expenses: Employee services 3,727 5,094 8,821 Services and supplies 6,545 975 7,520 Depreciation/amortization 1,942 78 2,020 Claims and judgements - 4 4
Total operating expenses 12,214 6,151 18,365
Operating income (loss) 4,386 (598) 3,788
Nonoperating revenues (expenses): Interest and investment revenue 199 - 199 Revenue from other agencies 3 439 442 Interest expense (1,483) - (1,483) Amortization of bond prepaid insurance (7) - (7)
Total nonoperating revenues (expenses) (1,288) 439 (849)
Income (loss) before transfers 3,098 (159) 2,939
Transfers in - 209 209 Transfers out (6,955) - (6,955)
Change in net position (3,857) 50 (3,807)
Total net position (deficit), beginning of year, as restated 38,417 (3,708) 34,709
Total net position (deficit), end of year 34,560$ (3,658)$ 30,902$
153
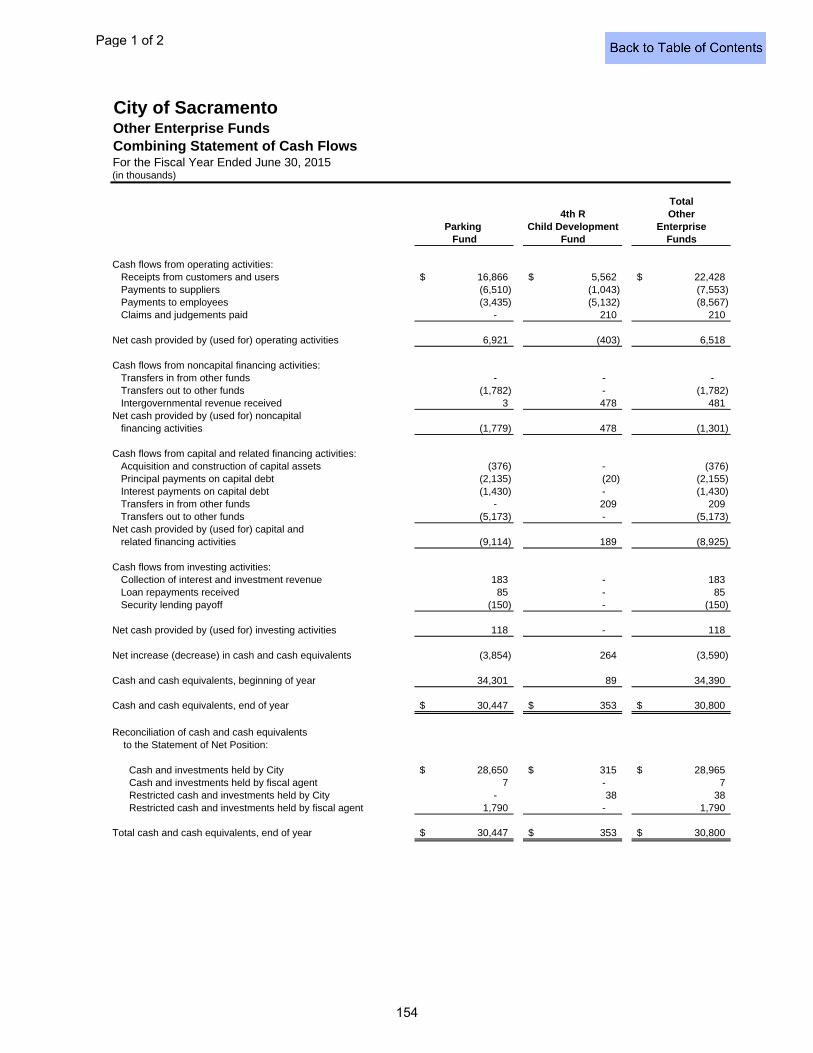
City of SacramentoOther Enterprise FundsCombining Statement of Cash FlowsFor the Fiscal Year Ended June 30, 2015(in thousands)
Total4th R Other
Parking Child Development EnterpriseFund Fund Funds
Cash flows from operating activities:Receipts from customers and users 16,866$ 5,562$ 22,428$ Payments to suppliers (6,510) (1,043) (7,553) Payments to employees (3,435) (5,132) (8,567) Claims and judgements paid - 210 210
Net cash provided by (used for) operating activities 6,921 (403) 6,518
Cash flows from noncapital financing activities:Transfers in from other funds - - - Transfers out to other funds (1,782) - (1,782) Intergovernmental revenue received 3 478 481
Net cash provided by (used for) noncapitalfinancing activities (1,779) 478 (1,301)
Cash flows from capital and related financing activities:Acquisition and construction of capital assets (376) - (376) Principal payments on capital debt (2,135) (20) (2,155) Interest payments on capital debt (1,430) - (1,430) Transfers in from other funds - 209 209 Transfers out to other funds (5,173) - (5,173)
Net cash provided by (used for) capital and related financing activities (9,114) 189 (8,925)
Cash flows from investing activities:Collection of interest and investment revenue 183 - 183 Loan repayments received 85 - 85 Security lending payoff (150) - (150)
Net cash provided by (used for) investing activities 118 - 118
Net increase (decrease) in cash and cash equivalents (3,854) 264 (3,590)
Cash and cash equivalents, beginning of year 34,301 89 34,390
Cash and cash equivalents, end of year 30,447$ 353$ 30,800$
Reconciliation of cash and cash equivalents to the Statement of Net Position:
Cash and investments held by City 28,650$ 315$ 28,965$ Cash and investments held by fiscal agent 7 - 7 Restricted cash and investments held by City - 38 38 Restricted cash and investments held by fiscal agent 1,790 - 1,790 Total cash and cash equivalents, end of year 30,447$ 353$ 30,800$
Page 1 of 2
154
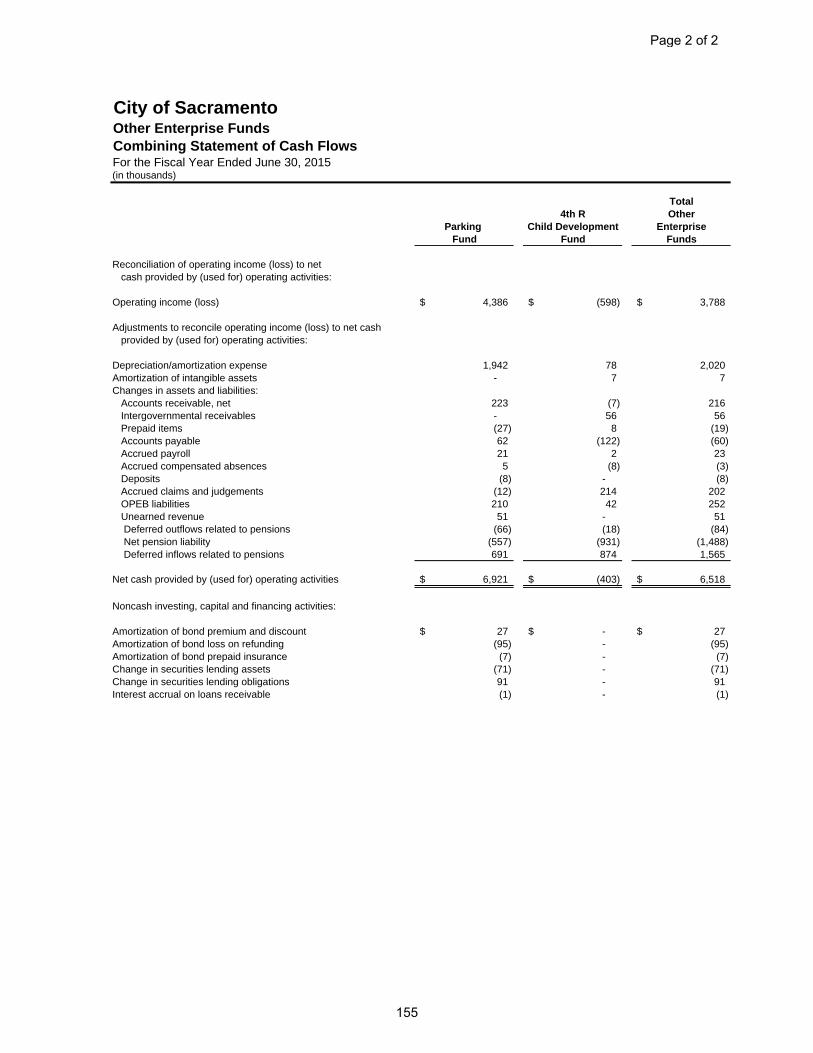
City of SacramentoOther Enterprise FundsCombining Statement of Cash FlowsFor the Fiscal Year Ended June 30, 2015(in thousands)
Total4th R Other
Parking Child Development EnterpriseFund Fund Funds
Reconciliation of operating income (loss) to netcash provided by (used for) operating activities:
Operating income (loss) 4,386$ (598)$ 3,788$
Adjustments to reconcile operating income (loss) to net cashprovided by (used for) operating activities:
Depreciation/amortization expense 1,942 78 2,020 Amortization of intangible assets - 7 7 Changes in assets and liabilities:
Accounts receivable, net 223 (7) 216 Intergovernmental receivables - 56 56 Prepaid items (27) 8 (19) Accounts payable 62 (122) (60) Accrued payroll 21 2 23 Accrued compensated absences 5 (8) (3) Deposits (8) - (8) Accrued claims and judgements (12) 214 202 OPEB liabilities 210 42 252 Unearned revenue 51 - 51 Deferred outflows related to pensions (66) (18) (84) Net pension liability (557) (931) (1,488) Deferred inflows related to pensions 691 874 1,565
Net cash provided by (used for) operating activities 6,921$ (403)$ 6,518$
Noncash investing, capital and financing activities:
Amortization of bond premium and discount 27$ -$ 27$ Amortization of bond loss on refunding (95) - (95) Amortization of bond prepaid insurance (7) - (7) Change in securities lending assets (71) - (71) Change in securities lending obligations 91 - 91 Interest accrual on loans receivable (1) - (1)
Page 2 of 2
155

THIS PAGE INTENTIONALLY LEFT BLANK
156

WATER FUND

THIS PAGE INTENTIONALLY LEFT BLANK
157
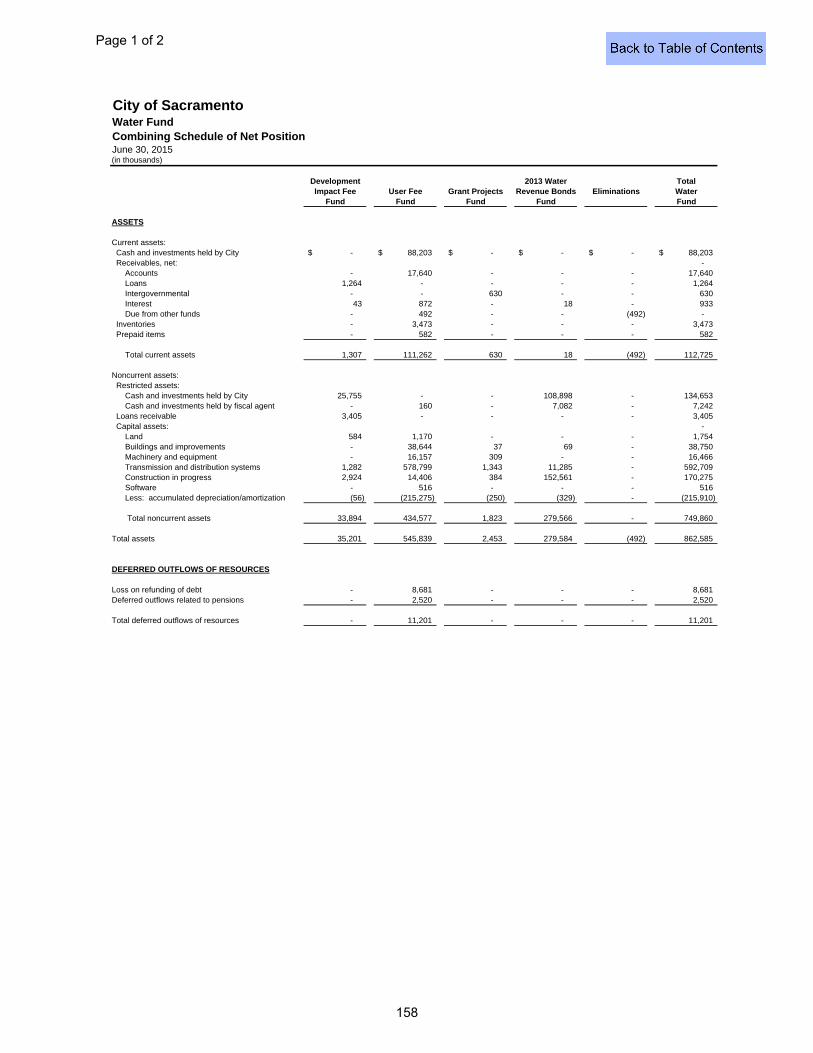
City of SacramentoWater FundCombining Schedule of Net PositionJune 30, 2015(in thousands)
Development 2013 Water TotalImpact Fee User Fee Grant Projects Revenue Bonds Eliminations Water
Fund Fund Fund Fund Fund
ASSETS
Current assets: Cash and investments held by City -$ 88,203$ -$ -$ -$ 88,203$ Receivables, net: - Accounts - 17,640 - - - 17,640 Loans 1,264 - - - - 1,264 Intergovernmental - - 630 - - 630 Interest 43 872 - 18 - 933 Due from other funds - 492 - - (492) - Inventories - 3,473 - - - 3,473 Prepaid items - 582 - - - 582
Total current assets 1,307 111,262 630 18 (492) 112,725
Noncurrent assets: Restricted assets: Cash and investments held by City 25,755 - - 108,898 - 134,653 Cash and investments held by fiscal agent - 160 - 7,082 - 7,242 Loans receivable 3,405 - - - - 3,405 Capital assets: - Land 584 1,170 - - - 1,754 Buildings and improvements - 38,644 37 69 - 38,750 Machinery and equipment - 16,157 309 - - 16,466 Transmission and distribution systems 1,282 578,799 1,343 11,285 - 592,709 Construction in progress 2,924 14,406 384 152,561 - 170,275 Software - 516 - - - 516 Less: accumulated depreciation/amortization (56) (215,275) (250) (329) - (215,910)
Total noncurrent assets 33,894 434,577 1,823 279,566 - 749,860
Total assets 35,201 545,839 2,453 279,584 (492) 862,585
DEFERRED OUTFLOWS OF RESOURCES
Loss on refunding of debt - 8,681 - - - 8,681 Deferred outflows related to pensions - 2,520 - - - 2,520
Total deferred outflows of resources - 11,201 - - - 11,201
Page 1 of 2
158
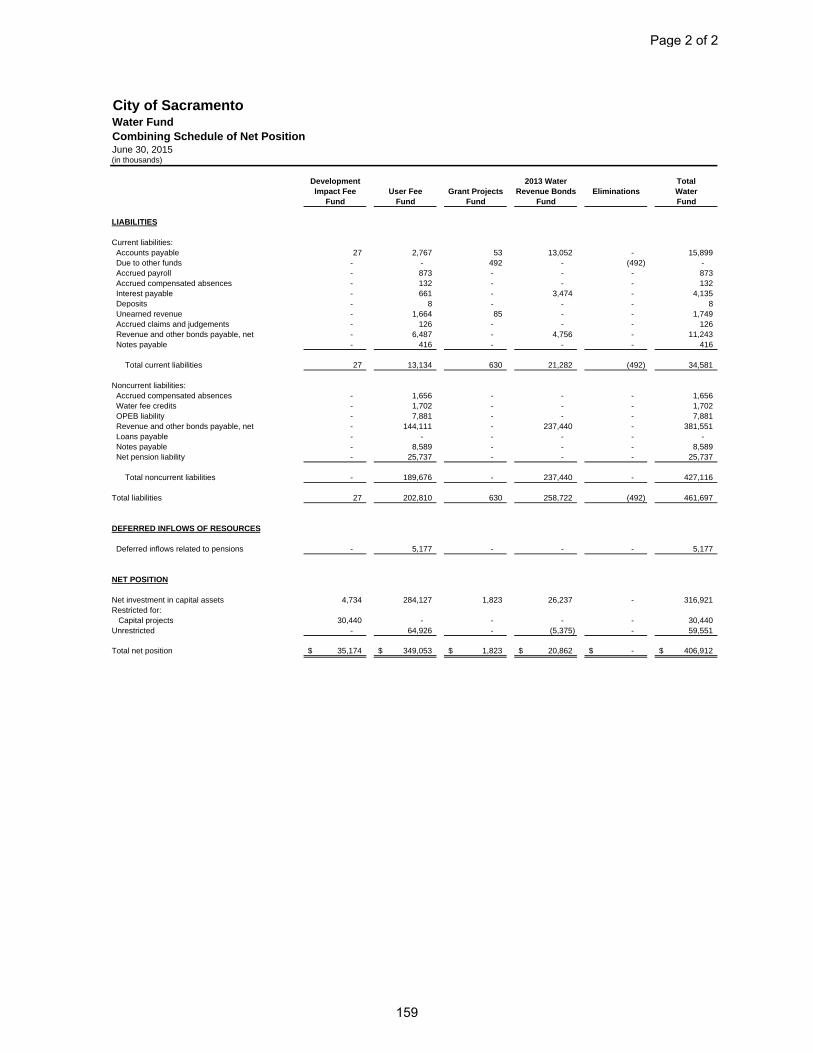
City of SacramentoWater FundCombining Schedule of Net PositionJune 30, 2015(in thousands)
Development 2013 Water TotalImpact Fee User Fee Grant Projects Revenue Bonds Eliminations Water
Fund Fund Fund Fund Fund
LIABILITIES
Current liabilities: Accounts payable 27 2,767 53 13,052 - 15,899 Due to other funds - - 492 - (492) - Accrued payroll - 873 - - - 873 Accrued compensated absences - 132 - - - 132 Interest payable - 661 - 3,474 - 4,135 Deposits - 8 - - - 8 Unearned revenue - 1,664 85 - - 1,749 Accrued claims and judgements - 126 - - - 126 Revenue and other bonds payable, net - 6,487 - 4,756 - 11,243 Notes payable - 416 - - - 416
Total current liabilities 27 13,134 630 21,282 (492) 34,581
Noncurrent liabilities: Accrued compensated absences - 1,656 - - - 1,656 Water fee credits - 1,702 - - - 1,702 OPEB liability - 7,881 - - - 7,881 Revenue and other bonds payable, net - 144,111 - 237,440 - 381,551 Loans payable - - - - - - Notes payable - 8,589 - - - 8,589 Net pension liability - 25,737 - - - 25,737
Total noncurrent liabilities - 189,676 - 237,440 - 427,116
Total liabilities 27 202,810 630 258,722 (492) 461,697
DEFERRED INFLOWS OF RESOURCES
Deferred inflows related to pensions - 5,177 - - - 5,177
NET POSITION
Net investment in capital assets 4,734 284,127 1,823 26,237 - 316,921 Restricted for:
Capital projects 30,440 - - - - 30,440 Unrestricted - 64,926 - (5,375) - 59,551
Total net position 35,174$ 349,053$ 1,823$ 20,862$ -$ 406,912$
Page 2 of 2
159

THIS PAGE INTENTIONALLY LEFT BLANK
160
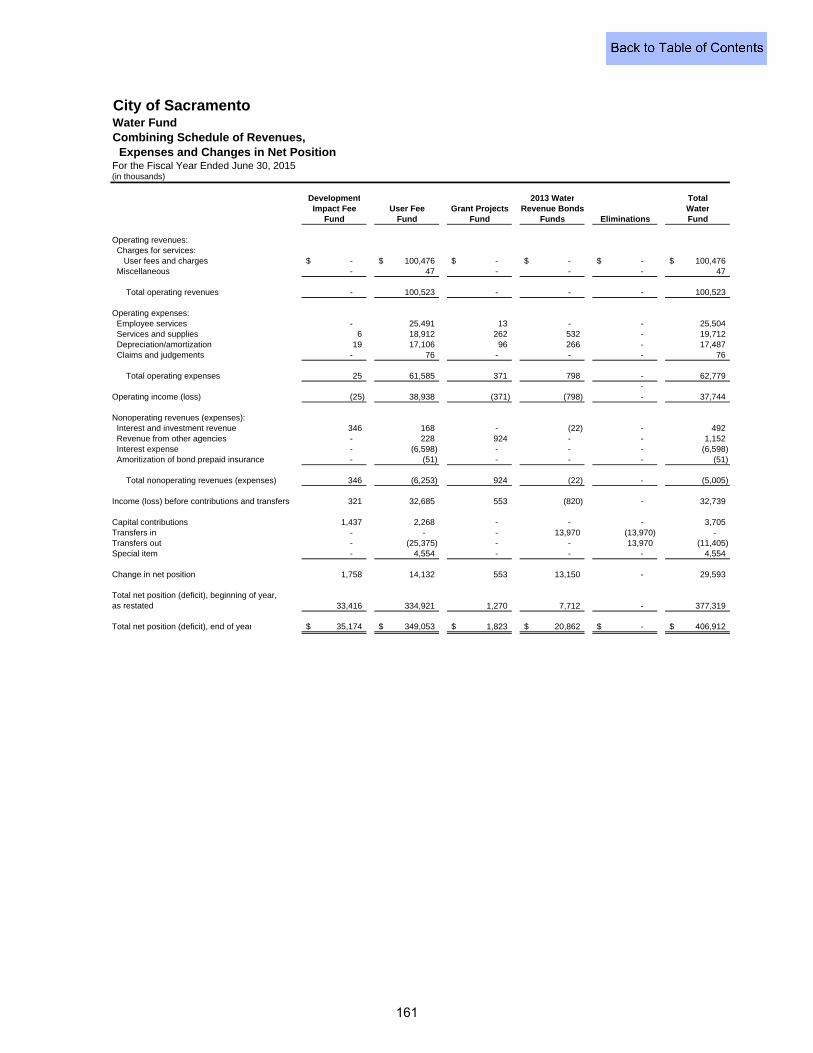
City of SacramentoWater FundCombining Schedule of Revenues, Expenses and Changes in Net PositionFor the Fiscal Year Ended June 30, 2015(in thousands)
Development 2013 Water TotalImpact Fee User Fee Grant Projects Revenue Bonds Water
Fund Fund Fund Funds Eliminations Fund
Operating revenues: Charges for services: User fees and charges -$ 100,476$ -$ -$ -$ 100,476$ Miscellaneous - 47 - - - 47
Total operating revenues - 100,523 - - - 100,523
Operating expenses: Employee services - 25,491 13 - - 25,504 Services and supplies 6 18,912 262 532 - 19,712 Depreciation/amortization 19 17,106 96 266 - 17,487 Claims and judgements - 76 - - - 76
Total operating expenses 25 61,585 371 798 - 62,779 -
Operating income (loss) (25) 38,938 (371) (798) - 37,744
Nonoperating revenues (expenses): Interest and investment revenue 346 168 - (22) - 492 Revenue from other agencies - 228 924 - - 1,152 Interest expense - (6,598) - - - (6,598) Amoritization of bond prepaid insurance - (51) - - - (51)
Total nonoperating revenues (expenses) 346 (6,253) 924 (22) - (5,005)
Income (loss) before contributions and transfers 321 32,685 553 (820) - 32,739
Capital contributions 1,437 2,268 - - - 3,705 Transfers in - - - 13,970 (13,970) - Transfers out - (25,375) - - 13,970 (11,405) Special item - 4,554 - - - 4,554
Change in net position 1,758 14,132 553 13,150 - 29,593
Total net position (deficit), beginning of year, as restated 33,416 334,921 1,270 7,712 - 377,319
Total net position (deficit), end of year 35,174$ 349,053$ 1,823$ 20,862$ -$ 406,912$
161
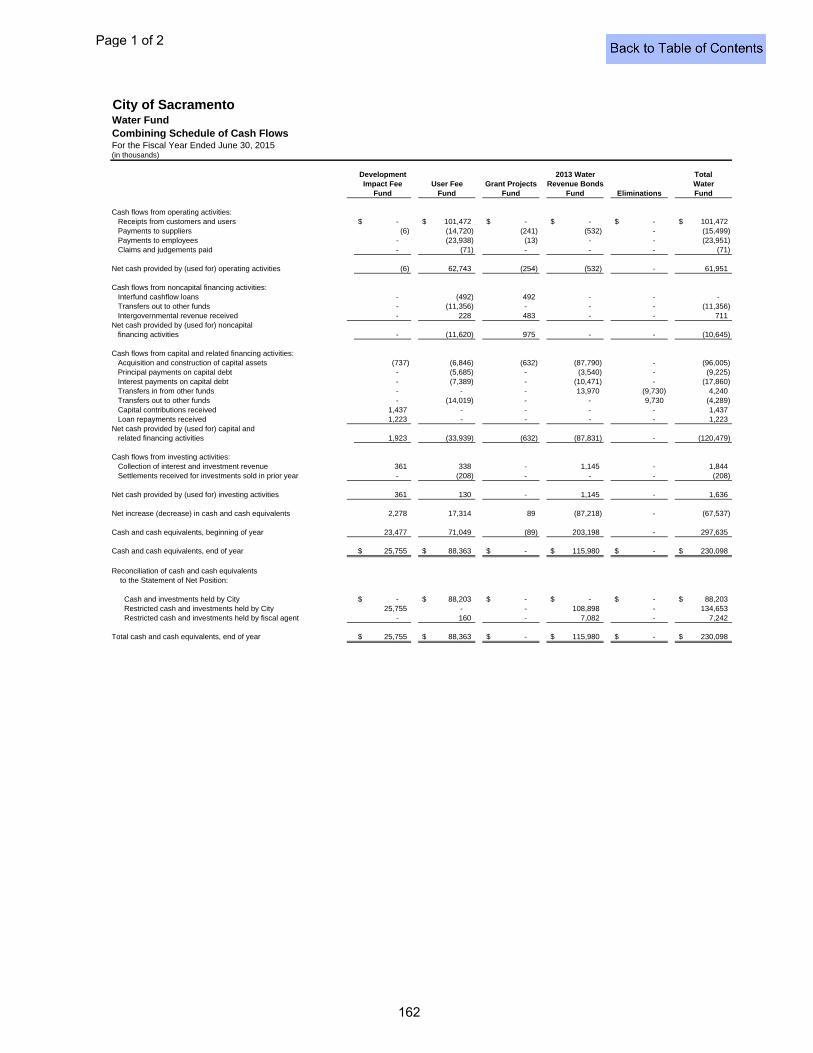
City of SacramentoWater FundCombining Schedule of Cash FlowsFor the Fiscal Year Ended June 30, 2015(in thousands)
Development 2013 Water TotalImpact Fee User Fee Grant Projects Revenue Bonds Water
Fund Fund Fund Fund Eliminations Fund
Cash flows from operating activities:Receipts from customers and users -$ 101,472$ -$ -$ -$ 101,472$ Payments to suppliers (6) (14,720) (241) (532) - (15,499) Payments to employees - (23,938) (13) - - (23,951) Claims and judgements paid - (71) - - - (71)
Net cash provided by (used for) operating activities (6) 62,743 (254) (532) - 61,951
Cash flows from noncapital financing activities:Interfund cashflow loans - (492) 492 - - - Transfers out to other funds - (11,356) - - - (11,356) Intergovernmental revenue received - 228 483 - - 711
Net cash provided by (used for) noncapitalfinancing activities - (11,620) 975 - - (10,645)
Cash flows from capital and related financing activities:Acquisition and construction of capital assets (737) (6,846) (632) (87,790) - (96,005) Principal payments on capital debt - (5,685) - (3,540) - (9,225) Interest payments on capital debt - (7,389) - (10,471) - (17,860) Transfers in from other funds - - - 13,970 (9,730) 4,240 Transfers out to other funds - (14,019) - - 9,730 (4,289) Capital contributions received 1,437 - - - - 1,437 Loan repayments received 1,223 - - - - 1,223
Net cash provided by (used for) capital and related financing activities 1,923 (33,939) (632) (87,831) - (120,479)
Cash flows from investing activities:Collection of interest and investment revenue 361 338 - 1,145 - 1,844 Settlements received for investments sold in prior year - (208) - - - (208)
Net cash provided by (used for) investing activities 361 130 - 1,145 - 1,636
Net increase (decrease) in cash and cash equivalents 2,278 17,314 89 (87,218) - (67,537)
Cash and cash equivalents, beginning of year 23,477 71,049 (89) 203,198 - 297,635
Cash and cash equivalents, end of year 25,755$ 88,363$ -$ 115,980$ -$ 230,098$
Reconciliation of cash and cash equivalents to the Statement of Net Position:
Cash and investments held by City -$ 88,203$ -$ -$ -$ 88,203$ Restricted cash and investments held by City 25,755 - - 108,898 - 134,653 Restricted cash and investments held by fiscal agent - 160 - 7,082 - 7,242
Total cash and cash equivalents, end of year 25,755$ 88,363$ -$ 115,980$ -$ 230,098$
Page 1 of 2
162
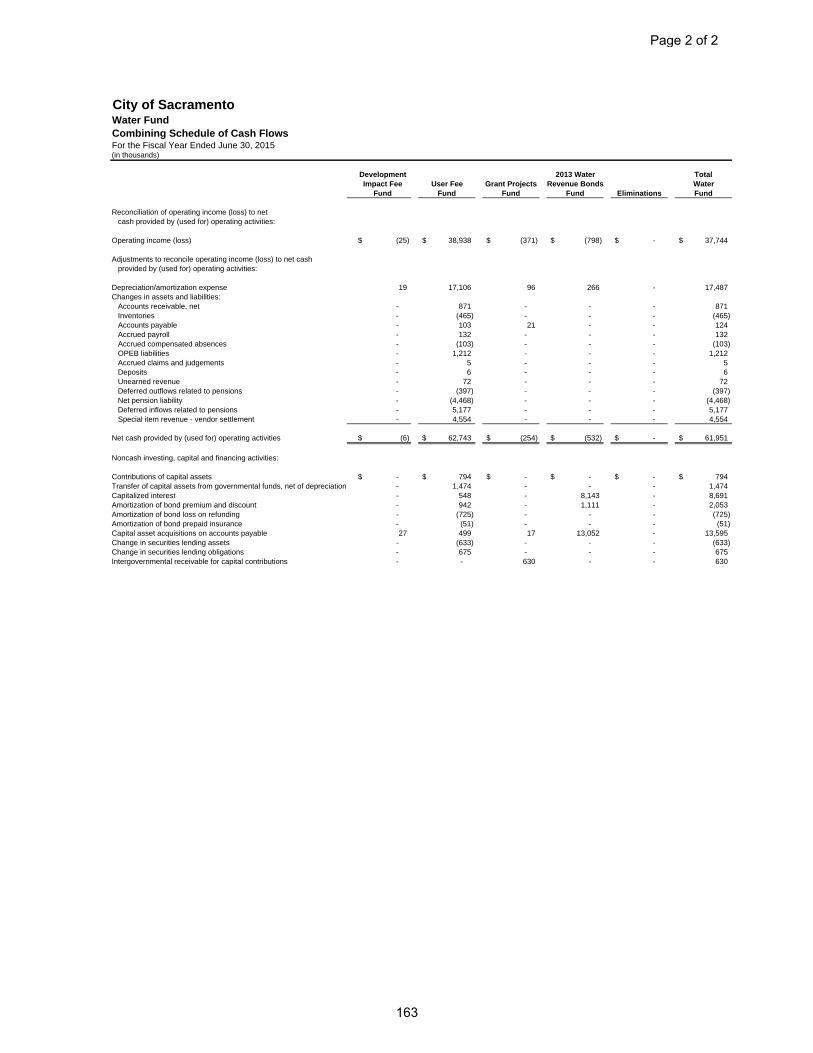
City of SacramentoWater FundCombining Schedule of Cash FlowsFor the Fiscal Year Ended June 30, 2015(in thousands)
Development 2013 Water TotalImpact Fee User Fee Grant Projects Revenue Bonds Water
Fund Fund Fund Fund Eliminations Fund
Reconciliation of operating income (loss) to netcash provided by (used for) operating activities:
Operating income (loss) (25)$ 38,938$ (371)$ (798)$ -$ 37,744$
Adjustments to reconcile operating income (loss) to net cashprovided by (used for) operating activities:
Depreciation/amortization expense 19 17,106 96 266 - 17,487 Changes in assets and liabilities:
Accounts receivable, net - 871 - - - 871 Inventories - (465) - - - (465) Accounts payable - 103 21 - - 124 Accrued payroll - 132 - - - 132 Accrued compensated absences - (103) - - - (103) OPEB liabilities - 1,212 - - - 1,212 Accrued claims and judgements - 5 - - - 5 Deposits - 6 - - - 6 Unearned revenue - 72 - - - 72 Deferred outflows related to pensions - (397) - - - (397) Net pension liability - (4,468) - - - (4,468) Deferred inflows related to pensions - 5,177 - - - 5,177 Special item revenue - vendor settlement - 4,554 - - - 4,554
Net cash provided by (used for) operating activities (6)$ 62,743$ (254)$ (532)$ -$ 61,951$
Noncash investing, capital and financing activities:
Contributions of capital assets -$ 794$ -$ -$ -$ 794$ Transfer of capital assets from governmental funds, net of depreciation - 1,474 - - - 1,474 Capitalized interest - 548 - 8,143 - 8,691 Amortization of bond premium and discount - 942 - 1,111 - 2,053 Amortization of bond loss on refunding - (725) - - - (725) Amortization of bond prepaid insurance - (51) - - - (51) Capital asset acquisitions on accounts payable 27 499 17 13,052 - 13,595 Change in securities lending assets - (633) - - - (633) Change in securities lending obligations - 675 - - - 675 Intergovernmental receivable for capital contributions - - 630 - - 630
Page 2 of 2
163

THIS PAGE INTENTIONALLY LEFT BLANK
164

WASTEWATER FUND

THIS PAGE INTENTIONALLY LEFT BLANK
165

City of SacramentoWastewater FundCombining Schedule of Net PositionJune 30, 2015(in thousands)
Development 2013 Wastewater TotalImpact Fee User Fee Grant Projects Revenue Bonds Eliminations Wastewater
Fund Fund Fund Fund Fund
ASSETS
Current assets: Cash and investments held by City -$ 26,382$ -$ -$ -$ 26,382$ Receivables, net: Accounts - 11,189 - - - 11,189 Loans - 128 - - - 128 Intergovernmental - - 2,530 4 - 2,534 Interest - 184 - - - 184 Due from other funds - 2,138 (2,138) - Inventories - 82 - - - 82
Total current assets - 40,103 2,530 4 (2,138) 40,499
Noncurrent assets: Restricted assets: Cash and investments held by City 2,719 817 - 14,801 - 18,337 Cash and investments held by fiscal agent - - - 991 - 991 Loans receivable - 681 - - - 681 Capital assets: Land - 1,138 - - - 1,138 Buildings and improvements - 15,219 - 11,153 - 26,372 Machinery and equipment - 4,846 - 301 - 5,147 Transmission and distribution systems 938 151,188 525 1,887 - 154,538 Construction in progress 291 990 3,041 4,491 - 8,813 Software - 324 - - - 324 Less: accumulated depreciation/amortization (14) (68,088) (10) (125) - (68,237)
Total noncurrent assets 3,934 107,115 3,556 33,499 - 148,104
Total assets 3,934 147,218 6,086 33,503 (2,138) 188,603
DEFERRED OUTFLOWS OF RESOURCES
Deferred outflows related to pensions - 958 - - - 958
Total deferred outflows of resources - 958 - - - 958
Page 1 of 2
166
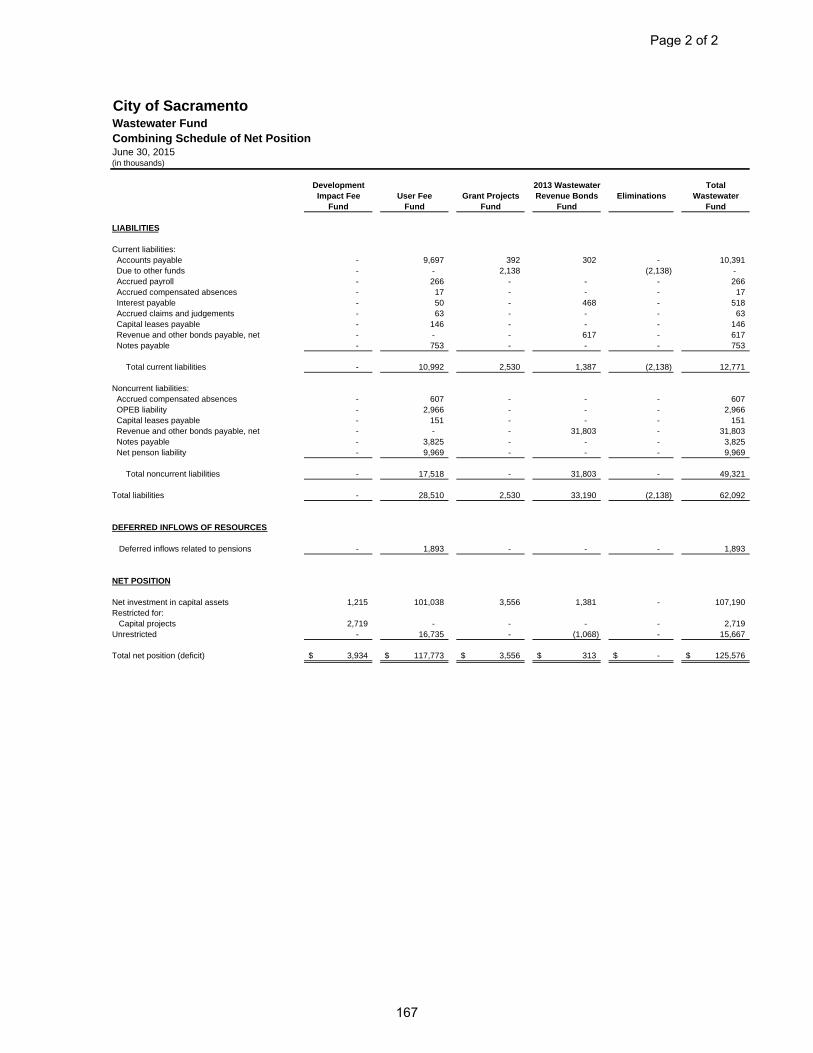
City of SacramentoWastewater FundCombining Schedule of Net PositionJune 30, 2015(in thousands)
Development 2013 Wastewater TotalImpact Fee User Fee Grant Projects Revenue Bonds Eliminations Wastewater
Fund Fund Fund Fund Fund
LIABILITIES
Current liabilities: Accounts payable - 9,697 392 302 - 10,391 Due to other funds - - 2,138 (2,138) - Accrued payroll - 266 - - - 266 Accrued compensated absences - 17 - - - 17 Interest payable - 50 - 468 - 518 Accrued claims and judgements - 63 - - - 63 Capital leases payable - 146 - - - 146 Revenue and other bonds payable, net - - - 617 - 617 Notes payable - 753 - - - 753 Total current liabilities - 10,992 2,530 1,387 (2,138) 12,771
Noncurrent liabilities: Accrued compensated absences - 607 - - - 607 OPEB liability - 2,966 - - - 2,966 Capital leases payable - 151 - - - 151 Revenue and other bonds payable, net - - - 31,803 - 31,803 Notes payable - 3,825 - - - 3,825 Net penson liability - 9,969 - - - 9,969
Total noncurrent liabilities - 17,518 - 31,803 - 49,321
Total liabilities - 28,510 2,530 33,190 (2,138) 62,092
DEFERRED INFLOWS OF RESOURCES
Deferred inflows related to pensions - 1,893 - - - 1,893
NET POSITION
Net investment in capital assets 1,215 101,038 3,556 1,381 - 107,190 Restricted for:
Capital projects 2,719 - - - - 2,719 Unrestricted - 16,735 - (1,068) - 15,667
Total net position (deficit) 3,934$ 117,773$ 3,556$ 313$ -$ 125,576$
Page 2 of 2
167

THIS PAGE INTENTIONALLY LEFT BLANK
168
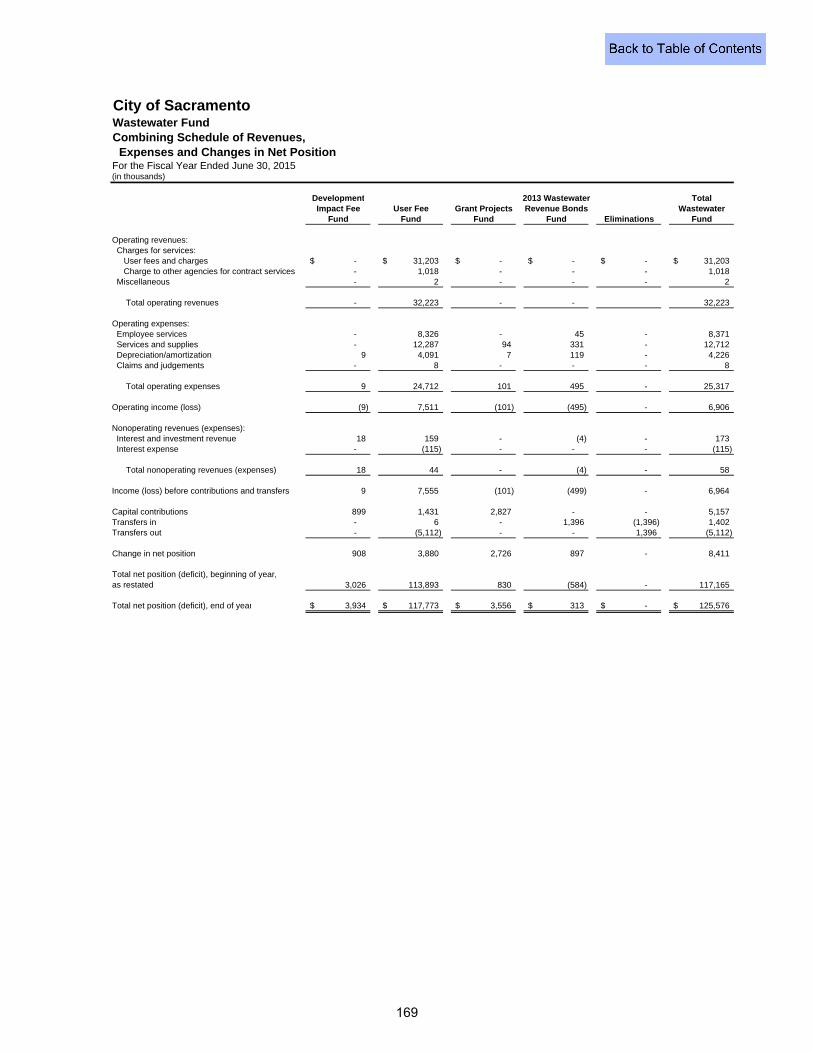
City of SacramentoWastewater FundCombining Schedule of Revenues, Expenses and Changes in Net PositionFor the Fiscal Year Ended June 30, 2015(in thousands)
Development 2013 Wastewater TotalImpact Fee User Fee Grant Projects Revenue Bonds Wastewater
Fund Fund Fund Fund Eliminations Fund
Operating revenues: Charges for services: User fees and charges -$ 31,203$ -$ -$ -$ 31,203$ Charge to other agencies for contract services - 1,018 - - - 1,018 Miscellaneous - 2 - - - 2
Total operating revenues - 32,223 - - 32,223
Operating expenses: Employee services - 8,326 - 45 - 8,371 Services and supplies - 12,287 94 331 - 12,712 Depreciation/amortization 9 4,091 7 119 - 4,226 Claims and judgements - 8 - - - 8
Total operating expenses 9 24,712 101 495 - 25,317
Operating income (loss) (9) 7,511 (101) (495) - 6,906
Nonoperating revenues (expenses): Interest and investment revenue 18 159 - (4) - 173 Interest expense - (115) - - - (115)
Total nonoperating revenues (expenses) 18 44 - (4) - 58
Income (loss) before contributions and transfers 9 7,555 (101) (499) - 6,964
Capital contributions 899 1,431 2,827 - - 5,157 Transfers in - 6 - 1,396 (1,396) 1,402 Transfers out - (5,112) - - 1,396 (5,112)
Change in net position 908 3,880 2,726 897 - 8,411
Total net position (deficit), beginning of year,as restated 3,026 113,893 830 (584) - 117,165
Total net position (deficit), end of year 3,934$ 117,773$ 3,556$ 313$ -$ 125,576$
169
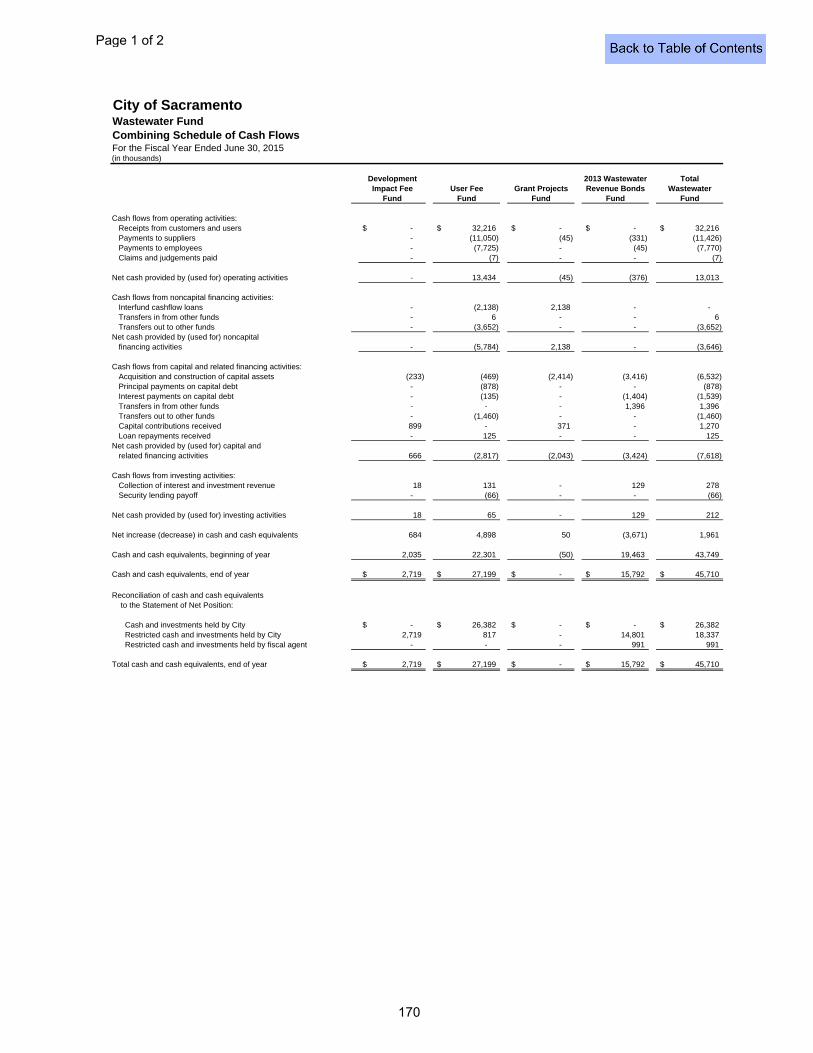
City of SacramentoWastewater FundCombining Schedule of Cash FlowsFor the Fiscal Year Ended June 30, 2015(in thousands)
Development 2013 Wastewater TotalImpact Fee User Fee Grant Projects Revenue Bonds Wastewater
Fund Fund Fund Fund Fund
Cash flows from operating activities:Receipts from customers and users -$ 32,216$ -$ -$ 32,216$ Payments to suppliers - (11,050) (45) (331) (11,426) Payments to employees - (7,725) - (45) (7,770) Claims and judgements paid - (7) - - (7)
Net cash provided by (used for) operating activities - 13,434 (45) (376) 13,013
Cash flows from noncapital financing activities:Interfund cashflow loans - (2,138) 2,138 - - Transfers in from other funds - 6 - - 6 Transfers out to other funds - (3,652) - - (3,652)
Net cash provided by (used for) noncapitalfinancing activities - (5,784) 2,138 - (3,646)
Cash flows from capital and related financing activities:Acquisition and construction of capital assets (233) (469) (2,414) (3,416) (6,532) Principal payments on capital debt - (878) - - (878) Interest payments on capital debt - (135) - (1,404) (1,539) Transfers in from other funds - - - 1,396 1,396 Transfers out to other funds - (1,460) - - (1,460) Capital contributions received 899 - 371 - 1,270 Loan repayments received - 125 - - 125
Net cash provided by (used for) capital and related financing activities 666 (2,817) (2,043) (3,424) (7,618)
Cash flows from investing activities:Collection of interest and investment revenue 18 131 - 129 278 Security lending payoff - (66) - - (66)
Net cash provided by (used for) investing activities 18 65 - 129 212
Net increase (decrease) in cash and cash equivalents 684 4,898 50 (3,671) 1,961
Cash and cash equivalents, beginning of year 2,035 22,301 (50) 19,463 43,749
Cash and cash equivalents, end of year 2,719$ 27,199$ -$ 15,792$ 45,710$
Reconciliation of cash and cash equivalents to the Statement of Net Position:
Cash and investments held by City -$ 26,382$ -$ -$ 26,382$ Restricted cash and investments held by City 2,719 817 - 14,801 18,337 Restricted cash and investments held by fiscal agent - - - 991 991
Total cash and cash equivalents, end of year 2,719$ 27,199$ -$ 15,792$ 45,710$
Page 1 of 2
170
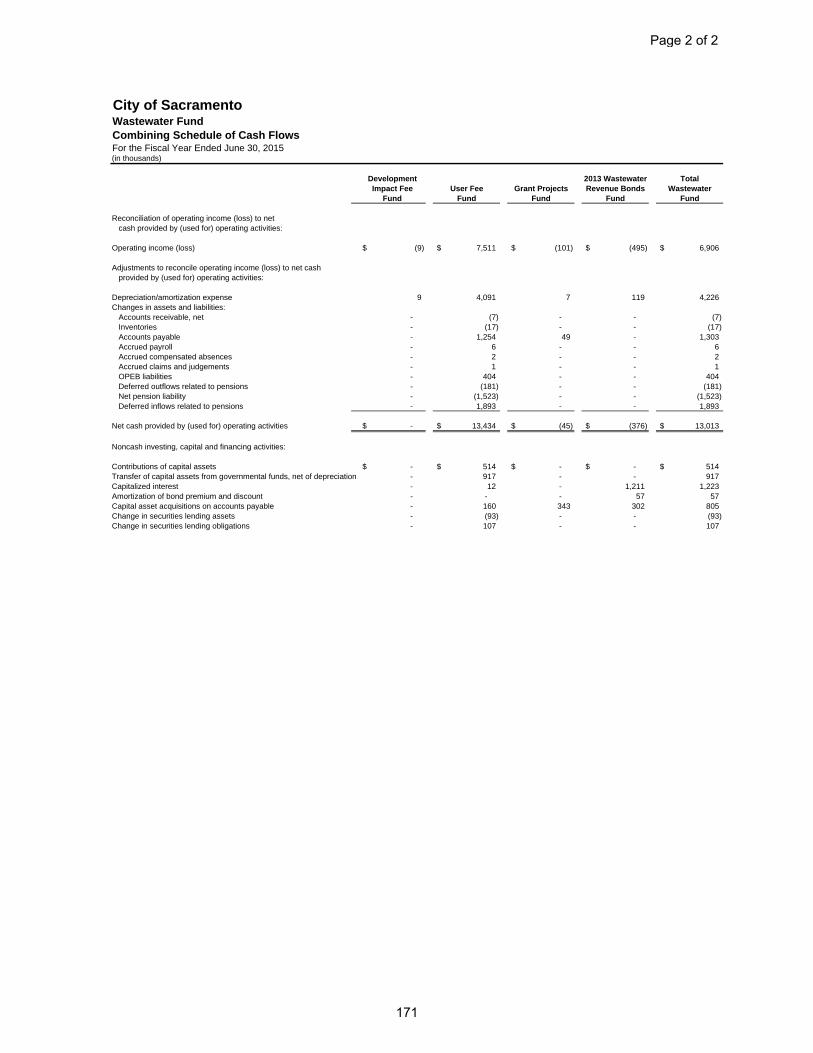
City of SacramentoWastewater FundCombining Schedule of Cash FlowsFor the Fiscal Year Ended June 30, 2015(in thousands)
Development 2013 Wastewater TotalImpact Fee User Fee Grant Projects Revenue Bonds Wastewater
Fund Fund Fund Fund Fund Reconciliation of operating income (loss) to net
cash provided by (used for) operating activities:
Operating income (loss) (9)$ 7,511$ (101)$ (495)$ 6,906$
Adjustments to reconcile operating income (loss) to net cashprovided by (used for) operating activities:
Depreciation/amortization expense 9 4,091 7 119 4,226 Changes in assets and liabilities:
Accounts receivable, net - (7) - - (7) Inventories - (17) - - (17) Accounts payable - 1,254 49 - 1,303 Accrued payroll - 6 - - 6 Accrued compensated absences - 2 - - 2 Accrued claims and judgements - 1 - - 1 OPEB liabilities - 404 - - 404 Deferred outflows related to pensions - (181) - - (181) Net pension liability - (1,523) - - (1,523) Deferred inflows related to pensions - 1,893 - - 1,893
Net cash provided by (used for) operating activities -$ 13,434$ (45)$ (376)$ 13,013$
Noncash investing, capital and financing activities:
Contributions of capital assets -$ 514$ -$ -$ 514$ Transfer of capital assets from governmental funds, net of depreciation - 917 - - 917 Capitalized interest - 12 - 1,211 1,223 Amortization of bond premium and discount - - - 57 57 Capital asset acquisitions on accounts payable - 160 343 302 805 Change in securities lending assets - (93) - - (93) Change in securities lending obligations - 107 - - 107
Page 2 of 2
171

THIS PAGE INTENTIONALLY LEFT BLANK
172
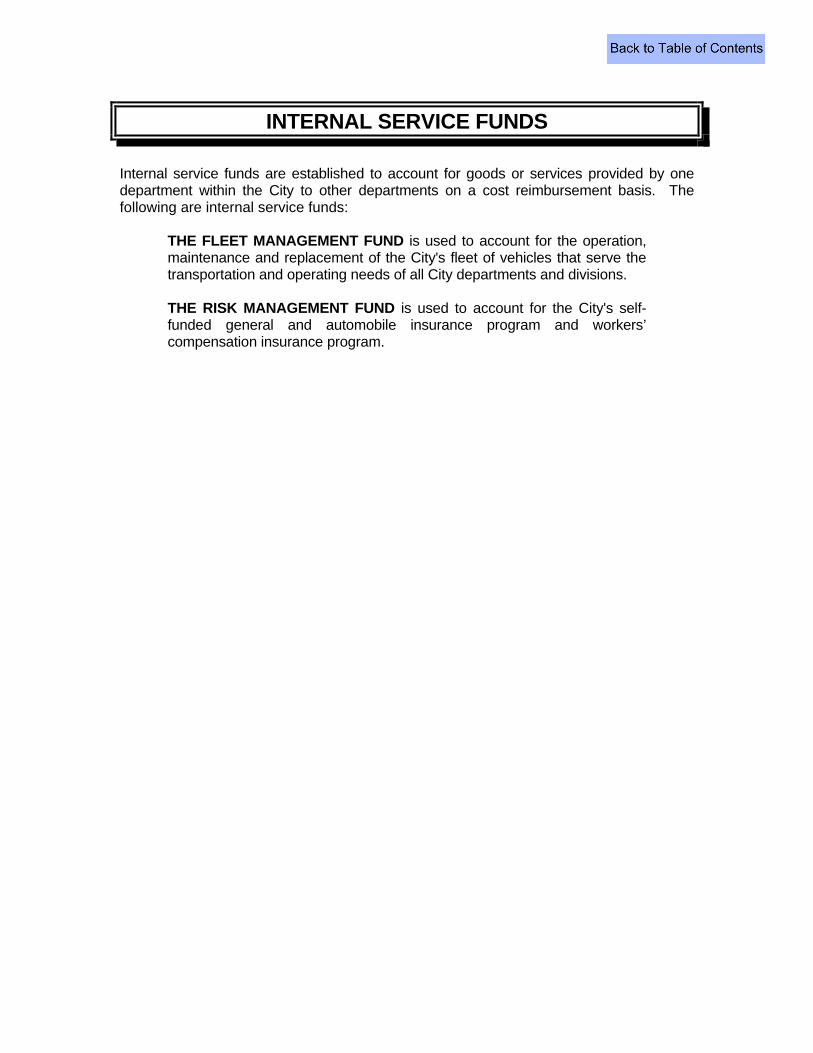
INTERNAL SERVICE FUNDS
Internal service funds are established to account for goods or services provided by one department within the City to other departments on a cost reimbursement basis. The following are internal service funds: THE FLEET MANAGEMENT FUND is used to account for the operation,
maintenance and replacement of the City's fleet of vehicles that serve the transportation and operating needs of all City departments and divisions.
THE RISK MANAGEMENT FUND is used to account for the City's self-
funded general and automobile insurance program and workers’ compensation insurance program.

THIS PAGE INTENTIONALLY LEFT BLANK
173
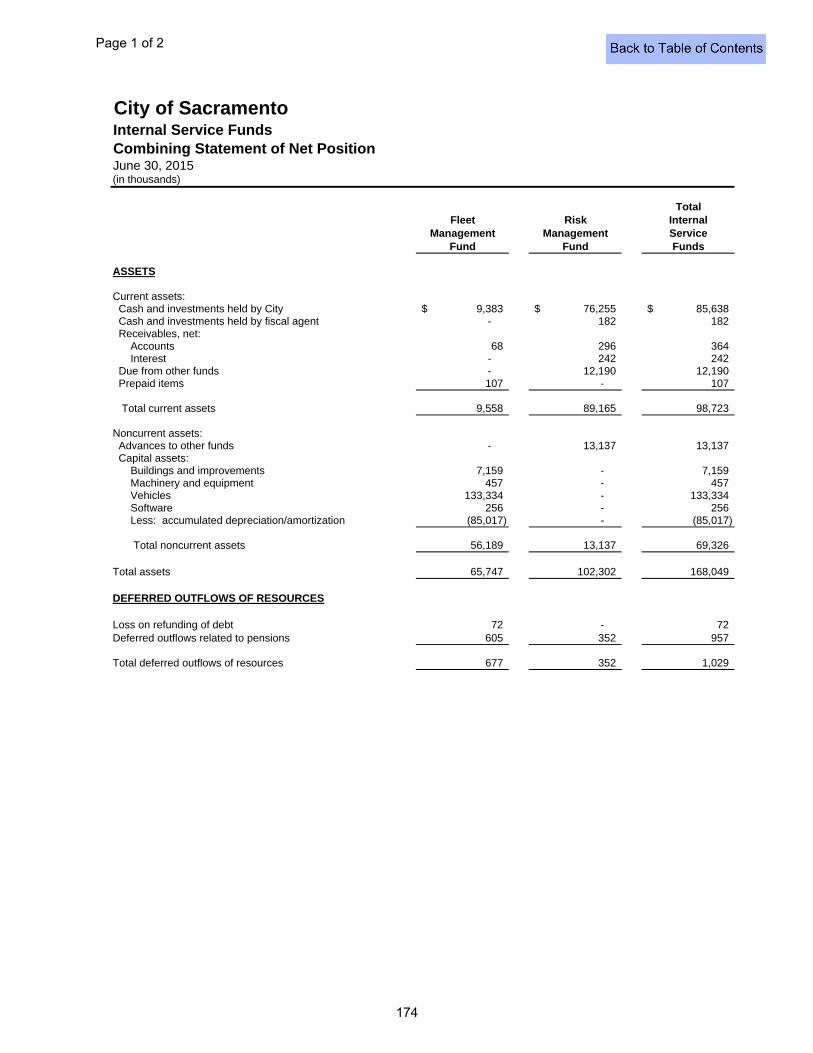
City of SacramentoInternal Service FundsCombining Statement of Net PositionJune 30, 2015(in thousands)
TotalFleet Risk Internal
Management Management ServiceFund Fund Funds
ASSETS
Current assets: Cash and investments held by City 9,383$ 76,255$ 85,638$ Cash and investments held by fiscal agent - 182 182 Receivables, net: Accounts 68 296 364 Interest - 242 242 Due from other funds - 12,190 12,190 Prepaid items 107 - 107
Total current assets 9,558 89,165 98,723
Noncurrent assets: Advances to other funds - 13,137 13,137 Capital assets: Buildings and improvements 7,159 - 7,159 Machinery and equipment 457 - 457 Vehicles 133,334 - 133,334 Software 256 - 256 Less: accumulated depreciation/amortization (85,017) - (85,017)
Total noncurrent assets 56,189 13,137 69,326
Total assets 65,747 102,302 168,049
DEFERRED OUTFLOWS OF RESOURCES
Loss on refunding of debt 72 - 72 Deferred outflows related to pensions 605 352 957
Total deferred outflows of resources 677 352 1,029
Page 1 of 2
174
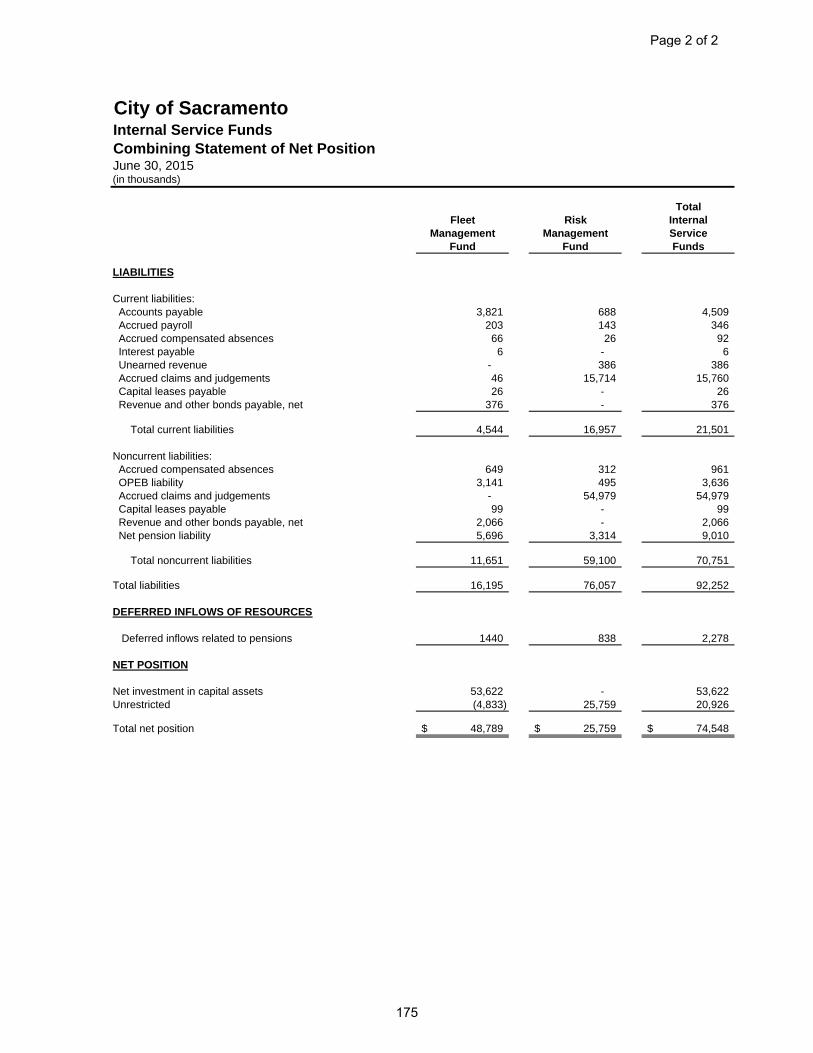
City of SacramentoInternal Service FundsCombining Statement of Net PositionJune 30, 2015(in thousands)
TotalFleet Risk Internal
Management Management ServiceFund Fund Funds
LIABILITIES
Current liabilities: Accounts payable 3,821 688 4,509 Accrued payroll 203 143 346 Accrued compensated absences 66 26 92 Interest payable 6 - 6 Unearned revenue - 386 386 Accrued claims and judgements 46 15,714 15,760 Capital leases payable 26 - 26 Revenue and other bonds payable, net 376 - 376
Total current liabilities 4,544 16,957 21,501
Noncurrent liabilities: Accrued compensated absences 649 312 961 OPEB liability 3,141 495 3,636 Accrued claims and judgements - 54,979 54,979 Capital leases payable 99 - 99 Revenue and other bonds payable, net 2,066 - 2,066 Net pension liability 5,696 3,314 9,010
Total noncurrent liabilities 11,651 59,100 70,751
Total liabilities 16,195 76,057 92,252
DEFERRED INFLOWS OF RESOURCES
Deferred inflows related to pensions 1440 838 2,278
NET POSITION
Net investment in capital assets 53,622 - 53,622 Unrestricted (4,833) 25,759 20,926
Total net position 48,789$ 25,759$ 74,548$
Page 2 of 2
175

THIS PAGE INTENTIONALLY LEFT BLANK
176
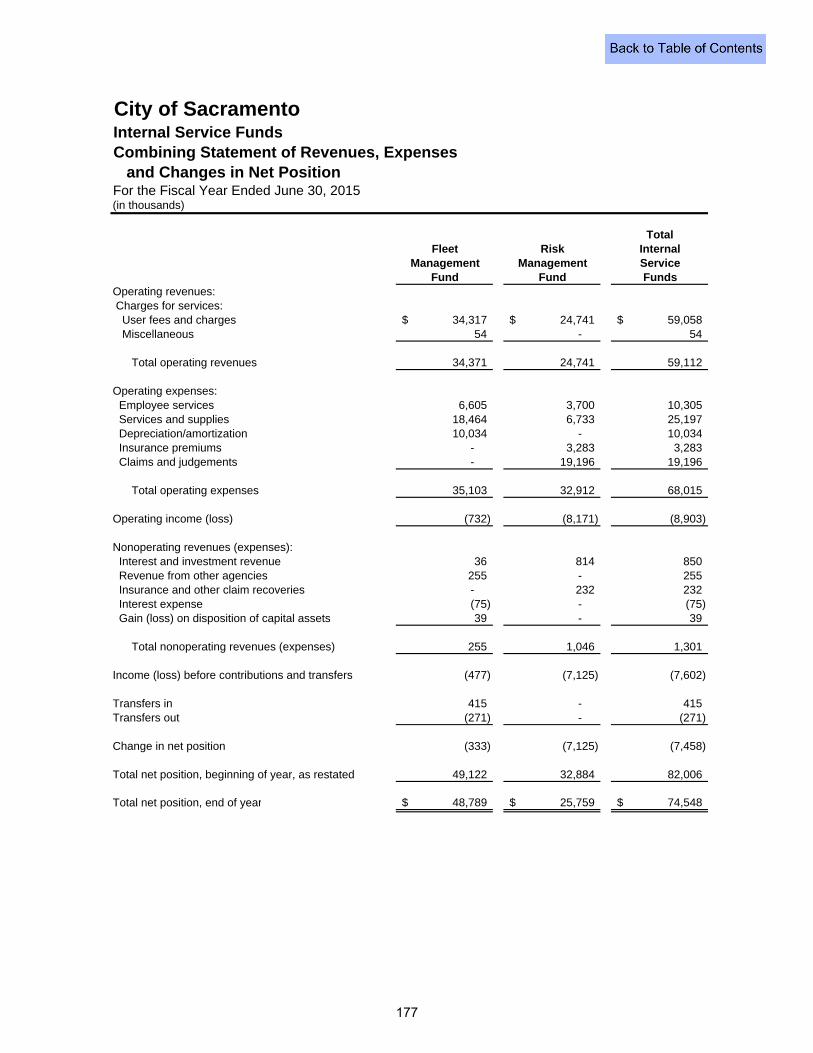
City of SacramentoInternal Service FundsCombining Statement of Revenues, Expenses and Changes in Net PositionFor the Fiscal Year Ended June 30, 2015(in thousands)
TotalFleet Risk Internal
Management Management ServiceFund Fund Funds
Operating revenues: Charges for services: User fees and charges 34,317$ 24,741$ 59,058$ Miscellaneous 54 - 54
Total operating revenues 34,371 24,741 59,112
Operating expenses: Employee services 6,605 3,700 10,305 Services and supplies 18,464 6,733 25,197 Depreciation/amortization 10,034 - 10,034 Insurance premiums - 3,283 3,283 Claims and judgements - 19,196 19,196
Total operating expenses 35,103 32,912 68,015
Operating income (loss) (732) (8,171) (8,903)
Nonoperating revenues (expenses): Interest and investment revenue 36 814 850 Revenue from other agencies 255 - 255 Insurance and other claim recoveries - 232 232 Interest expense (75) - (75) Gain (loss) on disposition of capital assets 39 - 39
Total nonoperating revenues (expenses) 255 1,046 1,301
Income (loss) before contributions and transfers (477) (7,125) (7,602)
Transfers in 415 - 415 Transfers out (271) - (271)
Change in net position (333) (7,125) (7,458)
Total net position, beginning of year, as restated 49,122 32,884 82,006
Total net position, end of year 48,789$ 25,759$ 74,548$
177
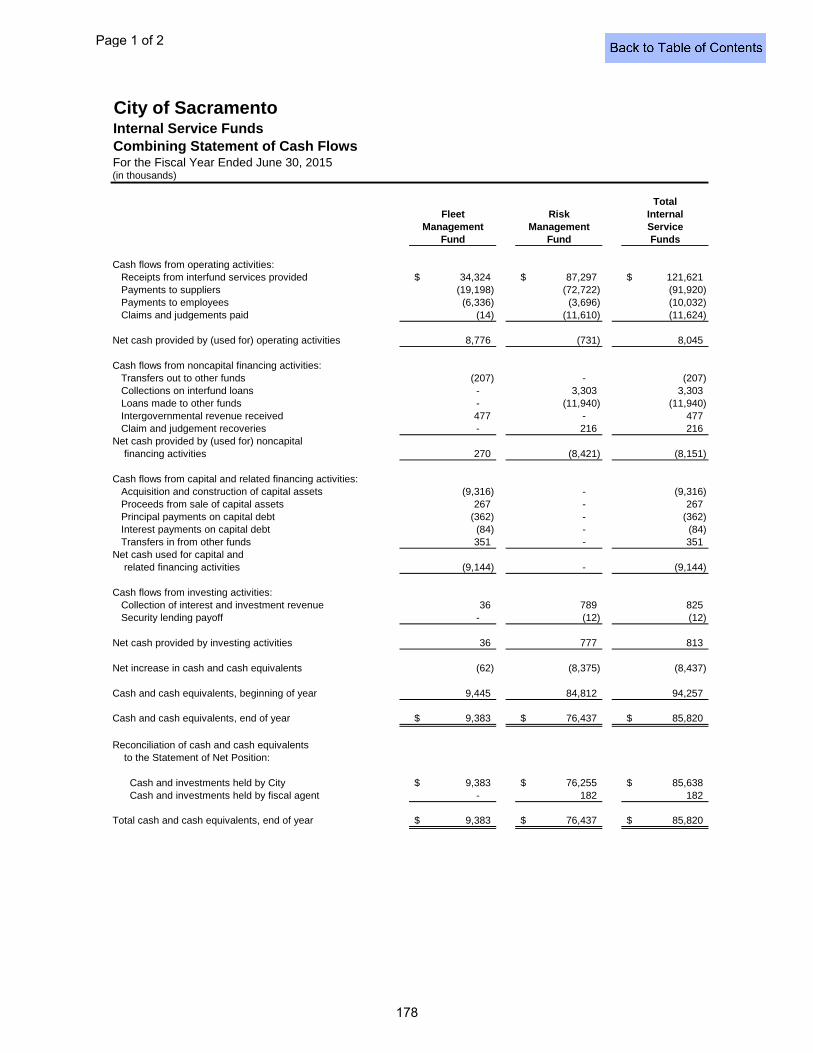
City of SacramentoInternal Service FundsCombining Statement of Cash FlowsFor the Fiscal Year Ended June 30, 2015(in thousands)
TotalFleet Risk Internal
Management Management ServiceFund Fund Funds
Cash flows from operating activities:Receipts from interfund services provided 34,324$ 87,297$ 121,621$ Payments to suppliers (19,198) (72,722) (91,920) Payments to employees (6,336) (3,696) (10,032) Claims and judgements paid (14) (11,610) (11,624)
Net cash provided by (used for) operating activities 8,776 (731) 8,045
Cash flows from noncapital financing activities:Transfers out to other funds (207) - (207) Collections on interfund loans - 3,303 3,303 Loans made to other funds - (11,940) (11,940) Intergovernmental revenue received 477 - 477 Claim and judgement recoveries - 216 216
Net cash provided by (used for) noncapital financing activities 270 (8,421) (8,151)
Cash flows from capital and related financing activities:Acquisition and construction of capital assets (9,316) - (9,316) Proceeds from sale of capital assets 267 - 267 Principal payments on capital debt (362) - (362) Interest payments on capital debt (84) - (84) Transfers in from other funds 351 - 351
Net cash used for capital and related financing activities (9,144) - (9,144)
Cash flows from investing activities:Collection of interest and investment revenue 36 789 825 Security lending payoff - (12) (12)
Net cash provided by investing activities 36 777 813
Net increase in cash and cash equivalents (62) (8,375) (8,437)
Cash and cash equivalents, beginning of year 9,445 84,812 94,257
Cash and cash equivalents, end of year 9,383$ 76,437$ 85,820$
Reconciliation of cash and cash equivalents to the Statement of Net Position:
Cash and investments held by City 9,383$ 76,255$ 85,638$ Cash and investments held by fiscal agent - 182 182
Total cash and cash equivalents, end of year 9,383$ 76,437$ 85,820$
Page 1 of 2
178
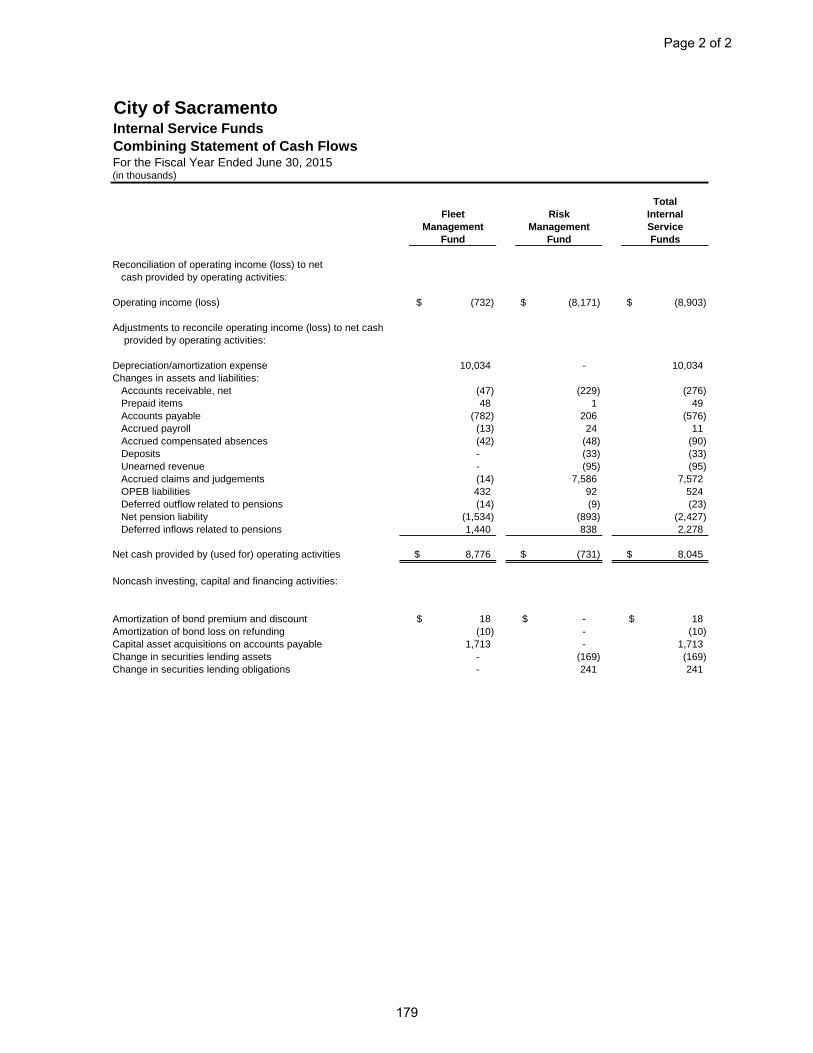
City of SacramentoInternal Service FundsCombining Statement of Cash FlowsFor the Fiscal Year Ended June 30, 2015(in thousands)
TotalFleet Risk Internal
Management Management ServiceFund Fund Funds
Reconciliation of operating income (loss) to netcash provided by operating activities:
Operating income (loss) (732)$ (8,171)$ (8,903)$
Adjustments to reconcile operating income (loss) to net cash provided by operating activities:
Depreciation/amortization expense 10,034 - 10,034Changes in assets and liabilities:
Accounts receivable, net (47) (229) (276)Prepaid items 48 1 49Accounts payable (782) 206 (576)Accrued payroll (13) 24 11Accrued compensated absences (42) (48) (90)Deposits - (33) (33)Unearned revenue - (95) (95)Accrued claims and judgements (14) 7,586 7,572OPEB liabilities 432 92 524Deferred outflow related to pensions (14) (9) (23)Net pension liability (1,534) (893) (2,427)Deferred inflows related to pensions 1,440 838 2,278
Net cash provided by (used for) operating activities 8,776$ (731)$ 8,045$
Noncash investing, capital and financing activities:
Amortization of bond premium and discount 18$ -$ 18$ Amortization of bond loss on refunding (10) - (10)Capital asset acquisitions on accounts payable 1,713 - 1,713Change in securities lending assets - (169) (169)Change in securities lending obligations - 241 241
Page 2 of 2
179

THIS PAGE INTENTIONALLY LEFT BLANK
180
INVESTMENT TRUST FUNDS
Investment trust funds account for assets and related liabilities of legally separate entities for which the City provides investment services. Investment Pool is used to account for assets and liabilities held for
external participants in the City Sponsored Investment Pool. Individual Investment Accounts are used to account for assets and
liabilities, held for entities external to the City, which are not invested in the City Sponsored Investment Pool.
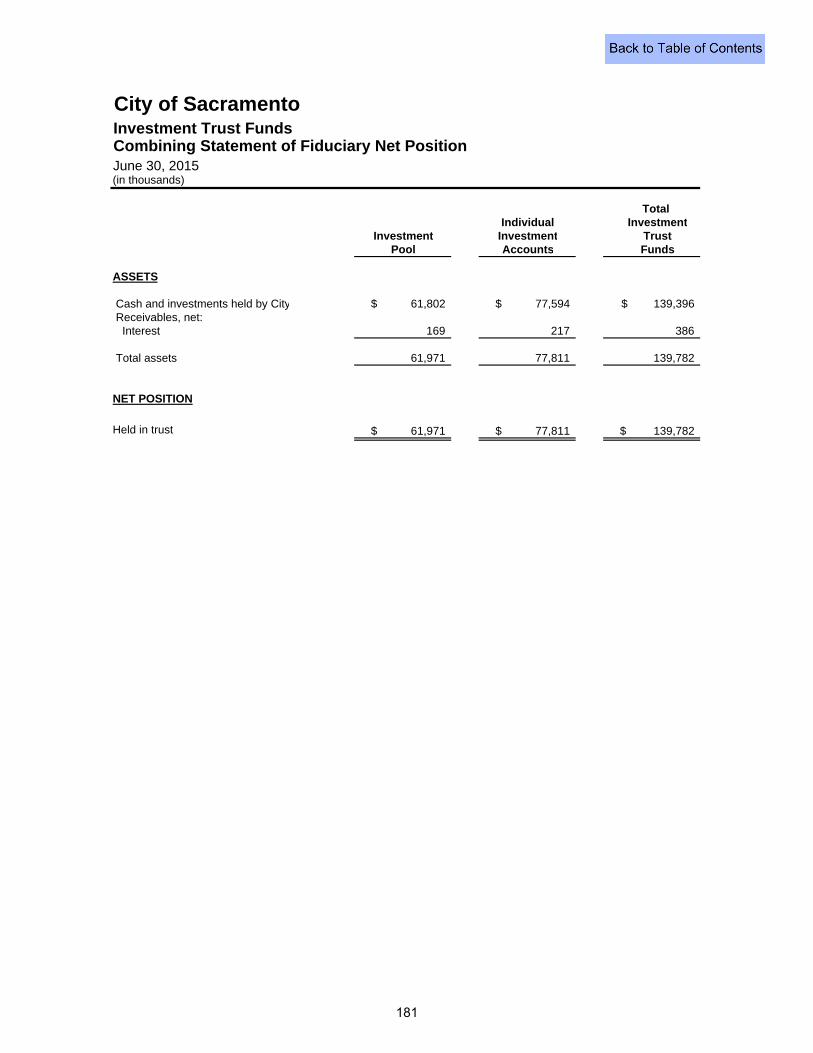
City of SacramentoInvestment Trust FundsCombining Statement of Fiduciary Net PositionJune 30, 2015(in thousands)
Total Investment
TrustFunds
ASSETS
Cash and investments held by City 61,802$ 77,594$ 139,396$ Receivables, net:
Interest 169 217 386
Total assets 61,971 77,811 139,782
NET POSITION
Held in trust 61,971$ 77,811$ 139,782$
InvestmentPool
IndividualInvestmentAccounts
181
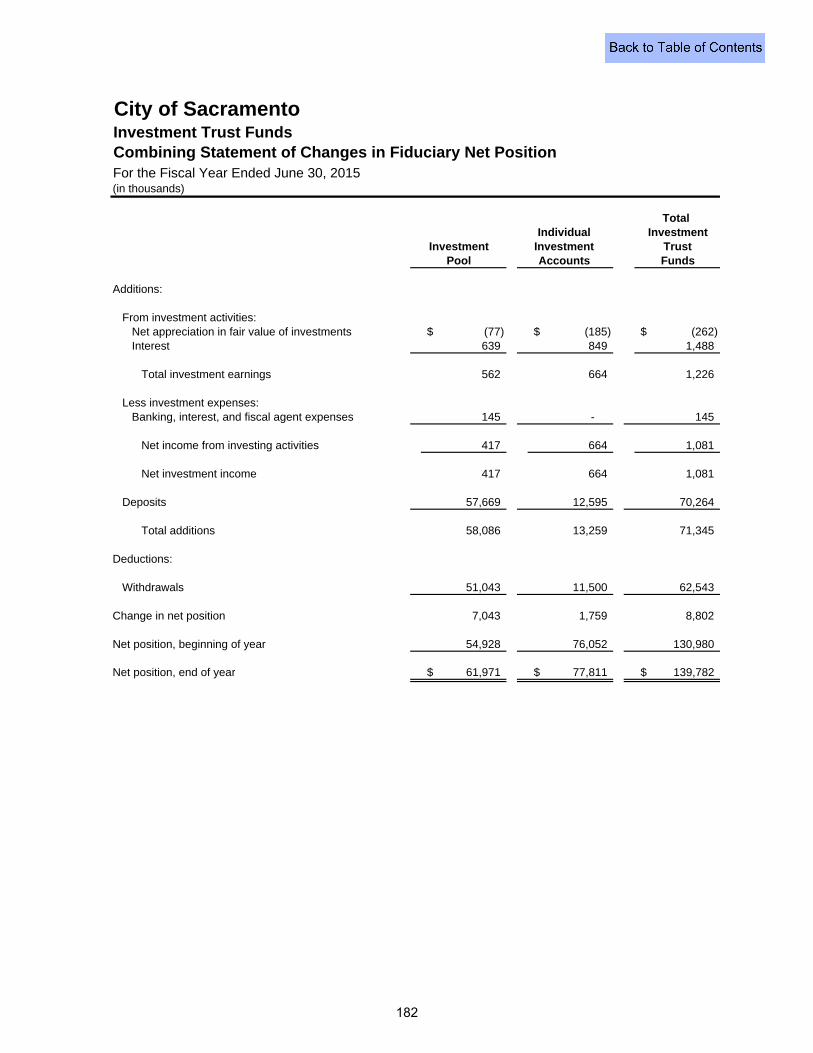
City of SacramentoInvestment Trust FundsCombining Statement of Changes in Fiduciary Net PositionFor the Fiscal Year Ended June 30, 2015(in thousands)
Total Investment
TrustFunds
Additions:
From investment activities:Net appreciation in fair value of investments (77)$ (185)$ (262)$ Interest 639 849 1,488
Total investment earnings 562 664 1,226
Less investment expenses:Banking, interest, and fiscal agent expenses 145 - 145
Net income from investing activities 417 664 1,081
Net investment income 417 664 1,081
Deposits 57,669 12,595 70,264
Total additions 58,086 13,259 71,345
Deductions:
Withdrawals 51,043 11,500 62,543
Change in net position 7,043 1,759 8,802
Net position, beginning of year 54,928 76,052 130,980
Net position, end of year 61,971$ 77,811$ 139,782$
InvestmentPool
Individual Investment Accounts
182
AGENCY FUNDS
Agency funds account for assets held for other organizations, governments or private individuals and includes: THE ASSESSMENT DISTRICTS FUND is used to account for parcel
assessments and debt service for bonds issued under the Improvement Bond Act of 1915.
THE COMMUNITY FACILITIES DISTRICTS FUND is used to account for
special tax assessments, debt service payments and the payment of other costs related to Mello-Roos districts within the City.
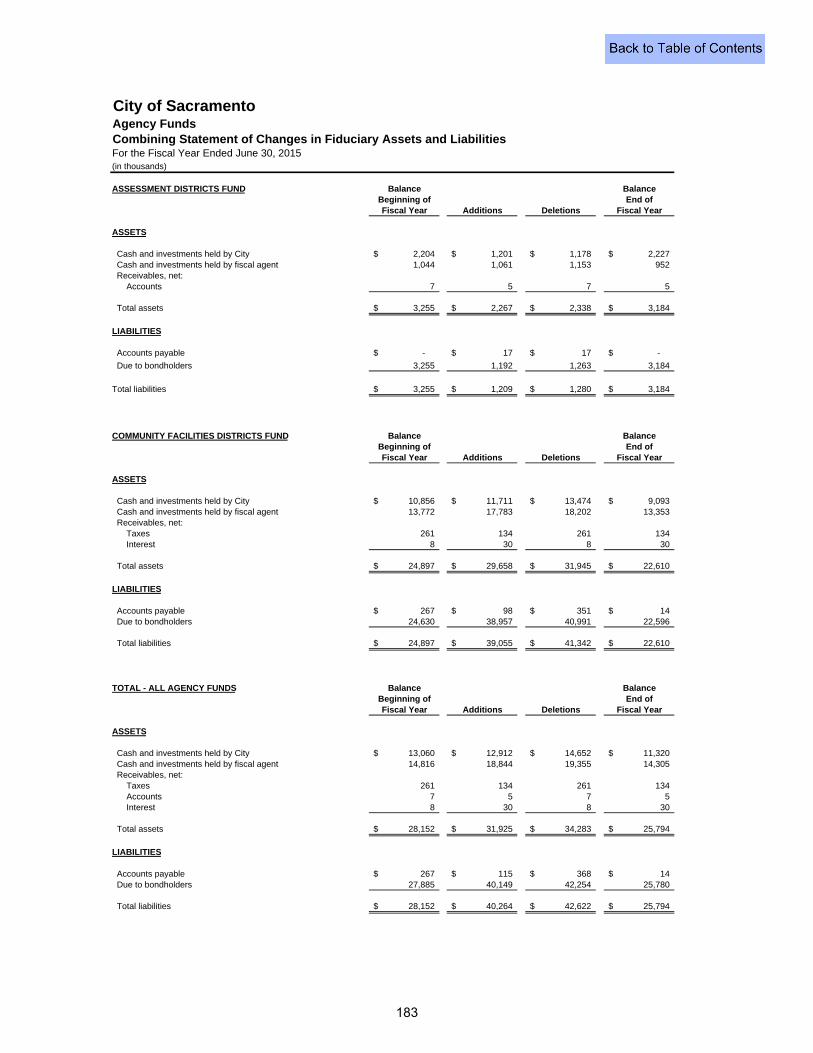
City of SacramentoAgency FundsCombining Statement of Changes in Fiduciary Assets and LiabilitiesFor the Fiscal Year Ended June 30, 2015(in thousands)
ASSESSMENT DISTRICTS FUND Balance BalanceBeginning of End ofFiscal Year Additions Deletions Fiscal Year
ASSETS
Cash and investments held by City 2,204$ 1,201$ 1,178$ 2,227$ Cash and investments held by fiscal agent 1,044 1,061 1,153 952 Receivables, net: Accounts 7 5 7 5
Total assets 3,255$ 2,267$ 2,338$ 3,184$
LIABILITIES
Accounts payable -$ 17$ 17$ -$
Due to bondholders 3,255 1,192 1,263 3,184
Total liabilities 3,255$ 1,209$ 1,280$ 3,184$
COMMUNITY FACILITIES DISTRICTS FUND Balance BalanceBeginning of End ofFiscal Year Additions Deletions Fiscal Year
ASSETS
Cash and investments held by City 10,856$ 11,711$ 13,474$ 9,093$ Cash and investments held by fiscal agent 13,772 17,783 18,202 13,353 Receivables, net: Taxes 261 134 261 134 Interest 8 30 8 30
Total assets 24,897$ 29,658$ 31,945$ 22,610$
LIABILITIES
Accounts payable 267$ 98$ 351$ 14$ Due to bondholders 24,630 38,957 40,991 22,596
Total liabilities 24,897$ 39,055$ 41,342$ 22,610$
TOTAL - ALL AGENCY FUNDS Balance BalanceBeginning of End ofFiscal Year Additions Deletions Fiscal Year
ASSETS
Cash and investments held by City 13,060$ 12,912$ 14,652$ 11,320$ Cash and investments held by fiscal agent 14,816 18,844 19,355 14,305 Receivables, net: Taxes 261 134 261 134 Accounts 7 5 7 5 Interest 8 30 8 30
Total assets 28,152$ 31,925$ 34,283$ 25,794$
LIABILITIES
Accounts payable 267$ 115$ 368$ 14$ Due to bondholders 27,885 40,149 42,254 25,780
Total liabilities 28,152$ 40,264$ 42,622$ 25,794$
183

THIS PAGE INTENTIONALLY LEFT BLANK
184

COMPONENT UNIT
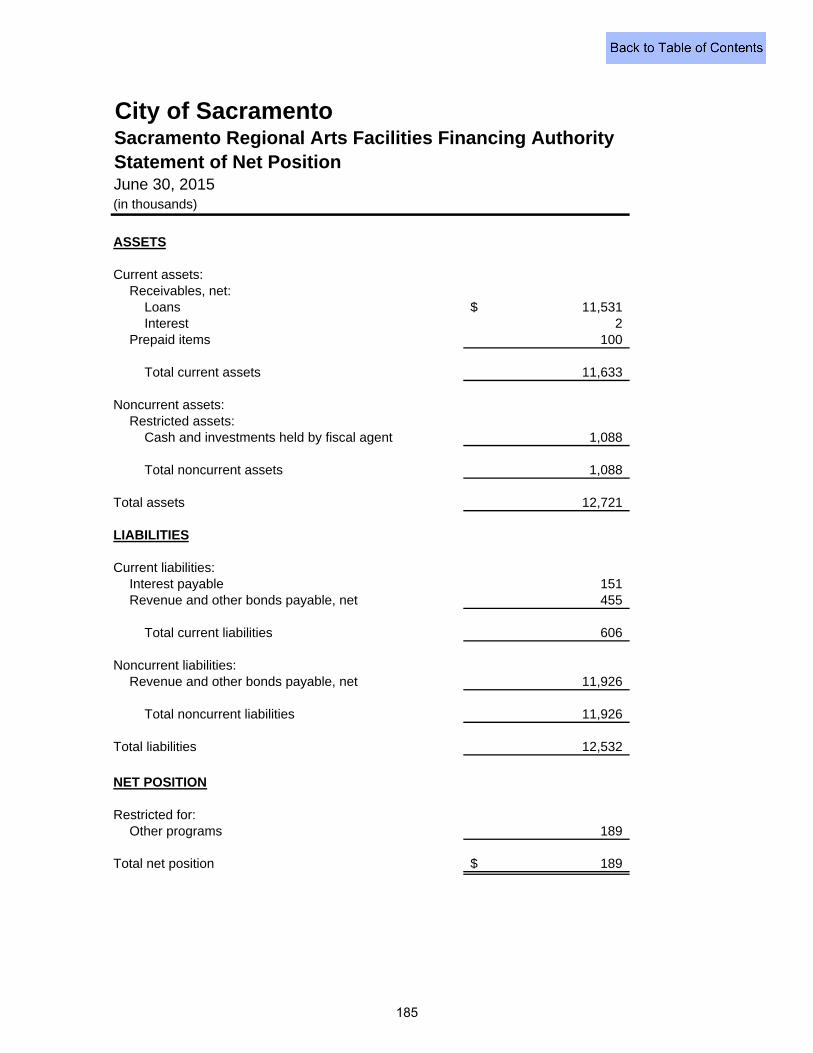
City of SacramentoSacramento Regional Arts Facilities Financing AuthorityStatement of Net PositionJune 30, 2015(in thousands)
ASSETS
Current assets:Receivables, net:
Loans 11,531$ Interest 2
Prepaid items 100
Total current assets 11,633
Noncurrent assets:Restricted assets:
Cash and investments held by fiscal agent 1,088
Total noncurrent assets 1,088
Total assets 12,721
LIABILITIES
Current liabilities:Interest payable 151 Revenue and other bonds payable, net 455
Total current liabilities 606
Noncurrent liabilities:Revenue and other bonds payable, net 11,926
Total noncurrent liabilities 11,926
Total liabilities 12,532
NET POSITION
Restricted for:Other programs 189
Total net position 189$
185
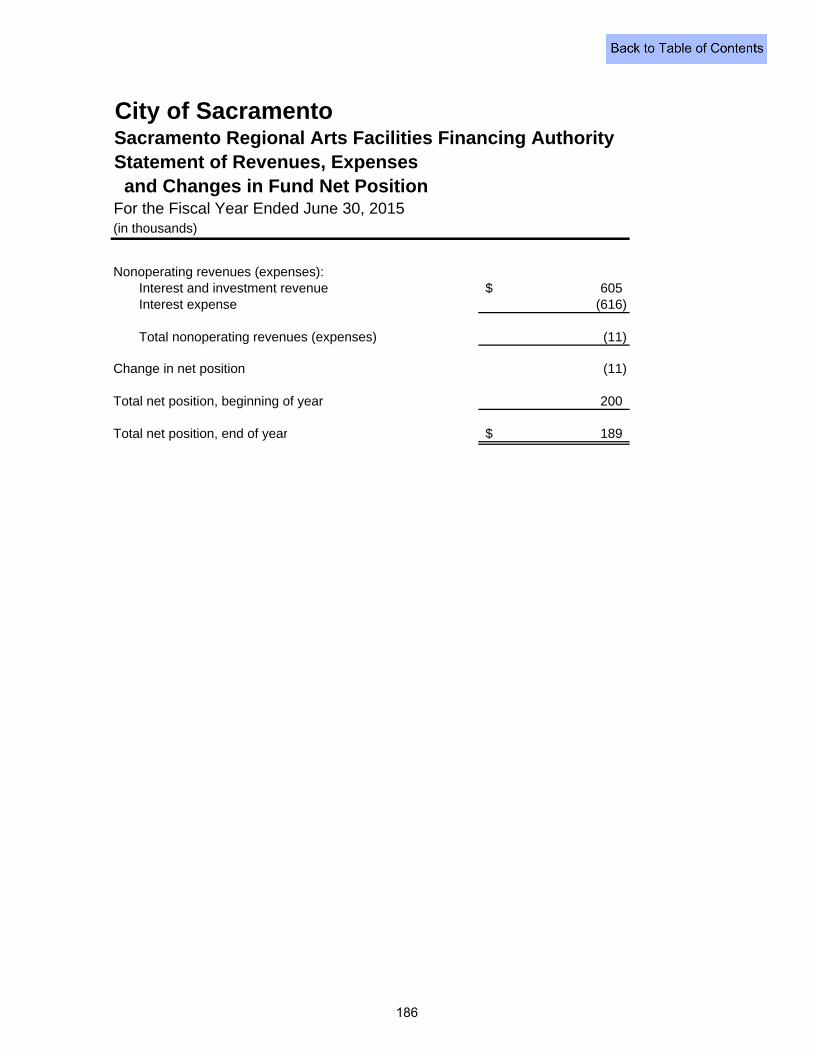
City of SacramentoSacramento Regional Arts Facilities Financing AuthorityStatement of Revenues, Expenses and Changes in Fund Net Position
For the Fiscal Year Ended June 30, 2015(in thousands)
Nonoperating revenues (expenses):Interest and investment revenue 605$ Interest expense (616)
Total nonoperating revenues (expenses) (11)
Change in net position (11)
Total net position, beginning of year 200
Total net position, end of year 189$
186
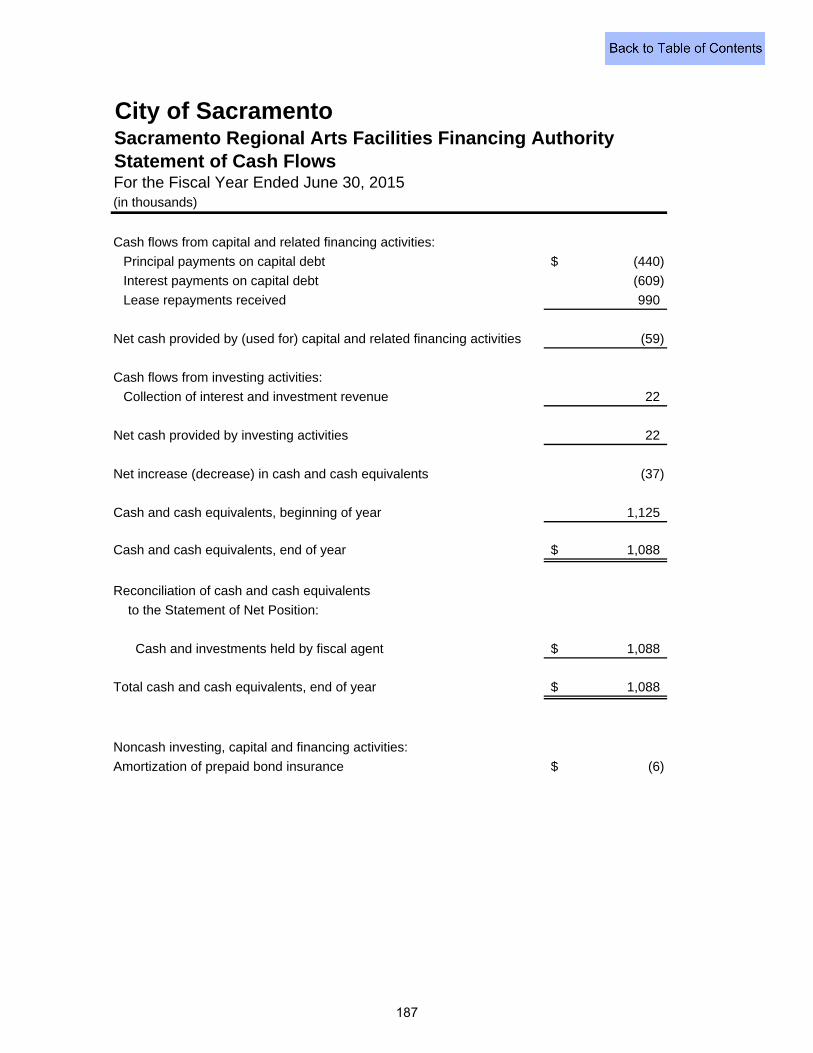
City of SacramentoSacramento Regional Arts Facilities Financing AuthorityStatement of Cash FlowsFor the Fiscal Year Ended June 30, 2015(in thousands)
Cash flows from capital and related financing activities:
Principal payments on capital debt (440)$
Interest payments on capital debt (609)
Lease repayments received 990
Net cash provided by (used for) capital and related financing activities (59)
Cash flows from investing activities:
Collection of interest and investment revenue 22
Net cash provided by investing activities 22
Net increase (decrease) in cash and cash equivalents (37)
Cash and cash equivalents, beginning of year 1,125
Cash and cash equivalents, end of year 1,088$
Reconciliation of cash and cash equivalents
to the Statement of Net Position:
Cash and investments held by fiscal agent 1,088$
Total cash and cash equivalents, end of year 1,088$
Noncash investing, capital and financing activities:
Amortization of prepaid bond insurance (6)$
187

THIS PAGE INTENTIONALLY LEFT BLANK
188

Statistical Section
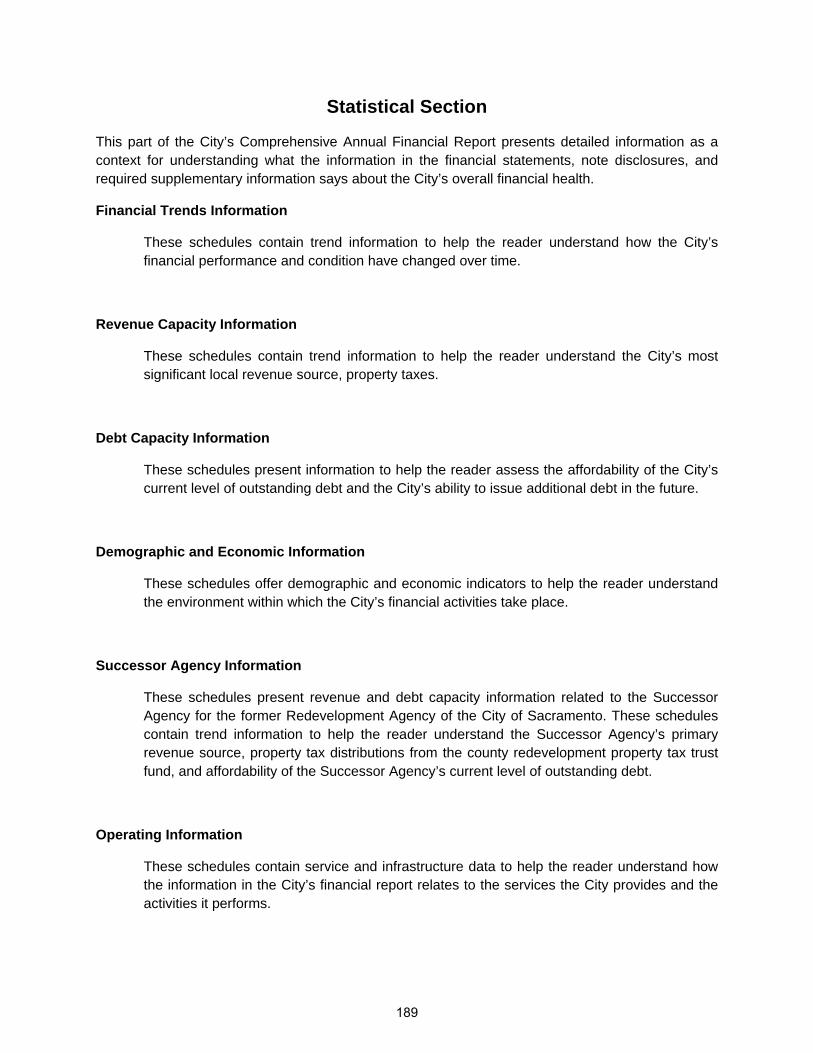
Statistical Section
This part of the City’s Comprehensive Annual Financial Report presents detailed information as a context for understanding what the information in the financial statements, note disclosures, and required supplementary information says about the City’s overall financial health.
Financial Trends Information
These schedules contain trend information to help the reader understand how the City’s financial performance and condition have changed over time.
Revenue Capacity Information
These schedules contain trend information to help the reader understand the City’s most significant local revenue source, property taxes.
Debt Capacity Information
These schedules present information to help the reader assess the affordability of the City’s current level of outstanding debt and the City’s ability to issue additional debt in the future.
Demographic and Economic Information
These schedules offer demographic and economic indicators to help the reader understand the environment within which the City’s financial activities take place.
Successor Agency Information
These schedules present revenue and debt capacity information related to the Successor Agency for the former Redevelopment Agency of the City of Sacramento. These schedules contain trend information to help the reader understand the Successor Agency’s primary revenue source, property tax distributions from the county redevelopment property tax trust fund, and affordability of the Successor Agency’s current level of outstanding debt.
Operating Information
These schedules contain service and infrastructure data to help the reader understand how the information in the City’s financial report relates to the services the City provides and the activities it performs.
189
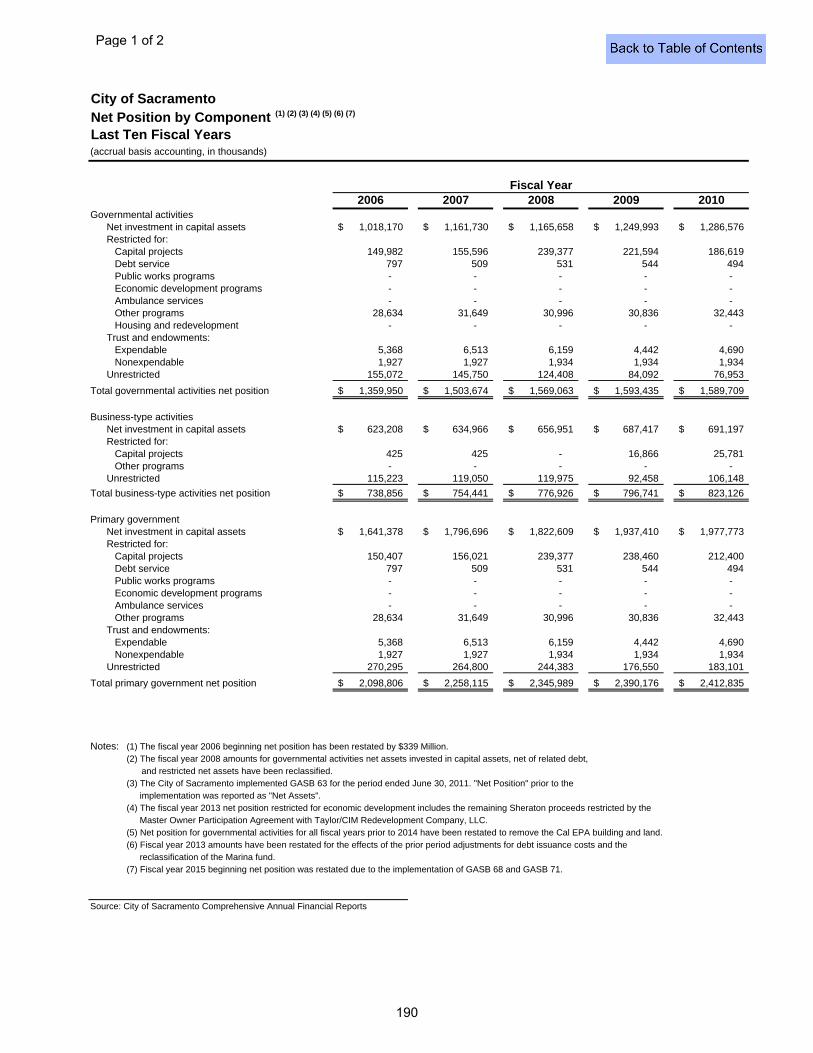
City of SacramentoNet Position by Component (1) (2) (3) (4) (5) (6) (7)
Last Ten Fiscal Years(accrual basis accounting, in thousands)
2006 2007 2008 2009 2010Governmental activities
Net investment in capital assets 1,018,170$ 1,161,730$ 1,165,658$ 1,249,993$ 1,286,576$ Restricted for:
Capital projects 149,982 155,596 239,377 221,594 186,619 Debt service 797 509 531 544 494 Public works programs - - - - - Economic development programs - - - - - Ambulance services - - - - - Other programs 28,634 31,649 30,996 30,836 32,443 Housing and redevelopment - - - - -
Trust and endowments:Expendable 5,368 6,513 6,159 4,442 4,690 Nonexpendable 1,927 1,927 1,934 1,934 1,934
Unrestricted 155,072 145,750 124,408 84,092 76,953
Total governmental activities net position 1,359,950$ 1,503,674$ 1,569,063$ 1,593,435$ 1,589,709$
Business-type activitiesNet investment in capital assets 623,208$ 634,966$ 656,951$ 687,417$ 691,197$ Restricted for:
Capital projects 425 425 - 16,866 25,781 Other programs - - - - -
Unrestricted 115,223 119,050 119,975 92,458 106,148
Total business-type activities net position 738,856$ 754,441$ 776,926$ 796,741$ 823,126$
Primary governmentNet investment in capital assets 1,641,378$ 1,796,696$ 1,822,609$ 1,937,410$ 1,977,773$ Restricted for:
Capital projects 150,407 156,021 239,377 238,460 212,400 Debt service 797 509 531 544 494 Public works programs - - - - - Economic development programs - - - - - Ambulance services - - - - - Other programs 28,634 31,649 30,996 30,836 32,443
Trust and endowments:Expendable 5,368 6,513 6,159 4,442 4,690 Nonexpendable 1,927 1,927 1,934 1,934 1,934
Unrestricted 270,295 264,800 244,383 176,550 183,101
Total primary government net position 2,098,806$ 2,258,115$ 2,345,989$ 2,390,176$ 2,412,835$
Notes: (1) The fiscal year 2006 beginning net position has been restated by $339 Million.(2) The fiscal year 2008 amounts for governmental activities net assets invested in capital assets, net of related debt, and restricted net assets have been reclassified.(3) The City of Sacramento implemented GASB 63 for the period ended June 30, 2011. "Net Position" prior to the
implementation was reported as "Net Assets".(4) The fiscal year 2013 net position restricted for economic development includes the remaining Sheraton proceeds restricted by the
Master Owner Participation Agreement with Taylor/CIM Redevelopment Company, LLC.(5) Net position for governmental activities for all fiscal years prior to 2014 have been restated to remove the Cal EPA building and land.(6) Fiscal year 2013 amounts have been restated for the effects of the prior period adjustments for debt issuance costs and the
reclassification of the Marina fund.(7) Fiscal year 2015 beginning net position was restated due to the implementation of GASB 68 and GASB 71.
Source: City of Sacramento Comprehensive Annual Financial Reports
Fiscal Year
Page 1 of 2
190
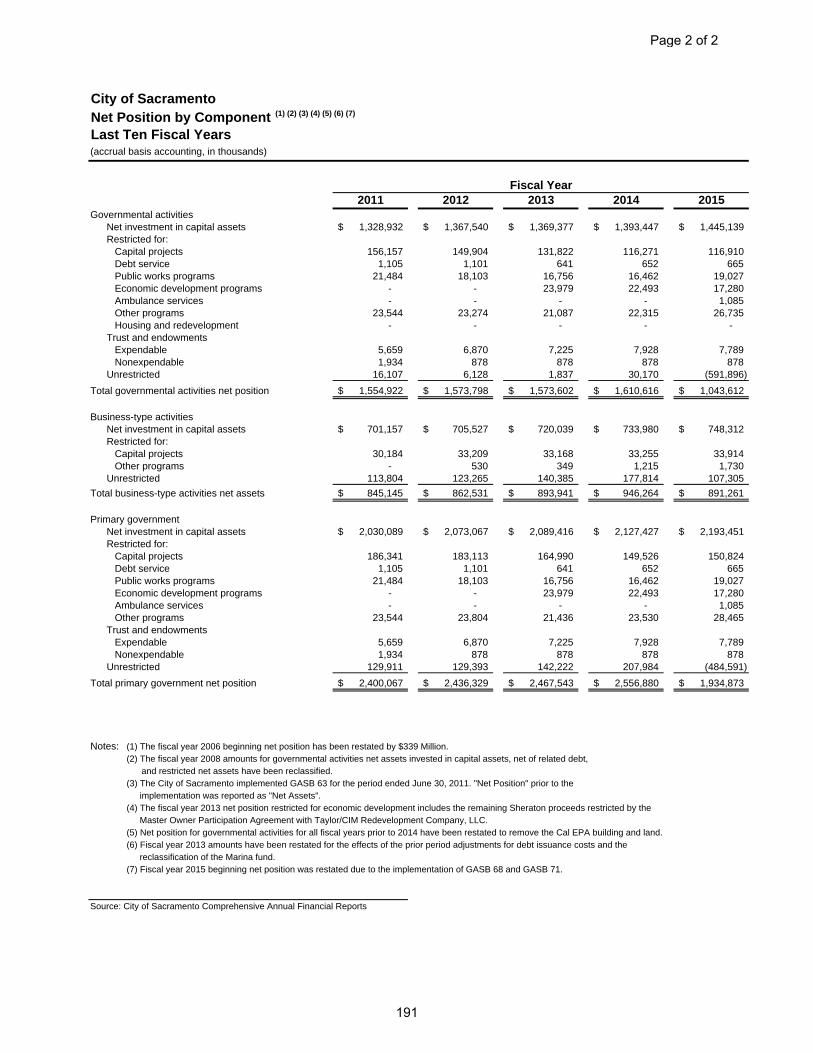
City of SacramentoNet Position by Component (1) (2) (3) (4) (5) (6) (7)
Last Ten Fiscal Years(accrual basis accounting, in thousands)
2011 2012 2013 2014 2015Governmental activities
Net investment in capital assets 1,328,932$ 1,367,540$ 1,369,377$ 1,393,447$ 1,445,139$ Restricted for:
Capital projects 156,157 149,904 131,822 116,271 116,910 Debt service 1,105 1,101 641 652 665 Public works programs 21,484 18,103 16,756 16,462 19,027 Economic development programs - - 23,979 22,493 17,280 Ambulance services - - - - 1,085 Other programs 23,544 23,274 21,087 22,315 26,735 Housing and redevelopment - - - - -
Trust and endowmentsExpendable 5,659 6,870 7,225 7,928 7,789 Nonexpendable 1,934 878 878 878 878
Unrestricted 16,107 6,128 1,837 30,170 (591,896)
Total governmental activities net position 1,554,922$ 1,573,798$ 1,573,602$ 1,610,616$ 1,043,612$
Business-type activitiesNet investment in capital assets 701,157$ 705,527$ 720,039$ 733,980$ 748,312$ Restricted for:
Capital projects 30,184 33,209 33,168 33,255 33,914 Other programs - 530 349 1,215 1,730
Unrestricted 113,804 123,265 140,385 177,814 107,305
Total business-type activities net assets 845,145$ 862,531$ 893,941$ 946,264$ 891,261$
Primary governmentNet investment in capital assets 2,030,089$ 2,073,067$ 2,089,416$ 2,127,427$ 2,193,451$ Restricted for:
Capital projects 186,341 183,113 164,990 149,526 150,824 Debt service 1,105 1,101 641 652 665 Public works programs 21,484 18,103 16,756 16,462 19,027 Economic development programs - - 23,979 22,493 17,280 Ambulance services - - - - 1,085 Other programs 23,544 23,804 21,436 23,530 28,465
Trust and endowmentsExpendable 5,659 6,870 7,225 7,928 7,789 Nonexpendable 1,934 878 878 878 878
Unrestricted 129,911 129,393 142,222 207,984 (484,591)
Total primary government net position 2,400,067$ 2,436,329$ 2,467,543$ 2,556,880$ 1,934,873$
Notes: (1) The fiscal year 2006 beginning net position has been restated by $339 Million.(2) The fiscal year 2008 amounts for governmental activities net assets invested in capital assets, net of related debt, and restricted net assets have been reclassified.(3) The City of Sacramento implemented GASB 63 for the period ended June 30, 2011. "Net Position" prior to the
implementation was reported as "Net Assets".(4) The fiscal year 2013 net position restricted for economic development includes the remaining Sheraton proceeds restricted by the
Master Owner Participation Agreement with Taylor/CIM Redevelopment Company, LLC.(5) Net position for governmental activities for all fiscal years prior to 2014 have been restated to remove the Cal EPA building and land.(6) Fiscal year 2013 amounts have been restated for the effects of the prior period adjustments for debt issuance costs and the
reclassification of the Marina fund.(7) Fiscal year 2015 beginning net position was restated due to the implementation of GASB 68 and GASB 71.
Source: City of Sacramento Comprehensive Annual Financial Reports
Fiscal Year
Page 2 of 2
191
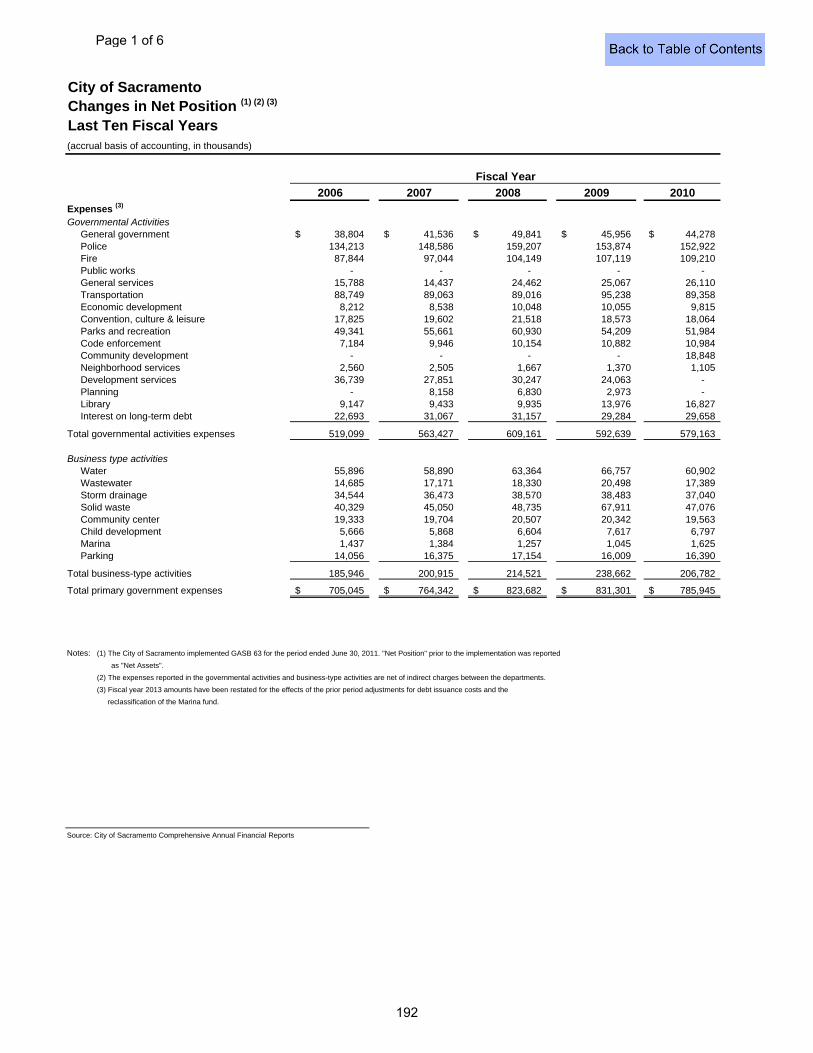
City of SacramentoChanges in Net Position (1) (2) (3)
Last Ten Fiscal Years(accrual basis of accounting, in thousands)
2006 2007 2008 2009 2010Expenses (3)
Governmental ActivitiesGeneral government 38,804$ 41,536$ 49,841$ 45,956$ 44,278$ Police 134,213 148,586 159,207 153,874 152,922 Fire 87,844 97,044 104,149 107,119 109,210 Public works - - - - - General services 15,788 14,437 24,462 25,067 26,110 Transportation 88,749 89,063 89,016 95,238 89,358 Economic development 8,212 8,538 10,048 10,055 9,815 Convention, culture & leisure 17,825 19,602 21,518 18,573 18,064 Parks and recreation 49,341 55,661 60,930 54,209 51,984 Code enforcement 7,184 9,946 10,154 10,882 10,984 Community development - - - - 18,848 Neighborhood services 2,560 2,505 1,667 1,370 1,105 Development services 36,739 27,851 30,247 24,063 - Planning - 8,158 6,830 2,973 - Library 9,147 9,433 9,935 13,976 16,827 Interest on long-term debt 22,693 31,067 31,157 29,284 29,658
Total governmental activities expenses 519,099 563,427 609,161 592,639 579,163
Business type activitiesWater 55,896 58,890 63,364 66,757 60,902Wastewater 14,685 17,171 18,330 20,498 17,389 Storm drainage 34,544 36,473 38,570 38,483 37,040 Solid waste 40,329 45,050 48,735 67,911 47,076 Community center 19,333 19,704 20,507 20,342 19,563 Child development 5,666 5,868 6,604 7,617 6,797 Marina 1,437 1,384 1,257 1,045 1,625 Parking 14,056 16,375 17,154 16,009 16,390
Total business-type activities 185,946 200,915 214,521 238,662 206,782
Total primary government expenses 705,045$ 764,342$ 823,682$ 831,301$ 785,945$
Notes: (1) The City of Sacramento implemented GASB 63 for the period ended June 30, 2011. "Net Position" prior to the implementation was reported
as "Net Assets".
(2) The expenses reported in the governmental activities and business-type activities are net of indirect charges between the departments.
(3) Fiscal year 2013 amounts have been restated for the effects of the prior period adjustments for debt issuance costs and the
reclassification of the Marina fund.
Source: City of Sacramento Comprehensive Annual Financial Reports
Fiscal Year
Page 1 of 6
192
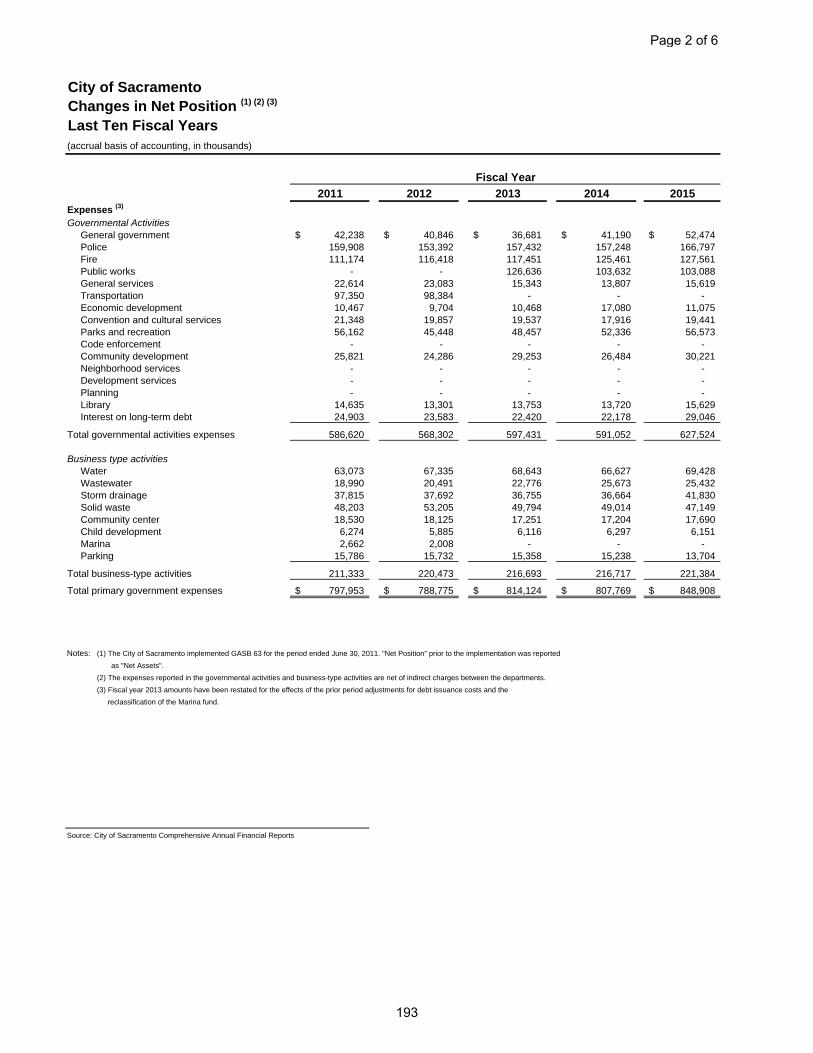
City of SacramentoChanges in Net Position (1) (2) (3)
Last Ten Fiscal Years(accrual basis of accounting, in thousands)
2011 2012 2013 2014 2015Expenses (3)
Governmental ActivitiesGeneral government 42,238$ 40,846$ 36,681$ 41,190$ 52,474$ Police 159,908 153,392 157,432 157,248 166,797 Fire 111,174 116,418 117,451 125,461 127,561 Public works - - 126,636 103,632 103,088 General services 22,614 23,083 15,343 13,807 15,619 Transportation 97,350 98,384 - - - Economic development 10,467 9,704 10,468 17,080 11,075 Convention and cultural services 21,348 19,857 19,537 17,916 19,441 Parks and recreation 56,162 45,448 48,457 52,336 56,573 Code enforcement - - - - - Community development 25,821 24,286 29,253 26,484 30,221 Neighborhood services - - - - - Development services - - - - - Planning - - - - - Library 14,635 13,301 13,753 13,720 15,629 Interest on long-term debt 24,903 23,583 22,420 22,178 29,046
Total governmental activities expenses 586,620 568,302 597,431 591,052 627,524
Business type activitiesWater 63,073 67,335 68,643 66,627 69,428 Wastewater 18,990 20,491 22,776 25,673 25,432 Storm drainage 37,815 37,692 36,755 36,664 41,830 Solid waste 48,203 53,205 49,794 49,014 47,149 Community center 18,530 18,125 17,251 17,204 17,690 Child development 6,274 5,885 6,116 6,297 6,151 Marina 2,662 2,008 - - - Parking 15,786 15,732 15,358 15,238 13,704
Total business-type activities 211,333 220,473 216,693 216,717 221,384
Total primary government expenses 797,953$ 788,775$ 814,124$ 807,769$ 848,908$
Notes: (1) The City of Sacramento implemented GASB 63 for the period ended June 30, 2011. "Net Position" prior to the implementation was reported
as "Net Assets".
(2) The expenses reported in the governmental activities and business-type activities are net of indirect charges between the departments.
(3) Fiscal year 2013 amounts have been restated for the effects of the prior period adjustments for debt issuance costs and the
reclassification of the Marina fund.
Source: City of Sacramento Comprehensive Annual Financial Reports
Fiscal Year
Page 2 of 6
193
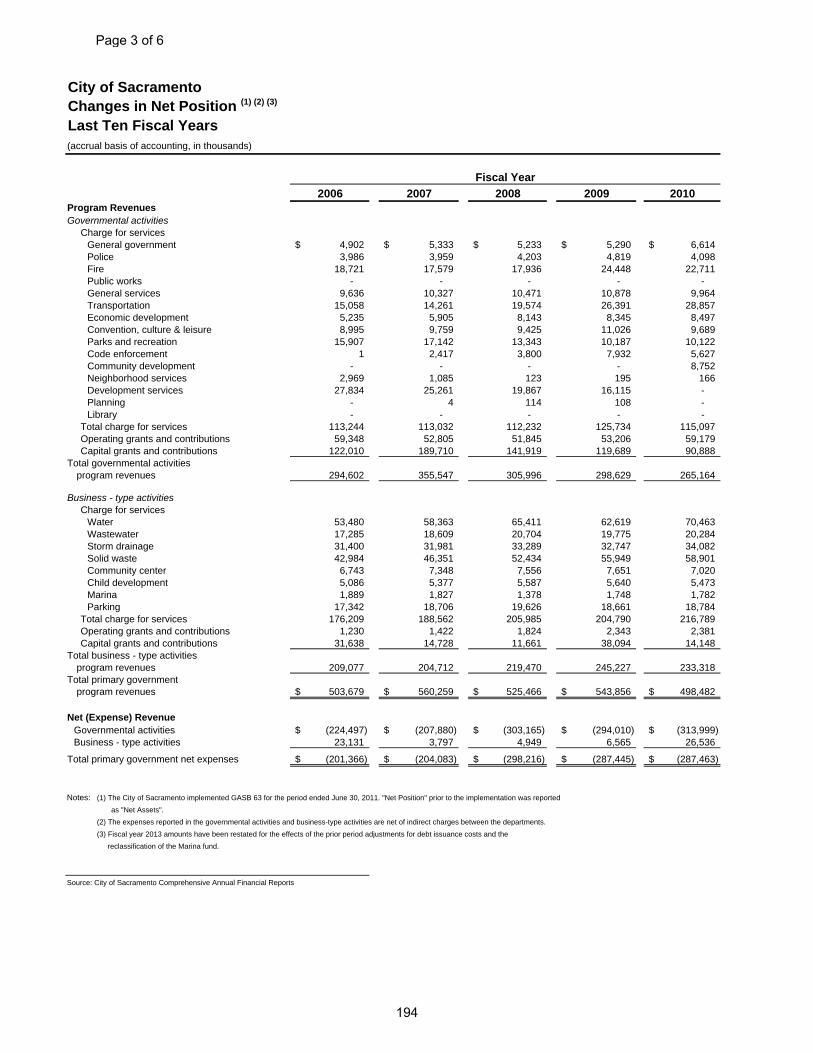
City of SacramentoChanges in Net Position (1) (2) (3)
Last Ten Fiscal Years(accrual basis of accounting, in thousands)
2006 2007 2008 2009 2010Program RevenuesGovernmental activities
Charge for servicesGeneral government 4,902$ 5,333$ 5,233$ 5,290$ 6,614$ Police 3,986 3,959 4,203 4,819 4,098Fire 18,721 17,579 17,936 24,448 22,711Public works - - - - -General services 9,636 10,327 10,471 10,878 9,964Transportation 15,058 14,261 19,574 26,391 28,857Economic development 5,235 5,905 8,143 8,345 8,497Convention, culture & leisure 8,995 9,759 9,425 11,026 9,689Parks and recreation 15,907 17,142 13,343 10,187 10,122Code enforcement 1 2,417 3,800 7,932 5,627Community development - - - - 8,752Neighborhood services 2,969 1,085 123 195 166Development services 27,834 25,261 19,867 16,115 -Planning - 4 114 108 -Library - - - - -
Total charge for services 113,244 113,032 112,232 125,734 115,097Operating grants and contributions 59,348 52,805 51,845 53,206 59,179 Capital grants and contributions 122,010 189,710 141,919 119,689 90,888
Total governmental activities program revenues 294,602 355,547 305,996 298,629 265,164
Business - type activitiesCharge for services
Water 53,480 58,363 65,411 62,619 70,463Wastewater 17,285 18,609 20,704 19,775 20,284Storm drainage 31,400 31,981 33,289 32,747 34,082Solid waste 42,984 46,351 52,434 55,949 58,901Community center 6,743 7,348 7,556 7,651 7,020Child development 5,086 5,377 5,587 5,640 5,473Marina 1,889 1,827 1,378 1,748 1,782Parking 17,342 18,706 19,626 18,661 18,784
Total charge for services 176,209 188,562 205,985 204,790 216,789Operating grants and contributions 1,230 1,422 1,824 2,343 2,381Capital grants and contributions 31,638 14,728 11,661 38,094 14,148
Total business - type activities program revenues 209,077 204,712 219,470 245,227 233,318
Total primary government program revenues 503,679$ 560,259$ 525,466$ 543,856$ 498,482$
Net (Expense) RevenueGovernmental activities (224,497)$ (207,880)$ (303,165)$ (294,010)$ (313,999)$ Business - type activities 23,131 3,797 4,949 6,565 26,536
Total primary government net expenses (201,366)$ (204,083)$ (298,216)$ (287,445)$ (287,463)$
Notes: (1) The City of Sacramento implemented GASB 63 for the period ended June 30, 2011. "Net Position" prior to the implementation was reported
as "Net Assets".
(2) The expenses reported in the governmental activities and business-type activities are net of indirect charges between the departments.
(3) Fiscal year 2013 amounts have been restated for the effects of the prior period adjustments for debt issuance costs and the
reclassification of the Marina fund.
Source: City of Sacramento Comprehensive Annual Financial Reports
Fiscal Year
Page 3 of 6
194
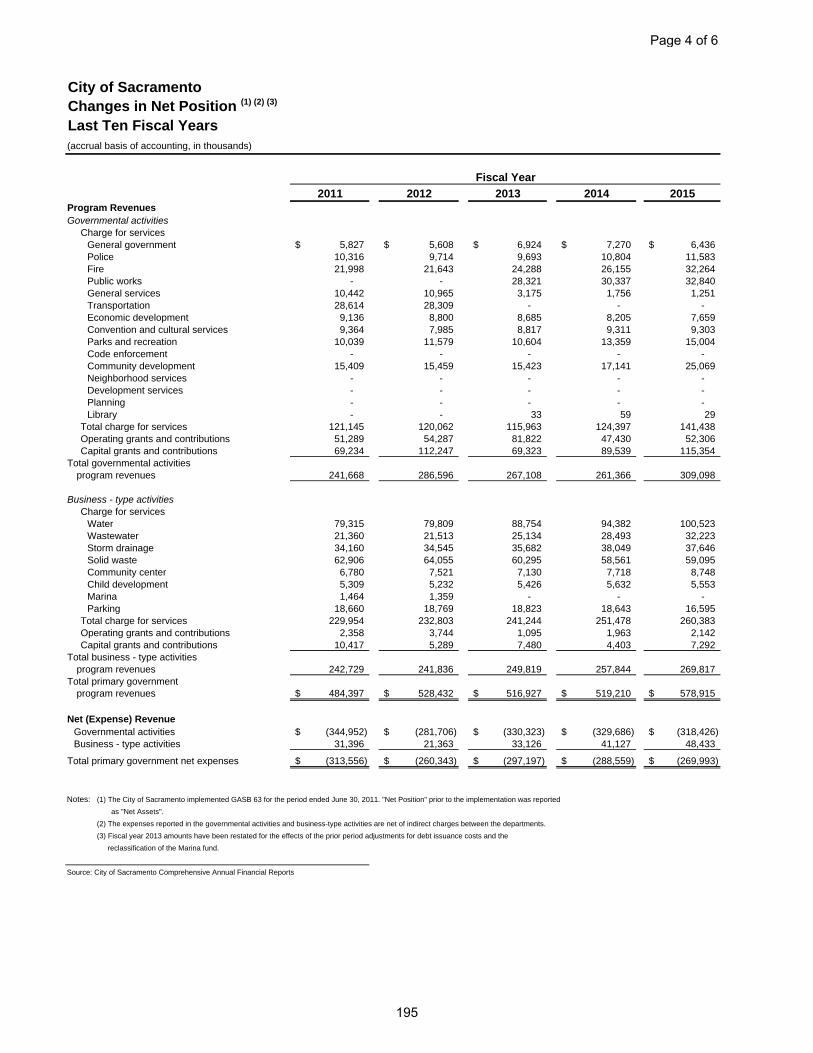
City of SacramentoChanges in Net Position (1) (2) (3)
Last Ten Fiscal Years(accrual basis of accounting, in thousands)
2011 2012 2013 2014 2015Program RevenuesGovernmental activities
Charge for servicesGeneral government 5,827$ 5,608$ 6,924$ 7,270$ 6,436$ Police 10,316 9,714 9,693 10,804 11,583 Fire 21,998 21,643 24,288 26,155 32,264 Public works - - 28,321 30,337 32,840 General services 10,442 10,965 3,175 1,756 1,251 Transportation 28,614 28,309 - - - Economic development 9,136 8,800 8,685 8,205 7,659 Convention and cultural services 9,364 7,985 8,817 9,311 9,303 Parks and recreation 10,039 11,579 10,604 13,359 15,004 Code enforcement - - - - - Community development 15,409 15,459 15,423 17,141 25,069 Neighborhood services - - - - - Development services - - - - - Planning - - - - - Library - - 33 59 29
Total charge for services 121,145 120,062 115,963 124,397 141,438 Operating grants and contributions 51,289 54,287 81,822 47,430 52,306 Capital grants and contributions 69,234 112,247 69,323 89,539 115,354
Total governmental activities program revenues 241,668 286,596 267,108 261,366 309,098
Business - type activitiesCharge for services
Water 79,315 79,809 88,754 94,382 100,523 Wastewater 21,360 21,513 25,134 28,493 32,223 Storm drainage 34,160 34,545 35,682 38,049 37,646 Solid waste 62,906 64,055 60,295 58,561 59,095 Community center 6,780 7,521 7,130 7,718 8,748 Child development 5,309 5,232 5,426 5,632 5,553 Marina 1,464 1,359 - - - Parking 18,660 18,769 18,823 18,643 16,595
Total charge for services 229,954 232,803 241,244 251,478 260,383 Operating grants and contributions 2,358 3,744 1,095 1,963 2,142 Capital grants and contributions 10,417 5,289 7,480 4,403 7,292
Total business - type activities program revenues 242,729 241,836 249,819 257,844 269,817
Total primary government program revenues 484,397$ 528,432$ 516,927$ 519,210$ 578,915$
Net (Expense) RevenueGovernmental activities (344,952)$ (281,706)$ (330,323)$ (329,686)$ (318,426)$ Business - type activities 31,396 21,363 33,126 41,127 48,433
Total primary government net expenses (313,556)$ (260,343)$ (297,197)$ (288,559)$ (269,993)$
Notes: (1) The City of Sacramento implemented GASB 63 for the period ended June 30, 2011. "Net Position" prior to the implementation was reported
as "Net Assets".
(2) The expenses reported in the governmental activities and business-type activities are net of indirect charges between the departments.
(3) Fiscal year 2013 amounts have been restated for the effects of the prior period adjustments for debt issuance costs and the
reclassification of the Marina fund.
Source: City of Sacramento Comprehensive Annual Financial Reports
Fiscal Year
Page 4 of 6
195
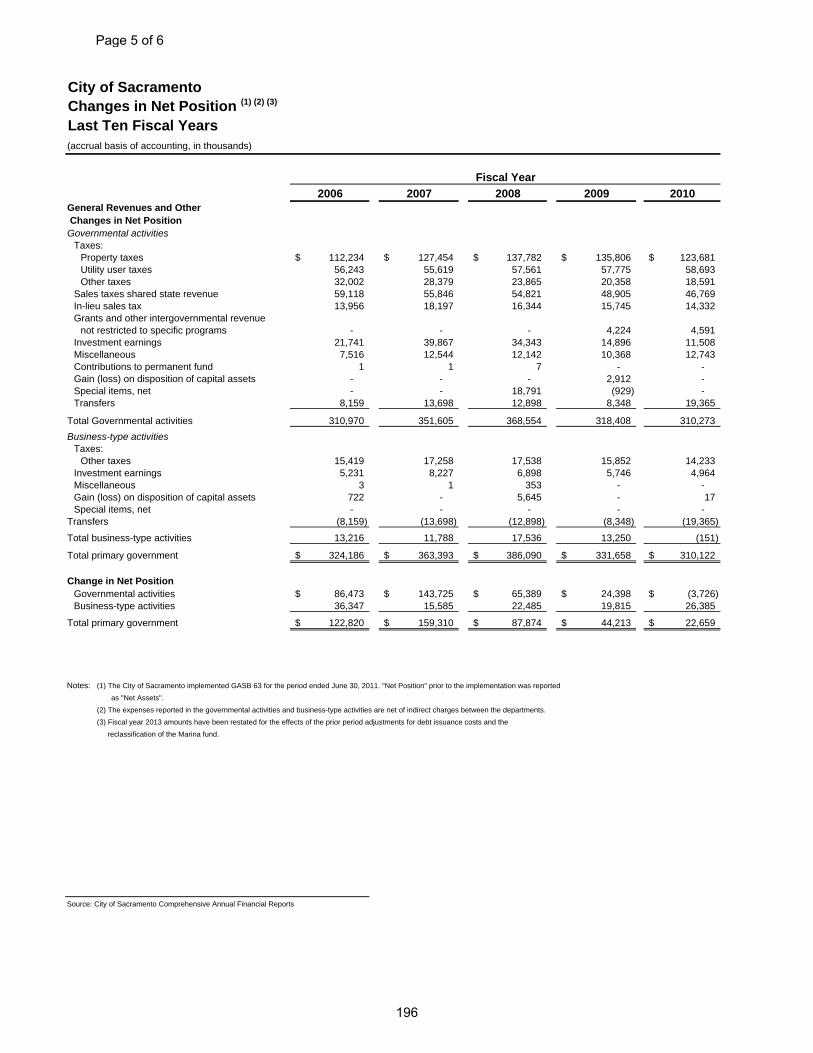
City of SacramentoChanges in Net Position (1) (2) (3)
Last Ten Fiscal Years(accrual basis of accounting, in thousands)
2006 2007 2008 2009 2010General Revenues and Other Changes in Net PositionGovernmental activities
Taxes:Property taxes 112,234$ 127,454$ 137,782$ 135,806$ 123,681$ Utility user taxes 56,243 55,619 57,561 57,775 58,693Other taxes 32,002 28,379 23,865 20,358 18,591
Sales taxes shared state revenue 59,118 55,846 54,821 48,905 46,769In-lieu sales tax 13,956 18,197 16,344 15,745 14,332Grants and other intergovernmental revenue
not restricted to specific programs - - - 4,224 4,591Investment earnings 21,741 39,867 34,343 14,896 11,508Miscellaneous 7,516 12,544 12,142 10,368 12,743Contributions to permanent fund 1 1 7 - -Gain (loss) on disposition of capital assets - - - 2,912 -Special items, net - - 18,791 (929) -Transfers 8,159 13,698 12,898 8,348 19,365
Total Governmental activities 310,970 351,605 368,554 318,408 310,273
Business-type activitiesTaxes:
Other taxes 15,419 17,258 17,538 15,852 14,233Investment earnings 5,231 8,227 6,898 5,746 4,964Miscellaneous 3 1 353 - -Gain (loss) on disposition of capital assets 722 - 5,645 - 17Special items, net - - - - -
Transfers (8,159) (13,698) (12,898) (8,348) (19,365)
Total business-type activities 13,216 11,788 17,536 13,250 (151)
Total primary government 324,186$ 363,393$ 386,090$ 331,658$ 310,122$
Change in Net PositionGovernmental activities 86,473$ 143,725$ 65,389$ 24,398$ (3,726)$ Business-type activities 36,347 15,585 22,485 19,815 26,385
Total primary government 122,820$ 159,310$ 87,874$ 44,213$ 22,659$
Notes: (1) The City of Sacramento implemented GASB 63 for the period ended June 30, 2011. "Net Position" prior to the implementation was reported
as "Net Assets".
(2) The expenses reported in the governmental activities and business-type activities are net of indirect charges between the departments.
(3) Fiscal year 2013 amounts have been restated for the effects of the prior period adjustments for debt issuance costs and the
reclassification of the Marina fund.
Source: City of Sacramento Comprehensive Annual Financial Reports
Fiscal Year
Page 5 of 6
196
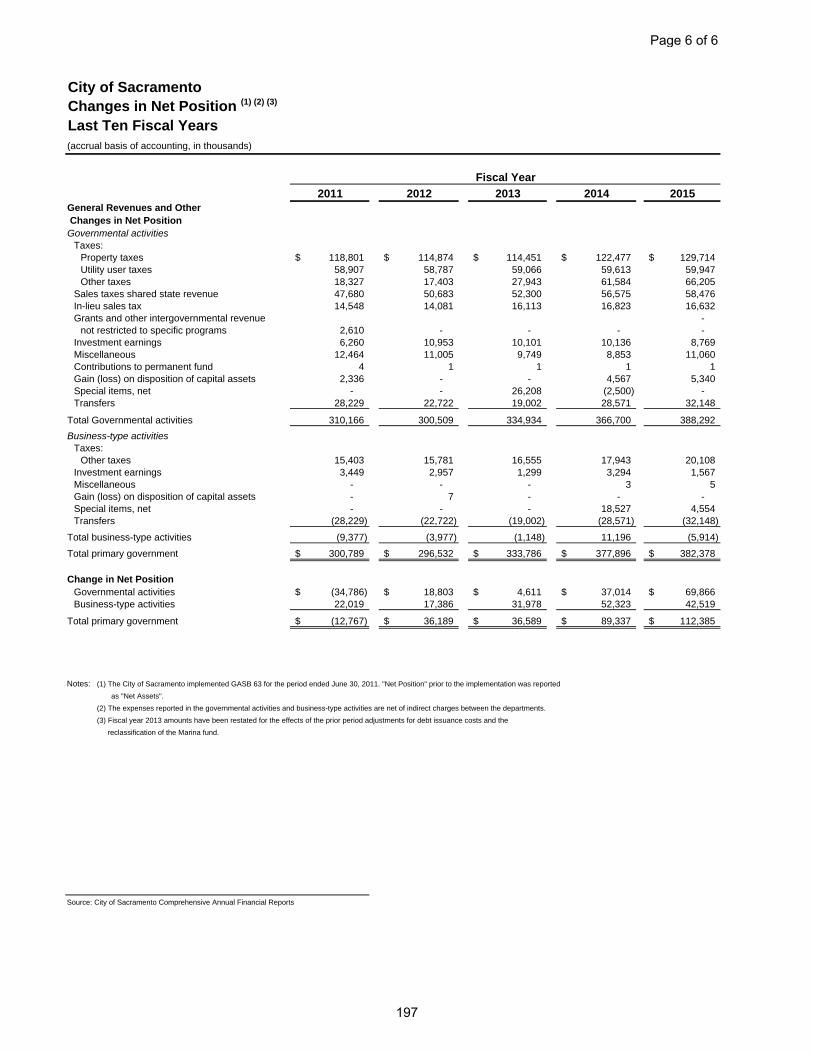
City of SacramentoChanges in Net Position (1) (2) (3)
Last Ten Fiscal Years(accrual basis of accounting, in thousands)
2011 2012 2013 2014 2015General Revenues and Other Changes in Net PositionGovernmental activities
Taxes:Property taxes 118,801$ 114,874$ 114,451$ 122,477$ 129,714$ Utility user taxes 58,907 58,787 59,066 59,613 59,947 Other taxes 18,327 17,403 27,943 61,584 66,205
Sales taxes shared state revenue 47,680 50,683 52,300 56,575 58,476 In-lieu sales tax 14,548 14,081 16,113 16,823 16,632 Grants and other intergovernmental revenue -
not restricted to specific programs 2,610 - - - - Investment earnings 6,260 10,953 10,101 10,136 8,769 Miscellaneous 12,464 11,005 9,749 8,853 11,060 Contributions to permanent fund 4 1 1 1 1 Gain (loss) on disposition of capital assets 2,336 - - 4,567 5,340 Special items, net - - 26,208 (2,500) - Transfers 28,229 22,722 19,002 28,571 32,148
Total Governmental activities 310,166 300,509 334,934 366,700 388,292
Business-type activitiesTaxes:
Other taxes 15,403 15,781 16,555 17,943 20,108 Investment earnings 3,449 2,957 1,299 3,294 1,567 Miscellaneous - - - 3 5 Gain (loss) on disposition of capital assets - 7 - - - Special items, net - - - 18,527 4,554 Transfers (28,229) (22,722) (19,002) (28,571) (32,148)
Total business-type activities (9,377) (3,977) (1,148) 11,196 (5,914)
Total primary government 300,789$ 296,532$ 333,786$ 377,896$ 382,378$
Change in Net PositionGovernmental activities (34,786)$ 18,803$ 4,611$ 37,014$ 69,866$ Business-type activities 22,019 17,386 31,978 52,323 42,519
Total primary government (12,767)$ 36,189$ 36,589$ 89,337$ 112,385$
Notes: (1) The City of Sacramento implemented GASB 63 for the period ended June 30, 2011. "Net Position" prior to the implementation was reported
as "Net Assets".
(2) The expenses reported in the governmental activities and business-type activities are net of indirect charges between the departments.
(3) Fiscal year 2013 amounts have been restated for the effects of the prior period adjustments for debt issuance costs and the
reclassification of the Marina fund.
Source: City of Sacramento Comprehensive Annual Financial Reports
Fiscal Year
Page 6 of 6
197
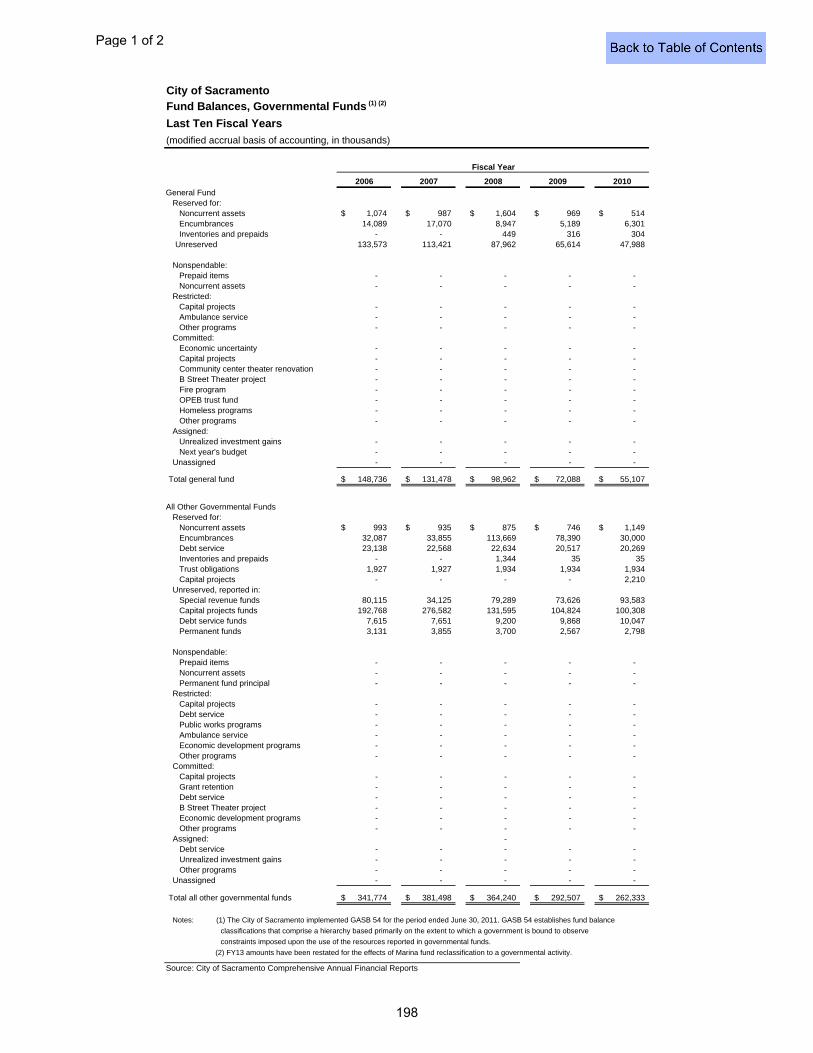
City of SacramentoFund Balances, Governmental Funds (1) (2)
Last Ten Fiscal Years
(modified accrual basis of accounting, in thousands)
2006 2007 2008 2009 2010General Fund
Reserved for:Noncurrent assets 1,074$ 987$ 1,604$ 969$ 514$ Encumbrances 14,089 17,070 8,947 5,189 6,301 Inventories and prepaids - - 449 316 304
Unreserved 133,573 113,421 87,962 65,614 47,988
Nonspendable:Prepaid items - - - - - Noncurrent assets - - - - -
Restricted:Capital projects - - - - - Ambulance service - - - - - Other programs - - - - -
Committed:Economic uncertainty - - - - - Capital projects - - - - - Community center theater renovation - - - - - B Street Theater project - - - - - Fire program - - - - - OPEB trust fund - - - - - Homeless programs - - - - - Other programs - - - - -
Assigned:Unrealized investment gains - - - - - Next year's budget - - - - -
Unassigned - - - - -
Total general fund 148,736$ 131,478$ 98,962$ 72,088$ 55,107$
All Other Governmental FundsReserved for:
Noncurrent assets 993$ 935$ 875$ 746$ 1,149$ Encumbrances 32,087 33,855 113,669 78,390 30,000 Debt service 23,138 22,568 22,634 20,517 20,269 Inventories and prepaids - - 1,344 35 35 Trust obligations 1,927 1,927 1,934 1,934 1,934 Capital projects - - - - 2,210
Unreserved, reported in:Special revenue funds 80,115 34,125 79,289 73,626 93,583 Capital projects funds 192,768 276,582 131,595 104,824 100,308 Debt service funds 7,615 7,651 9,200 9,868 10,047 Permanent funds 3,131 3,855 3,700 2,567 2,798
Nonspendable:Prepaid items - - - - - Noncurrent assets - - - - - Permanent fund principal - - - - -
Restricted:Capital projects - - - - - Debt service - - - - - Public works programs - - - - - Ambulance service - - - - - Economic development programs - - - - - Other programs - - - - -
Committed:Capital projects - - - - - Grant retention - - - - - Debt service - - - - - B Street Theater project - - - - - Economic development programs - - - - - Other programs - - - - -
Assigned: - Debt service - - - - - Unrealized investment gains - - - - - Other programs - - - - -
Unassigned - - - - -
Total all other governmental funds 341,774$ 381,498$ 364,240$ 292,507$ 262,333$
Notes: (1) The City of Sacramento implemented GASB 54 for the period ended June 30, 2011. GASB 54 establishes fund balance
classifications that comprise a hierarchy based primarily on the extent to which a government is bound to observe
constraints imposed upon the use of the resources reported in governmental funds.
(2) FY13 amounts have been restated for the effects of Marina fund reclassification to a governmental activity.
Source: City of Sacramento Comprehensive Annual Financial Reports
Fiscal Year
Page 1 of 2
198
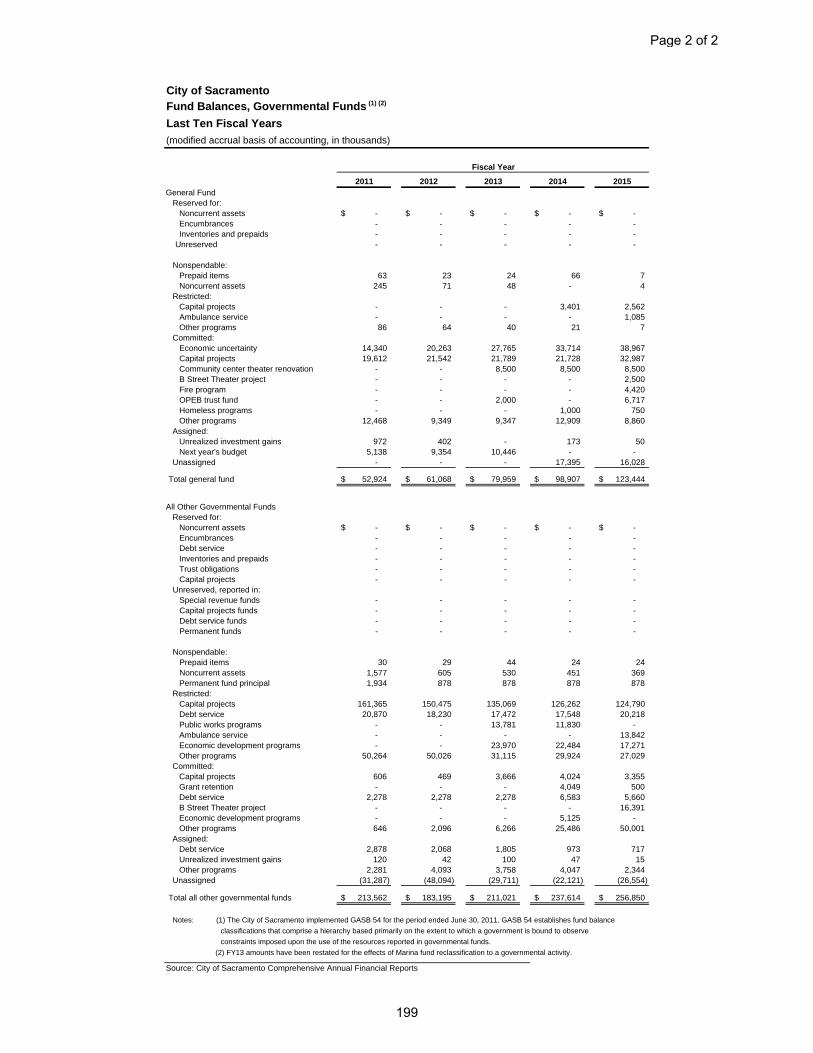
City of SacramentoFund Balances, Governmental Funds (1) (2)
Last Ten Fiscal Years
(modified accrual basis of accounting, in thousands)
2011 2012 2013 2014 2015General Fund
Reserved for:Noncurrent assets -$ -$ -$ -$ -$ Encumbrances - - - - - Inventories and prepaids - - - - -
Unreserved - - - - -
Nonspendable:Prepaid items 63 23 24 66 7 Noncurrent assets 245 71 48 - 4
Restricted:Capital projects - - - 3,401 2,562 Ambulance service - - - - 1,085 Other programs 86 64 40 21 7
Committed:Economic uncertainty 14,340 20,263 27,765 33,714 38,967 Capital projects 19,612 21,542 21,789 21,728 32,987 Community center theater renovation - - 8,500 8,500 8,500 B Street Theater project - - - - 2,500 Fire program - - - - 4,420 OPEB trust fund - - 2,000 - 6,717 Homeless programs - - - 1,000 750 Other programs 12,468 9,349 9,347 12,909 8,860
Assigned:Unrealized investment gains 972 402 - 173 50 Next year's budget 5,138 9,354 10,446 - -
Unassigned - - - 17,395 16,028
Total general fund 52,924$ 61,068$ 79,959$ 98,907$ 123,444$
All Other Governmental FundsReserved for:
Noncurrent assets -$ -$ -$ -$ -$ Encumbrances - - - - - Debt service - - - - - Inventories and prepaids - - - - - Trust obligations - - - - - Capital projects - - - - -
Unreserved, reported in:Special revenue funds - - - - - Capital projects funds - - - - - Debt service funds - - - - - Permanent funds - - - - -
Nonspendable:Prepaid items 30 29 44 24 24 Noncurrent assets 1,577 605 530 451 369 Permanent fund principal 1,934 878 878 878 878
Restricted:Capital projects 161,365 150,475 135,069 126,262 124,790 Debt service 20,870 18,230 17,472 17,548 20,218 Public works programs - - 13,781 11,830 - Ambulance service - - - - 13,842 Economic development programs - - 23,970 22,484 17,271 Other programs 50,264 50,026 31,115 29,924 27,029
Committed:Capital projects 606 469 3,666 4,024 3,355 Grant retention - - - 4,049 500 Debt service 2,278 2,278 2,278 6,583 5,660 B Street Theater project - - - - 16,391 Economic development programs - - - 5,125 - Other programs 646 2,096 6,266 25,486 50,001
Assigned:Debt service 2,878 2,068 1,805 973 717 Unrealized investment gains 120 42 100 47 15 Other programs 2,281 4,093 3,758 4,047 2,344
Unassigned (31,287) (48,094) (29,711) (22,121) (26,554)
Total all other governmental funds 213,562$ 183,195$ 211,021$ 237,614$ 256,850$
Notes: (1) The City of Sacramento implemented GASB 54 for the period ended June 30, 2011. GASB 54 establishes fund balance
classifications that comprise a hierarchy based primarily on the extent to which a government is bound to observe
constraints imposed upon the use of the resources reported in governmental funds.
(2) FY13 amounts have been restated for the effects of Marina fund reclassification to a governmental activity.
Source: City of Sacramento Comprehensive Annual Financial Reports
Fiscal Year
Page 2 of 2
199
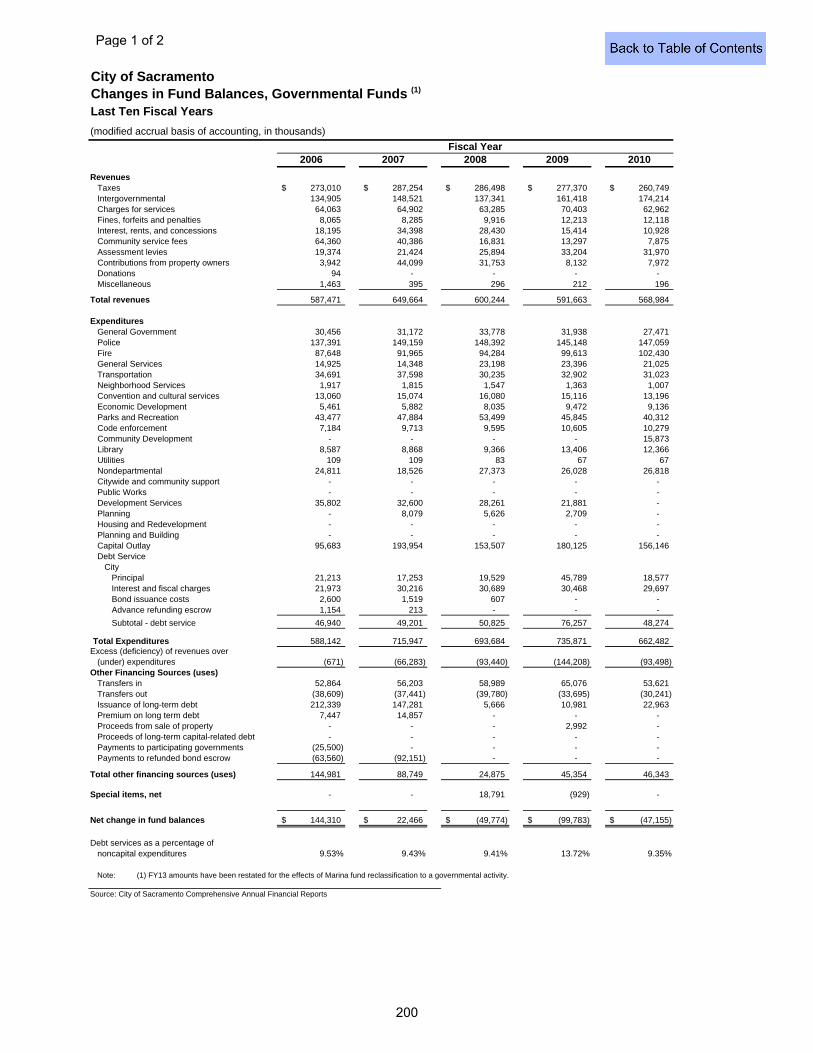
City of SacramentoChanges in Fund Balances, Governmental Funds (1)
Last Ten Fiscal Years
(modified accrual basis of accounting, in thousands)
Fiscal Year2006 2007 2008 2009 2010
RevenuesTaxes 273,010$ 287,254$ 286,498$ 277,370$ 260,749$ Intergovernmental 134,905 148,521 137,341 161,418 174,214 Charges for services 64,063 64,902 63,285 70,403 62,962 Fines, forfeits and penalties 8,065 8,285 9,916 12,213 12,118 Interest, rents, and concessions 18,195 34,398 28,430 15,414 10,928 Community service fees 64,360 40,386 16,831 13,297 7,875 Assessment levies 19,374 21,424 25,894 33,204 31,970 Contributions from property owners 3,942 44,099 31,753 8,132 7,972 Donations 94 - - - - Miscellaneous 1,463 395 296 212 196
Total revenues 587,471 649,664 600,244 591,663 568,984
ExpendituresGeneral Government 30,456 31,172 33,778 31,938 27,471 Police 137,391 149,159 148,392 145,148 147,059 Fire 87,648 91,965 94,284 99,613 102,430 General Services 14,925 14,348 23,198 23,396 21,025 Transportation 34,691 37,598 30,235 32,902 31,023 Neighborhood Services 1,917 1,815 1,547 1,363 1,007 Convention and cultural services 13,060 15,074 16,080 15,116 13,196 Economic Development 5,461 5,882 8,035 9,472 9,136 Parks and Recreation 43,477 47,884 53,499 45,845 40,312 Code enforcement 7,184 9,713 9,595 10,605 10,279 Community Development - - - - 15,873 Library 8,587 8,868 9,366 13,406 12,366 Utilities 109 109 83 67 67 Nondepartmental 24,811 18,526 27,373 26,028 26,818 Citywide and community support - - - - - Public Works - - - - - Development Services 35,802 32,600 28,261 21,881 - Planning - 8,079 5,626 2,709 - Housing and Redevelopment - - - - - Planning and Building - - - - - Capital Outlay 95,683 193,954 153,507 180,125 156,146 Debt Service
City Principal 21,213 17,253 19,529 45,789 18,577 Interest and fiscal charges 21,973 30,216 30,689 30,468 29,697 Bond issuance costs 2,600 1,519 607 - - Advance refunding escrow 1,154 213 - - -
Subtotal - debt service 46,940 49,201 50,825 76,257 48,274
Total Expenditures 588,142 715,947 693,684 735,871 662,482 Excess (deficiency) of revenues over
(under) expenditures (671) (66,283) (93,440) (144,208) (93,498) Other Financing Sources (uses)
Transfers in 52,864 56,203 58,989 65,076 53,621 Transfers out (38,609) (37,441) (39,780) (33,695) (30,241) Issuance of long-term debt 212,339 147,281 5,666 10,981 22,963 Premium on long term debt 7,447 14,857 - - - Proceeds from sale of property - - - 2,992 - Proceeds of long-term capital-related debt - - - - - Payments to participating governments (25,500) - - - - Payments to refunded bond escrow (63,560) (92,151) - - -
Total other financing sources (uses) 144,981 88,749 24,875 45,354 46,343
Special items, net - - 18,791 (929) -
Net change in fund balances 144,310$ 22,466$ (49,774)$ (99,783)$ (47,155)$
Debt services as a percentage ofnoncapital expenditures 9.53% 9.43% 9.41% 13.72% 9.35%
Note: (1) FY13 amounts have been restated for the effects of Marina fund reclassification to a governmental activity.
Source: City of Sacramento Comprehensive Annual Financial Reports
Page 1 of 2
200
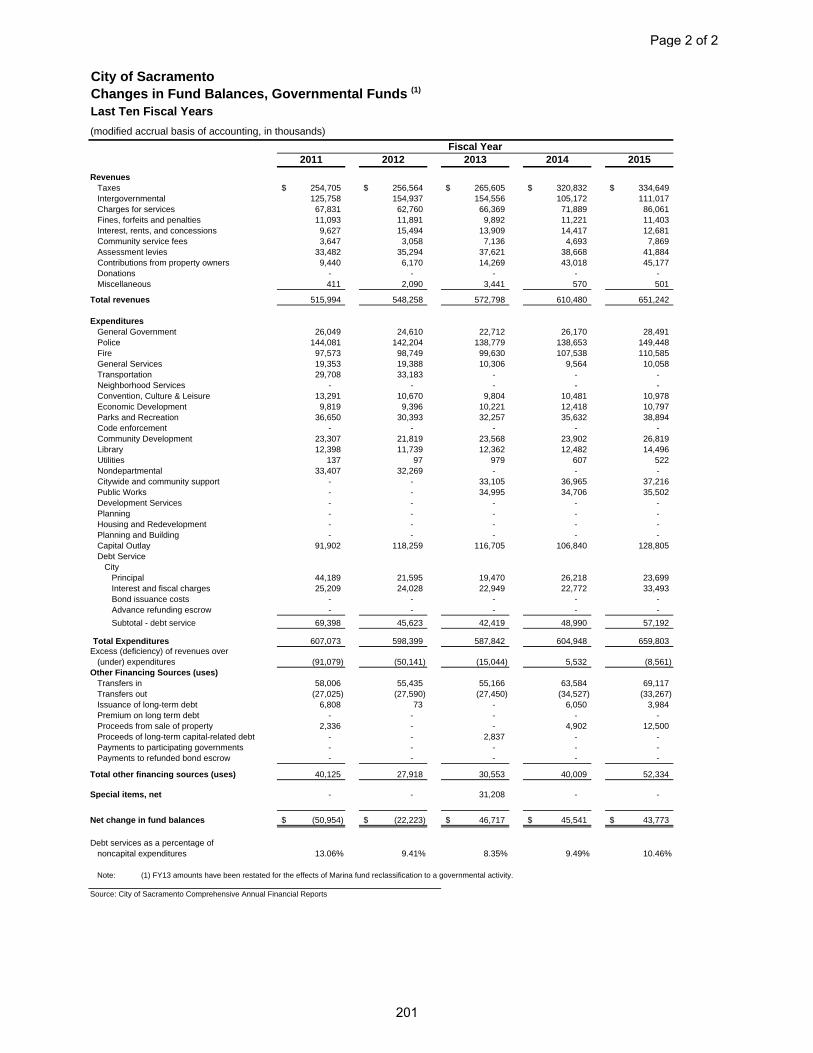
City of SacramentoChanges in Fund Balances, Governmental Funds (1)
Last Ten Fiscal Years
(modified accrual basis of accounting, in thousands)
Fiscal Year2011 2012 2013 2014 2015
RevenuesTaxes 254,705$ 256,564$ 265,605$ 320,832$ 334,649$ Intergovernmental 125,758 154,937 154,556 105,172 111,017 Charges for services 67,831 62,760 66,369 71,889 86,061 Fines, forfeits and penalties 11,093 11,891 9,892 11,221 11,403 Interest, rents, and concessions 9,627 15,494 13,909 14,417 12,681 Community service fees 3,647 3,058 7,136 4,693 7,869 Assessment levies 33,482 35,294 37,621 38,668 41,884 Contributions from property owners 9,440 6,170 14,269 43,018 45,177 Donations - - - - - Miscellaneous 411 2,090 3,441 570 501
Total revenues 515,994 548,258 572,798 610,480 651,242
ExpendituresGeneral Government 26,049 24,610 22,712 26,170 28,491 Police 144,081 142,204 138,779 138,653 149,448 Fire 97,573 98,749 99,630 107,538 110,585 General Services 19,353 19,388 10,306 9,564 10,058 Transportation 29,708 33,183 - - - Neighborhood Services - - - - - Convention, Culture & Leisure 13,291 10,670 9,804 10,481 10,978 Economic Development 9,819 9,396 10,221 12,418 10,797 Parks and Recreation 36,650 30,393 32,257 35,632 38,894 Code enforcement - - - - - Community Development 23,307 21,819 23,568 23,902 26,819 Library 12,398 11,739 12,362 12,482 14,496 Utilities 137 97 979 607 522 Nondepartmental 33,407 32,269 - - - Citywide and community support - - 33,105 36,965 37,216 Public Works - - 34,995 34,706 35,502 Development Services - - - - - Planning - - - - - Housing and Redevelopment - - - - - Planning and Building - - - - - Capital Outlay 91,902 118,259 116,705 106,840 128,805 Debt Service
City Principal 44,189 21,595 19,470 26,218 23,699 Interest and fiscal charges 25,209 24,028 22,949 22,772 33,493 Bond issuance costs - - - - - Advance refunding escrow - - - - -
Subtotal - debt service 69,398 45,623 42,419 48,990 57,192
Total Expenditures 607,073 598,399 587,842 604,948 659,803 Excess (deficiency) of revenues over
(under) expenditures (91,079) (50,141) (15,044) 5,532 (8,561) Other Financing Sources (uses)
Transfers in 58,006 55,435 55,166 63,584 69,117 Transfers out (27,025) (27,590) (27,450) (34,527) (33,267) Issuance of long-term debt 6,808 73 - 6,050 3,984 Premium on long term debt - - - - - Proceeds from sale of property 2,336 - - 4,902 12,500 Proceeds of long-term capital-related debt - - 2,837 - - Payments to participating governments - - - - - Payments to refunded bond escrow - - - - -
Total other financing sources (uses) 40,125 27,918 30,553 40,009 52,334
Special items, net - - 31,208 - -
Net change in fund balances (50,954)$ (22,223)$ 46,717$ 45,541$ 43,773$
Debt services as a percentage ofnoncapital expenditures 13.06% 9.41% 8.35% 9.49% 10.46%
Note: (1) FY13 amounts have been restated for the effects of Marina fund reclassification to a governmental activity.
Source: City of Sacramento Comprehensive Annual Financial Reports
Page 2 of 2
201
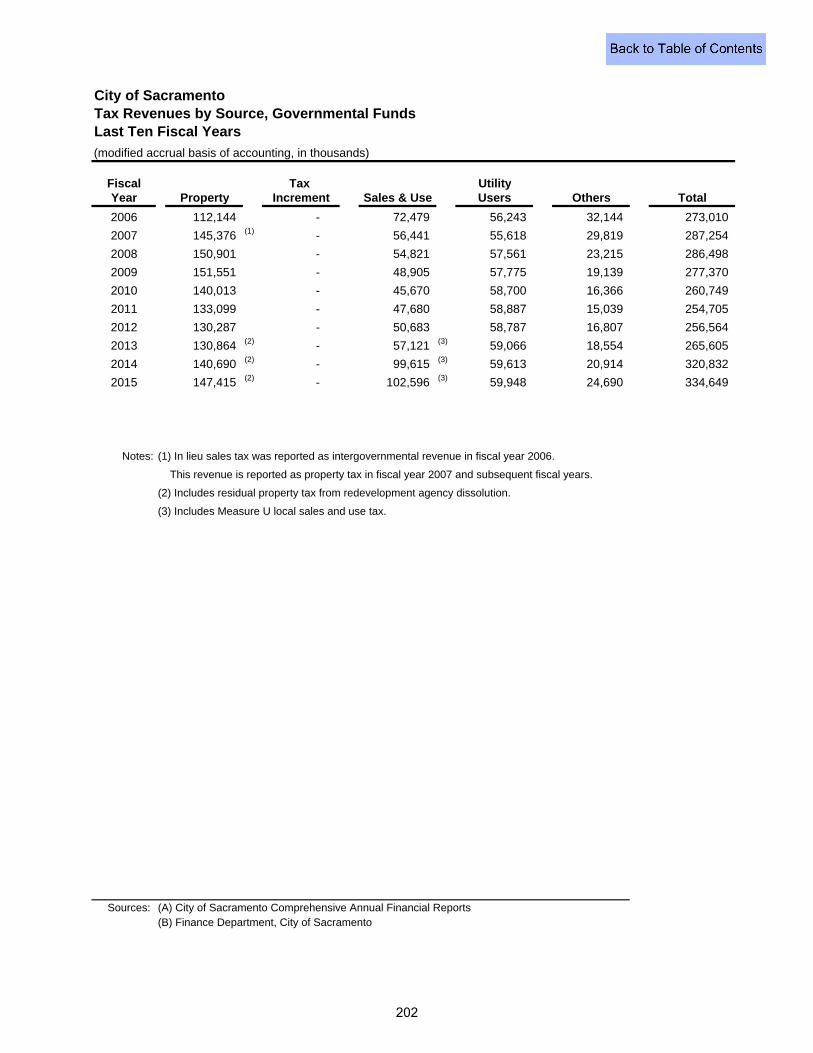
City of SacramentoTax Revenues by Source, Governmental FundsLast Ten Fiscal Years
(modified accrual basis of accounting, in thousands)
Fiscal Tax UtilityYear Property Increment Sales & Use Users Others Total
2006 112,144 - 72,479 56,243 32,144 273,010
2007 145,376 (1) - 56,441 55,618 29,819 287,254
2008 150,901 - 54,821 57,561 23,215 286,498
2009 151,551 - 48,905 57,775 19,139 277,370
2010 140,013 - 45,670 58,700 16,366 260,749
2011 133,099 - 47,680 58,887 15,039 254,705
2012 130,287 - 50,683 58,787 16,807 256,564
2013 130,864 (2) - 57,121 (3) 59,066 18,554 265,605
2014 140,690 (2) - 99,615 (3) 59,613 20,914 320,832
2015 147,415 (2) - 102,596 (3) 59,948 24,690 334,649
Notes: (1) In lieu sales tax was reported as intergovernmental revenue in fiscal year 2006.
This revenue is reported as property tax in fiscal year 2007 and subsequent fiscal years.
(2) Includes residual property tax from redevelopment agency dissolution.
(3) Includes Measure U local sales and use tax.
Sources: (A) City of Sacramento Comprehensive Annual Financial Reports(B) Finance Department, City of Sacramento
202
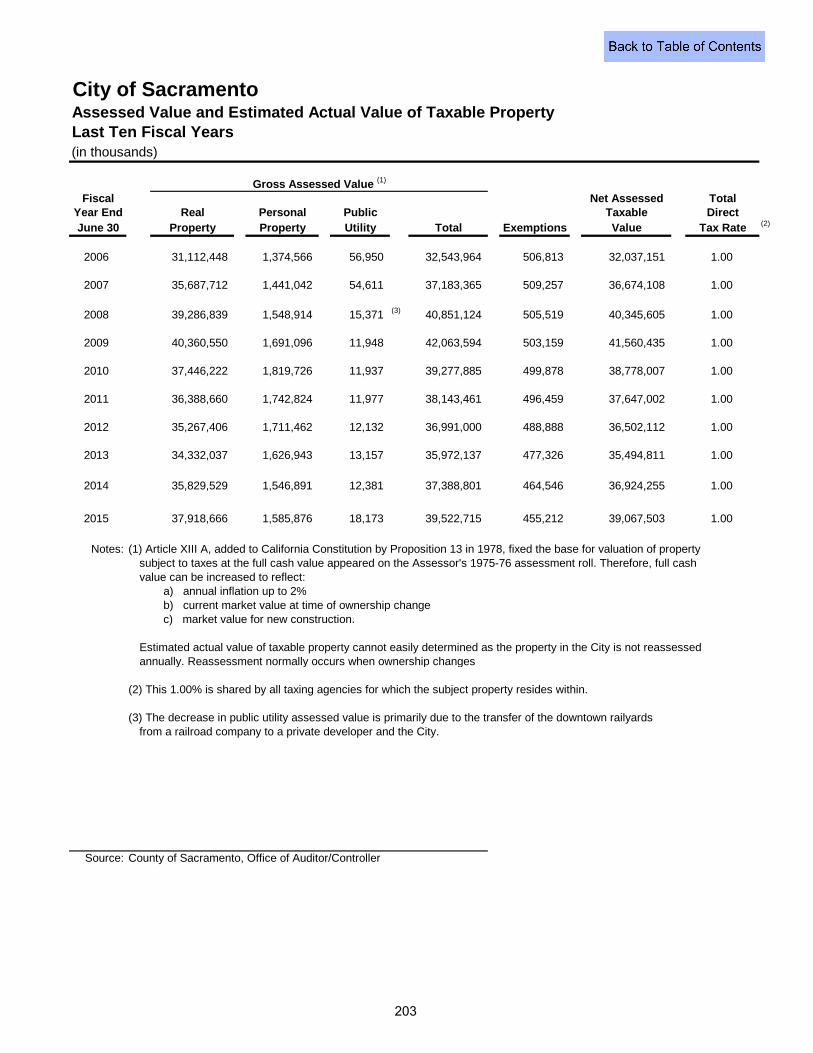
City of SacramentoAssessed Value and Estimated Actual Value of Taxable PropertyLast Ten Fiscal Years(in thousands)
Gross Assessed Value (1)
Fiscal Net AssessedYear End Real Personal Public TaxableJune 30 Property Property Utility Total Exemptions Value (2)
2006 31,112,448 1,374,566 56,950 32,543,964 506,813 32,037,151 1.00
2007 35,687,712 1,441,042 54,611 37,183,365 509,257 36,674,108 1.00
2008 39,286,839 1,548,914 15,371 (3) 40,851,124 505,519 40,345,605 1.00
2009 40,360,550 1,691,096 11,948 42,063,594 503,159 41,560,435 1.00
2010 37,446,222 1,819,726 11,937 39,277,885 499,878 38,778,007 1.00
2011 36,388,660 1,742,824 11,977 38,143,461 496,459 37,647,002 1.00
2012 35,267,406 1,711,462 12,132 36,991,000 488,888 36,502,112 1.00
2013 34,332,037 1,626,943 13,157 35,972,137 477,326 35,494,811 1.00
2014 35,829,529 1,546,891 12,381 37,388,801 464,546 36,924,255 1.00
2015 37,918,666 1,585,876 18,173 39,522,715 455,212 39,067,503 1.00
Notes: (1) Article XIII A, added to California Constitution by Proposition 13 in 1978, fixed the base for valuation of property subject to taxes at the full cash value appeared on the Assessor's 1975-76 assessment roll. Therefore, full cash value can be increased to reflect:
a) annual inflation up to 2%b) current market value at time of ownership changec) market value for new construction.
Estimated actual value of taxable property cannot easily determined as the property in the City is not reassessed annually. Reassessment normally occurs when ownership changes
(2) This 1.00% is shared by all taxing agencies for which the subject property resides within.
(3) The decrease in public utility assessed value is primarily due to the transfer of the downtown railyardsfrom a railroad company to a private developer and the City.
Source: County of Sacramento, Office of Auditor/Controller
TotalDirect
Tax Rate
203
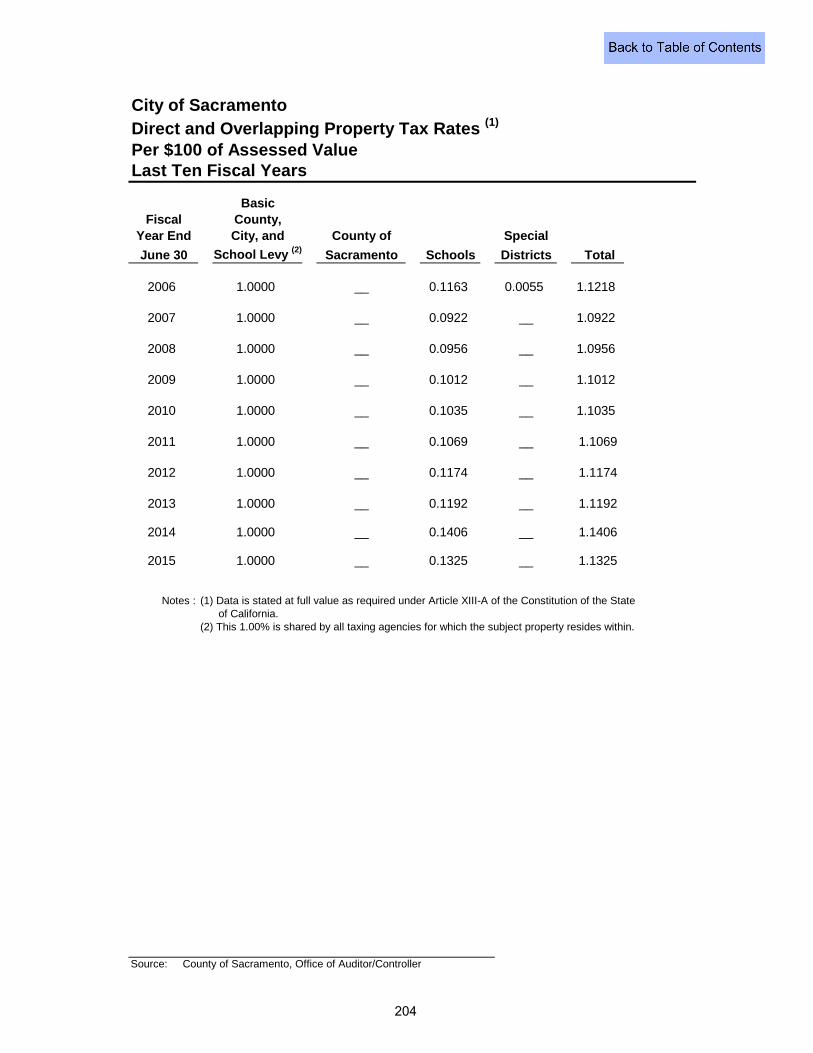
City of SacramentoDirect and Overlapping Property Tax Rates (1)
Per $100 of Assessed ValueLast Ten Fiscal Years
BasicFiscal County,
Year End City, and County of Special
June 30 School Levy (2) Sacramento Schools Districts Total
2006 1.0000 __ 0.1163 0.0055 1.1218
2007 1.0000 __ 0.0922 __ 1.0922
2008 1.0000 __ 0.0956 __ 1.0956
2009 1.0000 __ 0.1012 __ 1.1012
2010 1.0000 __ 0.1035 __ 1.1035
2011 1.0000 __ 0.1069 __ 1.1069
2012 1.0000 __ 0.1174 __ 1.1174
2013 1.0000 __ 0.1192 __ 1.1192
2014 1.0000 __ 0.1406 __ 1.1406
2015 1.0000 __ 0.1325 __ 1.1325
Notes : (1) Data is stated at full value as required under Article XIII-A of the Constitution of the State of California. (2) This 1.00% is shared by all taxing agencies for which the subject property resides within.
Source: County of Sacramento, Office of Auditor/Controller
204
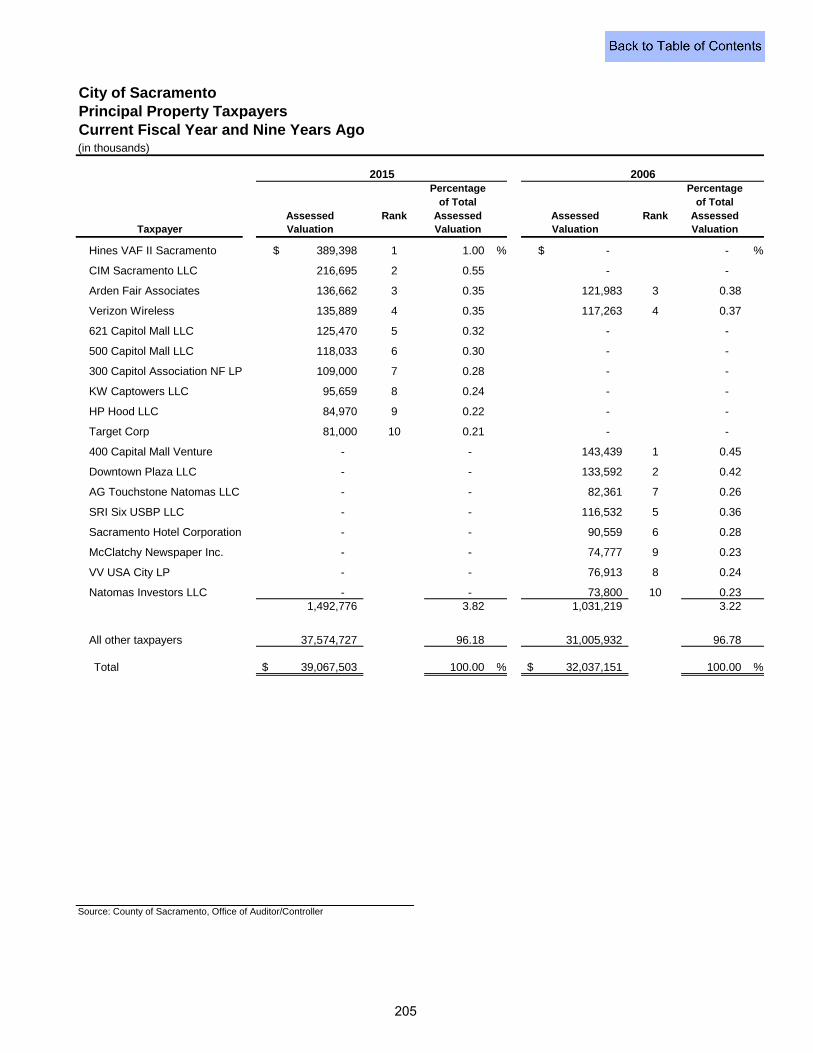
City of Sacramento Principal Property TaxpayersCurrent Fiscal Year and Nine Years Ago(in thousands)
Percentage Percentageof Total of Total
Assessed Rank Assessed Assessed Rank AssessedTaxpayer Valuation Valuation Valuation Valuation
Hines VAF II Sacramento 389,398$ 1 1.00 % -$ - %
CIM Sacramento LLC 216,695 2 0.55 - -
Arden Fair Associates 136,662 3 0.35 121,983 3 0.38
Verizon Wireless 135,889 4 0.35 117,263 4 0.37
621 Capitol Mall LLC 125,470 5 0.32 - -
500 Capitol Mall LLC 118,033 6 0.30 - -
300 Capitol Association NF LP 109,000 7 0.28 - -
KW Captowers LLC 95,659 8 0.24 - -
HP Hood LLC 84,970 9 0.22 - -
Target Corp 81,000 10 0.21 - -
400 Capital Mall Venture - - 143,439 1 0.45
Downtown Plaza LLC - - 133,592 2 0.42
AG Touchstone Natomas LLC - - 82,361 7 0.26
SRI Six USBP LLC - - 116,532 5 0.36
Sacramento Hotel Corporation - - 90,559 6 0.28
McClatchy Newspaper Inc. - - 74,777 9 0.23
VV USA City LP - - 76,913 8 0.24
Natomas Investors LLC - - 73,800 10 0.23 1,492,776 3.82 1,031,219 3.22
All other taxpayers 37,574,727 96.18 31,005,932 96.78
Total 39,067,503$ 100.00 % 32,037,151$ 100.00 %
Source: County of Sacramento, Office of Auditor/Controller
20062015
205

206
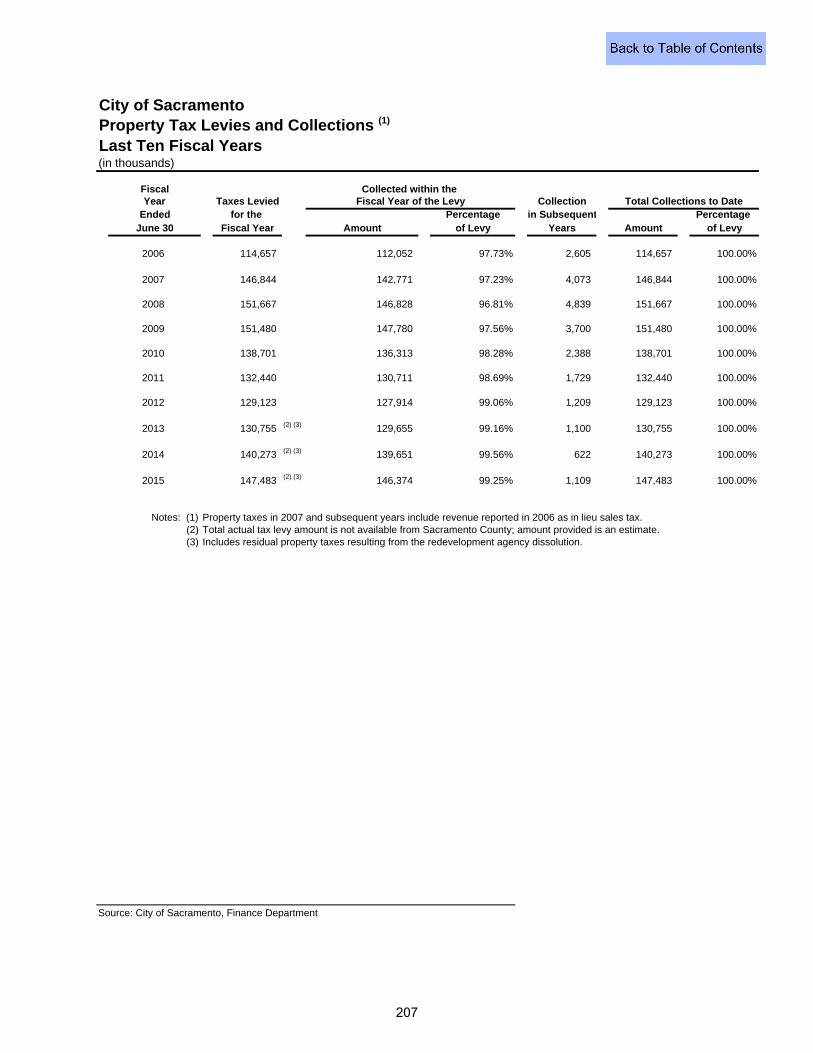
City of SacramentoProperty Tax Levies and Collections (1)
Last Ten Fiscal Years(in thousands)
Fiscal Year Taxes Levied Collection
Ended for the Percentage in Subsequent Percentage June 30 Fiscal Year Amount of Levy Years Amount of Levy
2006 114,657 112,052 97.73% 2,605 114,657 100.00%
2007 146,844 142,771 97.23% 4,073 146,844 100.00%
2008 151,667 146,828 96.81% 4,839 151,667 100.00%
2009 151,480 147,780 97.56% 3,700 151,480 100.00%
2010 138,701 136,313 98.28% 2,388 138,701 100.00%
2011 132,440 130,711 98.69% 1,729 132,440 100.00%
2012 129,123 127,914 99.06% 1,209 129,123 100.00%
2013 130,755 (2) (3) 129,655 99.16% 1,100 130,755 100.00%
2014 140,273 (2) (3) 139,651 99.56% 622 140,273 100.00%
2015 147,483 (2) (3) 146,374 99.25% 1,109 147,483 100.00%
Notes: (1) Property taxes in 2007 and subsequent years include revenue reported in 2006 as in lieu sales tax.(2) Total actual tax levy amount is not available from Sacramento County; amount provided is an estimate.(3) Includes residual property taxes resulting from the redevelopment agency dissolution.
Source: City of Sacramento, Finance Department
Collected within the Fiscal Year of the Levy Total Collections to Date
207
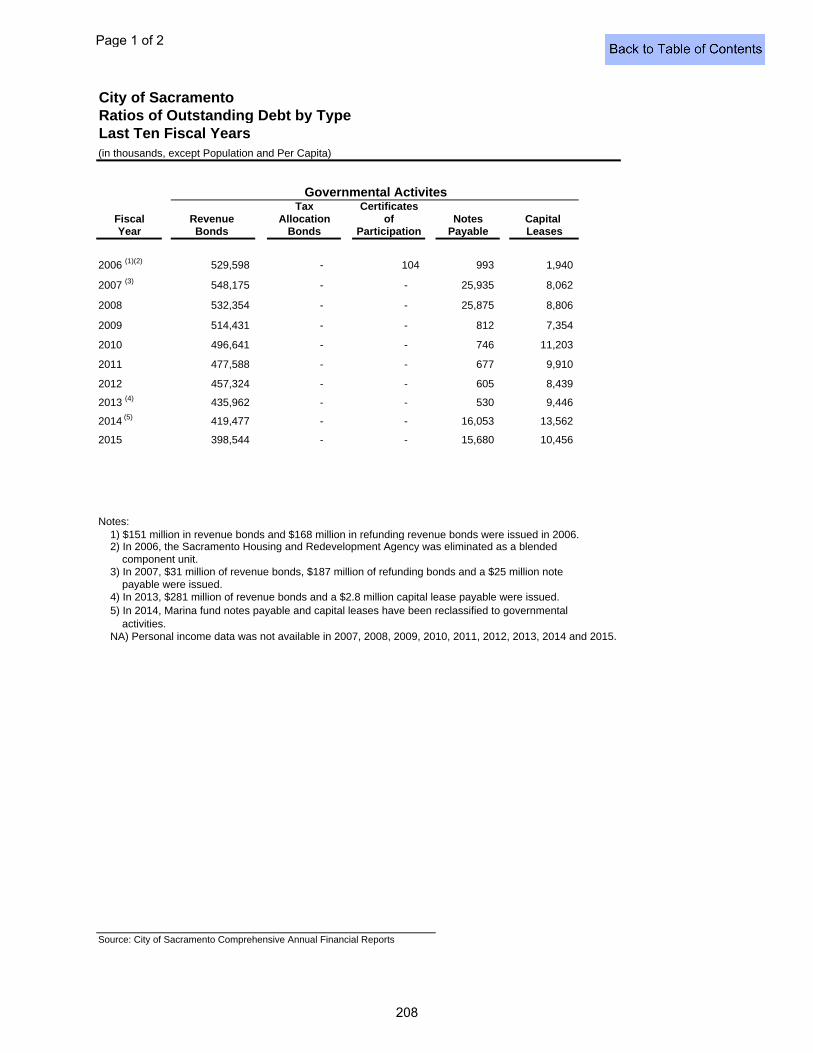
City of SacramentoRatios of Outstanding Debt by TypeLast Ten Fiscal Years(in thousands, except Population and Per Capita)
Tax CertificatesFiscal Revenue Allocation of Notes Capital Year Bonds Bonds Participation Payable Leases
2006 (1)(2) 529,598 - 104 993 1,940
2007 (3) 548,175 - - 25,935 8,062
2008 532,354 - - 25,875 8,806
2009 514,431 - - 812 7,354
2010 496,641 - - 746 11,203
2011 477,588 - - 677 9,910
2012 457,324 - - 605 8,439
2013 (4) 435,962 - - 530 9,446
2014 (5) 419,477 - - 16,053 13,562
2015 398,544 - - 15,680 10,456
Notes:
Source: City of Sacramento Comprehensive Annual Financial Reports
payable were issued. 4) In 2013, $281 million of revenue bonds and a $2.8 million capital lease payable were issued.
Governmental Activites
2) In 2006, the Sacramento Housing and Redevelopment Agency was eliminated as a blended component unit.
1) $151 million in revenue bonds and $168 million in refunding revenue bonds were issued in 2006.
NA) Personal income data was not available in 2007, 2008, 2009, 2010, 2011, 2012, 2013, 2014 and 2015.
5) In 2014, Marina fund notes payable and capital leases have been reclassified to governmental activities.
3) In 2007, $31 million of revenue bonds, $187 million of refunding bonds and a $25 million note
Page 1 of 2
208
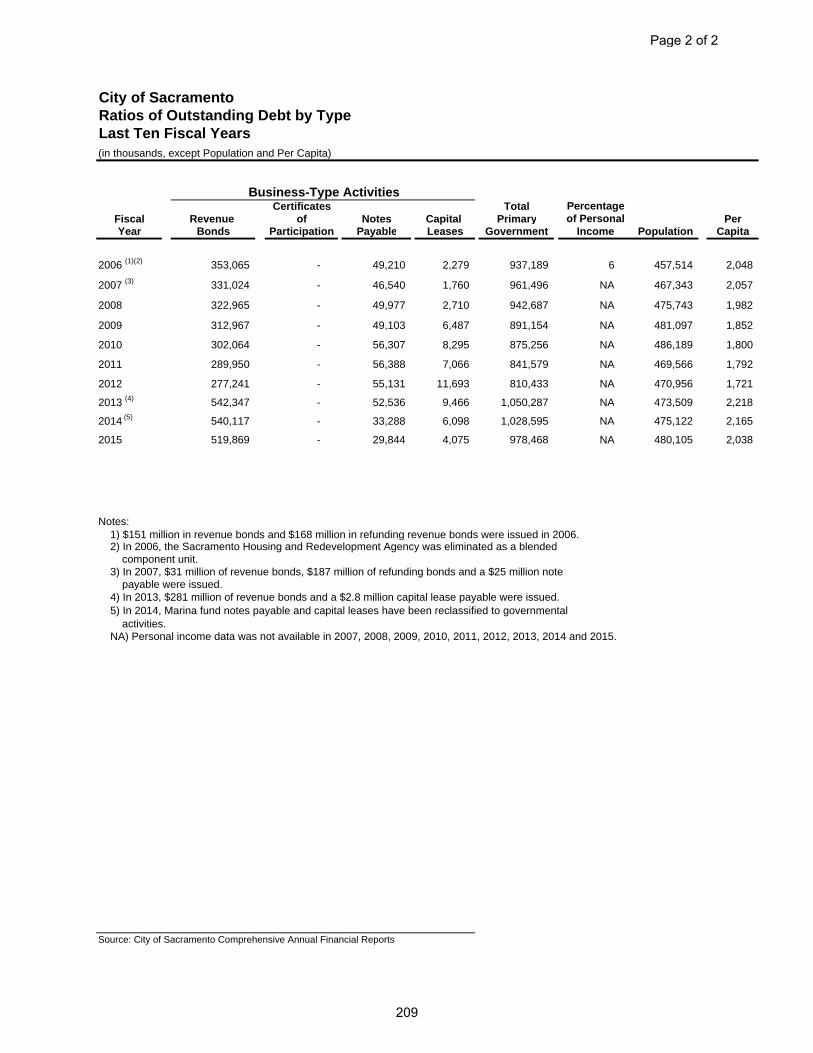
City of SacramentoRatios of Outstanding Debt by TypeLast Ten Fiscal Years(in thousands, except Population and Per Capita)
Certificates TotalFiscal Revenue of Notes Capital Primary PerYear Bonds Participation Payable Leases Government Population Capita
2006 (1)(2) 353,065 - 49,210 2,279 937,189 6 457,514 2,048
2007 (3) 331,024 - 46,540 1,760 961,496 NA 467,343 2,057
2008 322,965 - 49,977 2,710 942,687 NA 475,743 1,982
2009 312,967 - 49,103 6,487 891,154 NA 481,097 1,852
2010 302,064 - 56,307 8,295 875,256 NA 486,189 1,800
2011 289,950 - 56,388 7,066 841,579 NA 469,566 1,792
2012 277,241 - 55,131 11,693 810,433 NA 470,956 1,721
2013 (4) 542,347 - 52,536 9,466 1,050,287 NA 473,509 2,218
2014 (5) 540,117 - 33,288 6,098 1,028,595 NA 475,122 2,165
2015 519,869 - 29,844 4,075 978,468 NA 480,105 2,038
Notes:
4) In 2013, $281 million of revenue bonds and a $2.8 million capital lease payable were issued.
Source: City of Sacramento Comprehensive Annual Financial Reports
Business-Type ActivitiesPercentageof Personal
component unit.
5) In 2014, Marina fund notes payable and capital leases have been reclassified to governmental activities.
Income
3) In 2007, $31 million of revenue bonds, $187 million of refunding bonds and a $25 million note
1) $151 million in revenue bonds and $168 million in refunding revenue bonds were issued in 2006. 2) In 2006, the Sacramento Housing and Redevelopment Agency was eliminated as a blended
payable were issued.
NA) Personal income data was not available in 2007, 2008, 2009, 2010, 2011, 2012, 2013, 2014 and 2015.
Page 2 of 2
209
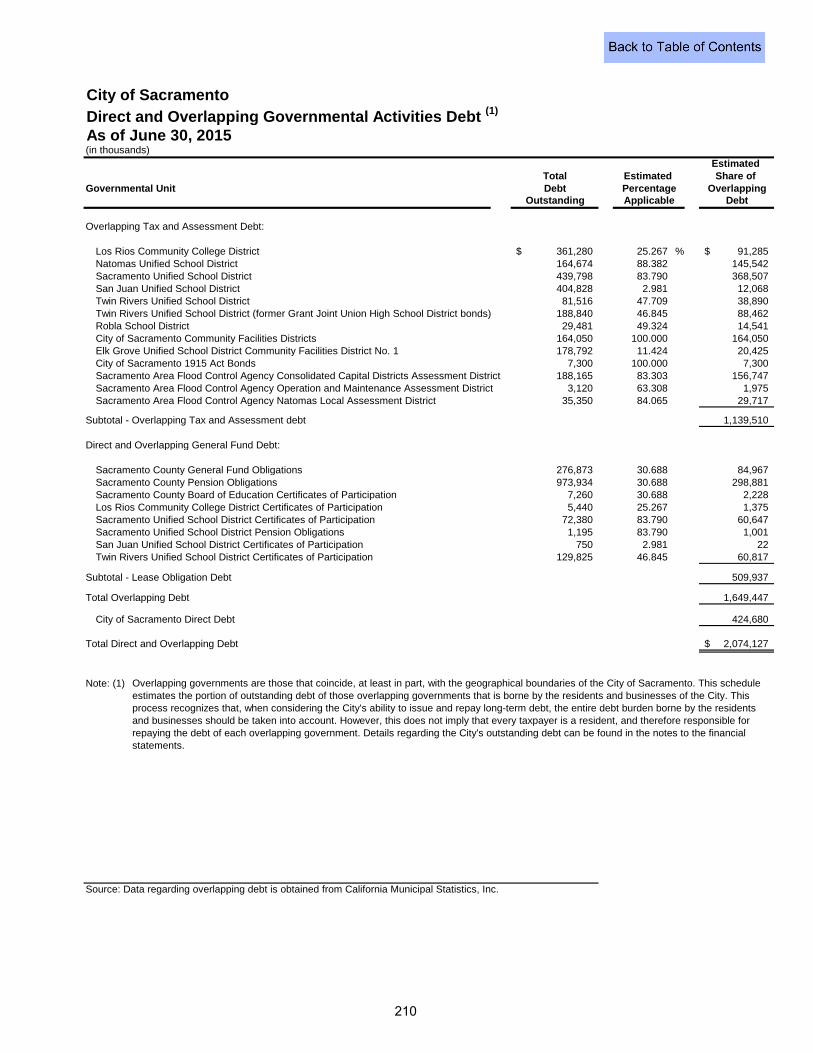
City of SacramentoDirect and Overlapping Governmental Activities Debt (1)
As of June 30, 2015(in thousands)
Estimated Total Share of
Governmental Unit Debt OverlappingOutstanding Debt
Overlapping Tax and Assessment Debt:
Los Rios Community College District 361,280$ 25.267 % 91,285$ Natomas Unified School District 164,674 88.382 145,542 Sacramento Unified School District 439,798 83.790 368,507 San Juan Unified School District 404,828 2.981 12,068 Twin Rivers Unified School District 81,516 47.709 38,890 Twin Rivers Unified School District (former Grant Joint Union High School District bonds) 188,840 46.845 88,462 Robla School District 29,481 49.324 14,541 City of Sacramento Community Facilities Districts 164,050 100.000 164,050 Elk Grove Unified School District Community Facilities District No. 1 178,792 11.424 20,425 City of Sacramento 1915 Act Bonds 7,300 100.000 7,300 Sacramento Area Flood Control Agency Consolidated Capital Districts Assessment District 188,165 83.303 156,747 Sacramento Area Flood Control Agency Operation and Maintenance Assessment District 3,120 63.308 1,975 Sacramento Area Flood Control Agency Natomas Local Assessment District 35,350 84.065 29,717
Subtotal - Overlapping Tax and Assessment debt 1,139,510
Direct and Overlapping General Fund Debt:
Sacramento County General Fund Obligations 276,873 30.688 84,967 Sacramento County Pension Obligations 973,934 30.688 298,881 Sacramento County Board of Education Certificates of Participation 7,260 30.688 2,228 Los Rios Community College District Certificates of Participation 5,440 25.267 1,375 Sacramento Unified School District Certificates of Participation 72,380 83.790 60,647 Sacramento Unified School District Pension Obligations 1,195 83.790 1,001 San Juan Unified School District Certificates of Participation 750 2.981 22 Twin Rivers Unified School District Certificates of Participation 129,825 46.845 60,817
Subtotal - Lease Obligation Debt 509,937
Total Overlapping Debt 1,649,447
City of Sacramento Direct Debt 424,680
Total Direct and Overlapping Debt 2,074,127$
Note: (1)
Source: Data regarding overlapping debt is obtained from California Municipal Statistics, Inc.
Estimated PercentageApplicable
Overlapping governments are those that coincide, at least in part, with the geographical boundaries of the City of Sacramento. This schedule estimates the portion of outstanding debt of those overlapping governments that is borne by the residents and businesses of the City. This process recognizes that, when considering the City's ability to issue and repay long-term debt, the entire debt burden borne by the residents and businesses should be taken into account. However, this does not imply that every taxpayer is a resident, and therefore responsible for repaying the debt of each overlapping government. Details regarding the City's outstanding debt can be found in the notes to the financial statements.
210
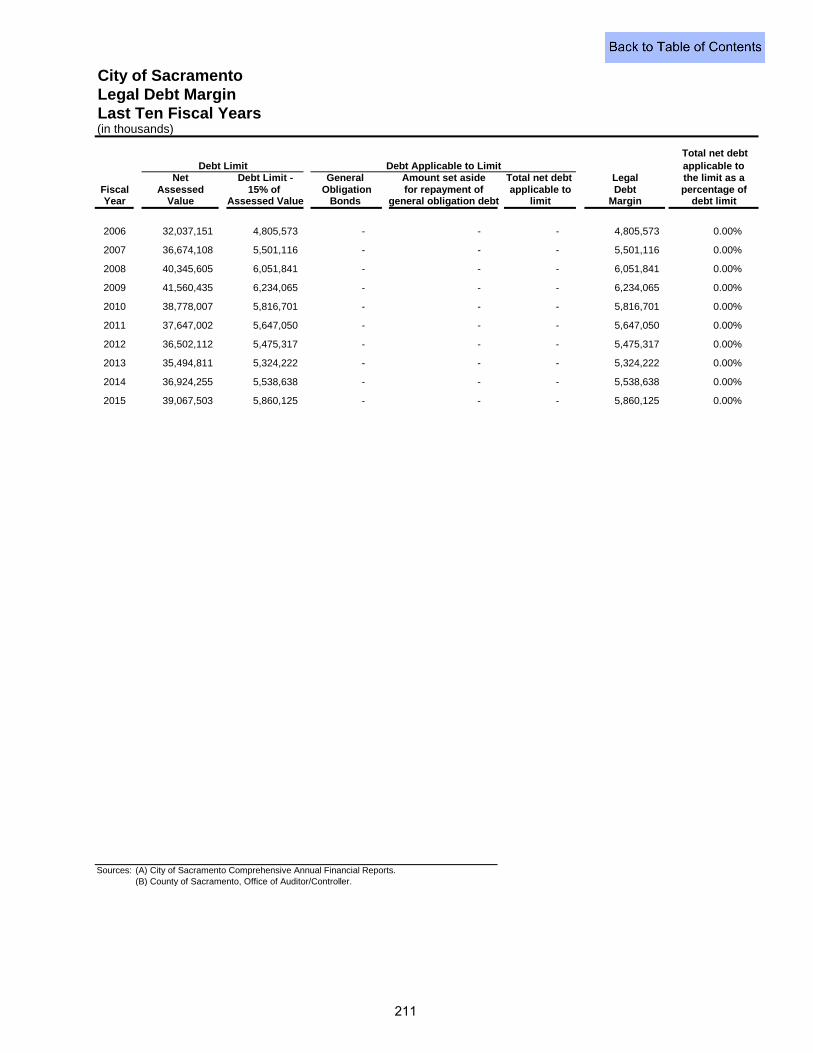
City of SacramentoLegal Debt MarginLast Ten Fiscal Years(in thousands)
Net Debt Limit - General Amount set aside Total net debt LegalFiscal Assessed 15% of Obligation for repayment of applicable to DebtYear Value Assessed Value Bonds general obligation debt limit Margin
2006 32,037,151 4,805,573 - - - 4,805,573 0.00%
2007 36,674,108 5,501,116 - - - 5,501,116 0.00%
2008 40,345,605 6,051,841 - - - 6,051,841 0.00%
2009 41,560,435 6,234,065 - - - 6,234,065 0.00%
2010 38,778,007 5,816,701 - - - 5,816,701 0.00%
2011 37,647,002 5,647,050 - - - 5,647,050 0.00%
2012 36,502,112 5,475,317 - - - 5,475,317 0.00%
2013 35,494,811 5,324,222 - - - 5,324,222 0.00%
2014 36,924,255 5,538,638 - - - 5,538,638 0.00%
2015 39,067,503 5,860,125 - - - 5,860,125 0.00%
Sources: (A) City of Sacramento Comprehensive Annual Financial Reports. (B) County of Sacramento, Office of Auditor/Controller.
percentage ofdebt limit
Debt Limit Debt Applicable to Limit Total net debt applicable to the limit as a
211
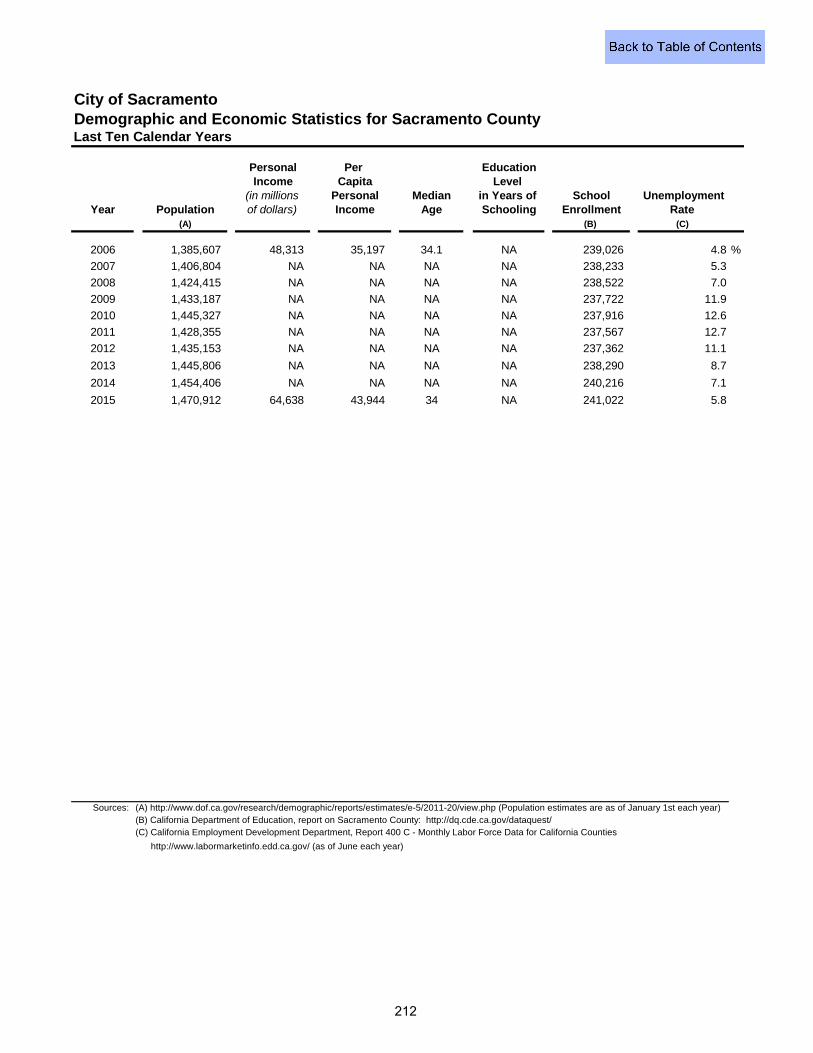
City of SacramentoDemographic and Economic Statistics for Sacramento CountyLast Ten Calendar Years
Personal Per EducationIncome Capita Level
(in millions Personal Median in Years of School UnemploymentYear Population of dollars) Income Age Schooling Enrollment Rate
(A) (B) (C)
2006 1,385,607 48,313 35,197 34.1 NA 239,026 4.8 %
2007 1,406,804 NA NA NA NA 238,233 5.3
2008 1,424,415 NA NA NA NA 238,522 7.0
2009 1,433,187 NA NA NA NA 237,722 11.9
2010 1,445,327 NA NA NA NA 237,916 12.6
2011 1,428,355 NA NA NA NA 237,567 12.7
2012 1,435,153 NA NA NA NA 237,362 11.1
2013 1,445,806 NA NA NA NA 238,290 8.7
2014 1,454,406 NA NA NA NA 240,216 7.1
2015 1,470,912 64,638 43,944 34 NA 241,022 5.8
Sources: (A) http://www.dof.ca.gov/research/demographic/reports/estimates/e-5/2011-20/view.php (Population estimates are as of January 1st each year)(B) California Department of Education, report on Sacramento County: http://dq.cde.ca.gov/dataquest/ (C) California Employment Development Department, Report 400 C - Monthly Labor Force Data for California Counties
http://www.labormarketinfo.edd.ca.gov/ (as of June each year)
212
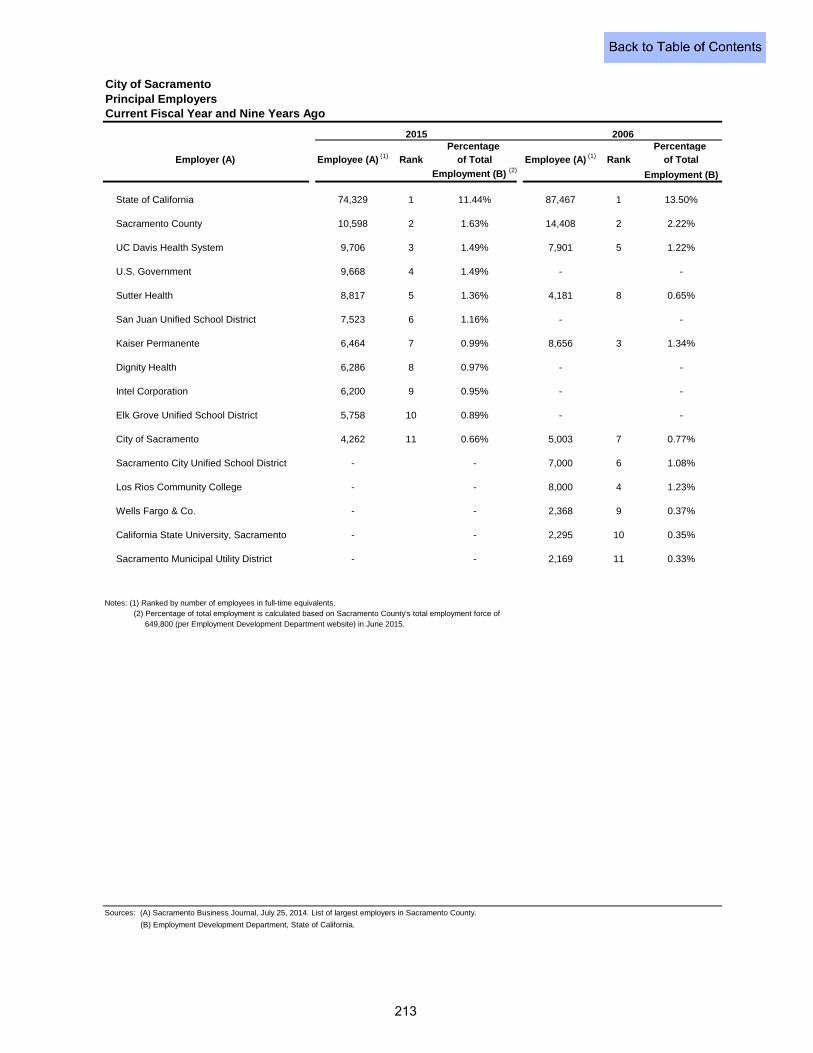
City of Sacramento Principal Employers Current Fiscal Year and Nine Years Ago
Percentage Percentage Employer (A) Employee (A) (1) Rank of Total Employee (A) (1) Rank of Total
Employment (B) (2) Employment (B)
State of California 74,329 1 11.44% 87,467 1 13.50%
Sacramento County 10,598 2 1.63% 14,408 2 2.22%
UC Davis Health System 9,706 3 1.49% 7,901 5 1.22%
U.S. Government 9,668 4 1.49% - -
Sutter Health 8,817 5 1.36% 4,181 8 0.65%
San Juan Unified School District 7,523 6 1.16% - -
Kaiser Permanente 6,464 7 0.99% 8,656 3 1.34%
Dignity Health 6,286 8 0.97% - -
Intel Corporation 6,200 9 0.95% - -
Elk Grove Unified School District 5,758 10 0.89% - -
City of Sacramento 4,262 11 0.66% 5,003 7 0.77%
Sacramento City Unified School District - - 7,000 6 1.08%
Los Rios Community College - - 8,000 4 1.23%
Wells Fargo & Co. - - 2,368 9 0.37%
California State University, Sacramento - - 2,295 10 0.35%
Sacramento Municipal Utility District - - 2,169 11 0.33%
Notes: (1) Ranked by number of employees in full-time equivalents. (2) Percentage of total employment is calculated based on Sacramento County's total employment force of 649,800 (per Employment Development Department website) in June 2015.
Sources: (A) Sacramento Business Journal, July 25, 2014. List of largest employers in Sacramento County.
(B) Employment Development Department, State of California.
20062015
213
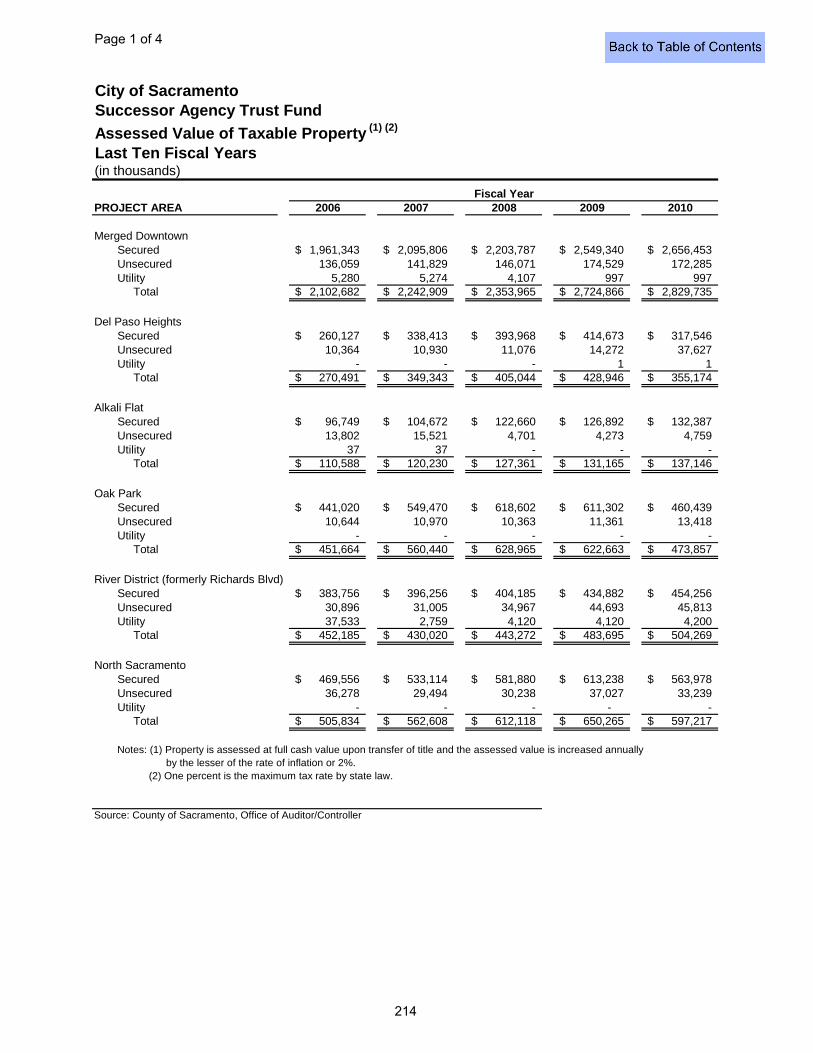
PROJECT AREA 2006 2007 2008 2009 2010
Merged DowntownSecured 1,961,343$ 2,095,806$ 2,203,787$ 2,549,340$ 2,656,453$ Unsecured 136,059 141,829 146,071 174,529 172,285 Utility 5,280 5,274 4,107 997 997 Total 2,102,682$ 2,242,909$ 2,353,965$ 2,724,866$ 2,829,735$
Del Paso HeightsSecured 260,127$ 338,413$ 393,968$ 414,673$ 317,546$ Unsecured 10,364 10,930 11,076 14,272 37,627 Utility - - - 1 1 Total 270,491$ 349,343$ 405,044$ 428,946$ 355,174$
Alkali FlatSecured 96,749$ 104,672$ 122,660$ 126,892$ 132,387$ Unsecured 13,802 15,521 4,701 4,273 4,759 Utility 37 37 - - - Total 110,588$ 120,230$ 127,361$ 131,165$ 137,146$
Oak ParkSecured 441,020$ 549,470$ 618,602$ 611,302$ 460,439$ Unsecured 10,644 10,970 10,363 11,361 13,418 Utility - - - - - Total 451,664$ 560,440$ 628,965$ 622,663$ 473,857$
River District (formerly Richards Blvd)Secured 383,756$ 396,256$ 404,185$ 434,882$ 454,256$ Unsecured 30,896 31,005 34,967 44,693 45,813 Utility 37,533 2,759 4,120 4,120 4,200 Total 452,185$ 430,020$ 443,272$ 483,695$ 504,269$
North SacramentoSecured 469,556$ 533,114$ 581,880$ 613,238$ 563,978$ Unsecured 36,278 29,494 30,238 37,027 33,239 Utility - - - - - Total 505,834$ 562,608$ 612,118$ 650,265$ 597,217$
Notes: (1) Property is assessed at full cash value upon transfer of title and the assessed value is increased annuallyby the lesser of the rate of inflation or 2%.
(2) One percent is the maximum tax rate by state law.
Source: County of Sacramento, Office of Auditor/Controller
Successor Agency Trust Fund
Assessed Value of Taxable Property (1) (2)
Last Ten Fiscal Years
City of Sacramento
(in thousands)
Fiscal Year
Page 1 of 4
214
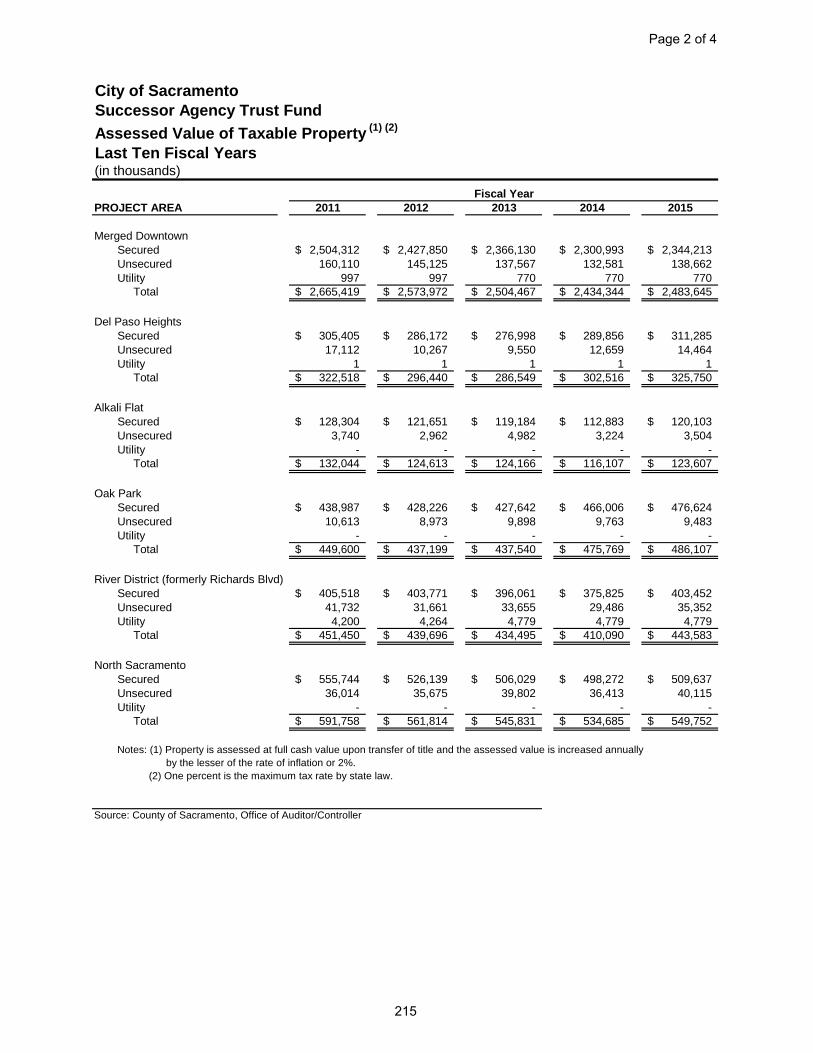
PROJECT AREA 2011 2012 2013 2014 2015
Merged DowntownSecured 2,504,312$ 2,427,850$ 2,366,130$ 2,300,993$ 2,344,213$ Unsecured 160,110 145,125 137,567 132,581 138,662 Utility 997 997 770 770 770 Total 2,665,419$ 2,573,972$ 2,504,467$ 2,434,344$ 2,483,645$
Del Paso HeightsSecured 305,405$ 286,172$ 276,998$ 289,856$ 311,285$ Unsecured 17,112 10,267 9,550 12,659 14,464 Utility 1 1 1 1 1 Total 322,518$ 296,440$ 286,549$ 302,516$ 325,750$
Alkali FlatSecured 128,304$ 121,651$ 119,184$ 112,883$ 120,103$ Unsecured 3,740 2,962 4,982 3,224 3,504 Utility - - - - - Total 132,044$ 124,613$ 124,166$ 116,107$ 123,607$
Oak ParkSecured 438,987$ 428,226$ 427,642$ 466,006$ 476,624$ Unsecured 10,613 8,973 9,898 9,763 9,483 Utility - - - - - Total 449,600$ 437,199$ 437,540$ 475,769$ 486,107$
River District (formerly Richards Blvd)Secured 405,518$ 403,771$ 396,061$ 375,825$ 403,452$ Unsecured 41,732 31,661 33,655 29,486 35,352 Utility 4,200 4,264 4,779 4,779 4,779 Total 451,450$ 439,696$ 434,495$ 410,090$ 443,583$
North SacramentoSecured 555,744$ 526,139$ 506,029$ 498,272$ 509,637$ Unsecured 36,014 35,675 39,802 36,413 40,115 Utility - - - - - Total 591,758$ 561,814$ 545,831$ 534,685$ 549,752$
Notes: (1) Property is assessed at full cash value upon transfer of title and the assessed value is increased annuallyby the lesser of the rate of inflation or 2%.
(2) One percent is the maximum tax rate by state law.
Source: County of Sacramento, Office of Auditor/Controller
Successor Agency Trust Fund
Assessed Value of Taxable Property (1) (2)
Last Ten Fiscal Years
City of Sacramento
(in thousands)
Fiscal Year
Page 2 of 4
215
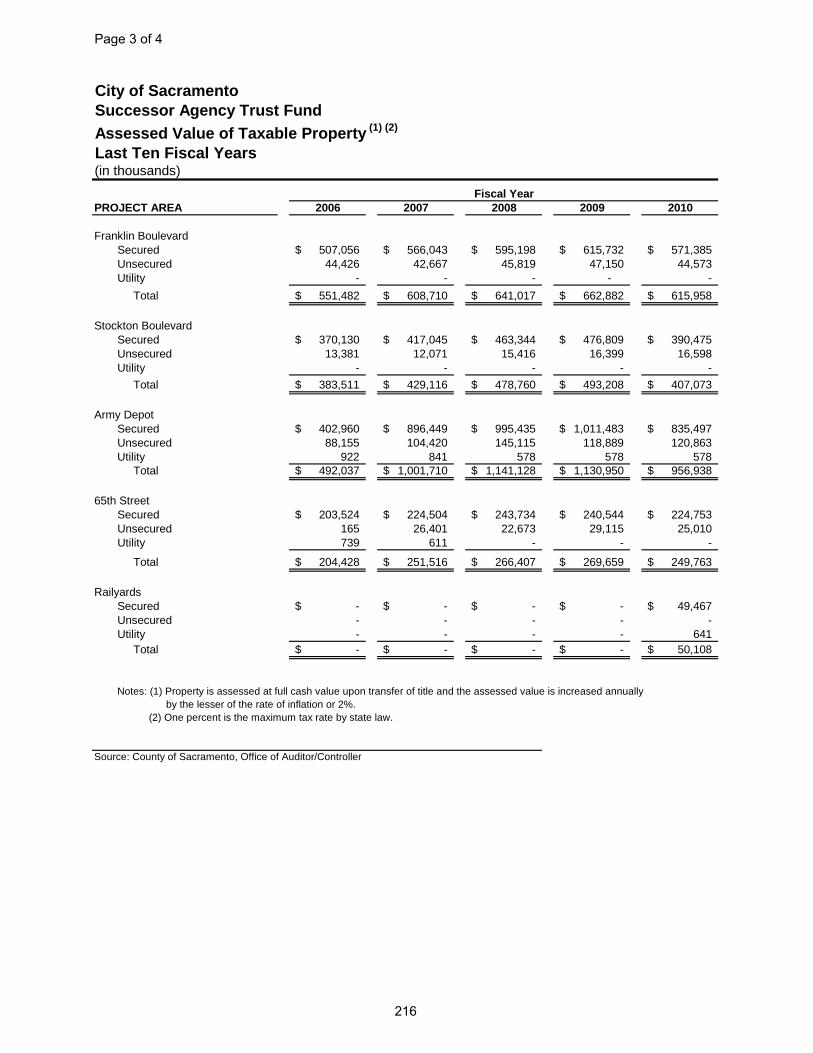
PROJECT AREA 2006 2007 2008 2009 2010
Franklin BoulevardSecured 507,056$ 566,043$ 595,198$ 615,732$ 571,385$ Unsecured 44,426 42,667 45,819 47,150 44,573 Utility - - - - -
Total 551,482$ 608,710$ 641,017$ 662,882$ 615,958$
Stockton BoulevardSecured 370,130$ 417,045$ 463,344$ 476,809$ 390,475$ Unsecured 13,381 12,071 15,416 16,399 16,598 Utility - - - - -
Total 383,511$ 429,116$ 478,760$ 493,208$ 407,073$
Army DepotSecured 402,960$ 896,449$ 995,435$ 1,011,483$ 835,497$ Unsecured 88,155 104,420 145,115 118,889 120,863 Utility 922 841 578 578 578 Total 492,037$ 1,001,710$ 1,141,128$ 1,130,950$ 956,938$
65th StreetSecured 203,524$ 224,504$ 243,734$ 240,544$ 224,753$ Unsecured 165 26,401 22,673 29,115 25,010 Utility 739 611 - - -
Total 204,428$ 251,516$ 266,407$ 269,659$ 249,763$
RailyardsSecured -$ -$ -$ -$ 49,467$ Unsecured - - - - - Utility - - - - 641 Total -$ -$ -$ -$ 50,108$
Notes: (1) Property is assessed at full cash value upon transfer of title and the assessed value is increased annuallyby the lesser of the rate of inflation or 2%.
(2) One percent is the maximum tax rate by state law.
Source: County of Sacramento, Office of Auditor/Controller
Fiscal Year
Successor Agency Trust Fund
Assessed Value of Taxable Property (1) (2)
Last Ten Fiscal Years(in thousands)
City of Sacramento
Page 3 of 4
216
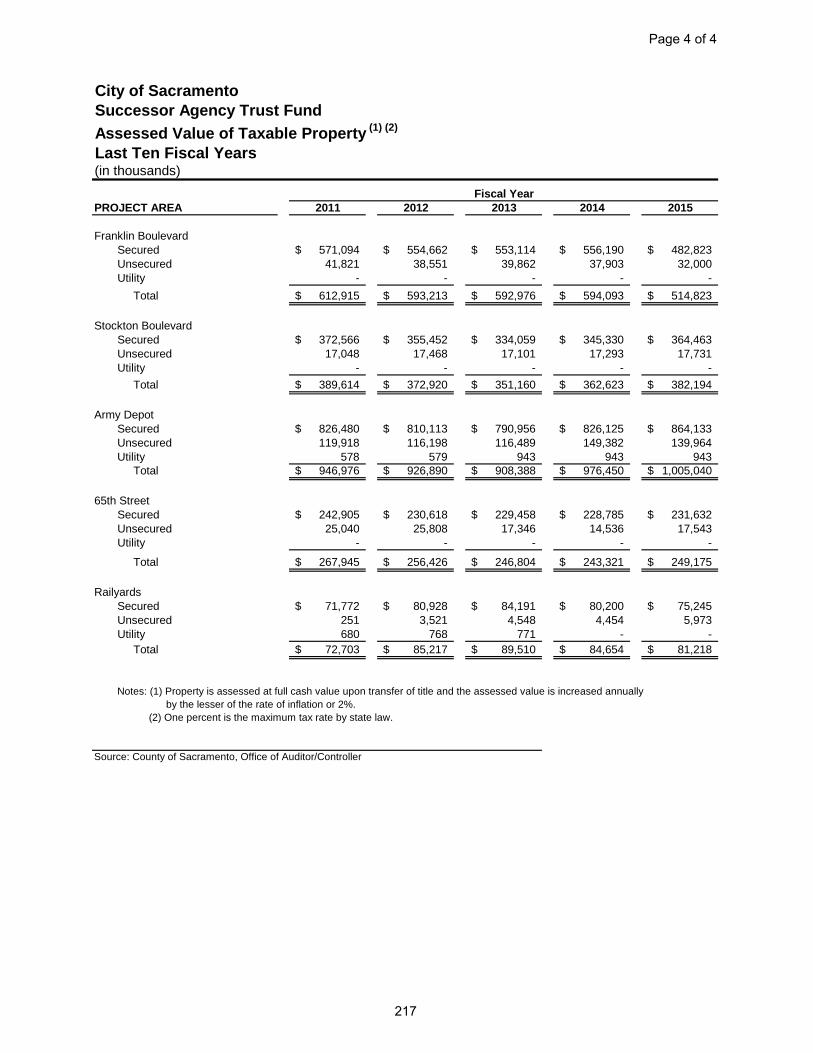
PROJECT AREA 2011 2012 2013 2014 2015
Franklin BoulevardSecured 571,094$ 554,662$ 553,114$ 556,190$ 482,823$ Unsecured 41,821 38,551 39,862 37,903 32,000 Utility - - - - -
Total 612,915$ 593,213$ 592,976$ 594,093$ 514,823$
Stockton BoulevardSecured 372,566$ 355,452$ 334,059$ 345,330$ 364,463$ Unsecured 17,048 17,468 17,101 17,293 17,731 Utility - - - - -
Total 389,614$ 372,920$ 351,160$ 362,623$ 382,194$
Army DepotSecured 826,480$ 810,113$ 790,956$ 826,125$ 864,133$ Unsecured 119,918 116,198 116,489 149,382 139,964 Utility 578 579 943 943 943 Total 946,976$ 926,890$ 908,388$ 976,450$ 1,005,040$
65th StreetSecured 242,905$ 230,618$ 229,458$ 228,785$ 231,632$ Unsecured 25,040 25,808 17,346 14,536 17,543 Utility - - - - -
Total 267,945$ 256,426$ 246,804$ 243,321$ 249,175$
RailyardsSecured 71,772$ 80,928$ 84,191$ 80,200$ 75,245$ Unsecured 251 3,521 4,548 4,454 5,973 Utility 680 768 771 - - Total 72,703$ 85,217$ 89,510$ 84,654$ 81,218$
Notes: (1) Property is assessed at full cash value upon transfer of title and the assessed value is increased annuallyby the lesser of the rate of inflation or 2%.
(2) One percent is the maximum tax rate by state law.
Source: County of Sacramento, Office of Auditor/Controller
Fiscal Year
Successor Agency Trust Fund
Assessed Value of Taxable Property (1) (2)
Last Ten Fiscal Years(in thousands)
City of Sacramento
Page 4 of 4
217
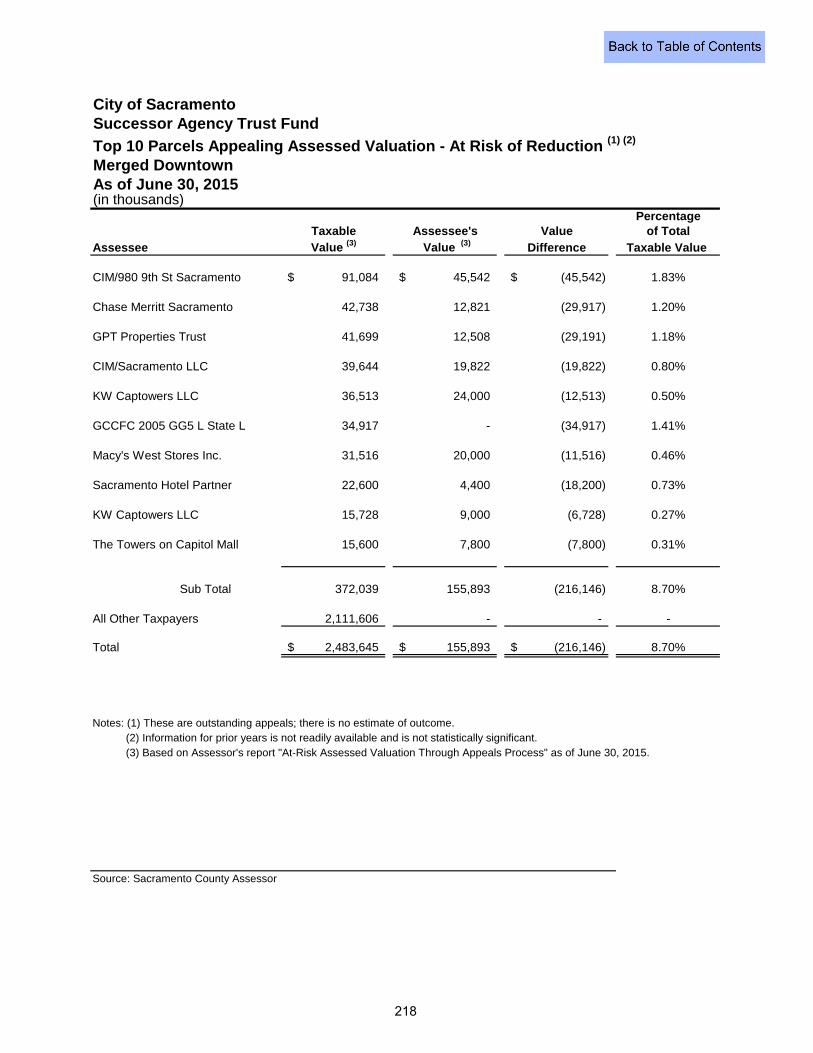
City of Sacramento
Merged Downtown
(in thousands)Percentage
Taxable Assessee's Value of TotalAssessee Value (3) Value (3) Difference Taxable Value
CIM/980 9th St Sacramento 91,084$ 45,542$ (45,542)$ 1.83%
Chase Merritt Sacramento 42,738 12,821 (29,917) 1.20%
GPT Properties Trust 41,699 12,508 (29,191) 1.18%
CIM/Sacramento LLC 39,644 19,822 (19,822) 0.80%
KW Captowers LLC 36,513 24,000 (12,513) 0.50%
GCCFC 2005 GG5 L State L 34,917 - (34,917) 1.41%
Macy's West Stores Inc. 31,516 20,000 (11,516) 0.46%
Sacramento Hotel Partner 22,600 4,400 (18,200) 0.73%
KW Captowers LLC 15,728 9,000 (6,728) 0.27%
The Towers on Capitol Mall 15,600 7,800 (7,800) 0.31%
Sub Total 372,039 155,893 (216,146) 8.70%
All Other Taxpayers 2,111,606 - - -
Total 2,483,645$ 155,893$ (216,146)$ 8.70%
Notes: (1) These are outstanding appeals; there is no estimate of outcome. (2) Information for prior years is not readily available and is not statistically significant. (3) Based on Assessor's report "At-Risk Assessed Valuation Through Appeals Process" as of June 30, 2015.
Source: Sacramento County Assessor
Successor Agency Trust Fund
Top 10 Parcels Appealing Assessed Valuation - At Risk of Reduction (1) (2)
As of June 30, 2015
218
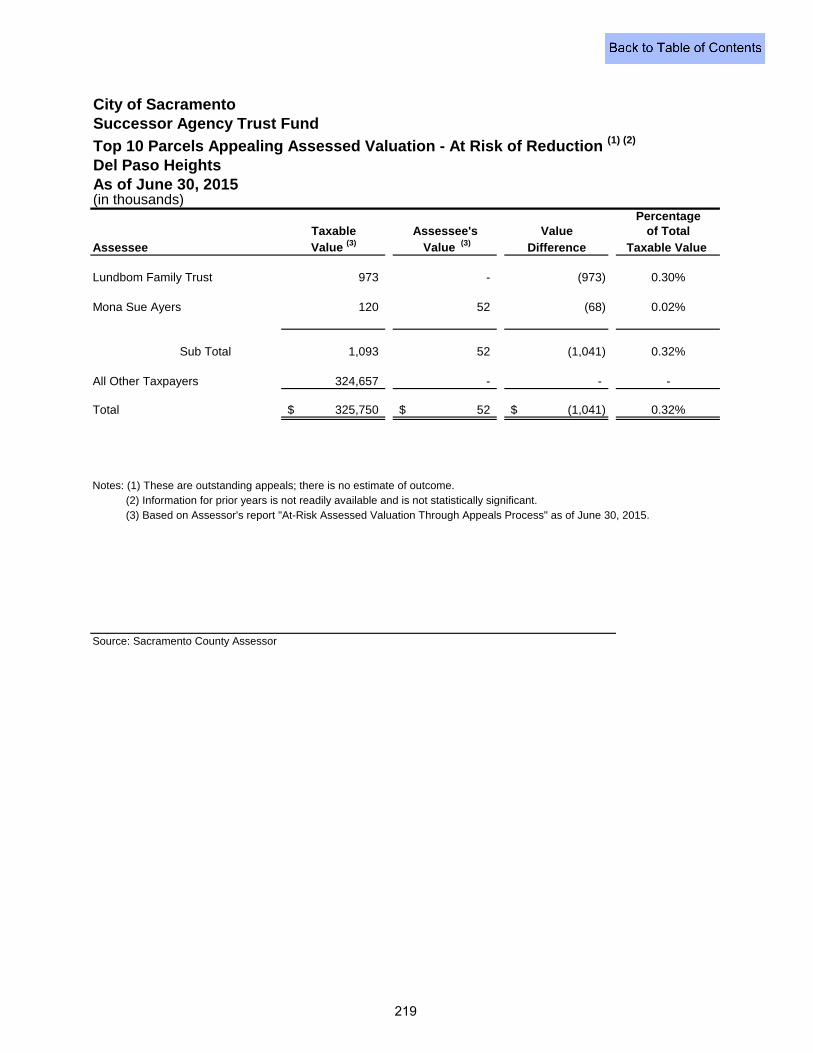
City of Sacramento
Del Paso Heights
(in thousands)Percentage
Taxable Assessee's Value of TotalAssessee Value (3) Value (3) Difference Taxable Value
Lundbom Family Trust 973 - (973) 0.30%
Mona Sue Ayers 120 52 (68) 0.02%
Sub Total 1,093 52 (1,041) 0.32%
All Other Taxpayers 324,657 - - -
Total 325,750$ 52$ (1,041)$ 0.32%
Notes: (1) These are outstanding appeals; there is no estimate of outcome. (2) Information for prior years is not readily available and is not statistically significant. (3) Based on Assessor's report "At-Risk Assessed Valuation Through Appeals Process" as of June 30, 2015.
Source: Sacramento County Assessor
Successor Agency Trust Fund
Top 10 Parcels Appealing Assessed Valuation - At Risk of Reduction (1) (2)
As of June 30, 2015
219

City of Sacramento
Alkali Flat
(in thousands)Percentage
Taxable Assessee's Value of TotalAssessee Value (3) Value (3) Difference Taxable Value
Hearst Argyle Stations 8,022 2,077 (5,945) 4.81%
Hearst Argyle Stations 7,865 2,889 (4,976) 4.03%
Sub Total 15,887 4,966 (10,921) 8.84%
All Other Taxpayers 107,720 - - -
Total 123,607$ 4,966$ (10,921)$ 8.84%
Notes: (1) These are outstanding appeals; there is no estimate of outcome. (2) Information for prior years is not readily available and is not statistically significant. (3) Based on Assessor's report "At-Risk Assessed Valuation Through Appeals Process" as of June 30, 2015.
Source: Sacramento County Assessor
Successor Agency Trust Fund
Parcels Appealing Assessed Valuation - At Risk of Reduction (1) (2)
As of June 30, 2015
220
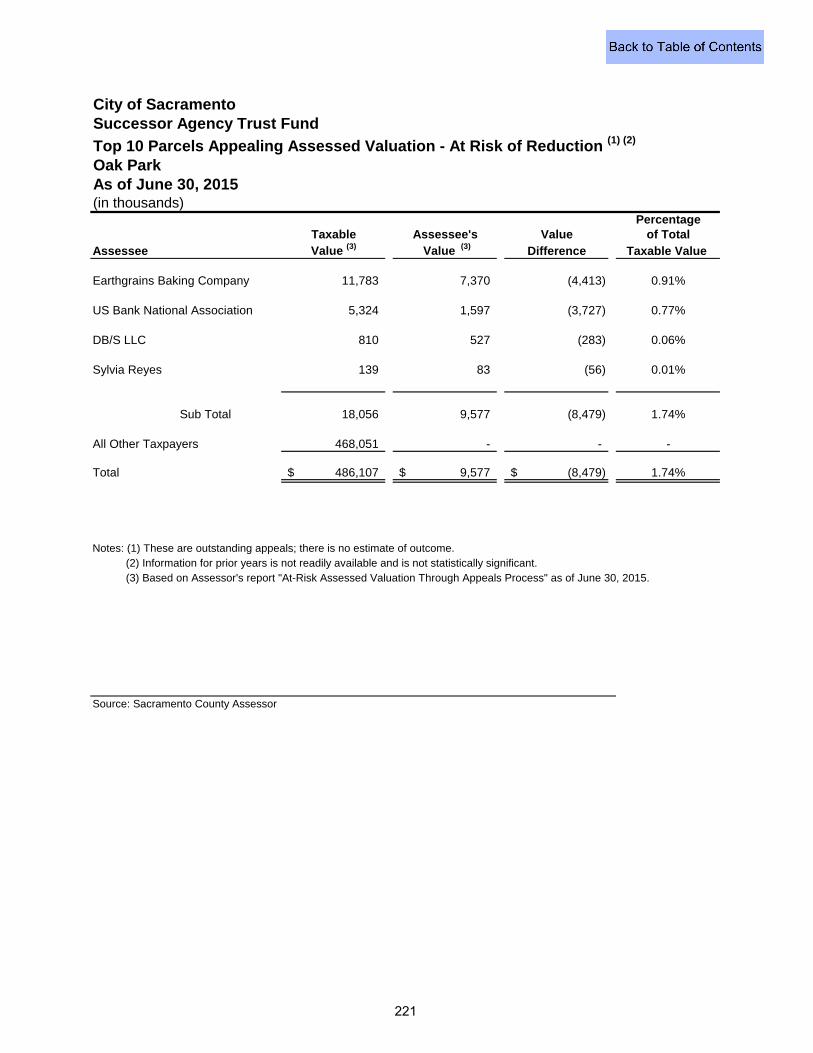
City of Sacramento
Oak Park
(in thousands)Percentage
Taxable Assessee's Value of TotalAssessee Value (3) Value (3) Difference Taxable Value
Earthgrains Baking Company 11,783 7,370 (4,413) 0.91%
US Bank National Association 5,324 1,597 (3,727) 0.77%
DB/S LLC 810 527 (283) 0.06%
Sylvia Reyes 139 83 (56) 0.01%
Sub Total 18,056 9,577 (8,479) 1.74%
All Other Taxpayers 468,051 - - -
Total 486,107$ 9,577$ (8,479)$ 1.74%
Notes: (1) These are outstanding appeals; there is no estimate of outcome. (2) Information for prior years is not readily available and is not statistically significant. (3) Based on Assessor's report "At-Risk Assessed Valuation Through Appeals Process" as of June 30, 2015.
Source: Sacramento County Assessor
Successor Agency Trust Fund
Top 10 Parcels Appealing Assessed Valuation - At Risk of Reduction (1) (2)
As of June 30, 2015
221
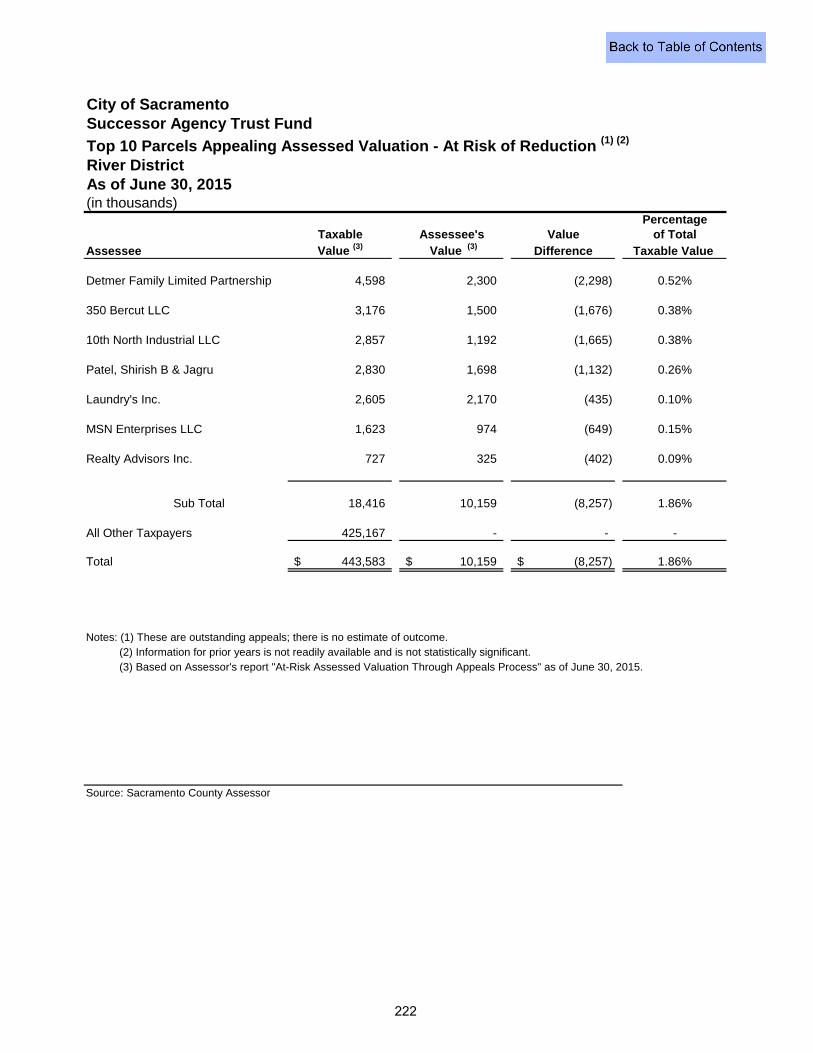
City of Sacramento
River District
(in thousands)Percentage
Taxable Assessee's Value of TotalAssessee Value (3) Value (3) Difference Taxable Value
Detmer Family Limited Partnership 4,598 2,300 (2,298) 0.52%
350 Bercut LLC 3,176 1,500 (1,676) 0.38%
10th North Industrial LLC 2,857 1,192 (1,665) 0.38%
Patel, Shirish B & Jagru 2,830 1,698 (1,132) 0.26%
Laundry's Inc. 2,605 2,170 (435) 0.10%
MSN Enterprises LLC 1,623 974 (649) 0.15%
Realty Advisors Inc. 727 325 (402) 0.09%
Sub Total 18,416 10,159 (8,257) 1.86%
All Other Taxpayers 425,167 - - -
Total 443,583$ 10,159$ (8,257)$ 1.86%
Notes: (1) These are outstanding appeals; there is no estimate of outcome. (2) Information for prior years is not readily available and is not statistically significant. (3) Based on Assessor's report "At-Risk Assessed Valuation Through Appeals Process" as of June 30, 2015.
Source: Sacramento County Assessor
Successor Agency Trust Fund
Top 10 Parcels Appealing Assessed Valuation - At Risk of Reduction (1) (2)
As of June 30, 2015
222
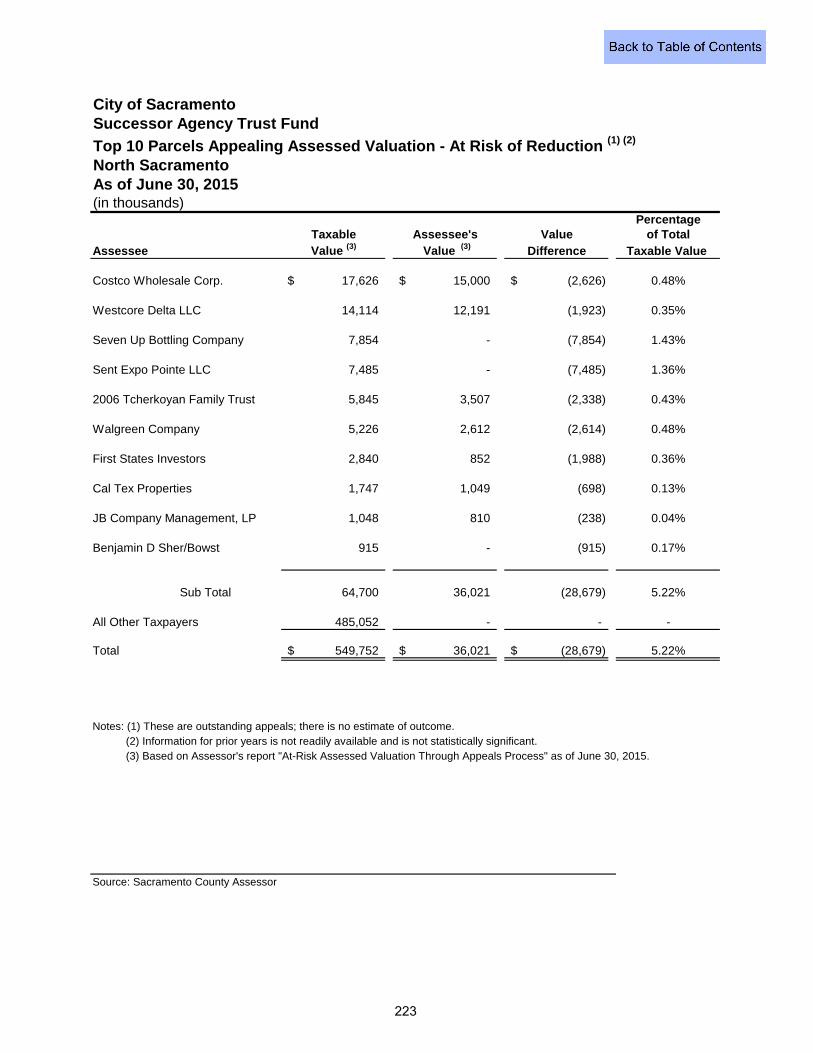
City of Sacramento
North Sacramento
(in thousands)Percentage
Taxable Assessee's Value of TotalAssessee Value (3) Value (3) Difference Taxable Value
Costco Wholesale Corp. 17,626$ 15,000$ (2,626)$ 0.48%
Westcore Delta LLC 14,114 12,191 (1,923) 0.35%
Seven Up Bottling Company 7,854 - (7,854) 1.43%
Sent Expo Pointe LLC 7,485 - (7,485) 1.36%
2006 Tcherkoyan Family Trust 5,845 3,507 (2,338) 0.43%
Walgreen Company 5,226 2,612 (2,614) 0.48%
First States Investors 2,840 852 (1,988) 0.36%
Cal Tex Properties 1,747 1,049 (698) 0.13%
JB Company Management, LP 1,048 810 (238) 0.04%
Benjamin D Sher/Bowst 915 - (915) 0.17%
Sub Total 64,700 36,021 (28,679) 5.22%
All Other Taxpayers 485,052 - - -
Total 549,752$ 36,021$ (28,679)$ 5.22%
Notes: (1) These are outstanding appeals; there is no estimate of outcome. (2) Information for prior years is not readily available and is not statistically significant. (3) Based on Assessor's report "At-Risk Assessed Valuation Through Appeals Process" as of June 30, 2015.
Source: Sacramento County Assessor
Successor Agency Trust Fund
Top 10 Parcels Appealing Assessed Valuation - At Risk of Reduction (1) (2)
As of June 30, 2015
223
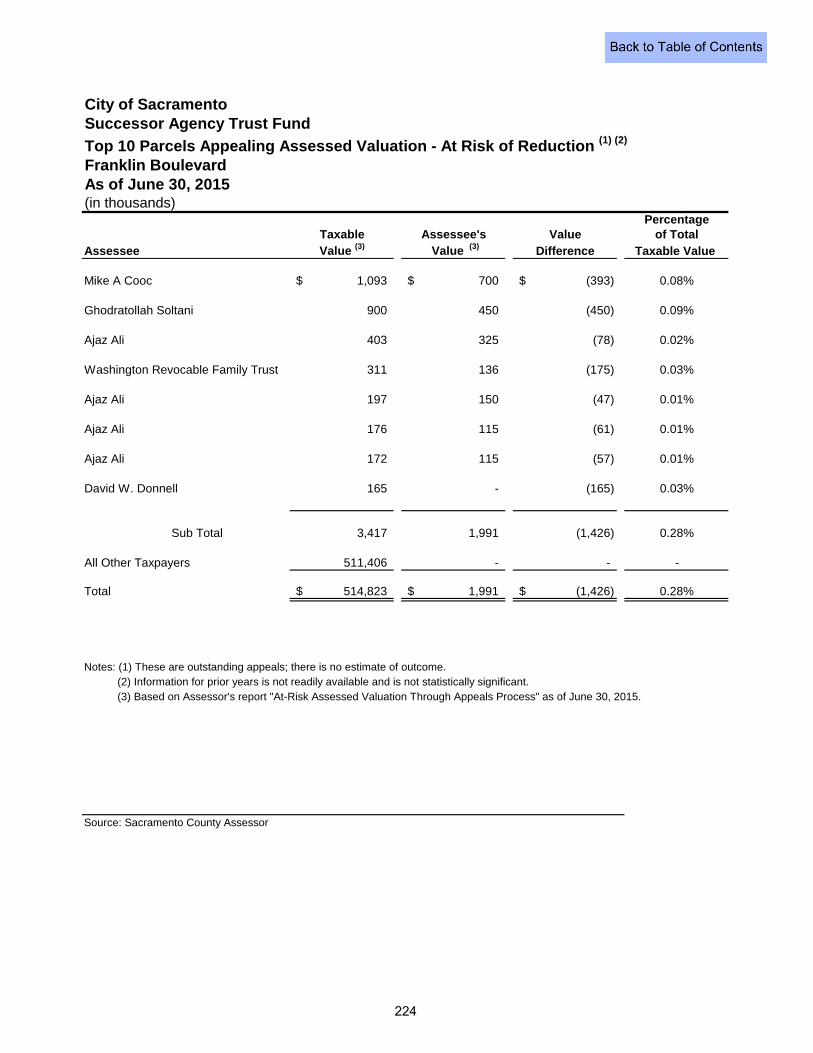
City of Sacramento
Franklin Boulevard
(in thousands)Percentage
Taxable Assessee's Value of TotalAssessee Value (3) Value (3) Difference Taxable Value
Mike A Cooc 1,093$ 700$ (393)$ 0.08%
Ghodratollah Soltani 900 450 (450) 0.09%
Ajaz Ali 403 325 (78) 0.02%
Washington Revocable Family Trust 311 136 (175) 0.03%
Ajaz Ali 197 150 (47) 0.01%
Ajaz Ali 176 115 (61) 0.01%
Ajaz Ali 172 115 (57) 0.01%
David W. Donnell 165 - (165) 0.03%
Sub Total 3,417 1,991 (1,426) 0.28%
All Other Taxpayers 511,406 - - -
Total 514,823$ 1,991$ (1,426)$ 0.28%
Notes: (1) These are outstanding appeals; there is no estimate of outcome. (2) Information for prior years is not readily available and is not statistically significant. (3) Based on Assessor's report "At-Risk Assessed Valuation Through Appeals Process" as of June 30, 2015.
Source: Sacramento County Assessor
Successor Agency Trust Fund
Top 10 Parcels Appealing Assessed Valuation - At Risk of Reduction (1) (2)
As of June 30, 2015
224
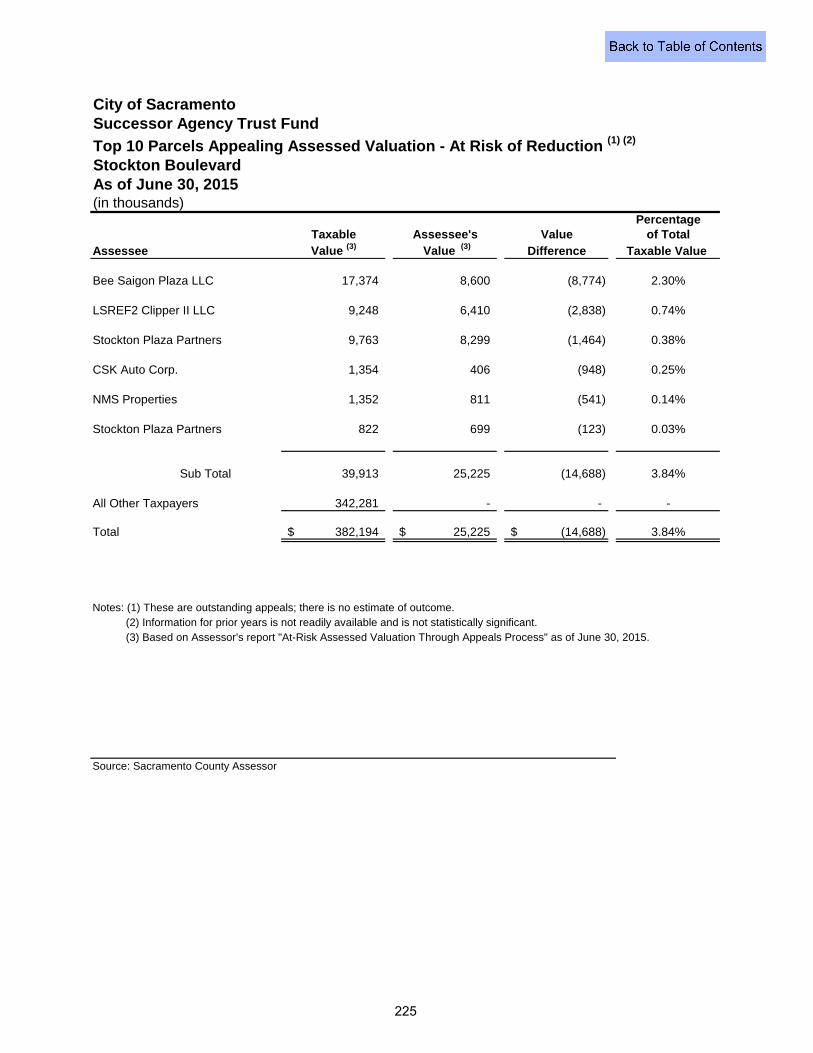
City of Sacramento
Stockton Boulevard
(in thousands)Percentage
Taxable Assessee's Value of TotalAssessee Value (3) Value (3) Difference Taxable Value
Bee Saigon Plaza LLC 17,374 8,600 (8,774) 2.30%
LSREF2 Clipper II LLC 9,248 6,410 (2,838) 0.74%
Stockton Plaza Partners 9,763 8,299 (1,464) 0.38%
CSK Auto Corp. 1,354 406 (948) 0.25%
NMS Properties 1,352 811 (541) 0.14%
Stockton Plaza Partners 822 699 (123) 0.03%
Sub Total 39,913 25,225 (14,688) 3.84%
All Other Taxpayers 342,281 - - -
Total 382,194$ 25,225$ (14,688)$ 3.84%
Notes: (1) These are outstanding appeals; there is no estimate of outcome. (2) Information for prior years is not readily available and is not statistically significant. (3) Based on Assessor's report "At-Risk Assessed Valuation Through Appeals Process" as of June 30, 2015.
Source: Sacramento County Assessor
Successor Agency Trust Fund
Top 10 Parcels Appealing Assessed Valuation - At Risk of Reduction (1) (2)
As of June 30, 2015
225
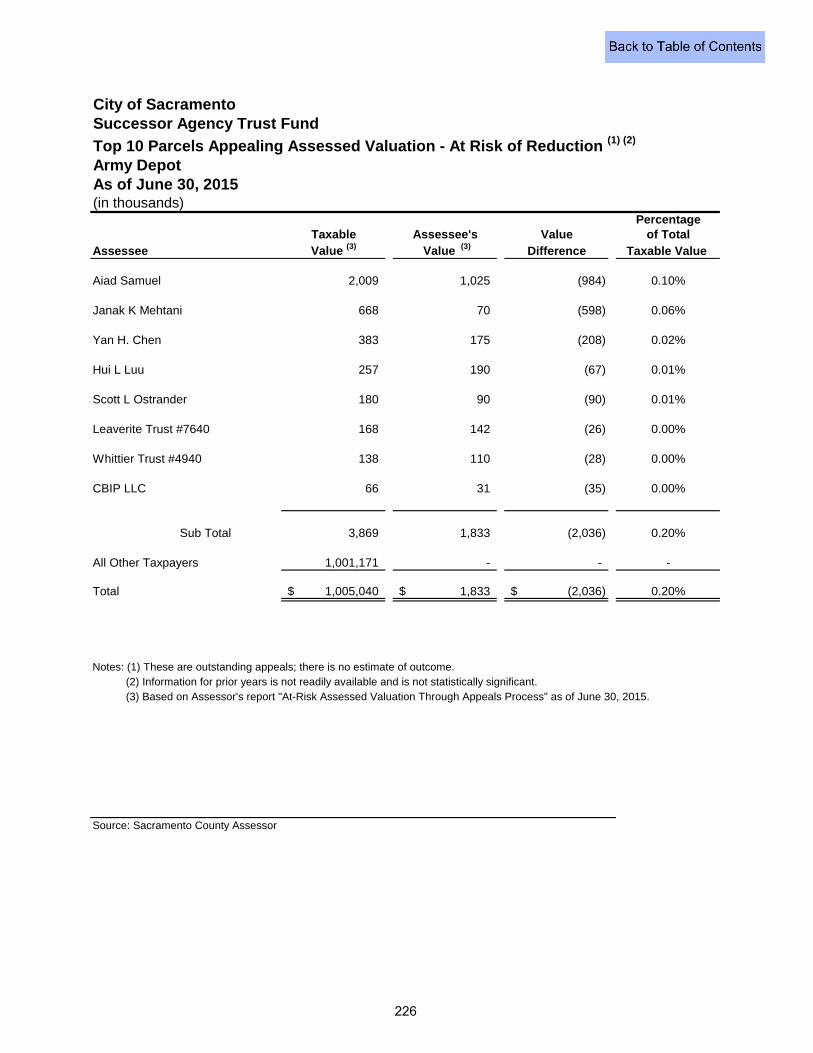
City of Sacramento
Army Depot
(in thousands)Percentage
Taxable Assessee's Value of TotalAssessee Value (3) Value (3) Difference Taxable Value
Aiad Samuel 2,009 1,025 (984) 0.10%
Janak K Mehtani 668 70 (598) 0.06%
Yan H. Chen 383 175 (208) 0.02%
Hui L Luu 257 190 (67) 0.01%
Scott L Ostrander 180 90 (90) 0.01%
Leaverite Trust #7640 168 142 (26) 0.00%
Whittier Trust #4940 138 110 (28) 0.00%
CBIP LLC 66 31 (35) 0.00%
Sub Total 3,869 1,833 (2,036) 0.20%
All Other Taxpayers 1,001,171 - - -
Total 1,005,040$ 1,833$ (2,036)$ 0.20%
Notes: (1) These are outstanding appeals; there is no estimate of outcome. (2) Information for prior years is not readily available and is not statistically significant. (3) Based on Assessor's report "At-Risk Assessed Valuation Through Appeals Process" as of June 30, 2015.
Source: Sacramento County Assessor
Successor Agency Trust Fund
Top 10 Parcels Appealing Assessed Valuation - At Risk of Reduction (1) (2)
As of June 30, 2015
226
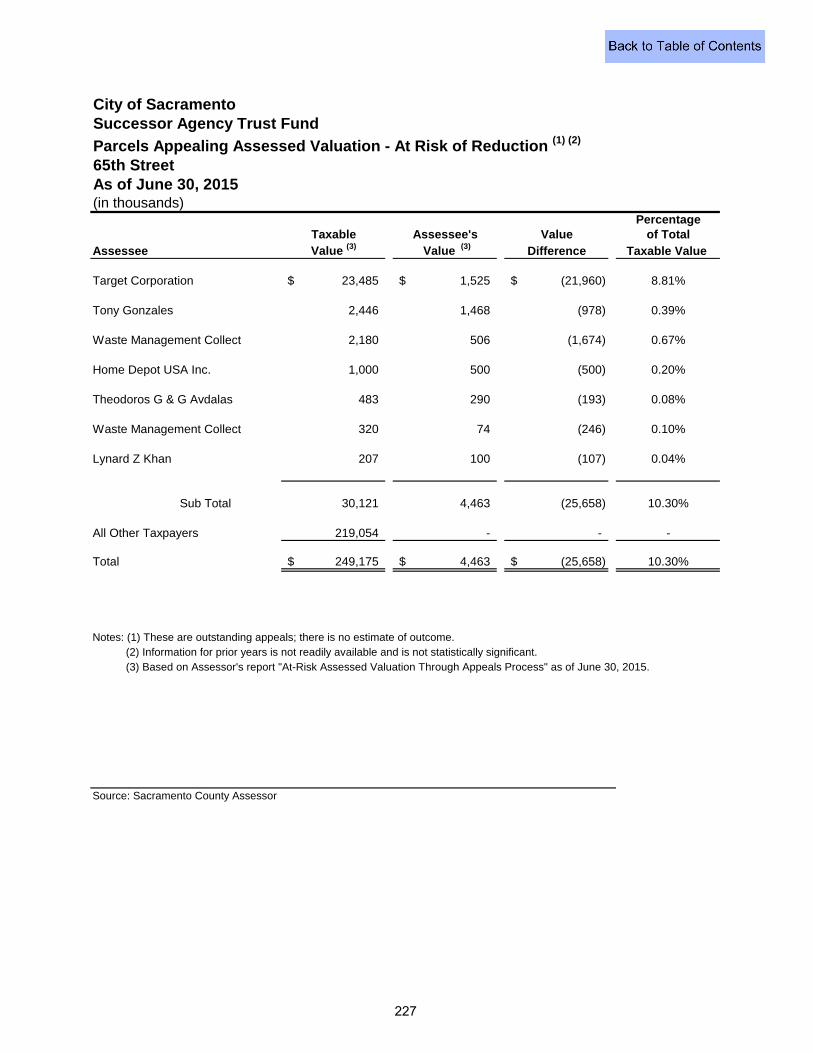
City of Sacramento
65th Street
(in thousands)Percentage
Taxable Assessee's Value of TotalAssessee Value (3) Value (3) Difference Taxable Value
Target Corporation 23,485$ 1,525$ (21,960)$ 8.81%
Tony Gonzales 2,446 1,468 (978) 0.39%
Waste Management Collect 2,180 506 (1,674) 0.67%
Home Depot USA Inc. 1,000 500 (500) 0.20%
Theodoros G & G Avdalas 483 290 (193) 0.08%
Waste Management Collect 320 74 (246) 0.10%
Lynard Z Khan 207 100 (107) 0.04%
Sub Total 30,121 4,463 (25,658) 10.30%
All Other Taxpayers 219,054 - - -
Total 249,175$ 4,463$ (25,658)$ 10.30%
Notes: (1) These are outstanding appeals; there is no estimate of outcome. (2) Information for prior years is not readily available and is not statistically significant. (3) Based on Assessor's report "At-Risk Assessed Valuation Through Appeals Process" as of June 30, 2015.
Source: Sacramento County Assessor
Successor Agency Trust Fund
Parcels Appealing Assessed Valuation - At Risk of Reduction (1) (2)
As of June 30, 2015
227

City of Sacramento
Railyards
(in thousands)Percentage
Taxable Assessee's Value of TotalAssessee Value (3) Value (3) Difference Taxable Value
Peter C Thompson 12,000 7,144 (4,856) 5.98%
Sub Total 12,000 7,144 (4,856) 5.98%
All Other Taxpayers 69,218 - - -
Total 81,218$ 7,144$ (4,856)$ 5.98%
Notes: (1) These are outstanding appeals; there is no estimate of outcome. (2) Information for prior years is not readily available and is not statistically significant. (3) Based on Assessor's report "At-Risk Assessed Valuation Through Appeals Process" as of June 30, 2015.
Source: Sacramento County Assessor
Successor Agency Trust Fund
Parcels Appealing Assessed Valuation - At Risk of Reduction (1) (2)
As of June 30, 2015
228
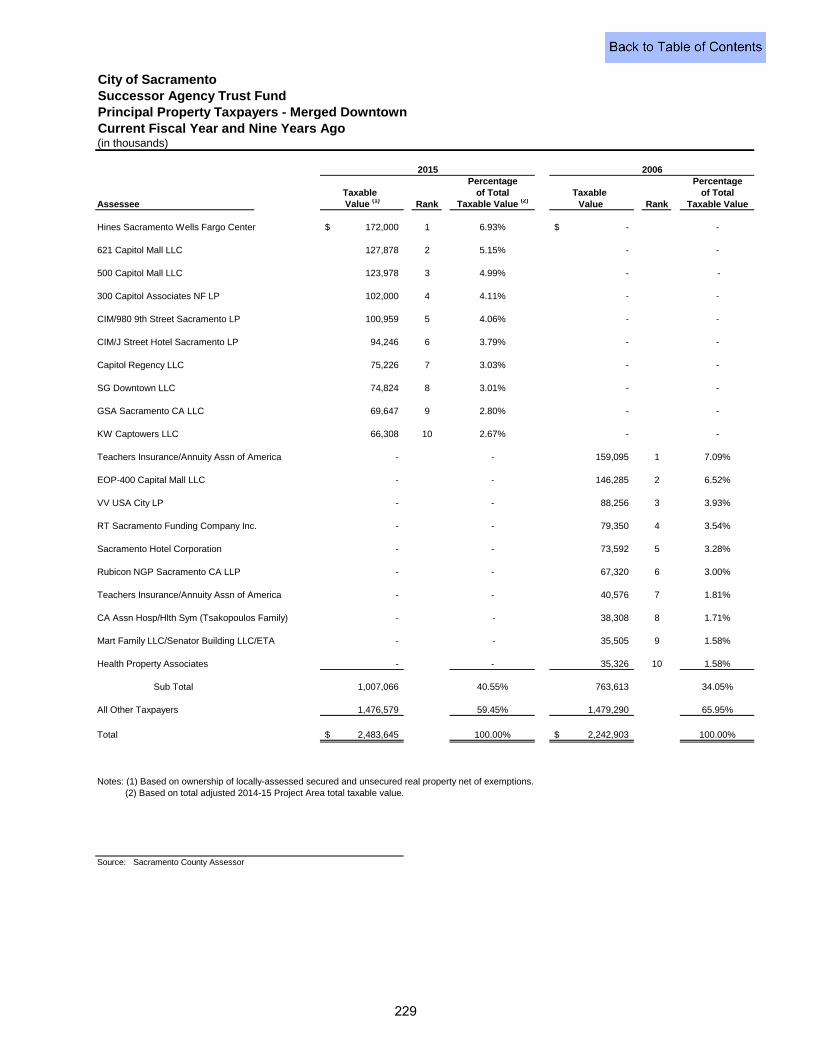
Successor Agency Trust Fund
(in thousands)
Percentage PercentageTaxable of Total Taxable of Total
Assessee Value (1) Rank Taxable Value (2) Value Rank Taxable Value
Hines Sacramento Wells Fargo Center 172,000$ 1 6.93% -$ -
621 Capitol Mall LLC 127,878 2 5.15% - -
500 Capitol Mall LLC 123,978 3 4.99% - -
300 Capitol Associates NF LP 102,000 4 4.11% - -
CIM/980 9th Street Sacramento LP 100,959 5 4.06% - -
CIM/J Street Hotel Sacramento LP 94,246 6 3.79% - -
Capitol Regency LLC 75,226 7 3.03% - -
SG Downtown LLC 74,824 8 3.01% - -
GSA Sacramento CA LLC 69,647 9 2.80% - -
KW Captowers LLC 66,308 10 2.67% - -
Teachers Insurance/Annuity Assn of America - - 159,095 1 7.09%
EOP-400 Capital Mall LLC - - 146,285 2 6.52%
VV USA City LP - - 88,256 3 3.93%
RT Sacramento Funding Company Inc. - - 79,350 4 3.54%
Sacramento Hotel Corporation - - 73,592 5 3.28%
Rubicon NGP Sacramento CA LLP - - 67,320 6 3.00%
Teachers Insurance/Annuity Assn of America - - 40,576 7 1.81%
CA Assn Hosp/Hlth Sym (Tsakopoulos Family) - - 38,308 8 1.71%
Mart Family LLC/Senator Building LLC/ETA - - 35,505 9 1.58%
Health Property Associates - - 35,326 10 1.58%
Sub Total 1,007,066 40.55% 763,613 34.05%
All Other Taxpayers 1,476,579 59.45% 1,479,290 65.95%
Total 2,483,645$ 100.00% 2,242,903$ 100.00%
Notes: (1) Based on ownership of locally-assessed secured and unsecured real property net of exemptions. (2) Based on total adjusted 2014-15 Project Area total taxable value.
Source: Sacramento County Assessor
2015 2006
City of Sacramento
Principal Property Taxpayers - Merged DowntownCurrent Fiscal Year and Nine Years Ago
229
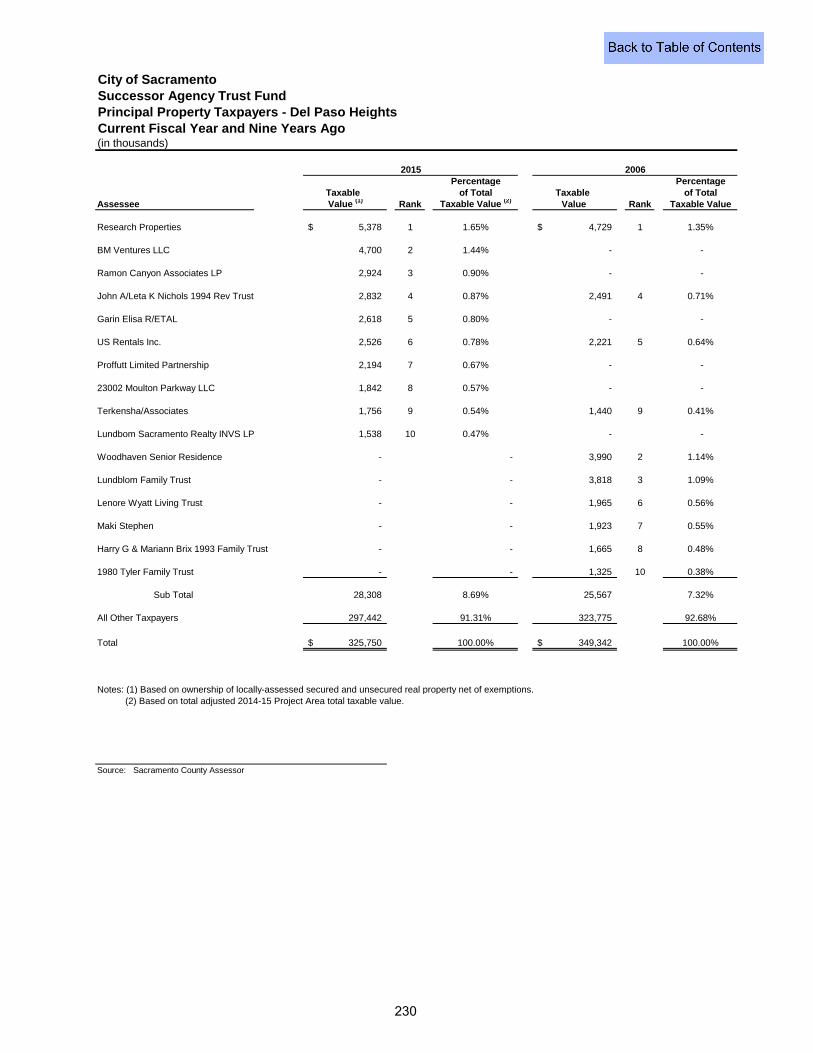
Successor Agency Trust Fund
(in thousands)
Percentage PercentageTaxable of Total Taxable of Total
Assessee Value (1) Rank Taxable Value (2) Value Rank Taxable Value
Research Properties 5,378$ 1 1.65% 4,729$ 1 1.35%
BM Ventures LLC 4,700 2 1.44% - -
Ramon Canyon Associates LP 2,924 3 0.90% - -
John A/Leta K Nichols 1994 Rev Trust 2,832 4 0.87% 2,491 4 0.71%
Garin Elisa R/ETAL 2,618 5 0.80% - -
US Rentals Inc. 2,526 6 0.78% 2,221 5 0.64%
Proffutt Limited Partnership 2,194 7 0.67% - -
23002 Moulton Parkway LLC 1,842 8 0.57% - -
Terkensha/Associates 1,756 9 0.54% 1,440 9 0.41%
Lundbom Sacramento Realty INVS LP 1,538 10 0.47% - -
Woodhaven Senior Residence - - 3,990 2 1.14%
Lundblom Family Trust - - 3,818 3 1.09%
Lenore Wyatt Living Trust - - 1,965 6 0.56%
Maki Stephen - - 1,923 7 0.55%
Harry G & Mariann Brix 1993 Family Trust - - 1,665 8 0.48%
1980 Tyler Family Trust - - 1,325 10 0.38%
Sub Total 28,308 8.69% 25,567 7.32%
All Other Taxpayers 297,442 91.31% 323,775 92.68%
Total 325,750$ 100.00% 349,342$ 100.00%
Notes: (1) Based on ownership of locally-assessed secured and unsecured real property net of exemptions. (2) Based on total adjusted 2014-15 Project Area total taxable value.
Source: Sacramento County Assessor
City of Sacramento
Principal Property Taxpayers - Del Paso HeightsCurrent Fiscal Year and Nine Years Ago
2015 2006
230
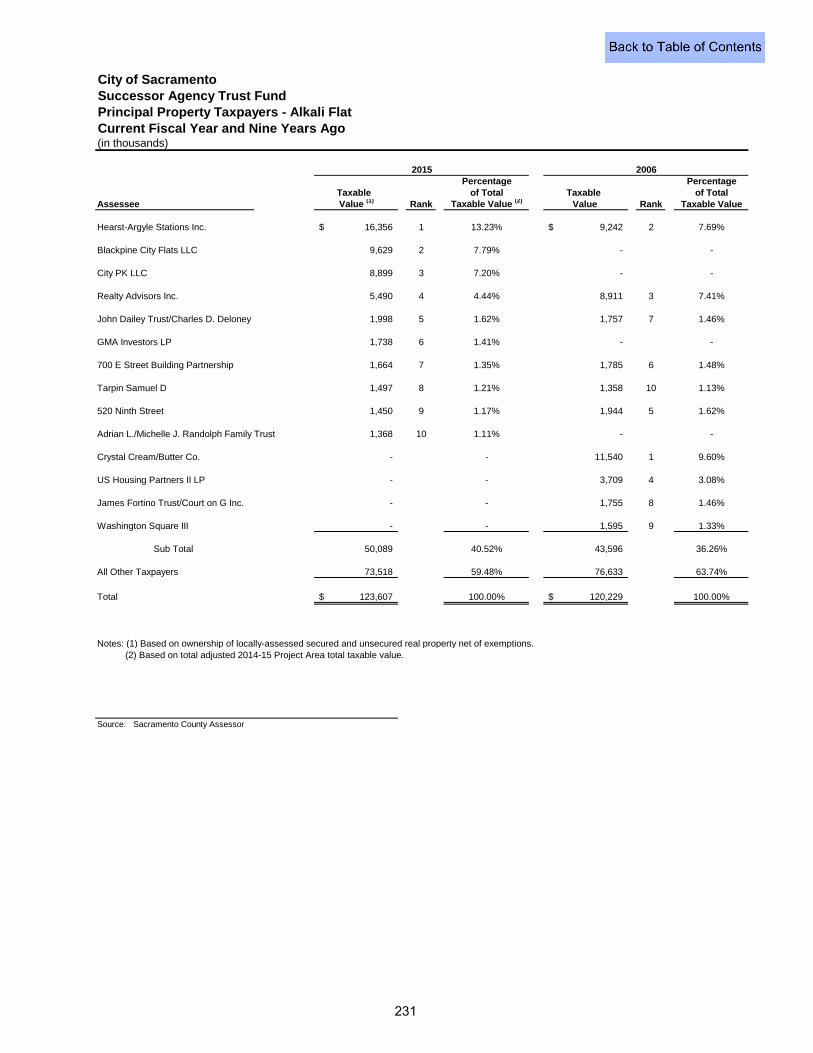
Successor Agency Trust Fund
(in thousands)
Percentage PercentageTaxable of Total Taxable of Total
Assessee Value (1) Rank Taxable Value (2) Value Rank Taxable Value
Hearst-Argyle Stations Inc. 16,356$ 1 13.23% 9,242$ 2 7.69%
Blackpine City Flats LLC 9,629 2 7.79% - -
City PK LLC 8,899 3 7.20% - -
Realty Advisors Inc. 5,490 4 4.44% 8,911 3 7.41%
John Dailey Trust/Charles D. Deloney 1,998 5 1.62% 1,757 7 1.46%
GMA Investors LP 1,738 6 1.41% - -
700 E Street Building Partnership 1,664 7 1.35% 1,785 6 1.48%
Tarpin Samuel D 1,497 8 1.21% 1,358 10 1.13%
520 Ninth Street 1,450 9 1.17% 1,944 5 1.62%
Adrian L./Michelle J. Randolph Family Trust 1,368 10 1.11% - -
Crystal Cream/Butter Co. - - 11,540 1 9.60%
US Housing Partners II LP - - 3,709 4 3.08%
James Fortino Trust/Court on G Inc. - - 1,755 8 1.46%
Washington Square III - - 1,595 9 1.33%
Sub Total 50,089 40.52% 43,596 36.26%
All Other Taxpayers 73,518 59.48% 76,633 63.74%
Total 123,607$ 100.00% 120,229$ 100.00%
Notes: (1) Based on ownership of locally-assessed secured and unsecured real property net of exemptions. (2) Based on total adjusted 2014-15 Project Area total taxable value.
Source: Sacramento County Assessor
City of Sacramento
Principal Property Taxpayers - Alkali FlatCurrent Fiscal Year and Nine Years Ago
2015 2006
231
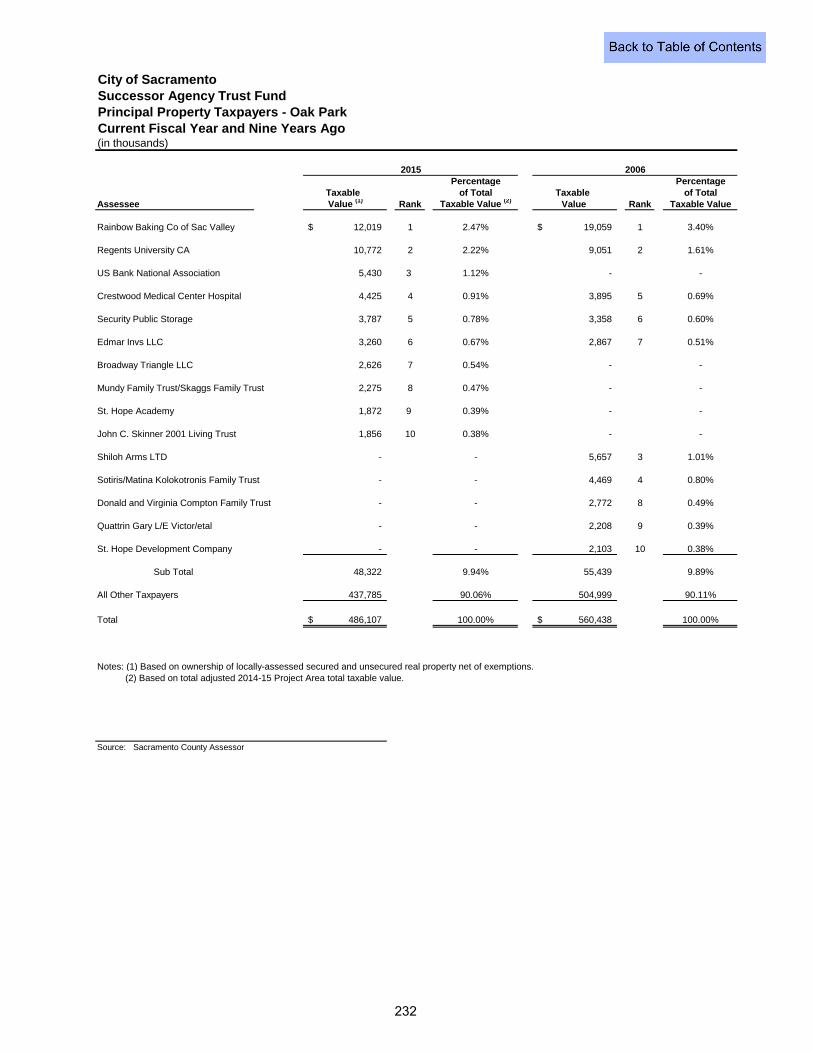
Successor Agency Trust Fund
(in thousands)
Percentage PercentageTaxable of Total Taxable of Total
Assessee Value (1) Rank Taxable Value (2) Value Rank Taxable Value
Rainbow Baking Co of Sac Valley 12,019$ 1 2.47% 19,059$ 1 3.40%
Regents University CA 10,772 2 2.22% 9,051 2 1.61%
US Bank National Association 5,430 3 1.12% - -
Crestwood Medical Center Hospital 4,425 4 0.91% 3,895 5 0.69%
Security Public Storage 3,787 5 0.78% 3,358 6 0.60%
Edmar Invs LLC 3,260 6 0.67% 2,867 7 0.51%
Broadway Triangle LLC 2,626 7 0.54% - -
Mundy Family Trust/Skaggs Family Trust 2,275 8 0.47% - -
St. Hope Academy 1,872 9 0.39% - -
John C. Skinner 2001 Living Trust 1,856 10 0.38% - -
Shiloh Arms LTD - - 5,657 3 1.01%
Sotiris/Matina Kolokotronis Family Trust - - 4,469 4 0.80%
Donald and Virginia Compton Family Trust - - 2,772 8 0.49%
Quattrin Gary L/E Victor/etal - - 2,208 9 0.39%
St. Hope Development Company - - 2,103 10 0.38%
Sub Total 48,322 9.94% 55,439 9.89%
All Other Taxpayers 437,785 90.06% 504,999 90.11%
Total 486,107$ 100.00% 560,438$ 100.00%
Notes: (1) Based on ownership of locally-assessed secured and unsecured real property net of exemptions. (2) Based on total adjusted 2014-15 Project Area total taxable value.
Source: Sacramento County Assessor
City of Sacramento
Principal Property Taxpayers - Oak ParkCurrent Fiscal Year and Nine Years Ago
2015 2006
232
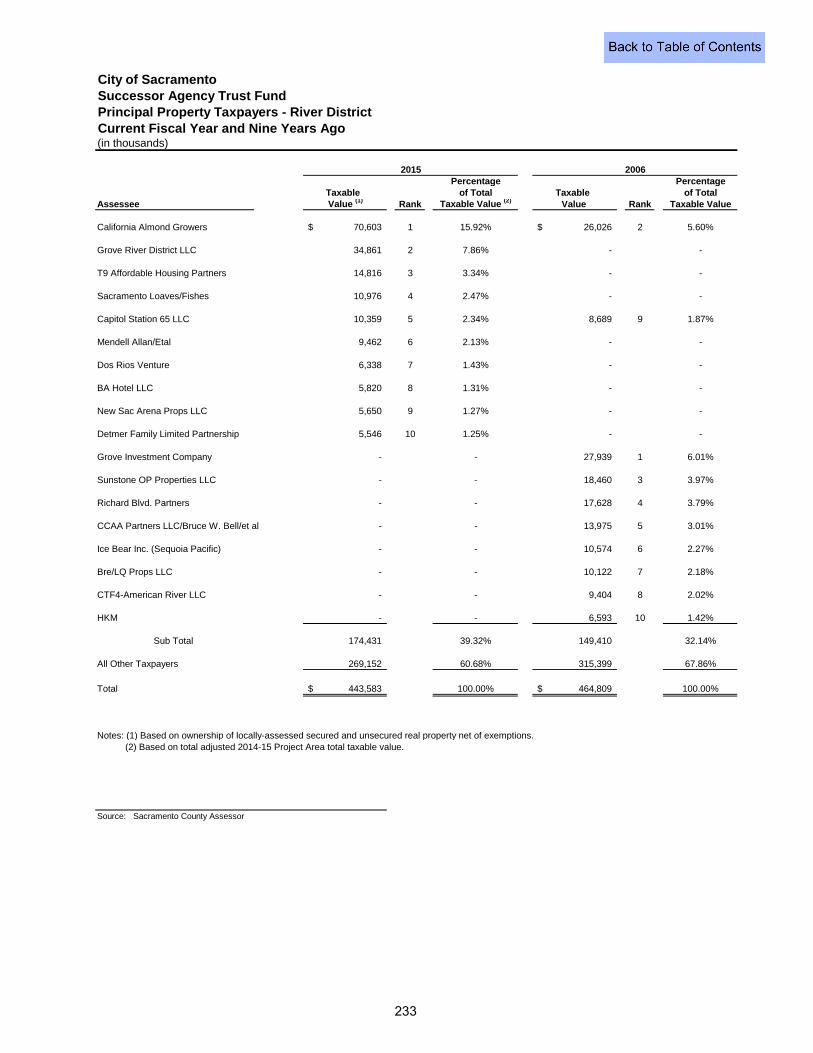
Successor Agency Trust Fund
(in thousands)
Percentage PercentageTaxable of Total Taxable of Total
Assessee Value (1) Rank Taxable Value (2) Value Rank Taxable Value
California Almond Growers 70,603$ 1 15.92% 26,026$ 2 5.60%
Grove River District LLC 34,861 2 7.86% - -
T9 Affordable Housing Partners 14,816 3 3.34% - -
Sacramento Loaves/Fishes 10,976 4 2.47% - -
Capitol Station 65 LLC 10,359 5 2.34% 8,689 9 1.87%
Mendell Allan/Etal 9,462 6 2.13% - -
Dos Rios Venture 6,338 7 1.43% - -
BA Hotel LLC 5,820 8 1.31% - -
New Sac Arena Props LLC 5,650 9 1.27% - -
Detmer Family Limited Partnership 5,546 10 1.25% - -
Grove Investment Company - - 27,939 1 6.01%
Sunstone OP Properties LLC - - 18,460 3 3.97%
Richard Blvd. Partners - - 17,628 4 3.79%
CCAA Partners LLC/Bruce W. Bell/et al - - 13,975 5 3.01%
Ice Bear Inc. (Sequoia Pacific) - - 10,574 6 2.27%
Bre/LQ Props LLC - - 10,122 7 2.18%
CTF4-American River LLC - - 9,404 8 2.02%
HKM - - 6,593 10 1.42%
Sub Total 174,431 39.32% 149,410 32.14%
All Other Taxpayers 269,152 60.68% 315,399 67.86%
Total 443,583$ 100.00% 464,809$ 100.00%
Notes: (1) Based on ownership of locally-assessed secured and unsecured real property net of exemptions. (2) Based on total adjusted 2014-15 Project Area total taxable value.
Source: Sacramento County Assessor
City of Sacramento
Principal Property Taxpayers - River DistrictCurrent Fiscal Year and Nine Years Ago
2015 2006
233
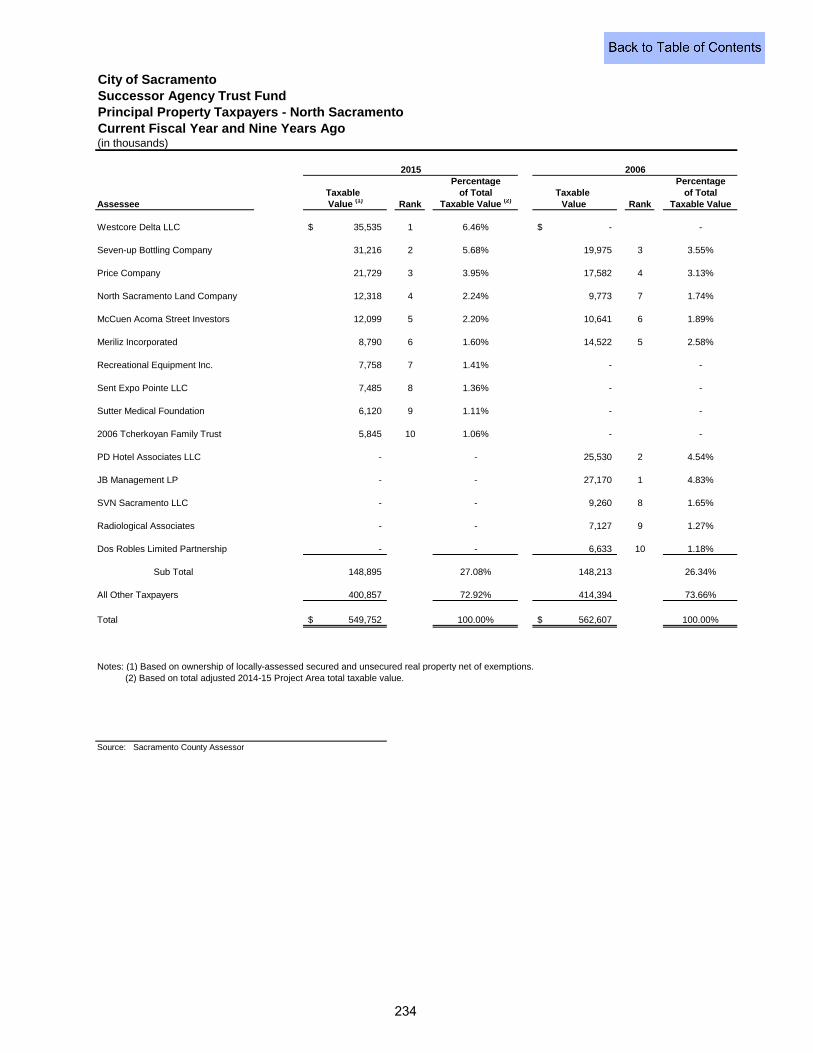
Successor Agency Trust Fund
(in thousands)
Percentage PercentageTaxable of Total Taxable of Total
Assessee Value (1) Rank Taxable Value (2) Value Rank Taxable Value
Westcore Delta LLC 35,535$ 1 6.46% -$ -
Seven-up Bottling Company 31,216 2 5.68% 19,975 3 3.55%
Price Company 21,729 3 3.95% 17,582 4 3.13%
North Sacramento Land Company 12,318 4 2.24% 9,773 7 1.74%
McCuen Acoma Street Investors 12,099 5 2.20% 10,641 6 1.89%
Meriliz Incorporated 8,790 6 1.60% 14,522 5 2.58%
Recreational Equipment Inc. 7,758 7 1.41% - -
Sent Expo Pointe LLC 7,485 8 1.36% - -
Sutter Medical Foundation 6,120 9 1.11% - -
2006 Tcherkoyan Family Trust 5,845 10 1.06% - -
PD Hotel Associates LLC - - 25,530 2 4.54%
JB Management LP - - 27,170 1 4.83%
SVN Sacramento LLC - - 9,260 8 1.65%
Radiological Associates - - 7,127 9 1.27%
Dos Robles Limited Partnership - - 6,633 10 1.18%
Sub Total 148,895 27.08% 148,213 26.34%
All Other Taxpayers 400,857 72.92% 414,394 73.66%
Total 549,752$ 100.00% 562,607$ 100.00%
Notes: (1) Based on ownership of locally-assessed secured and unsecured real property net of exemptions. (2) Based on total adjusted 2014-15 Project Area total taxable value.
Source: Sacramento County Assessor
City of Sacramento
Principal Property Taxpayers - North SacramentoCurrent Fiscal Year and Nine Years Ago
2015 2006
234
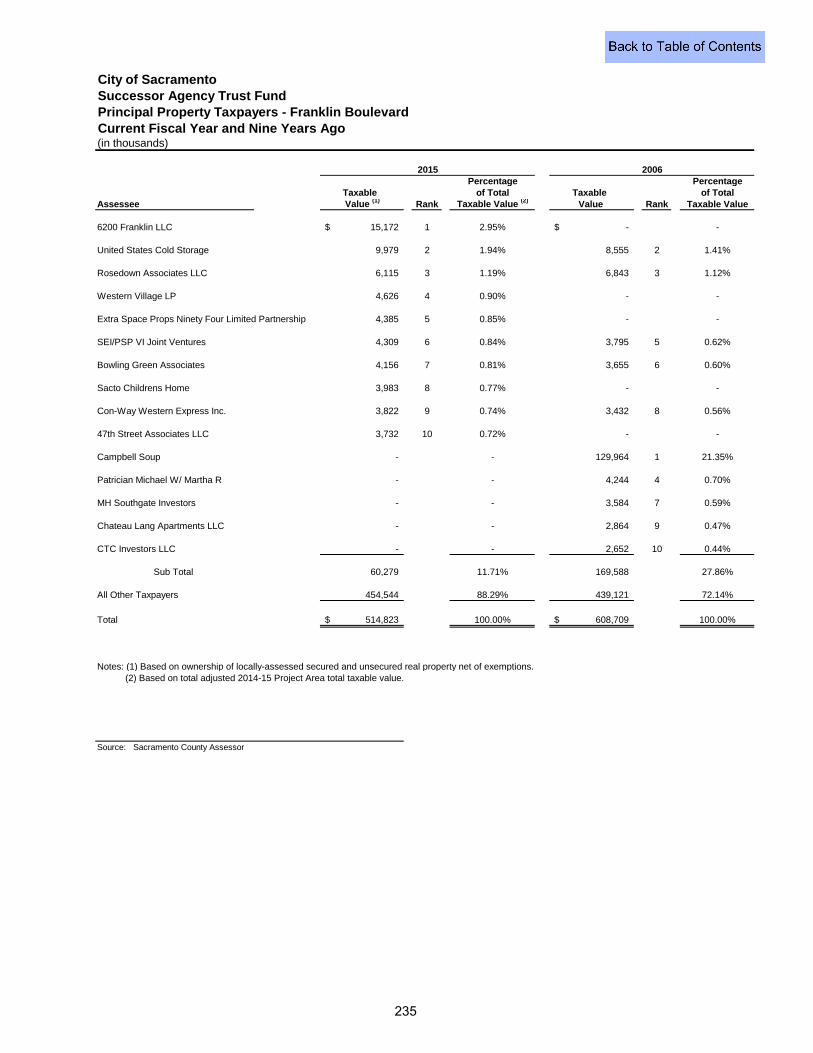
Successor Agency Trust Fund
(in thousands)
Percentage PercentageTaxable of Total Taxable of Total
Assessee Value (1) Rank Taxable Value (2) Value Rank Taxable Value
6200 Franklin LLC 15,172$ 1 2.95% -$ -
United States Cold Storage 9,979 2 1.94% 8,555 2 1.41%
Rosedown Associates LLC 6,115 3 1.19% 6,843 3 1.12%
Western Village LP 4,626 4 0.90% - -
Extra Space Props Ninety Four Limited Partnership 4,385 5 0.85% - -
SEI/PSP VI Joint Ventures 4,309 6 0.84% 3,795 5 0.62%
Bowling Green Associates 4,156 7 0.81% 3,655 6 0.60%
Sacto Childrens Home 3,983 8 0.77% - -
Con-Way Western Express Inc. 3,822 9 0.74% 3,432 8 0.56%
47th Street Associates LLC 3,732 10 0.72% - -
Campbell Soup - - 129,964 1 21.35%
Patrician Michael W/ Martha R - - 4,244 4 0.70%
MH Southgate Investors - - 3,584 7 0.59%
Chateau Lang Apartments LLC - - 2,864 9 0.47%
CTC Investors LLC - - 2,652 10 0.44%
Sub Total 60,279 11.71% 169,588 27.86%
All Other Taxpayers 454,544 88.29% 439,121 72.14%
Total 514,823$ 100.00% 608,709$ 100.00%
Notes: (1) Based on ownership of locally-assessed secured and unsecured real property net of exemptions. (2) Based on total adjusted 2014-15 Project Area total taxable value.
Source: Sacramento County Assessor
City of Sacramento
Principal Property Taxpayers - Franklin BoulevardCurrent Fiscal Year and Nine Years Ago
2015 2006
235
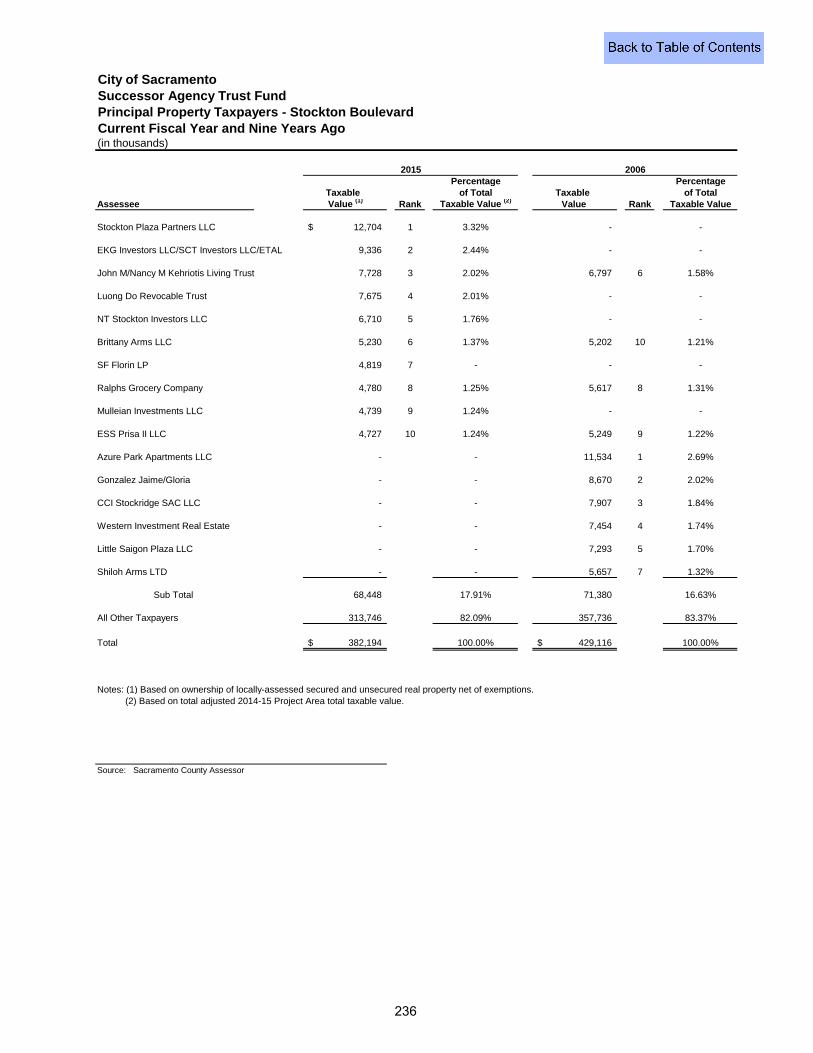
Successor Agency Trust Fund
(in thousands)
Percentage PercentageTaxable of Total Taxable of Total
Assessee Value (1) Rank Taxable Value (2) Value Rank Taxable Value
Stockton Plaza Partners LLC 12,704$ 1 3.32% - -
EKG Investors LLC/SCT Investors LLC/ETAL 9,336 2 2.44% - -
John M/Nancy M Kehriotis Living Trust 7,728 3 2.02% 6,797 6 1.58%
Luong Do Revocable Trust 7,675 4 2.01% - -
NT Stockton Investors LLC 6,710 5 1.76% - -
Brittany Arms LLC 5,230 6 1.37% 5,202 10 1.21%
SF Florin LP 4,819 7 - - -
Ralphs Grocery Company 4,780 8 1.25% 5,617 8 1.31%
Mulleian Investments LLC 4,739 9 1.24% - -
ESS Prisa II LLC 4,727 10 1.24% 5,249 9 1.22%
Azure Park Apartments LLC - - 11,534 1 2.69%
Gonzalez Jaime/Gloria - - 8,670 2 2.02%
CCI Stockridge SAC LLC - - 7,907 3 1.84%
Western Investment Real Estate - - 7,454 4 1.74%
Little Saigon Plaza LLC - - 7,293 5 1.70%
Shiloh Arms LTD - - 5,657 7 1.32%
Sub Total 68,448 17.91% 71,380 16.63%
All Other Taxpayers 313,746 82.09% 357,736 83.37%
Total 382,194$ 100.00% 429,116$ 100.00%
Notes: (1) Based on ownership of locally-assessed secured and unsecured real property net of exemptions. (2) Based on total adjusted 2014-15 Project Area total taxable value.
Source: Sacramento County Assessor
City of Sacramento
Principal Property Taxpayers - Stockton BoulevardCurrent Fiscal Year and Nine Years Ago
2015 2006
236
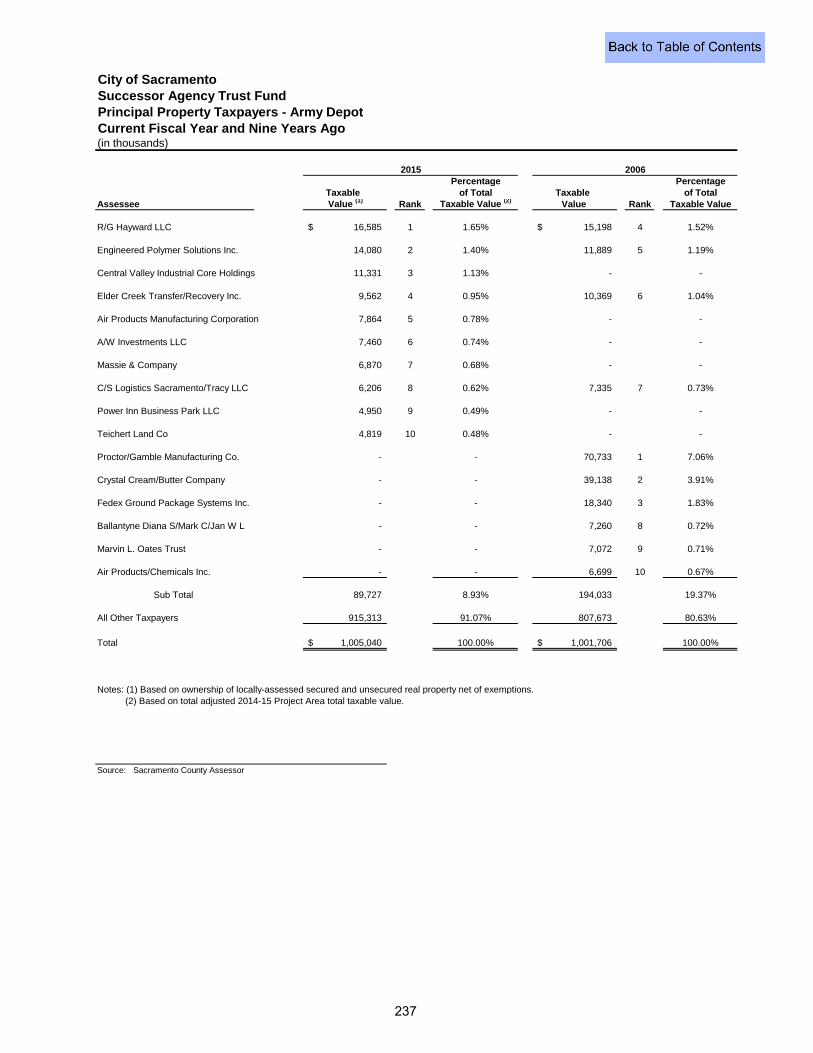
Successor Agency Trust Fund
(in thousands)
Percentage PercentageTaxable of Total Taxable of Total
Assessee Value (1) Rank Taxable Value (2) Value Rank Taxable Value
R/G Hayward LLC 16,585$ 1 1.65% 15,198$ 4 1.52%
Engineered Polymer Solutions Inc. 14,080 2 1.40% 11,889 5 1.19%
Central Valley Industrial Core Holdings 11,331 3 1.13% - -
Elder Creek Transfer/Recovery Inc. 9,562 4 0.95% 10,369 6 1.04%
Air Products Manufacturing Corporation 7,864 5 0.78% - -
A/W Investments LLC 7,460 6 0.74% - -
Massie & Company 6,870 7 0.68% - -
C/S Logistics Sacramento/Tracy LLC 6,206 8 0.62% 7,335 7 0.73%
Power Inn Business Park LLC 4,950 9 0.49% - -
Teichert Land Co 4,819 10 0.48% - -
Proctor/Gamble Manufacturing Co. - - 70,733 1 7.06%
Crystal Cream/Butter Company - - 39,138 2 3.91%
Fedex Ground Package Systems Inc. - - 18,340 3 1.83%
Ballantyne Diana S/Mark C/Jan W L - - 7,260 8 0.72%
Marvin L. Oates Trust - - 7,072 9 0.71%
Air Products/Chemicals Inc. - - 6,699 10 0.67%
Sub Total 89,727 8.93% 194,033 19.37%
All Other Taxpayers 915,313 91.07% 807,673 80.63%
Total 1,005,040$ 100.00% 1,001,706$ 100.00%
Notes: (1) Based on ownership of locally-assessed secured and unsecured real property net of exemptions. (2) Based on total adjusted 2014-15 Project Area total taxable value.
Source: Sacramento County Assessor
City of Sacramento
Principal Property Taxpayers - Army DepotCurrent Fiscal Year and Nine Years Ago
2015 2006
237
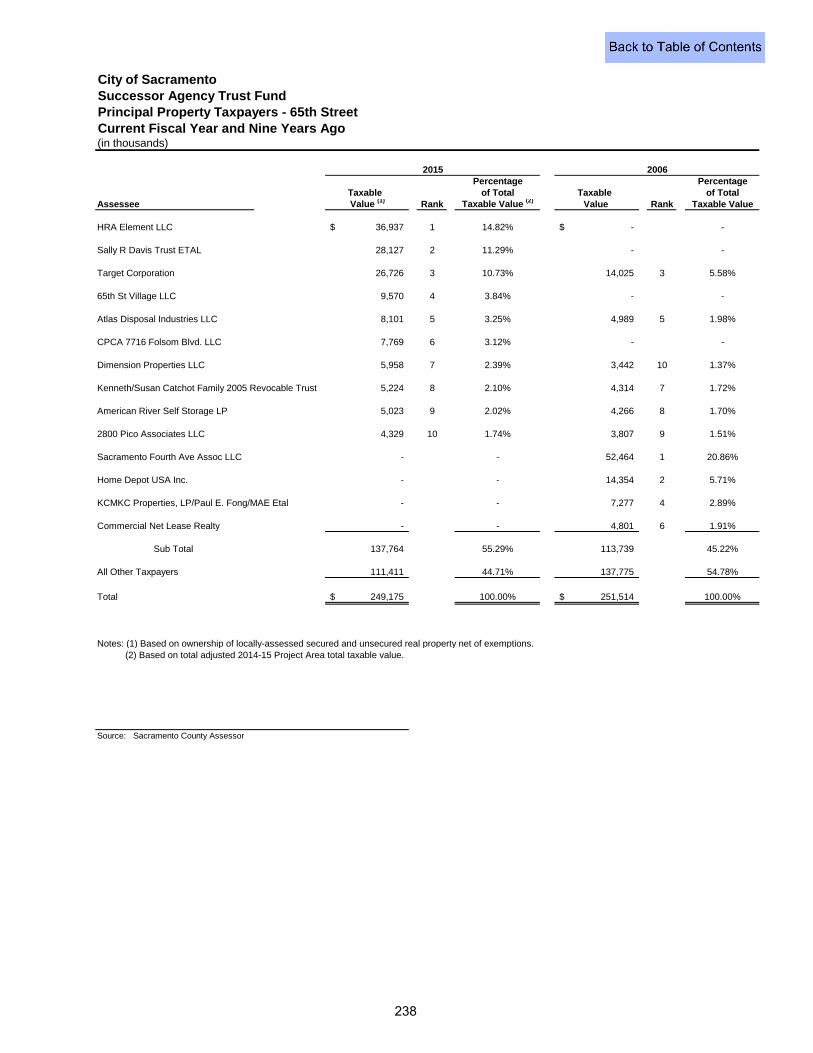
Successor Agency Trust Fund
(in thousands)
Percentage PercentageTaxable of Total Taxable of Total
Assessee Value (1) Rank Taxable Value (2) Value Rank Taxable Value
HRA Element LLC 36,937$ 1 14.82% -$ -
Sally R Davis Trust ETAL 28,127 2 11.29% - -
Target Corporation 26,726 3 10.73% 14,025 3 5.58%
65th St Village LLC 9,570 4 3.84% - -
Atlas Disposal Industries LLC 8,101 5 3.25% 4,989 5 1.98%
CPCA 7716 Folsom Blvd. LLC 7,769 6 3.12% - -
Dimension Properties LLC 5,958 7 2.39% 3,442 10 1.37%
Kenneth/Susan Catchot Family 2005 Revocable Trust 5,224 8 2.10% 4,314 7 1.72%
American River Self Storage LP 5,023 9 2.02% 4,266 8 1.70%
2800 Pico Associates LLC 4,329 10 1.74% 3,807 9 1.51%
Sacramento Fourth Ave Assoc LLC - - 52,464 1 20.86%
Home Depot USA Inc. - - 14,354 2 5.71%
KCMKC Properties, LP/Paul E. Fong/MAE Etal - - 7,277 4 2.89%
Commercial Net Lease Realty - - 4,801 6 1.91%
Sub Total 137,764 55.29% 113,739 45.22%
All Other Taxpayers 111,411 44.71% 137,775 54.78%
Total 249,175$ 100.00% 251,514$ 100.00%
Notes: (1) Based on ownership of locally-assessed secured and unsecured real property net of exemptions. (2) Based on total adjusted 2014-15 Project Area total taxable value.
Source: Sacramento County Assessor
City of Sacramento
Principal Property Taxpayers - 65th StreetCurrent Fiscal Year and Nine Years Ago
2015 2006
238
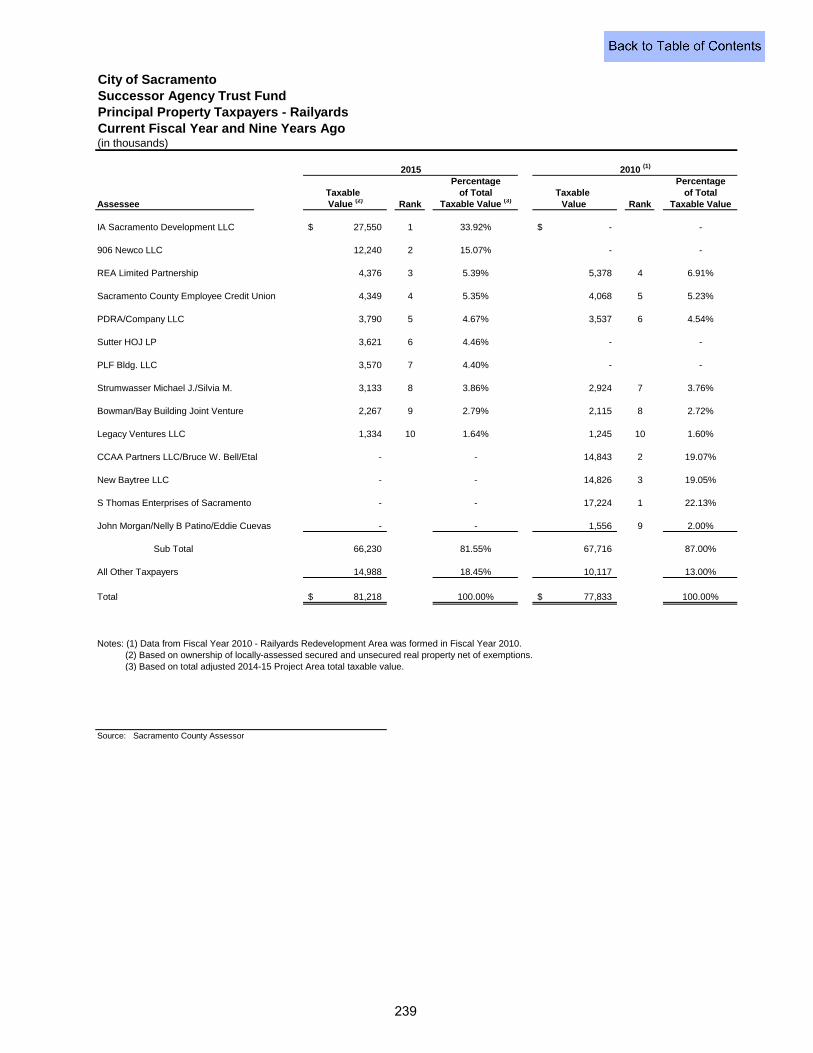
Successor Agency Trust Fund
(in thousands)
Percentage PercentageTaxable of Total Taxable of Total
Assessee Value (2) Rank Taxable Value (3) Value Rank Taxable Value
IA Sacramento Development LLC 27,550$ 1 33.92% -$ -
906 Newco LLC 12,240 2 15.07% - -
REA Limited Partnership 4,376 3 5.39% 5,378 4 6.91%
Sacramento County Employee Credit Union 4,349 4 5.35% 4,068 5 5.23%
PDRA/Company LLC 3,790 5 4.67% 3,537 6 4.54%
Sutter HOJ LP 3,621 6 4.46% - -
PLF Bldg. LLC 3,570 7 4.40% - -
Strumwasser Michael J./Silvia M. 3,133 8 3.86% 2,924 7 3.76%
Bowman/Bay Building Joint Venture 2,267 9 2.79% 2,115 8 2.72%
Legacy Ventures LLC 1,334 10 1.64% 1,245 10 1.60%
CCAA Partners LLC/Bruce W. Bell/Etal - - 14,843 2 19.07%
New Baytree LLC - - 14,826 3 19.05%
S Thomas Enterprises of Sacramento - - 17,224 1 22.13%
John Morgan/Nelly B Patino/Eddie Cuevas - - 1,556 9 2.00%
Sub Total 66,230 81.55% 67,716 87.00%
All Other Taxpayers 14,988 18.45% 10,117 13.00%
Total 81,218$ 100.00% 77,833$ 100.00%
(2) Based on ownership of locally-assessed secured and unsecured real property net of exemptions. (3) Based on total adjusted 2014-15 Project Area total taxable value.
Source: Sacramento County Assessor
Notes: (1) Data from Fiscal Year 2010 - Railyards Redevelopment Area was formed in Fiscal Year 2010.
City of Sacramento
Principal Property Taxpayers - RailyardsCurrent Fiscal Year and Nine Years Ago
2015 2010 (1)
239
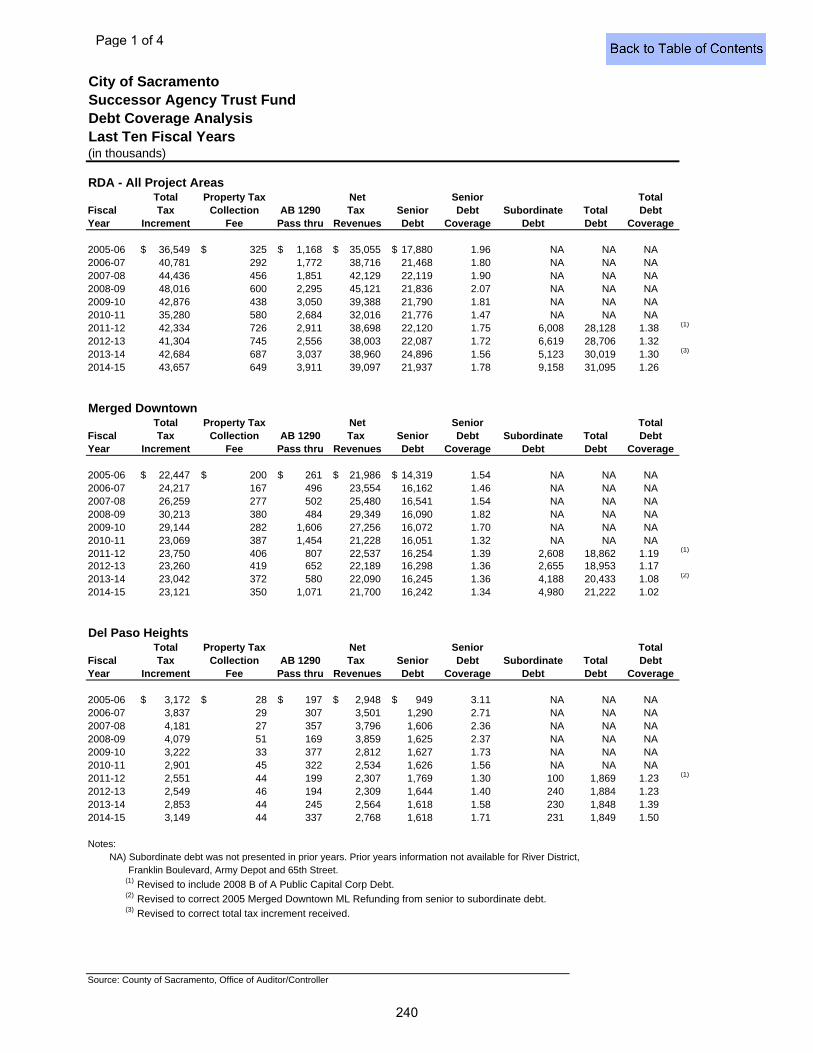
Successor Agency Trust Fund
(in thousands)
RDA - All Project AreasTotal Property Tax Net Senior Total
Fiscal Tax Collection AB 1290 Tax Senior Debt Subordinate Total DebtYear Increment Fee Pass thru Revenues Debt Coverage Debt Debt Coverage
2005-06 36,549$ 325$ 1,168$ 35,055$ 17,880$ 1.96 NA NA NA2006-07 40,781 292 1,772 38,716 21,468 1.80 NA NA NA2007-08 44,436 456 1,851 42,129 22,119 1.90 NA NA NA2008-09 48,016 600 2,295 45,121 21,836 2.07 NA NA NA2009-10 42,876 438 3,050 39,388 21,790 1.81 NA NA NA2010-11 35,280 580 2,684 32,016 21,776 1.47 NA NA NA2011-12 42,334 726 2,911 38,698 22,120 1.75 6,008 28,128 1.38 (1)
2012-13 41,304 745 2,556 38,003 22,087 1.72 6,619 28,706 1.322013-14 42,684 687 3,037 38,960 24,896 1.56 5,123 30,019 1.30 (3)
2014-15 43,657 649 3,911 39,097 21,937 1.78 9,158 31,095 1.26
Merged DowntownTotal Property Tax Net Senior Total
Fiscal Tax Collection AB 1290 Tax Senior Debt Subordinate Total DebtYear Increment Fee Pass thru Revenues Debt Coverage Debt Debt Coverage
2005-06 22,447$ 200$ 261$ 21,986$ 14,319$ 1.54 NA NA NA2006-07 24,217 167 496 23,554 16,162 1.46 NA NA NA2007-08 26,259 277 502 25,480 16,541 1.54 NA NA NA2008-09 30,213 380 484 29,349 16,090 1.82 NA NA NA2009-10 29,144 282 1,606 27,256 16,072 1.70 NA NA NA2010-11 23,069 387 1,454 21,228 16,051 1.32 NA NA NA2011-12 23,750 406 807 22,537 16,254 1.39 2,608 18,862 1.19 (1)
2012-13 23,260 419 652 22,189 16,298 1.36 2,655 18,953 1.172013-14 23,042 372 580 22,090 16,245 1.36 4,188 20,433 1.08 (2)
2014-15 23,121 350 1,071 21,700 16,242 1.34 4,980 21,222 1.02
Del Paso HeightsTotal Property Tax Net Senior Total
Fiscal Tax Collection AB 1290 Tax Senior Debt Subordinate Total DebtYear Increment Fee Pass thru Revenues Debt Coverage Debt Debt Coverage
2005-06 3,172$ 28$ 197$ 2,948$ 949$ 3.11 NA NA NA2006-07 3,837 29 307 3,501 1,290 2.71 NA NA NA2007-08 4,181 27 357 3,796 1,606 2.36 NA NA NA2008-09 4,079 51 169 3,859 1,625 2.37 NA NA NA2009-10 3,222 33 377 2,812 1,627 1.73 NA NA NA2010-11 2,901 45 322 2,534 1,626 1.56 NA NA NA2011-12 2,551 44 199 2,307 1,769 1.30 100 1,869 1.23 (1)
2012-13 2,549 46 194 2,309 1,644 1.40 240 1,884 1.232013-14 2,853 44 245 2,564 1,618 1.58 230 1,848 1.392014-15 3,149 44 337 2,768 1,618 1.71 231 1,849 1.50
Notes: NA) Subordinate debt was not presented in prior years. Prior years information not available for River District,
Franklin Boulevard, Army Depot and 65th Street.(1) Revised to include 2008 B of A Public Capital Corp Debt.(2) Revised to correct 2005 Merged Downtown ML Refunding from senior to subordinate debt. (3) Revised to correct total tax increment received.
Source: County of Sacramento, Office of Auditor/Controller
City of Sacramento
Debt Coverage AnalysisLast Ten Fiscal Years
Page 1 of 4
240
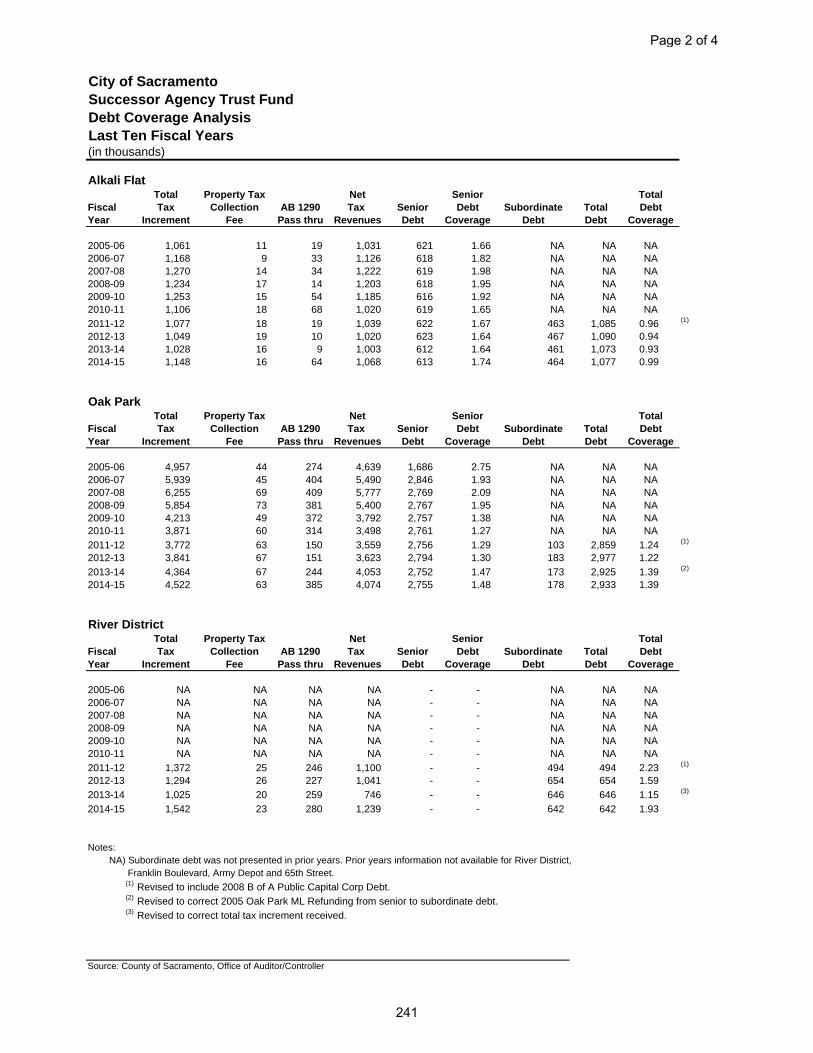
Successor Agency Trust Fund
(in thousands)
Alkali FlatTotal Property Tax Net Senior Total
Fiscal Tax Collection AB 1290 Tax Senior Debt Subordinate Total DebtYear Increment Fee Pass thru Revenues Debt Coverage Debt Debt Coverage
2005-06 1,061 11 19 1,031 621 1.66 NA NA NA2006-07 1,168 9 33 1,126 618 1.82 NA NA NA2007-08 1,270 14 34 1,222 619 1.98 NA NA NA2008-09 1,234 17 14 1,203 618 1.95 NA NA NA2009-10 1,253 15 54 1,185 616 1.92 NA NA NA2010-11 1,106 18 68 1,020 619 1.65 NA NA NA
2011-12 1,077 18 19 1,039 622 1.67 463 1,085 0.96 (1)
2012-13 1,049 19 10 1,020 623 1.64 467 1,090 0.942013-14 1,028 16 9 1,003 612 1.64 461 1,073 0.932014-15 1,148 16 64 1,068 613 1.74 464 1,077 0.99
Oak ParkTotal Property Tax Net Senior Total
Fiscal Tax Collection AB 1290 Tax Senior Debt Subordinate Total DebtYear Increment Fee Pass thru Revenues Debt Coverage Debt Debt Coverage
2005-06 4,957 44 274 4,639 1,686 2.75 NA NA NA2006-07 5,939 45 404 5,490 2,846 1.93 NA NA NA2007-08 6,255 69 409 5,777 2,769 2.09 NA NA NA2008-09 5,854 73 381 5,400 2,767 1.95 NA NA NA2009-10 4,213 49 372 3,792 2,757 1.38 NA NA NA2010-11 3,871 60 314 3,498 2,761 1.27 NA NA NA
2011-12 3,772 63 150 3,559 2,756 1.29 103 2,859 1.24 (1)
2012-13 3,841 67 151 3,623 2,794 1.30 183 2,977 1.22
2013-14 4,364 67 244 4,053 2,752 1.47 173 2,925 1.39 (2)
2014-15 4,522 63 385 4,074 2,755 1.48 178 2,933 1.39
River DistrictTotal Property Tax Net Senior Total
Fiscal Tax Collection AB 1290 Tax Senior Debt Subordinate Total DebtYear Increment Fee Pass thru Revenues Debt Coverage Debt Debt Coverage
2005-06 NA NA NA NA - - NA NA NA2006-07 NA NA NA NA - - NA NA NA2007-08 NA NA NA NA - - NA NA NA2008-09 NA NA NA NA - - NA NA NA2009-10 NA NA NA NA - - NA NA NA2010-11 NA NA NA NA - - NA NA NA
2011-12 1,372 25 246 1,100 - - 494 494 2.23 (1)
2012-13 1,294 26 227 1,041 - - 654 654 1.59
2013-14 1,025 20 259 746 - - 646 646 1.15 (3)
2014-15 1,542 23 280 1,239 - - 642 642 1.93
Notes: NA) Subordinate debt was not presented in prior years. Prior years information not available for River District,
Franklin Boulevard, Army Depot and 65th Street.(1) Revised to include 2008 B of A Public Capital Corp Debt.(2) Revised to correct 2005 Oak Park ML Refunding from senior to subordinate debt. (3) Revised to correct total tax increment received.
Source: County of Sacramento, Office of Auditor/Controller
City of Sacramento
Debt Coverage AnalysisLast Ten Fiscal Years
Page 2 of 4
241
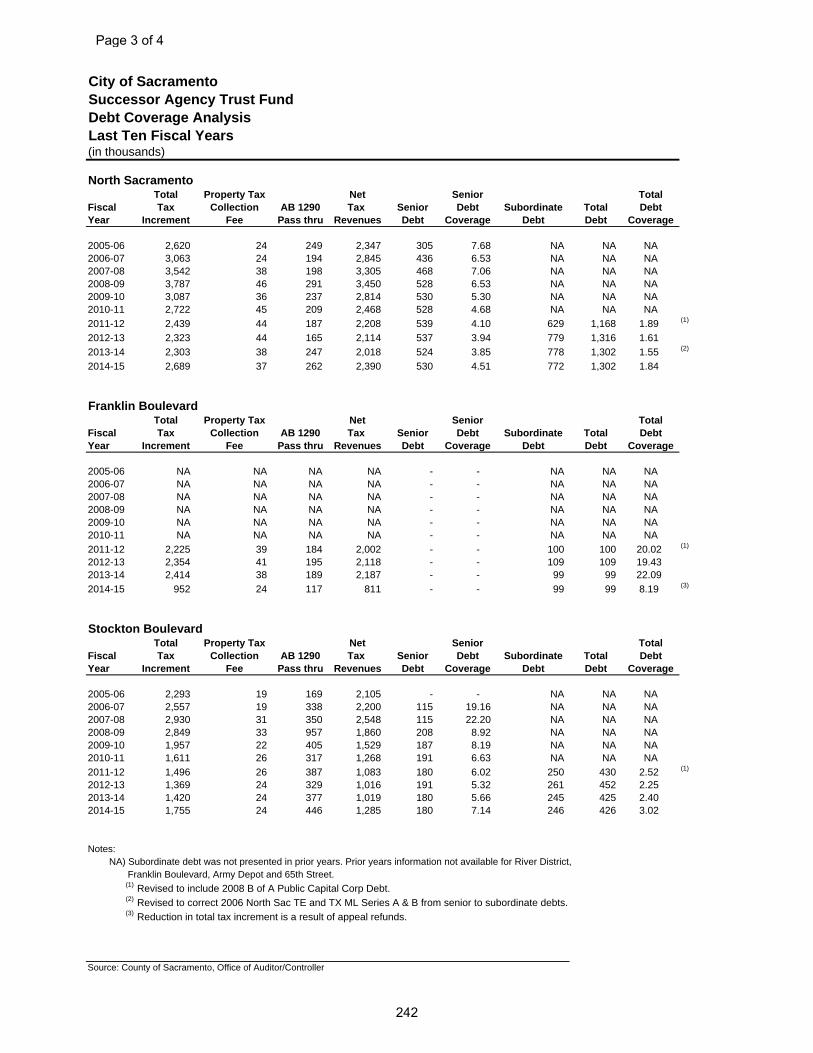
Successor Agency Trust Fund
(in thousands)
North SacramentoTotal Property Tax Net Senior Total
Fiscal Tax Collection AB 1290 Tax Senior Debt Subordinate Total DebtYear Increment Fee Pass thru Revenues Debt Coverage Debt Debt Coverage
2005-06 2,620 24 249 2,347 305 7.68 NA NA NA2006-07 3,063 24 194 2,845 436 6.53 NA NA NA2007-08 3,542 38 198 3,305 468 7.06 NA NA NA2008-09 3,787 46 291 3,450 528 6.53 NA NA NA2009-10 3,087 36 237 2,814 530 5.30 NA NA NA2010-11 2,722 45 209 2,468 528 4.68 NA NA NA
2011-12 2,439 44 187 2,208 539 4.10 629 1,168 1.89 (1)
2012-13 2,323 44 165 2,114 537 3.94 779 1,316 1.61
2013-14 2,303 38 247 2,018 524 3.85 778 1,302 1.55 (2)
2014-15 2,689 37 262 2,390 530 4.51 772 1,302 1.84
Franklin BoulevardTotal Property Tax Net Senior Total
Fiscal Tax Collection AB 1290 Tax Senior Debt Subordinate Total DebtYear Increment Fee Pass thru Revenues Debt Coverage Debt Debt Coverage
2005-06 NA NA NA NA - - NA NA NA2006-07 NA NA NA NA - - NA NA NA2007-08 NA NA NA NA - - NA NA NA2008-09 NA NA NA NA - - NA NA NA2009-10 NA NA NA NA - - NA NA NA2010-11 NA NA NA NA - - NA NA NA
2011-12 2,225 39 184 2,002 - - 100 100 20.02 (1)
2012-13 2,354 41 195 2,118 - - 109 109 19.432013-14 2,414 38 189 2,187 - - 99 99 22.09
2014-15 952 24 117 811 - - 99 99 8.19 (3)
Stockton BoulevardTotal Property Tax Net Senior Total
Fiscal Tax Collection AB 1290 Tax Senior Debt Subordinate Total DebtYear Increment Fee Pass thru Revenues Debt Coverage Debt Debt Coverage
2005-06 2,293 19 169 2,105 - - NA NA NA2006-07 2,557 19 338 2,200 115 19.16 NA NA NA2007-08 2,930 31 350 2,548 115 22.20 NA NA NA2008-09 2,849 33 957 1,860 208 8.92 NA NA NA2009-10 1,957 22 405 1,529 187 8.19 NA NA NA2010-11 1,611 26 317 1,268 191 6.63 NA NA NA
2011-12 1,496 26 387 1,083 180 6.02 250 430 2.52 (1)
2012-13 1,369 24 329 1,016 191 5.32 261 452 2.252013-14 1,420 24 377 1,019 180 5.66 245 425 2.402014-15 1,755 24 446 1,285 180 7.14 246 426 3.02
Notes: NA) Subordinate debt was not presented in prior years. Prior years information not available for River District,
Franklin Boulevard, Army Depot and 65th Street.(1) Revised to include 2008 B of A Public Capital Corp Debt.(2) Revised to correct 2006 North Sac TE and TX ML Series A & B from senior to subordinate debts. (3) Reduction in total tax increment is a result of appeal refunds.
Source: County of Sacramento, Office of Auditor/Controller
City of Sacramento
Debt Coverage AnalysisLast Ten Fiscal Years
Page 3 of 4
242
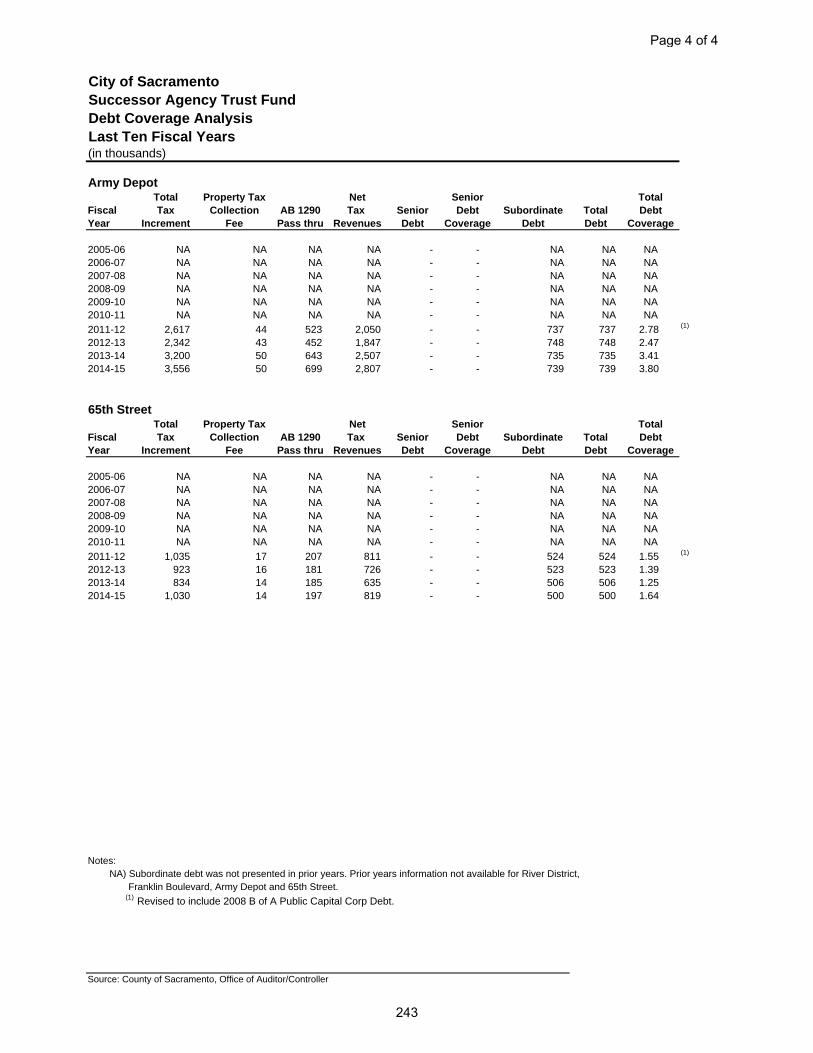
Successor Agency Trust Fund
(in thousands)
Army DepotTotal Property Tax Net Senior Total
Fiscal Tax Collection AB 1290 Tax Senior Debt Subordinate Total DebtYear Increment Fee Pass thru Revenues Debt Coverage Debt Debt Coverage
2005-06 NA NA NA NA - - NA NA NA2006-07 NA NA NA NA - - NA NA NA2007-08 NA NA NA NA - - NA NA NA2008-09 NA NA NA NA - - NA NA NA2009-10 NA NA NA NA - - NA NA NA2010-11 NA NA NA NA - - NA NA NA
2011-12 2,617 44 523 2,050 - - 737 737 2.78 (1)
2012-13 2,342 43 452 1,847 - - 748 748 2.472013-14 3,200 50 643 2,507 - - 735 735 3.412014-15 3,556 50 699 2,807 - - 739 739 3.80
65th StreetTotal Property Tax Net Senior Total
Fiscal Tax Collection AB 1290 Tax Senior Debt Subordinate Total DebtYear Increment Fee Pass thru Revenues Debt Coverage Debt Debt Coverage
2005-06 NA NA NA NA - - NA NA NA2006-07 NA NA NA NA - - NA NA NA2007-08 NA NA NA NA - - NA NA NA2008-09 NA NA NA NA - - NA NA NA2009-10 NA NA NA NA - - NA NA NA2010-11 NA NA NA NA - - NA NA NA
2011-12 1,035 17 207 811 - - 524 524 1.55 (1)
2012-13 923 16 181 726 - - 523 523 1.392013-14 834 14 185 635 - - 506 506 1.252014-15 1,030 14 197 819 - - 500 500 1.64
Notes: NA) Subordinate debt was not presented in prior years. Prior years information not available for River District,
Franklin Boulevard, Army Depot and 65th Street.(1) Revised to include 2008 B of A Public Capital Corp Debt.
Source: County of Sacramento, Office of Auditor/Controller
City of Sacramento
Debt Coverage AnalysisLast Ten Fiscal Years
Page 4 of 4
243
244
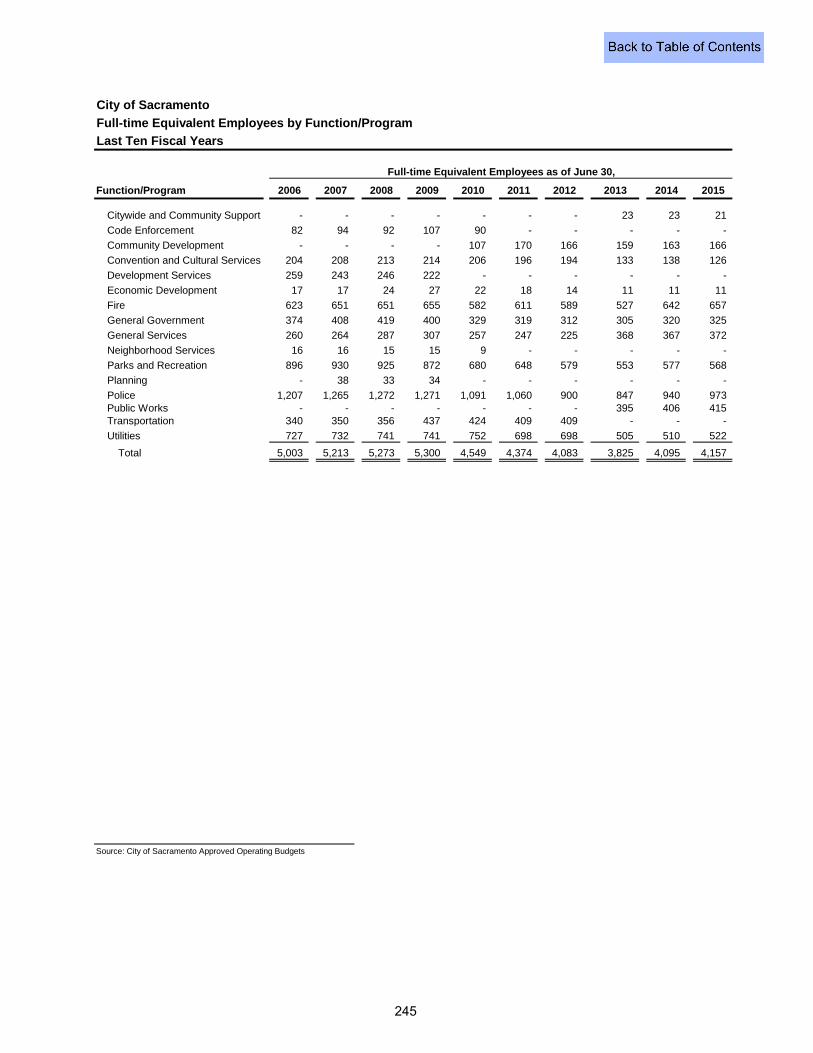
City of Sacramento
Full-time Equivalent Employees by Function/Program
Last Ten Fiscal Years
Function/Program 2006 2007 2008 2009 2010 2011 2012 2013 2014 2015
Citywide and Community Support - - - - - - - 23 23 21
Code Enforcement 82 94 92 107 90 - - - - -
Community Development - - - - 107 170 166 159 163 166
Convention and Cultural Services 204 208 213 214 206 196 194 133 138 126
Development Services 259 243 246 222 - - - - - -
Economic Development 17 17 24 27 22 18 14 11 11 11
Fire 623 651 651 655 582 611 589 527 642 657
General Government 374 408 419 400 329 319 312 305 320 325
General Services 260 264 287 307 257 247 225 368 367 372
Neighborhood Services 16 16 15 15 9 - - - - -
Parks and Recreation 896 930 925 872 680 648 579 553 577 568
Planning - 38 33 34 - - - - - -
Police 1,207 1,265 1,272 1,271 1,091 1,060 900 847 940 973 Public Works - - - - - - - 395 406 415 Transportation 340 350 356 437 424 409 409 - - -
Utilities 727 732 741 741 752 698 698 505 510 522
Total 5,003 5,213 5,273 5,300 4,549 4,374 4,083 3,825 4,095 4,157
Source: City of Sacramento Approved Operating Budgets
Full-time Equivalent Employees as of June 30,
245
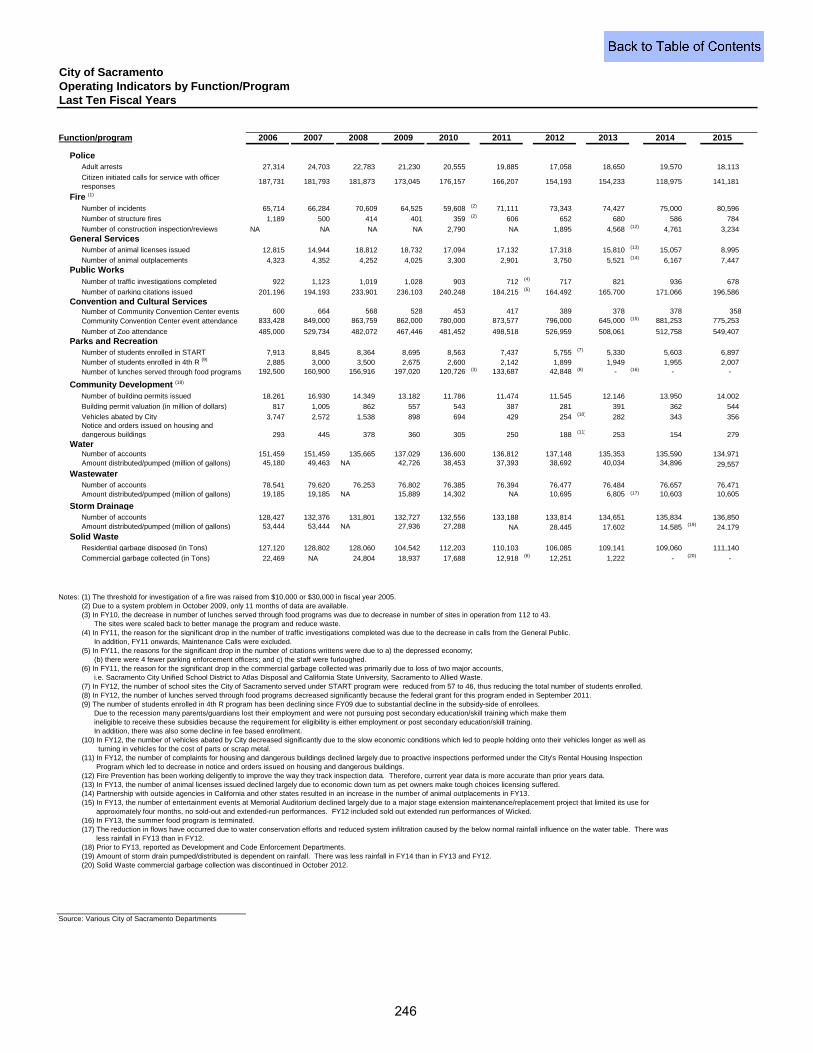
City of SacramentoOperating Indicators by Function/Program Last Ten Fiscal Years
Function/program 2006 2007 2008 2009 2010 2011 2012 2013 2014 2015
PoliceAdult arrests 27,314 24,703 22,783 21,230 20,555 19,885 17,058 18,650 19,570 18,113
Citizen initiated calls for service with officer responses
187,731 181,793 181,873 173,045 176,157 166,207 154,193 154,233 118,975 141,181
Fire (1)
Number of incidents 65,714 66,284 70,609 64,525 59,608 (2) 71,111 73,343 74,427 75,000 80,596
Number of structure fires 1,189 500 414 401 359 (2) 606 652 680 586 784
Number of construction inspection/reviews NA NA NA NA 2,790 NA 1,895 4,568 (12) 4,761 3,234 General Services
Number of animal licenses issued 12,815 14,944 18,812 18,732 17,094 17,132 17,318 15,810 (13) 15,057 8,995
Number of animal outplacements 4,323 4,352 4,252 4,025 3,300 2,901 3,750 5,521 (14) 6,167 7,447 Public Works
Number of traffic investigations completed 922 1,123 1,019 1,028 903 712 (4) 717 821 936 678
Number of parking citations issued 201,196 194,193 233,901 236,103 240,248 184,215 (5) 164,492 165,700 171,066 196,586 Convention and Cultural Services
Number of Community Convention Center events 600 664 568 528 453 417 389 378 378 358Community Convention Center event attendance 833,428 849,000 863,759 862,000 780,000 873,577 796,000 645,000 (15) 881,253 775,253
Number of Zoo attendance 485,000 529,734 482,072 467,446 481,452 498,518 526,959 508,061 512,758 549,407 Parks and Recreation
Number of students enrolled in START 7,913 8,845 8,364 8,695 8,563 7,437 5,755 (7) 5,330 5,603 6,897 Number of students enrolled in 4th R (9) 2,885 3,000 3,500 2,675 2,600 2,142 1,899 1,949 1,955 2,007 Number of lunches served through food programs 192,500 160,900 156,916 197,020 120,726 (3) 133,687 42,848 (8) - (16) - -
Community Development (18)
Number of building permits issued 18,261 16,930 14,349 13,182 11,786 11,474 11,545 12,146 13,950 14,002
Building permit valuation (in million of dollars) 817 1,005 862 557 543 387 281 391 362 544
Vehicles abated by City 3,747 2,572 1,538 898 694 429 254 (10) 282 343 356 Notice and orders issued on housing and dangerous buildings 293 445 378 360 305 250 188 (11) 253 154 279
WaterNumber of accounts 151,459 151,459 135,665 137,029 136,600 136,812 137,148 135,353 135,590 134,971 Amount distributed/pumped (million of gallons) 45,180 49,463 NA 42,726 38,453 37,393 38,692 40,034 34,896 29,557
WastewaterNumber of accounts 78,541 79,620 76,253 76,802 76,385 76,394 76,477 76,484 76,657 76,471 Amount distributed/pumped (million of gallons) 19,185 19,185 NA 15,889 14,302 NA 10,695 6,805 (17) 10,603 10,605
Storm DrainageNumber of accounts 128,427 132,376 131,801 132,727 132,556 133,188 133,814 134,651 135,834 136,850 Amount distributed/pumped (million of gallons) 53,444 53,444 NA 27,936 27,288 NA 28,445 17,602 14,585 (19) 24,179
Solid WasteResidential garbage disposed (in Tons) 127,120 128,802 128,060 104,542 112,203 110,103 106,085 109,141 109,060 111,140
Commercial garbage collected (in Tons) 22,469 NA 24,804 18,937 17,688 12,918 (6) 12,251 1,222 - (20) -
Notes: (1) The threshold for investigation of a fire was raised from $10,000 or $30,000 in fiscal year 2005.(2) Due to a system problem in October 2009, only 11 months of data are available.(3) In FY10, the decrease in number of lunches served through food programs was due to decrease in number of sites in operation from 112 to 43. The sites were scaled back to better manage the program and reduce waste.(4) In FY11, the reason for the significant drop in the number of traffic investigations completed was due to the decrease in calls from the General Public. In addition, FY11 onwards, Maintenance Calls were excluded.(5) In FY11, the reasons for the significant drop in the number of citations writtens were due to a) the depressed economy; (b) there were 4 fewer parking enforcement officers; and c) the staff were furloughed.(6) In FY11, the reason for the significant drop in the commercial garbage collected was primarily due to loss of two major accounts, i.e. Sacramento City Unified School District to Atlas Disposal and California State University, Sacramento to Allied Waste.(7) In FY12, the number of school sites the City of Sacramento served under START program were reduced from 57 to 46, thus reducing the total number of students enrolled.(8) In FY12, the number of lunches served through food programs decreased significantly because the federal grant for this program ended in September 2011.(9) The number of students enrolled in 4th R program has been declining since FY09 due to substantial decline in the subsidy-side of enrollees. Due to the recession many parents/guardians lost their employment and were not pursuing post secondary education/skill training which make them ineligible to receive these subsidies because the requirement for eligibility is either employment or post secondary education/skill training. In addition, there was also some decline in fee based enrollment.(10) In FY12, the number of vehicles abated by City decreased significantly due to the slow economic conditions which led to people holding onto their vehicles longer as well as turning in vehicles for the cost of parts or scrap metal.(11) In FY12, the number of complaints for housing and dangerous buildings declined largely due to proactive inspections performed under the City's Rental Housing Inspection Program which led to decrease in notice and orders issued on housing and dangerous buildings.(12) Fire Prevention has been working deligently to improve the way they track inspection data. Therefore, current year data is more accurate than prior years data. (13) In FY13, the number of animal licenses issued declined largely due to economic down turn as pet owners make tough choices licensing suffered.(14) Partnership with outside agencies in California and other states resulted in an increase in the number of animal outplacements in FY13.(15) In FY13, the number of entertainment events at Memorial Auditorium declined largely due to a major stage extension maintenance/replacement project that limited its use for approximately four months, no sold-out and extended-run performances. FY12 included sold out extended run performances of Wicked.(16) In FY13, the summer food program is terminated.(17) The reduction in flows have occurred due to water conservation efforts and reduced system infiltration caused by the below normal rainfall influence on the water table. There was less rainfall in FY13 than in FY12.(18) Prior to FY13, reported as Development and Code Enforcement Departments.(19) Amount of storm drain pumped/distributed is dependent on rainfall. There was less rainfall in FY14 than in FY13 and FY12.(20) Solid Waste commercial garbage collection was discontinued in October 2012.
Source: Various City of Sacramento Departments
246
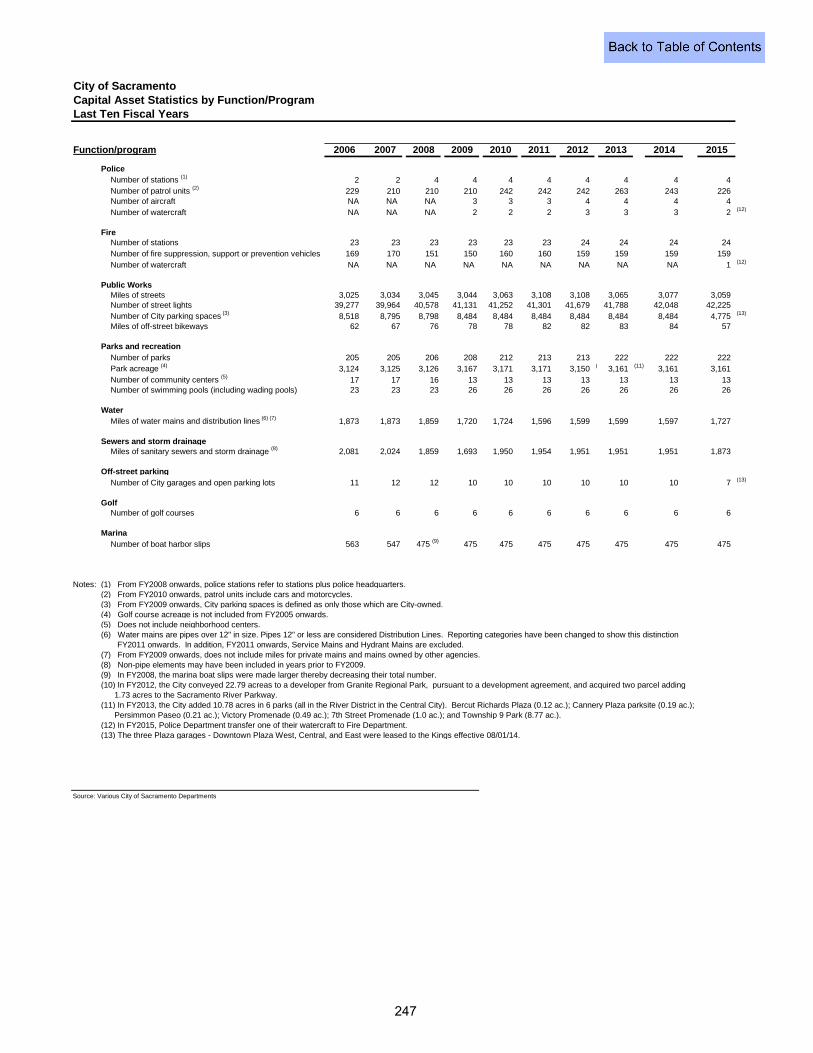
Function/program 2006 2007 2008 2009 2010 2011 2012 2013 2014 2015
PoliceNumber of stations (1) 2 2 4 4 4 4 4 4 4 4 Number of patrol units (2) 229 210 210 210 242 242 242 263 243 226 Number of aircraft NA NA NA 3 3 3 4 4 4 4 Number of watercraft NA NA NA 2 2 2 3 3 3 2 (12)
FireNumber of stations 23 23 23 23 23 23 24 24 24 24 Number of fire suppression, support or prevention vehicles 169 170 151 150 160 160 159 159 159 159 Number of watercraft NA NA NA NA NA NA NA NA NA 1 (12)
Public WorksMiles of streets 3,025 3,034 3,045 3,044 3,063 3,108 3,108 3,065 3,077 3,059 Number of street lights 39,277 39,964 40,578 41,131 41,252 41,301 41,679 41,788 42,048 42,225 Number of City parking spaces (3) 8,518 8,795 8,798 8,484 8,484 8,484 8,484 8,484 8,484 4,775 (13)
Miles of off-street bikeways 62 67 76 78 78 82 82 83 84 57
Parks and recreationNumber of parks 205 205 206 208 212 213 213 222 222 222 Park acreage (4) 3,124 3,125 3,126 3,167 3,171 3,171 3,150 ( 3,161 (11) 3,161 3,161 Number of community centers (5) 17 17 16 13 13 13 13 13 13 13
23 23 23 26 26 26 26 26 26 26
WaterMiles of water mains and distribution lines (6) (7) 1,873 1,873 1,859 1,720 1,724 1,596 1,599 1,599 1,597 1,727
Sewers and storm drainage2,081 2,024 1,859 1,693 1,950 1,954 1,951 1,951 1,951 1,873
Off-street parking11 12 12 10 10 10 10 10 10 7 (13)
GolfNumber of golf courses 6 6 6 6 6 6 6 6 6 6
MarinaNumber of boat harbor slips 563 547 475 (9) 475 475 475 475 475 475 475
Notes: (1) From FY2008 onwards, police stations refer to stations plus police headquarters.(2) From FY2010 onwards, patrol units include cars and motorcycles.(3) From FY2009 onwards, City parking spaces is defined as only those which are City-owned.(4) Golf course acreage is not included from FY2005 onwards.(5) Does not include neighborhood centers. (6) Water mains are pipes over 12" in size. Pipes 12" or less are considered Distribution Lines. Reporting categories have been changed to show this distinction
FY2011 onwards. In addition, FY2011 onwards, Service Mains and Hydrant Mains are excluded.(7) From FY2009 onwards, does not include miles for private mains and mains owned by other agencies.(8) Non-pipe elements may have been included in years prior to FY2009.(9) In FY2008, the marina boat slips were made larger thereby decreasing their total number. (10) In FY2012, the City conveyed 22.79 acreas to a developer from Granite Regional Park, pursuant to a development agreement, and acquired two parcel adding 1.73 acres to the Sacramento River Parkway.(11) In FY2013, the City added 10.78 acres in 6 parks (all in the River District in the Central City). Bercut Richards Plaza (0.12 ac.); Cannery Plaza parksite (0.19 ac.); Persimmon Paseo (0.21 ac.); Victory Promenade (0.49 ac.); 7th Street Promenade (1.0 ac.); and Township 9 Park (8.77 ac.).(12) In FY2015, Police Department transfer one of their watercraft to Fire Department.(13) The three Plaza garages - Downtown Plaza West, Central, and East were leased to the Kings effective 08/01/14.
Source: Various City of Sacramento Departments
Number of swimming pools (including wading pools)
Miles of sanitary sewers and storm drainage (8)
Number of City garages and open parking lots
City of SacramentoCapital Asset Statistics by Function/ProgramLast Ten Fiscal Years
247
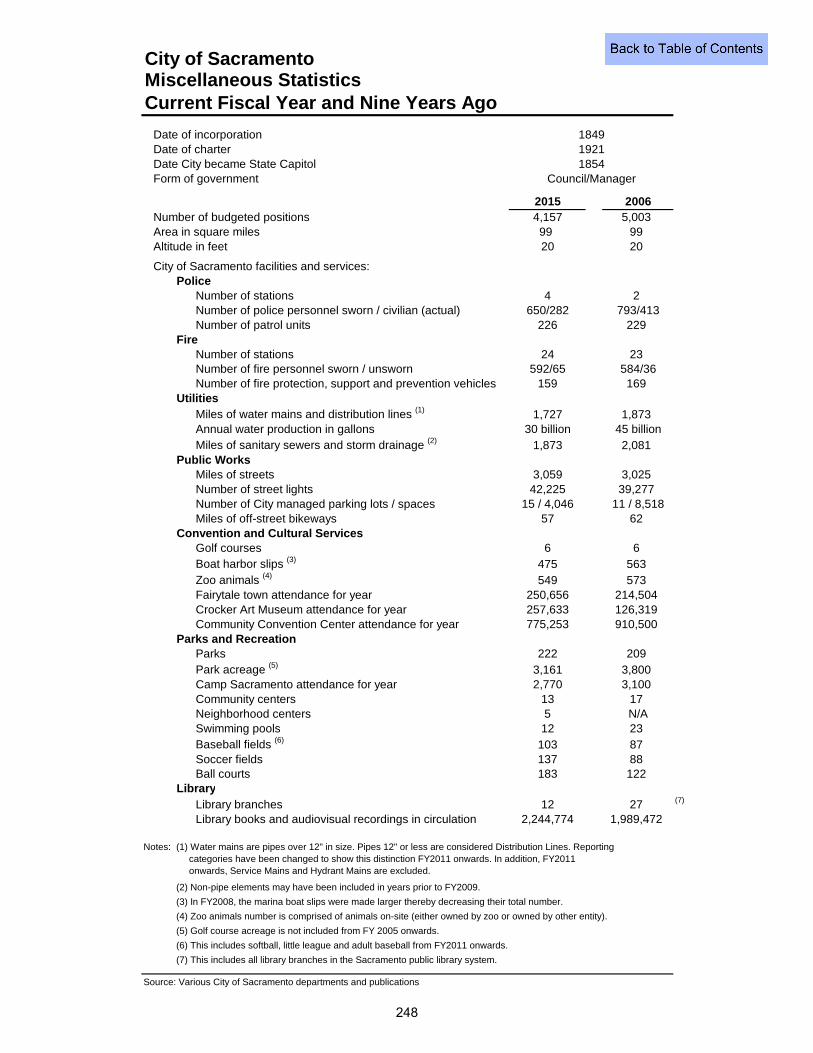
City of SacramentoMiscellaneous StatisticsCurrent Fiscal Year and Nine Years Ago
Date of incorporationDate of charterDate City became State CapitolForm of government
2015 2006Number of budgeted positions 4,157 5,003Area in square miles 99 99Altitude in feet 20 20
City of Sacramento facilities and services:Police
Number of stations 4 2Number of police personnel sworn / civilian (actual) 650/282 793/413Number of patrol units 226 229
FireNumber of stations 24 23Number of fire personnel sworn / unsworn 592/65 584/36Number of fire protection, support and prevention vehicles 159 169
UtilitiesMiles of water mains and distribution lines (1) 1,727 1,873Annual water production in gallons 30 billion 45 billionMiles of sanitary sewers and storm drainage (2) 1,873 2,081
Public WorksMiles of streets 3,059 3,025Number of street lights 42,225 39,277Number of City managed parking lots / spaces 15 / 4,046 11 / 8,518Miles of off-street bikeways 57 62
Convention and Cultural ServicesGolf courses 6 6Boat harbor slips (3) 475 563Zoo animals (4) 549 573Fairytale town attendance for year 250,656 214,504Crocker Art Museum attendance for year 257,633 126,319Community Convention Center attendance for year 775,253 910,500
Parks and RecreationParks 222 209Park acreage (5) 3,161 3,800Camp Sacramento attendance for year 2,770 3,100Community centers 13 17Neighborhood centers 5 N/ASwimming pools 12 23Baseball fields (6) 103 87Soccer fields 137 88Ball courts 183 122
LibraryLibrary branches 12 27 (7)
Library books and audiovisual recordings in circulation 2,244,774 1,989,472
Notes:
(2) Non-pipe elements may have been included in years prior to FY2009.
(3) In FY2008, the marina boat slips were made larger thereby decreasing their total number.
(4) Zoo animals number is comprised of animals on-site (either owned by zoo or owned by other entity).
Source: Various City of Sacramento departments and publications
(7) This includes all library branches in the Sacramento public library system.
19211849
(6) This includes softball, little league and adult baseball from FY2011 onwards.
(5) Golf course acreage is not included from FY 2005 onwards.
(1) Water mains are pipes over 12" in size. Pipes 12" or less are considered Distribution Lines. Reporting categories have been changed to show this distinction FY2011 onwards. In addition, FY2011 onwards, Service Mains and Hydrant Mains are excluded.
Council/Manager1854
248
CIT
Y O
F SA
CR
AM
EN
TO
, CA
LIFO
RN
IA | 2
015
CO
MP
RE
HE
NS
IVE
AN
NU
AL FIN
AN
CIA
L RE
PO
RT
The City of Sacramento was founded in 1849 and is the
oldest incorporated city in California.
In 1920, city voters adopted a Charter (municipal
constitution) and a City Council/City Manager form of
government.
The City is divided into eight districts.
Elected members of the City Council serve
four-year terms.
The Mayor is elected by all voters in the City. In 2002,
voters approved a measure for the Mayor to serve full-
time. All other Councilmembers are elected by district
and serve part-time.
The Mayor and other Councilmembers have an equal
vote in all matters.
The City of Sacramento currently encompasses
approximately 100 square miles.
The current estimated population is 480,105.
CITY OF SACRAMENTO FACTSKEVIN JOHNSON Mayor
ANGELIQUE ASHBY Mayor Pro Tem, District 1
ALLEN WARREN Vice Mayor, District 2
JEFF HARRIS Councilmember, District 3
STEVE HANSEN Councilmember, District 4
JAY SCHENIRER Councilmember, District 5
ERIC GUERRA Councilmember, District 6
RICK JENNINGS, II Councilmember, District 7
LARRY CARR Councilmember, District 8
CROCKER ART MUSEUM Gwathmey Siegel & Associates, Architects
www.CityofSacramento.org
Historic Crocker Art Museum (1942) image courtesy of the Center for Sacramento History
New Crocker Art Museum (2014) image courtesy of photographer Bruce Damonte
Fiscal Year Ended June 30, 2015City of Sacramento, California
Comprehensive Annual Financial Report
HISTORIC CROCKER ART MUSEUMSeth Babson, Architect