Embed Size (px)
Citation preview

Comprehensive Annual
Financial Report For Fiscal Year Ended September 30, 2017
City of Bellaire, Texas

COMPREHENSIVE ANNUAL FINANCIAL REPORT
CITY OF BELLAIRE, TEXAS
For the fiscal year ended
September 30, 2017
Prepared by Finance Department
Terrence Beaman Chief Financial Officer

CITY OF BELLAIRE, TEXAS COMPREHENSIVE ANNUAL FINANCIAL REPORT TABLE OF CONTENTS
Page Introductory Section
Letter of Transmittal i GFOA Certificate of Achievement viii Organization Chart ix Principal City Officials x
Financial Section Report of Independent Auditors 1
Management’s Discussion and Analysis 3
Basic Financial Statements Government-wide Financial Statements:
Statement of Net Position 15 Statement of Activities 16
Fund Financial Statements: Balance Sheet - Governmental Funds 18 Reconciliation of the Governmental Funds Balance Sheet to the Statement of Net
Position 21 Statement of Revenues, Expenditures, and Changes in Fund Balances - Governmental
Funds 22 Reconciliation of the Statement of Revenues, Expenditures, and Changes in Fund
Balances of Governmental Funds to the Statement of Activities 24 Statement of Net Position - Proprietary Fund 25 Statement of Revenues, Expenses and Changes in Fund Net Position - Proprietary
Fund 26 Statement of Cash Flows - Proprietary Fund 27
Notes to the Basic Financial Statements 28
Required Supplementary Information General Fund - Schedule of Revenues, Expenditures, and Changes
in Fund Balance - Budget and Actual 57 Schedule of Changes in Net Pension Liability and Related Ratios - TMRS 59 Schedule of Contributions - TMRS 60 Schedule of Funding Progress - Post Employment Healthcare Benefits 61

CITY OF BELLAIRE, TEXAS COMPREHENSIVE ANNUAL FINANCIAL REPORT TABLE OF CONTENTS (continued)
Other Supplementary Information Combining Balance Sheet - Non-major Governmental Funds 64 Combining Statement of Revenues, Expenditures and Changes in Fund Balances -
Non-major Governmental Funds 66 Schedule of Revenues, Expenditures and Changes in Fund Balance - Budget and Actual -
Debt Service Fund 68
Statistical Section
Net Position by Component 80 Changes in Net Position 72 Fund Balances of Governmental Funds 76 Changes in Fund Balances of Governmental Funds 78 Assessed Value and Estimated Actual Value of Taxable Property 80 Property Tax Rates - Direct and Overlapping Governments 82 Principal Property Taxpayers 85 Property Tax Levies and Collections 86 Ratios of Outstanding Debt by Type 88 Ratios of General Bonded Debt Outstanding 90 Direct and Overlapping Governmental Activities Debt 92 Legal Debt Margin Information 93 Demographic and Economic Statistics 94 Principal Employers 95 Full-time Equivalent Employees by Function 96 Operating Indicators by Function 98 Capital Assets Statistics by Function 100

Introductory Section
CITY OF
Bellaire
i
7008 South Rice Avenue • Bellaire, Texas 77401 • (p)713-662-8222 • (f)713-662-8212
March 19, 2018 To the Honorable Mayor, Members of the City Council, City Manager, and Citizens of the City of Bellaire, Texas: We are pleased to submit the Comprehensive Annual Financial Report (CAFR) of the City of Bellaire, Texas (the “City”) for the year ended September 30, 2017. This report is published to provide the citizens, City Council, City staff, bondholders, and other interested parties detailed information concerning the financial condition of the City. Responsibility for both the accuracy of the data and the completeness and fairness of the presentation, including all disclosures, rests with the City. We believe the data, as presented, is accurate in all material respects and that it is reported in a manner that fairly presents the financial position and results of operations of the City as measured by the financial activity of its various funds and account groups. All disclosures necessary to enable the reader to gain the maximum understanding of the City’s financial activities have been included.
THE REPORT In compliance with the Governmental Accounting Standards Board (GASB) Statement No. 34, this report includes a Management’s Discussion and Analysis (MD&A) which provides a narrative introduction, overview, and analysis to accompany the basic financial statements. The MD&A is located immediately following the Independent Auditors’ Report. This letter of transmittal is designed to complement MD&A and should be read in conjunction with it.
CITY PROFILE Location The City, founded in 1908 and incorporated under the laws of the State of Texas in 1918, is located in southwest Harris County. The City is entirely surrounded by the City of Houston. The City encompasses about 3.6 square miles and has a population of 18,593 as of 2016 per the US Census Bureau estimate. Form of Government Since 1949, the City has operated under a “Home Rule Charter” which provides for a Council-Manager form of government. The City Council is comprised of a Mayor and six council members. The Mayor is elected for a regular term of two years and is limited to four consecutive terms in that position. Council members, all of whom are elected at-large, are elected for a regular term of four years. No council member may serve more than two consecutive terms in that position. The Mayor and three council members are elected at each regular election. The City Council appoints a City Manager to be responsible for the daily management of the City.

ii
The Reporting Entity and Services Provided The basic financial statements of the City include police, fire and emergency medical services, parks and recreation, library services, street maintenance and repair, public improvements, water, sewer and solid waste systems, and general administrative services.
ECONOMIC CONDITION AND OUTLOOK Economic Condition As an enclave of Houston, the economy of the City is directly linked to the Houston metropolitan area. While a number of large employers, as well as retail and service type businesses, are located within the City, Bellaire is primarily a residential community. Many of the residents work minutes away in Houston’s largest business areas, including the Houston Medical Center, regarded as one of the finest health care facilities in the world. Two major airports, William P. Hobby International Airport and George Bush Intercontinental Airport, are easily accessible to Bellaire residents and business travelers. The Houston metropolitan area’s economy is based on petrochemicals, shipping, refining, chemicals, space exploration, manufacturing, education, health care, and tourism. Beginning around April 2015, Houston has seen increased unemployment and an economic slowdown due to a decrease in oil prices. However, due to a petrochemical construction boom, health care, and a strong nationwide economy that supports the metropolitan area, Houston’s economy is expected to continue its historical growth pattern but not at the pace experienced back in 2014. Most economic factors such as employment, oil prices, travel, and others are projected to either stabilize or grow as the Greater Houston area is still one of the most sought after markets to live and do business. Houston is the seat of Harris County, the most populous county in the State of Texas and the third most populous county in the nation. Houston’s phenomenal growth has brought about rapid development throughout the region, but the necessary infrastructure to support such growth in the outlying areas has lagged behind. As a result, many residents of the region have sought to reduce their commute time on Houston’s heavily congested transportation corridors by moving closer to the workplace. In addition to Bellaire being a safe city with high quality schools, Bellaire has become increasingly desirable due to its convenient location to Houston’s downtown, uptown, and midtown business districts and Houston’s medical center. The City is a mature community that is almost fully developed residentially with a network of businesses to support its citizens. While there is little undeveloped commercial property, the commercial infrastructure is not nearly as developed or modernized as the residential sector. The City continues to focus on better utilization and growth of the central commercial district and commercial corridors within the City based on its comprehensive plan adopted in 2009 and updated in September 2015. Large mature oak trees cascade over most of the City’s streets giving a “small town” feel to the area. Local government control through City Council gives Bellaire residents more influence over key government services such as police and fire protection. Major Initiatives In November 2005, voters approved two separate bond referenda totaling $50.00 million to be spent over a ten-year period on infrastructure and facility improvements. With an additional obligation of $5.00 million in pay-as-you-go funding, the City's "Rebuild Bellaire" capital improvement program totaled $55.00 million. The program provided for $43.50 million in funding for major street and drainage improvements throughout the City and $11.50 million for facilities replacement and renovation. The facilities included the new Bellaire Family Aquatic Center, Bellaire Fire Station, and renovations to the Bellaire Library and City Hall. The City issued this debt in stages including the final issuance of $1.56 million in 2017 for facilities.

iii
In November 2013, voters approved three bond referenda totaling $16.50 million. $11.00 million was approved for improvements to City Hall, Civic Center, Police Station, and Municipal Court facilities. An additional $5.00 million was approved for capital improvements to Evelyn's Park and an additional $0.50 million was approved for ground and facilities improvements to the Nature Discovery Center in Russ Pitman Park. The City issued $5.50 million in 2014 for construction of Evelyn's Park and improvements to the Nature Discovery Center in Russ Pitman Park. The remaining authority of $11.00 million for facilities was issued in 2017. In November 2016, voters approved three separate bond propositions collectively referred to as “Bonds for Better Bellaire 2016” totaling $53.98 million. Proposition 1 provides $24.00 million for design and construction of streets and drainage systems and sidewalks. Proposition 2 provides $5.60 million for new municipal buildings. These funds are in addition to the $1.56 million approved in November 2005 and the $11.00 million approved in November 2013 for a total project budget of $18.16 million for construction of a new city hall/civic center and police/municipal court facility. Proposition 3 provides $24.38 million for water and wastewater improvements, including $11.00 million for design and construction of water lines, $0.58 million for design and construction of wastewater lines, and $12.80 million for new water meter installation and improvements to the wastewater treatment plant. The City is issuing this debt in stages, including two issuances totaling totaling $32.48 million in 2017 for (a) streets, drainage, and sidewalks ($10.00 million), (b) municipal facilities ($5.60 million), and (c) water and wastewater improvements ($16.88 million). There remains authority of $14.00 million for streets, drainage, and sidewalks, and $7.50 million for water and wastewater improvements, which is projected to be issued in fiscal year 2018 and fiscal year 2019. Evelyn’s Park opened on Earth Day, April 22, 2017. The 5-acre property broke ground in June 2015. Evelyn's Park is a tranquil and beautifully landscaped park plan with walking trails, a children's garden and play area, a butterfly garden, an all-day café with banquet room, and an event lawn. With the support of City Council and its Planning and Zoning Commission, H-E-B has committed to re-invest in the community by building a newly designed grocery store at its current location, 5130 Cedar. City Council approved a release of right of way and easement to facilitate the replacement of the current H-E-B grocery store with a store that will more than double in size. Shoppers will enjoy expanded parking in the two-story garage. This project is reflective of the City’s efforts over the last several years to encourage commercial redevelopment through targeted changes in the zoning code, to attract new and renewed businesses that will improve Bellaire’s commercial areas and better serve the needs of residents. The original store opened in 1994. Construction began in 2017 with a grand opening of the new store expected in 2018. Construction of residential homes began in a new residential subdivision, Alder Circle, which will add an estimated $6.5 million to the tax rolls with an estimated completion date in 2018. Bellaire High School and Condit Elementary School were included in the Houston Independent School District's (HISD) 2012 $1.89 billion bond program approved by voters November 6, 2012. The old Condit Elementary school was torn down and a new building was erected in the summer of 2016. A new building for Bellaire High School is planned that will incorporate the recently completed science classroom and laboratory wing and add a parking garage. Bellaire High School is currently located on a 17-acre site in a residential area of Bellaire. The school has attendance in excess of 3,500 students and the parking is inadequate for a school of its size. As noted earlier, voters approved bonds in 2012 for HISD to rebuild the school and add a parking garage, but numerous delays have prevented the rebuilding. In September 2017, the Bellaire City Council approved a special use permit for HISD paving the way for the rebuilding in the near future.

iv
In July 2016 Chevron, the City’s top employer and property tax payer, announced it would be vacating its Bellaire facility and consolidating its operations into its downtown Houston offices. This opened up redevelopment possibilities for a contiguous, rectangular area of approximately 30 acres in the City. Long-established neighborhoods of single-family detached homes border the site to the North and South, and Interstate 610 borders the site to the East. The site presents a unique redevelopment opportunity that could accommodate a range of desirable potential uses. Since the 1940’s the site has been zoned as a Technical Research Park, which corresponded to use as a business park in the Land Use and Character Map within the City’s Comprehensive Plan. The Comprehensive Plan serves as a framework for guiding future development, redevelopment, and community enhancement. Sensing the opportunity for redevelopment of the Chevron property into something with more community benefit than a business park, the City amended its Comprehensive Plan in April 2017 identifying the area as the North Bellaire Special Development Area on the Future Land Use and Character Map within the Comprehensive Plan. This re-designation within the Comprehensive Plan indicates the City’s openness to alternative uses for the site such as traditional single family homes, lifecycle housing, and non-residential and mixed-use development. Long-Term Financial Planning The City’s strategic planning process has multiple components. At the base, is the City’s long-term Comprehensive Plan adopted in 2009, updated in 2015, and most recently revised in 2017. It has a 20-year planning horizon focusing on land use, infrastructure, and quality of life. Elements of the Comprehensive Plan feed into the development of City Council Priorities. City Council Priorities have a 5-year planning horizon focusing on safety, infrastructure and facilities, residential and recreational, budget and finance, and commercial redevelopment. Elements of City Council Priorities feed into the development of the Capital Improvement Plan. The Capital Improvement Plan has a 5-year planning horizon focusing on capital improvement projects. Elements of City Council Priorities and the Capital Improvement Plan feed into the development of the Fiscal Forecast. The Fiscal Forecast has a 5-year planning horizon focusing on major assumptions and overall forecasting of cash flows. Elements of City Council Priorities and the Fiscal Forecast feed into the development of the department level Service Plans. Department level Service Plans have a 3-year planning horizon focusing on why the department exists, what the department is responsible for, what the department does, who the department serves, what service level the department provides, a high level analysis of the department budget and fiscal forecast, an analysis of the environment in which the department operates, consideration of available assets, identification of potential future service enhancements, and development of future strategic goals. Elements of the Fiscal Forecast and the department level Service Plans feed into the development of the annual budget. While the longer-term strategic planning elements generally drive the development of the shorter-term strategic planning elements, there can be components of the shorter term planning elements identified which in turn are used in the updating or revising of the longer term planning elements, making the development a two-way street.

v
Debt management is a major component of the strategic planning process that incorporates financing needs for infrastructure development that is consistent with the revenue stream, while at the same time measuring and assessing the cost and timing of each debt issuance. Debt service payments are budgeted expenditures. Moreover, during the annual budget adoption process, the City adopts a property tax rate via Truth and Taxation laws necessary to fund voter approved debt. The General rate produces revenues available in the general fund to satisfy expenditures, while the Debt Service rate produces revenues available in the debt service fund to service debt. The City approved an increase of $0.0285 in the total property tax rate for tax year 2017, fiscal year 2018. The increase was split with an increase of $0.0127 from the General rate and an increase of $0.0158 from the Debt Service rate. Tax rates for the past and most recent fiscal years were apportioned as follows:
Fund 2015 Change 2016 Change 2017
General $0.2532 $(0.0031) $0.2501 $0.0050 $0.2551
Debt service 0.1404 (0.0100) 0.1304 0.0019 0.1323
Total Tax Rate $0.3936 $(0.0131) $0.3805 $0.0069 $0.3874 The tax rate for tax year 2017, fiscal year 2018, was increased by $0.0285, to $0.4159. Property tax revenues are the main source of resources available for debt service, however, in addition, the enterprise fund annually transfers $950,000 to cover debt service requirements on bond proceeds used for enterprise infrastructure.

vi
Payments for bond principal and interest, which include associated fees, totaled $17,496,550 in fiscal year 2017, including $9,942,234 for refunding bonds issued to achieve savings on interest costs. Payments for bond principal and interest are budgeted to be approximately $8,730,841 in fiscal year 2018. The City’s Charter contains no limit on the amount of debt the City may incur. The amount of ad valorem tax-supported debt that the City may incur is limited by the Constitution of the State of Texas (the “State”). The State Constitution provides that the ad valorem taxes levied by the City for general purposes and for paying the principal and interest on the City’s indebtedness must not exceed $2.50 for each $100 of assessed valuation of taxable property. There is no constitutional or statutory limitation with the $2.50 rate for debt payments; however, the Texas Attorney General has adopted an administrative policy that prohibits the issuance of debt by a municipality, such as Bellaire, if its issuance produces debt service requirements exceeding that which can be paid from $1.50 of the foregoing $2.50 maximum tax rate calculated at 90% collections. The City’s debt service tax rate for fiscal year 2017 of $0.1323 and for fiscal year 2018 of $0.1481 for each $100 of assessed value is well below the aforementioned limit of $1.50 for each $100 of assessed value. The City continues to update and monitor its five-year fiscal forecast and regularly re-visits all assumptions related to debt as economic indicators change. Financial Information The City’s accounting records for general government operations are maintained on a modified accrual basis with the revenues recorded when available and measurable and expenditures recorded when the goods or services are received and the liabilities incurred. Accounting records for the City’s proprietary activities are maintained on the accrual basis. Management of the City is responsible for establishing and maintaining internal controls designed to ensure that the assets of the City are protected from loss, theft, or misuse and to ensure that adequate accounting data is completed to allow for the preparation of financial statements in conformity with accounting principles generally accepted in the United States of America. Internal control is designed to provide reasonable, but not absolute, assurance that these objectives are met. The concept of reasonable assurance recognizes that (1) the cost of controls should not exceed the benefits expected to be derived and (2) the evaluation of costs and benefits require estimates and judgments by management. We believe the City’s accounting controls provide reasonable assurance that errors or irregularities that could be material to the financial statements are prevented, or would be detected within a timely period, by employees in the normal course of performing their assigned functions. Additionally, the City maintains budgetary controls. The objective of these budgetary controls is to ensure compliance with legal provisions embodied in the annual appropriated budget approved by City Council. Activities of each of the City’s funds are included in the annual appropriated budget. The level of budgetary control (the level at which expenditures cannot legally exceed the appropriated amount) is the total approved budget for each department. As demonstrated by the statements and schedules included in the financial section of this report, the City continues to meet its responsibility for sound financial management.


viii

ix

CITY OF BELLAIRE, TEXAS PRINCIPAL CITY OFFICIALS September 30, 2017
x
City Officials
Elective Position Term
Expires
Andrew S. Friedberg
Mayor
01/20
Neil Verma
Council Member - Position No. 1
01/22
Trisha S. Pollard
Council Member - Position No. 2
01/20
Gus E. Pappas
Council Member - Position No. 3
01/22
Pat McLaughlan
Council Member - Position No. 4
01/20
Michael Fife
Council Member - Position No. 5
01/22
David E. Montague
Council Member - Position No. 6
01/20
Key Staff
Position
Paul A. Hofmann
City Manager
Diane K. White
Assistant City Manager
Terrence Beaman
Chief Financial Officer
Tracy L. Dutton
City Clerk
Michael Leech
Director of Public Works
Byron Holloway
Police Chief
Darryl Anderson
Fire Chief
Karl Miller
Director of Parks, Recreation, and Facilities
Mary Cohrs
Library Director
ChaVonne Sampson
Director of Development Services
Yolanda Howze
Director of Human Resources
Patrice Baltuskonis
Director of Information Technology

Financial Section

Austin Dallas Fort Worth Houston
Houston Office3737 Buffalo Speedway Suite 1600Houston, Texas 77098713.621.1515 Main
whitleypenn.com
1
REPORT OF INDEPENDENT AUDITORS To the Honorable Mayor and
Members of the City Council City of Bellaire, Texas
Report on Financial Statements We have audited the accompanying financial statements of the governmental activities, the business-type activities, each major fund, and the aggregate remaining fund information of City of Bellaire, Texas (the “City”) as of and for the year ended September 30, 2017, and the related notes to the financial statements, which collectively comprise the City’s basic financial statements as listed in the table of contents. Management’s Responsibility for the Financial Statements Management is responsible for the preparation and fair presentation of these financial statements in accordance with accounting principles generally accepted in the United States of America; this includes the design, implementation, and maintenance of internal control relevant to the preparation and fair presentation of financial statements that are free from material misstatement, whether due to fraud or error. Auditor’s Responsibility Our responsibility is to express opinions on these financial statements based on our audit. We conducted our audit in accordance with auditing standards generally accepted in the United States of America. Those standards require that we plan and perform the audit to obtain reasonable assurance about whether the financial statements are free from material misstatement. An audit involves performing procedures to obtain audit evidence about the amounts and disclosures in the financial statements. The procedures selected depend on the auditor’s judgment, including the assessment of the risks of material misstatement of the financial statements, whether due to fraud or error. In making those risk assessments, the auditor considers internal control relevant to the entity’s preparation and fair presentation of the financial statements in order to design audit procedures that are appropriate in the circumstances, but not for the purpose of expressing an opinion on the effectiveness of the entity’s internal control. Accordingly, we express no such opinion. An audit also includes evaluating the appropriateness of accounting policies used and the reasonableness of significant accounting estimates made by management, as well as evaluating the overall presentation of the financial statements. We believe that the audit evidence we have obtained is sufficient and appropriate to provide a basis for our audit opinions. Opinions In our opinion, the financial statements referred to above present fairly, in all material respects, the respective financial position of the governmental activities, the business-type activities, each major fund, and the aggregate remaining fund information of the City, as of September 30, 2017, and the respective

To the Honorable Mayor and Members of the City Council
City of Bellaire, Texas
2
changes in financial position and, where applicable, cash flows thereof for the year then ended in accordance with accounting principles generally accepted in the United States of America.
Other Matters
Required Supplementary Information
Accounting principles generally accepted in the United States of America require that the management’s discussion and analysis on pages 3 through 12, budgetary comparison information on pages 57 through 58, and pension system and other post-employment benefit supplementary information on pages 59 through 61 be presented to supplement the basic financial statements. Such information, although not a part of the basic financial statements, is required by the Governmental Accounting Standards Board, who considers it to be an essential part of financial reporting for placing the basic financial statements in an appropriate operational, economic, or historical context. We have applied certain limited procedures to the required supplementary information in accordance with auditing standards generally accepted in the United States of America, which consisted of inquiries of management about the methods of preparing the information and comparing the information for consistency with management’s responses to our inquiries, the basic financial statements, and other knowledge we obtained during our audit of the basic financial statements. We do not express an opinion or provide any assurance on the information because the limited procedures do not provide us with sufficient evidence to express an opinion or provide any assurance.
Other Information
Our audit was conducted for the purpose of forming opinions on the financial statements that collectively comprise the City’s basic financial statements. The introductory section, debt service fund budgetary comparison schedule and statistical section are presented for purposes of additional analysis and are not a required part of the basic financial statements.
The combining fund statements and debt service fund budgetary comparison schedule is the responsibility of management and were derived from and relate directly to the underlying accounting and other records used to prepare the basic financial statements. Such information has been subjected to the auditing procedures applied in the audit of the basic financial statements and certain additional procedures, including comparing and reconciling such information directly to the underlying accounting and other records used to prepare the basic financial statements or to the basic financial statements themselves, and other additional procedures in accordance with auditing standards generally accepted in the United States of America. In our opinion, the combining fund statements and debt service fund budgetary comparison schedule are fairly stated, in all material respects, in relation to the basic financial statements as a whole.
The introductory and statistical sections have not been subjected to the auditing procedures applied in the audit of the basic financial statements and, accordingly, we do not express an opinion or provide any assurance on them.
March 19, 2018 Houston, Texas

CITY OF BELLAIRE, TEXAS MANAGEMENT’S DISCUSSION AND ANALYSIS
3
As management of the City of Bellaire, Texas (the “City”), we offer readers of the City’s financial statements this narrative overview and analysis of the financial activities of the City for the fiscal year ended September 30, 2017. Financial Highlights
The City’s assets and deferred outflows of resources exceeded its liabilities and deferred inflows of resources at the close of the most recent fiscal year by $64.5 million (net position). Of this amount, $0.6 million (unrestricted net position) may be used to meet the City’s ongoing obligations to citizens and creditors.
As of the close of the most recent fiscal year, the City’s governmental funds reported combined ending fund balances of $49.5 million, an increase of $28.1 million over the prior year. A primary driver of this increase was due to the proceeds received from the issuance of capital-related debt. Approximately 7% of the City’s combined governmental fund balances, $3.7 million, is available for spending at the City’s discretion (unassigned fund balance).
At the end of the most recent fiscal year, unassigned fund balance for the general fund was 20% of total general fund expenditures.
Overview of the Financial Statements This discussion and analysis is intended to serve as an introduction to the City’s basic financial statements. The City’s basic financial statements comprise three components: (1) government-wide financial statements, (2) fund financial statements, and (3) notes to the basic financial statements. This report also contains other supplementary information in addition to the basic financial statements themselves. Government-wide Financial Statements The government-wide financial statements are designed to provide readers with a broad overview of the City’s finances, in a manner similar to a private-sector business. The statement of net position presents information on all of the City’s assets, deferred outflows of resources, liabilities and deferred inflows of resources with the difference between the four reported as net position. Over time, increases or decreases in net position may serve as a useful indicator of whether the financial position of the City is improving or deteriorating. The statement of activities presents information showing how the City’s net position changed during the most recent fiscal year. All changes in net position are reported as soon as the underlying event giving rise to the change occurs, regardless of the timing of related cash flows. Thus, revenues and expenses are reported in this statement for some items that will only result in cash flows in future fiscal periods (e.g. uncollected taxes and earned but unused vacation leave). Both of the government-wide financial statements distinguish functions of the City that are principally supported by taxes and intergovernmental revenues (governmental activities) from other functions that are intended to recover all or a significant portion of their costs through user fees and charges (business-type activities). The governmental activities of the City include general government, public safety, public works, and culture and recreation. The business-type activities of the City include water services, sewer services, and solid waste services.

CITY OF BELLAIRE, TEXAS MANAGEMENT’S DISCUSSION AND ANALYSIS (continued)
4
The government-wide financial statements can be found on pages 15 through 17 of this report. Fund Financial Statements A fund is a grouping of related accounts that is used to maintain control over resources that have been segregated for specific activities or objectives. The City, like other state and local governments, uses fund accounting to ensure and demonstrate compliance with finance-related legal requirements. All of the funds of the City can be divided into two categories: governmental funds and proprietary funds. Governmental Funds Governmental funds are used to account for essentially the same functions reported as governmental activities in the government-wide financial statements. However, unlike the government-wide financial statements, governmental fund financial statements focus on near-term inflows and outflows of spendable resources, as well as on balances of spendable resources available at the end of the fiscal year. Such information may be useful in evaluating a government’s near-term financing requirements. Because the focus of governmental funds is narrower than that of the government-wide financial statements, it is useful to compare the information presented for governmental funds with similar information presented for governmental activities in the government-wide financial statements. By doing so, readers may better understand the long-term impact of the City’s near-term financing decisions. Both the governmental fund balance sheet and the governmental fund statement of revenues, expenditures and changes in fund balances provide a reconciliation to facilitate this comparison between governmental funds and governmental activities. The City maintains seven individual governmental funds. Information is presented separately in the governmental fund balance sheet and in the governmental fund statement of revenues, expenditures and changes in fund balances for the general fund, debt service fund, and capital bond fund, all of which are considered to be major funds for reporting purposes. Data from the non-major governmental funds are combined into a single, aggregated presentation. Individual fund data for each of these non-major governmental funds is provided in the form of combining statements found on pages 64 through 67 of this report. The City adopts an annual appropriated budget for all funds. Budgetary comparison schedules have been provided for the general fund and debt service fund to demonstrate compliance with their budgets. The basic governmental fund financial statements can be found on pages 18 through 24 of this report. Proprietary Funds Proprietary funds are used to report the same functions presented as business-type activities in the government-wide financial statements. The City maintains one type of proprietary fund. The City uses an enterprise fund to account for its water, sewer, and solid waste services. Proprietary fund financial statements provide the same type of information as the government-wide financial statements, only in more detail. The proprietary fund financial statements provide separate information for the water, sewer, and solid waste operations, and is considered to be a major fund of the City. The basic proprietary fund financial statements can be found on pages 25 through 27 of this report.

CITY OF BELLAIRE, TEXAS MANAGEMENT’S DISCUSSION AND ANALYSIS (continued)
5
Notes to the Basic Financial Statements The notes to the basic financial statements provide additional information that is essential to a full understanding of the data provided in the government-wide and fund financial statements. The notes to the basic financial statements can be found on pages 28 through 54 of this report. Other information In addition to the basic financial statements and accompanying notes, this report also presents certain required supplementary information concerning the City’s progress in funding its obligation to provide pension and other post-employment benefits to its employees and general fund budgetary comparisons. Required supplementary information can be found on pages 57 through 61 of this report. Government-wide Financial Analysis As noted earlier, net position may serve over time as a useful indicator of a government’s financial position. The assets and deferred outflows of resources of the City exceeded its liabilities and deferred inflows at the close of the most recent fiscal year by $64.5 million (net position). At the close of the most recent fiscal year, the City is able to report positive balances in all three categories of net position, both for the government as a whole, as well as for its separate governmental and business-type activities. By far, the largest portion of the City’s net position (96%) reflects its investment in capital assets (e.g., land, buildings, infrastructure, machinery and equipment), less any related debt used to acquire those assets that is still outstanding. Although the City’s investment in its capital assets is reported net of related debt, it should be noted that the resources needed to repay this debt must be provided from other sources, since the capital assets themselves cannot be used to liquidate these liabilities. An additional portion of the City’s net position (3%) represents resources that are subject to external restrictions on how they may be used. The remaining balance of unrestricted net position (1%) may be used to meet the City’s ongoing obligations to citizens and creditors. The City has historically issued and repaid debt in its governmental activities for which the proceeds were used to purchase capital assets for the business-type activities. With business-type activities carrying the capital assets and governmental activities carrying the debt, the result is governmental activities presenting negative unrestricted net position. The City has included a reconciliation column in the Statement of Net Position adjusting the net investment in capital assets. Outstanding debt associated with governmental activities in the amount of $23,621,897 is being used to finance capital assets reported in business-type activities. Accordingly, this amount has been added back to unrestricted net position and deducted from net investment in capital assets in total for the primary government.

CITY OF BELLAIRE, TEXAS MANAGEMENT’S DISCUSSION AND ANALYSIS (continued)
6
Government-wide Financial Analysis (continued) The following table summarizes the financial position of the City as of September 30, 2017 and 2016.
Governmental Activities
Business-type Activities Reconciliation
Total Primary Government
Current and other assets 55,023,663$ 1,975,841$ -$ 56,999,504$
Capital assets 96,643,061 48,987,489 - 145,630,550
Total Assets 151,666,724 50,963,330 - 202,630,054
Deferred charge on refunding 2,456,752 - - 2,456,752
Deferred outflows - pensions 4,052,897 499,912 - 4,552,809Total Deferred Outflows of Resources 6,509,649 499,912 - 7,009,561
Long-term liabilities 136,717,200 1,605,622 - 138,322,822
Other liabilities 5,482,314 570,728 - 6,053,042
Total Liabilities 142,199,514 2,176,350 - 144,375,864
Deferred Inflows of Resources - Pensions 691,971 80,491 - 772,462
Net investment in capital assets 36,737,254 48,987,489 (23,621,897) 62,102,846
Restricted 1,816,603 - - 1,816,603
Unrestricted (23,268,969) 218,912 23,621,897 571,840 Total Net Position 15,284,888$ 49,206,401$ -$ 64,491,289$
Governmental Activities
Business-type Activities Reconciliation
Total Primary Government
Current and other assets 25,536,469$ 2,043,992$ -$ 27,580,461$
Capital assets 87,352,743 43,105,844 - 130,458,587
Total Assets 112,889,212 45,149,836 - 158,039,048
Deferred charge on refunding 1,832,485 - - 1,832,485
Deferred outflows - pensions 4,853,277 601,956 - 5,455,233Total Deferred Outflows of Resources 6,685,762 601,956 - 7,287,718
Long-term liabilities 93,708,784 1,638,843 - 95,347,627
Other liabilities 4,250,811 443,755 - 4,694,566
Total Liabilities 97,959,595 2,082,598 - 100,042,193
Total Deferred Inflows of Resources 778,614 88,135 - 866,749
Net investment in capital assets 24,283,701 43,105,844 (7,640,602) 59,748,943
Restricted 2,926,117 - - 2,926,117
Unrestricted (6,373,053) 475,215 7,640,602 1,742,764 Total Net Position 20,836,765$ 43,581,059$ -$ 64,417,824$
September 30, 2017
September 30, 2016

CITY OF BELLAIRE, TEXAS MANAGEMENT’S DISCUSSION AND ANALYSIS (continued)
7
Government-wide Financial Analysis (continued) The City’s net position increased by $0.1 million during the most recent fiscal year, demonstrating the ability of the City’s revenues to keep pace with annual expenses. The following table summarizes the changes in net position for the City for the years ended September 30, 2017 and 2016. CONDENSED SCHEDULE OF CHANGES IN NET POSITION
For the Years Ended September 30, 2017 and 2016
Governmental Activities Business-type Activities Total Primary Government 2017 2016 2017 2016 2017 2016
Revenues:
Program revenues:
Charges for services 3,397,063$ 3,351,864$ 8,052,201$ 7,190,218$ 11,449,264$ 10,542,082$ Operating grants and contributions 1,600,306 1,678,882 102,310 - 1,702,616 1,678,882 Capital grants and contributions - - - 583,618 - 583,618
General revenues:
Property taxes 18,524,717 17,134,276 - - 18,524,717 17,134,276
Other taxes 3,680,685 3,851,425 - - 3,680,685 3,851,425
Other 461,603 116,984 59,792 67,155 521,395 184,139
Total Revenues 27,664,374 26,133,431 8,214,303 7,840,991 35,878,677 33,974,422
Expenses:
General government 4,863,991 4,535,002 - - 4,863,991 4,535,002
Public safety 9,717,944 9,099,845 - - 9,717,944 9,099,845
Public works 1,568,448 3,458,191 - - 1,568,448 3,458,191
Culture and recreation 6,957,959 4,934,103 - - 6,957,959 4,934,103
Water system - - 5,779,152 5,607,986 5,779,152 5,607,986
Sewer system - - 1,193,801 1,304,575 1,193,801 1,304,575
Solid waste - - 1,342,498 1,322,405 1,342,498 1,322,405
Interest on long-term debt 4,323,982 2,746,662 - - 4,323,982 2,746,662
Total Expenses 27,432,324 24,773,803 8,315,451 8,234,966 35,747,775 33,008,769
Change in net position before transfers 232,050 1,359,628 (101,148) (393,975) 130,902 965,653
Transfers in (out) (5,783,927) 2,646,000 5,726,490 (2,646,000) (57,437.00) - Change in net position (5,551,877) 4,005,628 5,625,342 (3,039,975) 73,465 965,653
Total Net Position - Beginning 20,836,765 16,831,137 43,581,059 46,621,034 64,417,824 63,452,171 Total Net Position - Ending 15,284,888$ 20,836,765$ 49,206,401$ 43,581,059$ 64,491,289$ 64,417,824$

CITY OF BELLAIRE, TEXAS MANAGEMENT’S DISCUSSION AND ANALYSIS (continued)
8
Governmental Activities Governmental activities decreased the City’s net position by approximately $5.6 million or 27% of beginning net position. The key element of this decrease is as follows:
$8.5 million in capital improvements were financed by governmental activities and transferred to and capitalized by business-type activities.
A comparison of program expenses to program revenues for fiscal year 2017 follows:
$‐
$2,000
$4,000
$6,000
$8,000
$10,000
$12,000
(amounts in 000's)
Expenses
Revenues
Revenue sources for governmental activities were distributed as follows:
Charges for services12%
Operating grants and
contributions6%
Property taxes67%
Other taxes13%
Other2%

CITY OF BELLAIRE, TEXAS MANAGEMENT’S DISCUSSION AND ANALYSIS (continued)
9
Business-type Activities Business-type activities increased the City’s net position by $5.6 million or 13% of beginning net position. For the year ended September 30, 2017, revenues for the water, sewer, and solid waste increased by $0.4 million, an increase of 4.8% from the previous year. For the year ended September 30, 2017, expenses for water, sewer, and solid waste increased by $80,485, an increase of 1.0% from the previous year. A comparison between expenses relating to water, sewer, and solid waste operations and program revenues (charges for services) for fiscal years 2017 and 2016 follows:
$6,600
$6,800
$7,000
$7,200
$7,400
$7,600
$7,800
$8,000
$8,200
$8,400
FY 2017 FY 2016
(amounts in 000's)
Operating expenses
Charges for services
Financial Analysis of the City’s Funds As noted earlier, the City uses fund accounting to ensure and demonstrate compliance with finance-related legal requirements. Governmental Funds The focus of the City’s governmental funds is to provide information on near-term inflows, outflows and balances of spendable resources. Such information is useful in assessing the City’s financing requirements. In particular, unassigned fund balance may serve as a useful measure of a government’s net resources available for spending at the end of the fiscal year. As of the end of the most recent fiscal year, the City’s governmental funds reported combined ending fund balances of $49.5 million, an increase of 131% or $28.1 million over the prior year. This increase is mainly attributable to $28.8 million increase in fund balance in the Capital Bond Fund due to the issuance of capital-related debt. Approximately 7% of the combined ending fund balances, $3.7 million, is available for spending at the City’s discretion (unassigned fund balance). The general fund is the chief operating fund of the City. At the end of the most recent fiscal year, the general fund reported an ending fund balance of $3.7 million, a decrease of $1.1 million from the prior year. While total revenues of $19.2 million exceeded total expenditures of $18.9 million, the general fund transferred $2.1 million out to other funds causing the decrease in fund balance.

CITY OF BELLAIRE, TEXAS MANAGEMENT’S DISCUSSION AND ANALYSIS (continued)
10
Governmental Funds (continued) These transfers were budgeted transfers for capital outlays, and the ending fund balance exceeded the City’s budgeted ending fund balance of $3.6 million. Unassigned fund balance of $3.7 million represents 20% of total general fund expenditures. The debt service fund has a total fund balance of $0.5 million at year-end, all of which is restricted for the payment of debt service. The net decrease in fund balance during the current year in the debt service fund was $18,369. The City’s capital improvement fund expended $2.3 million on capital projects and received transfers in of $1.7 million, resulting in an ending fund balance of $5.0 million. The City’s capital bond fund expended $16.4 million on street, drainage, and park improvements, resulting in an ending fund balance of $35.8 million. The City’s METRO fund reported an ending fund balance of $1.3 million, which was a decrease of $0.9 million. This decrease is a result of the City spending more on street projects than the funds received from METRO. The City’s vehicle and equipment replacement fund reported an ending fund balance of $2.7 million, an increase of $1.7 million. This increase is a result of a $1.5 million transfers in offset by expending $0.8 million on vehicles and equipment. These fund balances will be used for Council-approved improvements and projects. Proprietary Funds The City’s proprietary fund provides the same type of information found in the government-wide financial statements. The City’s enterprise fund operating expenses exceeded operating revenues by $0.2 million. Governmental funds contributed $8.5 million in capital assets and the enterprise fund transferred $2.7 million to the governmental funds to help finance previously issued debt and provide funds for future capital improvements. The unrestricted net position of the enterprise fund at the end of the year amounted to $0.2 million or 2.6% of operating expenses for the fund. General Fund Budgetary Highlights Actual general fund revenues were less than original and amended budgeted revenues by $0.5 million. General fund expenditures were less than the final budget by $0.6 million primarily due to less than expected expenditures in public safety, public works, and culture and recreation. The general fund net decrease in fund balance was $1.1 million, $0.1 million less than budgeted, with an ending fund balance of $3.7 million. The fund balance of $3.7 million represents 20% of total general fund expenditures. The City’s fund balance policy is to strive to maintain a minimum general fund balance equal to sixty (60) days of normal operating expenditures, which would equate to the fund balance representing approximately 16.5% of total expenditures. The City’s fiscal year 2017 general fund budget was structurally balanced with budgeted recurring revenues slightly exceeding budgeted recurring expenses. As the general fund was carrying a fund balance exceeding the sixty (60) day minimum at the end of fiscal year 2017, the fiscal year 2018 budget planned to use some of that fund balance as a resource to fund transfers to other funds for capital outlays. The actual ending fund balance at September 30, 2017 is $0.1 million greater than budgeted.

CITY OF BELLAIRE, TEXAS MANAGEMENT’S DISCUSSION AND ANALYSIS (continued)
11
Capital Asset and Debt Administration The City’s capital assets for its governmental and business-type activities as of September 30, 2017, amounted to $145.6 million (net of accumulated depreciation). This investment in capital assets includes a variety of capital assets and infrastructure. Capital asset balances increased by approximately $15.2 million from the prior year due to contributions and construction of infrastructure. Major capital asset events during the most recent fiscal year included drainage projects, design and construction of new city hall/police/court facilities, new vehicles, Evelyn’s Park, street and sidewalk improvements, Nature Discovery Center, and water and wastewater projects. The following table shows the balances at September 30, 2017 and 2016 (in $000’s):
2017 2016 2017 2016 2017 2016
Capital assets not being depreciated:Land and intangibles 5,668$ 5,668$ 256$ 256$ 5,925$ 5,925$ Construnciton in progress 11,806 17,122 7,272 162 19,078 17,284
Capital assets, net of depreciation:Infrastructure 71,535 57,284 34,165 34,609 105,700 91,894 Buildings and improvements 5,525 5,303 4,392 4,769 9,918 10,071 Vehicles and equipment 2,109 1,975 2,902 3,310 5,011 5,285
96,643$ 87,353$ 48,987$ 43,106$ 145,631$ 130,459$
Governmental Activities Business-type Activities Total
Additional information on the City’s capital assets can be found in Note 4 to the basic financial statements. Long-term Liabilities At the end of the most recent fiscal year, the City had total bonded debt outstanding of $118.3 million, all of which is general obligation debt. This is an increase from the prior year of $41.0 million, due to the issuance of capital-related debt offset by scheduled principal payments made during the year. The entire amount of bonded debt is backed by the full faith and credit of the City. A schedule of long-term liabilities at September 30, 2017 and 2016 follows (in $000’s):
2017 2016 2017 2016 2017 2016
Bonds payable:General obligation bonds 118,295$ 77,310$ -$ -$ 118,295$ 77,310$ Premiums 3,828 2,228 - - 3,828 2,228
Other long-term liabilities:Capital lease 723 - - - 723 - Compensated absences 700 689 39 36 739 725 Net OPEB obligation 263 237 30 27 293 264 Net pension liability 12,908 13,245 1,537 1,576 14,445 14,820
136,717$ 93,709$ 1,606$ 1,639$ 138,323$ 95,348$
Governmental Activities Business-type Activities Total
The City maintains a “AAA” rating from Standard & Poor’s Ratings Services for general obligation debt. Additional information on the City’s long-term debt can be found in Note 5 to the basic financial statements.

CITY OF BELLAIRE, TEXAS MANAGEMENT’S DISCUSSION AND ANALYSIS (continued)
12
Economic Factors and Next Year’s Budget and Rates As an enclave of Houston, the economy of the City is directly linked to the greater Houston area. The unemployment rate for the greater Houston area at December 31, 2016 was 4.3% as compared to the United States' average unemployment rate of 4.1% per the U.S. Bureau of Labor Statistics. This represents a decrease over the greater Houston area's December 31, 2016 unemployment rate of 5.3%, while the national unemployment rate decreased during 2017 from 4.5% at December 31, 2016. The rising unemployment in the Houston area experienced in 2016 as a result of depressed oil and natural gas prices has abated during 2017 and the greater Houston area's unemployment rate has trended back toward the national average. Each year the budget is prepared on key objectives and assumptions. The annual budget process is part of a broader long-term strategic planning process that includes at its foundation a comprehensive plan for the City and priorities established by City Council. Hurricane Harvey, a category 4 major hurricane made landfall on August 26, 2017 in Rockport, Texas, approximately 150 miles southwest of the City. After landfall, its speed slowed dramatically to a crawl. For about two days, the storm stalled just inland, dropping very heavy rainfall and causing widespread flash flooding in the Houston area, including in Bellaire. Initial assessments indicate approximately 2,400 of the approximately 6,300 homes in Bellaire, or approximately 38%, had some level of water damage. The City had exceptionally large amounts of debris to remove from public right-of-ways, and the City suffered substantial damage to its wastewater treatment plant. The City will incur significant unbudgeted costs associated with recovery and repair. It is expected that most of our costs will be reimbursable through the City’s flood insurance and the Federal Emergency Management Agency, however, not all costs will be reimbursed. Total expenditures to the City as a result of Hurricane Harvey are approximately $3.24 million. As of January 31, 2018, the City has received $601,499 in reimbursement; $301,588 from Texas Municipal League's Intergovernmental Risk Pool, the City’s insurance provider. Although the Federal Emergency Management Agency (FEMA) has reimbursed the City $299,911, the City still anticipates over $2 million of additional reimbursements once the debris removal project is completed and emergency protective measure expenditures are approved by FEMA. The original draft of the fiscal year 2018 budget included a transfer of $500,000 from the general fund to the capital improvement fund for the City’s pavement management program. Due in part to the anticipated expenditures associated with Hurricane Harvey, the $500,000 transfer was eliminated in the final budget approved by City Council and will remain as a contingency reserve with any unspent amounts added to fund balance. The property tax rate for fiscal year 2017 (tax year 2016) increased by approximately 1.8% to $0.3874 per $100 of assessed value. The property tax rate increased by 7.4% to $0.4159 per $100 of assessed value for fiscal year 2018 (tax year 2017). The enterprise fund water rates increased in fiscal year 2017 by approximately 13.5% and by approximately 17.5% in fiscal year 2018. These increases are necessary to catch up to increased costs of providing services. Requests for Information This financial report is designed to provide a general overview of the City’s finances for all those with an interest in the City’s finances. Questions concerning any of the information should be addressed to the Chief Financial Officer, City of Bellaire, 7008 South Rice Avenue, Bellaire, Texas 77401.

13
Basic Financial Statements

14
(This page intentionally left blank.)

15
CITY OF BELLAIRE, TEXASSTATEMENT OF NET POSITIONSeptember 30, 2017
Governmental Activities
Business-type Activities Reconciliation Total
AssetsCash and cash equivalents 53,281,260$ 75,651$ -$ 53,356,911$ Receivables, net of allowance 1,733,657 1,173,330 - 2,906,987Interest receivable 7,115 45 - 7,160Prepaid items 1,631 726,815 - 728,446Nondepreciable capital assets 17,474,349 7,528,034 - 25,002,383Depreciable capital assets, net of depreciation 79,168,712 41,459,455 - 120,628,167Total Capital Assets 96,643,061 48,987,489 - 145,630,550 Total Assets 151,666,724 50,963,330 - 202,630,054
Deferred Outflows of Resources
Deferred charge on refunding 2,456,752 - - 2,456,752 Deferred outflows - pension 4,052,897 499,912 - 4,552,809
Total Deferred Outflows of Resources 6,509,649 499,912 - 7,009,561
Liabilities
Accounts payable and accrued expenses 4,978,769 480,673 - 5,459,442 Customer deposits - 90,055 - 90,055 Accrued interest payable 503,545 - - 503,545 Long-term liabilities due within one year 5,359,248 32,664 - 5,391,912 Long-term liabilities due in more than one year 118,449,689 36,280 - 118,485,969 Net pension liability 12,908,263 1,536,678 - 14,444,941 Total Liabilities 142,199,514 2,176,350 - 144,375,864
Deferred Inflows of Resources
Deferred inflows - pension 691,971 80,491 - 772,462 Total Deferred Inflows of Resources 691,971 80,491 - 772,462
Net Position Net investment in capital assets 36,737,254 48,987,489 (23,621,897) 62,102,846 Restricted for:
Special revenue Communications from public education government fees 288,333 - - 288,333 Police and fire department vehicles and equipment 30,802 - - 30,802 Library supplies and equipment 14,357 - - 14,357 Municipal court technology 103,813 - - 103,813 Parks and recreation equipment 12,253 - - 12,253
Debt service 59,629 - - 59,629 Capital projects
Metropolitan streets or METRO 1,293,130 - - 1,293,130 Evelyn's Park improvement 14,286 - - 14,286
Unrestricted (23,268,969) 218,912 23,621,897 571,840 Total Net Position 15,284,888$ 49,206,401$ -$ 64,491,289$
See Notes To Basic Financial Statements.
Primary Government

16
CITY OF BELLAIRE, TEXASSTATEMENT OF ACTIVITIES
For the Year Ended September 30, 2017
Functions/Programs Expenses Charges for
Services
Operating Grants and
Contributions
Primary GovernmentGovernmental Activities:
General government 4,863,991$ 1,874,666$ -$
Public safety 9,717,944 591,717 30,508
Public works 1,568,448 - 1,313,098
Culture and recreation 6,957,959 930,680 256,700
Interest on long-term debt 4,323,982 - -
Total Governmental Activities 27,432,324 3,397,063 1,600,306
Business-type Activities:
Water system 5,779,152 4,009,291 102,310
Sewer system 1,193,801 2,355,069 -
Solid waste 1,342,498 1,687,841 -
Total business-type activities 8,315,451 8,052,201 102,310 Total Primary Government 35,747,775$ 11,449,264$ 1,702,616$
General Revenues:Taxes:
Property taxes
Sales and use taxes
Franchise taxes
Investment income
Miscellaneous
Transfers
Total General RevenuesChange in net position
Net Position - BeginningNet Position - Ending
See Notes to Basic Financial Statements.
Program Revenue

17
Net (Expense) Revenue and Changes in Net Position
Primary Government
Governmental Activities
Business-type Activities Total
(2,989,325)$ -$ (2,989,325)$
(9,095,719) - (9,095,719)
(255,350) - (255,350)
(5,770,579) - (5,770,579)
(4,323,982) - (4,323,982)
(22,434,955) - (22,434,955)
- (1,667,551) (1,667,551)
- 1,161,268 1,161,268
- 345,343 345,343
- (160,940) (160,940) (22,434,955) (160,940) (22,595,895)
18,524,717 - 18,524,717
2,241,860 - 2,241,860
1,438,825 - 1,438,825
288,552 936 289,488
173,051 58,856 231,907
(5,783,927) 5,726,490 (57,437.00)
16,883,078 5,786,282 22,669,360
(5,551,877) 5,625,342 73,465
20,836,765 43,581,059 64,417,824 15,284,888$ 49,206,401$ 64,491,289$

18
CITY OF BELLAIRE, TEXASBALANCE SHEET
GOVERNMENTAL FUNDS
September 30, 2017
General Debt Service Capital Bond
AssetsCash and cash equivalents 3,966,954$ 470,499$ 39,133,289$
Receivables, net of allowance 1,158,779 92,408 - Interest receivable 6,848 267 - Prepaid items 1,631 - -
Total Assets 5,134,212$ 563,174$ 39,133,289$
LiabilitiesAccounts payable and accrued liabilities 965,546$ -$ 3,294,647$
Total Liabilities 965,546 - 3,294,647
Deferred Inflows of ResourcesUnavailable revenues - other 289,551 - -
Unavailable revenues - property taxes 178,180 92,408 -
Total Deferred Inflows of Resources 467,731 92,408 -
Fund BalancesNonspendable 1,631 - - Restricted:
Public, educational, and governmental programming fees - - -
Police and fire department vehicles and equipment - - - Library supplies and equipment - - -
Municipal court technology - - -
Parks and recreation equipment - - -
Debt service - 470,766 -
Metropolitan streets or METRO - - -
Drainage and city facilities - - 35,838,642
Evelyn's Park improvement - - - Committed:
City facilities and equipment - - - Unassigned 3,699,304 - -
Total Fund Balances 3,700,935 470,766 35,838,642
Total Liabilities, Deferred Inflows, and Fund Balances 5,134,212$ 563,174$ 39,133,289$
See Notes to Basic Financial Statements.

19
Non-Major Governmental
Funds Total
9,710,518$ 53,281,260$
482,470 1,733,657 - 7,115 - 1,631
10,192,988$ 55,023,663$
718,574$ 4,978,767$
718,574 4,978,767
- 289,551
- 270,588
- 560,139
- 1,631
288,333 288,333
30,802 30,802 14,357 14,357
103,813 103,813
12,253 12,253
- 470,766
1,293,130 1,293,130
- 35,838,642
14,286 14,286
7,717,440 7,717,440 - 3,699,304
9,474,414 49,484,757
10,192,988$ 55,023,663$

20
(This page intentionally left blank.)
21
CITY OF BELLAIRE, TEXASRECONCILIATION OF THE GOVERNMENTAL FUNDS BALANCE SHEET TO THE STATEMENT OF NET POSITIONSeptember 30, 2017
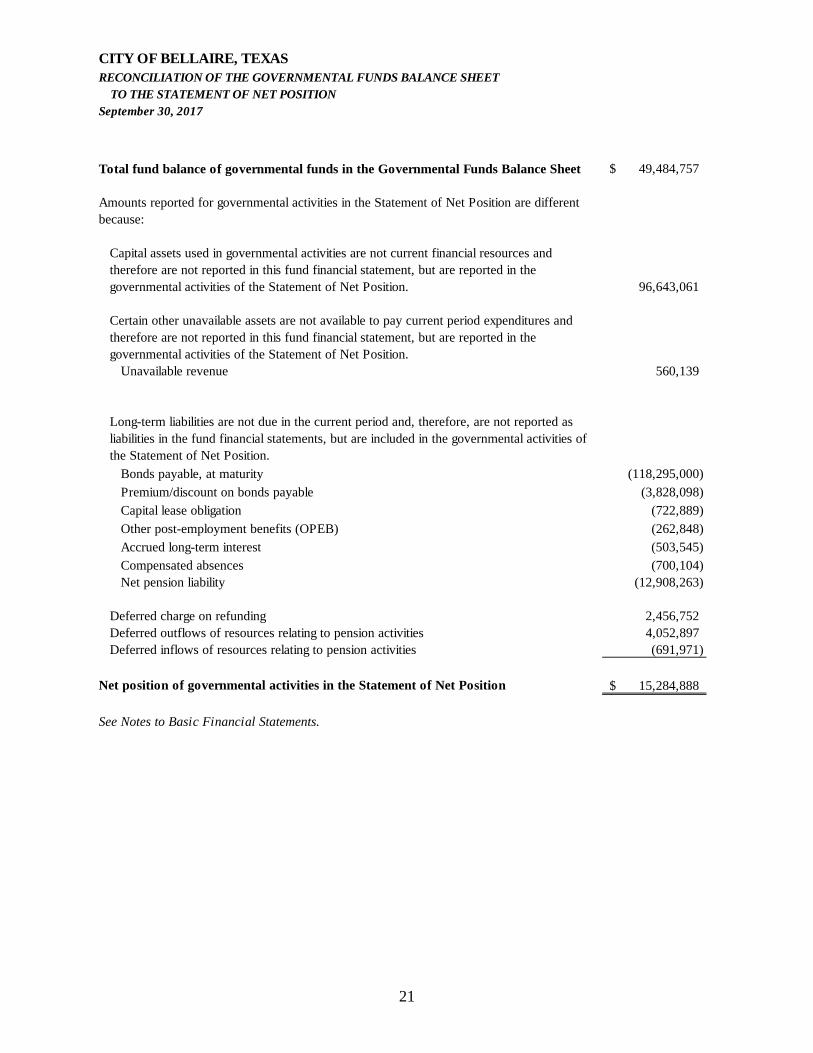
Total fund balance of governmental funds in the Governmental Funds Balance Sheet 49,484,757$
Amounts reported for governmental activities in the Statement of Net Position are different because:
Capital assets used in governmental activities are not current financial resources and therefore are not reported in this fund financial statement, but are reported in the governmental activities of the Statement of Net Position. 96,643,061
Certain other unavailable assets are not available to pay current period expenditures and therefore are not reported in this fund financial statement, but are reported in the governmental activities of the Statement of Net Position.
Unavailable revenue 560,139
Long-term liabilities are not due in the current period and, therefore, are not reported as liabilities in the fund financial statements, but are included in the governmental activities of the Statement of Net Position.
Bonds payable, at maturity (118,295,000)
Premium/discount on bonds payable (3,828,098)
Capital lease obligation (722,889)
Other post-employment benefits (OPEB) (262,848)
Accrued long-term interest (503,545)
Compensated absences (700,104) Net pension liability (12,908,263)
Deferred charge on refunding 2,456,752 Deferred outflows of resources relating to pension activities 4,052,897 Deferred inflows of resources relating to pension activities (691,971)
Net position of governmental activities in the Statement of Net Position 15,284,888$
See Notes to Basic Financial Statements.

22
CITY OF BELLAIRE, TEXASSTATEMENT OF REVENUES, EXPENDITURES AND CHANGES IN FUND BALANCESGOVERNMENTAL FUNDSFor the Year Ended September 30, 2017
General Fund Debt Service Capital Bond RevenuesTaxes:
Property taxes 12,161,757$ 6,268,910$ -$ Sales and use taxes 2,241,860 - - Franchise taxes 1,374,918 - -
Fines and forfeitures 679,883 - - Licenses and permits 1,199,500 - - Charges for services 1,229,988 - - Investment earnings 47,017 4,164 219,843 Intergovernmental 202,324 - - Other 37,786 - - Total Revenues 19,175,033 6,273,074 219,843
ExpendituresCurrent:
General government 4,654,894 - - Public safety 8,967,042 - - Public works 1,054,450 - - Culture and recreation 4,217,423 - -
Capital outlay - - 16,416,737 Debt service:
Principal - 4,510,000 - Interest and other charges - 3,059,476 - Bond issuance costs and fees - - 935,310
Total Expenditures 18,893,809 7,569,476 17,352,047
Revenues over (under) expenditures 281,224 (1,296,402) (17,132,204)
Other Financing Sources (Uses)Proceeds from issuance of general
obligation refunding bonds - 9,690,000 - Proceeds from issuance of capital
related debt - - 44,820,000Proceeds from capital leases - - -
Premium on issuance of bonds - 265,613 1,469,314Payment to bond refunding
escrow agent - (9,942,235) - Transfers in 624,000 1,264,655 - Transfers out (2,057,000) - (314,655)Sale of capital assets 37,184 - - Total Other Financing Sources (Uses) (1,395,816) 1,278,033 45,974,659
Net changes in fund balances (1,114,592) (18,369) 28,842,455 Fund Balances - Beginning 4,815,527 489,135 6,996,187 Fund Balances - Ending 3,700,935$ 470,766$ 35,838,642$
See Notes to Basic Financial Statements.

23
Non-Major Governmental
Funds
Total Governmental
Funds
-$ 18,430,667$ - 2,241,860
63,907 1,438,825 43,416 723,299
- 1,199,500 - 1,229,988
17,528 288,552 1,110,774 1,313,098
408,721 446,507 1,644,346 27,312,296
21,614 4,676,508 94,881 9,061,923
- 1,054,450 76,660 4,294,083
5,075,179 21,491,916
- 4,510,000 - 3,059,476 - 935,310
5,268,334 49,083,666
(3,623,988) (21,771,370)
- 9,690,000
- - 44,820,000
787,666 787,666
- 1,734,927
- (9,942,235) 3,229,000 5,117,655
- (2,371,655) - 37,184
4,016,666 49,873,542
392,678 28,102,172 9,081,736 21,382,585 9,474,414$ 49,484,757$
24
CITY OF BELLAIRE, TEXASRECONCILIATION OF THE STATEMENT OF REVENUES, EXPENDITURES AND CHANGES IN FUND BALANCES OF GOVERNMENTAL FUNDS TO THE STATEMENT OF ACTIVITIESFor the Year Ended September 30, 2017
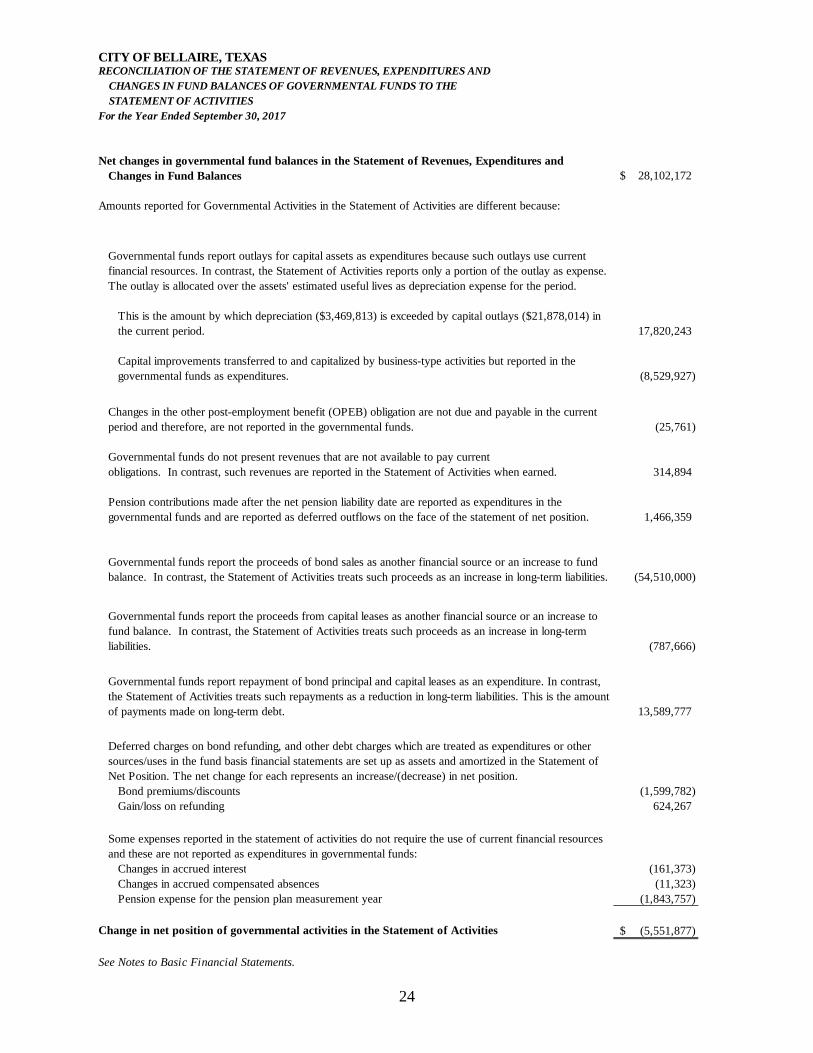
Net changes in governmental fund balances in the Statement of Revenues, Expenditures and Changes in Fund Balances 28,102,172$
Amounts reported for Governmental Activities in the Statement of Activities are different because:
Governmental funds report outlays for capital assets as expenditures because such outlays use current financial resources. In contrast, the Statement of Activities reports only a portion of the outlay as expense. The outlay is allocated over the assets' estimated useful lives as depreciation expense for the period.
This is the amount by which depreciation ($3,469,813) is exceeded by capital outlays ($21,878,014) in the current period. 17,820,243
Capital improvements transferred to and capitalized by business-type activities but reported in the governmental funds as expenditures. (8,529,927)
Changes in the other post-employment benefit (OPEB) obligation are not due and payable in the current period and therefore, are not reported in the governmental funds. (25,761)
Governmental funds do not present revenues that are not available to pay current obligations. In contrast, such revenues are reported in the Statement of Activities when earned. 314,894
Pension contributions made after the net pension liability date are reported as expenditures in the governmental funds and are reported as deferred outflows on the face of the statement of net position. 1,466,359
Governmental funds report the proceeds of bond sales as another financial source or an increase to fund balance. In contrast, the Statement of Activities treats such proceeds as an increase in long-term liabilities. (54,510,000)
Governmental funds report the proceeds from capital leases as another financial source or an increase to fund balance. In contrast, the Statement of Activities treats such proceeds as an increase in long-term liabilities. (787,666)
Governmental funds report repayment of bond principal and capital leases as an expenditure. In contrast, the Statement of Activities treats such repayments as a reduction in long-term liabilities. This is the amount of payments made on long-term debt. 13,589,777
Deferred charges on bond refunding, and other debt charges which are treated as expenditures or other sources/uses in the fund basis financial statements are set up as assets and amortized in the Statement of Net Position. The net change for each represents an increase/(decrease) in net position.
Bond premiums/discounts (1,599,782)Gain/loss on refunding 624,267
Some expenses reported in the statement of activities do not require the use of current financial resources and these are not reported as expenditures in governmental funds:
Changes in accrued interest (161,373)Changes in accrued compensated absences (11,323)Pension expense for the pension plan measurement year (1,843,757)
Change in net position of governmental activities in the Statement of Activities (5,551,877)$
See Notes to Basic Financial Statements.

25
CITY OF BELLAIRE, TEXASSTATEMENT OF NET POSITION
PROPRIETARY FUND
September 30, 2017
Business-type Activities
Enterprise
AssetsCurrent assets:
Cash and cash equivalents 75,651$
Accounts receivable, net 1,173,330
Interest receivable 45
Prepaid items 726,815
Total Current Assets 1,975,841
Non-current assets:
Capital assets not being depreciated:
Land 256,148
Construction in progress 7,271,886
Other capital assets, net of depreciation:
Buildings and improvements 12,039,531
Infrastructure 82,627,490
Vehicles and equipment 4,909,163
Less: accumulated depreciation (58,116,729)
Total Non-current Assets 48,987,489
Total Assets 50,963,330
Deferred Outflows of ResourcesDeferred outflows related to pension activities 499,912
Total Deferred Outflows of Resources 499,912
LiabilitiesCurrent liabilities:
Accounts payable 480,673
Deposits 90,055
Long-term liabilities due in less than one year 32,664
Total Current Liabilities 603,392
Non-current liabilities:
Net pension liability 1,536,678
Long-term liabilities due in more than one year 36,280
Total Non-current Liabilities 1,572,958
Total Liabilities 2,176,350
Deferred Inflows of ResourcesDeferred inflows related to pension activities 80,491
Total Deferred Inflows of Resources 80,491
Net PositionInvestment in capital assets 48,987,489
Unrestricted 218,912
Total Net Position 49,206,401$
See Notes to Basic Financial Statements.

26
CITY OF BELLAIRE, TEXASSTATEMENT OF REVENUES, EXPENSES AND CHANGES IN FUND NET POSITION
PROPRIETARY FUND
For the Year Ended September 30, 2017
Business-type Activities
Enterprise
Operating RevenuesWater services 4,009,291$
Sewer services 2,355,069
Solid waste services 1,687,841
Miscellaneous 58,856
Total Operating Revenues 8,111,057
Operating ExpensesPersonnel services 1,674,453
Supplies and materials 2,207,706
Contractual services 1,344,094
Repairs and maintenance 567,303
Depreciation 2,493,630
Total Operating Expenses 8,287,186
Operating Loss (176,129)
Non-operating Revenues (Expenses)Interest income 936
Loss on disposal of capital assets (28,265)
Intergovernmental revenue 102,310
Total Non-operating Revenues 74,981
Loss Before Capital Contributions and Transfers (101,148)
Capital contributions 8,472,490
Transfers out (2,746,000)
Change in net position 5,625,342
Total Net Position - Beginning 43,581,059 Total Net Position - Ending 49,206,401$
See Notes to Basic Financial Statements.

27
CITY OF BELLAIRE, TEXASSTATEMENT OF CASH FLOWSPROPRIETARY FUNDFor the Year Ended September 30, 2017
Business-type Activities
Enterprise
Cash Flows From Operating ActivitiesReceipts from customers and users 7,877,369$
Payments to suppliers (3,981,682)
Payments to employees (1,613,274)
Net Cash Provided By Operating Activities 2,282,413
Cash Flows From Noncapital Financing ActivitiesIntergovernmental revenue 102,310 Transfers to other funds (2,746,000)
Net Cash Used By Noncapital Financing Activities (2,643,690)
Cash Flows From Investing ActivitiesInterest income 891 Net Cash Used By Investing Activities 891
Net decrease in cash and cash equivalents (360,386) Cash and Cash Equivalents - Beginning 436,037
Cash and Cash Equivalents - Ending 75,651$
Reconciliation of Operating Loss to Net Cash Provided By Operating Activities
Operating loss (176,129)$ Adjustments to reconcile operating loss to net cash provided by operating activities:
Depreciation 2,493,630 (Increase) decrease in accounts receivable (231,594)
(Increase) decrease in prepaid expenses 5,854
(Increase) decrease in other assets 2,500
(Increase) decrease in deferred outflows relating to pension activities 102,044 (Increase) decrease in accounts payable 131,567 Increase (decrease) in accrued compensated absences 2,916 Increase (decrease) in other post-employment benefit liability 2,996 Increase (decrease) in customer deposits (4,594) Increase (decrease) in net pension liability (39,133) Increase (decrease) in deferred inflows relating to pension activities (7,644)
Net Cash Provided By Operating Activities 2,282,413$
Non-cash TransactionsCapital assets transferred to enterprise fund from governmental activities 8,472,490$
See Notes to Basic Financial Statements.

CITY OF BELLAIRE, TEXAS NOTES TO THE BASIC FINANCIAL STATEMENTS
28
Note 1 - Summary of Significant Accounting Policies A. Financial Reporting Entity The City of Bellaire, Texas (the "City") was incorporated under the laws of the State of Texas on June 24, 1918. The City operates under a "Home Rule Charter" which provides for a "Council-Manager" form of government. The City Council is the governing body of the City. The City Manager is appointed by a majority vote of the City Council and is responsible to the Council for the administration of all the affairs of the City. The City Manager is responsible for appointment and removal of department directors and employees, supervision and control of all City departments, and preparation of the annual budget. The City provides the following services: public safety to include police, fire, and emergency medical services; streets; sanitation; water and sewer services; recreation; public improvements; planning and zoning; and general administration. The City is an independent political subdivision of the State of Texas governed by an elected council and a mayor and is considered a primary government. As required by generally accepted accounting principles, these basic financial statements have been prepared after considering the potential for inclusion of other entities, organizations, or functions as part of the City's financial reporting entity. No other entities have been included in the City's reporting entity. Additionally, as the City is considered a primary government for financial reporting purposes, its activities are not considered a part of any other governmental or other type of reporting entity. Considerations regarding the potential for inclusion of other entities, organizations, or functions in the City's financial reporting entity are based on criteria prescribed by generally accepted accounting principles. These same criteria are evaluated in considering whether the City is a part of any other governmental or other type of reporting entity. The overriding elements associated with prescribed criteria considered in determining that the City's financial reporting entity status is that of a primary government are that it has a separately elected governing body, it is legally separate, and it is fiscally independent of other state and local governments. Additionally prescribed criteria under generally accepted accounting principles include considerations pertaining to organizations for which the primary government is financially accountable and considerations pertaining to organizations for which the nature and significance of their relationship with the primary government are such that exclusion would cause the reporting entity's financial statements to be misleading or incomplete. B. Government Wide Financial Statements The government-wide financial statements (i.e., the Statement of Net Position and the Statement of Activities) report information about the City as a whole. These statements include all activities of the primary government. Governmental activities, which normally are supported by taxes, intergovernmental revenues, and other nonexchange transactions, are reported separately from business-type activities, which rely to a significant extent on fees and charges to external customers for support. C. Basis of Presentation - Government-Wide Financial Statements While separate government-wide and fund financial statements are presented, they are interrelated. The governmental activities column incorporates data from governmental funds, while business-type activities incorporate data from the City's enterprise funds. Separate financial statements are provided for governmental funds and proprietary funds.

CITY OF BELLAIRE, TEXAS NOTES TO THE BASIC FINANCIAL STATEMENTS (continued)
29
Note 1 - Summary of Significant Accounting Policies (continued) C. Basis of Presentation - Government-Wide Financial Statements (continued) As a general rule, the effect of interfund activity has been eliminated from the government-wide financial statements. Exceptions to this general rule are payments in lieu of taxes where the amounts are reasonably equivalent in value to the interfund services provided and other charges between the City's water and wastewater functions and various other functions of the City. Elimination of these charges would distort the direct costs and program revenues reported for the various functions concerned. D. Basis of Presentation - Fund Financial Statements The fund financial statements provide information about the City's funds. Separate statements for each fund category - governmental and proprietary - are presented. The emphasis of fund financial statements is on major governmental and enterprise funds, each displayed in a separate column. All remaining governmental and enterprise funds are aggregated and reported as non-major funds. The City reports the following governmental funds: The general fund is used to account for and report all financial resources not accounted for and reported in another fund. The principal sources of revenues include local property taxes, sales and franchise taxes, licenses and permits, fines and forfeitures, and charges for services. Expenditures include general government, public safety, public works, and culture and recreation. The general fund is always considered a major fund for reporting purposes. The debt service fund is used to account for the payment of interest and principal on all long-term debt of the City. The primary source of revenue for debt service is local property taxes. The debt service fund is considered a major fund for reporting purposes. The capital projects funds are used to account for the expenditures of resources accumulated from the sale of bonds and related interest earnings for capital improvement projects. The capital projects funds include the capital improvement fund, which accounts for those projects funded by tax revenue; the capital bond fund, which includes those projects funded with bond proceeds; the metro fund; and the vehicle and equipment replacement fund, which includes those projects funded with revenue from other governmental sources. The capital bond fund is considered a major governmental fund for reporting purposes. The capital improvement fund, the metro fund, and vehicle and equipment replacement fund are considered non-major funds for reporting purposes. The special revenue fund is used to account for and report the proceeds of specific revenue sources that are restricted or committed to expenditure for specified purposes other than debt service or capital projects. The special revenue fund is considered s non-major fund for reporting purposes. The City reports the following proprietary funds: The enterprise fund is used to account for the operations that provide water and wastewater collection and wastewater treatment, as well as solid waste services. The services are financed and operated in a manner similar to private business enterprises where the intent of the governing body is that the costs (expenses including depreciation) of providing goods or services to the general public on a continuing basis will be financed or recovered primarily through user charges. The enterprise fund is considered a major fund for reporting purposes.
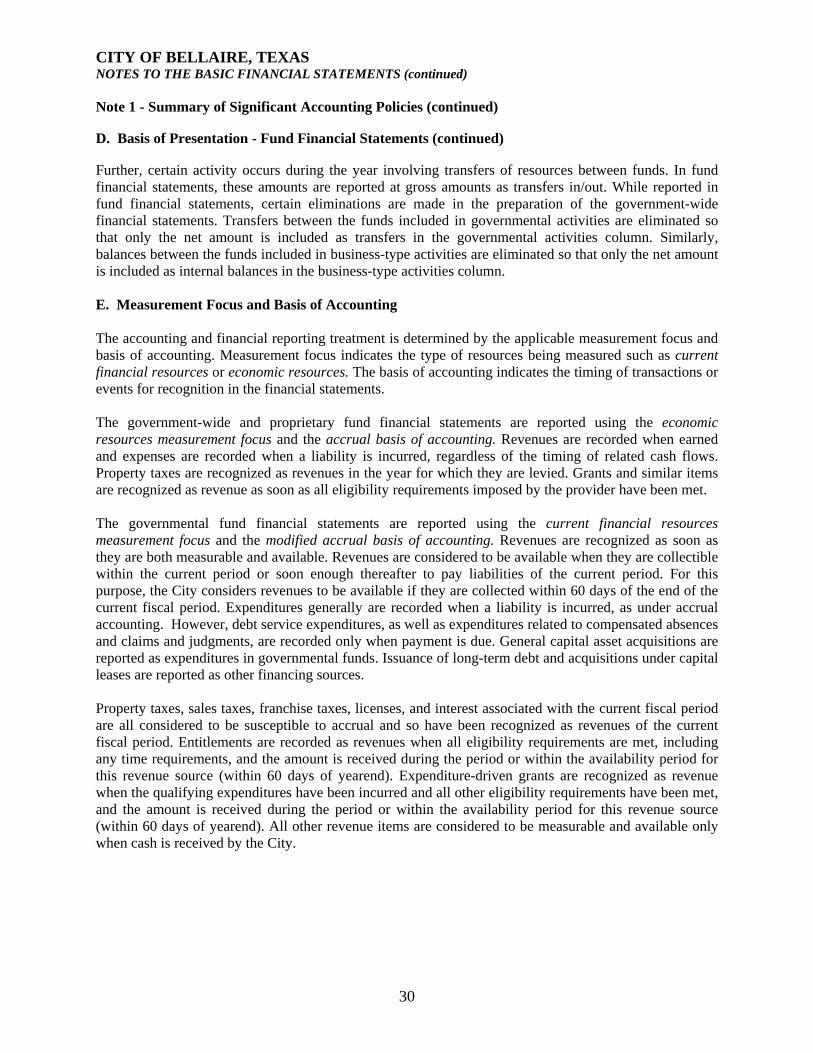
CITY OF BELLAIRE, TEXAS NOTES TO THE BASIC FINANCIAL STATEMENTS (continued)
30
Note 1 - Summary of Significant Accounting Policies (continued) D. Basis of Presentation - Fund Financial Statements (continued) Further, certain activity occurs during the year involving transfers of resources between funds. In fund financial statements, these amounts are reported at gross amounts as transfers in/out. While reported in fund financial statements, certain eliminations are made in the preparation of the government-wide financial statements. Transfers between the funds included in governmental activities are eliminated so that only the net amount is included as transfers in the governmental activities column. Similarly, balances between the funds included in business-type activities are eliminated so that only the net amount is included as internal balances in the business-type activities column. E. Measurement Focus and Basis of Accounting The accounting and financial reporting treatment is determined by the applicable measurement focus and basis of accounting. Measurement focus indicates the type of resources being measured such as current financial resources or economic resources. The basis of accounting indicates the timing of transactions or events for recognition in the financial statements. The government-wide and proprietary fund financial statements are reported using the economic resources measurement focus and the accrual basis of accounting. Revenues are recorded when earned and expenses are recorded when a liability is incurred, regardless of the timing of related cash flows. Property taxes are recognized as revenues in the year for which they are levied. Grants and similar items are recognized as revenue as soon as all eligibility requirements imposed by the provider have been met. The governmental fund financial statements are reported using the current financial resources measurement focus and the modified accrual basis of accounting. Revenues are recognized as soon as they are both measurable and available. Revenues are considered to be available when they are collectible within the current period or soon enough thereafter to pay liabilities of the current period. For this purpose, the City considers revenues to be available if they are collected within 60 days of the end of the current fiscal period. Expenditures generally are recorded when a liability is incurred, as under accrual accounting. However, debt service expenditures, as well as expenditures related to compensated absences and claims and judgments, are recorded only when payment is due. General capital asset acquisitions are reported as expenditures in governmental funds. Issuance of long-term debt and acquisitions under capital leases are reported as other financing sources. Property taxes, sales taxes, franchise taxes, licenses, and interest associated with the current fiscal period are all considered to be susceptible to accrual and so have been recognized as revenues of the current fiscal period. Entitlements are recorded as revenues when all eligibility requirements are met, including any time requirements, and the amount is received during the period or within the availability period for this revenue source (within 60 days of yearend). Expenditure-driven grants are recognized as revenue when the qualifying expenditures have been incurred and all other eligibility requirements have been met, and the amount is received during the period or within the availability period for this revenue source (within 60 days of yearend). All other revenue items are considered to be measurable and available only when cash is received by the City.

CITY OF BELLAIRE, TEXAS NOTES TO THE BASIC FINANCIAL STATEMENTS (continued)
31
Note 1 - Summary of Significant Accounting Policies (continued) F. Assets, Liabilities, Deferred Outflows/Inflows of Resources, and Net Position/Fund Balance 1. Cash and Cash Equivalents The City's cash and cash equivalents are considered to be cash on hand, demand deposits, balances in privately managed public funds investment pools (“TexPool”, “TexPool Prime”, and “TexSTAR”) and short-term investments with original maturities of three months or less from the date of acquisition. For the purpose of the statement of cash flows, the proprietary fund types consider temporary investments with maturities of three months or less when purchased to be cash equivalents. Cash balances from all funds are combined and invested in money market accounts, investment pools, and U.S. Government securities. Earnings from these investments are allocated to each fund based on month end equity balances in the investment pool. The City’s local government investment pools are recorded at amortized costs as permitted by GASB Statement No. 79, Certain Investment Pools and Pool Participants. 2. Investments The City reports all investments at fair value based on quoted market prices at year-end date. The City categorizes fair value measurements of its investments based on the hierarchy established by generally accepted accounting principles. The fair value hierarchy, which has three levels, is based on the valuation inputs used to measure an asset’s fair value: Level 1 inputs are quoted prices in active markets for identical assets; Level 2 inputs are significant other observable inputs; Level 3 inputs are significant unobservable inputs. The City has adopted a written investment policy regarding the investment of its funds as defined in the Public Funds Investment Act, Chapter 2256, Texas Government Code. In summary, the City is authorized to invest in the following:
Direct obligations of the U.S. Government Fully collateralized certificates of deposit Mutual funds of specific type Statewide investment pools
3. Inventories and Prepaid Items The costs of governmental fund type inventories are recorded as expenditures when the related liability is incurred (i.e., the purchase method). Certain payments to vendors reflect costs applicable to future accounting periods (prepaid expenditures) are also recognized as expenditures when utilized.

CITY OF BELLAIRE, TEXAS NOTES TO THE BASIC FINANCIAL STATEMENTS (continued)
32
Note 1 - Summary of Significant Accounting Policies (continued) F. Assets, Liabilities, Deferred Outflows/Inflows of Resources, and Net Position/Fund Balance (continued) 4. Capital Assets Capital assets, which include property, plant, equipment, and infrastructure assets (e.g., roads, bridges, sidewalks, and similar items), are reported in the applicable governmental or business-type activities columns in the government-wide financial statements. In accordance with GASB Statement No. 34, infrastructure has been capitalized retroactively. Capital assets are defined by the City as assets with an initial, individual cost of more than $10,000 and an estimated useful life in excess of four years. Such assets are recorded at historical cost or estimated historical cost if purchased or constructed. Donated capital assets, donated works of art and similar items, and capital assets received in a service concession arrangement are recorded at acquisition value. Major outlays for capital assets and improvements are capitalized as projects are constructed. The cost of a significant portion of the capital assets in the infrastructure category has been estimated based on management's estimated historical cost. Interest costs incurred in connection with construction of enterprise fund capital assets are capitalized when the effect of capitalization materially impacts the financial statements. The costs of normal maintenance and repairs that do not add to the value of the asset or materially extend assets' lives are not capitalized. Property, plant, and equipment of the primary government are depreciated using the straight-line method over the following estimated useful years:
Asset
Estimated Useful Lives
Infrastructure 10 to 40 years
Building and improvements 5 to 40 years
Vehicles and equipment 4 to 10 years
5. Deferred Outflows/Inflows of Resources In addition to assets, the statement of financial position will sometimes report a separate section for deferred outflows of resources. This separate financial statement element, deferred outflows of resources, represents a consumption of net position that applies to a future period(s) and so will not be recognized as an outflow of resources (expense/expenditure) until then. The City has two items that qualify for reporting in this category.
Deferred outflows of resources for refunding - Reported in the government-wide statement of net position, this deferred charge on refunding results from the difference in the carrying value of refunded debt and its reacquisition price. This amount is deferred and amortized over the shorter of the life of the refunded or refunding debt.

CITY OF BELLAIRE, TEXAS NOTES TO THE BASIC FINANCIAL STATEMENTS (continued)
33
Note 1 - Summary of Significant Accounting Policies (continued) F. Assets, Liabilities, Deferred Outflows/Inflows of Resources, and Net Position/Fund Balance (continued) 5. Deferred Outflows/Inflows of Resources (continued)
Deferred outflows of resources for pension activities - Reported in the government wide financial statement of net position, this deferred outflow results from pension plan contributions made after the measurement date of the net pension liability and the results of 1) differences between projected and actual earnings on pension plan investments; 2) changes in actuarial assumptions; and 3) differences between expected and actual actuarial experiences. The deferred outflows of resources related to pensions resulting from City contributions subsequent to the measurement date will be recognized as a reduction of the net pension liability in the next fiscal year. The deferred outflows resulting from differences between projected and actual earnings on pension plan investments will be amortized over a closed five year period. The remaining pension related deferred outflows will be amortized over the expected remaining service lives of all employees active and inactive employees) that are provided with pensions through the pension plan.
In addition to liabilities, the statement of financial position will sometimes report a separate section for deferred inflows of resources. This separate financial statement element, deferred inflows of resources, represents an acquisition of net position that applies to a future period(s) and so will not be recognized as an inflow of resources (revenue) until that time. The City has two items that qualify for reporting in this category.
Deferred inflows of resources for unavailable revenues - Reported only in the governmental funds balance sheet, unavailable revenues from property taxes, paving assessments and ambulance fees arise under the modified accrual basis of accounting. These amounts are deferred and recognized as an inflow of resources in the period that the amounts become available.
Deferred inflows of resources for pension activities - Reported in the government wide financial statement of net position, these deferred inflows result primarily from 1) changes in actuarial assumptions and 2) differences between expected and actual actuarial experiences. These pension related deferred inflows will be amortized over the expected remaining service lives of all employees (active and inactive employees) that are provided with pensions through the pension plan.
6. Compensated Employee Absences It is the City's policy to permit employees to accumulate earned but unused vacation, sick pay benefits and compensatory time, subject to certain limitations and caps. Amounts accumulated may be paid to employees upon termination of employment or during employment in accordance with the City's personnel policy. The estimated amount of compensation for services provided that is expected to be liquidated with expendable, available financial resources is reported as an expenditure and a fund liability of the governmental fund that will pay it when it matures or becomes due. Amounts of vested or accumulated vacation leave that are not expected to be liquidated with expendable, available financial resources are maintained separately and represent a reconciling item between the fund and government-wide presentations.

CITY OF BELLAIRE, TEXAS NOTES TO THE BASIC FINANCIAL STATEMENTS (continued)
34
Note 1 - Summary of Significant Accounting Policies (continued) F. Assets, Liabilities, Deferred Outflows/Inflows of Resources, and Net Position/Fund Balance (continued) 7. Long-Term Obligations In the government-wide financial statements and proprietary fund types in the fund financial statements, long-term debt and other long-term obligations are reported as liabilities in the applicable governmental activities, business-type activities, or proprietary fund type Statement of Net Position. Bond premiums and discounts are deferred and amortized over the life of the bonds using the effective interest method, if material. Bonds payable are reported net of the applicable bond premium or discount. In the fund financial statements, governmental fund types recognize bond premiums and discounts, as well as bond issuance costs, during the current period. The face amount of debt issued is reported as other financing sources. Premiums received on debt issuances are reported as other financing sources while discounts on debt issuances are reported as other financing uses. Issuance costs, whether or not withheld from the actual debt proceeds received, are reported as debt service expenditures. The property tax rate is allocated each year between the general and debt service funds. The full amount estimated to be required for debt service on general obligation debt is provided by the tax along with the interest earned in the debt service fund. Although a portion of the general obligation debt was directly related to the purchase of water and sewer infrastructure, the debt service expenditures are included in the governmental fund financial statements as they are expected to be paid from debt service tax revenues instead of water system revenues. 8. Net Position Flow Assumption Sometimes the City will fund outlays for a particular purpose from both restricted (e.g., restricted bond or grant proceeds) and unrestricted resources. In order to calculate the amounts to report as restricted net position and unrestricted net position in the government-wide and proprietary fund financial statements, a flow assumption must be made about the order in which the resources are considered to be applied. It is the City's policy to consider restricted net position to have been depleted before unrestricted net position is applied. 9. Fund Balance Flow Assumptions Sometimes the City will fund outlays for a particular purpose from both restricted and unrestricted resources (the total of committed, assigned, and unassigned fund balance). In order to calculate the amounts to report as restricted, committed, assigned, and unassigned fund balance in the governmental fund financial statements, a flow assumption must be made about the order in which the resources are considered to be applied. It is the City's policy to consider restricted fund balance to have been depleted before using any of the components of unrestricted fund balance. Further, when the components of unrestricted fund balance can be used for the same purpose, committed fund balance is depleted first, followed by assigned fund balance. Unassigned fund balance is applied last.

CITY OF BELLAIRE, TEXAS NOTES TO THE BASIC FINANCIAL STATEMENTS (continued)
35
Note 1 - Summary of Significant Accounting Policies (continued) F. Assets, Liabilities, Deferred Outflows/Inflows of Resources, and Net Position/Fund Balance (continued) 10. Fund Balance Policies Fund balances of governmental funds are reported in various categories based on the nature of any limitations requiring the use of resources for specific purposes. The City itself can establish limitations on the use of resources through either a commitment (committed fund balance) or an assignment (assigned fund balance). Amounts that cannot be spent because they are either not in spendable form or legally or contractually required to be maintained intact are classified as nonspendable fund balance. Limitations that are externally imposed by creditors, grantors, contributors, or laws or regulations of other governments or imposed by law through constitutional provisions are classified as restricted. The committed fund balance classification includes amounts that can be used only for the specific purposes determined by a formal action of the City's highest level of decision-making authority. The City Council is the highest level of decision-making authority for the City that can, by adoption of an ordinance prior to the end of the fiscal year, commit fund balance. Once adopted, the limitation imposed by the ordinance remains in place until a similar action is taken (the adoption of another ordinance) to remove or revise the limitation. Amounts in the assigned fund balance classification are intended to be used by the City for specific purposes but do not meet the criteria to be classified as committed. The City Council may also assign fund balance as it does when appropriating fund balance to cover a gap between estimated revenue and appropriations in the subsequent year's appropriated budget. Unlike commitments, assignments generally only exist temporarily. In other words, an additional action does not normally have to be taken for the removal of an assignment. Conversely, as discussed above, an additional action is essential to either remove or revise a commitment. 11. Other Post-Employment Benefits The City allows retirees to continue participation in the City's health care plan through an opt-in provision. Employees separating employment with the City who have had at least five years of service with the City and who are eligible for Texas Municipal Retirement System retirement benefits at the date of separation may purchase retiree health insurance through the City. Other terminating employees may be eligible for continued medical coverage under applicable federal laws. 12. Estimates The preparation of financial statements, in conformity with generally accepted accounting principles, requires management to make estimates and assumptions that affect the reported amounts of assets and liabilities and disclosure of contingent assets and liabilities at the date of the financial statements and the reported amounts of revenues and expenditures/expenses during the reporting period. Actual results could differ from those estimates.

CITY OF BELLAIRE, TEXAS NOTES TO THE BASIC FINANCIAL STATEMENTS (continued)
36
Note 1 - Summary of Significant Accounting Policies (continued) F. Assets, Liabilities, Deferred Outflows/Inflows of Resources, and Net Position/Fund Balance (continued) 13. Pensions For the purposes of measuring the net pension liability, deferred outflows of resources and deferred inflows of resources related to pensions, and pension expense, information about the fiduciary net position of the Texas Municipal Retirement System (TMRS) and additions to/deductions from TMRS's fiduciary net position have been determined on the same basis as they are reported by TMRS. For this purpose, plan contributions are recognized in the period that compensation is reported for the employee, which is when contributions are legally due. Benefit payments and refunds are recognized when due and payable in accordance with the benefit terms. Investments are reported at fair value. G. Revenues and Expenditures/Expenses 1. Program Revenues Amounts reported as program revenues include 1) charges to customers or applicants who purchase, use, or directly benefit from goods, services, or privileges provided by a given function or segment and 2) grants and contributions (including special assessments) that are restricted to meeting the operational or capital requirements of a particular function or segment. All taxes, including those dedicated for specific purposes, and other internally dedicated resources are reported as general revenues rather than as program revenues. 2. Property Taxes Property taxes are levied during September of each year, are due upon receipt of the City's tax bill, and become delinquent on February 1 of the following year. The City's tax lien exists from January 1 (the assessment date) each year until the taxes are paid. The penalties and interest accumulate on the unpaid accounts until July 1, at which time the delinquent accounts are turned over to the tax attorney for legal action. A penalty of six percent and interest of one percent are added to delinquent taxes on February 1. The penalty amount increases to a maximum of 12 percent on July 1 of each year, with interest continuing to increase at one percent per month until the account is paid. An additional penalty of 15 percent is added in July for attorney costs. There are no discounts allowed on taxes. 3. Proprietary Funds Operating and Non-operating Revenues and Expenses Proprietary funds distinguish operating revenues and expenses from nonoperating items. Operating revenues and expenses generally result from providing services and producing and delivering goods in connection with a proprietary fund's principal ongoing operations. The principal operating revenues of the enterprise fund are charges to customers for sales and services. The enterprise fund also recognizes as operating revenue the portion of tap fees intended to recover the cost of connecting new customers to the system. Operating expenses for the enterprise fund include the cost of sales and services, administrative expenses, and depreciation on capital assets. All revenues and expenses not meeting this definition are reported as nonoperating revenues and expenses.

CITY OF BELLAIRE, TEXAS NOTES TO THE BASIC FINANCIAL STATEMENTS (continued)
37
Note 1 - Summary of Significant Accounting Policies (continued) H. Stewardship, Compliance, and Accountability Annual budgets are adopted for all funds. The general fund, enterprise fund, and debt service fund are primarily funded through tax revenues and charges for services. Annual appropriations for these funds lapse at fiscal year-end. The remaining five funds (special revenue fund, vehicle and equipment replacement fund, capital improvement fund, capital bond fund, and METRO fund) are primarily funded by (1) annually appropriated transfers from the general fund and enterprise fund, (2) proceeds from voter approved bond issuances, and (3) restricted revenue sources such as donations, grants, METRO Mobility funds, and municipal court fees. Appropriations for these funds do not lapse at fiscal year-end. Appropriations for the capital project funds are project-length while appropriations for the special revenue fund are based on the available restricted revenue sources mentioned above. Note 2 - Deposits (Cash) and Investments As of September 30, 2017, the City reported the following deposits (cash) and investments:
Fair ValueWeighted Average Maturities (Days)
Credit Rating
Cash 4,889,507$ 1U.S. agencies:
Federal National Mortgage Association 990,533 730 AA+Federal Farm Credit Bank 995,193 729 AA+Federal Home Loan Mortgage Corporation 997,315 545 AA+
External investment pools:TexPool 10,836,601 37 AAAmTexPool Prime 32,305,912 51 AAAmTexSTAR 2,341,850 27 AAAm
Total Fair Value 53,356,911$
Portfolio weighted average maturity (days) 77
Investments’ fair value measurements are as follows as of September 30, 2017:
Investments Fair Value Level 1 Inputs Level 2 Inputs Level 3 InputsU.S. agencies:
Federal National Mortgage Association 990,533$ -$ 990,533$ -$ Federal Farm Credit Bank 995,193 - 995,193 - Federal Home Loan Mortgage Corporation 997,315 - 997,315 -
2,983,041$ -$ 2,983,041$ -$
Fair Value Measurements Using

CITY OF BELLAIRE, TEXAS NOTES TO THE BASIC FINANCIAL STATEMENTS (continued)
38
Note 2 - Deposits (Cash) and Investments (continued) Interest rate risk. In accordance with its investment policy, the City manages its exposure to declines in fair values by structuring the investment portfolio so that securities mature to meet cash requirements for ongoing operations and investing operating funds primarily in short-term securities. Credit risk. State law and the City's investment policy limit investments to obligations of states, agencies, counties, cities, and other political subdivisions of any state rated as to investment quality by a nationally recognized investment rating firm not less than "A" or its equivalent. Further, commercial paper must be rated not less than "A-1" or "P-1" or an equivalent rating by at least two nationally recognized credit rating agencies. As of September 30, 2017, the City's investments in TexPool, TexPool Prime, and TexSTAR were rated "AAAm" by Standard & Poor's. All other investments are guaranteed (either express or implied) by the full faith and credit of the United States government or the issuing U.S. agency. Custodial credit risk - deposits. In the case of deposits, this is the risk that in the event of a bank failure, the City's deposits may not be returned to it. The City's investment policy requires funds on deposit at the depository bank to be collateralized by securities and FDIC insurance. As of September 30, 2017, fair values of pledged securities and FDIC insurance exceeded bank balances. Custodial credit risk - investments. For an investment, this is the risk that, in the event of the failure of the counterparty, the City will not be able to recover the value of its investments or collateral securities that are in the possession of an outside party. The City's investment policy requires that it will seek to safe keep securities at financial institutions, avoiding physical possession. Further, all trades, where applicable, are executed by delivery versus payment to ensure that securities are deposited in the City's safekeeping account prior to the release of funds. Local Government Investment Pools As of September 30, 2017, the City’s investments included TexPool, TexPool Prime, and TexSTAR Investment Pools. The investment pools’ investments are not evidenced by securities that exist in physical or book entry form and, accordingly, do not have custodial risk. The TexPool porfolios are comprised of two investment alternatives: TexPool and TexPool Prime. TexPool policies require that local government deposits be used to purchase investments authorized by the Public Funds Investment Act (PFIA) of 1987, as amended. The Texas State Comptroller of Public Accounts has oversight responsibility for TexPool. TexPool is a public funds investment pool created by the Texas Treasury Safekeeping Trust Company (Trust Company) to provide a safe environment for the placement of local government funds in authorized short-term, fully collateralized investments, including direct obligations of, or obligations guaranteed by, the United States or State of Texas or their agencies; federally insured certificates of deposit issued by Texas banks or savings and loans; and fully collateralized direct repurchase agreements secured by United States Government agency securities and placed through a primary government securities dealer. The Trust Company was incorporated by the State Treasurer by authority of the Texas Legislature as a special purpose trust company with direct access to the services of the Federal Reserve Bank to manage, disburse, transfer, safe keep, and invest public funds and securities more efficiently and economically. The State Comptroller of Public Accounts exercises oversight responsibility over TexPool. Oversight includes the ability to significantly influence operations, designation of management, and accountability for fiscal matters. TexPool uses amortized cost rather than fair value to report net position to compute share prices. The fair value of the position in TexPool is the same as the value of TexPool shares.

CITY OF BELLAIRE, TEXAS NOTES TO THE BASIC FINANCIAL STATEMENTS (continued)
39
Note 2 - Deposits (Cash) and Investments (continued) Accordingly, the City’s investments in TexPool are stated at cost, which approximates fair value. TexPool is currently rated AAAm by Standard and Poor's. This rating indicates excellent safety and a superior capacity to maintain principal value and limit exposure to loss. TexSTAR is administered by First Southwest Asset Management, Inc. and JPMorgan Chase. TexSTAR is a local government investment cooperative created under the Interlocal Cooperation Act specifically tailored to meet state and local government investment objectives of preservation of principal, daily liquidity and competitive yield. The fund maintains a maturity of 60 days or less, with a maximum of 13 months for any individual security. The fund seeks to maintain a constant dollar objective and fulfills all requirements of Texas PFIA for local government investment pools. TexSTAR is overseen by a five member governing board made up of three participants and one of each of the program’s professional administrators. The responsibility of the board includes the ability to influence operations, designation of management, and accountability for fiscal matters. In addition, the pool has a Participant Advisory Board which provides input and feedback on the operations and direction of the program and Standard and Poor’s reviews the pool on a weekly basis to ensure the pool’s compliance with its rating requirements. Although TexSTAR is not registered with the SEC as an investment company, it operates in a manner consistent with the SEC’s Rule 2a7 of the Investment Company Act of 1940. GASB Statement No. 79 allows external investment pools to use amortized cost (which excludes unrealized gains and losses) rather than fair value to report net assets to compute share price. The fair value of the City’s position in TexSTAR is the same as the value of TexSTAR shares. In accordance with GASB Statement No. 79, Certain External Investment Pools and Pool Participants, the Local Government Investment Pools do not have any limitations and restrictions on withdrawals such as notice periods or maximum transaction amounts. These pools do not impose any liquidity fees or redemption gates. Note 3 - Receivables The following comprise receivable balances at year-end:
GeneralDebt
Service
Non-Major Governmental
Funds Enterprise Total
Property taxes 178,180$ 92,408$ -$ -$ 270,588$ Other taxes 518,837 - 15,154 - 533,991 Accounts 4,900,033 - 290,723 1,084,386 6,275,142 Assessments - - - 2,790 2,790 Due from other governments 197,601 - 176,593 102,310 476,504 Less allowance (4,635,872) - - (16,156) (4,652,028)
1,158,779$ 92,408$ 482,470$ 1,173,330$ 2,906,987$

CITY OF BELLAIRE, TEXAS NOTES TO THE BASIC FINANCIAL STATEMENTS (continued)
40
Note 4 - Capital Assets The following is a summary of changes in capital assets for governmental activities at fiscal year-end:
Balance Balance 9/30/2016 Additions Deletions 9/30/2017
Governmental ActivitiesCapital assets, not being depreciated:
Land and intangibles 5,668,439$ -$ -$ 5,668,439$ Construction in progress 17,121,750 13,274,614 (18,590,454) 11,805,910
Total capital assets, not being depreciated 22,790,189 13,274,614 (18,590,454) 17,474,349
Capital assets being depreciated:Infrastructure 101,700,504 17,090,252 (6,453,950) 112,336,806Buildings and improvements 15,592,986 500,000 - 16,092,986Vehicles and equipment 5,988,448 625,920 (795,523) 5,818,845
Total capital assets being depreciated 123,281,938 18,216,172 (7,249,473) 134,248,637
Less accumulated depreciation for:Infrastructure (44,416,042) (2,839,802) 6,453,950 (40,801,894)Buildings and improvements (10,290,289) (277,398) - (10,567,687)Vehicles and equipment (4,013,053) (352,611) 655,320 (3,710,344)
Total accumulated depreciation (58,719,384) (3,469,811) 7,109,270 (55,079,925)
Total capital assets being depreciated, net 64,562,554 14,746,361 (140,203) 79,168,712 Governmental Activities Capital Assets, Net 87,352,743$ 28,020,975$ (18,730,657)$ 96,643,061$
Plus unspent proceeds 35,838,642Plus deferred charge on refunding 2,456,752
Less associated debt and premiums (98,201,201)Net investment in capital assets 36,737,254$
Depreciation was charged to governmental functions as follows:
Governmental ActivitiesGeneral 57,251$ Public safety 412,730Public works 2,736,423Culture and recreation 263,407Total Governmental Activities Depreciation Expense 3,469,811$

CITY OF BELLAIRE, TEXAS NOTES TO THE BASIC FINANCIAL STATEMENTS (continued)
41
Note 4 - Capital Assets (continued)
Construction in progress and remaining commitments under related construction for general government construction projects at September 30, 2017, are as follows:
Authorized Total RemainingProject Description Contract in Progress CommitmentNew city hall/police/court 17,136,607$ 3,068,224$ 14,068,383$ Evelyn's Park improvement 6,759,836 6,694,163 65,673 Street striping 74,354 59,840 14,514 Street condition management program 1,558,038 1,381,522 176,516 Sidewalk projects 456,212 270,929 185,283 BBB2016 streets/drainage 1,747,250 163,966 1,583,284 Sidewalks 331,304 92,320 238,984 New fire truck 74,946 74,946 -
28,138,547$ 11,805,910$ 16,332,637$
The following is a summary of changes in capital assets for business-type activities at fiscal year-end:
Balance Balance 9/30/2016 Additions Deletions 9/30/2017
Business-type ActivitiesCapital assets, not being depreciated:
Land 256,148$ -$ -$ 256,148$ Construction in progress 162,027 7,109,859 - 7,271,886
Total capital assets, not being depreciated 418,175 7,109,859 - 7,528,034
Capital assets being depreciated:Infrastructure 81,421,597 1,230,893 (25,000) 82,627,490Buildings and improvements 12,039,531 - - 12,039,531Vehicles and equipment 5,521,234 131,737 (743,808) 4,909,163
Total capital assets being depreciated 98,982,362 1,362,630 (768,808) 99,576,184
Less accumulated depreciation for:Infrastructure (46,812,408) (1,675,288) 25,000 (48,462,696)Buildings and improvements (7,270,943) (376,271) - (7,647,214)Vehicles and equipment (2,211,342) (442,071) 646,594 (2,006,819)
Total accumulated depreciation (56,294,693) (2,493,630) 671,594 (58,116,729)
Total capital assets being depreciated, net 42,687,669 (1,131,000) (97,214) 41,459,455 Business-Type Activities Capital Assets, Net 43,105,844$ 5,978,859$ (97,214)$ 48,987,489$
Depreciation was charged to business-type functions as follows:
Business-type ActivitiesWater system 1,108,949$ Sewer system 1,246,273 Solid waste dosposal 138,408 Total Business-type Activities Depreciation Expense 2,493,630$

CITY OF BELLAIRE, TEXAS NOTES TO THE BASIC FINANCIAL STATEMENTS (continued)
42
Note 4 - Capital Assets (continued) Construction in progress and remaining commitments under related construction contracts for enterprise fund construction projects at September 30, 2017, are as follows:
Authorized Total Remaining
Project Description Contract in Progress CommitmentCity-wide scada system 121,840$ 121,840$ -$ Wastewater system upgrades 123,193 120,875 2,318 Renwick tank rehabilitation 330,265 312,665 17,600 Water line improvements 340,000 241,884 98,116 Automated water meter installation 4,817,461 4,475,564 341,897 Waste water treatment plant upgrades 7,964,344 1,999,058 5,965,286
13,697,103$ 7,271,886$ 6,425,217$
Note 5 - Long-term Liabilities Long-term liabilities applicable to the City's governmental activities are not due and payable in the current period and, accordingly, are not reported as fund liabilities in the governmental funds. The governmental activities of compensated absences, capital lease obligations, and other post-employment benefit obligations are generally liquidated by the general fund. Interest on long-term debt is not accrued in governmental funds, but rather is recognized as an expenditure when due. On December 6, 2016, the City issued $9,690,000 of General Obligation Refunding Bonds, Series 2016. The City used the proceeds to refund the following three bonds: (1) $1,730,000 of General Obligation Bonds Series 2009, (2) $3,145,000 of General Obligation Refunding Bonds Series 2010, and (3) $4,140,000 of General Obligation Bonds Series 2010A. The City deposited a sufficient amount of the proceeds in escrow, when combined with future investment earning thereon, to fully repay the refunded obligations according to their payment terms. The transaction constituted defeasance of the refunded obligations pursuant to the terms of Chapter 1207, Texas Government Code. Because of such defeasance, the refunded obligations are outstanding only for the purpose of receiving payments from the escrow account and are no longer deemed outstanding obligations of the City. Interest rates range from 2.0% to 2.3%. The refunding generated a gross savings of $1.49 million and a net present value savings of $1.26 million. Annual savings of approximately $66,828 is seen over 19 years. On February 1, 2017, the City issued $33,315,000 of General Obligation Bonds, Series 2017. Proceeds from the sale of bonds are used for improvements to streets, drainage and sidewalks, construction and improvement of City buildings, water and wastewater improvements, and paying the costs of issuing the bonds. Interest is payable on each February 15 and August 15 thereafter until the earlier of redemption or maturity. Interest rates range from 3% to 5%. On September 1, 2017, the City issued $11,505,000 of General Obligation Bonds, Series 2017A. Proceeds from the sale of bonds are used for improvements to streets, drainage, sidewalks, water and wastewater improvements, and for paying the costs of issuing the bonds. Interest is also payable on each February 15 and August 15 thereafter until the earlier of redemption or maturity. Interest rates range from 2% to 4%.

CITY OF BELLAIRE, TEXAS NOTES TO THE BASIC FINANCIAL STATEMENTS (continued)
43
Note 5 - Long-term Liabilities (continued) The following is a summary of changes in the City's total long-term liabilities for the year ended September 30, 2017. In general, the City uses the general and debt service funds to liquidate governmental long-term liabilities. The following is a summary of changes in the City's total governmental long-term liabilities for the year ended September 30, 2017.
Issued AmountsBeginning and Ending Due WithinBalance Additions Reductions Balance One Year
Governmental ActivitiesBonds payable:
General obligation bonds 77,310,000$ 54,510,000$ (13,525,000)$ 118,295,000$ * 4,920,000$ Premiums 2,228,316 1,734,927 (135,145) 3,828,098 -
Other liabilities:Capital lease - 787,666 (64,777) 722,889 56,707 Compensated absences 688,781 382,240 (370,917) 700,104 382,541 Net OPEB obligation 237,085 25,761 - 262,846 -
Total Governmental Activities 80,464,182$ 57,440,594$ (14,095,839)$ 123,808,937$ 5,359,248$
Long-term liabilities due in more than one year 118,449,689$
Business-type ActivitiesOther liabilities:
Compensated absences 35,870$ 36,920$ (34,004)$ 38,786$ 32,664$ Net OPEB obligation 27,162 2,996 - 30,158 -
Total Business-type Activities 63,032$ 39,916$ (34,004)$ 68,944$ 32,664$
Long-term liabilities due in more than one year 36,280$
Bonds payable associated with governmental capital assets 94,373,103$ Bonds payable associated with business-type capital assets 23,921,897
Total long-term bonds payable associated with capital assets 118,295,000$ *

CITY OF BELLAIRE, TEXAS NOTES TO THE BASIC FINANCIAL STATEMENTS (continued)
44
Note 5 - Long-term Liabilities (continued) Bonds Payable Long-term bonds payable at year end was comprised of the following issues:
InterestDescription Rates Balance
General Obligation BondsSeries 2009 3.00-4.80% $ 3,855,000 Series 2009-A Ref 2.00-4.20% 3,195,000 Series 2010-Ref 2.00-4.00% 8,705,000 Series 2010-A 3.25-4.25% 905,000 Series 2011 2.00-4.00% 5,720,000 Series 2011-A Ref 2.00-4.00% 5,095,000 Series 2011-B Ref 2.00-4.00% 6,800,000 Series 2012-Ref 1.00-3.00% 8,510,000 Series 2013 3.00-4.25% 4,980,000 Series 2014 3.00-5.00% 9,480,000 Series 2015 2.50-4.00% 6,710,000 Series 2016-Ref 2.00-2.30% 9,520,000 Series 2017 3.00-5.00% 33,315,000 Series 2017A 2.00-4.00% 11,505,000 Total Long-term Bonds Payable $ 118,295,000
Annual Debt Service Requirements The annual requirements to amortize general obligation bonds outstanding are as follows:
General Obligation BondsYears EndingSeptember 30, Principal Interest Total
2018 4,920,000$ 3,965,265$ 8,885,265$ 2019 5,085,000 3,825,530 8,910,530 2020 5,290,000 3,639,461 8,929,461 2021 5,470,000 3,444,394 8,914,394 2022 5,715,000 3,244,942 8,959,942
2023-2027 31,540,000 12,940,561 44,480,561 2028-2032 25,465,000 7,916,649 33,381,649
2033-2037 19,730,000 4,292,669 24,022,669
2038-2042 15,080,000 1,213,194 16,293,194 118,295,000$ 44,482,665$ 162,777,665$
The City issues general obligation bonds to provide funds for the acquisition and construction of major capital assets. General obligation bonds are direct obligations of the City for which its full faith and credit are pledged. Repayment of general obligation bonds is from taxes levied on all taxable property located within the City. The City is not obligated in any manner for special assessment debt.

CITY OF BELLAIRE, TEXAS NOTES TO THE BASIC FINANCIAL STATEMENTS (continued)
45
Note 5 - Long-term Liabilities (continued) Federal Arbitrage The Tax Reform Act of 1986 instituted certain arbitrage restrictions consisting of complex regulations with respect to the issuance of tax-exempt bonds after August 31, 1986. Arbitrage regulations deal with the investment of tax-exempt bond proceeds at an interest yield greater than the interest yield paid to bondholders. Generally, all interest paid to bondholders can be retroactively rendered taxable if applicable rebates are not reported and paid to the Internal Revenue Service (IRS) at least every five years for applicable bond issues. Accordingly, there is the risk that if such calculations are not performed, or are not performed correctly, it could result in a substantial liability to the City. The City engages an arbitrage consultant to perform the calculations in accordance with IRS rules and regulations. Capital Lease Obligation On January 3, 2017, the City (lessee) entered into a capital lease agreement with ZB, N.A. (lessor). The City will lease a Cinder Custom Pumper Fire Truck. The lease term is 12 years and upon completion of the lease, the fire truck becomes the property of the City. Semi-annual lease payments of $38,802 are due each March 1 and September 1, beginning March 1, 2017 and ending September 1, 2028. The principal amount of the lease was $787,667. The lease agreement qualifies as a capital lease for accounting purposes and, therefore, has been recorded at the present value of future minimum lease payments as of the inception date. The new fire truck will be placed in operation in fiscal year 2018. The future minimum lease obligations and net present value of these minimum lease payments as of September 30, 2017, were as follows:
Year Ending September 30Governmental
Activities2018 77,604$ 2019 77,604 2020 77,604 2021 77,604 2022 77,604
2023-2027 388,019 2028 75,635
Total minimum lease payments 851,674 Less: amount representing interest (128,785) Present value of minimum lease payments 722,889$

CITY OF BELLAIRE, TEXAS NOTES TO THE BASIC FINANCIAL STATEMENTS (continued)
46
Note 6 - Interfund Transactions Transfers between funds during the year were as follows:
Transfers in Transfers OutGovernmental Funds:Individual major governmental funds:
General 624,000$ 2,057,000$ Debt service 1,264,655 - Capital bond - 314,655
Individual non-major governmental funds:Capital improvement 1,529,000 - Vehicle and equipment replacement 1,700,000 -
Total Governmental Funds 5,117,655 2,371,655
Enterprise Fund:Individual major enterprise fund:
Water, sewer, and solid waste - 2,746,000Total Enterprise Fund - 2,746,000
Total Transfers 5,117,655$ 5,117,655$
The enterprise fund transferred funds to the debt service fund to pay a portion of the principal and interest on general obligation debt used to finance capital improvements used in enterprise activities. The enterprise fund transferred funds to the general fund to cover administrative costs performed for the enterprise fund by the general fund. The general fund and the enterprise fund transferred funds to the vehicle and equipment replacement fund for vehicle and equipment replacements. The general fund and the enterprise fund transferred funds to the capital improvement fund to fund capital improvement projects. The capital bond fund transferred the capitalized interest portion of bond proceeds to the debt service fund. Note 7 - Risk Management The City is exposed to various risks of loss related to torts; theft of, damage to, and destruction of assets; errors and omissions; and natural disasters for which the City participates along with several other entities in the Texas Municipal League's Intergovernmental Risk Pool (the "Pool"). The Pool purchases commercial insurance at group rates for participants in the Pool. The City has no additional risk or responsibility to the Pool outside of the payment of insurance premiums. The City has not significantly reduced insurance coverage or had settlements which exceeded coverage amounts for the past three fiscal years. Note 8 - Contingent Liabilities Amounts received or receivable from granting agencies are subject to audit and adjustment by grantor agencies, principally the federal government. Any disallowed claims, including amounts already collected, may constitute a liability of the applicable funds. The amounts of expenditures which may be disallowed by the grantor cannot be determined at this time although the City expects such amounts, if any, to be immaterial.

CITY OF BELLAIRE, TEXAS NOTES TO THE BASIC FINANCIAL STATEMENTS (continued)
47
Note 8 - Contingent Liabilities (continued) Liabilities are reported when it is probable that a loss has occurred and the amount of the loss can be reasonably estimated. Liabilities include an amount for claims that have been incurred but not reported. Claim liabilities are calculated considering the effects of inflation, recent claim settlement trends including frequency and amount of payouts, and other economic and social factors. No claim liabilities are reported at year end. Note 9 - Employee Retirement System Texas Municipal Retirement System Plan Description and Provisions The City participates as one of 872 plans in the nontraditional, joint contributory, hybrid defined benefit pension plan administered by the Texas Municipal Retirement System (TMRS). TMRS is an agency created by the State of Texas and administered in accordance with the TMRS Act, Subtitle G, Title 8, Texas Government Code (the "TMRS Act") as an agent multiple-employer retirement system for municipal employees in the State of Texas. The TMRS Act places the general administration and management of TMRS with a six-member Board of Trustees. Although the Governor, with the advice and consent of the Senate, appoints the Board, TMRS is not fiscally dependent on the State of Texas. TMRS's defined benefit pension plan is a tax-qualified plan under Section 401(a) of the Internal Revenue Code. TMRS issues a publicly available comprehensive annual financial report (CAFR) that can be obtained at www.tmrs.com. All eligible employees of the City are required to participate in TMRS. Benefits Provided TMRS provides retirement, disability, and death benefits. Benefit provisions are adopted by the governing body of the City, within the options available in the state statutes governing TMRS. At retirement, the benefit is calculated as if the sum of the employee's contributions, with interest, and the City-financed monetary credits with interest were used to purchase an annuity. Members may choose to receive their retirement benefit in one of seven payment options. Members may also choose to receive a portion of their benefit as a partial lump sum distribution in an amount equal to 12, 24, or 36 monthly payments, which cannot exceed 75% of the member's deposits and interest. The plan provisions are adopted by the governing body of the City, within the options available in the state statutes governing TMRS. A summary of plan provisions for the City are as follows:
Employee deposit rate: 7% Matching ratio (City to employee): 2 to 1 Years required for vesting: 5 Service retirement eligibility: 20 years at any age, 5 years
at age 60 and above Updated service credit: 100% repeating transfers Annuity increase to retirees: 70% of CPI repeating Supplemental death benefit – active employees and retirees
Yes

CITY OF BELLAIRE, TEXAS NOTES TO THE BASIC FINANCIAL STATEMENTS (continued)
48
Note 9 - Employee Retirement System (continued) Benefits Provided (continued) At the December 31, 2016 valuation and measurement date (the most current available), the following employees were covered by the benefit terms: Retirees or beneficiaries currently receiving benefits 125 Inactive employees entitled to but not receiving benefits 98 Active employees 156 379 Contributions The contribution rates for employees in TMRS are either 5%, 6%, or 7% of employee gross earnings, and the City matching percentages are either 100%, 150%, or 200%, both as adopted by the governing body of the City. Of these available options, the City has adopted a 7% contribution rate for employees and a 200% City matching percentage. Under the State law governing TMRS, the contribution rate for each City is determined annually by the consulting actuary, using the Entry Age Normal (EAN) actuarial cost method. The actuarially determined rate is the estimated amount necessary to finance the cost of benefits earned by employees during the year, with an additional amount to finance any unfunded accrued liability. Employees for the City were required to contribute 7% of their annual gross earnings during the fiscal year. For fiscal year 2017, the City made contributions of 21.20% for the months in 2016 and 20.87% for the months in 2017. Net Pension Liability The City's Net Pension Liability (NPL) was measured as of December 31, 2016, and the Total Pension Liability (TPL) used to calculate the NPL was determined by an actuarial valuation as of that date. Actuarial Assumptions The TPL in the December 31, 2016 actuarial valuation was determined using the following actuarial assumptions:
Inflation: 2.75% Overall payroll growth 3.50% to 10.50% including inflation Investment rate of return 6.75%
Salary increases were based on a service-related table. Mortality rates for active members, retirees, and beneficiaries were based on the gender-distinct RP2000 Combined Healthy Mortality Table, with male rates multiplied by 109% and female rates multiplied by 103%. The rates are projected on a fully generational basis by scale BB to account for future mortality improvements. For disabled annuitants, the gender-distinct RP2000 Disabled Retiree Mortality Table is used, with slight adjustments.

CITY OF BELLAIRE, TEXAS NOTES TO THE BASIC FINANCIAL STATEMENTS (continued)
49
Note 9 - Employee Retirement System (continued) Actuarial Assumptions (continued) These actuarial assumptions were developed primarily from the actuarial investigation of the experience of TMRS over the four year period from December 31, 2010 to December 31, 2014. They were adopted in 2015 and first used in the December 31, 2015 actuarial valuation. The post-retirement mortality assumption for healthy annuitants and Annuity Purchase Rate (APRs) are based on the Mortality Experience Investigation Study covering 2009 through 2011 and dated December 31, 2013. In conjunction with these changes first used in the December 31, 2013 valuation, the System adopted the Entry Age Normal actuarial cost method and a one-time change to the amortization policy. Assumptions are reviewed annually. No additional changes were made for the 2016 valuation. The long-term expected rate of return on pension plan investments is 6.75%. The pension plan’s policy in regard to the allocation of invested assets is established and may be amended by the TMRS Board of Trustees. Plan assets are managed on a total return basis with an emphasis on both capital appreciation as well as the production of income, in order to satisfy the short-term and long-term funding needs of TMRS. The long-term expected rate of return on pension plan investments was determined using a building-block method in which best estimate ranges of expected future real rates of return (expected returns, net of pension plan investment expense and inflation) are developed for each major asset class. These ranges are combined to produce the long-term expected rate of return by weighting the expected future real rates of return by the target asset allocation percentage and by adding expected inflation. The target allocation for each major asset class are summarized in the following table:
Asset Class Target AllocationU.S. equities 17.5%International equities 17.5%Core fixed income 10.0%Non-core fixed income 20.0%Real estate 10.0%Real return 10.0%Absolute return 10.0%Private equity 5.0%Total 100.0%
Discount Rate The discount rate used to measure the Total Pension Liability was 6.75%. The projection of cash flows used to determine the discount rate assumed that employee contributions will remain at the current 7% and employer contributions will be made at the rates specified in statute. Based on that assumption, the pension plan’s Fiduciary Net Position was projected to be available to make all projected future benefit payments of current plan members. Therefore, the long-term expected rate of return on pension plan investments was applied to all periods of projected benefit payments to determine the Total Pension Liability.

CITY OF BELLAIRE, TEXAS NOTES TO THE BASIC FINANCIAL STATEMENTS (continued)
50
Note 9 - Employee Retirement System (continued) Changes in the Net Pension Liability
Total Pension Liability (A)
Plan Fiduciary Net Position (B)
Net Pension Liability(A) - (B)
Changes for the plan year:Service cost 1,811,004$ -$ 1,811,004$ Interest 4,929,569 - 4,929,569 Difference between expected and actual experience (378,183) - (378,183) Changes of assumptions - - - Contributions - employer - 2,097,990 (2,097,990) Contributions - employee - 692,734 (692,734) Net investment income - 3,994,703 (3,994,703) Benefit payments, including refunds of employee contributions (3,654,340) (3,654,340) - Administrative expense - (45,133) 45,133 Other changes - (2,432) 2,432
Net Changes 2,708,050 3,083,522 (375,472) Balance at December 31, 2015 73,952,324 59,131,911 14,820,413 Balance at December 31, 2016 76,660,374$ 62,215,433$ 14,444,941$
Increase (Decrease)
Sensitivity of the NPL to Changes in the Discount Rate The following presents the net pension liability of the City, calculated using the discount rate of 6.75%, as well as what the City's net pension liability would be if it were calculated using a discount rate that is one percentage point lower (5.75%) or one percentage point higher (7.75%) than the current rate:
Current Single 1% Decrease to Rate Assumption 1% Increase to
5.75% 6.75% 7.75%City's net pension liability 24,655,923$ 14,444,941$ 6,030,314$
Pension Plan Fiduciary Net Position Detailed information about the pension plan's fiduciary net position is available in a separately-issued TMRS financial report. That report may be obtained on the internet at www.tmrs.com. Pension Expense and Deferred Outflows of Resources and Deferred Inflows of Resources Related to Pensions For the fiscal year ended September 30, 2017, the City recognized pension expense of $1,843,757.

CITY OF BELLAIRE, TEXAS NOTES TO THE BASIC FINANCIAL STATEMENTS (continued)
51
Note 9 - Employee Retirement System (continued) Pension Expense and Deferred Outflows of Resources and Deferred Inflows of Resources Related to Pensions (continued) At September 30, 2017, the City reported deferred outflows of resources and deferred inflows of resources related to pensions from the following sources:
Deferred Outflows of Resources
Deferred Inflows of Resources
Difference in expected and actual experience 3,030$ 772,462$ Difference in projected and actual earnings on pension plan investments
2,764,092 -
Difference in assumption changes 148,717 - Contributions subsequent to the measurement date 1,636,970 - Total 4,552,809$ 772,462$
Deferred outflows of resources related to pensions resulting from contributions subsequent to the measurement date of $1,636,970 will be recognized as a reduction of the net pension liability for the measurement year ending December 31, 2017 (i.e. recognized in the City’s fiscal year 2018 financial statements). Other amounts reported as deferred outflows and inflows of resources related to pensions will be recognized in pension expense as follows:
Net Deferred Plan Outflows (Inflows)Year of Resources2017 574,290$ 2018 828,728 2019 741,020 2020 (661)
2,143,377$
Note 10 - Other Post-Employment Benefits A. City of Bellaire Retiree Health Care Plan Plan Description In order to recognize and reward long-term employees, as well as to provide an incentive for those remaining in the City's employment, the City administers a single-employer defined benefit other post- employment benefits (OPEB) plan that will allow the retiree to pay their premium for continuation of the medical and dental insurance coverage. Retirees pay 100% of the premium, afforded a lower rate by participating in the City's plan as opposed to individual purchased insurance; the plan is known as the City Retiree Health Care Plan (the "Plan"). In order to be eligible for this benefit, the retiree must separate from service with at least five years of service with the City and be a current recipient of retirement benefits from Texas Municipal Retirement System (TMRS). The health care benefit of the Plan is available to the spouse and any dependent(s) if they were on the Plan at the beginning of the Plan year in which the employee retires. Furthermore, a dependent is eligible for coverage if they have not reached age 25. Eligibility for coverage for the spouse ends when Medicare coverage begins.

CITY OF BELLAIRE, TEXAS NOTES TO THE BASIC FINANCIAL STATEMENTS (continued)
52
Note 10 - Other Post-Employment Benefits (continued) A. City of Bellaire Retiree Health Care Plan (continued) Funding Policy The City has elected to subsidize premiums for the Plan and funding is provided on a pay-as-you-go basis. Annual OPEB Cost The City’s annual other post-employment benefits (OPEB) cost is calculated based on the annual required contribution of the employer (ARC), an amount actuarially determined in accordance with the parameters of GASB Statement No. 45. The ARC represents a level of accrual that, if paid on an ongoing basis, is projected to cover the normal cost each year and to amortize any unfunded actuarial liabilities (or funding excesses) over a period not to exceed thirty years. The City's annual OPEB cost for the fiscal year ending September 30, 2017 is as follows:
Annual Required Contribution (ARC) 84,569$ Interest on OPEB obligation 10,570 Adjustment to ARC (10,297) End of year annual OPEB cost 84,842 Net estimated employer contributions (56,085) Increase in net OPEB obligation 28,757 Beginning of year net OPEB obligation 264,247 End of year net OPEB obligation 293,004$
A separately audited post-employment benefit plan report is not available. The City's annual OPEB cost, the amount contributed by the employer, the percentage of annual OPEB cost contributed to the plan, and the net OPEB obligation for fiscal year ending September 30, 2017 and the preceding two fiscal years were as follows:
Annual Percentage of Fiscal OPEB Annual OPEB Annual OPEBYear Cost Contribution Cost Contributed Beginning Ending2015 66,460$ 45,980$ 69.18% 229,782$ 250,262$ 2016 68,499 54,514 79.58% 250,262 264,247 2017 84,842 56,085 66.11% 264,247 293,004
Net OPEB Obligation
Funded Status and Funding Progress As of December 31, 2016, the most recent actuarial valuation date, the plan was 0% funded. Funding is provided on a pay-as-you-go basis. The actuarial accrued liability for benefits was $1,004,711, and the actuarial value of assets was $0, resulting in an unfunded actuarial accrued liability (UAAL) of $1,004,711. The annual covered payroll used for the December 31, 2016 actuarial valuation was $9,896,194 and the UAAL as a percentage of covered payroll was 10.2%.

CITY OF BELLAIRE, TEXAS NOTES TO THE BASIC FINANCIAL STATEMENTS (continued)
53
Note 10 - Other Post-Employment Benefits (continued) A. City of Bellaire Retiree Health Care Plan (continued) Actuarial Methods and Assumptions The Individual Entry Age Normal Cost Method is used to calculate the GASB ARC for the City's retiree health care plan. Using the plan benefits, the present health premiums and a set of actuarial assumptions, the anticipated future payments are projected. The actuarial cost method then provides for a systematic funding for these anticipated payments. The yearly ARC is computed to cover the cost of benefits being earned by covered members as well as to amortize a portion of the unfunded accrued liability. Projections of health benefits are based on the plan as understood by the City and include the types of benefits in force at the valuation date and the pattern of sharing benefit costs between the City and the City's employees to that point. Actuarial calculations reflect a long-term perspective and employ methods and assumptions that are designed to reduce short-term volatility in actuarial accrued liabilities and the actuarial value of assets. Significant methods and assumptions were as follows:
Inflation rate 2.50% per annum Investment rate of return 4.00% per annum, net of expenses Actuarial cost method Individual entry age normal cost method Amortization method Level as a percentage of employee payroll Amortization period 30-year open amortization Payroll growth 3.00% per annum Medical trend Initial rate of 7.30% declining to an ultimate rate
of 4.25% after 14 years Actuarial valuations involve estimates of the value of reported amounts and assumptions about the probability of events in the future. Amounts determined regarding the funded status and the annual required contributions of the City's retiree health care plan are subject to continual revision as actual results are compared to past expectations and new estimates are made about the future. The required schedule of funding progress presented as required supplementary information provides multiyear trend information that shows whether the actuarial value of plan assets is increasing or decreasing over time relative to the actuarial accrued liability for benefits. B. TMRS Supplemental Death Benefit Fund Description The City also participates in the cost sharing multiple-employer defined benefit group-term life insurance plan operated by TMRS known as the Supplemental Death Benefits Fund (SDBF). The City elected, by ordinance, to provide group-term life insurance coverage to both current and retired employees. The City may terminate coverage under, and discontinue participation in, the SDBF by adopting an ordinance before November 1 of any year to be effective the following January 1. The death benefit for active employees provides a lump-sum payment approximately equal to the employee's annual salary (calculated based on the employee's actual earnings for the 12-month period preceding the month of death); retired employees are insured for $7,500 each; this coverage is an OPEB. The obligations of this plan are payable only from the SDBF and are not an obligation of, or a claim against, the TMRS Pension Trust Fund.

CITY OF BELLAIRE, TEXAS NOTES TO THE BASIC FINANCIAL STATEMENTS (continued)
54
Note 10 - Other Post-Employment Benefits (continued) B. TMRS Supplemental Death Benefit Fund (continued) Contributions The City contributes to the SDBF at a contractually required rate as determined by an annual actuarial valuation. The rate is equal to the cost of providing one-year term life insurance. The funding policy for the SDBF program is to assure that adequate resources are available to meet all death benefit payments for the upcoming year; the intent is not to pre-fund retiree term life insurance during employees' entire careers. The City's contributions to the TMRS SDBF for the years ended September 30 2017, 2016, and 2015 were $23,075, $22,635, and $22,302, respectively, which equaled the required contributions each year. The City's contribution rates for the retiree portion for the past three years are shown below:
2017 2016 2015Annual required contribution (rate) 0.06% 0.06% 0.06%Actual contribution made 0.06% 0.06% 0.06%Percentage of ARC contributed 100.00% 100.00% 100.00%
Note 11 – Subsequent Event On August 25, 2017, Hurricane Harvey, characterized as a Category 4 hurricane at its peak, made landfall on the Texas coast before stalling over Houston-Galveston region (the “Region”) and producing significant flooding. Many residences and commercial properties in the Region sustained damage. As a result of Hurricane Harvey, the City closed City Hall for a week to assess damage citywide and respond to Bellaire residents in need of assistance. Total expenditures of the City as a result of Hurricane Harvey are approximately $3.24 million. Debris removal in the amount of approximately $1.8 million is the largest expenditure as a result of the hurricane. The remaining cost related to the hurricane were damage to the waste water treatment plant, capital losses to flooded vehicles, emergency protective measures to respond to the event as it occurred, and personnel costs for staff time in responding to the disaster. As of January 31, 2018, the City has received $601,499 in reimbursement; $301,588 from Texas Municipal League's Intergovernmental Risk Pool, the City’s insurance provider. Although the Federal Emergency Management Agency (FEMA) has reimbursed the City $299,911, the City still anticipates over $2 million of additional reimbursements once the debris removal project is completed and emergency protective measure expenditures are approved by FEMA.

55
Required Supplementary Information

56
(This page intentionally left blank.)

57
CITY OF BELLAIRE, TEXASGENERAL FUNDSCHEDULE OF REVENUES, EXPENDITURES AND CHANGES IN FUND BALANCE BUDGET AND ACTUAL (BUDGETARY BASIS)For the Year Ended September 30, 2017with comparative actual totals for the year ended September 30, 2016
2016
Original Budget Final Budget Actual
Variance from Final Budget Actual
RevenuesTaxes:
Property taxes 12,331,714$ 12,331,714$ 12,161,757$ (169,957)$ 11,274,387$
Sales and use taxes 2,545,300 2,545,300 2,241,860 (303,440) 2,420,809
Franchise taxes 1,410,000 1,410,000 1,374,918 (35,082) 1,363,860
Fines and forfeitures 739,200 739,200 679,883 (59,317) 717,852
Licenses and permits 1,338,432 1,338,432 1,199,500 (138,932) 1,158,422
Charges for services 1,238,200 1,238,200 1,229,988 (8,212) 1,394,739
Investment earnings 35,000 35,000 47,017 12,017 46,454
Intergovernmental 2,800 2,800 202,324 199,524 2,325
Miscellaneous 31,800 31,800 37,786 5,986 34,847
Total Revenues 19,672,446 19,672,446 19,175,033 (497,413) 18,413,695
Expenditures
Current:
General government:Administration and finance 3,751,476 3,751,476 3,653,267 98,209 3,398,693
Legal 100,000 100,000 107,664 (7,664) 96,176 Development services 892,834 892,834 784,466 108,368 763,878
Total General Government 4,744,310 4,744,310 4,545,397 198,913 4,258,747
Public safety:Police 6,167,369 6,167,369 5,983,928 183,441 5,348,932 Fire 3,041,250 3,041,250 2,983,114 58,136 2,665,182
Total Public Safety 9,208,619 9,208,619 8,967,042 241,577 8,014,114
Public works: 1,199,142 1,199,142 1,054,450 144,692 1,056,541
Culture and recreation:Library 696,822 696,822 654,090 42,732 619,632 Parks, recreation, and facilities 3,717,857 3,717,857 3,563,333 154,524 3,410,445
Total Culture and Recreation 4,414,679 4,414,679 4,217,423 197,256 4,030,077
Non-departmental: (100,000) (100,000) 109,497 (209,497) 161,553
Total Expenditures 19,466,750 19,466,750 18,893,809 572,941 17,521,032
Excess of Revenues Over Expenditures 205,696 205,696 281,224 75,528 892,663
Other Financing Sources (Uses)Transfers in 624,000 624,000 624,000 - 624,000 Transfers out (2,057,000) (2,057,000) (2,057,000) - (2,306,000) Sale of capital assets 10,000 10,000 37,184 27,184 817 Total Other Financing Sources (Uses) (1,423,000) (1,423,000) (1,395,816) 27,184 (1,681,183)
Changes in fund balance (1,217,304) (1,217,304) (1,114,592) 102,712 (788,520)
Fund Balances - Beginning 4,815,527 4,815,527 4,815,527 - 5,604,047
Fund Balances - Ending 3,598,223$ 3,598,223$ 3,700,935$ 102,712$ 4,815,527$
2017
CITY OF BELLAIRE, TEXAS NOTES TO REQUIRED SUPPLEMENTARY BUDGET INFORMATION Year ended September 30, 2017
58
Budgetary Compliance The annual budget must specify appropriations for capital expenditures and for expenditures directed by Council for services and for the operation of city departments, offices and agencies. It must comply with fund requirements of bond covenants. The City Manager shall submit a proposed annual budget to the Council in sufficient time to permit Council to review and revise it. Said budget shall be prepared by the City Manager and filed with the City Clerk not less than thirty (30) days prior to the time the City Council adopts said budget. A public hearing shall be held not less than fifteen (15) days subsequent to the time the budget is filed, but prior to the time the City Council adopts said budget and sets the tax levy. Notice of the date, time and place of such public hearing shall be published in a newspaper of general circulation not less than fifteen (15) days prior to the date of the hearing. Before taxes are levied, but after a public hearing or hearings, Council shall adopt the annual budget. Council may amend the proposed budget but shall not delete or decrease appropriations required for debt service, or by law, and shall not authorize expenditures in excess of the total of estimated income plus funds available from earlier years. The budget, at the fund level, can be amended at any time with the approval of the City Manager and City Council action. The City Manager can approve department requests for reallocation of funding, within a departmental budget of a respective fund as long as the net difference of the respective fund is zero ($0). Council can authorize all changes to the budget at departmental and/or fund level. All appropriations shall lapse at the end of the budget year to the extent that they shall not have been expended or lawfully encumbered, except appropriations in the special revenue fund and the capital project funds which have project/program length appropriations which do not lapse at fiscal year-end. Excess of Expenditures Over Appropriations For the year ended September 30, 2017, expenditures exceeded appropriations in the legal department (the legal level of budgetary control) within the general government function of the general fund by $7,664.

CITY OF BELLAIRE, TEXAS REQUIRED PENSION SYSTEM SUPPLEMENTARY INFORMATION September 30, 2017
59
TEXAS MUNICIPAL RETIREMENT SYSTEM (UNAUDITED)
Schedule of Changes in Net Pension Liability and Related Ratios
Measurement Year
Measurement Year
2016 2015
Total Pension Liability:Service cost 1,811,004$ 1,741,147$ Interest (on the total pension liability) 4,929,569 4,884,753 Changes of benefit terms Difference between expected and actual experience (378,183) 6,060 Change in assumptions - 297,433 Benefit payments, including refunds of employee contributions (3,654,340) (3,777,366) Net change in total pension liability 2,708,050 3,152,027 Total pension liability - beginning 73,952,324 70,800,297 Total pension liability - ending (a) 76,660,374$ 73,952,324$
Plan Fiduciary Net Position:Contributions - employer 2,097,990$ 2,114,994$ Contributions - employee 692,734 664,198 Net investment income 3,994,703 88,677 Benefit payments, including refunds of employee contributions (3,654,340) (3,777,366) Administrative expense (45,133) (54,014) Other (2,432) (2,668) Net change in plan fiduciary net position 3,083,522 (966,179) Plan fiduciary net position - beginning 59,131,911 60,098,090 Plan fiduciary net position - ending (b) 62,215,433 59,131,911
Net Pension Liability - Ending (a) - (b) 14,444,941$ 14,820,413$
Plan Fiduciary Net Position as a Percentage of Total Pension Liability 81.16% 79.96%
Covered Employee Payroll 9,896,194$ 9,488,542$
Net Pension Liability as a Percentage of Covered Employee Payroll 145.96% 156.19%
The amounts presented are for each measurement year, which end the preceding December 31 of the City's fiscal year end. Net pension liability is calculated using a new methodology and will be presented prospectively in accordance with GASB 68. Ten years of data should be presented in this schedule but data was unavailable prior to 2014.

CITY OF BELLAIRE, TEXAS REQUIRED PENSION SYSTEM SUPPLEMENTARY INFORMATION September 30, 2017
60
TEXAS MUNICIPAL RETIREMENT SYSTEM (UNAUDITED)
Schedule of ContributionsLast Three Fiscal Years
2017* 2016* 2015*
Actuarially determined contribution 2,245,626$ 2,066,791$ 2,007,691$
Contribution in relation of the actuarially determined contribution 2,245,626 2,066,791 2,007,691
Contribution deficiency (excess) - - -
Covered employee payroll 10,726,161 9,615,818 9,005,248
Contributions as a percentage of covered employee payroll 20.94% 21.49% 22.29%
* Only three years of information are currently available. The City will build this schedule over the next seven-year period. Notes to Required Supplementary Information: Valuation Date: Actuarial determined contribution rates are calculated as of December 31 and become
effective in January, 12 months and a day later. Methods and Assumptions Used to Determine Contribution Rates:
Actuarial Cost Method: Entry Age Normal Amortization Method: Level Percentage of Payroll, Closed Remaining Amortization Period: 29 years Asset Valuation Method: 10 Year smoothed market; 15% soft corridor Inflation: 2.75% Salary Increases: 3.50% to 10.5% including inflation Investment Rate of Return: 6.75% Retirement Age: Experience-based table of rates that are specific to the City's plan
of benefits. Last updated for the 2015 valuation pursuant to an experience study of the period 2010 – 2014.
Mortality: RP2000 Combined Mortality Table with Blue Collar Adjustment with male rates multiplied by 109% and female rates multiplied by 103% and projected on a fully generational basis with scale BB.
Other Information: There were no benefit changes during the year.

CITY OF BELLAIRE, TEXAS REQUIRED OTHER POST-EMPLOYMENT BENEFITS SUPPLEMENTARY INFORMATION September 30, 2017
61
Other Post Employment Benefits
Schedule of Funding Progress (Unaudited)
Actuarial Valuation
Date December 31,
Actuarial Value of Assets
(a)
Actuarial Accrued
Liability (AAL) (b)
Unfunded AAL (UAAL)
(b-a)
Funded Ratio (a/b)
Covered Payroll (c)
UAAL as a % of Covered
Payroll ((b-a)/c)
2008 -$ 530,101$ 530,101$ 0.0% 8,421,545$ 6.3%
2010 - 606,586 606,586 0.0% 8,573,923 7.1%2013 - 691,207 691,207 0.0% 8,603,608 8.0%2016 - 1,004,711 1,004,711 0.0% 9,896,194 10.2%

62
(This page intentionally left blank.)

63
Other Supplementary Information

64
CITY OF BELLAIRE, TEXASCOMBINING BALANCE SHEET
NON-MAJOR GOVERNMENTAL FUNDS
September 30, 2017
Capital Improvement Metro
Vehicle and Equipment
Replacement
AssetsCash and cash equivalents 5,230,058$ 1,625,960$ 2,417,872$
Receivables, net of allowance - 176,593 290,723Total Assets 5,230,058$ 1,802,553$ 2,708,595$
LiabilitiesAccounts payable and accrued liabilities 195,827$ 509,423$ 11,100$
Total Liabilities 195,827 509,423 11,100
Fund BalancesRestricted:
Public, educational, and governmental programming fees - - -
Police and fire department vehicles and equipment - - - Library supplies and equipment - - -
Municipal court technology - - -
Parks and recreation equipment - - -
Metropolitan streets or METRO - 1,293,130 -
Evelyn's Park improvement 14,286 - - Committed:
City facilities and equipment 5,019,945 - 2,697,495
Total Fund Balances 5,034,231 1,293,130 2,697,495 Total Liabilities and Fund Balances 5,230,058$ 1,802,553$ 2,708,595$

65
Special Revenue Total
436,628$ 9,710,518$
15,154 482,470 451,782$ 10,192,988$
2,224$ 718,574$ 2,224 718,574
288,333 288,333
30,802 30,802 14,357 14,357
103,813 103,813
12,253 12,253
- 1,293,130
- 14,286
- 7,717,440
449,558 9,474,414 451,782$ 10,192,988$

66
CITY OF BELLAIRE, TEXASCOMBINING STATEMENT OF REVENUES, EXPENDITURES AND CHANGES IN FUND BALANCESNON-MAJOR GOVERNMENTAL FUNDSFor the Year Ended September 30, 2017
Capital Improvement Metro
Vehicle and Equipment
Replacement RevenuesTaxes:
Franchise taxes -$ -$ -$ Fines and forfeitures - - - Investment earnings - 17,528 - Intergovernmental - 1,110,774 - Other 14,592 - 290,724Total Revenues 14,592 1,128,302 290,724
ExpendituresCurrent:
General government - - - Public safety - - 75,674Culture and recreation - - -
Capital outlay 2,280,888 2,007,366 786,925 Total Expenditures 2,280,888 2,007,366 862,599
Revenues over (under) expenditures (2,266,296) (879,064) (571,875)
Other Financing Sources (Uses)Proceeds from capital leases - - 787,666Transfers in 1,700,000 - 1,529,000 Total Other Financing Sources (Uses) 1,700,000 - 2,316,666
Net changes in fund balances (566,296) (879,064) 1,744,791 Fund Balances - Beginning 5,600,527 2,172,194 952,704
Fund Balances - Ending 5,034,231$ 1,293,130$ 2,697,495$

67
Special Revenue Total
63,907$ 63,907$ 43,416 43,416
- 17,528 - 1,110,774
103,405 408,721 210,728 1,644,346
21,614 21,614 19,207 94,881 76,660 76,660
- 5,075,179 117,481 5,268,334
93,247 (3,623,988)
- 787,666 - 3,229,000 - 4,016,666
93,247 392,678 356,311 9,081,736 449,558$ 9,474,414$

68
DEBT SERVICE FUND
SCHEDULE OF REVENUES, EXPENDITURES AND CHANGES IN FUND BALANCE -
BUDGET AND ACTUAL (BUDGETARY BASIS)
For the Year Ended September 30, 2017
with comparative actual totals for the year ended September 30, 2016
2017 2016
Final Budget Actual
Variance Positive
(Negative) Actual RevenuesTaxes:
Property taxes 6,355,967$ 6,268,910$ (87,057)$ 5,846,605$
Investment earnings 5,000 4,164 (836) 6,081
Total Revenues 6,360,967 6,273,074 (87,893) 5,852,686
ExpendituresDebt Service:
Principal 4,340,000 4,510,000 170,000 4,055,000
Interest and other charges 2,970,967 3,059,476 (88,509) 2,772,676
Total Expenditures 7,310,967 7,569,476 (258,509) 6,827,676
Revenues under expenditures (950,000) (1,296,402) (346,402) (974,990)
Other Financing SourcesProceeds from issuance of general
obligation refunding bonds - 9,690,000 9,690,000 -
Premium on issuance of bonds - 265,613 265,613 -
Payment to bond refunding
escrow agent - (9,942,235) (9,942,235) -
Transfers in 950,000 1,264,655 314,655 950,000
Total Other Financing Sources 950,000 1,278,033 328,033 950,000
Net changes in fund balances (18,369) (18,369) (24,990)
Fund Balances - Beginning 489,135 489,135 - 514,125 Fund Balances - Ending 489,135$ 470,766$ (18,369)$ 489,135$

69
UNAUDITED STATISTICAL SECTION
This part of the City’s comprehensive annual financial report presents detailed information, both current and historical, as a context for understanding what the information in the financial statements, note disclosures, and required supplementary information says about the government's overall financial health. To assist financial statement users, the section is categorized as follows:
Contents Page
Financial Trends 70
These schedules contain trend information to help the reader understand how the City's financial performance and "well-being” have changed over time.
Revenue Capacity 80
These schedules contain information to help the reader assess the City's most significant local revenue source, the property tax.
Debt Capacity 88
These schedules present information to help the reader assess the affordability of the City's current levels of outstanding debt and the City's ability to issue additional debt in the future.
Demographic and Economic Information 94
These schedules offer demographic and economic indicators to help the reader understand the environment within which the City's financial activities take place.
Operating Information 98
These schedules contain service and infrastructure data to help the reader understand how the information in the City's financial report relates to the services the City provides and the activities it performs.
Sources: Unless otherwise noted, the information in these schedules is derived from the comprehensive annual financial reports for the relevant year. The City implemented GASB Statement No. 34 in the fiscal year ending September 30, 2004. Schedules presenting government-wide information include information beginning in that year.

70
CITY OF BELLAIRE, TEXASNET POSITION BY COMPONENTLast Ten Fiscal Years(Accrual Basis of Accounting)
2008 2009 2010 2011Governmental Activities
Net investment in capital assets 17,192,431$ 20,142,375$ 20,142,375$ 12,017,357$ Restricted 1,320,445 6,030,817 5,774,390 6,242,189Unrestricted (16,788,928) (18,317,743) (15,571,685) (3,491,035)
Total Governmental Activities Net Position 1,723,948$ 7,855,449$ 10,345,080$ 14,768,511$
Business-type ActivitiesNet investment in capital assets 27,214,828$ 48,235,925$ 47,928,473$ 46,796,314$ Unrestricted 26,841,244 6,546,670 4,621,733 3,827,399
Total Business-type Activities Net Position 54,056,072$ 54,782,595$ 52,550,206$ 50,623,713$
Primary GovernmentNet investment in capital assets 44,407,259$ 44,884,711$ 44,577,259$ 46,354,009$ Restricted 1,320,445 6,030,817 5,774,390 6,242,189Unrestricted 10,052,316 11,722,516 12,543,637 12,796,026
Total Primary Government Net Position 55,780,020$ 62,638,044$ 62,895,286$ 65,392,224$
Note: Net position was restated starting fiscal year end 2014 for GASB 68.

71
2012 2013 2014 2015 2016 2017
15,390,597$ 18,182,933$ 19,904,368$ 22,459,271$ 24,283,701$ 36,737,254$ 4,380,414 4,864,690 4,833,458 5,532,306 2,926,117 1,816,603
(3,786,554) (6,235,197) (13,112,693) (11,160,440) (6,373,053) (23,268,969)
15,984,457$ 16,812,426$ 11,625,133$ 16,831,137$ 20,836,765$ 15,284,888$
47,305,409$ 46,170,650$ 46,450,275$ 45,007,913$ 43,105,844$ 48,987,489$ 5,231,898 5,870,772 2,235,809 1,613,121 475,215 218,912
52,537,307$ 52,041,422$ 48,686,084$ 46,621,034$ 43,581,059$ 49,206,401$
51,430,068$ 54,219,309$ 57,031,939$ 58,974,777$ 59,748,943$ 62,102,846$ 4,380,414 4,864,690 4,833,459 5,532,306 2,926,117 1,816,603
12,711,282 9,769,849 (1,554,180) (1,054,912) 1,742,761 571,840
68,521,764$ 68,853,848$ 60,311,218$ 63,452,171$ 64,417,821$ 64,491,289$

72
CITY OF BELLAIRE, TEXASCHANGES IN NET POSITION
Last Ten Fiscal Years
(Accrual Basis of Accounting)
2008 2009 2010 2011
ExpensesGovernmental activities:
General government 4,266,030$ 4,256,797$ 4,533,506$ 5,175,769$ Public safety 7,264,380 7,518,726 7,475,162 7,120,797Public works 3,188,126 2,507,596 3,615,172 3,632,379Culture and recreation 2,616,748 2,616,119 3,112,650 2,793,350Interest on long-term debt 2,780,294 2,449,684 2,684,722 2,741,626
Total governmental activities expenses 20,115,578 19,348,922 21,421,212 21,463,921
Business-type activities:Water 3,800,826 4,313,110 3,123,730 4,849,850
Sewer 2,593,515 2,494,960 2,426,615 2,149,214
Solid waste 1,347,097 1,400,760 1,409,533 1,386,037Total business-type activities expenses 7,741,438 8,208,830 6,959,878 8,385,101
Total Primary Government 27,857,016$ 27,557,752$ 28,381,090$ 29,849,022$
Expenses
Program RevenueGovernmental activities:
Charges for services:General government 804,642$ 473,699$ 730,258$ 1,678,644$ Public safety 1,252,020 1,150,259 1,129,500 413,414Culture and recreation 1,155,874 845,041 735,064 914,892
Operating grants and contributions 1,305,291 1,031,926 955,326 4,926,010Capital grants and contributions - 7,278,443 - - Total governmental activities program
revenues 4,517,827 10,779,368 3,550,148 7,932,960
Business-type activities:Charges for services:
Water 3,281,193 3,563,310 3,070,758 4,163,534Sewer 2,149,613 2,212,164 2,102,466 2,222,214Solid waste 1,429,631 1,445,379 1,440,818 1,447,792
Operating grants and contributions 568,265 7,278,443 34,466 5,210Capital grants and contributions - - - - Total business-type activities program revenues 7,428,702 14,499,296 6,648,508 7,838,750
Total Primary Government Program Revenues 11,946,529$ 25,278,664$ 10,198,656$ 15,771,710$
Net (Expense)/RevenueGovernmental activities (15,597,751)$ (8,569,554)$ (17,871,064)$ (13,530,961)$ Business-type activities (312,736) 6,290,466 (311,370) (546,351)
Total Primary Government Net Expense (15,910,487)$ (2,279,088)$ (18,182,434)$ (14,077,312)$

73
2012 2013 2014 2015 2016 2017
4,208,790$ 4,666,521$ 4,650,382$ 4,186,635$ 4,535,002$ 4,863,991$ 7,411,656 7,408,510 7,688,067 7,642,560 9,099,845 9,717,9443,047,245 3,195,605 1,732,778 3,495,508 3,458,191 1,568,4483,007,000 3,129,411 4,744,672 4,129,555 4,934,103 6,957,9592,748,024 2,401,586 2,600,345 2,802,080 2,746,662 4,323,982
20,422,715 20,801,633 21,416,244 22,256,338 24,773,803 27,432,324
3,665,318 3,591,660 4,099,061 4,222,422 5,607,986 5,779,1522,085,949 2,208,464 2,551,872 2,140,266 1,304,575 1,193,8011,321,797 1,347,342 1,422,924 1,340,844 1,322,405 1,342,498
7,073,064 7,147,466 8,073,857 7,703,532 8,234,966 8,315,451
27,495,779$ 27,949,099$ 29,490,101$ 29,959,870$ 33,008,769$ 35,747,775$
1,706,544$ 1,742,547$ 1,870,963$ 1,623,777$ 1,865,093$ 1,874,666$ 444,703 414,322 445,708 484,435 464,951 591,717946,739 951,689 943,294 1,044,060 1,021,820 930,680
2,964,856 891,362 864,874 2,827,088 1,678,882 1,600,306- - - - - -
6,062,842 3,999,920 4,124,839 5,979,360 5,030,746 4,997,369
3,913,934 4,065,706 3,399,947 3,263,193 3,334,192 4,009,2912,458,792 2,433,842 2,306,693 2,184,372 2,177,649 2,355,0691,450,003 1,436,194 1,429,484 1,430,744 1,678,377 1,687,841
3,644 - - 63,000 102,310 - - - - 583,618 -
7,826,373 7,935,742 7,136,124 6,941,309 7,773,836 8,154,511
13,889,215$ 11,935,662$ 11,260,963$ 12,920,669$ 12,804,582$ 13,151,880$
(14,359,873)$ (16,801,713)$ (17,291,405)$ (16,276,978)$ (19,743,057)$ (22,434,955)$ 753,309 788,276 (937,733) (762,223) (461,130) (160,940)
(13,606,564)$ (16,013,437)$ (18,229,138)$ (17,039,201)$ (20,204,187)$ (22,595,895)$

74
CITY OF BELLAIRE, TEXASCHANGES IN NET POSITION (continued)
Last Ten Fiscal Years
(Accrual Basis of Accounting)
2008 2009 2010 2011General Revenues and Other Changes in Net PositionGovernmental activities:
Taxes:Property taxes 11,708,770$ 12,102,311$ 12,453,577$ 12,917,306$ Sales and use taxes 2,266,254 2,269,080 2,242,145 2,053,538 Franchise taxes 1,314,420 1,336,587 1,370,522 1,325,746
Investment earnings 891,011 243,367 105,393 82,226 Miscellaneous 388,022 649,507 2,134,344 76,530 Gain on sale of capital assets - - - - Transfers 239,190 (46,353) 2,054,714 1,499,046
Total Governmental Activities 16,807,667 16,554,499 20,360,695 17,954,392
Business-type activities:Investment earnings 118,767 68,955 39,267 21,806 Other revenues 89,803 216,316 94,428 97,098 Gain on sale of capital assets - - - - Transfers (239,190) 46,353 (2,054,714) (1,499,046)
Total Business-type Activities (30,620) 331,624 (1,921,019) (1,380,142)
Total Primary Government 16,777,047$ 16,886,123$ 18,439,676$ 16,574,250$
Change in Net Position
Governmental activities 1,209,916$ 7,984,945$ 2,489,631$ 4,423,431$ Business-type activities (343,356) 6,622,090 (2,232,389) (1,926,493)
Total Primary Government 866,560$ 14,607,035$ 257,242$ 2,496,938$

75
2012 2013 2014 2015 2016 2017
12,954,402$ 13,449,313$ 14,356,415$ 15,671,184$ 17,134,276$ 18,524,717$ 2,156,893 2,590,958 2,310,083 2,391,335 2,420,809 2,241,860 1,398,657 1,441,398 1,474,701 1,459,679 1,430,616 1,438,825
53,804 29,757 29,293 51,596 107,929 288,552 46,728 252,622 59,242 132,976 9,055 173,051
- - 13,298 - - - (1,034,665) 1,317,913 1,601,327 1,476,620 2,646,000 (5,783,927)
15,575,819 19,081,961 19,844,359 21,183,390 23,748,685 16,883,078
(10,686) 6,075 5,914 3,982 1,112 936 114,556 92,712 86,560 144,517 66,043 58,856 21,750 2,115 10,115 25,294 - -
1,034,665 (1,317,913) (1,601,327) (1,476,620) (2,646,000) 5,726,490
1,160,285 (1,217,011) (1,498,738) (1,302,827) (2,578,845) 5,786,282
16,736,104$ 17,864,950$ 18,345,621$ 19,880,563$ 21,169,840$ 22,669,360$
1,215,946$ 2,280,248$ 2,552,954$ 4,906,412$ 4,005,628$ (5,551,877)$ 1,913,594 (428,735) (2,436,471) (2,065,050) (3,039,975) 5,625,3423,129,540$ 1,851,513$ 116,483$ 2,841,362$ 965,653$ 73,465$

76
CITY OF BELLAIRE, TEXASFUND BALANCES OF GOVERNMENTAL FUNDSLast Ten Fiscal Years(Modified Accrual Basis of Accounting)
2008 2009 2010 2011General fund
Nonspendable -$ -$ -$ 97,987$ Restricted 113,780 107,263 102,163 201,200Assigned - - - 21,988 Unassigned 4,590,995 3,753,460 3,631,618 4,141,757
Total General Fund 4,704,775$ 3,860,723$ 3,733,781$ 4,462,932$
All other governmental fundsRestricted 1,320,445$ 6,049,456$ 5,783,733$ 17,926,249$ Committed 11,989,533 13,916,578 14,469,240 5,147,115Unassigned 1,855,831 - - -
Total All Other Governmental Funds 15,165,809$ 19,966,034$ 20,252,973$ 23,073,364$

77
2012 2013 2014 2015 2016 2017
92,942$ 1,107$ 1,269$ 7,243$ 1,151$ 1,631$ 181,314 - - - - -
22,595 - - - - - 3,529,097 4,211,936 4,621,983 5,596,804 4,814,376 3,699,3043,825,948$ 4,213,043$ 4,623,252$ 5,604,047$ 4,815,527$ 3,700,935$
13,858,353$ 17,373,785$ 22,366,030$ 26,258,593$ 10,203,975$ 38,066,382$ 5,056,709 4,451,200 4,460,179 4,599,903 6,363,083 7,717,440
- - - - - -
18,915,062$ 21,824,985$ 26,826,209$ 30,858,496$ 16,567,058$ 45,783,822$

78
CITY OF BELLAIRE, TEXASCHANGES IN FUND BALANCES OF GOVERNMENTAL FUNDS
Last Ten Fiscal Years
(Modified Accrual Basis of Accounting)
2008 2009 2010 2011
RevenuesTaxes:
Property taxes 11,742,440$ 12,086,558$ 12,482,631$ 12,905,050$
Sales and use taxes 2,266,254 2,269,080 2,242,145 2,053,538
Franchise taxes 1,314,420 1,336,587 1,370,522 1,325,746
Fines and forfeitures 1,155,874 845,041 735,064 862,810
Licenses and permits 804,642 473,699 730,258 844,802
Charges for services 1,252,020 1,150,259 1,129,500 1,299,338
Investment earnings 891,011 243,367 105,393 82,226
Intergovernmental 1,305,291 8,310,369 955,326 854,072
Other 379,631 679,258 187,656 395,145
Total Revenues 21,111,583 27,394,218 19,938,495 20,622,727
ExpendituresGeneral government 5,188,969 4,043,408 4,119,403 4,058,470
Public safety 6,979,965 7,299,264 6,973,262 7,000,186
Public works 1,176,934 1,097,403 1,039,404 930,165
Culture and recreation 2,331,453 2,396,656 2,466,966 2,444,683
Capital outlay 8,027,812 11,669,794 8,434,018 4,931,251
Debt service:
Principal 2,140,000 2,115,000 2,450,000 3,075,000
Interest 2,842,892 2,789,399 3,063,954 2,694,934
Bond issuance costs and fees - - - - Payment to bond refunding escrow agent (current refunding) - - - -
Total Expenditures 28,688,025 31,410,924 28,547,007 25,134,689
Excess of revenues over (under) expenditures (7,576,442) (4,016,706) (8,608,512) (4,511,962)
Other Financing Sources (Uses)Proceeds from issuance of general
obligation refunding bonds - 11,195,000 16,930,000 -
Proceeds from issuance of capital
related debt 5,000,000 7,000,000 6,000,000 6,500,000
Proceeds from capital leases
Premium on issuance of bonds 1,105 139,375 529,253 70,949 Payment to bond refunding escrow agent (advance refunding) - (11,325,829) (17,214,283) (21,343)
Transfers in 4,025,421 2,487,533 4,770,629 3,229,000
Transfers out (3,075,421) (1,537,533) (2,715,915) (1,729,954)
Sale of capital assets 8,391 14,333 468,825 12,852
Total Other Financing Sources (Uses) 5,959,496 7,972,879 8,768,509 8,061,504
Net Change in Fund Balances (1,616,946)$ 3,956,173$ 159,997$ 3,549,542$
Debt service as a percentage of noncapital
expenditures 24.12% 23.83% 27.06% 27.38%

79
2012 2013 2014 2015 2016 2017
12,968,976$ 13,468,975$ 14,370,857$ 15,696,635$ 17,120,992$ 18,430,667$
2,156,893 2,590,958 2,310,083 2,391,335 2,420,809 2,241,860
1,398,657 1,441,398 1,474,701 1,459,679 1,430,616 1,438,825
758,614 719,150 803,218 715,861 758,122 723,299
1,007,125 1,142,927 1,183,493 1,007,468 1,158,422 1,199,500
1,332,247 1,246,481 1,230,436 1,424,243 1,391,739 1,229,988
53,804 29,787 29,293 51,596 107,929 288,552
2,964,856 891,362 808,455 983,633 1,202,007 1,313,098
46,728 252,622 115,661 1,975,431 511,722 446,507
22,687,900 21,783,660 22,326,197 25,705,881 26,102,358 27,312,296
4,051,141 4,272,157 4,568,131 4,167,618 4,462,598 4,676,508
7,029,280 6,960,344 7,046,063 7,739,572 8,014,408 9,061,923
901,608 1,038,170 1,048,380 1,100,198 1,056,541 1,054,450
2,498,057 2,586,501 2,723,263 3,763,840 4,137,774 4,294,083
8,631,091 6,015,152 10,339,645 7,468,997 19,602,776 21,491,916
3,465,000 3,500,000 3,690,000 3,955,000 4,055,000 4,510,000
2,381,610 2,256,878 2,341,311 2,623,526 2,772,676 3,059,476
613,258 131,304 215,249 164,458 - 935,310
15,943,348 - - - - -
45,514,393 26,760,506 31,972,042 30,983,209 44,101,773 49,083,666
(22,826,493) (4,976,846) (9,645,845) (5,277,328) (17,999,415) (21,771,370)
24,915,000 - - - - 9,690,000
- 6,000,000 10,425,000 7,710,000 44,820,000
787,666
1,206,254 162,712 291,398 364,458 - 1,734,927
(9,548,460) - - - - (9,942,235)
2,584,697 3,144,600 5,224,485 2,460,000 4,952,000 5,117,655
(1,134,697) (950,000) (1,027,485) (275,000) (2,306,000) (2,371,655)
8,413 21,174 39,258 1,000 817 37,184
18,031,207 8,378,486 14,952,656 10,260,458 2,646,817 49,873,542
(4,795,286)$ 3,401,640$ 5,306,811$ 4,983,130$ (15,352,598)$ 28,102,172$
56.52% 26.47% 26.47% 27.27% 27.42% 30.60%

80
CITY OF BELLAIRE, TEXASASSESSED VALUE AND ESTIMATED ACTUAL VALUE
OF TAXABLE PROPERTYLast Ten Fiscal Years
2008 2009 2010 2011Real Property 2,768,166,389$ 3,056,644,555$ 3,173,006,018$ 3,091,605,353$ Personal Property 179,056,143 153,004,450 139,274,844 138,836,286
Total Taxable Assessed Value (1) $ 2,947,222,532 $ 3,209,649,005 $ 3,312,280,862 $ 3,230,441,639
Total Direct Tax Rate (2) 0.40000$ 0.37750$ 0.37590$ 0.39990$
Source: Harris County Certified/Uncertified Tax Roll
(1) Property is assessed at actual value, therefore, the assessed values are equal to actual value.(2) Tax rates are per $100 of assessed value.

81
2012 2013 2014 2015 2016 20173,113,840,746$ 3,233,587,984$ 3,490,155,153$ 3,905,688,782$ 4,393,494,108$ 4,716,891,547$
126,312,156 134,275,543 139,263,254 117,174,780 98,941,686 105,576,256
$ 3,240,152,902 $ 3,367,863,527 $ 3,629,418,407 $ 4,022,863,562 $ 4,492,435,794 $ 4,822,467,803
0.39990$ 0.39990$ 0.39990$ 0.39360$ 0.38050$ 0.38740$

82
CITY OF BELLAIRE, TEXASPROPERTY TAX RATESDIRECT AND OVERLAPPING GOVERNMENTS Last Ten Fiscal Years
City of Bellaire
Fiscal Year
Operating Tax Rate
Debt Service
Tax RateTotal Tax
Rate
Houston Independent
School District
Harris County
Harris County Flood
Control District
Port of Houston
Authority2008 0.27500$ 0.12500$ 0.40000$ 1.15670$ 0.39239$ 0.03106$ 0.01467$ 2009 0.26500 0.11250 0.37750 1.15670 0.38923 0.03086 0.01773 2010 0.26390 0.11200 0.37590 1.15670 0.39224 0.02922 0.01636 2011 0.26390 0.13600 0.39990 1.15670 0.38805 0.02930 0.02054 2012 0.24750 0.15240 0.39990 1.15670 0.39117 0.02809 0.01856 2013 0.25540 0.14450 0.39990 1.18670 0.40021 0.02809 0.01952 2014 0.25630 0.14360 0.39990 1.19670 0.41455 0.02827 0.01716 2015 0.25320 0.14040 0.39360 1.19670 0.41731 0.02736 0.01531 2016 0.25010 0.13040 0.38050 1.19670 0.41923 0.02733 0.01342 2017 0.25510 0.13230 0.38740 1.20670 0.41656 0.02829 0.01334
Source: Harris County Appraisal District
Note: Overlapping rates are those of local and county governments that apply within the City of Bellaire.Tax rates are per $100 of assessed value.

83
Harris County
Hospital District
Harris County Dept. of Education
Houston Community
College0.19216$ 0.00585$ 0.09243$ 0.19216 0.00584 0.09243 0.19216 0.00605 0.09222 0.19216 0.00658 0.09222 0.19216 0.00658 0.09722 0.18216 0.00662 0.09717 0.17000 0.00636 0.09717 0.17000 0.00599 0.10689 0.17000 0.00542 0.10194 0.17179 0.00520 0.10026

84
(This page intentionally left blank.)

85
CITY OF BELLAIRE, TEXASPRINCIPAL PROPERTY TAXPAYERSCurrent Year and Nine Years Ago
TaxpayerTaxable
Assessed Value Rank
% of Total Assessed
Valuation Taxable
Assessed Value Rank
% of Total Assessed
ValuationChevron Chemical 81,900,770$ 1 1.7% 97,761,104$ 1 3.3%Pin Oak North Parcel II LLC 52,838,215 2 1.1%KBS SOR 6565 6575 West Loop 36,988,682 3 0.8%BRI 1833 6330 LLC 36,200,573 4 0.8%Centerpoint Energy, Inc. 32,789,970 5 0.7% 35,361,586 5 1.2%
SBC Communications 28,283,940 6 0.6% 38,280,062 4 1.3%CHP Houston Tx MOB Owner LLC 27,880,000 7 0.6%
CHP Houston TX Hospital Land 23,197,526 8 0.5%Pin Oak South Parcell LL LLC 21,606,958 9 0.4% SLS Properties 13,176,820 10 0.3% FRM West Loop Assoc #6 47,500,000 2 1.6%WMPT Bellaire HP LP 39,742,348 3 1.3%Chase Merritt West Loop LLC 32,350,000 6 1.1%6330 WLS, LTD 30,243,360 7 1.0%Bellaire Atrium I & II LP 11,269,394 8 0.4%SPTMRT Properties Trust 8,010,609 9 0.3%FKM Partnership LTD 3-05 6,831,598 10 0.2%
354,863,454 7.4% 347,350,061 11.5%Other taxpayers 4,467,604,349 92.6% 2,599,872,471 88.5%Total Assessed Valuation 4,822,467,803$ 100.0% 2,947,222,532$ 100.0%
Source: Harris County Tax Assessor-Collector
2017 2008

86
CITY OF BELLAIRE, TEXASPROPERTY TAX LEVIES AND COLLECTIONSLast Ten Fiscal Years
Collected Within the Fiscal Year of the Levy
Fiscal Year
Tax Year Tax Rate
Total Tax Levy for
Fiscal Year AmountPercentage of
Levy
2008 2007 0.40000$ 11,610,889$ 11,530,140$ 99.30%2009 2008 0.37750 12,011,140 11,927,983 99.31%2010 2009 0.37590 12,385,668 12,319,214 99.46%2011 2010 0.39900 12,820,648 12,750,093 99.45%2012 2011 0.39900 12,909,927 12,857,279 99.59%2013 2012 0.39900 13,382,086 13,338,111 99.67%2014 2013 0.39900 14,364,926 14,319,678 99.69%2015 2014 0.39360 15,743,170 15,695,886 99.70%2016 2015 0.38050 17,137,875 17,078,390 99.65%2017 2016 0.38740 18,682,240 18,375,281 98.36%
Source: Harris County Tax Assessor-CollectorNote: Tax rates are per $100 of assessed value.

87
Collections in Subsequent
Years Total Collections to Date
Amount AmountPercentage of
Levy
68,626$ 11,598,766$ 99.90%72,377 12,000,360 99.91%54,902 12,374,116 99.91%54,900 12,804,993 99.88%36,991 12,894,270 99.88%
560 13,338,671 99.68%2,247 14,321,925 99.70%
(60,618) 15,635,268 99.31%(42,906) 17,035,484 99.40%
n/a 18,375,281 98.36%

88
CITY OF BELLAIRE, TEXASRATIOS OF OUTSTANDING DEBT BY TYPELast Ten Fiscal Years
2008 2009 2010 2011Primary GovernmentGovernmental Activities:
General obligation bonds (2) 57,916,125$ 63,618,526$ 67,424,141$ 70,966,183$ Total Primary Government 57,916,125$ 63,618,526$ 67,424,141$ 70,966,183$
Personal Income (1) -$ -$ -$ -$
Debt as a Percentageof Personal Income - - - -
Population 15,642 15,642 16,855 16,855
Debt Per Capita 3,570$ 3,752$ 4,355$ 4,574$
(1) Personal income data is not available.(2) Presented net of related premiums and discounts(3) Source: United States Census Bureau
Note: Details regarding the City's outstanding debt can be found in the notes to the basic financial statements.
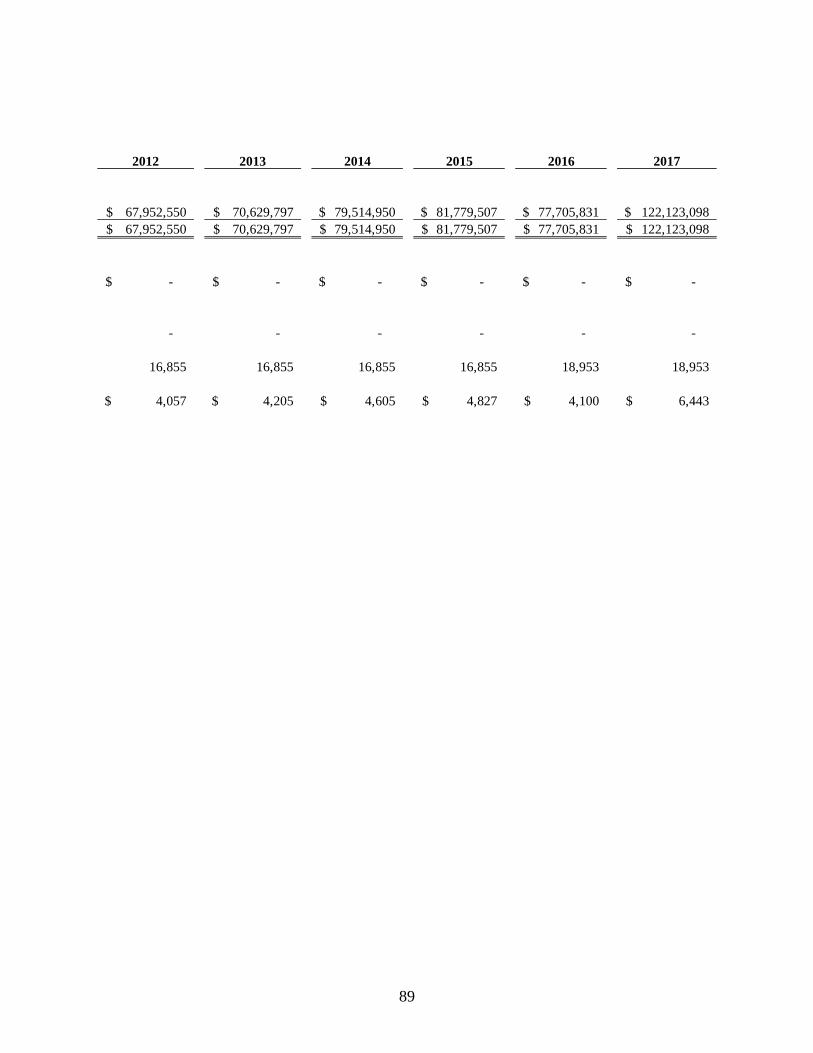
89
2012 2013 2014 2015 2016 2017
67,952,550$ 70,629,797$ 79,514,950$ 81,779,507$ 77,705,831$ 122,123,098$ 67,952,550$ 70,629,797$ 79,514,950$ 81,779,507$ 77,705,831$ 122,123,098$
-$ -$ -$ -$ -$ -$
- - - - - -
16,855 16,855 16,855 16,855 18,953 18,953
4,057$ 4,205$ 4,605$ 4,827$ 4,100$ 6,443$

90
CITY OF BELLAIRE, TEXASRATIOS OF GENERAL BONDED DEBT OUTSTANDINGLast Ten Fiscal Years
2008 2009 2010 2011
Net Taxable Assessed ValueAll property 2,947,222,532$ 3,209,649,005$ 3,312,280,862$ 3,206,212,748$
Net Bonded DebtGeneral obligation bonds (1) 57,916,125$ 63,618,526$ 67,424,141$ 70,966,183$
Less debt service funds 1,320,445 1,125,195 638,825 400,621Net Bonded Debt 56,595,680$ 62,493,331$ 66,785,316$ 70,565,562$
Percentage of Estimated Actual
Taxable Value of Property 1.95% 1.96% 2.04% 2.22%
Population 15,642 15,642 16,855 16,855
Net Bonded Debt Per Capita 3,668$ 4,020$ 4,314$ 4,548$
(1) Presented net of related premiums and discounts

91
2012 2013 2014 2015 2016 2017
3,240,152,902$ 3,367,863,527$ 3,629,418,407$ 4,022,863,562$ 4,492,435,794$ 4,822,467,803$
67,952,550$ 70,629,797$ 79,514,950$ 81,779,507$ 77,705,831$ 122,123,098$
469,433 504,450 562,532 514,125 489,135 470,76667,483,117$ 70,125,347$ 78,952,418$ 81,265,382$ 77,216,696$ 121,652,332$
2.10% 2.09% 2.12% 2.01% 1.72% 2.52%
16,855 16,855 16,855 16,855 18,593 18,593
4,029$ 4,175$ 4,571$ 4,797$ 4,153$ 6,543$

92
CITY OF BELLAIRE TEXASDIRECT AND OVERLAPPING GOVERNMENTAL
ACTIVITIES DEBTAs of September 30, 2017
Name of Governmental UnitDebt
Outstanding (1)
Estimated Percentage Applicable
Estimated Share of
Overlapping Debt
Houston Independent School District 3,058,240,000$ 2.98% 91,135,552$ Harris County (2) 2,295,044,505 1.19% 27,311,030 Port of Houston Authority 657,994,397 1.19% 7,830,133 Houston Community College District 599,540,000 2.48% 14,868,592 Harris County Hospital District 61,595,000 1.19% 732,981 Harris County Flood Control District 83,075,000 1.19% 988,593 Harris County Department of Education 6,780,000 1.19% 80,682
Subtotal, overlapping debt 6,762,268,902 142,947,562
City direct debt (3) 122,123,098 100.00% 122,123,098
Total Direct and Overlapping Debt 265,070,660$
Ratio of Direct and Overlapping Debt to 2016 Taxable Valuation 5.50%
Direct and Overlapping Debt per Capita 13,986$
Source: Municipal Advisory Council of Texas
(1) Debt outstanding as of September 30, 2017.(2) Excludes Unlimited Tax and Revenue Toll Road Tax Bonds. The County's policy and practice has
been to provide payment of debt service on the outstanding Toll Road Tax Bonds from toll revenuesand certain other funds. To date no tax has been collected to provide for such debt service.

93
CITY OF BELLAIRE, TEXASLEGAL DEBT MARGIN INFORMATION
Last Ten Years
Fiscal Year
Assessed Taxable Value
Debt Service Limit (1)
Amount Expended for
General Obligation Debt
Service (2)Legal Debt
Margin
Total Net Debt Applicable to the Limit as a Percentage of
Debt Limit2008 2,947,222,532$ 39,787,504$ 4,982,892$ 34,804,612$ 12.52%2009 3,209,649,005 43,330,262 4,904,399 38,425,863 11.32%2010 3,312,280,862 44,715,792 5,513,954 39,201,838 12.33%2011 3,230,441,639 43,610,962 5,769,934 37,841,028 13.23%2012 3,240,152,902 43,742,064 5,846,610 37,895,454 13.37%2013 3,367,863,527 45,466,158 5,756,878 39,709,280 12.66%2014 3,629,418,407 48,997,148 6,031,311 42,965,837 12.31%2015 4,022,863,562 54,308,658 6,578,526 47,730,132 12.11%2016 4,492,435,794 60,647,883 6,827,676 53,820,207 11.26%2017 4,822,467,803 65,103,315 7,554,315 57,549,000 11.60%
Note: General obligation debt is limited by the State of Texas. The State limit is established by Article XI,Section 5 of the Texas Constitution. Article XI, Section 5 limits the maximum ad valorem tax rate to$2.50 per $100 of assessed valuation (for all City purposes). Administratively, the Attorney Generalof the State of Texas prohibits the issuance of debt by a municipality if its issuance produces debtservice requirements exceeding that which can be paid from $1.50 of the foregoing $2.50 maximumtax rate calculated at 90% of collections.
(1) Debt service limited to $1.50 per $100 of assessed valuation calculated at 90% of collections. (2) Total principal and interest payments made on general obligation debt.

94
CITY OF BELLAIRE, TEXASDEMOGRAPHIC AND ECONOMIC STATISTICSLast Ten Fiscal Years
Fiscal Year
Population (1)
Personal Income (2)
Per Capita Personal
Income (3)Median Age (4)
School Enrollment
(5)Unemployment
Rate (6)2008 15,642 N/A N/A N/A 5,988 5.0%
2009 15,642 N/A 144,438$ 40.5 6,106 8.5%
2010 16,855 N/A 150,519$ 41.5 7,341 8.1%
2011 16,855 N/A 155,423$ 41.6 7,470 7.9%
2012 16,855 N/A 154,424$ 41.7 7,570 6.2%
2013 16,855 N/A 161,288$ 42.4 7,518 5.9%
2014 16,855 N/A 169,663$ 41.6 7,667 4.8%
2015 16,855 N/A 175,369$ 42.3 8,002 4.8%
2016 18,953 N/A 187,805$ 43.0 7,548 5.7%
2017 18,593 N/A N/A N/A 7,805 4.8%
Data Sources:(1) United States Census Bureau(2) Data to compute not available(3) United States Census Bureau, some data not available (median household income)(4) United States Census Bureau, some data not available(5) Houston Independent School District and private schools(6) Bureau of Labor Statistics (Houston-The Woodlands-Sugar Land, TX Metropolitan Statistical Area)

95
CITY OF BELLAIRE, TEXASPRINCIPAL EMPLOYERSCurrent Year (1)
Employer Total EmployeesWorley Parsons Ltd 500-999Bellaire High School 100-499
Brighton Gardens of Bellaire 100-499Chevron Oronite Co. LLC 100-499
Chevron Pipe Line Co. 100-499First Street Hospital 100-499
First Surgical Partners 100-499PFM, LLC 100-499
Pin Oak Middle School 100-499Randall's 100-499
(1) The requirement is the ten largest employers, the number of employees for each of the tenlargest employers, and each employer's percentage of total employment. However, this datafor the current year, along with ten years ago, is not available.
Source: Municipal Advisory Council of Texas

96
CITY OF BELLAIRE, TEXASFULL-TIME EQUIVALENT CITY GOVERNMENT BUDGETED POSITION BY FUNCTIONLast Ten Fiscal Years
2008 2009 2010 2011General Fund:
Administrative 7.0 7.0 7.0 7.0 Facilities 3.0 3.0 3.0 3.0 Finance 9.0 9.0 9.0 9.0 Development services 10.5 10.5 8.0 8.0 Fire department 25.0 25.0 25.0 24.0 Police department 57.5 57.5 57.5 57.5 Library 8.0 8.0 8.0 7.0 Public works 11.0 11.0 10.0 10.0 Parks and recreation 11.0 11.0 10.0 10.0 Parks, recreation, and facilities - - - - General Fund Total 142.0 142.0 137.5 135.5
Enterprise Fund:Administration 2.0 2.0 2.0 2.0 Water 7.0 7.0 4.0 4.0 Sewer 11.0 11.0 9.0 9.0 Solid waste 13.0 11.0 10.0 10.0 Enterprise Fund Total 33.0 31.0 25.0 25.0
Total City Positions 175.0 173.0 162.5 160.5
Source: City of Bellaire adopted budget

97
2012 2013 2014 2015 2016 2017
7.0 7.0 8.0 8.5 10.0 10.0 3.0 3.0 3.0 - - - 9.0 9.0 9.0 8.5 9.0 10.0 8.0 10.0 11.0 9.0 8.0 8.0
24.0 24.0 24.0 24.0 24.0 24.0 57.5 57.5 57.5 59.0 59.5 59.5
7.0 8.0 8.0 7.5 7.5 7.5 10.0 10.0 10.0 9.0 9.0 9.0 13.5 13.5 13.5 - - -
- - - 25.5 24.5 24.5 139.0 142.0 144.0 151.0 151.5 152.5
2.0 2.0 2.0 2.0 2.0 2.0 6.0 6.0 6.0 6.0 6.0 6.0
11.0 11.0 11.0 11.0 11.0 10.0 11.0 11.0 11.0 11.0 13.0 13.0 30.0 30.0 30.0 30.0 32.0 31.0
169.0 172.0 174.0 181.0 183.5 183.5

98
CITY OF BELLAIRE, TEXASOPERATING INDICATORS BY FUNCTIONLast Ten Fiscal Years
Function 2008 2009 2010 2011
PoliceArrests 1,641 1,630 1,080 1,147 Accident reports 647 716 614 663 Citations 8,636 4,707 5,078 6,854 Offense reports 1,388 1,149 989 1,011 Calls for service 38,994 30,618 29,903 33,815
FireEmergency responses 2,042 1,915 1,782 1,962 Fire incidents 38 47 52 45 Average response time 3:47 3:45 1:40 4:11
WaterNew accounts 802 671 747 763 Source:
Surface water 57% 50% 52% 58%Well water 43% 50% 48% 42%
Average daily consumption(millions of gallons) 2.944 3.170 3.022 3.577
Surface water pumped(millions of gallons) 612.640 575.799 561.480 755.293
Well water pumped(millions of gallons) 460.038 566.334 519.013 547.500
Total consumption (millions of gallons) 1,072.678 1,142.433 1,080.493 1,302.250 Peak daily consumption
(millions of gallons) 6.563 6.228 5.504 7.210 Sewer
Average daily sewage treatment(millions of gallons) 1.222 1.445 1.760 1.620
Total (millions of gallons) 446.356 527.352 642.400 591.475 Peak daily treatment
(millions of gallons) 6.599 3.965 6.600 5.600
Source: Various City Departments

99
2012 2013 2014 2015 2016 2017
1,114 908 1,042 1,026 1,066 1,125 636 556 628 786 771 717
4,974 4,796 4,443 3,953 5,833 4,508 627 841 1,110 1,021 973 1,080
33,133 28,713 31,570 29,793 31,815 32,732
1,948 1,905 2,057 2,019 2,184 2,266 40 49 39 29 26 29
4:06 4:05 4:06 4:13 6:00 4:50
701 769 668 639 611 691
56% 47% 58% 48% 52% 52%44% 53% 42% 52% 48% 48%
3.131 3.227 2.777 2.842 3.035 3.033
767.591 549.190 586.787 502.745 537.111 573.869
485.734 628.581 426.920 534.453 505.696 533.468 1,253.250 1,177.771 1,101.371 1,037.198 1,042.81 1,107.34
5.862 6.214 7.809 8.654 2.980 2.960
1.624 1.440 1.572 1.451 1.464 1.345 592.760 525.907 568.334 529.434 534.432 490.925
5.800 3.800 2.200 4.600 4.400 3.200

100
CITY OF BELLAIRE, TEXASCAPITAL ASSETS STATISTICS BY FUNCTIONLast Ten Fiscal Years
Function 2008 2009 2010 2011
PoliceStations 1 1 1 1 Patrol units 8 8 8 8
FireStations 1 1 1 1
Highways and streetsStreets (miles - centerlines) 67 67 67 67 Streetlights 918 918 925 925
Culture and recreationParks 12 12 12 12 Park acreage in City limits 31.4 31.4 31.4 31.4 Aquatics facilities 2 2 2 2 Baseball/softball diamonds 3 3 3 3 Tennis courts 7 7 7 7 Recreation centers 1 1 1 1 Houston ISD licensed fields 4 4 4 4 Houston ISD acreage 15 15 15 15
WaterWater mains (miles) 73 73 73 73 Fire hydrants 760 760 760 760 Storage capacity (millions of gallons) 4.23 4.23 4.23 4.23
SewerSanitary sewers (miles) 70 70 70 70 Storm sewers (miles) 49 49 49 49 Open ditch/creek/canal drainage (miles) 1.32 1.32 1.32 1.32 Treatment capacity (millions of gallons) 4.5 4.5 4.5 4.5
Source: Various City Departments

101
2012 2013 2014 2015 2016 2017
1 1 1 1 1 1 8 8 8 8 8 8
1 1 1 1 1 1
67 67 67 67 67 67925 925 1,017 1,061 1,061 1,026
12 12 14 15 15 14 36.4 36.4 46.4 51.0 51.0 121.3
2 2 2 2 2 2 3 3 3 3 3 3 7 7 7 7 7 7 1 1 1 1 1 1 4 4 4 4 4 4
15 15 15 15 15 15
73 73 73 73 73 73760 760 760 760 760 744
3.23 3.23 3.23 3.23 3.23 3.23
70 70 70 70 70 70 49 49 49 49 49 49
1.32 1.32 1.32 1.32 1.32 1.32 4.5 4.5 4.5 4.5 4.5 4.5