Embed Size (px)
Citation preview
28th NATIONAL RADIO SCIENCE CONFERENCE (NRSC 2011)
April 26-28, 2011, National Telecommunication Institute, Egypt
Modified Non-local Means Filter for Effective Speckle Reduction in Ultrasound Images
Abstract
Banazier A. Abrahim, Zeinab A.Mustafa, Yasser M Kadah System & Biomedical Engineering Department, Cairo University, Giza, Egypt
E-mail:[email protected]
Ultrasound imaging is a widely used and safe medical diagnostic technique, due to its noninvasive nature, low cost, capability of forming real time imaging, and the continuing improvements in image quality. However; the usefulness of ultrasound imaging is degraded by the presence of signal dependant noise known as speckle. It is well-known that speckle is a multiplicative noise that degrades the visual evaluation in ultrasound imaging. In ultrasound (US) imaging, denoising is intended to improve quantitative image analysis techniques. In this paper, a new version of the Non Local (NL-) means filter adapted for US images is proposed based on Similarity function depend on specific characteristics of the variance speckle noise in ultrasound images .The proposed method has been compared with Median, Wavelet , Mean and variance local statistics , Geometric , Anisotropic diffusion filtering , and Non - local means filter using quantitative parameters . From the visual results and image quality evaluation metrics obtained over real images we can conclude that the modified(NL-) means filter can be successfully used for ultrasound image denoising, and performs better results than all other methods while still retaining the structural details and retains the edges and textures very well while removing speckle noise .
Keywords: Ultrasound imaging; Image quality; Speckle; Non Local (NL-) means; Similarity function .
I. INTRODUCTION
Ultrasound image is often preferred over other medical imaging modalities and is a widely used and safe medical diagnostic technique, due to its noninvasive nature, low cost, capability of forming real time imaging, and the continuing improvements in image quality [1]. However ; one problem in processing ultrasound (US) images is the presence of speckle noise which is mUltiplicative and is a major limitation on image quality. Thepresence of the speckle noise affects image interpretation by human and the accuracy of computer-assisted diagnostic techniques [2] .The presence of speckle noise in ultrasound images has been documented since the early 1970s when researchers such as Burckhardt [3], Wagner et al. [4], and Goodman [5] described the fundamentals and the statistical properties of the speckle noise. Speckle is not truly a noise in the typical engineering sense because its texture often carries useful information about the image being viewed. Speckle in US B-scans is seen as a granular structure which is caused by the constructive and destructive coherent interferences of back scattered echoes from the scatterers that are typically much smaller than the spatial resolution of medical ultrasound system . This phenomenon is common to laser, sonar and synthetic aperture radar imagery (S AR). Speckle pattern is a form of mUltiplicative noise and it depends on the structure of imaged tissue and various imaging parameters. Speckle degrades the target delectability in B-scan images and reduces the contrast, resolutions which affect the human ability to identify normal and pathological tissue. It also degrades the speed and accuracy of ultrasound image processing tasks such as segmentation and registration. There are two main purposes for speckle reduction in medical ultrasound imaging (1) to improve the human interpretation of ultrasound images (2) despeckling is the preprocessing step for many ultrasound image processing tasks such as segmentation and registration [6].
In literature many techniques have been studied for speckle noise reduction. The Non Local (NL-) means filter was originally introduced by Buades et al. [7] for 2D image denoising describe in detail in material and methods. The filter( median) is a simple nonlinear operator that replaces the middle pixel in the window with the medianvalue of its neighbors [8].The wavelet de-noising method decomposes the image into the wavelet basis and shrinks the wavelet coefficients in order to despeckle the image. From the noisy image, global soft threshold coefficients are calculated for every decomposition level . After the thresholding, the image is reconstructed by inverse wavelet transforming and the despeckled image is derived [9] (waveltc) Wavelet despeckle filter, used in this study, is based on the idea of the Daubenchies Symlet wavelet and on soft-thresholding denoising, first proposed by Donoho [9]. First Order Statistics Filtering , (lsmv) Mean and variance local statistics despecklefilter this filter using the first order statistics such as the variance and the mean of the neighborhood [lO].The concept of the geometric filtering is that speckle appears in the image as narrow walls and valleys. The geometric filter, through iterative repetition, gradually tears down the narrow walls (bright edges) and fills up the narrow valleys
28th NATIONAL RADIO SCIENCE CONFERENCE (NRSC 2011)
April 26-28, 2011, National Telecommunication Institute, Egypt
(dark edges), thus smearing the weak edges that need to be preserved, The (gf4d) Geometric despeckle filter [11] investigated in this study uses a nonlinear noise reduction technique. Diffusion filters (srad) remove noise from an image by modifying the image via solving a partial differential equation (PDE) . The smoothing is carried out, depending on the image edges and their directions [12].
In this paper, a new version of the Non Local (NL-) means filter adapted for US images is proposed based on Similarity function depend on specific characteristics of the variance noise in ultrasound images (i.e. speckle noise). This method is inspired on a new filter recently proposed by Buades et al [7] known as Non-Local Means (NLM).
The paper is organized as follows. Section II, explains Material and Method description which consists overview of the NLM filter , Proposed Method and Image Quality Evaluation Metrics; Section III depicts the quantitative comparison among different filters which considers the experimental results and Discussions. Finally, the conclusion is presented in Section IV.
II. MATERIAL AND METHODS
The NLM filter is a neighbourhood filter [13] which achieves denoising by averaging similar image pixels according to their intensity similarity. The main difference between the NLM and previous related filters is that the similarity between pixels has been made more robust to the noise level by using region comparison rather than pixel comparison; furthermore, pattern redundancy has been not restricted to be local (non-local). That is, pixels far from the pixel being filtered are not penalized due to its distance to the current pixel, as for example happens in the bilateral filter [14].
A . The NL-means Filter
The NLM filter is an evolution of the Yaroslavsky filter (Yaroslavsky, 1985) which averages similar image
pixels according to their intensity distance . Some filters, like the SUS AN (Smith and Brady, 1997) or the bilateral
filters are based in the same principle. Nonlocal-means denoising [15] replaces the intensity of each pixel in the
noisy image by a weighted average of all of the pixel intensities in the image . The main differences of the NLM
with these methods is that the similarity between pixels is more robust in front of the noise level by using region
comparison rather than pixel comparison and that pattern redundancy is not restricted to be local (therefore, non
local). Pixels far from the pixel being filtered are not penalized due to its distance to the current pixel, as happens
with the bilateral filter. First introduced by Buades et al. in [16], the Non Local (NL) means algorithm is based on
the natural redundancy of information in images to remove noise. This filter allows avoiding the well-known
artifacts of the commonly used neighborhood filters [17] ,and to replace the local comparison of pixels by the non
local comparison of patches in [18].
Given an image Y, the filtered value at a point p using the NLM method is calculated as a weighted average of
all the pixels in the image following this formula:
NLM(Y(p)) = I w(p,q)Y(q) V'qEY
0:5 w(p,q):51 I w(p,q) = 1 V'qEY
(1)
where p is the point being filtered and q represents each one of the pixels in the image. The weights w(p,q) are
based on the similarity between the neighborhoods Np and N q of pixels p and q. Nj is defined as a square
neighbourhood window centered around pixel i with a user-defined radius Rsim•
The similarity w(p, q)is then calculated as
(2)
28th NATIONAL RADIO SCIENCE CONFERENCE (NRSC 2011)
April 26-28, 2011, National Telecommunication Institute, Egypt
� d(p,q) Z(p)
= L/-� '\fq
(3)
Z(p) is the normalizing constant, h is a exponential decay control parameter and d is a Gaussian weighted
Euclidian distance of all the pixels of each neighbourhood:
(4)
where Gp is a normalized Gaussian weighting function with zero mean and p standard deviation (usually set to
1) that penalizes pixels far from the center of the neighbourhood window by giving more weight to pixels near the center. The center pixel of the Gaussian weighting window is set to the same value that the pixels at a distance 1 to avoid over-weighting effects.
In Eq. (1) there is a special case when p = q. As the self similarity is very high, it can produce an overweighting effect. To solve this situation w(p, p) is calculated as
w(p,p) =
max(w(p,q)\fq *" p) (5)
The NL-means algorithm has three parameters and the filter results depend highly on their setting. The fIrst parameter, Rsearch , is the radius of the search window. Although the original method claimed to use all the pixels in the image by taking the weighted average of every pixel, this is ineffIcient if the only similar locations are relatively nearby. Besides, the computational burden would be prohibitive for clinical applications. Therefore, the search window has to be reduced to a local window W of smaller size.The second parameter, Rsim, is the radius of the neighbourhood window used to compute the similarity between two pixels. If the value of Rsim is increased the similarity measure will be more robust but fewer similar neighbourhoods will be found. The third parameter, h, is related to the decay of the exponential curve and controls the degree of smoothing. If h is too small, little noise will be removed while if h is set too high, the image will become blurry .
In our experiments we use an llxll search window, which seems a reasonable value for medical images. The best setting for Rsim and h under different noise levels was estimated to be Rsim = 1 and h is set to the estimated standard deviation of image noise.
B. Proposed Method
The proposed method depend on Similarity function can be summarized as follows:
In Eq. (4) the distance between two equal noisy patches will have an average distance equal to 202 [7]. Therefore, its associated weight will not be equal to 1 as expected (assuming h2 = 202) but lie (see equations 2 and 3). This can be easily solved by simply subtracting I from exponent in the weight computation so similar pixels will have a weight close to 1 (this has the same effect than subtracting 202 to distance as calculated in Eq. (4». To avoid negative values due to the subtraction operation, we calculate the normalized distance as the maximum of the distance after the subtraction and O. In this case, the similarity function is computed using the same defInition as in Eq .(2) but subtracting 1 to averaged distance to obtain a weight close to 1 when computing the distance of two equal patches.
Therefore, the propsed similarity function is computed as follows:
__ 1_ -[max[d��q)-l]] w(p, q) - Z(p)
e (6)
The nature of the speckle pattern can be categorized into one of three classes according to the number of scatterers per resolution cell or the so called scatterer number density (SND), spatial distribution and the characteristics of the imaging system itself As a result the image contrast is reduced .. Such bias is equal to 202 as shown by Nowak and, therefore, a simple bias subtraction will recover its original value. This value can be estimated as the mean value of the background intensities of the noisy image were the signal should be zero in this case the noise it can be easily removed and contrast enhancement. Thus, the proposed NLM estimation
28th NATIONAL RADIO SCIENCE CONFERENCE (NRSC 2011)
April 26-28, 2011, National Telecommunication Institute, Egypt
Improvements of the NL-means filter will be defined as follows: NLM(y)2 - 2cr2 computed from w(p, q) in Eq.(6).
C. Image Quality Evaluation Metrics
To quantify the performance improvements of the speckle reduction method various measures may be used. In this study the differences between the original, gi,j' and the despeckled, Aj, images were evaluated using image
quality evaluation metrics. The following measures, which are easy to compute and have clear physical meaning, were computed.
The MSE ( Mean square error) : M N
MSE = M� II (gi,j - fi,j)2 , (7)
i=l j=l which measures the quality change between the original and processed image in an MXNwindow [19].
The root MSE (RMSE), which is the square root of the squared error averaged over an MrlVwindow [20]:
M N
RMSE = M� I I (gi,j - fi.j)2
i=l j=l
The signal-to-noise ratio (SNR) is given by [21]:
The peak SNR (PSNR) is computed using [21]:
MSN PSNR = -10Iog10 -2-gmax
(8)
(9)
(10)
where g'#nax is the maximum intensity in the unfiltered image. The PSNR is higher for a better-transformed image and lower for a poorly transformed image
The error summation in the form of the Minkowski metric, which is the norm of the dissimilarity between the original and the despeckled images [19]:
( M N )l/fJ Err = :N f.� 19i.j - Ai
computed for fJ = 3 (Err3) and fJ = 4 (Err4). The mathematically defmed universal quality index [22] models is derived as:
(11)
(12)
where ff and f represent the mean of the original and despeckled values with their standard deviations, agand
at, of the original and despeckled values of the analysis window, and agt represents the covariance between the
original and despeckled windows.
28th NATIONAL RADIO SCIENCE CONFERENCE (NRSC 2011)
April 26-28, 2011, National Telecommunication Institute, Egypt
The structural similarity index between two images [23], is given by:
SSIN = (29 f + cl)(20"gt + C2)
-1 < SSIN < 1 (92 + [2 + Cl)(O"/ + 0"/ + C2) , , (13)
where cl = O.Oldr and c2 = 0.03dr, with dr = 255 representing the dynamic range of the ultrasound images. The range of values for the SSIN lies between -I, for a bad and I for a good similarity between the original and
despeckled images, respectively.
III. RESULTS AND DISCUSSIONS
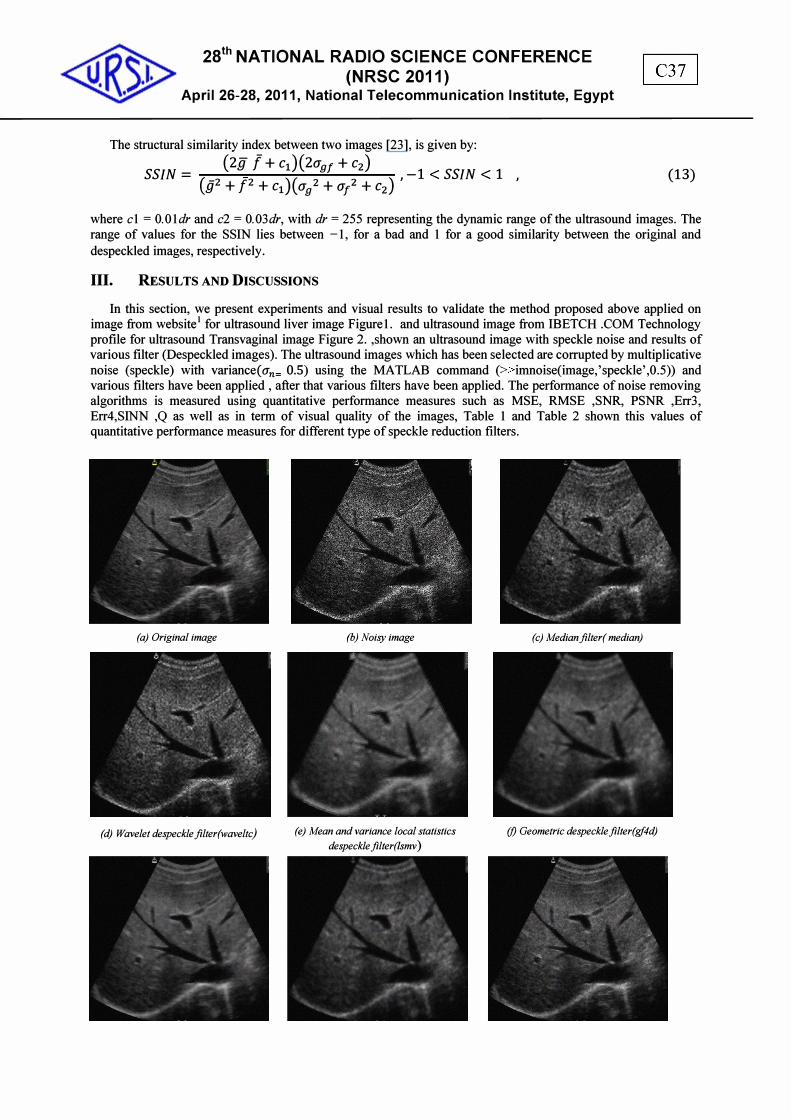
In this section, we present experiments and visual results to validate the method proposed above applied on image from website! for ultrasound liver image Figurel. and ultrasound image from IBETCR .COM Technology profile for ultrasound Transvaginal image Figure 2. ,shown an ultrasound image with speckle noise and results of various filter (Despeckled images). The ultrasound images which has been selected are corrupted by multiplicative noise (speckle) with variance(an= 0.5) using the M ATL AB command (»imnoise(image,'speckle',0.5)) and various filters have been applied , after that various filters have been applied. The performance of noise removing algorithms is measured using quantitative performance measures such as MSE, RMSE ,SNR, PSNR ,Err3, Err4,SINN ,Q as well as in term of visual quality of the images, Table 1 and Table 2 shown this values of quantitative performance measures for different type of speckle reduction filters.
(a) Original image
(d) Wavelet despeckle filter(waveltc)
(b) Noisy image
(e) Mean and variance local statistics despeckle filter(lsmv )
(c) Medianfilter( median)
(f) Geometric despeckle filter(gf4d)
28th NATIONAL RADIO SCIENCE CONFERENCE (NRSC 2011)
April 26-28, 2011, National Telecommunication Institute, Egypt
(g) Speckle reducing anisotropic diffosion (h)NL -means despecklefilter (i)Proposed method L'" 1 u filte,rinf7t(srad) t-I I' I" . .
h 0 5 0 " I I d - (1- - ) - . ( ) .Igure . ResUlts 0 various I ters on a mu tiP Icatlve nOise Wit (Tn= . , ngma u trasoun Image Iver Image given m a
, Noisy image given in (b), and the despeckled filtered images given in (c) - (h) and proposed method in (i) .
lhttp://www.medison.ru/uzi/eho240.htm
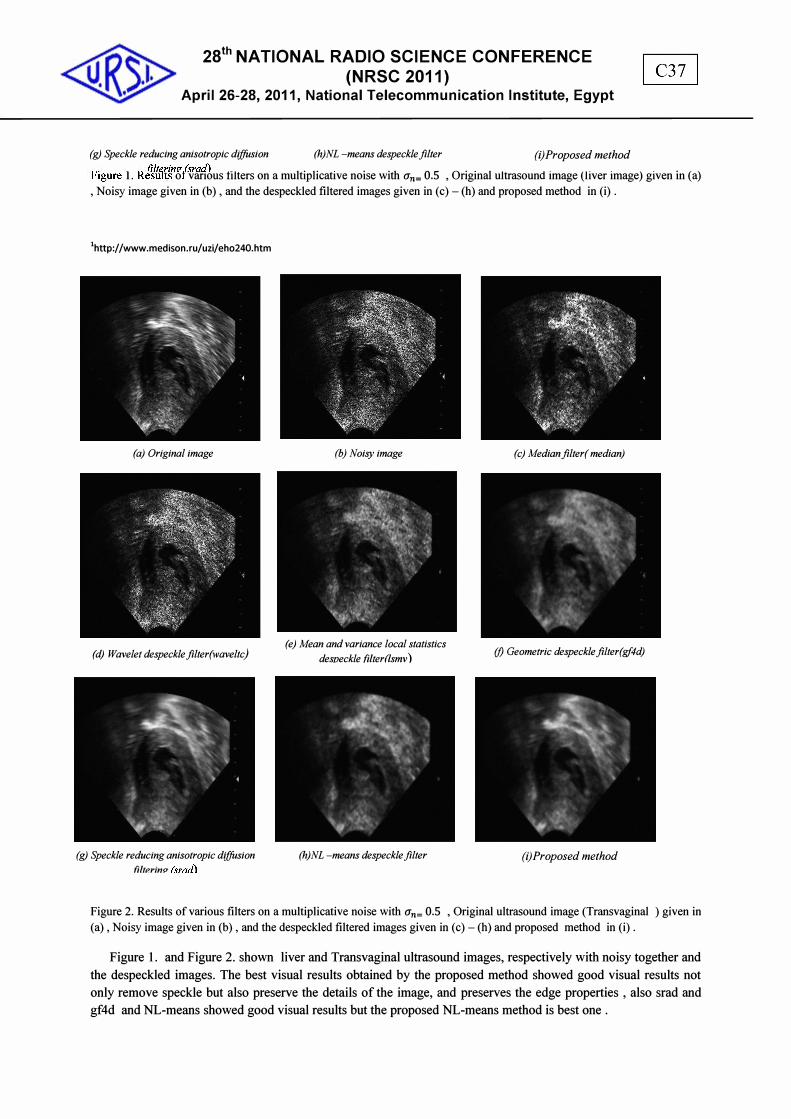
(a) Original image
(d) Wavelet despeckle filter(waveltc)
(g) Speckle reducing anisotropic diffosion filtprinp «rnd)
(b) Noisy image
(e) Mean and variance local statistics desTJeckle fi/ter(lsmv)
(h)NL -means despeckle filter
(c) Medianfilter( median)
(f) Geometric despeckle filter(gf4d)
(i)Proposed method
Figure 2. Results of various filters on a multiplicative noise with (Tn= 0.5 , Original ultrasound image (Transvaginal ) given in (a), Noisy image given in (b), and the despeckled filtered images given in (c) - (h) and proposed method in (i).
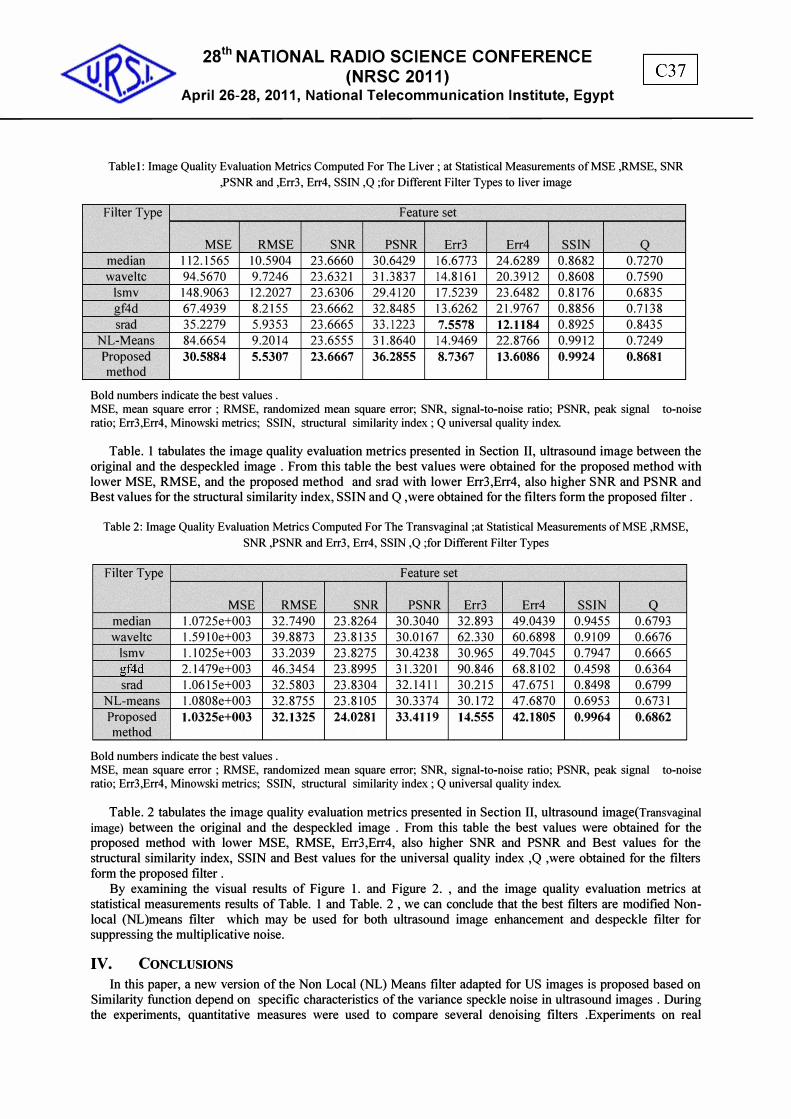
Figure 1. and Figure 2. shown liver and Transvaginal ultrasound images, respectively with noisy together and
the despeckled images. The best visual results obtained by the proposed method showed good visual results not
only remove speckle but also preserve the details of the image, and preserves the edge properties , also srad and
gf4d and NL-means showed good visual results but the proposed NL-means method is best one .
28th NATIONAL RADIO SCIENCE CONFERENCE (NRSC 2011)
April 26-28, 2011, National Telecommunication Institute, Egypt
Tablel: Image Quality Evaluation Metrics Computed For The Liver ; at Statistical Measurements of MSE ,RMSE, SNR ,PSNR and ,Err3, Err4, SSIN ,Q ;for Different Filter Types to liver image
Filter Type Feature set
MSE RMSE SNR PSNR Err3 Err4 SSIN Q median 112.1565 10.5904 23.6660 30.6429 16.6773 24.6289 0.8682 0.7270 waveltc 94.5670 9.7246 23.6321 31.3837 14.8161 20.3912 0.8608 0.7590
Ismv 148.9063 12.2027 23.6306 29.4120 17.5239 23.6482 0.8176 0.6835 gf4d 67.4939 8.2155 23.6662 32.8485 13.6262 21.9767 0.8856 0.7138 srad 35.2279 5.9353 23.6665 33.1223 7.5578 12.1184 0.8925 0.8435
NL-Means 84.6654 9.2014 23.6555 31.8640 14.9469 22.8766 0.9912 0.7249 Proposed 30.5884 5.5307 23.6667 36.2855 8.7367 13.6086 0.9924 0.8681 method
Bold numbers indicate the best values. MSE, mean square error ; RMSE, randomized mean square error; SNR, signal-to-noise ratio; PSNR, peak signal to-noise ratio; Err3,Err4, Minowski metrics; SSIN, structural similarity index ; Q universal quality index.
Table. 1 tabulates the image quality evaluation metrics presented in Section II, ultrasound image between the original and the despeckled image . From this table the best values were obtained for the proposed method with lower MSE, RMSE, and the proposed method and srad with lower Err3,Err4, also higher SNR and PSNR and Best values for the structural similarity index, SSIN and Q ,were obtained for the filters form the proposed filter .
Table 2: Image Quality Evaluation Metrics Computed For The Transvaginal ;at Statistical Measurements of MSE ,RMSE,
SNR ,PSNR and Err3, Err4, SSIN ,Q ;for Different Filter Types
Filter Type Feature set
MSE RMSE SNR PSNR Err3 Err4 SSIN Q median 1.0725e+003 32.7490 23.8264 30.3040 32.893 49.0439 0.9455 0.6793 waveltc 1.5910e+003 39.8873 23.8135 30.0167 62.330 60.6898 0.9109 0.6676
Ismv 1.1025e+003 33.2039 23.8275 30.4238 30.965 49.7045 0.7947 0.6665 gf4d 2.147ge+003 46.3454 23.8995 31.3201 90.846 68.8102 0.4598 0.6364 srad 1.0615e+003 32.5803 23.8304 32.1411 30.215 47.6751 0.8498 0.6799
NL-means 1.0808e+003 32.8755 23.8105 30.3374 30.172 47.6870 0.6953 0.6731 Proposed 1.0325e+003 32.1325 24.0281 33.4119 14.555 42.1805 0.9964 0.6862 method
Bold numbers indicate the best values. MSE, mean square error ; RMSE, randomized mean square error; SNR, signal-to-noise ratio; PSNR, peak signal to-noise ratio; Err3,Err4, Minowski metrics; SSIN, structural similarity index ; Q universal quality index.
Table. 2 tabulates the image quality evaluation metrics presented in Section II, ultrasound image(Transvaginal image) between the original and the despeckled image . From this table the best values were obtained for the proposed method with lower MSE, RMSE, Err3,Err4, also higher SNR and PSNR and Best values for the structural similarity index, SSIN and Best values for the universal quality index ,Q ,were obtained for the filters form the proposed filter .
By examining the visual results of Figure 1. and Figure 2. , and the image quality evaluation metrics at statistical measurements results of Table. 1 and Table. 2 , we can conclude that the best filters are modified Nonlocal (NL )means filter which may be used for both ultrasound image enhancement and despeckle filter for suppressing the multiplicative noise.
IV. CONCLUSIONS In this paper, a new version of the Non Local (NL) Means filter adapted for US images is proposed based on
Similarity function depend on specific characteristics of the variance speckle noise in ultrasound images . During the experiments, quantitative measures were used to compare several denoising filters .Experiments on real
28th NATIONAL RADIO SCIENCE CONFERENCE (NRSC 2011)
April 26-28, 2011, National Telecommunication Institute, Egypt
ultrasound data were conducted and showed that the proposed method is very efficient at smoothing homogeneous areas while preserving edges. Moreover, as assessed by quantitative results, our adaptation of classical NL-means filter to speckle noise proposes is more suitable for US imaging. Our method can preserve fine details like textures while removing the noise. Experimental results showed that the proposed filter works better than another filters , not only remove speckle but also preserve the details of the image and is better than all
other in quantitative terms as well as visual quality of the image. Initial fmdings show promising results ; however; Further work will be extension of the proposed NLM filter to three dimensions will further improve the results due to mainly two reasons. First, a 3D neighbourhood will produce a more robust similarity measure than in 2D and, second, the number of similar patterns surrounding each voxel will be increased.
REFERENCES
[1] A. Webb, Introduction to Biomedical Imaging: Hoboken: John Wiley & Sons, Inc., 2003 . [2] R. Maini and H. Aggarwal , "A Novel Technique for Speckle Noise Reduction onMedical Images,"
International Journal of Applied Engineering Research , vol. 5 ,no. 1 ,pp. 1-8, 2010 . [3] C.B. Burckhardt, " Speckle in ultrasound B-mode scans, " IEEE Trans. Sonics Ultrason., vol. SU-25, no. 1,
pp. 1--6, 1978. [4] R. F.Wagner, S.W. Smith, J. M. Sandrik, and H. Lopez, " Statistics of speckle in ultrasound B-scans, " IEEE
Trans. Sonics Ultrason., vol. 30, pp. 156-163, 1983. [5] J. W. Goodman, " Some fundamental properties of speckle, " J. Opt. Soc. Amer, vol. 66, no. 11, pp. 1145-
1149, 1976. [6] S.K. Narayanan and R.S.D.Wahidabanu , " A View on Despeckling in Ultrasound Imaging, " International
Journal of Signal Processing, Image Processing and Pattern Recognition ,vol. 2, No.3, pp . 85-98 ,Sep.2009.
[7] A. Buades, B. ColI, and J.M .Morel, " A non local algorithm for image denoising, " IEEE Int. Con! on Computer Vision and Pattern Recognition, vol. 2, pp. 60-65, 2005.
[8] T. Huang, G. Yang, and G. Tang, " A fast two-dimensional median filtering algorithm, " IEEE Trans. Acoust. Speech Signal Processing, vol. 27, no. 1, pp. 13-18, 1979.
[9] D.L. Donoho, "Denoising by soft thresholding, " IEEE Trans. Inform. Theory, vol. 41, pp. 613--627, 1995.
[10] A. Achim, A.Bezerianos and P.Tsakalides, " Novel Bayesian multi scale method for speckle removal in medical ultrasound images, " IEEE Trans. Med Imag.,vol.20, no.8 pp.772-783, Aug.2001.
[11] L. Busse, T. R. Crimmins, and J. R. Fienup, " A model based approach to improve the performance of the
geometric filtering speckle reduction algorithm, "in Proc. IEEE Ultras on. Symp., pp. 1353-1356 ,1995. [12] Y. Yongjian and S. T. Acton, "Speckle reducing anisotropic diffusion, "IEEE Trans. Image Processing, vol.
11, no. II, pp. 1260-1270, Nov. 2002. [13] L.P. Yaroslavsky, Digital Picture Processing - An Introduction, Springer Verlag, 1985. [14] C.Tomasi and R. Manduchi" Bilateral Filtering for Gray and Color Images, " IEEE International
Conference on Computer Vision, India. 1998. [15] A. Buades, B. ColI, and J.-M. Morel, "Nonlocal image and movie denoising, " Inti. J. Compo Vis., vol.
(toappear), 2007. [16] A. Buades et aI., " A review of image denoising algorithms, with a new one, " Multiscale Modeling &
Simulation, vol. 4, no. 2, pp. 490-530, 2005. [17] J.S. Lee. " Digital image smoothing and the sigma filter, "Computer Vision, Graphics and Image
Processing, vol.24 , pp.255-269, 1983. [18] P. Coupe, P. Hellier, C. Kervrann, and C. Barillot , " Nonlocal means-based speckle filtering for ultrasound
images , " IEEE Trans Image Process ,vol. 18, no. 10, pp.I-13, Nov. 2009 .
[19] T. J. Chen, K. S. Chuang, J. Wu, S. C. Chen, I. M. Hwang, and M. L. Jan, " A novel image quality index
using Moran I statistics, " Phys. Med BioI., vol. 48, pp. 131-137, 2003. [20] R. Gonzalez and R. Woods, "Digital Image Processing, " 2nd ed Upper Saddle River, NJ: Prentice-Hall,
pp. 419-420, 2002. [21] D. Sakrison, " On the role of observer and a distortion measure in image transmission, " IEEE Trans.
Commun., vol. 25, pp. 1251- 1267, Nov. 1977. [22] Z.Wang and A. Bovik, " A universal quality index, " IEEE Signal Processing Lett., vol. 9, no. 3, pp. 81-84,
Mar. 2002. [23] Z. Wang, A. Bovik, H. Sheikh, and E. Simoncelli, "Image quality assessment: From error measurement to
structural similarity, " IEEE Trans. Image Processing, vol. 13, no. 4, pp. 600--612, Apr. 2004.