Embed Size (px)
Citation preview
1
PROPOSITION 39 CLEAN ENERGY JOBS ACT REPORT TO THE LEGISLATURE
California’s Citizen Oversight Board
2nd ANNUAL REPORT
Edmund G. Brown Jr., Governor
March 2017
2
California Citizen Oversight Board
Kate Gordon Chair James “Walkie” Ray Vice Chair David Dias Mark Gold Arno Harris Gary Kremen Randall Martinez Chelina Odbert Board Members Robert Weisenmiller Michael Picker Ex-Officio Members Jack Bastida Staff Member, Citizen Oversight Board
3
TABLE OF CONTENTS
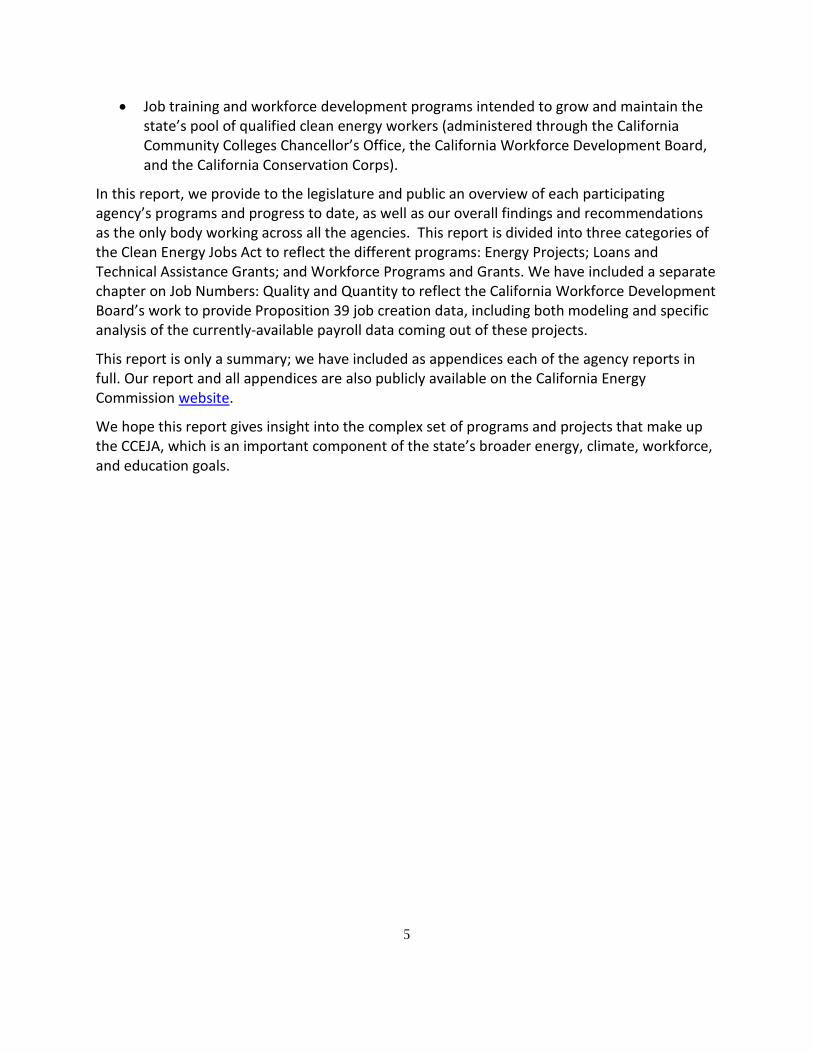
CHAPTER 1: Background and Update on the California Clean Energy Jobs Act ..... 7 CHAPTER 2: Citizen Oversight Board Mandates, Meeting History, and Audit Progress ............................................................................................................... 11 CHAPTER 3: Clean Energy Jobs Act Programs: Energy Projects ........................... 14
K-12 Program (California Energy Commission) .................................................. 15 Community College Program (California Community College Chancellor's Office) ............................................................................................................... 25
CHAPTER 4: Loans and Technical Assistance Grants ........................................... 31 Energy Conservation Assistance Account – Education (ECAA-Ed) Loans ............ 32 Bright School Program ...................................................................................... 33
CHAPTER 5: Workforce Programs and Grants ...................................................... 34 California Workforce Development Board Apprenticeship Grants .................... 34 California Community College Chancellor's Office Workforce Development Division Grants .................................................................................................. 38 California Conservation Corps - Energy Corps Program ..................................... 40
CHAPTER 6: Jobs Numbers: Quality and Quantity ................................................ 44 CHAPTER 7: Overall Findings and Recommendations .......................................... 50
4
INTRODUCTION
The Citizen Oversight Board is pleased to present its second annual report to the California legislature on California’s Clean Energy Jobs Act (also known as “CCEJA”). The California Clean Energy Jobs Act was created through legislation after voters approved Proposition 39 in the November 6, 2012 statewide general election. The statute changed the corporate income tax code and allocated projected revenue for five fiscal years, beginning with fiscal year 2013-14 and ending in fiscal year 2017-18.
We included a detailed overview of the history and governance of the CCEJA in last year’s report to the legislature, and will not repeat that information here.
But to briefly recap, the California Clean Energy Jobs Act was created under Proposition 39 (Prop 39) on November 6, 2012, in the statewide general election.0F
1 Post-election, the following legislative actions provided the structure and organization of the California Clean Energy Jobs Act:
● Enabling Legislation for Proposition 39: Senate Bill 731F
2 ● Subsequent legislation on CCEJA Citizen Oversight Board implementation: Assembly Bill
22272F
3 ● Regulatory Guidelines from the CEC: Proposition 39: California Clean Energy Jobs Act-
2013 Program Implementation Guidelines3F
4 ● Regulatory Guidelines from the California Community Colleges: California Community
College Proposition 39 Implementation Guidelines4F
5
The CCEJA as enacted encompasses programs from a number of state agencies, all focused on improving energy efficiency and promoting clean energy projects and jobs in our public schools and community colleges. These programs fall into three categories:
• Direct grants for energy audits, retrofits, and clean energy project development (administered by the California Energy Commission for K-12 schools and the California Community College Chancellor’s Office for community colleges);
• Loans and technical assistance to support these projects (administered through existing loan programs of the California Energy Commission); and
1 California Secretary of State. Statement of Vote: November 6, 2012 General Election. 2012 2 Senate Bill 73. Committee on Budget and Fiscal Review, Chapter 29, Statutes of 2013 3 Assembly Bill 2227, Quirk. Chapter 683, Statutes of 2014 4 Bucaneg, Haile, Pierre duVair, Cheng Moua, Justin Regnier, Keith Roberts, Elizabeth Shirakh, Joseph Wang. 2013. Proposition 39: California Clean Energy Jobs Act- 2013 Program Implementation Guidelines. California Energy Commission. CEC-400-2014-022-CMF. 5 California Community Colleges Chancellor’s Office. Revised 2014. California Community Colleges Proposition 39 Implementation Guidelines. 2014
5
• Job training and workforce development programs intended to grow and maintain the state’s pool of qualified clean energy workers (administered through the California Community Colleges Chancellor’s Office, the California Workforce Development Board, and the California Conservation Corps).
In this report, we provide to the legislature and public an overview of each participating agency’s programs and progress to date, as well as our overall findings and recommendations as the only body working across all the agencies. This report is divided into three categories of the Clean Energy Jobs Act to reflect the different programs: Energy Projects; Loans and Technical Assistance Grants; and Workforce Programs and Grants. We have included a separate chapter on Job Numbers: Quality and Quantity to reflect the California Workforce Development Board’s work to provide Proposition 39 job creation data, including both modeling and specific analysis of the currently-available payroll data coming out of these projects.
This report is only a summary; we have included as appendices each of the agency reports in full. Our report and all appendices are also publicly available on the California Energy Commission website.
We hope this report gives insight into the complex set of programs and projects that make up the CCEJA, which is an important component of the state’s broader energy, climate, workforce, and education goals.

6
7
CHAPTER 1: Background on the California Clean Energy Jobs Act
The main objectives of the California Clean Energy Jobs Act are laid out in the California Public Resource Code5F
6, which states that the program is intended to:
a) Create good-paying energy efficiency and clean energy jobs in California. b) Put Californians to work repairing and updating schools and public buildings to improve
their energy efficiency and make other clean energy improvements that create jobs and save energy and money.
c) Promote the creation of new private sector jobs improving the energy efficiency of commercial and residential buildings.
d) Achieve the maximum amount of job creation and energy benefits with available funds. e) Supplement, complement, and leverage existing energy efficiency and clean energy
programs to create increased economic and energy benefits for California in coordination with the California Energy Commission and the California Public Utilities Commission.
f) Provide a full public accounting of all money spent and jobs and benefits achieved so the programs and projects funded pursuant to this division can be reviewed and evaluated.
In this report to the legislature, which covers the period from January 2016 until December 2017, the Citizen Oversight Board looks to these overarching objectives of energy efficiency and clean energy jobs when determining our recommendations and conclusions regarding the California Clean Energy Jobs Act.
Update on timeline of the California Clean Energy Jobs Act
A complete timeline of the key events of the CCEJA is available in the board’s first Proposition 39 Clean Energy Jobs Act report to the legislature located at this link. Below is an update of that timeline that includes activities since March 2016. 2016
➢ March 2016: Citizen Oversight Board meeting
6 California Public Resource Code § 26201
8
➢ March 2016: Citizen Oversight Board’s first annual report submitted to the legislature ➢ April 2016: California Community College Chancellor's Office releases revised
implementation guidelines for community college program ➢ May 2016: Citizen Oversight Board meeting ➢ June 2016: California Community College Chancellor's Office releases 2016-17 Prop 39
allocations for community college districts ➢ July 2016: California Energy Commission revises program guidelines for K-12 program ➢ Sept 2016: Workforce Development Board awards Prop. 39 2.0 development grants in
technical assistance, development, and training implementation ➢ Sept 2016: Energy Commission’s K-12 program receives annual project progress reports ➢ Sept 2016: Citizen Oversight Board meeting
2017
➢ Feb 2017: Citizen Oversight Board meeting to review agency reports on prior year activities
➢ Feb 2017: California Department of Education releases 2017 Proposition 39 fund allocation entitlement to LEAs
➢ March 2017: Citizen Oversight Board meeting to approve final report to the legislature
Update on CCEJA Funding Allocations
The California Clean Energy Jobs Act necessitated the creation of the Clean Energy Job Creation Fund. This fund, created in the State Treasury, provides funds for the programs of the California Clean Energy Jobs Act. The fund is capitalized each year from corporate tax receipts generated by the tax loophole closed by the original Proposition 39. Because the fund is dependent on actual tax receipts, the amount placed into the fund each year varies.
Senate Bill 73 establishes that CEC’s Local Educational Agency Proposition 39 Award Program, which focuses on K-12 schools, receives 89 percent of the Clean Energy Job Creation Fund funds allocated by the Superintendent of Public Instruction, while the California Community College Chancellor’s Office receives 11 percent allocated by the Chancellor of the California Community Colleges. The Citizen Oversight Board is tasked with providing a full accounting audit of the fund, which we commissioned from the Controller’s office in June of 2016. We expect to receive the audit report in May of 2017.
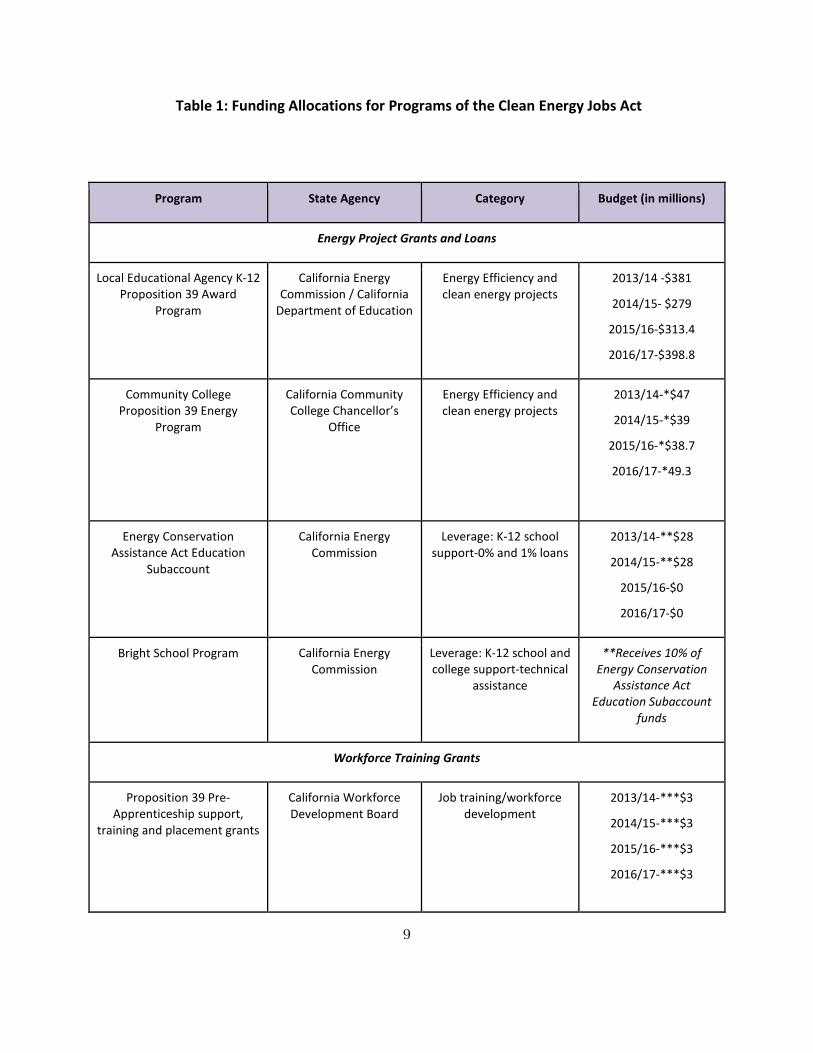
Table 1 below has been updated from last year’s report to show fiscal year 2016/17:
9
Table 1: Funding Allocations for Programs of the Clean Energy Jobs Act
Program State Agency Category Budget (in millions)
Energy Project Grants and Loans
Local Educational Agency K-12 Proposition 39 Award
Program
California Energy Commission / California
Department of Education
Energy Efficiency and clean energy projects
2013/14 -$381
2014/15- $279
2015/16-$313.4
2016/17-$398.8
Community College Proposition 39 Energy
Program
California Community College Chancellor’s
Office
Energy Efficiency and clean energy projects
2013/14-*$47
2014/15-*$39
2015/16-*$38.7
2016/17-*49.3
Energy Conservation Assistance Act Education
Subaccount
California Energy Commission
Leverage: K-12 school support-0% and 1% loans
2013/14-**$28
2014/15-**$28
2015/16-$0
2016/17-$0
Bright School Program California Energy Commission
Leverage: K-12 school and college support-technical
assistance
**Receives 10% of Energy Conservation
Assistance Act Education Subaccount
funds
Workforce Training Grants
Proposition 39 Pre-Apprenticeship support,
training and placement grants
California Workforce Development Board
Job training/workforce development
2013/14-***$3
2014/15-***$3
2015/16-***$3
2016/17-***$3
10
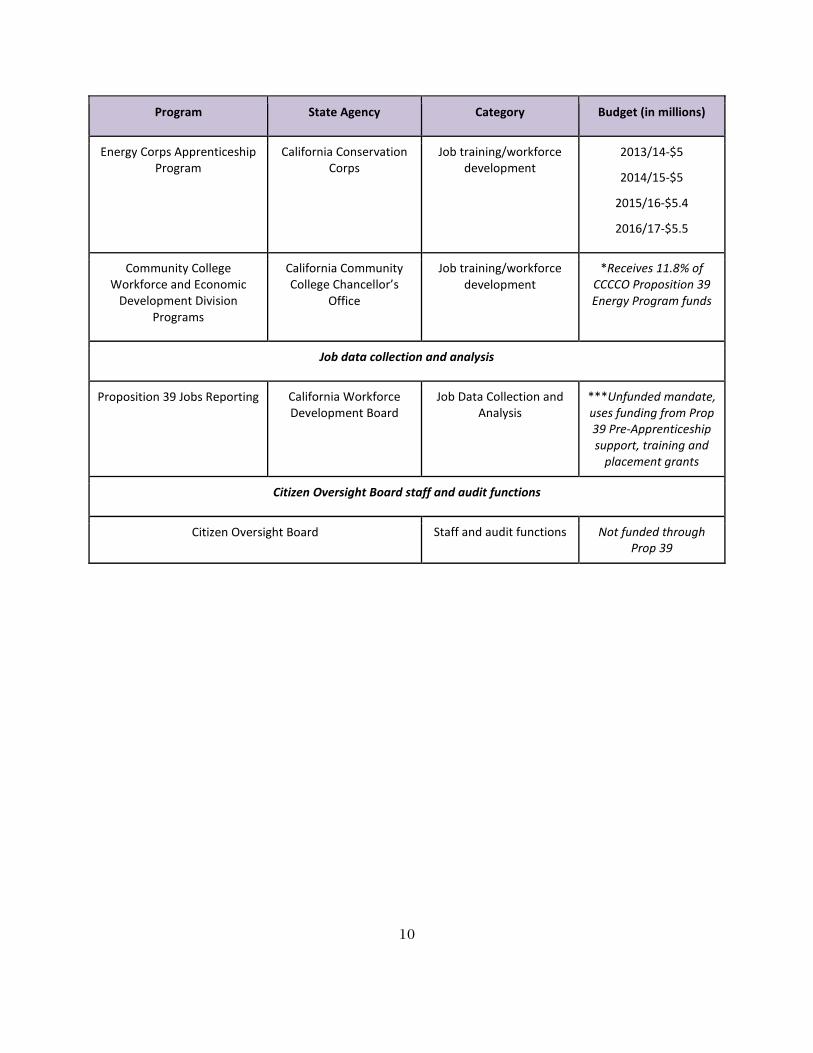
Program State Agency Category Budget (in millions)
Energy Corps Apprenticeship Program
California Conservation Corps
Job training/workforce development
2013/14-$5
2014/15-$5
2015/16-$5.4
2016/17-$5.5
Community College Workforce and Economic
Development Division Programs
California Community College Chancellor’s
Office
Job training/workforce development
*Receives 11.8% of CCCCO Proposition 39 Energy Program funds
Job data collection and analysis
Proposition 39 Jobs Reporting California Workforce Development Board
Job Data Collection and Analysis
***Unfunded mandate, uses funding from Prop 39 Pre-Apprenticeship support, training and
placement grants
Citizen Oversight Board staff and audit functions
Citizen Oversight Board Staff and audit functions Not funded through Prop 39
11
CHAPTER 2: Citizen Oversight Board Mandates, Meeting History, and Audit Progress
The Citizen Oversight Board is composed of nine members: three members appointed by each the Treasurer, the Controller, and the Attorney General. The California Public Utilities Commission and California Energy Commission also each designate an ex-officio (non-voting) member to serve on the board. Currently the board has eight members, as we are waiting for a replacement appointment from the State Treasurer’s Office.
Mandates of the Citizen Oversight Board
Assembly Bill 22276F
7 (2014) lays out the Citizen Oversight Board’s main responsibilities and adds these to the Public Resource Code7F
8
Those duties include:
1) Annually review all expenditures from the Job Creation Fund 2) Commission and review an annual independent audit of the Job Creation Fund and of a selection of projects completed to assess the effectiveness of the expenditures in meeting the objectives of this division 3) Publish a complete accounting of all expenditures each year, posting the information on a publicly accessible Internet Web site 4) Submit an evaluation of the program to the Legislature identifying any changes needed to meet the objectives of this division As such, the two major responsibilities of the Citizen Oversight Board are to produce an annual program audit of the California Clean Energy Jobs Act, and to provide an annual report to the legislature evaluating the overall program. This report serves to meet the latter responsibility; we discuss the progress on the audit below.
Meeting History of the Citizen Oversight Board
Below is a brief description of Citizen Oversight Board meetings that took place in 2016 and early 2017. Full agendas and minutes of the board are publicly available online at
7 Assembly Bill 2227, Quirk, Chapter 683, Statutes of 2014
8 Public Resource Code Section 26210-26217
12
http://www.energy.ca.gov/efficiency/proposition39/citizens_oversight_board/. (Note that the complete meeting history of the board starting in 2015 is available in last year’s legislative report.)
• January 11, 2016: The board heard reports from stakeholders and local education agencies on the K-12 program; report on the annual report received from the California Community College Chancellor’s Office; update on the jobs report from the California Workforce Development Board. The board also formed committees to focus on this legislative report and the formal audit.
• March 29, 2016: The board met to review final reports from relevant agencies and approve last year’s report to the legislature, among other activities.
• May 20, 2016: The board met to discuss entering into contract with the State Controller’s Office to perform an independent audit of the job creation fund. The board voted to enter into the contract.
• September 22, 2016: The board met to discuss the adoption of a conflict of interest code for the board. The board also heard from the TomKat Center Stanford University Fellows Solar Schools Project, which provides K-12 schools information for solar electricity generation potential.
• February 9, 2017: The board met to review and vote on accepting the annual reports from the various agencies of the California Clean Energy Jobs Act including the California Energy Commission, California Community College Chancellor’s Office, California Conservation Corps and the California Workforce Development Board. Also, the Board voting on accepting the jobs report from the California Workforce Development Board.
• March 21st, 2017: The board met to approve this year’s legislative report.
Audit Progress of the Citizen Oversight Board
In addition to the annual evaluation of the program to the legislature, the Citizen Oversight Board is also responsible for conducting an annual independent audit of the Clean Energy Job Creation Fund.
The Citizen Oversight Board entered into an interagency contract with the California State Controller’s Office on June 30th, 2016 to provide an independent audit of the Clean Energy Job Creation Fund for three years: fiscal years 2014, 2015, and 2016.
The audit of the fund will be divided into two separate audit reports. The first report will be a financial audit looking at the financial statements of the Clean Energy Job Creation Fund of the California Department of Education conducted in accordance with the Government Auditing Standards, issued by the Comptroller General of the United States. The second audit will be a performance audit of the Clean Energy Job Creation Fund aimed at reviewing a selection of completed projects from the Energy Commission K-12 Proposition 39 energy program and the
13
Community College Chancellor's Office Proposition 39 energy program to determine whether projects are consistent with the California Public Resource Code and program guidelines.
The California State Controller’s Office has selected the sites to be audited and will complete its fieldwork of visiting the sites in February 2017, with its final reports being issued in May 2017. The Citizen Oversight Board will make those audit reports available to the public and legislature and post them online when complete.
14
CHAPTER 3: Clean Energy Jobs Act Programs: Energy Projects
The California Department of Education estimates that about 70% of classrooms in the state are more than 25 years old, about 30% of them are at least 50 years old, and about 10% are at least 70 years old.8F
9 The age of the facilities, combined with deferred maintenance and regular wear and tear, has resulted in many buildings that are prime candidates for energy efficiency measures.
By implementing energy efficiency measures, many California schools have been able to reduce energy costs by as much as 30%, providing a savings on one of the few expenses for schools that can be lowered without affecting classroom instruction.9F
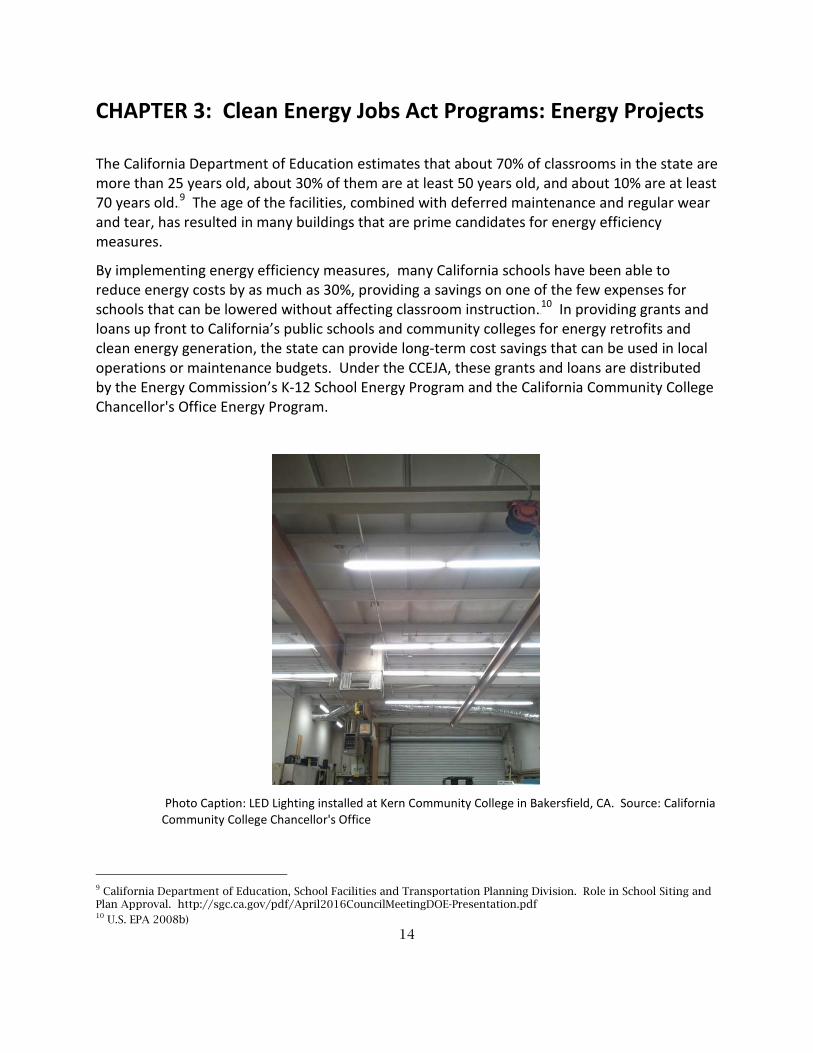
10 In providing grants and loans up front to California’s public schools and community colleges for energy retrofits and clean energy generation, the state can provide long-term cost savings that can be used in local operations or maintenance budgets. Under the CCEJA, these grants and loans are distributed by the Energy Commission’s K-12 School Energy Program and the California Community College Chancellor's Office Energy Program.
Photo Caption: LED Lighting installed at Kern Community College in Bakersfield, CA. Source: California
Community College Chancellor's Office
9 California Department of Education, School Facilities and Transportation Planning Division. Role in School Siting and Plan Approval. http://sgc.ca.gov/pdf/April2016CouncilMeetingDOE-Presentation.pdf 10 U.S. EPA 2008b)
15
K-12 Program (California Energy Commission)
Since program funding began flowing in January 2014, the Proposition 39 K-12 program has supported eligible energy efficiency measures and clean energy generation at schools within a Local Education Agency (LEA), defined as: public school districts, individual charter schools, county offices of education, and state special schools (e.g. schools serving students with special needs, such as sight- or hearing-impaired students). As of June 2016, public schools have been allocated approximately $773 million, charter schools $188 million, county offices of education $13 million, and special schools at $300,000.
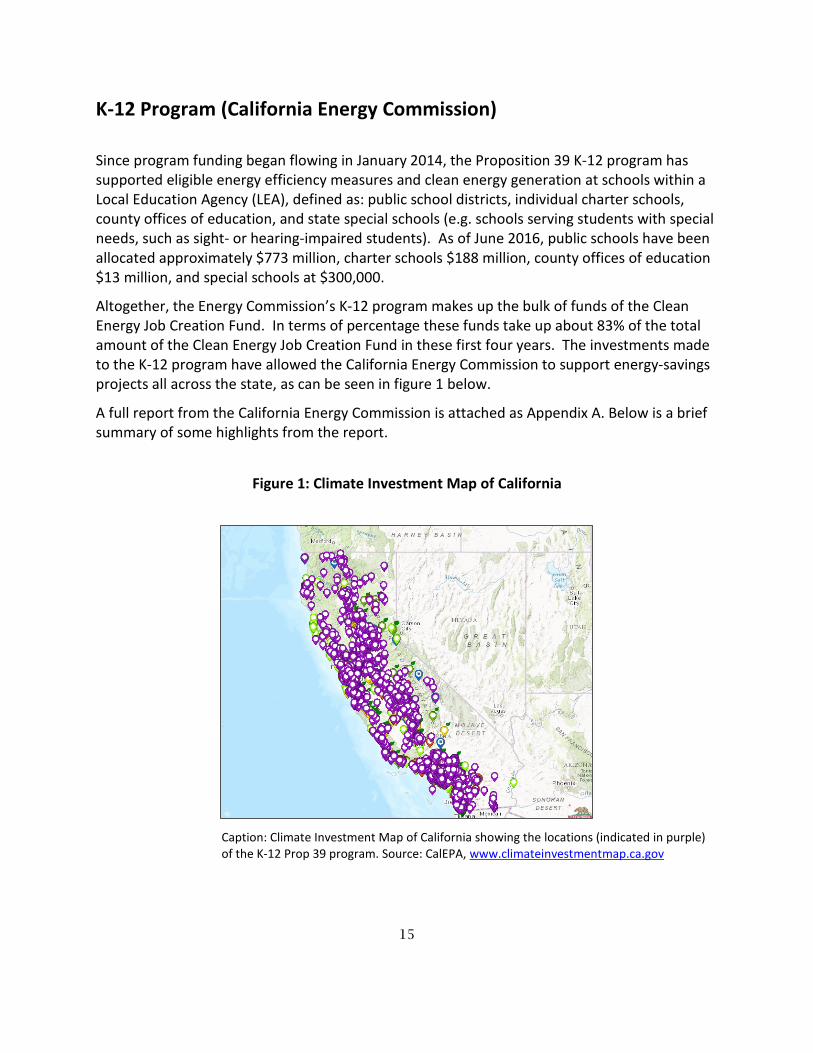
Altogether, the Energy Commission’s K-12 program makes up the bulk of funds of the Clean Energy Job Creation Fund. In terms of percentage these funds take up about 83% of the total amount of the Clean Energy Job Creation Fund in these first four years. The investments made to the K-12 program have allowed the California Energy Commission to support energy-savings projects all across the state, as can be seen in figure 1 below.
A full report from the California Energy Commission is attached as Appendix A. Below is a brief summary of some highlights from the report.
Figure 1: Climate Investment Map of California
Caption: Climate Investment Map of California showing the locations (indicated in purple) of the K-12 Prop 39 program. Source: CalEPA, www.climateinvestmentmap.ca.gov
16
Funding Allocations to Local Education Agencies
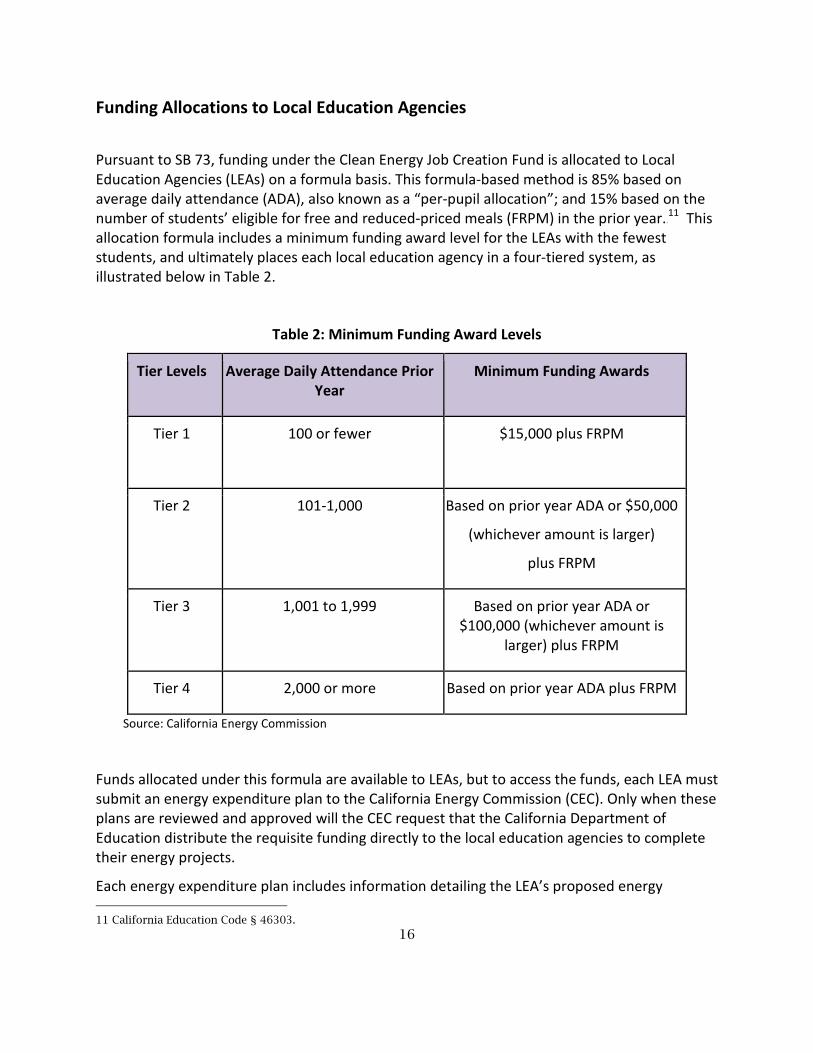
Pursuant to SB 73, funding under the Clean Energy Job Creation Fund is allocated to Local Education Agencies (LEAs) on a formula basis. This formula-based method is 85% based on average daily attendance (ADA), also known as a “per-pupil allocation”; and 15% based on the number of students’ eligible for free and reduced-priced meals (FRPM) in the prior year.10F
11 This allocation formula includes a minimum funding award level for the LEAs with the fewest students, and ultimately places each local education agency in a four-tiered system, as illustrated below in Table 2.
Table 2: Minimum Funding Award Levels
Tier Levels Average Daily Attendance Prior Year
Minimum Funding Awards
Tier 1
100 or fewer $15,000 plus FRPM
Tier 2 101-1,000 Based on prior year ADA or $50,000
(whichever amount is larger)
plus FRPM
Tier 3 1,001 to 1,999 Based on prior year ADA or $100,000 (whichever amount is
larger) plus FRPM
Tier 4 2,000 or more Based on prior year ADA plus FRPM
Source: California Energy Commission
Funds allocated under this formula are available to LEAs, but to access the funds, each LEA must submit an energy expenditure plan to the California Energy Commission (CEC). Only when these plans are reviewed and approved will the CEC request that the California Department of Education distribute the requisite funding directly to the local education agencies to complete their energy projects.
Each energy expenditure plan includes information detailing the LEA’s proposed energy 11 California Education Code § 46303.
17
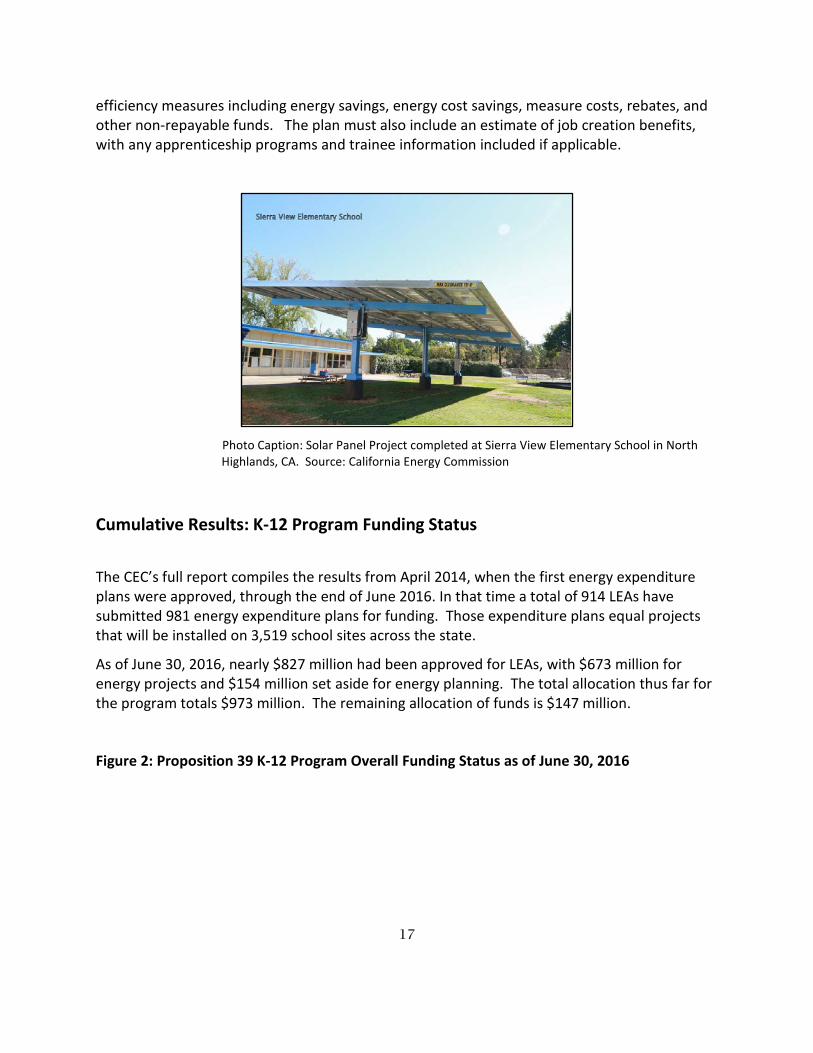
efficiency measures including energy savings, energy cost savings, measure costs, rebates, and other non-repayable funds. The plan must also include an estimate of job creation benefits, with any apprenticeship programs and trainee information included if applicable.
Photo Caption: Solar Panel Project completed at Sierra View Elementary School in North
Highlands, CA. Source: California Energy Commission
Cumulative Results: K-12 Program Funding Status
The CEC’s full report compiles the results from April 2014, when the first energy expenditure plans were approved, through the end of June 2016. In that time a total of 914 LEAs have submitted 981 energy expenditure plans for funding. Those expenditure plans equal projects that will be installed on 3,519 school sites across the state.
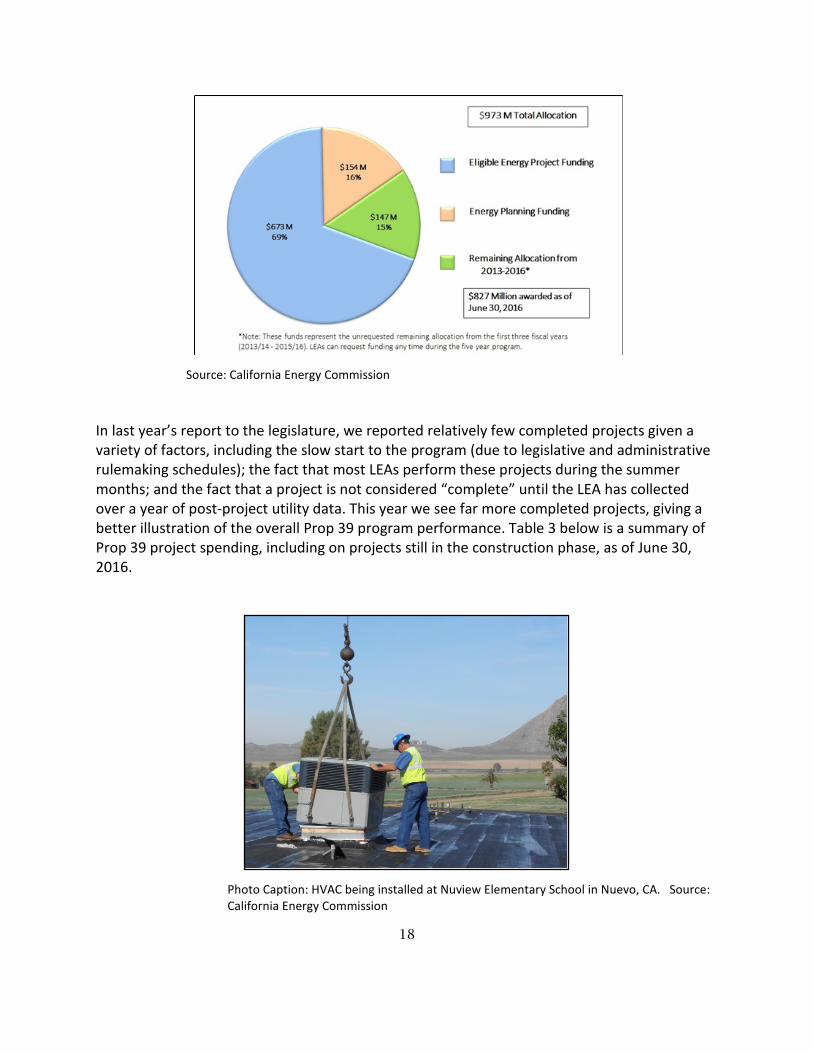
As of June 30, 2016, nearly $827 million had been approved for LEAs, with $673 million for energy projects and $154 million set aside for energy planning. The total allocation thus far for the program totals $973 million. The remaining allocation of funds is $147 million.
Figure 2: Proposition 39 K-12 Program Overall Funding Status as of June 30, 2016
18
Source: California Energy Commission
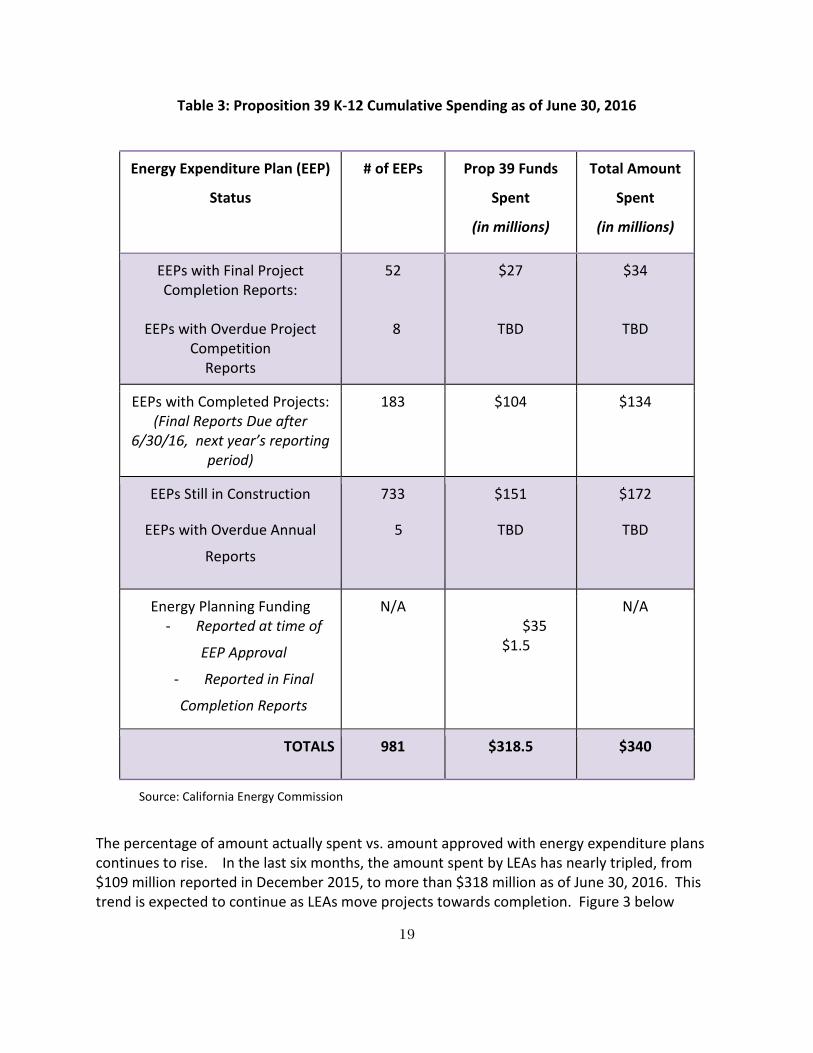
In last year’s report to the legislature, we reported relatively few completed projects given a variety of factors, including the slow start to the program (due to legislative and administrative rulemaking schedules); the fact that most LEAs perform these projects during the summer months; and the fact that a project is not considered “complete” until the LEA has collected over a year of post-project utility data. This year we see far more completed projects, giving a better illustration of the overall Prop 39 program performance. Table 3 below is a summary of Prop 39 project spending, including on projects still in the construction phase, as of June 30, 2016.
Photo Caption: HVAC being installed at Nuview Elementary School in Nuevo, CA. Source: California Energy Commission
19
Table 3: Proposition 39 K-12 Cumulative Spending as of June 30, 2016
Energy Expenditure Plan (EEP)
Status
# of EEPs Prop 39 Funds
Spent
(in millions)
Total Amount
Spent
(in millions)
EEPs with Final Project Completion Reports:
EEPs with Overdue Project
Competition Reports
52
8
$27
TBD
$34
TBD
EEPs with Completed Projects: (Final Reports Due after
6/30/16, next year’s reporting period)
183 $104 $134
EEPs Still in Construction
EEPs with Overdue Annual
Reports
733
5
$151
TBD
$172
TBD
Energy Planning Funding - Reported at time of
EEP Approval
- Reported in Final
Completion Reports
N/A $35
$1.5
N/A
TOTALS 981 $318.5 $340
Source: California Energy Commission
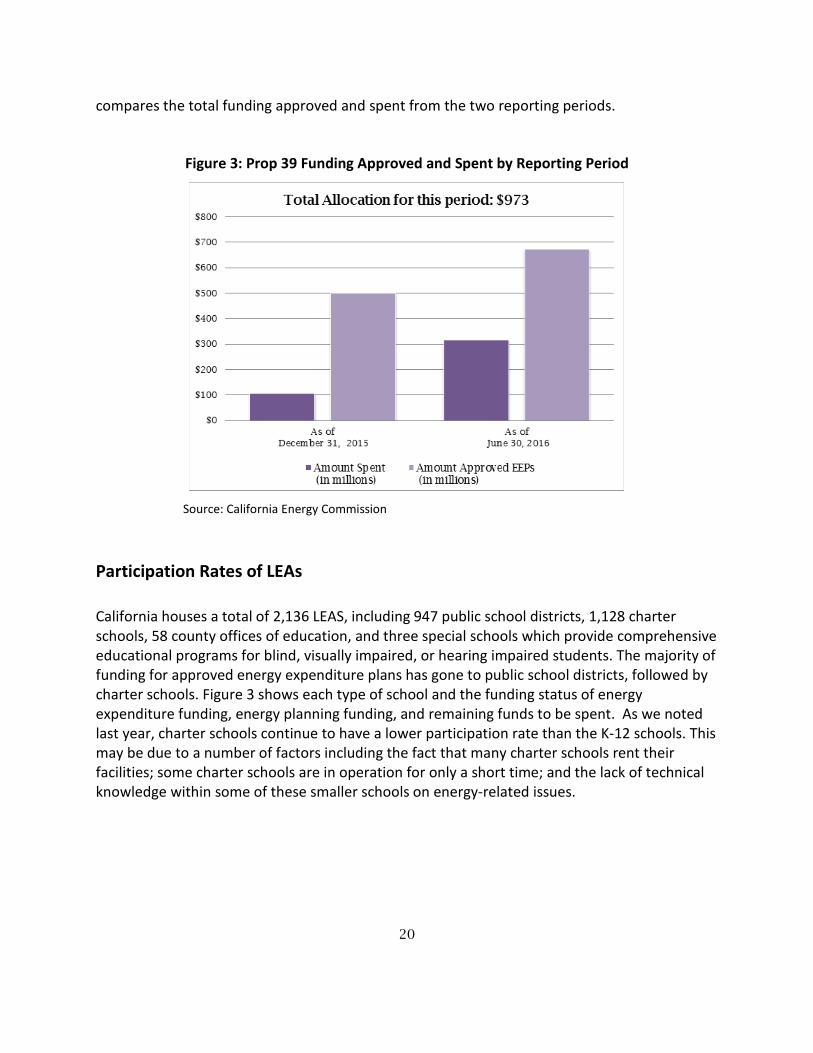
The percentage of amount actually spent vs. amount approved with energy expenditure plans continues to rise. In the last six months, the amount spent by LEAs has nearly tripled, from $109 million reported in December 2015, to more than $318 million as of June 30, 2016. This trend is expected to continue as LEAs move projects towards completion. Figure 3 below
20
compares the total funding approved and spent from the two reporting periods.
Figure 3: Prop 39 Funding Approved and Spent by Reporting Period
Source: California Energy Commission
Participation Rates of LEAs
California houses a total of 2,136 LEAS, including 947 public school districts, 1,128 charter schools, 58 county offices of education, and three special schools which provide comprehensive educational programs for blind, visually impaired, or hearing impaired students. The majority of funding for approved energy expenditure plans has gone to public school districts, followed by charter schools. Figure 3 shows each type of school and the funding status of energy expenditure funding, energy planning funding, and remaining funds to be spent. As we noted last year, charter schools continue to have a lower participation rate than the K-12 schools. This may be due to a number of factors including the fact that many charter schools rent their facilities; some charter schools are in operation for only a short time; and the lack of technical knowledge within some of these smaller schools on energy-related issues.
21
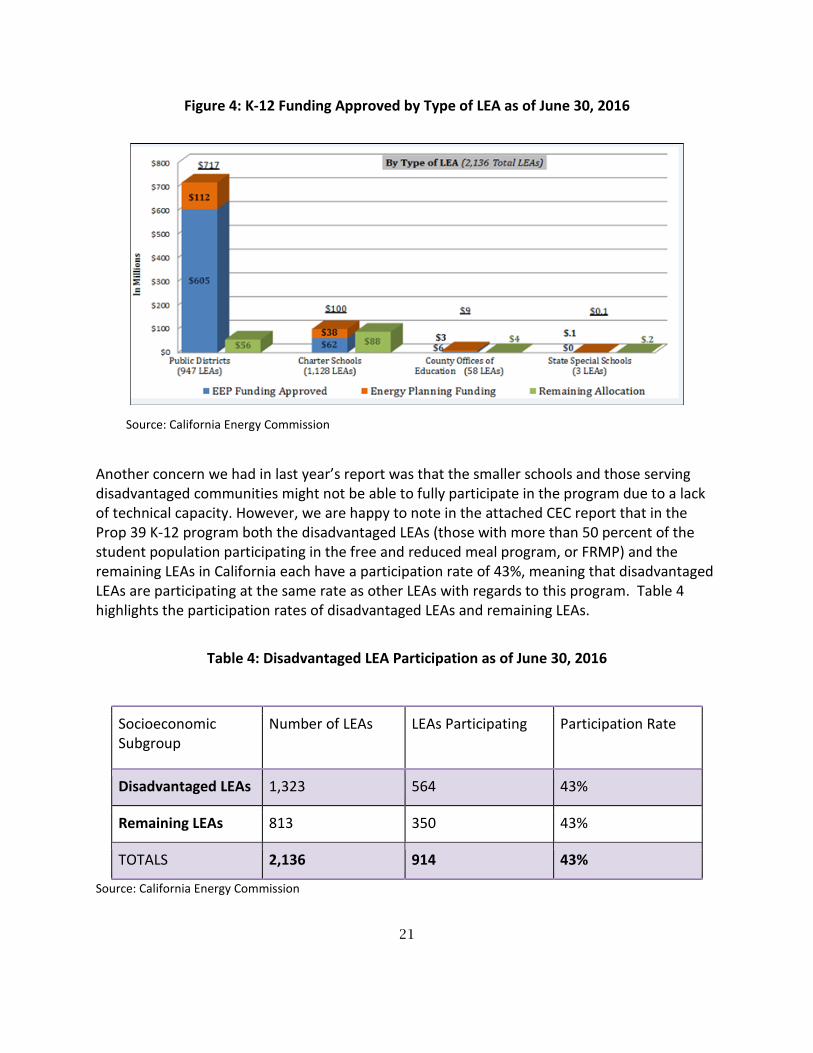
Figure 4: K-12 Funding Approved by Type of LEA as of June 30, 2016
Source: California Energy Commission
Another concern we had in last year’s report was that the smaller schools and those serving disadvantaged communities might not be able to fully participate in the program due to a lack of technical capacity. However, we are happy to note in the attached CEC report that in the Prop 39 K-12 program both the disadvantaged LEAs (those with more than 50 percent of the student population participating in the free and reduced meal program, or FRMP) and the remaining LEAs in California each have a participation rate of 43%, meaning that disadvantaged LEAs are participating at the same rate as other LEAs with regards to this program. Table 4 highlights the participation rates of disadvantaged LEAs and remaining LEAs.
Table 4: Disadvantaged LEA Participation as of June 30, 2016
Socioeconomic Subgroup
Number of LEAs LEAs Participating Participation Rate
Disadvantaged LEAs 1,323 564 43%
Remaining LEAs 813 350 43%
TOTALS 2,136 914 43%
Source: California Energy Commission
22
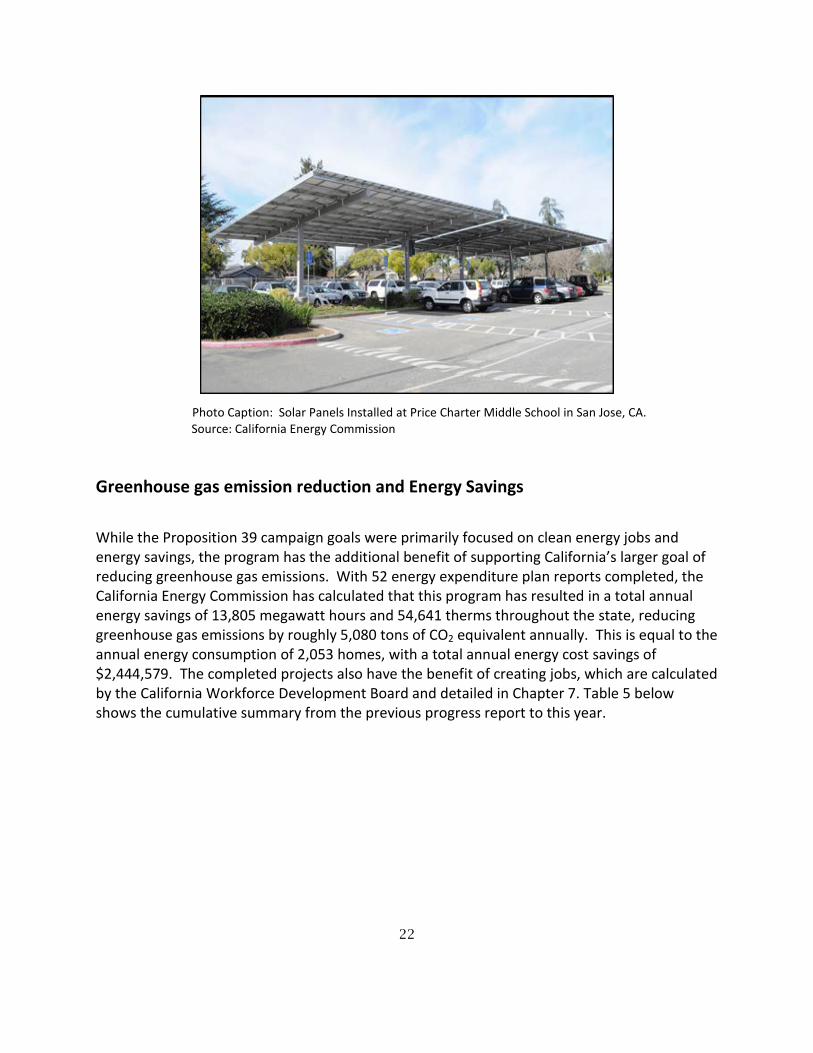
Photo Caption: Solar Panels Installed at Price Charter Middle School in San Jose, CA.
Source: California Energy Commission
Greenhouse gas emission reduction and Energy Savings
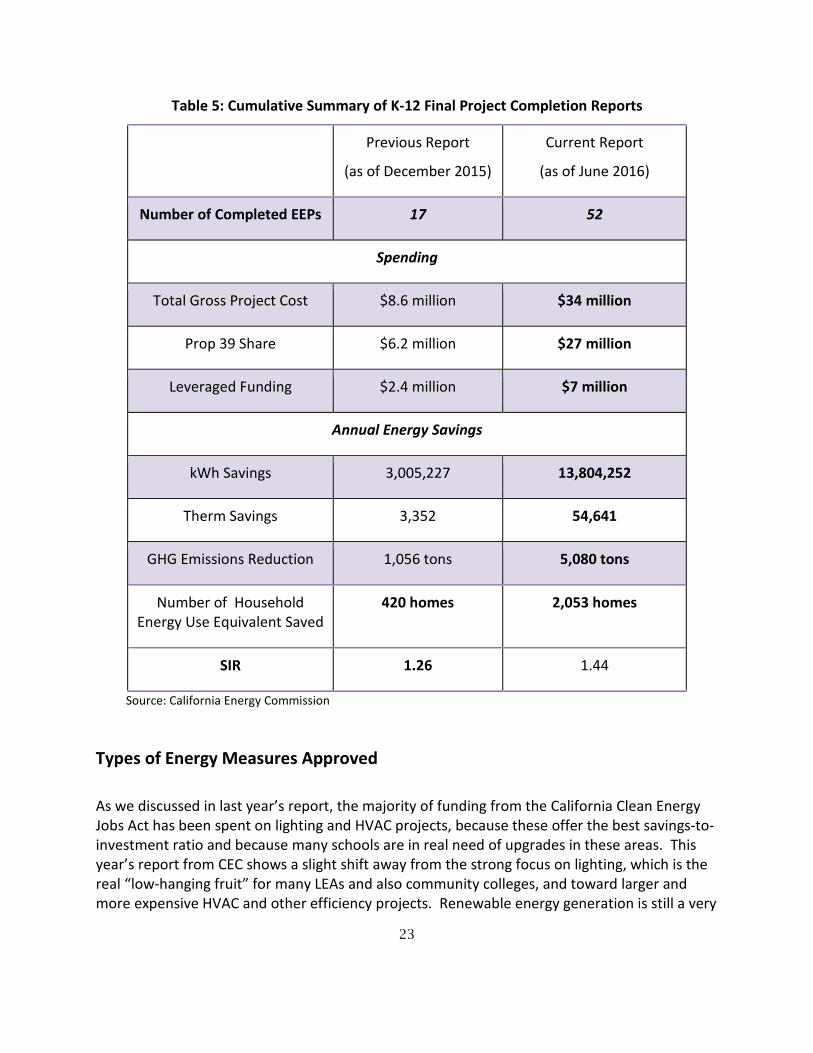
While the Proposition 39 campaign goals were primarily focused on clean energy jobs and energy savings, the program has the additional benefit of supporting California’s larger goal of reducing greenhouse gas emissions. With 52 energy expenditure plan reports completed, the California Energy Commission has calculated that this program has resulted in a total annual energy savings of 13,805 megawatt hours and 54,641 therms throughout the state, reducing greenhouse gas emissions by roughly 5,080 tons of CO2 equivalent annually. This is equal to the annual energy consumption of 2,053 homes, with a total annual energy cost savings of $2,444,579. The completed projects also have the benefit of creating jobs, which are calculated by the California Workforce Development Board and detailed in Chapter 7. Table 5 below shows the cumulative summary from the previous progress report to this year.
23
Table 5: Cumulative Summary of K-12 Final Project Completion Reports
Previous Report
(as of December 2015)
Current Report
(as of June 2016)
Number of Completed EEPs 17 52
Spending
Total Gross Project Cost $8.6 million $34 million
Prop 39 Share $6.2 million $27 million
Leveraged Funding $2.4 million $7 million
Annual Energy Savings
kWh Savings 3,005,227 13,804,252
Therm Savings 3,352 54,641
GHG Emissions Reduction 1,056 tons 5,080 tons
Number of Household Energy Use Equivalent Saved
420 homes 2,053 homes
SIR 1.26 1.44
Source: California Energy Commission
Types of Energy Measures Approved
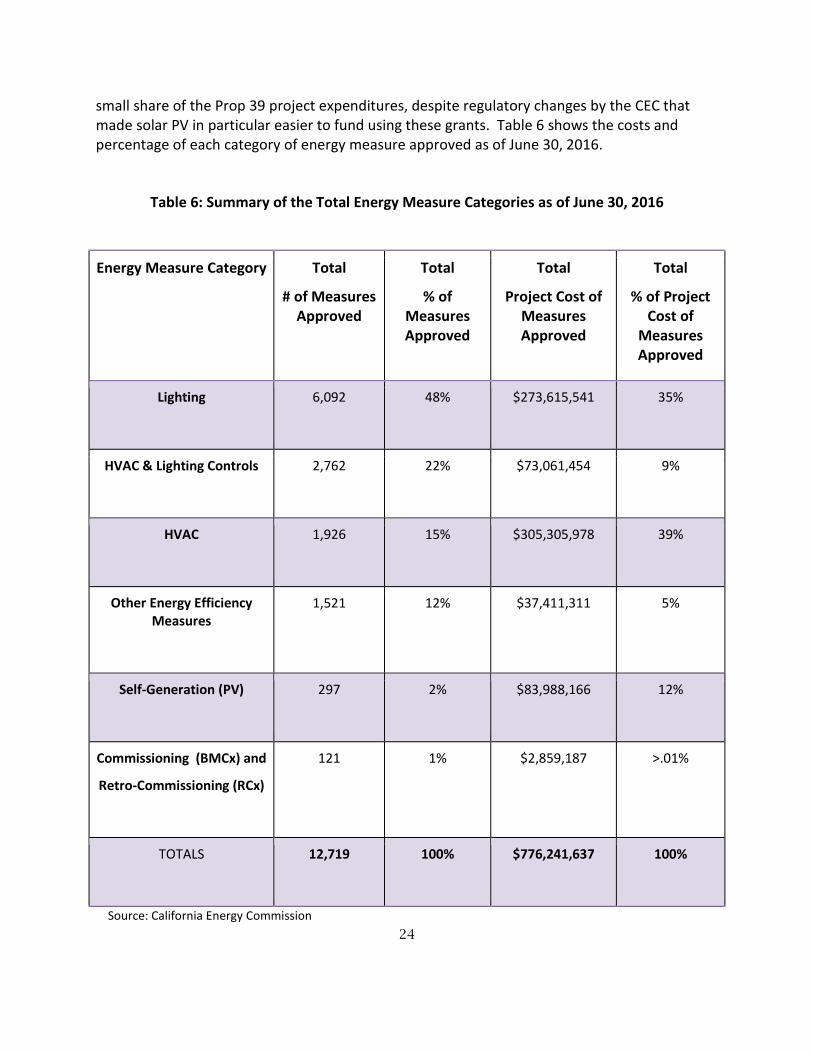
As we discussed in last year’s report, the majority of funding from the California Clean Energy Jobs Act has been spent on lighting and HVAC projects, because these offer the best savings-to-investment ratio and because many schools are in real need of upgrades in these areas. This year’s report from CEC shows a slight shift away from the strong focus on lighting, which is the real “low-hanging fruit” for many LEAs and also community colleges, and toward larger and more expensive HVAC and other efficiency projects. Renewable energy generation is still a very
24
small share of the Prop 39 project expenditures, despite regulatory changes by the CEC that made solar PV in particular easier to fund using these grants. Table 6 shows the costs and percentage of each category of energy measure approved as of June 30, 2016.
Table 6: Summary of the Total Energy Measure Categories as of June 30, 2016
Energy Measure Category
Total
# of Measures Approved
Total
% of Measures Approved
Total
Project Cost of Measures Approved
Total
% of Project Cost of
Measures Approved
Lighting
6,092 48% $273,615,541 35%
HVAC & Lighting Controls
2,762 22% $73,061,454 9%
HVAC
1,926 15% $305,305,978 39%
Other Energy Efficiency Measures
1,521 12% $37,411,311 5%
Self-Generation (PV)
297 2% $83,988,166 12%
Commissioning (BMCx) and
Retro-Commissioning (RCx)
121 1% $2,859,187 >.01%
TOTALS
12,719 100% $776,241,637 100%
Source: California Energy Commission
25
All in all, we are impressed by the increase in spending by LEAs since last year’s report, and by the geographic diversity of the projects taking advantage of this program. As we note in the recommendation section, we see some opportunities for improvement, most importantly in ensuring that the program encumbrance deadline is extended to ensure all schools can participate in the current program. We also recommend the entire program be re-upped and funded for another five years.
Community College Program (California Community College Chancellor's Office)
The California Community Colleges is the largest system of higher education in the nation, with 2.1 million students attending 113 community college campuses, with over 67% of students from diverse ethnic backgrounds.11F
12 Many times these colleges not only consist of a main campus, but also include a large number of additional facilities throughout the state. As with K-12 school facilities, the age of many of these buildings has provided fertile ground for energy-efficiency projects, which can help improve the overall building envelope, yield monetary savings for community college districts, and create a better educational environment for students across California.
Identifying Projects
At the time Proposition 39 became available to the Community College Chancellor's Office, that office already had a backlog of potential energy efficiency projects based on a 2013 ”Call for Projects” list. This already-established list, along with a pre-existing project backlog established in 2012, and the fact that funding for the community colleges is all distributed out of one central office rather than spread across over a thousand individual school sites (as is the case with the K-12 funding), allowed the Facilities Planning & Utilization division of Community College Chancellor's Office to begin allocating funding to projects on a very fast track.12F
13 To date, the Community College Chancellor's Office Energy Program has identified 735 energy projects, of which 254 have been completed.
Using its existing “Call for Projects” list, the Facilities Planning & Utilization Office had already developed a sustainably template for college districts to identify, screen, prioritize, and implement projects. This template follows California’s “loading order” of energy resources 12 California Community College Chancellor’s Office. California Community Colleges Key Facts. http://californiacommunitycolleges.cccco.edu/policyinaction/keyfacts.aspx 13 California Community Colleges Chancellor’s Office. Revised 2014. California Community Colleges Proposition 39 Implementation Guidelines. 6. 2014
26
established in 2003 in the state’s first Energy Action Plan, and requires districts to prioritize energy efficiency and demand response projects, followed by renewable energy generation, distributed generation, combined heat and power applications, and clean and efficient fossil-fired generation.
Photo Caption: New LED lighting being installed at El Camino Community College in
Torrance, CA Source: California Community College Chancellor's Office
Funding Overview
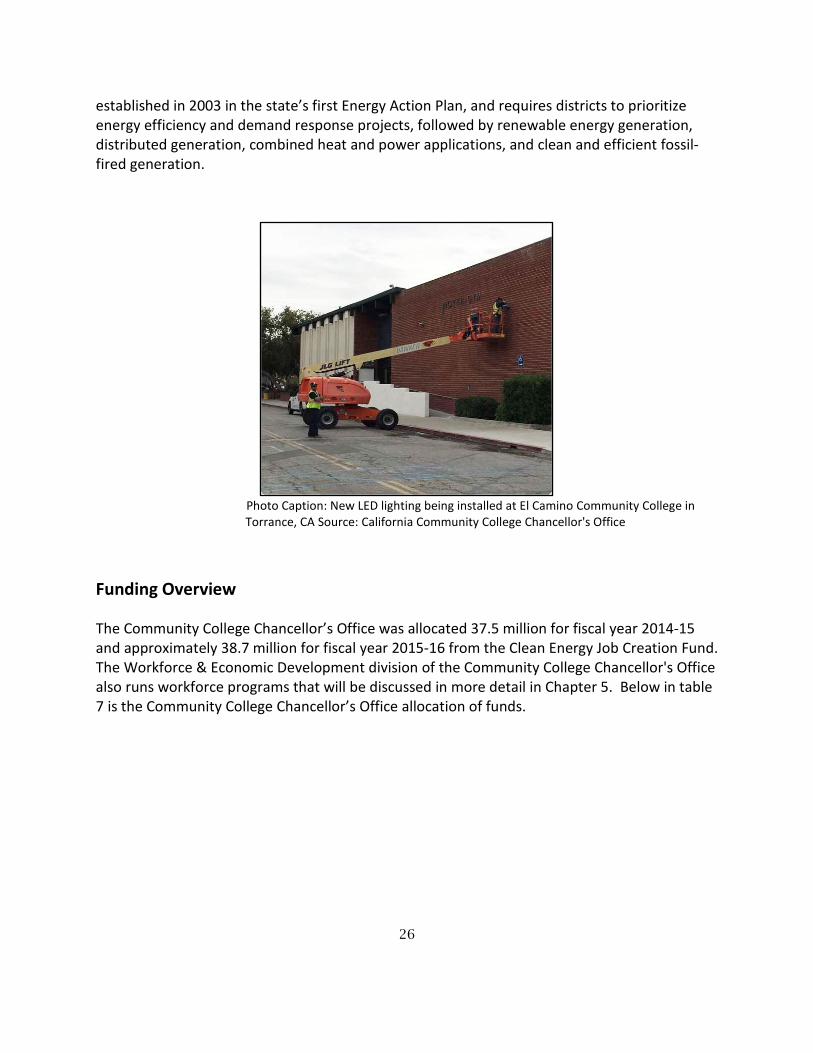
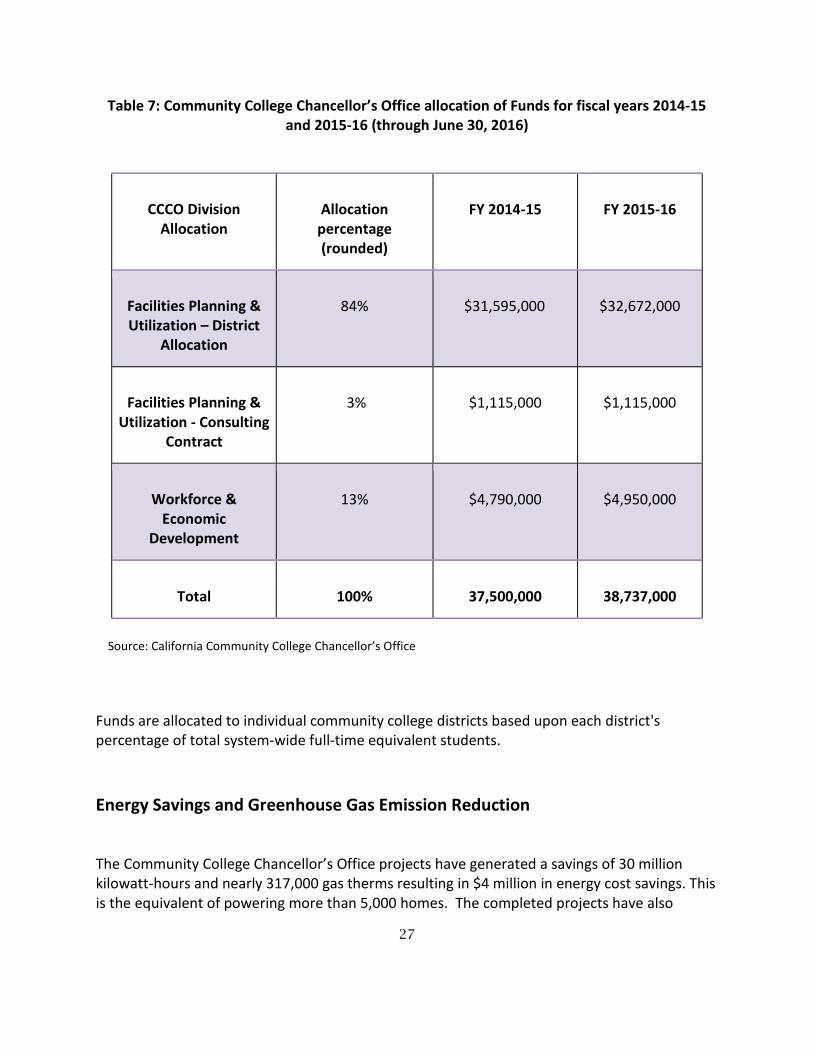
The Community College Chancellor’s Office was allocated 37.5 million for fiscal year 2014-15 and approximately 38.7 million for fiscal year 2015-16 from the Clean Energy Job Creation Fund. The Workforce & Economic Development division of the Community College Chancellor's Office also runs workforce programs that will be discussed in more detail in Chapter 5. Below in table 7 is the Community College Chancellor’s Office allocation of funds.
27
Table 7: Community College Chancellor’s Office allocation of Funds for fiscal years 2014-15 and 2015-16 (through June 30, 2016)
CCCO Division Allocation
Allocation percentage (rounded)
FY 2014-15 FY 2015-16
Facilities Planning & Utilization – District
Allocation
84% $31,595,000 $32,672,000
Facilities Planning & Utilization - Consulting
Contract
3% $1,115,000 $1,115,000
Workforce & Economic
Development
13% $4,790,000 $4,950,000
Total 100% 37,500,000 38,737,000
Source: California Community College Chancellor’s Office
Funds are allocated to individual community college districts based upon each district's percentage of total system-wide full-time equivalent students.
Energy Savings and Greenhouse Gas Emission Reduction
The Community College Chancellor’s Office projects have generated a savings of 30 million kilowatt-hours and nearly 317,000 gas therms resulting in $4 million in energy cost savings. This is the equivalent of powering more than 5,000 homes. The completed projects have also
28
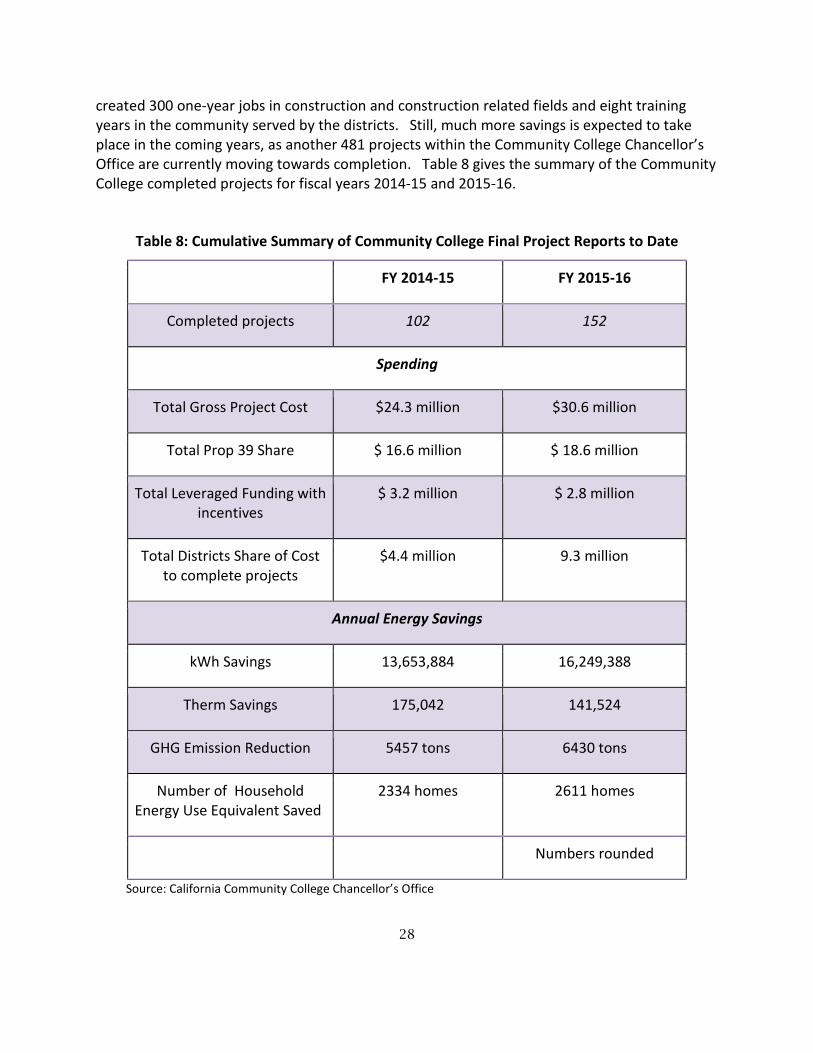
created 300 one-year jobs in construction and construction related fields and eight training years in the community served by the districts. Still, much more savings is expected to take place in the coming years, as another 481 projects within the Community College Chancellor’s Office are currently moving towards completion. Table 8 gives the summary of the Community College completed projects for fiscal years 2014-15 and 2015-16.
Table 8: Cumulative Summary of Community College Final Project Reports to Date
FY 2014-15 FY 2015-16
Completed projects 102 152
Spending
Total Gross Project Cost $24.3 million $30.6 million
Total Prop 39 Share $ 16.6 million $ 18.6 million
Total Leveraged Funding with incentives
$ 3.2 million $ 2.8 million
Total Districts Share of Cost to complete projects
$4.4 million 9.3 million
Annual Energy Savings
kWh Savings 13,653,884 16,249,388
Therm Savings 175,042 141,524
GHG Emission Reduction 5457 tons 6430 tons
Number of Household Energy Use Equivalent Saved
2334 homes 2611 homes
Numbers rounded
Source: California Community College Chancellor’s Office
29
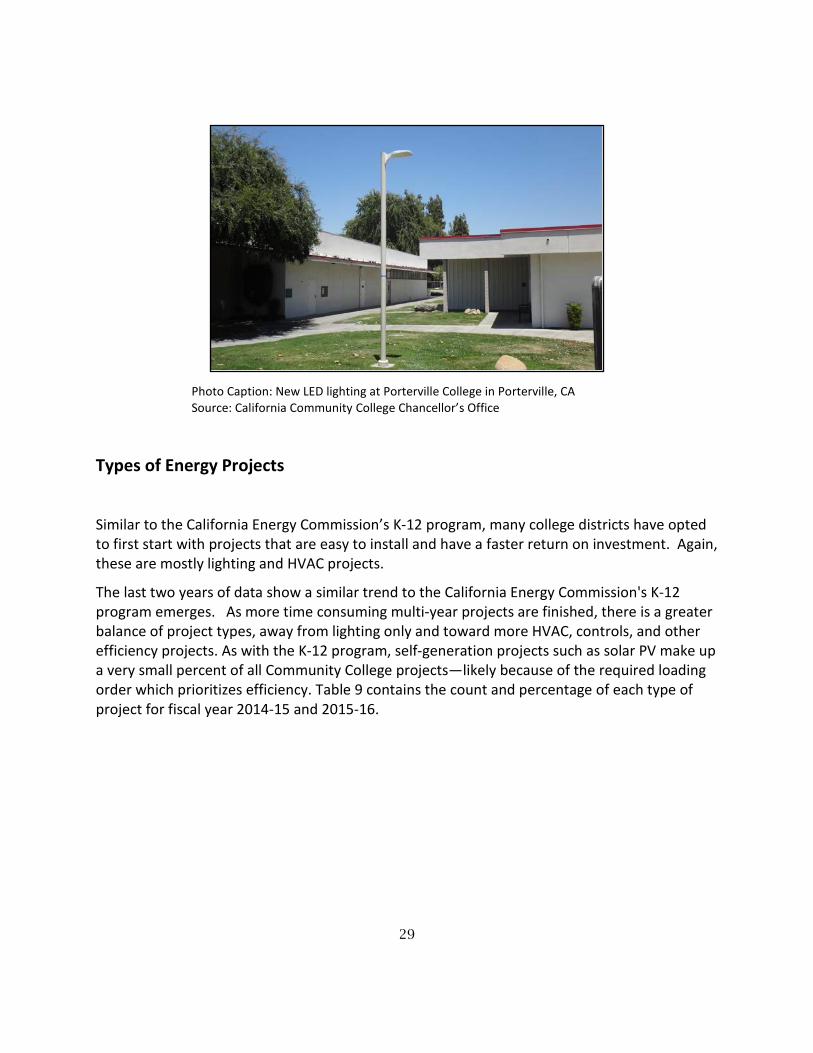
Photo Caption: New LED lighting at Porterville College in Porterville, CA Source: California Community College Chancellor’s Office
Types of Energy Projects
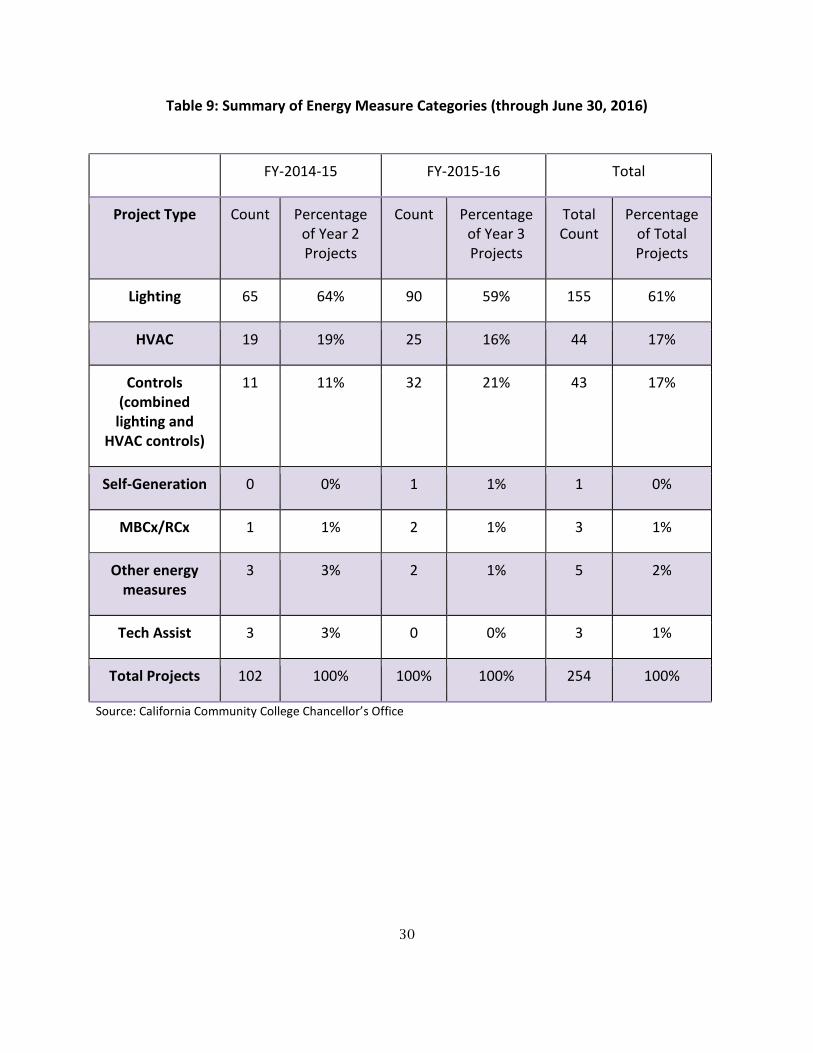
Similar to the California Energy Commission’s K-12 program, many college districts have opted to first start with projects that are easy to install and have a faster return on investment. Again, these are mostly lighting and HVAC projects.
The last two years of data show a similar trend to the California Energy Commission's K-12 program emerges. As more time consuming multi-year projects are finished, there is a greater balance of project types, away from lighting only and toward more HVAC, controls, and other efficiency projects. As with the K-12 program, self-generation projects such as solar PV make up a very small percent of all Community College projects—likely because of the required loading order which prioritizes efficiency. Table 9 contains the count and percentage of each type of project for fiscal year 2014-15 and 2015-16.
30
Table 9: Summary of Energy Measure Categories (through June 30, 2016)
FY-2014-15 FY-2015-16 Total
Project Type Count Percentage of Year 2 Projects
Count Percentage of Year 3 Projects
Total Count
Percentage of Total Projects
Lighting 65 64% 90 59% 155 61%
HVAC 19 19% 25 16% 44 17%
Controls (combined lighting and
HVAC controls)
11 11% 32 21% 43 17%
Self-Generation 0 0% 1 1% 1 0%
MBCx/RCx 1 1% 2 1% 3 1%
Other energy measures
3 3% 2 1% 5 2%
Tech Assist 3 3% 0 0% 3 1%
Total Projects 102 100% 100% 100% 254 100%
Source: California Community College Chancellor’s Office
31
CHAPTER 4: Loans and Technical Assistance Grants
In order to help LEAs better leverage Prop 39 funds, and to drive more private investment to energy efficiency and clean energy projects across the state, Senate Bill 73 included a section allowing program funding to be allocated to assistance grants. For the first 2 years of the program, funds were given to the State Energy Conservation Assistance Account-Education (ECAA-Ed) loan program and a part of ECAA-Ed, the Bright School Program, both implemented by the California Energy Commission for these purposes. Additional information for both of these programs is available in the Energy Commission’s report in Appendix A.
ECAA-Ed and Bright Schools Funding
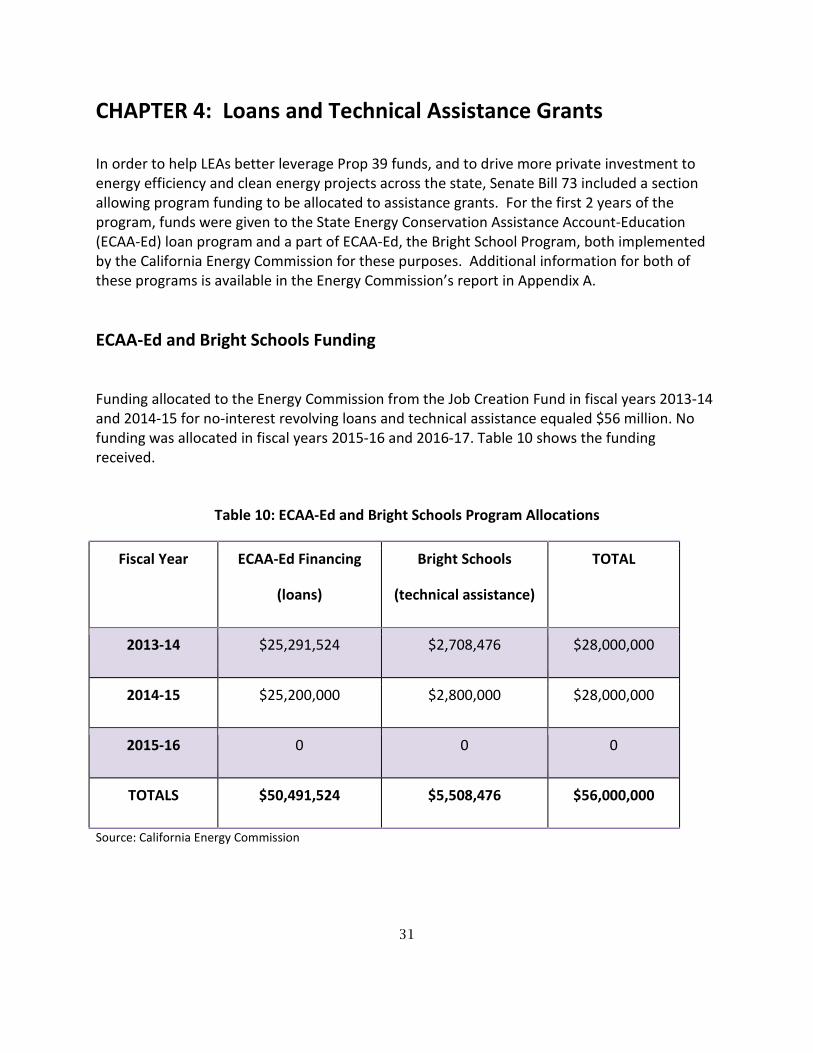
Funding allocated to the Energy Commission from the Job Creation Fund in fiscal years 2013-14 and 2014-15 for no-interest revolving loans and technical assistance equaled $56 million. No funding was allocated in fiscal years 2015-16 and 2016-17. Table 10 shows the funding received.
Table 10: ECAA-Ed and Bright Schools Program Allocations
Fiscal Year ECAA-Ed Financing
(loans)
Bright Schools
(technical assistance)
TOTAL
2013-14 $25,291,524 $2,708,476 $28,000,000
2014-15 $25,200,000 $2,800,000 $28,000,000
2015-16 0 0 0
TOTALS $50,491,524 $5,508,476 $56,000,000
Source: California Energy Commission
32
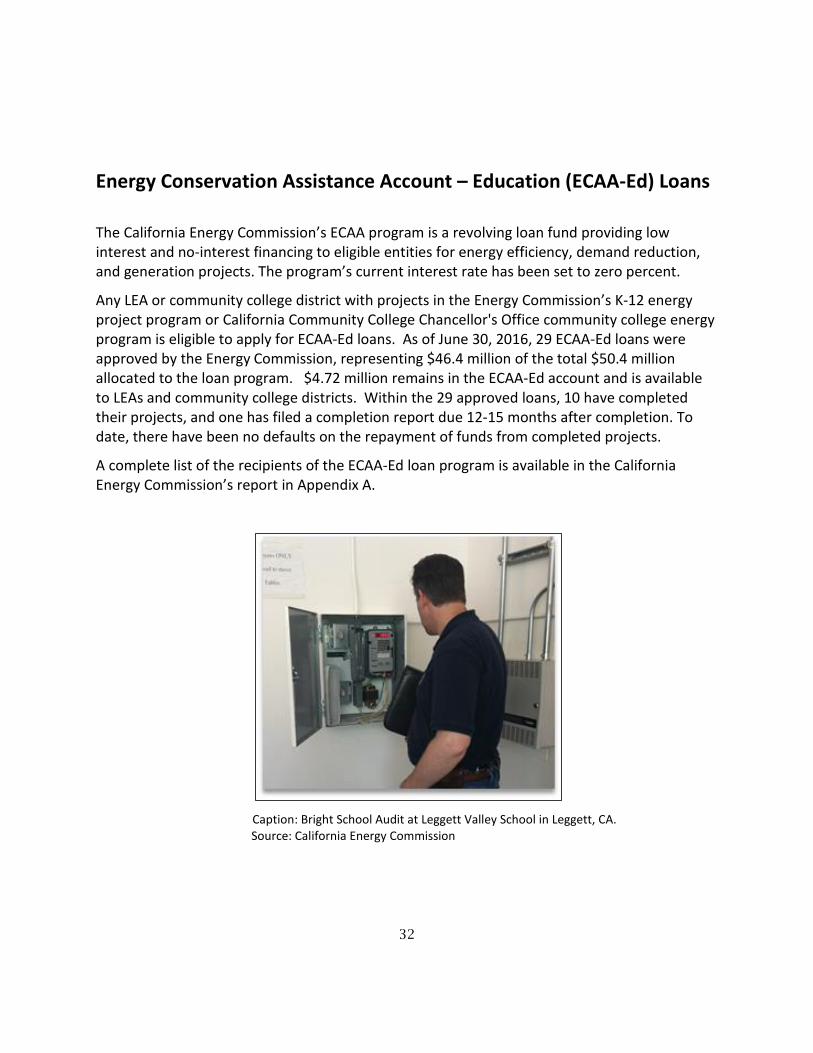
Energy Conservation Assistance Account – Education (ECAA-Ed) Loans
The California Energy Commission’s ECAA program is a revolving loan fund providing low interest and no-interest financing to eligible entities for energy efficiency, demand reduction, and generation projects. The program’s current interest rate has been set to zero percent.
Any LEA or community college district with projects in the Energy Commission’s K-12 energy project program or California Community College Chancellor's Office community college energy program is eligible to apply for ECAA-Ed loans. As of June 30, 2016, 29 ECAA-Ed loans were approved by the Energy Commission, representing $46.4 million of the total $50.4 million allocated to the loan program. $4.72 million remains in the ECAA-Ed account and is available to LEAs and community college districts. Within the 29 approved loans, 10 have completed their projects, and one has filed a completion report due 12-15 months after completion. To date, there have been no defaults on the repayment of funds from completed projects.
A complete list of the recipients of the ECAA-Ed loan program is available in the California Energy Commission’s report in Appendix A.
Caption: Bright School Audit at Leggett Valley School in Leggett, CA.
Source: California Energy Commission
33
Bright School Program
Ten percent of the funds allocated by the California Clean Energy Jobs Act to ECAA-Ed, in the first two years the program was funded, were dedicated to assist eligible entities with technical assistance in order to identify qualifying energy efficiency, demand reduction, and generation projects. The technical assistance program under ECAA-Ed is known as the Bright School Program; this program assists public and nonprofit K-12 schools in identifying energy saving projects in existing and planned facilities before applying for their Prop 39 energy project funds.
Technical assistance for energy audits can be particularly expensive, creating a barrier for smaller schools that need an energy audit to apply for Prop 39 energy project funds. The Bright School program allows smaller schools to pay for technical assistance up to $20,000 per LEA or community college district. This allows smaller schools, without the upfront cost, to identify energy-savings projects and plan renovations for use with Prop 39 energy project funds.
The Bright Schools Program has delivered energy audits to 260 sites across the state, with their energy measure recommendations representing an estimated annual savings of nearly 22,000 MWh of electricity and 261,439 therms of natural gas. This has resulted in more than a $3.6 million in utility costs savings for program participants.
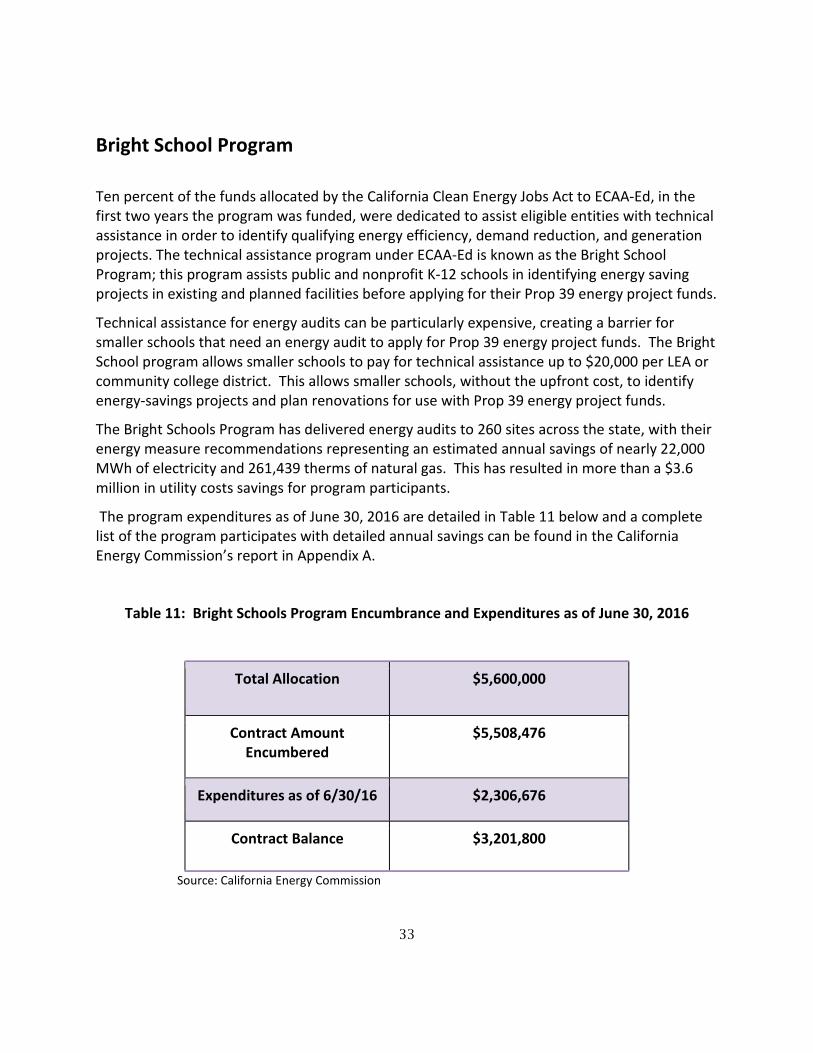
The program expenditures as of June 30, 2016 are detailed in Table 11 below and a complete list of the program participates with detailed annual savings can be found in the California Energy Commission’s report in Appendix A.
Table 11: Bright Schools Program Encumbrance and Expenditures as of June 30, 2016
Total Allocation $5,600,000
Contract Amount Encumbered
$5,508,476
Expenditures as of 6/30/16 $2,306,676
Contract Balance $3,201,800
Source: California Energy Commission
34
CHAPTER 5: Workforce Programs and Grants
As California strengthens its climate and clean energy goals, there will be increasing demand for trained and qualified energy workers to fill new positions. The California Clean Energy Jobs Act, for example, creates a new demand for clean energy workers by allowing K-12 schools and community colleges to hire project evaluation and construction teams where they might not otherwise have done so. Because of this, one of the CCEJAs main priorities is to allocate workforce development grants and programs in order to better prepare California’s future workforce meet the skills and demand from businesses supporting energy efficiency and clean energy sectors.
The CCEJA workforce training programs take a multi-faceted approach to helping prepare California’s workforce for clean energy jobs by focusing on basic skills for those interested in clean energy and efficiency careers. The three programs include the California Workforce Development Board Apprenticeship Grants, the California Community College Chancellor's Office Workforce Development Division Grants, and the California Conservation Corps Energy Corps Program.
These three workforce programs have different goals. The California Workforce Development Board Apprenticeship Grants offer paid pre-apprenticeship programs to at-risk youth, veterans, and disadvantaged job seekers, aimed at building the basic skills needs to join apprenticeship programs for the skilled trades. This training is specifically focused on building and maintaining a skilled, diverse workforce across California’s trades. The California Community College Chancellor's Office of Workforce Development Division Grants offers workforce development programs in energy, construction, and utilities for current community college students, often through regional partnerships that also include representatives from the building trades and construction industry. Finally, the largest program, the California Conservation Corps Energy Corp, trains young adults age 18 to 25 and recently returned veterans up to age 29 in the classroom and through onsite energy surveys and retrofits. The program is focused mainly on training youth for entry-level jobs in energy fields. A more detailed look at the workforce programs of the CCEJA is included in Appendix C and D.
California Workforce Development Board Apprenticeship Grants
The California Workforce Development Board Apprenticeship Grant Program has received $3 million per year for the last four fiscal years from the California Clean Energy Jobs Act to implement and support energy efficiency-focused pre-apprenticeship training pilot programs. Local apprenticeship communities, local Building Trades Councils, workforce development boards, community colleges, the California Conservation Corps, and other community-based organizations have all worked together to ensure these grants create opportunities for

35
disadvantaged California jobs seekers to earn industry-valued credentials and enter into pre-apprenticeship with a goal of a state-certified apprenticeship or direct employment in the energy efficiency and construction sectors.
Caption: Nichelle H., Apprentice with Laborers Local 261.
Source: California Workforce Development Board
Grants Awarded
The California Workforce Development Board uses CCEJA funds to provide grants in three program areas: technical assistance & capacity building, development, and training implementation. The first round of grants was awarded in February of 2014 and is continuing to fund six training implementation projects around the state. In 2016, the CWDB apprenticeship grant program launched its Prop 39 2.0 grants to add nine new grantees to build upon the first round of grants.
The first round of grants for technical assistance and capacity training, which were sent out in February 2014, were made to the California Labor Federation- WED Program and the Emerald Cities Collaborative, while the second round of grants in September of 2016 were made to the East Bay Alliance for Sustainable Economy (Ebase) and the California Labor Federation-WED Program.13F
14
The second type of grants, grants for development, were provided in February 2014 to the Workforce Investment Board of Santa Cruz County and the Marin County Building Trades, while the second round of grants in September of 2016 went to Orange County Development Board and the North Central Counties Consortium (NCCC).14F
15
Finally, the first set of training implementation grants were provided in February 2014 to six entities including the Fresno Regional Workforce Investment Board, Los Angeles Trade Technical College, Richmond Workforce Investment Board, Sacramento Employment and
14 Proposition 39 Pre-Apprenticeship Support, Training and Placement Grants, https://cwdb.ca.gov/files/2016/08/Prop39_2.0_1-10-17-Web_AnnouncementV2.pdf 15 Ibid.1
36
Training Agency, San Francisco Conservation Corps, and work2future (Silicon Valley Workforce Investment Network).15F
16 Each of these entities was also awarded an additional round of funding in early 2017 to extend their programs.16F
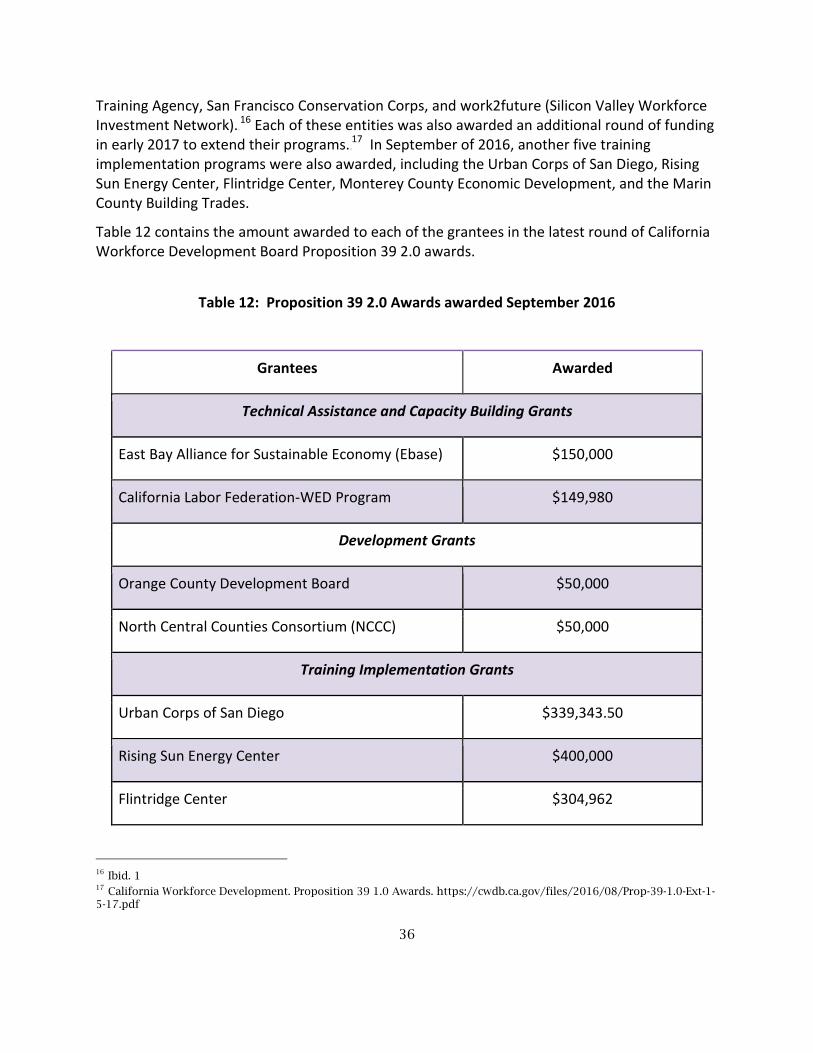
17 In September of 2016, another five training implementation programs were also awarded, including the Urban Corps of San Diego, Rising Sun Energy Center, Flintridge Center, Monterey County Economic Development, and the Marin County Building Trades.
Table 12 contains the amount awarded to each of the grantees in the latest round of California Workforce Development Board Proposition 39 2.0 awards.
Table 12: Proposition 39 2.0 Awards awarded September 2016
Grantees Awarded
Technical Assistance and Capacity Building Grants
East Bay Alliance for Sustainable Economy (Ebase) $150,000
California Labor Federation-WED Program $149,980
Development Grants
Orange County Development Board $50,000
North Central Counties Consortium (NCCC) $50,000
Training Implementation Grants
Urban Corps of San Diego $339,343.50
Rising Sun Energy Center $400,000
Flintridge Center $304,962
16 Ibid. 1 17 California Workforce Development. Proposition 39 1.0 Awards. https://cwdb.ca.gov/files/2016/08/Prop-39-1.0-Ext-1-5-17.pdf
37
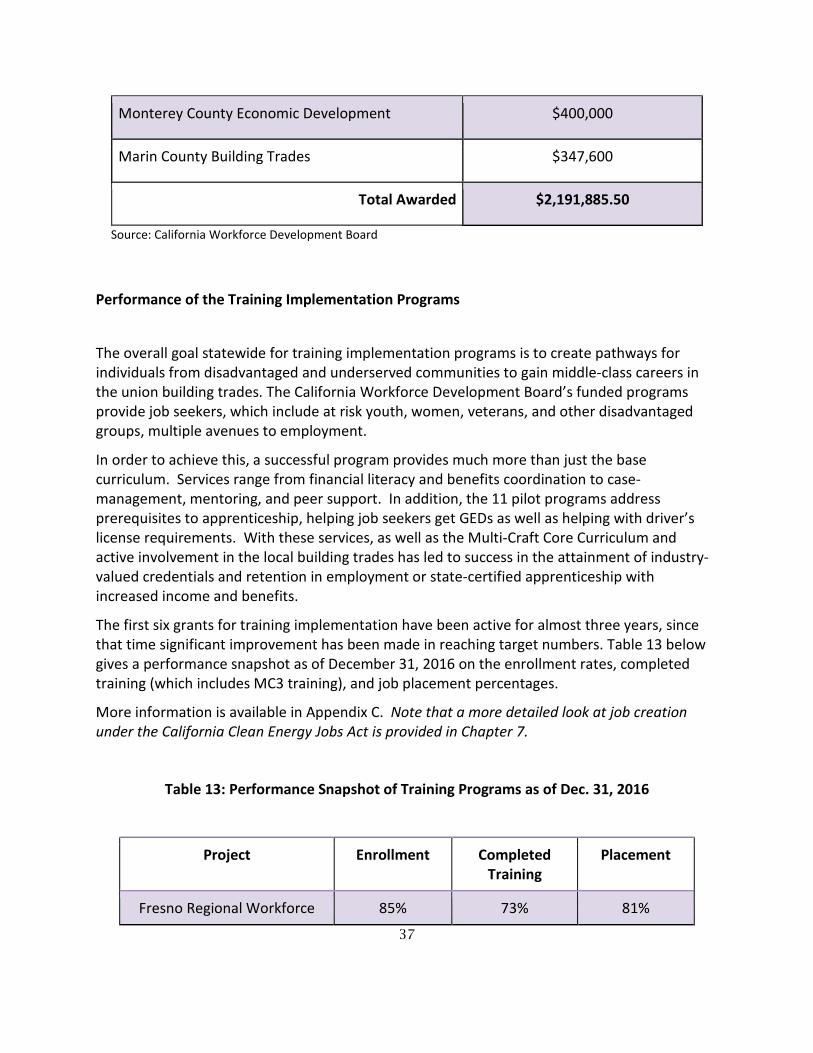
Monterey County Economic Development $400,000
Marin County Building Trades $347,600
Total Awarded $2,191,885.50
Source: California Workforce Development Board
Performance of the Training Implementation Programs
The overall goal statewide for training implementation programs is to create pathways for individuals from disadvantaged and underserved communities to gain middle-class careers in the union building trades. The California Workforce Development Board’s funded programs provide job seekers, which include at risk youth, women, veterans, and other disadvantaged groups, multiple avenues to employment.
In order to achieve this, a successful program provides much more than just the base curriculum. Services range from financial literacy and benefits coordination to case-management, mentoring, and peer support. In addition, the 11 pilot programs address prerequisites to apprenticeship, helping job seekers get GEDs as well as helping with driver’s license requirements. With these services, as well as the Multi-Craft Core Curriculum and active involvement in the local building trades has led to success in the attainment of industry-valued credentials and retention in employment or state-certified apprenticeship with increased income and benefits.
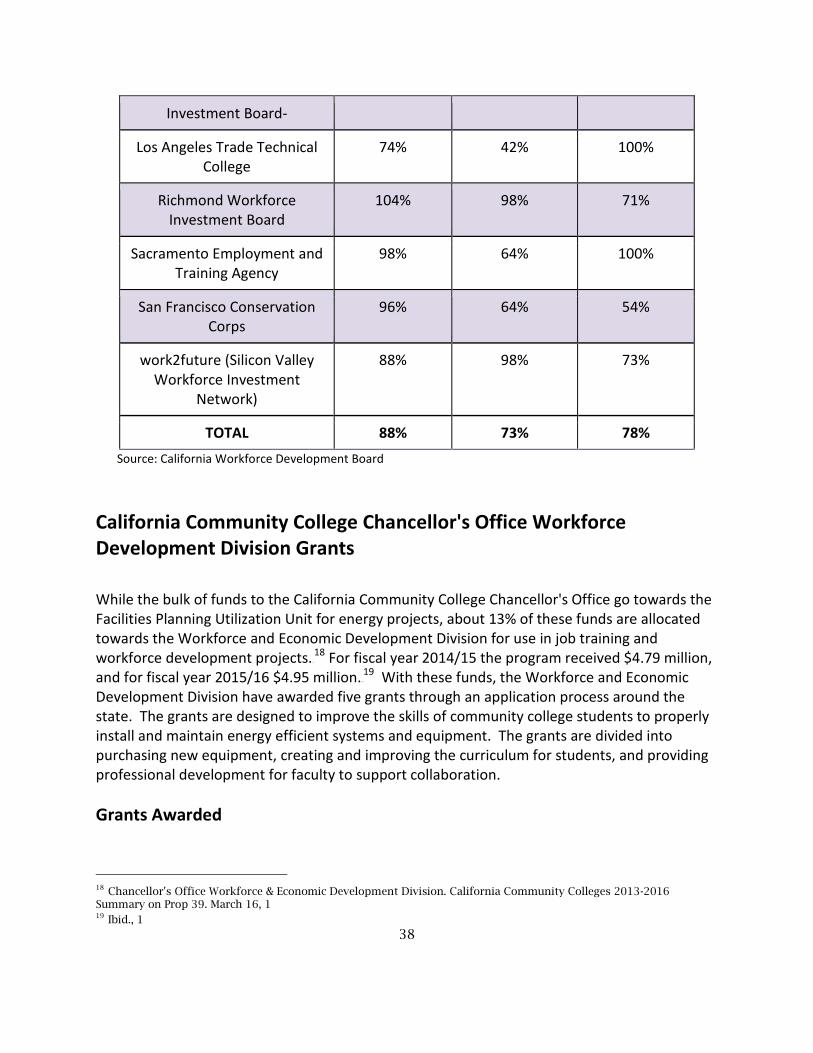
The first six grants for training implementation have been active for almost three years, since that time significant improvement has been made in reaching target numbers. Table 13 below gives a performance snapshot as of December 31, 2016 on the enrollment rates, completed training (which includes MC3 training), and job placement percentages.
More information is available in Appendix C. Note that a more detailed look at job creation under the California Clean Energy Jobs Act is provided in Chapter 7.
Table 13: Performance Snapshot of Training Programs as of Dec. 31, 2016
Project Enrollment Completed Training
Placement
Fresno Regional Workforce 85% 73% 81%
38
Investment Board-
Los Angeles Trade Technical College
74% 42% 100%
Richmond Workforce Investment Board
104% 98% 71%
Sacramento Employment and Training Agency
98% 64% 100%
San Francisco Conservation Corps
96% 64% 54%
work2future (Silicon Valley Workforce Investment
Network)
88% 98% 73%
TOTAL 88% 73% 78% Source: California Workforce Development Board
California Community College Chancellor's Office Workforce Development Division Grants
While the bulk of funds to the California Community College Chancellor's Office go towards the Facilities Planning Utilization Unit for energy projects, about 13% of these funds are allocated towards the Workforce and Economic Development Division for use in job training and workforce development projects.17F
18 For fiscal year 2014/15 the program received $4.79 million, and for fiscal year 2015/16 $4.95 million.18F
19 With these funds, the Workforce and Economic Development Division have awarded five grants through an application process around the state. The grants are designed to improve the skills of community college students to properly install and maintain energy efficient systems and equipment. The grants are divided into purchasing new equipment, creating and improving the curriculum for students, and providing professional development for faculty to support collaboration.
Grants Awarded
18 Chancellor's Office Workforce & Economic Development Division. California Community Colleges 2013-2016 Summary on Prop 39. March 16, 1 19 Ibid., 1
39
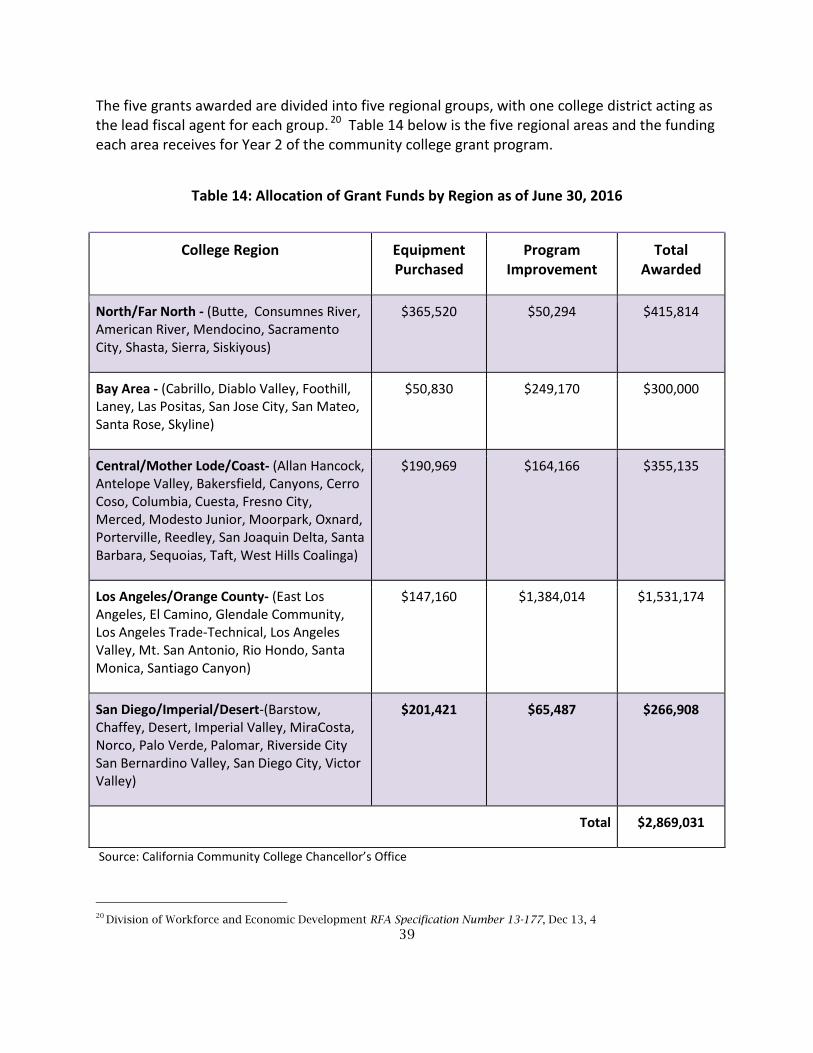
The five grants awarded are divided into five regional groups, with one college district acting as the lead fiscal agent for each group.19F
20 Table 14 below is the five regional areas and the funding each area receives for Year 2 of the community college grant program.
Table 14: Allocation of Grant Funds by Region as of June 30, 2016
College Region Equipment Purchased
Program Improvement
Total Awarded
North/Far North - (Butte, Consumnes River, American River, Mendocino, Sacramento City, Shasta, Sierra, Siskiyous)
$365,520 $50,294 $415,814
Bay Area - (Cabrillo, Diablo Valley, Foothill, Laney, Las Positas, San Jose City, San Mateo, Santa Rose, Skyline)
$50,830 $249,170 $300,000
Central/Mother Lode/Coast- (Allan Hancock, Antelope Valley, Bakersfield, Canyons, Cerro Coso, Columbia, Cuesta, Fresno City, Merced, Modesto Junior, Moorpark, Oxnard, Porterville, Reedley, San Joaquin Delta, Santa Barbara, Sequoias, Taft, West Hills Coalinga)
$190,969 $164,166 $355,135
Los Angeles/Orange County- (East Los Angeles, El Camino, Glendale Community, Los Angeles Trade-Technical, Los Angeles Valley, Mt. San Antonio, Rio Hondo, Santa Monica, Santiago Canyon)
$147,160 $1,384,014 $1,531,174
San Diego/Imperial/Desert-(Barstow, Chaffey, Desert, Imperial Valley, MiraCosta, Norco, Palo Verde, Palomar, Riverside City San Bernardino Valley, San Diego City, Victor Valley)
$201,421 $65,487 $266,908
Total $2,869,031
Source: California Community College Chancellor’s Office
20 Division of Workforce and Economic Development RFA Specification Number 13-177, Dec 13, 4
40
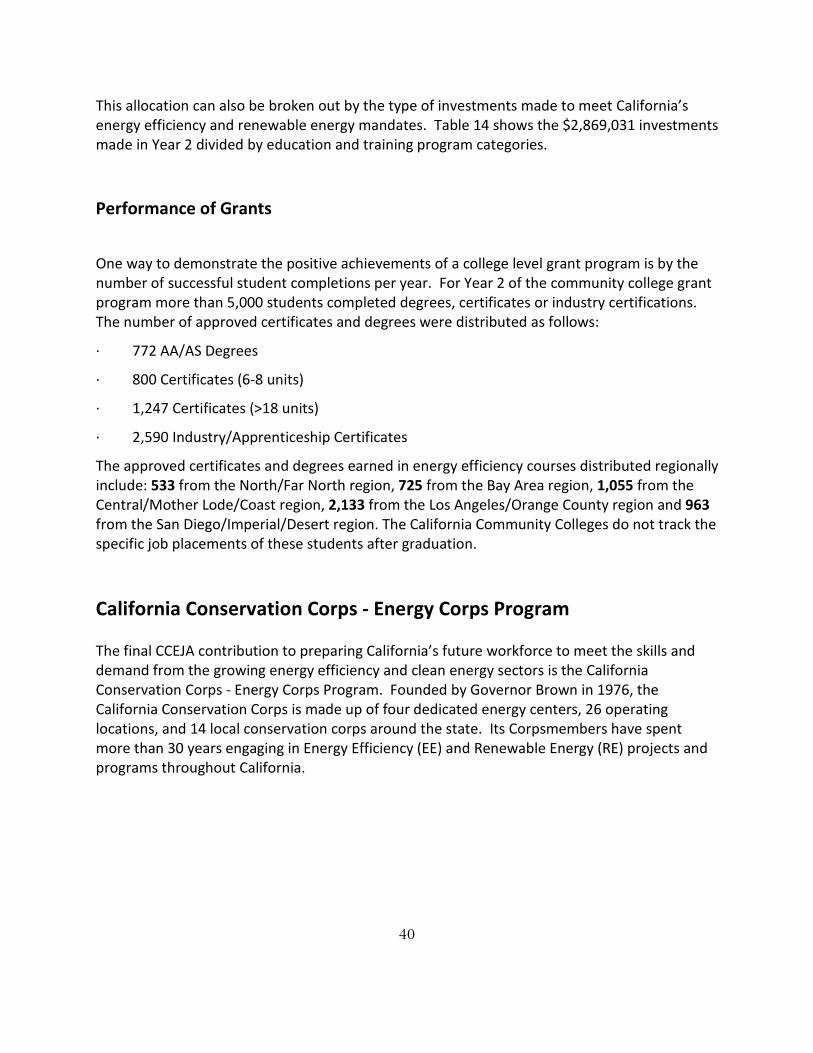
This allocation can also be broken out by the type of investments made to meet California’s energy efficiency and renewable energy mandates. Table 14 shows the $2,869,031 investments made in Year 2 divided by education and training program categories.
Performance of Grants
One way to demonstrate the positive achievements of a college level grant program is by the number of successful student completions per year. For Year 2 of the community college grant program more than 5,000 students completed degrees, certificates or industry certifications. The number of approved certificates and degrees were distributed as follows:
· 772 AA/AS Degrees
· 800 Certificates (6-8 units)
· 1,247 Certificates (>18 units)
· 2,590 Industry/Apprenticeship Certificates
The approved certificates and degrees earned in energy efficiency courses distributed regionally include: 533 from the North/Far North region, 725 from the Bay Area region, 1,055 from the Central/Mother Lode/Coast region, 2,133 from the Los Angeles/Orange County region and 963 from the San Diego/Imperial/Desert region. The California Community Colleges do not track the specific job placements of these students after graduation.
California Conservation Corps - Energy Corps Program The final CCEJA contribution to preparing California’s future workforce to meet the skills and demand from the growing energy efficiency and clean energy sectors is the California Conservation Corps - Energy Corps Program. Founded by Governor Brown in 1976, the California Conservation Corps is made up of four dedicated energy centers, 26 operating locations, and 14 local conservation corps around the state. Its Corpsmembers have spent more than 30 years engaging in Energy Efficiency (EE) and Renewable Energy (RE) projects and programs throughout California.
41
Photo Caption: California Conservation Corp classroom.
Source: California Conservation Corps Funding Allocation Over a period of four fiscal years, the CCC has been allocated a total of $ 21.073 million to provide energy industry services on behalf of K-12 LEAs throughout California. Table 15 shows the fiscal allocations to the Energy Corps program from the Job Creation Fund.
Table 15: Allocation of Funds by Fiscal Year
Fiscal Year Allocation Funds Encumbered
2013-14 $5,007,000 4,050,000
2014-15 $5,000,000 4,374,000
2015-16 $5,406,000 5,319,000
2016-17 $5,660,000
Total $21,073,000 Source: California Conservation Corps
Energy Corps Industry Training Corpsmembers (young adults age 18 to 25 and recently returned veterans up to age 29) and Staff are trained by industry experts, CCC Staff, and Energy Corps partners to operate and understand clean energy efficiency and renewable energy projects. Training consists of both traditional classroom based learning environments and extensive on-the-job work experience
42
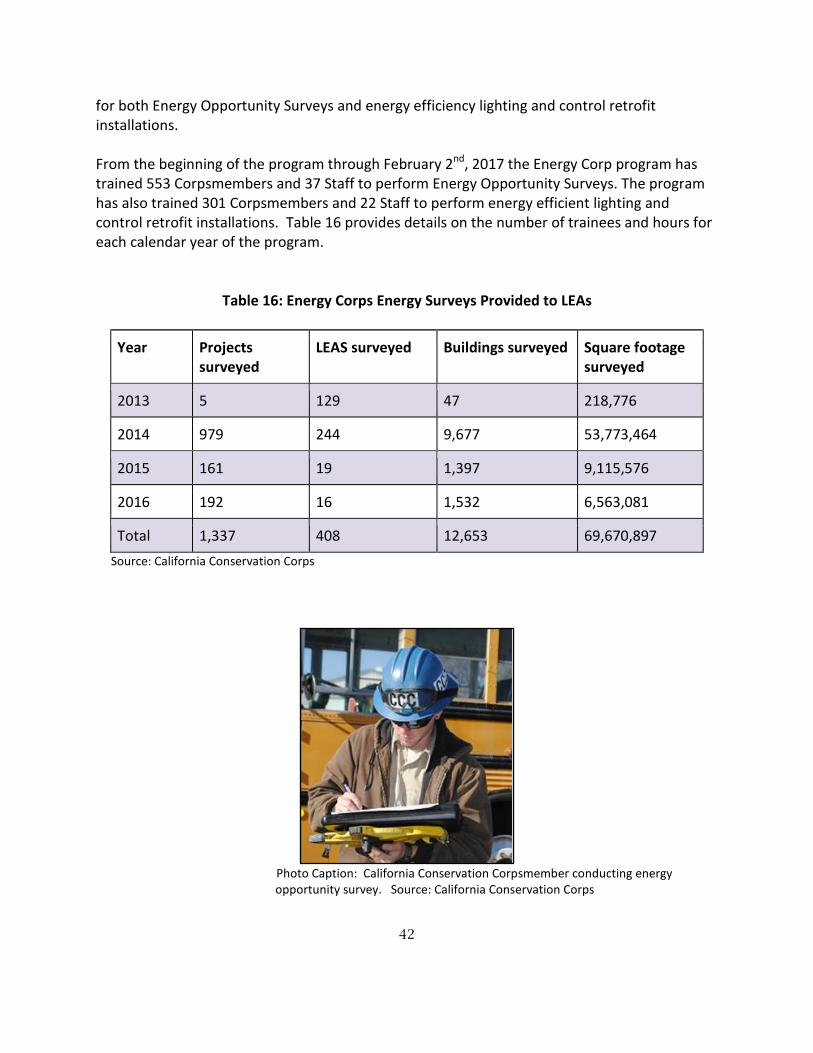
for both Energy Opportunity Surveys and energy efficiency lighting and control retrofit installations. From the beginning of the program through February 2nd, 2017 the Energy Corp program has trained 553 Corpsmembers and 37 Staff to perform Energy Opportunity Surveys. The program has also trained 301 Corpsmembers and 22 Staff to perform energy efficient lighting and control retrofit installations. Table 16 provides details on the number of trainees and hours for each calendar year of the program.
Table 16: Energy Corps Energy Surveys Provided to LEAs
Year Projects surveyed
LEAS surveyed Buildings surveyed Square footage surveyed
2013 5 129 47 218,776
2014 979 244 9,677 53,773,464
2015 161 19 1,397 9,115,576
2016 192 16 1,532 6,563,081
Total 1,337 408 12,653 69,670,897 Source: California Conservation Corps
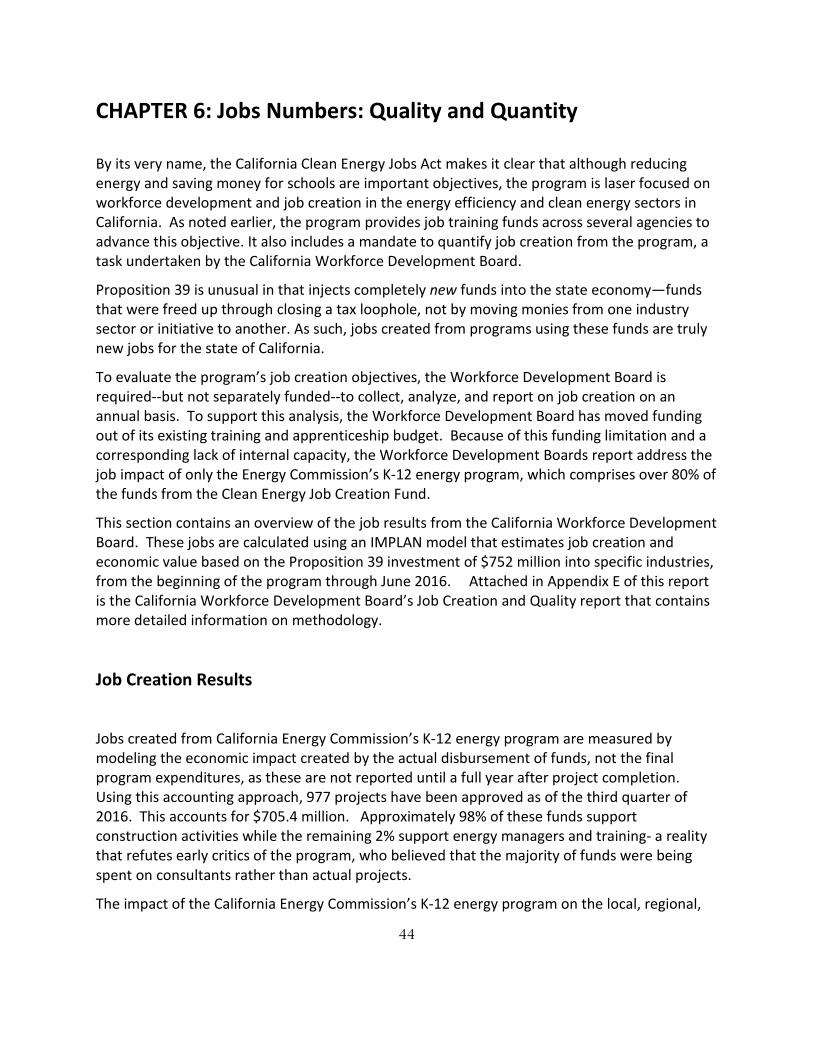
Photo Caption: California Conservation Corpsmember conducting energy
opportunity survey. Source: California Conservation Corps
43
Retrofit Services Some Corpsmembers go beyond energy surveys to provide actual retrofit services on specific projects. In mid-2015 the Energy Corps began providing CCEJA-funded energy efficient lighting retrofit installation for local education agencies throughout the state. Energy Industry Employment While the CCC does not keep detailed statistics on job placement, to date there have been 49 Energy Corps Corpsmembers that have self-reported having been hired directly into positions in energy industry companies before the end of their planned tenure with the California Conservation Corps. Another 52 Energy Corps Corpsmembers have been hired away from other companies. The performance of Corpsmembers working with energy companies on energy efficient projects has been positively received, resulting in Energy Corpsmembers being awarded scholarships from energy industry companies that have worked directly with the Corpsmembers.
44
CHAPTER 6: Jobs Numbers: Quality and Quantity
By its very name, the California Clean Energy Jobs Act makes it clear that although reducing energy and saving money for schools are important objectives, the program is laser focused on workforce development and job creation in the energy efficiency and clean energy sectors in California. As noted earlier, the program provides job training funds across several agencies to advance this objective. It also includes a mandate to quantify job creation from the program, a task undertaken by the California Workforce Development Board.
Proposition 39 is unusual in that injects completely new funds into the state economy—funds that were freed up through closing a tax loophole, not by moving monies from one industry sector or initiative to another. As such, jobs created from programs using these funds are truly new jobs for the state of California.
To evaluate the program’s job creation objectives, the Workforce Development Board is required--but not separately funded--to collect, analyze, and report on job creation on an annual basis. To support this analysis, the Workforce Development Board has moved funding out of its existing training and apprenticeship budget. Because of this funding limitation and a corresponding lack of internal capacity, the Workforce Development Boards report address the job impact of only the Energy Commission’s K-12 energy program, which comprises over 80% of the funds from the Clean Energy Job Creation Fund.
This section contains an overview of the job results from the California Workforce Development Board. These jobs are calculated using an IMPLAN model that estimates job creation and economic value based on the Proposition 39 investment of $752 million into specific industries, from the beginning of the program through June 2016. Attached in Appendix E of this report is the California Workforce Development Board’s Job Creation and Quality report that contains more detailed information on methodology.
Job Creation Results
Jobs created from California Energy Commission’s K-12 energy program are measured by modeling the economic impact created by the actual disbursement of funds, not the final program expenditures, as these are not reported until a full year after project completion. Using this accounting approach, 977 projects have been approved as of the third quarter of 2016. This accounts for $705.4 million. Approximately 98% of these funds support construction activities while the remaining 2% support energy managers and training- a reality that refutes early critics of the program, who believed that the majority of funds were being spent on consultants rather than actual projects.
The impact of the California Energy Commission’s K-12 energy program on the local, regional,
45
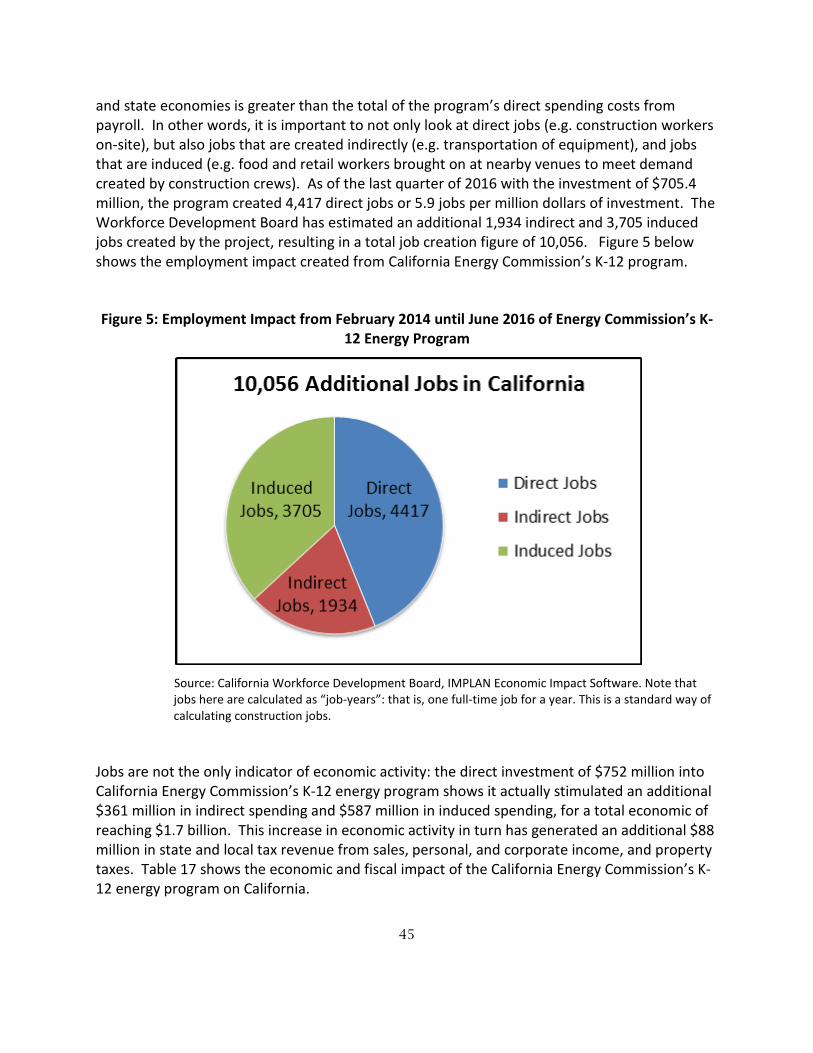
and state economies is greater than the total of the program’s direct spending costs from payroll. In other words, it is important to not only look at direct jobs (e.g. construction workers on-site), but also jobs that are created indirectly (e.g. transportation of equipment), and jobs that are induced (e.g. food and retail workers brought on at nearby venues to meet demand created by construction crews). As of the last quarter of 2016 with the investment of $705.4 million, the program created 4,417 direct jobs or 5.9 jobs per million dollars of investment. The Workforce Development Board has estimated an additional 1,934 indirect and 3,705 induced jobs created by the project, resulting in a total job creation figure of 10,056. Figure 5 below shows the employment impact created from California Energy Commission’s K-12 program.
Figure 5: Employment Impact from February 2014 until June 2016 of Energy Commission’s K-12 Energy Program
Source: California Workforce Development Board, IMPLAN Economic Impact Software. Note that
jobs here are calculated as “job-years”: that is, one full-time job for a year. This is a standard way of calculating construction jobs.
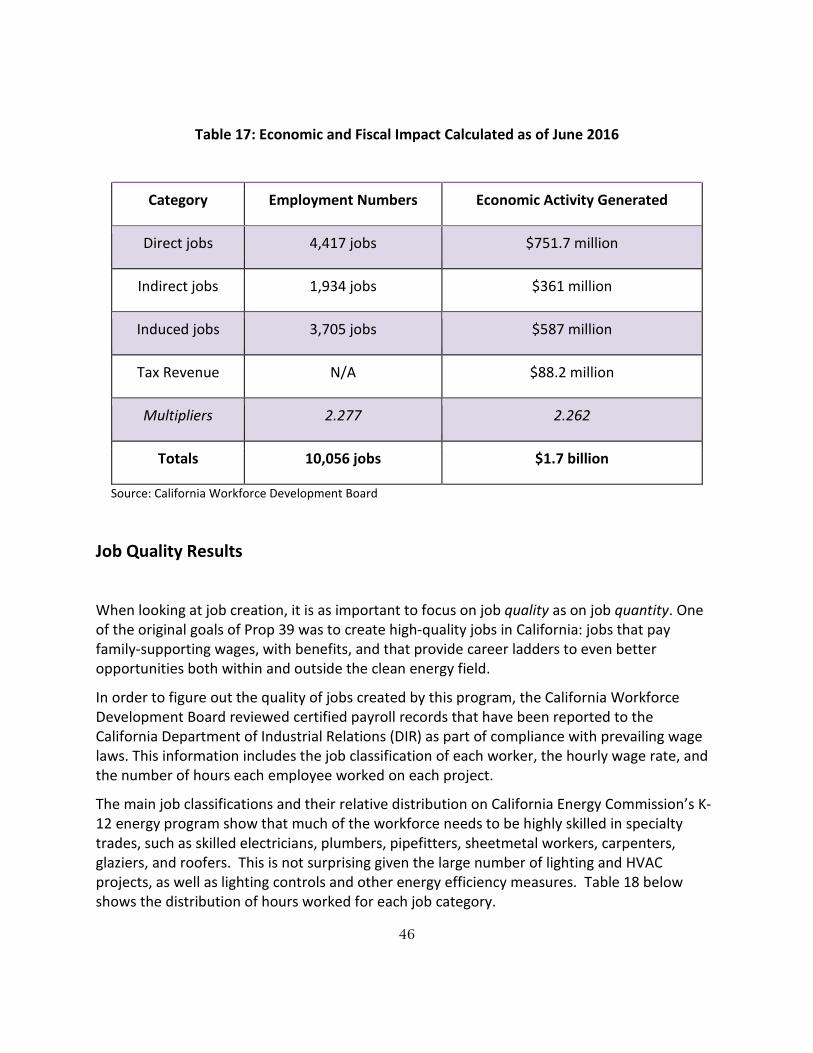
Jobs are not the only indicator of economic activity: the direct investment of $752 million into California Energy Commission’s K-12 energy program shows it actually stimulated an additional $361 million in indirect spending and $587 million in induced spending, for a total economic of reaching $1.7 billion. This increase in economic activity in turn has generated an additional $88 million in state and local tax revenue from sales, personal, and corporate income, and property taxes. Table 17 shows the economic and fiscal impact of the California Energy Commission’s K-12 energy program on California.
46
Table 17: Economic and Fiscal Impact Calculated as of June 2016
Category Employment Numbers Economic Activity Generated
Direct jobs 4,417 jobs $751.7 million
Indirect jobs 1,934 jobs $361 million
Induced jobs 3,705 jobs $587 million
Tax Revenue N/A $88.2 million
Multipliers 2.277 2.262
Totals 10,056 jobs $1.7 billion
Source: California Workforce Development Board
Job Quality Results
When looking at job creation, it is as important to focus on job quality as on job quantity. One of the original goals of Prop 39 was to create high-quality jobs in California: jobs that pay family-supporting wages, with benefits, and that provide career ladders to even better opportunities both within and outside the clean energy field.
In order to figure out the quality of jobs created by this program, the California Workforce Development Board reviewed certified payroll records that have been reported to the California Department of Industrial Relations (DIR) as part of compliance with prevailing wage laws. This information includes the job classification of each worker, the hourly wage rate, and the number of hours each employee worked on each project.
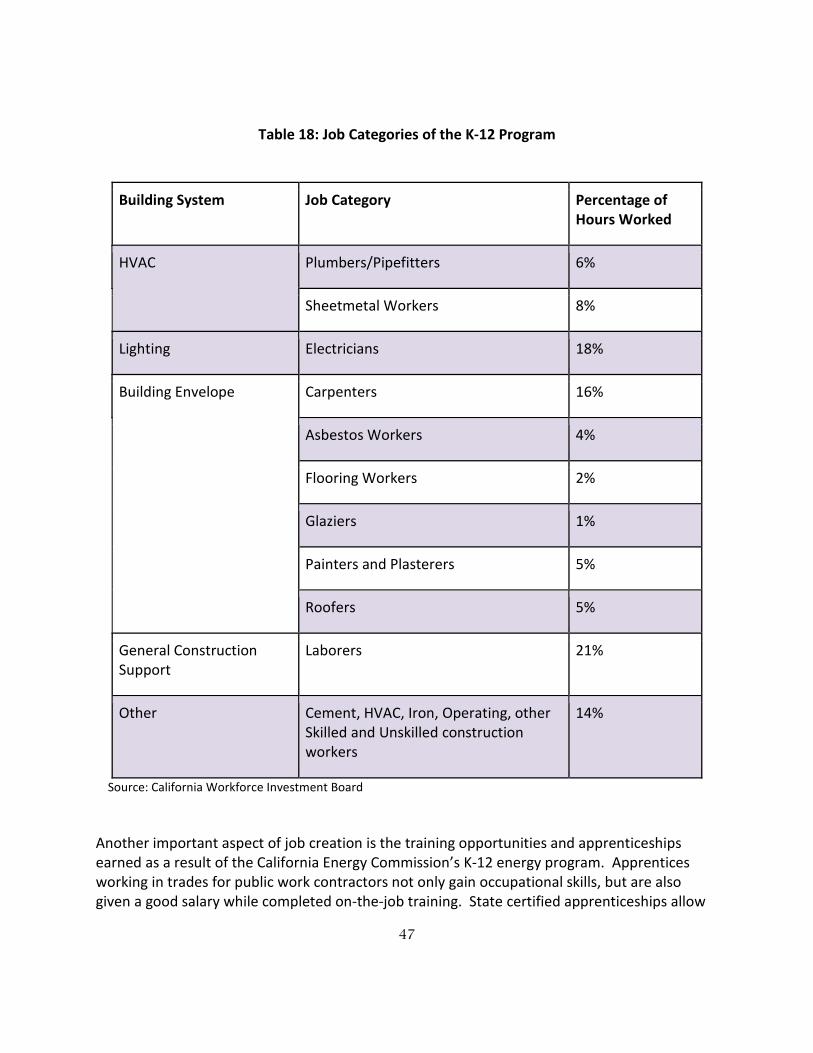
The main job classifications and their relative distribution on California Energy Commission’s K-12 energy program show that much of the workforce needs to be highly skilled in specialty trades, such as skilled electricians, plumbers, pipefitters, sheetmetal workers, carpenters, glaziers, and roofers. This is not surprising given the large number of lighting and HVAC projects, as well as lighting controls and other energy efficiency measures. Table 18 below shows the distribution of hours worked for each job category.
47
Table 18: Job Categories of the K-12 Program
Building System Job Category Percentage of Hours Worked
HVAC Plumbers/Pipefitters 6%
Sheetmetal Workers 8%
Lighting Electricians 18%
Building Envelope Carpenters 16%
Asbestos Workers 4%
Flooring Workers 2%
Glaziers 1%
Painters and Plasterers 5%
Roofers 5%
General Construction Support
Laborers 21%
Other Cement, HVAC, Iron, Operating, other Skilled and Unskilled construction workers
14%
Source: California Workforce Investment Board
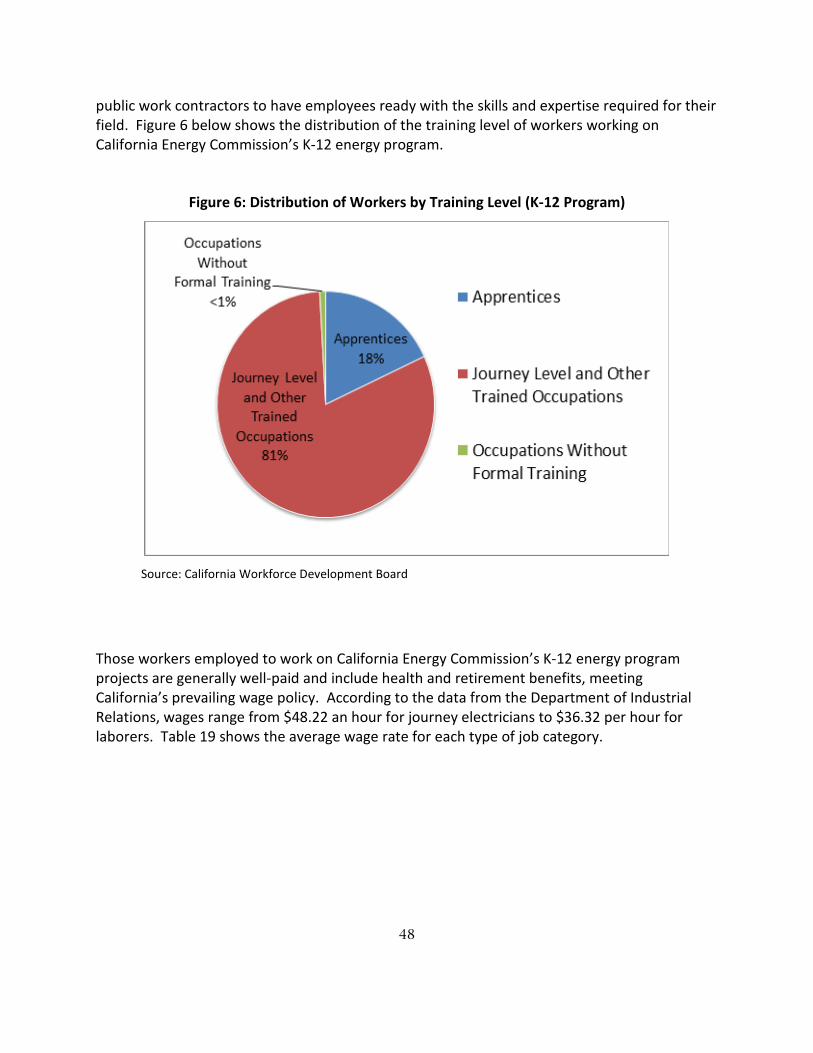
Another important aspect of job creation is the training opportunities and apprenticeships earned as a result of the California Energy Commission’s K-12 energy program. Apprentices working in trades for public work contractors not only gain occupational skills, but are also given a good salary while completed on-the-job training. State certified apprenticeships allow
48
public work contractors to have employees ready with the skills and expertise required for their field. Figure 6 below shows the distribution of the training level of workers working on California Energy Commission’s K-12 energy program.
Figure 6: Distribution of Workers by Training Level (K-12 Program)
Source: California Workforce Development Board
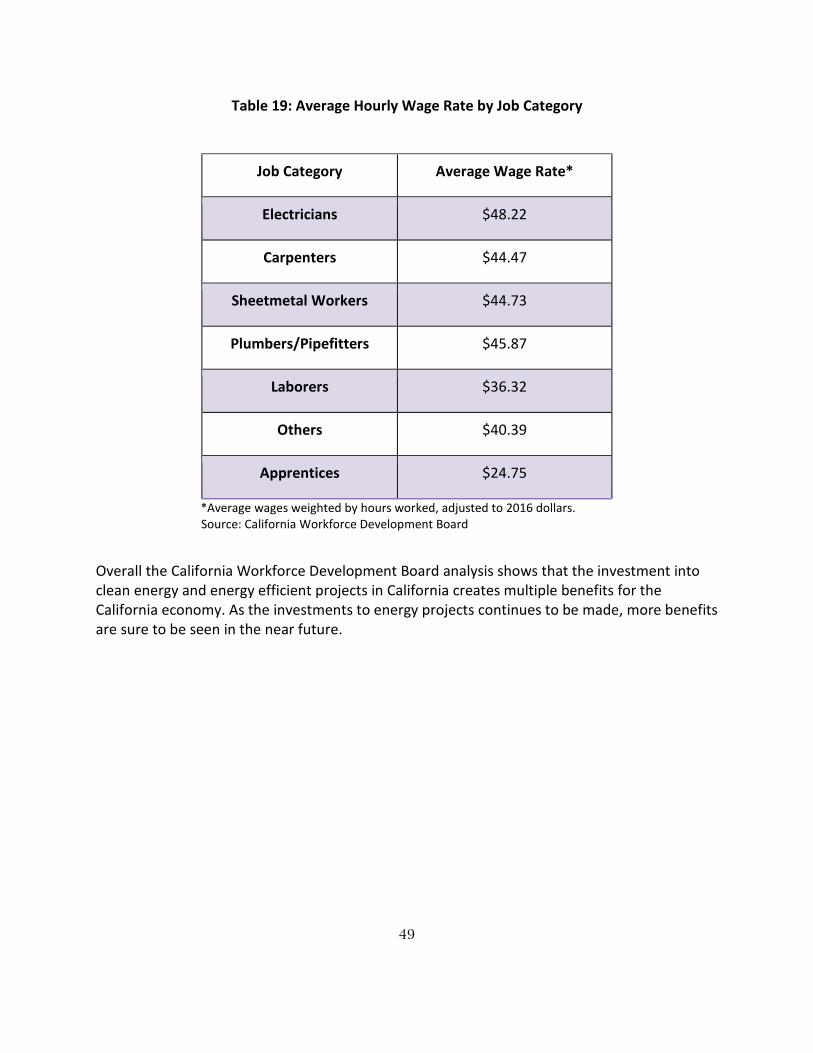
Those workers employed to work on California Energy Commission’s K-12 energy program projects are generally well-paid and include health and retirement benefits, meeting California’s prevailing wage policy. According to the data from the Department of Industrial Relations, wages range from $48.22 an hour for journey electricians to $36.32 per hour for laborers. Table 19 shows the average wage rate for each type of job category.
49
Table 19: Average Hourly Wage Rate by Job Category
Job Category Average Wage Rate*
Electricians $48.22
Carpenters $44.47
Sheetmetal Workers $44.73
Plumbers/Pipefitters $45.87
Laborers $36.32
Others $40.39
Apprentices $24.75
*Average wages weighted by hours worked, adjusted to 2016 dollars. Source: California Workforce Development Board
Overall the California Workforce Development Board analysis shows that the investment into clean energy and energy efficient projects in California creates multiple benefits for the California economy. As the investments to energy projects continues to be made, more benefits are sure to be seen in the near future.
50
CHAPTER 7: Citizen Oversight Board Findings and Recommendations
As should be clear from the section’s above, Proposition 39’s administration involves multiple agencies and institutions across the states. The Citizen Oversight Board is the only body involved in the program that has the opportunity to work across agencies, whether through our preparation for this report, our public meetings, or our audit process.
As such, we are in a good position to offer high-level findings and recommendations for the Proposition 39 program. We hope these recommendations are useful to both legislators and agency staff.
Findings
In general, we are pleased with the progress that has been made this past year under the California Clean Energy Jobs Act– the implementing legislation of Proposition 39. Last year we had relatively few completed projects to review, given the delay between the November 2012 vote on Proposition 39 and the actual legislation and regulations required to put that program into effect. This year, we were able to review significantly more completed projects, and are impressed with their geographic diversity, energy savings, and job creation. In particular, we are very happy to see that the participation rates are similar between disadvantaged and non-disadvantaged LEAs, possibly reflecting the fact that CEC staff took seriously our recommendation from last year on better outreach to smaller, less well-resourced schools.
We are also extremely impressed with the job training aspects of this program across the CCC, community colleges, and Workforce Development Board—especially the latter, which has demonstrated real progress in placing youth, veterans, and formerly incarcerated Californians into pre-apprenticeship programs that put them into a position to gain high-quality, career-track jobs in the building trades.
We believe this program is creating real value for the state of California, and is contributing to the state’s larger education, energy, climate, and economic development goals. As we note below, we strongly believe the program should be extended for an additional five years to allow for continued progress toward these goals in the coming years.
51
Recommendations:
1) Extend the CCEJA program another five years, and fix the encumbrance dates to allow
for maximum participation. We believe the California Clean Energy Jobs Act has demonstrated real success and that that the legislature should consider extending and funding it past the initial 5-year period. Under such an extension, the legislature would also need to extend the “encumbrance period” for an additional year beyond the new 5-year term. This would address an issue that is a problem under the current program as well. As the CEC notes in its attached report: “The June 30, 2018, encumbrance date in statute limits the use of funding in the final 2017-18 fiscal year. A local educational agency must submit an EEP to the Energy Commission no later than August 1, 2017, to complete the steps necessary for encumbering funds by the end of the 2017-18 fiscal year.” Because of this deadline, LEAs have to submit their EEPs before they have any information from the state Department of Education about exactly how much money they are entitled to apply for. As the CEC notes, “This deadline effectively shortens the program by eleven months, cutting projected benefits such as job creation, energy and cost savings, and non-energy health benefits. The program is more than halfway through the funding period, yet fewer than half of eligible 2,136 LEAs have requested energy project funding. If this trend continues, funds will remain unencumbered as of June 30, 2018.” Our recommendation, then, is to extend the entire program by 5 years, plus an additional year for encumbrance, or—in the event of non-extension—to at least tack on an additional encumbrance period to the current program.
2) Revisit Savings to Investment Ratio (SIR) for schools meeting specific conditions. One issue we’ve heard about the current program is that the savings-to-investment ratio (SIR) is hard to meet for schools that are located in areas with publicly-owned utilities, which often have very low energy rates. It can also be hard to meet for those schools that are not up to code and lack existing funds for basic maintenance. We would like to encourage the legislature and CEC to explore the idea of giving more flexibility in the Clean Energy Jobs Act definition of “cost-effectiveness” in these areas, so that schools with truly pressing non-energy issues (e.g. asbestos) would be able to include fixing these issues as non-energy benefits in the savings-to-investment (SIR) calculation.
3) Re-invest in loan and technical assistance programs. We have been very encouraged by the performance of the loan and technical assistance programs, ECAA-Ed and Bright Schools—programs that were not funded after the second year of the program. ECAA-Ed allows for more funding to be targeted at a broader range of schools, and also—
52
importantly for a state interested in fiscal discipline—are self-perpetuating, as schools pay back funds out of their energy savings. As the attached CEC report makes clear, not one of the participating schools has defaulted on a loan, underscoring the fiscal value of the program. We recommend reinstating funding for the current ECAA-Ed program and increasing it for any program extension. In addition, we know from our three years of watching this program that many schools, especially those in more remote or disadvantaged areas, would benefit from more technical assistance from the CEC as they struggle through the program application. We recommend that the legislature reinstate funding for the Bright Schools program, which provides this kind of technical assistance.
4) Increase support to Workforce Development Board for jobs analysis. Job training and creation were key reasons for the passage of Proposition 39 and were behind the legislation, appropriately titled the “Clean Energy JOBS Act.” Job numbers from the program have also been the source of political focus. Currently, the Workforce Development Board is responsible for “counting” the jobs from Prop 39, but they are expected to do so without any appropriated funding. Moreover, they are only in a position now to try and calculate jobs from the K-12 program. We recommend the WDB receive funding and capacity support in this endeavor, tied to a requirement to provide jobs analysis not just for the K-12 program, but for the other agency programs as well. Ideally this would include analysis on job placement in the training programs provided by CCC, the community colleges, and the pre-apprenticeship programs as well.
5) Increase support to California Energy Commission for program administration. Similarly, the CEC, which currently administers the largest chunk of funding over the most disparate grantees in the CCEJA, lacks appropriated funding to do this work. We recommend the CEC receive funding and capacity support to continue its work in processing EEPs, providing technical support to schools struggling with the SIR and other elements of program applications, providing program information and assistance on the CEC website, and generally serving as the front line of the program to the state’s K-12 schools.
6) Identify ways to increase participation rates of charter schools. We continue to be concerned about the low participation rates of charter schools, which are their own independent LEAs under the terms of this program. We recommend that the legislature and CEC work together to identify barriers to charter school participation, and to consider ways to increase involvement especially from those charter schools that are located within, and using the facilities of, public school districts.
7) Target unspent or new program funds for “innovation grants”. As can be seen from the CEC’s report on K-12 projects to date, there are currently a number of schools that
53
have not accessed their CCEJA program funds. While some of these schools may do so by banking funds at the end of the program, there still may be unspent funds after the first five years are completed. We recommend potentially targeting some portion of these funds for “innovation grants” to schools wanting to reach stretch goals, such as zero-net-energy or 100% renewable energy goals. We have seen through the CEC and community college reports that most Prop 39 funds are spent on fairly low-hanging fruit like lighting and HVAC, in part because of the need to meet the savings-to-investment ratio. Targeting a portion of funds to more ambitious goals, and relaxing the SIR on these specific projects, could provide the state with models for other schools and colleges to follow in the future. Note that we also recommend that ECAA-Ed and Bright Schools (mentioned in recommendation #4, above) are also good programs to consider funding in the event that funds remain unspent at the end of this first 5-year period.
8) Target unspent or new program funds for inventory of K-12 facilities. While we are impressed by the geographic reach of the Prop 39 program this year and the efforts CEC has made to include more schools of varying sizes, we remain concerned that some of the smaller schools with the most pressing energy issues may not be applying for funds. Ideally we would like to recommend that outreach and funds be better targeted to these schools—but at the moment, there is no existing inventory of California K-12 facilities that includes their age, maintenance history, energy use, or any other relevant details. We recommend the legislature consider funding such an inventory as a key input to this program, especially if the program is extended another five years.
9) Target unspent or new program funds for manual on best practices. Finally, as we come toward the conclusion of the first 5-year program period, we recommend that the legislature allocate some funding (possibly out of unspent program funds) to a third-party organization to review a cross-section of completed projects and provide a handbook, or manual, to schools across California that lays out the best opportunities for energy efficiency and self-generation projects, the key issues to consider (financing, capacity, technical know-how, etc.) in approaching such a project, and detailed case studies for some of the schools that have put together truly effective projects across a variety of technologies, geographies, and school size. We believe such a guide would increase the reach of this program even in the event that there is no longer-term extension.
Thank you so much for your consideration of this report, and of our recommendations. We truly appreciate the ability to serve the state of California in our capacity as the Citizen Oversight Board for this important and far-reaching program.