Embed Size (px)
Citation preview
EBioMedicine 2 (2015) 572–582
Contents lists available at ScienceDirect
EBioMedicine
j ourna l homepage: www.eb iomed ic ine.com
Original Article
Epstein–Barr Virus MicroRNAs are Expressed in Patients with ChronicLymphocytic Leukemia and Correlate with Overall Survival☆
Alessandra Ferrajoli a,1, Cristina Ivan b,1, Maria Ciccone a,c,1, Masayoshi Shimizu c, Yoshiaki Kita c,Masahisha Ohtsuka c, Lucilla D'Abundo c,d, Jun Qiang c,e, Susan Lerner a, Nazila Nouraee c, Kari G. Rabe f,Laura Z. Rassenti g, Katrien Van Roosbroeck c, John T.Manning h, Yuan Yuan i,j, Xinna Zhang b, Tait D. Shanafelt k,William G. Wierda a, Silvia Sabbioni d, Jeffrey J. Tarrand i, Zeev Estrov a, Milan Radovich l,m, Han Liang n,Massimo Negrini d, Thomas J. Kipps g, Neil E. Kay k, Michael Keating a,⁎, George A. Calin a,b,c,⁎⁎a Department of Leukemia, The University of Texas MD Anderson Cancer Center, 1515 Holcombe Blvd, Houston, TX 77030-1402, USAb Center for RNA Interference and Non-Coding RNAs, The University of Texas MD Anderson Cancer Center, Houston, TX, USAc Department of Experimental Therapeutics, The University of Texas MD Anderson Cancer Center, 1515 Holcombe Blvd, Houston, TX 77030, USAd Department of Morphology, Surgery and Experimental Medicine, University of Ferrara, Ferrara, 44100, Via Fossato di Mortara, 70, Italye Department of Microbiology, Harbin Medical University, 150081 Harbin, Chinaf Department of Health Science Research, Mayo Clinic College of Medicine, 200 First St SW, Rochester, MN 55905, USAg University of California San Diego, Moores Cancer Center, La Jolla, 3855 Health Sciences Dr, Rm 4307, San Diego, CA 92093-0820, USAh Department of Hematopathology, The University of Texas MD Anderson Cancer Center, 1515 Holcombe Blvd, Houston, TX 77030, USAi Department of Laboratory Medicine, The University of Texas MD Anderson Cancer Center, 1515 Holcombe Blvd, Houston, TX 77030, USAj Graduate Program in Structural and Computational Biology and Molecular Biophysics, Baylor College of Medicine, Houston, TX, USAk Department of Internal Medicine, Division of Hematology, Mayo Clinic College of Medicine, 200 First St SW, Rochester, MN 55905, USAl Department of Surgery, Division of General Surgery, Indiana University School of Medicine, 545 Barnhill Drive, Emerson Hall 203, IN, 46202 USAm Department of Medical and Molecular Genetics, Indiana University School of Medicine, 545 Barnhill Drive, Emerson Hall 203, IN, 46202 USAn Department of Bioinformatics and Computational Biology, The University of Texas MD Anderson Cancer Center, 1400 Pressler Street, Houston, TX, USA
☆ Conflict-of-interest disclosure: the authors declare no⁎ Corresponding author.⁎⁎ Correspondence to: G.A. Calin, Department of ExperimThe University of Texas MD Anderson Cancer Center, 15177030, USA.
E-mail addresses: [email protected] (M. Kea(G.A. Calin).
1 These authors contributed equally to this study.
http://dx.doi.org/10.1016/j.ebiom.2015.04.0182352-3964/© 2015 The Authors. Published by Elsevier B.V
a b s t r a c t
a r t i c l e i n f oArticle history:Received 22 February 2015Received in revised form 22 April 2015Accepted 22 April 2015Available online 29 April 2015
Keywords:miRNAsEpstein–Barr VirusChronic lymphocytic leukemiaBHRF1-1Overall survival
Although numerous studies highlighted the role of Epstein–Barr Virus (EBV) in B-cell transformation, theinvolvement of EBV proteins or genome in the development of the most frequent adult leukemia, chroniclymphocytic leukemia (CLL), has not yet been defined. We hypothesized that EBV microRNAs contribute toprogression of CLL and demonstrated the presence of EBVmiRNAs in B-cells, in paraffin-embedded bonemarrowbiopsies and in the plasma of patients with CLL by using three different methods (small RNA-sequencing,quantitative reverse transcription PCR [q-RT-PCR] and miRNAs in situ hybridization [miRNA-ISH]). We foundthat EBV miRNA BHRF1-1 expression levels were significantly higher in the plasma of patients with CLLcompared with healthy individuals (p b 0 · 0001). Notably, BHRF1-1 as well as BART4 expression were detectedin the plasma of either seronegative or seropositive (anti-EBNA-1 IgG and EBV DNA tested) patients; similarly,miRNA-ISH stained positive in bone marrow specimens while LMP1 and EBER immunohistochemistry failed todetect viral proteins and RNA. We also found that BHRF1-1 plasma expression levels were positively associatedwith elevated beta-2-microglobulin levels and advanced Rai stages and observed a correlation between higherBHRF1-1 expression levels and shorter survival in two independent patients' cohorts. Furthermore, in themajor-ity of CLL cases where BHRF1-1 was exogenously induced in primary malignant B cells the levels of TP53 werereduced. Our findings suggest that EBV may have a role in the process of disease progression in CLL and thatmiRNA RT-PCR and miRNAs ISH could represent additional methods to detect EBV miRNAs in patients with CLL.
© 2015 The Authors. Published by Elsevier B.V. This is an open access article under the CC BY-NC-ND license(http://creativecommons.org/licenses/by-nc-nd/4.0/).
competing financial interest.
ental Therapeutics, Unit 1950,5 Holcombe Blvd, Houston, TX
ting), [email protected]
. This is an open access article under
1. Introduction
Over the past decade, numerous studies have highlighted the centralrole of short non-coding transcripts, named microRNAs (miRNAs),in the pathogenesis of CLL and their influence on the development ofthe disease and its aggressiveness (Fabbri et al., 2011). MiRNAs arenon-coding RNAs which target messenger RNA for degradation and
the CC BY-NC-ND license (http://creativecommons.org/licenses/by-nc-nd/4.0/).
573A. Ferrajoli et al. / EBioMedicine 2 (2015) 572–582
translational repression, and are involved in many physiologic andpathologic processes (Calin and Croce, 2009). Amodel of CLL pathogen-esis that accounts for three of themost frequent recurrent chromosomalabnormalities in B-CLL (13q-, 11q- and 17p-) has been developedexplaining the complex interaction networks composed of coding andnon-coding genes (Fabbri and Croce, 2011).
The clinical course of CLL is highly heterogeneous; some patientshave indolent disease never requiring treatment, whereas others needtreatment at the time of disease presentation. Several prognosticmarkers have been identified including genomic abnormalities accord-ing to fluorescent in situ hybridization (FISH) (Dohner et al., 2000),immunoglobulin heavy chain variable gene (IGHV) mutation status(Hamblin et al., 1999; Damle et al., 1999), CD38 (Damle et al., 1999)and ZAP70 expression (Crespo et al., 2003). The prognostic value ofbiological markers relies on the ability to predict time to first treatment,response to treatment, progression free survival and overall survival(OS). Recently, our group found that a microRNA, miR-155, wasexpressed at high levels in B-cells from patients with CLL comparedwith B-cells from normal individuals and in plasma of patients whofailed to achieve a complete response compared to responding patients,suggesting its role as a biomarker for risk of progression (Ferrajoli et al.,2013).
Several studies have investigated the role played by the Epstein–BarrVirus (EBV) and other viruses in the pathogenesis of CLL (Tsimberidouet al., 2006; Tarrand et al., 2010), but a definitive mechanism involvingEBV proteins or genome has not been identified. EBV is a ubiquitous,human-specific gamma herpes virus, which typically causes subclinicaland latent infection of B cells in healthy individuals. It is associated witha variety of B-cell lymphomas that arise in patients with or withoutovert impairments in cellular immunity (Campo et al., 2011). Interest-ingly, in EBV-associated lymphomas, the substantial majority of cellsshow evidence for the presence of EBV genome by in-situ hybridization(ISH) (Delecluse et al., 2007). Three types of EBV latency states havebeen described in EBV-related lymphomas according to the pattern ofEBV nuclear antigen (EBNA) and the latent membrane protein (LMP)expression. Two sets of non-coding RNAs are also expressed in allforms of EBV infection: the EBER RNAs (Arrand and Rymo, 1982;Lerner et al., 1981) and the BamHI A rightward transcripts (BARTs). Ithas been shown that EBV also encodes miRNAs (Cai et al., 2006). EBVmiRNAs map to two regions of the viral genome: BHRF1 miRNAs arelocated immediately upstream and downstream of the BHRF1 openreading frame, while BART miRNAs lie within the intronic regions ofBART genes (Amoroso et al., 2011). To date there is little informationregarding their functions in the viral and cell life cycle although somespecific targets have been identified (Marquitz et al., 2011; Dolkenet al., 2010; Barth et al., 2008; Choy et al., 2008; Lo et al., 2007; Lunget al., 2009; Xia et al., 2008). EBV infectionmay influence the expressionof several cellular miRNAs (Navarro et al., 2008). Interestingly, it hasbeen reported that miR-155 is the cellular miRNA most highly inducedafter EBV infection of lymphoblastoid B-cells (Linnstaedt et al., 2010).
The purpose of our study is to assess EBV miRNAs expression andtheir contribution to the CLL disease progression. To do this, we ana-lyzed by different methods (small RNA sequencing analysis, qRT-PCRand miRNA In Situ Hybridization) the expression levels of EBV miRNAsin B-cells, plasma and paraffin-embedded bone marrow biopsyspecimens from patients with CLL and determined their associationwith clinical outcome.
2. Material and Methods
2.1. Patients and Samples
A total of 516 samples obtained from patients evaluated at theUniversity of Texas MD Anderson Cancer Center, Houston, Texas(UTMDACC) and The Mayo Clinics, Rochester, Minnesota were used
for this study (Table S1). Informed consent was obtained per institu-tional guidelines and in accordance with the Declaration of Helsinki.
We initially analyzed 48 samples by small RNA sequencing, includingB-cells isolated from 34 patients with CLL and 14 healthy individuals.Subsequently, we performed quantitative reverse transcriptase PCR(qRT-PCR) using the training/validation approach with multiple setsof B-cells and plasma samples. The samples were divided as follows:i) B-cells collected from 93 patients with untreated CLL constituted thetraining group and; ii) B-cells from a second set of 54 patients withboth treated and untreated patients constituted the validation group(clinical characteristics of these patients were described in Rossi et al.)(Rossi et al., 2010); iii) normal B lymphocytes from 20 healthy individ-uals were used as normal controls. Plasma samples collected from thefollowing groups: i) plasma samples from 143 patients with untreatedCLL constituted the training set; ii) plasma samples from a second setof 49 patientswith CLL constituted the validation set; iii) plasma samplesfrom 80 healthy individuals were used as normal controls. Finally, weperformed miRNA In Situ Hybridization (miRNA ISH) on paraffin-embedded bone marrow biopsies obtained from 29 patients with CLL,(with 19 out of 29 arranged on a Tissue Micro Array (TMA)). None ofthe CLL patients were on immunosuppressive therapy before the sam-ples collection. The B-cells and the plasma samples in the training cohortwere collected from previously untreated patients. Although the B-cellsvalidation cohort included both treated and untreated patients, none ofthe samples were collected during treatment.
Healthy individuals were volunteer blood donors; here “healthy”was defined as the absence of any type of cancer or known medicalcondition at the time of the sample collection has previously reported(Zuo et al., 2011).
Patients with CLL had a confirmed diagnosis based on morphologicand immunophenotypic features, and they were staged according tothe Rai classification. Immunoglobulin heavy chain variable (IGHV)gene mutational analysis, zeta-chain associated protein kinase 70 kDa(ZAP70) status, CD38 status and fluorescence in situ hybridization(FISH) analysis were available for most of the patients. IGHV mutationwas defined by the presence of b98% homology at sequencing andZAP70 was defined as being positive if expressed in more than 20% ofcells by flow cytometry. The characteristics of the patients are summa-rized in Table 1.
B-cellswere isolated and/or purified fromblood samples of healthy in-dividuals and patients with CLL as previously described (Ferrajoli et al.,2013). The typical purity of CD19+ CLL cells for our studies was N90%.
Plasma samples were obtained from the CLL Research Consortiumbank at The University of California, San Diego where they had beenstored at−80 °C until the experiments were performed.
2.2. Small RNA Sequencing
RNAwas extracted with Trizol Reagent (Life Technologies, Carlsbad,CA) and the SOLiD Total RNA-Seq kit was used for the library prepara-tion (Life Technologies, Carlsbad, CA). The RNA was run on the SOLiD5500XL System (Applied Biosystems, Carlsbad, CA). We analyzed themiRNA-sequencing data using CLC Genomics Workbench 6 usingdefault parameters and obtained miRNA sequences from miRBase. Inthe analysis, after filtering those reads that mapped to human miRNAs,the remaining reads were mapped to various viruses of interest.Sequences for miRNAs of 27 different viruses were obtained from themiRBase database (release 20, June 2013, www.mirbase.org). Thematch types of mapped reads were annotated according to the locationwithin miRNA genes by the software.
2.3. B-cell RNA Isolation, miRNA Expression Analysis and NormalizerIdentification
RNA was extracted with Trizol (Life Technologies, Carlsbad, CA)using B-cells isolated from healthy donors, or patients with CLL.
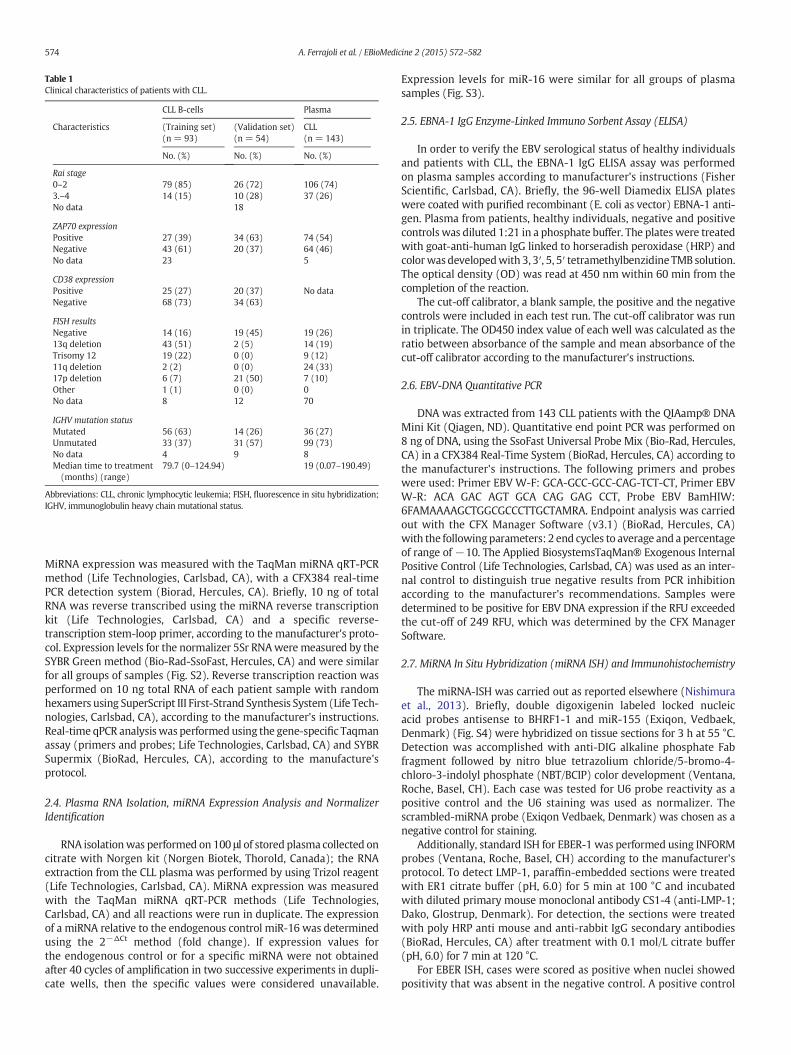
Table 1Clinical characteristics of patients with CLL.
CLL B-cells Plasma
Characteristics (Training set)(n = 93)
(Validation set)(n = 54)
CLL(n = 143)
No. (%) No. (%) No. (%)
Rai stage0–2 79 (85) 26 (72) 106 (74)3.–4 14 (15) 10 (28) 37 (26)No data 18
ZAP70 expressionPositive 27 (39) 34 (63) 74 (54)Negative 43 (61) 20 (37) 64 (46)No data 23 5
CD38 expressionPositive 25 (27) 20 (37) No dataNegative 68 (73) 34 (63)
FISH resultsNegative 14 (16) 19 (45) 19 (26)13q deletion 43 (51) 2 (5) 14 (19)Trisomy 12 19 (22) 0 (0) 9 (12)11q deletion 2 (2) 0 (0) 24 (33)17p deletion 6 (7) 21 (50) 7 (10)Other 1 (1) 0 (0) 0No data 8 12 70
IGHV mutation statusMutated 56 (63) 14 (26) 36 (27)Unmutated 33 (37) 31 (57) 99 (73)No data 4 9 8Median time to treatment(months) (range)
79.7 (0–124.94) 19 (0.07–190.49)
Abbreviations: CLL, chronic lymphocytic leukemia; FISH, fluorescence in situ hybridization;IGHV, immunoglobulin heavy chain mutational status.
574 A. Ferrajoli et al. / EBioMedicine 2 (2015) 572–582
MiRNA expression was measured with the TaqMan miRNA qRT-PCRmethod (Life Technologies, Carlsbad, CA), with a CFX384 real-timePCR detection system (Biorad, Hercules, CA). Briefly, 10 ng of totalRNA was reverse transcribed using the miRNA reverse transcriptionkit (Life Technologies, Carlsbad, CA) and a specific reverse-transcription stem-loop primer, according to the manufacturer's proto-col. Expression levels for the normalizer 5Sr RNAwere measured by theSYBR Green method (Bio-Rad-SsoFast, Hercules, CA) and were similarfor all groups of samples (Fig. S2). Reverse transcription reaction wasperformed on 10 ng total RNA of each patient sample with randomhexamers using SuperScript III First-Strand Synthesis System (Life Tech-nologies, Carlsbad, CA), according to the manufacturer's instructions.Real-time qPCR analysis was performed using the gene-specific Taqmanassay (primers and probes; Life Technologies, Carlsbad, CA) and SYBRSupermix (BioRad, Hercules, CA), according to the manufacture'sprotocol.
2.4. Plasma RNA Isolation, miRNA Expression Analysis and NormalizerIdentification
RNA isolationwas performed on 100 μl of stored plasma collected oncitrate with Norgen kit (Norgen Biotek, Thorold, Canada); the RNAextraction from the CLL plasma was performed by using Trizol reagent(Life Technologies, Carlsbad, CA). MiRNA expression was measuredwith the TaqMan miRNA qRT-PCR methods (Life Technologies,Carlsbad, CA) and all reactions were run in duplicate. The expressionof a miRNA relative to the endogenous control miR-16 was determinedusing the 2−ΔCt method (fold change). If expression values forthe endogenous control or for a specific miRNA were not obtainedafter 40 cycles of amplification in two successive experiments in dupli-cate wells, then the specific values were considered unavailable.
Expression levels for miR-16 were similar for all groups of plasmasamples (Fig. S3).
2.5. EBNA-1 IgG Enzyme-Linked Immuno Sorbent Assay (ELISA)
In order to verify the EBV serological status of healthy individualsand patients with CLL, the EBNA-1 IgG ELISA assay was performedon plasma samples according to manufacturer's instructions (FisherScientific, Carlsbad, CA). Briefly, the 96-well Diamedix ELISA plateswere coated with purified recombinant (E. coli as vector) EBNA-1 anti-gen. Plasma from patients, healthy individuals, negative and positivecontrols was diluted 1:21 in a phosphate buffer. The plateswere treatedwith goat-anti-human IgG linked to horseradish peroxidase (HRP) andcolorwasdevelopedwith 3, 3′, 5, 5′ tetramethylbenzidine TMB solution.The optical density (OD) was read at 450 nm within 60 min from thecompletion of the reaction.
The cut-off calibrator, a blank sample, the positive and the negativecontrols were included in each test run. The cut-off calibrator was runin triplicate. The OD450 index value of each well was calculated as theratio between absorbance of the sample and mean absorbance of thecut-off calibrator according to the manufacturer's instructions.
2.6. EBV-DNA Quantitative PCR
DNA was extracted from 143 CLL patients with the QIAamp® DNAMini Kit (Qiagen, ND). Quantitative end point PCR was performed on8 ng of DNA, using the SsoFast Universal Probe Mix (Bio-Rad, Hercules,CA) in a CFX384 Real-Time System (BioRad, Hercules, CA) according tothe manufacturer's instructions. The following primers and probeswere used: Primer EBV W-F: GCA-GCC-GCC-CAG-TCT-CT, Primer EBVW-R: ACA GAC AGT GCA CAG GAG CCT, Probe EBV BamHIW:6FAMAAAAGCTGGCGCCCTTGCTAMRA. Endpoint analysis was carriedout with the CFX Manager Software (v3.1) (BioRad, Hercules, CA)with the followingparameters: 2 end cycles to average and a percentageof range of −10. The Applied BiosystemsTaqMan® Exogenous InternalPositive Control (Life Technologies, Carlsbad, CA) was used as an inter-nal control to distinguish true negative results from PCR inhibitionaccording to the manufacturer's recommendations. Samples weredetermined to be positive for EBV DNA expression if the RFU exceededthe cut-off of 249 RFU, which was determined by the CFX ManagerSoftware.
2.7. MiRNA In Situ Hybridization (miRNA ISH) and Immunohistochemistry
The miRNA-ISH was carried out as reported elsewhere (Nishimuraet al., 2013). Briefly, double digoxigenin labeled locked nucleicacid probes antisense to BHRF1-1 and miR-155 (Exiqon, Vedbaek,Denmark) (Fig. S4) were hybridized on tissue sections for 3 h at 55 °C.Detection was accomplished with anti-DIG alkaline phosphate Fabfragment followed by nitro blue tetrazolium chloride/5-bromo-4-chloro-3-indolyl phosphate (NBT/BCIP) color development (Ventana,Roche, Basel, CH). Each case was tested for U6 probe reactivity as apositive control and the U6 staining was used as normalizer. Thescrambled-miRNA probe (Exiqon Vedbaek, Denmark) was chosen as anegative control for staining.
Additionally, standard ISH for EBER-1 was performed using INFORMprobes (Ventana, Roche, Basel, CH) according to the manufacturer'sprotocol. To detect LMP-1, paraffin-embedded sections were treatedwith ER1 citrate buffer (pH, 6.0) for 5 min at 100 °C and incubatedwith diluted primary mouse monoclonal antibody CS1-4 (anti-LMP-1;Dako, Glostrup, Denmark). For detection, the sections were treatedwith poly HRP anti mouse and anti-rabbit IgG secondary antibodies(BioRad, Hercules, CA) after treatment with 0.1 mol/L citrate buffer(pH, 6.0) for 7 min at 120 °C.
For EBER ISH, cases were scored as positive when nuclei showedpositivity that was absent in the negative control. A positive control
575A. Ferrajoli et al. / EBioMedicine 2 (2015) 572–582
was included in each experiment. Positivity for LMP-1 was defined bythe detection of immunoreactivity that was not present in the negativecontrol.
2.8. Construction of BHRF1-1 Lentivirus, Infection of Primary Malignant BCells from CLL Patients and TP53 Measurement by Western Blot
We constructed a lentivirus expressing BHRF1-1, the pMIRNA1–BHRF1-1 and the pMIRNA1–Empty Vector provided in E. coli bacterialstock form plated on LB-carbenicillin at 50 μg/ml (System Biosciences).The viral particles were obtained with the protocol from the SystemBiosciences User Manual, using the 293-TN cell line and pPACKH1Lentivector Packaging Kit (System Biosciences). Virus pellets wereresuspended in DMEM and stored in cryovials at−80 °C until use.
Primary malignant B cells from serial patients with CLL collectedbefore treatment in the Leukemia Department at MD Anderson CancerCenter were infected with the pMIRNA1–BHRF1-1 lentivirus with anefficiency of approximately 50% as determined by green fluorescentprotein measurement by flow cytometry. Empty lentivirus (LVEV,lentivirus empty vector) was used as a negative control for theexperiments.
After 96 h from infections, the protein extracts were prepared in ice-cold RIPA lysis buffer 1× (Santa Cruz Biotechnology) containingphenylmethylsulfonyl fluoride (PMSF), sodium orthovanadate andprotease inhibitor cocktail, or in 1× Lysis buffer (Cell Signaling) supple-mented with protease and phosphatase inhibitor (Sigma-Aldrich)according to the manufacturer's instructions.
Total protein (50 μg) was electrophoresed on Criterion TGX StainFree Precast Gels (Bio-Rad Laboratories) and electroblotted onto purePVDF or nitrocellulose membranes (Trans-Blot Transfer Turbo midi-format 0.2 μm; Bio-Rad Laboratories) with the Trans Blot Turbo System(Bio-Rad Laboratories). Membrane blocking and antibody incubationwere performed according to the Cell Signaling Western Immunoblot-ting Protocol, and antigen–antibody reactions were detected withSuperSignal West Femto reagents (Thermo Scientific). We usedthe primary antibodies anti-TP53DINP1 rabbit polyclonal antibody(OriGene) and the anti-Actine antibody as normalizer.
2.9. Statistical Analysis
All statistical analyses were performed in R (version 3.0.1). All testswere two-sided and considered statistically significant at the 0.05level. The Shapiro–Wilk test was applied to determine whetherdata followed a normal distribution. The t-test or analysis of variancefollowed by the post-hoc Tukey test (depending on the number ofgroups considered) was applied to normally distributed data;otherwise, the Mann–Whitney–Wilcoxon test or Kruskal–Wallis testfollowed by a post-hoc Nemenyi test was applied to assess the relation-ship betweenmiRNA expression and clinical parameters. The Spearmancorrelation test was applied to measure the strength of the associationbetween the variables. For each cohort, we checked for a relationshipbetween miRNA expression and overall survival as follows. Patientswere grouped into percentiles according to miRNA expression. TheLog-rank test was employed to determine the association betweenmiRNA expression and overall survival (OS). The Kaplan–Meiermethodwas used to generate OS curves. The cut-off to optimally separate thepatients into low/high miRNA (log-rank test p-value minim) was cho-sen. The relationship between OS and covariates (miRNA expressionlevels and known prognostic factors or other clinical parameters, suchas CD38, IGVH mutation status and ZAP70 expression) was examinedusing a Cox proportional hazard model. Neither FISH (high rate ofmissing data) nor Rai stage (few cases in the high risk group) wereconsidered in the models. Only the factors that were statisticallysignificant via univariable regression analyses were included in thefinal multivariable regression model.
3. Results
3.1. Small RNA-sequencing and qRT-PCR Identified EBV miRNAs Expressionin Peripheral Blood B-cells
By small RNA-sequencing we identified the presence of EBVmiRNAsin themalignant CLL B-cells (n=34 samples) aswell as in normal B-cells(n = 14 samples) (Fig. 1A–B). Sixteen different viruses out of twenty-seven screened, were found by small-RNA sequencing (Fig. 1C). Thevast majority (97%) of viral reads were from herpes gamma virus (EBVand Rhesus lymphocryptovirus). In order to confirm the sequencingresults, we performed qRT-PCR on 12 samples (8 patients with CLL and4 healthy individuals) and 3 EBV-positive cell lines (MEC1, MEC2 andRaji) as controls. The expression of 26 different EBV miRNAs, includingthe miRNAs identified by small RNA sequencing, was evaluated(Table S2 and Fig. S1). We found that BART-4 and BHRF1-1 miRNAswere expressed both in small RNA sequencing and at less than35 cycles in qRT-PCR (mean cycle threshold [Ct] in CLL samples 25.16,SD = 1.08 and 34.1, SD = 2.09 respectively) and further focused onthe study of these two EBV miRNAs.
3.2. 5S rRNA in B-cells and miR-16 in Plasma Showed Stable Expression inNormal Individuals and Patients with CLL
We then tested the levels of various non-coding RNAs as normalizerincluding U6 snRNA, U18 snRNA, U48 snRNA, 5S rRNA and 18S rRNA, aspreviously described (Ferrajoli et al., 2013). Among them, 5S rRNAshowed the most stable expression comparing normal and CLL B-cells,both in training and validation sets (Fig. S2) and therefore we decidedto use this as the reference gene. For the plasma analysis, we initiallyperformed qRT-PCR to amplify 2 genes previously used as normalizersin prior studies we conducted using plasma, miR-192 and miR-16(Cortez et al., 2011; Pritchard et al., 2012; Vasilescu et al., 2009). Mir-16 was expressed at high levels in all samples (mean Ct = 25.4, SD =1.68), whereas miR-192 was expressed at low levels in about 86% ofsamples (mean Ct = 33.19, SD= 1.20). However, the miR-16 chromo-somal locus (13q14) is deleted or silenced in a consistent proportion ofpatients with CLL. As we previously published (Ferrajoli et al., 2013), inorder to confirm the validity of miR-16 as normalizer we analyzed themiR-16 expression levels between cytogenetic subgroups; in ourcohort, no significant differences were observed, depending on FISHabnormalities. These results allowed us to use miR-16 as the sole nor-malizer according to the published qRT-PCR MIQE guidelines (Fig. S3)(Bustin et al., 2009).
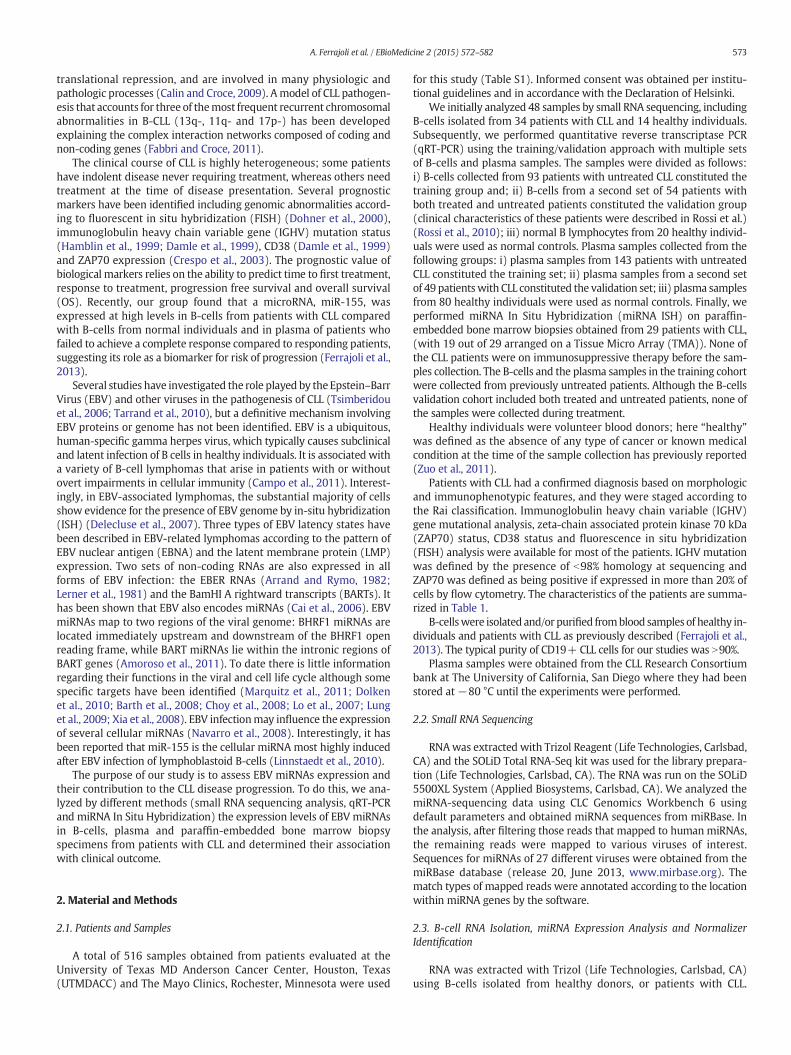
3.3. BHRF1-1 miRNA is Expressed at High Level in Plasma of Patients withCLL and Positively Correlated with miR-155 Expression
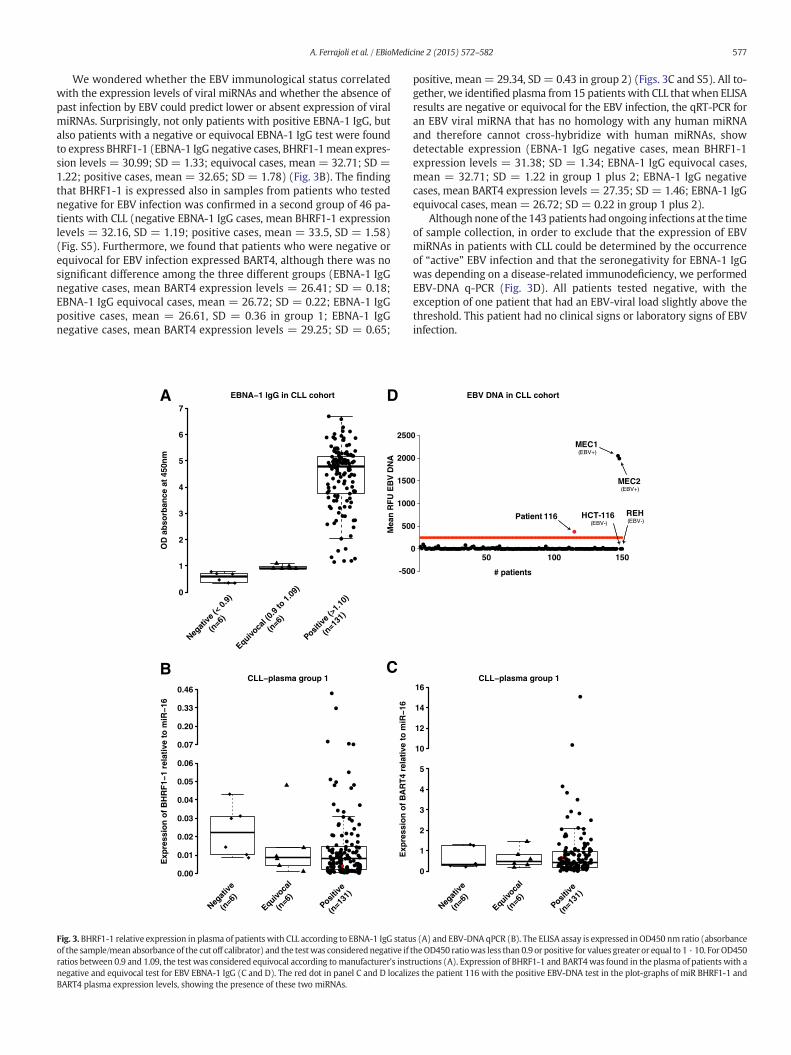
The plasma levels of amiRNAmight not be proportional to the B-cellexpression levels because miRNAs are secreted by various cells, includ-ingmalignant or microenvironment cells. We previously reportedmiR-155 overexpression in the plasma of patients with CLL and its correla-tion to a poor response to therapy (Ferrajoli et al., 2013). Thus, to verifyif EBV miRNAs are also detectable in the plasma of patients with CLL,we extended the analysis of the two previously chosen viral miRNAs(BART4 and BHRF1-1) to plasma samples from 143 patients with CLL(none of themwere on any treatment that could explain an EBV reacti-vation) and 80 normal individuals. We measured BHRF1-1 relativeexpression levels in the plasma of patientswith CLL and normal individ-uals and found that BHRF1-1was expressed at significantly higher levelsin the plasma of patients with CLL (Fig. 2). We, therefore, evaluated acorrelation between plasma BHRF1-1 miRNA levels and certain patientclinical characteristics and found that higher BHRF1-1 levelswere associ-ated with higher beta-2-microglobulin level (b3.3 versus N3.3 mg/L,p = 0.0008) and more advanced Rai stages (Rai 3–4 versus Rai 0–2,p = 0.001).
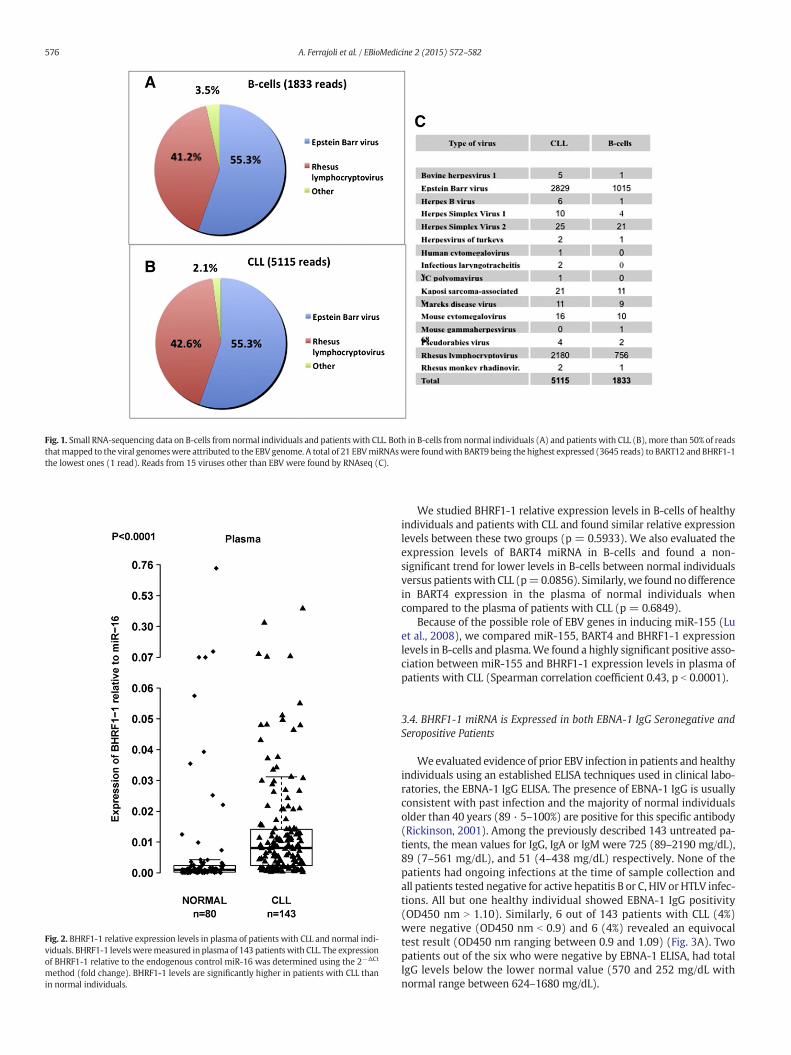
Fig. 2. BHRF1-1 relative expression levels in plasma of patients with CLL and normal indi-viduals. BHRF1-1 levelsweremeasured in plasma of 143 patients with CLL. The expressionof BHRF1-1 relative to the endogenous control miR-16 was determined using the 2−ΔCt
method (fold change). BHRF1-1 levels are significantly higher in patients with CLL thanin normal individuals.
Fig. 1. Small RNA-sequencing data on B-cells from normal individuals and patients with CLL. Both in B-cells from normal individuals (A) and patients with CLL (B), more than 50% of readsthatmapped to the viral genomeswere attributed to the EBV genome. A total of 21 EBVmiRNAswere foundwith BART9 being the highest expressed (3645 reads) to BART12 and BHRF1-1the lowest ones (1 read). Reads from 15 viruses other than EBV were found by RNAseq (C).
576 A. Ferrajoli et al. / EBioMedicine 2 (2015) 572–582
We studied BHRF1-1 relative expression levels in B-cells of healthyindividuals and patients with CLL and found similar relative expressionlevels between these two groups (p = 0.5933). We also evaluated theexpression levels of BART4 miRNA in B-cells and found a non-significant trend for lower levels in B-cells between normal individualsversus patientswith CLL (p=0.0856). Similarly, we foundnodifferencein BART4 expression in the plasma of normal individuals whencompared to the plasma of patients with CLL (p = 0.6849).
Because of the possible role of EBV genes in inducing miR-155 (Luet al., 2008), we compared miR-155, BART4 and BHRF1-1 expressionlevels in B-cells and plasma.We found a highly significant positive asso-ciation between miR-155 and BHRF1-1 expression levels in plasma ofpatients with CLL (Spearman correlation coefficient 0.43, p b 0.0001).
3.4. BHRF1-1 miRNA is Expressed in both EBNA-1 IgG Seronegative andSeropositive Patients
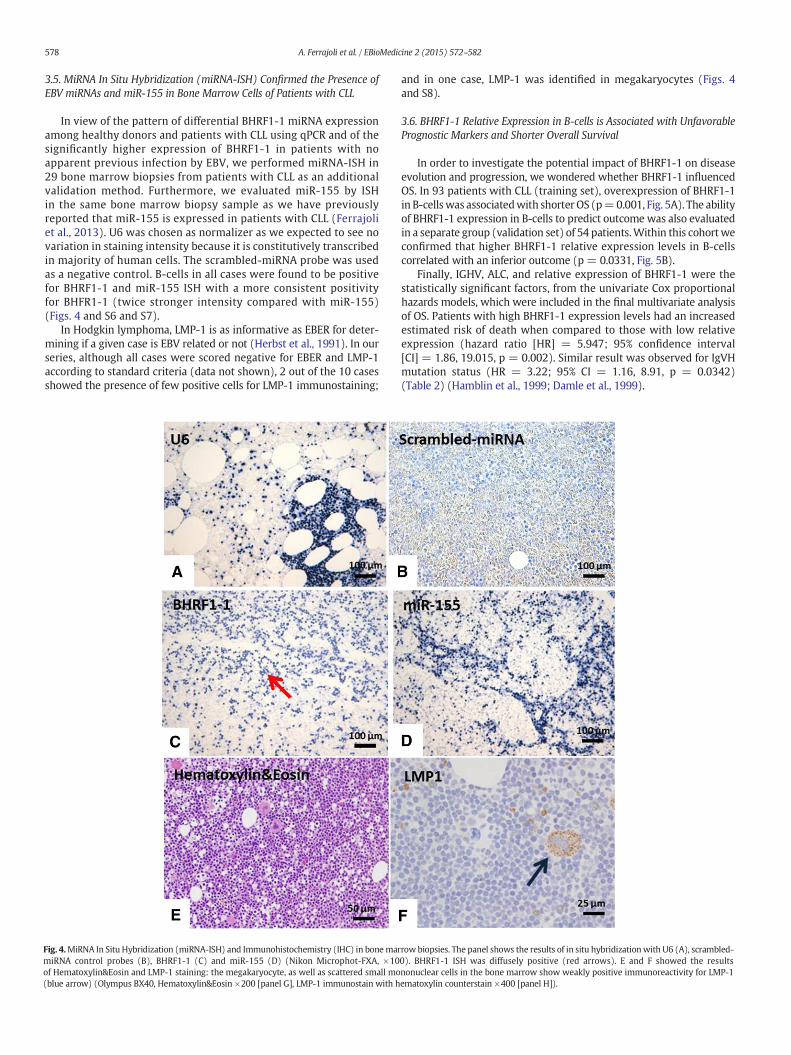
Weevaluated evidence of prior EBV infection in patients and healthyindividuals using an established ELISA techniques used in clinical labo-ratories, the EBNA-1 IgG ELISA. The presence of EBNA-1 IgG is usuallyconsistent with past infection and the majority of normal individualsolder than 40 years (89 · 5–100%) are positive for this specific antibody(Rickinson, 2001). Among the previously described 143 untreated pa-tients, the mean values for IgG, IgA or IgM were 725 (89–2190 mg/dL),89 (7–561 mg/dL), and 51 (4–438 mg/dL) respectively. None of thepatients had ongoing infections at the time of sample collection andall patients tested negative for active hepatitis B or C, HIV or HTLV infec-tions. All but one healthy individual showed EBNA-1 IgG positivity(OD450 nm N 1.10). Similarly, 6 out of 143 patients with CLL (4%)were negative (OD450 nm b 0.9) and 6 (4%) revealed an equivocaltest result (OD450 nm ranging between 0.9 and 1.09) (Fig. 3A). Twopatients out of the six who were negative by EBNA-1 ELISA, had totalIgG levels below the lower normal value (570 and 252 mg/dL withnormal range between 624–1680 mg/dL).
577A. Ferrajoli et al. / EBioMedicine 2 (2015) 572–582
We wondered whether the EBV immunological status correlatedwith the expression levels of viral miRNAs and whether the absence ofpast infection by EBV could predict lower or absent expression of viralmiRNAs. Surprisingly, not only patients with positive EBNA-1 IgG, butalso patients with a negative or equivocal EBNA-1 IgG test were foundto express BHRF1-1 (EBNA-1 IgG negative cases, BHRF1-1mean expres-sion levels = 30.99; SD = 1.33; equivocal cases, mean = 32.71; SD =1.22; positive cases, mean = 32.65; SD = 1.78) (Fig. 3B). The findingthat BHRF1-1 is expressed also in samples from patients who testednegative for EBV infection was confirmed in a second group of 46 pa-tients with CLL (negative EBNA-1 IgG cases, mean BHRF1-1 expressionlevels = 32.16, SD = 1.19; positive cases, mean = 33.5, SD = 1.58)(Fig. S5). Furthermore, we found that patients who were negative orequivocal for EBV infection expressed BART4, although there was nosignificant difference among the three different groups (EBNA-1 IgGnegative cases, mean BART4 expression levels = 26.41; SD = 0.18;EBNA-1 IgG equivocal cases, mean = 26.72; SD = 0.22; EBNA-1 IgGpositive cases, mean = 26.61, SD = 0.36 in group 1; EBNA-1 IgGnegative cases, mean BART4 expression levels = 29.25; SD = 0.65;
50 100 150
-500
0
500
1000
1500
2000
2500
# patients
Mea
n R
FU
EB
V D
NA
MEC1(EBV+)
MEC2(EBV+)
Patient 116 HCT-116(EBV-)
REH(EBV-)
EBV DNA in CLL cohortEBNA−1 lgG in CLL cohort
0
1
2
3
4
5
6
7
OD
ab
sorb
ance
at
450n
m
Negat
ive (<
0.9)
(n=6
)
Equivoca
l (0.9
to 1.
09)
(n=6
)
Positive
(>1.1
0)
(n=1
31)
A
BCLL−plasma group 1
0.00
0.01
0.02
0.03
0.04
0.05
0.06
0.07
0.20
0.33
0.46
Exp
ress
ion
of
BH
RF
1−1
rela
tive
to
miR
−16
Negat
ive
(n=6
)
Equivoca
l
(n=6
)Posit
ive
(n=1
31)
C
D
CLL−plasma group 1
0
1
2
3
4
5
10
12
14
16
Exp
ress
ion
of
BA
RT
4 re
lati
ve t
o m
iR−1
6
Negat
ive
(n=6
)
Equivoca
l
(n=6
)Posit
ive
(n=1
31)
ig. 3. BHRF1-1 relative expression in plasma of patients with CLL according to EBNA-1 IgG status (A) and EBV-DNA qPCR (B). The ELISA assay is expressed inOD450 nm ratio (absorbancef the sample/mean absorbance of the cut off calibrator) and the testwas considerednegative if theOD450 ratiowas less than 0.9 or positive for values greater or equal to 1 · 10. For OD450tios between 0.9 and 1.09, the test was considered equivocal according tomanufacturer's instructions (A). Expression of BHRF1-1 and BART4was found in the plasma of patients with aegative and equivocal test for EBV EBNA-1 IgG (C and D). The red dot in panel C and D localizes the patient 116 with the positive EBV-DNA test in the plot-graphs of miR BHRF1-1 andART4 plasma expression levels, showing the presence of these two miRNAs.
ForanB
positive, mean= 29.34, SD= 0.43 in group 2) (Figs. 3C and S5). All to-gether, we identified plasma from 15 patients with CLL that when ELISAresults are negative or equivocal for the EBV infection, the qRT-PCR foran EBV viral miRNA that has no homology with any human miRNAand therefore cannot cross-hybridize with human miRNAs, showdetectable expression (EBNA-1 IgG negative cases, mean BHRF1-1expression levels = 31.38; SD = 1.34; EBNA-1 IgG equivocal cases,mean = 32.71; SD = 1.22 in group 1 plus 2; EBNA-1 IgG negativecases, mean BART4 expression levels = 27.35; SD = 1.46; EBNA-1 IgGequivocal cases, mean = 26.72; SD = 0.22 in group 1 plus 2).
Although none of the 143 patients had ongoing infections at the timeof sample collection, in order to exclude that the expression of EBVmiRNAs in patients with CLL could be determined by the occurrenceof “active” EBV infection and that the seronegativity for EBNA-1 IgGwas depending on a disease-related immunodeficiency, we performedEBV-DNA q-PCR (Fig. 3D). All patients tested negative, with theexception of one patient that had an EBV-viral load slightly above thethreshold. This patient had no clinical signs or laboratory signs of EBVinfection.
578 A. Ferrajoli et al. / EBioMedicine 2 (2015) 572–582
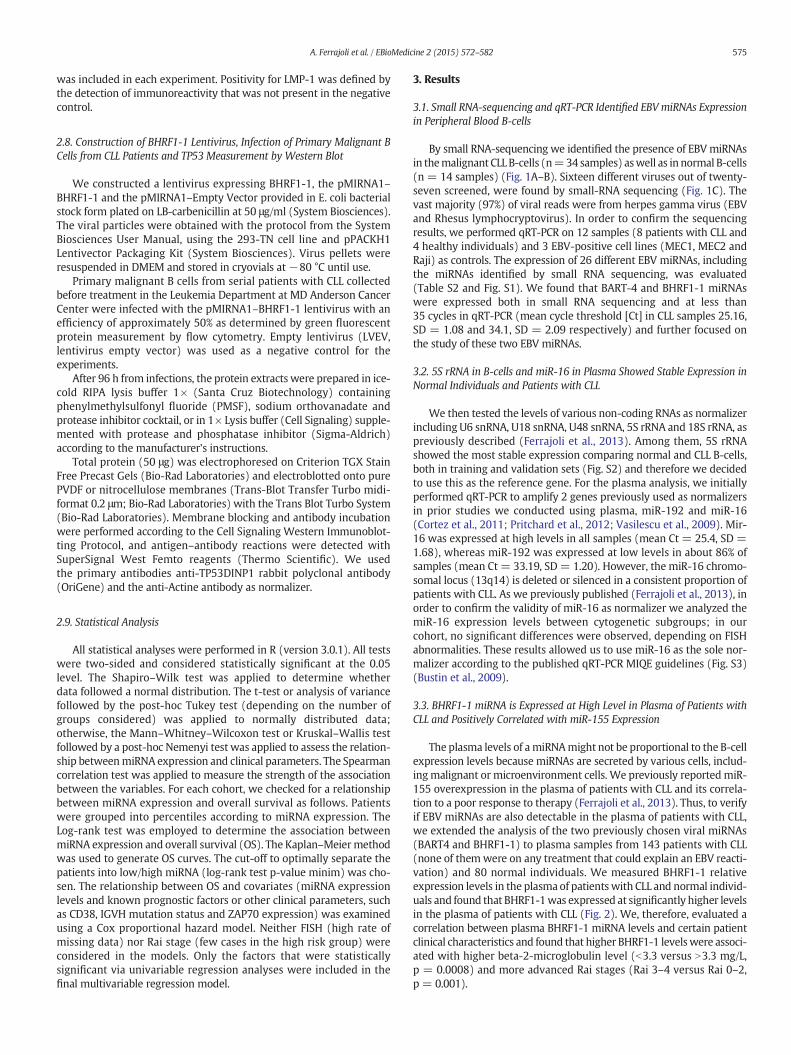
3.5. MiRNA In Situ Hybridization (miRNA-ISH) Confirmed the Presence ofEBV miRNAs and miR-155 in Bone Marrow Cells of Patients with CLL
In view of the pattern of differential BHRF1-1 miRNA expressionamong healthy donors and patients with CLL using qPCR and of thesignificantly higher expression of BHRF1-1 in patients with noapparent previous infection by EBV, we performed miRNA-ISH in29 bone marrow biopsies from patients with CLL as an additionalvalidation method. Furthermore, we evaluated miR-155 by ISHin the same bone marrow biopsy sample as we have previouslyreported that miR-155 is expressed in patients with CLL (Ferrajoliet al., 2013). U6 was chosen as normalizer as we expected to see novariation in staining intensity because it is constitutively transcribedin majority of human cells. The scrambled-miRNA probe was usedas a negative control. B-cells in all cases were found to be positivefor BHRF1-1 and miR-155 ISH with a more consistent positivityfor BHFR1-1 (twice stronger intensity compared with miR-155)(Figs. 4 and S6 and S7).
In Hodgkin lymphoma, LMP-1 is as informative as EBER for deter-mining if a given case is EBV related or not (Herbst et al., 1991). In ourseries, although all cases were scored negative for EBER and LMP-1according to standard criteria (data not shown), 2 out of the 10 casesshowed the presence of few positive cells for LMP-1 immunostaining;
Fig. 4.MiRNA In Situ Hybridization (miRNA-ISH) and Immunohistochemistry (IHC) in bonemarmiRNA control probes (B), BHRF1-1 (C) and miR-155 (D) (Nikon Microphot-FXA, ×10of Hematoxylin&Eosin and LMP-1 staining: the megakaryocyte, as well as scattered small mo(blue arrow) (Olympus BX40, Hematoxylin&Eosin ×200 [panel G], LMP-1 immunostain with h
and in one case, LMP-1 was identified in megakaryocytes (Figs. 4and S8).
3.6. BHRF1-1 Relative Expression in B-cells is Associated with UnfavorablePrognostic Markers and Shorter Overall Survival
In order to investigate the potential impact of BHRF1-1 on diseaseevolution and progression, we wondered whether BHRF1-1 influencedOS. In 93 patients with CLL (training set), overexpression of BHRF1-1in B-cellswas associatedwith shorter OS (p=0.001, Fig. 5A). The abilityof BHRF1-1 expression in B-cells to predict outcome was also evaluatedin a separate group (validation set) of 54 patients.Within this cohortweconfirmed that higher BHRF1-1 relative expression levels in B-cellscorrelated with an inferior outcome (p = 0.0331, Fig. 5B).
Finally, IGHV, ALC, and relative expression of BHRF1-1 were thestatistically significant factors, from the univariate Cox proportionalhazards models, which were included in the final multivariate analysisof OS. Patients with high BHRF1-1 expression levels had an increasedestimated risk of death when compared to those with low relativeexpression (hazard ratio [HR] = 5.947; 95% confidence interval[CI] = 1.86, 19.015, p = 0.002). Similar result was observed for IgVHmutation status (HR = 3.22; 95% CI = 1.16, 8.91, p = 0.0342)(Table 2) (Hamblin et al., 1999; Damle et al., 1999).
row biopsies. The panel shows the results of in situ hybridizationwith U6 (A), scrambled-0). BHRF1-1 ISH was diffusely positive (red arrows). E and F showed the resultsnonuclear cells in the bone marrow show weakly positive immunoreactivity for LMP-1ematoxylin counterstain ×400 [panel H]).
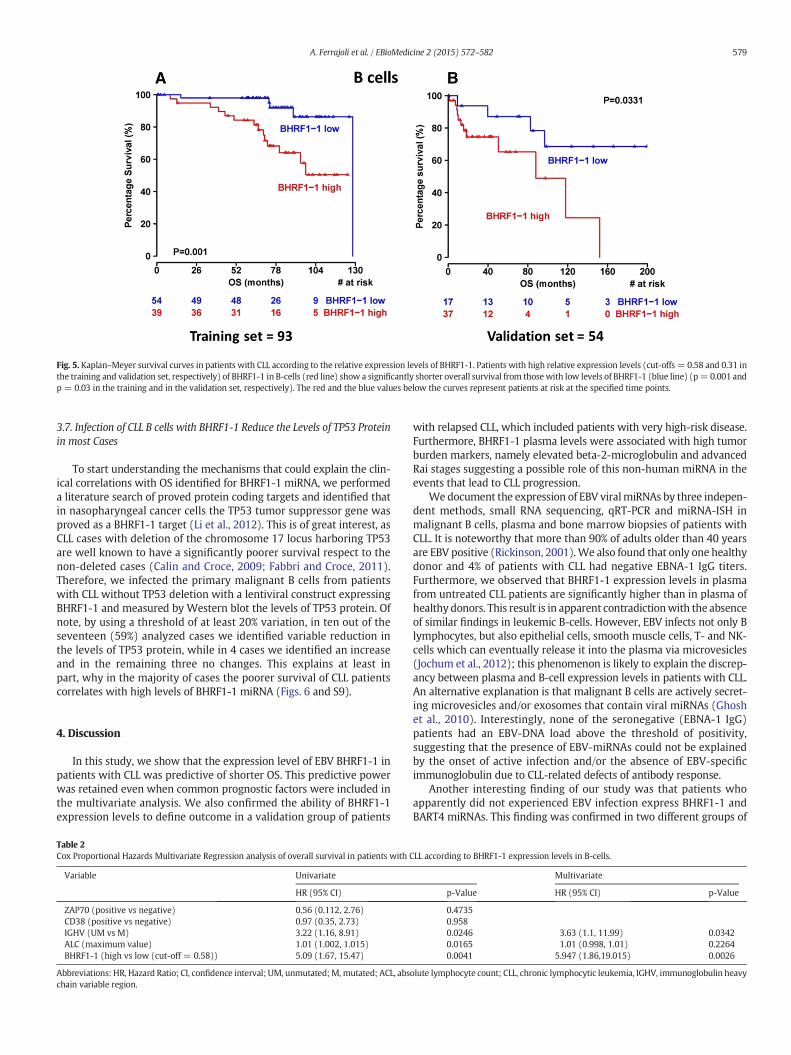
Fig. 5. Kaplan–Meyer survival curves in patients with CLL according to the relative expression levels of BHRF1-1. Patients with high relative expression levels (cut-offs = 0.58 and 0.31 inthe training and validation set, respectively) of BHRF1-1 in B-cells (red line) show a significantly shorter overall survival from those with low levels of BHRF1-1 (blue line) (p= 0.001 andp = 0.03 in the training and in the validation set, respectively). The red and the blue values below the curves represent patients at risk at the specified time points.
579A. Ferrajoli et al. / EBioMedicine 2 (2015) 572–582
3.7. Infection of CLL B cells with BHRF1-1 Reduce the Levels of TP53 Proteinin most Cases
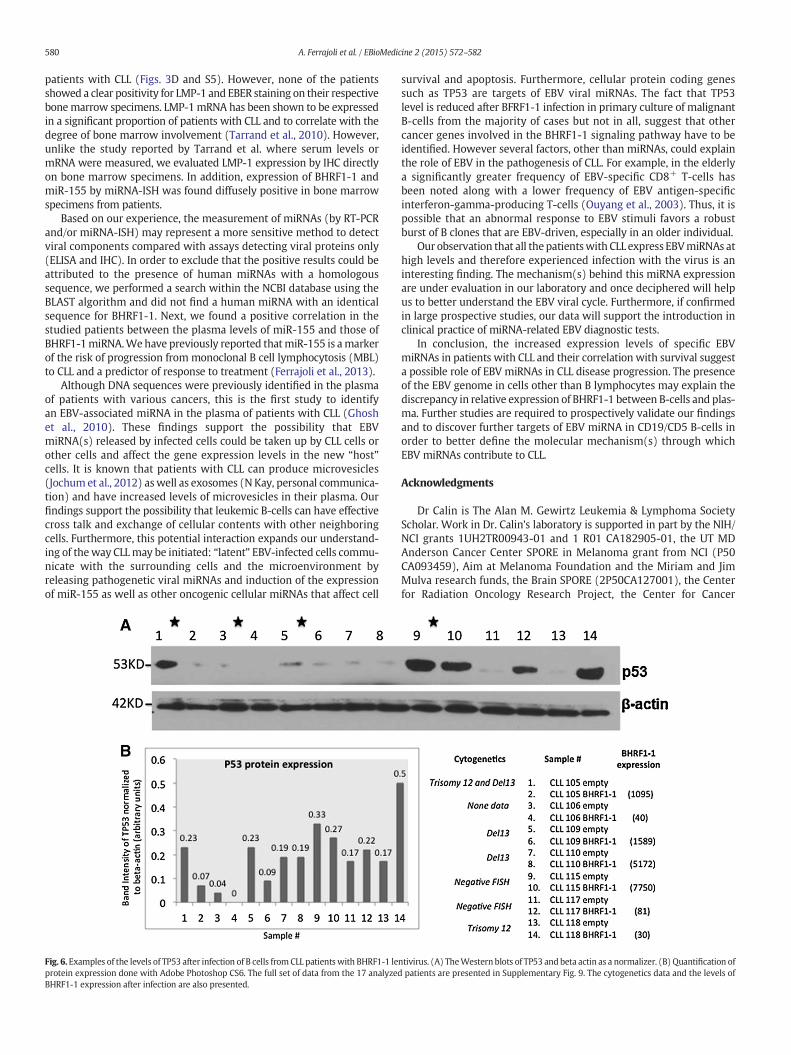
To start understanding the mechanisms that could explain the clin-ical correlations with OS identified for BHRF1-1 miRNA, we performeda literature search of proved protein coding targets and identified thatin nasopharyngeal cancer cells the TP53 tumor suppressor gene wasproved as a BHRF1-1 target (Li et al., 2012). This is of great interest, asCLL cases with deletion of the chromosome 17 locus harboring TP53are well known to have a significantly poorer survival respect to thenon-deleted cases (Calin and Croce, 2009; Fabbri and Croce, 2011).Therefore, we infected the primary malignant B cells from patientswith CLL without TP53 deletion with a lentiviral construct expressingBHRF1-1 and measured by Western blot the levels of TP53 protein. Ofnote, by using a threshold of at least 20% variation, in ten out of theseventeen (59%) analyzed cases we identified variable reduction inthe levels of TP53 protein, while in 4 cases we identified an increaseand in the remaining three no changes. This explains at least inpart, why in the majority of cases the poorer survival of CLL patientscorrelates with high levels of BHRF1-1 miRNA (Figs. 6 and S9).
4. Discussion
In this study, we show that the expression level of EBV BHRF1-1 inpatients with CLL was predictive of shorter OS. This predictive powerwas retained even when common prognostic factors were included inthe multivariate analysis. We also confirmed the ability of BHRF1-1expression levels to define outcome in a validation group of patients
Table 2Cox Proportional Hazards Multivariate Regression analysis of overall survival in patients with C
Variable Univariate
HR (95% CI)
ZAP70 (positive vs negative) 0.56 (0.112, 2.76)CD38 (positive vs negative) 0.97 (0.35, 2.73)IGHV (UM vs M) 3.22 (1.16, 8.91)ALC (maximum value) 1.01 (1.002, 1.015)BHRF1-1 (high vs low (cut-off = 0.58)) 5.09 (1.67, 15.47)
Abbreviations: HR, Hazard Ratio; CI, confidence interval; UM, unmutated; M, mutated; ACL, abschain variable region.
with relapsed CLL, which included patients with very high-risk disease.Furthermore, BHRF1-1 plasma levels were associated with high tumorburden markers, namely elevated beta-2-microglobulin and advancedRai stages suggesting a possible role of this non-human miRNA in theevents that lead to CLL progression.
We document the expression of EBV viralmiRNAs by three indepen-dent methods, small RNA sequencing, qRT-PCR and miRNA-ISH inmalignant B cells, plasma and bone marrow biopsies of patients withCLL. It is noteworthy that more than 90% of adults older than 40 yearsare EBV positive (Rickinson, 2001).We also found that only one healthydonor and 4% of patients with CLL had negative EBNA-1 IgG titers.Furthermore, we observed that BHRF1-1 expression levels in plasmafrom untreated CLL patients are significantly higher than in plasma ofhealthy donors. This result is in apparent contradictionwith the absenceof similar findings in leukemic B-cells. However, EBV infects not only Blymphocytes, but also epithelial cells, smooth muscle cells, T- and NK-cells which can eventually release it into the plasma via microvesicles(Jochum et al., 2012); this phenomenon is likely to explain the discrep-ancy between plasma and B-cell expression levels in patients with CLL.An alternative explanation is that malignant B cells are actively secret-ing microvesicles and/or exosomes that contain viral miRNAs (Ghoshet al., 2010). Interestingly, none of the seronegative (EBNA-1 IgG)patients had an EBV-DNA load above the threshold of positivity,suggesting that the presence of EBV-miRNAs could not be explainedby the onset of active infection and/or the absence of EBV-specificimmunoglobulin due to CLL-related defects of antibody response.
Another interesting finding of our study was that patients whoapparently did not experienced EBV infection express BHRF1-1 andBART4 miRNAs. This finding was confirmed in two different groups of
LL according to BHRF1-1 expression levels in B-cells.
Multivariate
p-Value HR (95% CI) p-Value
0.47350.9580.0246 3.63 (1.1, 11.99) 0.03420.0165 1.01 (0.998, 1.01) 0.22640.0041 5.947 (1.86,19.015) 0.0026
olute lymphocyte count; CLL, chronic lymphocytic leukemia, IGHV, immunoglobulin heavy
580 A. Ferrajoli et al. / EBioMedicine 2 (2015) 572–582
patients with CLL (Figs. 3D and S5). However, none of the patientsshowed a clear positivity for LMP-1 and EBER staining on their respectivebonemarrow specimens. LMP-1mRNA has been shown to be expressedin a significant proportion of patients with CLL and to correlate with thedegree of bone marrow involvement (Tarrand et al., 2010). However,unlike the study reported by Tarrand et al. where serum levels ormRNA were measured, we evaluated LMP-1 expression by IHC directlyon bone marrow specimens. In addition, expression of BHRF1-1 andmiR-155 by miRNA-ISH was found diffusely positive in bone marrowspecimens from patients.
Based on our experience, the measurement of miRNAs (by RT-PCRand/or miRNA-ISH) may represent a more sensitive method to detectviral components compared with assays detecting viral proteins only(ELISA and IHC). In order to exclude that the positive results could beattributed to the presence of human miRNAs with a homologoussequence, we performed a search within the NCBI database using theBLAST algorithm and did not find a human miRNA with an identicalsequence for BHRF1-1. Next, we found a positive correlation in thestudied patients between the plasma levels of miR-155 and those ofBHRF1-1miRNA.Wehave previously reported thatmiR-155 is amarkerof the risk of progression from monoclonal B cell lymphocytosis (MBL)to CLL and a predictor of response to treatment (Ferrajoli et al., 2013).
Although DNA sequences were previously identified in the plasmaof patients with various cancers, this is the first study to identifyan EBV-associated miRNA in the plasma of patients with CLL (Ghoshet al., 2010). These findings support the possibility that EBVmiRNA(s) released by infected cells could be taken up by CLL cells orother cells and affect the gene expression levels in the new “host”cells. It is known that patients with CLL can produce microvesicles(Jochum et al., 2012) aswell as exosomes (N Kay, personal communica-tion) and have increased levels of microvesicles in their plasma. Ourfindings support the possibility that leukemic B-cells can have effectivecross talk and exchange of cellular contents with other neighboringcells. Furthermore, this potential interaction expands our understand-ing of theway CLLmay be initiated: “latent” EBV-infected cells commu-nicate with the surrounding cells and the microenvironment byreleasing pathogenetic viral miRNAs and induction of the expressionof miR-155 as well as other oncogenic cellular miRNAs that affect cell
Fig. 6. Examples of the levels of TP53 after infection of B cells from CLL patients with BHRF1-1 leprotein expression done with Adobe Photoshop CS6. The full set of data from the 17 analyzedBHRF1-1 expression after infection are also presented.
survival and apoptosis. Furthermore, cellular protein coding genessuch as TP53 are targets of EBV viral miRNAs. The fact that TP53level is reduced after BFRF1-1 infection in primary culture of malignantB-cells from the majority of cases but not in all, suggest that othercancer genes involved in the BHRF1-1 signaling pathway have to beidentified. However several factors, other than miRNAs, could explainthe role of EBV in the pathogenesis of CLL. For example, in the elderlya significantly greater frequency of EBV-specific CD8+ T-cells hasbeen noted along with a lower frequency of EBV antigen-specificinterferon-gamma-producing T-cells (Ouyang et al., 2003). Thus, it ispossible that an abnormal response to EBV stimuli favors a robustburst of B clones that are EBV-driven, especially in an older individual.
Our observation that all thepatientswith CLL express EBVmiRNAs athigh levels and therefore experienced infection with the virus is aninteresting finding. The mechanism(s) behind this miRNA expressionare under evaluation in our laboratory and once deciphered will helpus to better understand the EBV viral cycle. Furthermore, if confirmedin large prospective studies, our data will support the introduction inclinical practice of miRNA-related EBV diagnostic tests.
In conclusion, the increased expression levels of specific EBVmiRNAs in patients with CLL and their correlation with survival suggesta possible role of EBV miRNAs in CLL disease progression. The presenceof the EBV genome in cells other than B lymphocytes may explain thediscrepancy in relative expression of BHRF1-1 between B-cells and plas-ma. Further studies are required to prospectively validate our findingsand to discover further targets of EBV miRNA in CD19/CD5 B-cells inorder to better define the molecular mechanism(s) through whichEBV miRNAs contribute to CLL.
Acknowledgments
Dr Calin is The Alan M. Gewirtz Leukemia & Lymphoma SocietyScholar. Work in Dr. Calin's laboratory is supported in part by the NIH/NCI grants 1UH2TR00943-01 and 1 R01 CA182905-01, the UT MDAnderson Cancer Center SPORE in Melanoma grant from NCI (P50CA093459), Aim at Melanoma Foundation and the Miriam and JimMulva research funds, the Brain SPORE (2P50CA127001), the Centerfor Radiation Oncology Research Project, the Center for Cancer
ntivirus. (A) TheWestern blots of TP53 and beta actin as a normalizer. (B) Quantification ofpatients are presented in Supplementary Fig. 9. The cytogenetics data and the levels of
581A. Ferrajoli et al. / EBioMedicine 2 (2015) 572–582
Epigenetics Pilot project, a 2014 Knowledge GAP MDACC grant, a CLLMoonshot pilot project, the UT MD Anderson Cancer Center DuncanFamily Institute for Cancer Prevention and Risk Assessment, a SINFgrant in colon cancer, the Laura and John Arnold Foundation, the RGKFoundation and the Estate of C. G. Johnson, Jr. This researchwas partiallysupported by the P01-CA81534 and the CLL Research Consortium toDrs. Rassenti and Kipps. Dr. Kay is the recipient of NCI research awardCA95241 and support from the CLL Research Consortium and the CLLGlobal Foundation. Dr. Shanafelt is a Clinical Scholar of the Leukemiaand Lymphoma Society. Dr Van Roosbroeck was a Henri BenedictusFellow of the King Baudouin Foundation and the Belgian AmericanEducation Foundation (B.A.E.F.). Dr Ciccone was supported by AIL-Associazione Italiana contro le Leucemie Sezione di Ferrara.
We dedicate this study to the memory of our collaborator SusanLerner, whoplayed a fundamental role in the development ofmicroRNACLL research programatMDACC.We thank Dr Richard Julian Jones fromMDACC for the critical reading of themanuscript and helpful comments.
Authorship Contributions
Study concept and design: AF, MK, GAC.Acquisition of data: AF, MC, MS, YK, MO, LDA, JQ, NN, KGR, LZR, KVR,
JTM, YY, XZ, TDS, WGW, SS, JJT, ZE, HL, MN, TJK, NEK, MK, GAC.Analysis and interpretation of data: AF, MK, NEK, GAC.Statistical analysis: CI, KGR, MR.Administrative, technical, or material support: MS, SL.Drafting of the manuscript: AF, MC, MK, GAC.All authors critically reviewed the manuscript and approved the
final version.
Role of Funding Source
The funders had no role in study design, data collection, dataanalysis, interpretation, writing of the report.
Appendix A. Supplementary Data
Supplementary data to this article can be found online at http://dx.doi.org/10.1016/j.ebiom.2015.04.018.
References
Amoroso, R., Fitzsimmons, L., Thomas, W.A., Kelly, G.L., Rowe, M., Bell, A.I., 2011.Quantitative studies of Epstein–Barr virus-encoded microRNAs provide novelinsights into their regulation. J. Virol. 85 (2), 996–1010 (Jan, PubMed PMID:21068248. Pubmed Central PMCID: 3020024).
Arrand, J.R., Rymo, L., 1982. Characterization of the major Epstein–Barr virus-specific RNAin Burkitt lymphoma-derived cells. J. Virol. 41 (2), 376–389 (Feb, PubMed PMID:6281455. Pubmed Central PMCID: 256768).
Barth, S., Pfuhl, T., Mamiani, A., Ehses, C., Roemer, K., Kremmer, E., et al., 2008. Epstein–Barr virus-encoded microRNA miR-BART2 down-regulates the viral DNA polymeraseBALF5. Nucleic Acids Res. 36 (2), 666–675 (Feb, PubMed PMID: 18073197. PubmedCentral PMCID: 2241876).
Bustin, S.A., Benes, V., Garson, J.A., Hellemans, J., Huggett, J., Kubista, M., et al., 2009. TheMIQE guidelines: minimum information for publication of quantitative real-timePCR experiments. Clin. Chem. 55 (4), 611–622 (Apr, PubMed PMID: 19246619).
Cai, X., Schafer, A., Lu, S., Bilello, J.P., Desrosiers, R.C., Edwards, R., et al., 2006. Epstein–Barrvirus microRNAs are evolutionarily conserved and differentially expressed. PLoSPathog. 2 (3) (Mar, PubMed PMID: 16557291. Pubmed Central PMCID: 1409806).
Calin, G.A., Croce, C.M., 2009. Chronic lymphocytic leukemia: interplay between noncod-ing RNAs and protein-coding genes. Blood 114 (23), 4761–4770 (Nov 26, PubMedPMID: 19745066. Pubmed Central PMCID: 2786287).
Campo, E., Swerdlow, S.H., Harris, N.L., Pileri, S., Stein, H., Jaffe, E.S., 2011. The 2008 WHOclassification of lymphoid neoplasms and beyond: evolving concepts and practicalapplications. Blood 117 (19), 5019–5032 (May 12, PubMed PMID: 21300984.Pubmed Central PMCID: 3109529).
Choy, E.Y., Siu, K.L., Kok, K.H., Lung, R.W., Tsang, C.M., To, K.F., et al., 2008. An Epstein–Barrvirus-encodedmicroRNA targets PUMA to promote host cell survival. J. Exp. Med. 205(11), 2551–2560 (Oct 27, PubMed PMID: 18838543. Pubmed Central PMCID:2571930).
Cortez, M.A., Bueso-Ramos, C., Ferdin, J., Lopez-Berestein, G., Sood, A.K., Calin, G.A., 2011.MicroRNAs in body fluids — the mix of hormones and biomarkers. Nat. Rev. Clin.
Oncol. 8 (8), 467–477 (Aug, PubMed PMID: 21647195. Pubmed Central PMCID:3423224).
Crespo, M., Bosch, F., Villamor, N., Bellosillo, B., Colomer, D., Rozman, M., et al., 2003. ZAP-70 expression as a surrogate for immunoglobulin-variable-region mutations inchronic lymphocytic leukemia. N. Engl. J. Med. 348 (18), 1764–1775 (May 1, PubMedPMID: 12724482).
Damle, R.N., Wasil, T., Fais, F., Ghiotto, F., Valetto, A., Allen, S.L., et al., 1999. Ig V genemutation status and CD38 expression as novel prognostic indicators in chroniclymphocytic leukemia. Blood 94 (6), 1840–1847 (Sep 15, PubMed PMID: 10477712).
Delecluse, H.J., Feederle, R., O'Sullivan, B., Taniere, P., 2007. Epstein Barr virus-associatedtumours: an update for the attention of the working pathologist. J. Clin. Pathol. 60(12), 1358–1364 (Dec, PubMed PMID: 17873116. Pubmed Central PMCID: 2095566).
Dohner, H., Stilgenbauer, S., Benner, A., Leupolt, E., Krober, A., Bullinger, L., et al., 2000.Genomic aberrations and survival in chronic lymphocytic leukemia. N. Engl. J. Med.343 (26), 1910–1916 (Dec 28, PubMed PMID: 11136261).
Dolken, L., Malterer, G., Erhard, F., Kothe, S., Friedel, C.C., Suffert, G., et al., 2010. Systematicanalysis of viral and cellular microRNA targets in cells latently infected with humangamma-herpesviruses by RISC immunoprecipitation assay. Cell Host Microbe 7 (4),324–334 (Apr 22, PubMed PMID: 20413099).
Fabbri, M., Croce, C.M., 2011. Role of microRNAs in lymphoid biology and disease. Curr.Opin. Hematol. 18 (4), 266–272 (Jul, PubMed PMID: 21519241. Pubmed CentralPMCID: 3400499).
Fabbri, M., Bottoni, A., Shimizu, M., Spizzo, R., Nicoloso, M.S., Rossi, S., et al., 2011.Association of a microRNA/TP53 feedback circuitry with pathogenesis and outcomeof B-cell chronic lymphocytic leukemia. JAMA 305 (1), 59–67 (Jan 5, PubMedPMID: 21205967. Pubmed Central PMCID: 3690301).
Ferrajoli, A., Shanafelt, T.D., Ivan, C., Shimizu, M., Rabe, K.G., Nouraee, N., et al., 2013.Prognostic value of miR-155 in individuals with monoclonal B-cell lymphocytosisand patients with B chronic lymphocytic leukemia. Blood 122 (11), 1891–1899(Sep 12, PubMed PMID: 23821659. Pubmed Central PMCID: 37793810).
Ghosh, A.K., Secreto, C.R., Knox, T.R., Ding, W., Mukhopadhyay, D., Kay, N.E., 2010.Circulating microvesicles in B-cell chronic lymphocytic leukemia can stimulatemarrow stromal cells: implications for disease progression. Blood 115 (9),1755–1764 (Mar 4, PubMed PMID: 20018914. Pubmed Central PMCID: 2832808).
Hamblin, T.J., Davis, Z., Gardiner, A., Oscier, D.G., Stevenson, F.K., 1999. Unmutated IgV(H) genes are associated with a more aggressive form of chronic lymphocyticleukemia. Blood 94 (6), 1848–1854 (Sep 15, PubMed PMID: 10477713).
Herbst, H., Dallenbach, F., Hummel, M., Niedobitek, G., Finn, T., Young, L.S., et al., 1991. Ep-stein–Barr virus DNA and latent gene products in Ki-1 (CD30)-positive anaplasticlarge cell lymphomas. Blood 78 (10), 2666–2673 (Nov 15, PubMed PMID: 1668608).
Jochum, S., Ruiss, R., Moosmann, A., Hammerschmidt, W., Zeidler, R., 2012. RNAs inEpstein–Barr virions control early steps of infection. Proc. Natl. Acad. Sci. U. S. A.109 (21), E1396–E1404 (May 22, PubMed PMID: 22543160. Pubmed CentralPMCID: 3361417).
Lerner, M.R., Andrews, N.C., Miller, G., Steitz, J.A., 1981. Two small RNAs encoded byEpstein–Barr virus and complexed with protein are precipitated by antibodies frompatients with systemic lupus erythematosus. Proc. Natl. Acad. Sci. U. S. A. 78 (2),805–809 (Feb, PubMed PMID: 6262773. Pubmed Central PMCID: 319891).
Li, Z., Chen, X., Li, L., Liu, S., Yang, L., Ma, X., et al., 2012. EBV encoded miR-BHRF1-1potentiates viral lytic replication by downregulating host p53 in nasopharyngealcarcinoma. Int. J. Biochem. Cell Biol. 44, 275–279.
Linnstaedt, S.D., Gottwein, E., Skalsky, R.L., Luftig, M.A., Cullen, B.R., 2010. Virally inducedcellularmicroRNAmiR-155 plays a key role in B-cell immortalization by Epstein–Barrvirus. J. Virol. 84 (22), 11670–11678 (Nov, PubMed PMID: 20844043. PubmedCentral PMCID: 2977875).
Lo, A.K., To, K.F., Lo, K.W., Lung, R.W., Hui, J.W., Liao, G., et al., 2007.Modulation of LMP1 pro-tein expression by EBV-encoded microRNAs. Proc. Natl. Acad. Sci. U. S. A. 104 (41),16164–16169 (Oct 9, PubMed PMID: 17911266. Pubmed Central PMCID: 2042179).
Lu, F., Weidmer, A., Liu, C.G., Volinia, S., Croce, C.M., Lieberman, P.M., 2008. Epstein–Barrvirus-induced miR-155 attenuates NF-kappaB signaling and stabilizes latent viruspersistence. J. Virol. 82 (21), 10436–10443 (Nov, PubMed PMID: 18753206. PubmedCentral PMCID: 2573162).
Lung, R.W., Tong, J.H., Sung, Y.M., Leung, P.S., Ng, D.C., Chau, S.L., et al., 2009.Modulation ofLMP2A expression by a newly identified Epstein–Barr virus-encoded microRNAmiR-BART22. Neoplasia 11 (11), 1174–1184 (Nov, PubMed PMID: 19881953. PubmedCentral PMCID: 2767219).
Marquitz, A.R., Mathur, A., Nam, C.S., Raab-Traub, N., 2011. The Epstein–Barr Virus BARTmicroRNAs target the pro-apoptotic protein Bim. Virology 412 (2), 392–400 (Apr10, PubMed PMID: 21333317. Pubmed Central PMCID: 3340891).
Navarro, A., Gaya, A., Martinez, A., Urbano-Ispizua, A., Pons, A., Balague, O., et al., 2008.MicroRNA expression profiling in classic Hodgkin lymphoma. Blood 111 (5),2825–2832 (Mar 1, PubMed PMID: 18089852).
Nishimura, M., Jung, E.J., Shah, M.Y., Lu, C., Spizzo, R., Shimizu, M., et al., 2013. Therapeuticsynergy between microRNA and siRNA in ovarian cancer treatment. Cancer Discov. 3(11), 1302–1315 (Sep 3. PubMed PMID: 24002999).
Ouyang, Q., Wagner, W.M., Walter, S., Muller, C.A., Wikby, A., Aubert, G., et al., 2003. Anage-related increase in the number of CD8+ T cells carrying receptors for animmunodominant Epstein–Barr virus (EBV) epitope is counteracted by a decreasedfrequency of their antigen-specific responsiveness. Mech. Ageing Dev. 124 (4),477–485 (Apr, PubMed PMID: 12714256).
Pritchard, C.C., Kroh, E., Wood, B., Arroyo, J.D., Dougherty, K.J., Miyaji, M.M., et al., 2012.Blood cell origin of circulating microRNAs: a cautionary note for cancer biomarkerstudies. Cancer Prev. Res. 5 (3), 492–497 (Mar, PubMed PMID: 22158052).
Rickinson, A.B., 2001. Epstein–Barr virus. In: Knipe, D.M., Howley, P.M., Griffin, D.E.,Martin, M.A., Lamb, R.A., Roizman, B. (Eds.), Field Virology. Lippincott Williams &Wilkins, Philadelphia, pp. 2575–2627.

582 A. Ferrajoli et al. / EBioMedicine 2 (2015) 572–582
Rossi, S., Shimizu, M., Barbarotto, E., Nicoloso, M.S., Dimitri, F., Sampath, D., et al., 2010.MicroRNA fingerprinting of CLL patients with chromosome 17p deletion identify amiR-21 score that stratifies early survival. Blood 116 (6), 945–952 (Aug 12, PMID:20393129).
Tarrand, J.J., Keating, M.J., Tsimberidou, A.M., O'Brien, S., LaSala, R.P., Han, X.Y., et al., 2010.Epstein–Barr virus latent membrane protein 1 mRNA is expressed in a significantproportion of patients with chronic lymphocytic leukemia. Cancer 116 (4),880–887 (Feb 15, PubMed PMID: 20052729).
Tsimberidou, A.M., Keating, M.J., Bueso-Ramos, C.E., Kurzrock, R., 2006. Epstein–Barr virusin patients with chronic lymphocytic leukemia: a pilot study. Leuk. Lymphoma 47(5), 827–836 (May, PubMed PMID: 16753866).
Vasilescu, C., Rossi, S., Shimizu, M., Tudor, S., Veronese, A., Ferracin, M., et al., 2009.MicroRNA fingerprints identify miR-150 as a plasma prognostic marker in patients
with sepsis. PLoS One 4 (10) (PubMed PMID: 19823581. Pubmed Central PMCID:2756627).
Xia, T., O'Hara, A., Araujo, I., Barreto, J., Carvalho, E., Sapucaia, J.B., et al., 2008. EBVmicroRNAs in primary lymphomas and targeting of CXCL-11 by ebv-mir-BHRF1-3.Cancer Res. 68 (5), 1436–1442 (Mar 1, PubMed PMID: 18316607. Pubmed CentralPMCID: 2855641).
Zuo, Z., Calin, G.A., de Paula, H.M., Medeiros, L.J., Fernandez, M.H., Shimizu, M., et al., 2011.Circulating microRNAs let-7a and miR-16 predict progression-free survival andoverall survival in patients with myelodysplastic syndrome. Blood 118 (2),413–415 (Jul 14, PubMed PMID: 21602527. Pubmed Central PMCID: 3293748).