Embed Size (px)
Citation preview
1
Evaluation of the Academic Progress of Children Served by the Cape York
Aboriginal Australian Academy
Bonnie Grossen, Ph.D.
Center for Applied Research in Education
Hillsboro, Oregon, USA
July 18, 2013
2
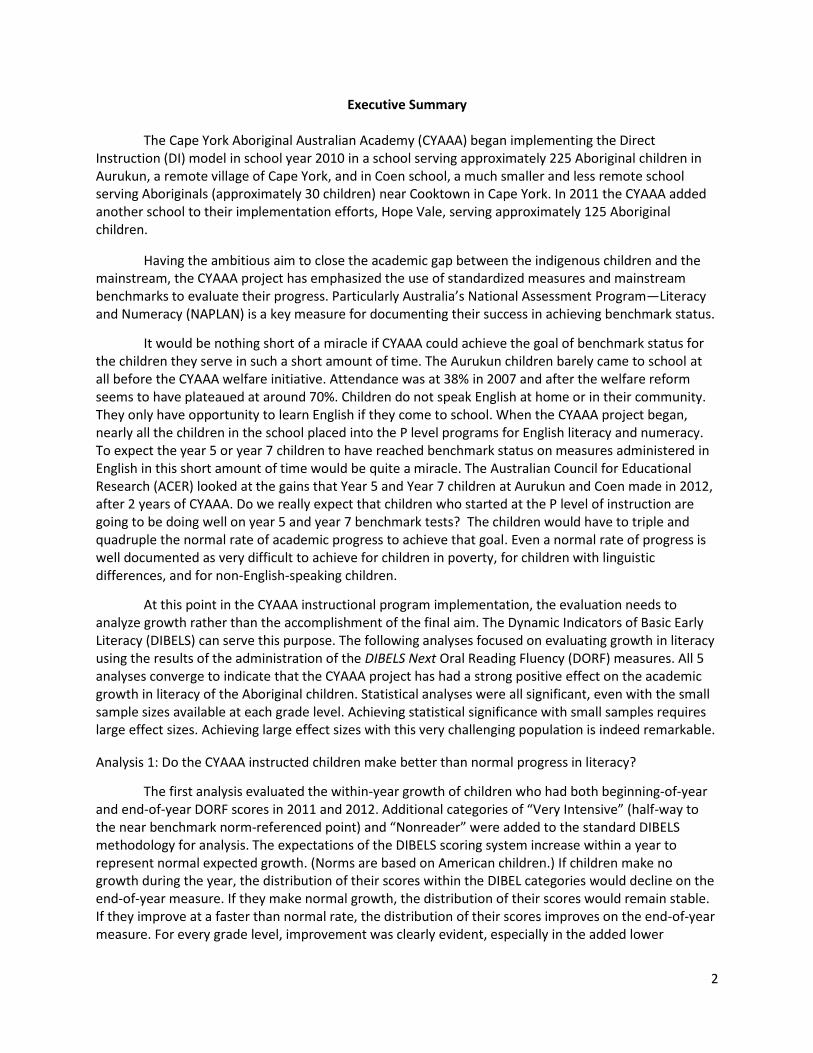
Executive Summary
The Cape York Aboriginal Australian Academy (CYAAA) began implementing the Direct Instruction (DI) model in school year 2010 in a school serving approximately 225 Aboriginal children in Aurukun, a remote village of Cape York, and in Coen school, a much smaller and less remote school serving Aboriginals (approximately 30 children) near Cooktown in Cape York. In 2011 the CYAAA added another school to their implementation efforts, Hope Vale, serving approximately 125 Aboriginal children.
Having the ambitious aim to close the academic gap between the indigenous children and the mainstream, the CYAAA project has emphasized the use of standardized measures and mainstream benchmarks to evaluate their progress. Particularly Australia’s National Assessment Program—Literacy and Numeracy (NAPLAN) is a key measure for documenting their success in achieving benchmark status.
It would be nothing short of a miracle if CYAAA could achieve the goal of benchmark status for the children they serve in such a short amount of time. The Aurukun children barely came to school at all before the CYAAA welfare initiative. Attendance was at 38% in 2007 and after the welfare reform seems to have plateaued at around 70%. Children do not speak English at home or in their community. They only have opportunity to learn English if they come to school. When the CYAAA project began, nearly all the children in the school placed into the P level programs for English literacy and numeracy. To expect the year 5 or year 7 children to have reached benchmark status on measures administered in English in this short amount of time would be quite a miracle. The Australian Council for Educational Research (ACER) looked at the gains that Year 5 and Year 7 children at Aurukun and Coen made in 2012, after 2 years of CYAAA. Do we really expect that children who started at the P level of instruction are going to be doing well on year 5 and year 7 benchmark tests? The children would have to triple and quadruple the normal rate of academic progress to achieve that goal. Even a normal rate of progress is well documented as very difficult to achieve for children in poverty, for children with linguistic differences, and for non-English-speaking children.
At this point in the CYAAA instructional program implementation, the evaluation needs to analyze growth rather than the accomplishment of the final aim. The Dynamic Indicators of Basic Early Literacy (DIBELS) can serve this purpose. The following analyses focused on evaluating growth in literacy using the results of the administration of the DIBELS Next Oral Reading Fluency (DORF) measures. All 5 analyses converge to indicate that the CYAAA project has had a strong positive effect on the academic growth in literacy of the Aboriginal children. Statistical analyses were all significant, even with the small sample sizes available at each grade level. Achieving statistical significance with small samples requires large effect sizes. Achieving large effect sizes with this very challenging population is indeed remarkable.
Analysis 1: Do the CYAAA instructed children make better than normal progress in literacy?
The first analysis evaluated the within-year growth of children who had both beginning-of-year and end-of-year DORF scores in 2011 and 2012. Additional categories of “Very Intensive” (half-way to the near benchmark norm-referenced point) and “Nonreader” were added to the standard DIBELS methodology for analysis. The expectations of the DIBELS scoring system increase within a year to represent normal expected growth. (Norms are based on American children.) If children make no growth during the year, the distribution of their scores within the DIBEL categories would decline on the end-of-year measure. If they make normal growth, the distribution of their scores would remain stable. If they improve at a faster than normal rate, the distribution of their scores improves on the end-of-year measure. For every grade level, improvement was clearly evident, especially in the added lower
3
categories. The 71% of the children who had both data points in 2011 and the 60% of the children who had both data points in 2012 were moving out of the illiterate categories into literacy at a faster than normal rate. (“Normal” defined as the rate at which American children grow. Australian norms for DIBELS have been developed, but they are more rigorous than the American norms. At this point, the lower level American norms seem sufficiently ambitious goals.)
Analysis 2: Do the CYAAA instructed children perform significantly better than a control group of non-CYAAA instructed children?
The second analysis compared the DORF scores from the end-of-year 2012, where only 5% of the enrolled children were missing, to a control group comprised of Aurukun children 2 cohorts prior (in 2010), and of Hope Vale children one cohort prior 2011. The control group theoretically was to represent children who had not received the CYAAA instructional model. (Coen was excluded because the children score so much higher overall than Aurukun and Hope Vale children, and the variability in the presence in the control or experimental group would skew the results. In technical terms, their inclusion would violate the homogeneity requirement for analysis of data from an unmatched sample.) In actuality, they had received some instruction. Each child’s first midyear score was taken for the control group. Then of the non-included children, each child’s first end-of-year score was taken. No beginning-of-year scores were included to avoid an unfair comparison of beginning-of-year to end-of-year performance. The results indicated that the CYAAA instructed children at the end of 2012 read significantly more correct words per minute with significantly better accuracy levels at all grade levels except grade 5. Analysis 3: Is the effectiveness of the CYAAA instructional program improving each year?
A third analysis compared the performance of the 2012 cohort to the 2011 cohort at each grade level using the DIBEL midpoint DORF scores. The midpoints had a lower level of missing data—within the range acceptable for analysis according to ACER’s rules. The results indicated that the CYAAA children performed significantly better on the DORF measure than the 2011 cohort. The CYAAA program improved its effectiveness, especially for grade 4 and grade 6 children. Analysis 4: What are the effect sizes (ES) of the growth in reading for CYAAA children?
A fourth analysis compared the children on the 2012 midyear DORF to the performance of the same children on the 2011 midyear DORF. Each child’s 2012 score was on passages that were one grade level more difficult than the passages they were tested on in 2011. So a score that was the same each year would already indicate growth. This analysis of the gain in correct words per minute for each year in school resulted in mostly very large effect sizes: Grade 2 in 2012, ES=.85; Grade 3, ES=.60; Grade 4, ES=.66; Grade 5, ES=.67, Grade 6, ES=.29, Grade 7, ES= .66. All grades except grade 6 in 2012 exceeded the ES of .40, Hattie’s criterion for an indicator of very significant growth. Analysis 5: How do we know the children are not just gaming the test—reading more words with less accuracy?
Using a more robust definition of literacy as reading at least 100 words per minute with at least 98% accuracy, a fifth analysis showed that the children’s improvements in reading including reading better, not just reading faster. In 2012, 30% of the children in grade 6 were already literate. Considering the starting point of the CYAAA project, this is excellent progress.
4
Introduction An evaluation of any effort to improve the schooling of seriously disadvantaged populations, such as the effort of the CYAAA to improve the education of the Australian Aboriginal children, is indeed very challenging. If the evaluators’ expectations are that the schools should be completely “fixed” in one or two years, then the evaluation is likely to find no positive effects, and by discouraging further effort cause the problem to never be solved. Turning low achieving schools around with effective models takes more than 2 years in inner city schools of America (Datnow & Stringfield, 2000). An evaluation risks prematurely discrediting a school reform initiative that could potentially provide a solution, if the evaluation does not carefully consider the sensitivity of the measurements. Mainstream standardized measures are usually not sensitive to growth in populations that perform far below the mean. Use of these measures is comparable to administering a calculus test to evaluate how well first grade children learned math. Perhaps the NAPLAN could be a sensitive measure. However, the restraints on the administration of the test result in so much missing data in populations where the attendance rates are extremely low. If the NAPLAN is ever to be useful for measuring the academic gains of the Aboriginal children, it would have to allow more opportunities to make-up the 3-day test than just one day for make-ups. These limited parameters for administration of the NAPLAN immediately preclude it as a measure sensitive to early achievements in changing the persistent factors of failure in Aboriginal schools. Curriculum-based-measurement (CBM) is more reliable and more sensitive to gains in low-level academic performance than mainstream standardized measures (American Psychological Association, 2004, Deno et al., 2002). For these reasons, CBM is widely used to evaluate the growth of special education children, where small samples sizes and low levels of performance are commonplace. Measures of oral reading fluency (ORF), for example, have been found to be sensitive to improvements in reading and are highly predictive of reading comprehension scores on more lengthy measures of reading comprehension (Pearce & Gale, 2009). The advantage of an ORF measure is that it is of short duration and can be highly reliable when administered with rigor. ORFs are individually administered so the factors of error related to group-administered tests are removed. (For example, a group-administered test may result in careless guesses or random responses, while an individually-administered test is more likely to solicit the child’s best effort.)
The Dynamic Indicators of Basic Early Literacy measures (DIBELS) are perhaps the most widely used, standardized CBM measures of reading (Hoffman, Jenkins, & Dunlap, 2009). DIBELS data may be collected over a defined window of time, each period occurring at the beginning, at the middle, and at the end of the year. Given the allowed longer and more flexible period of time to collect data at each data collection point, the DIBELS data are likely to have less missing data than the NAPLAN. If other conditions are met, the DIBELS data could be quite informative regarding the initial success or failure of the CYAAA project initiatives. In the interest of detecting the potential of various possible initiatives to improve the learning of vulnerable populations, we are obligated to identify methods that might be sensitive to learning progress these children might make.
The purpose of this analysis is to evaluate the DIBELS data in order to gain any insights these
data may offer in regard to the academic effects of the CYAAA project. The DIBELS were designed to be used for progress monitoring. The CYAAA project proposed to use them for program evaluation. The following analysis will evaluate whether this gap can be bridged and report the results of such an
5
analysis of the DIBELS data. This analysis will be made in the context of the limitations of the data collection procedures and the limitations of the measures themselves.
Background
Aurukun and Coen Schools began implementing the Direct Instruction (DI) Model in 2010. Hope Vale began implementing in 2011. Aurukun School is located in a very remote Aboriginal community in the far north of the Cape York Peninsula. The community still uses the Aboriginal language and the children come to school speaking no English at all. Attendance has always been extremely low at Aurukun, with many enrolled children having 0% attendance. The average attendance has been as low as 38%. With the initiation of the Cape York Project’s welfare reform, attendance has improved, but chronic absence is still a problem with many of the enrolled children. Hope Vale and Coen Schools are located near Cooktown and are less remote. The Aboriginal language of these communities is declining with the higher levels of interaction with the English-speaking world that are occurring. Children are beginning to know more English than they know of their Aboriginal language. Children come to school speaking English, but not fluently.
The implementation has been difficult, especially at Aurukun. Qualified teachers are difficult to
find. Most come from far-away cities for a 2-year period only and then return to their place of origin. The constant turnover in teachers requires constant professional development.
Method
DIBELS Next Measures The DIBELS were designed to use for progress monitoring. As such, the measures are reliable within one grade level. Each DIBEL Oral Reading Fluency (DORF) measure consists of 3 passages that children read for 1 minute. The median rate and accuracy score is used as the individual’s score for that testing occasion. A different set of passages are used for each grade level and for each of 3 testing occasions for grades 2 through 6. (Grade 1 DORFs are administered only midyear and end of year.) The passages for each grade level are set at the normal difficulty level for the end of that grade level, so the passages for each successive grade level increase in difficulty. Within each grade level the passages used on the 3 occasions are equal in difficulty, all at the level of the end of the specific grade. Each rate score (words correct per minute) is used to predict future success in reading using 2 cut points which establish 3 categories of risk: no risk of failure (at benchmark), some risk of future failure (requiring only strategic intervention), and at risk for future failure in literacy (in need of intensive intervention) (Galletly & Knight, 2006). As a progress monitoring tool, DIBELS identifies the at-risk children so that the school can work more intensely with those children, providing more time and more individualized instruction. With this more intensive instruction, the at-risk child may learn at a faster than normal rate and move out of the at-risk category. A child who makes normal progress would remain in the same risk category. The children in the at-risk category are defined as in need of intensive intervention, so this category of children is often labeled by the action required, “intensive,” rather than by the passive category name, “at risk.”
The cut points change from beginning of the year to the end of the year to reflect the expected growth rate, that is, the beginning-of-year passage uses a much lower criterion for categorizing a child as intensive than the end-of-year passage does. The cut points are normed on American English-speaking children. These norms are especially inappropriate for non-English speaking Aboriginal children for
6
whom the language of instruction is English. Local norms should be used to evaluate this population. Learning English in addition to learning to read presents additional challenges.
I use the DIBELnext cut points in this first analysis. However, to make the DIBELS measures more sensitive to growth in the lower ranges of performance, I inserted more cut points in the “intensive” (i.e., ”at-risk”) category. I added a category of “Nonreader.” Children in Grades 2 and 3 with a score of less than 5 correct words read per minute, and children in grades 4 and up with a score of less than 10 correct words per minute were identified as “Nonreaders.” In the administration of DIBELS, any child who reads less than 10 words correctly on the first passage, is discontinued without being required to read the additional 2 passages. In this case, only the score on the one passage is recorded, rather the median score from the 3 passages. I used the criterion of less than 5 correct words for the Nonreader category for grades 2 and 3 because so many children would have placed in this category if I had consistently used the less-than-10-words-correct cut point for all grades. I also added a second category of “Very Intensive,” for which the number of correct words required to score in the at-risk category was cut in half. So the children categorized as “Very Intensive” are halfway to exiting out of the at-risk category as defined by the American English-speaking norming sample.
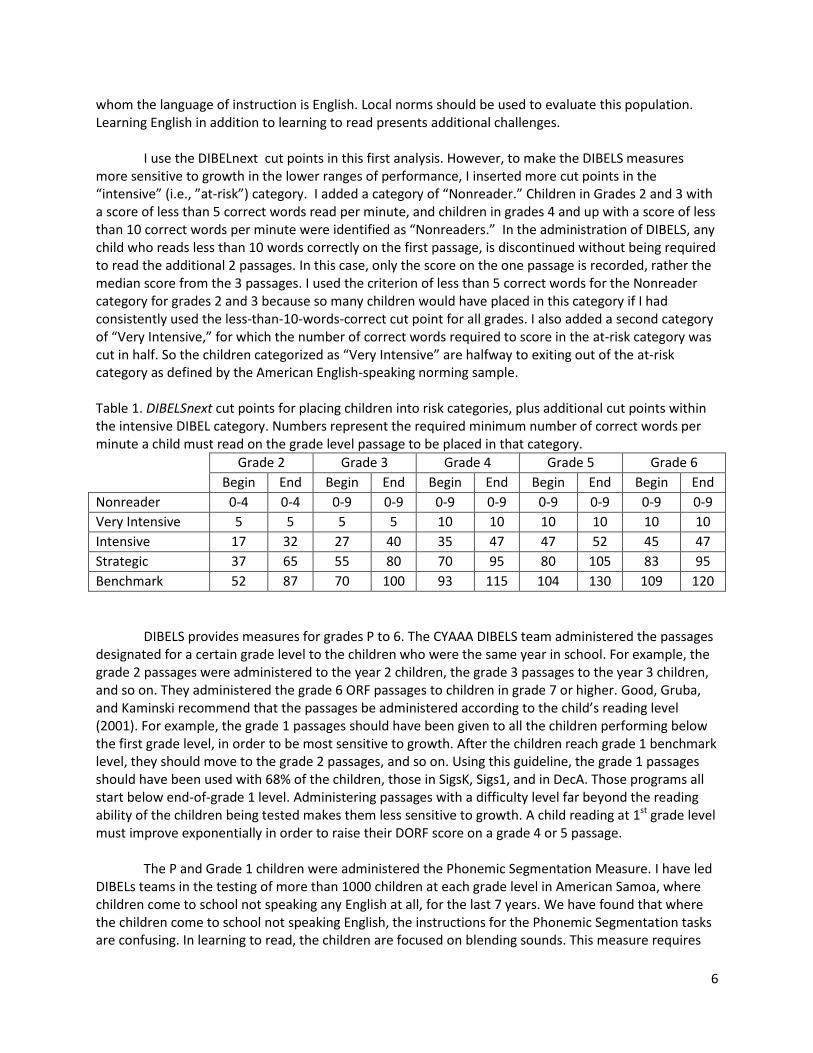
Table 1. DIBELSnext cut points for placing children into risk categories, plus additional cut points within the intensive DIBEL category. Numbers represent the required minimum number of correct words per minute a child must read on the grade level passage to be placed in that category.
Grade 2 Grade 3 Grade 4 Grade 5 Grade 6
Begin End Begin End Begin End Begin End Begin End
Nonreader 0-4 0-4 0-9 0-9 0-9 0-9 0-9 0-9 0-9 0-9
Very Intensive 5 5 5 5 10 10 10 10 10 10
Intensive 17 32 27 40 35 47 47 52 45 47
Strategic 37 65 55 80 70 95 80 105 83 95
Benchmark 52 87 70 100 93 115 104 130 109 120
DIBELS provides measures for grades P to 6. The CYAAA DIBELS team administered the passages
designated for a certain grade level to the children who were the same year in school. For example, the grade 2 passages were administered to the year 2 children, the grade 3 passages to the year 3 children, and so on. They administered the grade 6 ORF passages to children in grade 7 or higher. Good, Gruba, and Kaminski recommend that the passages be administered according to the child’s reading level (2001). For example, the grade 1 passages should have been given to all the children performing below the first grade level, in order to be most sensitive to growth. After the children reach grade 1 benchmark level, they should move to the grade 2 passages, and so on. Using this guideline, the grade 1 passages should have been used with 68% of the children, those in SigsK, Sigs1, and in DecA. Those programs all start below end-of-grade 1 level. Administering passages with a difficulty level far beyond the reading ability of the children being tested makes them less sensitive to growth. A child reading at 1st grade level must improve exponentially in order to raise their DORF score on a grade 4 or 5 passage.
The P and Grade 1 children were administered the Phonemic Segmentation Measure. I have led
DIBELs teams in the testing of more than 1000 children at each grade level in American Samoa, where children come to school not speaking any English at all, for the last 7 years. We have found that where the children come to school not speaking English, the instructions for the Phonemic Segmentation tasks are confusing. In learning to read, the children are focused on blending sounds. This measure requires
7
them to segment, a task they may have never done and tend not to do given instructions they do not understand. We have eliminated the Phonemic Segmentation Measure from our DIBELS assessment in American Samoa for this reason: Low scores are generally a result of not understanding the task rather than not being able to do the task. So I omitted the phonemic segmentation measure from my analyses.
The DAZE measure, which is new to the DIBELS Next package and was not part of the original
DIBELS, also has problems. In my analyses of the readability of the texts, I have found that the readability levels vary greatly and are generally several grade levels more difficult than the level designated for administration. Only 3 responses are available for each item in the DAZE, so it is rare to get scores that are better than chance with English learners. Also, we have found the paper version very difficult to administer reliably. The DAZE is timed for 3 minutes. Given that the administration time is so short, it is difficult to control this perfectly in administering the paper version. There is a computer-administered version available, which would control the time perfectly for each individual, but CYAAA did not use this. For these reasons, I am not analyzing the DAZE scores.
The several problems noted with the administration of the DORF measure of rate and accuracy
are these: 1. The norms for determining risk category are based on American English-speaking children are
inappropriate for evaluating the progress of non-English-speaking Aboriginal children. In the analyses below, I will use additional cut points in the intensive category to counter this problem.
2. The graded passages should be administered to the children reading at that grade level, rather than to the children who are in that year of school to be more sensitive to growth. Because 74% of the children placed initially in instruction that was below end-of-grade-1 level, most of the children read passages way beyond the reach of their growth in one year. This cannot be changed. But it should be noted that the bias resulting from administering the passages to children according to their year in school rather than their reading level, is a bias against showing CYAAA program progress.
3. The Phoneme Segmentation Measure and the DAZE measure are very unreliable for this population. So they have been eliminated from the analyses.
Administration Procedures When used for progress monitoring, the DIBELS measures are usually administered by the
child’s classroom teacher. The CYAAA project planned to use them for evaluation and provided for a team of central office people to administer the DIBELS in the 3 community schools. In no case did a teacher administer the DIBELS to his or her own students. The ACER report classifies the administration of the DIBELs as “internal,” implying potential bias and unreliability. However, the central office of CYAAA had rigorous procedures in place for ensuring reliability in administering the DIBELs. Most of the team consisted of the same persons. Procedures for achieving high inter-rater reliability were firmly in place. On each testing occasion, two persons on the team evaluated several children at the same time to achieve and maintain high reliability across team members before team members administered the tests independently. From school-to-school, an additional person might assist the team. New team members were only allowed to work independently until after their scoring was reliable with the lead team member. Scored protocols were checked by a second person for accuracy. Data entry was also double-checked. The normal internal administration of DIBELS was never used. The administration should be classified as “external.”
8
Missing data. A very important factor in determining how to deal with missing data is how the measures were administered. Was every effort made to include every child? Or were children intentionally not tested because the evaluator knew they would not score well. Or did someone eliminate low scores from the data set? After interviewing the DIBELS assessment team, I am convinced that every effort was made to get scores from as many children as possible within the testing window. Travel from school to school is difficult though in the Cape York Peninsula. It takes some time to get the best routines figured out for obtaining the most data. Extending the testing window beyond a limited amount of time creates other problems, when some children have had more instructional time than others. Most importantly, the DIBELS assessment team was independent, having no knowledge of how well a child was doing in class. In no case was the child’s teacher on the team.
As a rule, the ACER group does not evaluate a data set if more than 20% of the data are missing.
In normal school settings, low response rates would be a red flag. However, in these schools, where attendance rates are only 70%, response rates of 80% or higher are going to be difficult to obtain. In spite of the difficulties in testing children with chronic attendance problems, the response rates for the DIBELS measures in 2011 and 2012 were quite high, especially the end-of-year measure for 2012, where the missing data was less than 5%. The beginning-of-year measure in 2012 was compromised somewhat by a lower response rate from Aurukun. Analyses Using DIBELS Methodology
The DIBELS methodology allows a comparison of the reading growth of one or more children to
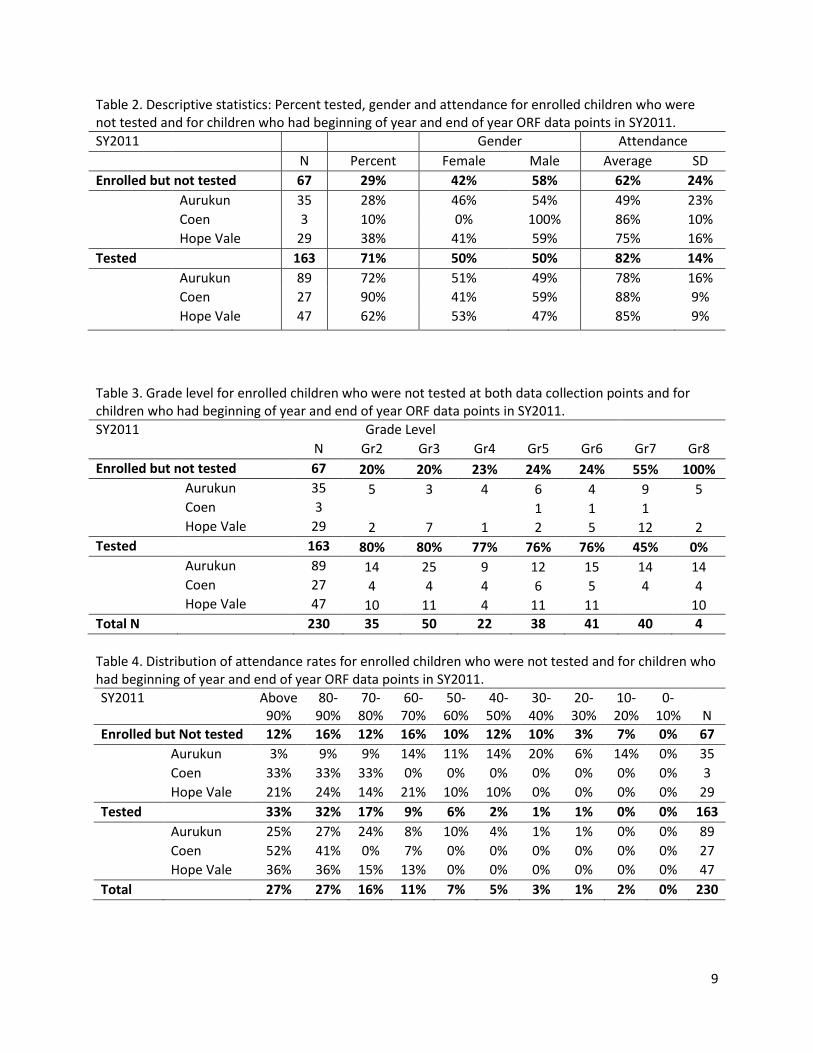
the expected growth rate derived from the DIBEL norming sample. To compare the CYAAA project children with the expected growth norms provided by the DIBEL cut points, I included only children with a score at both the beginning of the year and the end of the year in 2011 and another set of children with a score at the beginning and end of 2012. The midpoint data were excluded to avoid eliminating children for missing data. The midpoint offers little relevant information and only increases error with the small samples involved in these evaluations when evaluating within-year growth. Grade 1 children were also excluded from these analyses because the only beginning-of-year measure was the Phonemic Segmentation Measure, which was eliminated because of its inappropriateness for non-English-speaking children. Including only children with a score at the beginning and at the end of one year allows a more valid evaluation of their growth using the DIBELS methodology. Tables 2 to 4 present descriptive statistics for children who were enrolled during the year but were not tested at both points, and children who were tested. Tables 5 to 7 show the same for SY2012.
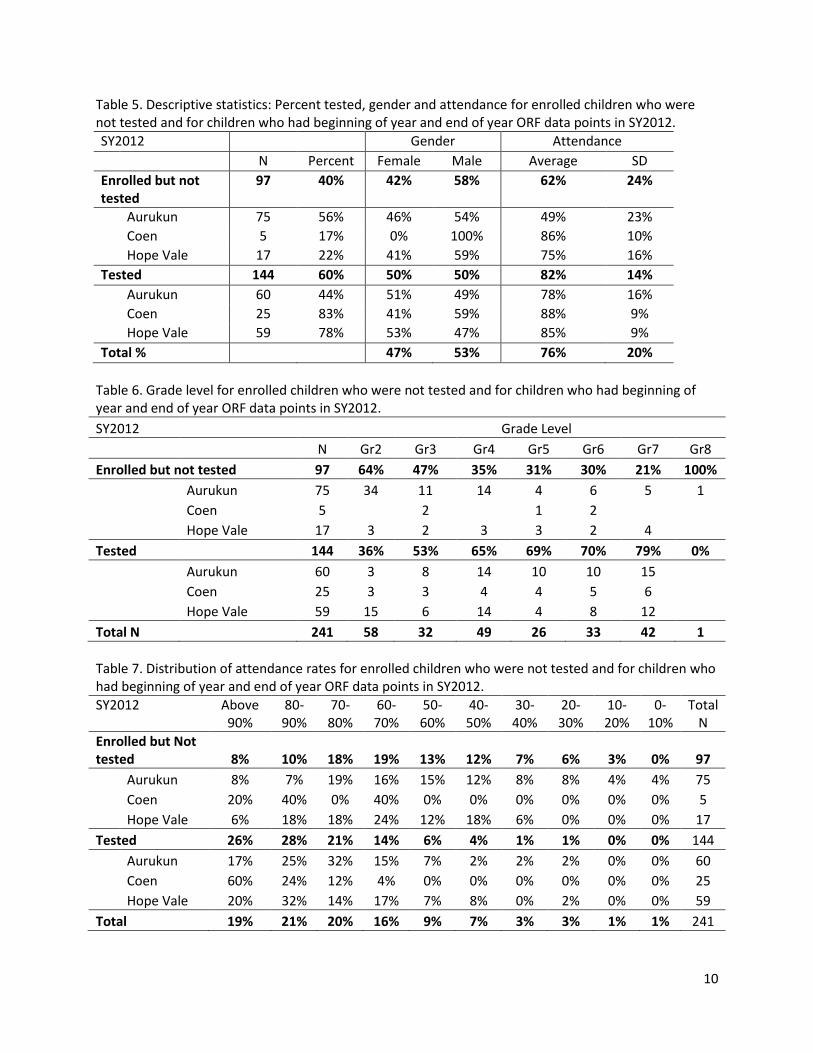
In SY2011, 71% of the children were tested on both beginning and end-of-year measures. Hope
Vale had a somewhat lower percentage of children participate than did Aurukun and Coen. In 2012, only 60% were tested on both occasions. Particularly at Aurukun most 2nd graders were missing the beginning of year scores in 2012. Given the mobility of the populations at these schools, the proportion of children with a score at both the beginning and end of year was quite high for Aurukun and Coen in 2011, and for Hope Vale and Coen in 2012. In 2011, grade 7 representation is low. In 2012, grade 2 representation is low. Given the effort the DIBEL assessment team makes to get as many students as possible, this sample is representative of the children who come to school. No one expects children to learn if they don’t come to school.
9
Table 2. Descriptive statistics: Percent tested, gender and attendance for enrolled children who were not tested and for children who had beginning of year and end of year ORF data points in SY2011.
SY2011 Gender Attendance
N Percent Female Male Average SD
Enrolled but not tested 67 29% 42% 58% 62% 24%
Aurukun 35 28% 46% 54% 49% 23%
Coen 3 10% 0% 100% 86% 10%
Hope Vale 29 38% 41% 59% 75% 16%
Tested 163 71% 50% 50% 82% 14%
Aurukun 89 72% 51% 49% 78% 16%
Coen 27 90% 41% 59% 88% 9%
Hope Vale 47 62% 53% 47% 85% 9%
Table 3. Grade level for enrolled children who were not tested at both data collection points and for children who had beginning of year and end of year ORF data points in SY2011.
SY2011 Grade Level
N Gr2 Gr3 Gr4 Gr5 Gr6 Gr7 Gr8
Enrolled but not tested 67 20% 20% 23% 24% 24% 55% 100%
Aurukun 35 5 3 4 6 4 9 5 Coen 3 1 1 1 Hope Vale 29 2 7 1 2 5 12 2
Tested 163 80% 80% 77% 76% 76% 45% 0%
Aurukun 89 14 25 9 12 15 14 14 Coen 27 4 4 4 6 5 4 4 Hope Vale 47 10 11 4 11 11 10
Total N 230 35 50 22 38 41 40 4
Table 4. Distribution of attendance rates for enrolled children who were not tested and for children who had beginning of year and end of year ORF data points in SY2011.
SY2011 Above 90%
80-90%
70-80%
60-70%
50-60%
40-50%
30-40%
20-30%
10-20%
0-10%
N
Enrolled but Not tested 12% 16% 12% 16% 10% 12% 10% 3% 7% 0% 67
Aurukun 3% 9% 9% 14% 11% 14% 20% 6% 14% 0% 35
Coen 33% 33% 33% 0% 0% 0% 0% 0% 0% 0% 3
Hope Vale 21% 24% 14% 21% 10% 10% 0% 0% 0% 0% 29
Tested 33% 32% 17% 9% 6% 2% 1% 1% 0% 0% 163
Aurukun 25% 27% 24% 8% 10% 4% 1% 1% 0% 0% 89
Coen 52% 41% 0% 7% 0% 0% 0% 0% 0% 0% 27
Hope Vale 36% 36% 15% 13% 0% 0% 0% 0% 0% 0% 47
Total 27% 27% 16% 11% 7% 5% 3% 1% 2% 0% 230
10
Table 5. Descriptive statistics: Percent tested, gender and attendance for enrolled children who were not tested and for children who had beginning of year and end of year ORF data points in SY2012.
SY2012 Gender Attendance
N Percent Female Male Average SD
Enrolled but not tested
97 40% 42% 58% 62% 24%
Aurukun 75 56% 46% 54% 49% 23%
Coen 5 17% 0% 100% 86% 10%
Hope Vale 17 22% 41% 59% 75% 16%
Tested 144 60% 50% 50% 82% 14%
Aurukun 60 44% 51% 49% 78% 16%
Coen 25 83% 41% 59% 88% 9%
Hope Vale 59 78% 53% 47% 85% 9%
Total % 47% 53% 76% 20%
Table 6. Grade level for enrolled children who were not tested and for children who had beginning of year and end of year ORF data points in SY2012.
SY2012
Grade Level
N Gr2 Gr3 Gr4 Gr5 Gr6 Gr7 Gr8
Enrolled but not tested 97 64% 47% 35% 31% 30% 21% 100%
Aurukun 75 34 11 14 4 6 5 1
Coen 5
2
1 2
Hope Vale 17 3 2 3 3 2 4
Tested
144 36% 53% 65% 69% 70% 79% 0%
Aurukun 60 3 8 14 10 10 15
Coen 25 3 3 4 4 5 6
Hope Vale 59 15 6 14 4 8 12
Total N
241 58 32 49 26 33 42 1
Table 7. Distribution of attendance rates for enrolled children who were not tested and for children who had beginning of year and end of year ORF data points in SY2012.
SY2012 Above 90%
80-90%
70-80%
60-70%
50-60%
40-50%
30-40%
20-30%
10-20%
0-10%
Total N
Enrolled but Not tested 8% 10% 18% 19% 13% 12% 7% 6% 3% 0% 97
Aurukun 8% 7% 19% 16% 15% 12% 8% 8% 4% 4% 75
Coen 20% 40% 0% 40% 0% 0% 0% 0% 0% 0% 5
Hope Vale 6% 18% 18% 24% 12% 18% 6% 0% 0% 0% 17
Tested 26% 28% 21% 14% 6% 4% 1% 1% 0% 0% 144
Aurukun 17% 25% 32% 15% 7% 2% 2% 2% 0% 0% 60
Coen 60% 24% 12% 4% 0% 0% 0% 0% 0% 0% 25
Hope Vale 20% 32% 14% 17% 7% 8% 0% 2% 0% 0% 59
Total 19% 21% 20% 16% 9% 7% 3% 3% 1% 1% 241
11
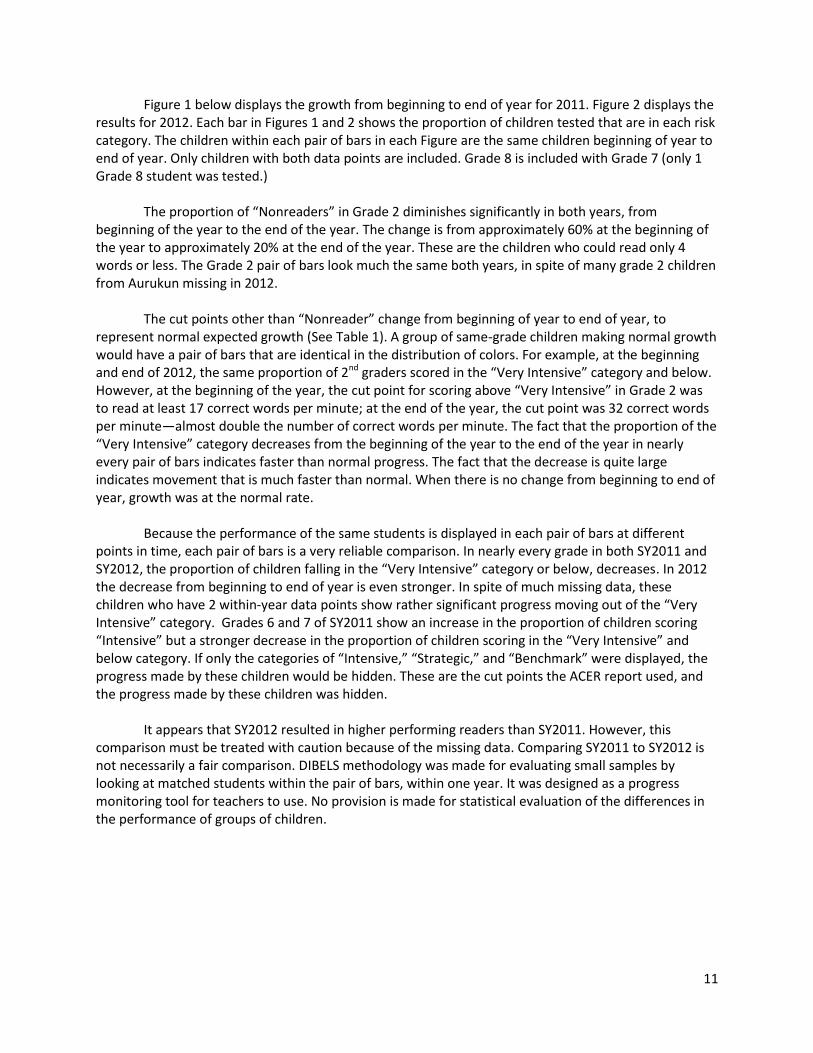
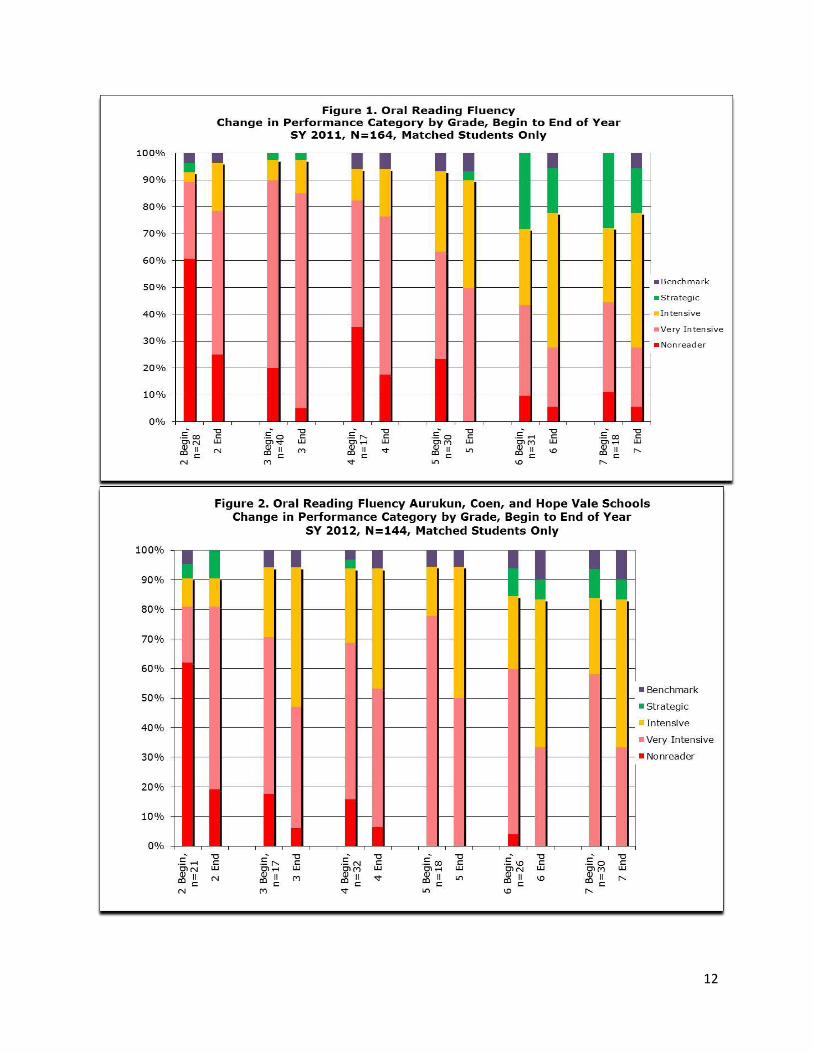
Figure 1 below displays the growth from beginning to end of year for 2011. Figure 2 displays the results for 2012. Each bar in Figures 1 and 2 shows the proportion of children tested that are in each risk category. The children within each pair of bars in each Figure are the same children beginning of year to end of year. Only children with both data points are included. Grade 8 is included with Grade 7 (only 1 Grade 8 student was tested.)
The proportion of “Nonreaders” in Grade 2 diminishes significantly in both years, from
beginning of the year to the end of the year. The change is from approximately 60% at the beginning of the year to approximately 20% at the end of the year. These are the children who could read only 4 words or less. The Grade 2 pair of bars look much the same both years, in spite of many grade 2 children from Aurukun missing in 2012.
The cut points other than “Nonreader” change from beginning of year to end of year, to
represent normal expected growth (See Table 1). A group of same-grade children making normal growth would have a pair of bars that are identical in the distribution of colors. For example, at the beginning and end of 2012, the same proportion of 2nd graders scored in the “Very Intensive” category and below. However, at the beginning of the year, the cut point for scoring above “Very Intensive” in Grade 2 was to read at least 17 correct words per minute; at the end of the year, the cut point was 32 correct words per minute—almost double the number of correct words per minute. The fact that the proportion of the “Very Intensive” category decreases from the beginning of the year to the end of the year in nearly every pair of bars indicates faster than normal progress. The fact that the decrease is quite large indicates movement that is much faster than normal. When there is no change from beginning to end of year, growth was at the normal rate.
Because the performance of the same students is displayed in each pair of bars at different
points in time, each pair of bars is a very reliable comparison. In nearly every grade in both SY2011 and SY2012, the proportion of children falling in the “Very Intensive” category or below, decreases. In 2012 the decrease from beginning to end of year is even stronger. In spite of much missing data, these children who have 2 within-year data points show rather significant progress moving out of the “Very Intensive” category. Grades 6 and 7 of SY2011 show an increase in the proportion of children scoring “Intensive” but a stronger decrease in the proportion of children scoring in the “Very Intensive” and below category. If only the categories of “Intensive,” “Strategic,” and “Benchmark” were displayed, the progress made by these children would be hidden. These are the cut points the ACER report used, and the progress made by these children was hidden.
It appears that SY2012 resulted in higher performing readers than SY2011. However, this
comparison must be treated with caution because of the missing data. Comparing SY2011 to SY2012 is not necessarily a fair comparison. DIBELS methodology was made for evaluating small samples by looking at matched students within the pair of bars, within one year. It was designed as a progress monitoring tool for teachers to use. No provision is made for statistical evaluation of the differences in the performance of groups of children.
12
13
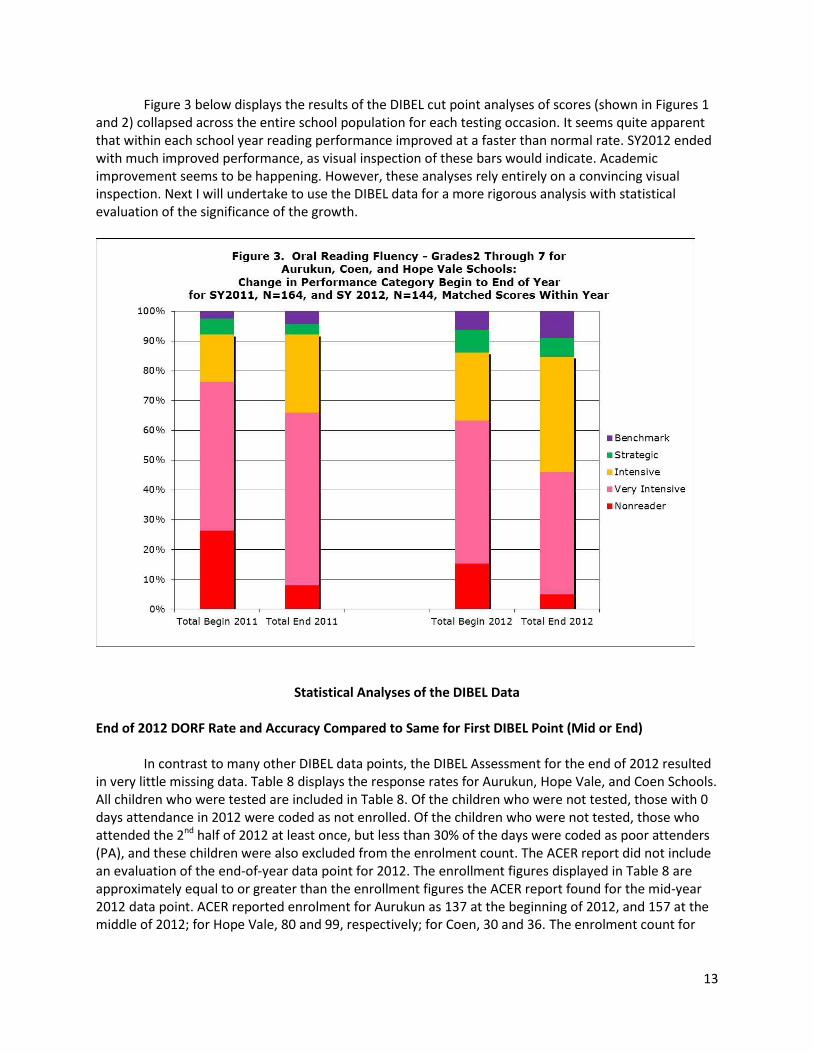
Figure 3 below displays the results of the DIBEL cut point analyses of scores (shown in Figures 1 and 2) collapsed across the entire school population for each testing occasion. It seems quite apparent that within each school year reading performance improved at a faster than normal rate. SY2012 ended with much improved performance, as visual inspection of these bars would indicate. Academic improvement seems to be happening. However, these analyses rely entirely on a convincing visual inspection. Next I will undertake to use the DIBEL data for a more rigorous analysis with statistical evaluation of the significance of the growth.
Statistical Analyses of the DIBEL Data
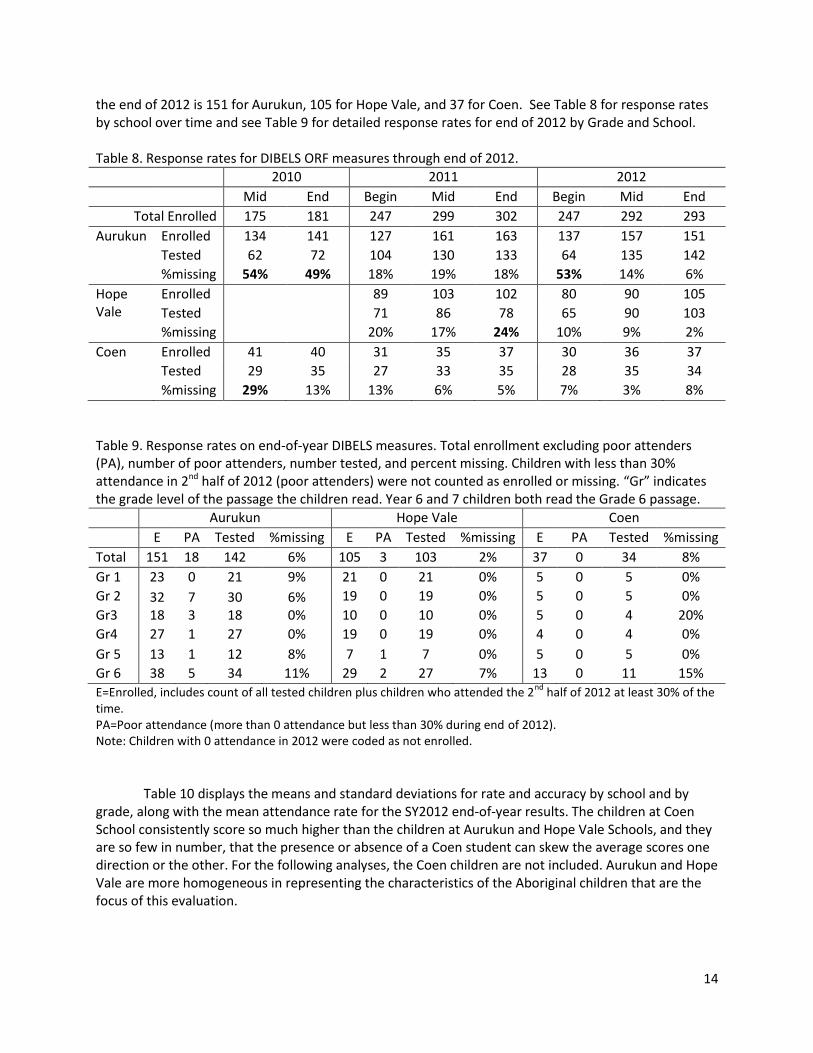
End of 2012 DORF Rate and Accuracy Compared to Same for First DIBEL Point (Mid or End) In contrast to many other DIBEL data points, the DIBEL Assessment for the end of 2012 resulted in very little missing data. Table 8 displays the response rates for Aurukun, Hope Vale, and Coen Schools. All children who were tested are included in Table 8. Of the children who were not tested, those with 0 days attendance in 2012 were coded as not enrolled. Of the children who were not tested, those who attended the 2nd half of 2012 at least once, but less than 30% of the days were coded as poor attenders (PA), and these children were also excluded from the enrolment count. The ACER report did not include an evaluation of the end-of-year data point for 2012. The enrollment figures displayed in Table 8 are approximately equal to or greater than the enrollment figures the ACER report found for the mid-year 2012 data point. ACER reported enrolment for Aurukun as 137 at the beginning of 2012, and 157 at the middle of 2012; for Hope Vale, 80 and 99, respectively; for Coen, 30 and 36. The enrolment count for
14
the end of 2012 is 151 for Aurukun, 105 for Hope Vale, and 37 for Coen. See Table 8 for response rates by school over time and see Table 9 for detailed response rates for end of 2012 by Grade and School. Table 8. Response rates for DIBELS ORF measures through end of 2012.
2010 2011 2012
Mid End Begin Mid End Begin Mid End
Total Enrolled 175 181 247 299 302 247 292 293
Aurukun Enrolled 134 141 127 161 163 137 157 151
Tested 62 72 104 130 133 64 135 142
%missing 54% 49% 18% 19% 18% 53% 14% 6%
Hope Vale
Enrolled 89 103 102 80 90 105
Tested 71 86 78 65 90 103
%missing 20% 17% 24% 10% 9% 2%
Coen Enrolled 41 40 31 35 37 30 36 37
Tested 29 35 27 33 35 28 35 34
%missing 29% 13% 13% 6% 5% 7% 3% 8%
Table 9. Response rates on end-of-year DIBELS measures. Total enrollment excluding poor attenders (PA), number of poor attenders, number tested, and percent missing. Children with less than 30% attendance in 2nd half of 2012 (poor attenders) were not counted as enrolled or missing. “Gr” indicates the grade level of the passage the children read. Year 6 and 7 children both read the Grade 6 passage.
Aurukun Hope Vale Coen
E PA Tested %missing E PA Tested %missing E PA Tested %missing
Total 151 18 142 6% 105 3 103 2% 37 0 34 8%
Gr 1 23 0 21 9% 21 0 21 0% 5 0 5 0%
Gr 2 32 7 30 6% 19 0 19 0% 5 0 5 0%
Gr3 18 3 18 0% 10 0 10 0% 5 0 4 20%
Gr4 27 1 27 0% 19 0 19 0% 4 0 4 0%
Gr 5 13 1 12 8% 7 1 7 0% 5 0 5 0%
Gr 6 38 5 34 11% 29 2 27 7% 13 0 11 15%
E=Enrolled, includes count of all tested children plus children who attended the 2nd
half of 2012 at least 30% of the time. PA=Poor attendance (more than 0 attendance but less than 30% during end of 2012). Note: Children with 0 attendance in 2012 were coded as not enrolled.
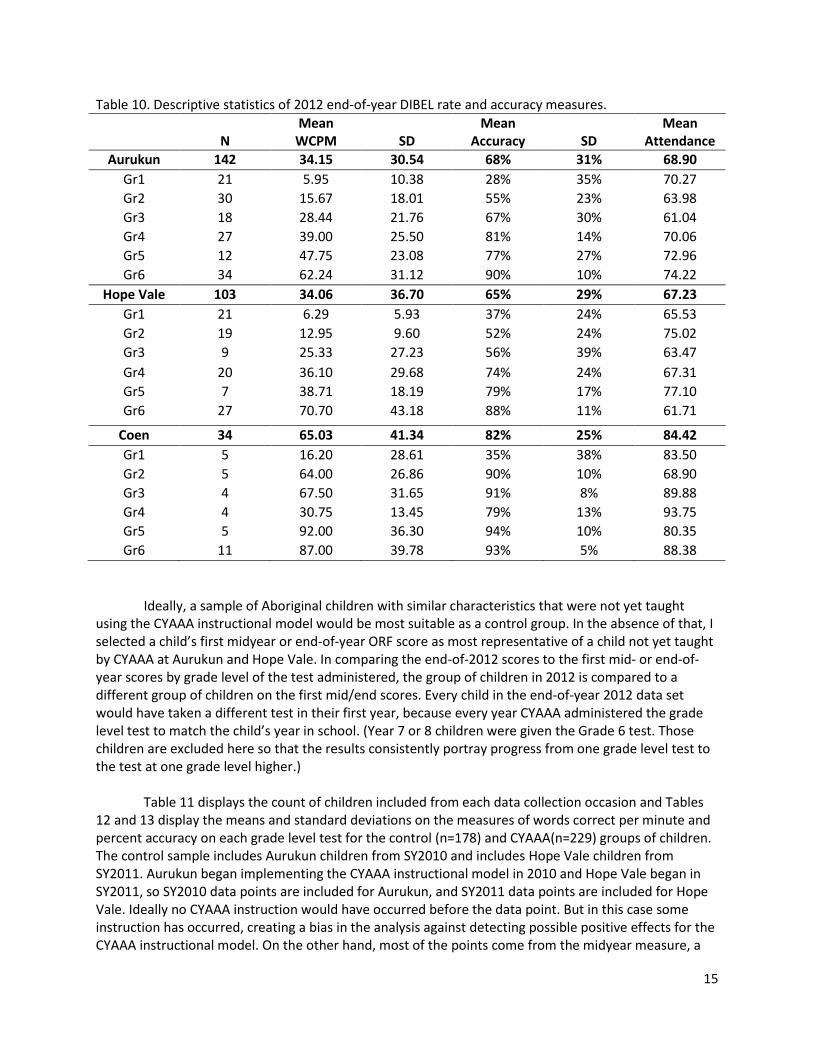
Table 10 displays the means and standard deviations for rate and accuracy by school and by grade, along with the mean attendance rate for the SY2012 end-of-year results. The children at Coen School consistently score so much higher than the children at Aurukun and Hope Vale Schools, and they are so few in number, that the presence or absence of a Coen student can skew the average scores one direction or the other. For the following analyses, the Coen children are not included. Aurukun and Hope Vale are more homogeneous in representing the characteristics of the Aboriginal children that are the focus of this evaluation.
15
Table 10. Descriptive statistics of 2012 end-of-year DIBEL rate and accuracy measures.
N
Mean WCPM SD
Mean Accuracy SD
Mean Attendance
Aurukun 142 34.15 30.54 68% 31% 68.90
Gr1 21 5.95 10.38 28% 35% 70.27
Gr2 30 15.67 18.01 55% 23% 63.98
Gr3 18 28.44 21.76 67% 30% 61.04
Gr4 27 39.00 25.50 81% 14% 70.06
Gr5 12 47.75 23.08 77% 27% 72.96
Gr6 34 62.24 31.12 90% 10% 74.22
Hope Vale 103 34.06 36.70 65% 29% 67.23
Gr1 21 6.29 5.93 37% 24% 65.53
Gr2 19 12.95 9.60 52% 24% 75.02
Gr3 9 25.33 27.23 56% 39% 63.47
Gr4 20 36.10 29.68 74% 24% 67.31
Gr5 7 38.71 18.19 79% 17% 77.10
Gr6 27 70.70 43.18 88% 11% 61.71
Coen 34 65.03 41.34 82% 25% 84.42
Gr1 5 16.20 28.61 35% 38% 83.50
Gr2 5 64.00 26.86 90% 10% 68.90
Gr3 4 67.50 31.65 91% 8% 89.88
Gr4 4 30.75 13.45 79% 13% 93.75
Gr5 5 92.00 36.30 94% 10% 80.35
Gr6 11 87.00 39.78 93% 5% 88.38
Ideally, a sample of Aboriginal children with similar characteristics that were not yet taught using the CYAAA instructional model would be most suitable as a control group. In the absence of that, I selected a child’s first midyear or end-of-year ORF score as most representative of a child not yet taught by CYAAA at Aurukun and Hope Vale. In comparing the end-of-2012 scores to the first mid- or end-of-year scores by grade level of the test administered, the group of children in 2012 is compared to a different group of children on the first mid/end scores. Every child in the end-of-year 2012 data set would have taken a different test in their first year, because every year CYAAA administered the grade level test to match the child’s year in school. (Year 7 or 8 children were given the Grade 6 test. Those children are excluded here so that the results consistently portray progress from one grade level test to the test at one grade level higher.) Table 11 displays the count of children included from each data collection occasion and Tables 12 and 13 display the means and standard deviations on the measures of words correct per minute and percent accuracy on each grade level test for the control (n=178) and CYAAA(n=229) groups of children. The control sample includes Aurukun children from SY2010 and includes Hope Vale children from SY2011. Aurukun began implementing the CYAAA instructional model in 2010 and Hope Vale began in SY2011, so SY2010 data points are included for Aurukun, and SY2011 data points are included for Hope Vale. Ideally no CYAAA instruction would have occurred before the data point. But in this case some instruction has occurred, creating a bias in the analysis against detecting possible positive effects for the CYAAA instructional model. On the other hand, most of the points come from the midyear measure, a
16
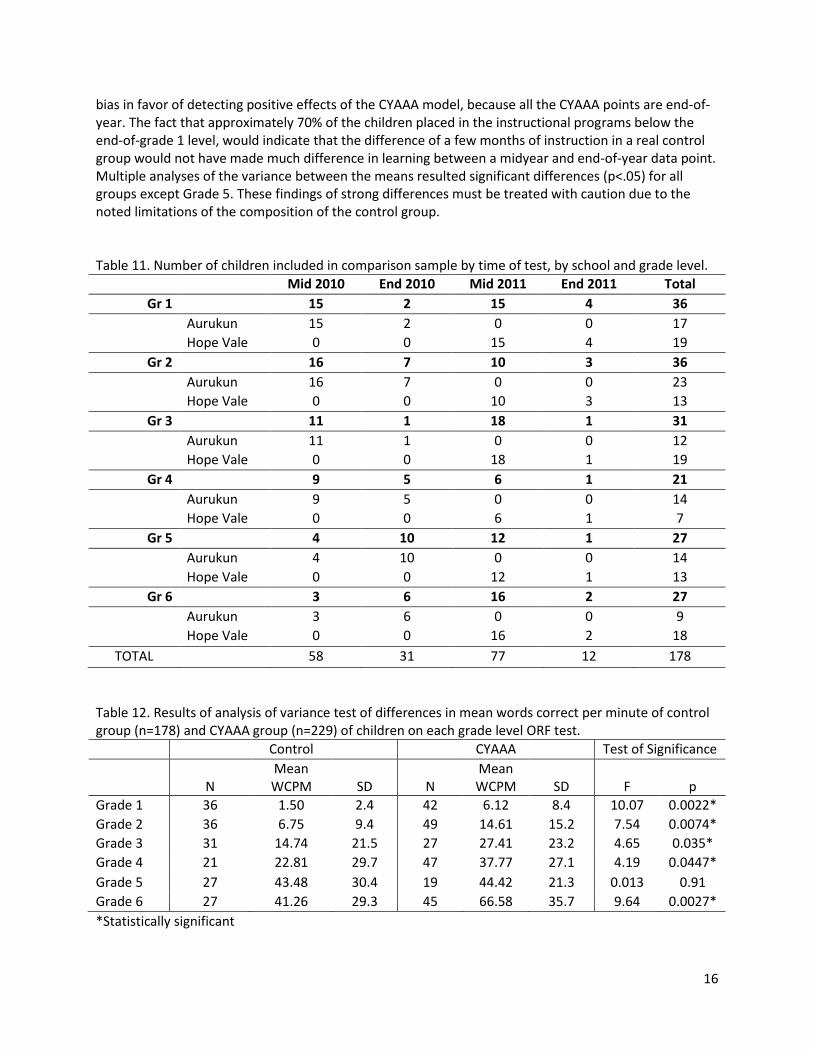
bias in favor of detecting positive effects of the CYAAA model, because all the CYAAA points are end-of-year. The fact that approximately 70% of the children placed in the instructional programs below the end-of-grade 1 level, would indicate that the difference of a few months of instruction in a real control group would not have made much difference in learning between a midyear and end-of-year data point. Multiple analyses of the variance between the means resulted significant differences (p<.05) for all groups except Grade 5. These findings of strong differences must be treated with caution due to the noted limitations of the composition of the control group. Table 11. Number of children included in comparison sample by time of test, by school and grade level.
Mid 2010 End 2010 Mid 2011 End 2011 Total
Gr 1 15 2 15 4 36
Aurukun 15 2 0 0 17
Hope Vale 0 0 15 4 19
Gr 2 16 7 10 3 36
Aurukun 16 7 0 0 23
Hope Vale 0 0 10 3 13
Gr 3 11 1 18 1 31
Aurukun 11 1 0 0 12
Hope Vale 0 0 18 1 19
Gr 4 9 5 6 1 21
Aurukun 9 5 0 0 14
Hope Vale 0 0 6 1 7
Gr 5 4 10 12 1 27
Aurukun 4 10 0 0 14
Hope Vale 0 0 12 1 13
Gr 6 3 6 16 2 27
Aurukun 3 6 0 0 9
Hope Vale 0 0 16 2 18
TOTAL 58 31 77 12 178
Table 12. Results of analysis of variance test of differences in mean words correct per minute of control group (n=178) and CYAAA group (n=229) of children on each grade level ORF test.
Control CYAAA Test of Significance
N Mean WCPM SD N
Mean WCPM SD F p
Grade 1 36 1.50 2.4 42 6.12 8.4 10.07 0.0022*
Grade 2 36 6.75 9.4 49 14.61 15.2 7.54 0.0074*
Grade 3 31 14.74 21.5 27 27.41 23.2 4.65 0.035*
Grade 4 21 22.81 29.7 47 37.77 27.1 4.19 0.0447*
Grade 5 27 43.48 30.4 19 44.42 21.3 0.013 0.91
Grade 6 27 41.26 29.3 45 66.58 35.7 9.64 0.0027*
*Statistically significant
17
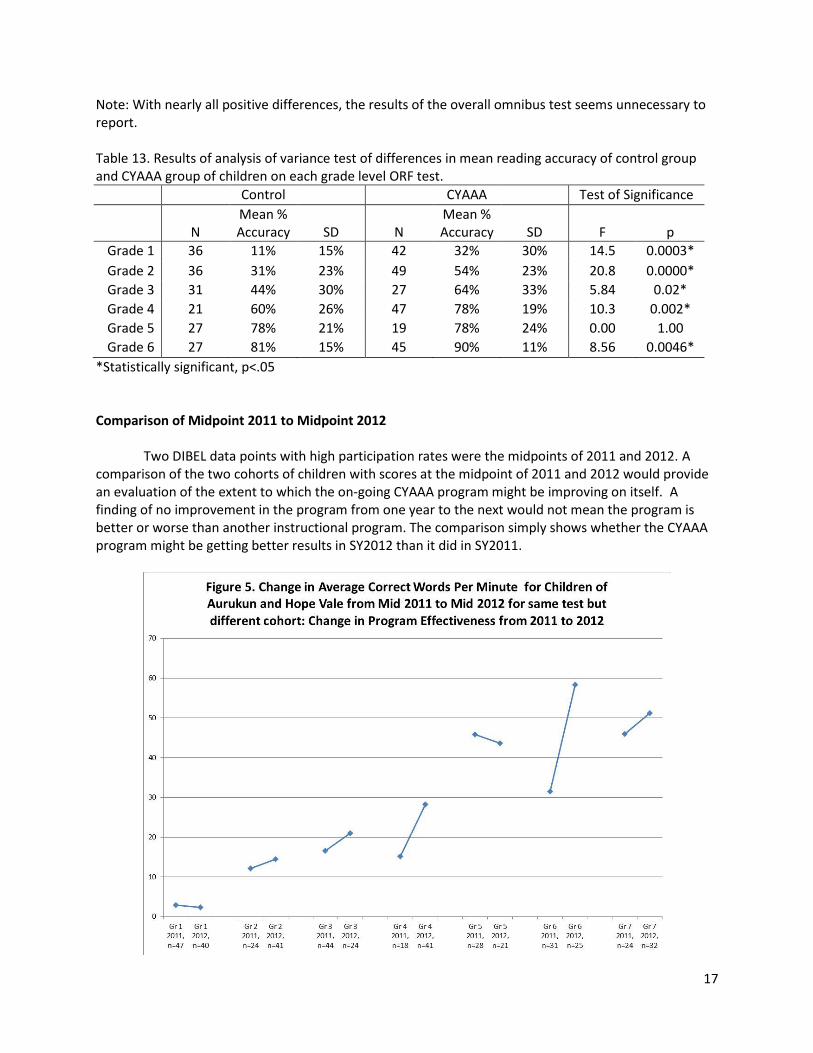
Note: With nearly all positive differences, the results of the overall omnibus test seems unnecessary to report. Table 13. Results of analysis of variance test of differences in mean reading accuracy of control group and CYAAA group of children on each grade level ORF test.
Control CYAAA Test of Significance
N Mean % Accuracy SD N
Mean % Accuracy SD F p
Grade 1 36 11% 15% 42 32% 30% 14.5 0.0003*
Grade 2 36 31% 23% 49 54% 23% 20.8 0.0000*
Grade 3 31 44% 30% 27 64% 33% 5.84 0.02*
Grade 4 21 60% 26% 47 78% 19% 10.3 0.002*
Grade 5 27 78% 21% 19 78% 24% 0.00 1.00
Grade 6 27 81% 15% 45 90% 11% 8.56 0.0046*
*Statistically significant, p<.05 Comparison of Midpoint 2011 to Midpoint 2012 Two DIBEL data points with high participation rates were the midpoints of 2011 and 2012. A comparison of the two cohorts of children with scores at the midpoint of 2011 and 2012 would provide an evaluation of the extent to which the on-going CYAAA program might be improving on itself. A finding of no improvement in the program from one year to the next would not mean the program is better or worse than another instructional program. The comparison simply shows whether the CYAAA program might be getting better results in SY2012 than it did in SY2011.
18
Because Coen has such small numbers of children with much higher scores than children at
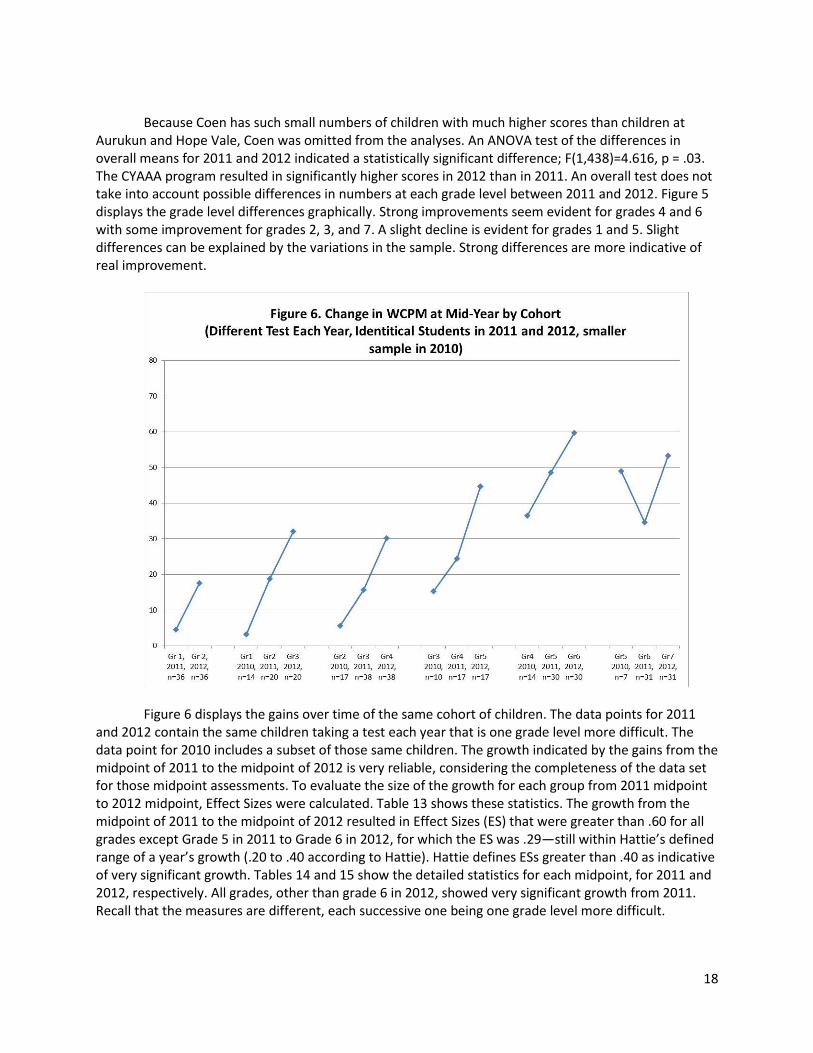
Aurukun and Hope Vale, Coen was omitted from the analyses. An ANOVA test of the differences in overall means for 2011 and 2012 indicated a statistically significant difference; F(1,438)=4.616, p = .03. The CYAAA program resulted in significantly higher scores in 2012 than in 2011. An overall test does not take into account possible differences in numbers at each grade level between 2011 and 2012. Figure 5 displays the grade level differences graphically. Strong improvements seem evident for grades 4 and 6 with some improvement for grades 2, 3, and 7. A slight decline is evident for grades 1 and 5. Slight differences can be explained by the variations in the sample. Strong differences are more indicative of real improvement.
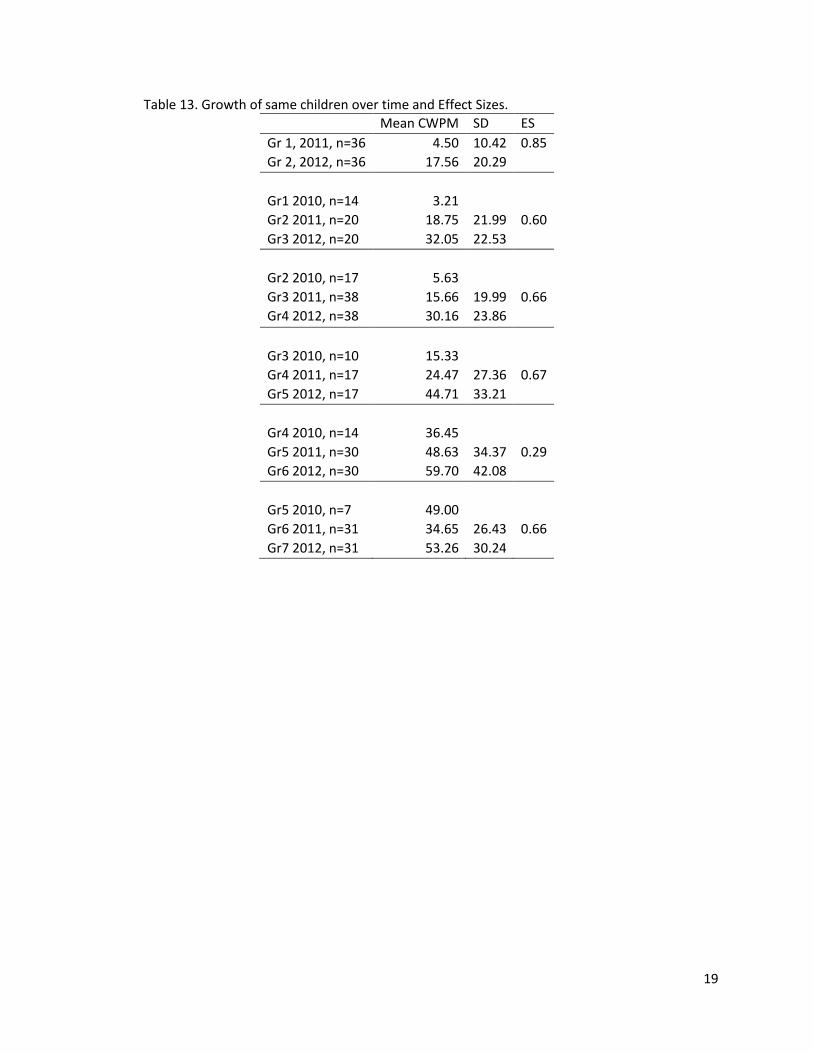
Figure 6 displays the gains over time of the same cohort of children. The data points for 2011
and 2012 contain the same children taking a test each year that is one grade level more difficult. The data point for 2010 includes a subset of those same children. The growth indicated by the gains from the midpoint of 2011 to the midpoint of 2012 is very reliable, considering the completeness of the data set for those midpoint assessments. To evaluate the size of the growth for each group from 2011 midpoint to 2012 midpoint, Effect Sizes were calculated. Table 13 shows these statistics. The growth from the midpoint of 2011 to the midpoint of 2012 resulted in Effect Sizes (ES) that were greater than .60 for all grades except Grade 5 in 2011 to Grade 6 in 2012, for which the ES was .29—still within Hattie’s defined range of a year’s growth (.20 to .40 according to Hattie). Hattie defines ESs greater than .40 as indicative of very significant growth. Tables 14 and 15 show the detailed statistics for each midpoint, for 2011 and 2012, respectively. All grades, other than grade 6 in 2012, showed very significant growth from 2011. Recall that the measures are different, each successive one being one grade level more difficult.
19
Table 13. Growth of same children over time and Effect Sizes.
Mean CWPM SD ES
Gr 1, 2011, n=36 4.50 10.42 0.85
Gr 2, 2012, n=36 17.56 20.29
Gr1 2010, n=14 3.21
Gr2 2011, n=20 18.75 21.99 0.60
Gr3 2012, n=20 32.05 22.53
Gr2 2010, n=17 5.63
Gr3 2011, n=38 15.66 19.99 0.66
Gr4 2012, n=38 30.16 23.86
Gr3 2010, n=10 15.33
Gr4 2011, n=17 24.47 27.36 0.67
Gr5 2012, n=17 44.71 33.21
Gr4 2010, n=14 36.45
Gr5 2011, n=30 48.63 34.37 0.29
Gr6 2012, n=30 59.70 42.08
Gr5 2010, n=7 49.00
Gr6 2011, n=31 34.65 26.43 0.66
Gr7 2012, n=31 53.26 30.24
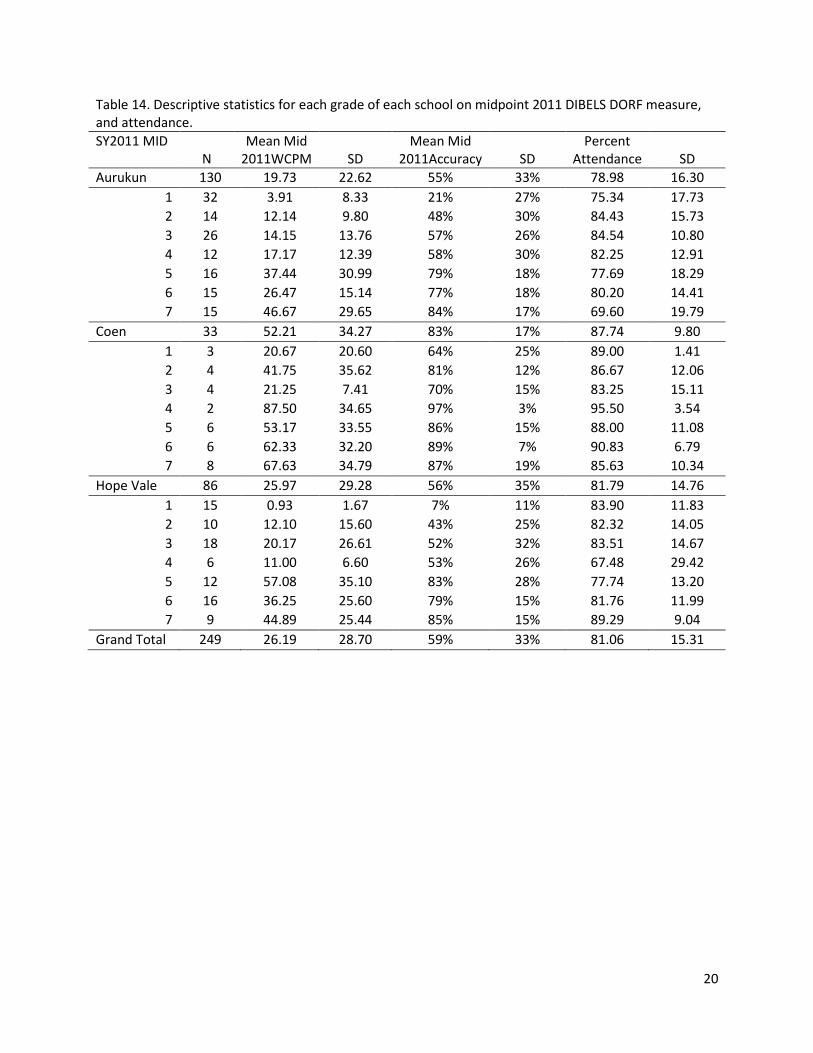
20
Table 14. Descriptive statistics for each grade of each school on midpoint 2011 DIBELS DORF measure, and attendance.
SY2011 MID N
Mean Mid 2011WCPM SD
Mean Mid 2011Accuracy SD
Percent Attendance SD
Aurukun 130 19.73 22.62 55% 33% 78.98 16.30
1 32 3.91 8.33 21% 27% 75.34 17.73
2 14 12.14 9.80 48% 30% 84.43 15.73
3 26 14.15 13.76 57% 26% 84.54 10.80
4 12 17.17 12.39 58% 30% 82.25 12.91
5 16 37.44 30.99 79% 18% 77.69 18.29
6 15 26.47 15.14 77% 18% 80.20 14.41
7 15 46.67 29.65 84% 17% 69.60 19.79
Coen 33 52.21 34.27 83% 17% 87.74 9.80
1 3 20.67 20.60 64% 25% 89.00 1.41
2 4 41.75 35.62 81% 12% 86.67 12.06
3 4 21.25 7.41 70% 15% 83.25 15.11
4 2 87.50 34.65 97% 3% 95.50 3.54
5 6 53.17 33.55 86% 15% 88.00 11.08
6 6 62.33 32.20 89% 7% 90.83 6.79
7 8 67.63 34.79 87% 19% 85.63 10.34
Hope Vale 86 25.97 29.28 56% 35% 81.79 14.76
1 15 0.93 1.67 7% 11% 83.90 11.83
2 10 12.10 15.60 43% 25% 82.32 14.05
3 18 20.17 26.61 52% 32% 83.51 14.67
4 6 11.00 6.60 53% 26% 67.48 29.42
5 12 57.08 35.10 83% 28% 77.74 13.20
6 16 36.25 25.60 79% 15% 81.76 11.99
7 9 44.89 25.44 85% 15% 89.29 9.04
Grand Total 249 26.19 28.70 59% 33% 81.06 15.31

21
Table 15. Descriptive statistics for each grade of each school on midpoint 2012 DIBELS DORF measure, and attendance.
SY2012 MID N
Mean Mid 2012 WCPM SD
Mean Mid 2012 Accuracy SD
Percent Attendance SD
Aurukun 135 28.02 26.28 63% 32% 63.17 23.60
1 21 2.19 5.38 10% 19% 61.92 21.58
2 26 17.77 20.46 52% 28% 56.41 25.63
3 16 22.94 16.09 64% 24% 56.80 31.38
4 26 30.69 20.51 75% 12% 66.55 23.12
5 13 38.08 17.24 83% 15% 67.21 21.28
6 15 50.27 38.29 82% 14% 72.38 16.34
7 18 47.83 24.07 88% 13% 69.20 16.65
Coen 35 58.54 40.68 78% 28% 88.03 15.68
1 5 11.20 20.78 27% 39% 92.50 10.65
2 3 61.33 27.10 94% 8% 86.40 12.26
3 5 48.40 30.42 78% 16% 89.20 5.07
4 5 48.80 40.86 83% 10% 100.00 0.00
5 5 87.80 34.11 95% 4% 81.00 25.18
6 7 68.86 47.25 84% 17% 84.67 13.79
7 5 80.40 35.42 92% 5% 84.60 26.26
Hope Vale 89 29.03 38.03 53% 34% 79.82 14.15
1 19 2.58 3.27 16% 20% 76.85 14.45
2 15 8.80 8.93 39% 26% 82.00 10.36
3 8 17.25 18.67 54% 31% 85.13 10.44
4 15 24.00 28.94 59% 26% 79.59 14.53
5 8 52.75 48.67 81% 13% 78.22 18.84
6 10 70.50 48.98 82% 23% 85.23 10.39
7 14 55.57 40.36 76% 30% 76.19 17.61
Grand Total 259 32.49 34.30 61% 33% 71.68 22.22
Analyses of Accuracy The rate score (correct words per minute) has a very extensive research base in the CBM literature as a predictor of reading comprehension. Oddly enough, accuracy is less predictive. This is likely so because standardized reading tests are timed. Reading more would result in more responses, so rate would be more predictive. Other research has found that when accuracy falls below 98%, reading comprehension is affected negatively (Hasbrouck, 1998). Just imagine yourself reading a passage with 2% of the text missing or changed. Misunderstanding could occur. When you increase the percent errors, understanding can become extremely difficult. Accurate decoding is necessary, but not sufficient for reading comprehension. (With accurate reading, comprehension is possible, but not guaranteed.)
The DIBELSnext includes a system for scoring accuracy. However, this DIBELS scoring system would not be sensitive to growth because the accuracy levels of the children in this sample are so low. Instead I use a system of evaluating the combined rate and accuracy scores that I developed to place the “Intensive” children into instructional program levels. Accuracy is a very important consideration for placement in instructional program level. Children who read accurately but very slowly will improve with
22
practice. Decoding instruction is not necessary anymore. However, a child who makes many errors needs decoding instruction, because this child will only practice reading incorrectly without it. Children who read with less accuracy need a lower level instructional program. The goal of the instructional program placement is to place the child in reading material that is at a low enough readability level that the child does not make so many decoding errors. After decoding is taken care of the focus of instruction can be on comprehension.
I developed a system using both rate and accuracy information for placing more than 7000
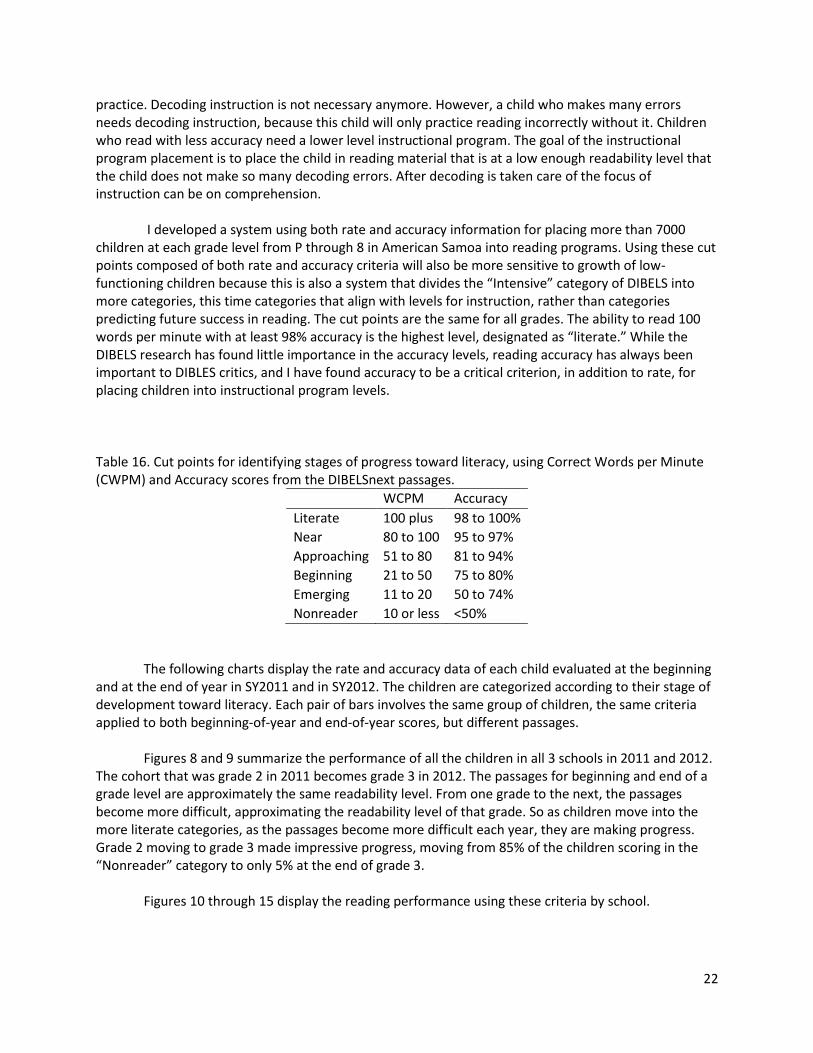
children at each grade level from P through 8 in American Samoa into reading programs. Using these cut points composed of both rate and accuracy criteria will also be more sensitive to growth of low-functioning children because this is also a system that divides the “Intensive” category of DIBELS into more categories, this time categories that align with levels for instruction, rather than categories predicting future success in reading. The cut points are the same for all grades. The ability to read 100 words per minute with at least 98% accuracy is the highest level, designated as “literate.” While the DIBELS research has found little importance in the accuracy levels, reading accuracy has always been important to DIBLES critics, and I have found accuracy to be a critical criterion, in addition to rate, for placing children into instructional program levels.
Table 16. Cut points for identifying stages of progress toward literacy, using Correct Words per Minute (CWPM) and Accuracy scores from the DIBELSnext passages.
WCPM Accuracy
Literate 100 plus 98 to 100%
Near 80 to 100 95 to 97%
Approaching 51 to 80 81 to 94%
Beginning 21 to 50 75 to 80%
Emerging 11 to 20 50 to 74%
Nonreader 10 or less <50%
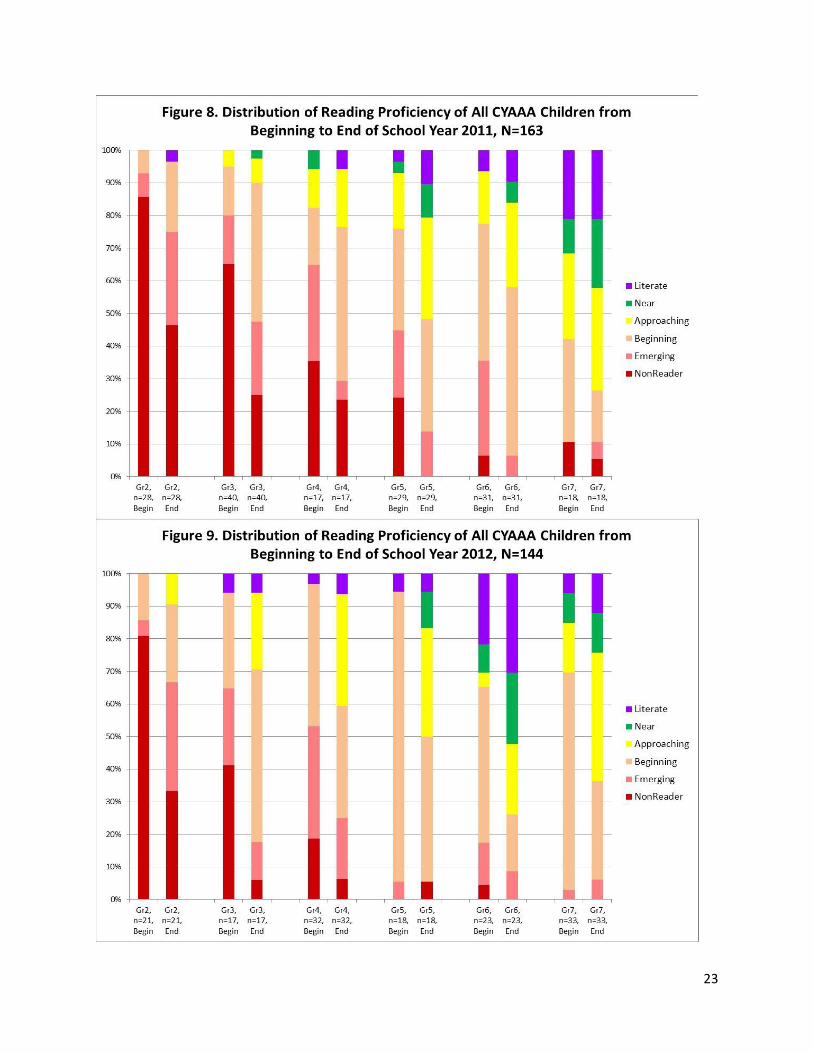
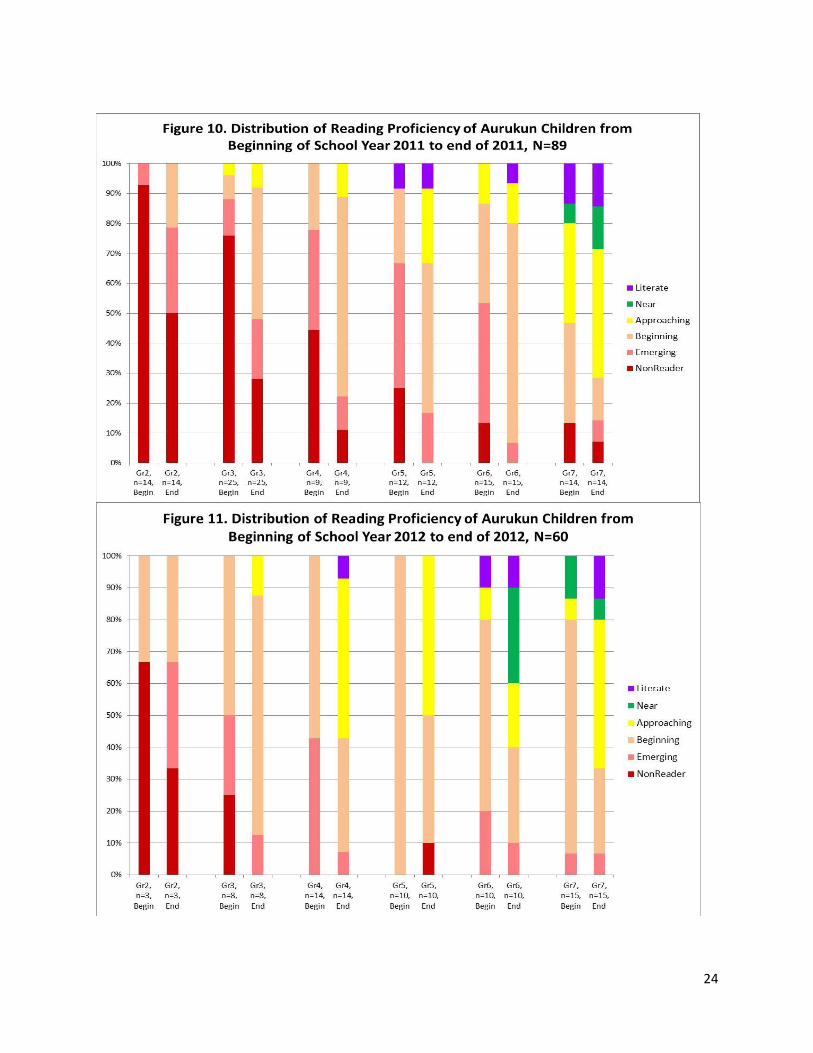
The following charts display the rate and accuracy data of each child evaluated at the beginning and at the end of year in SY2011 and in SY2012. The children are categorized according to their stage of development toward literacy. Each pair of bars involves the same group of children, the same criteria applied to both beginning-of-year and end-of-year scores, but different passages. Figures 8 and 9 summarize the performance of all the children in all 3 schools in 2011 and 2012. The cohort that was grade 2 in 2011 becomes grade 3 in 2012. The passages for beginning and end of a grade level are approximately the same readability level. From one grade to the next, the passages become more difficult, approximating the readability level of that grade. So as children move into the more literate categories, as the passages become more difficult each year, they are making progress. Grade 2 moving to grade 3 made impressive progress, moving from 85% of the children scoring in the “Nonreader” category to only 5% at the end of grade 3.
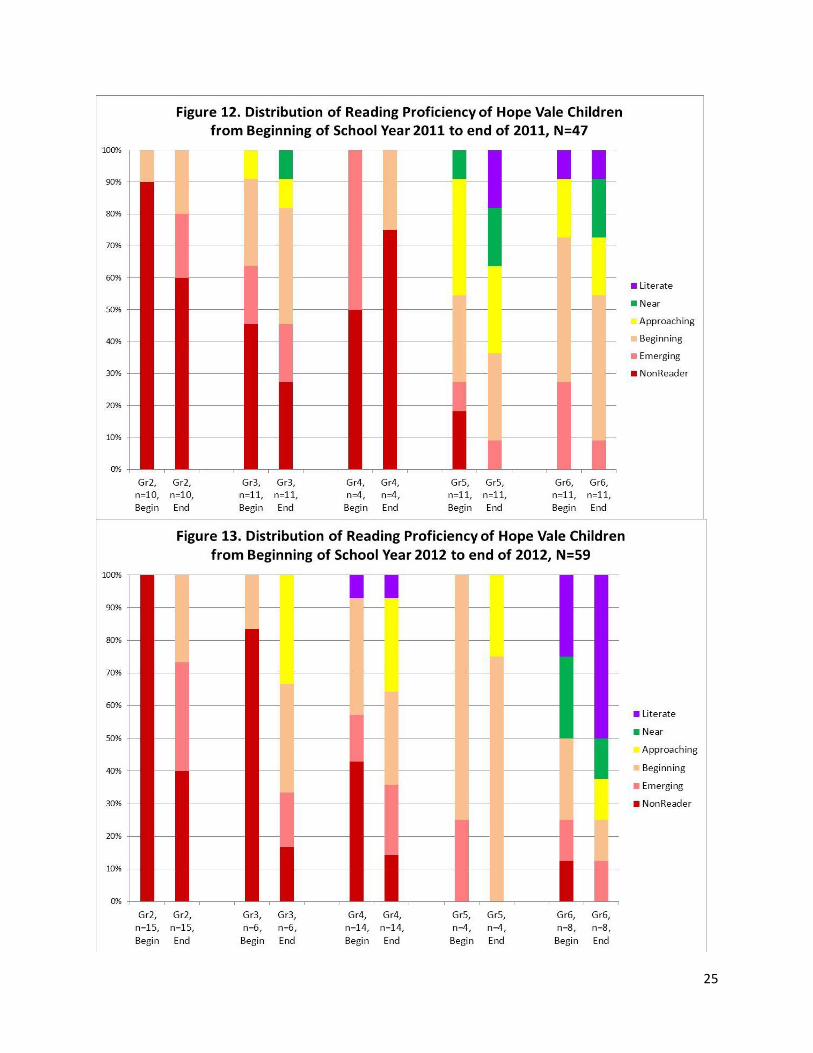
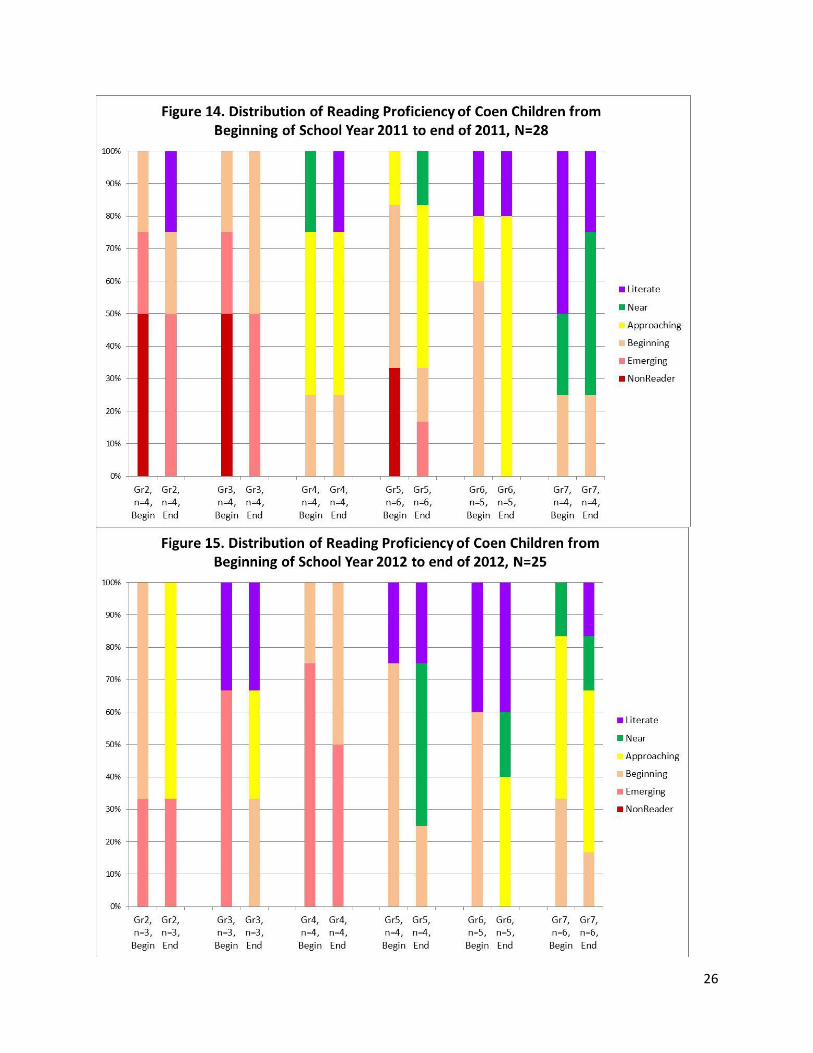
Figures 10 through 15 display the reading performance using these criteria by school.
23
24
25
26
27
Discussion and Conclusions Of course we expect the children in the CYAAA schools to eventually score well on the NAPLAN and show academic behaviors consistent with mainstream populations. But considering the low academic functioning these children have to start with, impressive progress toward achieving these goals can occur undetected, if we only measure the desired outcome. The advantage of using oral reading fluency measures, such as DIBELS, is that these measures can be sensitive to growth of initially very low-achieving children. The DIBELS measures are most sensitive to growth if the passages designated for a given grade level are administered to children who are performing just below that grade level, rather than to children who are that year in school, regardless of how poor their reading performance is. Sensitivity was lost in the way the DIBELS passages were administered: to document achievement of benchmark levels rather than to be sensitive to early growth.
Data from other Direct Instruction models shows consistently that the growth of low-performing children often produces a logarithmic curve, with slow progress at first as the learning foundation is built, followed by accelerated progress and a steep rise in achievement later. In the CYAAA schools, some individuals have shown a steep rise in progress already, as the Coen School children have. But the greater number of children at Aurukun and Hope Vale seem to not have reached the point of greatly accelerated progress, with the exception of perhaps 4th and 6th year children. The ACER Evaluation critiques the extent of the missing data and the problem that results in determining how representative the tested sample is of the population. This evaluation should be an attempt to evaluate the progress of the children who attended. Schools cannot affect the learning of children with poor attendance. The ACER report has misidentified the population to which their conclusions would apply. Stakeholders can only reasonably expect schools to affect the learning of the children they have an opportunity to teach. The proportion of boys who didn’t go to school, but were enrolled at least at some point during the year, is also unimportant, given the severity of the attendance issues. Considering the integrity of the DIBEL data collection, we are obligated to analyze the data we have. The very most important consideration is whether the available data were collected reliably, with integrity, and with the intention to test every possible child. I am convinced that this occurred. If the data had been collected internally (by the child’s teacher) as the DIBEL system recommends, I would be very skeptical. But CYAAA took care at great expense to provide an external data collection team that very conscientiously administered the DORFS and reliably scored the student protocols. The ACER evaluators criticize Coughlin’s report for using the median attendance rate at a school to define high and low attendance. The instructional program these schools have adopted presents instruction at the rate the children in the instructional group can learn to mastery. When attendance is low, the rate of instruction is low. When attendance is high, the rate of instruction is high. So it is the outliers that will have difficulty keeping up. Using the median attendance rather than an absolute criterion was a more appropriate criterion for identifying children who would not be able to learn because of their attendance. In my analyses above, I included all data. I only used level of attendance rules for determining whether to count the untested child as enrolled or not. The ACER evaluation report claims they can make no conclusions because there is no comparison to be made. The analyses I report in this evaluation have provided 2 comparison populations for the DIBELS data. The first comparison was that of the CYAAA project Aboriginal children’s progress in reading performance compared to the American national norms as provided by the DIBEL methodology. By creating an additional cut point (i.e., dividing the intensive category in half),
28
it becomes very apparent that at nearly every grade level across schools, children are progressing at a rate faster than the norm, in spite of low attendance. It is evident in Figures 1 to 3, that while the intensive category of DIBELS shows little progress, taking the half-point of the DIBEL intensive category shows much progress, faster than the norm. The elimination of absolute non-readers (those who cannot read 5 words in grades 2 and 3 or cannot read 10 words in grades 4 to 6) is also an important accomplishment. I compared the differences in the reading performance of children at Aurukun and Hope Vale at the end of SY2012, where very little data was missing, with the performance of children on their first mid- or end-of-year data point, as a control group. The statistical tests of the differences in the means for each grade were significant for mean correct words per minute and mean accuracy levels for each grade level, except grade 5. These analyses were done on the Aurukun and Hope Vale populations only because of their homogeneity. Coen was eliminated from the analyses because of Coen’s overall much higher performance levels and small numbers. The presence of a couple of Coen students in one grade but not another and the small numbers of participants from Coen would result in skewed data. An additional comparison of the means of the midpoints in SY2011 and SY2012 was completed because of the low rate of missing data for those testing occasions. The analysis of the differences in the performance of the two different cohorts on the same test for each grade level group indicated that strong improvements in program effectiveness were found in grades 4 and 6. The absence of any strong declines and the presence of only strong improvements indicates that the CYAAA program likely improved its effectiveness in SY2012. In a further analysis of the growth within a cohort, using matched scores for 2011 and 2012, and a score for the 2010 midpoint that included a smaller sample of the main group, I found that the Effect Sizes of the within-group growth was greater than .60, with the exception of grade 5 to 6, which had an ES of .29. The ES for grade 1 to 2 was .85, more than double the mark Hattie sets (.40) as an indicator of very significant growth (Hattie, 2009). The analysis of the 2011 and 2012 midpoints produced strong evidence for program effectiveness. The completeness of the data for those midpoints lends strong credibility to that conclusion. Finally, the distribution of the reading performance of the children taking each grade level DORF, using a combination of rate and accuracy data showed clear improvement in overall reading rate and accuracy. These distributions included cut points I have successfully used to determine how to place children into different levels of beginning reading programs. Again, when more sensitive measures are used, the children of the CYAAA project show clear gains in reading proficiency.
While the large amount of missing data would cast doubt on a single analysis of the data, the convergence of multiple analyses warrants the following conclusion: The CYAAA project has made a significant difference in the progress of the children in reading and is producing significantly better outcomes each year.
References
American Psychological Association, American Educational Research Association, & Education, National Council on Measurement in Education. (2004). Standards for educational and psychological tests. Washington, DC: American Psychological Association.
29
Datnow, A., & Stringfield, S. (2000). Working together for reliable schoolreform. Journal of Education for Students Placed at Risk, 5(1/2), 182-204.
Deno, S.L., Fuchs, L, Marston, D., & Shin, J. (2002). Using Curriculum-based Measurement to Establish Growth Standards for Students with Learning Disabilities. School Psychology Review, Vol. 30, No. 4, pp. 507-524.
Galletly, S.A., & Knight, B. (2006). The Dynamic Indicators of Basic Early Literacy Skills (DIBELS)
used in an Australian Context. Australian Journal of Learning Disabilities, vol. 11, no. 3, pp. 147-154.
Good, R.H., Gruba, J., & Kaminski, R.A. (2001). Best practices in using Dibels in an outcomes-driven model. In A. Thomas & J. Grimes (Eds.) Best practices in school psychology IV (pp. 679-700). Washington, DC: National Association of School Psychologists.
Hasbrouck (1998). Reading fluency: Principles for instruction and progress monitoring.
Professional Development Guide. Austin, TX: Texas Center for Reading and Language Arts, University of Texas at Austin.
Hasbrouck, J. E., & Tindal, G. (1992, Spring). Curriculum-based oral reading fluency norms for students in grades 2 through 5. Teaching Exceptional Children, pp. 41-44.
Hattie, J. (2009). Visible Learning: A Synthesis of Over 800 Meta-Analyses Related to
Achievement. London & New York: Routledge, Taylor, & Francis Group.
Hoffman, A. R., & Jenkins, J.E., & Dunlap, S.K. (2009). Using DIBELS: A Survey of Purposes and Practices. Reading Psychology, Vol. 30, No. 1 , pp. 1-16.
Pearce, L., & Gale, R. (2009). Oral Reading Fluency as a Predictor of Reading Comprehension With American Indian and White Elementary Students. School Psychology Review, Vol. 38, No. 3, pp. 419-427. __________________________________________________________________________________________ Stanley L. Deno, Lynn Fuchs, Douglas Marston & Jongho Shin, ‘Using Curriculum-based Measurement to Establish Growth Standards for Students with Learning Disabilities’, School Psychology Review, Vol. 30, No. 4, 2002, pp. 507-524. Lee R. Pearce and Richard Gale, ‘Oral Reading Fluency as a Predictor of Reading Comprehension With American Indian and White Elementary Students’, School Psychology Review, Vol. 38, No. 3, 2009, pp. 419-427. Amy R. Hoffman, Jeanne E. Jenkins and S. Kay Dunlap, ‘Using DIBELS: A Survey of Purposes and Practices’, Reading Psychology, Vol. 30, No. 1, 2009, pp. 1-16. Susan A. Galletly and Bruce Allen Knight, ‘The Dynamic Indicators of Basic Early Literacy Skills (DIBELS) used in an Australian Context’, Australian Journal of Learning Disabilities, Vol. 11, No. 3, 2006, pp. 147-154.

30