Embed Size (px)
Citation preview

Information of Value—You Send….We Trend
WBARS Accuracy…Nuances….Fun Facts
RAISE THE ROOF!Envision Excellence in Affordable Housing Management
AHMA/ARHC ConventionYakima 2014

City of Seattle Office of Housing Joanne Quinn
Washington State Housing Finance Commission Lanakay Lipp
Washington State Department of Commerce Nona White
YOU SEND…..WE TREND
BUILD BUILD BUILD BUILD BUILD BUILD BUILD

FEED ME—WE ARE INSATIABLE!!
YOU SEND
WBARS
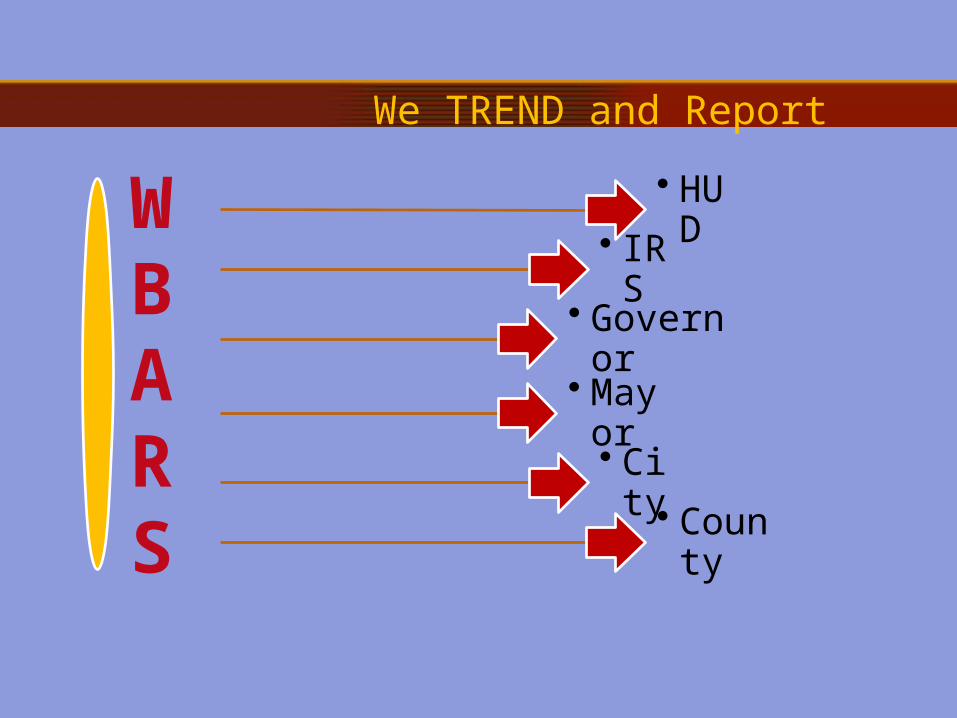
We TREND and Report
• HUD• IR
S• Govern
or• May
or• Ci
ty • County
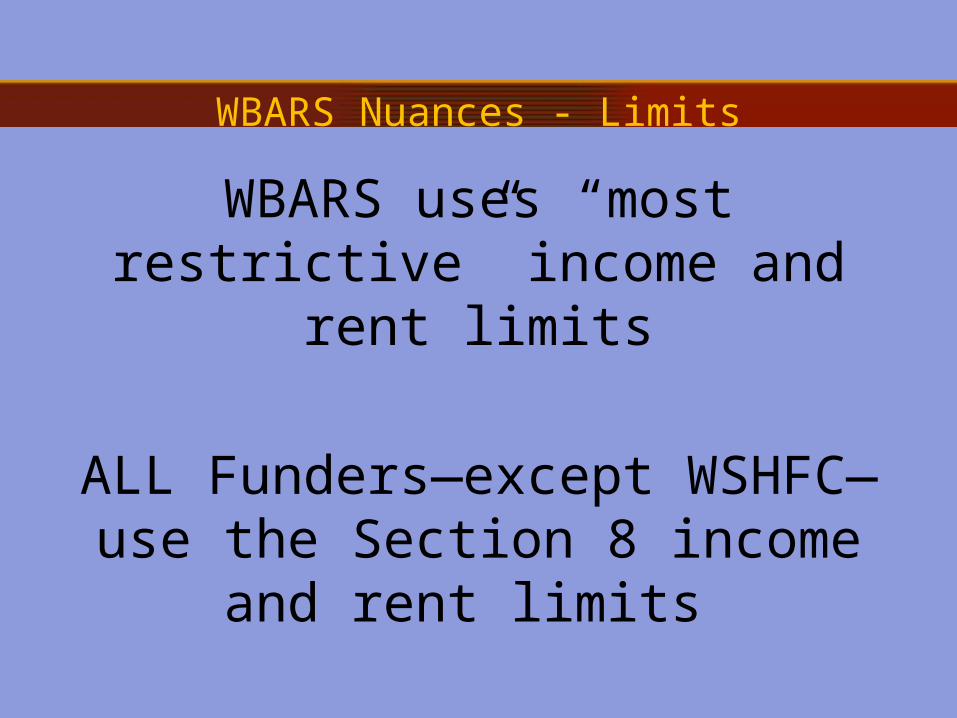
WBARS uses “most restrictive” income and rent limits
ALL Funders—except WSHFC—use the Section 8 income and
rent limits
WBARS Nuances - Limits
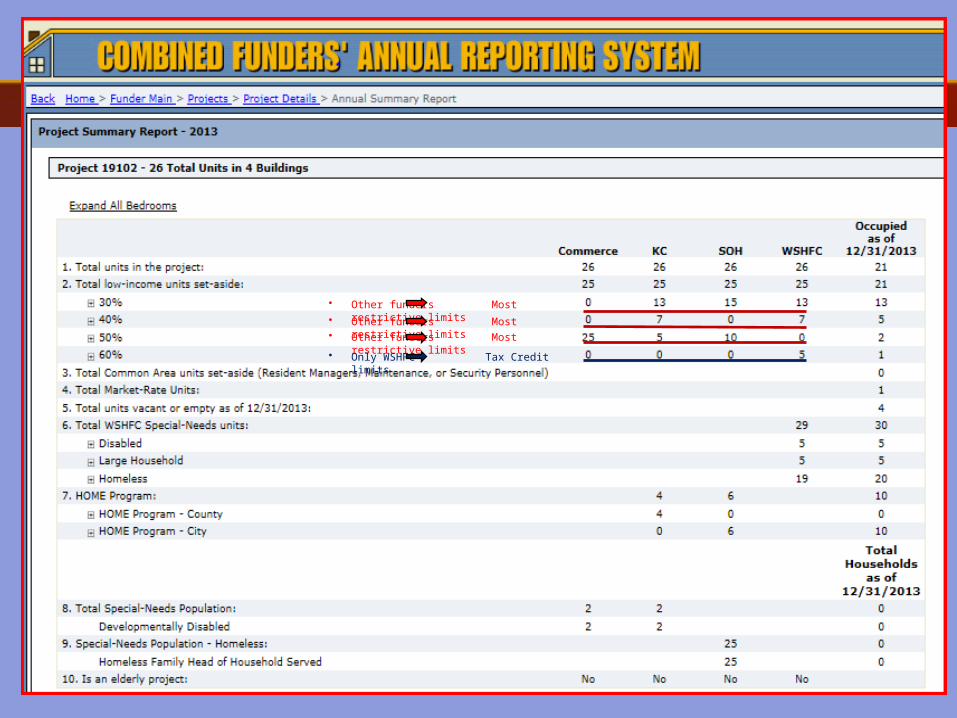
• Other funders Most restrictive limits• Other funders Most restrictive limits• Other funders Most restrictive limits• Only WSHFC Tax Credit limits
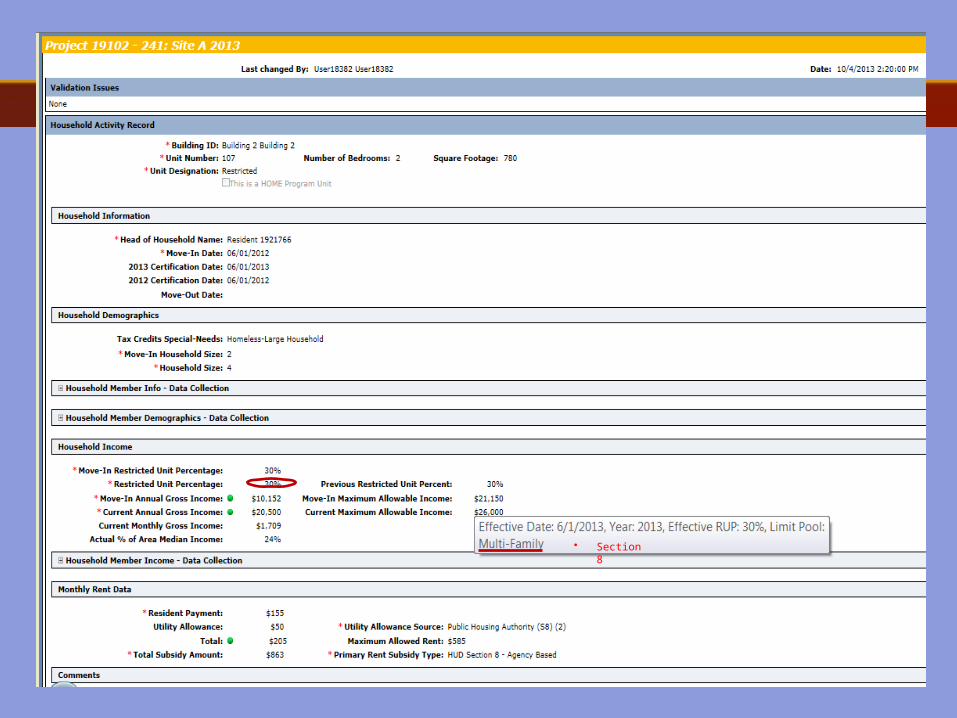
• Section 8
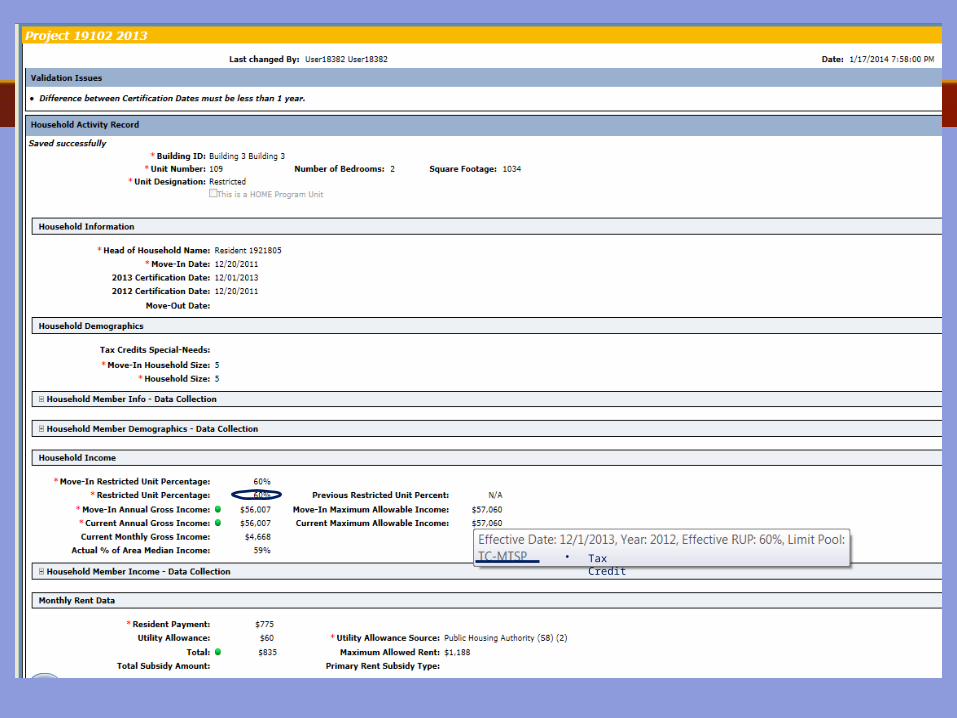
• Tax Credit
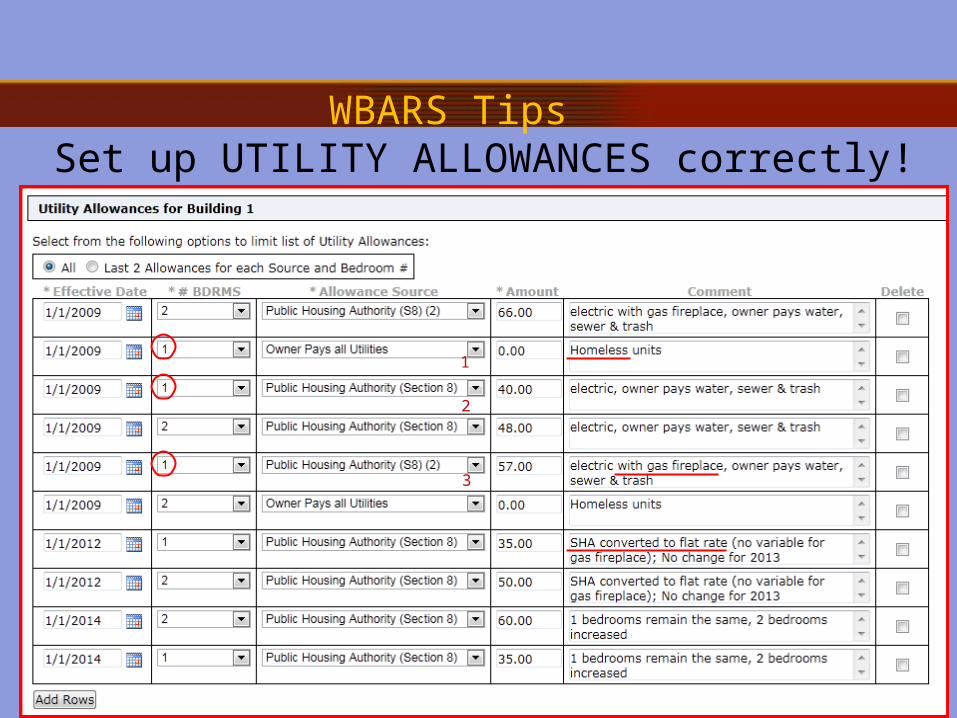
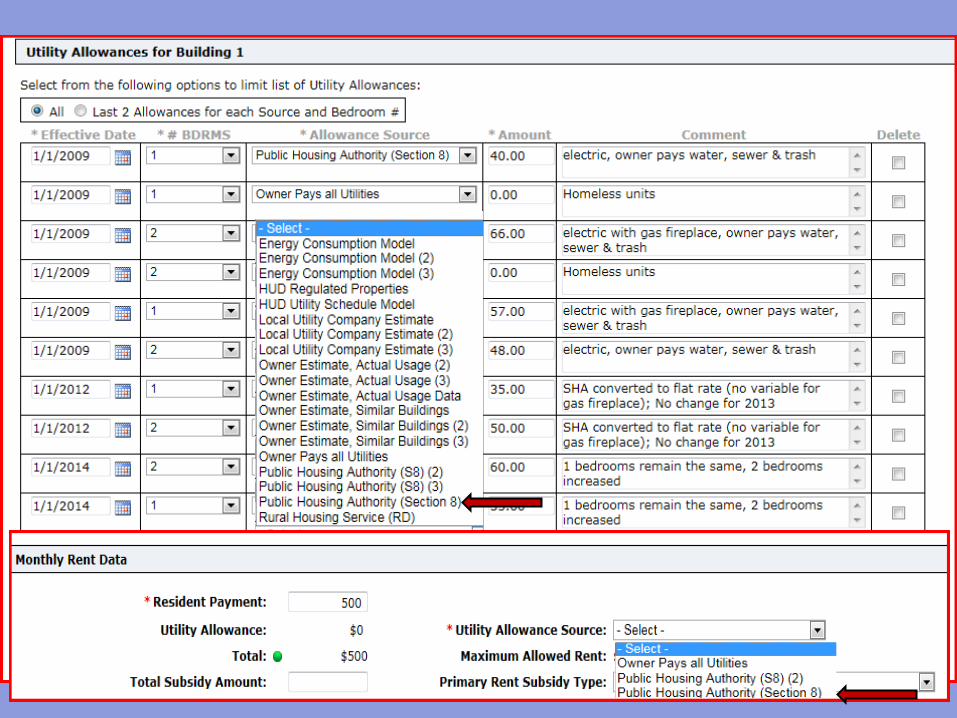
Set up UTILITY ALLOWANCES correctly!
1
2
3
WBARS Tips
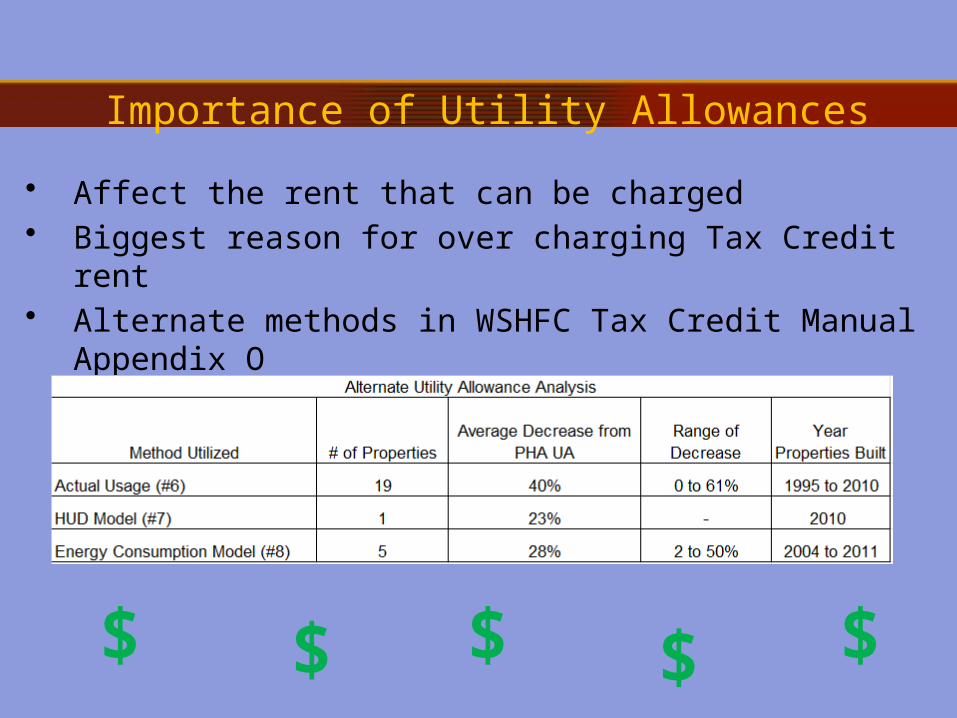
Importance of Utility Allowances
• Affect the rent that can be charged• Biggest reason for over charging Tax Credit rent• Alternate methods in WSHFC Tax Credit Manual
Appendix O
$ $ $ $ $
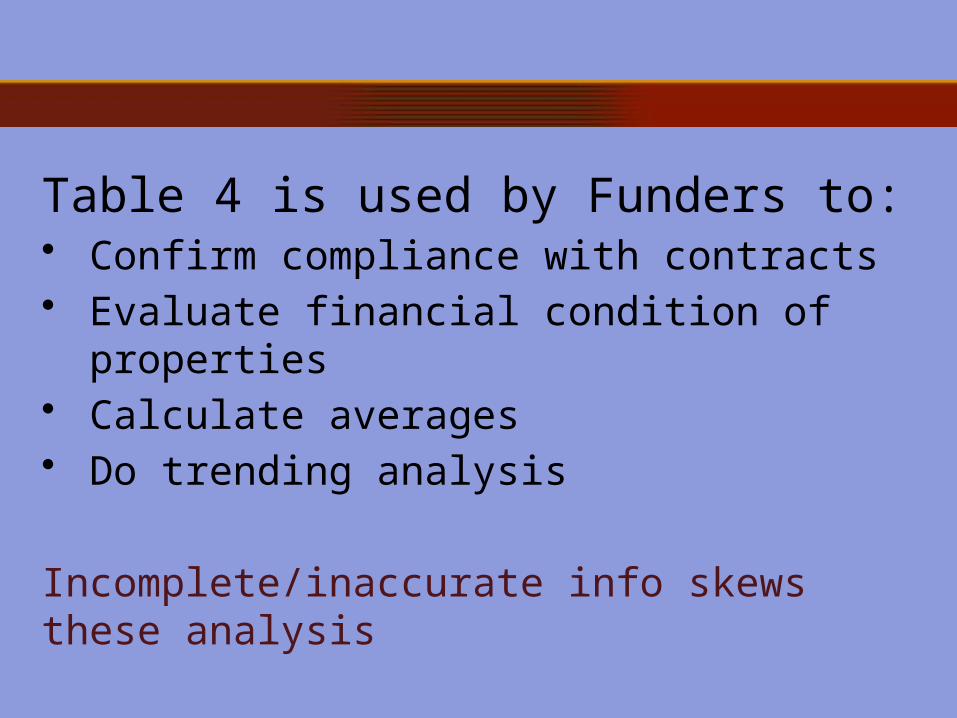
Table 4 is used by Funders to:• Confirm compliance with contracts• Evaluate financial condition of properties • Calculate averages • Do trending analysis
Incomplete/inaccurate info skews these analysis
FUN FACTS FROM FUNDERS
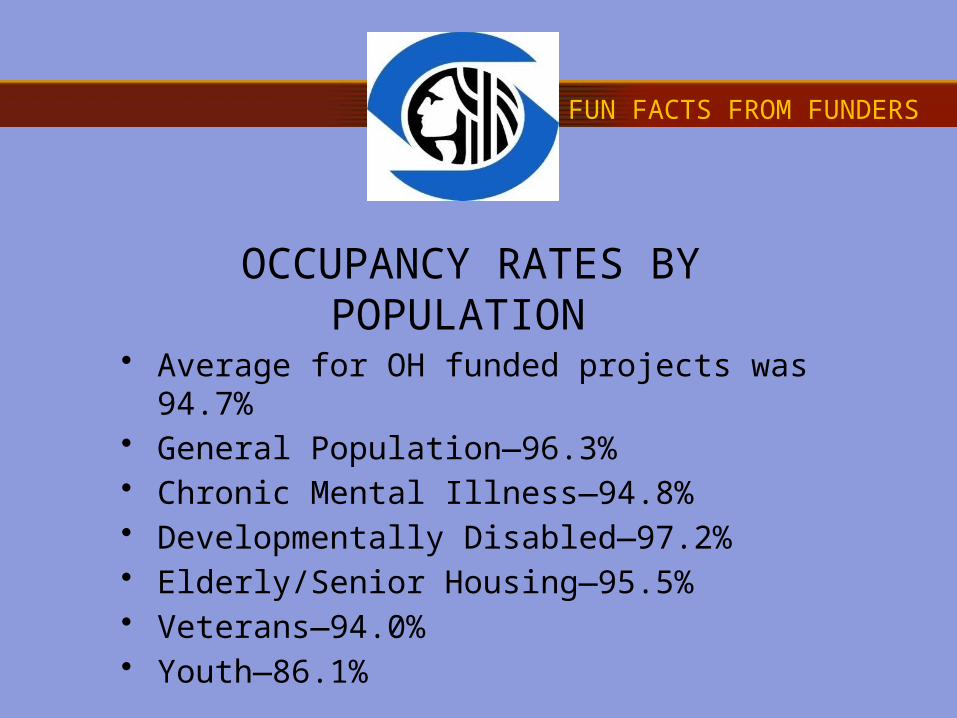
OCCUPANCY RATES BY POPULATION
• Average for OH funded projects was 94.7%
• General Population—96.3%• Chronic Mental Illness—94.8%• Developmentally Disabled—97.2%• Elderly/Senior Housing—95.5%• Veterans—94.0%• Youth—86.1%
FUN FACTS FROM FUNDERS
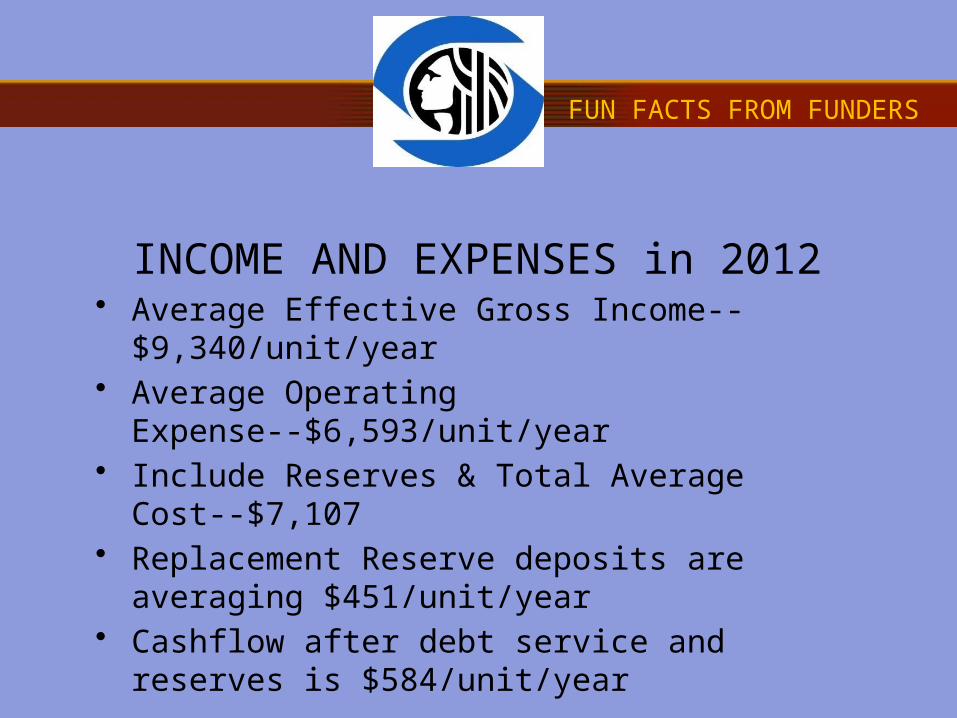
INCOME AND EXPENSES in 2012• Average Effective Gross
Income--$9,340/unit/year• Average Operating
Expense--$6,593/unit/year• Include Reserves & Total Average Cost--
$7,107• Replacement Reserve deposits are averaging
$451/unit/year• Cashflow after debt service and reserves is
$584/unit/year
FUN FACTS FROM FUNDERS
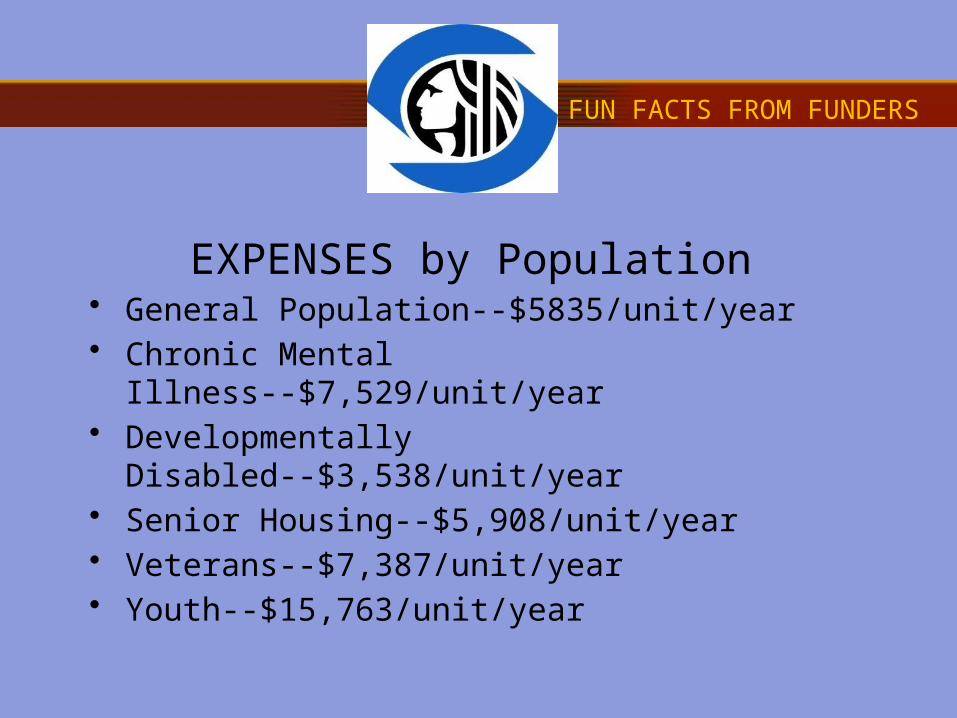
EXPENSES by Population• General Population--$5835/unit/year• Chronic Mental Illness--$7,529/unit/year• Developmentally Disabled--$3,538/unit/year• Senior Housing--$5,908/unit/year• Veterans--$7,387/unit/year• Youth--$15,763/unit/year
FUN FACTS FROM FUNDERS
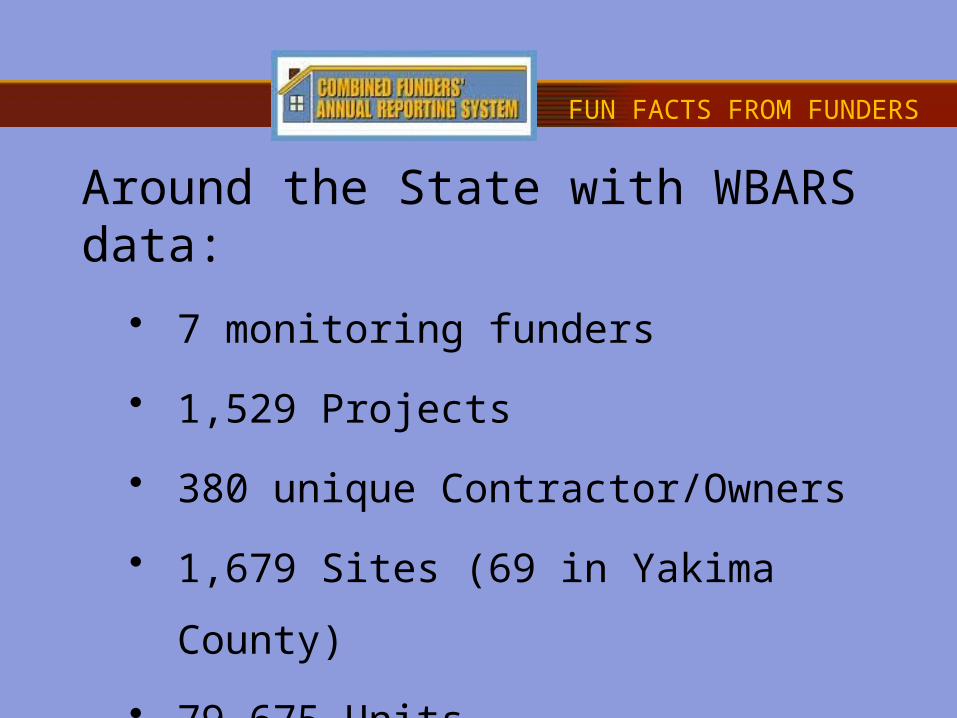
Around the State with WBARS data:
• 7 monitoring funders
• 1,529 Projects
• 380 unique Contractor/Owners
• 1,679 Sites (69 in Yakima County)
• 79,675 Units
FUN FACTS FROM FUNDERS
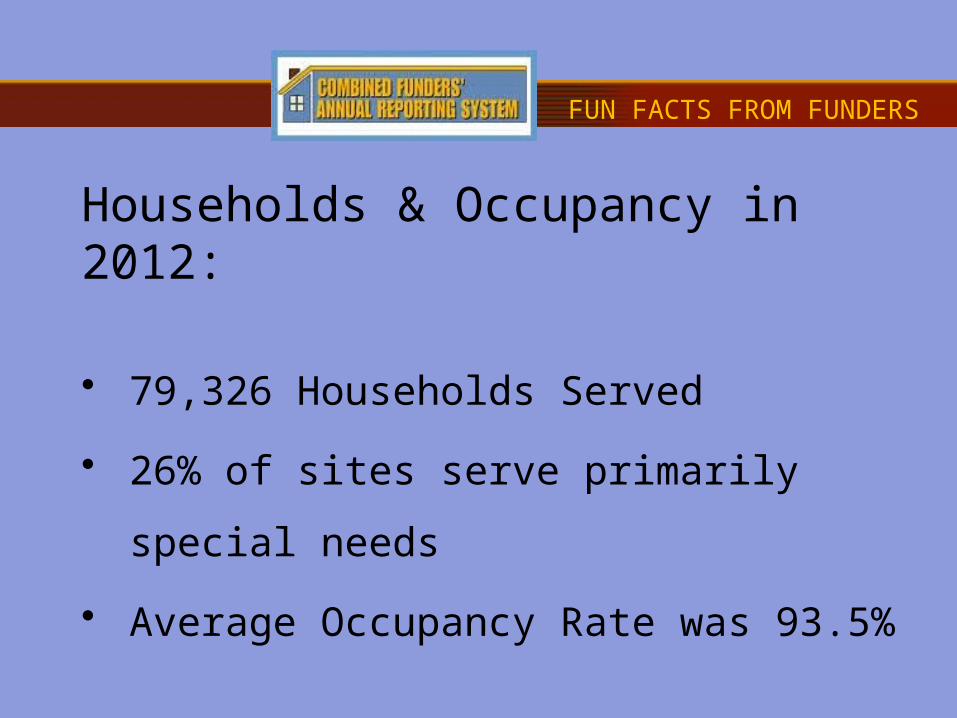
Households & Occupancy in 2012:
• 79,326 Households Served
• 26% of sites serve primarily special
needs
• Average Occupancy Rate was 93.5%
FUN FACTS FROM FUNDERS
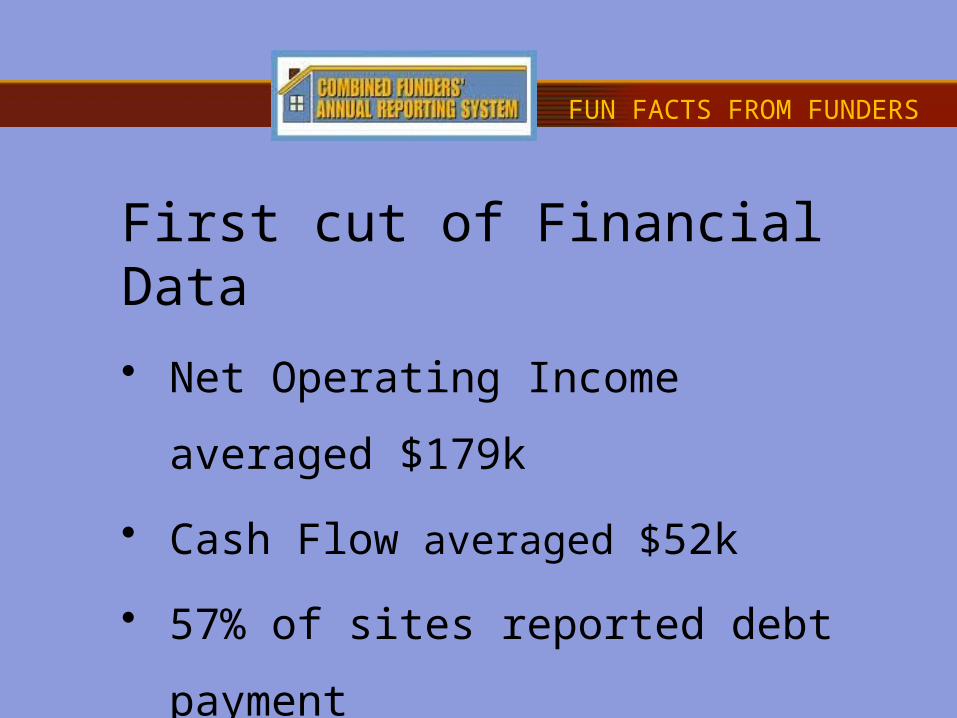
First cut of Financial Data
• Net Operating Income averaged $179k
• Cash Flow averaged $52k
• 57% of sites reported debt payment
• Average debt payment was $128k
FUN FACTS FROM FUNDERS
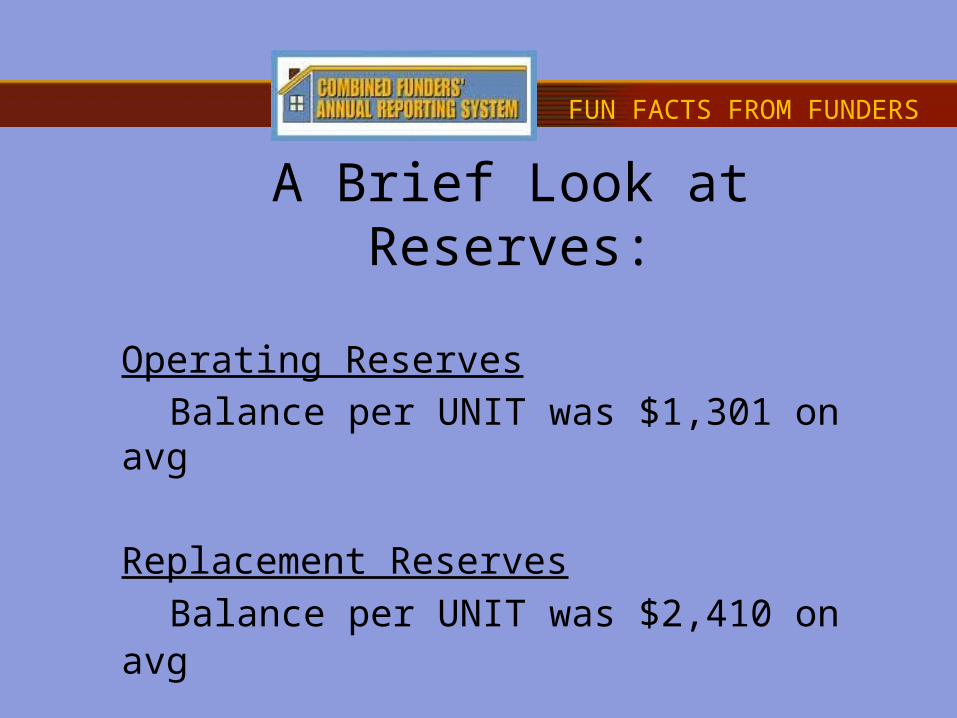
A Brief Look at Reserves:
Operating Reserves
Balance per UNIT was $1,301 on avg
Replacement Reserves
Balance per UNIT was $2,410 on avg

City of Seattle Office of Housing Joanne Quinn [email protected]
Washington State Housing Finance Commission Lanakay Lipp [email protected]
Washington Department of Commerce Nona White [email protected]
FUN FACTS FROM FUNDERS