Embed Size (px)
Citation preview
PM V1 Tfl
NACA
RESEARCH MEMORANDUM
PRELIMINARY INVESTIGATION OF CYCLIC DE-ICING OF AN AIRFOIL
USING AN EXTERNAL ELECTRIC HEATER
By lames P. Lewis and Dean T. Bowden
Lewis Flight Propulsion Laboratory Cleveland, Ohio
NATIONAL ADVISORY COMMITTEE FOR AERONAUTICS
WASH I NGTON
February 4, 1952
NACA RN E51J30
NATIONAL ADVISORY CONMITTi±LL FOR AERONAUTICS
RESEARCH MEMORANDUM
PRELIMINARY INVESTIGATION OF CYCLIC DE-ICING OF AN AIRFOIL USING
AN JJJHNAL ELECTRIC HEATER
By James P. Lewis and. Dean T. Bowden
SUNMABY
An investigation was conducted in the NACA Lewis icing research tunnel to determine the characteristics and requirements of cyclic de-icing of a 65,2-216 airfoil by use of an external electric heater. The present investigation was limited to an airspeed of 175 miles per hour. Data are presented to show the effects of variations in heat-on and heat-off periods, ambient air temperature, liquid-water content, angle of attack, and. heating distribution on the requirements for cyclic de-icing. The external heat flow at various icing and heating conditions is also presented.
A continuously heated parting strip at the airfoil leading edge was found necessary for quick, complete, and consistent ice removal. The cyclic power requirements were found to be primarily a function of the datum temperature and heat-on time, with the other operating and meteor-ological variables having a second-order effect. Short heat-on periods and high power densities resulted in the most efficient ice removal, the minimum energy input, and the minimum runback ice formations. The opti-mum chordwise heating distribution pattern was found to consist of a uniform distribution of cycled power density in the impingement region. Downstream of the impingemeit region the power density decreased to the limits of heating which, for the conditions investigated, extended from 5.7 percent chord on the upper surface of the airfoil to 8.9 percent chord on the lower surface. Ice removal did not take place at a heater surface temperature of 320 F; surface temperatures of approximately 50° to 1000 F were required to effect removal. Better de-icing performance and greater energy savings would be possible with a heater having a higher thermal efficiency.
II'ffRODUCTION
The protection of aircraft in icing conditions can be achieved by continuously heating the critical components of the aircraft suff 1-ciently to prevent the formation of ice. Past NACA research has
2 NACA RM E51J30
established the feasibility and the design basis for this system of anti-icing (references 1 to 3). An alternate thermal method of protec-tion of aircraft in icing is the system of cyclic de-icing or intermit-tent heating. Recent design analyses (reference 4) have shown that the heat requirements for large high-speed, high-altitude aircraft using the method of ice prevention by continuous heating are extremely large and in some cases prohibitive. In addition, use of the hot-gas continuous anti-icing system, in the case of specific designs, may result in diffi-cult design, structural, and. installation problems. Preliminary anal-ysis has indicated that the cyclic do-icing system possesses several advantages that would aid the solution of these protection problems.
Cyclic do-icing is that method of thermal icing protection in which ice is allowed to form for a relatively short period of time on the vul-nerable component, and then heat is applied at a rate sufficient to melt quickly the bond of the ice to the surface, allowing aerodynamic or other forces to remove the ice. Upon ice removal, heating is termin-ated, allowing the surface to cool and re-ice, with the process being repeated. in regular cycles. Since the heating is intermittent, heat can be supplied successively to small areas from a single source, thus reducing the heat-energy requirement over that required for continuous ice prevention. It would appear that a cyclic system can utilize several methods of heating, including hot gas and electric resistance heaters applied as either internal or ecternal heaters. In particular, an electric cyclic de-icing system, in addition to reducing the heat-energy requirements over those for continuous heating, would have a generator weight of tolerable magnitude as compared with the prohibitive weight required for an electric anti-icing system operated continuously. A further possible advantage of the cyclic system is that such a system would tend to minimize the runback problem encountered with continuous heating when operating at an off-design condition.
Previous investigations of cyclic 4e-icing have been restricted to special cases namely, the propeller (references 5 and 6) and jet-engine inlet guide vanes, and limited analytical studies (references 7 to 9). Application of the results of these investigations to airfoils is ques-tionable for several reasons. In the case of propellers, centrifugal forces are present to aid removal of the ice. For an inlet guide vane, the size and. shape of the vane and its attendant ice formation are con-siderably different from those of an airfoil of the size and shape gen-erally employed in airplane wings and elTrpennage. Limited experimental results of cyclic de-icing applied to airfoils have been reported by the National Research Council of Canada.
The analytical studies of the problem reported in references 8 and 9 employed an electric network analyzer in the solution of the transient heat flow. However, cyclic de-icing is a complex problem in transient
NACA RN E51J30 3
heat flow for which the boundary conditions are imperfectly known. These uncertain factors include the local heat-transfer coefficient and the local rate of ice accretion. More important the criterion of per-forinance is as yet not specifically defined; that is, the point in time at which removal takes place is not given in independent terms to which the heat-transfer processes or the removal forces may be related. This is in contrast to the case of anti-icing for which there is the def i-nite criterion of maintaining the surface at some specified temperature above freezing or evaporating certain amounts of water from the surface. Thus an analytical solution of the problem appears extremely difficult, and, in the absence of experimental data, would not necessarily be accurate or complete. For these reasons an experimental approach .was taken in the investigation of cyclic de-icing of airfoils in the NACA Lewis icing research tunnel.
The NACA is currently engaged in a general investigation of cyclic de-icing of airfoils including various types of heaters and methods of heating. The objectives of this investigation include a study of cyclic de-icing of airfoils to obtain a more complete understanding of the pro-cesses involved and to determine the criteria for successful operation of this method of ice protection. It is also desired to determined thi requirements for cyclic de-icing of airfoils in terms of the amounts of heat and cycle times required and to obtain the relation between these requirements and the meteorological and aircraft operatintgconditions.
In this report are presented the results of an initial phase of the investigation which employed an external electric heater of the rubber-clad type mounted on the forward portion of an 8-foot chord, 65,2-216 airfoil model in the NACA Lewis icing research tunnel. Preliminary studies and past experience with the cyclic de-icing of other bodies indicated that air speed is of second-order importance. For this reason, the present investigation was limited to an airspeed of 175 miles per hour. This restriction of airspeed permitted opera-tion over a range of anibient air temperature, liquid-water content, angle of attack, and various heating configurations without damage to the experimental heaters from excessive heating. The drag penalties involved in cyclic de-icing are not reported. Continued investigations covering a full range of airspeed, determinations of the drag penalties, and studies of various types of heater are the subject of future research.
DESCRIPTION OF EQUIPMENT
The model used in the tunnel investigation of cyclic de-icing of airfoils consisted of a NACA 65,2-216 airfoil having an 8-foot chord and a 6-foot span mounted vertically in the test section of the 6- by
4 NACA RN E51J30
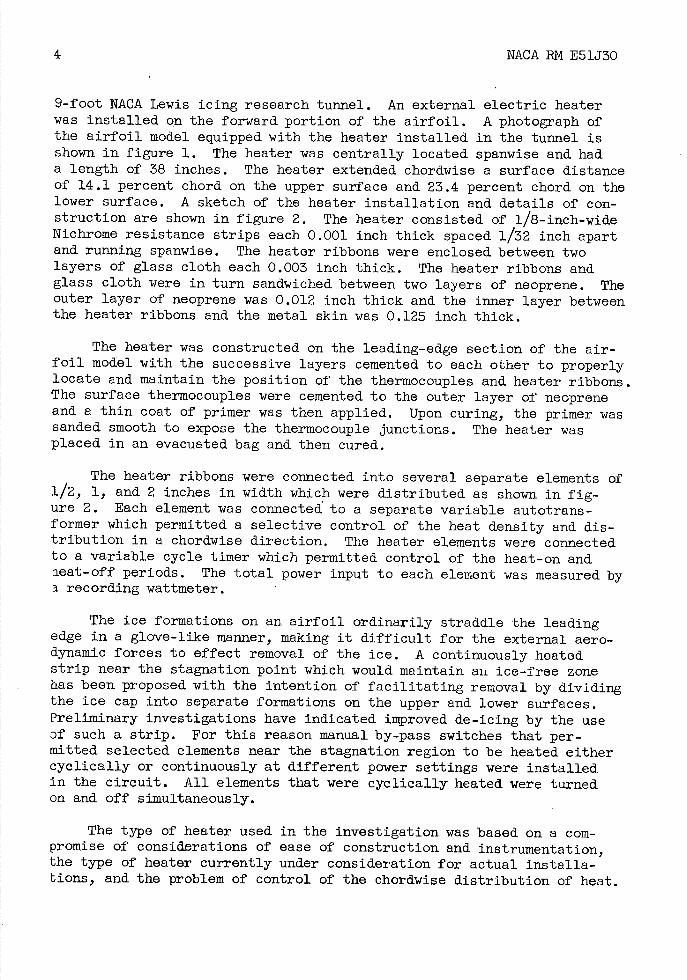
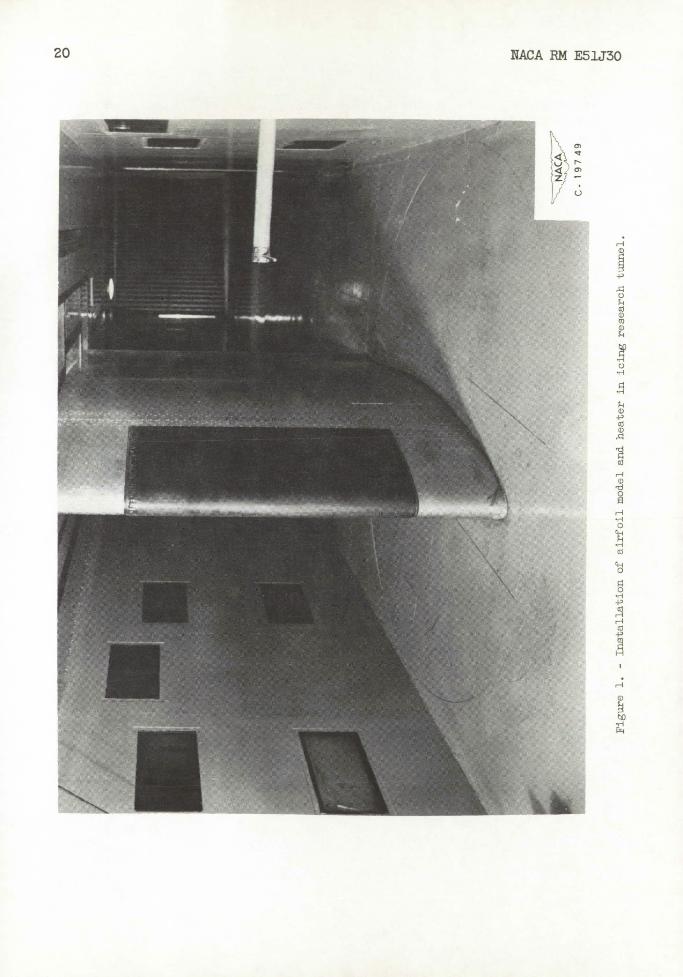
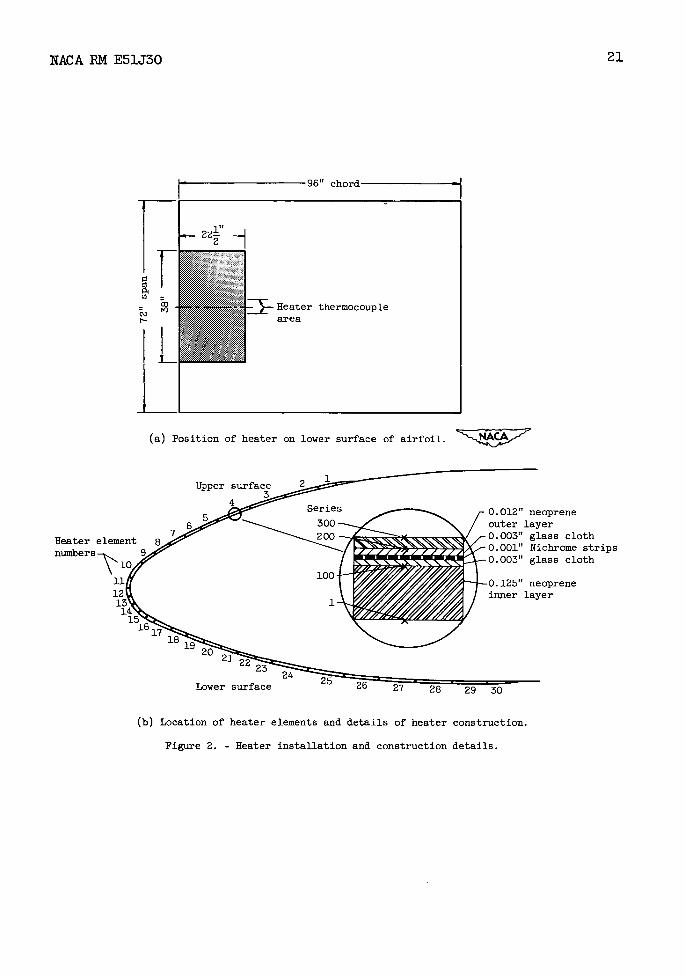
9-foot NACA Lewis icing research tunnel. An external electric heater was installed on the forward portion of the airfoil. A photograph of the airfoil model equipped with the heater installed in the tunnel is shown in figure 1. The heater was centrally located spanwise and had a length of 38 inches. The heater extended chordwise a surface distance of 14.1 percent chord on the upper surface and 23.4 percent chord on the lower surface. A sketch of the heater installation and details of con-struction are shown in figure 2. The heater consisted of 1/8-inch-wide Nicbrome resistance strips each 0.001 inch thick spaced 1/32 inch apart and running spanwise. The heater ribbons were enclosed between two layers of glass cloth each 0.003 inch thick. The heater ribbons and glass cloth were in turn sandwiched between two layers of neoprene. The outer layer of neoprene was 0.012 inch thick and the inner layer between the heater ribbons and the metal skin was 0.125 inch thick.
The heater was constructed on the leading-edge section of the air-foil model with the successive layers cemented to each other to properly locate and. maintain the position of the thermocouples and heater ribbons. The surface thermocouples were cemented to the outer layer of neoprene and a thin coat of primer was then applied. Upon curing, the primer was sanded smooth to expose the thermocouple junctions. The heater was placed in an evacuated bag and then cured.
The heater ribbons were connected into several separate elements of 1/2, 1, and 2 inches in width which were distributed as shown in fig-ure 2. Each element was connected to a separate variable autotrans-former which permitted a selective control of the heat density and dis-tribution in a chordwise direction. The heater elements were connected to a variable cycle timer which permitted control of the heat-on and ieat-off periods. The total power input to each element was measured by . recording wattmeter.
The ice formations on an airfoil ordinarily straddle the leading edge in a glove-like manner, making it difficult for the external aero-dynamic forces to effect removal of the ice. A continuously heated strip near the stagnation point which would maintain au ice-free zone has been proposed with the intention of facilitating removal by dividing the ice cap into separate formations on the upper and lower surfaces. Preliminary investigations have indicated improved de-icing by the use of such a strip. For this reason manual by-pass switches that per-initted selected elements near the stagnation region to be heated either cyclically or continuously at different power settings were installed in the circuit. All elements that were cyclically heated were turned on and off simultaneously.
The type of heater used in the investigation was based on a com -promise of considerations of ease of construction and instrumentation, the type of heater currently under consideration for actual installa-bions, and the problem of control of the chordwise distribution of heat.
NACA RN E51J30 5
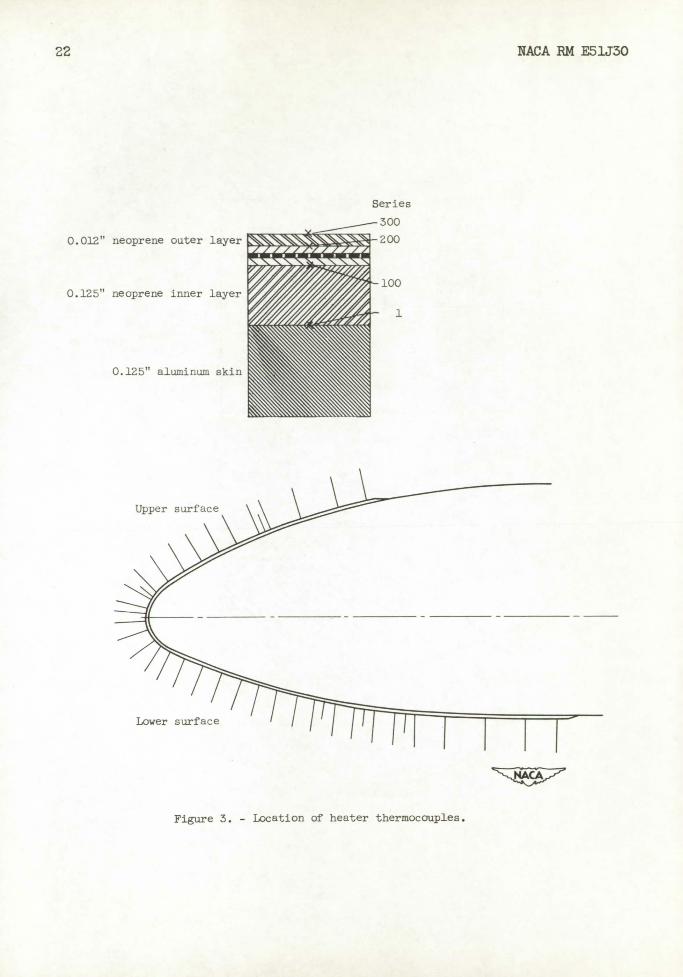
Numerous thermocouples were located in the central plane of the heater and. were distributed in four layers as shown in figure 3. The two sets of thermocouples on each side of the heater ribbon enabled measurements to be made of the heat flow both inward and outward during steady-state conditions. The two outer layers of thermocouples were used in transient conditions to measure the heat flow outward from the heater to the ice. Calculations indicated that the thermal capacity of the outer layer of neoprene was small enough that the temperature gradi-ent through the outer layer was essentially linear after approximately the first second of heating for the conditions of temperature and heat flux employed in the investigation. The thermocouples in the heater section consisted of 30 gage iron and constantan wire rolled down to a ribbon of approximately 0.0025 inch thickness. The ribbons were butt welded and were laid chordwise with the adjacent thermocouple junctions staggered to obtain the desired chordwise spacing. Thermocouples were also installed in the metal skin underneath and behind the heater. All thermocouples were recorded on flight recorders.
Measurement of the tunnel total temperature was obtained from shielded thermocouples located in the low-velocity section of the tunnel. All temperature measurements were referenced to a common bath tempera-ture. The tunnel airspeed and angle of attack were obtained from the standard tunnel instrumentation. The liquid-water content and droplet size were obtained from a calibration of the tunnel spray system.
CONDITIONS AND PROCEDURE
Preliminary to the cyclic de-icing investigation, a determination was made with continuous heating in dry air of the effective thermal resistance of the layer of neoprene between the two outer layers of thermocouples. Measurements were made of the power input to each ele-ment and the temperatures throughout the heater. From the measured values of power and temperature an average effective thermal conduc-tivity of 107.4 Btu/(hr)ft) 2 (F) for the outer layer of neoprene was obtained. This value was used with the measured temperature drop obtained in subsequent cyclic de-icing tests to compute the heat flow from the heater to the ice. Within the accuracy of the temperature measurements it was not possible to find any variation of the conduc-tivity with the mean temperature of the neoprene.
In the tunnel study of the requirements for cyclic de-icing the procedure was to determine by trial the minimum power density input and the chordwise distribution of heat for a specified heat-on period for given conditions of heat-off period, air temperature, airspeed, angle of attack, and water content. This optimum condition was defined as that power input that just resulted in complete and consistent ice removal at the end of the specified heat-on period. Upon attainment of
6
NACA RM E51J30
this optimum power input condition, all conditions were maintained con-stant and. all pertinent data were recorded. Visual observations were made of the d.e-icing performance and photographs were taken during and after ice removal for each optimum set of conditions. Heat was applied to the wing before the sprays were turned on for most cases, but some runs were made with the heat applied after the water sprays were turned on.
The meteorological conditions investigated were as follows:
Liquid-water content
(grains/cu m)
Volume median Droplet size droplet size distribution1 (microns)
0.25 6 D
.65 8 E
1.0 10 G
RESULTS
Continuously Heated Areas
Cyclic de-icing of an airfoil is much more difficult than that of a rotating body such as a propeller since centrifugal forces are not pre-sent to aid the aerodynamic forces in effecting ice removal. For this reason the use of the burn-through or parting strip has been proposed to facilitate ice removal. The parting strip consists of a narrow spanwise area located near the airfoil stagnation region and is continuously heated in contrast to the cyclic heating of the remaining heated area. The tunnel investigation included the use of the parting strip as well as runs with the entire area cyclically heated. Quick, complete, and consistent ice removal was accomplished only with the aid of the parting strip. For the case of all cycled heating, ice removal was obtained but it was sporadic; and good removal was usually obtained only on alternate cycles.
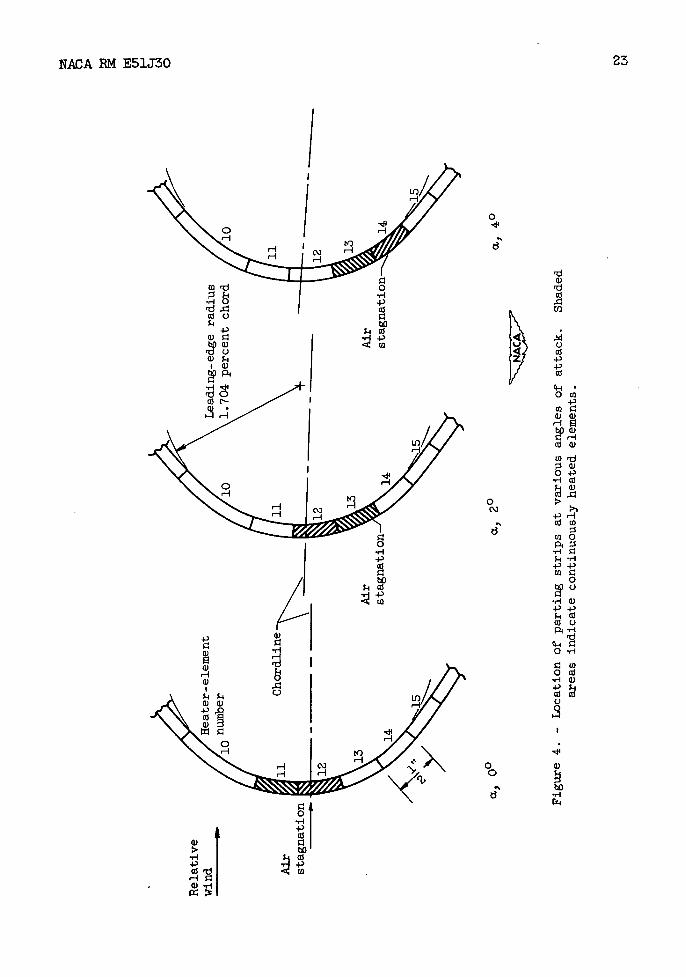
Parting-strip locations. - The location of the parting strip that resulted in the best ice removal is presented in figure 4 for various angles of attack. The heater-element arrangement around the leading edge and the location of the air stagnation point are also indicated.
he droplet size distribution used herein is that defined in reference D and was obtained by the rotating multi-cylinder technique.
NACA RM E51J30 7
The best parting-strip location is very close to the stagnation point at each angle of attack. It might be assumed that the parting strip should be located at the point of the maximum rate of impingement to divide equally the formation. This point, as indicated by experience and the calculations of reference 11, lies between the stagnation point and the foremost point of the airfoil. The results of figure 4, however, mdi-
te that the parting strip should lie between the stagnation point and the point of maximum impingement. For the full range of air temperature (19° to _110 F) it was necessary to use a parting strip 1 inch wide, as indicated in figure 4. At the higher temperatures (greater than 200 F) good removal was obtained with only a 1/2-inch strip. The precise loca-tion of the parting strip, however, was not found to be critical and variations in water content and droplet size had. no appreciable effect. A single 1-inch-wide strip located at a point corresponding to elements 12 and 13 (fig. 4) would probably result in good removal over the full temperature range and a range of angle of attack of _20 to 6°.
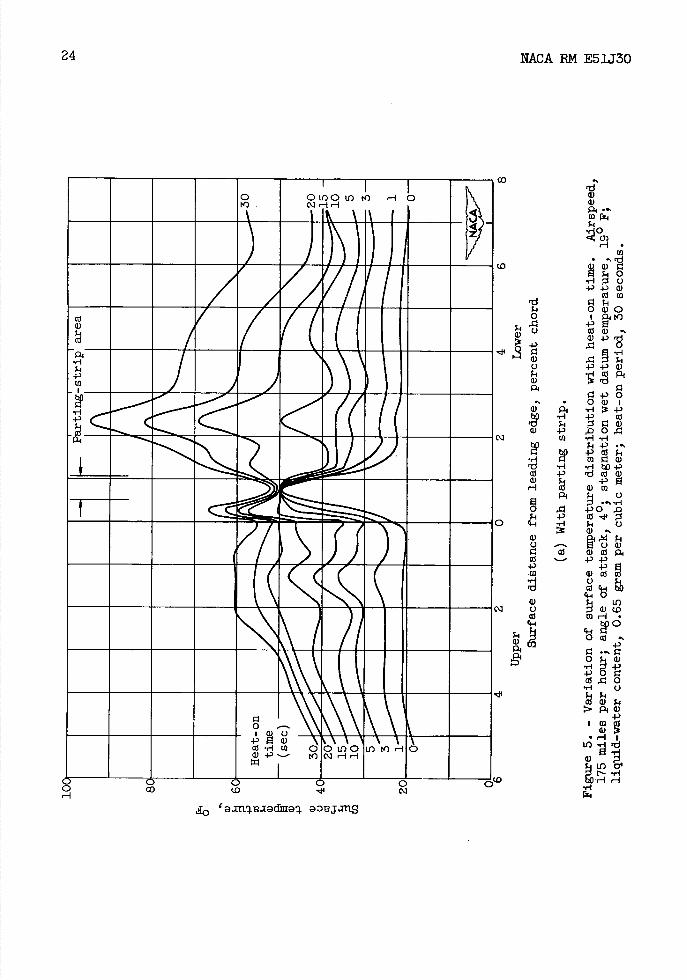
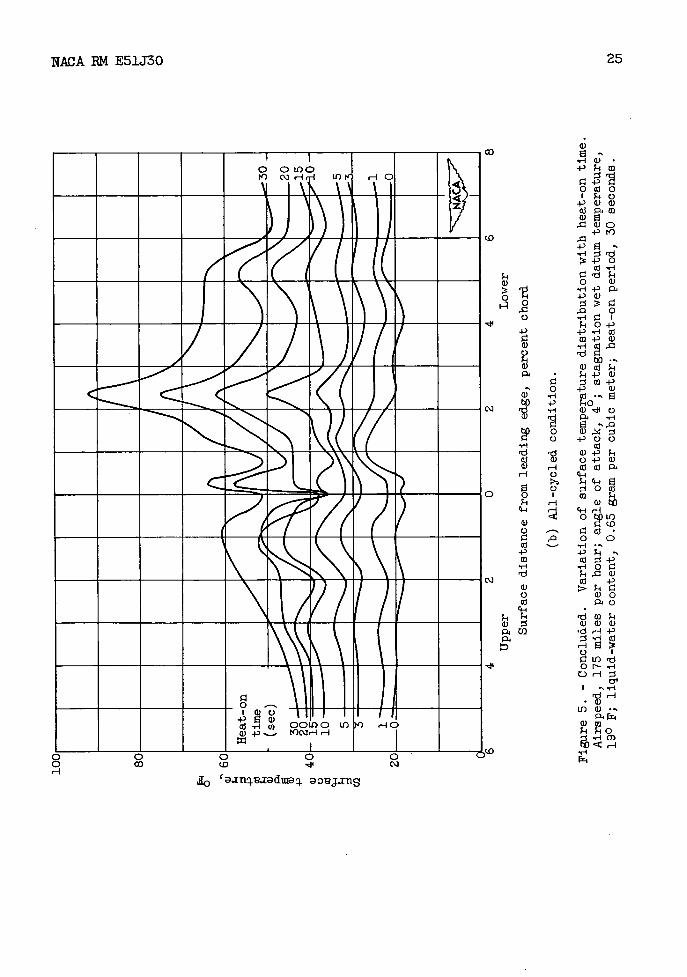
Parting-strip temperatures. - Because of conduction losses to the adjacent cycled areas, a peak surface temperature of approximately 5Q0 F was maintained at the center of the parting strip to insure a finite ice-free area and to prevent the adjacent ice formations from bridging over. The variation of the parting-strip surface temperature during de-icing is shown in figure 5(a) at various time intervals. The surface temperatures of the adjacent cyclically heated areas are also shown. For comparison the heated surface temperatures for the case in which all the heated elements including the parting strip area were cyclically heated is given in figure 5(b). All conditions of cycled power density, angle of attack, air temperature and speed, and liquid-water content were maintained constant for the two conditions. For the conditions of figure 5(a), a 1/2-inch-wide parting strip was used extending from 0.52 to 1.04 percent chord on the lower surface. The cycled power density used was the minimum required to obtain complete removal within the 30-second heat-on period. For the conditions of figure 5(b), the parting-strip area was cycled at the same power density as the adjacent cycled areas.
The results of figure 5(a) indicate an initial temperature peak in the parting-strip area which persists for approximately 5 to 10 seconds, at which time melting of the inner layer on the adjacent areas has begun. The peak temperature in the center of the parting strip exhibited very little change during the heating period, rising only 3° F, and during the heat-off period cooled to its initial temperature. The maximum variation in the peak parting-strip temperature was approximately 5° F. Comparing figures 5(a) and 5(b) shows that the direct effect of the parting strip on the adjacent surface temperatures is rather small, influencing only the area within approximately 0.5 percent chord on each side of the parting strip. The temperatures in the cycled areas
8
NACA RM E51J30
beyond the parting-strip area for the two conditions are very similar in magnitude and rate of change. The results show a steady rise during approximately the first 10 seconds of heating with sudden changes in surface temperature occurring thereafter, together with large peak values resulting on the lower surface. The greatest differences in the surface temperatures occur near the leading edge where for the all-cycled condition the curves become very irregular.
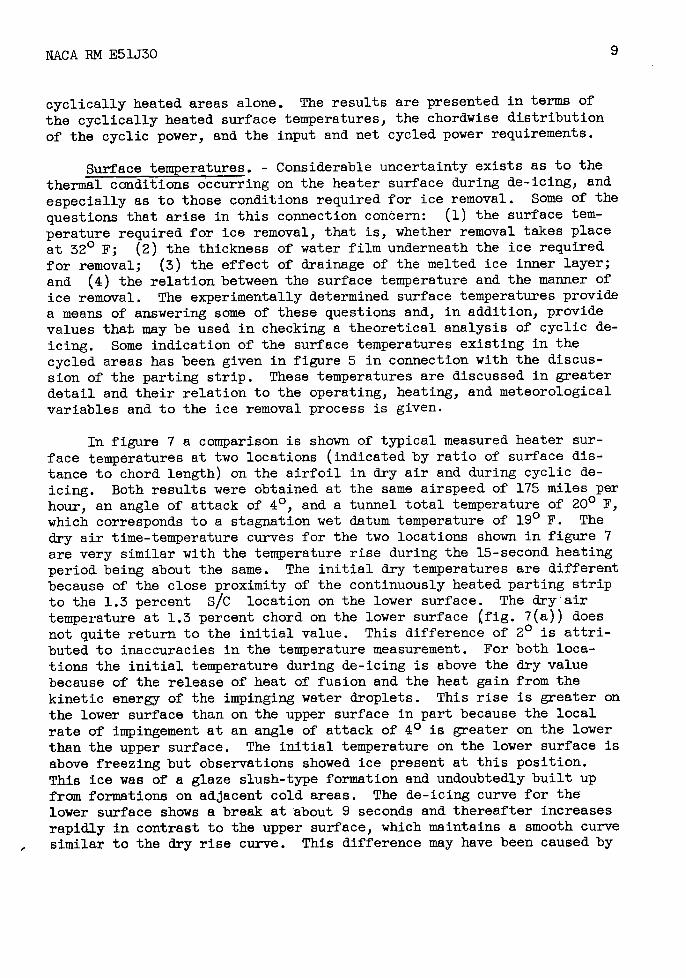
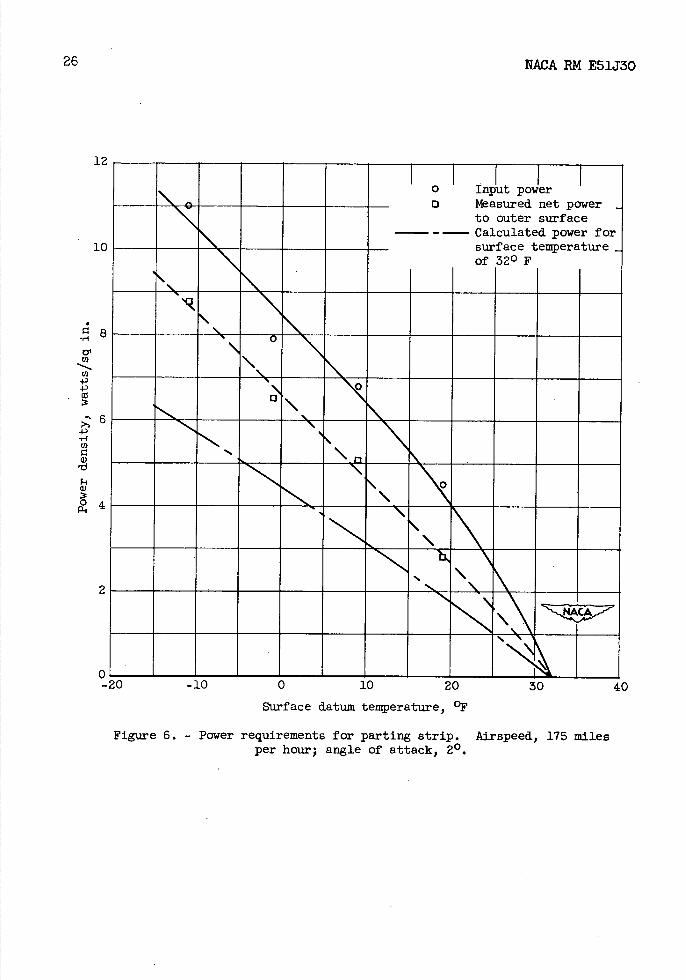
Parting-strip power requirements. - The input power densities for the parting strip obtained in the tunnel investigation are shown in fig-ure 6 as a function of the surface datum temperature. The determina-tion of these power requirements was based on the criterion of the minimum power required to maintain a finite ice-free area and the best removal for a given condition. The surface datum temperature is defined as the ambient air temperature plus the adiabatic rise, and in the case of wet air conditions, minus the temperature depression resulting from evaporation of water from the airfoil surface. The measured and cal-culated dry datum temperatures agreed within the accuracy of the tem-perature measurement. The wet datum temperature is an unheated hypo-thetical temperature and cannot be measured during icing. For the range of airspeed and temperature investigated, however, the difference in the dry and wet datum temperatures is very small, being less than 30 F. The power requirement was found to be essentially a single-valued func-tion of the datum temperature with no significant variations resulting from changes in angle of attack, water content, droplet size, or cycle times.
A curve showing the net power to the outer surface as calculated from the measured temperatures is also shown. The net power to the outer surface is approximately 70 to 80 percent of the input power indi-cating the efficiency of the heater. The calculated power required to maintain the surface at 32° F is also shown in figure 6 as indicating the minitnum theoretical power requirement. This power was calculated using the Martinelli equation (reference 12) for the heat-transfer coefficient for the stagnation point of a cylinder and a water content of 1.0 gram per cubic meter. These values differ from the measured net powers primarily, because of the higher temperatures (approximately 50 F) used in the tunnel investigation.
Cyclically Heated Areas
As stated in the preceding section, prompt, complete, and consist-ent de-icing was obtained only with the use of the parting strip. For this reason the remainder of the discussion is concerned with the results obtained from those investigations employing the parting strip and necessarily includes data from the parting strip as well as from the
NACA IM E51J30 9
cyclically heated areas alone. The results are presented in terms of the cyclically heated surface temperatures, the chordwise distribution of the cyclic power, and the input and net cycled power requirements.
Surface temperatures. - Considerable uncertainty exists as to the thermal conditions occurring on the heater surface during d.e-icing, and especially as to those conditions required for ice removal. Some of the questions that arise in this connection concern: (1) the surface tem-perature required for ice removal, that is, whether removal takes place at 32° F; (2) the thickness of water film underneath the ice required for removal; (3) the effect of drainage of the melted ice inner layer; and (4) the relation between the surface temperature and the manner of ice removal. The experimentally determined surface temperatures provide a means of answering some of these questions and, in addition, provide values that may be used in checking a theoretical analysis of cyclic de-icing. Some indication of the surface temperatures existing in the cycled areas has been given in figure 5 in connection with the discus-sion of the parting strip. These temperatures are discussed in greater detail and their relation to the operating, heating, and meteorological variables and to the ice removal process is given.
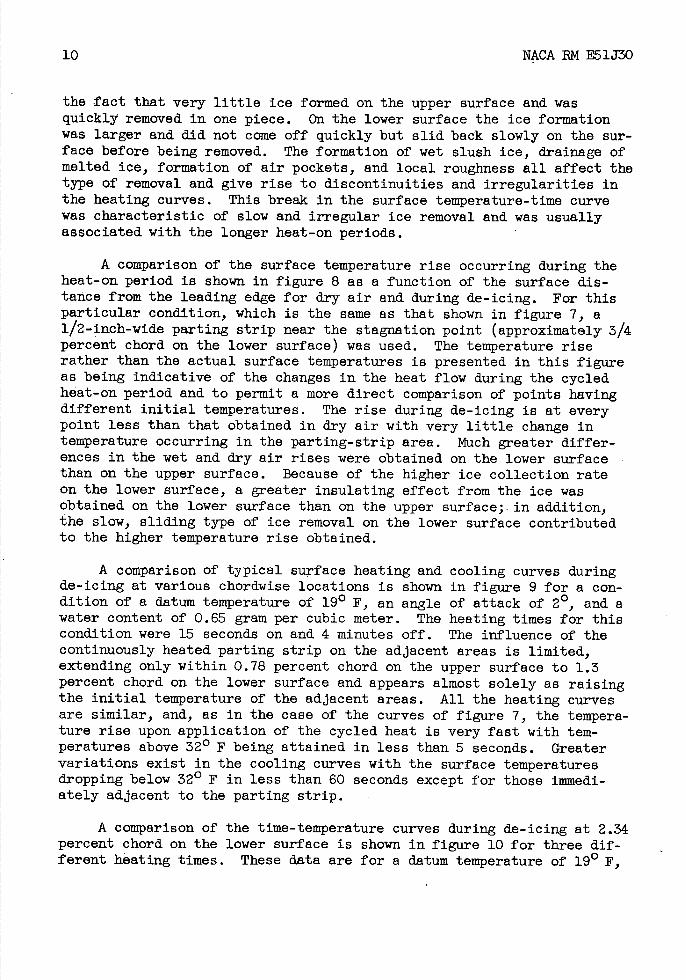
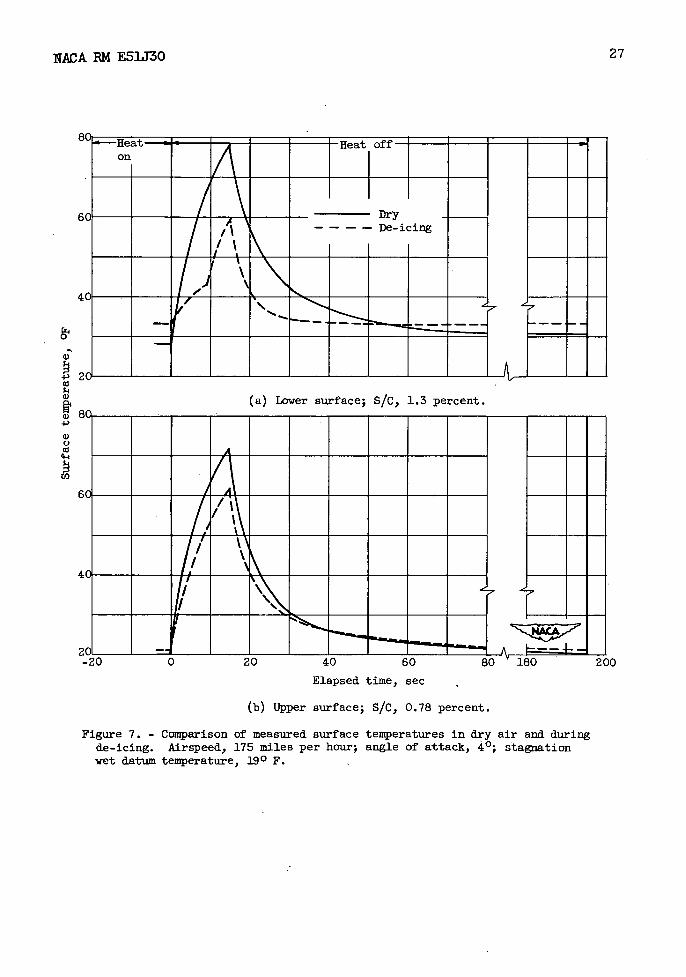
In figure 7 a comparison is shown of typical measured heater sur-face temperatures at two locations (indicated by ratio of surface dis-tance to chord length) on the airfoil in dry air and during cyclic de-icing. Both results were obtained at the same airspeed of 175 miles per hour, an angle of attack of 40, and a tunnel total temperature of 200 F, which corresponds to a stagnation wet datum temperature of 190 F. The dry air time-temperature curves for the two locations shown in figure 7 are very similar with the temperature rise during the 15-second heating period being about the same. The initial dry temperatures are different because of the close proximity of the continuously heated parting strip to the 1.3 percent s/c location on the lower surface. The dry air temperature at 1.3 percent chord on the lower surface (fig. 7(a)) does not quite return to the initial value. This difference of 2° is attri-buted to inaccuracies in the temperature measurement. For both loca-tions the initial temperature during de-icing is above the dry value because of the release of heat of fusion and the heat gain from the kinetic energy of the impinging water droplets. This rise is greater on the lower surface than on the upper surface in part because the local rate of impingement at an angle of attack of 40 is greater on the lower than the upper surface. The initial temperature on the lower surface is above freezing but observations showed ice present at this position. This ice was of a glaze slush-type formation and undoubtedly built up from formations on adjacent cold areas. The de-icing curve for the lower surface shows a break at about 9 seconds and thereafter increases rapidly in contrast to the upper surface, which maintains a smooth curve similar to the dry rise curve. This difference may have been caused by
10 NACA FM E51J30
the tact that very little ice formed on the upper surface and was quickly removed in one piece. On the lower surface the ice formation was larger and did not come off quickly but slid back slowly on the sur-face before being removed. The formation of wet slush ice, drainage of melted ice, formation of air pockets, and local roughness all affect the type of removal and give rise to discontinuities and irregularities in the heating curves. This break in the surface temperature-time curve was characteristic of slow and irregular ice removal and was usually associated with the longer heat-on periods.
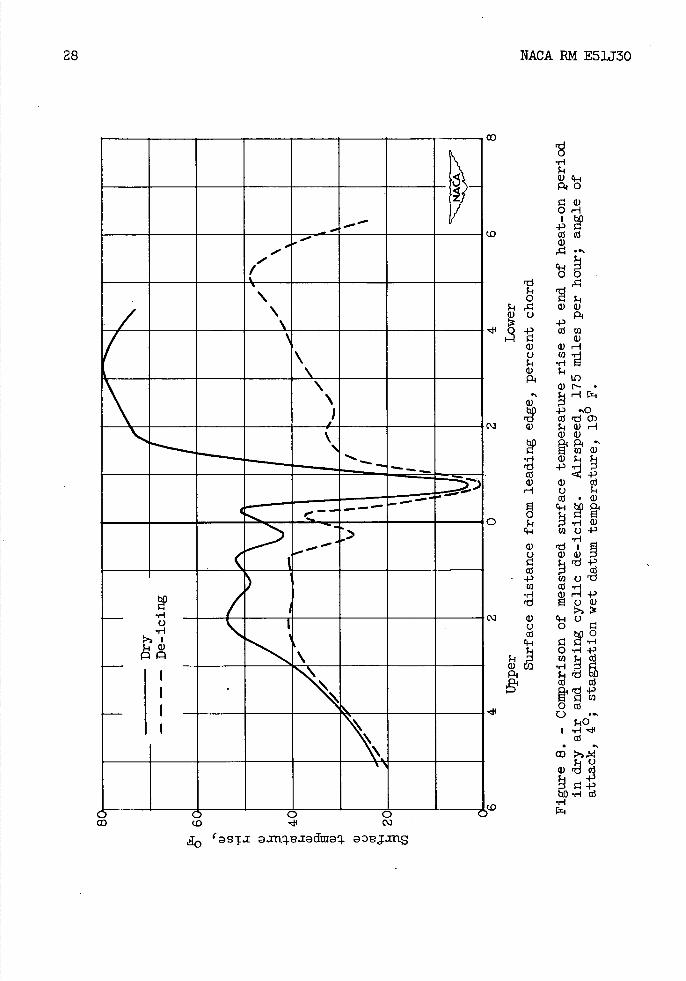
A comparison of the surface temperature rise occurring during the heat-on period is shown in fIgure 8 as a function of the surface dis-tance from the leading edge for dry air and during de-icing. For this particular condition, which is the same as that shown in figure 7, a 1/2-inch-wide parting strip near the stagnation point (approximately 3/4 percent chord on the lower surface) was used. The temperature rise rather than the actual surface temperatures is presented in this figure as being indicative of the changes in the heat flow during the cycled heat-on period and to permit a more direct comparison of points having different Initial temperatures. The rise during de-icing is at every point less than that obtained in dry air with very little change in temperature occurring in the parting-strip area. Much greater differ-ences in the wet and dry air rises were obtained on the lower surface than on the upper surface. Because of the higher ice collection rate on the lower surface, a greater insulating effect from the ice was obtained on the lower surface than on the upper surface;. in addition, the slow, sliding type of ice removal on the lower surface contributed to the higher temperature rise obtained.
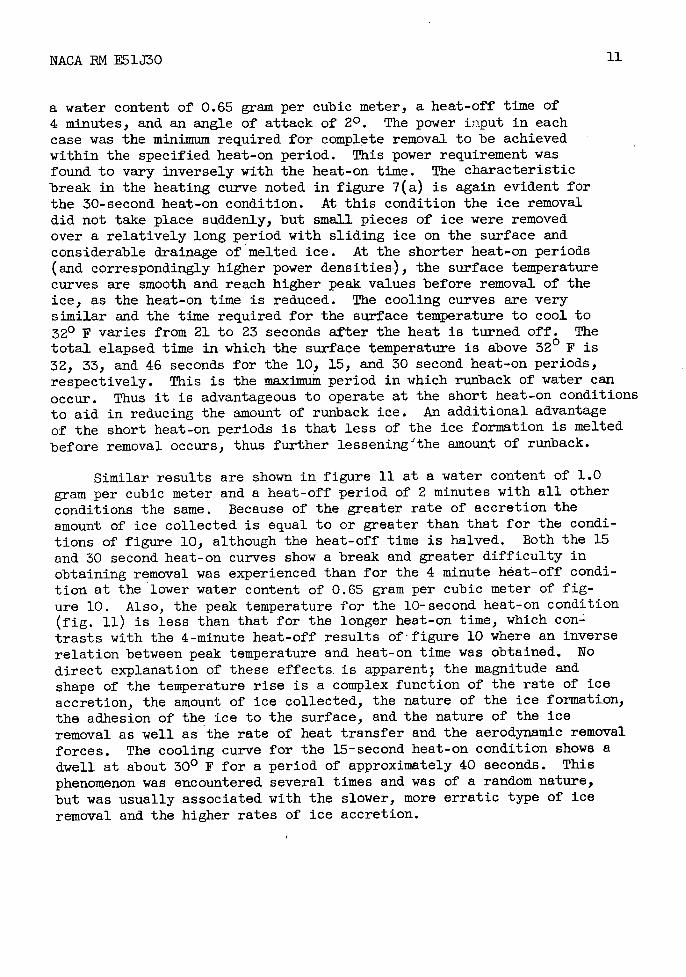
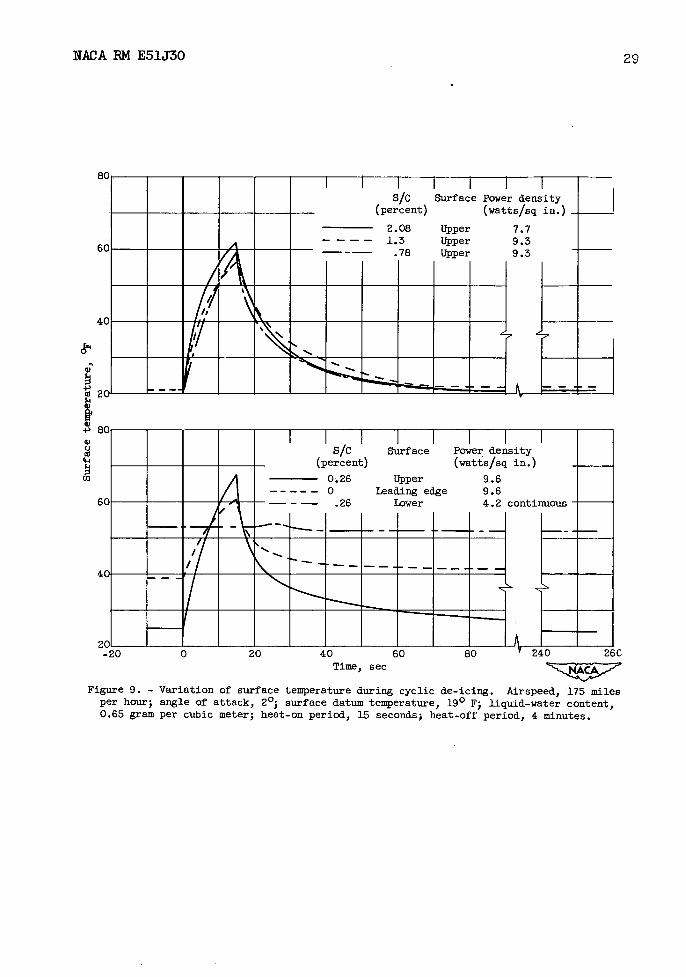
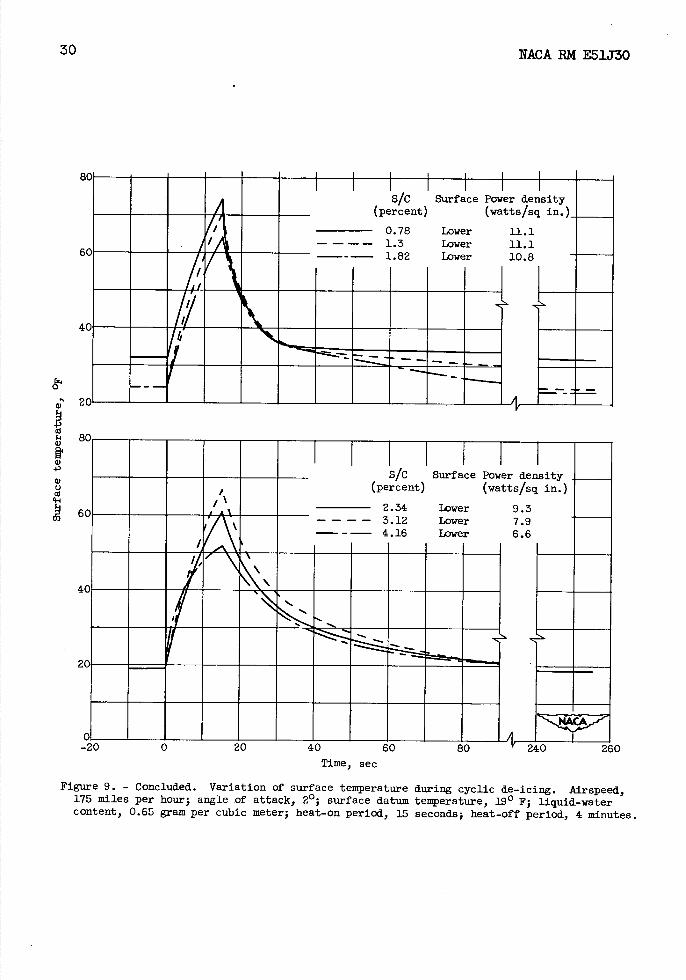
A comparison of typical surface heating and cooling curves during de-icing at various chordwise locations is shown in figure 9 for a con-dition of a datum temperature of 190 F, an angle of attack of 20, and a water content of 0.65 gram per cubic meter. The heating times for this condition were 15 seconds on and 4 minutes off. The influence of the continuously heated parting strip on the adjacent areas is limited, extending only within 0.78 percent chord on the upper surface to 1.3 percent chord on the lower surface and appears almost solely as raising the initial temperature of the adjacent areas. All the heating curves are similar, and, as in the case of the curves of figure 7, the tempera-ture rise upon application of the cycled heat is very fast with tem-peratures above 320 F being attained In less than 5 seconds. Greater variations exist in the cooling curves with the surface temperatures dropping below 32° F in less than 60 seconds except for those iminedi-ately adjacent to the parting strip.
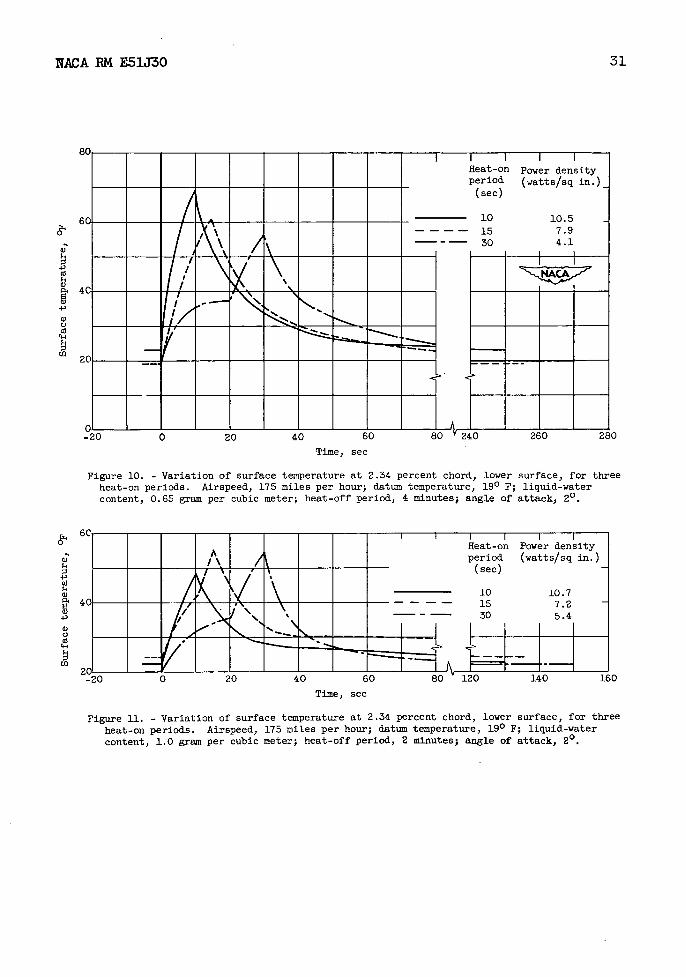
A comparison of the time-temperature curves during de-icing at 2.34 percent chord on the lower surface is shown In figure 10 for three dif-ferent heating times. These data are for a datum temperature of 190 F,
NACA PM E51J30 11
a water content of 0.65 gram per cubic meter, a heat-off time of 4 minutes, and. an angle of attack of 20. The power iiput in each case was the minimum required for complete removal to be achieved within the specified heat-on period. This power requirement was found to vary inversely with the heat-on time. The characteristic break in the heating curve noted in figure 7(a) is again evident for the 30-second heat-on condition. At this condition the ice removal did not take place suddenly, but small pieces of ice were removed over a relatively long period with sliding ice on the surface and. considerable drainage of melted ice. At the shorter heat-on periods (and correspondingly higher power densities.), the surface temperature curves are smooth and reach higher peak values before removal of the ice, as the heat-on time is reduced. The cooling curves are very similar and the time required for the surface temperature to cool to 32° p varies from 21 to 23 seconds after the heat is turned off. The total elapsed time in which the surface temperature is above 32° F is 32, 33, and 46 seconds for the 10, 15, and 30 second. heat-on periods, respectively. This is the maximum period in which runback of water can occur. Thus it is advantageous to operate at the short heat-on conditions to aid in reducing the amount of runback ice. An additional advantage of the short heat-on periods is that less of the ice formation is melted before removal occurs, thus further 1essening'the amoun.t of runback.
Similar results are shown in figure 11 at a water content of 1.0 gram per cubic meter and a heat-off period of 2 minutes with all other conditions the same. Because of the greater rate of accretion the amount of ice collected is equal to or greater than that for the condi-tions of figure 10, although the heat-off time is halved. Both the 15 and 30 second heat-on curves show a break and greater difficulty in obtaining removal was experienced. than for the 4 minute heat-off condi-tion at the lower water content of 0.65 gram per cubic meter of fig-ure 10. Also, the peak temperature for the 10-second heat-on condition (fig. ii) is less than that for the longer heat-on time, which con-trasts with the 4-minute heat-off results of figure 10 where an inverse relation between peak temperature and heat-on time was obtained. No direct explanation of these effects. is apparent; the magnitude and shape of the temperature rise is a complex function of the rate of ice accretion, the amount of ice collected., the nature of the ice formation, the adhesion of the ice to the surface, and the nature of the ice removal as well as the rate of heat transfer and the aerodynamic removal forces. The cooling curve for the 15-second heat-on condition shows a dwell at about 30° F for a period of approximately 40 seconds. This phenomenon was encountered several times and was of a random nature, but was usually associated with the slower, more erratic type of ice removal and the higher rates of ice accretion.
12 NACA PM E51J30
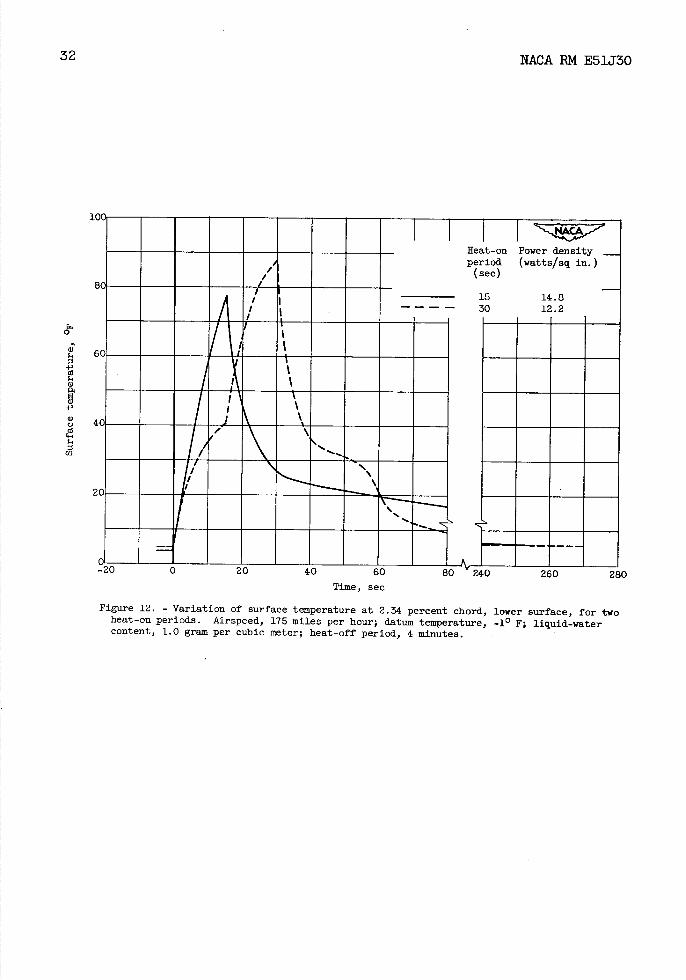
Typical surface temperature-time curves at this same location are shown in figure 12 at a datum temperature of _10 F for two heat-on times. 1n general the results are similar to those of figures 10 and. 11, but much higher peak values were obtained. The higher peak temperatures are caused by the greatly increased power densities required at the low temperature condition for prompt removal.
Examination of the results of figures 7 to 12 shows that in no case did complete removal, which took place oniy at the end o the heat-on period, occur at a surface temperature of 320 F. The range of peak sur-face temperatures at which ice removal occurred extended from 5Q0 to 1000 F. Considerable variation in the surface temperature at the point of removal with the operating, meteorological, and heating conditions existed and no correlation of these results was possible. The point of ice removal cannot as yet be defined in terms of the surface temperature for specific conditions. The slower temperature rise curves as well as irregularities and breaks in the curves were found to be associated with the slower ice removal. A rapid and smooth rise in the surface tempera -ture accompanied the fast removal obtained at the short heating periods as well as the minimum total time in which the surface temperatures were above the freezing point. At these short heating periods the ice removal occurred almost simultaneously at the end of the period, whereas with the longer heat-on, lower power density condition the ice was removed in numerous small pieces with the removal process taking place over a considerable portion of the heat-on period.
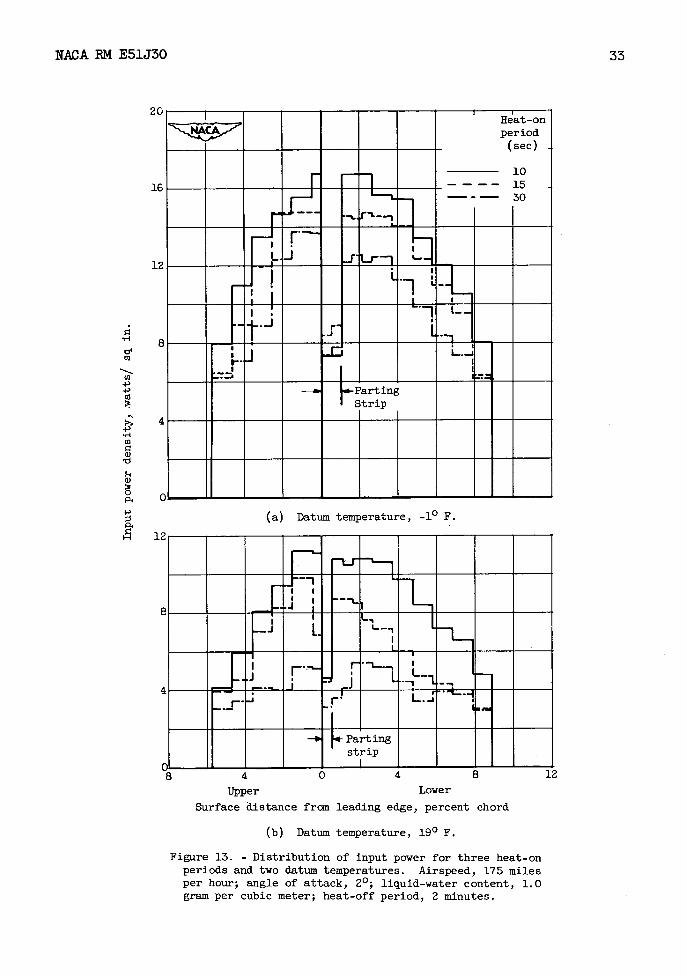
Distribution of cyclic power. - The construction of the experi-mental heater permitted the study of various chordwise distributions of the cycled heat. Thus it was possible to determine the optimum chord-wise extent and distribution of heating for this particular type of heater. This optimum condition was defined as the minimum extent of heating and local heat input that resulted in the most complete and con-sistent ice removal together with the minimum amount of runback for a specific operating, meteorological, and cycle time condition. Typical optimum heating distributions are shown in figure 13 for two air tem-peratures and three heat-on times for an angle of attack of 20. The location and relative magnitude of the parting-strip requirement are indicated. The power densities shown are the instantaneous densities based on the local areas heated at one particular time. With the exception of the continuously heated parting-strip area, an essentially uniform distribution of cycled power input in the region from approxi-
mately 1 percent chord on the upper surface to approximately 4 percent chord on the lower surface resulted in the best performance. This region of uniform power corresponded closely to the limits of direct water impingement. Downstream of this uniform area the power densities quickly reduce. Extending heating beyond the limits shown here did not aid in the d.e-icing nor in eliminating the amount of runback. The
NACA RM E51J30 13
extent of heating shown in figure 13 is that which provided good de-icing over a range of angle of attack from 0 to 40• Decreasing the heat-on time resulted in an increase in the magnitude of the power density requirement but caused very little change in the shape of the distribution pattern except at the higher air temperature.
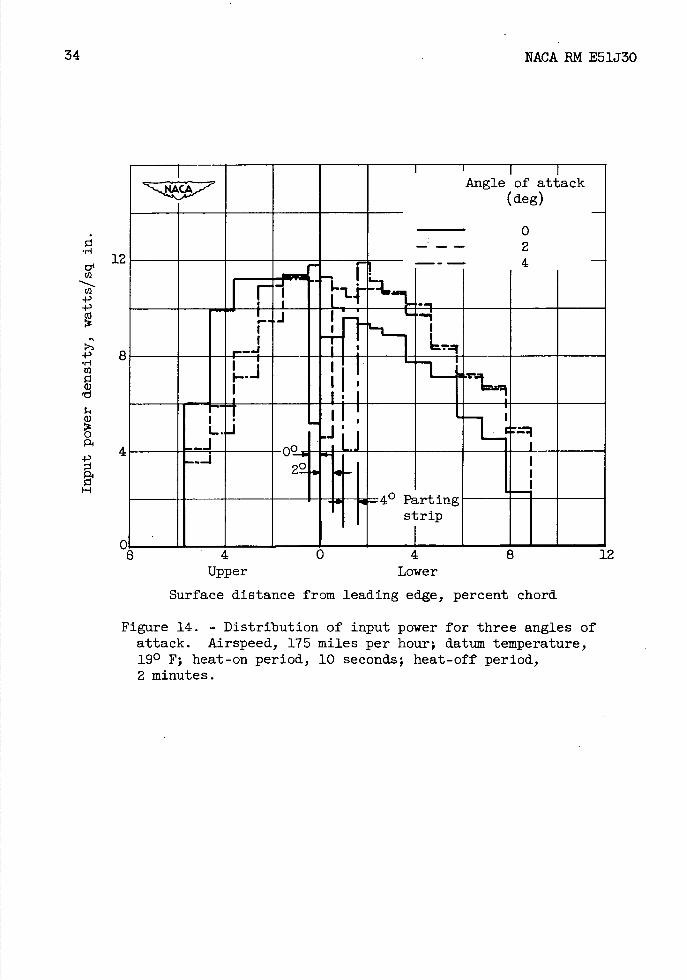
The variation in the heating distribution with angle of attack is shown in figure 14. As might be expected the power on the upper surface decreased with increasing angle of attack, with the opposite true on the lower surface, for a larger percentage of the ice formation collected on the lower surface as the angle of attack was increased.
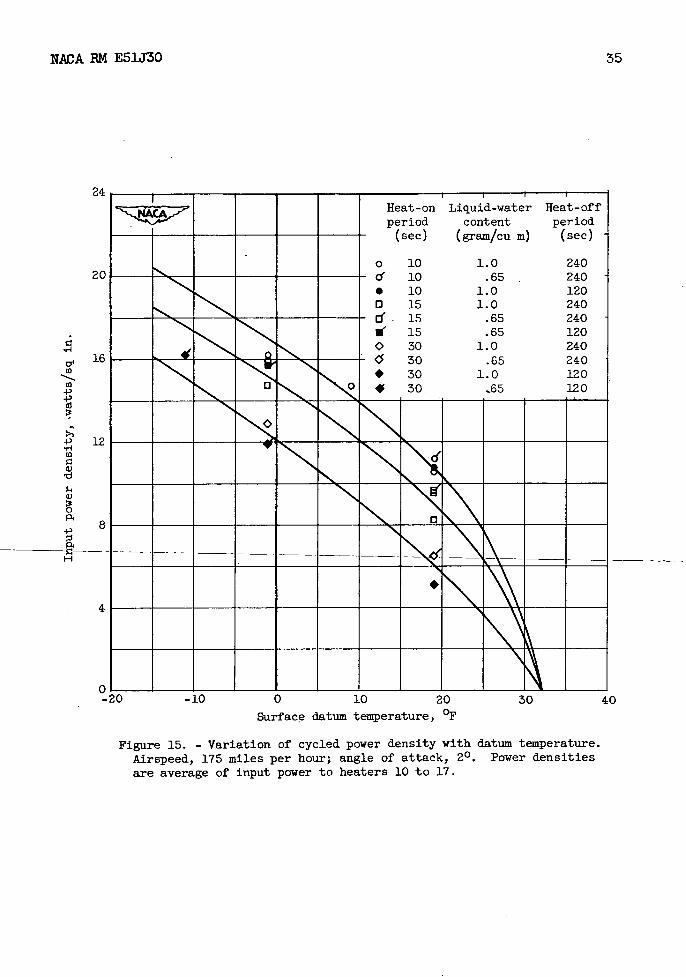
Cycled power requirements. - •The variation of the average input cycled power density with datum temperature is shown in figure 15 for various heat-on and heat-off times, liquid-water contents, and an angle of attack of 20. The average of the cycled power densities between 1 percent chord on the upper surface and 3 percent chord on the lower surface is taken as representative of the input cycled power density requirement. For the range of conditions investigated, the power density for a particular heat-on time appears to be primarily a function of the datum temperature, with variation in the heat-off time and liquid-water content having only a second-order effect. The power density increases with decreasing datum temperature; the curves tend to become linear at the lower temperatures. Higher power densities are required with the shorter heat-on times, as was shown previously in figure 13. This variation of power density with heat-on time may be better shown by a cross plot of these data.
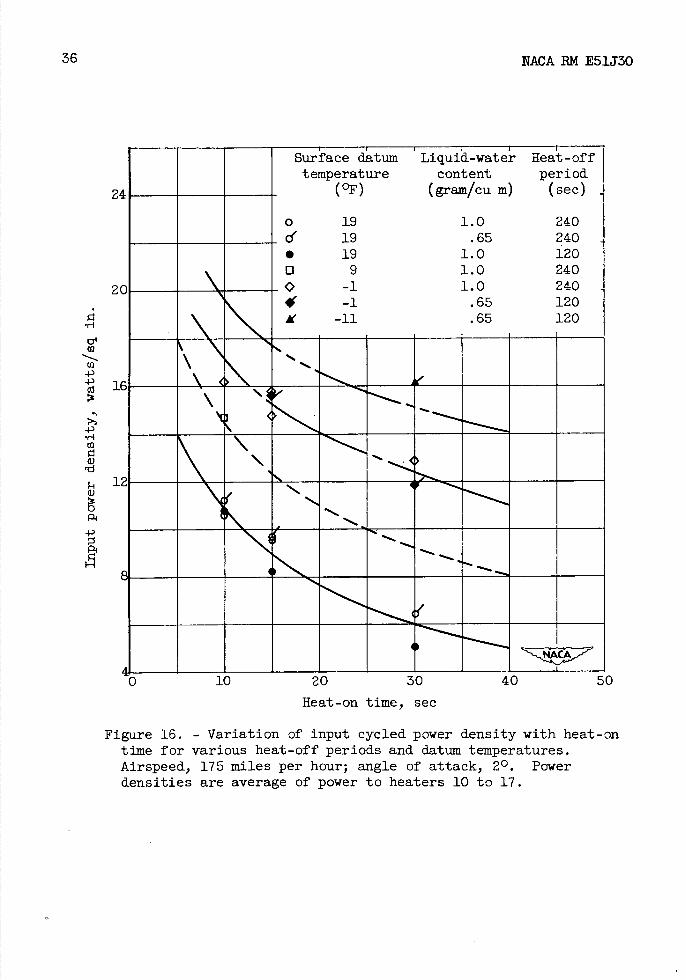
In figure 16 the power density is plotted against heat-on time for a range of datum temperatures, two heat-off periods, and two liquid-water contents. As shown in figure 16, the effect of heat-off period and water content is small and is obscured by the scatter of the data. The increase in power density with decreasing heat-on time is quite rapid. Operation at heat-on times much less than 10 seconds would re-quire a heater capable of withstanding very high power densities. At the longer heat-on times the curves asymptotically approach finite values of power density, and it would seem that operation at heat-on times in excess of 40 seconds would not result in an appreciable reduction in power density.
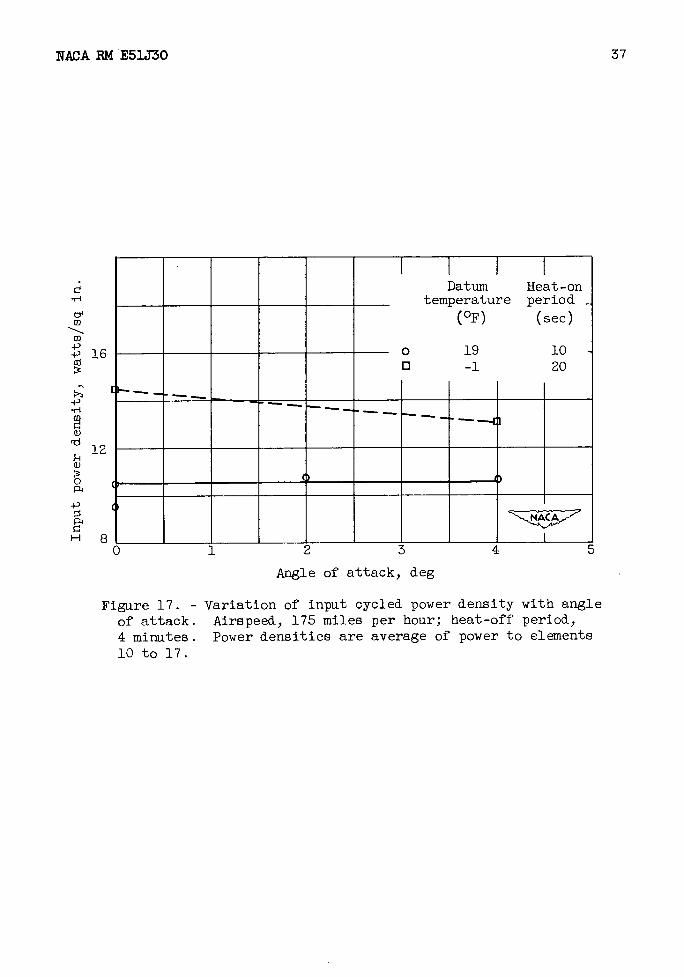
Practically no variation was obtained in the average input cycled power density with angle of attack. The power density as a function of angle of attack is shown in figure 17 for two datum temperatures and two heat-off times at a constant heat-off time of 4 minutes. At a datum temperature of 190 F the power density remains constant with angle of attack.. The power density for -1° F shows a slight decrease with increasing angle 01' attack. This effect may be caused by experimental error, since it was difficult to determine precisely the exact point at which the de-icing performance became marginal.
14
NACA RN E51330
System Efficiency and De-Icing Effectiveness
The heat requirements for the cyclic and continuously heated areas have been presented separately. To evaluate the cyclic de-icing system consideration must be given to the combined heat requirements, a compari-son of the cyclic requirements with those for ice prevention, the eff 1-ciency of the heater, and the effectiveness of the de-icing process itself, including the formation of runback ice.
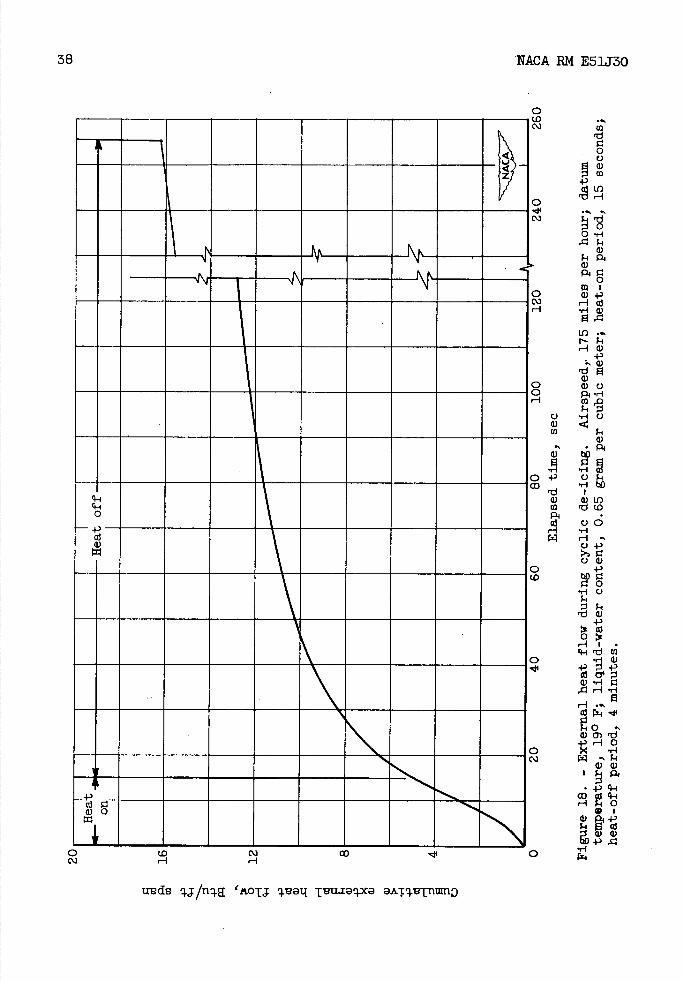
Heater and system efficiency. - From the temperatures measured on the heater surface and those measured underneath the outer layer of rubber, the external heat flow from the heater surface during a cycle was calculated using the value of thermal conductivity determined in the dry air tests. A typical plot of this cumulative external heat flow during a complete cycle as a function of the cycle time is shown in figure 18 for a datum temperature of 19° F, a liquid-water content of 0.65 gram per cubic meter, an angle of attack of 20, and a cycle of 15 seconds heat on and 4 minutes heat off. The heat flow is the cumulative heat dissipated from the heater surface integrated over the entire heated area and includes both the cyclic and continuously heated regions. Approximately 30 percent of the external heat flow is dissi-pated within the 15-second heating period. After the cyclic heat ceases the curve continues to increase fairly rapidly as the residual heat stored in the heater during the heat-on period is given up. Approxi-mately 1 minute after the cyclic heating ceases the curve becomes essentially linear, the cyclic heat having been dissipated, and the only heat flow is that from the continuously heated parting strip. Similar results were obtained at the other operating, meteorological, and heating conditions with the percentage of the external heat flow during the heat-on period varying from approximately 30 to 65 percent of the total external heat flow for a complete cycle, and the larger values obtained at the longer heating periods.
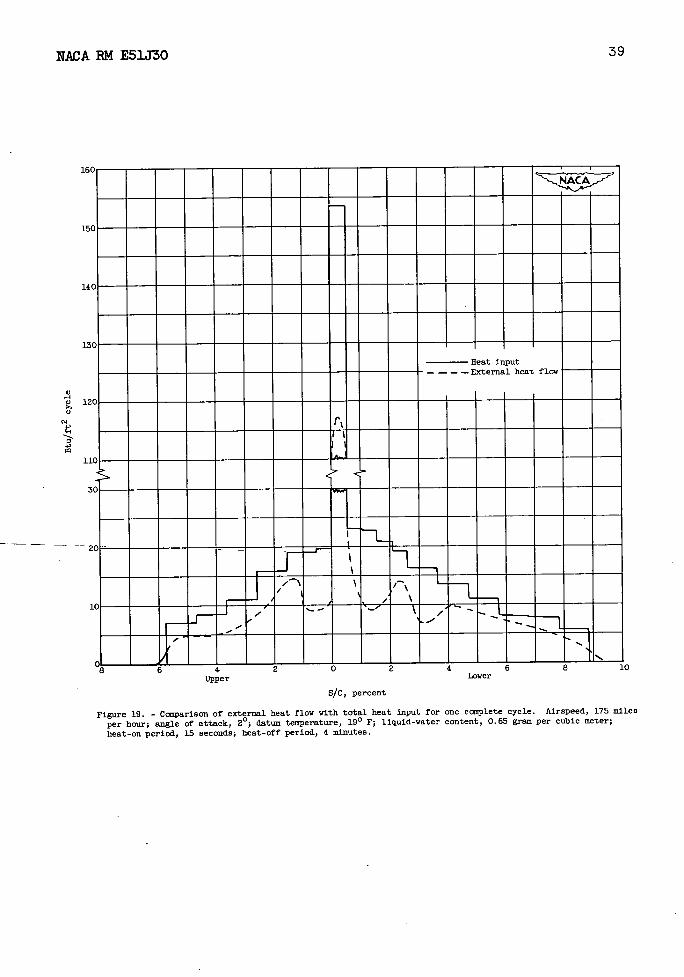
A typical comparison of the cumulative external heat flow during a complete cycle with the total heat input is shown in figure 19 as a function of the chordwise surface distance. These results are for the same condition as figure 18. The large peak in the input and external flow curves at 0.26 percent chord on the lower surface is caused by the continuously heated parting strip. For the condition of figure 19, the integrated external heat flow is approximately 65 percent of the total input per cycle. For all conditions this efficiency ranged from approximately 60 to 80 percent. These efficiencies are indicative of the heat lost through the inner layer of neoprene to the unheated por-tions of the heater and the wing structure. The actual heat useful in de-icing is the total external heat flow during the heat-on period. Thus the true efficiency of the heater is the ratio of the total exter-nal heat flow during the heat-on period to the total energy input per cycle, and for the conditions of figures 18 and 19 this true efficiency would be 30 percent of 65 percent, or 19.5 percent.
NACA RN E51330
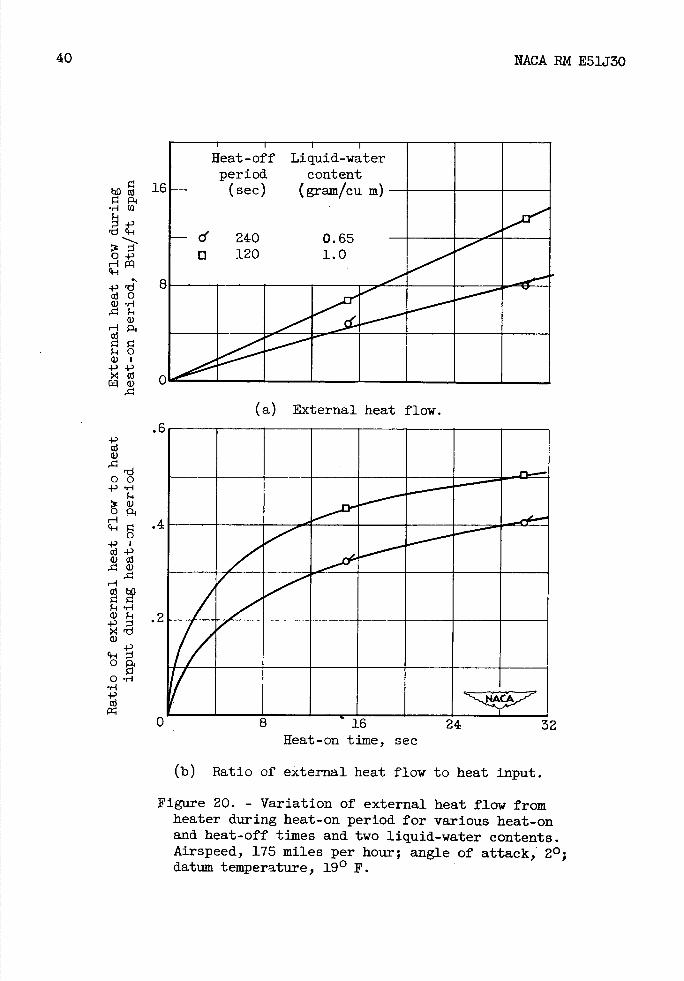
The cumulative external heat flow during the heat-on period is plotted in figure 20 as a function of the heat-on time at a datum tem-perature of 190 F for two heat-off periods and two liquid-water contents. The data indicate a linear increase of the external heat flow with an increasing heat-on time as contrasted with the decrease in cycled input specific power density as indicated in figure 16. Insuff i-dent data are available for a complete correlation of the effect of heat-off time and liquid-water content on the exterilal heat flow. The results of figure 20(a), however, indicate that the external heat flow is not a direct function of ice thickness alone. The amount of ice collected is the product of the airspeed, time, liquid-water content, and collection efficiency. For a specific airfoil and fixed airspeed, altitude, and air temperature, a linear relation of collection eff i-ciency to droplet size may be assumed. Thus the amount of ice collected for the 0.65 gram per cubic meter and 4 minute heat-off condition is equal to or s1ihtly greater than the 1.0 gram per cubic meter and 2 minute heat-off condition. For this reason the differences in the heat flow for the two conditions cannot be explained on the basis of the insulating effect of the ice formation. The larger heat flow at the 1.0 gram per cubic meter and 2 minute heat-off condition may be explained by the greater rate of ice accretion rather than differences in ice thickness. The ratio of the cumulative external heat flow to the heat input during the heat-on period is shown in figure 20(b) with the same trends evident. For the heat-on conditions investigated, the external heat flow is one half or less of the input including both the cycled and continuously heated areas. For the very short heat-on periods, particularly less than 8 seconds, very low heater efficiencies are obtained and very little increase in efficiency would be obtained by operating at longer heat-on periods than those shown. More efficient utilization of the heat input would require a decrease in the heat capacity, an increase in the thermal insulation of the inner layer, and a decrease in the thermal resistance of the outer layer over the heating elements.
The results presented thus far have indicated low heater eff 1-ciencies and large cycled power density requirements for short heat-on conditions. Consideration must be given, however, to the system eff i-ciency and the load on the heat source. For a practical installation the heater for a given aircraft or component may consist of several seg-ments of equal area, each heated in turn, so that there would be no time in which an area is not being heated, with the resultant demand on the heat source being constant. For such a condition an equivalent con-tinuous power density may be defined as the sum of the cycled power to an individual area at any one time and the total power to all the con-tinuously heated areas divided by the total heated area of the aircraft or component. This equivalent continuous power represents the load on the heat source and is a correct measure of the cyclic system eff i -ciency in terms of energy requirement. The equivalent continuous power
16 NACA RN E51J30
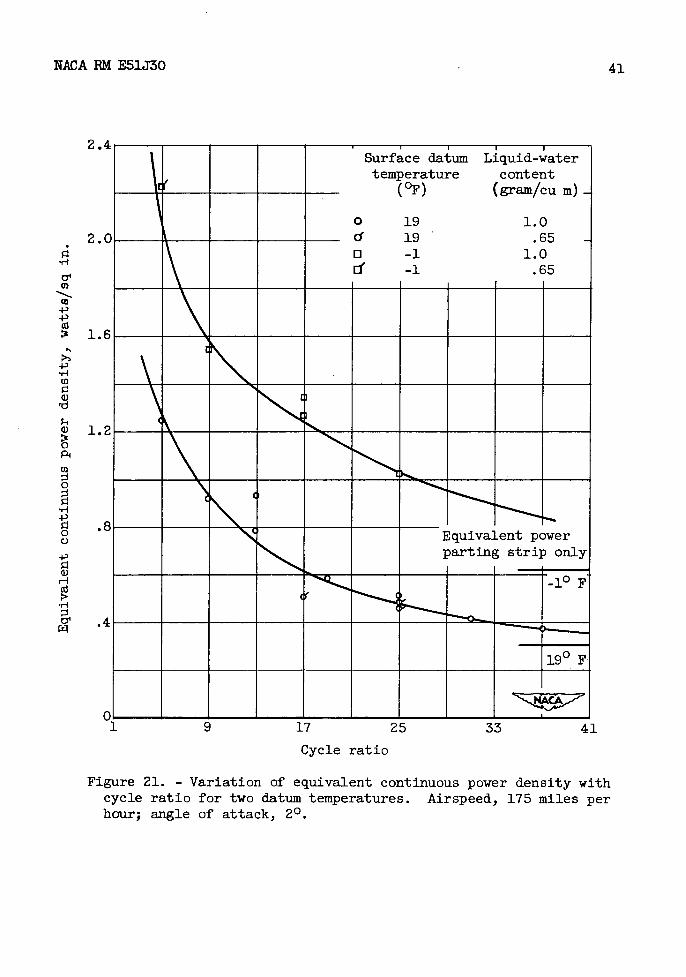
density is plotted in figure 21 as a function of the cycle ratio for two datum temperatures and two liquid-water contents for an angle of attack of 2°. The cycle ratio is defined as the time for a complete cycle di-vided by the heat-on time. The curves show a sharp increase in equiva-lent continuous power at the smaller cycle ratios where they approach a cycle ratio of 1, or a condition of continuous heating. At the larger values of cycle ratio the curves become asymptotic to a finite value of power density equal to the parting-strip input divided by the total area which is independent of the cycle ratio. This limiting parting-strip requirement is indicated in figure 21 for each of the datum temperature conditions. It is apparent that little gain in power saving is made by the use of larger cycle ratios than those shown. For an actual system the determination of the cycle ratio will depend not only on this con-sideration of minimizing the energy demand on the heat source but also on the number of segments into which the heated area may be divided practically, together with the tolerance of the wing to the ice col-lected during the off period in terms of aerodynamic penalties.
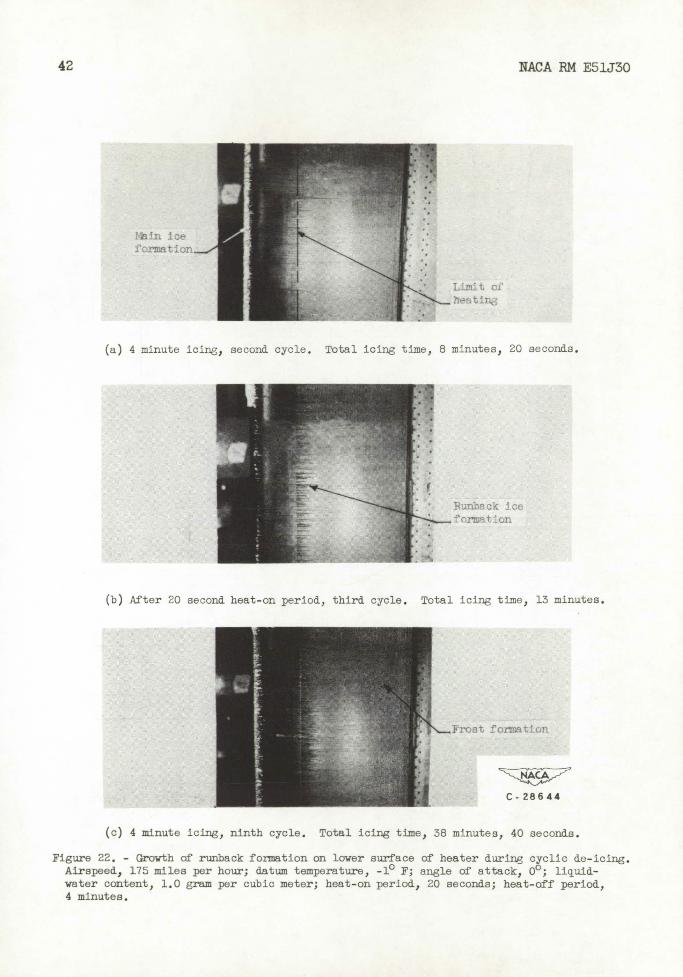
De-icing effectiveness and formation of runback. - The de-icing effectiveness of the cyclic de-icing system may be measured by the speed, completeness, and consistency of removal and the amount of run-back ice formed together with the aerodynamic penalties incurred by the direct impingement and runback ice formations. In the absence of meas-urements of drag and other aerodynamic penalties, the system de-icing effectiveness may be indicated by photographs taken during the de-icing process. Typical de-icing and growth of the runback formation are shown in figure 22. The pictures were taken during cyclic operation through transparent sections in the tunnel side walls and show the lower surface on the airfoil with the limit of heating indicated.
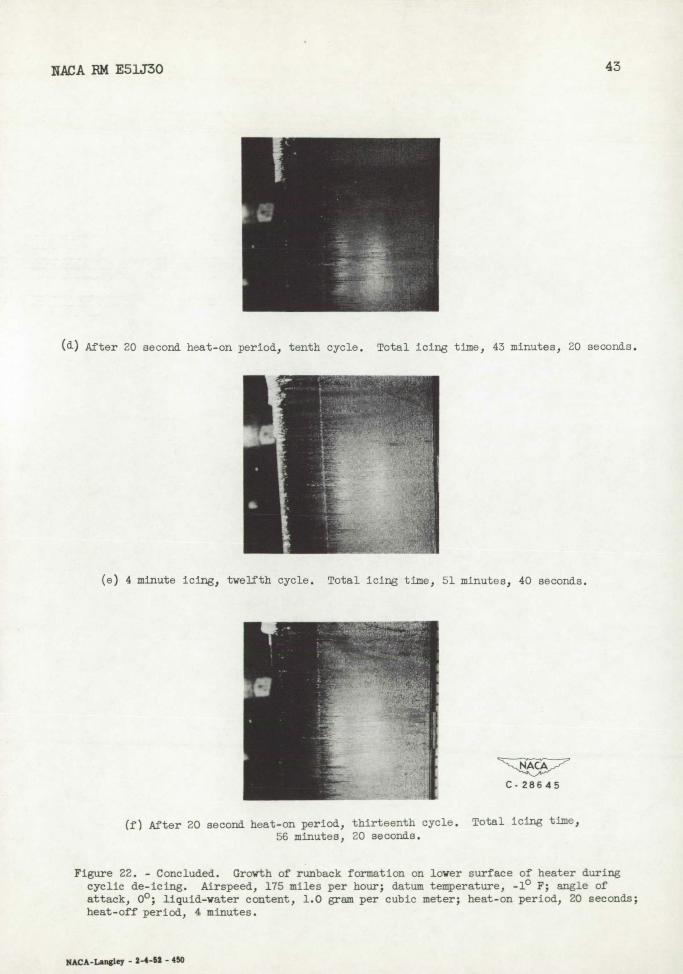
The ice formation after 8 minutes and 20 seconds, or just before the second heat-on period, is illustrated in figure 22(a). The main ice formation is shown and very slight amounts of runback ice may be seen on the unheated portion of the heater. The next picture, figure 22(b), taken after the third heat-on period, shows the removal of the main ice formation and a slight increase in runback ice. Figure 22(c), taken just before the ninth heat-on period, shows that the runback formation has increased in size although very little in extent. The frost forma-tions that have started to form downstream of the heated area are t3rpi-cal of those obtained in all tests and appear to be inherent to tunnel operation. These frost formations increased in size and extent with increasing amounts of runback and residual ice. A small amount of ice downstream of the leading edge within the heated area is visible in figure 22(d), taken at the end of the tnth heat-on period. This fornia-tion is apparent at the end of each heat-on period, but does not increase in size and, consequently, may not be detrimental. The ice formation prior to the twelfth heat-on period is shown in figure 22(e).
NACA ii E5iJ3 17
Figure 22(f) was taken after the thirteenth heat-on period, a total icing time of 56 minutes and 20 seconds. The residual ice formation is slight and the runback formation, although it has built forward on the heated area, is still small. Similar results were obtained on the upper surface of the airfoil. For the results shown in figure 22 the heat was applied to the partilig strip before the water sprays were turned on. Other runs were made in which the heat to the parting strip was not applied until after the sprays were on for a full heat-off period. In this case removal was not obtained until the second heat-on period, but good de-icing performance was obtained thereafter.
The de-icing effectiveness shown in figure 22 was typical of that obtained at all conditions. The longer heat-on periods did not, as a rule, give the complete and consistent removal associated with the short heat-on, high power density heating cycles. The amount of runback was also observed to decrease with decreasing heat-on time. The chordwise location of the runback formation varied with the chordwise extent of heating; however, the size of the formation did not reduce materially with extended chordwise heating.
SUMMARY OF RESULTS AND CONCLUSIONS
For the range of variables investigated, the following results and conclusions may be stated:
1. A continuously heated parting strip in conjunction with cyclic heating was found necessary to insure quick, complete, and. consistent ice removal. A 1-inch-wide continuously heated strip at the leading edge was sufficient for the range of datum temperatures from 19° to _l10 F.
2. The most important variables in determining the cyclic power requirements are the datum temperature and the heat-on time; the heat-off time, the liquid-water content, and the droplet size have a second-order effect, and the angle of attack has no appreciable effect.
3. For the most efficient removal of ice, minimum runback ice, and minimum total energy input, the condition of high local power density and short (less than 15 seconds) heating period gave the best results.
4. The optimum cycled heat input distribution pattern consisted of a uniform power density for the region of water impingement. Extensive heating beyond the impingement region did not aid materially in de-icing performance or in eliminating runback ice.
5. The experimental heater was found to have a rather low thermal efficiency. Better de-icing performance and further economies in the
18
NACA RM E51J3O
energy requirement would be obtained using a heater having a lower thermal capacity and a smaller thermal resistance between the heater elements and the outer surface.
6. Ice removal did not take place on attainment of a heater surface temperature of 320 F. For complete ice removal, peak surface tempera-tures of approximately 50° to 100 0 F resulted with a finite but undeter-mined water film formed underneath the ice formation.
Lewis Flight Propulsion Laboratory National Advisory Connaittee for Aeronautics
Cleveland, Ohio
REFERENCES
1. Jones, Alun B., and Rodert, Lewis A.: Development of Thermal Ice-Prevention Equipment for the B-24D Airplane. NACA ACR Feb. 1943.
2. Neel, Carr B., Jr., Bergrun, Norman B., Jukoff, David, and Schiaff, Bernard A.: The Calculation of the Heat Required for Wing Thermal Ice Prevention in Specified Icing Conditions. NACA TN 1472, 1947.
3. Gelder, Thomas F., and Lewis, James P.: Comparison of Heat Transfer from Airfoil in Natural and Simulated Icing Conditions. NACA TN 2480, 1951.
4. Hacker, P. T., Dorsch, R. G., Gelder, T. F., Lewis J. P., Chandler, H. C., Jr., and Koutz, S. L.: Ice Protection for Turbojet Trans-port Airplane. S.M.F. Fund Paper No. FF-1, Presented at I.A.S. Fifth Annual Flight Propulsion Meeting, March 24, 1950.
5. Lewis, James P.: Be-Icing Effectiveness of External Electric Heaters for Propeller Blades. NACA TN 1520, 1948.
6. Lewis, James P., and Stevens, Howard C., Jr.: Icing and Be-Icing of a Propeller with Internal Blade Heaters. NACA TN 1691, 1948.
NACA RN E51J30
19
7. Scherrer, Richard: An Analytical Investigation of Thermal-Electric Means of Preventing Ice Formations on a Propeller Blade. NACA ACR 4H31, 1944.
8. Tribus, Myron: Intermittent Heating for Aircraft Ice Protection with Application to Propellers and Jet Engines. Aircraft Gas Tur-bine Divs., Gen. Elec. Co. (Lynn, Mass.), Sept. 1949.
9. Weiner, Frederick R.: Further Remarks on Intermittent Heating for Aircra±t Ice Protection. Paper No. 5l-SA-38, A.S.M.E. Semi-Annual Meeting (Toronto), June 11-14, 1951.
10. Langmuir, Irving, and Blodgett, Katherine B.: A Mathematical Investigation of Water Droplet Trajectories. Tech. Rep. No. 5418, Air Material Conmiand, AAF, Feb. 19, 1946. (Contract No. W-33-038-ac-9L51 with Gen. Elec. Co.)
11. Guibert, A. G., Janssen, E., and Robbins, W. N.: Determination of Rate, Area, and Distribution of Impingement of Waterth'ops on Various Airfoils from Trajectories Obtained on the Differential Analyzer. NACA RN 9A05, 1949.
12. Boelter, L. M. K., Grossman, L. M., Martinelli, R. C., and Morrin, E. H.: An Investigation of Aircraft Heaters. XXIX - Comparison of Several Methods of Calculating Heat Losses from Airfoils. NACA TN 1453, 1948.
20
NACA RM E51J30
zi I
II
Heater element numbers
lO,
0.012" neoprene outer layer 0.003" glass cloth 0.001" Nichrome strips 0.003" glass cloth
21 NACA RN E51J30
(a) Position of heater on lower surface of airfoil.
0.125" neoprene inner layer
(b) Location of heater elements and details of heater construction.
Figure 2. - Heater instaflation and construction details.
Series
300
200
100
1
Figure 3. - Location of heater thermocouples.
22
NACA EM E51J30
0.012" neoprene outer layer
0.125" neoprene inner layer
0.125" aluminum skin
WCJ p
r1 I 10) I
0 '-I 4.)
H
H
C_) I
0
0
1:3
a)
Co
C-)
cli 4-, 4-)
0U'
HE
cllQ)
cord
0+'
4 clico
:1 COO
4)4-' CO
0
•.-i a
cliu
0 •r-1
0 rlQ)
()
NACA EM E51J30
23
00
a 6
it h
a)
"-I
0
a)
a)
'-4
Ca a) H
a) C-,
Ca 4-) -Ca
a) C-) Ca cl-I
a) a) P4 Ca
O) H.
Ca
a)a)
d C) -P4) a)
CaCa
o a)0 I P4C'
-PE Caa) •'
+'4-' a) ,-1CaP4
4) 0 Oa) I '-4 .+) -P Ca
0,z ,-I ,-I
4) 4-) Ca -1
Caa) '-I 4) dca a)
a)u) 1 C-'
.-,-4 -PG ,Q Ca' 4 i -I 0 a).' P4'1 -I
0a)
4)4) 4.)
0 Caq-i 4-I0 I- LI)
a)CO cOH
bOO 4-4 OCa -
..'i 0 a)
Ca.I 0 ,-1 0
a)a) -I
P1 '-I
4-, Ca
'-I 4-)
P1
4-) "-I
24
NACA EM E51J30
Ia
o V)
OLOOLt)t4 HO
)
'7 ___ ___
___ ___ ___)
___ ___ ___
Ca
__
a)
Ca I I I I 4) I Ca I ___
I ___ __
-pea)
Q)#— tOC'Hr-1 Car-ICa OOuOtUV)HO
0 H
oj.xns
a)
0
C)
a) C) a)
a)
a)0
4-,
I '-1
NACA RM E51J•30
25
'Jn zdm ojjn
a) 8-a)
o a 4-' a)a)
- a)O +V)
-P8 - ,-I id
+, 0
o a) '-I-P
, 0 -i 04-'
4-' a) l
-+' a)
4-' a) •- 8
a)4 0 p 8 -,a 4-'C)O
ai a)-4-) 0+' U)
aJ P
8 0
eI4H 0 U)
0 0 -'
4-) ,-1 0 -i1 a)
4-' a)0 P.O
a)a)a) 'dH4-' ::•-4 Ui H8 0 I
Lfld 0 r- ,-i OH
rdH .a)
L1) a) P.1=i 40
,-1O) H
'-4 r4
26
12
'C
2
0 -20
NACA RM E51J30
\
I I I I o Input power - 0 Measured net power -
to outer surface -- Calculated power for
surface temperature of 32° F N
-
\\ \
N
N.. _ _ _ _ _ _ _
.' \
_______N \\\
N __
-10 0 10 20 30 40
Surface datum temperature, °F
Figure 6. - Power requirements for parting strip. Airspeed, 175 miles per hour; angle of attack, 2.
• a a'
(I) 4) -1-'
.4)
a)
NACA RM E51J30
27
I
.—Heat---i on
.- T -Heat off — —.
-----De-icing / /'
_ _--
--
(a) Lover surface; S/c, 1.3 percent.
-AL) U U 'kU bU tiU LOU UU
Elapsed time, sec
(b) Upper surface; S/C, 0.78 percent.
Figure 7. - Comparison of measured surface temperatures in dry air and during de-icing. Airspeed, 175 miles per hour; angle of attack, 4; stagnation wet datum temperature, 19° F.
80
6(
4(
2C
0 0 0 0 C\3
g0 'ST.I ithxxq. o3J.xri
LU
0
a)
'J G)
a) H
0 0
a) C-)
.4-) (I) r1
rd C'.] a)
0
a)Ci p4
—
/
\
7/_ \_ _
\- — - -
-•=: - - - - — - ___>___ )
- - C-)
(I
__ _____ __ __ __ •H
-'a) fin - -
___ __
___ __
___ __ __
___ ___ __
___ __ II
II . Ii ______ ___ - - II ______ _____ ___
'[Tel
28
NACA RN E51J30
[SI
a)q-1 P40
a) OH
a)
1:1. 4) .O crdO)
a)a) p4p1
cQa)
+ r1
a) C3 o -i ai •a) CHbOp4
E i r1 a) Ci 0-P
r1 di a)a)
CHO 0
UO
O r4 -P
.r-4
cj
0cj C_) •-'
Q)'d4)
.-4 a -'-I ILl
N.ACA RM E51J30
29
I I I I I s/c Surface Power density - (percent) (watts/sq in.)
0.26 Upper 9.6
- - - - - 0 Leading edge 9.6 - - - - .26 Lower 4.2 continuous -
ii :± ::==
A /
80
6C
4(
2C
I I I I s/c Surface Power density - (percent) (watts/sq in.) - _____
2.08 Upper 7.7
- - - -
1.3 Upper 9.3 .78 Upper 9.3
8C
6C
40
20 -20 0 20 40 60 80 240 26C
Time, Sec
Figure 9. - Variation of Surface temperature during cyclic de-icing. Airspeed, 175 miles per hour; angle of attack, 2°; surface datum temperature, 19° F; liquid-water content, 0.65 gram per cubic meter; heat-on period, 15 seconds; heat-off period, 4 minutes.
I I I I I
S/C Surface Power density (percent) (watts/sq in.)
0.78 Lower 11.1 - - - - 1.3 Lower 11.1
1.82 Lower 10.8
/ /
I
8C
6(
4(
a, 2(
80
S/C Surface Power density (percent) (watts/sq in.)
-
/ 2.34 Lower 9.3 - - - - 3.12 Lower 7.9
ft - - - 4.16 I.ower 6.6
I6C
4(
2C
NACA RM E51J30
U ft a,
a, U
-20
U U 0 60 80 ' 240 260 Time, sec
Figure 9. - Concluded. Variation of surface temperature during cyclic de-icing. Airspeed, 175 miles per hour; angle of attack, 2°; surface datum temperature, l9 F; Uquid-water content, 0.65 gram per cubic meter; heat-on period, 15 seconds; heat-off period, 4 minutes.
N.ACA EM E51J30
31
6(
a
4., a
U) 2(
C--20 0 20 40 60 80 ' 240 260 280
Time, sec
Figure 10. - Variation of surface temperature at 2.34 percent chord, lower surface, for three heat-on periods. Airspeed, 175 miles per hour; datum temperature, 19° F; liquid-water content, 0.65 gram per cubic meter; heat-off period, 4 minutes; angle of attack, 2°.
I I I I Heat-on Power density
- period (watts/sq in.) (eec)
10:5
----- ——__4.1
ft--
_fI/
I I I I Heat-on Power density
/period (watts/sq in.) (sec) -7- i-
__ 10 10.7
-_J iii IE44J4-
6C
a 0
4-, a
i
-20 0 20 40 60 80 120 140 160
Time, sec
Figure II. - Variation of surface temperature at 2.34 percent chord, lower surface, for three heat-on periods. Airspeed, 175 miles per hour; datum temperature, 19° F; liquid-water content, 1.0 gram per cubic meter; heat-off period, 2 minutes angle of attack, 2°.
32
10(
NACA RM E51J30
- Heat-on Power density - period (watts/sq in.) (sec)
- - 15 14.8 A /
/t / 30 12.2
--V--1----------
I •' \
/
20 40 60 80 • 240 260 280 Time, Sec
Figure 12. - Variation of surface temperature at 2.34 percent chord, lower surface, for two heat-on periods. Airspeed, 175 miles per hour; datum temperature, -1° F; liquid-water content, 1.0 gram per cubic meter; heat-off period, 4 minutes. -
a, 0
IC -o
N.ACA RM E51J'30
- (sec)
------L---LL r
____EJ L r
L1 Lii r
_LL____ ___i_ - - -L...
_I_Partin Strip
(a) Datum temperature, -1° F.
ThiiI II4____J
Ii r—.-'- r._..,L_.. - L.J
strip
4 0 4 8 12
Upper Lower
Surface distance from leading edge, percent chord
(b) Datum temperature, 19° F.
Figure 13. - Distribution of input power for three heat-on periods and two datum temperatures. Airspeed, 175 miles per hour; angle of attack, 2°; liquid-water content, 1.0 gram per cubic meter; heat-off period, 2 minutes.
20
16
12
a 01 0)
4 -p
0) 0 '1)
II)
-p
12
C8
33
34
NACA RN E51J30
:12
. 8
a)
ci)
H
I I I I
(d) -
0 2 4 -
I I!
--J1Thii .J
o4%1=40 Parting
__ __
_____
__
____
____
____ - H1
__
strip
8
4 0 4 8 12 Upper Lower
Surface distance from leading edge, percent chord
Figure 14. - Distribution of input power for three angles of attack. Airspeed, 175 miles per hour; datum temperature, 19° F; heat-on period, 10 seconds; heat-off period, 2 minutes.
-10 0 10 20 30 40 Surface datum temperature, °F
c,1 16 U)
U)
+'
12
'—I
24
20
4
0--20
_____ _____ _____
Heat-on Liquid-water Heat-off period content period
• (see) (grain/cu m) (see)
o 10 1.0 240 • 0' 10 .65 240 • 10 1.0 120 0 15 1.0 240
- 15 .65 240 U' 15 .65 120 0 30 1.0 240
30 .65 240 30 1.0 120
• 30 ..65 120
_____ _____ _____
____ ____ ____ ____
____
____
____ ____ ____ ____
_NN____ __
• r -
I(ACA BM E51330
35
Figure 15. - Variation of cycled power density with datum temperature. Airspeed, 175 miles per hour; angle of attack, 2°. Power densities are average of input power to heaters 10 to 17.
NACA RN E51J30
_________- I I I
Surface datum Liquid-water Heat-off temperature content period
____ (°F) (gram/cu in) (see) ____ ____
o 19 1.0 240 ____ 19 .65 240
• 19 1.0 120 ________
o 9 1.0 240 ____ ____ -1 1.0 240
-1 .65 120 ____
\\ \ K -11 .65 120
\\\ __/ ______ __ ____ s.—.
_N\_______ N 5-.-.-
- -.5
________________________________________________________________ ____________________________________________________________ ____________________________________________________________ ________________________________________________________________ ____________________________________________________________ ________________________________________________________________ ____________________________________________________________ ____________________________________________________________ I
10 20 30 40 50
Heat-on time, sec
Figure 16. - Variation of input cycled power density with heat-on time for various heat-off periods and datum temperatures. Airspeed, 175 miles per hour; angle of attack, 2°. Power densities are average of power to heaters 10 to 17.
36
r-1
01
I)
4)
"5
U)
a) rd
a)
P1
4.)
H
24
2C
1€
€
NACA BM E51J30
37
a1
:ie
4)
l2
H 8
_____ _____
I I I I
Datum Heat-on ____ temperature period
(°F) (sec)
o 19 10 o -1 20
_____ _____ _____
0 1 .
Angle of attack, deg
Figure 17. - Variation of input cycled power density with angle of attack. Airspeed, 175 miles per hour; heat-off period, 4 minutes. Power densities are average of power to elements 10 to 17.
0 C)
4., 'dH
Or1 '1)
p4
0)4.'
•r4Q)
LI) .. Ha)
111 C)
dw
0 Hi.
U) 0)
4.) +) ci o a) .,-4 1
H
.4-HO 4
N -s-i 0)0)
.4)4-I a 4-i Hi0
,-1
C) a)
a)
4)
0)
38
NACA RM E51J30
0
NC'
--)-
V
C'
--- _______
_____ C
uds q;/nq.a 'toT; q.q AqTrnun3
Heat input heat flov - - - - External
--
16(
15(
141
131
4:
-I
0 0 ' .- - - Upper Lover
NACA EM E51J3O
39
5/C, percent
Figure 19. - Cczsparison of external heat flow with total heat input for one complete cycle. Airspeed, 175 miles per hour; angle of attack, 2°; datum temperature, 19° F; liquid-water content, 0.65 gram per cubic meter; heat-on period, 15 second-a; heat-off perIod, 4 minutes.
I
Heat - of f period
- (sec)
— c' 240 0 120
I
Liquid-water content
(gram/cu in) -
0.65 - 1.0
_____
____
_____ _____
____
i.E p.I
rd
Q4) Hcr
4 cO a) '—i
a)
oil
ci
40
NACA RN E51J30
(a) External heat flow.
/,v
SHeat-on time, sec
(b) Ratio of external heat flow to heat input.
Figure 20. - Variation of external heat flow from heater during heat-on period for various heat-on and heat-off times and two liquid-water contents. Airspeed, 175 miles per hour; angle of attack, 2°; datum temperature, 19° F.
cli a)
00
a) op H
0
a)cli ,a) H
-H
a)
0
o r1
cli
.4
.2
Li]
N.ACA RM E51J30
41
1 II I I
Surface datum Liquid-water temperature content
(°F) (gram/cum).
0 19 1.0 __d 19 .65 -
: :65
__ __
\\\
__ __
___ ___
\\ N __ \ __ __
_____ __ ____ __ __
parting Equivalent
strip power
only
_
-1°F
_____ _____ _____ _____ _____ _____ 19°F
9 17 25 33 41
Cycle ratio
Figure 21. - Variation of equivalent continuous power density with cycle ratio for two datum temperatures. Airspeed, 175 miles per hour; angle of attack, 2°.
2.4
2 .0
Dl 0)
0)
1.6
4.)
U)
1)
a) 1.2
p4
U)
0
.,-1
0
4-)
1) H
.4
C1
L :nt of intin
Runback icc :crmat Ion
Froat formation
C- 28644
42
NACA RN E51J30
(a) 4 minute icing, cecond. cyc]e. Total icing time, 8 minutes, 20 seconds.
(b) After 20 second heat-on period, third cycle. Total icing time, 13 minutes.
(c) 4 minute icing, ninth cycle. Total icing time, 38 minutes, 40 seconds.
Figure 22. - Growth of runback formation on lower surface of heater during cyclic de-icing. Airspeed, 175 miles per hour; datum temperature, _l0 F; angle of attack, 0; liqdd-water content, 1.0 gram per cubic meter; heat-on period, 20 seconds; heat-off period, 4 minutes.
AC
C- 28645
NACA RM E51J30
43
(d) After 20 second heat-on period, tenth cycle. Total icing time, 43 minutes, 20 seconds.
(e) 4 minute icing, twelfth cycle. Total icing time, 51 minutes, 40 seconds.
(f) After 20 second heat-on period, thirteenth cycle. Total icing time,
56 minutes, 20 seconds.
Figure 22. - Concluded. Growth of runback formation on lower surface of heater during cyclic de-icing. Airspeed, 175 miles per hour; datum temperature, _l0 F; angle of attack, 00; liquid-water content, 1.0 grain per cubic meter; heat-on period, 20 seconds; heat-off period, 4 minutes.
MACA-LAngley - 2-4-bi - 450