Embed Size (px)
Citation preview

Comprehensive Annual Financial ReportFiscal Year Ended 6.30.08
California Public Employees’ Retirement System
A Component Unit of the State of California
Preparing for Tomorrow

Preparing for Tomorrow
Comprehensive Annual Financial ReportFiscal Year Ended 6.30.08
Prepared by the Fiscal Services Division, the
Investment Offi ce, the Actuarial and Employer
Services Branch, the Offi ce of Public Affairs, and
several additional divisions and branches of the
California Public Employees’ Retirement System.
Available online at www.calpers.ca.gov
California Public Employees’ Retirement System
A Component Unit of the State of California
Table of Contents
Introductory SectionChief Executive Offi cer’s Letter of Transmittal . . . . . . . . . . . . . . . . . . . . . . . . . 2Board of Administration . . . . . . . . . . . . . . . . . . . . . . . . . . . . . . . . . . . . 6Executive Staff . . . . . . . . . . . . . . . . . . . . . . . . . . . . . . . . . . . . . . . . 7CalPERS Organizational Chart . . . . . . . . . . . . . . . . . . . . . . . . . . . . . . . . 8
Financial SectionReport of Independent Accountants . . . . . . . . . . . . . . . . . . . . . . . . . . . . . 10Management’s Discussion & Analysis . . . . . . . . . . . . . . . . . . . . . . . . . . . . 12
Basic Financial StatementsStatement of Fiduciary Net Assets — Fiduciary Funds . . . . . . . . . . . . . . . . . . . . 34Statement of Changes in Fiduciary Net Assets — Fiduciary Funds . . . . . . . . . . . . . . . 36Statement of Net Assets — Proprietary Funds . . . . . . . . . . . . . . . . . . . . . . . . 38Statement of Revenues, Expenses & Changes in Fund Net Assets — Proprietary Funds . . . . 39Statement of Cash Flows — Proprietary Funds . . . . . . . . . . . . . . . . . . . . . . . . 40Notes to the Basic Financial Statements . . . . . . . . . . . . . . . . . . . . . . . . . . . 41
Required Supplemental SchedulesRequired Supplemental Schedule of Funding Progress — Pension Trust Funds . . . . . . . . . 64Required Supplemental Schedule of Employer Contributions — Pension Trust Funds . . . . . 65Required Supplemental Schedule of Claims Development Information . . . . . . . . . . . . 67
Supporting Schedules and Agency FundsAdministrative Expenses — All Funds . . . . . . . . . . . . . . . . . . . . . . . . . . . . 72Investment Expenses — PERF . . . . . . . . . . . . . . . . . . . . . . . . . . . . . . . . 73Investment Expenses — PERF & IRC 457 . . . . . . . . . . . . . . . . . . . . . . . . . . 77Consultant & Professional Services Expenses — PERF . . . . . . . . . . . . . . . . . . . . 78Statement of Changes in Assets & Liabilities — Agency Funds . . . . . . . . . . . . . . . . 81
Investment SectionChief Investment Offi cer’s Letter . . . . . . . . . . . . . . . . . . . . . . . . . . . . . . . 84Summary of Investments — PERF . . . . . . . . . . . . . . . . . . . . . . . . . . . . . . 86Investment Performance — PERF . . . . . . . . . . . . . . . . . . . . . . . . . . . . . . 87CalPERS Asset Allocations — PERF . . . . . . . . . . . . . . . . . . . . . . . . . . . . . 88Portfolio of California Investments at Market Value — PERF . . . . . . . . . . . . . . . . . 89Largest Stock & Bond Holdings at Market Value — PERF . . . . . . . . . . . . . . . . . . 90Schedule of Commissions & Fees — PERF . . . . . . . . . . . . . . . . . . . . . . . . . . 91Schedule of Fees & Costs for Private Equity Partners — PERF . . . . . . . . . . . . . . . . 94
CalPERS Comprehensive Annual Financial Report, Year Ended June 30, 2008
Table of Contents (continued)
Investment Section (continued)Schedule of Fees & Costs for Absolute Return Strategies Program — PERF . . . . . . . . . . 97Investment Performance — JRF II . . . . . . . . . . . . . . . . . . . . . . . . . . . . . . 98Investment Performance — LRF . . . . . . . . . . . . . . . . . . . . . . . . . . . . . . . 99
Actuarial Section — Based on Actuarial Valuations as of June 30, 2007CalPERS Actuarial Certifi cation . . . . . . . . . . . . . . . . . . . . . . . . . . . . . . . 102CalPERS Actuarial Methods & Assumptions . . . . . . . . . . . . . . . . . . . . . . . . . 103Changes Since Prior Valuation . . . . . . . . . . . . . . . . . . . . . . . . . . . . . . . . 106Summary of Funding Progress . . . . . . . . . . . . . . . . . . . . . . . . . . . . . . . . 107Exhibit A: Funding Progress — Unfunded Liability & Funded Ratios . . . . . . . . . . . . . 108Exhibit B: Funding Progress — Solvency Test . . . . . . . . . . . . . . . . . . . . . . . . 110Exhibit C: Sample Pay Increase Assumptions for Individual Members . . . . . . . . . . . . . 112Exhibit D: Sample Non-Economic Assumptions . . . . . . . . . . . . . . . . . . . . . . . 114Exhibit E: Single Life Retirement Values . . . . . . . . . . . . . . . . . . . . . . . . . . . 123Exhibit F: History of Member Salary Data . . . . . . . . . . . . . . . . . . . . . . . . . . 123Exhibit G: Members in Valuation . . . . . . . . . . . . . . . . . . . . . . . . . . . . . . 124Exhibit H: Schedule of Retirees & Benefi ciaries Added to & Removed from Rolls . . . . . . . 129Actuarial Certifi cations — Other Systems . . . . . . . . . . . . . . . . . . . . . . . . . . 130
Statistical SectionExpenses by Type — Retirement Programs . . . . . . . . . . . . . . . . . . . . . . . . . . 134Revenues by Source — Retirement Programs . . . . . . . . . . . . . . . . . . . . . . . . . 136Changes in Net Assets — Retirement Programs . . . . . . . . . . . . . . . . . . . . . . . 138Membership & Retirement Data — Retirement Programs . . . . . . . . . . . . . . . . . . 140Program Data . . . . . . . . . . . . . . . . . . . . . . . . . . . . . . . . . . . . . . . . 142Public Agency Employers . . . . . . . . . . . . . . . . . . . . . . . . . . . . . . . . . . 150Judges’ Retirement System Program Data . . . . . . . . . . . . . . . . . . . . . . . . . . 165Judges’ Retirement System II Program Data . . . . . . . . . . . . . . . . . . . . . . . . . 168Legislators’ Retirement System Program Data . . . . . . . . . . . . . . . . . . . . . . . . . 171
Other Programs Expenses & Revenues — Enterprise Funds . . . . . . . . . . . . . . . . . . . . . . . . . . 176Health Benefi ts Program Data . . . . . . . . . . . . . . . . . . . . . . . . . . . . . . . . 178Deferred Compensation Program Data . . . . . . . . . . . . . . . . . . . . . . . . . . . . 189Long-Term Care Program Data . . . . . . . . . . . . . . . . . . . . . . . . . . . . . . . 190
Index of Tables, Charts, & Lists . . . . . . . . . . . . . . . . . . . . . . . . . . . . . . . . . . 192
CalPERS Comprehensive Annual Financial Report, Year Ended June 30, 2008
Public Pension Coordinating Council
Public Pension Standards AwardFor Funding and Administration
2008 Presented to
California Public Employees’ Retirement System
In recognition of meeting professional standards for plan design and administration as
set forth in the Public Pension Standards.
Presented by the Public Pension Coordinating Council, a confederation of
National Association of State Retirement Administrators (NASRA)
National Conference on Public Employee Retirement Systems (NCPERS)
National Council on Teacher Retirement (NCTR)
Alan H. WinkleProgram Administrator


Introductory Section
Preparing for Tomorrow
As the nation’s largest public pension fund, we are
committed to ensuring the sustainability of our members’
pension and health benefi ts. We exercise strong global
leadership to fulfi ll our fi duciary responsibilities.

2 CalPERS Comprehensive Annual Financial Report, Year Ended June 30, 2008
December 17, 2008
Members of the CalPERS Board of Administration:
I am pleased to present the CalPERS Comprehensive Annual Financial Report (CAFR) and accompanying Operations Summary for the year ended June 30, 2008.
Throughout the year, we took decisive action to prepare for tomorrow and to ensure that CalPERS remains the fi nest retirement system in the nation. We safeguarded our investment assets, administered retirement benefi ts, minimized employer contributions, and delivered affordable health care to our members.
This fi scal year presented extraordinary challenges brought on by the economic downturn and the volatile investment climate. We ended the fi scal year with a 5.1 percent negative rate of return on our investments — the fi rst negative return in four years. Our average annual return over the last fi ve years remains strong at 10.7 percent. We ended the year with $237.9 billion in net assets.
While the fi nancial markets continue to change, we foresee no immediate impact to employer contributions to the fund. We amortize investment gains and losses over 15 years, which greatly reduces cost volatility for State and local governments. Our rate-smoothing policy cushions the effect of any future investment losses on employers. While we cannot predict the future, we do know that employers’ contributions will not change in the 2008-09 fi scal year due to past investment performance. In the meantime, our investment staff is positioning our assets for a market recovery.
During the year, our investment team initiated strategies to maximize returns despite ongoing market challenges. The Board set an asset allocation that, among other things, expands our diversifi cation by investing in timberland, infl ation-linked bonds, commodities, and infrastructure.
CEO Letter of Transmittal
Kenneth W. MarzionInterim Chief Executive Offi cer
3 CalPERS Comprehensive Annual Financial Report, Year Ended June 30, 2008
CEO Letter of Transmittal (continued)
Our three-year business plan directs our activities as we prepare for tomorrow. As more “baby boomers” retire, we will see an increasing demand on the System. We are meeting this challenge by increasing the number of ways members can serve themselves and more easily manage their retirement and health benefi ts.
A component of our forward-looking approach is the development of our integrated Web-based member and employer technology platform — my|CalPERS. Members have been using my|CalPERS since June 2007, and they are enthusiastic about being able to access information about their benefi ts at their own convenience. Once the system is fully implemented, it will extend my|CalPERS functionality to employers, business partners, and staff, providing a robust method for interacting with CalPERS. As we continue to expand my|CalPERS, we are also expanding our outreach and education programs. We want the transition to the new system to be seamless for members, employers, and employees.
Another way we are enhancing self-service capabilities for members and employers is through the CalPERS Education Center (CEC). This online education management system offers members a series of retirement planning classes that focus on benefi ts, issues, and services related to their career life cycles. The CEC also provides employers access to online classes that address topics such as contracts, payroll reporting, and membership.
As we conduct more business via the Internet, we have taken steps to reinforce the security of our systems. During the year, our Privacy Protection and Security Task Force evaluated internal security procedures, established new protocols for protecting confi dential information, and implemented security awareness
programs for employees. Our goal is to cultivate a “Culture of Security,” in which we use the most advanced security practices available. We require all our employees to take personal responsibility for protecting confi dential information.
Our health program remained a top priority during the year. Premiums for members enrolled in a Basic or Medicare PPO remained the same — and some PPO members saw decreases in their premiums. We set a 2009 health benefi ts package that increases premiums by 4.3 percent — the lowest overall increase in more than 10 years. Our health benefi ts program stabilized the PPO premiums in part by using surplus reserves. We continued to address the drivers of health care costs by enacting various initiatives, including educating members about their role in helping to control costs.
Management Responsibility for Financial ReportingOur system management prepared the CalPERS fi nancial statements included in this CAFR for the 2007-08 fi scal year. Management is responsible for the integrity and fairness of the information presented, including data that, out of necessity, is based on estimates and judgments. The accounting policies used to prepare these fi nancial statements conform to accounting principles generally accepted in the United States. Financial information presented throughout this Annual Report is consistent with these fi nancial statements.
CalPERS maintains a system of internal controls designed to provide reasonable assurance that assets are properly safeguarded, transactions are properly executed, and fi nancial statements are reliable.
4 CalPERS Comprehensive Annual Financial Report, Year Ended June 30, 2008
CEO Letter of Transmittal (continued)
In addition, internal audit personnel provide a continuing review of the internal controls and operations of CalPERS, and the Chief of the Offi ce of Audit Services regularly reports to the CalPERS Board of Administration’s Finance Committee. The Committee reviews the audit fi ndings and recommendations for improvements in internal control and operational effi ciency and the actions of management to implement such recommendations.
Our independent external auditors, Macias Gini & O’Connell, have conducted an audit of the basic fi nancial statements in accordance with auditing standards generally accepted in the United States of America, performing such tests and other procedures as they deem necessary to express an opinion in their report to the Board. The external auditors also have full and unrestricted access to the Board to discuss their audit and related fi ndings as to the integrity of the fi nancial reporting and adequacy of internal control systems.
AwardsThe Government Finance Offi cers Association of the United States and Canada (GFOA) awarded a Certifi cate of Achievement for Excellence in Financial Reporting to CalPERS for our Comprehensive Annual Financial Report for the fi scal year ended June 30, 2007. This was the 12th consecutive year that CalPERS has achieved this prestigious award. In order to be awarded a Certifi cate of Achievement, a government must publish an easily readable and effi ciently organized comprehensive annual fi nancial report. This report must satisfy both generally accepted accounting principles and applicable legal requirements. A Certifi cate of Achievement is valid for a period of one year. We believe our current comprehensive
annual report continues to meet the Certifi cate of Achievement Program’s requirements, and we are submitting it to GFOA to determine its eligibility for another certifi cate.
Accounting System & ReportsManagement is responsible for establishing and maintaining an internal control structure designed to ensure that CalPERS assets are protected from loss, theft, or misuse, and income is equally distributed. Responsibility for the accuracy, completeness, and fair presentation of the information, and all disclosures, rests with CalPERS. The basic fi nancial statements have been prepared in accordance with accounting principles generally accepted in the United States of America. The basic fi nancial statements are presented in accordance with pronouncements of the Governmental Accounting Standards Board (GASB), including standards established by GASB Statement No. 25, Financial Reporting for Defi ned Benefi t Plans; GASB Statement No. 34, Basic Financial Statements — and Management’s Discussion and Analysis — for State and Local Governments; GASB Statement No. 43, Financial Reporting for Post-Employment Benefi t Plans Other Than Pension Plans; and other GASB statements as appropriate. GASB Statement No. 34 requires that management provide a narrative introduction, overview, and analysis to accompany the basic fi nancial statements in the form of a Management’s Discussion and Analysis (MD&A).
This Letter of Transmittal is designed to complement the MD&A and should be read in conjunction with it. The CalPERS MD&A can be found immediately following the report of the independent auditors.

5 CalPERS Comprehensive Annual Financial Report, Year Ended June 30, 2008
CEO Letter of Transmittal (continued)
InvestmentsProper funding and healthy long-term investment returns are essential to the fi nancial soundness of CalPERS. The ratio of investment earnings to total revenue during the last 10 years is evidence of the System’s continued solid fi nancial management. See the Chief Investment Offi cer’s letter, page 84, for a summary of our investment performance.
Asset AllocationAn integral part of the overall investment policy is the strategic asset allocation policy. This policy is designed to provide an optimal mix of asset class investments which can best meet future pension obligations with the lowest risk possible and the lowest cost to taxpayers, employers, and employees. This approach emphasizes strong diversifi cation among a range of investments, each of which offers the prospect of compelling, long-term returns. These investments include allocations to listed markets (money markets, bonds, global stocks, and commodities) as well as private markets (real estate, private equity, hedge funds, forestland, and infrastructure).
FundingThe bottom line for a retirement system is its level of funding. If the funding level is adequate, the ratio of total accumulated assets to total liabilities will be larger and the need for contributions will be reduced. Also, an adequate funding level gives participants assurance that their pension benefi ts are secure.
The historical level of funding for the Public Employees’ Retirement Fund (PERF) is good. As of June 30, 2007, the PERF is 87.2 percent funded, using “smoothed” assets, and 101.2 percent funded, using market value of assets. The advantages of a well-funded plan are that participants can see assets that
are irrevocably committed to the payment of promised benefi ts, and employees and taxpayers can minimize their contributions in support of defi ned benefi ts. The Required Supplemental Schedules to the Basic Financial Statements and the Actuarial Section contain a summary of CalPERS unfunded actuarial accrued liabilities.
Investment returns are used to generate additional revenues and, ultimately, this allows CalPERS to reduce employer contribution rates, reducing pension costs to employers and taxpayers.
In Closing…It is clear that we are facing extraordinary conditions in our economy and fi nancial markets. During this time, it is important to remember that CalPERS is meeting its benefi t obligations and will continue to do so in the future. We are also engaged in short-term and long-term investment strategies to ensure that our assets are protected and positioned for future growth.
CalPERS has a proven track record, and we are resilient. We opened our doors in the depth of the Great Depression. Our record for the past 25 years includes 21 positive years with an average investment return of 15 percent versus four down years with an average return of negative 5 percent. We are diversifi ed, disciplined, and focused on minimizing employer contributions.
While no one can predict when our markets and economy will recover, you can be assured that we are using our full range of resources and talents to protect the fi nancial interests of our members and employers today and into the future.
Kenneth W. MarzionInterim Chief Executive Offi cer
6 CalPERS Comprehensive Annual Financial Report, Year Ended June 30, 2008
Rob Feckner, PresidentEmployee Member (elected by school members) Glazing Specialist, Napa Valley Unifi ed School DistrictTerm Ends: January 15, 2011
George Diehr, Vice PresidentEmployee Member (elected by State members)Professor, CSU San MarcosTerm Ends: January 15, 2011
Marjorie BerteOffi cial of Life Insurer 1
Retired Vice President, California State Automobile Association Term Ends: January 15, 2009
John Chiang State ControllerEx Offi cio Member
David GilbDirector, Department of Personnel AdministrationEx Offi cio Member
Henry JonesRetired Member (elected by retirees)Retired, Chief Financial Offi cer,Los Angeles Unifi ed School DistrictTerm Ends: January 15, 2012
Bill LockyerState TreasurerEx Offi cio Member
Priya MathurEmployee Member (elected by public agency members)Economist, Bay Area Rapid TransitTerm Ends: January 15, 2011
Louis F. MoretPublic Representative 2
Term Ends: January 15, 2012
Tony Oliveira Elected Offi cial of Local Government 1
Reappointed February 8, 2007Term Ends: January 15, 2011
Anne SheehanState Personnel Board Member (designated by the State Personnel Board)Term Ends: Serves at the pleasure of the SPB
Kurato ShimadaEmployee Member (elected by all members)Retired, Supervisor of Operations,Oak Grove School DistrictTerm Ends: January 15, 2010
Charles P. ValdesEmployee Member (elected by all members) Retired Counsel, Department of TransportationTerm Ends: January 15, 2010
1 Governor appointee
2 Appointed jointly by the Speaker of the Assembly and the Senate Rules Committee
Board of Administration
7 CalPERS Comprehensive Annual Financial Report, Year Ended June 30, 2008
Kenneth W. MarzionChief Executive Offi cer (Interim),(Fred Buenrostro through May 12, 2008)
Gloria Moore AndrewsDeputy Executive Offi cer,Operations(Retired December 2008)
Jarvio A. GreviousDeputy Executive Offi cer,Benefi ts Administration(Retired November 2008)
Teri BennettAssistant Executive Offi cer,Information Technology Services
Gregory FranklinAssistant Executive Offi cer,Health Benefi t Services
John HiberAssistant Executive Offi cer,Administrative Services
Patricia K. MachtAssistant Executive Offi cer,Public Affairs
Peter H. MixonGeneral Counsel
Ron SeelingChief Actuary,Actuarial & Employer Services
Anne StausbollChief Investment Offi cer (Interim),(Russell Read through April 23, 2008)andChief Operating Investment Offi cer,Investment Operations
Kathie VaughnAssistant Executive Offi cer,Member & Benefi t Services(Retired December 2008)
Executive Staff
8 CalPERS Comprehensive Annual Financial Report, Year Ended June 30, 2008
Not
e: C
onsu
ltant
s w
ho p
rovi
ded
serv
ices
to C
alPE
RS
are
liste
d on
pag
e 78
(pr
ofes
sion
al c
onsu
ltant
s) a
nd p
age
91 (
inve
stm
ent-
spec
ifi c
cons
ulta
nts)
.
Ass
ista
nt
Exe
cuti
ve
Offi
cer
/
Info
rmat
ion
Tec
hn
olo
gy
Serv
ices
Bra
nch
Pen
sion
Syst
em
Res
um
pti
on
Pro
ject
En
terp
rise
Tra
nsi
tion
Man
agem
ent
Tec
hn
olo
gy
Serv
ices
&
Sup
port
Div
isio
n
Inn
ovat
ion
Serv
ices
Div
isio
n
Info
rmat
ion
Tec
hn
olo
gy
Ad
min
istr
atio
n
Div
isio
n
Ass
ista
nt
Exe
cuti
ve
Offi
cer
/
Offi
ce
of
Pu
bli
c
Aff
airs
Div
ersi
ty
Offi
ce
Ass
ista
nt
Exe
cuti
ve
Offi
cer
/
Mem
ber
& B
enefi
t
Serv
ices
Bra
nch
Mem
ber
Serv
ices
Ben
efi t
Serv
ices
Cu
stom
er
Serv
ice
&
Ed
uca
tion
Ass
ista
nt
Exe
cuti
ve
Offi
cer
/
Hea
lth
Ben
efi t
s
Bra
nch
Em
plo
yer
& M
ember
Hea
lth
Serv
ices
Hea
lth
Pla
n
Ad
min
istr
atio
n
Hea
lth
Poli
cy
& P
rogr
am
Sup
port
Op
erat
ion
s
and
Infr
astr
uct
ure
Sup
port
Ch
ief
Inve
stm
ent
Offi
cer
Ch
ief
Op
erat
ing
Inve
stm
ent
Offi
cer
/
Inve
stm
ent
Op
erat
ion
s
Inve
stm
ents
Sup
ple
men
tal
Inco
me
Pla
ns
Ch
ief
Act
uar
y
Ass
ista
nt
Exe
cuti
ve
Offi
cer
/
Act
uar
ial &
Em
plo
yer
Serv
ices
Bra
nch
Em
plo
yer
Serv
ices
Pu
bli
c
Em
plo
yer
Rea
din
ess
Pro
ject
Act
uar
ial
Serv
ices
Gen
eral
Cou
nse
l
Leg
al
Au
dit
Serv
ices
Info
rmat
ion
Secu
rity
En
terp
rise
Com
pli
ance
Bo
ard
of
Ad
min
istr
atio
n
Ch
ief
Exe
cuti
ve O
ffi c
er
Dep
uty
Exe
cuti
ve O
ffi c
er/
Ben
efi t
s A
dm
inis
trat
ion
Dep
uty
Exe
cuti
ve
Offi
cer
/Op
erat
ion
s
Ass
ista
nt
Exe
cuti
ve
Offi
cer
/
Ad
min
istr
ativ
e
Serv
ices
Bra
nch
Fis
cal
Serv
ices
Hu
man
Res
ou
rces
Stra
tegi
c
Man
agem
ent
Serv
ices
Div
isio
n
Op
erat
ion
s
Sup
port
Serv
ices
Gov
ern
men
tal
Aff
airs
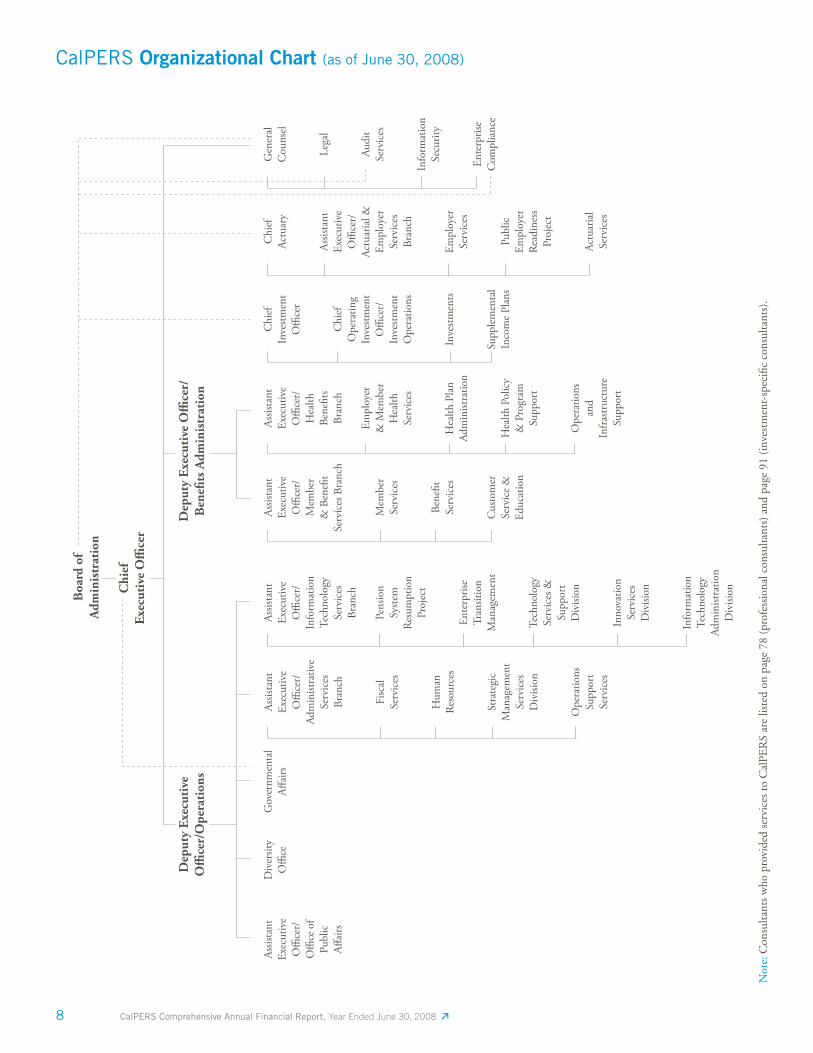
CalPERS Organizational Chart (as of June 30, 2008)

Financial Section
Managing Risk
We’re meeting our obligations today, and will meet
them tomorrow. We manage the risk and volatility
of assets and liabilities, and ensure suffi cient funds
are available to pay benefi ts, as well as minimize
and stabilize employer contributions.
10 CalPERS Comprehensive Annual Financial Report, Year Ended June 30, 2008
Report of Independent Accountants
Independent Auditor’s Report
To the Board of Administration California Public Employees’ Retirement SystemSacramento, California
We have audited the accompanying statement of fi duciary net assets of the fi duciary funds and the statement of net assets of the proprietary funds of the California Public Employees’ Retirement System (the System or CalPERS), a component unit of the State of California, as of June 30, 2008, and the related statement of changes in fi duciary net assets of the fi duciary funds, and the statements of revenues, expenses and changes in fund net assets and cash fl ows of the proprietary funds for the year then ended. These fi nancial statements are the responsibility of the System’s management. Our responsibility is to express an opinion on these fi nancial statements based on our audit. The prior year summarized comparative information has been derived from the System’s 2007 fi nancial statements on which our report dated November 13, 2007, expressed an unqualifi ed opinion.
We conducted our audit in accordance with auditing standards generally accepted in the United States of America. Those standards require that we plan and perform the audit to obtain reasonable assurance about whether the fi nancial statements are free of material misstatement. An audit includes consideration of internal control over fi nancial reporting as a basis for designing audit procedures that are appropriate in the circumstances, but not for the purpose of expressing an opinion on the effectiveness of the System’s internal control over fi nancial reporting. Accordingly, we express no such opinion. An audit also includes examining, on a test basis, evidence supporting the amounts and disclosures in the fi nancial statements, assessing the accounting principles used and signifi cant estimates made by management, as well as evaluating the overall fi nancial statement presentation. We believe that our audit provides a reasonable basis for our opinion.
In our opinion, the fi nancial statements referred to above present fairly, in all material respects, the fi duciary net assets of the fi duciary funds and the net assets of proprietary funds of the California Public Employees’ Retirement System as of June 30, 2008, and the changes in fi duciary net assets of the fi duciary funds and the changes in net assets and cash fl ows of the proprietary funds for the year then ended in conformity with the accounting principles generally accepted in the United States of America.
3000 S Street, Suite 300Sacramento, CA 95816
916.928.4600
2175 N. California Boulevard, Suite 645Walnut Creek, CA 94596
925.274.0190
515 S. Figueroa Street, Suite 325Los Angeles, CA 90071
213.286.6400
402 West Broadway, Suite 400San Diego, CA 92101
619.573.1112
11 CalPERS Comprehensive Annual Financial Report, Year Ended June 30, 2008
Report of Independent Accountants (continued)
As discussed in Note 2, effective July 1, 2007, the System adopted the provisions of Governmental Accounting Standards Board Statement No. 50, Pension Disclosures – an amendment of GASB Statements No. 25 and No. 27.
As discussed in Note 5, actuarial data presented for the California Employers’ Retirement Benefi t Trust Fund was derived from actuarial valuations performed by actuarial fi rms engaged by participating employers. Actuarial valuations must comply with the CalPERS OPEB Assumption Model, which requires the use of specifi ed actuarial methods and assumptions.
As also discussed in Note 5 to the fi nancial statements, actual contributions made by the State of California to the Judges’ Retirement Fund were signifi cantly less than the actuarially determined annual required contribution. State of California contributions were used to fund benefi t payments of the current period. As such, the Judges’ Retirement Fund does not retain the accumulated contributions of active members. Management and legal counsel believe the State of California is legally required to provide contributions to fund benefi ts when due.
The global fi nancial markets have experienced signifi cant volatility. As a result, the fair value of the System’s investments has declined subsequent to June 30, 2008, as described in Note 11.
The Management’s Discussion and Analysis on pages 12 through 32, the Schedules of Funding Progress and the Schedules of Employer Contributions on pages 64 through 66 are not a required part of the basic fi nancial statements, but are supplementary information required by accounting principles generally accepted in the United States of America. We have applied certain limited procedures, which consisted principally of inquiries of management regarding the methods of measurement and presentation of the required supplementary information. However, we did not audit the information and express no opinion on it.
Our audit was conducted for the purpose of forming an opinion on the basic fi nancial statements. The supporting schedules listed in the table of contents are presented for purposes of additional analysis and are not a required part of the basic fi nancial statements. Such information has been subjected to auditing procedures applied in the audit of the basic fi nancial statements and, in our opinion, is fairly stated in all material respects in relation to the basic fi nancial statements taken as a whole.
Certifi ed Public Accountants
Sacramento, CaliforniaNovember 20, 2008
12 CalPERS Comprehensive Annual Financial Report, Year Ended June 30, 2008
Introduction
This section presents management’s discussion and analysis of the California Public Employees’ Retirement System (CalPERS) fi nancial performance during the fi scal year ended June 30, 2008. It is a narrative overview and analysis that we present in conjunction with the Chief Executive Offi cer’s Letter of Transmittal, included in the Introductory Section of this Comprehensive Annual Financial Report. It should also be read in conjunction with the basic fi nancial statements of CalPERS, as presented in this report.
In addition to historical information, the Management’s Discussion and Analysis includes certain forward-looking statements which involve certain risks and uncertainties. CalPERS actual results, performance, and achievements may differ materially from the results, performance, and achievements expressed or implied in such forward-looking statements, due to a wide range of factors, including changes in interest rates, changes in the securities markets, general economic conditions, and legislative changes, as well as other factors.
CalPERS is primarily responsible for administering retirement and health benefi ts, as well as administering supplemental retirement savings plans. CalPERS comprises a total of 16 funds, including fi ve defi ned benefi t pension funds, one other post-employment benefi t fund, four defi ned contribution pension funds, four proprietary funds, and two agency funds. The Public Employees’ Retirement Fund (PERF) is the primary fund administered by CalPERS.
Financial Highlights
Public Employees’ Retirement Fund (PERF)
• The net assets of the PERF decreased by $13.2 billion, or 5.3 percent. The decrease was primarily due to the overall economic slowdown and lagging global equity markets. CalPERS, as a long-term investor, must view investment performance across a multi-year horizon. On a five-year basis, overall investment returns remain strong at 10.7 percent.
• The PERF net rate of return on investments was negative 5.1 percent on a fair value basis, approximately 12.9 percentage points less than the actuarially assumed 7.75 percent investment return. However, CalPERS
earned double-digit gains in the four years leading up to the 2007-08 fiscal year.
• Through CalPERS 15 year smoothing of investment returns, previous positive returns will cushion the impact of the 2007-08 fi scal year investment losses on employer contribution rates. As of June 30, 2007, the asset smoothing method set aside about 14 percent of the CalPERS fund as a “rainy day” fund. The negative 5.1 percent return for fi scal year 2007-08 uses up about 13 percent of the 14 percent “rainy day” fund, leaving about one percent. If this one percent is used evenly over 15 years, then employer contribution rates set by the June 30, 2008 actuarial valuations are estimated to be lower by up to 0.1 percent of payroll. However, given the decline in PERF investments between June 30 and October 31, 2008, it is not certain that the “rainy day” fund will be available beyond the June 30, 2008 actuarial valuations. This analysis also assumes that all other actuarial assumptions are realized in aggregate. It is important to note that in recent years, the demographic experience of most plans translated to increases in employer rates.
• As of June 30, 2007, the date of the most recent actuarial valuation, the PERF is funded at 87.2 percent, based on the actuarial value of assets. A better measure of benefi t security is the funded status on a market value of assets basis; on that basis, the funded status rose from 92.6 percent at June 30, 2006, to 101.2 percent at June 30, 2007.
• The PERF paid $10.9 billion in retirement benefits to 468,898 annuitants during 2008, compared to $10.1 billion paid to 455,208 annuitants during the 2007 fiscal year. Benefit payments increased primarily due to an increase in the number of new retirees and cost-of-living adjustments (COLA).
• The total active and inactive membership was 1,126,133 at June 30, 2008. The PERF received $3.5 billion in
employee contributions from 836,914 active members and $7.2 billion in employer contributions from
1,572 employers during fiscal year 2008, compared with $3.3 billion and $6.4 billion in employee and
employer contributions respectively, in fiscal year 2007.
Additional fi nancial information related to the other pension funds administered by CalPERS is included in the Financial Analysis of CalPERS Funds section of the Management’s Discussion and Analysis.
Management’s Discussion & Analysis
13 CalPERS Comprehensive Annual Financial Report, Year Ended June 30, 2008
Health, Other Post-Employment Benefi ts & Long-Term Care Programs
• CalPERS administers the PERSCare, PERS Choice, and PERS Select self-funded health care programs. Financial activity for these programs is accounted for through the Public Employees’ System Health Care Fund. The CalPERS self-funded health care program earned $115.4 million from operations, and unrestricted net assets increased by $150.0 million to $598.6 million. This increase can be attributed to an increase in self-insurance premiums and savings from pharmacy initiatives.
• Contributions to the California Employers’ Retiree Benefit Trust Fund (CERBTF) were $655.0 million, with investment losses of $21.0 million. The net asset value of the CERBTF at June 30, 2008 was $643.6 million.
• The unrestricted net assets of the CalPERS Long-Term Care Program amounted to a deficit of $134.7 million at June 30, 2008. This amounts to an average deficit of $801 for each of the 168,140 enrollees. The Long-Term Care Program collected $299.5 million in premiums, and the approximate average annual premium per person was $1,781. The deficit of $134.7 million is a decrease of $707.5 million from the deficit of $842.3 million of June 30, 2007. The major source of the deficit decrease is Board-approved rate increases which resulted in a decrease in estimated Long-Term Care Fund liabilities.
Critical Accounting Policies
CalPERS basic fi nancial statements are prepared in accordance with accounting principles generally accepted in the United States of America (GAAP). CalPERS signifi cant accounting policies are presented in Note 2 to the Basic Financial Statements, which are included in this Comprehensive Annual Financial Report. CalPERS follows accounting policies to comply with various applicable laws and regulations and the guidelines as established by the Governmental Accounting Standards Board (GASB).
CalPERS most signifi cant management accounting policies relate to the following:
Investments
In accordance with GASB Statements 25 and 31, CalPERS investments are reported at fair value. Many factors are considered in arriving at fair value. The fair value of investments in publicly held securities are generally based on actual market prices and quotations from major investment fi rms. In general, corporate bonds that do not have a published market price are valued based on yields currently available on comparable securities of issuers with similar credit ratings. The CalPERS Investment Offi ce securities analysts or outside experts determine the criteria to identify comparable securities based on the size, industry, and profi tability of the company offering the securities and the term, rate, and dollar amount of the security.
Mortgages are valued on the basis of the timing of future principal payments and the amount of interest payments discounted at prevailing interest rates for similar instruments. The prevailing interest rates for mortgages are generally based on the 30-year Treasury note rate, which can be found in fi nancial publications. Market interest rate changes impact the likelihood of refi nancing activity, which impacts the value of the mortgage investments. Declining interest rates will cause the value of mortgage investments to increase, but at a slower rate than non-callable similar duration securities.
The fair value of real estate investments is estimated based on independent appraisals performed by CalPERS-approved appraisers who meet specifi c professional qualifi cations. Core and non-core real estate assets are appraised as required by the Board’s policy for Equity Real Estate Appraisal and Valuation. Independent real estate appraisal fi rms provide an unbiased and neutral opinion of asset value. All appraisals are completed in compliance with NCREIF’s Real Estate Investment Standards and the Appraisal Institute’s Uniform Standards of Professional Appraisal Practice.
In accordance with GAAP, real estate construction development projects are accounted for and reported at cost until project completion, which approximates fair
Management’s Discussion & Analysis (continued)
14 CalPERS Comprehensive Annual Financial Report, Year Ended June 30, 2008
value. However, due to recent events in the real estate markets, CalPERS investments in single-family housing construction projects were appraised as of March 31, 2008, to establish the fair value of that sector of the CalPERS real estate portfolio. All housing assets will be appraised annually going forward.
Short-term investments are reported at fair value, when available, or at cost plus accrued interest, when quoted market values are not available.
Alternative investments consist of investments in a variety of markets and industries through partnerships, corporate entities, co-investments, direct investments, and other investment vehicles. Publicly traded alternative investments are valued based on quoted market prices. For alternative investments made through a structure where an investment manager is responsible for the valuation, management generally utilizes the manager’s valuation, assuming a clean audit opinion under GAAP has been obtained. For direct investments where no readily ascertainable market value exists, management, in consultation with investment advisors, will determine the fair value. In making all fair value determinations, management will take into consideration the fi nancial performance of the entity, cash fl ow analysis, recent sales prices, market comparable transactions, new round of fi nancings, changes in economic conditions, and other pertinent information. These fair value estimates are, by their nature, subjective and based on judgment. Hedge funds are valued at fair value.
CalPERS holds investments in futures and options and enters into forward foreign currency exchange contracts. The fair value of futures, options, and forward foreign currency exchange contracts are determined based upon quoted market values.
CalPERS could be exposed to risk if the counterparties to the contracts are unable to meet the terms of the contract. CalPERS investment managers seek to control this risk through counterparty credit evaluations and approvals, counterparty credit limits, and exposure monitoring procedures. Investment performance rates of return for asset classes and total funds are prepared using asset data by Wilshire Associates. The returns are based solely on Wilshire Associates’ compilation and analysis of the data as provided by the master custodian, State Street Bank.
Actuarial Valuation
Actuarial valuations are used to determine the cost of pension benefi ts payable to the members of CalPERS who participate in the PERF, the Legislators’ Retirement Fund (LRF), the Judges’ Retirement Fund (JRF), and the Judges’ Retirement Fund II (JRF II) as well as the related required contribution rates. The actuarial valuations include a number of signifi cant assumptions, including the actuarial valuation method used, the asset valuation method, the rate of return on the investment portfolio, rate of infl ation, projected salary increases, post-retirement benefi ts, and the life expectancy of members and benefi ciaries. Signifi cant actuarial assumptions used in the valuations are included in the Notes to the fi nancial statements.
Estimated Liabilities
The Public Employees’ Health Care Fund (HCF) establishes claim liabilities based on estimates of the ultimate costs of claims (including future claim adjustment expenses) that have been reported but not settled, and claims that have been incurred but not reported (IBNR). The estimated claims liability was calculated by the HCF’s third-party administrator, using a variety of actuarial and statistical techniques, and adjusted for actual experience to produce current estimates that refl ect recent settlements, claim frequency, and other economic and social factors. Adjustments to claims liabilities are charged or credited to an expense in the periods in which they are made. The estimated claims liability is carried at its face amount, and no interest discount is assumed. The IBNR portion represents an estimate for claims that have been incurred prior to the fi scal year end, but have not been reported to the HCF.
The Public Employees’ Long-Term Care Fund (LTCF) estimates the required funding level to provide for the payment of future claim benefi ts. This estimate is predicated upon participation levels that are expected to be achieved by the program. The LTCF establishes the current liability for future benefi ts based on the present value of such future benefi ts and expenses, less the present value of expected future premiums.
An actuarial valuation establishes the liability for future policy benefi ts based on the present value of future benefi ts and expenses less the present value of future premiums.
Management’s Discussion & Analysis (continued)
15 CalPERS Comprehensive Annual Financial Report, Year Ended June 30, 2008
The liability for future policy benefi ts was calculated by using a variety of actuarial and statistical techniques.
The actuarial valuations for the CERBTF are conducted by outside actuarial firms that must base their valuations on the CalPERS OPEB Assumption Model. This model requires the use of actuarial methods and assumptions similar to those employed for the PERF. An additional assumption used for the CERBTF is the health care cost trend rate. The actuarial valuation estimates the cost of future health and other post-employment benefi t insurance premiums for current and retired participating employees.
Overview of the Financial Statements
The Management’s Discussion and Analysis provides an introduction to and overview of the CalPERS basic fi nancial statements, which comprise the following components: Fund Financial Statements; Notes to the Basic Financial Statements; Required Supplementary Information; and Other Supplementary Schedules. Collectively, this information presents the combined net assets held in trust for pension benefi ts, other post-employment benefi ts, and the combined unrestricted net assets for each of the other funds administered by CalPERS as of June 30, 2008. It also summarizes the combined changes in net assets held in trust for pension and other post-employment benefi ts, the combined changes in unrestricted net assets, and the cash fl ows of the proprietary funds for the year then ended, along with an actuarial view on the funding status of the defi ned benefi t plans. The information available in each of these sections is briefl y summarized as follows.
Fund Financial Statements
At June 30, 2008, fi nancial statements are presented for the two types of funds administered by CalPERS: fi duciary funds and proprietary funds.
Fiduciary Funds — include pension trust funds, one other post-employment defi ned benefi t fund, and agency funds. The defi ned benefi t plans administered by CalPERS include the PERF, LRF, JRF, JRF II, and the CERBTF. The defi ned contribution plans administered by CalPERS include the State Peace Offi cers’ and Firefi ghters’ Defi ned Contribution Plan Fund (SPOFF), the Public Agency Deferred Compensation Program (IRC 457), the Replacement
Benefi t Fund (RBF), and the Supplemental Contributions Program Fund (SCPF). The remaining fi duciary funds are the Old Age & Survivors’ Insurance Revolving Fund (OASI), and the Contingency Reserve Agency Fund (CRF). The Volunteer Firefi ghters’ Length of Service Award Fund (VFF), a fi duciary fund, was administered by CalPERS during the 2007-08 fi scal year until February 29, 2008. The fi duciary funds are used to account for resources held for the benefi t of CalPERS participants. A statement of fi duciary net assets and a statement of changes in fi duciary net assets are presented for the fi duciary funds as of and for the year ended June 30, 2008, along with comparative total information as of and for the year ended June 30, 2007. These financial statements reflect the resources available to pay benefi ts to retirees and other benefi ciaries as of year end, as well as the changes in those resources during the year.
Proprietary Funds — include the following enterprise funds: the Public Employees’ Health Care Fund (HCF), the Public Employees’ Contingency Reserve Fund (CRF), the Public Employees’ Long-Term Care Fund (LTCF), and the Public Employees’ Deferred Compensation Fund (DCF). Proprietary funds are used to account for CalPERS business-type activities, where fees are charged to cover the costs of certain services, including long-term care, health care, and other benefi ts. A statement of net assets, a statement of revenues, expenses, and changes in fund net assets, and a statement of cash fl ows are presented for the proprietary funds as of June 30, 2008, and for the year then ended, along with comparative total information as of and for the year ended June 30, 2007. These fi nancial statements refl ect the net assets of, changes in net assets of, and cash fl ows from CalPERS business-type activities.
Notes to the Basic Financial Statements
The fi nancial statement notes provide additional information that is essential to a full understanding of the information provided in the fund fi nancial statements. Information available in the notes to the fi nancial statements is described below.
Note 1 — provides a general description of CalPERS, as well as a concise description of each of the funds administered by CalPERS. Information regarding employer and member participation in the pension plans administered by CalPERS is also provided.
Management’s Discussion & Analysis (continued)
16 CalPERS Comprehensive Annual Financial Report, Year Ended June 30, 2008
Note 2 — provides a summary of signifi cant accounting policies, including the basis of accounting for each of the fund types, investment accounting policies, management’s use of estimates, information regarding the implementation of new accounting pronouncements, and other signifi cant accounting policies.
Note 3 — provides information on cash and cash equivalents.
Note 4 — describes investments, including investing authority, investment risk categorizations, and additional information about cash, securities lending, and derivatives.
Note 5 — provides information about employer contributions to the pension and other post-employment benefi t funds administered by CalPERS.
Note 6 — provides information on commitments.
Note 7 — provides information on potential contingencies of CalPERS.
Note 8 — provides detailed information on the estimated claims liability of the HCF.
Note 9 — provides information regarding the LTCF June 30, 2008 actuarial valuation.
Note 10 — provides information regarding the funded status and actuarial assumptions for the PERF, LRF, JRF, JRF II, and CERBTF.
Note 11 — provides information regarding subsequent events.
Required Supplementary Information
Because of the long-term nature of a public defi ned benefi t pension plan and other post-employment benefi t plans, fi nancial statements for the past year alone cannot provide suffi cient information to properly refl ect the funded position of the plans. Therefore, in addition to the basic fi nancial statements, two required schedules of historical trend information related to the defi ned benefi t and other post-employment benefi t plans are presented as part of the Required Supplementary Information (RSI) section of the
basic fi nancial statements. These two schedules are the Required Supplemental Schedule of Funding Progress and the Required Supplemental Schedule of Employer Contributions. These two schedules are based on the actuarial valuations for the pension plans performed by CalPERS actuaries and the other post-employment benefi ts sponsoring employer actuaries, and provide additional actuarial information that contributes to the understanding of the changes in the actuarial funding and the funded status of these defi ned benefi t and other post-employment benefi t plans over the past six years. The actuarial information is based upon assumptions made about future events at the time the valuations were performed, and, therefore, the amounts presented are management’s estimates. Also included as part of the RSI is the Required Supplemental Schedule of Claims Development Information for the HCF.
Other Supplementary Schedules
Other schedules include detailed information on administrative expenses incurred by CalPERS-administered funds, as well as investment and other professional services expenses incurred.
Financial Analysis of CalPERS Funds
Public Employees’ Retirement Fund (PERF)
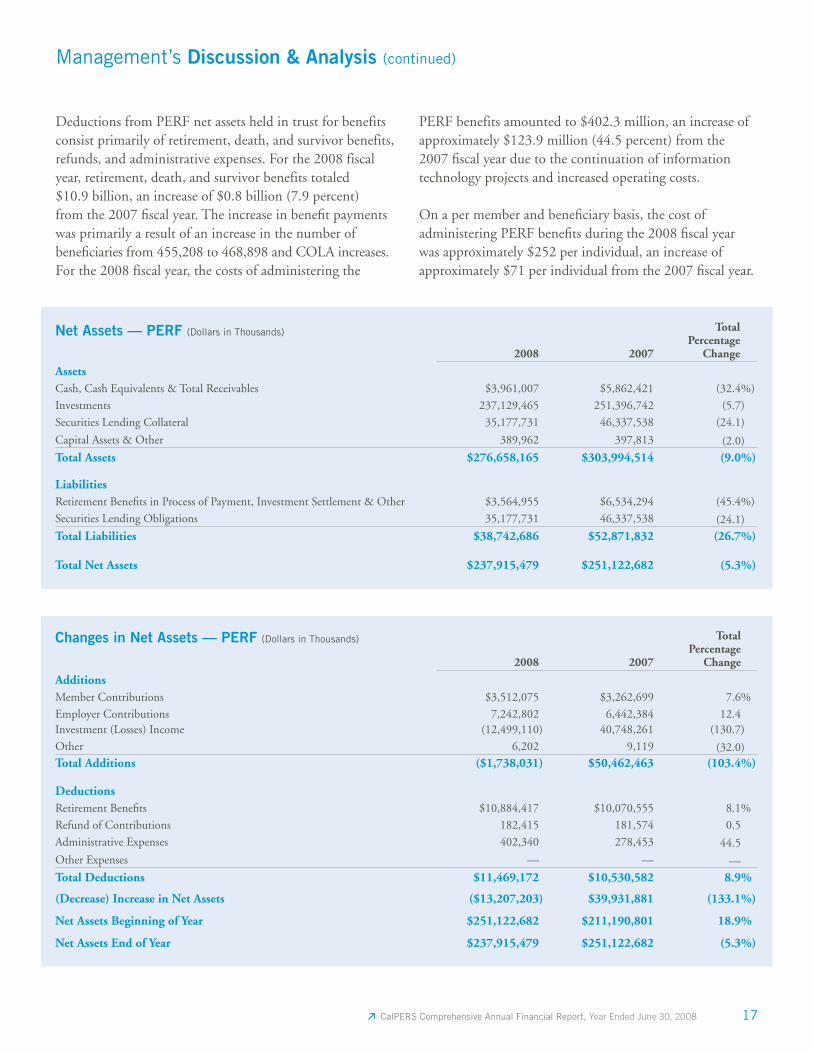
Plan Net AssetsThe PERF provides retirement benefi ts to State of California and other California public agency employees. PERF benefi ts are funded by member and employer contributions and by earnings on investments. The PERF net assets held in trust for benefits at June 30, 2008 were $237.9 billion, a decrease of $13.2 billion (5.3 percent) from $251.1 billion at June 30, 2007.
Additions to PERF net assets held in trust for benefits include employer and member contributions, offset by investment losses. For the 2008 fiscal year, employer and member contributions totaled $10.8 billion, an increase of $1.1 billion (11.3 percent) from the 2007 fiscal year. The increase in required contributions was due primarily to an increase in employer contributions. The PERF recognized a net investment loss of $12.5 billion for the 2008 fiscal year, compared with a net investment income of $40.7 billion for the 2007 fiscal year. Investment losses were due to the overall economic slowdown and lagging global equity markets.
Management’s Discussion & Analysis (continued)
17 CalPERS Comprehensive Annual Financial Report, Year Ended June 30, 2008
Management’s Discussion & Analysis (continued)
Net Assets — PERF (Dollars in Thousands)
2008 2007
TotalPercentage
Change
AssetsCash, Cash Equivalents & Total Receivables $3,961,007 $5,862,421 (32.4%)
Investments 237,129,465 251,396,742 (5.7)
Securities Lending Collateral 35,177,731 46,337,538 (24.1)
Capital Assets & Other 389,962 397,813 (2.0)
Total Assets $276,658,165 $303,994,514 (9.0%)
LiabilitiesRetirement Benefi ts in Process of Payment, Investment Settlement & Other $3,564,955 $6,534,294 (45.4%)
Securities Lending Obligations 35,177,731 46,337,538 (24.1)
Total Liabilities $38,742,686 $52,871,832 (26.7%)
Total Net Assets $237,915,479 $251,122,682 (5.3%)
Changes in Net Assets — PERF (Dollars in Thousands)
2008 2007
Total Percentage
Change
AdditionsMember Contributions $3,512,075 $3,262,699 7.6%
Employer Contributions 7,242,802 6,442,384 12.4Investment (Losses) Income (12,499,110) 40,748,261 (130.7)
Other 6,202 9,119 (32.0)Total Additions ($1,738,031) $50,462,463 (103.4%)
DeductionsRetirement Benefi ts $10,884,417 $10,070,555 8.1%
Refund of Contributions 182,415 181,574 0.5
Administrative Expenses 402,340 278,453 44.5
Other Expenses — — —
Total Deductions $11,469,172 $10,530,582 8.9%
(Decrease) Increase in Net Assets ($13,207,203) $39,931,881 (133.1%)
Net Assets Beginning of Year $251,122,682 $211,190,801 18.9%
Net Assets End of Year $237,915,479 $251,122,682 (5.3%)
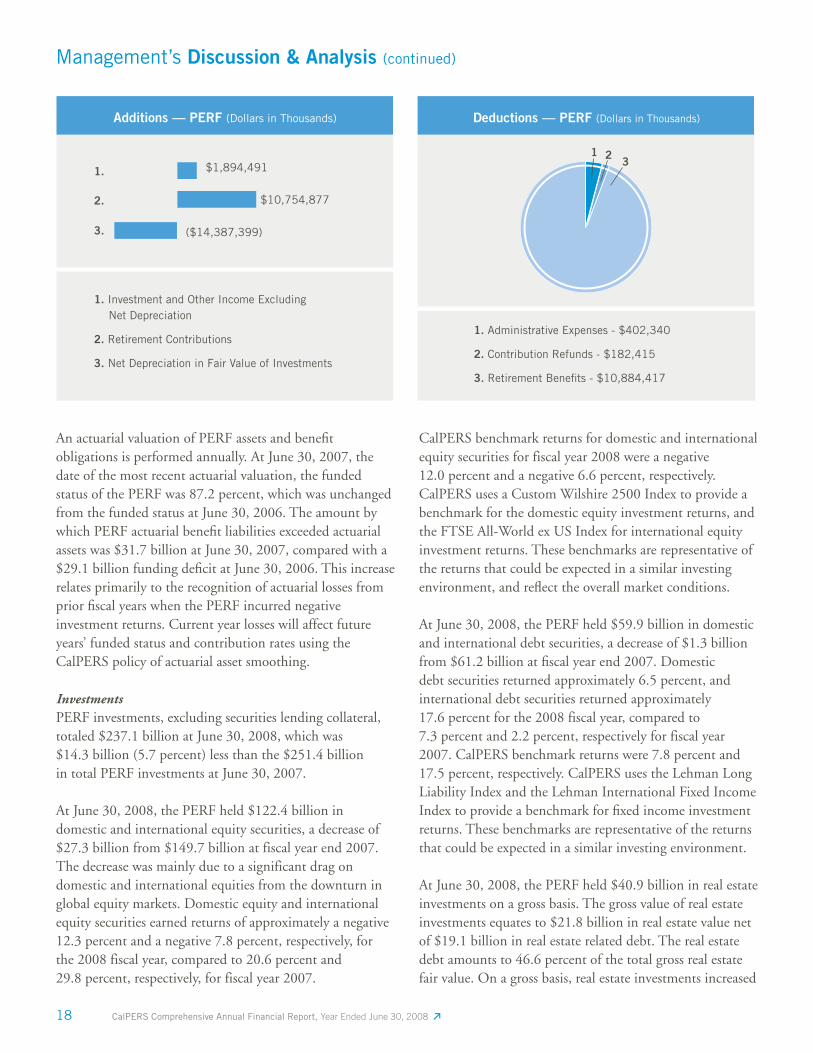
Deductions from PERF net assets held in trust for benefits consist primarily of retirement, death, and survivor benefits, refunds, and administrative expenses. For the 2008 fiscal year, retirement, death, and survivor benefits totaled $10.9 billion, an increase of $0.8 billion (7.9 percent) from the 2007 fi scal year. The increase in benefi t payments was primarily a result of an increase in the number of benefi ciaries from 455,208 to 468,898 and COLA increases. For the 2008 fiscal year, the costs of administering the
PERF benefits amounted to $402.3 million, an increase of approximately $123.9 million (44.5 percent) from the 2007 fi scal year due to the continuation of information technology projects and increased operating costs.
On a per member and benefi ciary basis, the cost of administering PERF benefi ts during the 2008 fi scal year was approximately $252 per individual, an increase of approximately $71 per individual from the 2007 fi scal year.
18 CalPERS Comprehensive Annual Financial Report, Year Ended June 30, 2008
Management’s Discussion & Analysis (continued)
An actuarial valuation of PERF assets and benefi t obligations is performed annually. At June 30, 2007, the date of the most recent actuarial valuation, the funded status of the PERF was 87.2 percent, which was unchanged from the funded status at June 30, 2006. The amount by which PERF actuarial benefi t liabilities exceeded actuarial assets was $31.7 billion at June 30, 2007, compared with a $29.1 billion funding defi cit at June 30, 2006. This increase relates primarily to the recognition of actuarial losses from prior fi scal years when the PERF incurred negative investment returns. Current year losses will affect future years’ funded status and contribution rates using the CalPERS policy of actuarial asset smoothing.
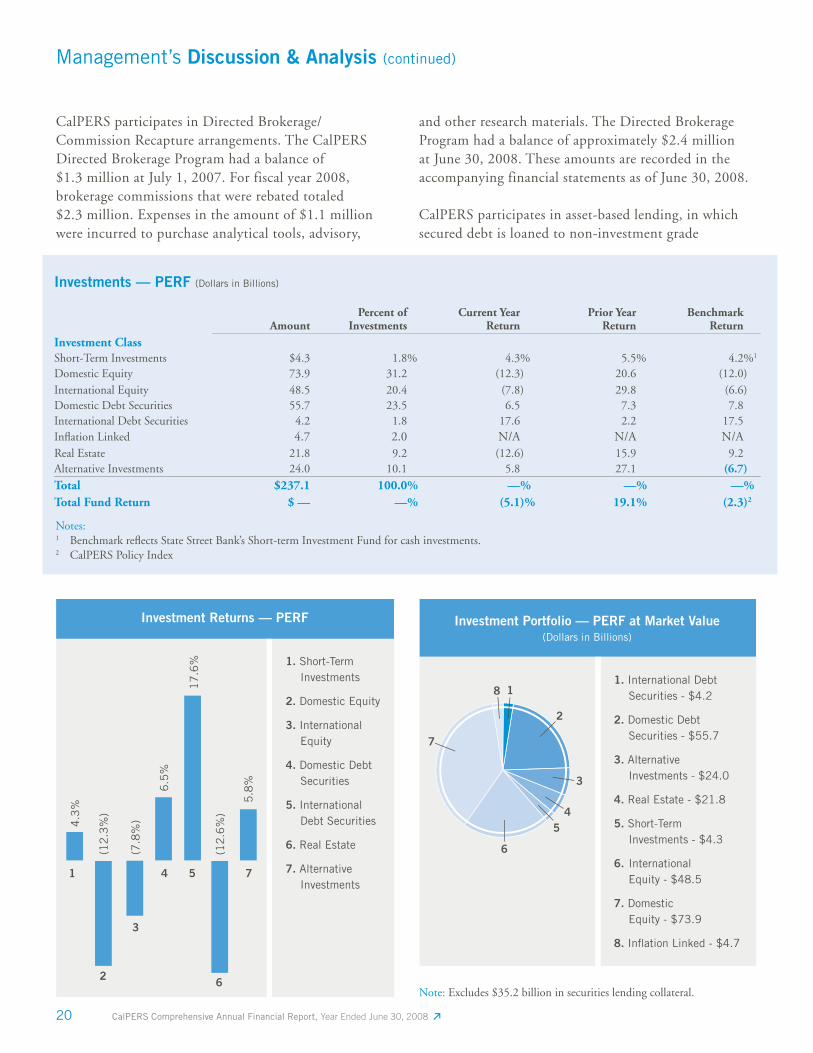
InvestmentsPERF investments, excluding securities lending collateral, totaled $237.1 billion at June 30, 2008, which was $14.3 billion (5.7 percent) less than the $251.4 billion in total PERF investments at June 30, 2007.
At June 30, 2008, the PERF held $122.4 billion in domestic and international equity securities, a decrease of $27.3 billion from $149.7 billion at fiscal year end 2007. The decrease was mainly due to a significant drag on domestic and international equities from the downturn in global equity markets. Domestic equity and international equity securities earned returns of approximately a negative 12.3 percent and a negative 7.8 percent, respectively, for the 2008 fiscal year, compared to 20.6 percent and 29.8 percent, respectively, for fiscal year 2007.
CalPERS benchmark returns for domestic and international equity securities for fiscal year 2008 were a negative 12.0 percent and a negative 6.6 percent, respectively. CalPERS uses a Custom Wilshire 2500 Index to provide a benchmark for the domestic equity investment returns, and the FTSE All-World ex US Index for international equity investment returns. These benchmarks are representative of the returns that could be expected in a similar investing environment, and refl ect the overall market conditions.
At June 30, 2008, the PERF held $59.9 billion in domestic and international debt securities, a decrease of $1.3 billion from $61.2 billion at fi scal year end 2007. Domestic debt securities returned approximately 6.5 percent, and international debt securities returned approximately 17.6 percent for the 2008 fiscal year, compared to 7.3 percent and 2.2 percent, respectively for fiscal year 2007. CalPERS benchmark returns were 7.8 percent and 17.5 percent, respectively. CalPERS uses the Lehman Long Liability Index and the Lehman International Fixed Income Index to provide a benchmark for fi xed income investment returns. These benchmarks are representative of the returns that could be expected in a similar investing environment.
At June 30, 2008, the PERF held $40.9 billion in real estate investments on a gross basis. The gross value of real estate investments equates to $21.8 billion in real estate value net of $19.1 billion in real estate related debt. The real estate debt amounts to 46.6 percent of the total gross real estate fair value. On a gross basis, real estate investments increased
Deductions — PERF (Dollars in Thousands)
132
1. Investment and Other Income Excluding Net Depreciation
2. Retirement Contributions
3. Net Depreciation in Fair Value of Investments
$1,894,491
$10,754,877
($14,387,399)
1.
2.
3.
1. Administrative Expenses - $402,340
2. Contribution Refunds - $182,415
3. Retirement Benefi ts - $10,884,417
Additions — PERF (Dollars in Thousands)
19 CalPERS Comprehensive Annual Financial Report, Year Ended June 30, 2008
Management’s Discussion & Analysis (continued)
$4.0 billion from the $37.0 billion gross real estate investments at the 2007 fiscal year end.
In addition, the Investment Policy for Equity Real Estate Leverage provides for the use of Credit Accommodations. These accommodations generally refer to a guarantee executed by CalPERS, whereby CalPERS agrees to pay the debt obligation of a real estate partnership entity in the event the entity fails to pay the debt obligation.
Real estate investments returned approximately negative 12.6 percent for the 2008 fiscal year, compared to 15.9 percent for fiscal year 2007. The negative returns in real estate investments were primarily due to the downturn in the residential real estate market.
CalPERS benchmark for real estate return for fiscal year 2008 was 9.2 percent. CalPERS uses the NCREIF property Index to provide a benchmark for real estate investment returns. The NCREIF is a property-level performance benchmark for institutionally owned real estate held in a fiduciary environment.
Real estate investments are classified as investments in accordance with GASB Statement 25. Certain real estate investments are leveraged whereby partnerships have been established to purchase properties through a combination of contributions from CalPERS and other investors and through the acquisition of debt.
The $19.1 billion in real estate debt is made up of $13.9 billion in long-term mortgages payable and $5.2 billion in other short-term liabilities.
For the Alternative Investments Management (AIM) program, CalPERS has private equity unfunded commitments of $26.4 billion that are not displayed on the Statement of Fiduciary Net Assets. In addition, CalPERS has real estate unfunded commitments of $17.1 billion that are not displayed on the Statement of Fiduciary Net Assets.
The CalPERS Board of Administration approved a new asset allocation, effective January 2008, which increased allocations to both real estate and private equity, and established a new Inflation Linked Asset Class (ILAC). The ILAC is Board-approved to include commodities, inflation-linked bonds, infrastructure, and forestland.
At June 30, 2008, the ILAC held $1.6 billion in inflation-linked bonds, $0.1 billion in infrastructure, $1.6 billion in forestland, and $1.4 billion in commodities exposure. ILAC has not been held for a full year, therefore, an annual rate of return is not available.
At June 30, 2008, the PERF held $24.0 billion in alternative investments, an increase of $7.2 billion from $16.8 billion at the 2007 fiscal year end. Alternative investments yielded a return of approximately 5.8 percent for the 2008 fiscal year, compared to 27.1 percent for fiscal year 2007. CalPERS uses the Custom Wilshire 2500 Index +300 basis points as the long-term benchmark for the AIM program.
At June 30, 2008, the PERF held $4.3 billion in short-term investments, an increase of $0.7 billion from the $3.6 billion at the 2007 fi scal year end. Short-term investments returned approximately 4.3 percent for the 2008 fi scal year, compared to 5.5 percent for fi scal year 2007. CalPERS uses the SSGA Custom STIF as a benchmark for short-term investments.
The PERF earned other investment income of $155.6 million for the 2008 fiscal year. Included in other investment income was income earned from securities litigation, sale of fractional shares, and other miscellaneous income.
The PERF earns additional investment income by lending investment securities. Borrowers pay a fee for the right to borrow securities, and then provide collateral to the PERF for 102 percent to 105 percent of the values of the securities borrowed. The over collateralization ensures the PERF is made whole in the event the borrower fails to return the security. The PERF pays the borrower a rate for holding collateral, called a rebate. The PERF invests the cash collateral in short-term securities, and any spread above the rebate rate is additional income for the PERF. For the 2008 fi scal year, net securities lending losses amounted to $158.5 million, compared to the $154.7 million in net securities lending income during the 2007 fi scal year. The $158.5 million in securities lending unrealized losses resulted mainly from short-term income markets’ volatility, resulting in a lack of liquidity throughout the short-term market.
20 CalPERS Comprehensive Annual Financial Report, Year Ended June 30, 2008
Management’s Discussion & Analysis (continued)
CalPERS participates in Directed Brokerage/Commission Recapture arrangements. The CalPERS Directed Brokerage Program had a balance of $1.3 million at July 1, 2007. For fiscal year 2008, brokerage commissions that were rebated totaled $2.3 million. Expenses in the amount of $1.1 millionwere incurred to purchase analytical tools, advisory,
and other research materials. The Directed Brokerage Program had a balance of approximately $2.4 million at June 30, 2008. These amounts are recorded in the accompanying financial statements as of June 30, 2008.
CalPERS participates in asset-based lending, in which secured debt is loaned to non-investment grade
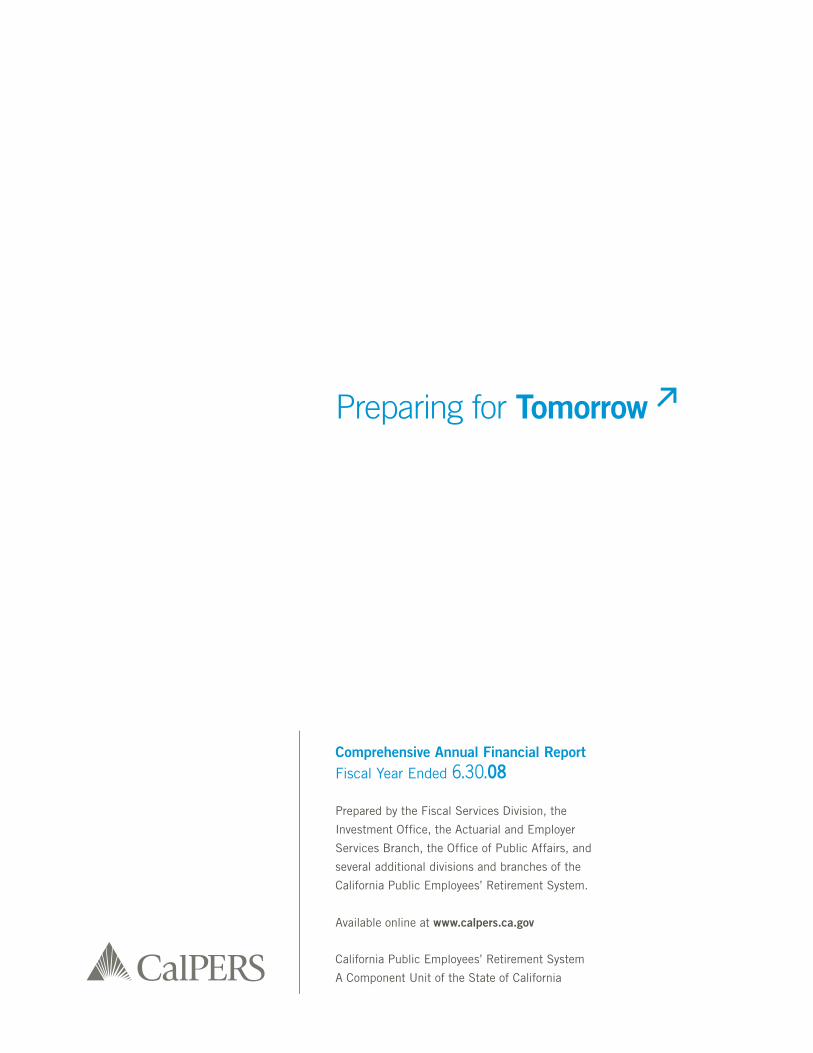
Investments — PERF (Dollars in Billions)
AmountPercent of
InvestmentsCurrent Year
ReturnPrior Year
ReturnBenchmark
ReturnInvestment ClassShort-Term Investments $4.3 1.8% 4.3% 5.5% 4.2%1
Domestic Equity 73.9 31.2 (12.3) 20.6 (12.0)International Equity 48.5 20.4 (7.8) 29.8 (6.6)Domestic Debt Securities 55.7 23.5 6.5 7.3 7.8International Debt Securities 4.2 1.8 17.6 2.2 17.5Infl ation Linked 4.7 2.0 N/A N/A N/AReal Estate 21.8 9.2 (12.6) 15.9 9.2Alternative Investments 24.0 10.1 5.8 27.1 (6.7)Total $237.1 100.0% —% —% —%Total Fund Return $ — —% (5.1)% 19.1% (2.3)2
Notes: 1 Benchmark refl ects State Street Bank’s Short-term Investment Fund for cash investments.2 CalPERS Policy Index
Note: Excludes $35.2 billion in securities lending collateral.
1
3
2
45
6
8
7
1 2 4 5 7
4.3
%
(12
.3%
)
(7.8
%)
6.5
%
17
.6%
5.8
%
(12
.6%
)
3
62
1. Short-Term Investments
2. Domestic Equity
3. International Equity
4. Domestic Debt Securities
5. International Debt Securities
6. Real Estate
7. Alternative Investments
1. International Debt Securities - $4.2
2. Domestic Debt Securities - $55.7
3. Alternative Investments - $24.0
4. Real Estate - $21.8
5. Short-Term Investments - $4.3
6. International Equity - $48.5
7. Domestic Equity - $73.9
8. Infl ation Linked - $4.7
Investment Portfolio — PERF at Market Value(Dollars in Billions)
Investment Returns — PERF
21 CalPERS Comprehensive Annual Financial Report, Year Ended June 30, 2008
borrowers, primarily for working capital, acquisitions, turnarounds, growth financing, debtor-in-possession financing, exit financing, and corporate recapitalization/reorganizations. In exchange for these loan amounts, CalPERS receives interest and fees from the borrowers. Interest and fee income earned was $22.3 million for the 2008 fiscal year, and outstanding commitments totaled $1.0 billion at June 30, 2008.
Other Defi ned Benefi t Pension Plans
Legislators’ Retirement Fund (LRF)
Plan Net AssetsThe LRF provides retirement benefits to California Legislators elected to office before November 7, 1990, and to all Constitutional and Statutory Officers. The number of LRF members is declining as eligible incumbent Legislators leave office and are replaced by those ineligible to participate in the LRF.
The LRF net assets held in trust for benefits at June 30, 2008 totaled $134.1 million, a decrease of $8.1 million (5.7 percent) from June 30, 2007.
Additions to LRF net assets held in trust for benefi ts were from investment income and contributions to repurchase military and prior year service credit. There were no actuarially determined annual required employer and member contributions for 2008. Net investment income decreased $16.3 million (98.7 percent) to a net investment gain of $0.2 million for the 2008 fiscal year, from a net investment gain of $16.5 million for the 2007 fiscal year, due primarily to poorly performing domestic and international equity markets during 2008.
Deductions in LRF net assets held in trust for benefits are primarily composed of retirement, death, and survivor benefits. For the 2008 fiscal year, these benefits decreased $0.1 million (1.3 percent) to $7.6 million from $7.7 million in 2007. On a per member and beneficiary basis, the cost of administering LRF benefits during the 2008 fiscal year was approximately $1,315 per individual, an increase of approximately $290 per individual from the 2007 fiscal year due to increased direct expenses and an accrual of the State’s OPEB costs.
An actuarial valuation of LRF assets and benefi t obligations is performed annually using the aggregate cost method, which does not identify unfunded actuarial liabilities. Based on the most recent actuarial valuation, performed as of June 30, 2007, the active member contribution rate for the 2008 fiscal year remains at zero percent.
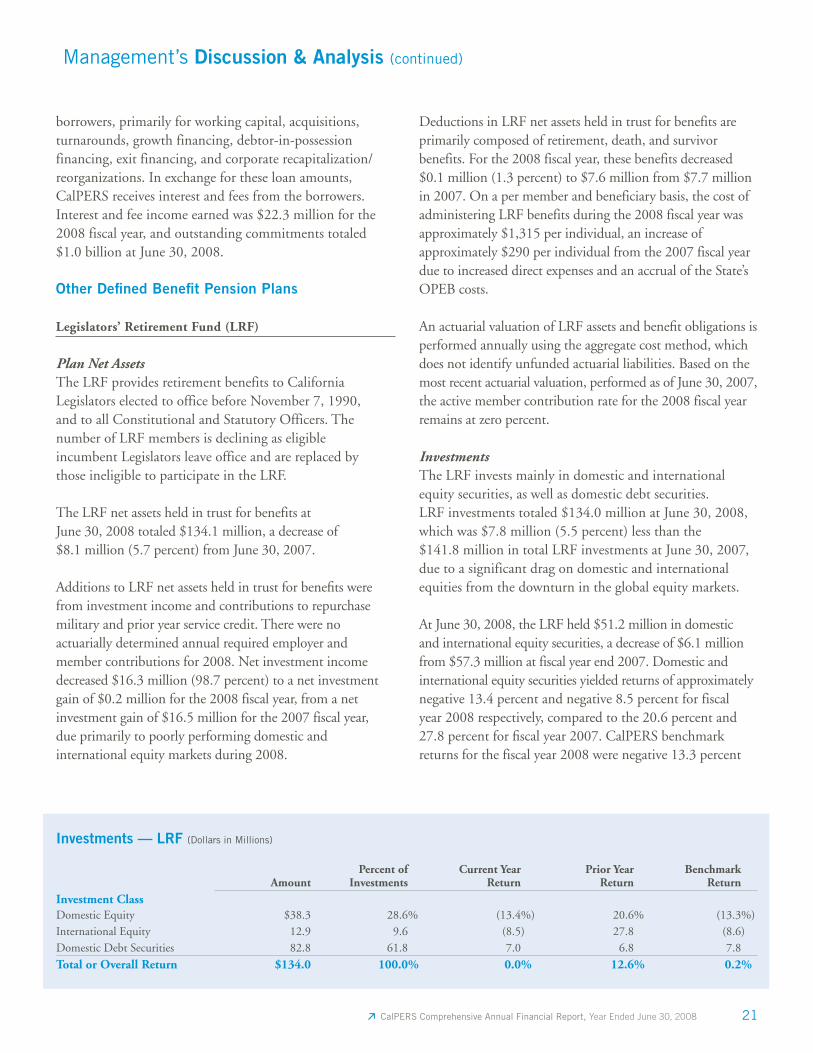
InvestmentsThe LRF invests mainly in domestic and international equity securities, as well as domestic debt securities. LRF investments totaled $134.0 million at June 30, 2008,which was $7.8 million (5.5 percent) less than the $141.8 million in total LRF investments at June 30, 2007, due to a significant drag on domestic and international equities from the downturn in the global equity markets.
At June 30, 2008, the LRF held $51.2 million in domestic and international equity securities, a decrease of $6.1 million from $57.3 million at fiscal year end 2007. Domestic and international equity securities yielded returns of approximately negative 13.4 percent and negative 8.5 percent for fiscal year 2008 respectively, compared to the 20.6 percent and 27.8 percent for fi scal year 2007. CalPERS benchmark returns for the fiscal year 2008 were negative 13.3 percent
Investments — LRF (Dollars in Millions)
AmountPercent of
InvestmentsCurrent Year
ReturnPrior Year
ReturnBenchmark
ReturnInvestment ClassDomestic Equity $38.3 28.6% (13.4%) 20.6% (13.3%)International Equity 12.9 9.6 (8.5) 27.8 (8.6)Domestic Debt Securities 82.8 61.8 7.0 6.8 7.8
Total or Overall Return $134.0 100.0% 0.0% 12.6% 0.2%
Management’s Discussion & Analysis (continued)
22 CalPERS Comprehensive Annual Financial Report, Year Ended June 30, 2008
and negative 8.6 percent. CalPERS uses the Custom S&P 500 Index and FTSE Developed World ex US & Tobacco Index (net of dividends), to provide a benchmark for the domestic and international equity investment returns, respectively. These benchmarks are representative of the returns that could be expected in a similar investing environment and reflect the overall market conditions.
At June 30, 2008, the LRF held $82.8 million in domestic debt securities, a decrease of $1.7 million from $84.5 million at fi scal year end 2007. Domestic debt securities returned 7.0 percent for fi scal year 2008, compared to 6.8 percent for fi scal year 2007. CalPERS benchmark return for fi scal year 2008 was 7.8 percent. CalPERS uses the Lehman Long Liability Index to provide
Management’s Discussion & Analysis (continued)
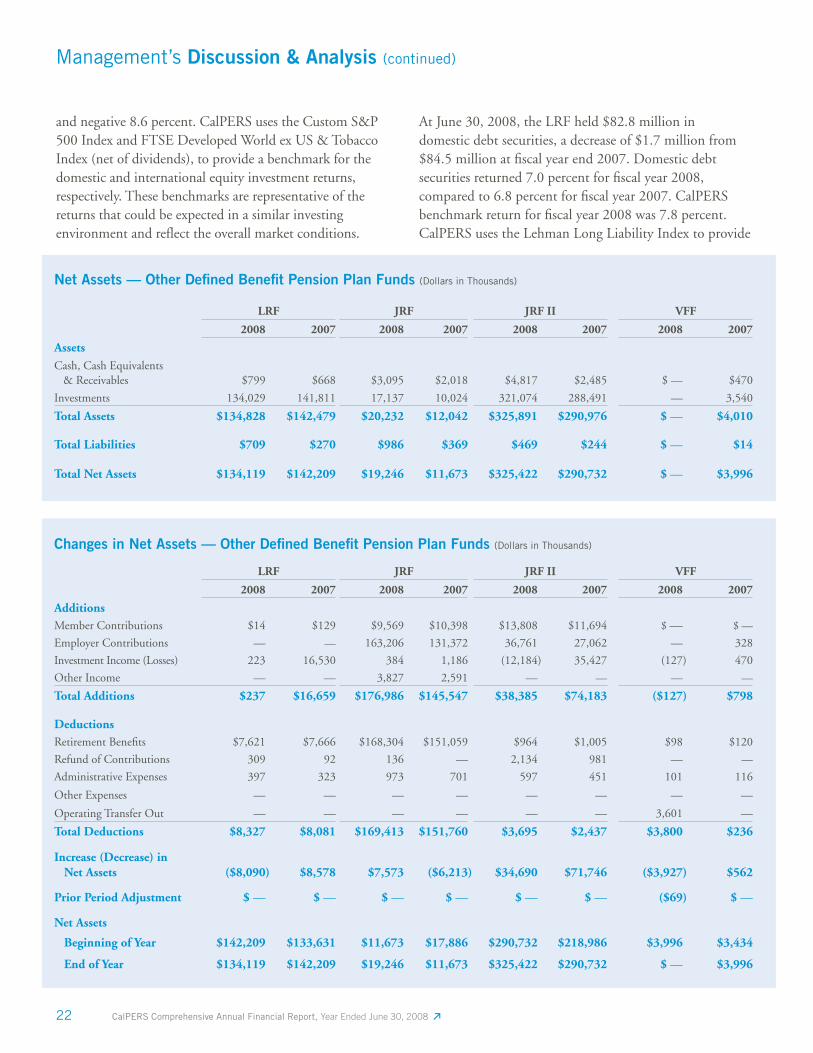
Net Assets — Other Defi ned Benefi t Pension Plan Funds (Dollars in Thousands)
LRF JRF JRF II VFF
2008 2007 2008 2007 2008 2007 2008 2007
AssetsCash, Cash Equivalents & Receivables $799 $668 $3,095 $2,018 $4,817 $2,485 $ — $470
Investments 134,029 141,811 17,137 10,024 321,074 288,491 — 3,540
Total Assets $134,828 $142,479 $20,232 $12,042 $325,891 $290,976 $ — $4,010
Total Liabilities $709 $270 $986 $369 $469 $244 $ — $14
Total Net Assets $134,119 $142,209 $19,246 $11,673 $325,422 $290,732 $ — $3,996
Changes in Net Assets — Other Defi ned Benefi t Pension Plan Funds (Dollars in Thousands)
LRF JRF JRF II VFF
2008 2007 2008 2007 2008 2007 2008 2007
Additions Member Contributions $14 $129 $9,569 $10,398 $13,808 $11,694 $ — $ —
Employer Contributions — — 163,206 131,372 36,761 27,062 — 328
Investment Income (Losses) 223 16,530 384 1,186 (12,184) 35,427 (127) 470
Other Income — — 3,827 2,591 — — — —
Total Additions $237 $16,659 $176,986 $145,547 $38,385 $74,183 ($127) $798
Deductions Retirement Benefi ts $7,621 $7,666 $168,304 $151,059 $964 $1,005 $98 $120
Refund of Contributions 309 92 136 — 2,134 981 — —
Administrative Expenses 397 323 973 701 597 451 101 116
Other Expenses — — — — — — — —
Operating Transfer Out — — — — — — 3,601 —
Total Deductions $8,327 $8,081 $169,413 $151,760 $3,695 $2,437 $3,800 $236
Increase (Decrease) in Net Assets ($8,090) $8,578 $7,573 ($6,213) $34,690 $71,746 ($3,927) $562
Prior Period Adjustment $ — $ — $ — $ — $ — $ — ($69) $ —
Net Assets
Beginning of Year $142,209 $133,631 $11,673 $17,886 $290,732 $218,986 $3,996 $3,434
End of Year $134,119 $142,209 $19,246 $11,673 $325,422 $290,732 $ — $3,996
23 CalPERS Comprehensive Annual Financial Report, Year Ended June 30, 2008
a benchmark for our fi xed income investment returns. This benchmark is representative of the returns that could be expected in a similar investing environment, and refl ects the overall market characteristics.
Judges’ Retirement Fund (JRF)
Plan Net AssetsThe JRF provides retirement benefits to California Supreme and Appellate Court Justices and Superior Court Judges. The JRF net assets held in trust for benefits at June 30, 2008, totaled $19.2 million, an increase of $7.5 million from June 30, 2007.
Additions to JRF net assets held in trust for benefits include employer, State of California, and member contributions, as well as investment income. For the 2008 fiscal year, employer, State, and member contributions increased $31.0 million (21.9 percent) to $172.8 million, from $141.8 million for the 2007 fiscal year, primarily as a result of an increase in the State’s contribution. For the 2008 fiscal year, net investment income decreased $0.8 million (67.6 percent) from the 2007 fiscal year due mainly to lower average asset balances throughout the year.
Deductions in JRF net assets held in trust for benefits are primarily composed of retirement, death, and survivor benefits. For the 2008 fiscal year, these benefits amounted to $168.3 million, an increase of $17.2 million (11.4 percent) from the 2007 fiscal year. The increase in benefit payments was mainly a result of a COLA and an increase in the number of JRF retirees and beneficiaries to 1,735 in the 2008 fiscal year from 1,702 in the 2007 fiscal year.
On a per member and beneficiary basis, the cost of administering JRF benefits during 2008 was approximately $402 per individual, an increase of approximately $117 per individual from fiscal year 2007. The increase is due primarily to increased direct costs in the 2008 fiscal year.
The JRF is funded on a “pay-as-you-go” basis, where short-term investments, contributions received during the year, and a State General Fund augmentation are used to provide funding for benefit payments. This funding method is generally more expensive in the long term, as the fund does not have investment returns generated by a funded
plan. Without the State General Fund augmentation, the JRF will not be able to pay the accumulated benefit payments due in 2009.
InvestmentsThe JRF invests only in short-term securities. Total JRF investments were $17.1 million at June 30, 2008, which was $7.1 million more than the $10.0 million in total JRF investments at June 30, 2007. The increase in short-term investments is due to a rise in benefit payments from a growing retired member population and the resulting necessity for a larger General Fund augmentation to cover benefit payments. The increase in the General Fund augmentation results in a higher cash flow and larger balance in short-term investments. Short-term investments returned approximately 3.3 percent for fi scal year 2008, compared with the 5.3 percent for fi scal year 2007.
Judges’ Retirement Fund II (JRF II)
Plan Net AssetsThe JRF II provides retirement benefits to California Supreme and Appellate Court Justices, Superior Court Judges, and Municipal Court Judges first appointed or elected after November 9, 1994. The JRF II net assets held in trust for benefits at June 30, 2008 were $325.4 million, an increase of $34.7 million (11.9 percent) from June 30, 2007.
Additions to JRF II net assets held in trust for benefits include employer and member contributions, as well as investment income. Employer and member contributions increased $11.8 million (30.4 percent), to $50.6 million for the 2008 fi scal year, from $38.8 million for the 2007 fiscal year, primarily as a result of a 7.2 percent increase in active membership from 2007 to 2008. For the 2008 fiscal year, the JRF II incurred a net investment loss of $12.2 million, a decrease in income of approximately $47.6 million (134.5 percent) from the 2007 fiscal year net investment income of $35.4 million, primarily due to negative returns in equity and real estate investments.
Deductions in JRF II net assets held in trust for benefits are primarily composed of retirement, death, survivor benefits, and refunds of contributions. For the 2008 fiscal year, these benefits remained stable at $1.0 million. However, contribution refunds increased $1.1 million
Management’s Discussion & Analysis (continued)
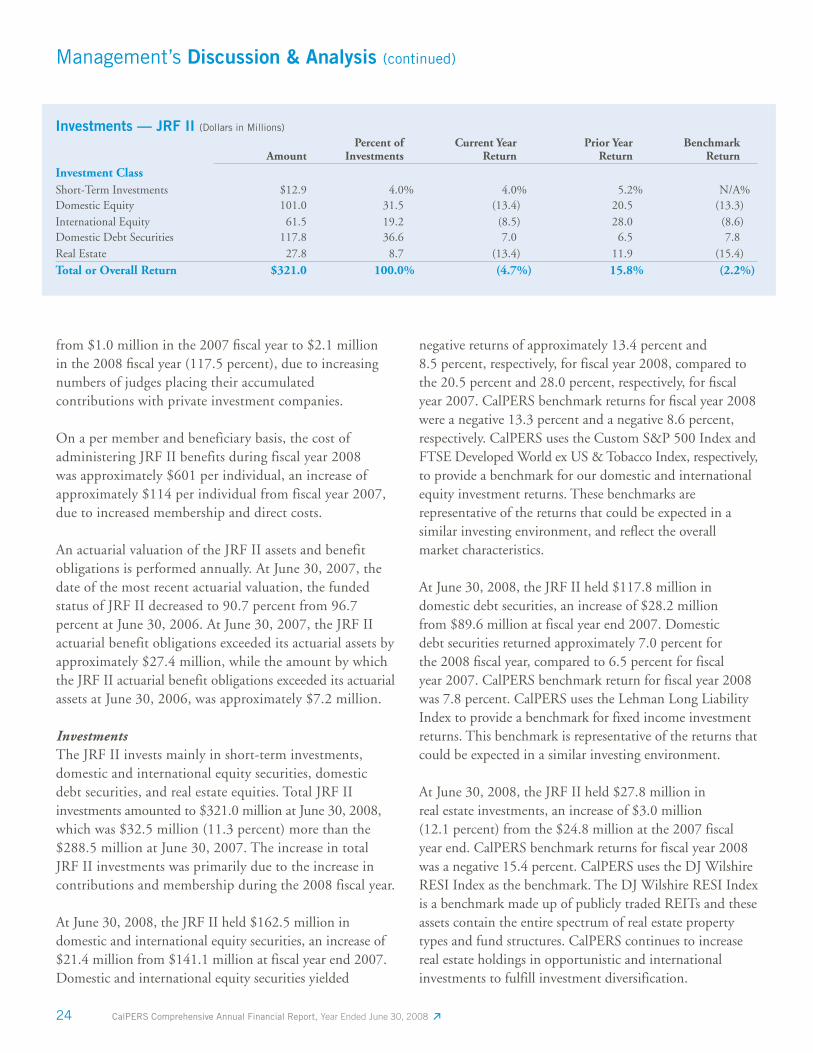
24 CalPERS Comprehensive Annual Financial Report, Year Ended June 30, 2008
from $1.0 million in the 2007 fi scal year to $2.1 million in the 2008 fi scal year (117.5 percent), due to increasing numbers of judges placing their accumulated contributions with private investment companies.
On a per member and beneficiary basis, the cost of administering JRF II benefits during fiscal year 2008 was approximately $601 per individual, an increase of approximately $114 per individual from fiscal year 2007,due to increased membership and direct costs.
An actuarial valuation of the JRF II assets and benefit obligations is performed annually. At June 30, 2007, the date of the most recent actuarial valuation, the funded status of JRF II decreased to 90.7 percent from 96.7 percent at June 30, 2006. At June 30, 2007, the JRF II actuarial benefit obligations exceeded its actuarial assets by approximately $27.4 million, while the amount by which the JRF II actuarial benefit obligations exceeded its actuarial assets at June 30, 2006, was approximately $7.2 million.
InvestmentsThe JRF II invests mainly in short-term investments, domestic and international equity securities, domestic debt securities, and real estate equities. Total JRF II investments amounted to $321.0 million at June 30, 2008, which was $32.5 million (11.3 percent) more than the $288.5 million at June 30, 2007. The increase in total JRF II investments was primarily due to the increase in contributions and membership during the 2008 fiscal year.
At June 30, 2008, the JRF II held $162.5 million in domestic and international equity securities, an increase of $21.4 million from $141.1 million at fiscal year end 2007. Domestic and international equity securities yielded
negative returns of approximately 13.4 percent and 8.5 percent, respectively, for fiscal year 2008, compared to the 20.5 percent and 28.0 percent, respectively, for fi scal year 2007. CalPERS benchmark returns for fi scal year 2008 were a negative 13.3 percent and a negative 8.6 percent, respectively. CalPERS uses the Custom S&P 500 Index and FTSE Developed World ex US & Tobacco Index, respectively, to provide a benchmark for our domestic and international equity investment returns. These benchmarks are representative of the returns that could be expected in a similar investing environment, and reflect the overall market characteristics.
At June 30, 2008, the JRF II held $117.8 million in domestic debt securities, an increase of $28.2 million from $89.6 million at fiscal year end 2007. Domestic debt securities returned approximately 7.0 percent for the 2008 fi scal year, compared to 6.5 percent for fiscal year 2007. CalPERS benchmark return for fiscal year 2008 was 7.8 percent. CalPERS uses the Lehman Long Liability Index to provide a benchmark for fixed income investment returns. This benchmark is representative of the returns that could be expected in a similar investing environment.
At June 30, 2008, the JRF II held $27.8 million in real estate investments, an increase of $3.0 million (12.1 percent) from the $24.8 million at the 2007 fiscal year end. CalPERS benchmark returns for fiscal year 2008 was a negative 15.4 percent. CalPERS uses the DJ Wilshire RESI Index as the benchmark. The DJ Wilshire RESI Index is a benchmark made up of publicly traded REITs and these assets contain the entire spectrum of real estate property types and fund structures. CalPERS continues to increase real estate holdings in opportunistic and international investments to fulfill investment diversification.
Management’s Discussion & Analysis (continued)
Investments — JRF II (Dollars in Millions)
AmountPercent of
InvestmentsCurrent Year
ReturnPrior Year
ReturnBenchmark
ReturnInvestment ClassShort-Term Investments $12.9 4.0% 4.0 % 5.2% N/A%Domestic Equity 101.0 31.5 (13.4) 20.5 (13.3)International Equity 61.5 19.2 (8.5) 28.0 (8.6)Domestic Debt Securities 117.8 36.6 7.0 6.5 7.8Real Estate 27.8 8.7 (13.4) 11.9 (15.4)
Total or Overall Return $321.0 100.0% (4.7%) 15.8% (2.2%)
25 CalPERS Comprehensive Annual Financial Report, Year Ended June 30, 2008
At June 30, 2008, the JRF II held $12.9 million in short-term investments, a decrease of $20.0 million from $32.9 million at fiscal year end 2007. Short-term investments returned approximately 4.0 percent for fiscal year 2008, compared to 5.2 percent for fiscal year 2007.
Volunteer Firefi ghters’ Fund (VFF)
Plan Net AssetsThe VFF provided monetary awards to volunteer firefighters. There are no VFF net assets reported because the assets and liabilities of the VFF were transferred from CalPERS to the California State Firefighters’ Employee Welfare Benefits Corporation (CSFEWBC). The Statutes of 2007, Chapter 651, SEC. 3. added Article 7 (commencing with Section 50980) to Chapter 4.5 of Division 1 of Title 5 of the Government Code, which provided for the transfer of the data and files, assets and liabilities of the VFF from CalPERS to the CSFEWBC on or before March 1, 2008. Government Code Section 50985 provided that the transfer is deemed complete on the date CalPERS transferred the assets and liabilities of the VFF, and Government Code Section 50984 provided that upon the transfer, the CSFEWBC assumed all responsibility and liability of the VFF. Therefore, on February 29, 2008, CalPERS ceased administration of the Fund by transferring the assets and liabilities to the CSFEWBC. On that date responsibility for administration of the VFF was transferred to the CSFEWBC.
There are no contribution revenues for the eight month period ending February 29, 2008, because the contributions are normally determined annually after the close of each 12 month fiscal year. Participating fire departments and eligible firefighters for the previous fiscal year are reported to CalPERS up to three months after the close of the fiscal year. The participating fire departments are billed after the fire department submits a report of participation and number of eligible firefighters. The amount billed is based upon the number of eligible volunteer firefighters reported. At the time of the transfer of the Fund’s assets and liabilities, a full fiscal year had not elapsed, and, therefore, contribution amounts to be billed to each participating fire department could not be determined. The new administrator is responsible for recording and collecting the contributions for the fiscal year ended 2008.
Deductions from VFF net assets held in trust included awards of approximately $98,000 for the eight month period ended February 29, 2008. This was an 18.3 percent decrease from the 2007 fiscal year due to the shorter period that the VFF was administered by CalPERS.
Additionally, as discussed in Note 1 of the Notes to the Basic Financial Statements, a $3.6 million transfer out was executed in order to transfer the VFF assets to the California State Fire Employees’ Welfare Benefit Corporation.
InvestmentsThe VFF invested mainly in domestic equity securities, international equity securities, domestic debt securities, and real estate equities. At the time all investment assets were liquidated for transfer of funds, the VFF incurred an investment loss of approximately $127,000 primarily due to losses in equity and real estate securities.
Other Post-Employment Benefi t Fund
California Employers’ Retiree Benefi t Trust Fund
Plan Net AssetsThe CERBTF is a trust for the pre-funding by employers of health, dental, and other non-pension benefits promised employees when they retire. The CERBTF net assets held in trust for benefits on June 30, 2008 were $643.6 million, an increase of $632.2 million due primarily to an increase of participating public agencies from two in the 2007 fiscal year, to 72 at June 30, 2008.
Additions to the CERBTF net assets held in trust for benefits include employer contributions. Employers participating contributed $655.0 million. During the 2008 fi scal year the CERBTF incurred a net investment loss of $21.0 million primarily due to equity market declines.
During the 2008 fiscal year there was $1.7 million in CERBTF deductions.
InvestmentsAt June 30, 2008, the CERBTF held $202.5 million in short-term investments, $280.3 million in domestic and international equity securities, $115.9 million in domestic debt securities, and $48.1 million in real estate equities.
Management’s Discussion & Analysis (continued)
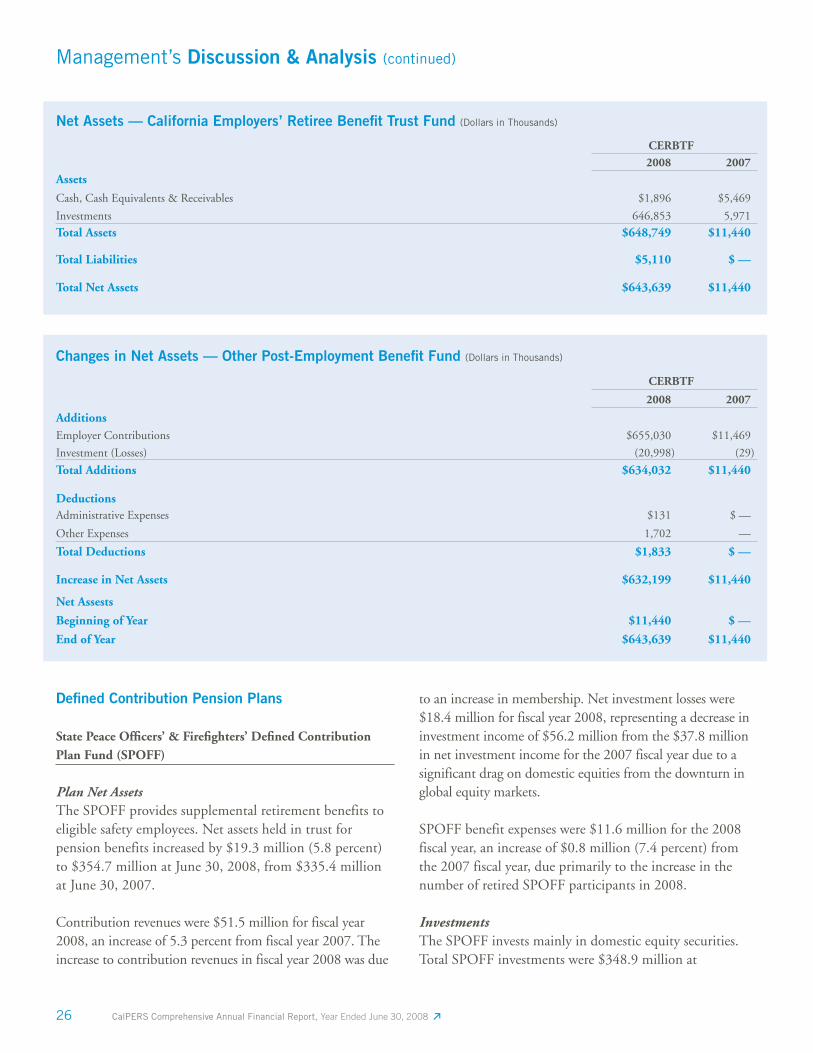
26 CalPERS Comprehensive Annual Financial Report, Year Ended June 30, 2008
Defi ned Contribution Pension Plans
State Peace Offi cers’ & Firefi ghters’ Defi ned Contribution Plan Fund (SPOFF)
Plan Net AssetsThe SPOFF provides supplemental retirement benefits to eligible safety employees. Net assets held in trust for pension benefits increased by $19.3 million (5.8 percent) to $354.7 million at June 30, 2008, from $335.4 million at June 30, 2007.
Contribution revenues were $51.5 million for fiscal year 2008, an increase of 5.3 percent from fiscal year 2007. The increase to contribution revenues in fiscal year 2008 was due
to an increase in membership. Net investment losses were $18.4 million for fiscal year 2008, representing a decrease in investment income of $56.2 million from the $37.8 million in net investment income for the 2007 fiscal year due to a significant drag on domestic equities from the downturn in global equity markets.
SPOFF benefit expenses were $11.6 million for the 2008 fiscal year, an increase of $0.8 million (7.4 percent) from the 2007 fiscal year, due primarily to the increase in the number of retired SPOFF participants in 2008.
InvestmentsThe SPOFF invests mainly in domestic equity securities. Total SPOFF investments were $348.9 million at
Management’s Discussion & Analysis (continued)
Net Assets — California Employers’ Retiree Benefi t Trust Fund (Dollars in Thousands)
CERBTF2008 2007
Assets
Cash, Cash Equivalents & Receivables $1,896 $5,469
Investments 646,853 5,971
Total Assets $648,749 $11,440
Total Liabilities $5,110 $ —
Total Net Assets $643,639 $11,440
Changes in Net Assets — Other Post-Employment Benefi t Fund (Dollars in Thousands)
CERBTF
2008 2007
Additions Employer Contributions $655,030 $11,469
Investment (Losses) (20,998) (29)
Total Additions $634,032 $11,440
Deductions Administrative Expenses $131 $ —
Other Expenses 1,702 —
Total Deductions $1,833 $ —
Increase in Net Assets $632,199 $11,440
Net Assests
Beginning of Year $11,440 $ —
End of Year $643,639 $11,440
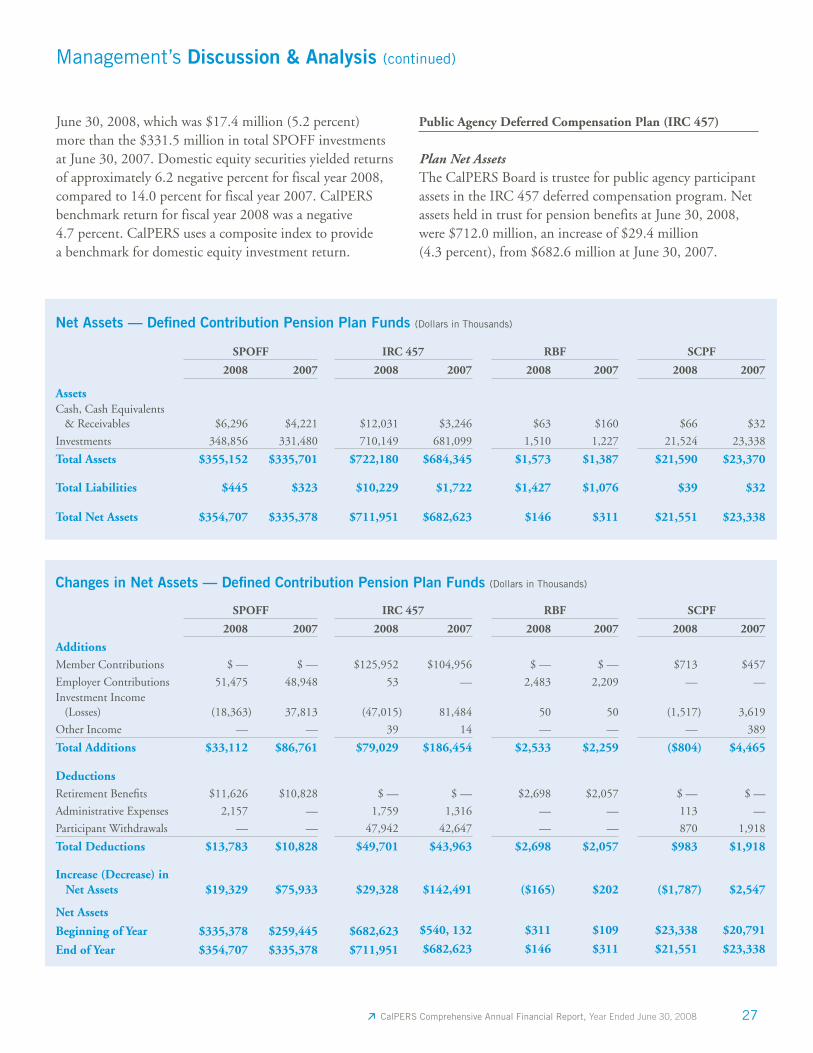
27 CalPERS Comprehensive Annual Financial Report, Year Ended June 30, 2008
June 30, 2008, which was $17.4 million (5.2 percent) more than the $331.5 million in total SPOFF investments at June 30, 2007. Domestic equity securities yielded returns of approximately 6.2 negative percent for fiscal year 2008, compared to 14.0 percent for fiscal year 2007. CalPERS benchmark return for fiscal year 2008 was a negative 4.7 percent. CalPERS uses a composite index to provide a benchmark for domestic equity investment return.
Management’s Discussion & Analysis (continued)
Net Assets — Defi ned Contribution Pension Plan Funds (Dollars in Thousands)
SPOFF IRC 457 RBF SCPF
2008 2007 2008 2007 2008 2007 2008 2007
AssetsCash, Cash Equivalents & Receivables $6,296 $4,221 $12,031 $3,246 $63 $160 $66 $32
Investments 348,856 331,480 710,149 681,099 1,510 1,227 21,524 23,338
Total Assets $355,152 $335,701 $722,180 $684,345 $1,573 $1,387 $21,590 $23,370
Total Liabilities $445 $323 $10,229 $1,722 $1,427 $1,076 $39 $32
Total Net Assets $354,707 $335,378 $711,951 $682,623 $146 $311 $21,551 $23,338
Changes in Net Assets — Defi ned Contribution Pension Plan Funds (Dollars in Thousands)
SPOFF IRC 457 RBF SCPF
2008 2007 2008 2007 2008 2007 2008 2007
Additions Member Contributions $ — $ — $125,952 $104,956 $ — $ — $713 $457
Employer Contributions 51,475 48,948 53 — 2,483 2,209 — —Investment Income (Losses) (18,363) 37,813 (47,015) 81,484 50 50 (1,517) 3,619
Other Income — — 39 14 — — — 389
Total Additions $33,112 $86,761 $79,029 $186,454 $2,533 $2,259 ($804) $4,465
Deductions Retirement Benefi ts $11,626 $10,828 $ — $ — $2,698 $2,057 $ — $ —
Administrative Expenses 2,157 — 1,759 1,316 — — 113 —
Participant Withdrawals — — 47,942 42,647 — — 870 1,918
Total Deductions $13,783 $10,828 $49,701 $43,963 $2,698 $2,057 $983 $1,918
Increase (Decrease) in Net Assets $19,329 $75,933 $29,328 $142,491 ($165) $202 ($1,787) $2,547
Net Assets
Beginning of Year $335,378 $259,445 $682,623 $540, 132 $311 $109 $23,338 $20,791
End of Year $354,707 $335,378 $711,951 $682,623 $146 $311 $21,551 $23,338
Public Agency Deferred Compensation Plan (IRC 457)
Plan Net AssetsThe CalPERS Board is trustee for public agency participant assets in the IRC 457 deferred compensation program. Net assets held in trust for pension benefits at June 30, 2008, were $712.0 million, an increase of $29.4 million (4.3 percent), from $682.6 million at June 30, 2007.
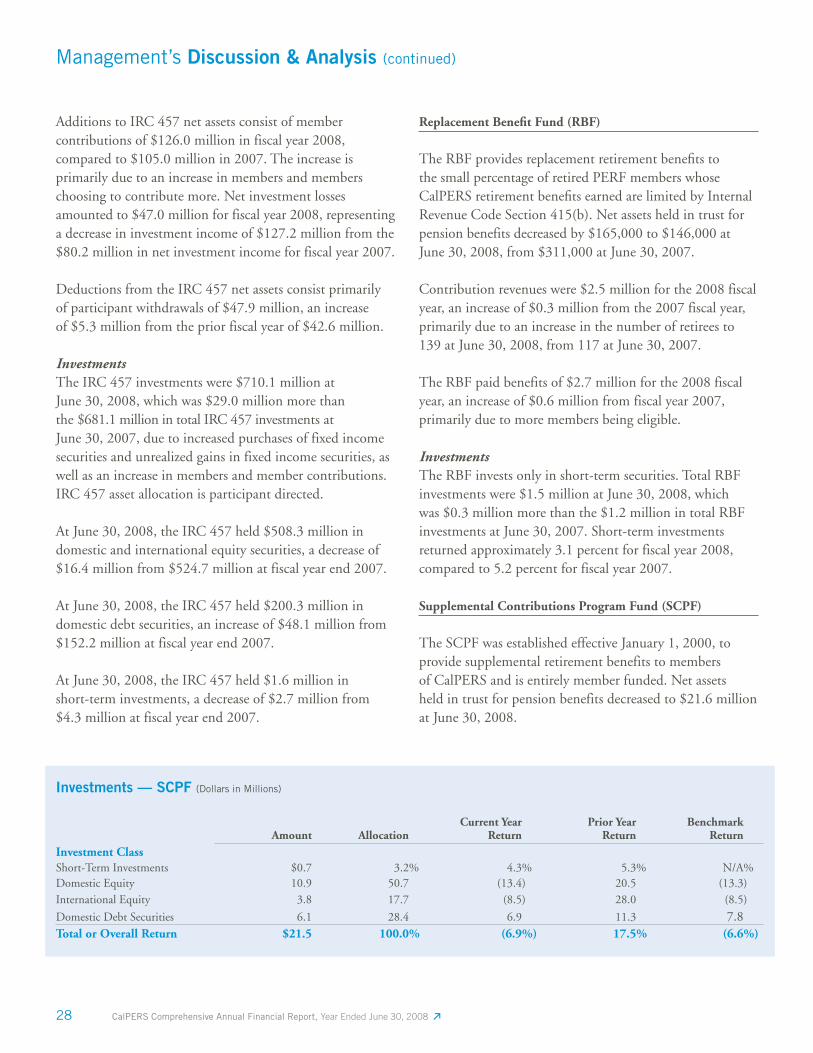
28 CalPERS Comprehensive Annual Financial Report, Year Ended June 30, 2008
Replacement Benefi t Fund (RBF)
The RBF provides replacement retirement benefi ts to the small percentage of retired PERF members whose CalPERS retirement benefi ts earned are limited by Internal Revenue Code Section 415(b). Net assets held in trust for pension benefits decreased by $165,000 to $146,000 at June 30, 2008, from $311,000 at June 30, 2007.
Contribution revenues were $2.5 million for the 2008 fiscal year, an increase of $0.3 million from the 2007 fiscal year, primarily due to an increase in the number of retirees to 139 at June 30, 2008, from 117 at June 30, 2007.
The RBF paid benefits of $2.7 million for the 2008 fiscal year, an increase of $0.6 million from fiscal year 2007, primarily due to more members being eligible.
InvestmentsThe RBF invests only in short-term securities. Total RBF investments were $1.5 million at June 30, 2008, which was $0.3 million more than the $1.2 million in total RBF investments at June 30, 2007. Short-term investments returned approximately 3.1 percent for fiscal year 2008, compared to 5.2 percent for fiscal year 2007.
Supplemental Contributions Program Fund (SCPF)
The SCPF was established effective January 1, 2000, to provide supplemental retirement benefits to members of CalPERS and is entirely member funded. Net assets held in trust for pension benefits decreased to $21.6 million at June 30, 2008.
Investments — SCPF (Dollars in Millions)
Amount AllocationCurrent Year
ReturnPrior Year
ReturnBenchmark
ReturnInvestment ClassShort-Term Investments $0.7 3.2% 4.3% 5.3% N/A %Domestic Equity 10.9 50.7 (13.4) 20.5 (13.3)International Equity 3.8 17.7 (8.5) 28.0 (8.5)
Domestic Debt Securities 6.1 28.4 6.9 11.3 7.8Total or Overall Return $21.5 100.0% (6.9%) 17.5% (6.6%)
Management’s Discussion & Analysis (continued)
Additions to IRC 457 net assets consist of member contributions of $126.0 million in fiscal year 2008, compared to $105.0 million in 2007. The increase is primarily due to an increase in members and members choosing to contribute more. Net investment losses amounted to $47.0 million for fiscal year 2008, representing a decrease in investment income of $127.2 million from the $80.2 million in net investment income for fiscal year 2007.
Deductions from the IRC 457 net assets consist primarily of participant withdrawals of $47.9 million, an increase of $5.3 million from the prior fiscal year of $42.6 million.
InvestmentsThe IRC 457 investments were $710.1 million at June 30, 2008, which was $29.0 million more than the $681.1 million in total IRC 457 investments at June 30, 2007, due to increased purchases of fixed income securities and unrealized gains in fixed income securities, as well as an increase in members and member contributions. IRC 457 asset allocation is participant directed.
At June 30, 2008, the IRC 457 held $508.3 million in domestic and international equity securities, a decrease of $16.4 million from $524.7 million at fiscal year end 2007.
At June 30, 2008, the IRC 457 held $200.3 million in domestic debt securities, an increase of $48.1 million from $152.2 million at fiscal year end 2007.
At June 30, 2008, the IRC 457 held $1.6 million in short-term investments, a decrease of $2.7 million from $4.3 million at fiscal year end 2007.
29 CalPERS Comprehensive Annual Financial Report, Year Ended June 30, 2008
Contribution revenues were $713,000 for the 2008 fiscal year, an increase of 56.0 percent from the 2007 fiscal year, primarily due to an increase in participant contributions. Net investment losses were $1.5 million for fiscal year 2008, representing a decrease in investment income of $5.1 million from $3.6 million in net investment income for fiscal year 2007 due to a significant drag on domestic and international equities from the downturn in global equity markets.
For fiscal year 2008, participant withdrawals were $0.9 million, a decrease of $1.0 million (52.6 percent) from fiscal year 2007.
InvestmentsThe SCPF investments were $21.5 million at June 30, 2008, which was $1.8 million less than the $23.3 million in total SCPF investments at June 30, 2007.
At June 30, 2008, the SCPF held $14.7 million in domestic and international equity securities, a decrease of $2.0 million from $16.7 million at fiscal year end 2007. Domestic and international equity securities yielded returns of approximately negative 13.4 percent and negative 8.5 percent for fiscal year 2008, compared to the 20.5 percent and 28.0 percent for fiscal year 2007. CalPERS benchmark returns for fiscal year 2008 were negative 13.3 percent and negative 8.5 percent. CalPERS uses the Custom S&P 500 Index and a Custom Benchmark Index to provide a benchmark for our domestic and international equity investment returns, respectively.
At June 30, 2008, the SCPF held $6.1 million in domestic debt securities, an increase of $0.1 million from $6.0 million at fiscal year end 2007. Domestic debt securities returned approximately 6.9 percent for fiscal year 2008, compared to 11.3 percent for fiscal year 2007. CalPERS benchmark return for fiscal year 2008 was 7.8 percent. CalPERS uses a Custom Benchmark as a benchmark for its domestic debt security investment returns.
At June 30, 2008, the SCPF held $647,000 in short-term investments, an increase of $8,000 from $639,000 at fiscal year end 2007. Short-term investments returned approximately 4.3 percent for fiscal year 2008, which was a decline from the 5.3 percent for fiscal year 2007.
Enterprise Funds
Employees’ Health Care Fund (HCF)
Plan ActivityThe HCF accounts for the activities of the CalPERS self-insured health care programs.
The self-insured health care programs incurred claims expenses of $1.3 billion for the 2008 fiscal year, an increase of 8.3 percent from the 2007 fiscal year, primarily due to increases in provider pricing and increased benefit utilization. Premium revenues were $1.5 billion for the 2008 fiscal year, an increase of 7.1 percent from the 2007 fiscal year, primarily as a result of premium rate increases and enrollment growth. Net investment income was $34.6 million for the 2008 fiscal year, an increase of 72.1 percent from the 2007 fiscal year due to unrealized gains in the fund’s government bond investments. As a result of increased assets, unrestricted net assets increased by $150.0 million (33.4 percent) to $598.5 million at June 30, 2008.
InvestmentsInvestments of the HCF at June 30, 2008 and 2007, include highly liquid, short-term securities and domestic debt securities. Investments increased $125.0 million from $577.8 million at June 30, 2007, to $702.8 million at June 30, 2008.
Public Employees’ Contingency Reserve Fund (CRF)
The CRF was established to fund administrative costs related to the CalPERS health care programs and to provide a contingency reserve for potential increases in future health care premium rates or health care benefit costs. In the 2008 fiscal year, pursuant to GASB Statement 43, activity in the CRF is reported in two separate fund types.
Administrative fees collected and related costs are accounted for in the CRF proprietary fund type. Administrative fees earned by the CRF were $14.9 million for the 2008 fiscal year, a decrease of 9.6 percent from 2007 fiscal year of $16.5 million. The decrease was due mainly to administrative rate decreases during the 2008 fiscal year. Net investment income was $8.0 million for the 2008 fiscal year, a decrease of 14.0 percent from the 2007 fiscal year. Unrestricted net assets decreased by $1.4 million (9.6 percent) to $13.2 million at June 30, 2008.
Management’s Discussion & Analysis (continued)
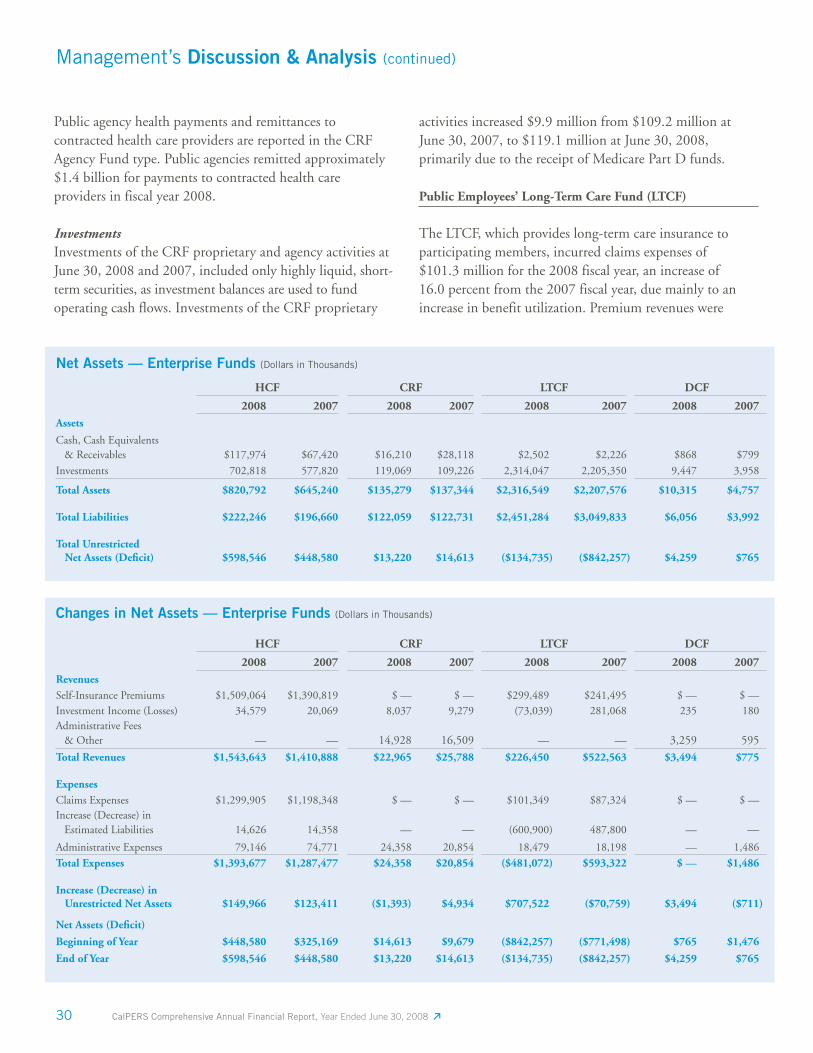
30 CalPERS Comprehensive Annual Financial Report, Year Ended June 30, 2008
Net Assets — Enterprise Funds (Dollars in Thousands)
HCF CRF LTCF DCF
2008 2007 2008 2007 2008 2007 2008 2007Assets
Cash, Cash Equivalents & Receivables $117,974 $67,420 $16,210 $28,118 $2,502 $2,226 $868 $799
Investments 702,818 577,820 119,069 109,226 2,314,047 2,205,350 9,447 3,958
Total Assets $820,792 $645,240 $135,279 $137,344 $2,316,549 $2,207,576 $10,315 $4,757
Total Liabilities $222,246 $196,660 $122,059 $122,731 $2,451,284 $3,049,833 $6,056 $3,992
Total Unrestricted Net Assets (Defi cit) $598,546 $448,580 $13,220 $14,613 ($134,735) ($842,257) $4,259 $765
Changes in Net Assets — Enterprise Funds (Dollars in Thousands)
HCF CRF LTCF DCF
2008 2007 2008 2007 2008 2007 2008 2007Revenues Self-Insurance Premiums $1,509,064 $1,390,819 $ — $ — $299,489 $241,495 $ — $ —Investment Income (Losses) 34,579 20,069 8,037 9,279 (73,039) 281,068 235 180Administrative Fees & Other — — 14,928 16,509 — — 3,259 595
Total Revenues $1,543,643 $1,410,888 $22,965 $25,788 $226,450 $522,563 $3,494 $775
Expenses Claims Expenses $1,299,905 $1,198,348 $ — $ — $101,349 $87,324 $ — $ —Increase (Decrease) in Estimated Liabilities 14,626 14,358 — — (600,900) 487,800 — —
Administrative Expenses 79,146 74,771 24,358 20,854 18,479 18,198 — 1,486
Total Expenses $1,393,677 $1,287,477 $24,358 $20,854 ($481,072) $593,322 $ — $1,486
Increase (Decrease) in Unrestricted Net Assets $149,966 $123,411 ($1,393) $4,934 $707,522 ($70,759) $3,494 ($711)
Net Assets (Defi cit)
Beginning of Year $448,580 $325,169 $14,613 $9,679 ($842,257) ($771,498) $765 $1,476
End of Year $598,546 $448,580 $13,220 $14,613 ($134,735) ($842,257) $4,259 $765
Management’s Discussion & Analysis (continued)
Public agency health payments and remittances to contracted health care providers are reported in the CRF Agency Fund type. Public agencies remitted approximately $1.4 billion for payments to contracted health care providers in fiscal year 2008.
InvestmentsInvestments of the CRF proprietary and agency activities at June 30, 2008 and 2007, included only highly liquid, short-term securities, as investment balances are used to fund operating cash flows. Investments of the CRF proprietary
activities increased $9.9 million from $109.2 million at June 30, 2007, to $119.1 million at June 30, 2008, primarily due to the receipt of Medicare Part D funds.
Public Employees’ Long-Term Care Fund (LTCF)
The LTCF, which provides long-term care insurance to participating members, incurred claims expenses of $101.3 million for the 2008 fiscal year, an increase of 16.0 percent from the 2007 fiscal year, due mainly to an increase in benefit utilization. Premium revenues were
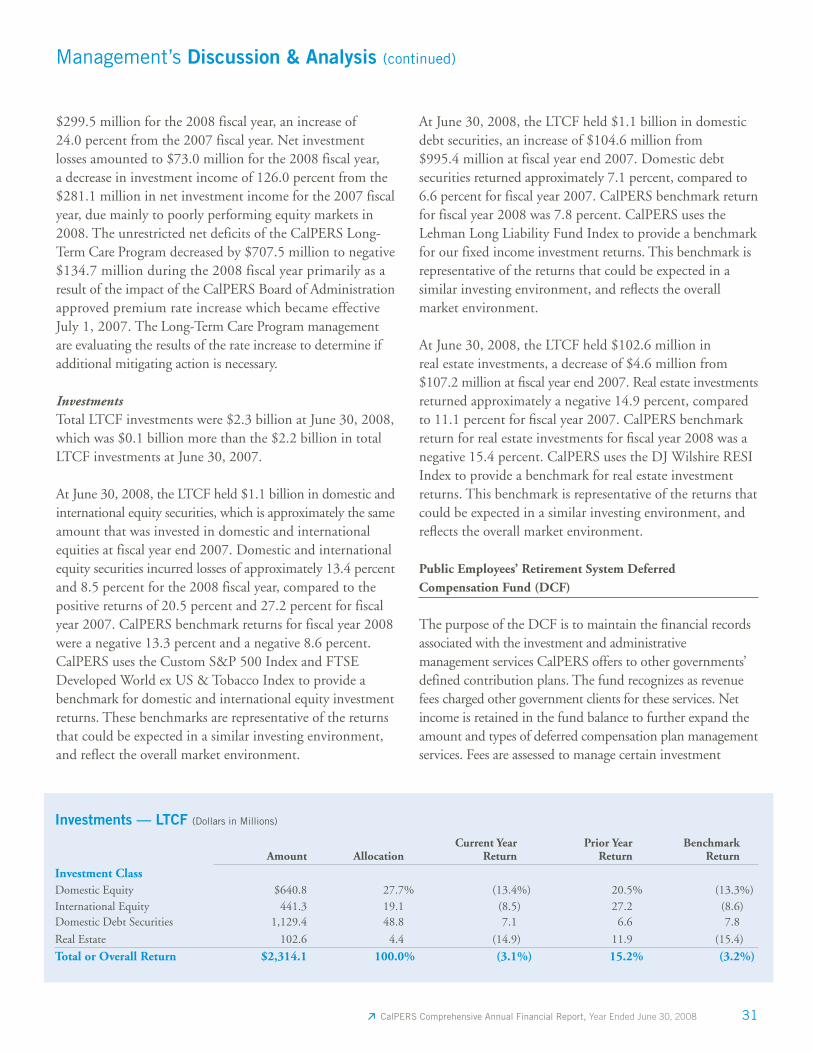
31 CalPERS Comprehensive Annual Financial Report, Year Ended June 30, 2008
$299.5 million for the 2008 fiscal year, an increase of 24.0 percent from the 2007 fiscal year. Net investment losses amounted to $73.0 million for the 2008 fiscal year, a decrease in investment income of 126.0 percent from the $281.1 million in net investment income for the 2007 fiscal year, due mainly to poorly performing equity markets in 2008. The unrestricted net deficits of the CalPERS Long-Term Care Program decreased by $707.5 million to negative $134.7 million during the 2008 fiscal year primarily as a result of the impact of the CalPERS Board of Administration approved premium rate increase which became effective July 1, 2007. The Long-Term Care Program management are evaluating the results of the rate increase to determine if additional mitigating action is necessary.
InvestmentsTotal LTCF investments were $2.3 billion at June 30, 2008, which was $0.1 billion more than the $2.2 billion in total LTCF investments at June 30, 2007.
At June 30, 2008, the LTCF held $1.1 billion in domestic and international equity securities, which is approximately the same amount that was invested in domestic and international equities at fiscal year end 2007. Domestic and international equity securities incurred losses of approximately 13.4 percent and 8.5 percent for the 2008 fiscal year, compared to the positive returns of 20.5 percent and 27.2 percent for fiscal year 2007. CalPERS benchmark returns for fiscal year 2008 were a negative 13.3 percent and a negative 8.6 percent. CalPERS uses the Custom S&P 500 Index and FTSE Developed World ex US & Tobacco Index to provide a benchmark for domestic and international equity investment returns. These benchmarks are representative of the returns that could be expected in a similar investing environment, and reflect the overall market environment.
At June 30, 2008, the LTCF held $1.1 billion in domestic debt securities, an increase of $104.6 million from $995.4 million at fiscal year end 2007. Domestic debt securities returned approximately 7.1 percent, compared to 6.6 percent for fiscal year 2007. CalPERS benchmark return for fiscal year 2008 was 7.8 percent. CalPERS uses the Lehman Long Liability Fund Index to provide a benchmark for our fixed income investment returns. This benchmark is representative of the returns that could be expected in a similar investing environment, and refl ects the overall market environment.
At June 30, 2008, the LTCF held $102.6 million in real estate investments, a decrease of $4.6 million from $107.2 million at fi scal year end 2007. Real estate investments returned approximately a negative 14.9 percent, compared to 11.1 percent for fi scal year 2007. CalPERS benchmark return for real estate investments for fi scal year 2008 was a negative 15.4 percent. CalPERS uses the DJ Wilshire RESI Index to provide a benchmark for real estate investment returns. This benchmark is representative of the returns that could be expected in a similar investing environment, and refl ects the overall market environment.
Public Employees’ Retirement System Deferred Compensation Fund (DCF)
The purpose of the DCF is to maintain the financial records associated with the investment and administrative management services CalPERS offers to other governments’ defined contribution plans. The fund recognizes as revenue fees charged other government clients for these services. Net income is retained in the fund balance to further expand the amount and types of deferred compensation plan management services. Fees are assessed to manage certain investment
Investments — LTCF (Dollars in Millions)
Amount AllocationCurrent Year
ReturnPrior Year
ReturnBenchmark
Return
Investment ClassDomestic Equity $640.8 27.7% (13.4%) 20.5% (13.3%)International Equity 441.3 19.1 (8.5) 27.2 (8.6)Domestic Debt Securities 1,129.4 48.8 7.1 6.6 7.8
Real Estate 102.6 4.4 (14.9) 11.9 (15.4)
Total or Overall Return $2,314.1 100.0% (3.1%) 15.2% (3.2%)
Management’s Discussion & Analysis (continued)
32 CalPERS Comprehensive Annual Financial Report, Year Ended June 30, 2008
portfolios of the SPOFF, SCPF, and the IRC 457 public agency program.
The DCF reported administrative and investment management revenues of $3.3 million for the 2008 fiscal year, which is $2.7 million more than the $0.6 million for the 2007 fiscal year. Net income in fiscal year 2008 from investment of the DCF fund balance was $235,000, an increase of 30.6 percent from the 2007 fiscal year, due mainly to more fees earned. Unrestricted net assets increased by $3.5 million (456.7 percent) to $4.3 million at June 30, 2008.
InvestmentsInvestments of the DCF at June 30, 2008 and 2007, included only highly liquid, short-term securities. Investments increased $5.4 million from $4.0 million at June 30, 2007, to $9.4 million at June 30, 2008.
Currently Known Facts and Events
Subsequent to the June 30 fi scal year end, the fi nancial markets continued to experience high volatility with an outcome that negatively affected all asset classes. As of October 31, 2008, the Public Employees’ Retirement Fund (PERF) investment portfolio, excluding securities lending collateral, had declined by an estimated $50.4 billion in value to $186.7 billion based on net of fees reporting by State Street Bank. The most signifi cant decline was in the domestic and international public equity portfolios. These portfolios declined $40.5 billion or 33.0 percent during this period. The privately held investments, due to their less frequent valuation cycles, experienced smaller declines.
CalPERS had exposure to fi nancial institutions that were either acquired by another institution, the U.S. Government, or fi led for bankruptcy during this period. CalPERS continually monitors the value of its investments that are
Management’s Discussion & Analysis (continued)
involved in these transactions. However, the fi nal value is not certain until the bankruptcy process or acquisition has been completed. After June 30, the more noteworthy equity and debt holdings that declined in value were American International Group (AIG), Fannie Mae, Freddie Mac, Lehman Brothers, and Washington Mutual.CalPERS holdings in these fi ve fi rms decreased approximately $1.7 billion.
In addition, CalPERS Real Estate Program continued to experience declines due to overall market conditions and negative returns in the Housing Program. These declines were driven by a combination of a slowdown in absorption/sales of new homes and value declines resulting from the annual independent appraisal process.
The overall risk profi le of the PERF has remained unchanged since June 30, 2008, and the volatility of the investment portfolio remains in line with the overall fi nancial markets. The global capital markets are highly dynamic and the value of the PERF changes every day. CalPERS continues to rely on the long-held investment philosophy of diversifi cation and the search for long-term value. Up-to-date investment portfolio information is published monthly as part of the Investment Committee agenda. Please visit www.calpers.ca.gov for more information.
Requests For Information
This Financial Report is designed to provide a general overview of CalPERS fi nances. Questions concerning any of the information provided in this report or requests for additional fi nancial information should be addressed to the CalPERS Fiscal Services Division, P.O. Box 942703, Sacramento, CA, 94229-2703, or by calling 888 CalPERS (or 888-225-7377).

Financial Section Basic Financial Statements
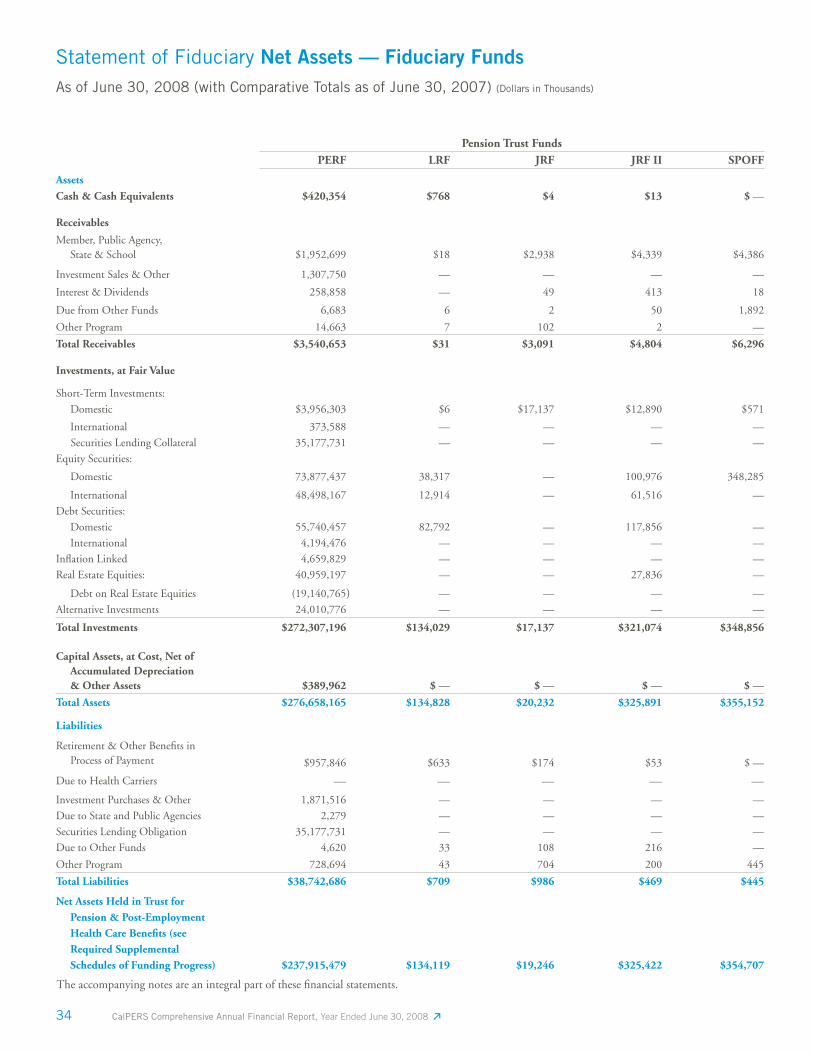
34 CalPERS Comprehensive Annual Financial Report, Year Ended June 30, 2008
Statement of Fiduciary Net Assets — Fiduciary FundsAs of June 30, 2008 (with Comparative Totals as of June 30, 2007) (Dollars in Thousands)
Pension Trust FundsPERF LRF JRF JRF II SPOFF
Assets
Cash & Cash Equivalents $420,354 $768 $4 $13 $ —
Receivables
Member, Public Agency, State & School $1,952,699 $18 $2,938 $4,339 $4,386
Investment Sales & Other 1,307,750 — — — —
Interest & Dividends 258,858 — 49 413 18
Due from Other Funds 6,683 6 2 50 1,892
Other Program 14,663 7 102 2 —
Total Receivables $3,540,653 $31 $3,091 $4,804 $6,296
Investments, at Fair Value
Short-Term Investments:
Domestic $3,956,303 $6 $17,137 $12,890 $571
International 373,588 — — — —
Securities Lending Collateral 35,177,731 — — — —
Equity Securities:
Domestic 73,877,437 38,317 — 100,976 348,285
International 48,498,167 12,914 — 61,516 —
Debt Securities:
Domestic 55,740,457 82,792 — 117,856 —
International 4,194,476 — — — —
Infl ation Linked 4,659,829 — — — —
Real Estate Equities: 40,959,197 — — 27,836 —
Debt on Real Estate Equities (19,140,765) — — — —
Alternative Investments 24,010,776 — — — —
Total Investments $272,307,196 $134,029 $17,137 $321,074 $348,856
Capital Assets, at Cost, Net of Accumulated Depreciation & Other Assets $389,962 $ — $ — $ — $ —
Total Assets $276,658,165 $134,828 $20,232 $325,891 $355,152
Liabilities
Retirement & Other Benefi ts in Process of Payment $957,846 $633 $174 $53 $ —
Due to Health Carriers — — — — —
Investment Purchases & Other 1,871,516 — — — —
Due to State and Public Agencies 2,279 — — — —
Securities Lending Obligation 35,177,731 — — — —
Due to Other Funds 4,620 33 108 216 —
Other Program 728,694 43 704 200 445
Total Liabilities $38,742,686 $709 $986 $469 $445
Net Assets Held in Trust for Pension & Post-Employment Health Care Benefi ts (see Required Supplemental Schedules of Funding Progress) $237,915,479 $134,119 $19,246 $325,422 $354,707
The accompanying notes are an integral part of these fi nancial statements.
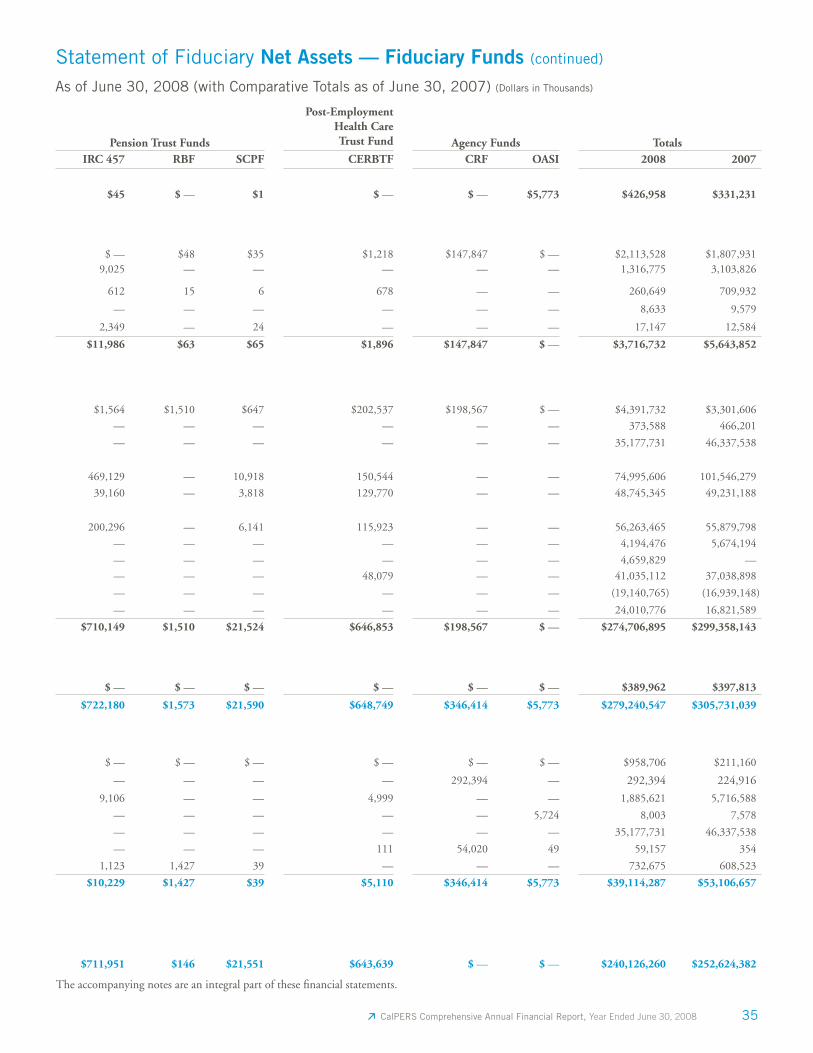
35 CalPERS Comprehensive Annual Financial Report, Year Ended June 30, 2008
Statement of Fiduciary Net Assets — Fiduciary Funds (continued)
As of June 30, 2008 (with Comparative Totals as of June 30, 2007) (Dollars in Thousands)
Pension Trust Funds
Post-EmploymentHealth Care Trust Fund Agency Funds Totals
IRC 457 RBF SCPF CERBTF CRF OASI 2008 2007
$45 $ — $1 $ — $ — $5,773 $426,958 $331,231
$ — $48 $35 $1,218 $147,847 $ — $2,113,528 $1,807,9319,025 — — — — — 1,316,775 3,103,826
612 15 6 678 — — 260,649 709,932
— — — — — — 8,633 9,579
2,349 — 24 — — — 17,147 12,584
$11,986 $63 $65 $1,896 $147,847 $ — $3,716,732 $5,643,852
$1,564 $1,510 $647 $202,537 $198,567 $ — $4,391,732 $3,301,606
— — — — — — 373,588 466,201
— — — — — — 35,177,731 46,337,538
469,129 — 10,918 150,544 — — 74,995,606 101,546,279
39,160 — 3,818 129,770 — — 48,745,345 49,231,188
200,296 — 6,141 115,923 — — 56,263,465 55,879,798
— — — — — — 4,194,476 5,674,194
— — — — — — 4,659,829 —
— — — 48,079 — — 41,035,112 37,038,898
— — — — — — (19,140,765) (16,939,148)
— — — — — — 24,010,776 16,821,589
$710,149 $1,510 $21,524 $646,853 $198,567 $ — $274,706,895 $299,358,143
$ — $ — $ — $ — $ — $ — $389,962 $397,813
$722,180 $1,573 $21,590 $648,749 $346,414 $5,773 $279,240,547 $305,731,039
$ — $ — $ — $ — $ — $ — $958,706 $211,160
— — — — 292,394 — 292,394 224,916
9,106 — — 4,999 — — 1,885,621 5,716,588
— — — — — 5,724 8,003 7,578
— — — — — — 35,177,731 46,337,538
— — — 111 54,020 49 59,157 354
1,123 1,427 39 — — — 732,675 608,523
$10,229 $1,427 $39 $5,110 $346,414 $5,773 $39,114,287 $53,106,657
$711,951 $146 $21,551 $643,639 $ — $ — $240,126,260 $252,624,382
The accompanying notes are an integral part of these fi nancial statements.
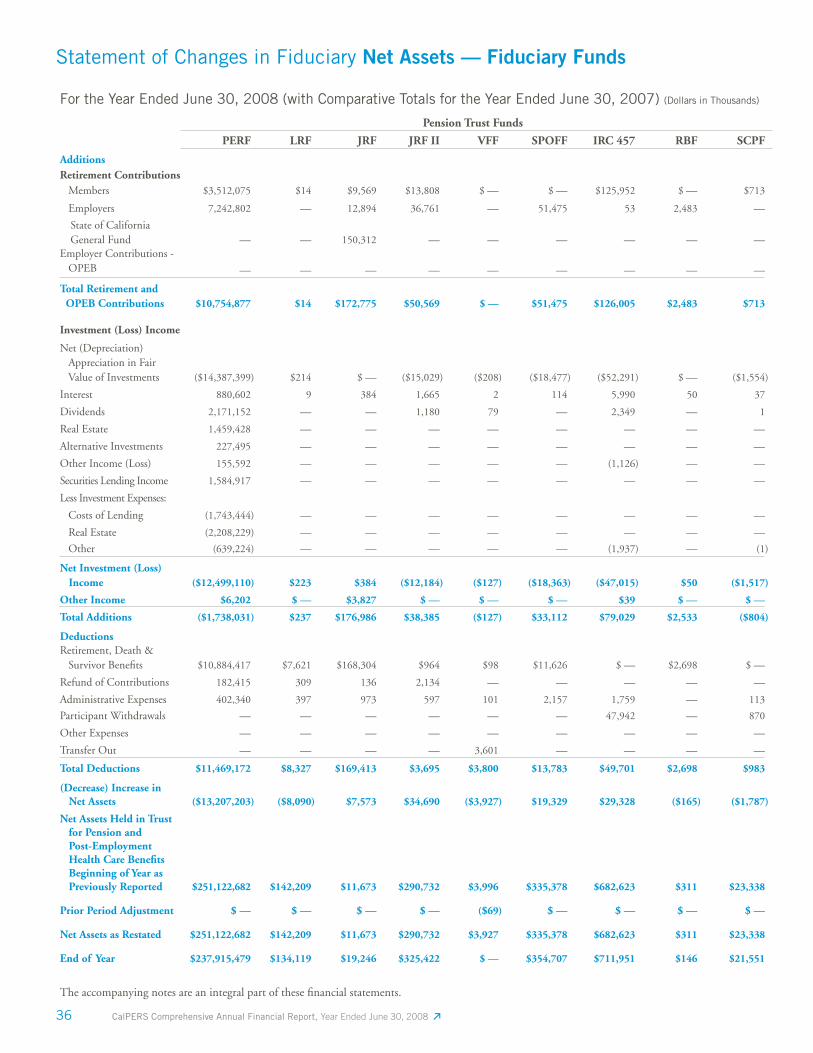
36 CalPERS Comprehensive Annual Financial Report, Year Ended June 30, 2008
Statement of Changes in Fiduciary Net Assets — Fiduciary Funds
For the Year Ended June 30, 2008 (with Comparative Totals for the Year Ended June 30, 2007) (Dollars in Thousands)
Pension Trust Funds
PERF LRF JRF JRF II VFF SPOFF IRC 457 RBF SCPF
AdditionsRetirement Contributions Members $3,512,075 $14 $9,569 $13,808 $ — $ — $125,952 $ — $713
Employers 7,242,802 — 12,894 36,761 — 51,475 53 2,483 —
State of California General Fund — — 150,312 — — — — — —
Employer Contributions - OPEB — — — — — — — — —
Total Retirement and OPEB Contributions $10,754,877 $14 $172,775 $50,569 $ — $51,475 $126,005 $2,483 $713
Investment (Loss) Income
Net (Depreciation) Appreciation in Fair Value of Investments ($14,387,399) $214 $ — ($15,029) ($208) ($18,477) ($52,291) $ — ($1,554)
Interest 880,602 9 384 1,665 2 114 5,990 50 37
Dividends 2,171,152 — — 1,180 79 — 2,349 — 1
Real Estate 1,459,428 — — — — — — — —
Alternative Investments 227,495 — — — — — — — —
Other Income (Loss) 155,592 — — — — — (1,126) — —
Securities Lending Income 1,584,917 — — — — — — — —
Less Investment Expenses:
Costs of Lending (1,743,444) — — — — — — — —
Real Estate (2,208,229) — — — — — — — —
Other (639,224) — — — — — (1,937) — (1)
Net Investment (Loss) Income ($12,499,110) $223 $384 ($12,184) ($127) ($18,363) ($47,015) $50 ($1,517)
Other Income $6,202 $ — $3,827 $ — $ — $ — $39 $ — $ —
Total Additions ($1,738,031) $237 $176,986 $38,385 ($127) $33,112 $79,029 $2,533 ($804)
DeductionsRetirement, Death & Survivor Benefi ts $10,884,417 $7,621 $168,304 $964 $98 $11,626 $ — $2,698 $ —
Refund of Contributions 182,415 309 136 2,134 — — — — —
Administrative Expenses 402,340 397 973 597 101 2,157 1,759 — 113
Participant Withdrawals — — — — — — 47,942 — 870
Other Expenses — — — — — — — — —
Transfer Out — — — — 3,601 — — — —
Total Deductions $11,469,172 $8,327 $169,413 $3,695 $3,800 $13,783 $49,701 $2,698 $983
(Decrease) Increase in Net Assets ($13,207,203) ($8,090) $7,573 $34,690 ($3,927) $19,329 $29,328 ($165) ($1,787)
Net Assets Held in Trust for Pension and Post-Employment Health Care Benefi ts Beginning of Year as Previously Reported $251,122,682 $142,209 $11,673 $290,732 $3,996 $335,378 $682,623 $311 $23,338
Prior Period Adjustment $ — $ — $ — $ — ($69) $ — $ — $ — $ —
Net Assets as Restated $251,122,682 $142,209 $11,673 $290,732 $3,927 $335,378 $682,623 $311 $23,338
End of Year $237,915,479 $134,119 $19,246 $325,422 $ — $354,707 $711,951 $146 $21,551
The accompanying notes are an integral part of these fi nancial statements.
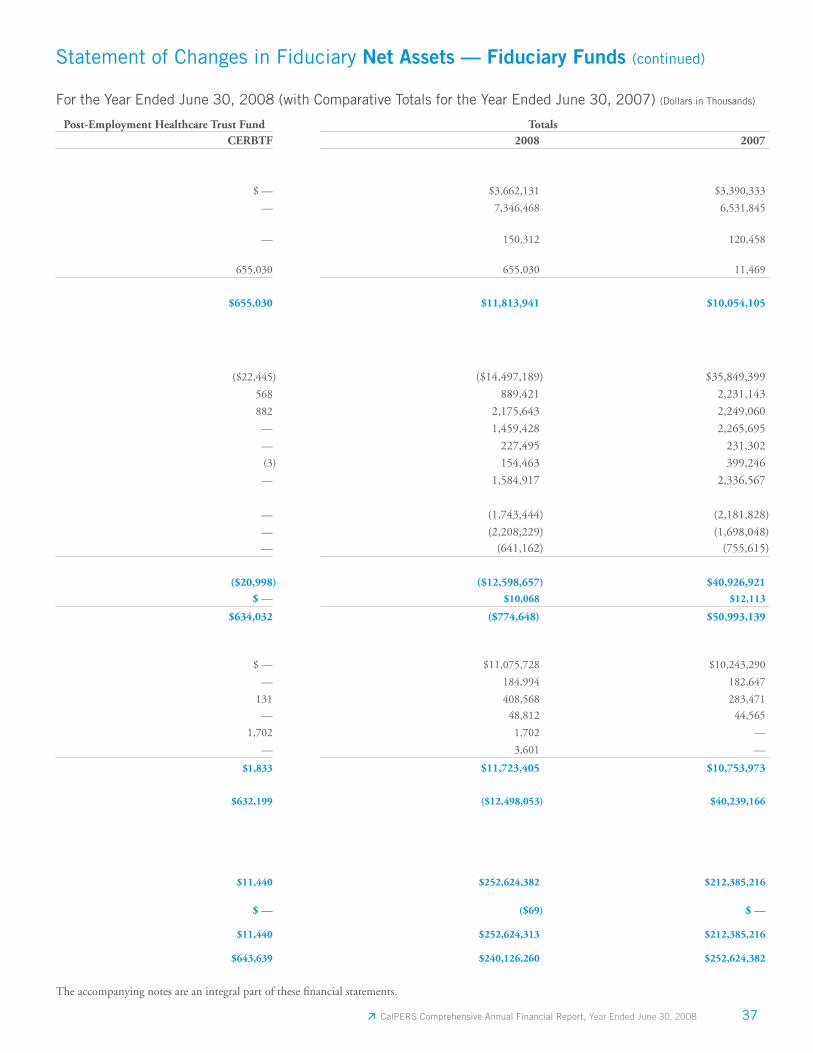
37 CalPERS Comprehensive Annual Financial Report, Year Ended June 30, 2008
Statement of Changes in Fiduciary Net Assets — Fiduciary Funds (continued)
For the Year Ended June 30, 2008 (with Comparative Totals for the Year Ended June 30, 2007) (Dollars in Thousands)
Post-Employment Healthcare Trust Fund TotalsCERBTF 2008 2007
$ — $3,662,131 $3,390,333
— 7,346,468 6,531,845
— 150,312 120,458
655,030 655,030 11,469
$655,030 $11,813,941 $10,054,105
($22,445) ($14,497,189) $35,849,399
568 889,421 2,231,143
882 2,175,643 2,249,060
— 1,459,428 2,265,695
— 227,495 231,302
(3) 154,463 399,246
— 1,584,917 2,336,567
— (1,743,444) (2,181,828)
— (2,208,229) (1,698,048)— (641,162) (755,615)
($20,998) ($12,598,657) $40,926,921
$ — $10,068 $12,113
$634,032 ($774,648) $50,993,139
$ — $11,075,728 $10,243,290
— 184,994 182,647
131 408,568 283,471
— 48,812 44,565
1,702 1,702 —
— 3,601 —
$1,833 $11,723,405 $10,753,973
$632,199 ($12,498,053) $40,239,166
$11,440 $252,624,382 $212,385,216
$ — ($69) $ —
$11,440 $252,624,313 $212,385,216
$643,639 $240,126,260 $252,624,382
The accompanying notes are an integral part of these fi nancial statements.
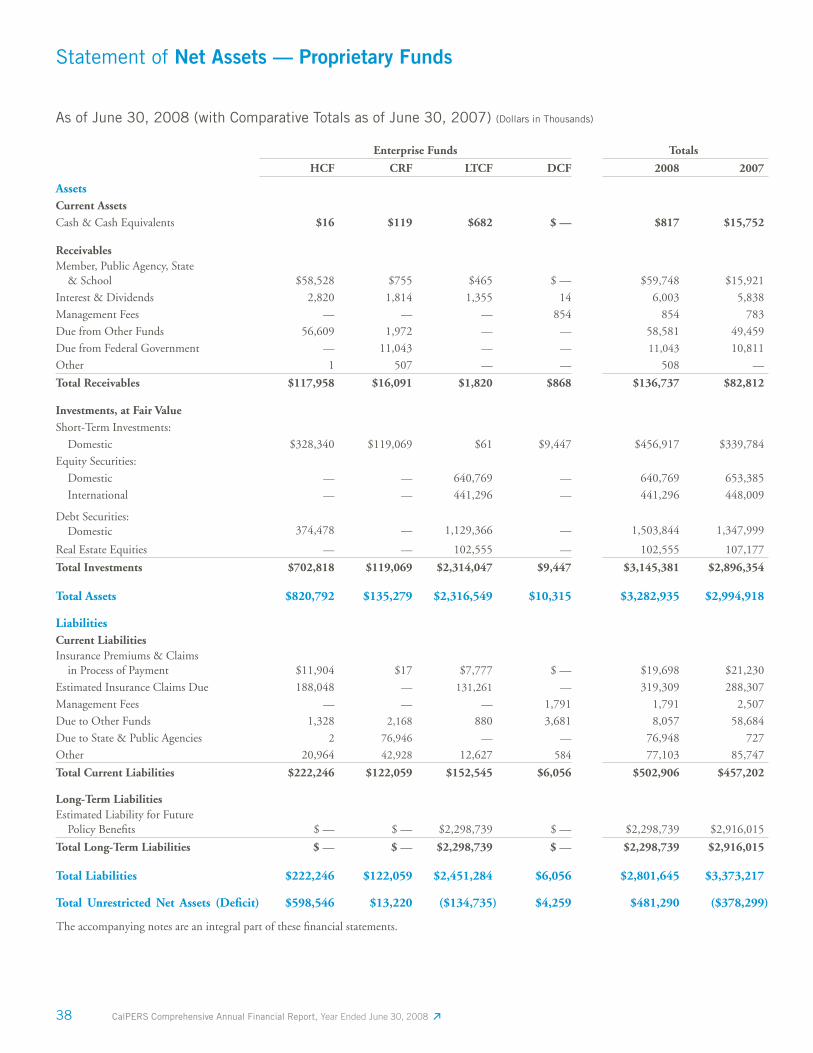
38 CalPERS Comprehensive Annual Financial Report, Year Ended June 30, 2008
The accompanying notes are an integral part of these fi nancial statements.
As of June 30, 2008 (with Comparative Totals as of June 30, 2007) (Dollars in Thousands)
Enterprise Funds Totals
HCF CRF LTCF DCF 2008 2007
AssetsCurrent AssetsCash & Cash Equivalents $16 $119 $682 $ — $817 $15,752
ReceivablesMember, Public Agency, State & School $58,528 $755 $465 $ — $59,748 $15,921
Interest & Dividends 2,820 1,814 1,355 14 6,003 5,838
Management Fees — — — 854 854 783
Due from Other Funds 56,609 1,972 — — 58,581 49,459
Due from Federal Government — 11,043 — — 11,043 10,811
Other 1 507 — — 508 —
Total Receivables $117,958 $16,091 $1,820 $868 $136,737 $82,812
Investments, at Fair ValueShort-Term Investments:
Domestic $328,340 $119,069 $61 $9,447 $456,917 $339,784
Equity Securities:
Domestic — — 640,769 — 640,769 653,385
International — — 441,296 — 441,296 448,009
Debt Securities: Domestic 374,478 — 1,129,366 — 1,503,844 1,347,999
Real Estate Equities — — 102,555 — 102,555 107,177
Total Investments $702,818 $119,069 $2,314,047 $9,447 $3,145,381 $2,896,354
Total Assets $820,792 $135,279 $2,316,549 $10,315 $3,282,935 $2,994,918
LiabilitiesCurrent LiabilitiesInsurance Premiums & Claims in Process of Payment $11,904 $17 $7,777 $ — $19,698 $21,230
Estimated Insurance Claims Due 188,048 — 131,261 — 319,309 288,307
Management Fees — — — 1,791 1,791 2,507
Due to Other Funds 1,328 2,168 880 3,681 8,057 58,684
Due to State & Public Agencies 2 76,946 — — 76,948 727
Other 20,964 42,928 12,627 584 77,103 85,747
Total Current Liabilities $222,246 $122,059 $152,545 $6,056 $502,906 $457,202
Long-Term LiabilitiesEstimated Liability for Future Policy Benefi ts $ — $ — $2,298,739 $ — $2,298,739 $2,916,015
Total Long-Term Liabilities $ — $ — $2,298,739 $ — $2,298,739 $2,916,015
Total Liabilities $222,246 $122,059 $2,451,284 $6,056 $2,801,645 $3,373,217
Total Unrestricted Net Assets (Defi cit) $598,546 $13,220 ($134,735) $4,259 $481,290 ($378,299 )
Statement of Net Assets — Proprietary Funds
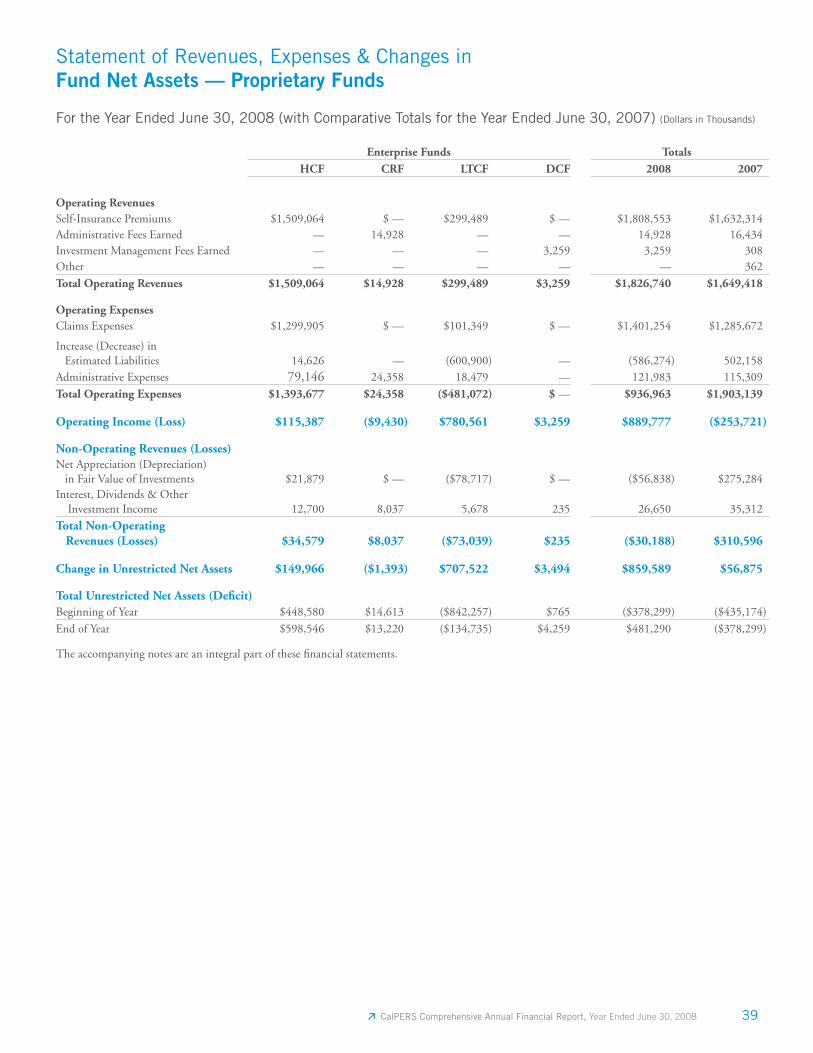
39 CalPERS Comprehensive Annual Financial Report, Year Ended June 30, 2008
Statement of Revenues, Expenses & Changes in Fund Net Assets — Proprietary Funds
The accompanying notes are an integral part of these fi nancial statements.
For the Year Ended June 30, 2008 (with Comparative Totals for the Year Ended June 30, 2007) (Dollars in Thousands)
Enterprise Funds TotalsHCF CRF LTCF DCF 2008 2007
Operating RevenuesSelf-Insurance Premiums $1,509,064 $ — $299,489 $ — $1,808,553 $1,632,314Administrative Fees Earned — 14,928 — — 14,928 16,434Investment Management Fees Earned — — — 3,259 3,259 308Other — — — — — 362
Total Operating Revenues $1,509,064 $14,928 $299,489 $3,259 $1,826,740 $1,649,418
Operating ExpensesClaims Expenses $1,299,905 $ — $101,349 $ — $1,401,254 $1,285,672
Increase (Decrease) in Estimated Liabilities 14,626 — (600,900) — (586,274) 502,158Administrative Expenses 79,146 24,358 18,479 — 121,983 115,309
Total Operating Expenses $1,393,677 $24,358 ($481,072) $ — $936,963 $1,903,139
Operating Income (Loss) $115,387 ($9,430) $780,561 $3,259 $889,777 ($253,721)
Non-Operating Revenues (Losses)Net Appreciation (Depreciation) in Fair Value of Investments $21,879 $ — ($78,717) $ — ($56,838) $275,284Interest, Dividends & Other Investment Income 12,700 8,037 5,678 235 26,650 35,312
Total Non-Operating Revenues (Losses) $34,579 $8,037 ($73,039) $235 ($30,188) $310,596
Change in Unrestricted Net Assets $149,966 ($1,393) $707,522 $3,494 $859,589 $56,875
Total Unrestricted Net Assets (Defi cit)Beginning of Year $448,580 $14,613 ($842,257) $765 ($378,299) ($435,174)
End of Year $598,546 $13,220 ($134,735) $4,259 $481,290 ($378,299)
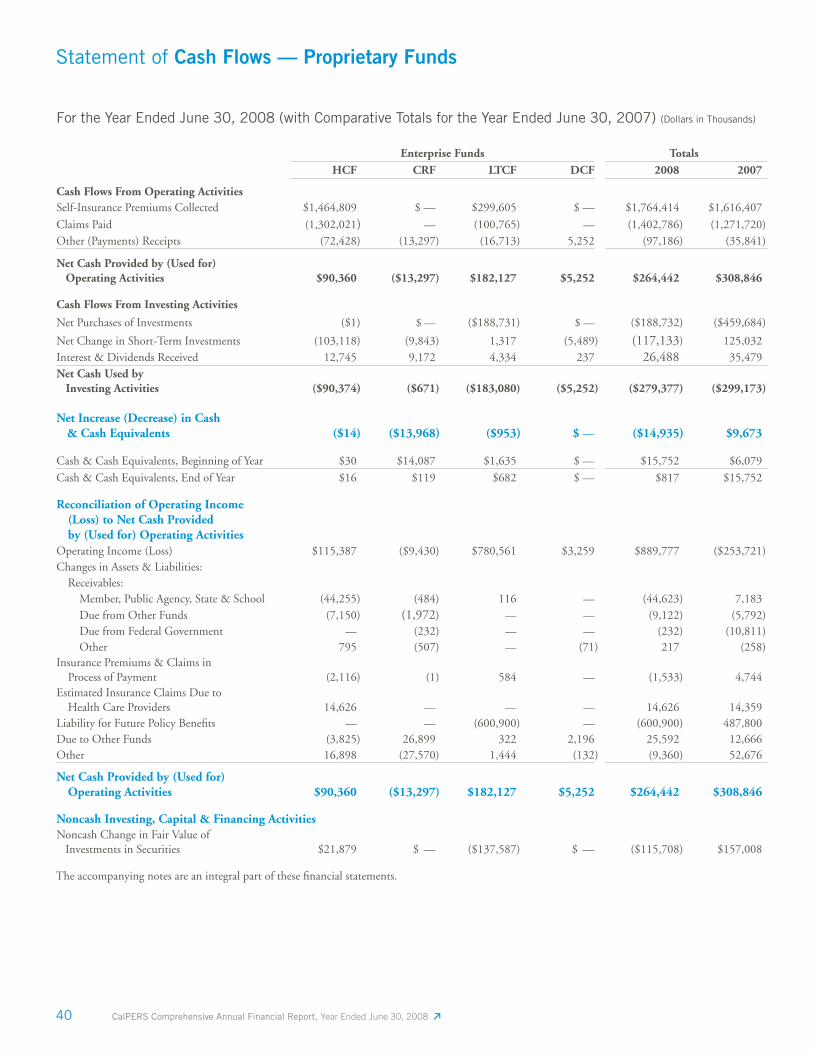
40 CalPERS Comprehensive Annual Financial Report, Year Ended June 30, 2008
Statement of Cash Flows — Proprietary Funds
The accompanying notes are an integral part of these fi nancial statements.
For the Year Ended June 30, 2008 (with Comparative Totals for the Year Ended June 30, 2007) (Dollars in Thousands)
Enterprise Funds TotalsHCF CRF LTCF DCF 2008 2007
Cash Flows From Operating ActivitiesSelf-Insurance Premiums Collected $1,464,809 $ — $299,605 $ — $1,764,414 $1,616,407
Claims Paid (1,302,021) — (100,765) — (1,402,786) (1,271,720)Other (Payments) Receipts (72,428) (13,297) (16,713) 5,252 (97,186) (35,841)
Net Cash Provided by (Used for) Operating Activities $90,360 ($13,297) $182,127 $5,252 $264,442 $308,846
Cash Flows From Investing Activities
Net Purchases of Investments ($1) $ — ($188,731) $ — ($188,732) ($459,684)
Net Change in Short-Term Investments (103,118) (9,843) 1,317 (5,489) (117,133) 125,032Interest & Dividends Received 12,745 9,172 4,334 237 26,488 35,479Net Cash Used by Investing Activities ($90,374) ($671) ($183,080) ($5,252) ($279,377) ($299,173)
Net Increase (Decrease) in Cash & Cash Equivalents ($14) ($13,968) ($953) $ — ($14,935) $9,673
Cash & Cash Equivalents, Beginning of Year $30 $14,087 $1,635 $ — $15,752 $6,079
Cash & Cash Equivalents, End of Year $16 $119 $682 $ — $817 $15,752
Reconciliation of Operating Income (Loss) to Net Cash Provided by (Used for) Operating ActivitiesOperating Income (Loss) $115,387 ($9,430) $780,561 $3,259 $889,777 ($253,721)Changes in Assets & Liabilities: Receivables: Member, Public Agency, State & School (44,255) (484) 116 — (44,623) 7,183 Due from Other Funds (7,150) (1,972) — — (9,122) (5,792) Due from Federal Government — (232) — — (232) (10,811) Other 795 (507) — (71) 217 (258)Insurance Premiums & Claims in Process of Payment (2,116) (1) 584 — (1,533) 4,744Estimated Insurance Claims Due to Health Care Providers 14,626 — — — 14,626 14,359Liability for Future Policy Benefi ts — — (600,900) — (600,900) 487,800Due to Other Funds (3,825) 26,899 322 2,196 25,592 12,666Other 16,898 (27,570) 1,444 (132) (9,360) 52,676
Net Cash Provided by (Used for) Operating Activities $90,360 ($13,297) $182,127 $5,252 $264,442 $308,846
Noncash Investing, Capital & Financing ActivitiesNoncash Change in Fair Value of Investments in Securities $21,879 $ — ($137,587) $ — ($115,708) $157,008
41 CalPERS Comprehensive Annual Financial Report, Year Ended June 30, 2008
1. General Description of the Plan
General
The State Employees’ Retirement System, the predecessor to the Public Employees’ Retirement System of the State of California (CalPERS), or the “System,” was created after voters approved a constitutional amendment authorizing legislation to establish a pension system for State employees. Such legislation became effective January 1, 1932. CalPERS has expanded to include, among others, employees of local agencies that elect to participate in the System. At June 30, 2008, the Board of Administration (Board) of CalPERS administers a total of 14 funds, including four defi ned benefi t retirement plans: the Public Employees’ Retirement Fund (PERF), the Legislators’ Retirement Fund (LRF), the Judges’ Retirement Fund (JRF), and the Judges’ Retirement Fund II (JRF II); four defi ned contribution retirement plans: the State Peace Offi cers’ and Firefi ghters’ Defi ned Contribution Plan Fund (SPOFF), the Public Agency Deferred Compensation Program (IRC 457), the Replacement Benefi t Fund (RBF), and the Supplemental Contributions Program Fund (SCPF); one defi ned benefi t post-employment health care plan, the California Employers’ Retirement Benefi t Trust Fund (CERBTF); one health care plan: the Public Employees’ Health Care Fund (HCF); and fi ve other plans: the Public Employees’ Long-Term Care Fund (LTCF), the Public Employees’ Deferred Compensation Fund (DCF), the Old Age & Survivors’ Insurance Revolving Fund (OASI), the Public Employees’ Contingency Reserve Proprietary Fund (CRF), and the Public Employees’ Contingency Reserve Agency Fund (CRF).
Reporting Entity
The basic fi nancial statements of CalPERS include fund fi nancial statements reporting the fi nancial activities of all of the above funds and assets under trust. The CalPERS Board of Administration has plenary authority and
fi duciary responsibility for the investment of monies and the administration of the System pursuant to the State Constitution, Article XVI, Section 17. CalPERS is a unit of the State of California State and Consumer Services Agency; however, CalPERS is not subject to administrative direction by any department, commission, board, bureau, or agency of the State. As such, CalPERS is classifi ed as a component unit of the State of California for fi nancial reporting purposes, in accordance with the provisions of Governmental Accounting Standards Board Statement No. 39.
CalPERS fi nancial statements are included in fi duciary and proprietary funds in the State of California Comprehensive Annual Financial Report.
Defi ned Benefi t Pension Plans
The PERF was established in 1932, the LRF in 1947, the JRF in 1937, and JRF II in 1994. The PERF, LRF, JRF, and JRF II are defi ned benefi t pension plans which provide benefi ts based on members’ years of service, age, fi nal compensation, and benefi t formula. In addition, benefi ts are provided for disability, death, and survivors of eligible members or benefi ciaries.
At June 30, 2008, the State of California and 1,571 public agencies and schools (representing more than 2,600 entities) contribute to the PERF, JRF, and JRF II, which are agent multiple employer and cost-sharing defi ned benefi t pension plans. CalPERS acts as the common investment and administrative agent for the member agencies, including schools (for classifi ed employees). The LRF is a single-employer defi ned benefi t pension plan for the State of California.
Members of the PERF, LRF, JRF, and JRF II become fully vested in their retirement benefi ts earned to date after fi ve years (10 years for State Second Tier members) of credited service.
Notes to the Basic Financial Statements
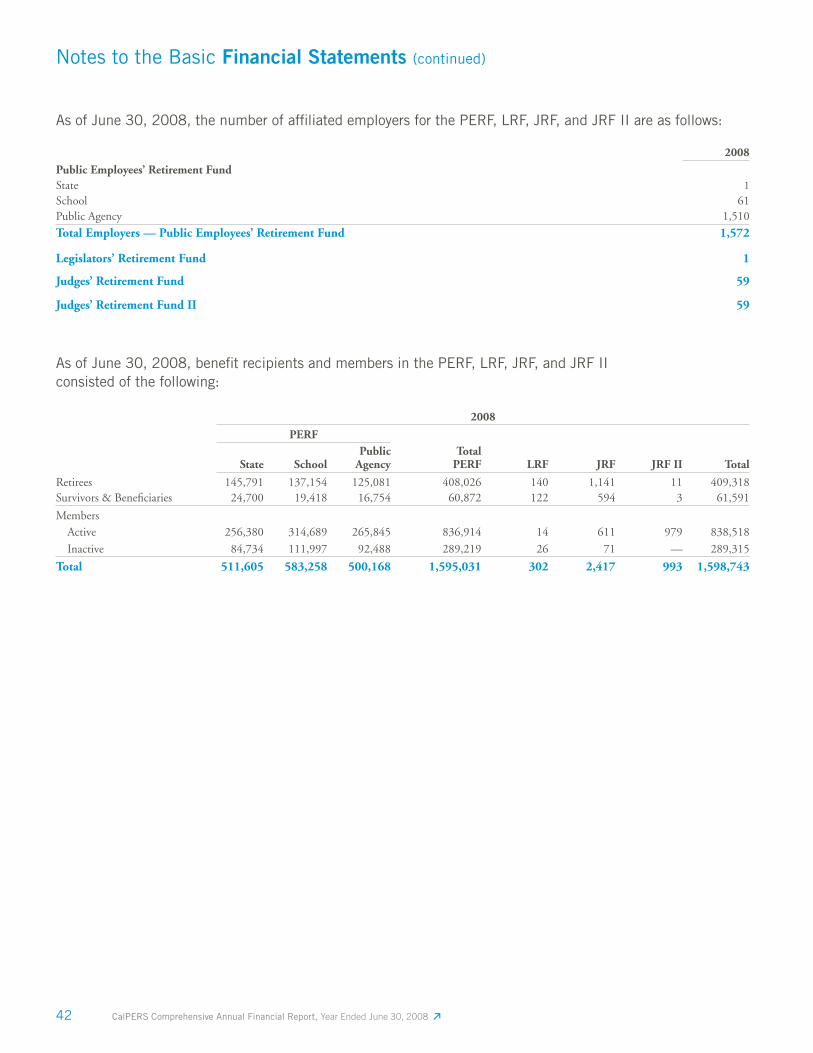
42 CalPERS Comprehensive Annual Financial Report, Year Ended June 30, 2008
Notes to the Basic Financial Statements (continued)
As of June 30, 2008, the number of affi liated employers for the PERF, LRF, JRF, and JRF II are as follows:
2008
Public Employees’ Retirement FundState 1School 61Public Agency 1,510
Total Employers — Public Employees’ Retirement Fund 1,572
Legislators’ Retirement Fund 1
Judges’ Retirement Fund 59
Judges’ Retirement Fund II 59
As of June 30, 2008, benefi t recipients and members in the PERF, LRF, JRF, and JRF II consisted of the following:
2008
PERF
State SchoolPublic
AgencyTotal
PERF LRF JRF JRF II Total
Retirees 145,791 137,154 125,081 408,026 140 1,141 11 409,318Survivors & Benefi ciaries 24,700 19,418 16,754 60,872 122 594 3 61,591
Members Active 256,380 314,689 265,845 836,914 14 611 979 838,518
Inactive 84,734 111,997 92,488 289,219 26 71 — 289,315
Total 511,605 583,258 500,168 1,595,031 302 2,417 993 1,598,743
43 CalPERS Comprehensive Annual Financial Report, Year Ended June 30, 2008
The membership consists of the following categories:
PERF
• Safety — includes California Highway Patrol, peace offi cers, fi refi ghters, and other employees whose principal duties are in active law enforcement or fi re prevention and suppression work, or who occupy positions designated by law as safety member positions.
• Schools — includes non-teaching, non-certifi cated school employees.
• State Industrial — includes all employees of the Department of Corrections and the California Youth Authority who are not safety members.
• General — includes all other members, defi ned by statute as “miscellaneous” members.
LRF
• State Legislators• Constitutional Offi cers• Legislative Statutory Offi cers
JRF
• Judges — includes Supreme Court, Courts of Appeal, and Superior Courts appointed or elected before November 9, 1994.
JRF II
• Judges — includes Supreme Court, Courts of Appeal and Superior Courts appointed or elected on or after November 9, 1994.
Financing
The benefi ts for the PERF, LRF, JRF, and JRF II are funded by contributions from members and employers, and earnings from investments. Member and employer contributions for the PERF, LRF, JRF, and JRF II are a percentage of applicable member compensation. Member contribution rates for the PERF, LRF, JRF, and JRF II are defi ned by law and depend on the respective employer’s benefi t formulas. Employer contribution rates are deter-mined by periodic actuarial valuations or by State statute. Actuarial valuations are based on the benefi t formulas and
employee groups of each employer. Employer contributions, including lump sum contri butions made when agencies fi rst join the Public Employ ees’ Retirement Fund, are credited with a market value adjustment in determining contribution rates.
The required contribution rates of active plan members are based on a percentage of salary in excess of a base compensation amount ranging from $133 to $863 monthly. For the fiscal year ended June 30, 2008, the required contribution rates for active plan members are as follows:
PERFState Employees:
Miscellaneous & Industrial 5% or 6%
Miscellaneous & Industrial
— Second Tier 0%
Safety 6%
Peace Offi cers & Firefi ghters 8%
California Highway Patrol 8%
Classifi ed School Employees 7%
Public Agency Employees 5% to 9%
LRF 0%
JRF 8%
JRF II 8%
These contributions are deposited in a fund established for each entity for the purpose of creating actuarial reserves for future benefi ts.
All employees in a covered class of employment who work on a half-time basis or more are eligible to participate in the retirement plans. CalPERS administers several different retirement plans, each providing a monthly allowance based on age, years of credited service, the benefi t formula, and highest average compensation over an established period of one year to three years. All plans provide death and disability benefi ts. Within the PERF, the benefi t provisions for the State and school employees are established by statute. The benefi ts for the public agencies are established by contract with the System, in accordance with the provisions of the Public Employees’ Retirement Law. The benefi ts for the LRF are established in accordance with the provisions of the Legislators’ Retirement Law. The benefi ts for the JRF are established in accordance with the provisions of the Judges’ Retirement Law. The benefi ts for
Notes to the Basic Financial Statements (continued)
44 CalPERS Comprehensive Annual Financial Report, Year Ended June 30, 2008
the JRF II are established in accordance with the provisions of the Judges’ Retirement System II Law.
In November 1990, Article IV, Section 4.5 was added to the State Constitution by adopting Proposition 140. This section effectively prohibited future Legislators from earning State retirement benefi ts for service in the Legislature on or after November 7, 1990, though it recognized vested pension benefi ts that had accrued before that date.
Due to the effects of Proposition 140, there are no current legislators eligible to participate in the Legislators’ Retirement Fund. The only active members in the fund are Constitutional Offi cers (including the Insurance Commissioner and members of the Board of Equalization) and Legislative Statutory Offi cers.
Costs of administering the funds are fi nanced through contributions and investment earnings of the funds.
Termination
Upon separation from the retirement plans, accumulated member contributions are refundable, with interest credited through the date of refund, as required by applicable laws. Withdrawal of such accumulated contributions results in forfeiture of the related vested benefi ts.
In the event that public agencies elect to terminate their contracts with the retirement plans, accumulated member and employer contributions, interest, and the related liability for benefi ts may be transferred to the employers. If amounts are not transferred to the employer, suffi cient assets required to cover the related liability for benefi ts are retained in the retirement plans. Excess assets above those required, if any, are returned to the employer, while the employer is billed for any defi ciency in assets.
CERBTF
The California Employers’ Retiree Benefi t Trust Fund (CERBTF) was established by Chapter 331 of the 1988 Statutes and initially funded in 2007. At June 30, 2008, 72 employers had elected to participate in the fund. The purpose of the fund is to receive contributions from participating employers and establish separate employer prefunding accounts to pay for health care or other
post-employment benefi ts in accordance with the terms of participating employer’s plans. Contributions are voluntarily determined by the employer’s own funding schedule, and there are no long-term contracts for contributions to the plan. The CERBTF is an agent multiple-employer plan as defi ned in Governmental Accounting Standards Board (GASB) Statement No. 43 with pooled administrative and investment functions.
Participating employers may receive disbursements from the fund not to exceed the annual premium and other costs of eligible post-employment benefi ts. If the employer’s participation in the fund terminates, all assets in the employer’s prefunding account shall remain in the fund except as otherwise provided. Allowable termination disbursements are to a trustee or as a trustee transfer of assets upon satisfactorily showing to the Board the transfer will satisfy applicable requirements of the Internal Revenue Code and the Board’s fi duciary duties, or the employer substantiates to the Board that all of the employer’s obligations for the payment of post-employment benefi ts has been satisfi ed. At June 30, 2008, there were 70,566 active and 29,133 retired miscellaneous and 6,003 active and 3,714 retired safety participants.
Costs to administer the plan are determined through the CalPERS Board-approved cost-allocation plan, where actual direct and indirect costs of administering the System are equitably assessed to each fund.
Defi ned Contribution Plans
SPOFF
The State Peace Offi cers’ and Firefi ghters’ Defi ned Contribution Plan Fund (SPOFF) is a defi ned contribution pension plan established by Chapter 820 of the 1998 Statutes. The plan is a qualifi ed money purchase pension plan under Section 401(a) of Title 26 of the Internal Revenue Code, and is intended to supplement the retirement benefi ts provided by the PERF to eligible correctional offi cers employed by the State of California.
Contributions to the plan are funded entirely by the employer, with a contribution rate of 2 percent of the employee’s base pay, not to exceed contribution limits established by the Internal Revenue Code. Contribution
Notes to the Basic Financial Statements (continued)
45 CalPERS Comprehensive Annual Financial Report, Year Ended June 30, 2008
requirements are established and may be amended through a Memorandum of Understanding from the State of California Department of Personnel Administration. These contributions, as well as the participant’s share of the net earnings of the fund, are credited to the participant’s account.
The net earnings of the fund are allocated to the participant’s account as of each valuation date, in the ratio that the participant’s account balance bears to the aggregate of all participants’ account balances. The benefi t paid to participants will depend only on the amount contributed to participant’s account and earnings on the value of the participant’s account. Plan provisions are established and may be amended by statute. At June 30, 2008, there were 40,470 participants.
IRC 457
Government Code Section 21670 authorizes the Board of Administration to establish a deferred compensation plan qualifi ed under Section 457 of Title 26 of the United States Code for California public employees.
The Public Agency Deferred Compensation Program (IRC 457) is an Internal Revenue Code Section 457(g) defi ned contribution plan administered by State Street Bank & Trust Company (acting as an agent of CalPERS) to provide benefi ts at retirement to public agency employees. Plan participation is voluntary to employees of participating public agencies, and contributions are separate from the defi ned benefi t contributions made to CalPERS.
Members may contribute up to the limits established under the Internal Revenue Code. At June 30, 2008, there were 26,516 participants with account balances.
Members of the plan are allowed to change their contribution amount, transfer account balances among 18 investment options, or change the contribution percentages designated to each option on a daily basis. The 18 investment options are: SSGA Target Retirement Income Fund, SSGA Target Retirement 2010 Fund, SSGA Target Retirement 2020 Fund, SSGA Target Retirement 2030 Fund, SSGA Target Retirement 2040 Fund, SSGA Conservative Asset Allocation Fund, SSGA Moderate Asset Allocation Fund, SSGA Aggressive Asset Allocation Fund,
SSGA Stable Fixed Income Fund, CalPERS Treasury Infl ation Protected Securities Fund, CalPERS Total Return Bond Fund, CalPERS S&P 500 Equity Index Fund, Alliance Bernstein Active Large Cap Equity Value Fund, Turner Active Large Cap Equity Growth Fund, CalPERS Small & Mid Cap Equity Index Fund, CalPERS International Index Fund, SSGA Select Active International Fund, and a Self Manage Account (SMA). Members may access their funds upon retirement, separation from employment, or other distributions as allowed under the Internal Revenue Code. The CalPERS Board of Administration has authorization under the Government Code of the State of California to establish plan provisions.
RBF
The Replacement Benefi t Fund (RBF) was established by Chapter 938 of the 1995 Statutes and initially funded in 1998 to provide benefi ts to members of the PERF whose retirement benefi t exceeds Internal Revenue Code Section 415(b) limits. IRC Section 415(b) imposes a dollar limit on the annual retirement benefi ts an individual may receive from a qualifi ed defi ned benefi t pension plan.
The RBF is funded on a “pay-as-you-go” basis. That is, money collected from an employer during any calendar year must be paid to the retiree during that same year. Employer contributions must be in amounts “equivalent to” the benefi ts not paid as a result of the limitations of IRC Section 415(b). CalPERS calculates the member’s retirement allowance based on the member’s choice of retirement option. CalPERS also is responsible for calculating the applicable dollar limit under IRC Section 415(b), and setting the employer rates. At June 30, 2008, there were 139 retirees in the RBF.
SCPF
The Supplemental Contributions Program Fund (the program) was established January 1, 2000, by Chapter 307 of the 1999 Statutes, as a separate trust fund for the Supplemental Contributions Program, a defi ned contribution plan that provides supplemental benefi ts at retirement to members of CalPERS. The program is a qualifi ed plan under Section 401(a) of Title 26 of the United States Code, administered by CalPERS.
Notes to the Basic Financial Statements (continued)
46 CalPERS Comprehensive Annual Financial Report, Year Ended June 30, 2008
Currently, the program is available only to State of California employees who are members of CalPERS. The program is entirely member funded, and participation is voluntary. Participant contributions are made on an after-tax basis and are separate from the defi ned benefi t contributions made to CalPERS. Participants may be able to contribute to a deferred compensation or 401(k) plan in conjunction with the program, if the participant remains within the Internal Revenue Code Section 415(c) limits. Distributions are allowed only at retirement or permanent separation from employment. The CalPERS Board of Administration has authorization under the Government Code of the State of California to establish plan provisions. At June 30, 2008, there were 732 participants in the program.
Other Funds Administered by CalPERS
OASI
The Old Age & Survivors’ Insurance Revolving Fund (OASI) was established to consolidate the collection and payment for California public agencies of employee and employer contributions under the provisions of the federal Social Security regulations.
Federal legislation was enacted on October 21, 1986, which required direct remittance of Social Security contributions by individual public agencies and eliminates the intermediary collection and remittance of such contributions by individual public agencies and by State Social Security agencies, such as the OASI. As such, effective January 1, 1987, the OASI stopped receiving contributions from public agencies. Since then the OASI fund has operated in the capacity of an intermediary in the reconciliation of past year’s payroll contributions to the federal government and to reimburse the PERF for OASI contract management services. As reconciliations are completed, amounts will be collected and transmitted to the federal government or returned to the local governments. If any liabilities are owed which the OASI cannot collect, the State of California or the appropriate public agency is responsible for payment.
HCF
The Public Employees’ Health Care Fund (HCF) was established under the Public Employees’ Medical and Hospital Care Act (PEMHCA) as of July 1, 1988. The self-funded plans, PERS Choice, PERSCare, and PERS Select are risk pools available to all entities that contract for health insurance coverage under PEMHCA. Having all members in a single risk pool spreads catastrophic claims over a large base and minimizes administrative expenses. PERS Choice, PERSCare, and PERS Select retain all the risk of loss of allowable health claims. Fund members are not subject to a supplemental assessment in the event of defi ciencies. Premium rates for PERS Choice, PERSCare, and PERS Select are set by the Board based on a trend analysis of the historic cost, utilization, demographics, and administrative expenses of the HCF to provide for the claims incurred and the actuarially determined required level of reserves.
PERS Choice, PERSCare, and PERS Select rely on operating cash fl ows and investment income to fund health benefi t payments. During the 2008 fi scal year, the Board continued to increase member premiums to mitigate the impact of increasing costs associated with enrollment growth, increases in provider pricing, and increased benefi t utilization. Management believes that the current sources of funding for PERS Choice, PERSCare, and PERS Select will be adequate to provide for benefi ts of the plans.
Public agencies participating in PERS Choice, PERSCare, and PERS Select are required to make periodic premium payments based on rates as established by CalPERS. Plan members pay the difference between the premium rate and the employers’ contribution. Administrative costs are fi nanced through investment earnings.
CRF
The Public Employees’ Contingency Reserve Fund (CRF) was established in 1962, with the passage of PEMHCA, to fund administrative costs related to the PEMHCA program, and as a contingency reserve for such items as increases in future rates or in future benefi ts. PEMHCA was expanded to include local public agency employees on a contract basis in 1967. The CRF is reimbursed by the State and contracting public agencies for costs incurred for administering the program.
Notes to the Basic Financial Statements (continued)
47 CalPERS Comprehensive Annual Financial Report, Year Ended June 30, 2008
Activity in the CRF is reported in two separate fund types. Administrative fees collected and related costs are accounted for in the CRF proprietary fund type. Public agency health payments and remittances to contracted health care providers are reported in the CRF Agency Fund type.
PEMHCA establishes eligibility rules for the following:• retirees and benefi ciaries receiving health care benefi ts;• terminated plan members entitled to but not yet
receiving benefi ts; and• active plan members.
Administrative costs include direct costs of the program and a proportionate share of indirect costs allocated to the CRF by the PERF. The administrative fee is determined as a percentage of insurance premiums paid by the employers. The administrative fee for the year ended June 30, 2008, was 0.29 percent. Contribution rates are reviewed annually and are adjusted, if needed, to cover budgeted administrative costs.
Public agency employers whose employees do not elect PERS Choice, PERSCare, or PERS Select submit the provider-determined, Board-approved premiums to the CRF Agency Fund, which in turn submits the premiums to the respective provider.
At June 30, 2008, 1,147 entities participated in health insurance coverage under PEMHCA.
LTCF
The Public Employees’ Long-Term Care Fund (LTCF) began providing self-insured long-term care plans in 1995. The LTCF operates by providing long-term care coverage to enrolled members under the Public Employees’ Long-Term Care Act (PERL, Chapter 15). The fund contracts with a third party to administer the program. Long-term care coverage is offered to all public employees (active or retired), their spouses, parents, parents-in-law, and siblings. The LTCF is a member-paid program with no contributions from employers. Premium rates are recommended to the Board by the program actuary and are set by the Board. Prospective enrollees apply directly to the program for long-term care coverage.
As of June 30, 2008, there are 168,140 enrollees, of which 3,077 are receiving benefits.
The decrease in the unrestricted net deficit in the LTCF from $842.3 million in 2007 to $134.7 million in 2008 is attributable to premium rate increases and a decrease in the actuarially determined liability for future policy benefits. The CalPERS Board of Administration increased premiums in the 2007- 08 fiscal year to eliminate future deficits. In addition, the LTCF is in the process of reviewing its current policies and exploring different options to address the deficit.
DCF
The Public Employees’ Retirement System Deferred Compensation Fund (DCF) accounts for revenues and expenses associated with administrative and investment management services provided to other governments by CalPERS staff. The services provided assist other governments with their administration of deferred compensation plans. Revenues come from fees charged to various State of California public agencies for managing 18 investment portfolios offered in the CalPERS IRC 457 plan and certain investments of the SPOFF and SCPF.
The DCF was established by Chapter 1659 of the 1990 Statutes, which added Government Code Sections 21420-21429. These Government Code Sections were subsequently renumbered to Government Code Sections 21670-21685 by Chapter 379 of the 1995 Statutes. Operation and initial funding of the DCF commenced July 1991.
VFF
Pursuant to California State Law, the assets and liabilities of the Volunteer Firefi ghters’ Fund (VFF) were transferred from CalPERS to the California State Fire Employees’ Welfare Benefi t Corporation (CSFEWBC). The Statutes of 2007, Chaper 651, SEC. 3 added Article 7 (commencing with Section 50980) to Chapter 4.5 of Division 1 of Title 5 of the Government Code which provided for the transfer of the data and fi les, assets and liabilities of the VFF from CalPERS to the CSFEWBC on or before March 1, 2008. Government Code Section 50985 provided that the transfer
Notes to the Basic Financial Statements (continued)
48 CalPERS Comprehensive Annual Financial Report, Year Ended June 30, 2008
is deemed complete on the date CalPERS transferred the assets and liabilities of the VFF and Government Code Section 50984 provided that upon the transfer, CSFEWBC assumed all responsibility and liability of the VFF. CalPERS ceased to administer the VFF on February 29, 2008. On February 27, 2008, and February 29, 2008, CalPERS transferred $3,561,438 in cash, $46,122 in accounts receivable, and $6,000 in Death Benefi ts Payable to CSFEWBC. Effective February 29, 2008, responsibility for administration of the VFF was transferred to the CSFEWBC.
During the period ended February 29, 2008, management discovered that member contributions were overstated for the fi scal year ended June 30, 2007. Net assets held in trust for award benefi ts were restated as follows:
Net assets, beginning of the year $3,996,000
Prior period adjustment (69,000)
Net assets, beginning of the year, as restated $3,927,000
2. Summary of Signifi cant Accounting Policies
Measurement Focus, Basis of Accounting & Basis of Presentation
The accompanying fi nancial statements have been prepared in accordance with accounting principles generally accepted in the United States of America.
Due to the types of investments held by the CRF agency and proprietary funds, JRF, RBF, and DCF, there was no appreciation (depreciation) in the fair value of investments in fi scal year 2008. The calculation of realized gains and losses is independent of the calculation of the change in the fair value of investments. Realized gains and losses of the current period include unrealized amounts from prior periods.
The accounts of CalPERS are organized and operated on the basis of funds. CalPERS has the following fund types at June 30, 2008:
Fiduciary funds — including pension trust, other post-employment trust, and agency funds, account for assets held by the government in a trustee capacity or as an agent
on behalf of others. The pension trust funds (PERF, LRF, JRF, JRF II, SPOFF, IRC 457, RBF, and SCPF) and the other post-employment health care fund (CERBTF) are accounted for on the fl ow of economic resources measurement focus and the accrual basis of accounting. Member contributions for the PERF, LRF, JRF, JRF II, IRC 457, and SCPF are recognized in the period in which the contributions are due. Employer contributions for the PERF, JRF, JRF II, SPOFF, CERBTF, and RBF are recognized when due and the employer has made a formal commitment to provide the contributions. Benefi ts under the defi ned benefi t plans and refunds are recognized when due and payable in accordance with the terms of each plan. The agency funds (OASI and CRF) are custodial in nature and do not measure the results of operations. Assets and liabilities are recorded using the accrual basis of accounting.
Proprietary funds — including enterprise funds (HCF, CRF, LTCF, and DCF) are accounted for on the fl ow of economic resources measurement focus and use the accrual basis of accounting. Under this method, revenues are recorded when earned and expenses are recorded at the time liabilities are incurred. CalPERS applies all applicable GASB pronouncements in accounting and reporting for its proprietary operations, and follows FASB pronouncements issued prior to December 1, 1989, insofar as those standards do not confl ict or contradict guidance of the GASB.
Operating revenues and expenses are distinguished from non-operating items and generally result from providing services in connection with ongoing operations. The principal operating revenues of the HCF, CRF, LTCF, and DCF are derived from self-insurance premiums and providing administrative services. Operating expenses include the cost of claims and related administrative expenses. All revenues and expenses not meeting these defi nitions are reported as non-operating revenues and expenses.
GASB Statement No. 50
Effective July 1, 2007, CalPERS implemented the provisions of GASB 50. GASB 50 requires that information about the funded status of each pension plan as of the most recent actuarial valuation be disclosed in the notes to the fi nancial statements. Additionally, GASB 50 requires disclosure of information about actuarial methods and
Notes to the Basic Financial Statements (continued)
49 CalPERS Comprehensive Annual Financial Report, Year Ended June 30, 2008
assumptions used in valuations on which reported information about the ARC and the funded status and funding progress are based. The required schedules of funding progress immediately following the notes to the fi nancial statements present multiyear trend information about whether the actuarial value of plan assets is increasing or decreasing over time relative to the actuarial accrued liability for benefi ts.
Investments
As a result of Proposition 162 (State Constitution, Article XVI, Section 17), the CalPERS Board of Administration has plenary authority and fi duciary responsibility for the investment of monies. CalPERS invests in stocks, bonds, mortgages, real estate, alternative, and other investments. Alternative investments include two components: direct investments and partnerships. CalPERS maintains certain deposits, cash equivalents, and other investments with fi nancial institutions.
Investments are reported at fair value. Certain construction projects and alternative investments are reported at cost, which approximates market value. The fair values of investments in securities are generally based on published market prices and quotations from major investment fi rms. Many factors are considered in arriving at fair value. In general, corporate bonds are valued based on yields currently available on comparable securities of issuers with similar credit ratings. Investments in certain restricted common stocks are valued at the quoted market price of the issuer’s unrestricted common stock, less an appropriate discount. Investments held in internally and externally managed investment pools have been reported at fair value.
Mortgages are valued on the basis of their future principal and interest payments discounted at prevailing interest rates for similar instruments. The fair value of real estate investments is estimated based on independent appraisals. Short-term investments are reported at market value, when available, or at cost plus accrued interest, which approximates market value when market values are not available. For investments where no readily ascertainable market value exists, management, in consultation with their investment advisors, has determined the fair values for the individual investments. Alternative investments are valued based
upon partnerships’ June 30, 2008 fi nancial statements.
In December 2007, the CalPERS Board of Administration approved an investment asset allocation that includes a 5 percent allocation in an Infl ation Linked Asset Class (ILAC). The ILAC is Board-approved to include commodities, infl ation-linked bonds, infrastructure, and forestland. At June 30, 2008, the ILAC held $1.6 billion of infl ation-linked bonds, $0.1 billion in infrastructure, $1.6 billion in forestland, and $1.4 billion in commodities exposure.
There are certain market risks, credit risks, liquidity risks, foreign currency exchange risks, and event risks which may subject CalPERS to economic changes occurring in certain industries, sectors, or geographies.
Derivatives
Under the State Constitution and statutory provisions governing CalPERS investment authority, CalPERS holds investments in futures and options and enters into forward foreign currency exchange contracts. Futures and options with fair values of approximately negative $99.9 million are held for investment purposes and included within the financial statements at June 30, 2008. Gains and losses on futures and options are determined based upon quoted market values and recorded in the Statement of Changes in Fiduciary Net Assets.
Due to the level of risk associated with certain derivative investment securities, it is reasonably possible that changes in the values of investment securities will occur in the near term and that such changes could affect the amounts reported in the fi nancial statements.
Forward foreign currency exchange contracts are used primarily to hedge against changes in exchange rates related to foreign securities. At June 30, 2008, CalPERS has approximately negative $99.5 million net exposure to loss from forward foreign currency exchange transactions related to the approximately $5.0 billion and $48.5 billion international debt and equity portfolios, respectively.
CalPERS could be exposed to risk if the counterparties to the contracts are unable to meet the terms of the contracts.
Notes to the Basic Financial Statements (continued)
50 CalPERS Comprehensive Annual Financial Report, Year Ended June 30, 2008
Notes to the Basic Financial Statements (continued)
CalPERS investment managers seek to control this risk through counterparty credit evaluations and approvals, counterparty credit limits, and exposure monitoring procedures. CalPERS anticipates that the counterparties will be able to satisfy their obligations under the contracts.
Capital Assets
Capital assets are defi ned by CalPERS as assets with an initial individual cost of $5,000 or more, and an estimated useful life in excess of one year.
Capital assets held by the PERF, consisting of buildings, furniture, and equipment, are recorded at cost or, if donated, at their estimated fair market value at the date of donation. Capital assets are depreciated over their estimated useful lives, ranging from one to fi ve years for furniture and equipment and 40 years for buildings, using the straight-line method of depreciation.
Use of Estimates in the Preparation of Financial Statements
The preparation of fi nancial statements in conformity with accounting principles generally accepted in the United States of America requires management to make estimates and assumptions that affect the reported amounts of net assets held in trust for pension and post-employment health care benefi ts and changes therein, IBNR, claims payable, LTCF liability, and disclosure of contingent liabilities at the date of the fi nancial statements. Actual results could differ from those estimates.
Comparative Totals
The basic fi nancial statements include certain prior-year summarized comparative information in total but not at the level of detail required for a presentation in conformity with generally accepted accounting principles. Accordingly, such information should be read in conjunction with CalPERS fi nancial statements for the year ended June 30, 2007, from which the summarized information was derived.
Reclassifi cations
Certain reclassifi cations have been made to the comparative totals as of and for the year ended June 30, 2007, to conform to the presentation as of June 30, 2008.
3. Cash & Cash Equivalents
Cash and cash equivalents of approximately $427.8 million in 2008 represent amounts held in the CalPERS general operating accounts with the State Treasury. These monies are not individually identifi able by fund, as they are pooled with the monies of other State agencies and invested by the State Treasurer’s Offi ce.
4. Investments
For the year ended June 30, 2008, State Street Bank & Trust Company was the master custodian for signifi cantly all of the securities of CalPERS, however, certain securities are held by alternative investment managers. Real estate deeds of trust are held in the name of Limited Liability Corporations and Partnerships. The investments held by the PERF, LRF, JRF II, SCPF, CERBTF, IRC 457, HCF, and LTCF have been commingled in internally managed investment pools. The investment pools are an internally managed domestic and international equity pool, and an internally managed debt securities pool. Each of the eight funds has a different asset allocation based on Board-approved policy.
In accordance with GASB Statement 40, CalPERS discloses investments of all CalPERS managed funds that are subject to certain risks: custodial credit risk, concentration of credit risk, interest rate risk, credit risk and foreign currency risk.
GASB Statement 40 investment risk disclosures begin on page 51, disclosing the investments subject to the various risks for the PERF and all other affi liate funds.
Securities Lending
The State Constitution and CalPERS Board policies permit CalPERS to use investments of the PERF to enter into
51 CalPERS Comprehensive Annual Financial Report, Year Ended June 30, 2008
Notes to the Basic Financial Statements (continued)
securities lending transactions; collateralized loans of securities to broker-dealers and other entities with a simultaneous agreement to return the collateral for the same securities in the future. CalPERS has contracted with Boston Global Advisors (BGA), eSecLending LLC (eSec), State Street Bank & Trust (SSB), and Wachovia Global Securities Lending as third-party securities lending agents to lend domestic and international equity and debt securities. Additionally, CalPERS contracts with eSecLending as an administrative agent for CalPERS principal borrowers.
Domestic and international securities are collateralized for cash at 102 percent and 105 percent, respectively, of the securities market value. Management believes CalPERS has minimized credit risk exposure to borrowers by requiring the borrower to provide collateralization greater than 100 percent of the market value of the securities loan. The securities loaned are priced daily. On June 30, 2008, the fair market value of the securities on loan was $33.9 billion.
In the event that a borrower fails to return the securities or fails to remit income distributions by the securities’ issuers to CalPERS while the securities are on loan, the agent is responsible for the associated costs. Securities on loan can be recalled on demand by CalPERS, and loans of securities may be terminated by CalPERS or the borrower. CalPERS may enter into term loan agreements which are evaluated on an individual basis.
The cash collateral is invested in accordance with CalPERS investment guidelines in short-term, high-credit quality fi xed income securities. Currently, eSec and CalPERS manage the unrated cash collateral pools. For the year ended June 30, 2008, the cash collateral pools invested by eSec and CalPERS had weighted average maturities of 46 days, 364 days, 499 days, and 57 days, respectively, and durations of 1, 21, 22, and 2 days, respectively.
The following investment risk schedules disclose CalPERS investments subject to certain types of risk, pursuant to GASB Statement 40. Each schedule discloses investments of all funds managed by CalPERS subject to each type of risk. Some securities are held in internally-managed investment pools shared by all funds.
Custodial Credit Risk
CalPERS does not have any funds or deposits that are not covered by depository insurance, which are either uncollateralized, collateralized with securities held by the pledging fi nancial institution, or collateralized with securities held by the pledging fi nancial institution’s trust department or agent, but not in CalPERS name. Nor does CalPERS have any investments that are not registered in the name of CalPERS and are either held by the counterparty or the counterparty’s trust department or agent, but not in CalPERS name.
Concentration of Credit Risk
CalPERS does not have investments in any one issuer which represent 5 percent or more of total fair value of all investments.
Interest Rate Risk
Interest rate risk is the risk that changes in interest rates will adversely affect the fair value of an investment. This risk is managed within the portfolios using the effective duration or option-adjusted methodology. The System’s investment policies require the option-adjusted duration of the total fi xed income portfolio to stay within 20 percent of the option-adjusted duration of its benchmark (Lehman Brothers Long Liabilities). All individual portfolios are required to maintain a specifi ed level of risk relative to their benchmark. Risk exposures are monitored daily. These are reported grouped by effective duration ranges.
Credit Risk
Credit risk is defi ned as the risk that an issuer or other counterparty to an investment will not fulfi ll its obligations. The System’s investment policies establish general as well as specifi c risk measures for the fi xed income portfolio. From the most general perspective, 90 percent of the total fi xed income portfolio must be invested in investment-grade securities.
Investment-grade securities are those fi xed income securities with a Moody’s rating of AAA to BAA or a Standard &
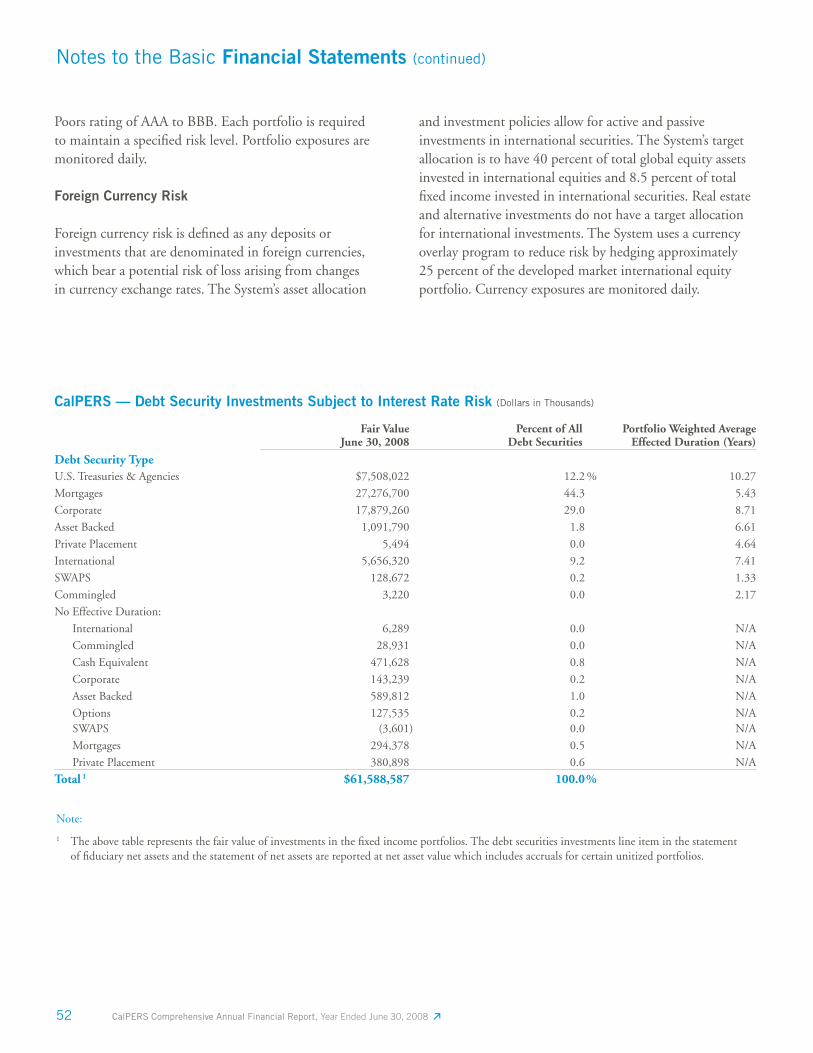
52 CalPERS Comprehensive Annual Financial Report, Year Ended June 30, 2008
Poors rating of AAA to BBB. Each portfolio is required to maintain a specifi ed risk level. Portfolio exposures are monitored daily.
Foreign Currency Risk
Foreign currency risk is defi ned as any deposits or investments that are denominated in foreign currencies, which bear a potential risk of loss arising from changes in currency exchange rates. The System’s asset allocation
Notes to the Basic Financial Statements (continued)
Note:
1 The above table represents the fair value of investments in the fi xed income portfolios. The debt securities investments line item in the statement of fi duciary net assets and the statement of net assets are reported at net asset value which includes accruals for certain unitized portfolios.
and investment policies allow for active and passive investments in international securities. The System’s target allocation is to have 40 percent of total global equity assets invested in international equities and 8.5 percent of total fi xed income invested in international securities. Real estate and alternative investments do not have a target allocation for international investments. The System uses a currency overlay program to reduce risk by hedging approximately 25 percent of the developed market international equity portfolio. Currency exposures are monitored daily.
CalPERS — Debt Security Investments Subject to Interest Rate Risk (Dollars in Thousands)
Fair ValueJune 30, 2008
Percent of AllDebt Securities
Portfolio Weighted Average Effected Duration (Years)
Debt Security TypeU.S. Treasuries & Agencies $7,508,022 12.2 % 10.27
Mortgages 27,276,700 44.3 5.43
Corporate 17,879,260 29.0 8.71
Asset Backed 1,091,790 1.8 6.61
Private Placement 5,494 0.0 4.64
International 5,656,320 9.2 7.41
SWAPS 128,672 0.2 1.33
Commingled 3,220 0.0 2.17
No Effective Duration:
International 6,289 0.0 N/A
Commingled 28,931 0.0 N/A
Cash Equivalent 471,628 0.8 N/A
Corporate 143,239 0.2 N/A
Asset Backed 589,812 1.0 N/A
Options 127,535 0.2 N/A SWAPS (3,601) 0.0 N/A
Mortgages 294,378 0.5 N/A
Private Placement 380,898 0.6 N/A
Total 1 $61,588,587 100.0%
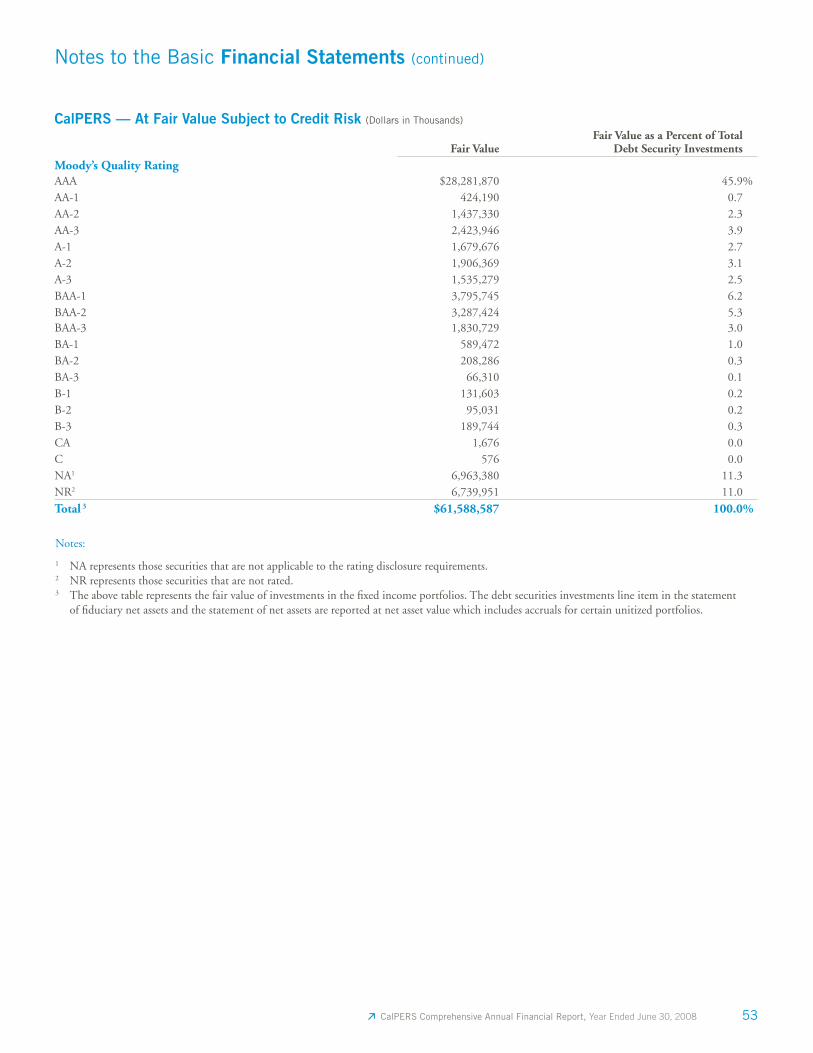
53 CalPERS Comprehensive Annual Financial Report, Year Ended June 30, 2008
Notes to the Basic Financial Statements (continued)
CalPERS — At Fair Value Subject to Credit Risk (Dollars in Thousands)
Fair ValueFair Value as a Percent of Total
Debt Security InvestmentsMoody’s Quality RatingAAA $28,281,870 45.9%AA-1 424,190 0.7AA-2 1,437,330 2.3AA-3 2,423,946 3.9A-1 1,679,676 2.7A-2 1,906,369 3.1A-3 1,535,279 2.5BAA-1 3,795,745 6.2BAA-2 3,287,424 5.3BAA-3 1,830,729 3.0BA-1 589,472 1.0BA-2 208,286 0.3BA-3 66,310 0.1B-1 131,603 0.2B-2 95,031 0.2B-3 189,744 0.3CA 1,676 0.0C 576 0.0NA1 6,963,380 11.3NR2 6,739,951 11.0
Total 3 $61,588,587 100.0%
Notes:
1 NA represents those securities that are not applicable to the rating disclosure requirements.2 NR represents those securities that are not rated.3 The above table represents the fair value of investments in the fi xed income portfolios. The debt securities investments line item in the statement
of fi duciary net assets and the statement of net assets are reported at net asset value which includes accruals for certain unitized portfolios.
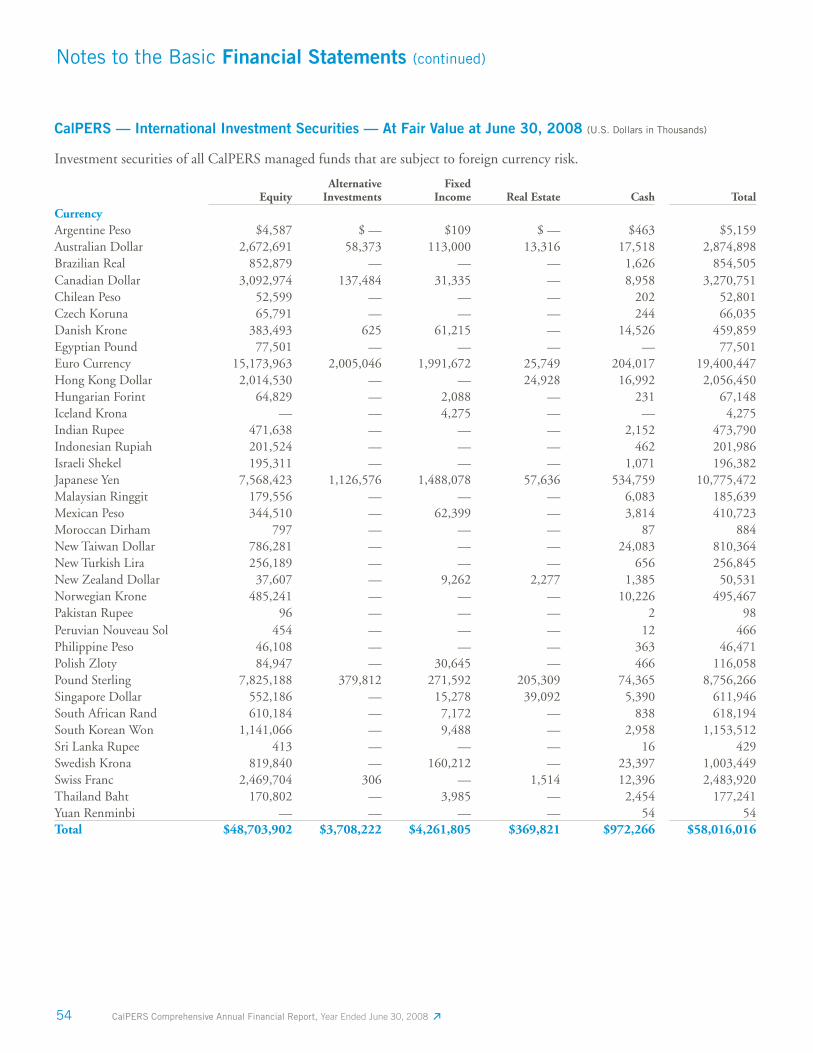
54 CalPERS Comprehensive Annual Financial Report, Year Ended June 30, 2008
Notes to the Basic Financial Statements (continued)
CalPERS — International Investment Securities — At Fair Value at June 30, 2008 (U.S. Dollars in Thousands)
Investment securities of all CalPERS managed funds that are subject to foreign currency risk.
EquityAlternative
InvestmentsFixed
Income Real Estate Cash TotalCurrencyArgentine Peso $4,587 $ — $109 $ — $463 $5,159Australian Dollar 2,672,691 58,373 113,000 13,316 17,518 2,874,898Brazilian Real 852,879 — — — 1,626 854,505Canadian Dollar 3,092,974 137,484 31,335 — 8,958 3,270,751Chilean Peso 52,599 — — — 202 52,801Czech Koruna 65,791 — — — 244 66,035Danish Krone 383,493 625 61,215 — 14,526 459,859Egyptian Pound 77,501 — — — — 77,501Euro Currency 15,173,963 2,005,046 1,991,672 25,749 204,017 19,400,447Hong Kong Dollar 2,014,530 — — 24,928 16,992 2,056,450Hungarian Forint 64,829 — 2,088 — 231 67,148Iceland Krona — — 4,275 — — 4,275Indian Rupee 471,638 — — — 2,152 473,790Indonesian Rupiah 201,524 — — — 462 201,986Israeli Shekel 195,311 — — — 1,071 196,382Japanese Yen 7,568,423 1,126,576 1,488,078 57,636 534,759 10,775,472Malaysian Ringgit 179,556 — — — 6,083 185,639Mexican Peso 344,510 — 62,399 — 3,814 410,723Moroccan Dirham 797 — — — 87 884New Taiwan Dollar 786,281 — — — 24,083 810,364New Turkish Lira 256,189 — — — 656 256,845New Zealand Dollar 37,607 — 9,262 2,277 1,385 50,531Norwegian Krone 485,241 — — — 10,226 495,467Pakistan Rupee 96 — — — 2 98Peruvian Nouveau Sol 454 — — — 12 466Philippine Peso 46,108 — — — 363 46,471Polish Zloty 84,947 — 30,645 — 466 116,058Pound Sterling 7,825,188 379,812 271,592 205,309 74,365 8,756,266Singapore Dollar 552,186 — 15,278 39,092 5,390 611,946South African Rand 610,184 — 7,172 — 838 618,194South Korean Won 1,141,066 — 9,488 — 2,958 1,153,512Sri Lanka Rupee 413 — — — 16 429Swedish Krona 819,840 — 160,212 — 23,397 1,003,449Swiss Franc 2,469,704 306 — 1,514 12,396 2,483,920Thailand Baht 170,802 — 3,985 — 2,454 177,241Yuan Renminbi — — — — 54 54Total $48,703,902 $3,708,222 $4,261,805 $369,821 $972,266 $58,016,016
55 CalPERS Comprehensive Annual Financial Report, Year Ended June 30, 2008
Notes to the Basic Financial Statements (continued)
5. Contributions & Reserves
Employer Contributions Actuarially Determined & Contributions Made
Employer contributions are calculated as a percentage of employer payroll. OPEB plan employer contributions are voluntarily determined by the employer and there are no long-term contracts for contributions. The payroll for employees covered by the PERF, JRF, and JRF II in 2008 was approximately $43.9 billion, $124.8 million, and $173.8 million, respectively.
The actuarial cost methods used are Entry Age Normal for the CERBTF and Individual Entry Age Normal for the PERF, LRF, and JRF, and Aggregate Entry Age Normal for the JRF II. These actuarial cost methods are projected Benefi t cost methods. That is, the method takes into account those benefi ts that are expected to be earned in the future, as well as those already accrued.
According to this cost method, the normal cost percent for an employee pension liability is the level percentage of payroll amount which would fund the projected benefi t if it were paid annually from date of employment until retirement. The Entry Age Normal Actuarial Cost Method used by the PERF, CERBTF, and JRF II is modifi ed by CalPERS so that the employers’ total normal cost is expressed as a level percentage of payroll. The PERF, CERBTF, and JRF II use the level percentage of payroll method to amortize any unfunded actuarial liabilities.
The signifi cant actuarial assumptions used in the 2007 valuations to compute the actuarially determined contribution requirements for the PERF and JRF II are the same as those used to compute the actuarial accrued liability. The CERBTF uses assumptions similar to the pension plans with the addition of the Health Cost Trend Rate assumption.
Real Estate
Real estate investments are classifi ed as investments in accordance with GASB Statement 25. Certain real estate investments are leveraged whereby partnerships have been established to purchase properties through a combination of contributions from CalPERS and other investors and through the acquisition of debt. At June 30, 2008, real estate equities of approximately $41.0 billion are reported at estimated fair market value. Of this amount, $22.0 billion is equity and $13.9 billion is long-term mortgages payable, and $5.2 billion is other short-term liabilities.
Required repayment of real estate debt is as follows:(Dollars in Thousands)
Debt Matures Year Ending June 30 Amount
2009 $2,154,209
2010 2,699,990
2011 1,961,656
2012 1,622,342
2013 1,504,569
2014-2018 3,017,442
2019-2023 258,666
2024-2028 235,151
2029-2033 235,151
2034-2038 235,151
Grand Total $13,924,327
Other Investment Income
Total other investment income earned by CalPERS in the 2008 fi scal year is $155.6 million. This total consists of income from securities litigation, sale of fractional shares, other miscellaneous income earned across all other investment portfolios, amortization income earned in the fixed income portfolios, and $1.2 million from the directed brokerage program.
56 CalPERS Comprehensive Annual Financial Report, Year Ended June 30, 2008
Restrictions on Net Assets Available for Benefi ts
Included in the Net Assets Held in Trust for Pension Benefi ts is a restricted reserve that, by law, is retained in the PERF and LRF as a reserve against defi ciencies in interest earned, potential losses under investments, court-mandated costs, and actuarial losses resulting from terminations, mergers, or dissolutions of contracting agencies. This reserve cannot exceed 0.2 percent of total assets of the PERF and the LRF, and totaled approximately $483.0 million and $270,000 as of June 30, 2008, for the PERF and LRF, respectively.
PERF
Actuarial valuations of the PERF are performed annually. The last valuation was performed as of June 30, 2007, for the State, schools, and public agencies.
The total 2008 net retirement contributions for the PERF amounted to approximately $10.8 billion, of which $7.2 billion (the actuarially determined annual required contribution) came from 1,572 employers and approximately $3.5 billion came from nearly 837,000 members. The contributions to the PERF were for the retirement program, the 1959 Survivor Program, and the Group Term Life Insurance Program. For the retirement program, the average employer normal cost is 10.553 percent of covered payroll, and amortization of the unfunded liabilities is 4.793 percent of covered payroll. These fi gures are averages for all employers. The actual fi gures vary by each employer’s plan.
LRF
The current contribution requirements of the LRF are based on actuarially determined rates promulgated as part of legislation passed in 1977.
Actuarial valuations of the LRF are required to be carried out at least every two years. The Board of Administration utilizes these actuarial valuations to make recommendations to the State for fi nancing the Fund. For the fi scal year ending June 30, 2008, there was no statutory contribution required based on the June 30, 2006 valuation.
JRF
Contributions made by the State of California to the JRF are made pursuant to State statute and are not actuarially determined; however, an actuarial valuation of the JRF assets and liabilities is performed every year and is used by CalPERS to make recom mendations for fi nancing the JRF.
The California law which states that on and after January 1, 2004, the JRF shall be funded and actuarially sound was amended in conjunction with the adoption of the Judges’ Retirement System II Law, which, among other provisions, eliminated the requirement that the JRF be funded and actuarially sound. Recommendations to achieve the necessary level of contributions have been submitted by the CalPERS Board to the Legislature.
As of June 30, 2008, funding was provided from the follow ing sources to meet benefi t payment requirements:• Member Contributions — 8 percent of applicable
member compensation;• Employer Contributions — 8 percent of applicable
member compensation;• Filing Fees — Varying amounts depending on fee rate
and number of fi lings;• Investments — Current yield on short-term investments;• State of California “Balancing Contributions” — An amount required by the Judges’ Retirement Law, at
least equal to the estimated benefi ts payable during the ensuing fi scal year less the sum of 1) the estimated member contributions during the ensuing fi scal year and; 2) net assets available for benefi ts at the begin ning of the fi scal year.
Under the pay-as-you-go basis, short-term investments as well as contributions received during the year are used to make benefi t payments. Management and legal counsel believe the State of California is legally required to provide these required contributions to fund the benefi ts.
For the year ended June 30, 2008, the actual contributions made by the State to the JRF were approximately $163.2 million, which is significantly less than the actuarially determined annual required contribution of approximately $623.5 million.
Notes to the Basic Financial Statements (continued)
57 CalPERS Comprehensive Annual Financial Report, Year Ended June 30, 2008
Because current contributions are used to make benefit payments, the fund does not retain the accumulated contributions of active members. The cumulative contributions of all currently active members since inception were approximately $172.8 million at June 30, 2008, which exceeded Net Assets Held in Trust for Pension Benefits by approximately $153.5 million at June 30, 2008.
JRF II
Actuarial valuations for the JRF II are required to be carried out annually. The legislated State contribution rate will be adjusted periodically as part of the annual Budget Act in order to maintain or restore the actuarial soundness of the fund. The last actuarial valuation was performed as of June 30, 2007.
For the year ending June 30, 2008, the statutory employer contribution rate was 19.916 percent based on the June 30, 2006 actuarial valuation. Therefore, for the year ended June 30, 2008, the contributions made by the State to the fund were approximately $36.8 million, which is more than the actuarially determined required contributions of approximately $31.7 million.
CERBTF
The actuarial valuations for the CERBTF are conducted by outside actuarial firms engaged by participating employers that must base their valuations on the CalPERS OPEB Assumption Model. This model requires the use of actuarial methods and assumptions similar to those employed for the PERF. An additional assumption used for the CERBTF is the health care cost trend rate. The actuarial valuation estimates the cost of future health and other post-employment benefit insurance premiums for current and retired participating employees.
The total 2008 actual net OPEB employer contribution from 72 participating employers was $786.7 million, compared to the actuarially determined annual required contribution of 8.9 percent of covered payroll, or $450.8 million. This amount includes the $655.0 million in contributions made to the CERBTF, plus another $180.6 million in retiree health care premiums paid by employers directly to providers, implicit rate subsidies, and other GASB 45 compliant costs recognized by employers as contributions
toward the Annual Required Contribution (ARC) and excludes $48.9 million of actual contributions made to the CERBTF that were treated as existing assets for purposes of calculating the annual required contribution.
CERBTF calculations are based upon plan benefi ts defi ned by the Public Employees Hospital Care Act (PEMHCA) in effect at the time of the valuations. The projection of benefi ts for fi nancial reporting purposes does not explicitly incorporate the potential effects of legal or contractual funding limitations on the pattern of future employer and employee cost sharing.
6. Commitments
At June 30, 2008, CalPERS total capital commitments to private equity funds was $57.7 billion. Of this amount, $26.4 billion remained unfunded and is not recorded on the CalPERS Statement of Fiduciary Net Assets.
At June 30, 2008, CalPERS total commitments to real estate portfolios was $29.6 billion. Of this amount, $17.1 billion remained unfunded and is not recorded on the CalPERS Statement of Fiduciary Net Assets.
7. Contingencies
CalPERS has entered into agreements with a number of issuers of non-taxable debt to provide payment of principal and interest in the event of non-payment. CalPERS is paid a quarterly fee over the term of the agreement for each transaction. The majority of the transactions are supported by collateral, letters of credit from banks or bond insurers for repayment. As of June 30, 2008, the credit enhancement program had contingent liabilities of approximately $1.7 billion and net fee income of approximately $2.4 million.
CalPERS is a defendant in litigation involving individual benefi t payment and participant eligibility issues and arising from its normal activities. In the event of an adverse decision, any payments awarded by the courts would be recovered by CalPERS through prospective adjustments to the employer contribution rate. Based upon consultation with legal counsel, management believes there will be no material adverse effect on the basic fi nancial statements as a result of the ultimate outcome of these matters.
Notes to the Basic Financial Statements (continued)
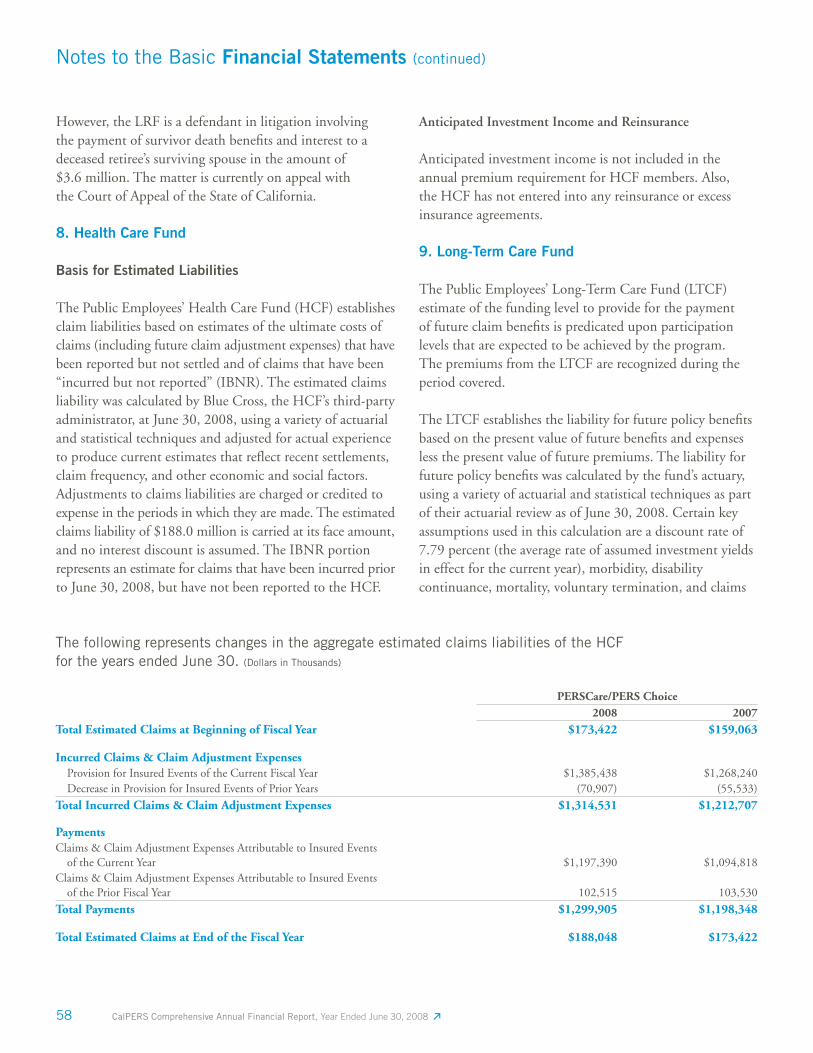
58 CalPERS Comprehensive Annual Financial Report, Year Ended June 30, 2008
Notes to the Basic Financial Statements (continued)
However, the LRF is a defendant in litigation involving the payment of survivor death benefi ts and interest to a deceased retiree’s surviving spouse in the amount of $3.6 million. The matter is currently on appeal with the Court of Appeal of the State of California.
8. Health Care Fund
Basis for Estimated Liabilities
The Public Employees’ Health Care Fund (HCF) establishes claim liabilities based on estimates of the ultimate costs of claims (including future claim adjustment expenses) that have been reported but not settled and of claims that have been “incurred but not reported” (IBNR). The estimated claims liability was calculated by Blue Cross, the HCF’s third-party administrator, at June 30, 2008, using a variety of actuarial and statistical techniques and adjusted for actual experience to produce current estimates that reflect recent settlements, claim frequency, and other economic and social factors. Adjustments to claims liabilities are charged or credited to expense in the periods in which they are made. The estimated claims liability of $188.0 million is carried at its face amount, and no interest discount is assumed. The IBNR portion represents an estimate for claims that have been incurred prior to June 30, 2008, but have not been reported to the HCF.
Anticipated Investment Income and Reinsurance
Anticipated investment income is not included in the annual premium requirement for HCF members. Also, the HCF has not entered into any reinsurance or excess insurance agreements.
9. Long-Term Care Fund
The Public Employees’ Long-Term Care Fund (LTCF) estimate of the funding level to provide for the payment of future claim benefi ts is predicated upon participation levels that are expected to be achieved by the program. The premiums from the LTCF are recognized during the period covered.
The LTCF establishes the liability for future policy benefi ts based on the present value of future benefi ts and expenses less the present value of future premiums. The liability for future policy benefi ts was calculated by the fund’s actuary, using a variety of actuarial and statistical techniques as part of their actuarial review as of June 30, 2008. Certain key assumptions used in this calculation are a discount rate of 7.79 percent (the average rate of assumed investment yields in effect for the current year), morbidity, disability continuance, mortality, voluntary termination, and claims
The following represents changes in the aggregate estimated claims liabilities of the HCF for the years ended June 30. (Dollars in Thousands)
PERSCare/PERS Choice2008 2007
Total Estimated Claims at Beginning of Fiscal Year $173,422 $159,063
Incurred Claims & Claim Adjustment Expenses Provision for Insured Events of the Current Fiscal Year $1,385,438 $1,268,240 Decrease in Provision for Insured Events of Prior Years (70,907) (55,533)
Total Incurred Claims & Claim Adjustment Expenses $1,314,531 $1,212,707
PaymentsClaims & Claim Adjustment Expenses Attributable to Insured Events of the Current Year $1,197,390 $1,094,818Claims & Claim Adjustment Expenses Attributable to Insured Events of the Prior Fiscal Year 102,515 103,530
Total Payments $1,299,905 $1,198,348
Total Estimated Claims at End of the Fiscal Year $188,048 $173,422
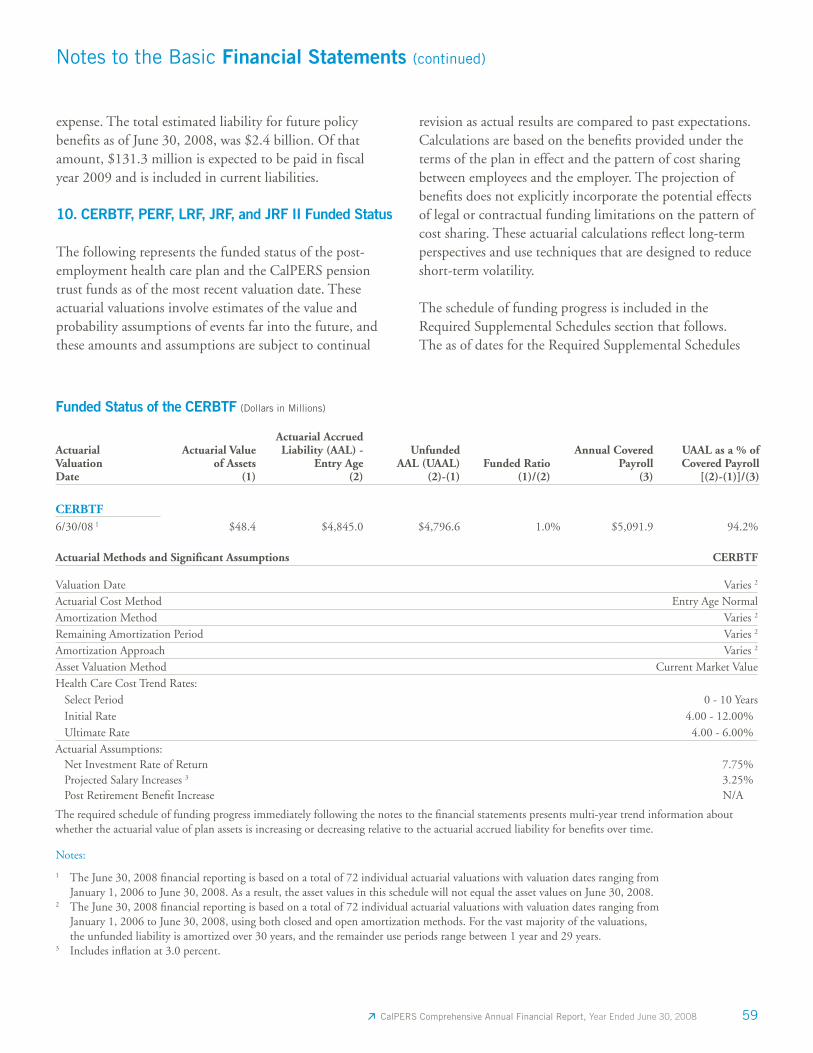
59 CalPERS Comprehensive Annual Financial Report, Year Ended June 30, 2008
Notes to the Basic Financial Statements (continued)
Funded Status of the CERBTF (Dollars in Millions)
Actuarial Valuation Date
Actuarial Value
of Assets(1)
Actuarial Accrued Liability (AAL) -
Entry Age(2)
Unfunded AAL (UAAL)
(2)-(1)
Funded Ratio
(1)/(2)
Annual Covered
Payroll(3)
UAAL as a % of
Covered Payroll[(2)-(1)]/(3)
CERBTF6/30/08 1 $48.4 $4,845.0 $4,796.6 1.0% $5,091.9 94.2%
expense. The total estimated liability for future policy benefits as of June 30, 2008, was $2.4 billion. Of that amount, $131.3 million is expected to be paid in fiscal year 2009 and is included in current liabilities.
10. CERBTF, PERF, LRF, JRF, and JRF II Funded Status
The following represents the funded status of the post-employment health care plan and the CalPERS pension trust funds as of the most recent valuation date. These actuarial valuations involve estimates of the value and probability assumptions of events far into the future, and these amounts and assumptions are subject to continual
Actuarial Methods and Signifi cant Assumptions CERBTF
Valuation Date Varies 2
Actuarial Cost Method Entry Age NormalAmortization Method Varies 2
Remaining Amortization Period Varies 2
Amortization Approach Varies 2 Asset Valuation Method Current Market ValueHealth Care Cost Trend Rates: Select Period 0 - 10 Years Initial Rate 4.00 - 12.00% Ultimate Rate 4.00 - 6.00% Actuarial Assumptions: Net Investment Rate of Return 7.75% Projected Salary Increases 3 3.25% Post Retirement Benefi t Increase N/A
The required schedule of funding progress immediately following the notes to the fi nancial statements presents multi-year trend information about whether the actuarial value of plan assets is increasing or decreasing relative to the actuarial accrued liability for benefi ts over time.
revision as actual results are compared to past expectations. Calculations are based on the benefi ts provided under the terms of the plan in effect and the pattern of cost sharing between employees and the employer. The projection of benefi ts does not explicitly incorporate the potential effects of legal or contractual funding limitations on the pattern of cost sharing. These actuarial calculations refl ect long-term perspectives and use techniques that are designed to reduce short-term volatility.
The schedule of funding progress is included in the Required Supplemental Schedules section that follows. The as of dates for the Required Supplemental Schedules
Notes:
1 The June 30, 2008 fi nancial reporting is based on a total of 72 individual actuarial valuations with valuation dates ranging from January 1, 2006 to June 30, 2008. As a result, the asset values in this schedule will not equal the asset values on June 30, 2008.
2 The June 30, 2008 fi nancial reporting is based on a total of 72 individual actuarial valuations with valuation dates ranging from January 1, 2006 to June 30, 2008, using both closed and open amortization methods. For the vast majority of the valuations, the unfunded liability is amortized over 30 years, and the remainder use periods range between 1 year and 29 years.
3 Includes infl ation at 3.0 percent.
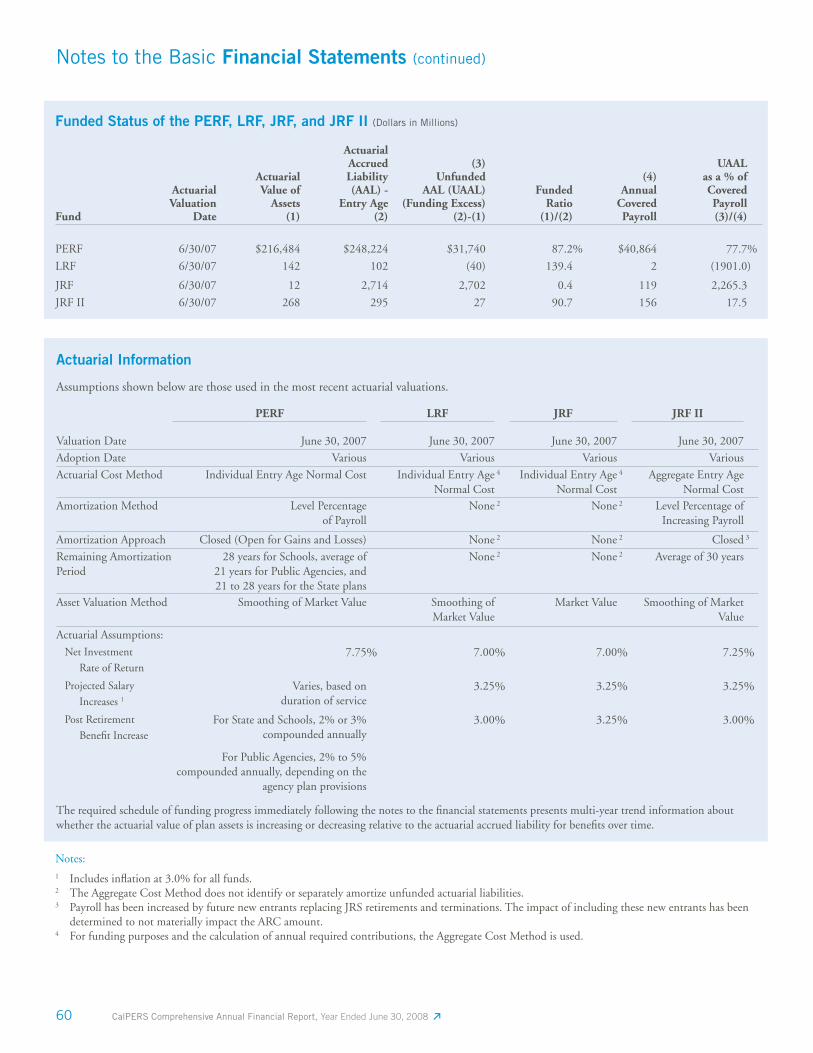
60 CalPERS Comprehensive Annual Financial Report, Year Ended June 30, 2008
Notes to the Basic Financial Statements (continued)
Funded Status of the PERF, LRF, JRF, and JRF II (Dollars in Millions)
Fund
Actuarial Valuation
Date
Actuarial Value of
Assets(1)
Actuarial Accrued Liability (AAL) -
Entry Age(2)
(3)Unfunded
AAL (UAAL)(Funding Excess)
(2)-(1)
Funded Ratio
(1)/(2)
(4) Annual
Covered Payroll
UAAL as a % of Covered
Payroll(3)/(4)
PERF 6/30/07 $216,484 $248,224 $31,740 87.2% $40,864 77.7%
LRF 6/30/07 142 102 (40) 139.4 2 (1901.0)
JRF 6/30/07 12 2,714 2,702 0.4 119 2,265.3
JRF II 6/30/07 268 295 27 90.7 156 17.5
Actuarial Information
Assumptions shown below are those used in the most recent actuarial valuations.
PERF LRF JRF JRF II
Valuation Date June 30, 2007 June 30, 2007 June 30, 2007 June 30, 2007
Adoption Date Various Various Various Various
Actuarial Cost Method Individual Entry Age Normal Cost Individual Entry Age Normal Cost
4 Individual Entry Age Normal Cost
4 Aggregate Entry Age Normal Cost
Amortization Method Level Percentageof Payroll
None 2 None 2 Level Percentage of Increasing Payroll
Amortization Approach Closed (Open for Gains and Losses) None 2 None 2 Closed 3
Remaining Amortization Period
28 years for Schools, average of 21 years for Public Agencies, and 21 to 28 years for the State plans
None 2 None 2 Average of 30 years
Asset Valuation Method Smoothing of Market Value Smoothing of Market Value
Market Value Smoothing of Market Value
Actuarial Assumptions:
Net Investment
Rate of Return7.75% 7.00% 7.00% 7.25%
Projected Salary
Increases 1
Varies, based on duration of service
3.25% 3.25% 3.25%
Post Retirement
Benefi t IncreaseFor State and Schools, 2% or 3%
compounded annually
For Public Agencies, 2% to 5% compounded annually, depending on the
agency plan provisions
3.00% 3.25% 3.00%
The required schedule of funding progress immediately following the notes to the fi nancial statements presents multi-year trend information about whether the actuarial value of plan assets is increasing or decreasing relative to the actuarial accrued liability for benefi ts over time.
Notes:1 Includes infl ation at 3.0% for all funds.2 The Aggregate Cost Method does not identify or separately amortize unfunded actuarial liabilities.3 Payroll has been increased by future new entrants replacing JRS retirements and terminations. The impact of including these new entrants has been
determined to not materially impact the ARC amount.4 For funding purposes and the calculation of annual required contributions, the Aggregate Cost Method is used.
61 CalPERS Comprehensive Annual Financial Report, Year Ended June 30, 2008
Notes to the Basic Financial Statements (continued)
of Employer Contributions were June 30, 2006, for PERF State and Schools, LRF, JRF, and JRF II; and June 30, 2005, for the PERF Public Agencies.
11. Subsequent Events
Subsequent to the June 30 fi scal year end, the fi nancial markets continued to experience high volatility with an outcome that negatively affected all asset classes. As of October 31, 2008, the Public Employees’ Retirement Fund (PERF) investment portfolio, excluding securities lending collateral, had declined by an estimated $50.4 billion in value to $186.7 billion based on net of fees reporting by State Street Bank. The most signifi cant decline was in the domestic and international public equity portfolios. These portfolios declined $40.5 billion or 33.0 percent during this period. The privately held investments, due to their less frequent valuation cycles, experienced smaller declines.
CalPERS had exposure to fi nancial institutions that were either acquired by another institution, the U.S. Government, or fi led for bankruptcy during this period. CalPERS continually monitors the value of its investments that are involved in these transactions, however, the fi nal value is not certain until the bankruptcy process or
acquisition has been completed. After June 30, the more noteworthy equity and debt holdings that declined in value were American International Group (AIG), Fannie Mae, Freddie Mac, Lehman Brothers, and Washington Mutual. CalPERS holdings in these fi ve fi rms decreased approximately $1.7 billion.
In addition, CalPERS Real Estate Program continued to experience declines due to overall market conditions and negative returns in the Housing Program. These declines were driven by a combination of a slowdown in absorption/sales of new homes, and value declines resulting from the annual independent appraisal process.
The overall risk profi le of the PERF has remained unchanged since June 30, 2008, and the volatility of the investment portfolio remains in line with the overall fi nancial markets. The global capital markets are highly dynamic and the value of the PERF changes every day. CalPERS continues to rely on the long-held investment philosophy of diversifi cation and the search for long-term value. Up-to-date investment portfolio information is published monthly as part of the Investment Committee agenda. Please visit www.calpers.ca.gov for more information.

62 CalPERS Comprehensive Annual Financial Report, Year Ended June 30, 2008

Financial Section Required Supplemental Schedules
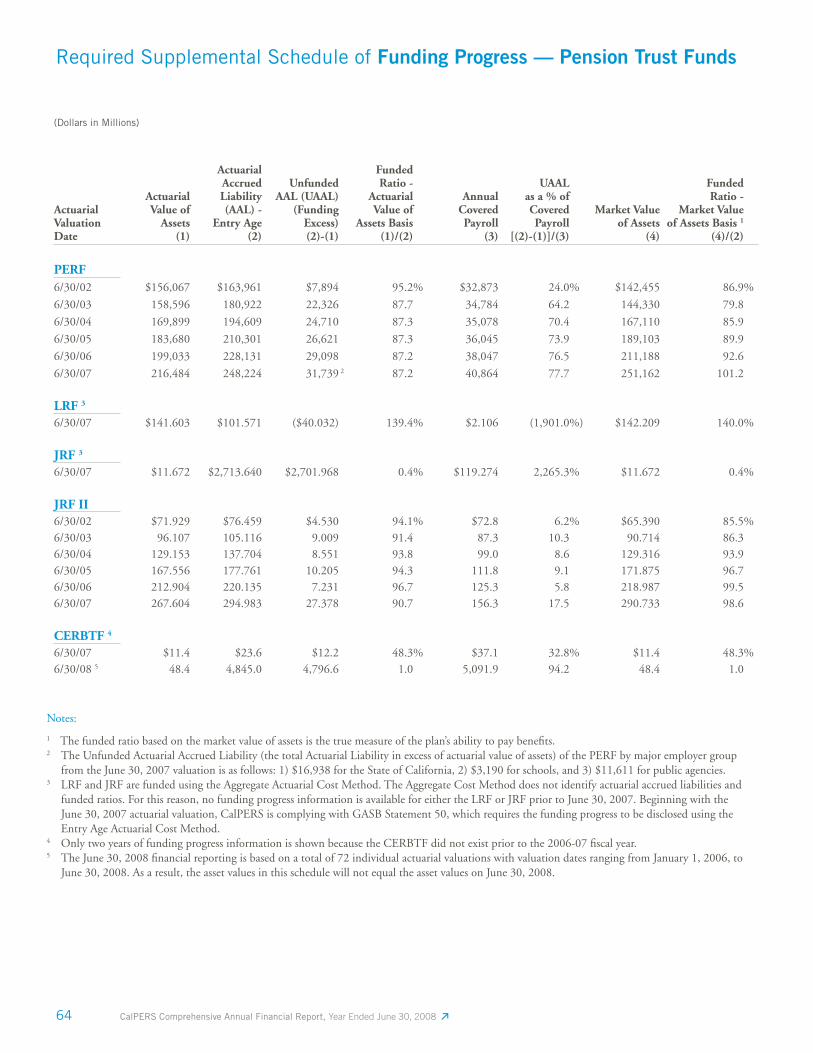
64 CalPERS Comprehensive Annual Financial Report, Year Ended June 30, 2008
Required Supplemental Schedule of Funding Progress — Pension Trust Funds
(Dollars in Millions)
Actuarial Valuation Date
Actuarial Value of
Assets(1)
Actuarial Accrued Liability (AAL) -
Entry Age(2)
Unfunded AAL (UAAL)
(Funding Excess) (2)-(1)
Funded Ratio -
Actuarial Value of
Assets Basis (1)/(2)
Annual
Covered Payroll
(3)
UAAL
as a % of Covered
Payroll[(2)-(1)]/(3)
Market Valueof Assets
(4)
Funded Ratio -
Market Value of Assets Basis 1
(4)/(2)
PERF6/30/02 $156,067 $163,961 $7,894 95.2% $32,873 24.0% $142,455 86.9%
6/30/03 158,596 180,922 22,326 87.7 34,784 64.2 144,330 79.8
6/30/04 169,899 194,609 24,710 87.3 35,078 70.4 167,110 85.9
6/30/05 183,680 210,301 26,621 87.3 36,045 73.9 189,103 89.9
6/30/06 199,033 228,131 29,098 87.2 38,047 76.5 211,188 92.6
6/30/07 216,484 248,224 31,739 2 87.2 40,864 77.7 251,162 101.2
LRF 3
6/30/07 $141.603 $101.571 ($40.032) 139.4% $2.106 (1,901.0%) $142.209 140.0%
JRF 3
6/30/07 $11.672 $2,713.640 $2,701.968 0.4% $119.274 2,265.3% $11.672 0.4%
JRF II6/30/02 $71.929 $76.459 $4.530 94.1% $72.8 6.2% $65.390 85.5%6/30/03 96.107 105.116 9.009 91.4 87.3 10.3 90.714 86.36/30/04 129.153 137.704 8.551 93.8 99.0 8.6 129.316 93.96/30/05 167.556 177.761 10.205 94.3 111.8 9.1 171.875 96.76/30/06 212.904 220.135 7.231 96.7 125.3 5.8 218.987 99.56/30/07 267.604 294.983 27.378 90.7 156.3 17.5 290.733 98.6
CERBTF 4
6/30/07 $11.4 $23.6 $12.2 48.3% $37.1 32.8% $11.4 48.3%6/30/08 5 48.4 4,845.0 4,796.6 1.0 5,091.9 94.2 48.4 1.0
Notes:
1 The funded ratio based on the market value of assets is the true measure of the plan’s ability to pay benefi ts.2 The Unfunded Actuarial Accrued Liability (the total Actuarial Liability in excess of actuarial value of assets) of the PERF by major employer group
from the June 30, 2007 valuation is as follows: 1) $16,938 for the State of California, 2) $3,190 for schools, and 3) $11,611 for public agencies.3 LRF and JRF are funded using the Aggregate Actuarial Cost Method. The Aggregate Cost Method does not identify actuarial accrued liabilities and
funded ratios. For this reason, no funding progress information is available for either the LRF or JRF prior to June 30, 2007. Beginning with the June 30, 2007 actuarial valuation, CalPERS is complying with GASB Statement 50, which requires the funding progress to be disclosed using the Entry Age Actuarial Cost Method.
4 Only two years of funding progress information is shown because the CERBTF did not exist prior to the 2006-07 fi scal year.5 The June 30, 2008 fi nancial reporting is based on a total of 72 individual actuarial valuations with valuation dates ranging from January 1, 2006, to
June 30, 2008. As a result, the asset values in this schedule will not equal the asset values on June 30, 2008.
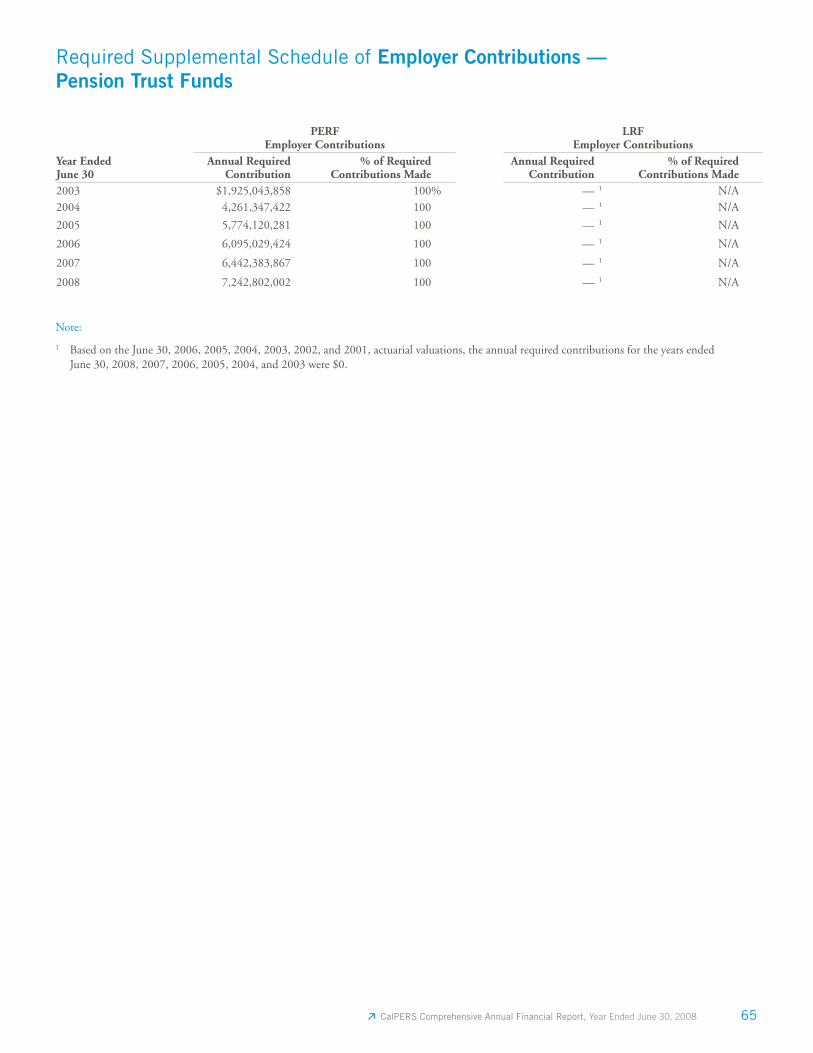
65 CalPERS Comprehensive Annual Financial Report, Year Ended June 30, 2008
Required Supplemental Schedule of Employer Contributions — Pension Trust Funds
PERFEmployer Contributions
LRFEmployer Contributions
Year Ended June 30
Annual RequiredContribution
% of Required Contributions Made
Annual RequiredContribution
% of RequiredContributions Made
2003 $1,925,043,858 100% — 1 N/A2004 4,261,347,422 100 — 1 N/A
2005 5,774,120,281 100 — 1 N/A
2006 6,095,029,424 100 — 1 N/A
2007 6,442,383,867 100 — 1 N/A
2008 7,242,802,002 100 — 1 N/A
Note:
1 Based on the June 30, 2006, 2005, 2004, 2003, 2002, and 2001, actuarial valuations, the annual required contributions for the years ended June 30, 2008, 2007, 2006, 2005, 2004, and 2003 were $0.
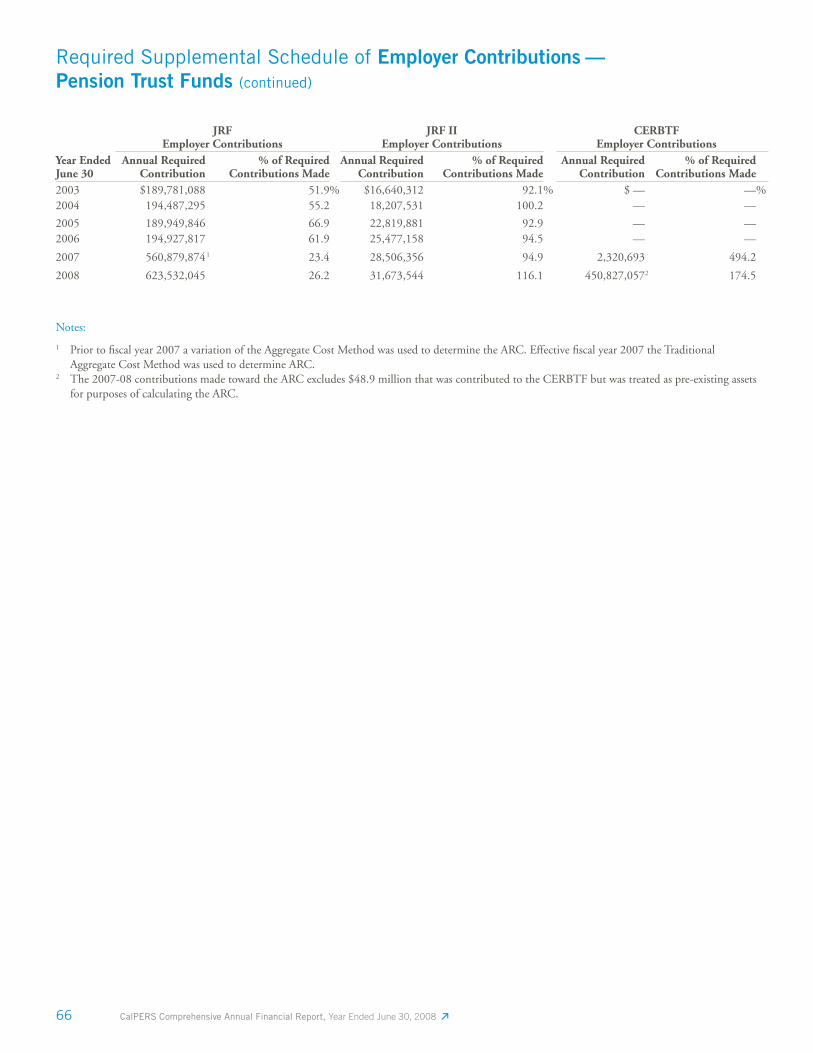
66 CalPERS Comprehensive Annual Financial Report, Year Ended June 30, 2008
Required Supplemental Schedule of Employer Contributions — Pension Trust Funds (continued)
JRF Employer Contributions
JRF IIEmployer Contributions
CERBTFEmployer Contributions
Year Ended June 30
Annual Required Contribution
% of Required Contributions Made
Annual Required Contribution
% of Required Contributions Made
Annual RequiredContribution
% of Required Contributions Made
2003 $189,781,088 51.9% $16,640,312 92.1% $ — —%2004 194,487,295 55.2 18,207,531 100.2 — —
2005 189,949,846 66.9 22,819,881 92.9 — —2006 194,927,817 61.9 25,477,158 94.5 — —
2007 560,879,874 1 23.4 28,506,356 94.9 2,320,693 494.2
2008 623,532,045 26.2 31,673,544 116.1 450,827,0572 174.5
Notes:
1 Prior to fi scal year 2007 a variation of the Aggregate Cost Method was used to determine the ARC. Effective fi scal year 2007 the Traditional Aggregate Cost Method was used to determine ARC.
2 The 2007-08 contributions made toward the ARC excludes $48.9 million that was contributed to the CERBTF but was treated as pre-existing assets for purposes of calculating the ARC.
67 CalPERS Comprehensive Annual Financial Report, Year Ended June 30, 2008
Required Supplemental Schedule of Claims Development Information
The table on the next page presents the Health Care Fund’s (HCF) earned revenues and investment income as well as losses and other expenses over the last 10 years. Rows one through six contain the following information:
1) This line shows the total earned premium revenues and investment revenues for each fi scal year.
2) This line shows other HCF operating costs, including overhead and claims expense not allocable to individual claims, for each fi scal year.
3) This line shows the HCF’s incurred claims and allocated claim adjustment expenses (both paid and accrued) as reported at the end of the policy year. The policy year is the fi rst year in which the triggering event under the contract occurred.
4) This section shows the cumulative amounts paid as of the end of each policy year and years succeeding the policy year.
5) This section shows re-estimated incurred claims as of the end of each policy year and years succeeding the policy year. Re-estimates are based on new information received on known claims, as well as information on new claims not previously reported.
6) This line compares the amount of the re-estimated incurred claims to the amount initially established (line 3), and shows whether the re-estimate is greater or less than projected. As data mature for individual policy years, the correlation between initial estimates and re-estimates is used to evaluate the accuracy of incurred claims currently recognized.
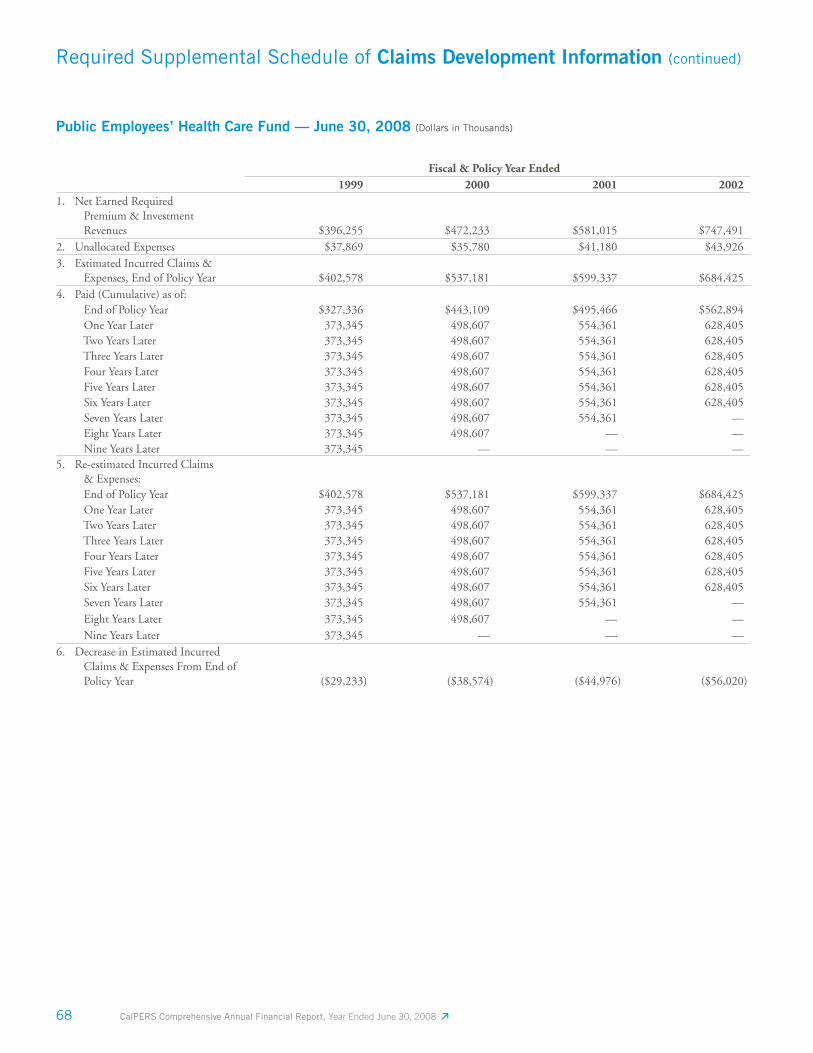
68 CalPERS Comprehensive Annual Financial Report, Year Ended June 30, 2008
Required Supplemental Schedule of Claims Development Information (continued)
Public Employees’ Health Care Fund — June 30, 2008 (Dollars in Thousands)
Fiscal & Policy Year Ended1999 2000 2001 2002
1. Net Earned Required Premium & Investment Revenues $396,255 $472,233 $581,015 $747,4912. Unallocated Expenses $37,869 $35,780 $41,180 $43,9263. Estimated Incurred Claims & Expenses, End of Policy Year $402,578 $537,181 $599,337 $684,4254. Paid (Cumulative) as of:
End of Policy Year $327,336 $443,109 $495,466 $562,894 One Year Later 373,345 498,607 554,361 628,405 Two Years Later 373,345 498,607 554,361 628,405 Three Years Later 373,345 498,607 554,361 628,405 Four Years Later 373,345 498,607 554,361 628,405 Five Years Later 373,345 498,607 554,361 628,405 Six Years Later 373,345 498,607 554,361 628,405 Seven Years Later 373,345 498,607 554,361 — Eight Years Later 373,345 498,607 — — Nine Years Later 373,345 — — —
5. Re-estimated Incurred Claims & Expenses:
End of Policy Year $402,578 $537,181 $599,337 $684,425 One Year Later 373,345 498,607 554,361 628,405 Two Years Later 373,345 498,607 554,361 628,405 Three Years Later 373,345 498,607 554,361 628,405 Four Years Later 373,345 498,607 554,361 628,405 Five Years Later 373,345 498,607 554,361 628,405 Six Years Later 373,345 498,607 554,361 628,405 Seven Years Later 373,345 498,607 554,361 — Eight Years Later 373,345 498,607 — — Nine Years Later 373,345 — — —
6. Decrease in Estimated Incurred Claims & Expenses From End of Policy Year ($29,233) ($38,574) ($44,976) ($56,020)
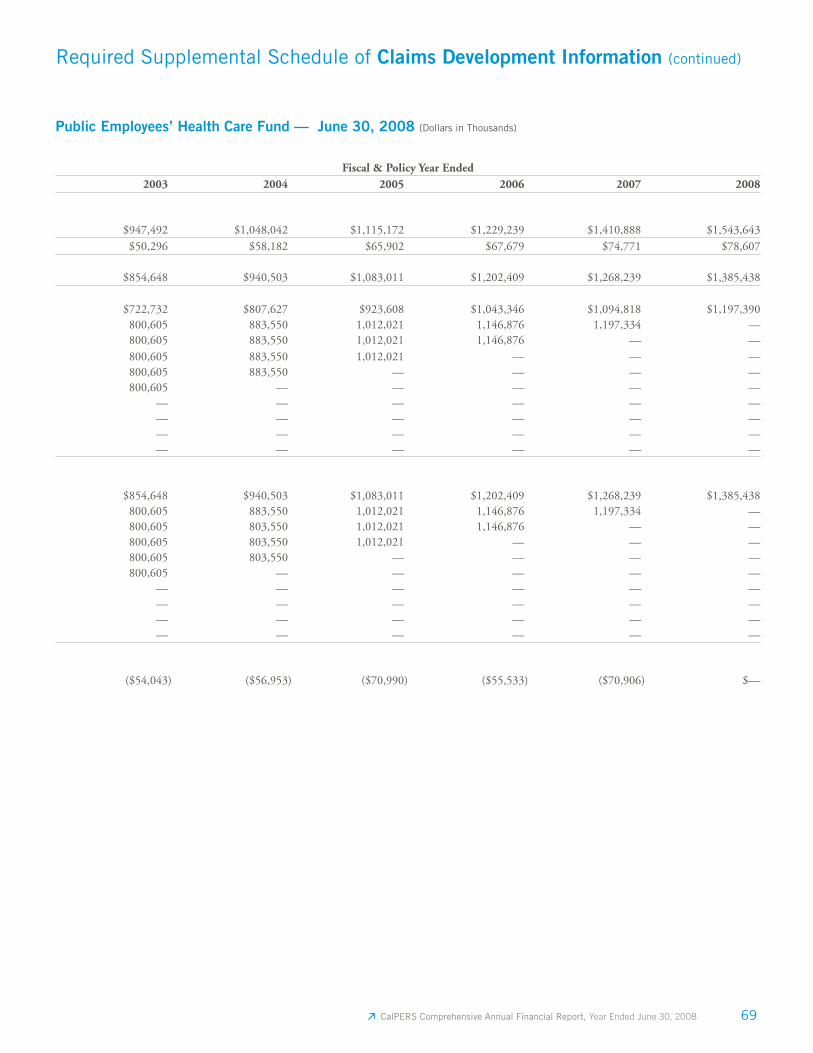
69 CalPERS Comprehensive Annual Financial Report, Year Ended June 30, 2008
Required Supplemental Schedule of Claims Development Information (continued)
Public Employees’ Health Care Fund — June 30, 2008 (Dollars in Thousands)
Fiscal & Policy Year Ended2003 2004 2005 2006 2007 2008
$947,492 $1,048,042 $1,115,172 $1,229,239 $1,410,888 $1,543,643$50,296 $58,182 $65,902 $67,679 $74,771 $78,607
$854,648 $940,503 $1,083,011 $1,202,409 $1,268,239 $1,385,438
$722,732 $807,627 $923,608 $1,043,346 $1,094,818 $1,197,390800,605 883,550 1,012,021 1,146,876 1,197,334 —800,605 883,550 1,012,021 1,146,876 — —800,605 883,550 1,012,021 — — —800,605 883,550 — — — —800,605 — — — — —
— — — — — —— — — — — —— — — — — —— — — — — —
$854,648 $940,503 $1,083,011 $1,202,409 $1,268,239 $1,385,438800,605 883,550 1,012,021 1,146,876 1,197,334 —800,605 803,550 1,012,021 1,146,876 — —800,605 803,550 1,012,021 — — —800,605 803,550 — — — —800,605 — — — — —
— — — — — —— — — — — —— — — — — —— — — — — —
($54,043 ) ($56,953) ($70,990) ($55,533) ($70,906 ) $—

70 CalPERS Comprehensive Annual Financial Report, Year Ended June 30, 2008

Financial Section Supporting Schedules and Agency Funds
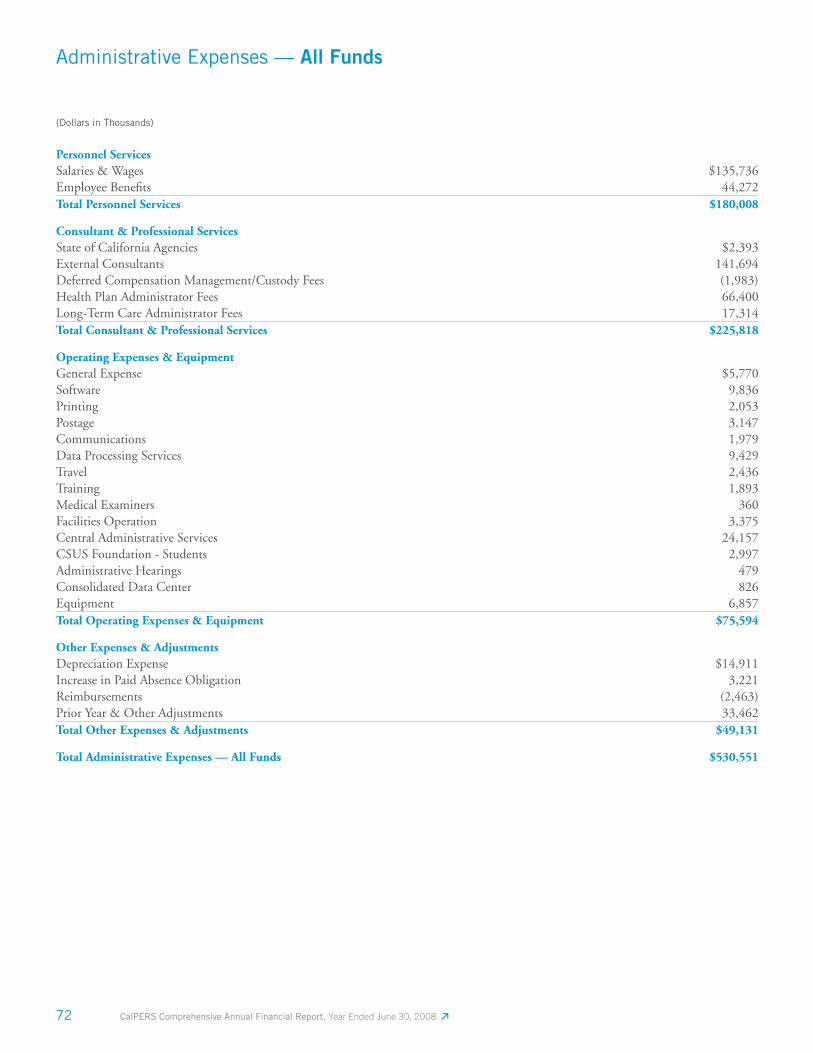
72 CalPERS Comprehensive Annual Financial Report, Year Ended June 30, 2008
Administrative Expenses — All Funds
(Dollars in Thousands)
Personnel ServicesSalaries & Wages $135,736Employee Benefi ts 44,272Total Personnel Services $180,008
Consultant & Professional ServicesState of California Agencies $2,393External Consultants 141,694Deferred Compensation Management/Custody Fees (1,983)Health Plan Administrator Fees 66,400Long-Term Care Administrator Fees 17,314Total Consultant & Professional Services $225,818
Operating Expenses & EquipmentGeneral Expense $5,770Software 9,836Printing 2,053Postage 3,147Communications 1,979Data Processing Services 9,429Travel 2,436Training 1,893Medical Examiners 360Facilities Operation 3,375Central Administrative Services 24,157CSUS Foundation - Students 2,997Administrative Hearings 479Consolidated Data Center 826Equipment 6,857Total Operating Expenses & Equipment $75,594
Other Expenses & AdjustmentsDepreciation Expense $14,911Increase in Paid Absence Obligation 3,221Reimbursements (2,463)Prior Year & Other Adjustments 33,462Total Other Expenses & Adjustments $49,131
Total Administrative Expenses — All Funds $530,551
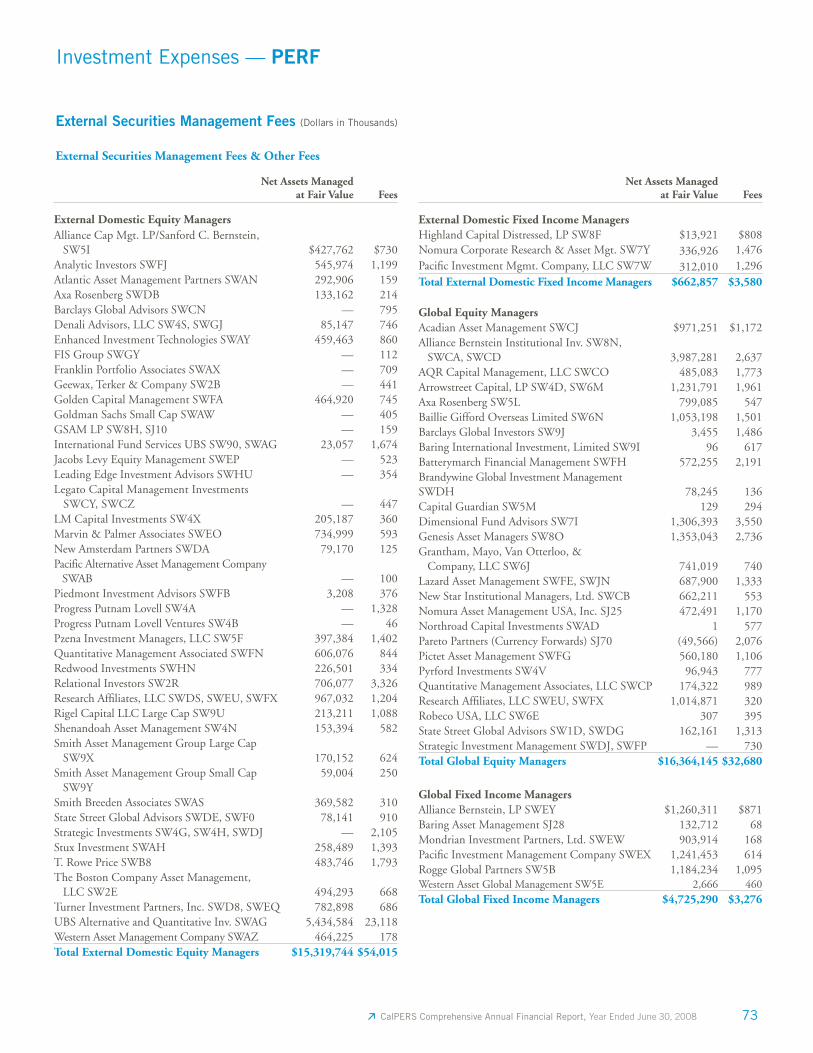
73 CalPERS Comprehensive Annual Financial Report, Year Ended June 30, 2008
Investment Expenses — PERF
Net Assets Managed at Fair Value Fees
External Domestic Equity ManagersAlliance Cap Mgt. LP/Sanford C. Bernstein, SW5I $427,762 $730Analytic Investors SWFJ 545,974 1,199Atlantic Asset Management Partners SWAN 292,906 159Axa Rosenberg SWDB 133,162 214Barclays Global Advisors SWCN — 795Denali Advisors, LLC SW4S, SWGJ 85,147 746Enhanced Investment Technologies SWAY 459,463 860FIS Group SWGY — 112Franklin Portfolio Associates SWAX — 709Geewax, Terker & Company SW2B — 441Golden Capital Management SWFA 464,920 745Goldman Sachs Small Cap SWAW — 405GSAM LP SW8H, SJ10 — 159International Fund Services UBS SW90, SWAG 23,057 1,674Jacobs Levy Equity Management SWEP — 523Leading Edge Investment Advisors SWHU — 354Legato Capital Management Investments SWCY, SWCZ — 447LM Capital Investments SW4X 205,187 360Marvin & Palmer Associates SWEO 734,999 593New Amsterdam Partners SWDA 79,170 125Pacific Alternative Asset Management Company SWAB — 100Piedmont Investment Advisors SWFB 3,208 376Progress Putnam Lovell SW4A — 1,328Progress Putnam Lovell Ventures SW4B — 46Pzena Investment Managers, LLC SW5F 397,384 1,402Quantitative Management Associated SWFN 606,076 844Redwood Investments SWHN 226,501 334Relational Investors SW2R 706,077 3,326Research Affi liates, LLC SWDS, SWEU, SWFX 967,032 1,204Rigel Capital LLC Large Cap SW9U 213,211 1,088Shenandoah Asset Management SW4N 153,394 582Smith Asset Management Group Large Cap SW9X 170,152 624Smith Asset Management Group Small Cap SW9Y
59,004 250
Smith Breeden Associates SWAS 369,582 310State Street Global Advisors SWDE, SWF0 78,141 910Strategic Investments SW4G, SW4H, SWDJ — 2,105Stux Investment SWAH 258,489 1,393T. Rowe Price SWB8 483,746 1,793The Boston Company Asset Management, LLC SW2E 494,293 668Turner Investment Partners, Inc. SWD8, SWEQ 782,898 686UBS Alternative and Quantitative Inv. SWAG 5,434,584 23,118Western Asset Management Company SWAZ 464,225 178Total External Domestic Equity Managers $15,319,744 $54,015
Net Assets Managed at Fair Value Fees
External Domestic Fixed Income ManagersHighland Capital Distressed, LP SW8F $13,921 $808Nomura Corporate Research & Asset Mgt. SW7Y 336,926 1,476Pacifi c Investment Mgmt. Company, LLC SW7W 312,010 1,296Total External Domestic Fixed Income Managers $662,857 $3,580
Global Equity ManagersAcadian Asset Management SWCJ $971,251 $1,172Alliance Bernstein Institutional Inv. SW8N, SWCA, SWCD 3,987,281 2,637AQR Capital Management, LLC SWCO 485,083 1,773Arrowstreet Capital, LP SW4D, SW6M 1,231,791 1,961Axa Rosenberg SW5L 799,085 547Baillie Gifford Overseas Limited SW6N 1,053,198 1,501Barclays Global Investors SW9J 3,455 1,486Baring International Investment, Limited SW9I 96 617Batterymarch Financial Management SWFH 572,255 2,191Brandywine Global Investment Management SWDH 78,245 136Capital Guardian SW5M 129 294Dimensional Fund Advisors SW7I 1,306,393 3,550Genesis Asset Managers SW8O 1,353,043 2,736Grantham, Mayo, Van Otterloo, & Company, LLC SW6J 741,019 740Lazard Asset Management SWFE, SWJN 687,900 1,333New Star Institutional Managers, Ltd. SWCB 662,211 553Nomura Asset Management USA, Inc. SJ25 472,491 1,170Northroad Capital Investments SWAD 1 577Pareto Partners (Currency Forwards) SJ70 (49,566) 2,076Pictet Asset Management SWFG 560,180 1,106Pyrford Investments SW4V 96,943 777Quantitative Management Associates, LLC SWCP 174,322 989Research Affi liates, LLC SWEU, SWFX 1,014,871 320Robeco USA, LLC SW6E 307 395State Street Global Advisors SW1D, SWDG 162,161 1,313Strategic Investment Management SWDJ, SWFP — 730Total Global Equity Managers $16,364,145 $32,680
Global Fixed Income ManagersAlliance Bernstein, LP SWEY $1,260,311 $871 Baring Asset Management SJ28 132,712 68 Mondrian Investment Partners, Ltd. SWEW 903,914 168 Pacifi c Investment Management Company SWEX 1,241,453 614 Rogge Global Partners SW5B 1,184,234 1,095 Western Asset Global Management SW5E 2,666 460 Total Global Fixed Income Managers $4,725,290 $3,276
External Securities Management Fees (Dollars in Thousands)
External Securities Management Fees & Other Fees
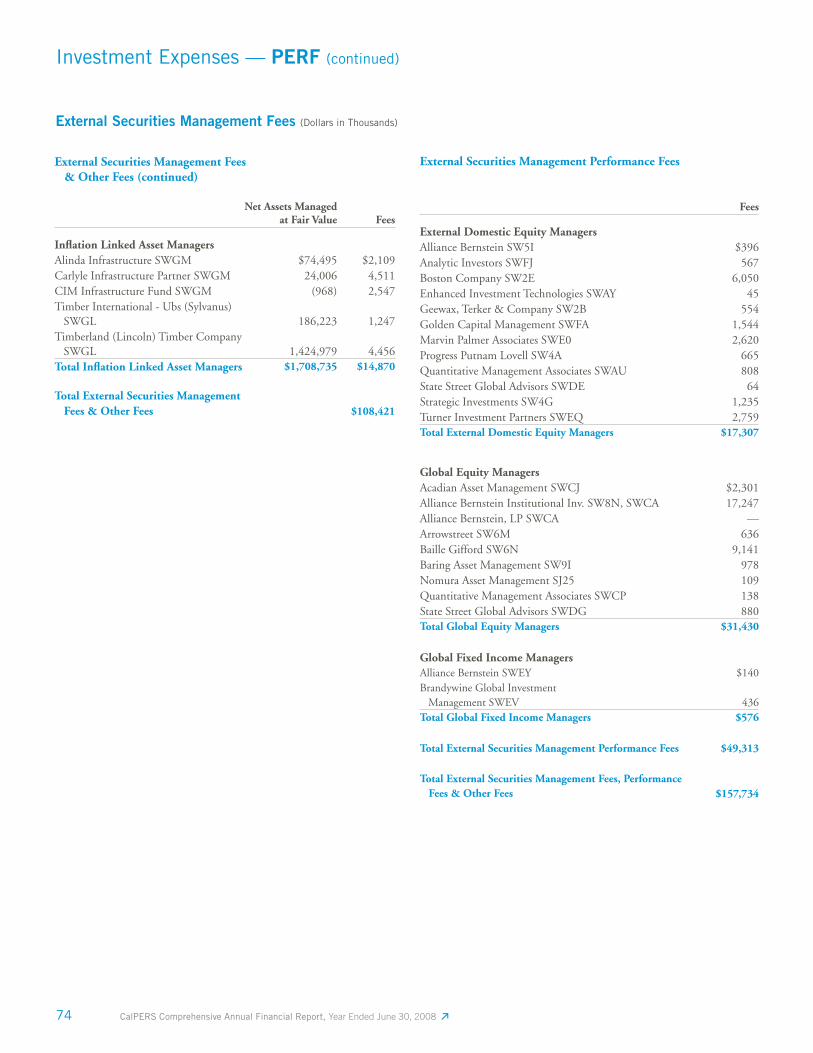
74 CalPERS Comprehensive Annual Financial Report, Year Ended June 30, 2008
Investment Expenses — PERF (continued)
External Securities Management Fees (Dollars in Thousands)
External Securities Management Performance Fees
Fees
External Domestic Equity ManagersAlliance Bernstein SW5I $396 Analytic Investors SWFJ 567 Boston Company SW2E 6,050 Enhanced Investment Technologies SWAY 45 Geewax, Terker & Company SW2B 554 Golden Capital Management SWFA 1,544 Marvin Palmer Associates SWE0 2,620 Progress Putnam Lovell SW4A 665 Quantitative Management Associates SWAU 808 State Street Global Advisors SWDE 64 Strategic Investments SW4G 1,235 Turner Investment Partners SWEQ 2,759 Total External Domestic Equity Managers $17,307
Global Equity ManagersAcadian Asset Management SWCJ $2,301 Alliance Bernstein Institutional Inv. SW8N, SWCA 17,247 Alliance Bernstein, LP SWCA —Arrowstreet SW6M 636 Baille Gifford SW6N 9,141 Baring Asset Management SW9I 978 Nomura Asset Management SJ25 109 Quantitative Management Associates SWCP 138 State Street Global Advisors SWDG 880 Total Global Equity Managers $31,430
Global Fixed Income ManagersAlliance Bernstein SWEY $140 Brandywine Global Investment Management SWEV 436 Total Global Fixed Income Managers $576
Total External Securities Management Performance Fees $49,313
Total External Securities Management Fees, Performance Fees & Other Fees $157,734
External Securities Management Fees & Other Fees (continued)
Net Assets Managed at Fair Value Fees
Infl ation Linked Asset ManagersAlinda Infrastructure SWGM $74,495 $2,109 Carlyle Infrastructure Partner SWGM 24,006 4,511 CIM Infrastructure Fund SWGM (968) 2,547 Timber International - Ubs (Sylvanus) SWGL 186,223 1,247 Timberland (Lincoln) Timber Company SWGL 1,424,979 4,456 Total Infl ation Linked Asset Managers $1,708,735 $14,870
Total External Securities Management Fees & Other Fees $108,421
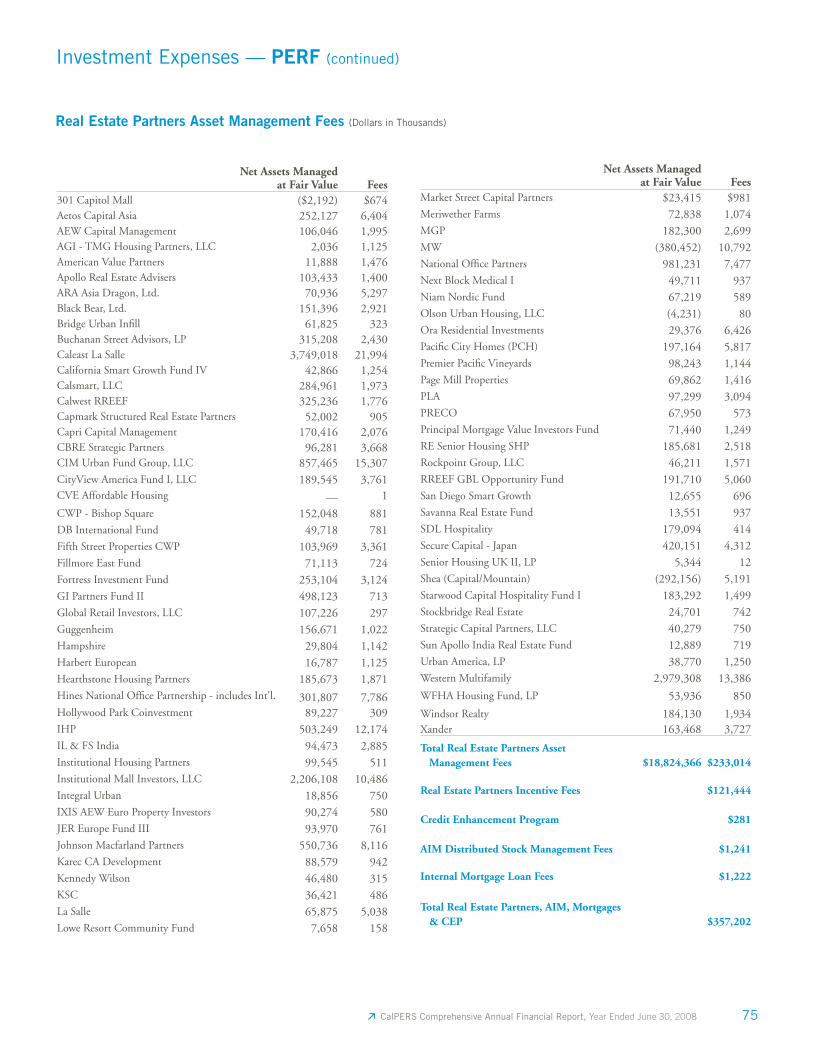
75 CalPERS Comprehensive Annual Financial Report, Year Ended June 30, 2008
Net Assets Managed at Fair Value Fees
301 Capitol Mall ($2,192) $674Aetos Capital Asia 252,127 6,404AEW Capital Management 106,046 1,995AGI - TMG Housing Partners, LLC 2,036 1,125American Value Partners 11,888 1,476Apollo Real Estate Advisers 103,433 1,400ARA Asia Dragon, Ltd. 70,936 5,297Black Bear, Ltd. 151,396 2,921Bridge Urban Infi ll 61,825 323Buchanan Street Advisors, LP 315,208 2,430Caleast La Salle 3,749,018 21,994California Smart Growth Fund IV 42,866 1,254Calsmart, LLC 284,961 1,973Calwest RREEF 325,236 1,776Capmark Structured Real Estate Partners 52,002 905Capri Capital Management 170,416 2,076CBRE Strategic Partners 96,281 3,668CIM Urban Fund Group, LLC 857,465 15,307CityView America Fund I, LLC 189,545 3,761CVE Affordable Housing — 1
CWP - Bishop Square 152,048 881DB International Fund 49,718 781Fifth Street Properties CWP 103,969 3,361Fillmore East Fund 71,113 724Fortress Investment Fund 253,104 3,124GI Partners Fund II 498,123 713Global Retail Investors, LLC 107,226 297Guggenheim 156,671 1,022Hampshire 29,804 1,142Harbert European 16,787 1,125Hearthstone Housing Partners 185,673 1,871Hines National Offi ce Partnership - includes Int'l. 301,807 7,786Hollywood Park Coinvestment 89,227 309IHP 503,249 12,174IL & FS India 94,473 2,885Institutional Housing Partners 99,545 511Institutional Mall Investors, LLC 2,206,108 10,486Integral Urban 18,856 750IXIS AEW Euro Property Investors 90,274 580JER Europe Fund III 93,970 761Johnson Macfarland Partners 550,736 8,116Karec CA Development 88,579 942Kennedy Wilson 46,480 315KSC 36,421 486La Salle 65,875 5,038Lowe Resort Community Fund 7,658 158
Investment Expenses — PERF (continued)
Real Estate Partners Asset Management Fees (Dollars in Thousands)
Net Assets Managed at Fair Value Fees
Market Street Capital Partners $23,415 $981Meriwether Farms 72,838 1,074MGP 182,300 2,699MW (380,452) 10,792National Offi ce Partners 981,231 7,477Next Block Medical I 49,711 937Niam Nordic Fund 67,219 589Olson Urban Housing, LLC (4,231) 80Ora Residential Investments 29,376 6,426Pacifi c City Homes (PCH) 197,164 5,817Premier Pacifi c Vineyards 98,243 1,144Page Mill Properties 69,862 1,416PLA 97,299 3,094PRECO 67,950 573Principal Mortgage Value Investors Fund 71,440 1,249RE Senior Housing SHP 185,681 2,518Rockpoint Group, LLC 46,211 1,571RREEF GBL Opportunity Fund 191,710 5,060San Diego Smart Growth 12,655 696Savanna Real Estate Fund 13,551 937SDL Hospitality 179,094 414Secure Capital - Japan 420,151 4,312Senior Housing UK II, LP 5,344 12Shea (Capital/Mountain) (292,156) 5,191Starwood Capital Hospitality Fund I 183,292 1,499Stockbridge Real Estate 24,701 742Strategic Capital Partners, LLC 40,279 750Sun Apollo India Real Estate Fund 12,889 719Urban America, LP 38,770 1,250Western Multifamily 2,979,308 13,386
WFHA Housing Fund, LP 53,936 850
Windsor Realty 184,130 1,934Xander 163,468 3,727
Total Real Estate Partners Asset Management Fees $18,824,366 $233,014
Real Estate Partners Incentive Fees $121,444
Credit Enhancement Program $281
AIM Distributed Stock Management Fees $1,241
Internal Mortgage Loan Fees $1,222
Total Real Estate Partners, AIM, Mortgages & CEP $357,202
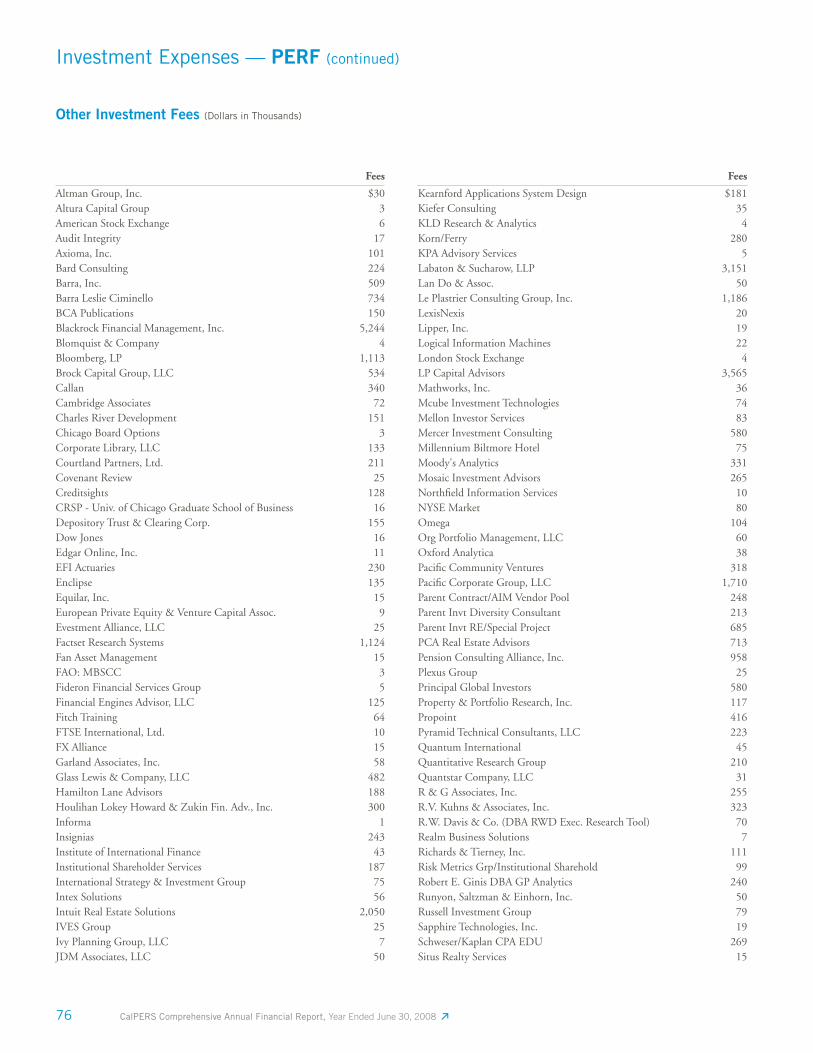
76 CalPERS Comprehensive Annual Financial Report, Year Ended June 30, 2008
Investment Expenses — PERF (continued)
Other Investment Fees (Dollars in Thousands)
Fees
Altman Group, Inc. $30 Altura Capital Group 3 American Stock Exchange 6 Audit Integrity 17 Axioma, Inc. 101 Bard Consulting 224 Barra, Inc. 509 Barra Leslie Ciminello 734 BCA Publications 150 Blackrock Financial Management, Inc. 5,244 Blomquist & Company 4 Bloomberg, LP 1,113 Brock Capital Group, LLC 534 Callan 340 Cambridge Associates 72 Charles River Development 151 Chicago Board Options 3 Corporate Library, LLC 133 Courtland Partners, Ltd. 211 Covenant Review 25 Creditsights 128 CRSP - Univ. of Chicago Graduate School of Business 16 Depository Trust & Clearing Corp. 155 Dow Jones 16 Edgar Online, Inc. 11 EFI Actuaries 230 Enclipse 135 Equilar, Inc. 15 European Private Equity & Venture Capital Assoc. 9 Evestment Alliance, LLC 25 Factset Research Systems 1,124 Fan Asset Management 15 FAO: MBSCC 3 Fideron Financial Services Group 5 Financial Engines Advisor, LLC 125 Fitch Training 64 FTSE International, Ltd. 10 FX Alliance 15 Garland Associates, Inc. 58 Glass Lewis & Company, LLC 482 Hamilton Lane Advisors 188 Houlihan Lokey Howard & Zukin Fin. Adv., Inc. 300 Informa 1 Insignias 243 Institute of International Finance 43 Institutional Shareholder Services 187 International Strategy & Investment Group 75 Intex Solutions 56 Intuit Real Estate Solutions 2,050 IVES Group 25 Ivy Planning Group, LLC 7 JDM Associates, LLC 50
Fees
Kearnford Applications System Design $181 Kiefer Consulting 35 KLD Research & Analytics 4 Korn/Ferry 280 KPA Advisory Services 5 Labaton & Sucharow, LLP 3,151 Lan Do & Assoc. 50 Le Plastrier Consulting Group, Inc. 1,186 LexisNexis 20 Lipper, Inc. 19 Logical Information Machines 22 London Stock Exchange 4 LP Capital Advisors 3,565 Mathworks, Inc. 36 Mcube Investment Technologies 74 Mellon Investor Services 83 Mercer Investment Consulting 580 Millennium Biltmore Hotel 75 Moody's Analytics 331 Mosaic Investment Advisors 265 Northfi eld Information Services 10 NYSE Market 80 Omega 104 Org Portfolio Management, LLC 60 Oxford Analytica 38 Pacifi c Community Ventures 318 Pacifi c Corporate Group, LLC 1,710 Parent Contract/AIM Vendor Pool 248 Parent Invt Diversity Consultant 213 Parent Invt RE/Special Project 685 PCA Real Estate Advisors 713 Pension Consulting Alliance, Inc. 958 Plexus Group 25 Principal Global Investors 580 Property & Portfolio Research, Inc. 117 Propoint 416 Pyramid Technical Consultants, LLC 223 Quantum International 45 Quantitative Research Group 210 Quantstar Company, LLC 31 R & G Associates, Inc. 255 R.V. Kuhns & Associates, Inc. 323 R.W. Davis & Co. (DBA RWD Exec. Research Tool) 70 Realm Business Solutions 7 Richards & Tierney, Inc. 111 Risk Metrics Grp/Institutional Sharehold 99 Robert E. Ginis DBA GP Analytics 240 Runyon, Saltzman & Einhorn, Inc. 50 Russell Investment Group 79 Sapphire Technologies, Inc. 19 Schweser/Kaplan CPA EDU 269 Situs Realty Services 15
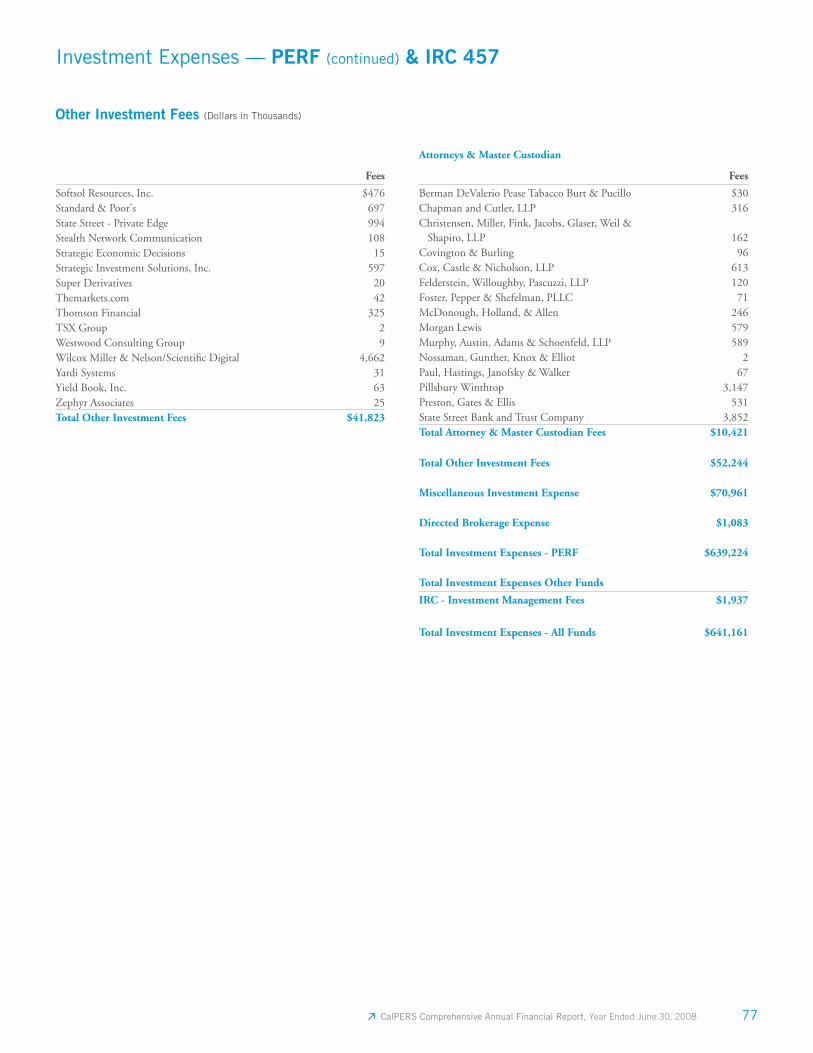
77 CalPERS Comprehensive Annual Financial Report, Year Ended June 30, 2008
Investment Expenses — PERF (continued) & IRC 457
Fees
Softsol Resources, Inc. $476 Standard & Poor's 697 State Street - Private Edge 994 Stealth Network Communication 108 Strategic Economic Decisions 15 Strategic Investment Solutions, Inc. 597 Super Derivatives 20 Themarkets.com 42 Thomson Financial 325 TSX Group 2 Westwood Consulting Group 9 Wilcox Miller & Nelson/Scientifi c Digital 4,662 Yardi Systems 31 Yield Book, Inc. 63 Zephyr Associates 25 Total Other Investment Fees $41,823
Fees
Berman DeValerio Pease Tabacco Burt & Pucillo $30 Chapman and Cutler, LLP 316 Christensen, Miller, Fink, Jacobs, Glaser, Weil & Shapiro, LLP 162Covington & Burling 96 Cox, Castle & Nicholson, LLP 613 Felderstein, Willoughby, Pascuzzi, LLP 120 Foster, Pepper & Shefelman, PLLC 71 McDonough, Holland, & Allen 246 Morgan Lewis 579 Murphy, Austin, Adams & Schoenfeld, LLP 589 Nossaman, Gunther, Knox & Elliot 2 Paul, Hastings, Janofsky & Walker 67 Pillsbury Winthrop 3,147 Preston, Gates & Ellis 531 State Street Bank and Trust Company 3,852 Total Attorney & Master Custodian Fees $10,421
Total Other Investment Fees $52,244
Miscellaneous Investment Expense $70,961
Directed Brokerage Expense $1,083
Total Investment Expenses - PERF $639,224
Total Investment Expenses Other Funds
IRC - Investment Management Fees $1,937
Total Investment Expenses - All Funds $641,161
Other Investment Fees (Dollars in Thousands)
Attorneys & Master Custodian
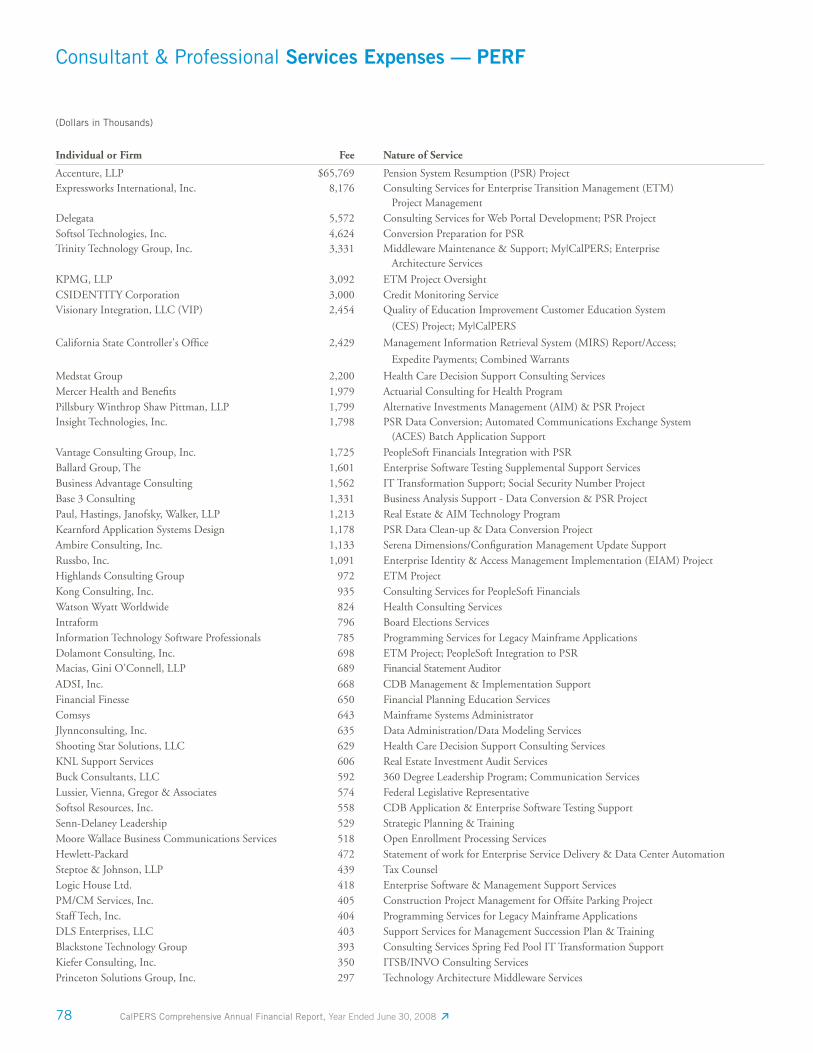
78 CalPERS Comprehensive Annual Financial Report, Year Ended June 30, 2008
Consultant & Professional Services Expenses — PERF
(Dollars in Thousands)
Individual or Firm Fee Nature of Service
Accenture, LLP $65,769 Pension System Resumption (PSR) ProjectExpressworks International, Inc. 8,176 Consulting Services for Enterprise Transition Management (ETM)
Project ManagementDelegata 5,572 Consulting Services for Web Portal Development; PSR ProjectSoftsol Technologies, Inc. 4,624 Conversion Preparation for PSRTrinity Technology Group, Inc. 3,331 Middleware Maintenance & Support; My|CalPERS; Enterprise
Architecture Services
KPMG, LLP 3,092 ETM Project OversightCSIDENTITY Corporation 3,000 Credit Monitoring ServiceVisionary Integration, LLC (VIP) 2,454 Quality of Education Improvement Customer Education System
(CES) Project; My|CalPERS
California State Controller's Offi ce 2,429 Management Information Retrieval System (MIRS) Report/Access;
Expedite Payments; Combined Warrants
Medstat Group 2,200 Health Care Decision Support Consulting ServicesMercer Health and Benefi ts 1,979 Actuarial Consulting for Health ProgramPillsbury Winthrop Shaw Pittman, LLP 1,799 Alternative Investments Management (AIM) & PSR ProjectInsight Technologies, Inc. 1,798 PSR Data Conversion; Automated Communications Exchange System
(ACES) Batch Application SupportVantage Consulting Group, Inc. 1,725 PeopleSoft Financials Integration with PSRBallard Group, The 1,601 Enterprise Software Testing Supplemental Support ServicesBusiness Advantage Consulting 1,562 IT Transformation Support; Social Security Number ProjectBase 3 Consulting 1,331 Business Analysis Support - Data Conversion & PSR ProjectPaul, Hastings, Janofsky, Walker, LLP 1,213 Real Estate & AIM Technology ProgramKearnford Application Systems Design 1,178 PSR Data Clean-up & Data Conversion ProjectAmbire Consulting, Inc. 1,133 Serena Dimensions/Confi guration Management Update SupportRussbo, Inc. 1,091 Enterprise Identity & Access Management Implementation (EIAM) ProjectHighlands Consulting Group 972 ETM ProjectKong Consulting, Inc. 935 Consulting Services for PeopleSoft FinancialsWatson Wyatt Worldwide 824 Health Consulting ServicesIntraform 796 Board Elections ServicesInformation Technology Software Professionals 785 Programming Services for Legacy Mainframe ApplicationsDolamont Consulting, Inc. 698 ETM Project; PeopleSoft Integration to PSRMacias, Gini O'Connell, LLP 689 Financial Statement Auditor
ADSI, Inc. 668 CDB Management & Implementation SupportFinancial Finesse 650 Financial Planning Education ServicesComsys 643 Mainframe Systems AdministratorJlynnconsulting, Inc. 635 Data Administration/Data Modeling ServicesShooting Star Solutions, LLC 629 Health Care Decision Support Consulting ServicesKNL Support Services 606 Real Estate Investment Audit ServicesBuck Consultants, LLC 592 360 Degree Leadership Program; Communication ServicesLussier, Vienna, Gregor & Associates 574 Federal Legislative RepresentativeSoftsol Resources, Inc. 558 CDB Application & Enterprise Software Testing SupportSenn-Delaney Leadership 529 Strategic Planning & TrainingMoore Wallace Business Communications Services 518 Open Enrollment Processing ServicesHewlett-Packard 472 Statement of work for Enterprise Service Delivery & Data Center AutomationSteptoe & Johnson, LLP 439 Tax CounselLogic House Ltd. 418 Enterprise Software & Management Support ServicesPM/CM Services, Inc. 405 Construction Project Management for Offsite Parking ProjectStaff Tech, Inc. 404 Programming Services for Legacy Mainframe ApplicationsDLS Enterprises, LLC 403 Support Services for Management Succession Plan & TrainingBlackstone Technology Group 393 Consulting Services Spring Fed Pool IT Transformation SupportKiefer Consulting, Inc. 350 ITSB/INVO Consulting ServicesPrinceton Solutions Group, Inc. 297 Technology Architecture Middleware Services
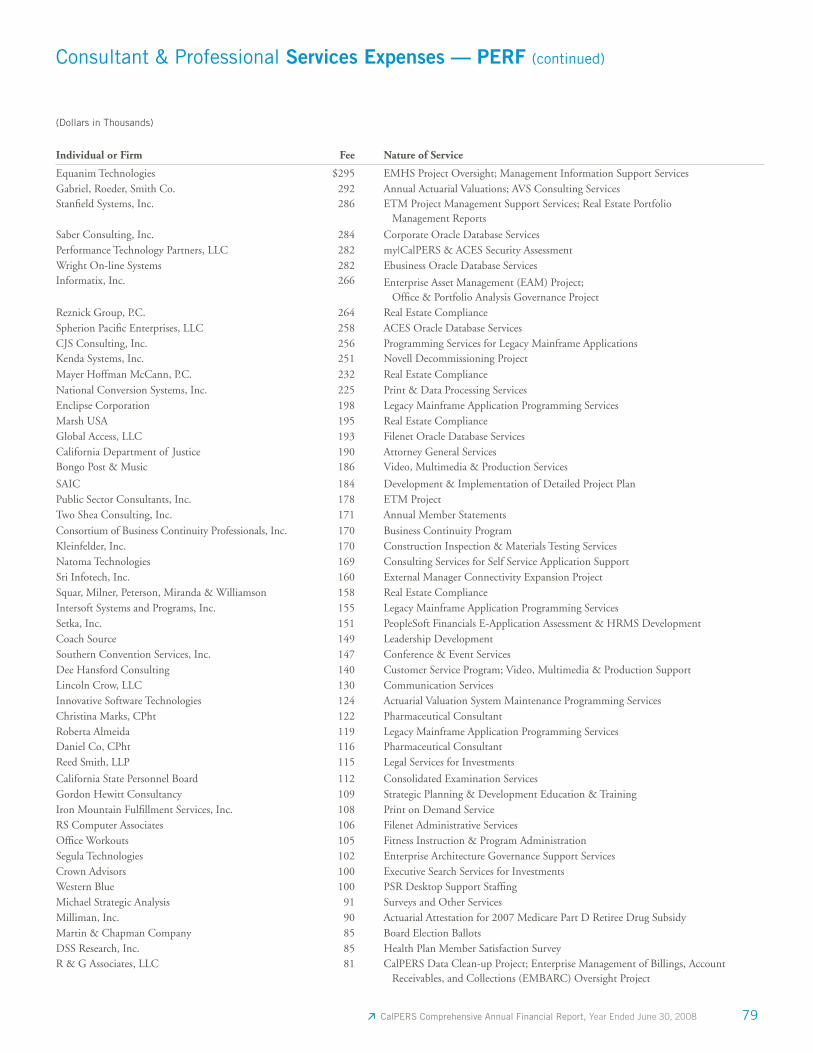
79 CalPERS Comprehensive Annual Financial Report, Year Ended June 30, 2008
Consultant & Professional Services Expenses — PERF (continued)
(Dollars in Thousands)
Individual or Firm Fee Nature of Service
Equanim Technologies $295 EMHS Project Oversight; Management Information Support ServicesGabriel, Roeder, Smith Co. 292 Annual Actuarial Valuations; AVS Consulting ServicesStanfi eld Systems, Inc. 286 ETM Project Management Support Services; Real Estate Portfolio
Management Reports
Saber Consulting, Inc. 284 Corporate Oracle Database ServicesPerformance Technology Partners, LLC 282 my|CalPERS & ACES Security AssessmentWright On-line Systems 282 Ebusiness Oracle Database ServicesInformatix, Inc. 266 Enterprise Asset Management (EAM) Project;
Offi ce & Portfolio Analysis Governance ProjectReznick Group, P.C. 264 Real Estate ComplianceSpherion Pacifi c Enterprises, LLC 258 ACES Oracle Database ServicesCJS Consulting, Inc. 256 Programming Services for Legacy Mainframe ApplicationsKenda Systems, Inc. 251 Novell Decommissioning Project
Mayer Hoffman McCann, P.C. 232 Real Estate ComplianceNational Conversion Systems, Inc. 225 Print & Data Processing ServicesEnclipse Corporation 198 Legacy Mainframe Application Programming ServicesMarsh USA 195 Real Estate ComplianceGlobal Access, LLC 193 Filenet Oracle Database ServicesCalifornia Department of Justice 190 Attorney General ServicesBongo Post & Music 186 Video, Multimedia & Production Services
SAIC 184 Development & Implementation of Detailed Project PlanPublic Sector Consultants, Inc. 178 ETM ProjectTwo Shea Consulting, Inc. 171 Annual Member Statements
Consortium of Business Continuity Professionals, Inc. 170 Business Continuity ProgramKleinfelder, Inc. 170 Construction Inspection & Materials Testing ServicesNatoma Technologies 169 Consulting Services for Self Service Application SupportSri Infotech, Inc. 160 External Manager Connectivity Expansion ProjectSquar, Milner, Peterson, Miranda & Williamson 158 Real Estate ComplianceIntersoft Systems and Programs, Inc. 155 Legacy Mainframe Application Programming ServicesSetka, Inc. 151 PeopleSoft Financials E-Application Assessment & HRMS DevelopmentCoach Source 149 Leadership DevelopmentSouthern Convention Services, Inc. 147 Conference & Event ServicesDee Hansford Consulting 140 Customer Service Program; Video, Multimedia & Production SupportLincoln Crow, LLC 130 Communication ServicesInnovative Software Technologies 124 Actuarial Valuation System Maintenance Programming ServicesChristina Marks, CPht 122 Pharmaceutical ConsultantRoberta Almeida 119 Legacy Mainframe Application Programming ServicesDaniel Co, CPht 116 Pharmaceutical ConsultantReed Smith, LLP 115 Legal Services for Investments
California State Personnel Board 112 Consolidated Examination ServicesGordon Hewitt Consultancy 109 Strategic Planning & Development Education & TrainingIron Mountain Fulfi llment Services, Inc. 108 Print on Demand ServiceRS Computer Associates 106 Filenet Administrative ServicesOffi ce Workouts 105 Fitness Instruction & Program AdministrationSegula Technologies 102 Enterprise Architecture Governance Support ServicesCrown Advisors 100 Executive Search Services for InvestmentsWestern Blue 100 PSR Desktop Support Staffi ngMichael Strategic Analysis 91 Surveys and Other ServicesMilliman, Inc. 90 Actuarial Attestation for 2007 Medicare Part D Retiree Drug SubsidyMartin & Chapman Company 85 Board Election BallotsDSS Research, Inc. 85 Health Plan Member Satisfaction SurveyR & G Associates, LLC 81 CalPERS Data Clean-up Project; Enterprise Management of Billings, Account
Receivables, and Collections (EMBARC) Oversight Project
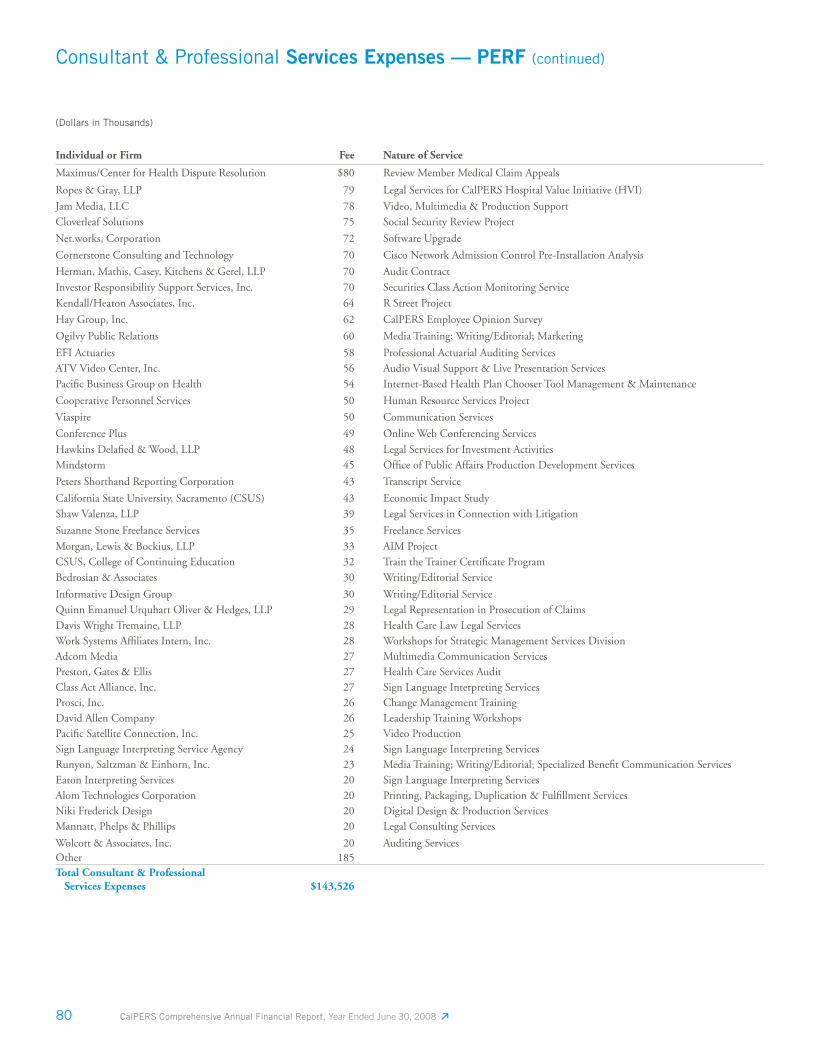
80 CalPERS Comprehensive Annual Financial Report, Year Ended June 30, 2008
Consultant & Professional Services Expenses — PERF (continued)
(Dollars in Thousands)
Individual or Firm Fee Nature of Service
Maximus/Center for Health Dispute Resolution $80 Review Member Medical Claim Appeals
Ropes & Gray, LLP 79 Legal Services for CalPERS Hospital Value Initiative (HVI)
Jam Media, LLC 78 Video, Multimedia & Production SupportCloverleaf Solutions 75 Social Security Review Project
Net.works, Corporation 72 Software Upgrade
Cornerstone Consulting and Technology 70 Cisco Network Admission Control Pre-Installation Analysis
Herman, Mathis, Casey, Kitchens & Gerel, LLP 70 Audit ContractInvestor Responsibility Support Services, Inc. 70 Securities Class Action Monitoring ServiceKendall/Heaton Associates, Inc. 64 R Street Project
Hay Group, Inc. 62 CalPERS Employee Opinion Survey
Ogilvy Public Relations 60 Media Training; Writing/Editorial; Marketing
EFI Actuaries 58 Professional Actuarial Auditing ServicesATV Video Center, Inc. 56 Audio Visual Support & Live Presentation ServicesPacifi c Business Group on Health 54 Internet-Based Health Plan Chooser Tool Management & Maintenance
Cooperative Personnel Services 50 Human Resource Services Project
Viaspire 50 Communication Services
Conference Plus 49 Online Web Conferencing Services
Hawkins Delafi ed & Wood, LLP 48 Legal Services for Investment ActivitiesMindstorm 45 Offi ce of Public Affairs Production Development Services
Peters Shorthand Reporting Corporation 43 Transcript Service
California State University, Sacramento (CSUS) 43 Economic Impact StudyShaw Valenza, LLP 39 Legal Services in Connection with Litigation
Suzanne Stone Freelance Services 35 Freelance Services
Morgan, Lewis & Bockius, LLP 33 AIM ProjectCSUS, College of Continuing Education 32 Train the Trainer Certifi cate ProgramBedrosian & Associates 30 Writing/Editorial Service
Informative Design Group 30 Writing/Editorial ServiceQuinn Emanuel Urquhart Oliver & Hedges, LLP 29 Legal Representation in Prosecution of ClaimsDavis Wright Tremaine, LLP 28 Health Care Law Legal ServicesWork Systems Affi liates Intern, Inc. 28 Workshops for Strategic Management Services DivisionAdcom Media 27 Multimedia Communication ServicesPreston, Gates & Ellis 27 Health Care Services AuditClass Act Alliance, Inc. 27 Sign Language Interpreting ServicesProsci, Inc. 26 Change Management TrainingDavid Allen Company 26 Leadership Training WorkshopsPacifi c Satellite Connection, Inc. 25 Video ProductionSign Language Interpreting Service Agency 24 Sign Language Interpreting ServicesRunyon, Saltzman & Einhorn, Inc. 23 Media Training; Writing/Editorial; Specialized Benefi t Communication ServicesEaton Interpreting Services 20 Sign Language Interpreting ServicesAlom Technologies Corporation 20 Printing, Packaging, Duplication & Fulfi llment ServicesNiki Frederick Design 20 Digital Design & Production ServicesMannatt, Phelps & Phillips 20 Legal Consulting Services
Wolcott & Associates, Inc. 20 Auditing ServicesOther 185Total Consultant & Professional Services Expenses $143,526
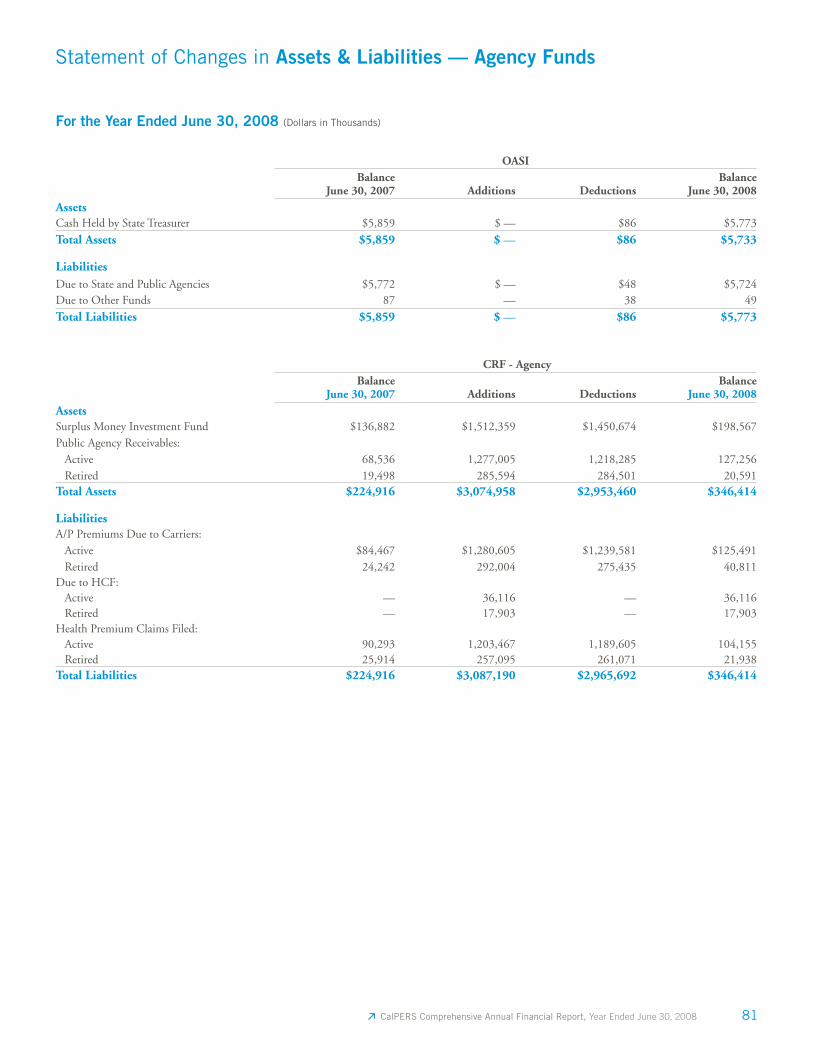
81 CalPERS Comprehensive Annual Financial Report, Year Ended June 30, 2008
Statement of Changes in Assets & Liabilities — Agency Funds
For the Year Ended June 30, 2008 (Dollars in Thousands)
OASIBalance
June 30, 2007 Additions DeductionsBalance
June 30, 2008AssetsCash Held by State Treasurer $5,859 $ — $86 $5,773
Total Assets $5,859 $ — $86 $5,733
LiabilitiesDue to State and Public Agencies $5,772 $ — $48 $5,724Due to Other Funds 87 — 38 49
Total Liabilities $5,859 $ — $86 $5,773
CRF - AgencyBalance
June 30, 2007 Additions DeductionsBalance
June 30, 2008AssetsSurplus Money Investment Fund $136,882 $1,512,359 $1,450,674 $198,567Public Agency Receivables: Active 68,536 1,277,005 1,218,285 127,256 Retired 19,498 285,594 284,501 20,591Total Assets $224,916 $3,074,958 $2,953,460 $346,414
LiabilitiesA/P Premiums Due to Carriers: Active $84,467 $1,280,605 $1,239,581 $125,491 Retired 24,242 292,004 275,435 40,811Due to HCF: Active — 36,116 — 36,116 Retired — 17,903 — 17,903Health Premium Claims Filed: Active 90,293 1,203,467 1,189,605 104,155 Retired 25,914 257,095 261,071 21,938Total Liabilities $224,916 $3,087,190 $2,965,692 $346,414

82 CalPERS Comprehensive Annual Financial Report, Year Ended June 30, 2008

Investment Section
Exercising Leadership
Good corporate governance leads to better investment
performance. We seek corporate reforms and invest with
partners who use corporate governance strategies to add
value to our fund. Our corporate governance activism ensures
companies respond to the need for long-term returns.
84 CalPERS Comprehensive Annual Financial Report, Year Ended June 30, 2008
Investment Office
P.O. Box 2749Sacramento, CA 95812-2749
June 30, 2008
The Board of Administration of the California Public Employees’ Retirement System
On behalf of CalPERS Investment Offi ce, I am pleased to present reports on the pension fund’s investments, California investments, our investment performance, and investment-related fees and costs for the period that ended June 30, 2008. Our Investment Offi ce staff, pension consultant Wilshire Associates, and State Street Bank & Trust, our master custodian, compiled this data as required by the Retirement Law.
We incurred a 5.1 percent loss (net of fees) on our investments for the one-year period ending June 30, 2008, reducing our portfolio value to $237.1 billion. Our fi ve-year return was 11.1 percent, compared with the annual actuarial target of 7.75 percent for funding our members’ retirement benefi ts.
Our Global Equity portfolio was the hardest hit, with fi scal year declines of 12.3 percent in U.S. stocks and 7.8 percent in international stocks. Private Equity (the Alternative Investment Management [AIM] Program) gained 5.8 percent for the year. Our Global Fixed Income investments returned 6.5 percent for the domestic portfolio and 17.6 percent for international, in part because our internal investment management team avoided the sub-prime securities that produced the severe mortgage losses suffered by many other investors. Finally, our real estate assets had a market value decline of 12.6 percent over the fi scal year as the impact of the slowdown in the national housing market and property devaluations set in.
A revised, three-year asset allocation adopted in December 2007 lowered targets and ranges for Global Equity and Fixed Income, raised them for AIM and Real Estate, and created a new 5 percent target allocation for a new Infl ation-Linked Asset Class – including commodities, infrastructure, forestland, and infl ation-linked bonds.
We continued to invest in the State of California. As of June 30, 2008, we had $24 billion deployed or committed for investment in California entrepreneurial businesses, real estate, urban infi ll, and stocks and bonds in corporations based in California.
We continued to reach out to emerging investment managers, to explore and advocate environmental investments and sound, sustainable environmental practices. We also expanded investment options for local public agencies and schools employees in our Supplemental Income Program, providing more funds under CalPERS management and new ones that automatically modify asset allocations as participants approach their retirement dates.
And fi nally, in the area of corporate governance, our annual Focus List called attention to several U.S. companies with poor fi nancial and corporate governance performance. By the end of the fi scal year, we had voted 7,471 individual global proxies in compliance with our Principles of Accountable Corporate Governance. We fi led 32 shareowner proposals and averaged 65 percent support from voting investors.
Chief Investment Offi cer’s Letter

85 CalPERS Comprehensive Annual Financial Report, Year Ended June 30, 2008
Looking ahead, we will rely on our size, diversifi ed portfolio, and short-term and long-term strategies to manage going forward.
We see continued opportunities in the environmental arena with long-range commitments of more than $1 billion in clean technology. We may soon reach our fi ve-year goal of reducing real estate partners’ energy use by 20 percent by 2009. We already were more than halfway there in 2007 with a single-year reduction of 13.3 percent.
Despite serious market challenges, CalPERS is resilient. We are well able to meet obligations to members, contracting employers, and investment partners. We have the right people and the right tools to maximize risk-adjusted investment returns through all market cycles, having achieved positive returns for 21 of the past 25 years with an average gain of 15 percent. As the nation’s largest public pension fund, we can weather market storms without having to do widespread selling that might lock in our losses. We will take advantage of good buying opportunities when appropriate that will pay off after the market recovers.
Anne StausbollInterim Chief Investment Offi cer
California Public Employees’ Retirement SystemLincoln Plaza 400 Q Street Sacramento, CA 95811
Chief Investment Offi cer’s Letter (continued)
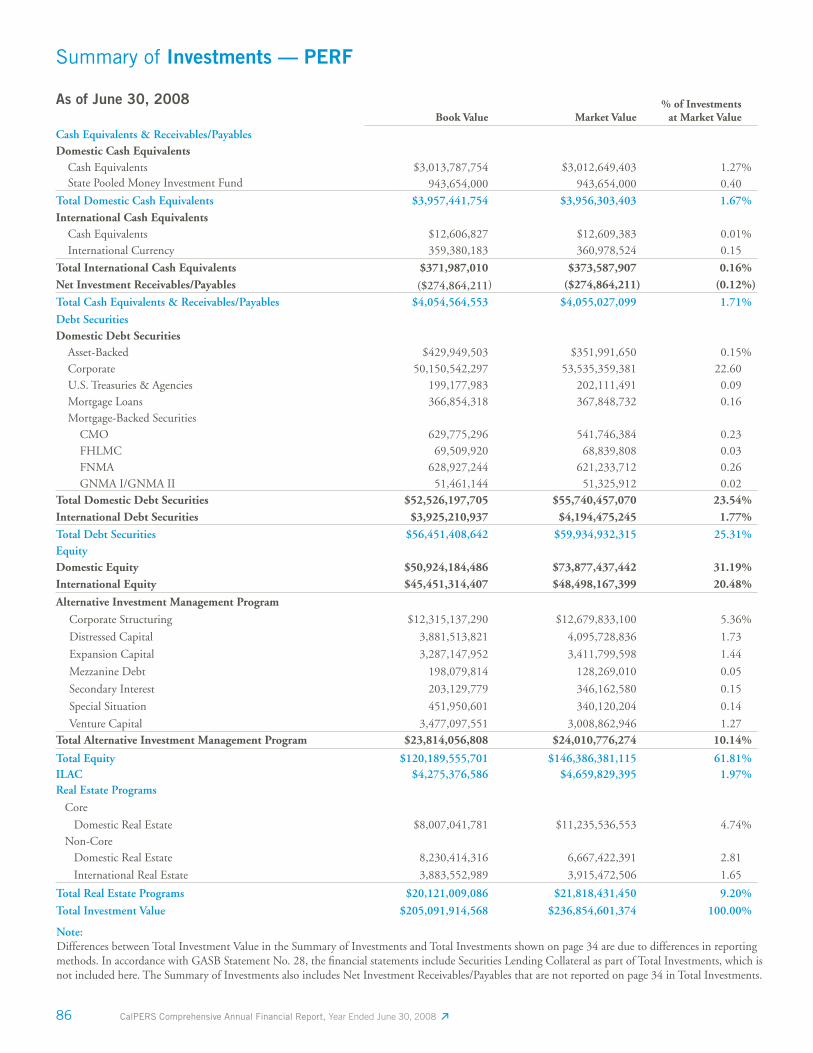
86 CalPERS Comprehensive Annual Financial Report, Year Ended June 30, 2008
Note:Differences between Total Investment Value in the Summary of Investments and Total Investments shown on page 34 are due to differences in reporting methods. In accordance with GASB Statement No. 28, the fi nancial statements include Securities Lending Collateral as part of Total Investments, which is not included here. The Summary of Investments also includes Net Investment Receivables/Payables that are not reported on page 34 in Total Investments.
As of June 30, 2008Book Value Market Value
% of Investmentsat Market Value
Cash Equivalents & Receivables/PayablesDomestic Cash Equivalents Cash Equivalents $3,013,787,754 $3,012,649,403 1.27% State Pooled Money Investment Fund 943,654,000 943,654,000 0.40
Total Domestic Cash Equivalents $3,957,441,754 $3,956,303,403 1.67%International Cash Equivalents Cash Equivalents $12,606,827 $12,609,383 0.01% International Currency 359,380,183 360,978,524 0.15
Total International Cash Equivalents $371,987,010 $373,587,907 0.16%Net Investment Receivables/Payables ($274,864,211) ($274,864,211) (0.12%)
Total Cash Equivalents & Receivables/Payables $4,054,564,553 $4,055,027,099 1.71%
Debt SecuritiesDomestic Debt Securities Asset-Backed $429,949,503 $351,991,650 0.15% Corporate 50,150,542,297 53,535,359,381 22.60 U.S. Treasuries & Agencies 199,177,983 202,111,491 0.09 Mortgage Loans 366,854,318 367,848,732 0.16 Mortgage-Backed Securities CMO 629,775,296 541,746,384 0.23 FHLMC 69,509,920 68,839,808 0.03 FNMA 628,927,244 621,233,712 0.26 GNMA I/GNMA II 51,461,144 51,325,912 0.02Total Domestic Debt Securities $52,526,197,705 $55,740,457,070 23.54%International Debt Securities $3,925,210,937 $4,194,475,245 1.77%
Total Debt Securities $56,451,408,642 $59,934,932,315 25.31%EquityDomestic Equity $50,924,184,486 $73,877,437,442 31.19%International Equity $45,451,314,407 $48,498,167,399 20.48%
Alternative Investment Management Program
Corporate Structuring $12,315,137,290 $12,679,833,100 5.36% Distressed Capital 3,881,513,821 4,095,728,836 1.73
Expansion Capital 3,287,147,952 3,411,799,598 1.44
Mezzanine Debt 198,079,814 128,269,010 0.05
Secondary Interest 203,129,779 346,162,580 0.15
Special Situation 451,950,601 340,120,204 0.14
Venture Capital 3,477,097,551 3,008,862,946 1.27Total Alternative Investment Management Program $23,814,056,808 $24,010,776,274 10.14%
Total Equity $120,189,555,701 $146,386,381,115 61.81%ILAC $4,275,376,586 $4,659,829,395 1.97%Real Estate Programs
Core
Domestic Real Estate $8,007,041,781 $11,235,536,553 4.74% Non-Core Domestic Real Estate 8,230,414,316 6,667,422,391 2.81
International Real Estate 3,883,552,989 3,915,472,506 1.65
Total Real Estate Programs $20,121,009,086 $21,818,431,450 9.20%
Total Investment Value $205,091,914,568 $236,854,601,374 100.00%
Summary of Investments — PERF
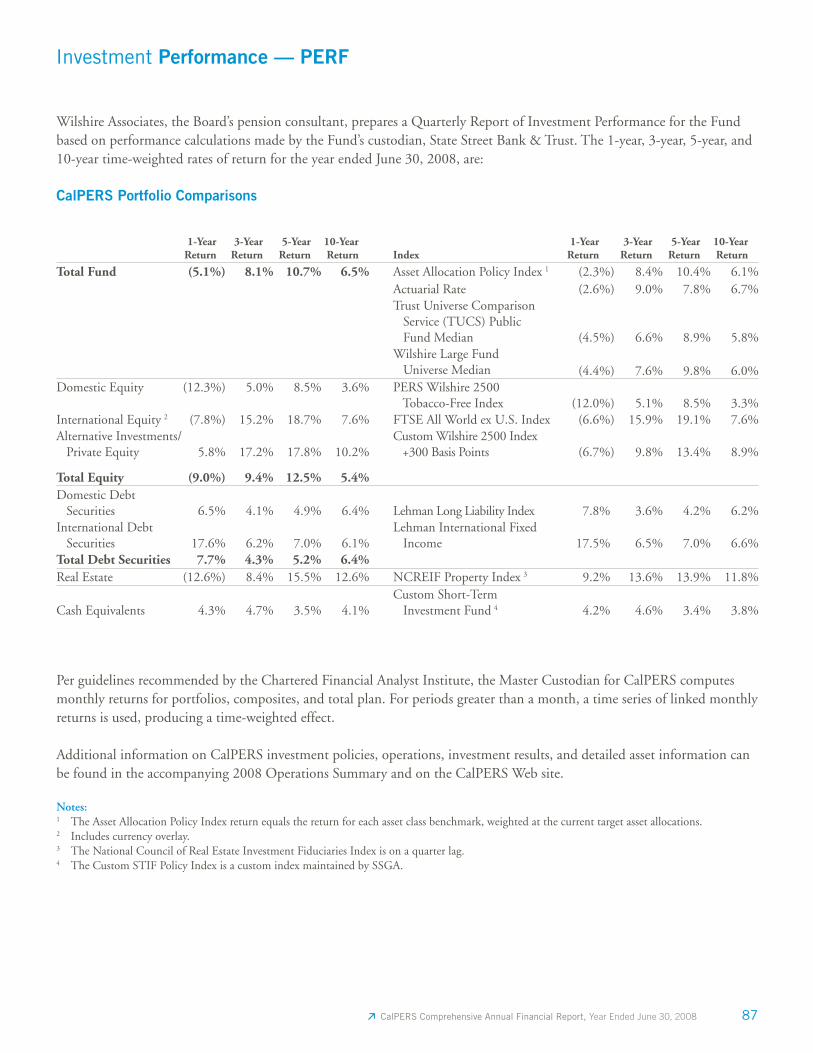
87 CalPERS Comprehensive Annual Financial Report, Year Ended June 30, 2008
Wilshire Associates, the Board’s pension consultant, prepares a Quarterly Report of Investment Performance for the Fund based on performance calculations made by the Fund’s custodian, State Street Bank & Trust. The 1-year, 3-year, 5-year, and 10-year time-weighted rates of return for the year ended June 30, 2008, are:
CalPERS Portfolio Comparisons
1-Year Return
3-YearReturn
5-YearReturn
10-YearReturn Index
1-YearReturn
3-YearReturn
5-YearReturn
10-YearReturn
Total Fund (5.1%) 8.1% 10.7% 6.5% Asset Allocation Policy Index 1 (2.3%) 8.4% 10.4% 6.1%Actuarial Rate (2.6%) 9.0% 7.8% 6.7%Trust Universe Comparison Service (TUCS) Public Fund Median (4.5%) 6.6% 8.9% 5.8%Wilshire Large Fund Universe Median (4.4%) 7.6% 9.8% 6.0%
Domestic Equity (12.3%) 5.0% 8.5% 3.6% PERS Wilshire 2500 Tobacco-Free Index (12.0%) 5.1% 8.5% 3.3%
International Equity 2 (7.8%) 15.2% 18.7% 7.6% FTSE All World ex U.S. Index (6.6%) 15.9% 19.1% 7.6%Alternative Investments/ Private Equity 5.8% 17.2% 17.8% 10.2%
Custom Wilshire 2500 Index +300 Basis Points (6.7%) 9.8% 13.4% 8.9%
Total Equity (9.0%) 9.4% 12.5% 5.4%Domestic Debt Securities 6.5% 4.1% 4.9% 6.4% Lehman Long Liability Index 7.8% 3.6% 4.2% 6.2%International Debt Securities 17.6% 6.2% 7.0% 6.1%
Lehman International Fixed Income 17.5% 6.5% 7.0% 6.6%
Total Debt Securities 7.7% 4.3% 5.2% 6.4%Real Estate (12.6%) 8.4% 15.5% 12.6% NCREIF Property Index 3 9.2% 13.6% 13.9% 11.8%
Cash Equivalents 4.3% 4.7% 3.5% 4.1%Custom Short-Term Investment Fund 4 4.2% 4.6% 3.4% 3.8%
Per guidelines recommended by the Chartered Financial Analyst Institute, the Master Custodian for CalPERS computes monthly returns for portfolios, composites, and total plan. For periods greater than a month, a time series of linked monthly returns is used, producing a time-weighted effect.
Additional information on CalPERS investment policies, operations, investment results, and detailed asset information can be found in the accompanying 2008 Operations Summary and on the CalPERS Web site.
Notes:1 The Asset Allocation Policy Index return equals the return for each asset class benchmark, weighted at the current target asset allocations.2 Includes currency overlay.3 The National Council of Real Estate Investment Fiduciaries Index is on a quarter lag.4 The Custom STIF Policy Index is a custom index maintained by SSGA.
Investment Performance — PERF
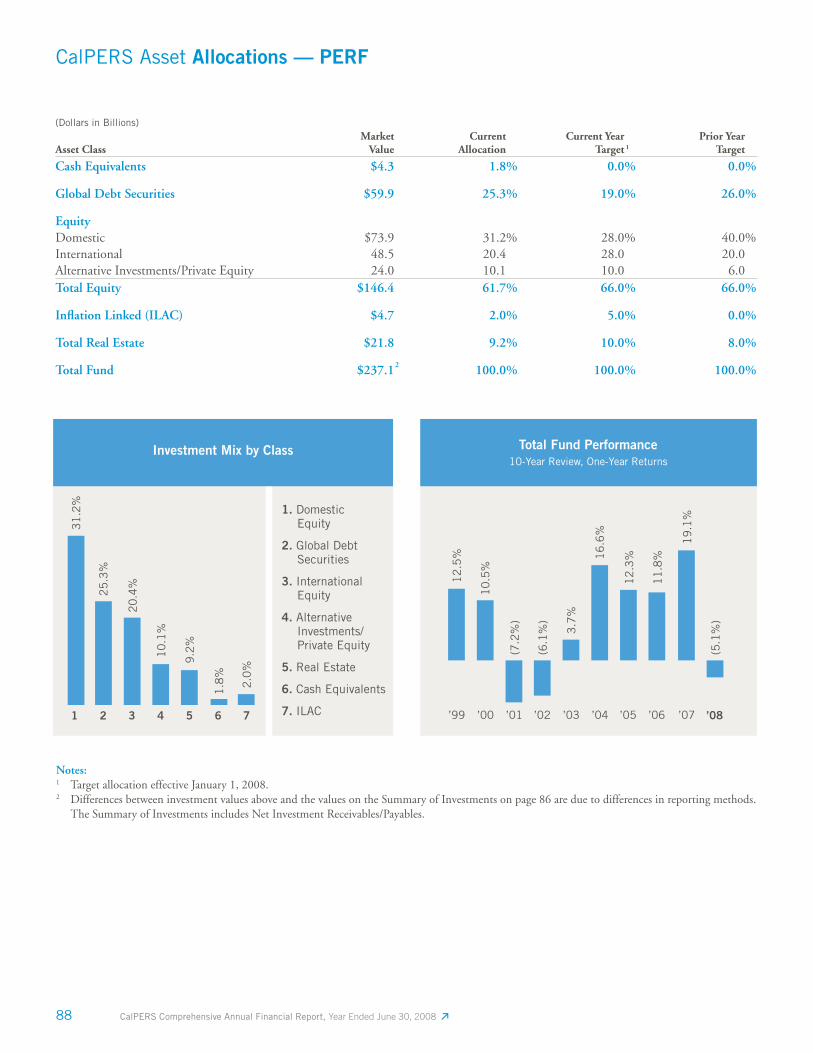
88 CalPERS Comprehensive Annual Financial Report, Year Ended June 30, 2008
CalPERS Asset Allocations — PERF
(Dollars in Billions)
Asset Class Market
Value Current Allocation
Current Year Target 1
Prior Year Target
Cash Equivalents $4.3 1.8% 0.0% 0.0%
Global Debt Securities $59.9 25.3% 19.0% 26.0%
EquityDomestic $73.9 31.2% 28.0% 40.0%International 48.5 20.4 28.0 20.0Alternative Investments/Private Equity 24.0 10.1 10.0 6.0Total Equity $146.4 61.7% 66.0% 66.0%
Infl ation Linked (ILAC) $4.7 2.0% 5.0% 0.0%
Total Real Estate $21.8 9.2% 10.0% 8.0%
Total Fund $237.1 2 100.0% 100.0% 100.0%
Notes:1 Target allocation effective January 1, 2008.2 Differences between investment values above and the values on the Summary of Investments on page 86 are due to differences in reporting methods.
The Summary of Investments includes Net Investment Receivables/Payables.
’99 ’00 ’01 ’02 ’03 ’04 ’05 ’06 ’07 ’08
12
.5%
10
.5%
(7.2
%)
(6.1
%)
3.7
%
16
.6%
12
.3%
11
.8%
19
.1%
1 2 3 4 5 6 7
31
.2%
25
.3%
20
.4%
10
.1%
9.2
%
1.8
%
(5.1
%)
2.0
%
1. Domestic Equity
2. Global Debt Securities
3. International Equity
4. Alternative Investments/ Private Equity
5. Real Estate
6. Cash Equivalents
7. ILAC
Total Fund Performance10-Year Review, One-Year Returns
Investment Mix by Class
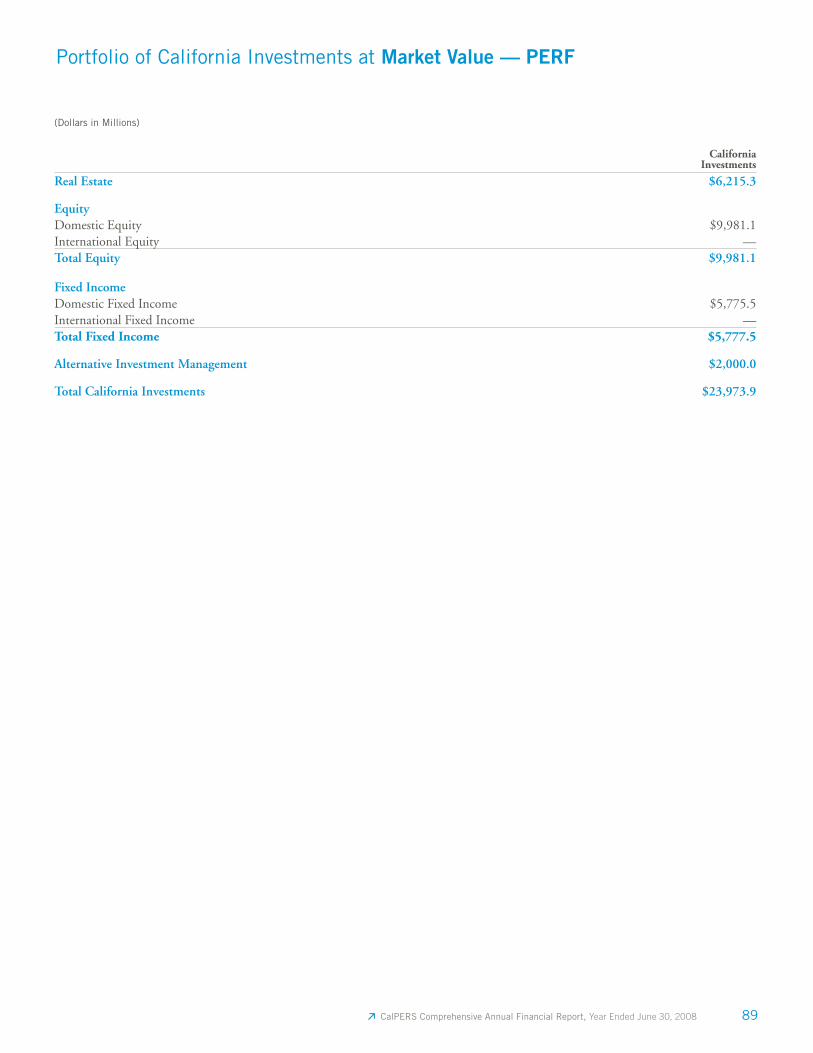
89 CalPERS Comprehensive Annual Financial Report, Year Ended June 30, 2008
(Dollars in Millions)
California Investments
Real Estate $6,215.3
EquityDomestic Equity $9,981.1International Equity —Total Equity $9,981.1
Fixed IncomeDomestic Fixed Income $5,775.5International Fixed Income —Total Fixed Income $5,777.5
Alternative Investment Management $2,000.0
Total California Investments $23,973.9
Portfolio of California Investments at Market Value — PERF
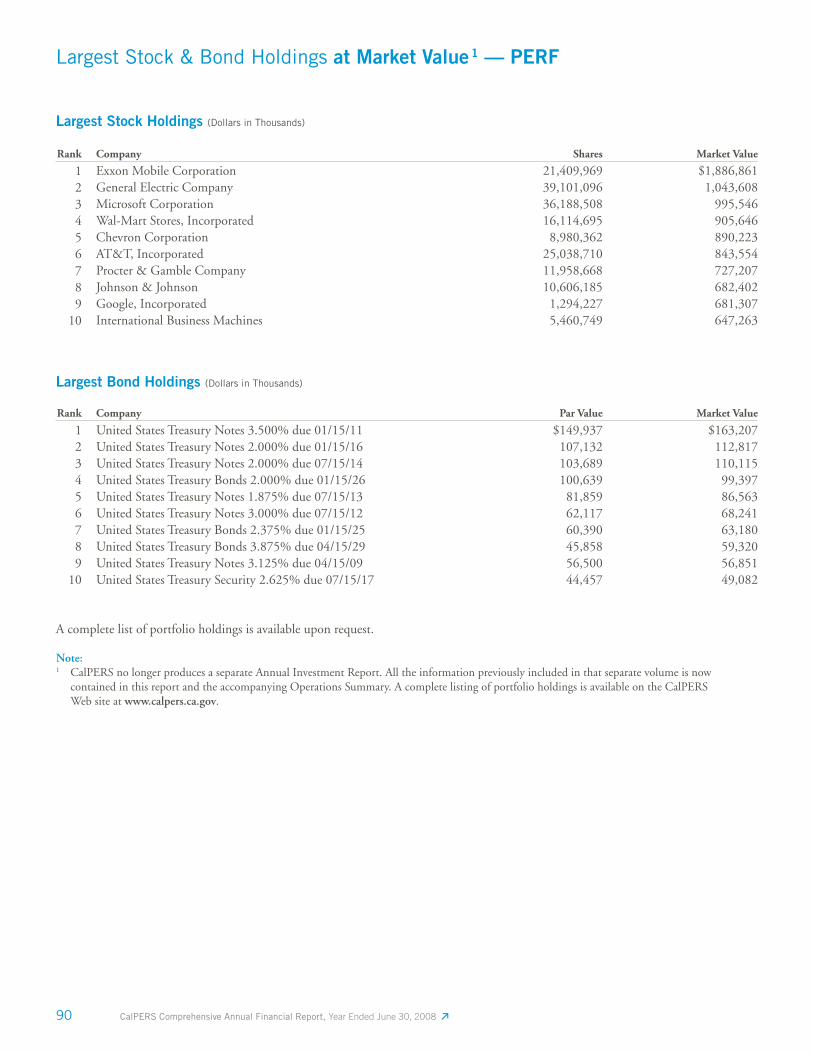
90 CalPERS Comprehensive Annual Financial Report, Year Ended June 30, 2008
Largest Stock Holdings (Dollars in Thousands)
Rank Company Shares Market Value
1 Exxon Mobile Corporation 21,409,969 $1,886,861 2 General Electric Company 39,101,096 1,043,608 3 Microsoft Corporation 36,188,508 995,546 4 Wal-Mart Stores, Incorporated 16,114,695 905,646 5 Chevron Corporation 8,980,362 890,223 6 AT&T, Incorporated 25,038,710 843,554 7 Procter & Gamble Company 11,958,668 727,207 8 Johnson & Johnson 10,606,185 682,402 9 Google, Incorporated 1,294,227 681,307
10 International Business Machines 5,460,749 647,263
Largest Bond Holdings (Dollars in Thousands)
Rank Company Par Value Market Value
1 United States Treasury Notes 3.500% due 01/15/11 $149,937 $163,207 2 United States Treasury Notes 2.000% due 01/15/16 107,132 112,817 3 United States Treasury Notes 2.000% due 07/15/14 103,689 110,115 4 United States Treasury Bonds 2.000% due 01/15/26 100,639 99,397 5 United States Treasury Notes 1.875% due 07/15/13 81,859 86,563 6 United States Treasury Notes 3.000% due 07/15/12 62,117 68,241 7 United States Treasury Bonds 2.375% due 01/15/25 60,390 63,180 8 United States Treasury Bonds 3.875% due 04/15/29 45,858 59,320 9 United States Treasury Notes 3.125% due 04/15/09 56,500 56,851
10 United States Treasury Security 2.625% due 07/15/17 44,457 49,082
A complete list of portfolio holdings is available upon request.
Note:1 CalPERS no longer produces a separate Annual Investment Report. All the information previously included in that separate volume is now
contained in this report and the accompanying Operations Summary. A complete listing of portfolio holdings is available on the CalPERS Web site at www.calpers.ca.gov.
Largest Stock & Bond Holdings at Market Value 1 — PERF
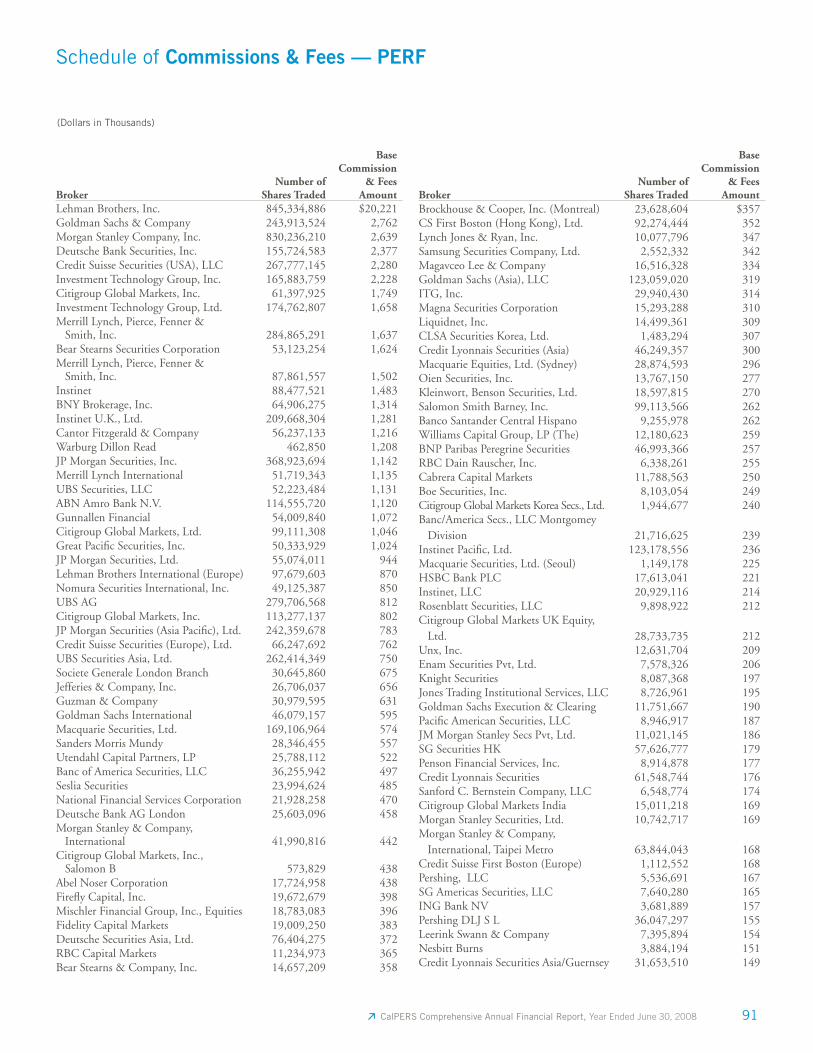
91 CalPERS Comprehensive Annual Financial Report, Year Ended June 30, 2008
(Dollars in Thousands)
Schedule of Commissions & Fees — PERF
BrokerNumber of
Shares Traded
BaseCommission
& FeesAmount
Lehman Brothers, Inc. 845,334,886 $20,221 Goldman Sachs & Company 243,913,524 2,762 Morgan Stanley Company, Inc. 830,236,210 2,639 Deutsche Bank Securities, Inc. 155,724,583 2,377 Credit Suisse Securities (USA), LLC 267,777,145 2,280 Investment Technology Group, Inc. 165,883,759 2,228 Citigroup Global Markets, Inc. 61,397,925 1,749 Investment Technology Group, Ltd. 174,762,807 1,658 Merrill Lynch, Pierce, Fenner & Smith, Inc. 284,865,291 1,637 Bear Stearns Securities Corporation 53,123,254 1,624 Merrill Lynch, Pierce, Fenner & Smith, Inc. 87,861,557 1,502 Instinet 88,477,521 1,483 BNY Brokerage, Inc. 64,906,275 1,314 Instinet U.K., Ltd. 209,668,304 1,281 Cantor Fitzgerald & Company 56,237,133 1,216 Warburg Dillon Read 462,850 1,208 JP Morgan Securities, Inc. 368,923,694 1,142 Merrill Lynch International 51,719,343 1,135 UBS Securities, LLC 52,223,484 1,131 ABN Amro Bank N.V. 114,555,720 1,120 Gunnallen Financial 54,009,840 1,072 Citigroup Global Markets, Ltd. 99,111,308 1,046 Great Pacifi c Securities, Inc. 50,333,929 1,024 JP Morgan Securities, Ltd. 55,074,011 944 Lehman Brothers International (Europe) 97,679,603 870 Nomura Securities International, Inc. 49,125,387 850 UBS AG 279,706,568 812 Citigroup Global Markets, Inc. 113,277,137 802 JP Morgan Securities (Asia Pacifi c), Ltd. 242,359,678 783 Credit Suisse Securities (Europe), Ltd. 66,247,692 762 UBS Securities Asia, Ltd. 262,414,349 750 Societe Generale London Branch 30,645,860 675 Jefferies & Company, Inc. 26,706,037 656 Guzman & Company 30,979,595 631 Goldman Sachs International 46,079,157 595 Macquarie Securities, Ltd. 169,106,964 574 Sanders Morris Mundy 28,346,455 557 Utendahl Capital Partners, LP 25,788,112 522 Banc of America Securities, LLC 36,255,942 497 Seslia Securities 23,994,624 485 National Financial Services Corporation 21,928,258 470 Deutsche Bank AG London 25,603,096 458 Morgan Stanley & Company, International 41,990,816 442 Citigroup Global Markets, Inc., Salomon B 573,829 438 Abel Noser Corporation 17,724,958 438 Firefl y Capital, Inc. 19,672,679 398 Mischler Financial Group, Inc., Equities 18,783,083 396 Fidelity Capital Markets 19,009,250 383 Deutsche Securities Asia, Ltd. 76,404,275 372 RBC Capital Markets 11,234,973 365 Bear Stearns & Company, Inc. 14,657,209 358
BrokerNumber of
Shares Traded
BaseCommission
& FeesAmount
Brockhouse & Cooper, Inc. (Montreal) 23,628,604 $357 CS First Boston (Hong Kong), Ltd. 92,274,444 352 Lynch Jones & Ryan, Inc. 10,077,796 347 Samsung Securities Company, Ltd. 2,552,332 342 Magavceo Lee & Company 16,516,328 334 Goldman Sachs (Asia), LLC 123,059,020 319 ITG, Inc. 29,940,430 314 Magna Securities Corporation 15,293,288 310 Liquidnet, Inc. 14,499,361 309 CLSA Securities Korea, Ltd. 1,483,294 307 Credit Lyonnais Securities (Asia) 46,249,357 300 Macquarie Equities, Ltd. (Sydney) 28,874,593 296 Oien Securities, Inc. 13,767,150 277 Kleinwort, Benson Securities, Ltd. 18,597,815 270 Salomon Smith Barney, Inc. 99,113,566 262 Banco Santander Central Hispano 9,255,978 262 Williams Capital Group, LP (The) 12,180,623 259 BNP Paribas Peregrine Securities 46,993,366 257 RBC Dain Rauscher, Inc. 6,338,261 255 Cabrera Capital Markets 11,788,563 250 Boe Securities, Inc. 8,103,054 249 Citigroup Global Markets Korea Secs., Ltd. 1,944,677 240 Banc/America Secs., LLC Montgomey Division 21,716,625 239 Instinet Pacifi c, Ltd. 123,178,556 236 Macquarie Securities, Ltd. (Seoul) 1,149,178 225 HSBC Bank PLC 17,613,041 221 Instinet, LLC 20,929,116 214 Rosenblatt Securities, LLC 9,898,922 212 Citigroup Global Markets UK Equity, Ltd. 28,733,735 212 Unx, Inc. 12,631,704 209 Enam Securities Pvt, Ltd. 7,578,326 206 Knight Securities 8,087,368 197 Jones Trading Institutional Services, LLC 8,726,961 195 Goldman Sachs Execution & Clearing 11,751,667 190 Pacifi c American Securities, LLC 8,946,917 187 JM Morgan Stanley Secs Pvt, Ltd. 11,021,145 186 SG Securities HK 57,626,777 179 Penson Financial Services, Inc. 8,914,878 177 Credit Lyonnais Securities 61,548,744 176 Sanford C. Bernstein Company, LLC 6,548,774 174 Citigroup Global Markets India 15,011,218 169 Morgan Stanley Securities, Ltd. 10,742,717 169 Morgan Stanley & Company, International, Taipei Metro 63,844,043 168 Credit Suisse First Boston (Europe) 1,112,552 168 Pershing, LLC 5,536,691 167 SG Americas Securities, LLC 7,640,280 165 ING Bank NV 3,681,889 157 Pershing DLJ S L 36,047,297 155 Leerink Swann & Company 7,395,894 154 Nesbitt Burns 3,884,194 151 Credit Lyonnais Securities Asia/Guernsey 31,653,510 149
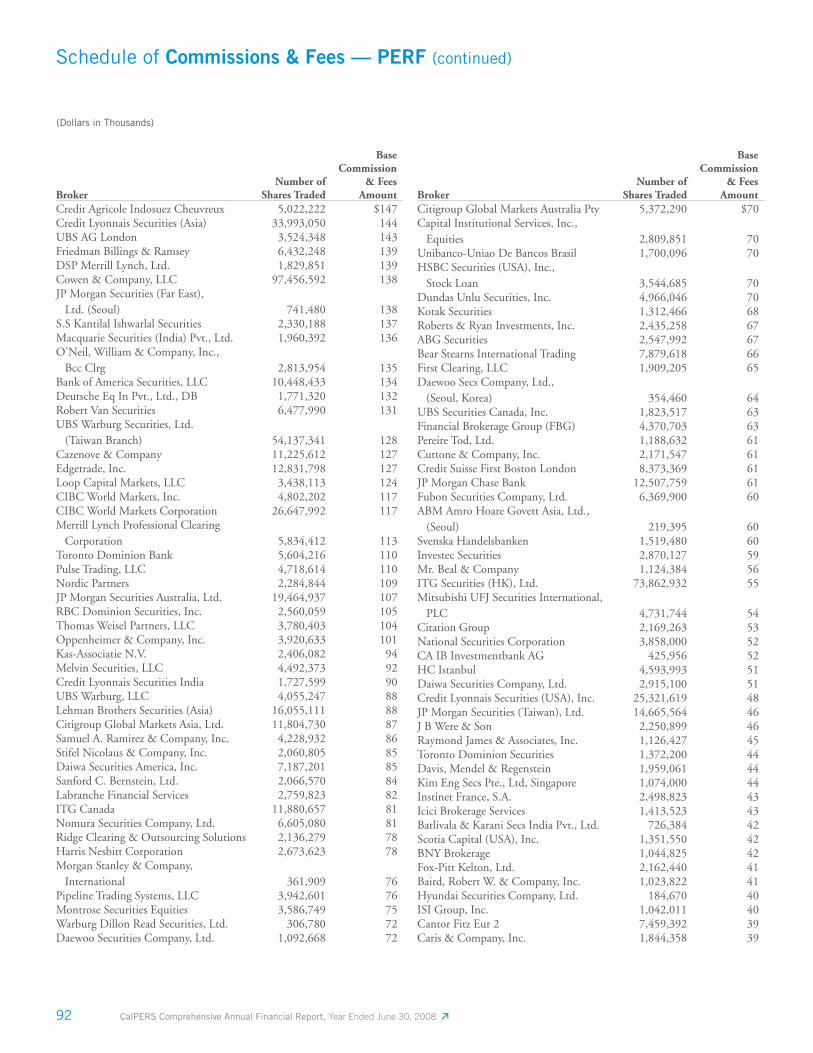
92 CalPERS Comprehensive Annual Financial Report, Year Ended June 30, 2008
BrokerNumber of
Shares Traded
BaseCommission
& FeesAmount
Credit Agricole Indosuez Cheuvreux 5,022,222 $147 Credit Lyonnais Securities (Asia) 33,993,050 144 UBS AG London 3,524,348 143 Friedman Billings & Ramsey 6,432,248 139 DSP Merrill Lynch, Ltd. 1,829,851 139 Cowen & Company, LLC 97,456,592 138 JP Morgan Securities (Far East), Ltd. (Seoul) 741,480 138 S.S Kantilal Ishwarlal Securities 2,330,188 137 Macquarie Securities (India) Pvt., Ltd. 1,960,392 136 O'Neil, William & Company, Inc., Bcc Clrg 2,813,954 135 Bank of America Securities, LLC 10,448,433 134 Deutsche Eq In Pvt., Ltd., DB 1,771,320 132 Robert Van Securities 6,477,990 131 UBS Warburg Securities, Ltd. (Taiwan Branch) 54,137,341 128 Cazenove & Company 11,225,612 127 Edgetrade, Inc. 12,831,798 127 Loop Capital Markets, LLC 3,438,113 124 CIBC World Markets, Inc. 4,802,202 117 CIBC World Markets Corporation 26,647,992 117 Merrill Lynch Professional Clearing Corporation 5,834,412 113 Toronto Dominion Bank 5,604,216 110 Pulse Trading, LLC 4,718,614 110 Nordic Partners 2,284,844 109 JP Morgan Securities Australia, Ltd. 19,464,937 107 RBC Dominion Securities, Inc. 2,560,059 105 Thomas Weisel Partners, LLC 3,780,403 104 Oppenheimer & Company, Inc. 3,920,633 101 Kas-Associatie N.V. 2,406,082 94 Melvin Securities, LLC 4,492,373 92 Credit Lyonnais Securities India 1,727,599 90 UBS Warburg, LLC 4,055,247 88 Lehman Brothers Securities (Asia) 16,055,111 88 Citigroup Global Markets Asia, Ltd. 11,804,730 87 Samuel A. Ramirez & Company, Inc. 4,228,932 86 Stifel Nicolaus & Company, Inc. 2,060,805 85 Daiwa Securities America, Inc. 7,187,201 85 Sanford C. Bernstein, Ltd. 2,066,570 84 Labranche Financial Services 2,759,823 82 ITG Canada 11,880,657 81 Nomura Securities Company, Ltd. 6,605,080 81 Ridge Clearing & Outsourcing Solutions 2,136,279 78 Harris Nesbitt Corporation 2,673,623 78 Morgan Stanley & Company, International 361,909 76 Pipeline Trading Systems, LLC 3,942,601 76 Montrose Securities Equities 3,586,749 75 Warburg Dillon Read Securities, Ltd. 306,780 72 Daewoo Securities Company, Ltd. 1,092,668 72
BrokerNumber of
Shares Traded
BaseCommission
& FeesAmount
Citigroup Global Markets Australia Pty 5,372,290 $70 Capital Institutional Services, Inc., Equities 2,809,851 70 Unibanco-Uniao De Bancos Brasil 1,700,096 70 HSBC Securities (USA), Inc., Stock Loan 3,544,685 70 Dundas Unlu Securities, Inc. 4,966,046 70 Kotak Securities 1,312,466 68 Roberts & Ryan Investments, Inc. 2,435,258 67 ABG Securities 2,547,992 67 Bear Stearns International Trading 7,879,618 66 First Clearing, LLC 1,909,205 65 Daewoo Secs Company, Ltd., (Seoul, Korea) 354,460 64 UBS Securities Canada, Inc. 1,823,517 63 Financial Brokerage Group (FBG) 4,370,703 63 Pereire Tod, Ltd. 1,188,632 61 Cuttone & Company, Inc. 2,171,547 61 Credit Suisse First Boston London 8,373,369 61 JP Morgan Chase Bank 12,507,759 61 Fubon Securities Company, Ltd. 6,369,900 60 ABM Amro Hoare Govett Asia, Ltd., (Seoul) 219,395 60 Svenska Handelsbanken 1,519,480 60 Investec Securities 2,870,127 59 Mr. Beal & Company 1,124,384 56 ITG Securities (HK), Ltd. 73,862,932 55 Mitsubishi UFJ Securities International, PLC 4,731,744 54 Citation Group 2,169,263 53 National Securities Corporation 3,858,000 52 CA IB Investmentbank AG 425,956 52 HC Istanbul 4,593,993 51 Daiwa Securities Company, Ltd. 2,915,100 51 Credit Lyonnais Securities (USA), Inc. 25,321,619 48 JP Morgan Securities (Taiwan), Ltd. 14,665,564 46 J B Were & Son 2,250,899 46 Raymond James & Associates, Inc. 1,126,427 45 Toronto Dominion Securities 1,372,200 44 Davis, Mendel & Regenstein 1,959,061 44 Kim Eng Secs Pte., Ltd, Singapore 1,074,000 44 Instinet France, S.A. 2,498,823 43 Icici Brokerage Services 1,413,523 43 Batlivala & Karani Secs India Pvt., Ltd. 726,384 42 Scotia Capital (USA), Inc. 1,351,550 42 BNY Brokerage 1,044,825 42 Fox-Pitt Kelton, Ltd. 2,162,440 41 Baird, Robert W. & Company, Inc. 1,023,822 41 Hyundai Securities Company, Ltd. 184,670 40 ISI Group, Inc. 1,042,011 40 Cantor Fitz Eur 2 7,459,392 39 Caris & Company, Inc. 1,844,358 39
Schedule of Commissions & Fees — PERF (continued)
(Dollars in Thousands)
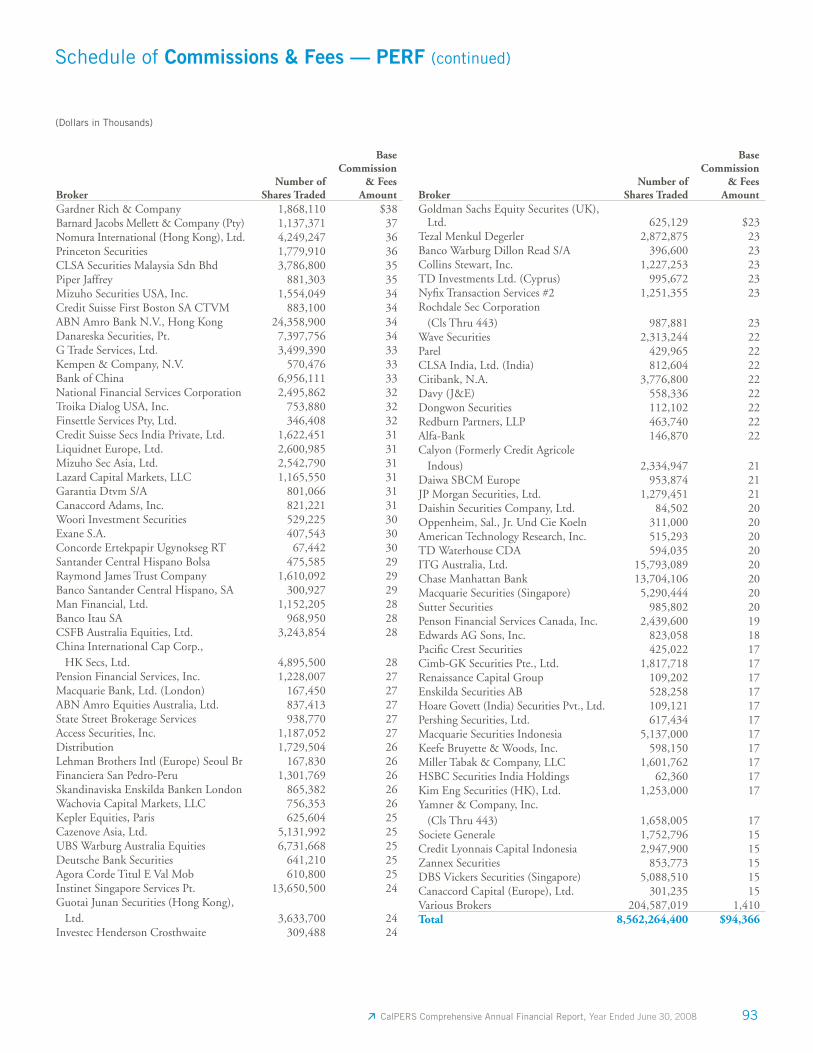
93 CalPERS Comprehensive Annual Financial Report, Year Ended June 30, 2008
BrokerNumber of
Shares Traded
BaseCommission
& FeesAmount
Gardner Rich & Company 1,868,110 $38 Barnard Jacobs Mellett & Company (Pty) 1,137,371 37 Nomura International (Hong Kong), Ltd. 4,249,247 36 Princeton Securities 1,779,910 36 CLSA Securities Malaysia Sdn Bhd 3,786,800 35 Piper Jaffrey 881,303 35 Mizuho Securities USA, Inc. 1,554,049 34 Credit Suisse First Boston SA CTVM 883,100 34 ABN Amro Bank N.V., Hong Kong 24,358,900 34 Danareska Securities, Pt. 7,397,756 34 G Trade Services, Ltd. 3,499,390 33 Kempen & Company, N.V. 570,476 33 Bank of China 6,956,111 33 National Financial Services Corporation 2,495,862 32 Troika Dialog USA, Inc. 753,880 32 Finsettle Services Pty, Ltd. 346,408 32 Credit Suisse Secs India Private, Ltd. 1,622,451 31 Liquidnet Europe, Ltd. 2,600,985 31 Mizuho Sec Asia, Ltd. 2,542,790 31 Lazard Capital Markets, LLC 1,165,550 31 Garantia Dtvm S/A 801,066 31 Canaccord Adams, Inc. 821,221 31 Woori Investment Securities 529,225 30 Exane S.A. 407,543 30 Concorde Ertekpapir Ugynokseg RT 67,442 30 Santander Central Hispano Bolsa 475,585 29 Raymond James Trust Company 1,610,092 29 Banco Santander Central Hispano, SA 300,927 29 Man Financial, Ltd. 1,152,205 28 Banco Itau SA 968,950 28 CSFB Australia Equities, Ltd. 3,243,854 28 China International Cap Corp., HK Secs, Ltd. 4,895,500 28 Pension Financial Services, Inc. 1,228,007 27 Macquarie Bank, Ltd. (London) 167,450 27 ABN Amro Equities Australia, Ltd. 837,413 27 State Street Brokerage Services 938,770 27 Access Securities, Inc. 1,187,052 27 Distribution 1,729,504 26 Lehman Brothers Intl (Europe) Seoul Br 167,830 26 Financiera San Pedro-Peru 1,301,769 26 Skandinaviska Enskilda Banken London 865,382 26 Wachovia Capital Markets, LLC 756,353 26 Kepler Equities, Paris 625,604 25 Cazenove Asia, Ltd. 5,131,992 25 UBS Warburg Australia Equities 6,731,668 25 Deutsche Bank Securities 641,210 25 Agora Corde Titul E Val Mob 610,800 25 Instinet Singapore Services Pt. 13,650,500 24 Guotai Junan Securities (Hong Kong), Ltd. 3,633,700 24 Investec Henderson Crosthwaite 309,488 24
Schedule of Commissions & Fees — PERF (continued)
(Dollars in Thousands)
BrokerNumber of
Shares Traded
BaseCommission
& FeesAmount
Goldman Sachs Equity Securites (UK), Ltd. 625,129 $23 Tezal Menkul Degerler 2,872,875 23 Banco Warburg Dillon Read S/A 396,600 23 Collins Stewart, Inc. 1,227,253 23 TD Investments Ltd. (Cyprus) 995,672 23 Nyfi x Transaction Services #2 1,251,355 23 Rochdale Sec Corporation (Cls Thru 443) 987,881 23 Wave Securities 2,313,244 22 Parel 429,965 22 CLSA India, Ltd. (India) 812,604 22 Citibank, N.A. 3,776,800 22 Davy (J&E) 558,336 22 Dongwon Securities 112,102 22 Redburn Partners, LLP 463,740 22 Alfa-Bank 146,870 22 Calyon (Formerly Credit Agricole Indous) 2,334,947 21 Daiwa SBCM Europe 953,874 21 JP Morgan Securities, Ltd. 1,279,451 21 Daishin Securities Company, Ltd. 84,502 20 Oppenheim, Sal., Jr. Und Cie Koeln 311,000 20 American Technology Research, Inc. 515,293 20 TD Waterhouse CDA 594,035 20 ITG Australia, Ltd. 15,793,089 20 Chase Manhattan Bank 13,704,106 20 Macquarie Securities (Singapore) 5,290,444 20 Sutter Securities 985,802 20 Penson Financial Services Canada, Inc. 2,439,600 19 Edwards AG Sons, Inc. 823,058 18 Pacifi c Crest Securities 425,022 17 Cimb-GK Securities Pte., Ltd. 1,817,718 17 Renaissance Capital Group 109,202 17 Enskilda Securities AB 528,258 17 Hoare Govett (India) Securities Pvt., Ltd. 109,121 17 Pershing Securities, Ltd. 617,434 17 Macquarie Securities Indonesia 5,137,000 17 Keefe Bruyette & Woods, Inc. 598,150 17 Miller Tabak & Company, LLC 1,601,762 17 HSBC Securities India Holdings 62,360 17 Kim Eng Securities (HK), Ltd. 1,253,000 17 Yamner & Company, Inc. (Cls Thru 443) 1,658,005 17 Societe Generale 1,752,796 15 Credit Lyonnais Capital Indonesia 2,947,900 15 Zannex Securities 853,773 15 DBS Vickers Securities (Singapore) 5,088,510 15 Canaccord Capital (Europe), Ltd. 301,235 15 Various Brokers 204,587,019 1,410 Total 8,562,264,400 $94,366
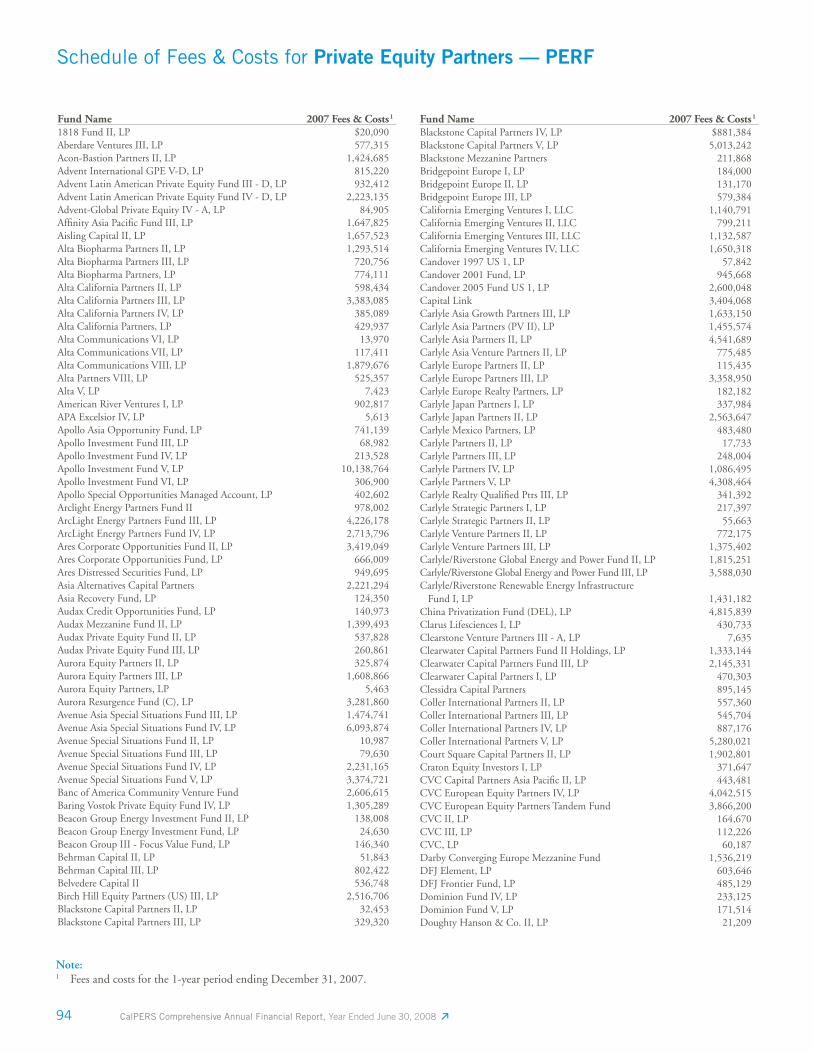
94 CalPERS Comprehensive Annual Financial Report, Year Ended June 30, 2008
Schedule of Fees & Costs for Private Equity Partners — PERF
Fund Name 2007 Fees & Costs 1
1818 Fund II, LP $20,090 Aberdare Ventures III, LP 577,315 Acon-Bastion Partners II, LP 1,424,685 Advent International GPE V-D, LP 815,220 Advent Latin American Private Equity Fund III - D, LP 932,412 Advent Latin American Private Equity Fund IV - D, LP 2,223,135 Advent-Global Private Equity IV - A, LP 84,905 Affi nity Asia Pacifi c Fund III, LP 1,647,825 Aisling Capital II, LP 1,657,523 Alta Biopharma Partners II, LP 1,293,514 Alta Biopharma Partners III, LP 720,756 Alta Biopharma Partners, LP 774,111 Alta California Partners II, LP 598,434 Alta California Partners III, LP 3,383,085 Alta California Partners IV, LP 385,089 Alta California Partners, LP 429,937 Alta Communications VI, LP 13,970 Alta Communications VII, LP 117,411 Alta Communications VIII, LP 1,879,676 Alta Partners VIII, LP 525,357 Alta V, LP 7,423 American River Ventures I, LP 902,817 APA Excelsior IV, LP 5,613 Apollo Asia Opportunity Fund, LP 741,139 Apollo Investment Fund III, LP 68,982 Apollo Investment Fund IV, LP 213,528 Apollo Investment Fund V, LP 10,138,764 Apollo Investment Fund VI, LP 306,900 Apollo Special Opportunities Managed Account, LP 402,602 Arclight Energy Partners Fund II 978,002 ArcLight Energy Partners Fund III, LP 4,226,178 ArcLight Energy Partners Fund IV, LP 2,713,796 Ares Corporate Opportunities Fund II, LP 3,419,049 Ares Corporate Opportunities Fund, LP 666,009 Ares Distressed Securities Fund, LP 949,695 Asia Alternatives Capital Partners 2,221,294 Asia Recovery Fund, LP 124,350 Audax Credit Opportunities Fund, LP 140,973 Audax Mezzanine Fund II, LP 1,399,493 Audax Private Equity Fund II, LP 537,828 Audax Private Equity Fund III, LP 260,861 Aurora Equity Partners II, LP 325,874 Aurora Equity Partners III, LP 1,608,866 Aurora Equity Partners, LP 5,463 Aurora Resurgence Fund (C), LP 3,281,860 Avenue Asia Special Situations Fund III, LP 1,474,741 Avenue Asia Special Situations Fund IV, LP 6,093,874 Avenue Special Situations Fund II, LP 10,987 Avenue Special Situations Fund III, LP 79,630 Avenue Special Situations Fund IV, LP 2,231,165 Avenue Special Situations Fund V, LP 3,374,721 Banc of America Community Venture Fund 2,606,615 Baring Vostok Private Equity Fund IV, LP 1,305,289 Beacon Group Energy Investment Fund II, LP 138,008 Beacon Group Energy Investment Fund, LP 24,630 Beacon Group III - Focus Value Fund, LP 146,340 Behrman Capital II, LP 51,843 Behrman Capital III, LP 802,422 Belvedere Capital II 536,748 Birch Hill Equity Partners (US) III, LP 2,516,706 Blackstone Capital Partners II, LP 32,453 Blackstone Capital Partners III, LP 329,320
Fund Name 2007 Fees & Costs 1
Blackstone Capital Partners IV, LP $881,384 Blackstone Capital Partners V, LP 5,013,242 Blackstone Mezzanine Partners 211,868 Bridgepoint Europe I, LP 184,000 Bridgepoint Europe II, LP 131,170 Bridgepoint Europe III, LP 579,384 California Emerging Ventures I, LLC 1,140,791 California Emerging Ventures II, LLC 799,211 California Emerging Ventures III, LLC 1,132,587 California Emerging Ventures IV, LLC 1,650,318 Candover 1997 US 1, LP 57,842 Candover 2001 Fund, LP 945,668 Candover 2005 Fund US 1, LP 2,600,048 Capital Link 3,404,068 Carlyle Asia Growth Partners III, LP 1,633,150 Carlyle Asia Partners (PV II), LP 1,455,574 Carlyle Asia Partners II, LP 4,541,689 Carlyle Asia Venture Partners II, LP 775,485 Carlyle Europe Partners II, LP 115,435 Carlyle Europe Partners III, LP 3,358,950 Carlyle Europe Realty Partners, LP 182,182 Carlyle Japan Partners I, LP 337,984 Carlyle Japan Partners II, LP 2,563,647 Carlyle Mexico Partners, LP 483,480 Carlyle Partners II, LP 17,733 Carlyle Partners III, LP 248,004 Carlyle Partners IV, LP 1,086,495 Carlyle Partners V, LP 4,308,464 Carlyle Realty Qualifi ed Ptrs III, LP 341,392 Carlyle Strategic Partners I, LP 217,397 Carlyle Strategic Partners II, LP 55,663 Carlyle Venture Partners II, LP 772,175 Carlyle Venture Partners III, LP 1,375,402 Carlyle/Riverstone Global Energy and Power Fund II, LP 1,815,251 Carlyle/Riverstone Global Energy and Power Fund III, LP 3,588,030 Carlyle/Riverstone Renewable Energy Infrastructure Fund I, LP 1,431,182 China Privatization Fund (DEL), LP 4,815,839 Clarus Lifesciences I, LP 430,733 Clearstone Venture Partners III - A, LP 7,635 Clearwater Capital Partners Fund II Holdings, LP 1,333,144 Clearwater Capital Partners Fund III, LP 2,145,331 Clearwater Capital Partners I, LP 470,303 Clessidra Capital Partners 895,145 Coller International Partners II, LP 557,360 Coller International Partners III, LP 545,704 Coller International Partners IV, LP 887,176 Coller International Partners V, LP 5,280,021 Court Square Capital Partners II, LP 1,902,801 Craton Equity Investors I, LP 371,647 CVC Capital Partners Asia Pacifi c II, LP 443,481 CVC European Equity Partners IV, LP 4,042,515 CVC European Equity Partners Tandem Fund 3,866,200 CVC II, LP 164,670 CVC III, LP 112,226 CVC, LP 60,187 Darby Converging Europe Mezzanine Fund 1,536,219 DFJ Element, LP 603,646 DFJ Frontier Fund, LP 485,129 Dominion Fund IV, LP 233,125 Dominion Fund V, LP 171,514 Doughty Hanson & Co. II, LP 21,209
Note:1 Fees and costs for the 1-year period ending December 31, 2007.
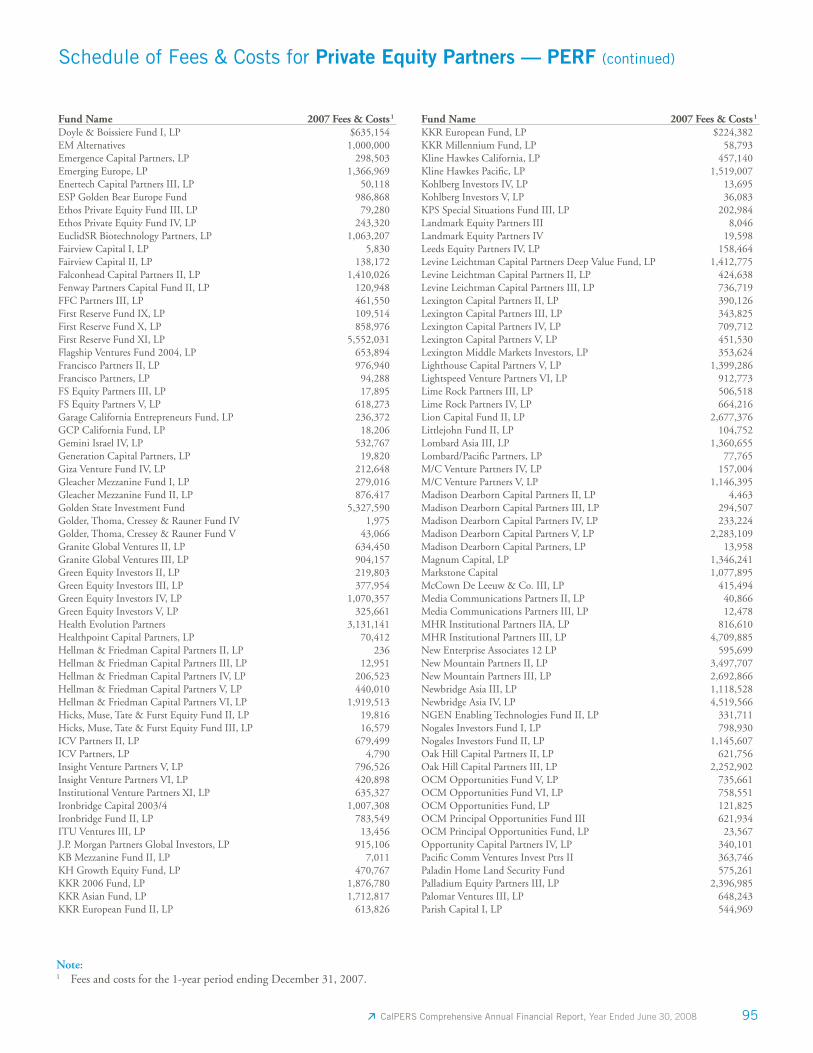
95 CalPERS Comprehensive Annual Financial Report, Year Ended June 30, 2008
Note:1 Fees and costs for the 1-year period ending December 31, 2007.
Schedule of Fees & Costs for Private Equity Partners — PERF (continued)
Fund Name 2007 Fees & Costs 1
Doyle & Boissiere Fund I, LP $635,154 EM Alternatives 1,000,000 Emergence Capital Partners, LP 298,503 Emerging Europe, LP 1,366,969 Enertech Capital Partners III, LP 50,118 ESP Golden Bear Europe Fund 986,868 Ethos Private Equity Fund III, LP 79,280 Ethos Private Equity Fund IV, LP 243,320 EuclidSR Biotechnology Partners, LP 1,063,207 Fairview Capital I, LP 5,830 Fairview Capital II, LP 138,172 Falconhead Capital Partners II, LP 1,410,026 Fenway Partners Capital Fund II, LP 120,948 FFC Partners III, LP 461,550 First Reserve Fund IX, LP 109,514 First Reserve Fund X, LP 858,976 First Reserve Fund XI, LP 5,552,031 Flagship Ventures Fund 2004, LP 653,894 Francisco Partners II, LP 976,940 Francisco Partners, LP 94,288 FS Equity Partners III, LP 17,895 FS Equity Partners V, LP 618,273 Garage California Entrepreneurs Fund, LP 236,372 GCP California Fund, LP 18,206 Gemini Israel IV, LP 532,767 Generation Capital Partners, LP 19,820 Giza Venture Fund IV, LP 212,648 Gleacher Mezzanine Fund I, LP 279,016 Gleacher Mezzanine Fund II, LP 876,417 Golden State Investment Fund 5,327,590 Golder, Thoma, Cressey & Rauner Fund IV 1,975 Golder, Thoma, Cressey & Rauner Fund V 43,066 Granite Global Ventures II, LP 634,450 Granite Global Ventures III, LP 904,157 Green Equity Investors II, LP 219,803 Green Equity Investors III, LP 377,954 Green Equity Investors IV, LP 1,070,357 Green Equity Investors V, LP 325,661 Health Evolution Partners 3,131,141 Healthpoint Capital Partners, LP 70,412 Hellman & Friedman Capital Partners II, LP 236 Hellman & Friedman Capital Partners III, LP 12,951 Hellman & Friedman Capital Partners IV, LP 206,523 Hellman & Friedman Capital Partners V, LP 440,010 Hellman & Friedman Capital Partners VI, LP 1,919,513 Hicks, Muse, Tate & Furst Equity Fund II, LP 19,816 Hicks, Muse, Tate & Furst Equity Fund III, LP 16,579 ICV Partners II, LP 679,499 ICV Partners, LP 4,790 Insight Venture Partners V, LP 796,526 Insight Venture Partners VI, LP 420,898 Institutional Venture Partners XI, LP 635,327 Ironbridge Capital 2003/4 1,007,308 Ironbridge Fund II, LP 783,549 ITU Ventures III, LP 13,456 J.P. Morgan Partners Global Investors, LP 915,106 KB Mezzanine Fund II, LP 7,011 KH Growth Equity Fund, LP 470,767 KKR 2006 Fund, LP 1,876,780 KKR Asian Fund, LP 1,712,817 KKR European Fund II, LP 613,826
Fund Name 2007 Fees & Costs 1
KKR European Fund, LP $224,382 KKR Millennium Fund, LP 58,793 Kline Hawkes California, LP 457,140 Kline Hawkes Pacifi c, LP 1,519,007 Kohlberg Investors IV, LP 13,695 Kohlberg Investors V, LP 36,083 KPS Special Situations Fund III, LP 202,984 Landmark Equity Partners III 8,046 Landmark Equity Partners IV 19,598 Leeds Equity Partners IV, LP 158,464 Levine Leichtman Capital Partners Deep Value Fund, LP 1,412,775 Levine Leichtman Capital Partners II, LP 424,638 Levine Leichtman Capital Partners III, LP 736,719 Lexington Capital Partners II, LP 390,126 Lexington Capital Partners III, LP 343,825 Lexington Capital Partners IV, LP 709,712 Lexington Capital Partners V, LP 451,530 Lexington Middle Markets Investors, LP 353,624 Lighthouse Capital Partners V, LP 1,399,286 Lightspeed Venture Partners VI, LP 912,773 Lime Rock Partners III, LP 506,518 Lime Rock Partners IV, LP 664,216 Lion Capital Fund II, LP 2,677,376 Littlejohn Fund II, LP 104,752 Lombard Asia III, LP 1,360,655 Lombard/Pacifi c Partners, LP 77,765 M/C Venture Partners IV, LP 157,004 M/C Venture Partners V, LP 1,146,395 Madison Dearborn Capital Partners II, LP 4,463 Madison Dearborn Capital Partners III, LP 294,507 Madison Dearborn Capital Partners IV, LP 233,224 Madison Dearborn Capital Partners V, LP 2,283,109 Madison Dearborn Capital Partners, LP 13,958 Magnum Capital, LP 1,346,241 Markstone Capital 1,077,895 McCown De Leeuw & Co. III, LP 415,494 Media Communications Partners II, LP 40,866 Media Communications Partners III, LP 12,478 MHR Institutional Partners IIA, LP 816,610 MHR Institutional Partners III, LP 4,709,885 New Enterprise Associates 12 LP 595,699 New Mountain Partners II, LP 3,497,707 New Mountain Partners III, LP 2,692,866 Newbridge Asia III, LP 1,118,528 Newbridge Asia IV, LP 4,519,566 NGEN Enabling Technologies Fund II, LP 331,711 Nogales Investors Fund I, LP 798,930 Nogales Investors Fund II, LP 1,145,607 Oak Hill Capital Partners II, LP 621,756 Oak Hill Capital Partners III, LP 2,252,902 OCM Opportunities Fund V, LP 735,661 OCM Opportunities Fund VI, LP 758,551 OCM Opportunities Fund, LP 121,825 OCM Principal Opportunities Fund III 621,934 OCM Principal Opportunities Fund, LP 23,567 Opportunity Capital Partners IV, LP 340,101 Pacifi c Comm Ventures Invest Ptrs II 363,746 Paladin Home Land Security Fund 575,261 Palladium Equity Partners III, LP 2,396,985 Palomar Ventures III, LP 648,243 Parish Capital I, LP 544,969
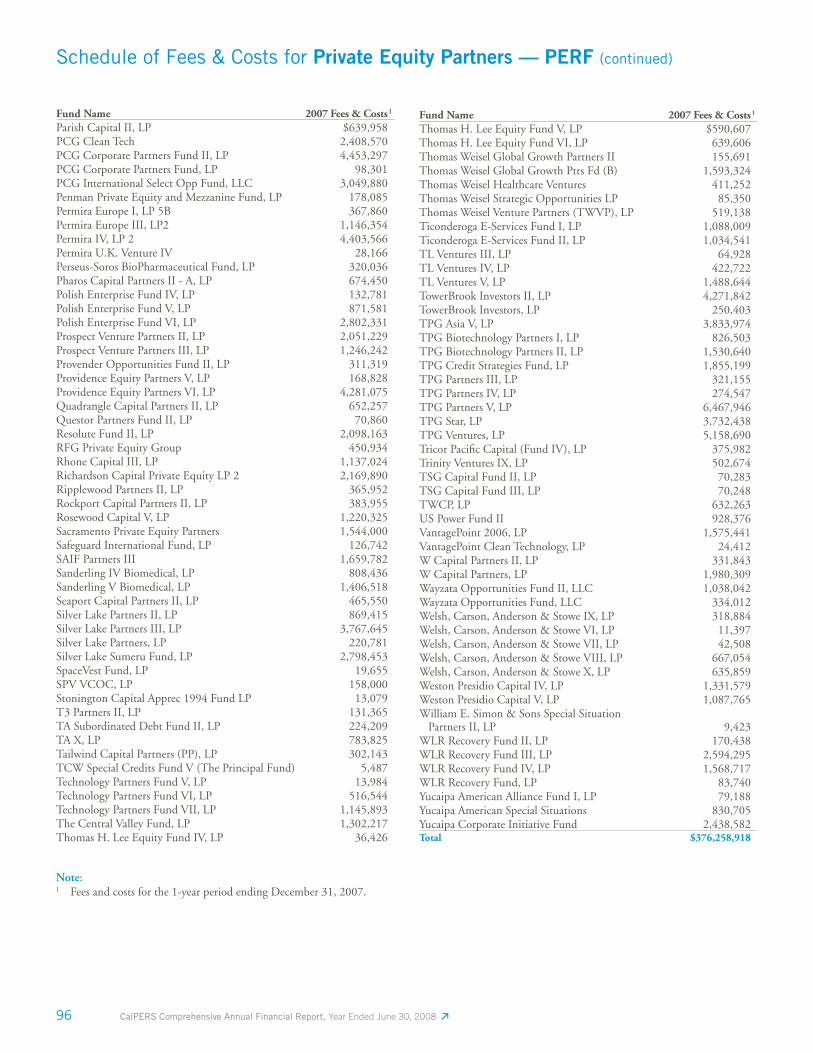
96 CalPERS Comprehensive Annual Financial Report, Year Ended June 30, 2008
Schedule of Fees & Costs for Private Equity Partners — PERF (continued)
Fund Name 2007 Fees & Costs 1
Parish Capital II, LP $639,958 PCG Clean Tech 2,408,570 PCG Corporate Partners Fund II, LP 4,453,297 PCG Corporate Partners Fund, LP 98,301 PCG International Select Opp Fund, LLC 3,049,880 Penman Private Equity and Mezzanine Fund, LP 178,085 Permira Europe I, LP 5B 367,860 Permira Europe III, LP2 1,146,354 Permira IV, LP 2 4,403,566 Permira U.K. Venture IV 28,166 Perseus-Soros BioPharmaceutical Fund, LP 320,036 Pharos Capital Partners II - A, LP 674,450 Polish Enterprise Fund IV, LP 132,781 Polish Enterprise Fund V, LP 871,581 Polish Enterprise Fund VI, LP 2,802,331 Prospect Venture Partners II, LP 2,051,229 Prospect Venture Partners III, LP 1,246,242 Provender Opportunities Fund II, LP 311,319 Providence Equity Partners V, LP 168,828 Providence Equity Partners VI, LP 4,281,075 Quadrangle Capital Partners II, LP 652,257 Questor Partners Fund II, LP 70,860 Resolute Fund II, LP 2,098,163 RFG Private Equity Group 450,934 Rhone Capital III, LP 1,137,024 Richardson Capital Private Equity LP 2 2,169,890 Ripplewood Partners II, LP 365,952 Rockport Capital Partners II, LP 383,955 Rosewood Capital V, LP 1,220,325 Sacramento Private Equity Partners 1,544,000 Safeguard International Fund, LP 126,742 SAIF Partners III 1,659,782 Sanderling IV Biomedical, LP 808,436 Sanderling V Biomedical, LP 1,406,518 Seaport Capital Partners II, LP 465,550 Silver Lake Partners II, LP 869,415 Silver Lake Partners III, LP 3,767,645 Silver Lake Partners, LP 220,781 Silver Lake Sumeru Fund, LP 2,798,453 SpaceVest Fund, LP 19,655 SPV VCOC, LP 158,000 Stonington Capital Apprec 1994 Fund LP 13,079 T3 Partners II, LP 131,365 TA Subordinated Debt Fund II, LP 224,209 TA X, LP 783,825 Tailwind Capital Partners (PP), LP 302,143 TCW Special Credits Fund V (The Principal Fund) 5,487 Technology Partners Fund V, LP 13,984 Technology Partners Fund VI, LP 516,544 Technology Partners Fund VII, LP 1,145,893 The Central Valley Fund, LP 1,302,217 Thomas H. Lee Equity Fund IV, LP 36,426
Fund Name 2007 Fees & Costs 1
Thomas H. Lee Equity Fund V, LP $590,607 Thomas H. Lee Equity Fund VI, LP 639,606 Thomas Weisel Global Growth Partners II 155,691 Thomas Weisel Global Growth Ptrs Fd (B) 1,593,324 Thomas Weisel Healthcare Ventures 411,252 Thomas Weisel Strategic Opportunities LP 85,350 Thomas Weisel Venture Partners (TWVP), LP 519,138 Ticonderoga E-Services Fund I, LP 1,088,009 Ticonderoga E-Services Fund II, LP 1,034,541 TL Ventures III, LP 64,928 TL Ventures IV, LP 422,722 TL Ventures V, LP 1,488,644 TowerBrook Investors II, LP 4,271,842 TowerBrook Investors, LP 250,403 TPG Asia V, LP 3,833,974 TPG Biotechnology Partners I, LP 826,503 TPG Biotechnology Partners II, LP 1,530,640 TPG Credit Strategies Fund, LP 1,855,199 TPG Partners III, LP 321,155 TPG Partners IV, LP 274,547 TPG Partners V, LP 6,467,946 TPG Star, LP 3,732,438 TPG Ventures, LP 5,158,690 Tricor Pacifi c Capital (Fund IV), LP 375,982 Trinity Ventures IX, LP 502,674 TSG Capital Fund II, LP 70,283 TSG Capital Fund III, LP 70,248 TWCP, LP 632,263 US Power Fund II 928,376 VantagePoint 2006, LP 1,575,441 VantagePoint Clean Technology, LP 24,412 W Capital Partners II, LP 331,843 W Capital Partners, LP 1,980,309 Wayzata Opportunities Fund II, LLC 1,038,042 Wayzata Opportunities Fund, LLC 334,012 Welsh, Carson, Anderson & Stowe IX, LP 318,884 Welsh, Carson, Anderson & Stowe VI, LP 11,397 Welsh, Carson, Anderson & Stowe VII, LP 42,508 Welsh, Carson, Anderson & Stowe VIII, LP 667,054 Welsh, Carson, Anderson & Stowe X, LP 635,859 Weston Presidio Capital IV, LP 1,331,579 Weston Presidio Capital V, LP 1,087,765 William E. Simon & Sons Special Situation Partners II, LP 9,423 WLR Recovery Fund II, LP 170,438 WLR Recovery Fund III, LP 2,594,295 WLR Recovery Fund IV, LP 1,568,717 WLR Recovery Fund, LP 83,740 Yucaipa American Alliance Fund I, LP 79,188 Yucaipa American Special Situations 830,705 Yucaipa Corporate Initiative Fund 2,438,582 Total $376,258,918
Note:1 Fees and costs for the 1-year period ending December 31, 2007.
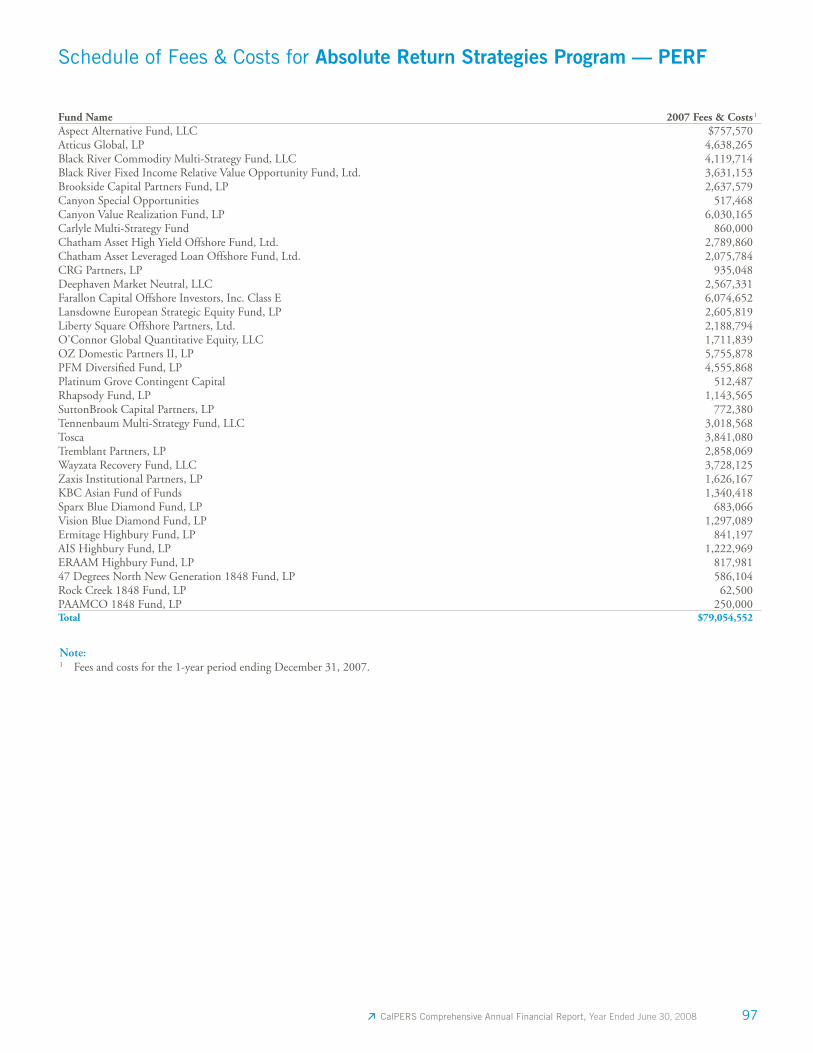
97 CalPERS Comprehensive Annual Financial Report, Year Ended June 30, 2008
Fund Name 2007 Fees & Costs 1
Aspect Alternative Fund, LLC $757,570 Atticus Global, LP 4,638,265 Black River Commodity Multi-Strategy Fund, LLC 4,119,714 Black River Fixed Income Relative Value Opportunity Fund, Ltd. 3,631,153 Brookside Capital Partners Fund, LP 2,637,579 Canyon Special Opportunities 517,468 Canyon Value Realization Fund, LP 6,030,165 Carlyle Multi-Strategy Fund 860,000 Chatham Asset High Yield Offshore Fund, Ltd. 2,789,860 Chatham Asset Leveraged Loan Offshore Fund, Ltd. 2,075,784 CRG Partners, LP 935,048 Deephaven Market Neutral, LLC 2,567,331 Farallon Capital Offshore Investors, Inc. Class E 6,074,652 Lansdowne European Strategic Equity Fund, LP 2,605,819 Liberty Square Offshore Partners, Ltd. 2,188,794 O'Connor Global Quantitative Equity, LLC 1,711,839 OZ Domestic Partners II, LP 5,755,878 PFM Diversifi ed Fund, LP 4,555,868 Platinum Grove Contingent Capital 512,487 Rhapsody Fund, LP 1,143,565 SuttonBrook Capital Partners, LP 772,380 Tennenbaum Multi-Strategy Fund, LLC 3,018,568 Tosca 3,841,080 Tremblant Partners, LP 2,858,069 Wayzata Recovery Fund, LLC 3,728,125 Zaxis Institutional Partners, LP 1,626,167 KBC Asian Fund of Funds 1,340,418 Sparx Blue Diamond Fund, LP 683,066 Vision Blue Diamond Fund, LP 1,297,089 Ermitage Highbury Fund, LP 841,197 AIS Highbury Fund, LP 1,222,969 ERAAM Highbury Fund, LP 817,981 47 Degrees North New Generation 1848 Fund, LP 586,104 Rock Creek 1848 Fund, LP 62,500 PAAMCO 1848 Fund, LP 250,000 Total $79,054,552
Schedule of Fees & Costs for Absolute Return Strategies Program — PERF
Note:1 Fees and costs for the 1-year period ending December 31, 2007.
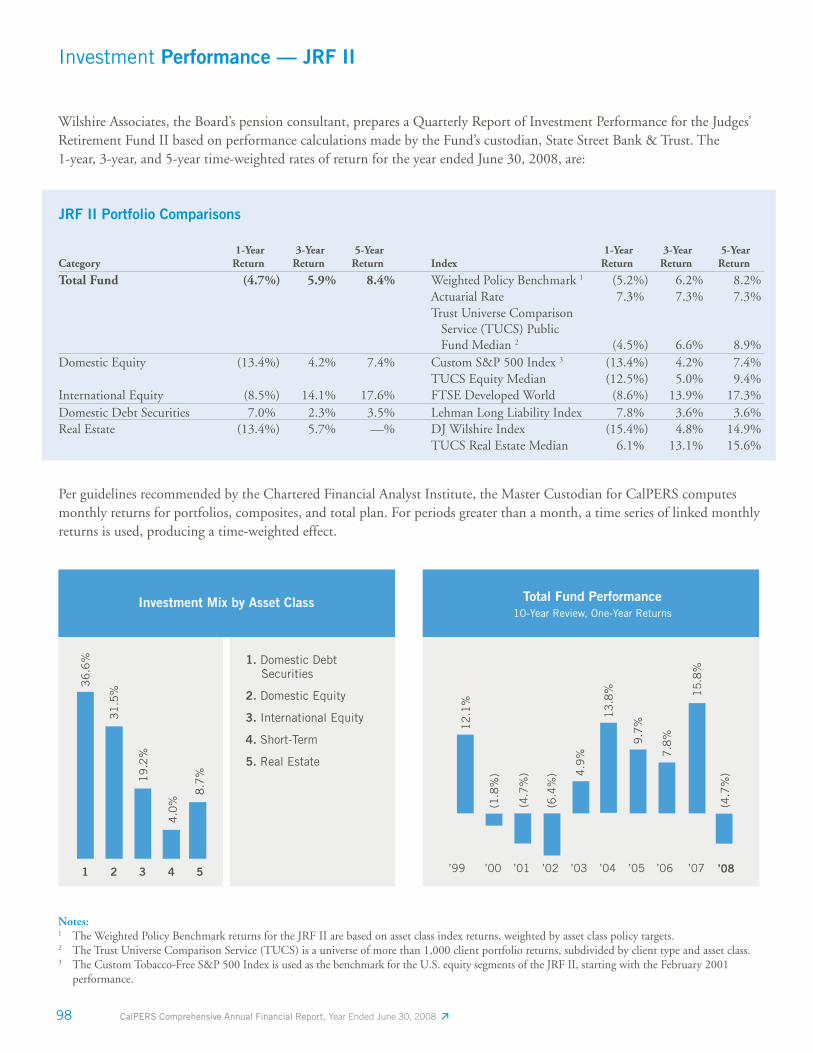
98 CalPERS Comprehensive Annual Financial Report, Year Ended June 30, 2008
1 2 3 4 5
JRF II Portfolio Comparisons
Category1-Year
Return3-Year
Return5-Year
Return Index1-Year
Return3-Year
Return5-Year
Return
Total Fund (4.7%) 5.9% 8.4% Weighted Policy Benchmark 1 (5.2%) 6.2% 8.2%Actuarial Rate 7.3% 7.3% 7.3%Trust Universe Comparison Service (TUCS) Public Fund Median 2 (4.5%) 6.6% 8.9%
Domestic Equity (13.4%) 4.2% 7.4% Custom S&P 500 Index 3 (13.4%) 4.2% 7.4%TUCS Equity Median (12.5%) 5.0% 9.4%
International Equity (8.5%) 14.1% 17.6% FTSE Developed World (8.6%) 13.9% 17.3%Domestic Debt Securities 7.0% 2.3% 3.5% Lehman Long Liability Index 7.8% 3.6% 3.6%Real Estate (13.4%) 5.7% —% DJ Wilshire Index (15.4%) 4.8% 14.9%
TUCS Real Estate Median 6.1% 13.1% 15.6%
Per guidelines recommended by the Chartered Financial Analyst Institute, the Master Custodian for CalPERS computes monthly returns for portfolios, composites, and total plan. For periods greater than a month, a time series of linked monthly returns is used, producing a time-weighted effect.
Notes:1 The Weighted Policy Benchmark returns for the JRF II are based on asset class index returns, weighted by asset class policy targets.2 The Trust Universe Comparison Service (TUCS) is a universe of more than 1,000 client portfolio returns, subdivided by client type and asset class.3 The Custom Tobacco-Free S&P 500 Index is used as the benchmark for the U.S. equity segments of the JRF II, starting with the February 2001
performance.
Investment Performance — JRF II
12
.1%
(1.8
%)
(4.7
%)
(6.4
%) 4
.9%
13
.8%
9.7
%
36
.6%
31
.5%
19
.2%
4.0
%
8.7
%
7.8
%
Wilshire Associates, the Board’s pension consultant, prepares a Quarterly Report of Investment Performance for the Judges’ Retirement Fund II based on performance calculations made by the Fund’s custodian, State Street Bank & Trust. The 1-year, 3-year, and 5-year time-weighted rates of return for the year ended June 30, 2008, are:
15
.8%
(4.7
%)
’99 ’00 ’01 ’02 ’03 ’04 ’05 ’06 ’07 ’08
1. Domestic Debt Securities
2. Domestic Equity
3. International Equity
4. Short-Term
5. Real Estate
Total Fund Performance10-Year Review, One-Year Returns
Investment Mix by Asset Class
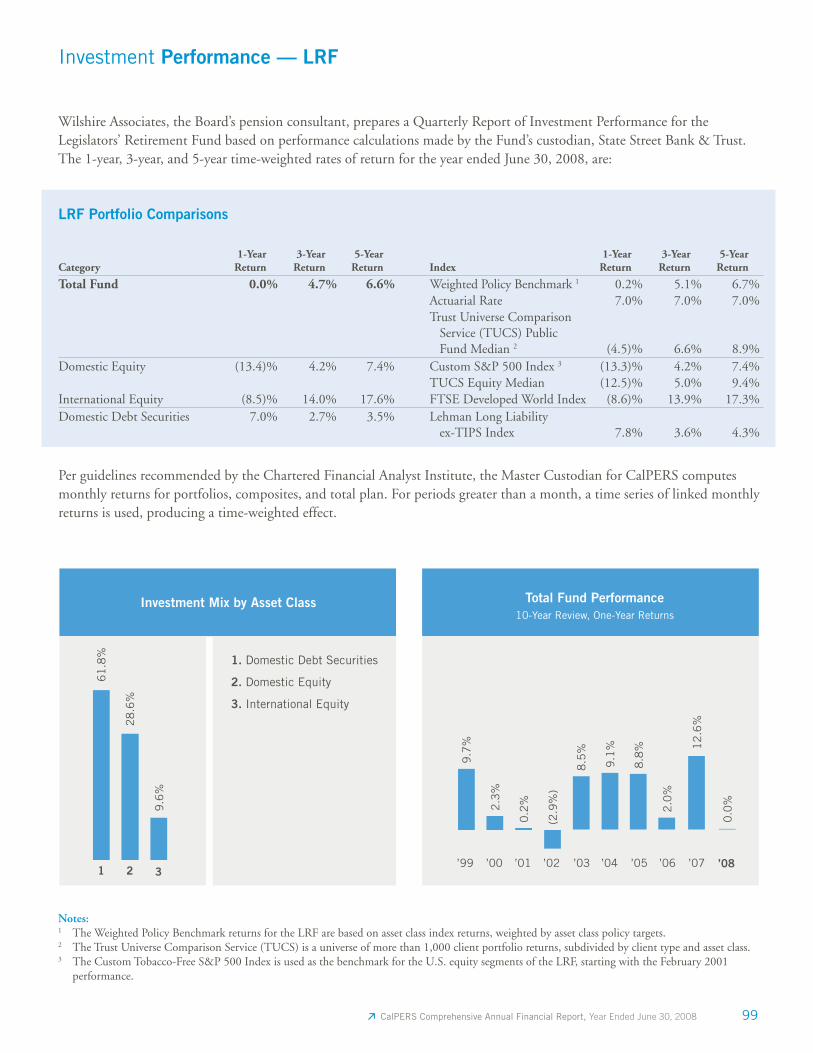
99 CalPERS Comprehensive Annual Financial Report, Year Ended June 30, 2008
1 2 3
61
.8%
28
.6%
9.6
%
LRF Portfolio Comparisons
Category1-Year
Return3-Year
Return5-Year
Return Index1-Year
Return3-Year
Return5-Year
Return
Total Fund 0.0% 4.7% 6.6% Weighted Policy Benchmark 1 0.2% 5.1% 6.7%Actuarial Rate 7.0% 7.0% 7.0%Trust Universe Comparison Service (TUCS) Public Fund Median 2 (4.5)% 6.6% 8.9%
Domestic Equity (13.4)% 4.2% 7.4% Custom S&P 500 Index 3 (13.3)% 4.2% 7.4%TUCS Equity Median (12.5)% 5.0% 9.4%
International Equity (8.5)% 14.0% 17.6% FTSE Developed World Index (8.6)% 13.9% 17.3%Domestic Debt Securities 7.0% 2.7% 3.5% Lehman Long Liability
ex-TIPS Index 7.8% 3.6% 4.3%
Per guidelines recommended by the Chartered Financial Analyst Institute, the Master Custodian for CalPERS computes monthly returns for portfolios, composites, and total plan. For periods greater than a month, a time series of linked monthly returns is used, producing a time-weighted effect.
Notes:1 The Weighted Policy Benchmark returns for the LRF are based on asset class index returns, weighted by asset class policy targets.2 The Trust Universe Comparison Service (TUCS) is a universe of more than 1,000 client portfolio returns, subdivided by client type and asset class.3 The Custom Tobacco-Free S&P 500 Index is used as the benchmark for the U.S. equity segments of the LRF, starting with the February 2001
performance.
Investment Performance — LRF
9.7
%
2.3
%
0.2
%
(2.9
%)
8.5
%
9.1
%
8.8
%
2.0
%
Wilshire Associates, the Board’s pension consultant, prepares a Quarterly Report of Investment Performance for the Legislators’ Retirement Fund based on performance calculations made by the Fund’s custodian, State Street Bank & Trust. The 1-year, 3-year, and 5-year time-weighted rates of return for the year ended June 30, 2008, are:
12
.6%
0.0
%
1. Domestic Debt Securities
2. Domestic Equity
3. International Equity
’99 ’00 ’01 ’02 ’03 ’04 ’05 ’06 ’07 ’08
Total Fund Performance10-Year Review, One-Year Returns
Investment Mix by Asset Class

100 CalPERS Comprehensive Annual Financial Report, Year Ended June 30, 2008

Actuarial Section
Holding the Line
CalPERS strives to minimize and stabilize employer
contributions. We reduce the volatility of employer rates
by spreading market gains and losses over 15 years;
we give early warning to help employers prepare; and
we maintain a rainy day fund for reserves.
102 CalPERS Comprehensive Annual Financial Report, Year Ended June 30, 2008
Actuarial and Employer Services BranchP.O. Box 942709Sacramento, CA 94229-2709
September 2008
The Board of Administration of the California Public Employees’ Retirement System:
As authorized, the CalPERS actuarial staff perform annual actuarial valuations of the CalPERS State, schools, and public agency plans; the latest such valuations are as of June 30, 2007.
The funding objective for each of these plans is to accumulate assets equal to 100 percent of the accrued liability as measured by the Entry Age Normal Cost method in a manner that keeps contributions approximately level as a percentage of payroll. Unfunded actuarial liabilities or surplus assets (excess assets) are amortized pursuant to Board policy such that the amortization payment is not less than that required to amortize an unfunded liability over 30 years.
The actuarial assumptions and methods used for funding purposes meet the parameters set for disclosures presented in the Financial Section by Governmental Accounting Standards Board Statements No. 25 and No. 43. In our opinion, the actuarial assumptions are internally consistent and produce results which are reasonable in the aggregate.
The valuations are based on the member and fi nancial data as of the valuation date, extracted from the various CalPERS databases. Both the membership and fi nancial data are subject to extensive tests for reasonableness.
Further, information has been provided by us for the completion of (i) the trend data schedules (Required Schedule of Funding Progress and Schedule of Employer Contributions) in the Financial Section, and (ii) Exhibits A through H in the Actuarial Section of the CAFR.
Ron Seeling, Ph.D., F.C.A., A.S.A., M.A.A.A.Enrolled ActuaryChief Actuary, CalPERS
CalPERS Actuarial Certifi cation
California Public Employees’ Retirement SystemLincoln Plaza 400 Q Street Sacramento, CA 95811
103 CalPERS Comprehensive Annual Financial Report, Year Ended June 30, 2008
CalPERS Actuarial Methods & Assumptions
Actuarial Methods
The ultimate cost that a retirement system such as CalPERS incurs is equal to benefi ts paid plus the expenses resulting from administration and fi nancing. These costs are paid through contributions to the plan and investment earnings on the System’s assets.
The actuarial valuations rely upon data extracted from central databases maintained by CalPERS. These databases are created from data supplied by the individual employers. The data was not audited by the actuarial staff, but appears to be reasonable for valuation purposes. Summary information regarding plan membership data for various groups is provided in Exhibits F through H.
Using each plan’s schedule of benefi ts, member data described above, and a set of actuarial assumptions, the plan’s actuary estimates the cost of the benefi ts to be paid. Then, using a particular actuarial funding method, the actuary allocates these costs to the fi scal years within the employee’s career.
In the case of the CalPERS plans with pay-related benefi ts, the fi nancial objective is to fund in a manner which keeps contribution rates approximately as a level percentage of payroll from generation to generation, while accumulating suffi cient assets over each member’s working career. The primary funding method used to accomplish this objective is the Entry Age Normal Cost Method. This method is used for all defi ned benefi t pay-related plans within CalPERS and for the Judges’ Retirement System II (JRS II). It is also used for the Indexed Level of 1959 Survivor Benefi ts. CalPERS uses the level dollar Aggregate Cost Method for those pay-related plans which are closed and declining in membership. This method is used for the Legislators’ Retirement System (LRS) and the Judges’ Retirement System (JRS).
For CalPERS non-pay-related plans, the fi nancial objective is to produce annual costs that coincide with the value of benefi ts earned for that year. The Term Insurance Cost Method is used for the plans within the 1959 Survivor Program that are not indexed and for the State Group Term Life Insurance Program.
Annual actuarial valuations are performed each June 30 using these methods. This report contains information through the most recent valuation date of June 30, 2007. Progress in fi nancing can be found in the Summary of Funding Progress, Exhibits A and B.
The actuarial assumptions and methods used for funding purposes meet the parameters set for disclosures presented in the Financial Section by Governmental Accounting Standards Board Statements No. 25 and No. 43.
Entry Age Normal Cost Method
Under the Entry Age Normal Cost Method, projected benefi ts are determined for all members. For active members, liabilities are spread in a manner that produces level annual costs as a percent of pay in each year from the age of hire (entry age) to the assumed retirement age. The cost allocated to the current fi scal year is called the normal cost. The actuarial accrued liability for active members is then calculated as the portion of the total cost of the plan allocated to prior years.
The actuarial accrued liability for members currently receiving benefi ts, for active members beyond the assumed retirement age, and for inactive members entitled to deferred benefi ts is equal to the present value of the benefi ts expected to be paid. No normal costs are applicable for these participants.
104 CalPERS Comprehensive Annual Financial Report, Year Ended June 30, 2008
CalPERS Actuarial Methods & Assumptions (continued)
The excess of the total actuarial accrued liability over the value of plan assets is called the unfunded actuarial accrued liability.
The required contribution is then determined by adding the normal cost and an amortization of the unfunded liability as a level percentage of assumed future payroll.
In the CalPERS case, the unfunded liability is broken down into components, or bases, according to their date of origin and the cause that gave rise to that component. A component of the unfunded liability that arose due to a change in plan provisions or in actuarial methods or assumptions is separately tracked and amortized over a declining 20-year period.
The actuarial assumptions discussed in this section are used to determine projected benefi ts. The effect of differences between those assumptions and the actual experience of the plan is calculated each year when the annual actuarial valuation is performed. These differences are actuarial gains or losses. Gains and losses are tracked separately and amortized over a rolling 30-year period.
A maximum 30-year amortization payment on the entire unfunded liability is enforced on the amortization methods described above. In addition, for those plans in which the amortization methods described above result in either mathematical inconsistencies or unreasonable actuarial results, all unfunded liability components are combined into a single base and amortized over a period of time, as determined by the CalPERS Chief Actuary. There is a minimum employer contribution equal to normal cost, less 30-year amortization of surplus (negative unfunded liability), if any.
Term Insurance Cost Method
The actuarial funding method for non-indexed levels of the 1959 Survivor Program is a modifi ed Term Insurance Cost Method. Under this method, there is no actuarial accrued liability for active members; all liability is due to current benefi ciaries. The normal cost is calculated as the amount needed to provide benefi ts to survivors of deaths expected in the next one-year period.
The Term Insurance Cost Method is also used for the State Group Term Life Insurance Program. The required contributions are calculated as one and one-half times the expected life insurance payments for the coming year less the current assets available to pay those benefi ts, but not less than zero.
Aggregate Cost Method
The Aggregate Cost Method is used for the LRS and JRS systems. Under this method, the difference between the present value of projected benefi ts and the assets of the plan is allocated over a specifi ed period of time as a level dollar amount. The amount allocated to the current fi scal year is called the normal cost. There is no actuarial accrued liability calculated using the Aggregate Cost Method.
105 CalPERS Comprehensive Annual Financial Report, Year Ended June 30, 2008
CalPERS Actuarial Methods & Assumptions (continued)
Asset Valuation Method
In order to dampen the effect of short-term market value fl uctuations on employer contribution rates, the following asset-smoothing technique is used: fi rst an Expected Value of Assets is computed by bringing forward the prior year’s Actuarial Value of Assets and the contributions received and benefi ts paid during the year at the assumed actuarial rate of return. The Actuarial Value of Assets is then computed as the Expected Value of Assets plus one-fi fteenth of the difference between the actual Market Value of Assets and the Expected Value of Assets as of the valuation date. However, in no case will the Actuarial Value of Assets be less than 80 percent or greater than 120 percent of the actual Market Value of Assets. This methodology is used in the valuations for all programs except the JRS, which uses an Actuarial Value of Assets equal to the Market Value of the Fund plus accrued interest.
Actuarial Assumptions
The actuarial assumptions used in determining actuarial liabilities and required employer contributions include both economic and non-economic assumptions. These assumptions represent the actuary’s best estimate of anticipated future experience and are reviewed in depth periodically.
Economic Assumptions
The economic assumptions include an assumed infl ation assumption of 3.0 percent compounded annually. The infl ation assumption is a component of assumed investment return, assumed wage growth, and assumed future post-retirement cost-of-living increases.
Based upon the asset allocation of the Public Employees’ Retirement Fund (PERF), the assumed investment return (net of administrative and investment expenses) is 7.75 percent per year, compounded annually. Different asset allocations and lower assumed investment returns apply to LRF, JRF, and JRF II.
The assumed investment returns for these three plans are 7.0 percent, 7.0 percent, and 7.25 percent, respectively.
For plans within CalPERS, the overall payroll is assumed to increase 3.25 percent annually. This is based upon the 3.0 percent infl ation assumption and a 0.25 percent per annum productivity increase assumption. The overall payroll growth assumption is used to project future payroll over which the unfunded liability is amortized.
For plans within CalPERS, the assumed growth in an individual employee’s future pay is composed of the 3.0 percent infl ation component, an additional 0.25 percent per annum productivity component, and an annual merit increase based on the member’s length of service. The service-based merit increase in an individual’s salary recognizes that larger salary increases tend to occur earlier in an employee’s career. Pay increase assumptions for individual members are shown for sample lengths of service in Exhibit C.
Non-Economic Assumptions
Non-economic assumptions for plans within the PERF are based upon demographic studies covering the period June 30, 1997 through June 30, 2002. The probabilities of service retirement, withdrawal from service, non-industrial disability, industrial disability, and death-in-service are shown for sample ages in Exhibit D. Individuals hired on or before June 30, 1982, are entitled to subsidized optional benefi ts. Certain valuation liabilities are increased to refl ect this subsidy.
Post-retirement mortality tables are based on CalPERS experience. These tables are used to estimate the value of benefi ts expected to be paid for service and disability retirements. For disability retirements, impaired longevity is recognized by a separate table. Sample life annuity values based on these tables are shown in Exhibit E.

106 CalPERS Comprehensive Annual Financial Report, Year Ended June 30, 2008
Changes in Actuarial Methods
There were no changes in actuarial methods since the prior year’s actuarial valuation.
Changes in Actuarial Assumptions
There were no changes in actuarial assumptions.
Changes in Plan Provisions
Public agencies can make changes to their plan provisions, and such changes occur on an ongoing basis. A summary of the plan provisions that were used for a specifi c plan can be found in Appendix B of the plan’s annual valuation report.
There were no changes in plan provisions since the prior valuation.
Changes Since Prior Valuation
107 CalPERS Comprehensive Annual Financial Report, Year Ended June 30, 2008
Summary of Funding Progress
Unfunded Liability & Funded Ratios
For the plans in CalPERS, unfunded actuarial accrued liabilities are the difference between Entry Age Normal Accrued Liabilities and the assets of the Fund. It is required that these unfunded liabilities be fi nanced systematically over future years.
Because of infl ation, comparing the dollar amounts of assets, benefi ts paid, member salaries, and unfunded actuarial accrued liabilities can be misleading. While no one or two measures can fully describe the fi nancial condition of a plan, the ratio of a pension plan’s actuarial value of assets to its liabilities provides a meaningful index. However, a better measure is the funded ratio based on the market value of assets. This is the true measure of a plan’s ability to pay benefi ts. The higher this ratio, the stronger the plan and observation of this ratio over a period of years can give an indication as to the fi nancial strength of the system. Both these measures are presented in Exhibit A.
Solvency Test
Exhibit B, Funding Progress — Solvency Test, demonstrates System solvency as measured under the Governmental Accounting Standards Board Statement No. 25.
Independent Review
To ensure the quality of its valuations, CalPERS contracts with independent consulting actuaries to review the valuations on a triennial basis.
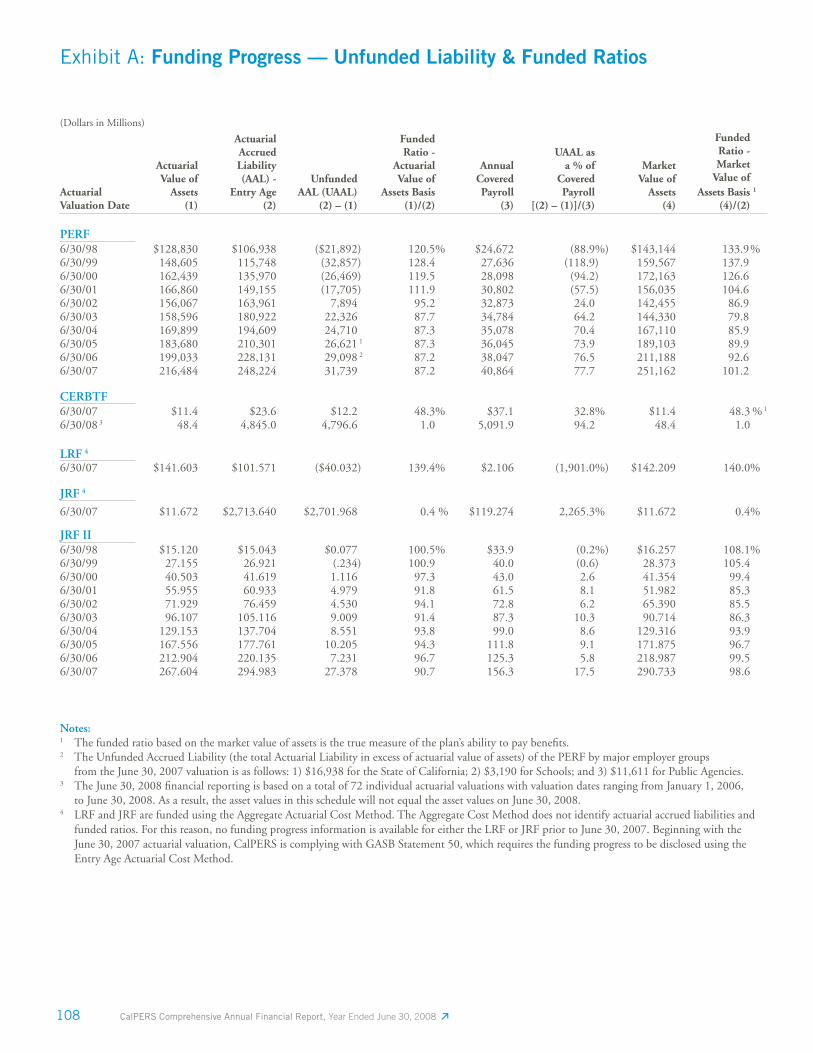
108 CalPERS Comprehensive Annual Financial Report, Year Ended June 30, 2008
(Dollars in Millions)
Actuarial Valuation Date
ActuarialValue of
Assets(1)
Actuarial AccruedLiability (AAL) -
Entry Age(2)
Unfunded AAL (UAAL)
(2) – (1)
Funded Ratio -
Actuarial Value of
Assets Basis (1)/(2)
Annual Covered Payroll
(3)
UAAL as a % of
Covered Payroll
[(2) – (1)]/(3)
MarketValue of
Assets(4)
Funded Ratio - Market Value of
Assets Basis(4)/(2)
1
PERF6/30/98 $128,830 $106,938 ($21,892) 120.5% $24,672 (88.9%) $143,144 133.9%6/30/99 148,605 115,748 (32,857) 128.4 27,636 (118.9) 159,567 137.9 6/30/00 162,439 135,970 (26,469) 119.5 28,098 (94.2) 172,163 126.6 6/30/01 166,860 149,155 (17,705) 111.9 30,802 (57.5) 156,035 104.6 6/30/02 156,067 163,961 7,894 95.2 32,873 24.0 142,455 86.9 6/30/03 158,596 180,922 22,326 87.7 34,784 64.2 144,330 79.8 6/30/04 169,899 194,609 24,710 87.3 35,078 70.4 167,110 85.9 6/30/05 183,680 210,301 26,621 1 87.3 36,045 73.9 189,103 89.9 6/30/06 199,033 228,131 29,098 2 87.2 38,047 76.5 211,188 92.6 6/30/07 216,484 248,224 31,739 87.2 40,864 77.7 251,162 101.2
CERBTF6/30/07 $11.4 $23.6 $12.2 48.3% $37.1 32.8% $11.4 48.3 % 1
6/30/08 3 48.4 4,845.0 4,796.6 1.0 5,091.9 94.2 48.4 1.0
LRF 4
6/30/07 $141.603 $101.571 ($40.032) 139.4% $2.106 (1,901.0%) $142.209 140.0%
JRF 4
6/30/07 $11.672 $2,713.640 $2,701.968 0.4 % $119.274 2,265.3% $11.672 0.4%
JRF II6/30/98 $15.120 $15.043 $0.077 100.5% $33.9 (0.2%) $16.257 108.1%6/30/99 27.155 26.921 (.234) 100.9 40.0 (0.6) 28.373 105.4 6/30/00 40.503 41.619 1.116 97.3 43.0 2.6 41.354 99.4 6/30/01 55.955 60.933 4.979 91.8 61.5 8.1 51.982 85.3 6/30/02 71.929 76.459 4.530 94.1 72.8 6.2 65.390 85.5 6/30/03 96.107 105.116 9.009 91.4 87.3 10.3 90.714 86.3 6/30/04 129.153 137.704 8.551 93.8 99.0 8.6 129.316 93.9 6/30/05 167.556 177.761 10.205 94.3 111.8 9.1 171.875 96.7 6/30/06 212.904 220.135 7.231 96.7 125.3 5.8 218.987 99.5 6/30/07 267.604 294.983 27.378 90.7 156.3 17.5 290.733 98.6
Exhibit A: Funding Progress — Unfunded Liability & Funded Ratios
Notes:1 The funded ratio based on the market value of assets is the true measure of the plan’s ability to pay benefi ts.2 The Unfunded Accrued Liability (the total Actuarial Liability in excess of actuarial value of assets) of the PERF by major employer groups from the June 30, 2007 valuation is as follows: 1) $16,938 for the State of California; 2) $3,190 for Schools; and 3) $11,611 for Public Agencies.3 The June 30, 2008 fi nancial reporting is based on a total of 72 individual actuarial valuations with valuation dates ranging from January 1, 2006,
to June 30, 2008. As a result, the asset values in this schedule will not equal the asset values on June 30, 2008.4 LRF and JRF are funded using the Aggregate Actuarial Cost Method. The Aggregate Cost Method does not identify actuarial accrued liabilities and
funded ratios. For this reason, no funding progress information is available for either the LRF or JRF prior to June 30, 2007. Beginning with the June 30, 2007 actuarial valuation, CalPERS is complying with GASB Statement 50, which requires the funding progress to be disclosed using the Entry Age Actuarial Cost Method.
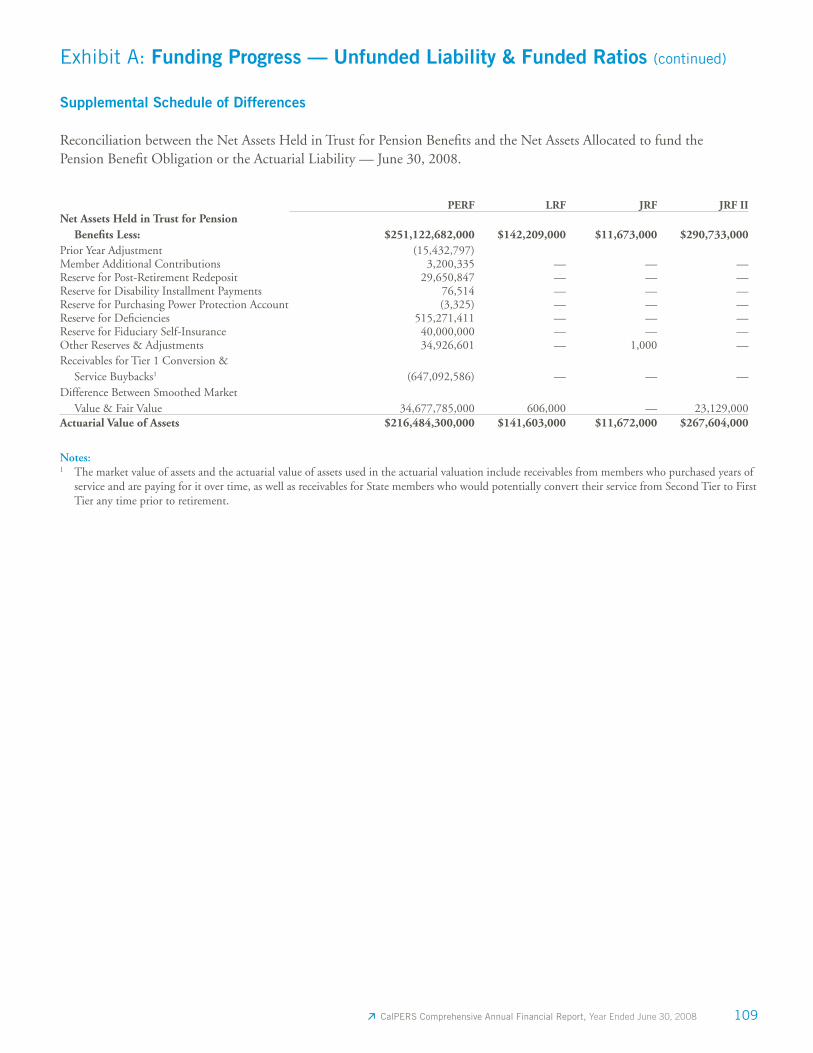
109 CalPERS Comprehensive Annual Financial Report, Year Ended June 30, 2008
Supplemental Schedule of Differences
Reconciliation between the Net Assets Held in Trust for Pension Benefi ts and the Net Assets Allocated to fund the Pension Benefi t Obligation or the Actuarial Liability — June 30, 2008.
PERF LRF JRF JRF IINet Assets Held in Trust for Pension Benefi ts Less: $251,122,682,000 $142,209,000 $11,673,000 $290,733,000Prior Year Adjustment (15,432,797)Member Additional Contributions 3,200,335 — — —Reserve for Post-Retirement Redeposit 29,650,847 — — —Reserve for Disability Installment Payments 76,514 — — —Reserve for Purchasing Power Protection Account (3,325) — — —Reserve for Defi ciencies 515,271,411 — — —Reserve for Fiduciary Self-Insurance 40,000,000 — — —Other Reserves & Adjustments 34,926,601 — 1,000 —Receivables for Tier 1 Conversion & Service Buybacks1 (647,092,586) — — —Difference Between Smoothed Market Value & Fair Value 34,677,785,000 606,000 — 23,129,000Actuarial Value of Assets $216,484,300,000 $141,603,000 $11,672,000 $267,604,000
Notes: 1 The market value of assets and the actuarial value of assets used in the actuarial valuation include receivables from members who purchased years of
service and are paying for it over time, as well as receivables for State members who would potentially convert their service from Second Tier to First Tier any time prior to retirement.
Exhibit A: Funding Progress — Unfunded Liability & Funded Ratios (continued)
110 CalPERS Comprehensive Annual Financial Report, Year Ended June 30, 2008
The funding objective for a retirement system is to be able to pay long-term benefi t promises through contributions that remain approximately level from year to year as a percent of salaries earned by members. In this way, members and employers in each year pay their fair share for retirement services accrued in that year by the retirement system’s members.
If a system follows level contribution rate fi nancing principles, it will pay all promised benefi ts when due — the ultimate test of fi nancial soundness.
A short-term solvency test is one means of checking a system’s funding progress. In a short-term solvency test, the plan’s present assets (investments and cash) are compared with 1) member contributions on deposit, 2) the liabilities for future benefi ts to persons who have retired or
terminated, and 3) the liabilities for projected benefi ts for service already rendered by active members. In a system that has been following the discipline of level contribution rate fi nancing, the liabilities for member contributions on deposit (liability 1) and the liabilities for future benefi ts to present retirees (liability 2) will be fully covered by present assets, except in rare circumstances.
In addition, the liabilities for service already rendered by members (liability 3) will be partially covered by the remainder of present assets. Generally, if the system has been using level contribution rate fi nancing, the funded portion of liability 3 will increase over time.
Exhibit B illustrates the progress of funding liability of the PERF, JRF, JRF II, and LRF.
Exhibit B: Funding Progress — Solvency Test
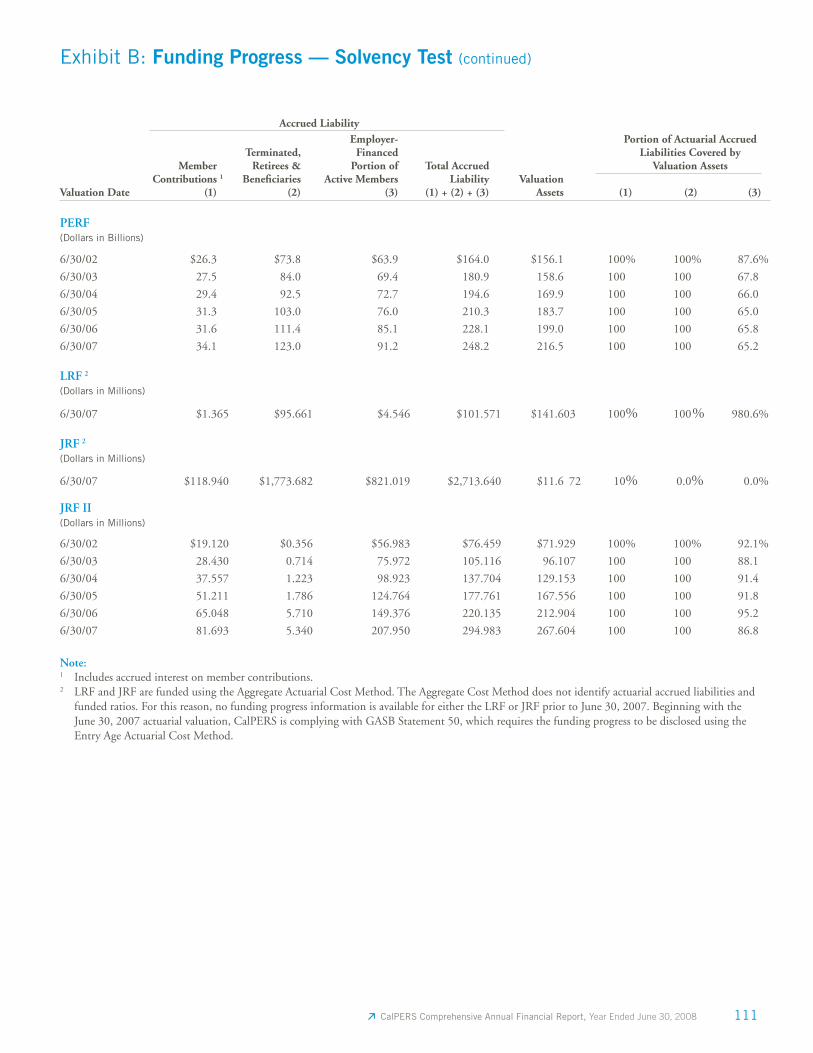
111 CalPERS Comprehensive Annual Financial Report, Year Ended June 30, 2008
Note:1 Includes accrued interest on member contributions.2 LRF and JRF are funded using the Aggregate Actuarial Cost Method. The Aggregate Cost Method does not identify actuarial accrued liabilities and
funded ratios. For this reason, no funding progress information is available for either the LRF or JRF prior to June 30, 2007. Beginning with the June 30, 2007 actuarial valuation, CalPERS is complying with GASB Statement 50, which requires the funding progress to be disclosed using the Entry Age Actuarial Cost Method.
Accrued Liability
Valuation Date
Member Contributions
(1)
1
Terminated, Retirees &
Benefi ciaries (2)
Employer-Financed
Portion of Active Members
(3)
Total AccruedLiability
(1) + (2) + (3)Valuation
Assets
Portion of Actuarial AccruedLiabilities Covered by
Valuation Assets
(1) (2) (3)
PERF (Dollars in Billions)
6/30/02 $26.3 $73.8 $63.9 $164.0 $156.1 100% 100% 87.6%
6/30/03 27.5 84.0 69.4 180.9 158.6 100 100 67.8
6/30/04 29.4 92.5 72.7 194.6 169.9 100 100 66.0
6/30/05 31.3 103.0 76.0 210.3 183.7 100 100 65.0
6/30/06 31.6 111.4 85.1 228.1 199.0 100 100 65.8
6/30/07 34.1 123.0 91.2 248.2 216.5 100 100 65.2
LRF 2
(Dollars in Millions)
6/30/07 $1.365 $95.661 $4.546 $101.571 $141.603 100% 100% 980.6%
JRF 2 (Dollars in Millions)
6/30/07 $118.940 $1,773.682 $821.019 $2,713.640 $11.6 72 10% 0.0% 0.0%
JRF II (Dollars in Millions)
6/30/02 $19.1 20 $0.356 $56.983 $76.459 $71.929 100% 100% 92.1%
6/30/03 28.430 0.714 75.972 105.116 96.107 100 100 88.1
6/30/04 37.557 1.223 98.923 137.704 129.153 100 100 91.4
6/30/05 51.211 1.786 124.764 177.761 167.556 100 100 91.8
6/30/06 65.048 5.710 149.376 220.135 212.904 100 100 95.2
6/30/07 81.693 5.340 207.950 294.983 267.604 100 100 86.8
Exhibit B: Funding Progress — Solvency Test (continued)
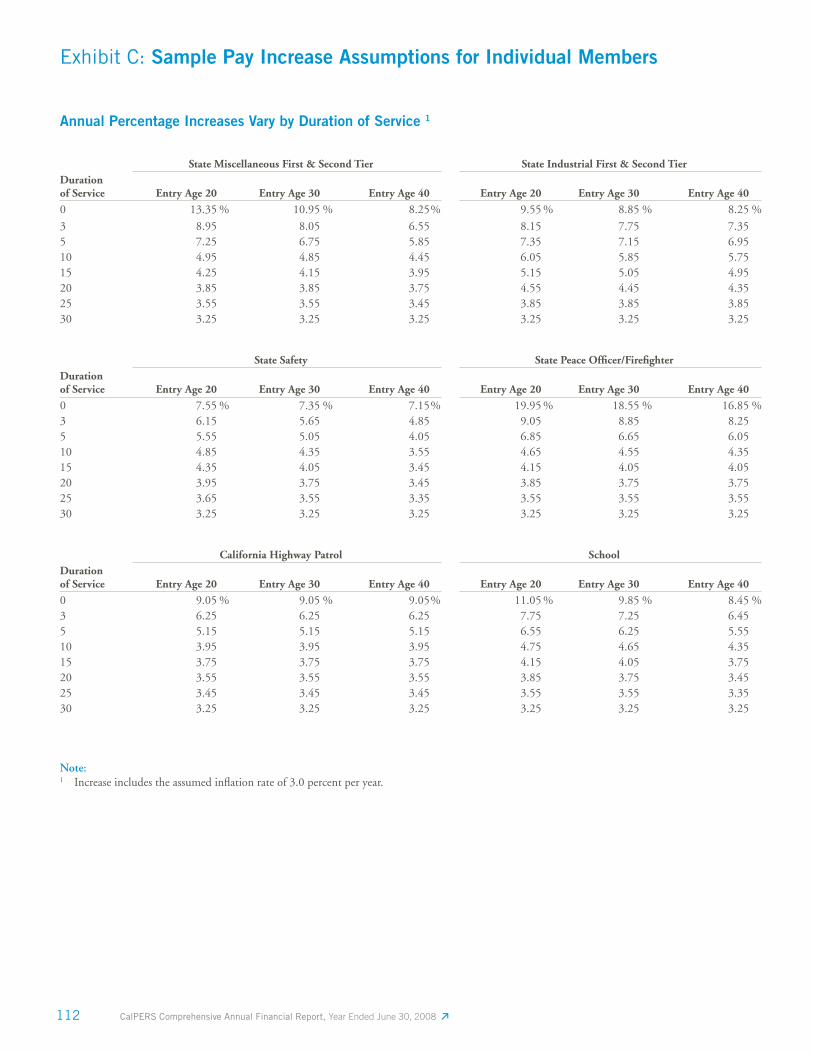
112 CalPERS Comprehensive Annual Financial Report, Year Ended June 30, 2008
Annual Percentage Increases Vary by Duration of Service 1
State Miscellaneous First & Second Tier State Industrial First & Second TierDuration of Service Entry Age 20 Entry Age 30 Entry Age 40 Entry Age 20 Entry Age 30 Entry Age 40
0 13.35 % 10.95 % 8.25% 9.55 % 8.85 % 8.25 %
3 8.95 8.05 6.55 8.15 7.75 7.355 7.25 6.75 5.85 7.35 7.15 6.9510 4.95 4.85 4.45 6.05 5.85 5.7515 4.25 4.15 3.95 5.15 5.05 4.9520 3.85 3.85 3.75 4.55 4.45 4.3525 3.55 3.55 3.45 3.85 3.85 3.8530 3.25 3.25 3.25 3.25 3.25 3.25
State Safety State Peace Offi cer/Firefi ghterDuration of Service Entry Age 20 Entry Age 30 Entry Age 40 Entry Age 20 Entry Age 30 Entry Age 40
0 7.55 % 7.35 % 7.15% 19.95 % 18.55 % 16.85 %3 6.15 5.65 4.85 9.05 8.85 8.255 5.55 5.05 4.05 6.85 6.65 6.0510 4.85 4.35 3.55 4.65 4.55 4.3515 4.35 4.05 3.45 4.15 4.05 4.0520 3.95 3.75 3.45 3.85 3.75 3.7525 3.65 3.55 3.35 3.55 3.55 3.5530 3.25 3.25 3.25 3.25 3.25 3.25
California Highway Patrol SchoolDuration of Service Entry Age 20 Entry Age 30 Entry Age 40 Entry Age 20 Entry Age 30 Entry Age 40
0 9.05 % 9.05 % 9.05% 11.05 % 9.85 % 8.45 %3 6.25 6.25 6.25 7.75 7.25 6.455 5.15 5.15 5.15 6.55 6.25 5.5510 3.95 3.95 3.95 4.75 4.65 4.3515 3.75 3.75 3.75 4.15 4.05 3.7520 3.55 3.55 3.55 3.85 3.75 3.4525 3.45 3.45 3.45 3.55 3.55 3.3530 3.25 3.25 3.25 3.25 3.25 3.25
Note:1 Increase includes the assumed infl ation rate of 3.0 percent per year.
Exhibit C: Sample Pay Increase Assumptions for Individual Members
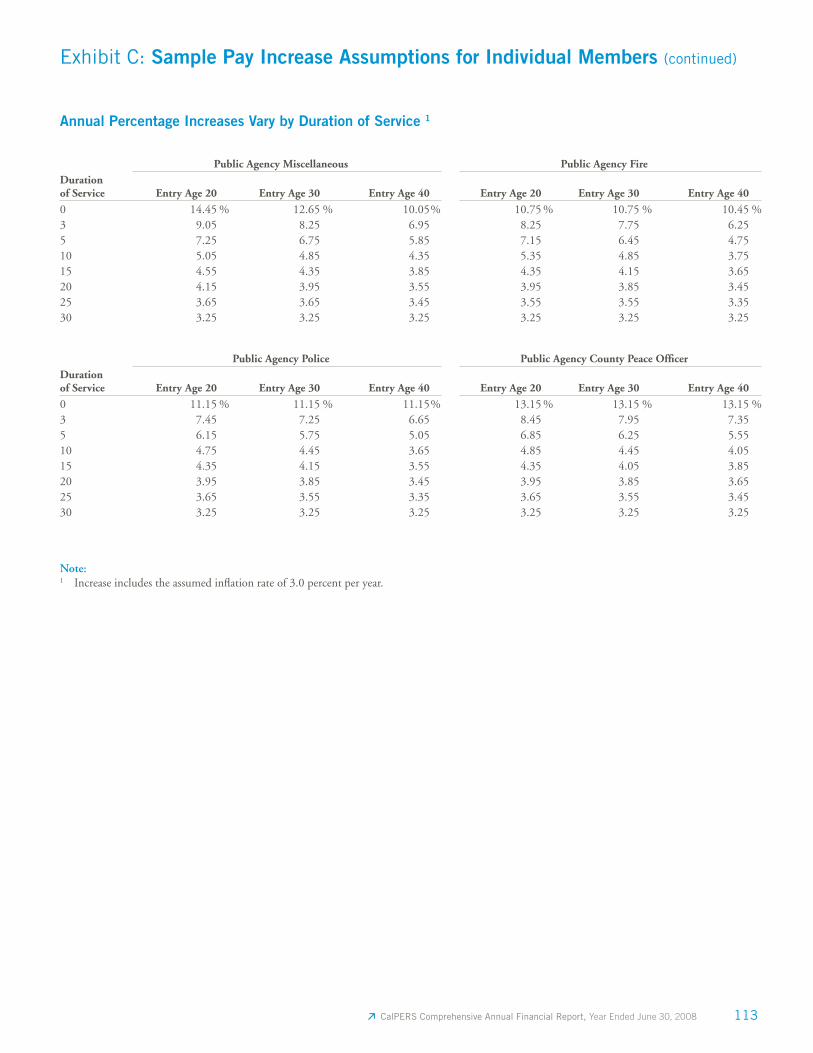
113 CalPERS Comprehensive Annual Financial Report, Year Ended June 30, 2008
Annual Percentage Increases Vary by Duration of Service 1
Public Agency Miscellaneous Public Agency FireDuration of Service Entry Age 20 Entry Age 30 Entry Age 40 Entry Age 20 Entry Age 30 Entry Age 40
0 14.45 % 12.65 % 10.05% 10.75 % 10.75 % 10.45 %3 9.05 8.25 6.95 8.25 7.75 6.255 7.25 6.75 5.85 7.15 6.45 4.7510 5.05 4.85 4.35 5.35 4.85 3.7515 4.55 4.35 3.85 4.35 4.15 3.6520 4.15 3.95 3.55 3.95 3.85 3.4525 3.65 3.65 3.45 3.55 3.55 3.3530 3.25 3.25 3.25 3.25 3.25 3.25
Public Agency Police Public Agency County Peace Offi cerDuration of Service Entry Age 20 Entry Age 30 Entry Age 40 Entry Age 20 Entry Age 30 Entry Age 40
0 11.15 % 11.15 % 11.15% 13.15 % 13.15 % 13.15 %3 7.45 7.25 6.65 8.45 7.95 7.355 6.15 5.75 5.05 6.85 6.25 5.5510 4.75 4.45 3.65 4.85 4.45 4.0515 4.35 4.15 3.55 4.35 4.05 3.8520 3.95 3.85 3.45 3.95 3.85 3.6525 3.65 3.55 3.35 3.65 3.55 3.4530 3.25 3.25 3.25 3.25 3.25 3.25
Note:1 Increase includes the assumed infl ation rate of 3.0 percent per year.
Exhibit C: Sample Pay Increase Assumptions for Individual Members (continued)
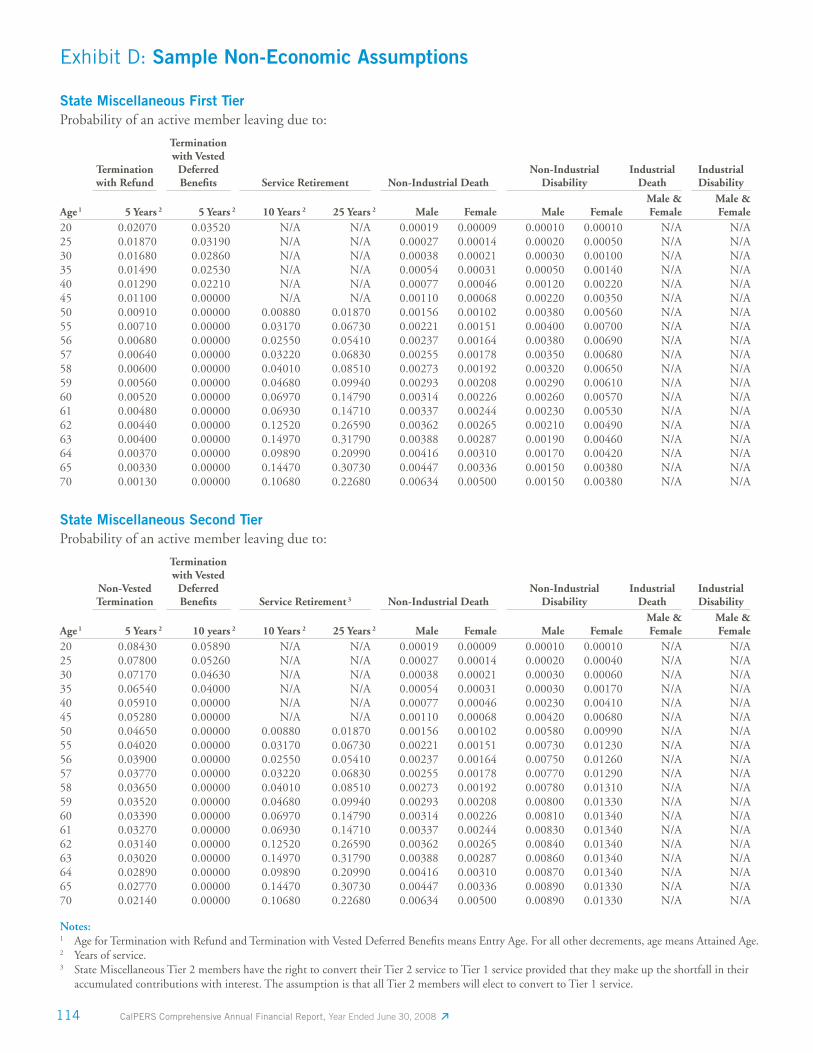
114 CalPERS Comprehensive Annual Financial Report, Year Ended June 30, 2008
State Miscellaneous First TierProbability of an active member leaving due to:
Age 1
Termination with Refund
2
Termination with Vested
Deferred Benefi ts
2
Service Retirement Non-Industrial DeathNon-Industrial
DisabilityIndustrial
DeathIndustrial Disability
5 Years 5 Years 10 Years 2 25 Years 2 Male Female Male FemaleMale & Female
Male & Female
20 0.02070 0.03520 N/A N/A 0.00019 0.00009 0.00010 0.00010 N/A N/A25 0.01870 0.03190 N/A N/A 0.00027 0.00014 0.00020 0.00050 N/A N/A30 0.01680 0.02860 N/A N/A 0.00038 0.00021 0.00030 0.00100 N/A N/A35 0.01490 0.02530 N/A N/A 0.00054 0.00031 0.00050 0.00140 N/A N/A40 0.01290 0.02210 N/A N/A 0.00077 0.00046 0.00120 0.00220 N/A N/A45 0.01100 0.00000 N/A N/A 0.00110 0.00068 0.00220 0.00350 N/A N/A50 0.00910 0.00000 0.00880 0.01870 0.00156 0.00102 0.00380 0.00560 N/A N/A55 0.00710 0.00000 0.03170 0.06730 0.00221 0.00151 0.00400 0.00700 N/A N/A56 0.00680 0.00000 0.02550 0.05410 0.00237 0.00164 0.00380 0.00690 N/A N/A57 0.00640 0.00000 0.03220 0.06830 0.00255 0.00178 0.00350 0.00680 N/A N/A58 0.00600 0.00000 0.04010 0.08510 0.00273 0.00192 0.00320 0.00650 N/A N/A59 0.00560 0.00000 0.04680 0.09940 0.00293 0.00208 0.00290 0.00610 N/A N/A60 0.00520 0.00000 0.06970 0.14790 0.00314 0.00226 0.00260 0.00570 N/A N/A61 0.00480 0.00000 0.06930 0.14710 0.00337 0.00244 0.00230 0.00530 N/A N/A62 0.00440 0.00000 0.12520 0.26590 0.00362 0.00265 0.00210 0.00490 N/A N/A63 0.00400 0.00000 0.14970 0.31790 0.00388 0.00287 0.00190 0.00460 N/A N/A64 0.00370 0.00000 0.09890 0.20990 0.00416 0.00310 0.00170 0.00420 N/A N/A65 0.00330 0.00000 0.14470 0.30730 0.00447 0.00336 0.00150 0.00380 N/A N/A70 0.00130 0.00000 0.10680 0.22680 0.00634 0.00500 0.00150 0.00380 N/A N/A
Notes: 1 Age for Termination with Refund and Termination with Vested Deferred Benefi ts means Entry Age. For all other decrements, age means Attained Age.2 Years of service.3 State Miscellaneous Tier 2 members have the right to convert their Tier 2 service to Tier 1 service provided that they make up the shortfall in their
accumulated contributions with interest. The assumption is that all Tier 2 members will elect to convert to Tier 1 service.
Exhibit D: Sample Non-Economic Assumptions
State Miscellaneous Second TierProbability of an active member leaving due to:
Age 1
Non-VestedTermination
2
Termination with Vested
Deferred Benefi ts
2
Service Retirement 3 Non-Industrial DeathNon-Industrial
DisabilityIndustrial
DeathIndustrial Disability
5 Years 10 years 10 Years 2 25 Years 2 Male Female Male FemaleMale & Female
Male & Female
20 0.08430 0.05890 N/A N/A 0.00019 0.00009 0.00010 0.00010 N/A N/A25 0.07800 0.05260 N/A N/A 0.00027 0.00014 0.00020 0.00040 N/A N/A30 0.07170 0.04630 N/A N/A 0.00038 0.00021 0.00030 0.00060 N/A N/A35 0.06540 0.04000 N/A N/A 0.00054 0.00031 0.00030 0.00170 N/A N/A40 0.05910 0.00000 N/A N/A 0.00077 0.00046 0.00230 0.00410 N/A N/A45 0.05280 0.00000 N/A N/A 0.00110 0.00068 0.00420 0.00680 N/A N/A50 0.04650 0.00000 0.00880 0.01870 0.00156 0.00102 0.00580 0.00990 N/A N/A55 0.04020 0.00000 0.03170 0.06730 0.00221 0.00151 0.00730 0.01230 N/A N/A56 0.03900 0.00000 0.02550 0.05410 0.00237 0.00164 0.00750 0.01260 N/A N/A57 0.03770 0.00000 0.03220 0.06830 0.00255 0.00178 0.00770 0.01290 N/A N/A58 0.03650 0.00000 0.04010 0.08510 0.00273 0.00192 0.00780 0.01310 N/A N/A59 0.03520 0.00000 0.04680 0.09940 0.00293 0.00208 0.00800 0.01330 N/A N/A60 0.03390 0.00000 0.06970 0.14790 0.00314 0.00226 0.00810 0.01340 N/A N/A61 0.03270 0.00000 0.06930 0.14710 0.00337 0.00244 0.00830 0.01340 N/A N/A62 0.03140 0.00000 0.12520 0.26590 0.00362 0.00265 0.00840 0.01340 N/A N/A63 0.03020 0.00000 0.14970 0.31790 0.00388 0.00287 0.00860 0.01340 N/A N/A64 0.02890 0.00000 0.09890 0.20990 0.00416 0.00310 0.00870 0.01340 N/A N/A65 0.02770 0.00000 0.14470 0.30730 0.00447 0.00336 0.00890 0.01330 N/A N/A70 0.02140 0.00000 0.10680 0.22680 0.00634 0.00500 0.00890 0.01330 N/A N/A
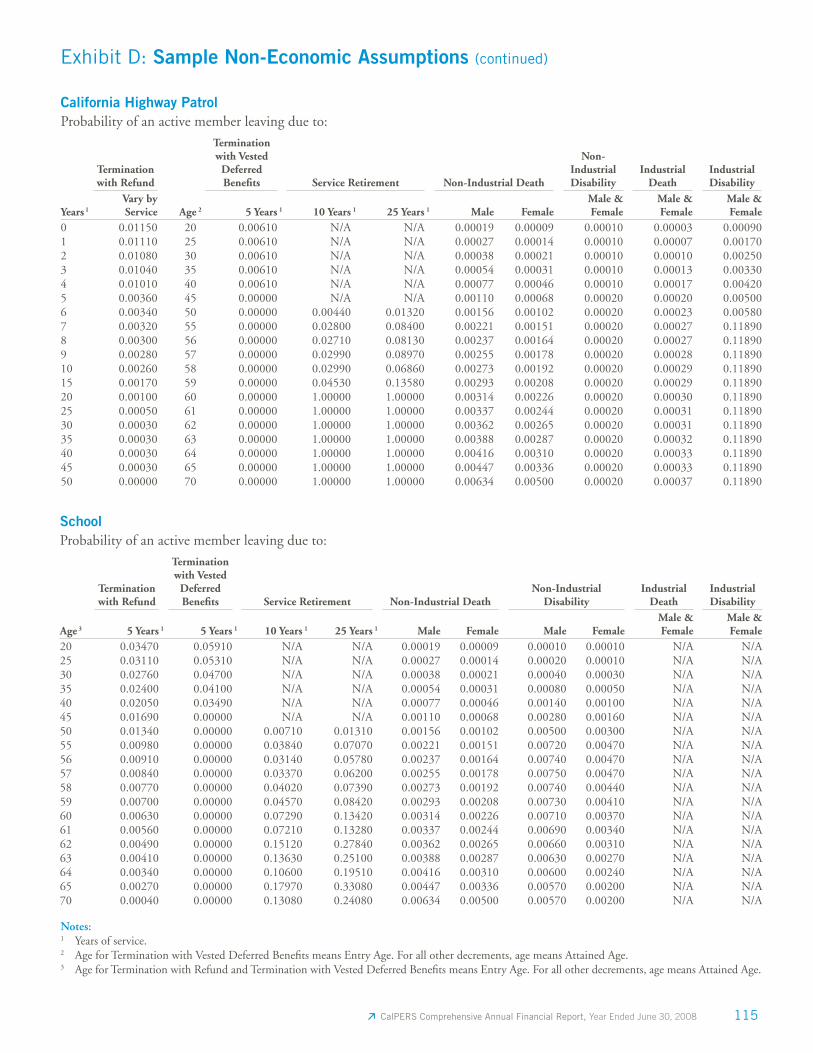
115 CalPERS Comprehensive Annual Financial Report, Year Ended June 30, 2008
Notes: 1 Years of service.2 Age for Termination with Vested Deferred Benefi ts means Entry Age. For all other decrements, age means Attained Age.3 Age for Termination with Refund and Termination with Vested Deferred Benefi ts means Entry Age. For all other decrements, age means Attained Age.
Exhibit D: Sample Non-Economic Assumptions (continued)
California Highway PatrolProbability of an active member leaving due to:
Years 1
Termination with Refund
Age 2
Termination with Vested
Deferred Benefi ts
1
Service Retirement Non-Industrial Death
Non-IndustrialDisability
Industrial Death
Industrial Disability
Vary by Service 5 Years 10 Years 1 25 Years 1 Male Female
Male & Female
Male & Female
Male & Female
0 0.01150 20 0.00610 N/A N/A 0.00019 0.00009 0.00010 0.00003 0.000901 0.01110 25 0.00610 N/A N/A 0.00027 0.00014 0.00010 0.00007 0.001702 0.01080 30 0.00610 N/A N/A 0.00038 0.00021 0.00010 0.00010 0.002503 0.01040 35 0.00610 N/A N/A 0.00054 0.00031 0.00010 0.00013 0.003304 0.01010 40 0.00610 N/A N/A 0.00077 0.00046 0.00010 0.00017 0.004205 0.00360 45 0.00000 N/A N/A 0.00110 0.00068 0.00020 0.00020 0.005006 0.00340 50 0.00000 0.00440 0.01320 0.00156 0.00102 0.00020 0.00023 0.005807 0.00320 55 0.00000 0.02800 0.08400 0.00221 0.00151 0.00020 0.00027 0.118908 0.00300 56 0.00000 0.02710 0.08130 0.00237 0.00164 0.00020 0.00027 0.118909 0.00280 57 0.00000 0.02990 0.08970 0.00255 0.00178 0.00020 0.00028 0.1189010 0.00260 58 0.00000 0.02990 0.06860 0.00273 0.00192 0.00020 0.00029 0.1189015 0.00170 59 0.00000 0.04530 0.13580 0.00293 0.00208 0.00020 0.00029 0.1189020 0.00100 60 0.00000 1.00000 1.00000 0.00314 0.00226 0.00020 0.00030 0.1189025 0.00050 61 0.00000 1.00000 1.00000 0.00337 0.00244 0.00020 0.00031 0.1189030 0.00030 62 0.00000 1.00000 1.00000 0.00362 0.00265 0.00020 0.00031 0.1189035 0.00030 63 0.00000 1.00000 1.00000 0.00388 0.00287 0.00020 0.00032 0.1189040 0.00030 64 0.00000 1.00000 1.00000 0.00416 0.00310 0.00020 0.00033 0.1189045 0.00030 65 0.00000 1.00000 1.00000 0.00447 0.00336 0.00020 0.00033 0.1189050 0.00000 70 0.00000 1.00000 1.00000 0.00634 0.00500 0.00020 0.00037 0.11890
SchoolProbability of an active member leaving due to:
Age 3
Termination with Refund
1
Termination with Vested
Deferred Benefi ts
1
Service Retirement Non-Industrial DeathNon-Industrial
DisabilityIndustrial
DeathIndustrial Disability
5 Years 5 Years 10 Years 1 25 Years 1 Male Female Male FemaleMale & Female
Male & Female
20 0.03470 0.05910 N/A N/A 0.00019 0.00009 0.00010 0.00010 N/A N/A25 0.03110 0.05310 N/A N/A 0.00027 0.00014 0.00020 0.00010 N/A N/A30 0.02760 0.04700 N/A N/A 0.00038 0.00021 0.00040 0.00030 N/A N/A35 0.02400 0.04100 N/A N/A 0.00054 0.00031 0.00080 0.00050 N/A N/A40 0.02050 0.03490 N/A N/A 0.00077 0.00046 0.00140 0.00100 N/A N/A45 0.01690 0.00000 N/A N/A 0.00110 0.00068 0.00280 0.00160 N/A N/A50 0.01340 0.00000 0.00710 0.01310 0.00156 0.00102 0.00500 0.00300 N/A N/A55 0.00980 0.00000 0.03840 0.07070 0.00221 0.00151 0.00720 0.00470 N/A N/A56 0.00910 0.00000 0.03140 0.05780 0.00237 0.00164 0.00740 0.00470 N/A N/A57 0.00840 0.00000 0.03370 0.06200 0.00255 0.00178 0.00750 0.00470 N/A N/A58 0.00770 0.00000 0.04020 0.07390 0.00273 0.00192 0.00740 0.00440 N/A N/A59 0.00700 0.00000 0.04570 0.08420 0.00293 0.00208 0.00730 0.00410 N/A N/A60 0.00630 0.00000 0.07290 0.13420 0.00314 0.00226 0.00710 0.00370 N/A N/A61 0.00560 0.00000 0.07210 0.13280 0.00337 0.00244 0.00690 0.00340 N/A N/A62 0.00490 0.00000 0.15120 0.27840 0.00362 0.00265 0.00660 0.00310 N/A N/A63 0.00410 0.00000 0.13630 0.25100 0.00388 0.00287 0.00630 0.00270 N/A N/A64 0.00340 0.00000 0.10600 0.19510 0.00416 0.00310 0.00600 0.00240 N/A N/A65 0.00270 0.00000 0.17970 0.33080 0.00447 0.00336 0.00570 0.00200 N/A N/A70 0.00040 0.00000 0.13080 0.24080 0.00634 0.00500 0.00570 0.00200 N/A N/A
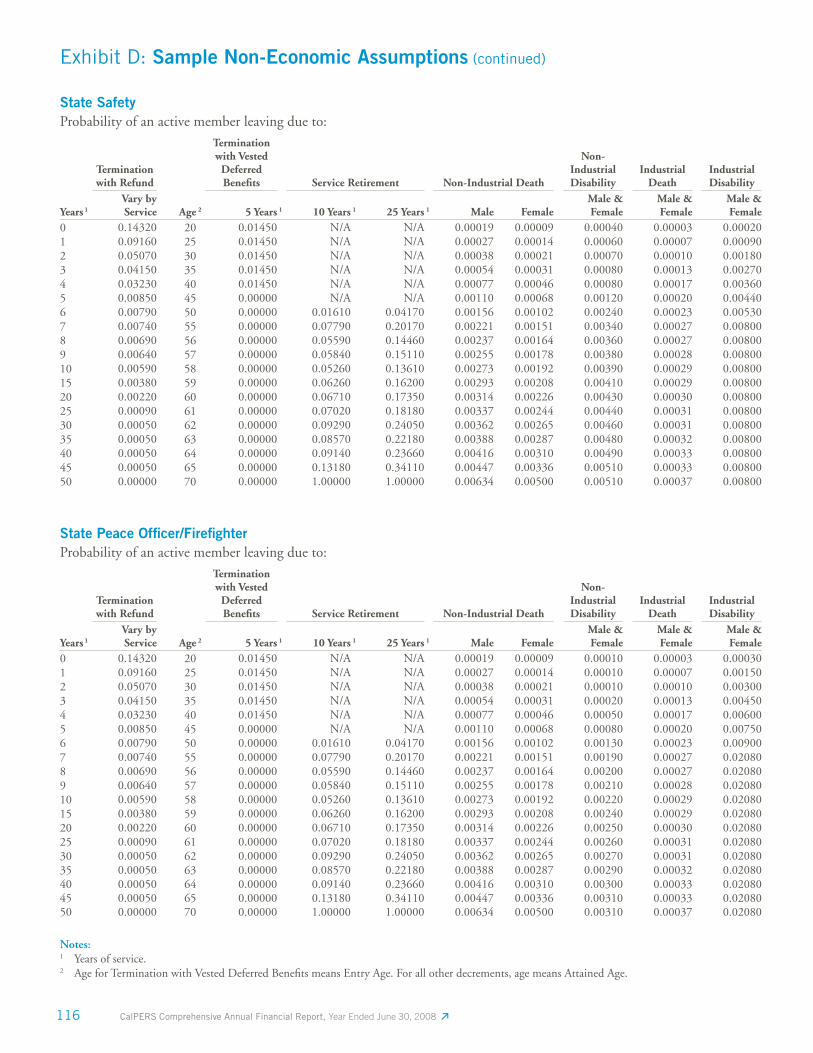
116 CalPERS Comprehensive Annual Financial Report, Year Ended June 30, 2008
State SafetyProbability of an active member leaving due to:
Years 1
Termination with Refund
Age 2
Termination with Vested
Deferred Benefi ts
1
Service Retirement Non-Industrial Death
Non-IndustrialDisability
Industrial Death
Industrial Disability
Vary by Service 5 Years 10 Years 1 25 Years 1 Male Female
Male & Female
Male & Female
Male & Female
0 0.14320 20 0.01450 N/A N/A 0.00019 0.00009 0.00040 0.00003 0.000201 0.09160 25 0.01450 N/A N/A 0.00027 0.00014 0.00060 0.00007 0.000902 0.05070 30 0.01450 N/A N/A 0.00038 0.00021 0.00070 0.00010 0.001803 0.04150 35 0.01450 N/A N/A 0.00054 0.00031 0.00080 0.00013 0.002704 0.03230 40 0.01450 N/A N/A 0.00077 0.00046 0.00080 0.00017 0.003605 0.00850 45 0.00000 N/A N/A 0.00110 0.00068 0.00120 0.00020 0.004406 0.00790 50 0.00000 0.01610 0.04170 0.00156 0.00102 0.00240 0.00023 0.005307 0.00740 55 0.00000 0.07790 0.20170 0.00221 0.00151 0.00340 0.00027 0.008008 0.00690 56 0.00000 0.05590 0.14460 0.00237 0.00164 0.00360 0.00027 0.008009 0.00640 57 0.00000 0.05840 0.15110 0.00255 0.00178 0.00380 0.00028 0.0080010 0.00590 58 0.00000 0.05260 0.13610 0.00273 0.00192 0.00390 0.00029 0.0080015 0.00380 59 0.00000 0.06260 0.16200 0.00293 0.00208 0.00410 0.00029 0.0080020 0.00220 60 0.00000 0.06710 0.17350 0.00314 0.00226 0.00430 0.00030 0.0080025 0.00090 61 0.00000 0.07020 0.18180 0.00337 0.00244 0.00440 0.00031 0.0080030 0.00050 62 0.00000 0.09290 0.24050 0.00362 0.00265 0.00460 0.00031 0.0080035 0.00050 63 0.00000 0.08570 0.22180 0.00388 0.00287 0.00480 0.00032 0.0080040 0.00050 64 0.00000 0.09140 0.23660 0.00416 0.00310 0.00490 0.00033 0.0080045 0.00050 65 0.00000 0.13180 0.34110 0.00447 0.00336 0.00510 0.00033 0.0080050 0.00000 70 0.00000 1.00000 1.00000 0.00634 0.00500 0.00510 0.00037 0.00800
Notes: 1 Years of service.2 Age for Termination with Vested Deferred Benefi ts means Entry Age. For all other decrements, age means Attained Age.
Exhibit D: Sample Non-Economic Assumptions (continued)
State Peace Offi cer/Firefi ghterProbability of an active member leaving due to:
Years 1
Termination with Refund
Age 2
Termination with Vested
Deferred Benefi ts
1
Service Retirement Non-Industrial Death
Non-IndustrialDisability
Industrial Death
Industrial Disability
Vary by Service 5 Years 10 Years 1 25 Years 1 Male Female
Male & Female
Male & Female
Male & Female
0 0.14320 20 0.01450 N/A N/A 0.00019 0.00009 0.00010 0.00003 0.000301 0.09160 25 0.01450 N/A N/A 0.00027 0.00014 0.00010 0.00007 0.001502 0.05070 30 0.01450 N/A N/A 0.00038 0.00021 0.00010 0.00010 0.003003 0.04150 35 0.01450 N/A N/A 0.00054 0.00031 0.00020 0.00013 0.004504 0.03230 40 0.01450 N/A N/A 0.00077 0.00046 0.00050 0.00017 0.006005 0.00850 45 0.00000 N/A N/A 0.00110 0.00068 0.00080 0.00020 0.007506 0.00790 50 0.00000 0.01610 0.04170 0.00156 0.00102 0.00130 0.00023 0.009007 0.00740 55 0.00000 0.07790 0.20170 0.00221 0.00151 0.00190 0.00027 0.020808 0.00690 56 0.00000 0.05590 0.14460 0.00237 0.00164 0.00200 0.00027 0.020809 0.00640 57 0.00000 0.05840 0.15110 0.00255 0.00178 0.00210 0.00028 0.0208010 0.00590 58 0.00000 0.05260 0.13610 0.00273 0.00192 0.00220 0.00029 0.0208015 0.00380 59 0.00000 0.06260 0.16200 0.00293 0.00208 0.00240 0.00029 0.0208020 0.00220 60 0.00000 0.06710 0.17350 0.00314 0.00226 0.00250 0.00030 0.0208025 0.00090 61 0.00000 0.07020 0.18180 0.00337 0.00244 0.00260 0.00031 0.0208030 0.00050 62 0.00000 0.09290 0.24050 0.00362 0.00265 0.00270 0.00031 0.0208035 0.00050 63 0.00000 0.08570 0.22180 0.00388 0.00287 0.00290 0.00032 0.0208040 0.00050 64 0.00000 0.09140 0.23660 0.00416 0.00310 0.00300 0.00033 0.0208045 0.00050 65 0.00000 0.13180 0.34110 0.00447 0.00336 0.00310 0.00033 0.0208050 0.00000 70 0.00000 1.00000 1.00000 0.00634 0.00500 0.00310 0.00037 0.02080
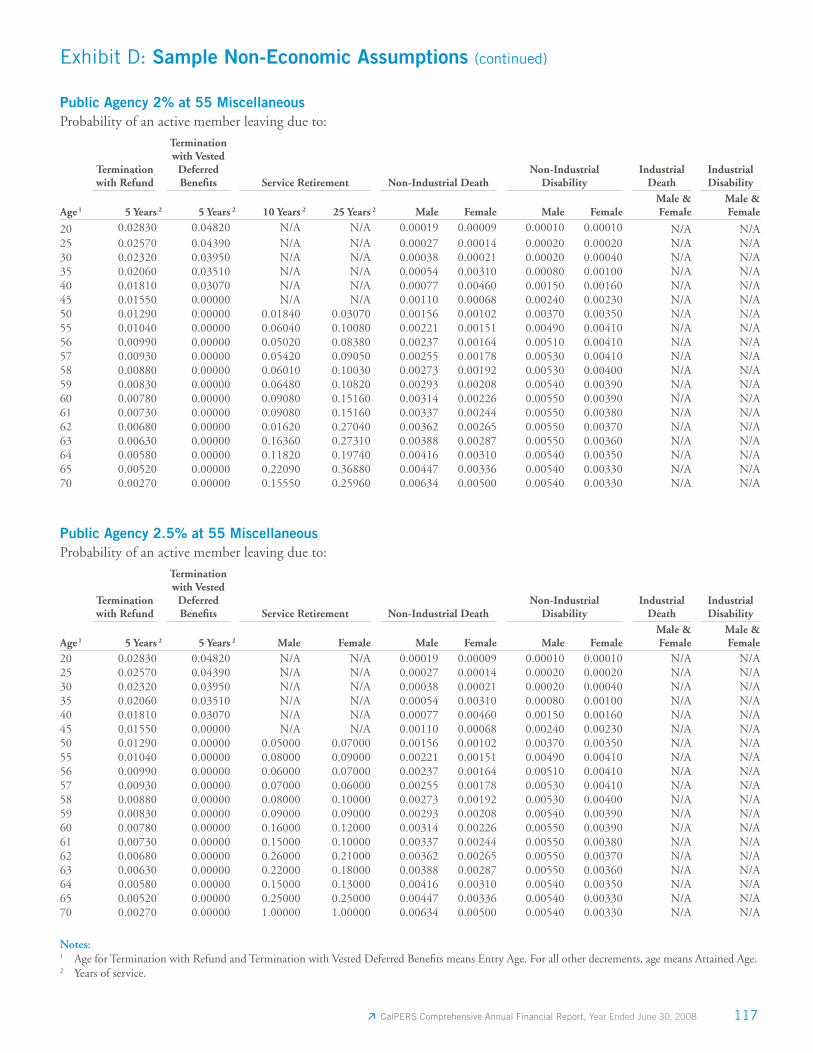
117 CalPERS Comprehensive Annual Financial Report, Year Ended June 30, 2008
Notes: 1 Age for Termination with Refund and Termination with Vested Deferred Benefi ts means Entry Age. For all other decrements, age means Attained Age.2 Years of service.
Exhibit D: Sample Non-Economic Assumptions (continued)
Public Agency 2% at 55 MiscellaneousProbability of an active member leaving due to:
Age 1
Termination with Refund
2
Termination with Vested
Deferred Benefi ts
2
Service Retirement Non-Industrial DeathNon-Industrial
DisabilityIndustrial
DeathIndustrial Disability
5 Years 5 Years 10 Years 2 25 Years 2 Male Female Male FemaleMale & Female
Male & Female
20 0.02830 0.04820 N/A N/A 0.00019 0.00009 0.00010 0.00010 N/A N/A25 0.02570 0.04390 N/A N/A 0.00027 0.00014 0.00020 0.00020 N/A N/A30 0.02320 0.03950 N/A N/A 0.00038 0.00021 0.00020 0.00040 N/A N/A35 0.02060 0.03510 N/A N/A 0.00054 0.00310 0.00080 0.00100 N/A N/A40 0.01810 0.03070 N/A N/A 0.00077 0.00460 0.00150 0.00160 N/A N/A45 0.01550 0.00000 N/A N/A 0.00110 0.00068 0.00240 0.00230 N/A N/A50 0.01290 0.00000 0.01840 0.03070 0.00156 0.00102 0.00370 0.00350 N/A N/A55 0.01040 0.00000 0.06040 0.10080 0.00221 0.00151 0.00490 0.00410 N/A N/A56 0.00990 0.00000 0.05020 0.08380 0.00237 0.00164 0.00510 0.00410 N/A N/A57 0.00930 0.00000 0.05420 0.09050 0.00255 0.00178 0.00530 0.00410 N/A N/A58 0.00880 0.00000 0.06010 0.10030 0.00273 0.00192 0.00530 0.00400 N/A N/A59 0.00830 0.00000 0.06480 0.10820 0.00293 0.00208 0.00540 0.00390 N/A N/A60 0.00780 0.00000 0.09080 0.15160 0.00314 0.00226 0.00550 0.00390 N/A N/A61 0.00730 0.00000 0.09080 0.15160 0.00337 0.00244 0.00550 0.00380 N/A N/A62 0.00680 0.00000 0.01620 0.27040 0.00362 0.00265 0.00550 0.00370 N/A N/A63 0.00630 0.00000 0.16360 0.27310 0.00388 0.00287 0.00550 0.00360 N/A N/A64 0.00580 0.00000 0.11820 0.19740 0.00416 0.00310 0.00540 0.00350 N/A N/A65 0.00520 0.00000 0.22090 0.36880 0.00447 0.00336 0.00540 0.00330 N/A N/A70 0.00270 0.00000 0.15550 0.25960 0.00634 0.00500 0.00540 0.00330 N/A N/A
Public Agency 2.5% at 55 MiscellaneousProbability of an active member leaving due to:
Age 1
Termination with Refund
2
Termination with Vested
Deferred Benefi ts
2
Service Retirement Non-Industrial DeathNon-Industrial
DisabilityIndustrial
DeathIndustrial Disability
5 Years 5 Years Male Female Male Female Male FemaleMale & Female
Male & Female
20 0.02830 0.04820 N/A N/A 0.00019 0.00009 0.00010 0.00010 N/A N/A25 0.02570 0.04390 N/A N/A 0.00027 0.00014 0.00020 0.00020 N/A N/A30 0.02320 0.03950 N/A N/A 0.00038 0.00021 0.00020 0.00040 N/A N/A35 0.02060 0.03510 N/A N/A 0.00054 0.00310 0.00080 0.00100 N/A N/A40 0.01810 0.03070 N/A N/A 0.00077 0.00460 0.00150 0.00160 N/A N/A45 0.01550 0.00000 N/A N/A 0.00110 0.00068 0.00240 0.00230 N/A N/A50 0.01290 0.00000 0.05000 0.07000 0.00156 0.00102 0.00370 0.00350 N/A N/A55 0.01040 0.00000 0.08000 0.09000 0.00221 0.00151 0.00490 0.00410 N/A N/A56 0.00990 0.00000 0.06000 0.07000 0.00237 0.00164 0.00510 0.00410 N/A N/A57 0.00930 0.00000 0.07000 0.06000 0.00255 0.00178 0.00530 0.00410 N/A N/A58 0.00880 0.00000 0.08000 0.10000 0.00273 0.00192 0.00530 0.00400 N/A N/A59 0.00830 0.00000 0.09000 0.09000 0.00293 0.00208 0.00540 0.00390 N/A N/A60 0.00780 0.00000 0.16000 0.12000 0.00314 0.00226 0.00550 0.00390 N/A N/A61 0.00730 0.00000 0.15000 0.10000 0.00337 0.00244 0.00550 0.00380 N/A N/A62 0.00680 0.00000 0.26000 0.21000 0.00362 0.00265 0.00550 0.00370 N/A N/A63 0.00630 0.00000 0.22000 0.18000 0.00388 0.00287 0.00550 0.00360 N/A N/A64 0.00580 0.00000 0.15000 0.13000 0.00416 0.00310 0.00540 0.00350 N/A N/A65 0.00520 0.00000 0.25000 0.25000 0.00447 0.00336 0.00540 0.00330 N/A N/A70 0.00270 0.00000 1.00000 1.00000 0.00634 0.00500 0.00540 0.00330 N/A N/A
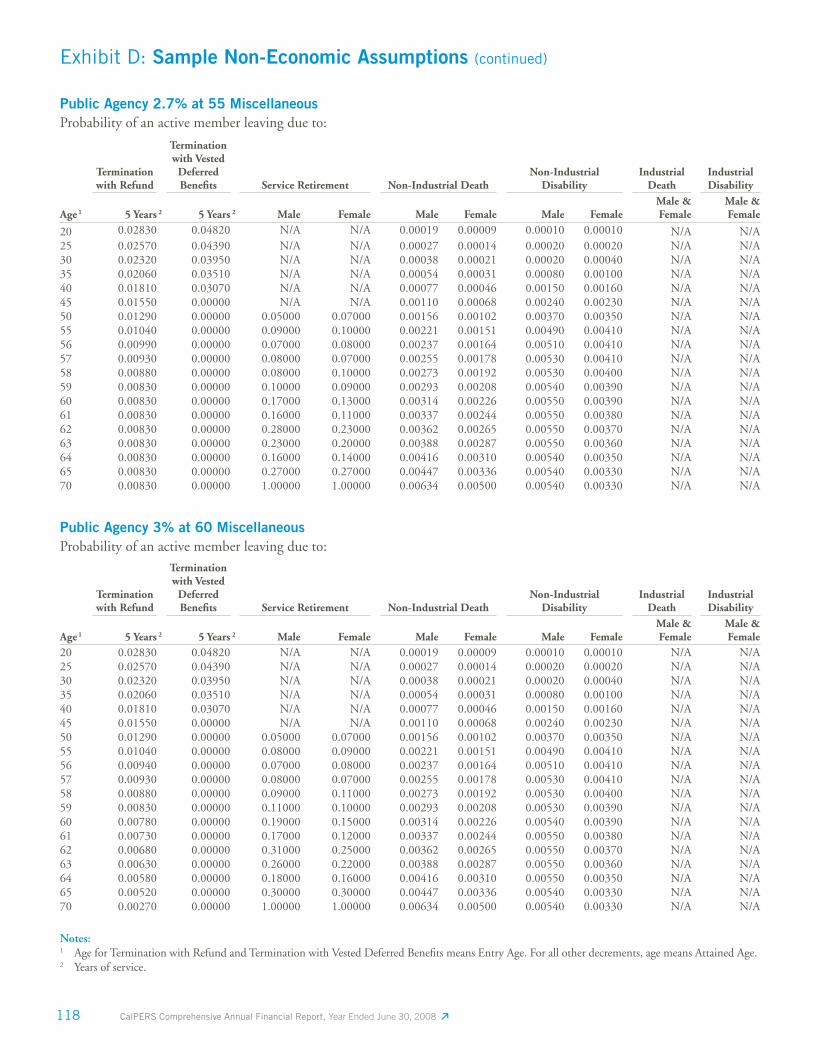
118 CalPERS Comprehensive Annual Financial Report, Year Ended June 30, 2008
Exhibit D: Sample Non-Economic Assumptions (continued)
Notes: 1 Age for Termination with Refund and Termination with Vested Deferred Benefi ts means Entry Age. For all other decrements, age means Attained Age.2 Years of service.
Public Agency 2.7% at 55 MiscellaneousProbability of an active member leaving due to:
Age 1
Termination with Refund
2
Termination with Vested
Deferred Benefi ts
2
Service Retirement Non-Industrial DeathNon-Industrial
DisabilityIndustrial
DeathIndustrial Disability
5 Years 5 Years Male Female Male Female Male FemaleMale & Female
Male & Female
20 0.02830 0.04820 N/A N/A 0.00019 0.00009 0.00010 0.00010 N/A N/A25 0.02570 0.04390 N/A N/A 0.00027 0.00014 0.00020 0.00020 N/A N/A30 0.02320 0.03950 N/A N/A 0.00038 0.00021 0.00020 0.00040 N/A N/A35 0.02060 0.03510 N/A N/A 0.00054 0.00031 0.00080 0.00100 N/A N/A40 0.01810 0.03070 N/A N/A 0.00077 0.00046 0.00150 0.00160 N/A N/A45 0.01550 0.00000 N/A N/A 0.00110 0.00068 0.00240 0.00230 N/A N/A50 0.01290 0.00000 0.05000 0.07000 0.00156 0.00102 0.00370 0.00350 N/A N/A55 0.01040 0.00000 0.09000 0.10000 0.00221 0.00151 0.00490 0.00410 N/A N/A56 0.00990 0.00000 0.07000 0.08000 0.00237 0.00164 0.00510 0.00410 N/A N/A57 0.00930 0.00000 0.08000 0.07000 0.00255 0.00178 0.00530 0.00410 N/A N/A58 0.00880 0.00000 0.08000 0.10000 0.00273 0.00192 0.00530 0.00400 N/A N/A59 0.00830 0.00000 0.10000 0.09000 0.00293 0.00208 0.00540 0.00390 N/A N/A60 0.00830 0.00000 0.17000 0.13000 0.00314 0.00226 0.00550 0.00390 N/A N/A61 0.00830 0.00000 0.16000 0.11000 0.00337 0.00244 0.00550 0.00380 N/A N/A62 0.00830 0.00000 0.28000 0.23000 0.00362 0.00265 0.00550 0.00370 N/A N/A63 0.00830 0.00000 0.23000 0.20000 0.00388 0.00287 0.00550 0.00360 N/A N/A64 0.00830 0.00000 0.16000 0.14000 0.00416 0.00310 0.00540 0.00350 N/A N/A65 0.00830 0.00000 0.27000 0.27000 0.00447 0.00336 0.00540 0.00330 N/A N/A70 0.00830 0.00000 1.00000 1.00000 0.00634 0.00500 0.00540 0.00330 N/A N/A
Public Agency 3% at 60 MiscellaneousProbability of an active member leaving due to:
Age 1
Termination with Refund
2
Termination with Vested
Deferred Benefi ts
2
Service Retirement Non-Industrial DeathNon-Industrial
DisabilityIndustrial
DeathIndustrial Disability
5 Years 5 Years Male Female Male Female Male FemaleMale & Female
Male & Female
20 0.02830 0.04820 N/A N/A 0.00019 0.00009 0.00010 0.00010 N/A N/A25 0.02570 0.04390 N/A N/A 0.00027 0.00014 0.00020 0.00020 N/A N/A30 0.02320 0.03950 N/A N/A 0.00038 0.00021 0.00020 0.00040 N/A N/A35 0.02060 0.03510 N/A N/A 0.00054 0.00031 0.00080 0.00100 N/A N/A40 0.01810 0.03070 N/A N/A 0.00077 0.00046 0.00150 0.00160 N/A N/A45 0.01550 0.00000 N/A N/A 0.00110 0.00068 0.00240 0.00230 N/A N/A50 0.01290 0.00000 0.05000 0.07000 0.00156 0.00102 0.00370 0.00350 N/A N/A55 0.01040 0.00000 0.08000 0.09000 0.00221 0.00151 0.00490 0.00410 N/A N/A56 0.00940 0.00000 0.07000 0.08000 0.00237 0.00164 0.00510 0.00410 N/A N/A57 0.00930 0.00000 0.08000 0.07000 0.00255 0.00178 0.00530 0.00410 N/A N/A58 0.00880 0.00000 0.09000 0.11000 0.00273 0.00192 0.00530 0.00400 N/A N/A59 0.00830 0.00000 0.11000 0.10000 0.00293 0.00208 0.00530 0.00390 N/A N/A60 0.00780 0.00000 0.19000 0.15000 0.00314 0.00226 0.00540 0.00390 N/A N/A61 0.00730 0.00000 0.17000 0.12000 0.00337 0.00244 0.00550 0.00380 N/A N/A62 0.00680 0.00000 0.31000 0.25000 0.00362 0.00265 0.00550 0.00370 N/A N/A63 0.00630 0.00000 0.26000 0.22000 0.00388 0.00287 0.00550 0.00360 N/A N/A64 0.00580 0.00000 0.18000 0.16000 0.00416 0.00310 0.00550 0.00350 N/A N/A65 0.00520 0.00000 0.30000 0.30000 0.00447 0.00336 0.00540 0.00330 N/A N/A70 0.00270 0.00000 1.00000 1.00000 0.00634 0.00500 0.00540 0.00330 N/A N/A
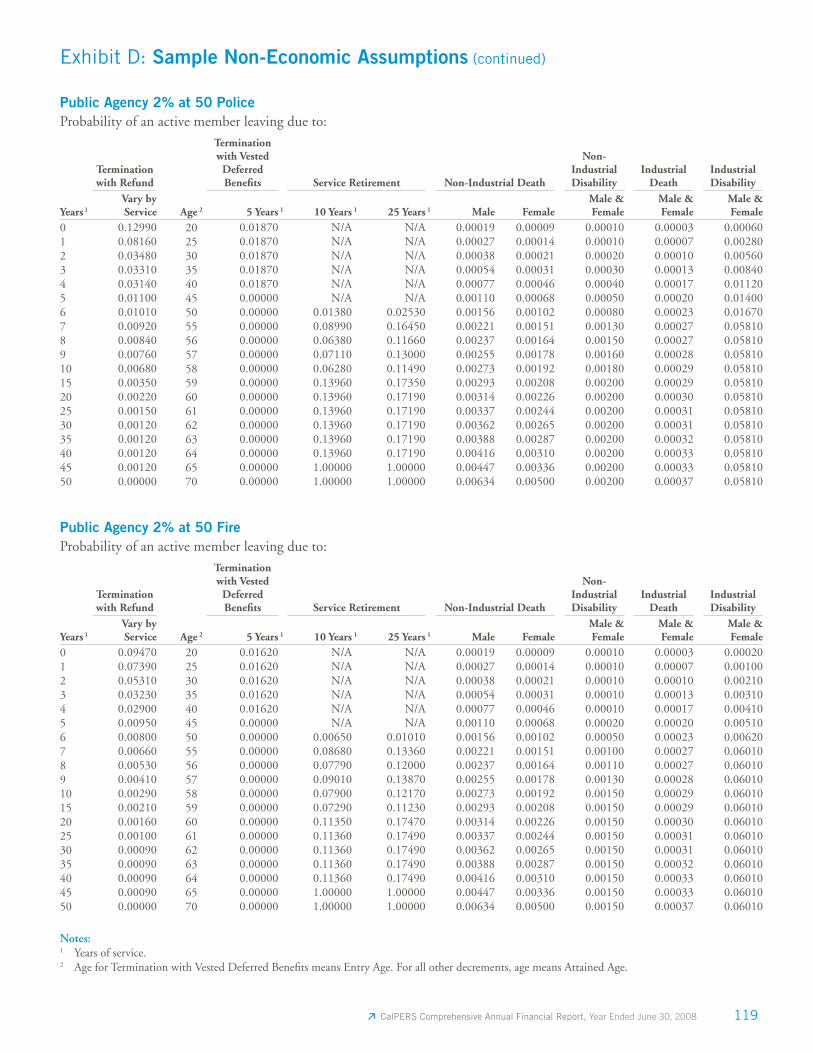
119 CalPERS Comprehensive Annual Financial Report, Year Ended June 30, 2008
Exhibit D: Sample Non-Economic Assumptions (continued)
Notes: 1 Years of service.2 Age for Termination with Vested Deferred Benefi ts means Entry Age. For all other decrements, age means Attained Age.
Public Agency 2% at 50 PoliceProbability of an active member leaving due to:
Years 1
Termination with Refund
Age 2
Termination with Vested
Deferred Benefi ts
1
Service Retirement Non-Industrial Death
Non-IndustrialDisability
Industrial Death
Industrial Disability
Vary by Service 5 Years 10 Years 1 25 Years 1 Male Female
Male & Female
Male & Female
Male & Female
0 0.12990 20 0.01870 N/A N/A 0.00019 0.00009 0.00010 0.00003 0.000601 0.08160 25 0.01870 N/A N/A 0.00027 0.00014 0.00010 0.00007 0.002802 0.03480 30 0.01870 N/A N/A 0.00038 0.00021 0.00020 0.00010 0.005603 0.03310 35 0.01870 N/A N/A 0.00054 0.00031 0.00030 0.00013 0.008404 0.03140 40 0.01870 N/A N/A 0.00077 0.00046 0.00040 0.00017 0.011205 0.01100 45 0.00000 N/A N/A 0.00110 0.00068 0.00050 0.00020 0.014006 0.01010 50 0.00000 0.01380 0.02530 0.00156 0.00102 0.00080 0.00023 0.016707 0.00920 55 0.00000 0.08990 0.16450 0.00221 0.00151 0.00130 0.00027 0.058108 0.00840 56 0.00000 0.06380 0.11660 0.00237 0.00164 0.00150 0.00027 0.058109 0.00760 57 0.00000 0.07110 0.13000 0.00255 0.00178 0.00160 0.00028 0.0581010 0.00680 58 0.00000 0.06280 0.11490 0.00273 0.00192 0.00180 0.00029 0.0581015 0.00350 59 0.00000 0.13960 0.17350 0.00293 0.00208 0.00200 0.00029 0.0581020 0.00220 60 0.00000 0.13960 0.17190 0.00314 0.00226 0.00200 0.00030 0.0581025 0.00150 61 0.00000 0.13960 0.17190 0.00337 0.00244 0.00200 0.00031 0.0581030 0.00120 62 0.00000 0.13960 0.17190 0.00362 0.00265 0.00200 0.00031 0.0581035 0.00120 63 0.00000 0.13960 0.17190 0.00388 0.00287 0.00200 0.00032 0.0581040 0.00120 64 0.00000 0.13960 0.17190 0.00416 0.00310 0.00200 0.00033 0.0581045 0.00120 65 0.00000 1.00000 1.00000 0.00447 0.00336 0.00200 0.00033 0.0581050 0.00000 70 0.00000 1.00000 1.00000 0.00634 0.00500 0.00200 0.00037 0.05810
Public Agency 2% at 50 FireProbability of an active member leaving due to:
Years 1
Termination with Refund
Age 2
Termination with Vested
Deferred Benefi ts
1
Service Retirement Non-Industrial Death
Non-IndustrialDisability
Industrial Death
Industrial Disability
Vary by Service 5 Years 10 Years 1 25 Years 1 Male Female
Male & Female
Male & Female
Male & Female
0 0.09470 20 0.01620 N/A N/A 0.00019 0.00009 0.00010 0.00003 0.000201 0.07390 25 0.01620 N/A N/A 0.00027 0.00014 0.00010 0.00007 0.001002 0.05310 30 0.01620 N/A N/A 0.00038 0.00021 0.00010 0.00010 0.002103 0.03230 35 0.01620 N/A N/A 0.00054 0.00031 0.00010 0.00013 0.003104 0.02900 40 0.01620 N/A N/A 0.00077 0.00046 0.00010 0.00017 0.004105 0.00950 45 0.00000 N/A N/A 0.00110 0.00068 0.00020 0.00020 0.005106 0.00800 50 0.00000 0.00650 0.01010 0.00156 0.00102 0.00050 0.00023 0.006207 0.00660 55 0.00000 0.08680 0.13360 0.00221 0.00151 0.00100 0.00027 0.060108 0.00530 56 0.00000 0.07790 0.12000 0.00237 0.00164 0.00110 0.00027 0.060109 0.00410 57 0.00000 0.09010 0.13870 0.00255 0.00178 0.00130 0.00028 0.0601010 0.00290 58 0.00000 0.07900 0.12170 0.00273 0.00192 0.00150 0.00029 0.0601015 0.00210 59 0.00000 0.07290 0.11230 0.00293 0.00208 0.00150 0.00029 0.0601020 0.00160 60 0.00000 0.11350 0.17470 0.00314 0.00226 0.00150 0.00030 0.0601025 0.00100 61 0.00000 0.11360 0.17490 0.00337 0.00244 0.00150 0.00031 0.0601030 0.00090 62 0.00000 0.11360 0.17490 0.00362 0.00265 0.00150 0.00031 0.0601035 0.00090 63 0.00000 0.11360 0.17490 0.00388 0.00287 0.00150 0.00032 0.0601040 0.00090 64 0.00000 0.11360 0.17490 0.00416 0.00310 0.00150 0.00033 0.0601045 0.00090 65 0.00000 1.00000 1.00000 0.00447 0.00336 0.00150 0.00033 0.0601050 0.00000 70 0.00000 1.00000 1.00000 0.00634 0.00500 0.00150 0.00037 0.06010
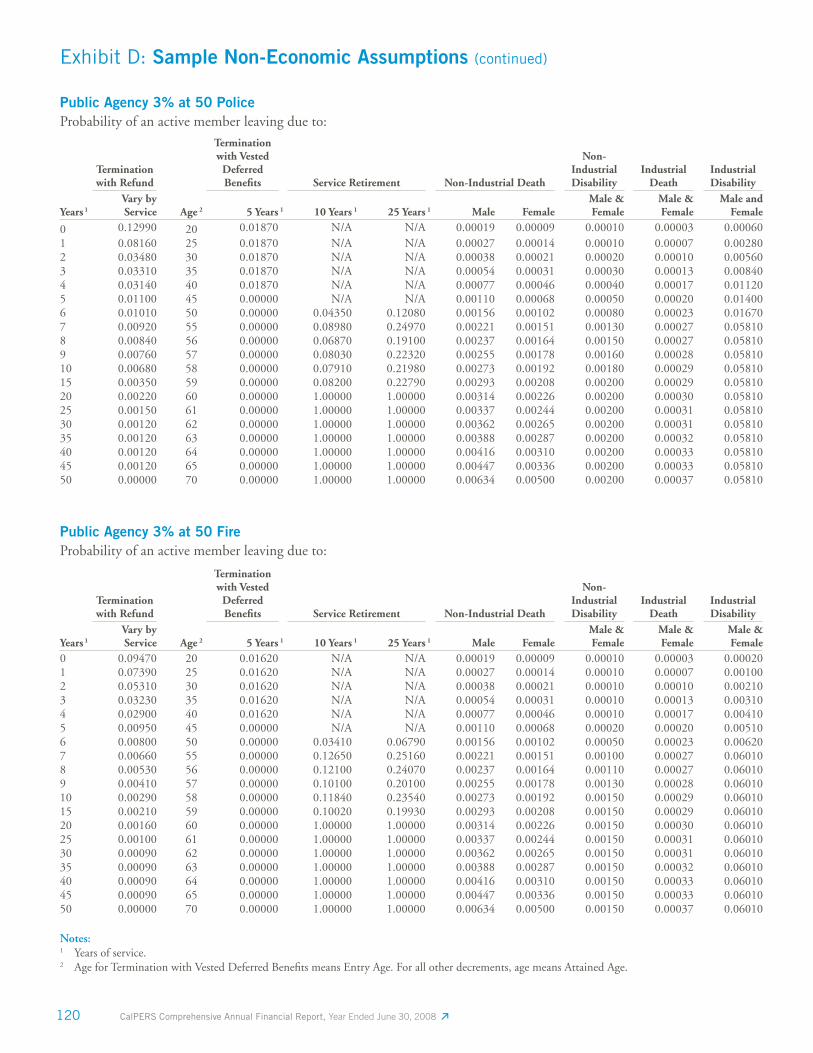
120 CalPERS Comprehensive Annual Financial Report, Year Ended June 30, 2008
Notes: 1 Years of service.2 Age for Termination with Vested Deferred Benefi ts means Entry Age. For all other decrements, age means Attained Age.
Public Agency 3% at 50 PoliceProbability of an active member leaving due to:
Years 1
Termination with Refund
Age 2
Termination with Vested
Deferred Benefi ts
1
Service Retirement Non-Industrial Death
Non-IndustrialDisability
Industrial Death
Industrial Disability
Vary by Service 5 Years 10 Years 1 25 Years 1 Male Female
Male & Female
Male & Female
Male and Female
0 0.12990 20 0.01870 N/A N/A 0.00019 0.00009 0.00010 0.00003 0.000601 0.08160 25 0.01870 N/A N/A 0.00027 0.00014 0.00010 0.00007 0.002802 0.03480 30 0.01870 N/A N/A 0.00038 0.00021 0.00020 0.00010 0.005603 0.03310 35 0.01870 N/A N/A 0.00054 0.00031 0.00030 0.00013 0.008404 0.03140 40 0.01870 N/A N/A 0.00077 0.00046 0.00040 0.00017 0.011205 0.01100 45 0.00000 N/A N/A 0.00110 0.00068 0.00050 0.00020 0.014006 0.01010 50 0.00000 0.04350 0.12080 0.00156 0.00102 0.00080 0.00023 0.016707 0.00920 55 0.00000 0.08980 0.24970 0.00221 0.00151 0.00130 0.00027 0.058108 0.00840 56 0.00000 0.06870 0.19100 0.00237 0.00164 0.00150 0.00027 0.058109 0.00760 57 0.00000 0.08030 0.22320 0.00255 0.00178 0.00160 0.00028 0.0581010 0.00680 58 0.00000 0.07910 0.21980 0.00273 0.00192 0.00180 0.00029 0.0581015 0.00350 59 0.00000 0.08200 0.22790 0.00293 0.00208 0.00200 0.00029 0.0581020 0.00220 60 0.00000 1.00000 1.00000 0.00314 0.00226 0.00200 0.00030 0.0581025 0.00150 61 0.00000 1.00000 1.00000 0.00337 0.00244 0.00200 0.00031 0.0581030 0.00120 62 0.00000 1.00000 1.00000 0.00362 0.00265 0.00200 0.00031 0.0581035 0.00120 63 0.00000 1.00000 1.00000 0.00388 0.00287 0.00200 0.00032 0.0581040 0.00120 64 0.00000 1.00000 1.00000 0.00416 0.00310 0.00200 0.00033 0.0581045 0.00120 65 0.00000 1.00000 1.00000 0.00447 0.00336 0.00200 0.00033 0.0581050 0.00000 70 0.00000 1.00000 1.00000 0.00634 0.00500 0.00200 0.00037 0.05810
Exhibit D: Sample Non-Economic Assumptions (continued)
Public Agency 3% at 50 FireProbability of an active member leaving due to:
Years 1
Termination with Refund
Age 2
Termination with Vested
Deferred Benefi ts
1
Service Retirement Non-Industrial Death
Non-IndustrialDisability
Industrial Death
Industrial Disability
Vary by Service 5 Years 10 Years 1 25 Years 1 Male Female
Male & Female
Male & Female
Male & Female
0 0.09470 20 0.01620 N/A N/A 0.00019 0.00009 0.00010 0.00003 0.000201 0.07390 25 0.01620 N/A N/A 0.00027 0.00014 0.00010 0.00007 0.001002 0.05310 30 0.01620 N/A N/A 0.00038 0.00021 0.00010 0.00010 0.002103 0.03230 35 0.01620 N/A N/A 0.00054 0.00031 0.00010 0.00013 0.003104 0.02900 40 0.01620 N/A N/A 0.00077 0.00046 0.00010 0.00017 0.004105 0.00950 45 0.00000 N/A N/A 0.00110 0.00068 0.00020 0.00020 0.005106 0.00800 50 0.00000 0.03410 0.06790 0.00156 0.00102 0.00050 0.00023 0.006207 0.00660 55 0.00000 0.12650 0.25160 0.00221 0.00151 0.00100 0.00027 0.060108 0.00530 56 0.00000 0.12100 0.24070 0.00237 0.00164 0.00110 0.00027 0.060109 0.00410 57 0.00000 0.10100 0.20100 0.00255 0.00178 0.00130 0.00028 0.0601010 0.00290 58 0.00000 0.11840 0.23540 0.00273 0.00192 0.00150 0.00029 0.0601015 0.00210 59 0.00000 0.10020 0.19930 0.00293 0.00208 0.00150 0.00029 0.0601020 0.00160 60 0.00000 1.00000 1.00000 0.00314 0.00226 0.00150 0.00030 0.0601025 0.00100 61 0.00000 1.00000 1.00000 0.00337 0.00244 0.00150 0.00031 0.0601030 0.00090 62 0.00000 1.00000 1.00000 0.00362 0.00265 0.00150 0.00031 0.0601035 0.00090 63 0.00000 1.00000 1.00000 0.00388 0.00287 0.00150 0.00032 0.0601040 0.00090 64 0.00000 1.00000 1.00000 0.00416 0.00310 0.00150 0.00033 0.0601045 0.00090 65 0.00000 1.00000 1.00000 0.00447 0.00336 0.00150 0.00033 0.0601050 0.00000 70 0.00000 1.00000 1.00000 0.00634 0.00500 0.00150 0.00037 0.06010
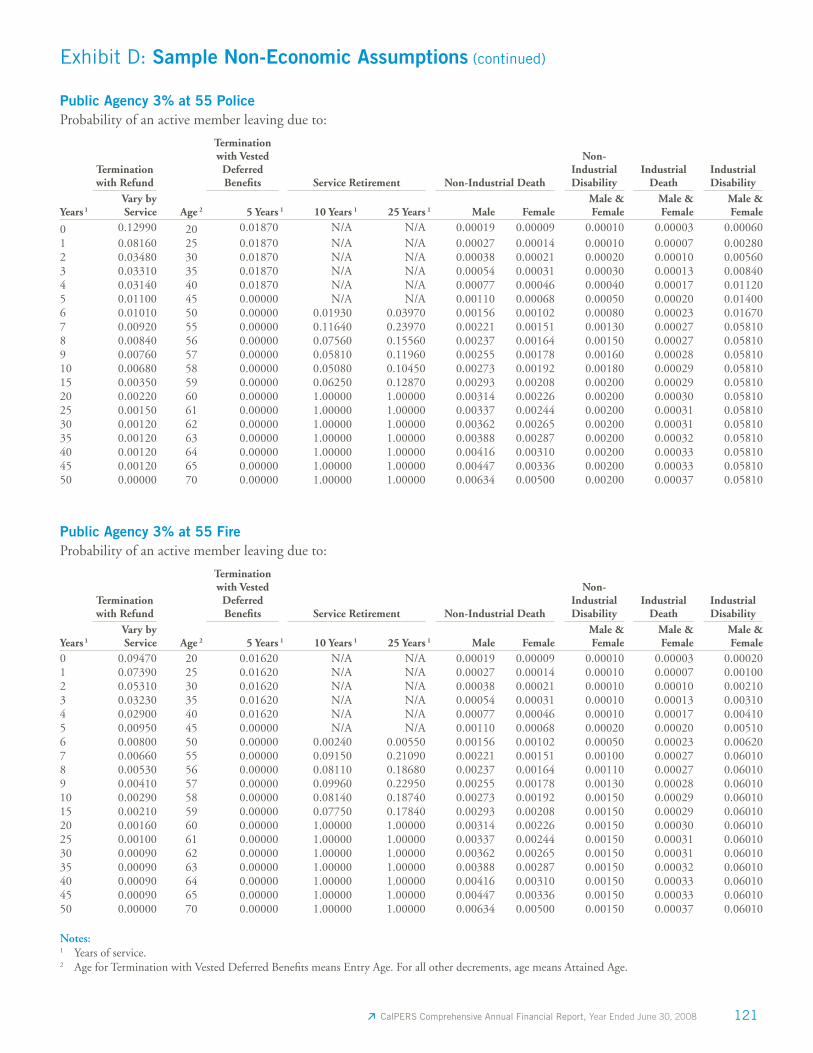
121 CalPERS Comprehensive Annual Financial Report, Year Ended June 30, 2008
Notes: 1 Years of service.2 Age for Termination with Vested Deferred Benefi ts means Entry Age. For all other decrements, age means Attained Age.
Public Agency 3% at 55 PoliceProbability of an active member leaving due to:
Years 1
Termination with Refund
Age 2
Termination with Vested
Deferred Benefi ts
1
Service Retirement Non-Industrial Death
Non-IndustrialDisability
Industrial Death
Industrial Disability
Vary by Service 5 Years 10 Years 1 25 Years 1 Male Female
Male & Female
Male & Female
Male & Female
0 0.12990 20 0.01870 N/A N/A 0.00019 0.00009 0.00010 0.00003 0.000601 0.08160 25 0.01870 N/A N/A 0.00027 0.00014 0.00010 0.00007 0.002802 0.03480 30 0.01870 N/A N/A 0.00038 0.00021 0.00020 0.00010 0.005603 0.03310 35 0.01870 N/A N/A 0.00054 0.00031 0.00030 0.00013 0.008404 0.03140 40 0.01870 N/A N/A 0.00077 0.00046 0.00040 0.00017 0.011205 0.01100 45 0.00000 N/A N/A 0.00110 0.00068 0.00050 0.00020 0.014006 0.01010 50 0.00000 0.01930 0.03970 0.00156 0.00102 0.00080 0.00023 0.016707 0.00920 55 0.00000 0.11640 0.23970 0.00221 0.00151 0.00130 0.00027 0.058108 0.00840 56 0.00000 0.07560 0.15560 0.00237 0.00164 0.00150 0.00027 0.058109 0.00760 57 0.00000 0.05810 0.11960 0.00255 0.00178 0.00160 0.00028 0.0581010 0.00680 58 0.00000 0.05080 0.10450 0.00273 0.00192 0.00180 0.00029 0.0581015 0.00350 59 0.00000 0.06250 0.12870 0.00293 0.00208 0.00200 0.00029 0.0581020 0.00220 60 0.00000 1.00000 1.00000 0.00314 0.00226 0.00200 0.00030 0.0581025 0.00150 61 0.00000 1.00000 1.00000 0.00337 0.00244 0.00200 0.00031 0.0581030 0.00120 62 0.00000 1.00000 1.00000 0.00362 0.00265 0.00200 0.00031 0.0581035 0.00120 63 0.00000 1.00000 1.00000 0.00388 0.00287 0.00200 0.00032 0.0581040 0.00120 64 0.00000 1.00000 1.00000 0.00416 0.00310 0.00200 0.00033 0.0581045 0.00120 65 0.00000 1.00000 1.00000 0.00447 0.00336 0.00200 0.00033 0.0581050 0.00000 70 0.00000 1.00000 1.00000 0.00634 0.00500 0.00200 0.00037 0.05810
Exhibit D: Sample Non-Economic Assumptions (continued)
Public Agency 3% at 55 FireProbability of an active member leaving due to:
Years 1
Termination with Refund
Age 2
Termination with Vested
Deferred Benefi ts
1
Service Retirement Non-Industrial Death
Non-IndustrialDisability
Industrial Death
Industrial Disability
Vary by Service 5 Years 10 Years 1 25 Years 1 Male Female
Male & Female
Male & Female
Male & Female
0 0.09470 20 0.01620 N/A N/A 0.00019 0.00009 0.00010 0.00003 0.000201 0.07390 25 0.01620 N/A N/A 0.00027 0.00014 0.00010 0.00007 0.001002 0.05310 30 0.01620 N/A N/A 0.00038 0.00021 0.00010 0.00010 0.002103 0.03230 35 0.01620 N/A N/A 0.00054 0.00031 0.00010 0.00013 0.003104 0.02900 40 0.01620 N/A N/A 0.00077 0.00046 0.00010 0.00017 0.004105 0.00950 45 0.00000 N/A N/A 0.00110 0.00068 0.00020 0.00020 0.005106 0.00800 50 0.00000 0.00240 0.00550 0.00156 0.00102 0.00050 0.00023 0.006207 0.00660 55 0.00000 0.09150 0.21090 0.00221 0.00151 0.00100 0.00027 0.060108 0.00530 56 0.00000 0.08110 0.18680 0.00237 0.00164 0.00110 0.00027 0.060109 0.00410 57 0.00000 0.09960 0.22950 0.00255 0.00178 0.00130 0.00028 0.0601010 0.00290 58 0.00000 0.08140 0.18740 0.00273 0.00192 0.00150 0.00029 0.0601015 0.00210 59 0.00000 0.07750 0.17840 0.00293 0.00208 0.00150 0.00029 0.0601020 0.00160 60 0.00000 1.00000 1.00000 0.00314 0.00226 0.00150 0.00030 0.0601025 0.00100 61 0.00000 1.00000 1.00000 0.00337 0.00244 0.00150 0.00031 0.0601030 0.00090 62 0.00000 1.00000 1.00000 0.00362 0.00265 0.00150 0.00031 0.0601035 0.00090 63 0.00000 1.00000 1.00000 0.00388 0.00287 0.00150 0.00032 0.0601040 0.00090 64 0.00000 1.00000 1.00000 0.00416 0.00310 0.00150 0.00033 0.0601045 0.00090 65 0.00000 1.00000 1.00000 0.00447 0.00336 0.00150 0.00033 0.0601050 0.00000 70 0.00000 1.00000 1.00000 0.00634 0.00500 0.00150 0.00037 0.06010
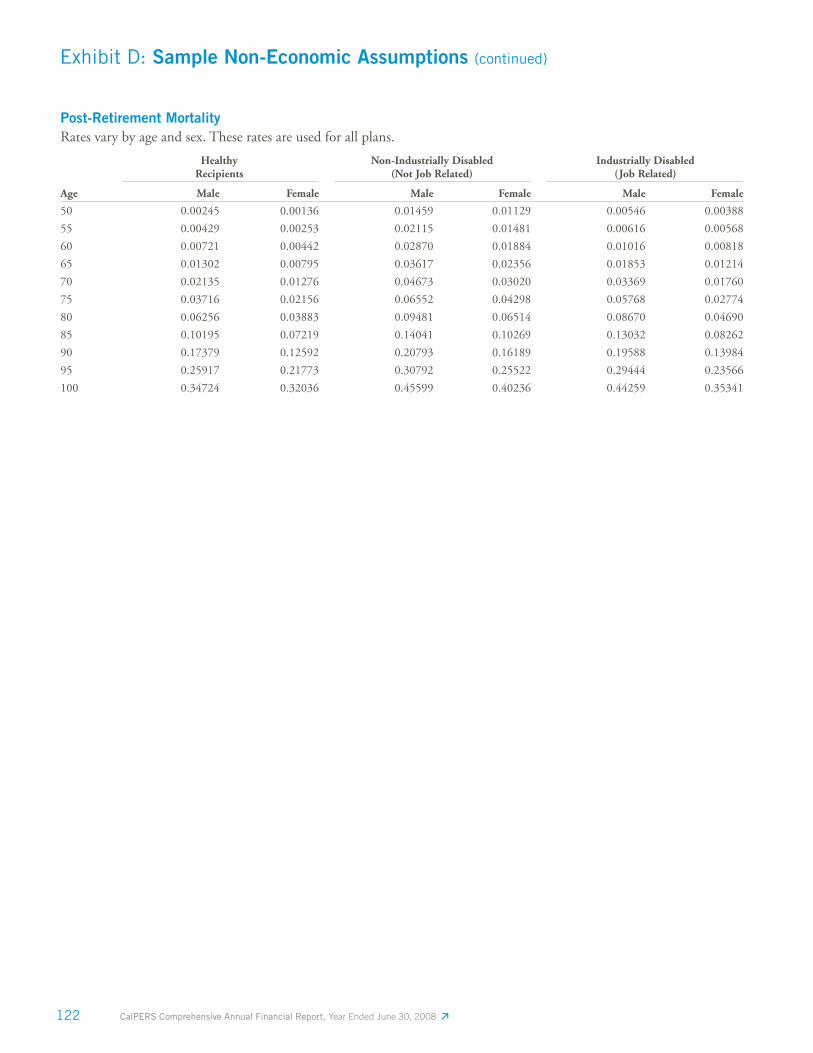
122 CalPERS Comprehensive Annual Financial Report, Year Ended June 30, 2008
Post-Retirement MortalityRates vary by age and sex. These rates are used for all plans.
Age
Healthy Recipients
Non-Industrially Disabled (Not Job Related)
Industrially Disabled (Job Related)
Male Female Male Female Male Female
50 0.00245 0.00136 0.01459 0.01129 0.00546 0.00388
55 0.00429 0.00253 0.02115 0.01481 0.00616 0.00568
60 0.00721 0.00442 0.02870 0.01884 0.01016 0.00818
65 0.01302 0.00795 0.03617 0.02356 0.01853 0.01214
70 0.02135 0.01276 0.04673 0.03020 0.03369 0.01760
75 0.03716 0.02156 0.06552 0.04298 0.05768 0.02774
80 0.06256 0.03883 0.09481 0.06514 0.08670 0.04690
85 0.10195 0.07219 0.14041 0.10269 0.13032 0.08262
90 0.17379 0.12592 0.20793 0.16189 0.19588 0.13984
95 0.25917 0.21773 0.30792 0.25522 0.29444 0.23566
100 0.34724 0.32036 0.45599 0.40236 0.44259 0.35341
Exhibit D: Sample Non-Economic Assumptions (continued)
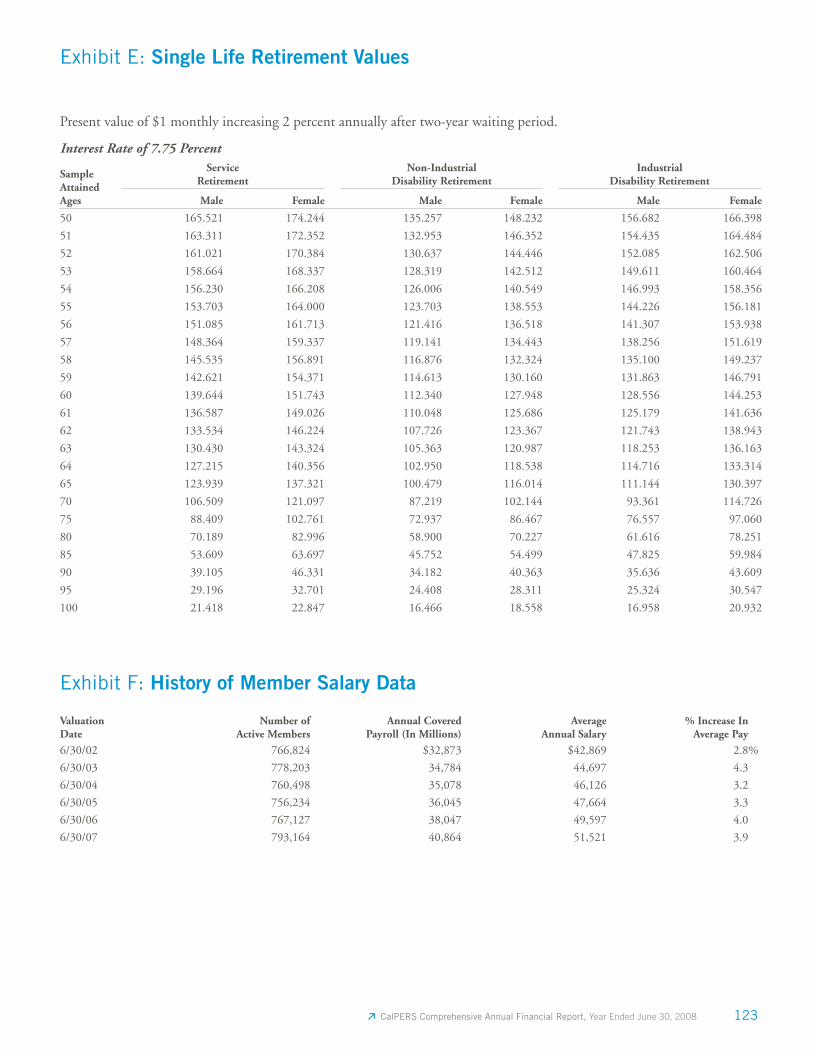
123 CalPERS Comprehensive Annual Financial Report, Year Ended June 30, 2008
Present value of $1 monthly increasing 2 percent annually after two-year waiting period.
Interest Rate of 7.75 Percent
Sample Attained Ages
Service Retirement
Non-Industrial Disability Retirement
Industrial Disability Retirement
Male Female Male Female Male Female
50 165.521 174.244 135.257 148.232 156.682 166.398
51 163.311 172.352 132.953 146.352 154.435 164.484
52 161.021 170.384 130.637 144.446 152.085 162.506
53 158.664 168.337 128.319 142.512 149.611 160.464
54 156.230 166.208 126.006 140.549 146.993 158.356
55 153.703 164.000 123.703 138.553 144.226 156.181
56 151.085 161.713 121.416 136.518 141.307 153.938
57 148.364 159.337 119.141 134.443 138.256 151.619
58 145.535 156.891 116.876 132.324 135.100 149.237
59 142.621 154.371 114.613 130.160 131.863 146.791
60 139.644 151.743 112.340 127.948 128.556 144.253
61 136.587 149.026 110.048 125.686 125.179 141.636
62 133.534 146.224 107.726 123.367 121.743 138.943
63 130.430 143.324 105.363 120.987 118.253 136.163
64 127.215 140.356 102.950 118.538 114.716 133.314
65 123.939 137.321 100.479 116.014 111.144 130.397
70 106.509 121.097 87.219 102.144 93.361 114.726
75 88.409 102.761 72.937 86.467 76.557 97.060
80 70.189 82.996 58.900 70.227 61.616 78.251
85 53.609 63.697 45.752 54.499 47.825 59.984
90 39.105 46.331 34.182 40.363 35.636 43.609
95 29.196 32.701 24.408 28.311 25.324 30.547
100 21.418 22.847 16.466 18.558 16.958 20.932
Exhibit F: History of Member Salary Data
Valuation Date
Number of Active Members
Annual Covered Payroll (In Millions)
Average Annual Salary
% Increase In Average Pay
6/30/02 766,824 $32,873 $42,869 2.8%
6/30/03 778,203 34,784 44,697 4.3
6/30/04 760,498 35,078 46,126 3.2
6/30/05 756,234 36,045 47,664 3.3
6/30/06 767,127 38,047 49,597 4.0
6/30/07 793,164 40,864 51,521 3.9
Exhibit E: Single Life Retirement Values
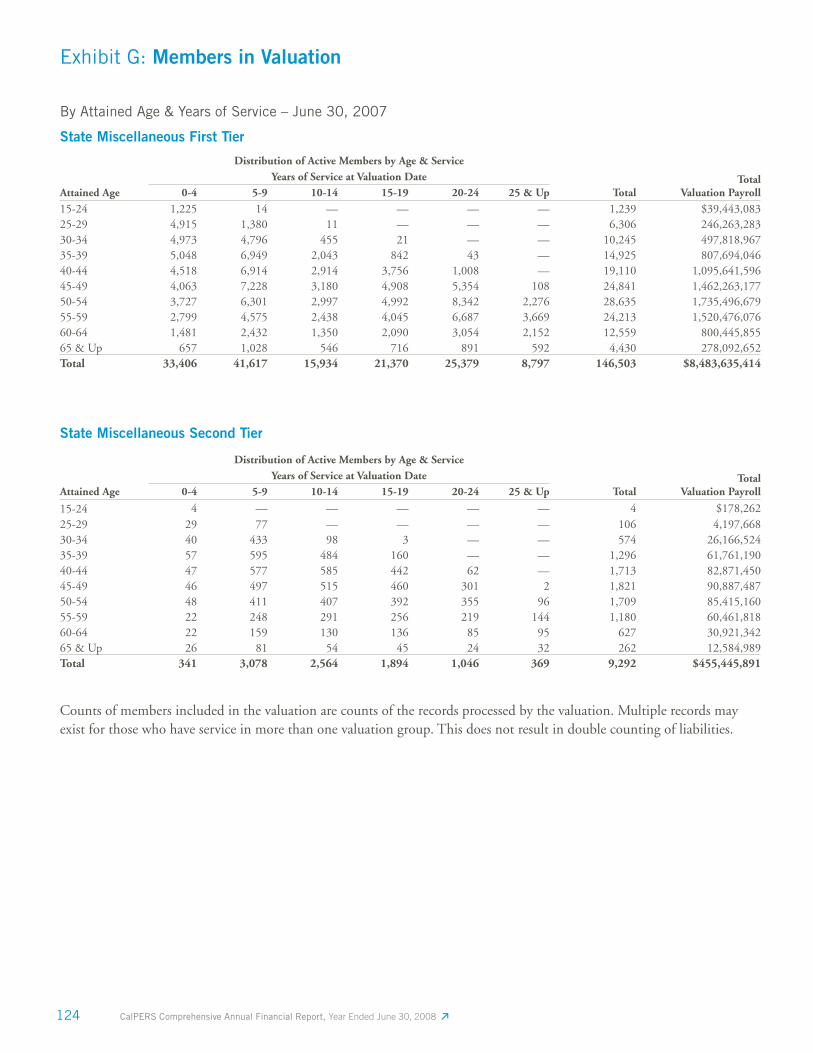
124 CalPERS Comprehensive Annual Financial Report, Year Ended June 30, 2008
By Attained Age & Years of Service – June 30, 2007
State Miscellaneous First Tier
Attained Age
Distribution of Active Members by Age & ServiceYears of Service at Valuation Date Total
Valuation Payroll0-4 5-9 10-14 15-19 20-24 25 & Up Total
15-24 1,225 14 — — — — 1,239 $39,443,08325-29 4,915 1,380 11 — — — 6,306 246,263,283 30-34 4,973 4,796 455 21 — — 10,245 497,818,967 35-39 5,048 6,949 2,043 842 43 — 14,925 807,694,046 40-44 4,518 6,914 2,914 3,756 1,008 — 19,110 1,095,641,596 45-49 4,063 7,228 3,180 4,908 5,354 108 24,841 1,462,263,177 50-54 3,727 6,301 2,997 4,992 8,342 2,276 28,635 1,735,496,679 55-59 2,799 4,575 2,438 4,045 6,687 3,669 24,213 1,520,476,076 60-64 1,481 2,432 1,350 2,090 3,054 2,152 12,559 800,445,855 65 & Up 657 1,028 546 716 891 592 4,430 278,092,652 Total 33,406 41,617 15,934 21,370 25,379 8,797 146,503 $8,483,635,414
Exhibit G: Members in Valuation
State Miscellaneous Second Tier
Attained Age
Distribution of Active Members by Age & ServiceYears of Service at Valuation Date Total
Valuation Payroll0-4 5-9 10-14 15-19 20-24 25 & Up Total
15-24 4 — — — — — 4 $178,26225-29 29 77 — — — — 106 4,197,668 30-34 40 433 98 3 — — 574 26,166,524 35-39 57 595 484 160 — — 1,296 61,761,190 40-44 47 577 585 442 62 — 1,713 82,871,450 45-49 46 497 515 460 301 2 1,821 90,887,487 50-54 48 411 407 392 355 96 1,709 85,415,160 55-59 22 248 291 256 219 144 1,180 60,461,818 60-64 22 159 130 136 85 95 627 30,921,342 65 & Up 26 81 54 45 24 32 262 12,584,989 Total 341 3,078 2,564 1,894 1,046 369 9,292 $455,445,891
Counts of members included in the valuation are counts of the records processed by the valuation. Multiple records may exist for those who have service in more than one valuation group. This does not result in double counting of liabilities.
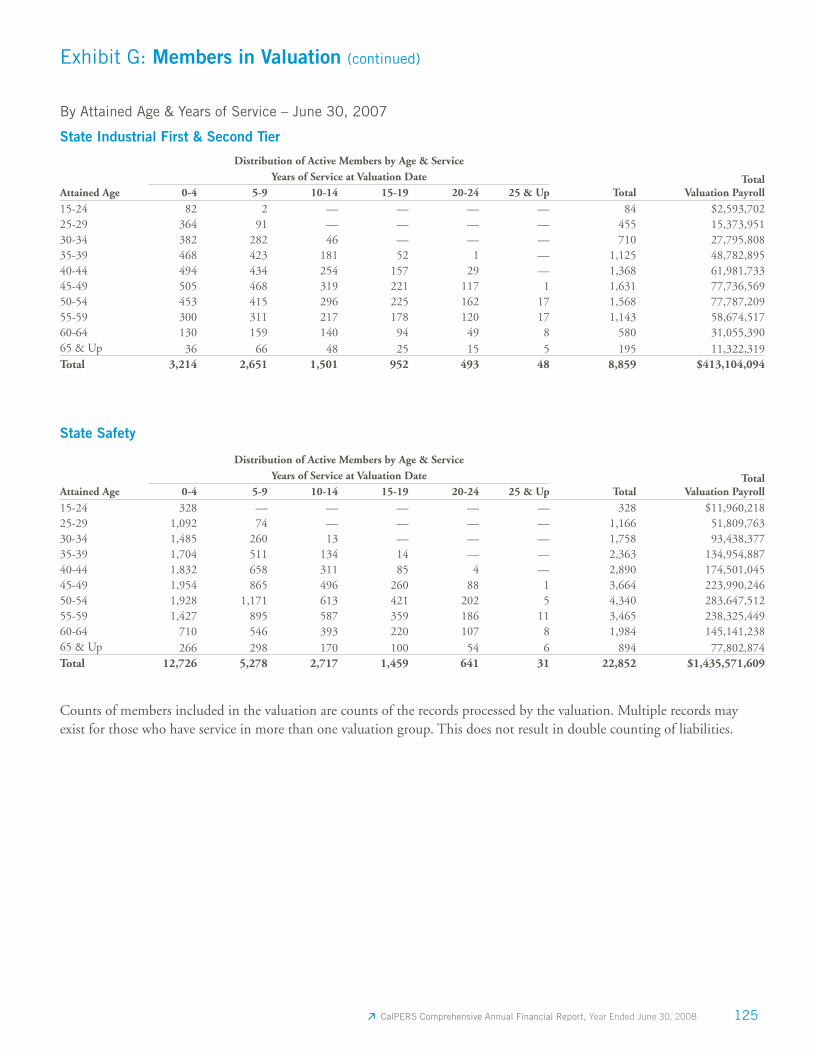
125 CalPERS Comprehensive Annual Financial Report, Year Ended June 30, 2008
By Attained Age & Years of Service – June 30, 2007
State Industrial First & Second Tier
Attained Age
Distribution of Active Members by Age & ServiceYears of Service at Valuation Date Total
Valuation Payroll0-4 5-9 10-14 15-19 20-24 25 & Up Total
15-24 82 2 — — — — 84 $2,593,70225-29 364 91 — — — — 455 15,373,951 30-34 382 282 46 — — — 710 27,795,808 35-39 468 423 181 52 1 — 1,125 48,782,895 40-44 494 434 254 157 29 — 1,368 61,981,733 45-49 505 468 319 221 117 1 1,631 77,736,569 50-54 453 415 296 225 162 17 1,568 77,787,209 55-59 300 311 217 178 120 17 1,143 58,674,517 60-64 130 159 140 94 49 8 580 31,055,390 65 & Up 36 66 48 25 15 5 195 11,322,319 Total 3,214 2,651 1,501 952 493 48 8,859 $413,104,094
Exhibit G: Members in Valuation (continued)
State Safety
Attained Age
Distribution of Active Members by Age & ServiceYears of Service at Valuation Date Total
Valuation Payroll0-4 5-9 10-14 15-19 20-24 25 & Up Total
15-24 328 — — — — — 328 $11,960,21825-29 1,092 74 — — — — 1,166 51,809,763 30-34 1,485 260 13 — — — 1,758 93,438,377 35-39 1,704 511 134 14 — — 2,363 134,954,887 40-44 1,832 658 311 85 4 — 2,890 174,501,045 45-49 1,954 865 496 260 88 1 3,664 223,990,246 50-54 1,928 1,171 613 421 202 5 4,340 283,647,512 55-59 1,427 895 587 359 186 11 3,465 238,325,449 60-64 710 546 393 220 107 8 1,984 145,141,238 65 & Up 266 298 170 100 54 6 894 77,802,874 Total 12,726 5,278 2,717 1,459 641 31 22,852 $1,435,571,609
Counts of members included in the valuation are counts of the records processed by the valuation. Multiple records may exist for those who have service in more than one valuation group. This does not result in double counting of liabilities.
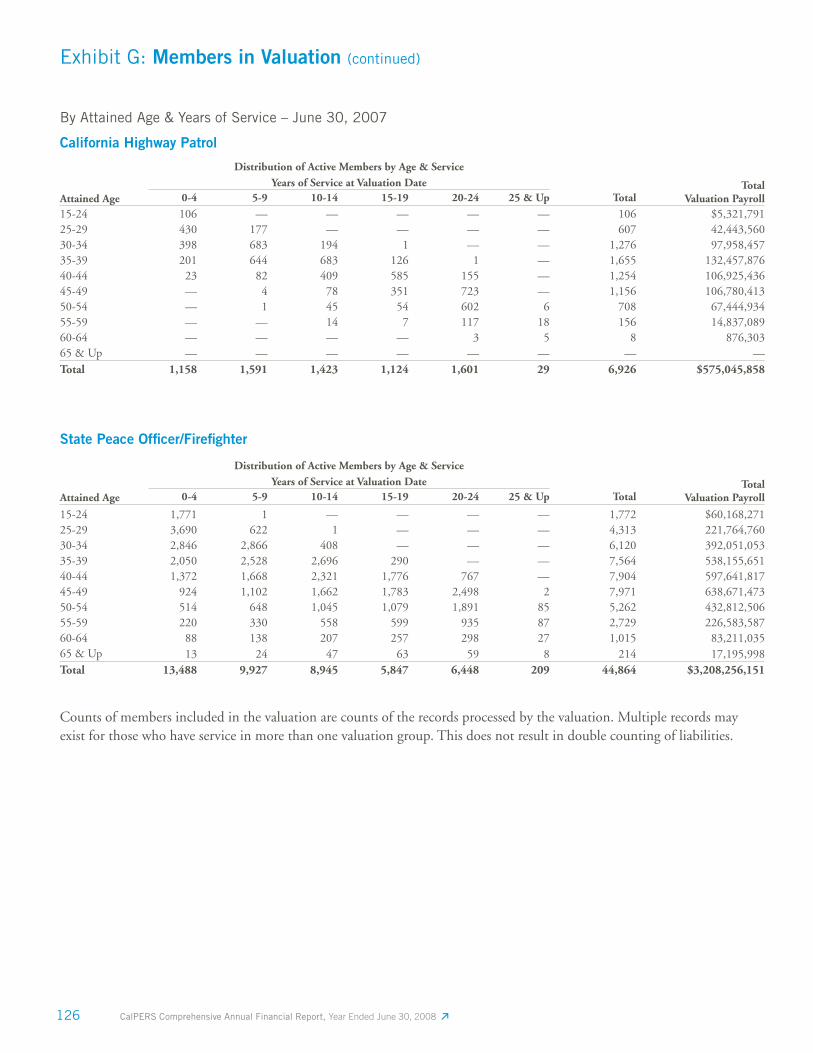
126 CalPERS Comprehensive Annual Financial Report, Year Ended June 30, 2008
By Attained Age & Years of Service – June 30, 2007
California Highway Patrol
Attained Age
Distribution of Active Members by Age & ServiceYears of Service at Valuation Date Total
Valuation Payroll0-4 5-9 10-14 15-19 20-24 25 & Up Total
15-24 106 — — — — — 106 $5,321,79125-29 430 177 — — — — 607 42,443,560 30-34 398 683 194 1 — — 1,276 97,958,457 35-39 201 644 683 126 1 — 1,655 132,457,876 40-44 23 82 409 585 155 — 1,254 106,925,436 45-49 — 4 78 351 723 — 1,156 106,780,413 50-54 — 1 45 54 602 6 708 67,444,934 55-59 — — 14 7 117 18 156 14,837,089 60-64 — — — — 3 5 8 876,303 65 & Up — — — — — — — — Total 1,158 1,591 1,423 1,124 1,601 29 6,926 $575,045,858
Exhibit G: Members in Valuation (continued)
State Peace Offi cer/Firefi ghter
Attained Age
Distribution of Active Members by Age & ServiceYears of Service at Valuation Date Total
Valuation Payroll0-4 5-9 10-14 15-19 20-24 25 & Up Total
15-24 1,771 1 — — — — 1,772 $60,168,27125-29 3,690 622 1 — — — 4,313 221,764,760 30-34 2,846 2,866 408 — — — 6,120 392,051,053 35-39 2,050 2,528 2,696 290 — — 7,564 538,155,651 40-44 1,372 1,668 2,321 1,776 767 — 7,904 597,641,817 45-49 924 1,102 1,662 1,783 2,498 2 7,971 638,671,473 50-54 514 648 1,045 1,079 1,891 85 5,262 432,812,506 55-59 220 330 558 599 935 87 2,729 226,583,587 60-64 88 138 207 257 298 27 1,015 83,211,035 65 & Up 13 24 47 63 59 8 214 17,195,998 Total 13,488 9,927 8,945 5,847 6,448 209 44,864 $3,208,256,151
Counts of members included in the valuation are counts of the records processed by the valuation. Multiple records may exist for those who have service in more than one valuation group. This does not result in double counting of liabilities.
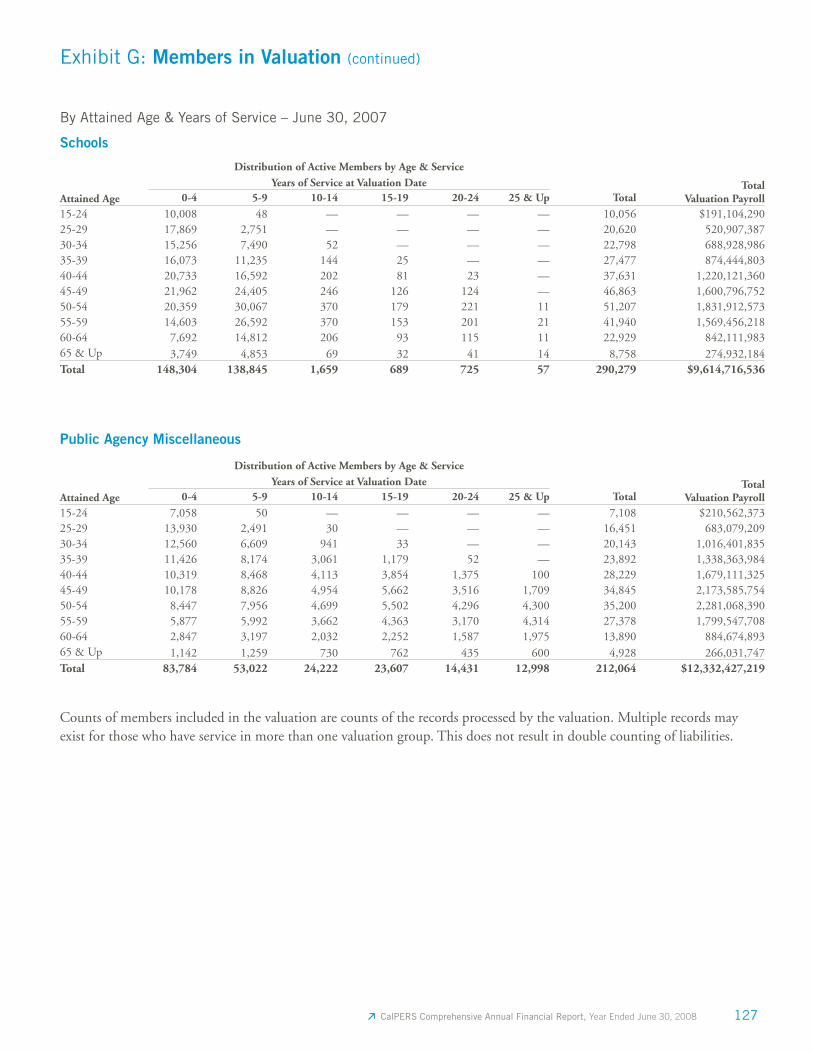
127 CalPERS Comprehensive Annual Financial Report, Year Ended June 30, 2008
By Attained Age & Years of Service – June 30, 2007
Schools
Attained Age
Distribution of Active Members by Age & ServiceYears of Service at Valuation Date Total
Valuation Payroll0-4 5-9 10-14 15-19 20-24 25 & Up Total
15-24 10,008 48 — — — — 10,056 $191,104,29025-29 17,869 2,751 — — — — 20,620 520,907,387 30-34 15,256 7,490 52 — — — 22,798 688,928,986 35-39 16,073 11,235 144 25 — — 27,477 874,444,803 40-44 20,733 16,592 202 81 23 — 37,631 1,220,121,360 45-49 21,962 24,405 246 126 124 — 46,863 1,600,796,752 50-54 20,359 30,067 370 179 221 11 51,207 1,831,912,573 55-59 14,603 26,592 370 153 201 21 41,940 1,569,456,218 60-64 7,692 14,812 206 93 115 11 22,929 842,111,983 65 & Up 3,749 4,853 69 32 41 14 8,758 274,932,184 Total 148,304 138,845 1,659 689 725 57 290,279 $9,614,716,536
Exhibit G: Members in Valuation (continued)
Public Agency Miscellaneous
Attained Age
Distribution of Active Members by Age & ServiceYears of Service at Valuation Date Total
Valuation Payroll0-4 5-9 10-14 15-19 20-24 25 & Up Total
15-24 7,058 50 — — — — 7,108 $210,562,37325-29 13,930 2,491 30 — — — 16,451 683,079,209 30-34 12,560 6,609 941 33 — — 20,143 1,016,401,835 35-39 11,426 8,174 3,061 1,179 52 — 23,892 1,338,363,984 40-44 10,319 8,468 4,113 3,854 1,375 100 28,229 1,679,111,325 45-49 10,178 8,826 4,954 5,662 3,516 1,709 34,845 2,173,585,754 50-54 8,447 7,956 4,699 5,502 4,296 4,300 35,200 2,281,068,390 55-59 5,877 5,992 3,662 4,363 3,170 4,314 27,378 1,799,547,708 60-64 2,847 3,197 2,032 2,252 1,587 1,975 13,890 884,674,893 65 & Up 1,142 1,259 730 762 435 600 4,928 266,031,747 Total 83,784 53,022 24,222 23,607 14,431 12,998 212,064 $12,332,427,219
Counts of members included in the valuation are counts of the records processed by the valuation. Multiple records may exist for those who have service in more than one valuation group. This does not result in double counting of liabilities.
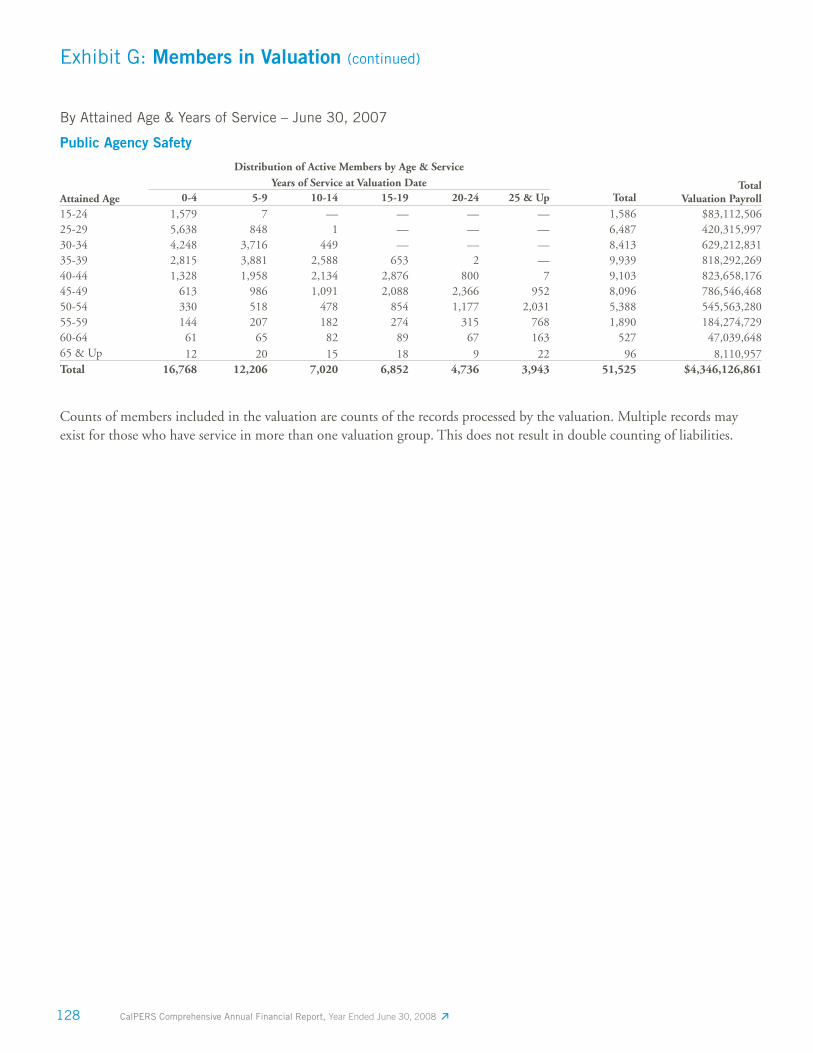
128 CalPERS Comprehensive Annual Financial Report, Year Ended June 30, 2008
By Attained Age & Years of Service – June 30, 2007
Public Agency Safety
Attained Age
Distribution of Active Members by Age & ServiceYears of Service at Valuation Date Total
Valuation Payroll0-4 5-9 10-14 15-19 20-24 25 & Up Total
15-24 1,579 7 — — — — 1,586 $83,112,506 25-29 5,638 848 1 — — — 6,487 420,315,997 30-34 4,248 3,716 449 — — — 8,413 629,212,831 35-39 2,815 3,881 2,588 653 2 — 9,939 818,292,269 40-44 1,328 1,958 2,134 2,876 800 7 9,103 823,658,176 45-49 613 986 1,091 2,088 2,366 952 8,096 786,546,468 50-54 330 518 478 854 1,177 2,031 5,388 545,563,280 55-59 144 207 182 274 315 768 1,890 184,274,729 60-64 61 65 82 89 67 163 527 47,039,648 65 & Up 12 20 15 18 9 22 96 8,110,957 Total 16,768 12,206 7,020 6,852 4,736 3,943 51,525 $4,346,126,861
Counts of members included in the valuation are counts of the records processed by the valuation. Multiple records may exist for those who have service in more than one valuation group. This does not result in double counting of liabilities.
Exhibit G: Members in Valuation (continued)
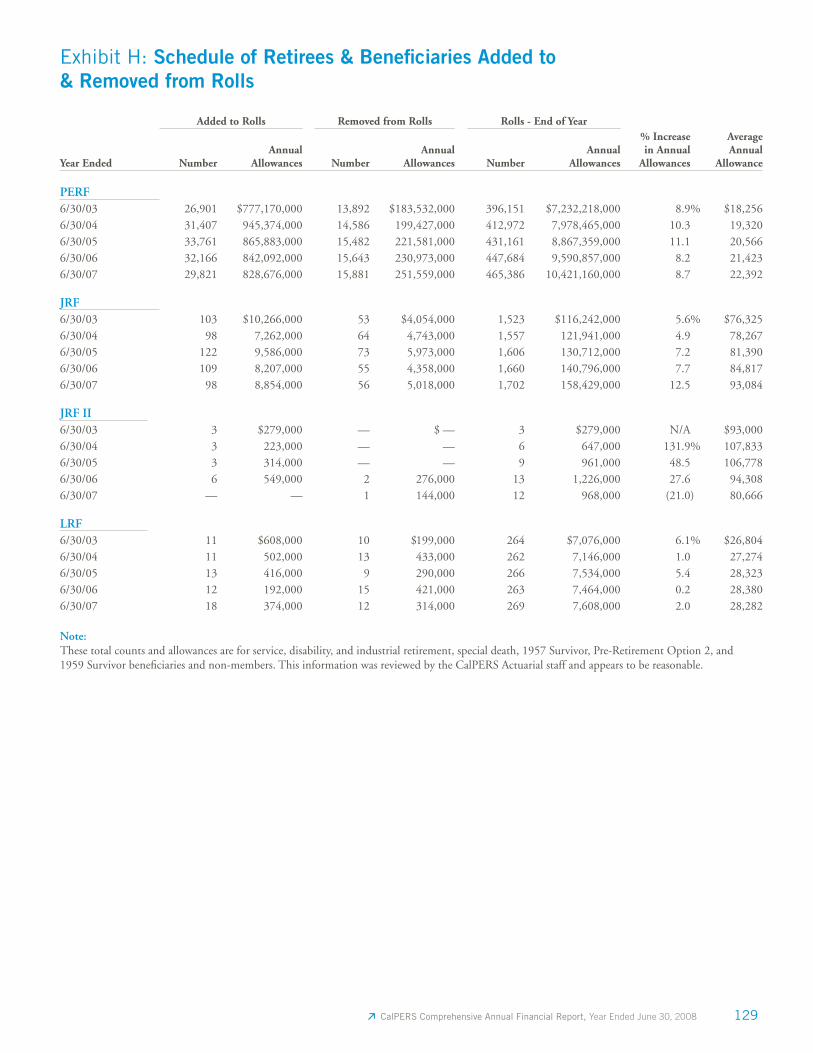
129 CalPERS Comprehensive Annual Financial Report, Year Ended June 30, 2008
Year Ended
Added to Rolls Removed from Rolls Rolls - End of Year% Increase in Annual
Allowances
Average Annual
AllowanceNumberAnnual
Allowances NumberAnnual
Allowances NumberAnnual
Allowances
PERF6/30/03 26,901 $777,170,000 13,892 $183,532,000 396,151 $7,232,218,000 8.9% $18,2566/30/04 31,407 945,374,000 14,586 199,427,000 412,972 7,978,465,000 10.3 19,3206/30/05 33,761 865,883,000 15,482 221,581,000 431,161 8,867,359,000 11.1 20,5666/30/06 32,166 842,092,000 15,643 230,973,000 447,684 9,590,857,000 8.2 21,4236/30/07 29,821 828,676,000 15,881 251,559,000 465,386 10,421,160,000 8.7 22,392
JRF6/30/03 103 $10,266,000 53 $4,054,000 1,523 $116,242,000 5.6% $76,3256/30/04 98 7,262,000 64 4,743,000 1,557 121,941,000 4.9 78,2676/30/05 122 9,586,000 73 5,973,000 1,606 130,712,000 7.2 81,3906/30/06 109 8,207,000 55 4,358,000 1,660 140,796,000 7.7 84,8176/30/07 98 8,854,000 56 5,018,000 1,702 158,429,000 12.5 93,084
JRF II6/30/03 3 $279,000 — $ — 3 $279,000 N/A $93,0006/30/04 3 223,000 — — 6 647,000 131.9% 107,8336/30/05 3 314,000 — — 9 961,000 48.5 106,7786/30/06 6 549,000 2 276,000 13 1,226,000 27.6 94,3086/30/07 — — 1 144,000 12 968,000 (21.0) 80,666
LRF6/30/03 11 $608,000 10 $199,000 264 $7,076,000 6.1% $26,8046/30/04 11 502,000 13 433,000 262 7,146,000 1.0 27,2746/30/05 13 416,000 9 290,000 266 7,534,000 5.4 28,3236/30/06 12 192,000 15 421,000 263 7,464,000 0.2 28,3806/30/07 18 374,000 12 314,000 269 7,608,000 2.0 28,282
Exhibit H: Schedule of Retirees & Benefi ciaries Added to & Removed from Rolls
Note: These total counts and allowances are for service, disability, and industrial retirement, special death, 1957 Survivor, Pre-Retirement Option 2, and1959 Survivor benefi ciaries and non-members. This information was reviewed by the CalPERS Actuarial staff and appears to be reasonable.
130 CalPERS Comprehensive Annual Financial Report, Year Ended June 30, 2008
Judges’ Retirement System
April 2008
Actuarial Certifi cationAs authorized by the CalPERS Board of Administration, we perform an annual actuarial valuation of the Judges’ Retirement System; the latest such valuation is as of June 30, 2007.
To the best of our knowledge, this report is complete and accurate and contains suffi cient information to fully and fairly disclose the actuarial funded condition of the Judges’ Retirement System, as of June 30, 2007. Based on the employee data provided by the CalPERS Judges’ and Legislators’ Offi ce, the statement of assets provided by the CalPERS Fiscal Services Division, and the benefi ts as outlined in Appendix B, it is our opinion that the valuation has been performed in accordance with generally accepted actuarial principles and that the assumptions and methods, as prescribed by the CalPERS Board of Administration, are reasonable for the System.
Further, information has been provided by us for the completion of (i) the trend data schedules (Required Schedule of Funding Progress and Schedule of Employer Contributions) in the Financial Section, and (ii) Exhibits A through H in the Actuarial Section of the CAFR.
Gale D. Patrick, F.S.A., M.A.A.A.Enrolled ActuarySenior Pension Actuary, CalPERS
Ron Seeling, Ph.D., F.C.A., A.S.A., M.A.A.A.Enrolled ActuaryChief Actuary, CalPERS
Judges’ Retirement System II
April 2008
Actuarial Certifi cationAs authorized by the CalPERS Board of Administration, we perform an annual actuarial valuation of the Judges’ Retirement System II; the latest such valuation is as of June 30, 2007.
To the best of our knowledge, this report is complete and accurate and contains suffi cient information to fully and fairly disclose the actuarial funded condition of the Judges’ Retirement System II, as of June 30, 2007. Based on the employee data provided by the Judges’ Retirement System administrative staff at CalPERS, the statement of assets provided by the CalPERS Fiscal Services Division, and the benefi ts as outlined in Appendix B, it is our opinion that the valuation has been performed in accordance with generally accepted actuarial principles and that the assumptions and methods are reasonable for this plan.
Further, information has been provided by us for the completion of (i) the trend data schedules (Required Schedule of Funding Progress and Schedule of Employer Contributions) in the Financial Section, and (ii) Exhibits A through H in the Actuarial Section of the CAFR.
Ray Lane, A.S.A., M.A.A.A.Enrolled ActuarySenior Pension Actuary, CalPERS
Ron Seeling, Ph.D., F.C.A., A.S.A., M.A.A.A.Enrolled ActuaryChief Actuary, CalPERS
Actuarial Certifi cations — Other Systems
131 CalPERS Comprehensive Annual Financial Report, Year Ended June 30, 2008
Legislators’ Retirement System
April 2008
Actuarial Certifi cationAs authorized by the CalPERS Board of Administration, we perform an annual actuarial valuation of the Legislators’ Retirement System; the latest such valuation is as of June 30, 2007.
To the best of our knowledge, this report is complete and accurate and contains suffi cient information to fully and fairly disclose the actuarial funded condition of the Legislators’ Retirement System. Based on the employee data provided by the CalPERS Judges’ and Legislators’ Offi ce, the statement of assets provided by the CalPERS Fiscal Services Division, and the benefi ts plans as outlined in Appendix B, it is our opinion that the valuation has been performed in accordance with generally accepted actuarial principles and that the assumptions and methods are reasonable for the System.
Further, information has been provided by us for the completion of (i) the trend data schedules (Required Schedule of Funding Progress and Schedule of Employer Contributions) in the Financial Section, and (ii) Exhibits A through H in the Actuarial Section of the CAFR.
David Clement, A.S.A., M.A.A.A.Enrolled ActuarySenior Pension Actuary, CalPERS
Ron Seeling, Ph.D., F.C.A., A.S.A., M.A.A.A.Enrolled ActuaryChief Actuary, CalPERS
The actuarial report and supporting documents for the Judges’ Retirement System, Judges’ Retirement System II, and Legislators’ Retirement System can be obtained through the CalPERS Actuarial and Employer Services Division, P.O. Box 942709, Sacramento, CA 94229-2709.
Actuarial Certifi cations — Other Systems (continued)

132 CalPERS Comprehensive Annual Financial Report, Year Ended June 30, 2008

Statistical Section
Meeting Obligations
CalPERS is resilient. We’ve provided pension benefi ts
since our inception during the Great Depression. We’ve
never missed a benefi t payout. We are a buy-and-hold,
long-term investor, and our long-term horizon enables
us to be patient.
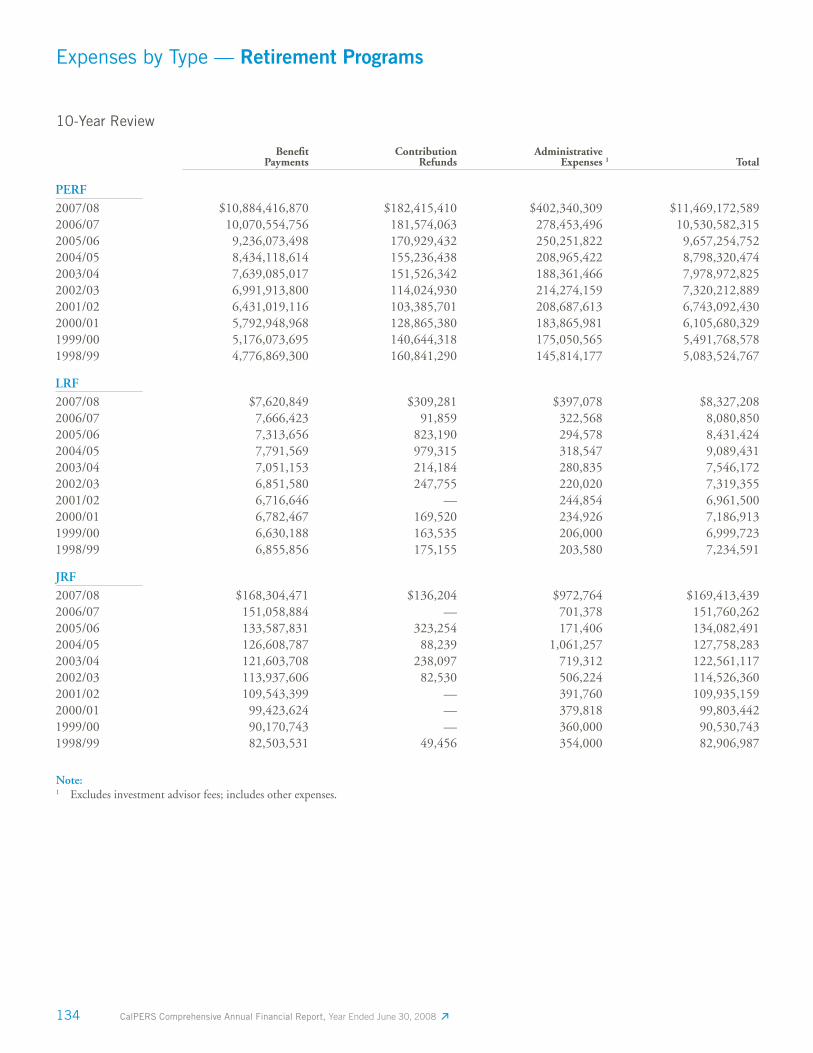
134 CalPERS Comprehensive Annual Financial Report, Year Ended June 30, 2008
Expenses by Type — Retirement Programs
Benefi t Payments
Contribution Refunds
Administrative Expenses 1 Total
PERF2007/08 $10,884,416,870 $182,415,410 $402,340,309 $11,469,172,5892006/07 10,070,554,756 181,574,063 278,453,496 10,530,582,3152005/06 9,236,073,498 170,929,432 250,251,822 9,657,254,7522004/05 8,434,118,614 155,236,438 208,965,422 8,798,320,4742003/04 7,639,085,017 151,526,342 188,361,466 7,978,972,8252002/03 6,991,913,800 114,024,930 214,274,159 7,320,212,8892001/02 6,431,019,116 103,385,701 208,687,613 6,743,092,4302000/01 5,792,948,968 128,865,380 183,865,981 6,105,680,3291999/00 5,176,073,695 140,644,318 175,050,565 5,491,768,5781998/99 4,776,869,300 160,841,290 145,814,177 5,083,524,767
LRF2007/08 $7,620,849 $309,281 $397,078 $8,327,2082006/07 7,666,423 91,859 322,568 8,080,8502005/06 7,313,656 823,190 294,578 8,431,4242004/05 7,791,569 979,315 318,547 9,089,4312003/04 7,051,153 214,184 280,835 7,546,1722002/03 6,851,580 247,755 220,020 7,319,3552001/02 6,716,646 — 244,854 6,961,5002000/01 6,782,467 169,520 234,926 7,186,9131999/00 6,630,188 163,535 206,000 6,999,7231998/99 6,855,856 175,155 203,580 7,234,591
JRF2007/08 $168,304,471 $136,204 $972,764 $169,413,4392006/07 151,058,884 — 701,378 151,760,2622005/06 133,587,831 323,254 171,406 134,082,4912004/05 126,608,787 88,239 1,061,257 127,758,2832003/04 121,603,708 238,097 719,312 122,561,1172002/03 113,937,606 82,530 506,224 114,526,3602001/02 109,543,399 — 391,760 109,935,1592000/01 99,423,624 — 379,818 99,803,4421999/00 90,170,743 — 360,000 90,530,7431998/99 82,503,531 49,456 354,000 82,906,987
Note:1 Excludes investment advisor fees; includes other expenses.
10-Year Review
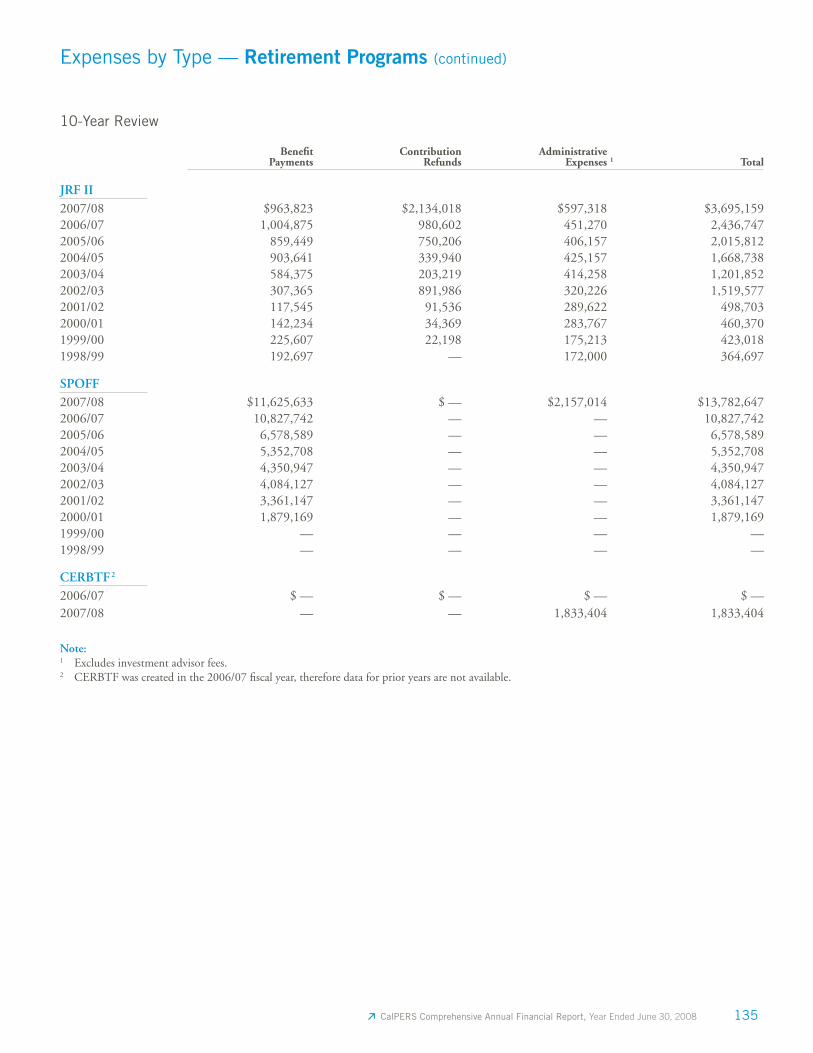
CalPERS Comprehensive Annual Financial Report, Year Ended June 30, 2008 135
Benefi t Payments
Contribution Refunds
Administrative Expenses 1 Total
JRF II2007/08 $963,823 $2,134,018 $597,318 $3,695,1592006/07 1,004,875 980,602 451,270 2,436,7472005/06 859,449 750,206 406,157 2,015,8122004/05 903,641 339,940 425,157 1,668,7382003/04 584,375 203,219 414,258 1,201,8522002/03 307,365 891,986 320,226 1,519,5772001/02 117,545 91,536 289,622 498,7032000/01 142,234 34,369 283,767 460,3701999/00 225,607 22,198 175,213 423,0181998/99 192,697 — 172,000 364,697
SPOFF2007/08 $11,625,633 $ — $2,157,014 $13,782,6472006/07 10,827,742 — — 10,827,7422005/06 6,578,589 — — 6,578,5892004/05 5,352,708 — — 5,352,7082003/04 4,350,947 — — 4,350,9472002/03 4,084,127 — — 4,084,1272001/02 3,361,147 — — 3,361,1472000/01 1,879,169 — — 1,879,1691999/00 — — — —1998/99 — — — —
CERBTF2
2006/07 $ — $ — $ — $ —2007/08 — — 1,833,404 1,833,404
Note:1 Excludes investment advisor fees.2 CERBTF was created in the 2006/07 fi scal year, therefore data for prior years are not available.
Expenses by Type — Retirement Programs (continued)
10-Year Review
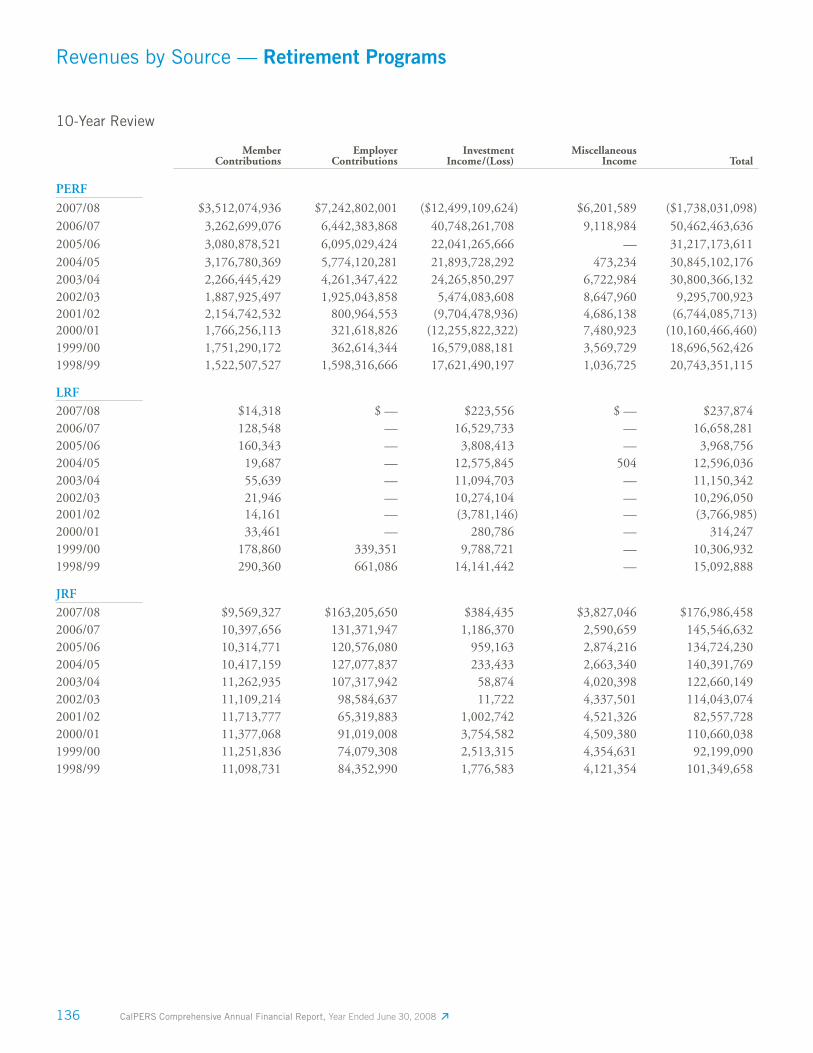
136 CalPERS Comprehensive Annual Financial Report, Year Ended June 30, 2008
Revenues by Source — Retirement Programs
MemberContributions
EmployerContributions
InvestmentIncome/(Loss)
MiscellaneousIncome Total
PERF
2007/08 $3,512,074,936 $7,242,802,001 ($12,499,109,624) $6,201,589 ($1,738,031,098)2006/07 3,262,699,076 6,442,383,868 40,748,261,708 9,118,984 50,462,463,6362005/06 3,080,878,521 6,095,029,424 22,041,265,666 — 31,217,173,6112004/05 3,176,780,369 5,774,120,281 21,893,728,292 473,234 30,845,102,1762003/04 2,266,445,429 4,261,347,422 24,265,850,297 6,722,984 30,800,366,1322002/03 1,887,925,497 1,925,043,858 5,474,083,608 8,647,960 9,295,700,9232001/02 2,154,742,532 800,964,553 (9,704,478,936) 4,686,138 (6,744,085,713)2000/01 1,766,256,113 321,618,826 (12,255,822,322) 7,480,923 (10,160,466,460)1999/00 1,751,290,172 362,614,344 16,579,088,181 3,569,729 18,696,562,4261998/99 1,522,507,527 1,598,316,666 17,621,490,197 1,036,725 20,743,351,115
LRF 2007/08 $14,318 $ — $223,556 $ — $237,8742006/07 128,548 — 16,529,733 — 16,658,2812005/06 160,343 — 3,808,413 — 3,968,7562004/05 19,687 — 12,575,845 504 12,596,0362003/04 55,639 — 11,094,703 — 11,150,3422002/03 21,946 — 10,274,104 — 10,296,0502001/02 14,161 — (3,781,146) — (3,766,985)2000/01 33,461 — 280,786 — 314,2471999/00 178,860 339,351 9,788,721 — 10,306,9321998/99 290,360 661,086 14,141,442 — 15,092,888
JRF2007/08 $9,569,327 $163,205,650 $384,435 $3,827,046 $176,986,4582006/07 10,397,656 131,371,947 1,186,370 2,590,659 145,546,6322005/06 10,314,771 120,576,080 959,163 2,874,216 134,724,2302004/05 10,417,159 127,077,837 233,433 2,663,340 140,391,7692003/04 11,262,935 107,317,942 58,874 4,020,398 122,660,1492002/03 11,109,214 98,584,637 11,722 4,337,501 114,043,0742001/02 11,713,777 65,319,883 1,002,742 4,521,326 82,557,7282000/01 11,377,068 91,019,008 3,754,582 4,509,380 110,660,0381999/00 11,251,836 74,079,308 2,513,315 4,354,631 92,199,0901998/99 11,098,731 84,352,990 1,776,583 4,121,354 101,349,658
10-Year Review
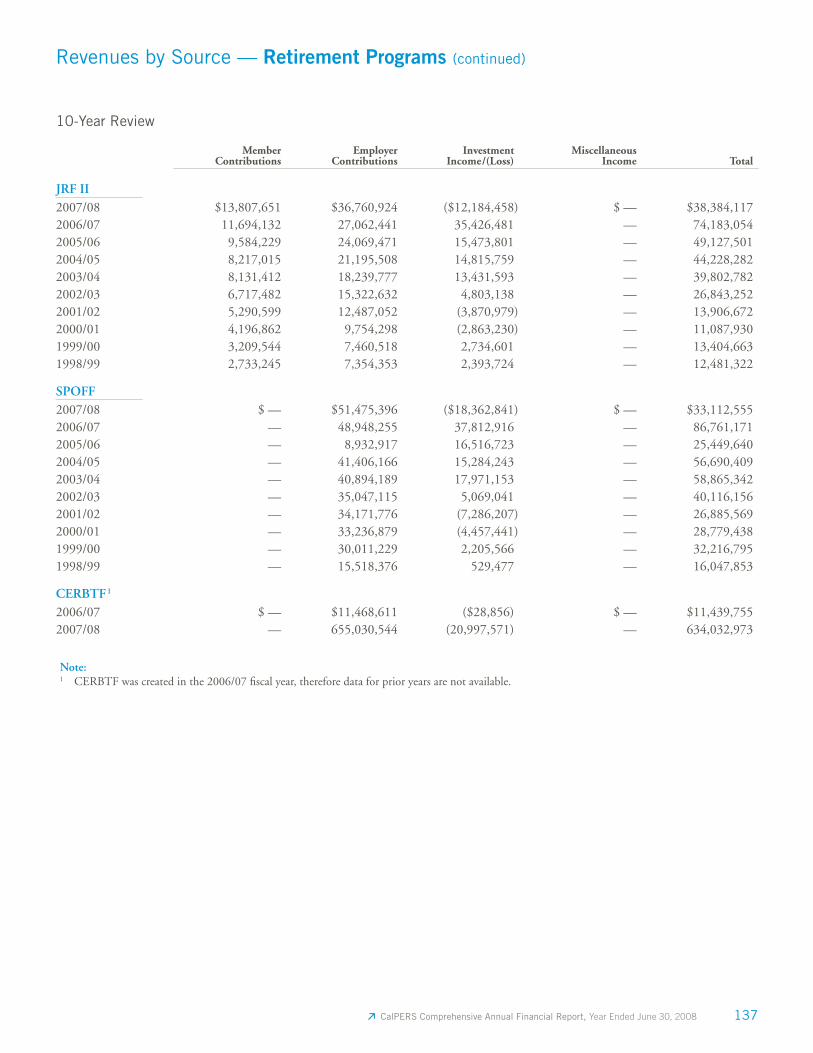
CalPERS Comprehensive Annual Financial Report, Year Ended June 30, 2008 137
Revenues by Source — Retirement Programs (continued)
MemberContributions
EmployerContributions
InvestmentIncome/(Loss)
MiscellaneousIncome Total
JRF II2007/08 $13,807,651 $36,760,924 ($12,184,458) $ — $38,384,1172006/07 11,694,132 27,062,441 35,426,481 — 74,183,0542005/06 9,584,229 24,069,471 15,473,801 — 49,127,5012004/05 8,217,015 21,195,508 14,815,759 — 44,228,2822003/04 8,131,412 18,239,777 13,431,593 — 39,802,7822002/03 6,717,482 15,322,632 4,803,138 — 26,843,2522001/02 5,290,599 12,487,052 (3,870,979) — 13,906,6722000/01 4,196,862 9,754,298 (2,863,230) — 11,087,9301999/00 3,209,544 7,460,518 2,734,601 — 13,404,6631998/99 2,733,245 7,354,353 2,393,724 — 12,481,322
SPOFF2007/08 $ — $51,475,396 ($18,362,841) $ — $33,112,5552006/07 — 48,948,255 37,812,916 — 86,761,1712005/06 — 8,932,917 16,516,723 — 25,449,6402004/05 — 41,406,166 15,284,243 — 56,690,4092003/04 — 40,894,189 17,971,153 — 58,865,3422002/03 — 35,047,115 5,069,041 — 40,116,1562001/02 — 34,171,776 (7,286,207) — 26,885,5692000/01 — 33,236,879 (4,457,441) — 28,779,4381999/00 — 30,011,229 2,205,566 — 32,216,7951998/99 — 15,518,376 529,477 — 16,047,853
CERBTF1
2006/07 $ — $11,468,611 ($28,856) $ — $11,439,7552007/08 — 655,030,544 (20,997,571) — 634,032,973
10-Year Review
Note:1 CERBTF was created in the 2006/07 fi scal year, therefore data for prior years are not available.
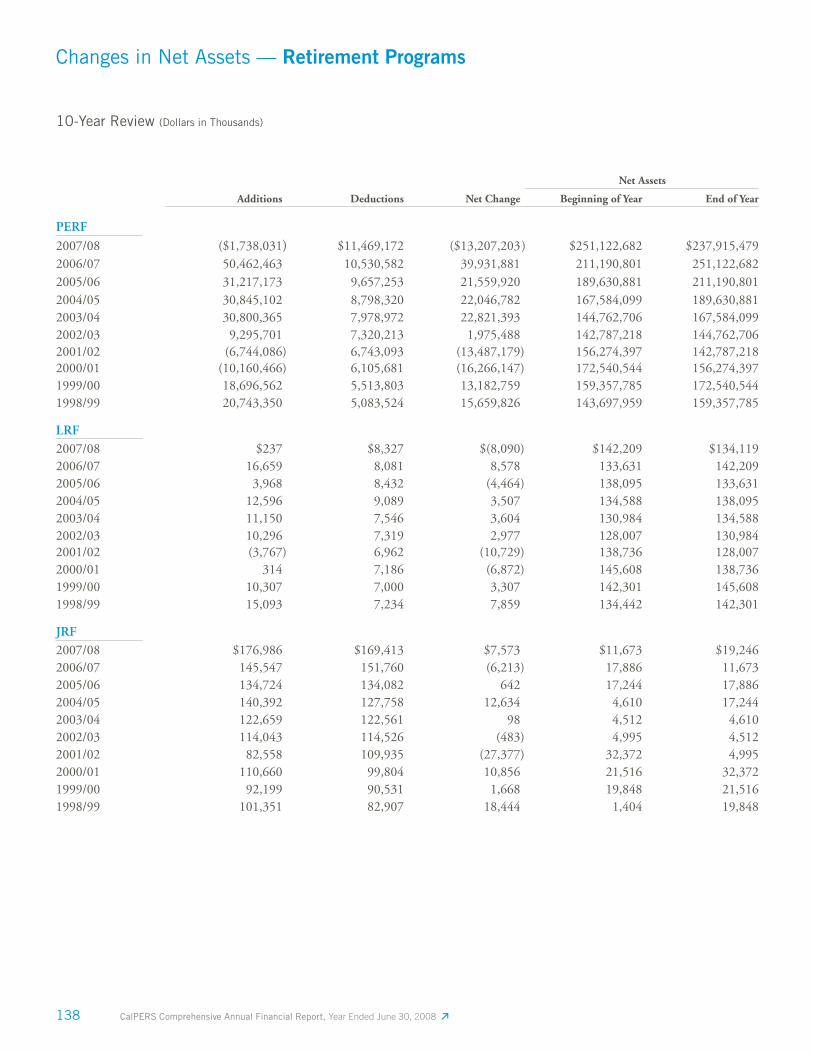
138 CalPERS Comprehensive Annual Financial Report, Year Ended June 30, 2008
Changes in Net Assets — Retirement Programs
Net Assets
Additions Deductions Net Change Beginning of Year End of Year
PERF
2007/08 ($1,738,031) $11,469,172 ($13,207,203) $251,122,682 $237,915,4792006/07 50,462,463 10,530,582 39,931,881 211,190,801 251,122,6822005/06 31,217,173 9,657,253 21,559,920 189,630,881 211,190,8012004/05 30,845,102 8,798,320 22,046,782 167,584,099 189,630,8812003/04 30,800,365 7,978,972 22,821,393 144,762,706 167,584,0992002/03 9,295,701 7,320,213 1,975,488 142,787,218 144,762,7062001/02 (6,744,086) 6,743,093 (13,487,179) 156,274,397 142,787,2182000/01 (10,160,466) 6,105,681 (16,266,147) 172,540,544 156,274,3971999/00 18,696,562 5,513,803 13,182,759 159,357,785 172,540,5441998/99 20,743,350 5,083,524 15,659,826 143,697,959 159,357,785
LRF 2007/08 $237 $8,327 $(8,090) $142,209 $134,1192006/07 16,659 8,081 8,578 133,631 142,2092005/06 3,968 8,432 (4,464) 138,095 133,6312004/05 12,596 9,089 3,507 134,588 138,0952003/04 11,150 7,546 3,604 130,984 134,5882002/03 10,296 7,319 2,977 128,007 130,9842001/02 (3,767) 6,962 (10,729) 138,736 128,0072000/01 314 7,186 (6,872) 145,608 138,7361999/00 10,307 7,000 3,307 142,301 145,6081998/99 15,093 7,234 7,859 134,442 142,301
JRF2007/08 $176,986 $169,413 $7,573 $11,673 $19,2462006/07 145,547 151,760 (6,213) 17,886 11,6732005/06 134,724 134,082 642 17,244 17,8862004/05 140,392 127,758 12,634 4,610 17,2442003/04 122,659 122,561 98 4,512 4,6102002/03 114,043 114,526 (483) 4,995 4,5122001/02 82,558 109,935 (27,377) 32,372 4,9952000/01 110,660 99,804 10,856 21,516 32,3721999/00 92,199 90,531 1,668 19,848 21,5161998/99 101,351 82,907 18,444 1,404 19,848
10-Year Review (Dollars in Thousands)
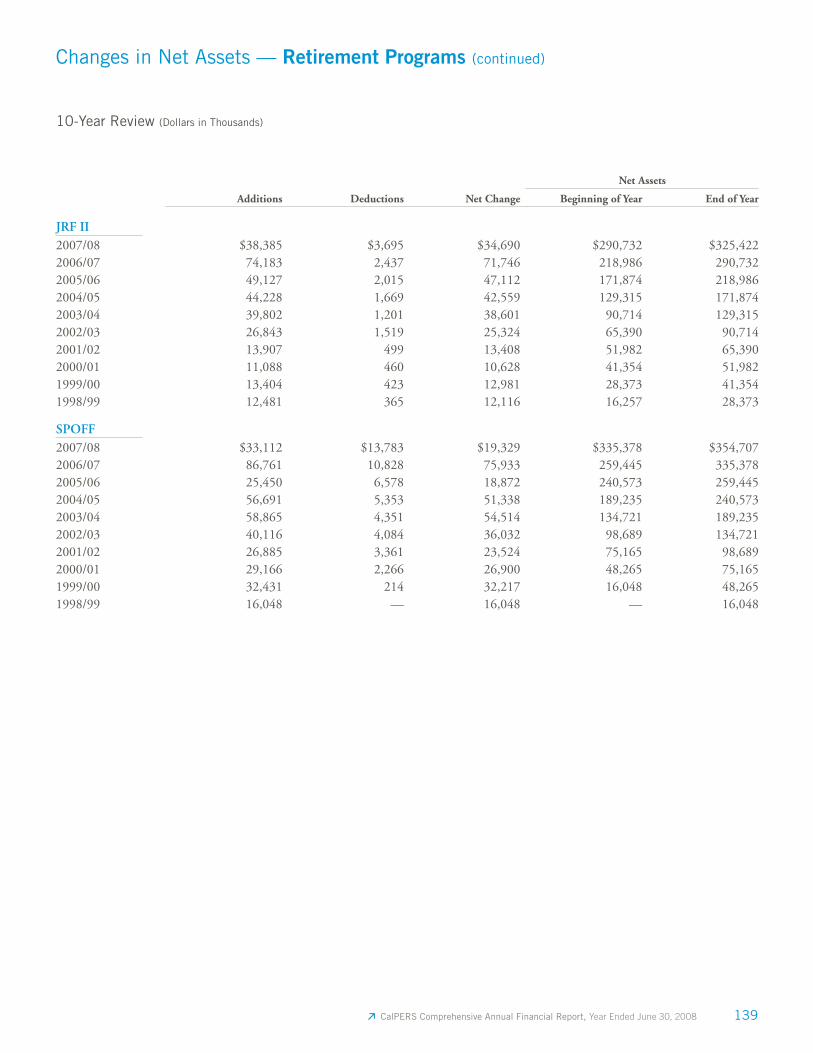
CalPERS Comprehensive Annual Financial Report, Year Ended June 30, 2008 139
Changes in Net Assets — Retirement Programs (continued)
Net Assets
Additions Deductions Net Change Beginning of Year End of Year
JRF II2007/08 $38,385 $3,695 $34,690 $290,732 $325,4222006/07 74,183 2,437 71,746 218,986 290,7322005/06 49,127 2,015 47,112 171,874 218,9862004/05 44,228 1,669 42,559 129,315 171,8742003/04 39,802 1,201 38,601 90,714 129,3152002/03 26,843 1,519 25,324 65,390 90,7142001/02 13,907 499 13,408 51,982 65,3902000/01 11,088 460 10,628 41,354 51,9821999/00 13,404 423 12,981 28,373 41,3541998/99 12,481 365 12,116 16,257 28,373
SPOFF2007/08 $33,112 $13,783 $19,329 $335,378 $354,7072006/07 86,761 10,828 75,933 259,445 335,3782005/06 25,450 6,578 18,872 240,573 259,4452004/05 56,691 5,353 51,338 189,235 240,5732003/04 58,865 4,351 54,514 134,721 189,2352002/03 40,116 4,084 36,032 98,689 134,7212001/02 26,885 3,361 23,524 75,165 98,6892000/01 29,166 2,266 26,900 48,265 75,1651999/00 32,431 214 32,217 16,048 48,2651998/99 16,048 — 16,048 — 16,048
10-Year Review (Dollars in Thousands)
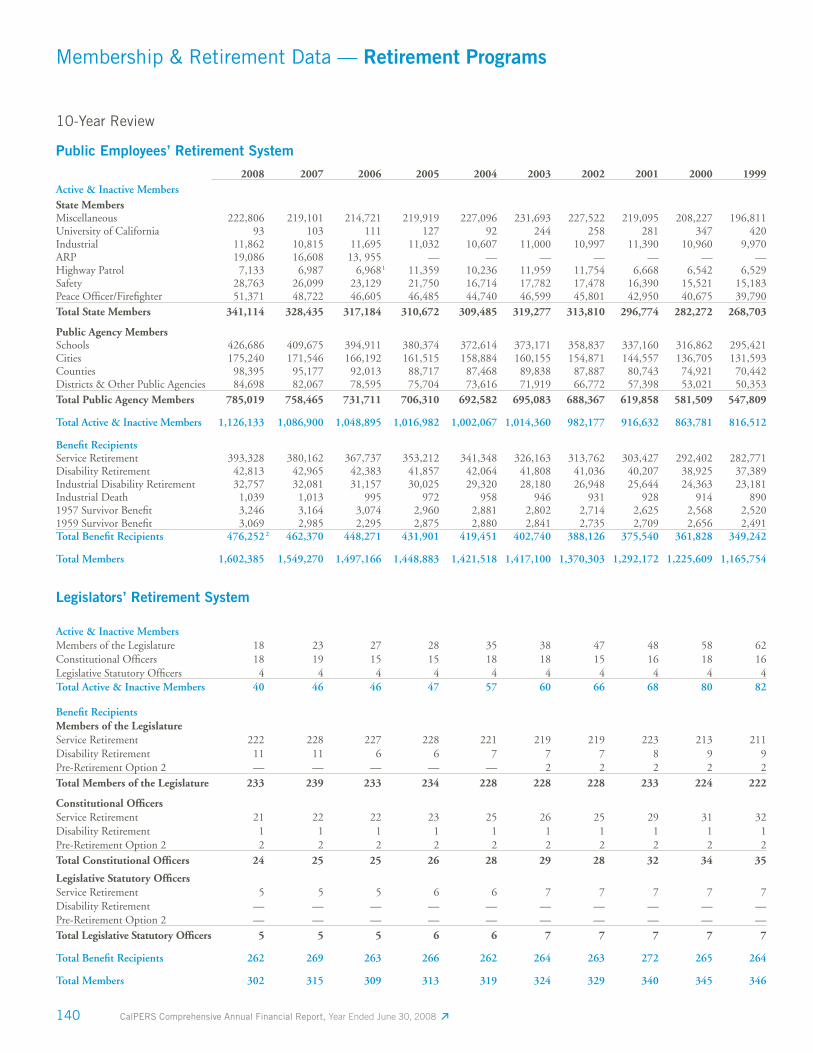
140 CalPERS Comprehensive Annual Financial Report, Year Ended June 30, 2008
Membership & Retirement Data — Retirement Programs
Public Employees’ Retirement System
2008 2007 2006 2005 2004 2003 2002 2001 2000 1999Active & Inactive Members State MembersMiscellaneous 222,806 219,101 214,721 219,919 227,096 231,693 227,522 219,095 208,227 196,811University of California 93 103 111 127 92 244 258 281 347 420Industrial 11,862 10,815 11,695 11,032 10,607 11,000 10,997 11,390 10,960 9,970ARP 19,086 16,608 13, 955 — — — — — — —Highway Patrol 7,133 6,987 6,968 1 11,359 10,236 11,959 11,754 6,668 6,542 6,529Safety 28,763 26,099 23,129 21,750 16,714 17,782 17,478 16,390 15,521 15,183Peace Offi cer/Firefi ghter 51,371 48,722 46,605 46,485 44,740 46,599 45,801 42,950 40,675 39,790Total State Members 341,114 328,435 317,184 310,672 309,485 319,277 313,810 296,774 282,272 268,703
Public Agency MembersSchools 426,686 409,675 394,911 380,374 372,614 373,171 358,837 337,160 316,862 295,421Cities 175,240 171,546 166,192 161,515 158,884 160,155 154,871 144,557 136,705 131,593Counties 98,395 95,177 92,013 88,717 87,468 89,838 87,887 80,743 74,921 70,442Districts & Other Public Agencies 84,698 82,067 78,595 75,704 73,616 71,919 66,772 57,398 53,021 50,353Total Public Agency Members 785,019 758,465 731,711 706,310 692,582 695,083 688,367 619,858 581,509 547,809
Total Active & Inactive Members 1,126,133 1,086,900 1,048,895 1,016,982 1,002,067 1,014,360 982,177 916,632 863,781 816,512
Benefi t RecipientsService Retirement 393,328 380,162 367,737 353,212 341,348 326,163 313,762 303,427 292,402 282,771Disability Retirement 42,813 42,965 42,383 41,857 42,064 41,808 41,036 40,207 38,925 37,389Industrial Disability Retirement 32,757 32,081 31,157 30,025 29,320 28,180 26,948 25,644 24,363 23,181Industrial Death 1,039 1,013 995 972 958 946 931 928 914 8901957 Survivor Benefi t 3,246 3,164 3,074 2,960 2,881 2,802 2,714 2,625 2,568 2,5201959 Survivor Benefi t 3,069 2,985 2,295 2,875 2,880 2,841 2,735 2,709 2,656 2,491Total Benefi t Recipients 476,252 2 462,370 448,271 431,901 419,451 402,740 388,126 375,540 361,828 349,242
Total Members 1,602,385 1,549,270 1,497,166 1,448,883 1,421,518 1,417,100 1,370,303 1,292,172 1,225,609 1,165,754
Legislators’ Retirement System
Active & Inactive MembersMembers of the Legislature 18 23 27 28 35 38 47 48 58 62Constitutional Offi cers 18 19 15 15 18 18 15 16 18 16Legislative Statutory Offi cers 4 4 4 4 4 4 4 4 4 4Total Active & Inactive Members 40 46 46 47 57 60 66 68 80 82
Benefi t RecipientsMembers of the LegislatureService Retirement 222 228 227 228 221 219 219 223 213 211Disability Retirement 11 11 6 6 7 7 7 8 9 9Pre-Retirement Option 2 — — — — — 2 2 2 2 2Total Members of the Legislature 233 239 233 234 228 228 228 233 224 222
Constitutional Offi cersService Retirement 21 22 22 23 25 26 25 29 31 32Disability Retirement 1 1 1 1 1 1 1 1 1 1Pre-Retirement Option 2 2 2 2 2 2 2 2 2 2 2Total Constitutional Offi cers 24 25 25 26 28 29 28 32 34 35
Legislative Statutory Offi cersService Retirement 5 5 5 6 6 7 7 7 7 7Disability Retirement — — — — — — — — — —Pre-Retirement Option 2 — — — — — — — — — —Total Legislative Statutory Offi cers 5 5 5 6 6 7 7 7 7 7
Total Benefi t Recipients 262 269 263 266 262 264 263 272 265 264
Total Members 302 315 309 313 319 324 329 340 345 346
10-Year Review
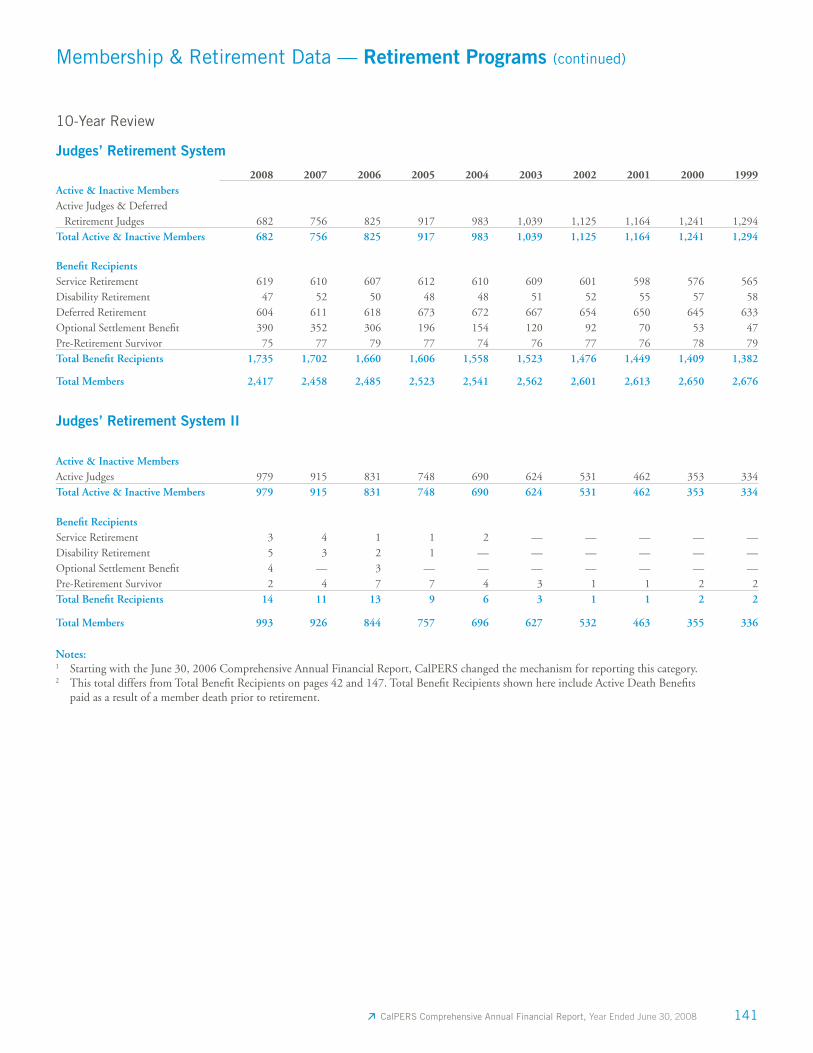
CalPERS Comprehensive Annual Financial Report, Year Ended June 30, 2008 141
Membership & Retirement Data — Retirement Programs (continued)
Judges’ Retirement System
2008 2007 2006 2005 2004 2003 2002 2001 2000 1999Active & Inactive MembersActive Judges & Deferred Retirement Judges 682 756 825 917 983 1,039 1,125 1,164 1,241 1,294Total Active & Inactive Members 682 756 825 917 983 1,039 1,125 1,164 1,241 1,294
Benefi t RecipientsService Retirement 619 610 607 612 610 609 601 598 576 565Disability Retirement 47 52 50 48 48 51 52 55 57 58Deferred Retirement 604 611 618 673 672 667 654 650 645 633Optional Settlement Benefi t 390 352 306 196 154 120 92 70 53 47Pre-Retirement Survivor 75 77 79 77 74 76 77 76 78 79Total Benefi t Recipients 1,735 1,702 1,660 1,606 1,558 1,523 1,476 1,449 1,409 1,382
Total Members 2,417 2,458 2,485 2,523 2,541 2,562 2,601 2,613 2,650 2,676
Judges’ Retirement System II
Active & Inactive MembersActive Judges 979 915 831 748 690 624 531 462 353 334Total Active & Inactive Members 979 915 831 748 690 624 531 462 353 334
Benefi t RecipientsService Retirement 3 4 1 1 2 — — — — —Disability Retirement 5 3 2 1 — — — — — —Optional Settlement Benefi t 4 — 3 — — — — — — —Pre-Retirement Survivor 2 4 7 7 4 3 1 1 2 2Total Benefi t Recipients 14 11 13 9 6 3 1 1 2 2
Total Members 993 926 844 757 696 627 532 463 355 336
Notes:1 Starting with the June 30, 2006 Comprehensive Annual Financial Report, CalPERS changed the mechanism for reporting this category. 2 This total differs from Total Benefi t Recipients on pages 42 and 147. Total Benefi t Recipients shown here include Active Death Benefi ts
paid as a result of a member death prior to retirement.
10-Year Review
142 CalPERS Comprehensive Annual Financial Report, Year Ended June 30, 2008
Program Data
Primary Benefi ts
Benefi ts are paid according to the category of employment and the type of benefi t coverage provided by an employer. Local agencies have variations in benefi ts due to their specifi c contract obligations with CalPERS.
Th e four categories of membership are:
Miscellaneous Members — staff, operational, supervisory, and all other eligible employees who are not in special membership categories.
Safety Members — California Highway Patrol offi cers, police offi cers, fi refi ghters, and other employees whose principal duties are in active law enforcement or fi re prevention and suppression work, or who occupy positions designated by law as safety member positions.
State Industrial Members — employees of the Department of Corrections and the California Youth Authority who have the same service retirement and other benefi ts as miscellaneous members, but who also have industrial death and disability benefi ts under certain limited circumstances.
State Peace Officer/Firefighter Members — State employees who are involved in law enforcement, fi refi ghting and fi re suppression, public safety, protective services, or the management and supervision thereof, whose positions are defi ned as State peace offi cer/fi refi ghter members in the Government Code or by the Department of Personnel Administration.
Separation from Employment/Refunds
At permanent separation from employment, members may either leave their contributions on deposit and defer retirement1 or terminate membership by electing to take a refund of member contributions plus interest (compounded annually). With a refund election, CalPERS is required to deduct federal withholding of 20 percent from the untaxed portion of the refund, unless the taxable portion is directly rolled over to a qualifi ed plan or IRA.
Service Retirement
State Miscellaneous & State Industrial Members
(First Tier), School Members & University Members
2 Percent at 55 Formula
Service not coordinated with Social Security — A guarantee of 2 percent of fi nal compensation2 at age 55 for each year of service credit. Retirement may begin at age 50 with a reduced benefi t rate, or after age 55 with an increased benefi t rate to age 63.
Service coordinated with Social Security — Same basic benefi t rate; however, there is a reduction of $133.33 from the fi nal compensation before benefi ts are determined.
School members with service credit rendered after January 1, 2001: fi nal compensation will not be reduced by $133.33.
State Miscellaneous & State Industrial Members
Separated from Service Prior to January 1, 2000
2 Percent at 60 Formula
Service not coordinated with Social Security — A guarantee of 2 percent of fi nal compensation at age 60 for each year of service credit. Retirement may begin at age 50 with a reduced benefi t rate, or after age 60 with an increased benefi t rate to age 63.
Service coordinated with Social Security — Same basic benefi t rate; however, there is a reduction of $133.33 from the fi nal compensation before benefi ts are determined.
State Miscellaneous & State Industrial Members
(Second Tier) 1.25 Percent at 65 Formula
A guarantee of 1.25 percent of fi nal compensation at age 65 for each year of service credit. Retirement may begin at age 55, or as early as age 50 (if there is a combination of First Tier and Second Tier service; a reduced benefi t rate will apply).
Notes:1 A member who has less than the required amount of service credit must return to CalPERS-covered employment to obtain the minimum service
credit required to be eligible for retirement.2 The term “fi nal compensation” appears throughout this section. It means the average payrate and special compensation over the last three
consecutive years of employment (or one year for State and school members or as a contract option for local members) unless the member elects a different period with a higher average.

CalPERS Comprehensive Annual Financial Report, Year Ended June 30, 2008 143
Program Data (continued)
Local Miscellaneous Members 2 Percent at 60 Formula
Service not coordinated with Social Security — A guarantee of 2 percent of fi nal compensation at age 60 for each year of service credit. Retirement may begin at age 50 with a reduced benefi t rate, or after age 60 with an increased benefi t rate to age 63.
Service coordinated with Social Security — Same basic benefi t rate; however, there is a reduction of $133.33 from the fi nal compensation before benefi ts are determined.
Local Miscellaneous Members 2 Percent at 55 Formula
Service not coordinated with Social Security — A guarantee of 2 percent of fi nal compensation at age 55 for each year of service credit. Retirement may begin at age 50 with a reduced benefi t rate, or after age 55 with an increased benefi t rate to age 63.
Service coordinated with Social Security — Same basic benefi t rate; however, there is a reduction of $133.33 from the fi nal compensation before benefi ts are determined.
Local Miscellaneous Members 2.5 Percent at 55 Formula
Service not coordinated with Social Security — A guarantee of 2.5 percent of fi nal compensation at age 55 for each year of service credit. Retirement may begin at age 50 with a reduced benefi t rate.
Service coordinated with Social Security — Same basic benefi t rate; however, there is a reduction of $133.33 from the fi nal compensation before benefi ts are determined.
Local Miscellaneous Members 2.7 Percent at 55 Formula
Service not coordinated with Social Security — A guarantee of 2.7 percent of fi nal compensation at age 55 for each year of service credit. Retirement may begin at age 50 with a reduced benefi t rate.
Service coordinated with Social Security — Same basic benefi t rate; however, there is a reduction of $133.33 from the fi nal compensation before benefi ts are determined.
Local Miscellaneous Members 3 Percent at 60 Formula
Service not coordinated with Social Security — A guarantee of 3 percent of fi nal compensation at age 60 for each year of service credit. Retirement may begin at age 50 with a reduced benefi t rate.
Service coordinated with Social Security — Same basic benefi t rate; however, there is a reduction of $133.33 from the fi nal compensation before benefi ts are determined.
Local Safety Members 2 Percent at 50 Formula
2 percent of fi nal compensation for each year of service for retirement at age 50, with an increased benefi t rate to age 55. The maximum allowance payable is 90 percent of fi nal compensation.
State Safety Members & Local Safety Members
2 Percent at 55 Formula
2 percent of fi nal compensation for each year of service for retirement at age 55. The maximum allowance payable is 90 percent of fi nal compensation. Retirement may begin at age 50 with a reduced benefi t rate.
Local Safety Members Half Pay at 55 Formula
This benefi t is no longer available as a contract amendment. Only a small number of local agencies are still covered under this formula which guarantees one-half of fi nal compensation at age 55 with 20 or more years of service credit. Retirement may begin at age 50 with a reduced benefi t rate.
State Safety Members & Local Safety Members
2.5 Percent at 55 Formula
This benefi t is no longer available as a contract amendment. It provides 2.5 percent of fi nal compensation for each year of service for retirement at age 55. The maximum allowance payable is 80 percent of fi nal compensation for State safety members and 90 percent for local safety members. Retirement may begin at age 50 with a reduced benefi t rate.
144 CalPERS Comprehensive Annual Financial Report, Year Ended June 30, 2008
Program Data (continued)
State Patrol Members, Local Safety Members & State
Peace Offi cer/Firefi ghter Members 3 Percent at 50 Formula
3 percent of fi nal compensation for each year of service for retirement at age 50. The maximum allowance payable is 90 percent of fi nal compensation for State patrol members, local safety members, and State peace offi cer/fi refi ghters.
State Peace Offi cer/Firefi ghter Members &
Local Safety Members 3 Percent at 55 Formula
3 percent of fi nal compensation for each year of service for retirement at age 55. The maximum allowance payable is 90 percent for State peace offi cer/fi refi ghter members and local safety members. Retirement may begin at age 50 with a reduced benefi t rate.
Disability Retirement
For Most Members
A monthly allowance of 1.8 percent of fi nal compensation for each year of service, improved under certain conditions to 331/3 percent of fi nal compensation, applicable to members with at least fi ve years of service credit.
By Contract Amendment Only for Local Agencies
A monthly allowance of 30 percent of fi nal compensation, plus an additional 1 percent for each year of service over fi ve years to a maximum of 50 percent.
For State Second Tier Members
A monthly allowance of 1.125 percent of fi nal compensation for each year of service, improved under certain conditions to 331/3 percent of fi nal compensation, applicable to members with at least 10 years of service credit or fi ve years if credited as of January 1, 1985.
For Local Public Agency Members
A monthly allowance of 1.35 percent of fi nal compensation for each year of service, improved under certain conditions to 331⁄3 percent of fi nal compensation, applicable to members with at least fi ve years of service credit.
Industrial Disability Retirement
For Most Members
A monthly allowance of 50 percent of fi nal compensation, applicable to patrol members, State and local safety members, State peace offi cer/fi refi ghter members, State industrial members, local miscellaneous members (by contract amendment only), and certain State miscellaneous members defi ned by law. The member must be serving in one of these categories at the time the industrial disability occurs. California Highway Patrol members may be entitled to an enhanced benefi t if specifi c qualifying factors are met.
By Contract Amendment Only for Local Agencies
A monthly allowance of 75 percent of fi nal compen sation, if found totally disabled.
By Contract Amendment Only for Local Agencies
A monthly allowance of 50 percent to 90 percent of fi nal compensation, depending on the disability rating by the Workers’ Compensation Appeals Board.
Death Benefi ts (Before Retirement)
Basic Death Benefi t — All Members Except State Employees
Eligible to retire or not — A return of member contributions plus interest (compounded annually) and an employer-paid portion equal to one month’s compensation earnable for each year of current service to a maximum of six months.
Basic Death Benefi t — State Employees Only
Eligible to retire or not eligible to retire with 20 years or more of State service credit — A return of member contributions plus interest (compounded annually) and a State-paid portion equal to six months’ pay (50 percent of the member’s earnable pay for the 12 months prior to the member’s death).
Not eligible to retire with less than 20 years of State service credit — A return of only the member contributions plus interest (compounded annually).
CalPERS Comprehensive Annual Financial Report, Year Ended June 30, 2008 145
Program Data (continued)
Insurance Benefi t — State Employees Only
Eligible to retire or not eligible to retire with 20 years or more of State service credit — $5,000 in a lump sum.
Not eligible to retire with less than 20 years of State service credit — $5,000 in a lump sum plus six months’ pay (50 percent of annual compensation).
Alternate Death Benefi t 1 — For State Members in Bargaining
Units Contracting for this Benefi t, Who are Not Eligible to
Retire, With 20 Years or More of State Service Credit
A monthly allowance payable to a surviving spouse or registered domestic partner until death, then to children under age 18. It is calculated similarly to pre-retirement Option 2W (if the benefi ciary is a spouse or registered domestic partner), or like a 1957 Survivor Benefi t (if the benefi ciary is a minor child), as though the member had been old enough to retire. A spouse or registered domestic partner or minor child may receive continued health and dental insurance with the Alternate Death Benefi t.
Alternate Death Benefi t for Firefi ghters — Local Agency
Employers Contracting for this Benefi t, With 20 Years
or More of Total Service Credit
A monthly non-job-related allowance payable to a surviving spouse or registered domestic partner until death, then to children under age 18. It is calculated similarly to Pre-Retirement Option 2W (if the benefi ciary is a spouse or registered domestic partner, even if the agency does not contract separately for the Pre-Retirement Option 2W benefi t), or like a 1957 Survivor Benefi t (if the benefi ciary is a minor child), as though the member had either been old enough to retire (if the member died before reaching retirement age), or based on the member’s actual age if the member was eligible to retire at the time of death. This benefi t applies to all service credit earned by the member, including service that may have been earned with a local agency that does not contract for the Alternate Death Benefi t, as long as the member was employed at the time of death by a local agency that provides this benefi t in their contract.
Pre-Retirement Option 2W Benefi t — Local Agencies
by Contract, Married, or Registered Domestic Partnership
A monthly allowance payable to the surviving spouse or registered domestic partner until death, then to children under age 18, equal to what the deceased member would have received had they retired on the date of their death and elected Option 2W.
Pre-Retirement Option 2W Benefi t 1 — For All State
Members, Married, or Registered Domestic Partnership
A monthly allowance payable to the surviving spouse or registered domestic partner until death, then to children under age 18, equal to what the deceased member would have received had they retired on the date of their death and elected Option 2W.
1957 Survivor Benefi t 1 — Local Members, Married, or
Registered Domestic Partnership
For all members eligible to retire who are married or in a registered domestic partnership, a monthly allowance payable to the surviving spouse or registered domestic partner until death, then to children under age 18, equal to one-half of the highest allowance (unmodifi ed) the member would have received had they retired on the date of death.
1957 Survivor Benefi t 1 — All Members, Not Married, or No
Registered Domestic Partnership
For all members eligible to retire who are not married or in a registered domestic partnership, a monthly allowance payable to the unmarried surviving minor children until age 18, equal to one-half of the highest allowance (unmodifi ed) the member would have received had they retired on the date of death. Once allowance stops, the total allowance paid is compared to the Basic Death Benefi t amount, and any difference is paid in a lump sum to all of the member’s surviving children.
Note:1 The surviving spouse or registered domestic partner of other than a State member, or a guardian of a minor child, may elect the Basic Death Benefi t
or the 1957 Survivor Benefi t. The surviving spouse or registered domestic partner of a State member may elect the Basic Death Benefi t or the Pre-Retirement Option 2W Death Benefi t.
146 CalPERS Comprehensive Annual Financial Report, Year Ended June 30, 2008
Program Data (continued)
1959 Survivor Benefi t — State & School Members & by
Contract Option, Local Agency Members Not Coordinated
With Social Security
A monthly benefi t paid to survivors of deceased members who died prior to retirement. This benefi t is similar to the Social Security Survivor Benefi t and is paid in addition to any other applicable pre-retirement death benefi t, except the Special Death Benefi t.
Special Death Benefi t 1 — Survivors of Patrol, State & Local
Safety, State Industrial & State Peace Offi cer/Firefi ghter
Members, State Miscellaneous 2 & Local Miscellaneous by
Contract Amendment 2
A monthly allowance equal to 50 percent of fi nal compensation payable to the surviving spouse or registered domestic partner until death, or if no spouse, to natural or adopted unmarried children up to age 22. The monthly allowance is recalculated annually on October 1 based on the salary rates for employees who work in the position the member held at the time of death until such time as the member would have attained age 50.
Special Death Benefi t 1 — Violent Death
Provides increased benefi ts (up to 75 percent of fi nal compensation) based upon the number of surviving children, if the member’s death is the result of external violence or physical force.
Death Benefi ts (After Retirement)
Retired Death Benefi t — State Members Only
A $2,000 lump sum payable in addition to any optional settlement elected.
Retired Death Benefi t — Local & School Members
A $500, $600, $2,000, $3,000, $4,000, or $5,000 lump sum (depending on the employer contract) payable in addition to any optional settlement elected.
Survivor Continuance Benefi t — State Members, School
Members & by Contract Option, Local Agency Members
Service not coordinated with Social Security — 50 percent of the deceased member’s unmodifi ed retirement allowance amount will continue to an eligible survivor.
Service coordinated with Social Security — 25 percent of the deceased member’s unmodifi ed retirement allowance amount will continue to an eligible survivor.
Optional Settlements
For All Members
All the disability and service retirement allowances discussed in this section are the highest (unmodifi ed) allowances payable to a retired member. There are six optional settlements to allow a member to reduce their allowance to provide a benefi t to a named benefi ciary at the member’s death. Under two of these options, if the benefi ciary predeceases the member, the member’s allowance will be increased to the higher (unmodifi ed) amount.
Cost-of-Living Adjustments (COLA)
For All Members — Except State Second Tier
A maximum of 2 percent compounded annually (up to 5 percent maximum as a contract option for retired members of local agencies).
For State Second Tier Members Only
A fi xed 3 percent compounded annually.
Notes:1 The Special Death Benefi t is payable if the member’s death is job related.2 The survivor of a State or local miscellaneous member qualifi es for the Special Death Benefi t if the member was killed or fatally injured while
performing their offi cial duties.
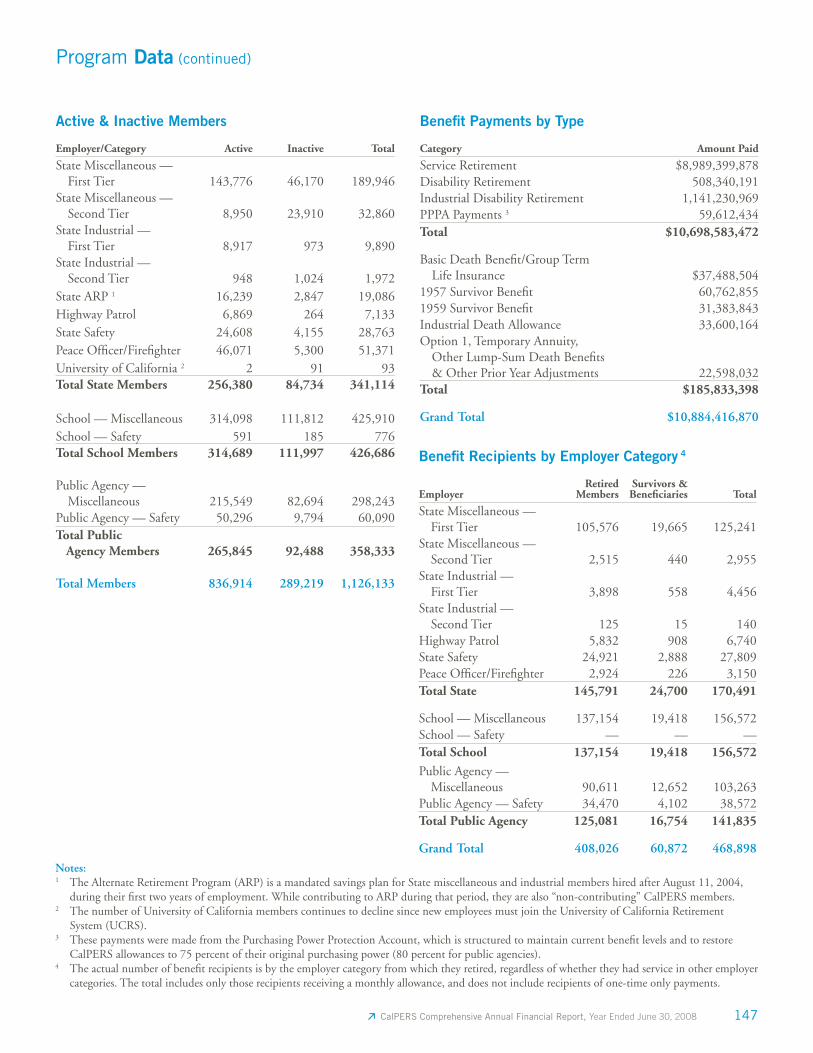
CalPERS Comprehensive Annual Financial Report, Year Ended June 30, 2008 147
Program Data (continued)
Notes:1 The Alternate Retirement Program (ARP) is a mandated savings plan for State miscellaneous and industrial members hired after August 11, 2004,
during their fi rst two years of employment. While contributing to ARP during that period, they are also “non-contributing” CalPERS members. 2 The number of University of California members continues to decline since new employees must join the University of California Retirement
System (UCRS).3 These payments were made from the Purchasing Power Protection Account, which is structured to maintain current benefi t levels and to restore
CalPERS allowances to 75 percent of their original purchasing power (80 percent for public agencies).4 The actual number of benefi t recipients is by the employer category from which they retired, regardless of whether they had service in other employer
categories. The total includes only those recipients receiving a monthly allowance, and does not include recipients of one-time only payments.
Active & Inactive Members
Employer/Category Active Inactive Total
State Miscellaneous — First Tier 143,776 46,170 189,946State Miscellaneous — Second Tier 8,950 23,910 32,860State Industrial — First Tier 8,917 973 9,890State Industrial — Second Tier 948 1,024 1,972State ARP 1 16,239 2,847 19,086Highway Patrol 6,869 264 7,133State Safety 24,608 4,155 28,763Peace Offi cer/Firefi ghter 46,071 5,300 51,371University of California 2 2 91 93Total State Members 256,380 84,734 341,114
School — Miscellaneous 314,098 111,812 425,910School — Safety 591 185 776Total School Members 314,689 111,997 426,686
Public Agency — Miscellaneous 215,549 82,694 298,243Public Agency — Safety 50,296 9,794 60,090Total Public Agency Members 265,845 92,488 358,333
Total Members 836,914 289,219 1,126,133
Benefi t Recipients by Employer Category 4
EmployerRetired
MembersSurvivors & Benefi ciaries Total
State Miscellaneous — First Tier 105,576 19,665 125,241State Miscellaneous — Second Tier 2,515 440 2,955State Industrial — First Tier 3,898 558 4,456State Industrial — Second Tier 125 15 140Highway Patrol 5,832 908 6,740State Safety 24,921 2,888 27,809Peace Offi cer/Firefi ghter 2,924 226 3,150Total State 145,791 24,700 170,491
School — Miscellaneous 137,154 19,418 156,572School — Safety — — —Total School 137,154 19,418 156,572
Public Agency — Miscellaneous 90,611 12,652 103,263Public Agency — Safety 34,470 4,102 38,572Total Public Agency 125,081 16,754 141,835
Grand Total 408,026 60,872 468,898
Benefi t Payments by Type
Category Amount Paid
Service Retirement $8,989,399,878Disability Retirement 508,340,191Industrial Disability Retirement 1,141,230,969PPPA Payments 3 59,612,434Total $10,698,583,472
Basic Death Benefi t/Group Term Life Insurance $37,488,5041957 Survivor Benefi t 60,762,8551959 Survivor Benefi t 31,383,843Industrial Death Allowance 33,600,164Option 1, Temporary Annuity, Other Lump-Sum Death Benefi ts & Other Prior Year Adjustments 22,598,032Total $185,833,398
Grand Total $10,884,416,870
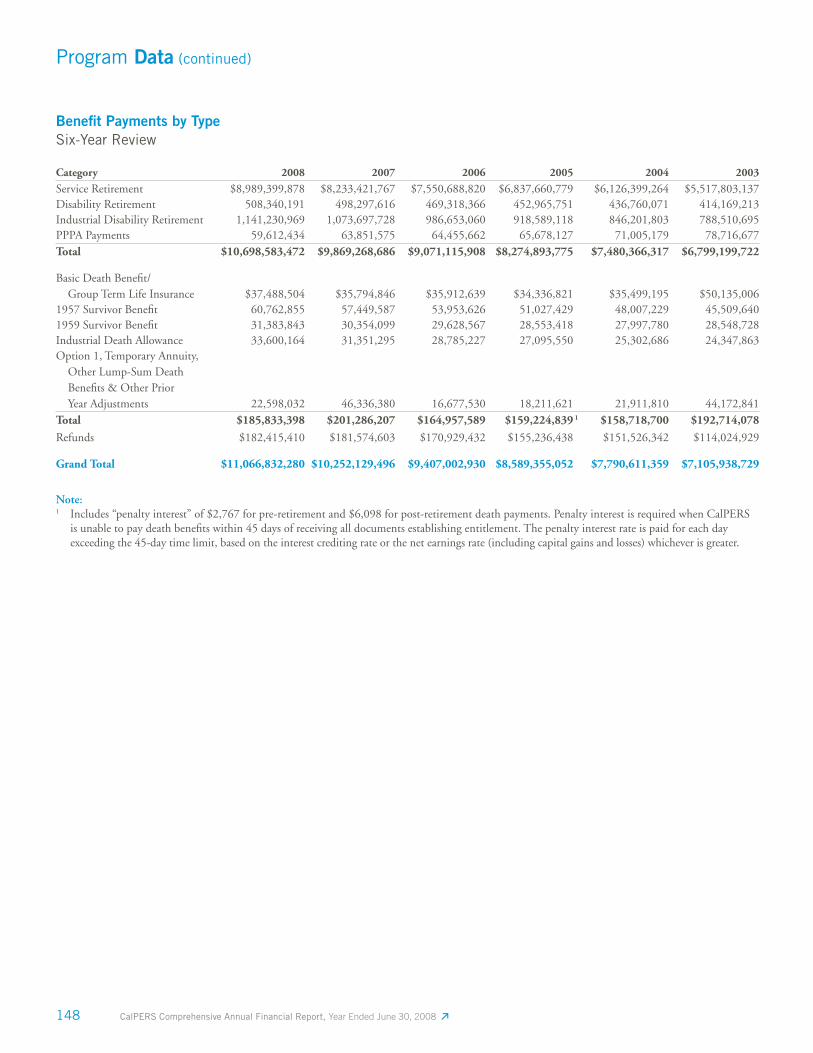
148 CalPERS Comprehensive Annual Financial Report, Year Ended June 30, 2008
Program Data (continued)
Benefi t Payments by TypeSix-Year Review
Category 2008 2007 2006 2005 2004 2003
Service Retirement $8,989,399,878 $8,233,421,767 $7,550,688,820 $6,837,660,779 $6,126,399,264 $5,517,803,137Disability Retirement 508,340,191 498,297,616 469,318,366 452,965,751 436,760,071 414,169,213Industrial Disability Retirement 1,141,230,969 1,073,697,728 986,653,060 918,589,118 846,201,803 788,510,695PPPA Payments 59,612,434 63,851,575 64,455,662 65,678,127 71,005,179 78,716,677Total $10,698,583,472 $9,869,268,686 $9,071,115,908 $8,274,893,775 $7,480,366,317 $6,799,199,722
Basic Death Benefi t/ Group Term Life Insurance $37,488,504 $35,794,846 $35,912,639 $34,336,821 $35,499,195 $50,135,0061957 Survivor Benefi t 60,762,855 57,449,587 53,953,626 51,027,429 48,007,229 45,509,6401959 Survivor Benefi t 31,383,843 30,354,099 29,628,567 28,553,418 27,997,780 28,548,728Industrial Death Allowance 33,600,164 31,351,295 28,785,227 27,095,550 25,302,686 24,347,863Option 1, Temporary Annuity, Other Lump-Sum Death Benefi ts & Other Prior Year Adjustments 22,598,032 46,336,380 16,677,530 18,211,621 21,911,810 44,172,841Total $185,833,398 $201,286,207 $164,957,589 $159,224,839 1 $158,718,700 $192,714,078
Refunds $182,415,410 $181,574,603 $170,929,432 $155,236,438 $151,526,342 $114,024,929
Grand Total $11,066,832,280 $10,252,129,496 $9,407,002,930 $8,589,355,052 $7,790,611,359 $7,105,938,729
Note:1 Includes “penalty interest” of $2,767 for pre-retirement and $6,098 for post-retirement death payments. Penalty interest is required when CalPERS
is unable to pay death benefi ts within 45 days of receiving all documents establishing entitlement. The penalty interest rate is paid for each day exceeding the 45-day time limit, based on the interest crediting rate or the net earnings rate (including capital gains and losses) whichever is greater.
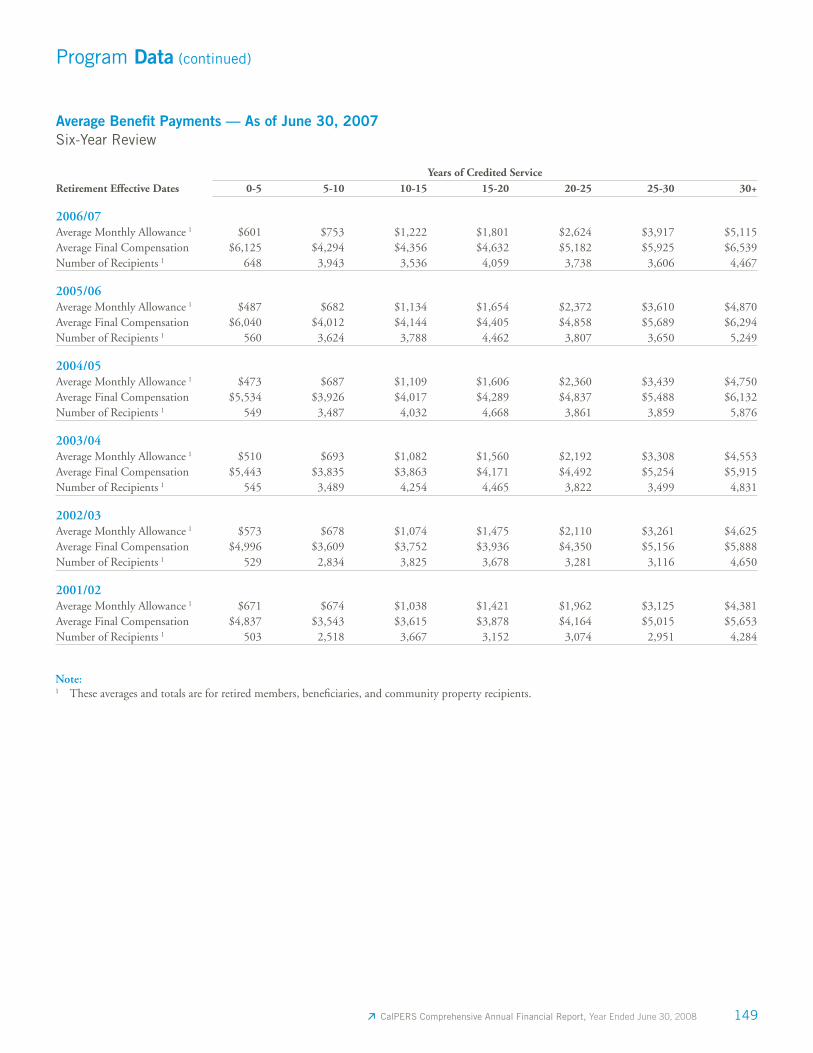
CalPERS Comprehensive Annual Financial Report, Year Ended June 30, 2008 149
Note:1 These averages and totals are for retired members, benefi ciaries, and community property recipients.
Average Benefi t Payments — As of June 30, 2007Six-Year Review
Years of Credited ServiceRetirement Effective Dates 0-5 5-10 10-15 15-20 20-25 25-30 30+
2006/07Average Monthly Allowance 1 $601 $753 $1,222 $1,801 $2,624 $3,917 $5,115Average Final Compensation $6,125 $4,294 $4,356 $4,632 $5,182 $5,925 $6,539Number of Recipients 1 648 3,943 3,536 4,059 3,738 3,606 4,467
2005/06Average Monthly Allowance 1 $487 $682 $1,134 $1,654 $2,372 $3,610 $4,870Average Final Compensation $6,040 $4,012 $4,144 $4,405 $4,858 $5,689 $6,294Number of Recipients 1 560 3,624 3,788 4,462 3,807 3,650 5,249
2004/05Average Monthly Allowance 1 $473 $687 $1,109 $1,606 $2,360 $3,439 $4,750Average Final Compensation $5,534 $3,926 $4,017 $4,289 $4,837 $5,488 $6,132Number of Recipients 1 549 3,487 4,032 4,668 3,861 3,859 5,876
2003/04Average Monthly Allowance 1 $510 $693 $1,082 $1,560 $2,192 $3,308 $4,553Average Final Compensation $5,443 $3,835 $3,863 $4,171 $4,492 $5,254 $5,915Number of Recipients 1 545 3,489 4,254 4,465 3,822 3,499 4,831
2002/03Average Monthly Allowance 1 $573 $678 $1,074 $1,475 $2,110 $3,261 $4,625Average Final Compensation $4,996 $3,609 $3,752 $3,936 $4,350 $5,156 $5,888Number of Recipients 1 529 2,834 3,825 3,678 3,281 3,116 4,650
2001/02Average Monthly Allowance 1 $671 $674 $1,038 $1,421 $1,962 $3,125 $4,381Average Final Compensation $4,837 $3,543 $3,615 $3,878 $4,164 $5,015 $5,653Number of Recipients 1 503 2,518 3,667 3,152 3,074 2,951 4,284
Program Data (continued)
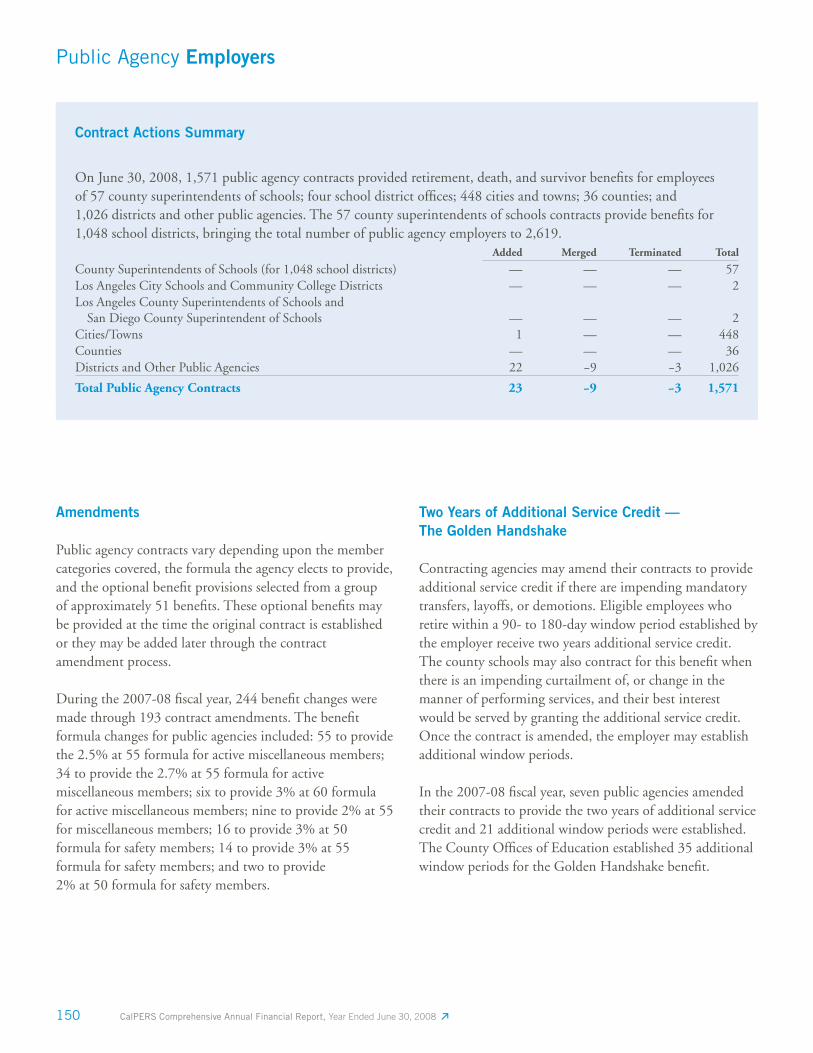
150 CalPERS Comprehensive Annual Financial Report, Year Ended June 30, 2008
Public Agency Employers
Contract Actions Summary
On June 30, 2008, 1,571 public agency contracts provided retirement, death, and survivor benefi ts for employees of 57 county superintendents of schools; four school district offi ces; 448 cities and towns; 36 counties; and 1,026 districts and other public agencies. The 57 county superintendents of schools contracts provide benefi ts for 1,048 school districts, bringing the total number of public agency employers to 2,619.
Added Merged Terminated Total
County Superintendents of Schools (for 1,048 school districts) — — — 57Los Angeles City Schools and Community College Districts — — — 2Los Angeles County Superintendents of Schools and San Diego County Superintendent of Schools — — — 2Cities/Towns 1 — — 448Counties — — — 36Districts and Other Public Agencies 22 -9 -3 1,026
Total Public Agency Contracts 23 -9 -3 1,571
Amendments
Public agency contracts vary depending upon the member categories covered, the formula the agency elects to provide, and the optional benefi t provisions selected from a group of approximately 51 benefi ts. These optional benefi ts may be provided at the time the original contract is established or they may be added later through the contract amendment process.
During the 2007-08 fi scal year, 244 benefi t changes were made through 193 contract amendments. The benefi t formula changes for public agencies included: 55 to provide the 2.5% at 55 formula for active miscellaneous members; 34 to provide the 2.7% at 55 formula for active miscellaneous members; six to provide 3% at 60 formula for active miscellaneous members; nine to provide 2% at 55 for miscellaneous members; 16 to provide 3% at 50 formula for safety members; 14 to provide 3% at 55 formula for safety members; and two to provide 2% at 50 formula for safety members.
Two Years of Additional Service Credit — The Golden Handshake
Contracting agencies may amend their contracts to provide additional service credit if there are impending mandatory transfers, layoffs, or demotions. Eligible employees who retire within a 90- to 180-day window period established by the employer receive two years additional service credit. The county schools may also contract for this benefi t when there is an impending curtailment of, or change in the manner of performing services, and their best interest would be served by granting the additional service credit. Once the contract is amended, the employer may establish additional window periods.
In the 2007-08 fi scal year, seven public agencies amended their contracts to provide the two years of additional service credit and 21 additional window periods were established. The County Offi ces of Education established 35 additional window periods for the Golden Handshake benefi t.
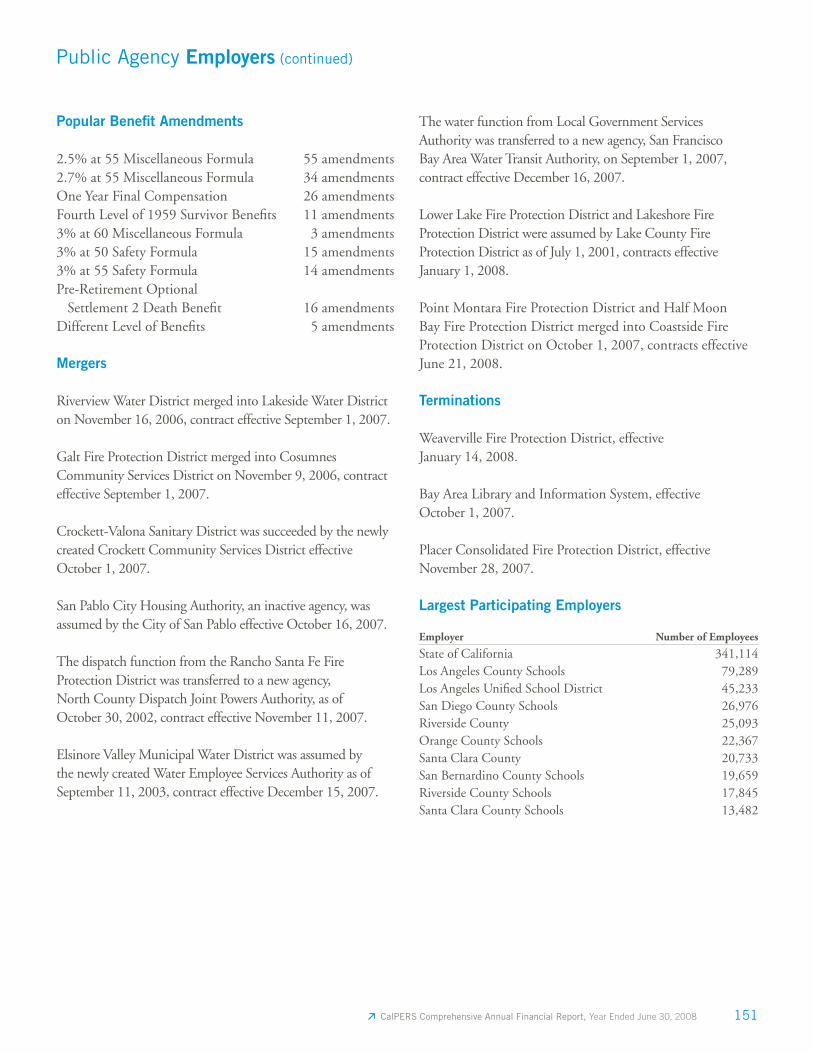
CalPERS Comprehensive Annual Financial Report, Year Ended June 30, 2008 151
Public Agency Employers (continued)
Popular Benefi t Amendments
2.5% at 55 Miscellaneous Formula 55 amendments2.7% at 55 Miscellaneous Formula 34 amendmentsOne Year Final Compensation 26 amendmentsFourth Level of 1959 Survivor Benefi ts 11 amendments3% at 60 Miscellaneous Formula 3 amendments3% at 50 Safety Formula 15 amendments3% at 55 Safety Formula 14 amendmentsPre-Retirement Optional Settlement 2 Death Benefi t 16 amendmentsDifferent Level of Benefi ts 5 amendments
Mergers
Riverview Water District merged into Lakeside Water District on November 16, 2006, contract effective September 1, 2007.
Galt Fire Protection District merged into Cosumnes Community Services District on November 9, 2006, contract effective September 1, 2007.
Crockett-Valona Sanitary District was succeeded by the newly created Crockett Community Services District effective October 1, 2007.
San Pablo City Housing Authority, an inactive agency, was assumed by the City of San Pablo effective October 16, 2007.
The dispatch function from the Rancho Santa Fe Fire Protection District was transferred to a new agency, North County Dispatch Joint Powers Authority, as of October 30, 2002, contract effective November 11, 2007.
Elsinore Valley Municipal Water District was assumed by the newly created Water Employee Services Authority as of September 11, 2003, contract effective December 15, 2007.
The water function from Local Government Services Authority was transferred to a new agency, San Francisco Bay Area Water Transit Authority, on September 1, 2007, contract effective December 16, 2007.
Lower Lake Fire Protection District and Lakeshore Fire Protection District were assumed by Lake County Fire Protection District as of July 1, 2001, contracts effective January 1, 2008.
Point Montara Fire Protection District and Half Moon Bay Fire Protection District merged into Coastside Fire Protection District on October 1, 2007, contracts effective June 21, 2008.
Terminations
Weaverville Fire Protection District, effective January 14, 2008.
Bay Area Library and Information System, effectiveOctober 1, 2007.
Placer Consolidated Fire Protection District, effective November 28, 2007.
Largest Participating Employers
Employer Number of Employees
State of California 341,114Los Angeles County Schools 79,289Los Angeles Unifi ed School District 45,233San Diego County Schools 26,976Riverside County 25,093Orange County Schools 22,367Santa Clara County 20,733San Bernardino County Schools 19,659Riverside County Schools 17,845Santa Clara County Schools 13,482
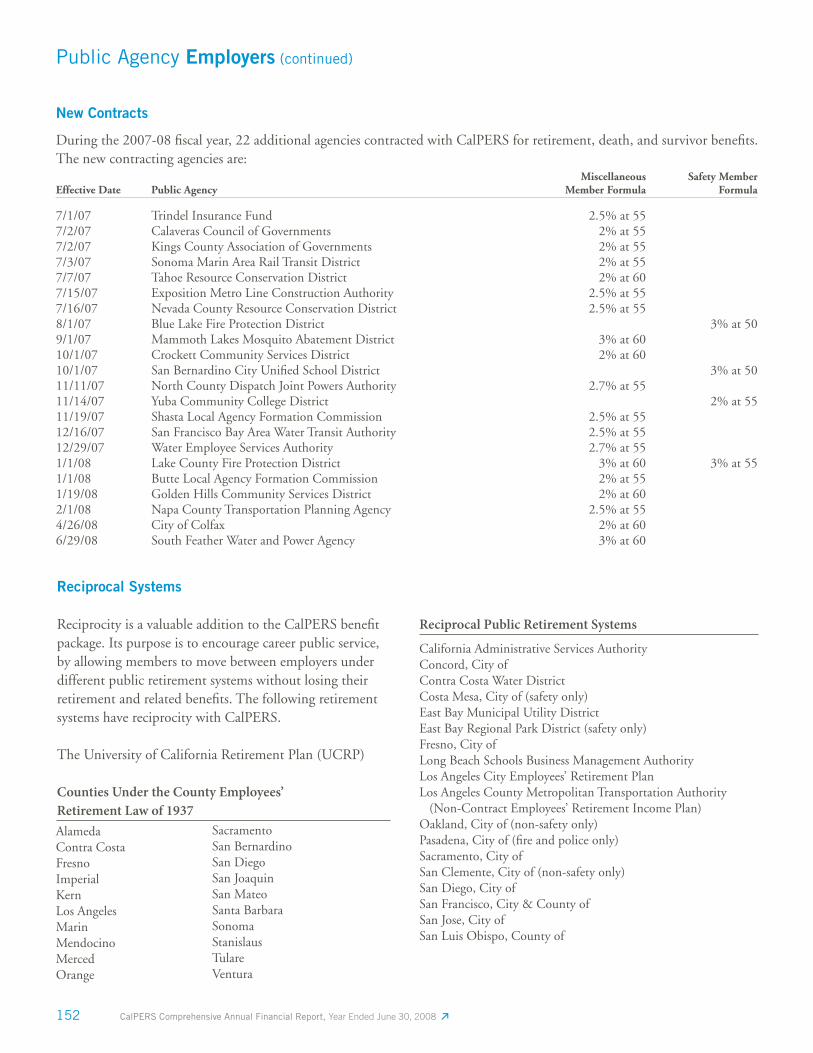
152 CalPERS Comprehensive Annual Financial Report, Year Ended June 30, 2008
Public Agency Employers (continued)
Reciprocal Systems
Reciprocity is a valuable addition to the CalPERS benefi t package. Its purpose is to encourage career public service, by allowing members to move between employers under different public retirement systems without losing their retirement and related benefi ts. The following retirement systems have reciprocity with CalPERS.
The University of California Retirement Plan (UCRP)
Counties Under the County Employees’
Retirement Law of 1937
AlamedaContra CostaFresnoImperialKern Los AngelesMarinMendocinoMercedOrange
SacramentoSan BernardinoSan DiegoSan JoaquinSan MateoSanta BarbaraSonoma Stanislaus Tulare Ventura
Reciprocal Public Retirement Systems
California Administrative Services AuthorityConcord, City ofContra Costa Water DistrictCosta Mesa, City of (safety only)East Bay Municipal Utility DistrictEast Bay Regional Park District (safety only)Fresno, City ofLong Beach Schools Business Management AuthorityLos Angeles City Employees’ Retirement PlanLos Angeles County Metropolitan Transportation Authority (Non-Contract Employees’ Retirement Income Plan)Oakland, City of (non-safety only)Pasadena, City of (fi re and police only)Sacramento, City ofSan Clemente, City of (non-safety only)San Diego, City ofSan Francisco, City & County ofSan Jose, City of San Luis Obispo, County of
New Contracts
During the 2007-08 fi scal year, 22 additional agencies contracted with CalPERS for retirement, death, and survivor benefi ts. The new contracting agencies are:
Effective Date Public AgencyMiscellaneous
Member FormulaSafety Member
Formula
7/1/07 Trindel Insurance Fund 2.5% at 557/2/07 Calaveras Council of Governments 2% at 557/2/07 Kings County Association of Governments 2% at 557/3/07 Sonoma Marin Area Rail Transit District 2% at 557/7/07 Tahoe Resource Conservation District 2% at 607/15/07 Exposition Metro Line Construction Authority 2.5% at 557/16/07 Nevada County Resource Conservation District 2.5% at 558/1/07 Blue Lake Fire Protection District 3% at 509/1/07 Mammoth Lakes Mosquito Abatement District 3% at 6010/1/07 Crockett Community Services District 2% at 6010/1/07 San Bernardino City Unifi ed School District 3% at 5011/11/07 North County Dispatch Joint Powers Authority 2.7% at 5511/14/07 Yuba Community College District 2% at 5511/19/07 Shasta Local Agency Formation Commission 2.5% at 5512/16/07 San Francisco Bay Area Water Transit Authority 2.5% at 5512/29/07 Water Employee Services Authority 2.7% at 551/1/08 Lake County Fire Protection District 3% at 60 3% at 551/1/08 Butte Local Agency Formation Commission 2% at 551/19/08 Golden Hills Community Services District 2% at 602/1/08 Napa County Transportation Planning Agency 2.5% at 554/26/08 City of Colfax 2% at 606/29/08 South Feather Water and Power Agency 3% at 60
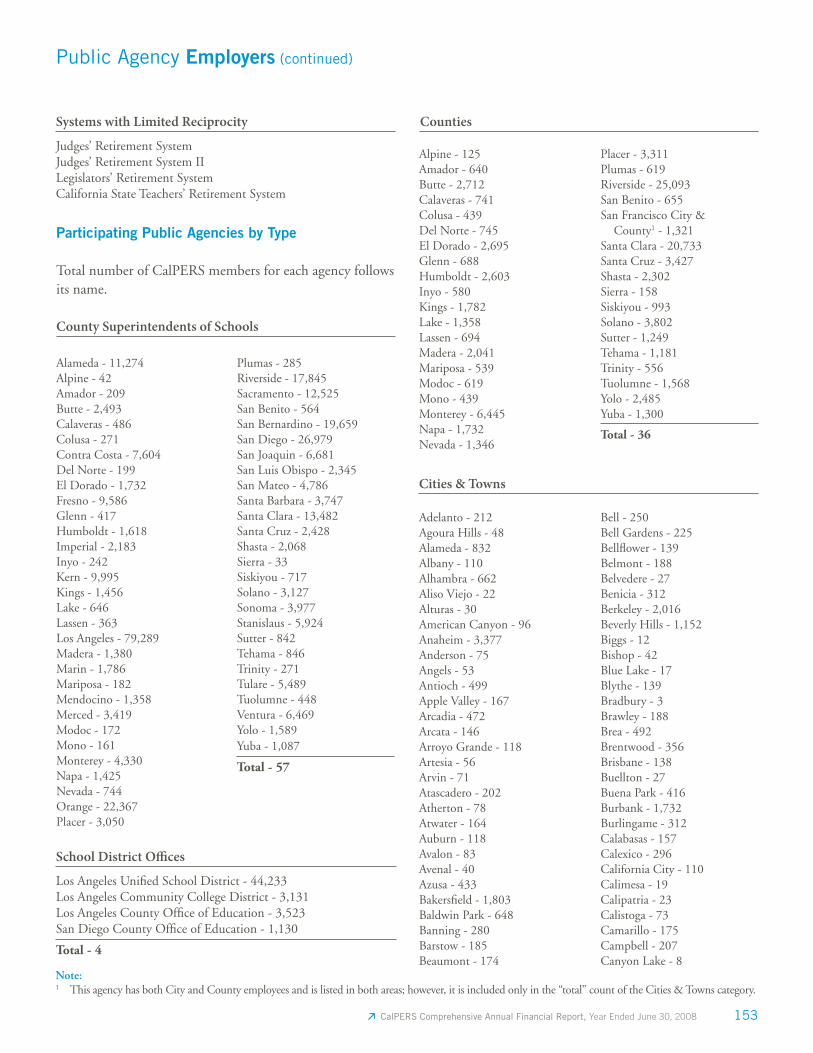
CalPERS Comprehensive Annual Financial Report, Year Ended June 30, 2008 153
Public Agency Employers (continued)
Participating Public Agencies by Type
Total number of CalPERS members for each agency follows its name.
County Superintendents of Schools
Alameda - 11,274Alpine - 42Amador - 209Butte - 2,493Calaveras - 486Colusa - 271Contra Costa - 7,604Del Norte - 199El Dorado - 1,732Fresno - 9,586Glenn - 417Humboldt - 1,618Imperial - 2,183Inyo - 242Kern - 9,995Kings - 1,456Lake - 646Lassen - 363Los Angeles - 79,289Madera - 1,380Marin - 1,786Mariposa - 182Mendocino - 1,358Merced - 3,419Modoc - 172Mono - 161Monterey - 4,330Napa - 1,425Nevada - 744Orange - 22,367Placer - 3,050
Plumas - 285Riverside - 17,845Sacramento - 12,525San Benito - 564San Bernardino - 19,659San Diego - 26,979San Joaquin - 6,681San Luis Obispo - 2,345San Mateo - 4,786Santa Barbara - 3,747Santa Clara - 13,482Santa Cruz - 2,428Shasta - 2,068Sierra - 33Siskiyou - 717Solano - 3,127Sonoma - 3,977Stanislaus - 5,924Sutter - 842Tehama - 846Trinity - 271Tulare - 5,489Tuolumne - 448Ventura - 6,469Yolo - 1,589Yuba - 1,087
Total - 57
School District Offi ces
Los Angeles Unifi ed School District - 44,233Los Angeles Community College District - 3,131Los Angeles County Offi ce of Education - 3,523San Diego County Offi ce of Education - 1,130
Total - 4
Systems with Limited Reciprocity
Judges’ Retirement SystemJudges’ Retirement System IILegislators’ Retirement SystemCalifornia State Teachers’ Retirement System
Counties
Alpine - 125Amador - 640Butte - 2,712Calaveras - 741Colusa - 439Del Norte - 745El Dorado - 2,695Glenn - 688Humboldt - 2,603Inyo - 580Kings - 1,782Lake - 1,358Lassen - 694Madera - 2,041Mariposa - 539Modoc - 619Mono - 439Monterey - 6,445Napa - 1,732Nevada - 1,346
Placer - 3,311Plumas - 619Riverside - 25,093San Benito - 655San Francisco City & County1 - 1,321Santa Clara - 20,733Santa Cruz - 3,427Shasta - 2,302Sierra - 158Siskiyou - 993Solano - 3,802Sutter - 1,249Tehama - 1,181Trinity - 556Tuolumne - 1,568Yolo - 2,485Yuba - 1,300
Total - 36
Cities & Towns
Adelanto - 212Agoura Hills - 48Alameda - 832Albany - 110Alhambra - 662Aliso Viejo - 22Alturas - 30American Canyon - 96Anaheim - 3,377Anderson - 75Angels - 53Antioch - 499Apple Valley - 167Arcadia - 472Arcata - 146Arroyo Grande - 118Artesia - 56Arvin - 71Atascadero - 202Atherton - 78Atwater - 164Auburn - 118Avalon - 83Avenal - 40Azusa - 433Bakersfi eld - 1,803Baldwin Park - 648Banning - 280Barstow - 185Beaumont - 174
Bell - 250Bell Gardens - 225Bellfl ower - 139Belmont - 188Belvedere - 27Benicia - 312Berkeley - 2,016Beverly Hills - 1,152Biggs - 12Bishop - 42Blue Lake - 17Blythe - 139Bradbury - 3Brawley - 188Brea - 492Brentwood - 356Brisbane - 138Buellton - 27Buena Park - 416Burbank - 1,732Burlingame - 312Calabasas - 157Calexico - 296California City - 110Calimesa - 19Calipatria - 23Calistoga - 73Camarillo - 175Campbell - 207Canyon Lake - 8
Note:1 This agency has both City and County employees and is listed in both areas; however, it is included only in the “total” count of the Cities & Towns category.
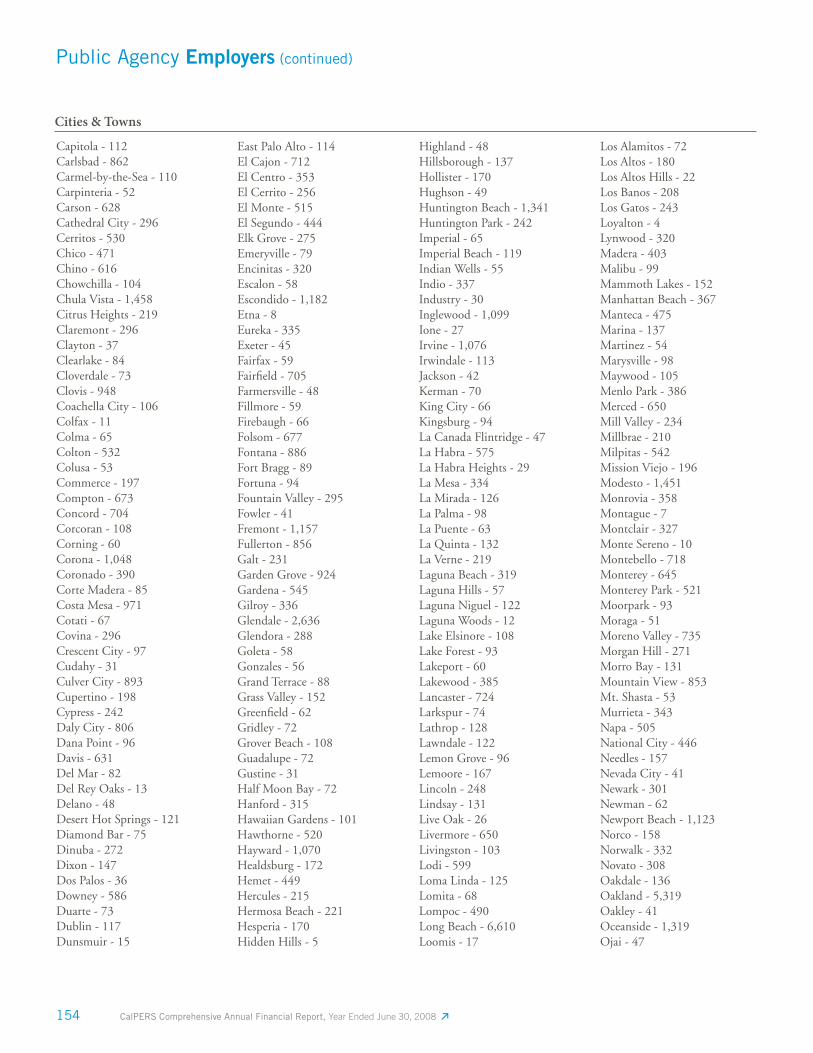
154 CalPERS Comprehensive Annual Financial Report, Year Ended June 30, 2008
Public Agency Employers (continued)
Cities & Towns
Capitola - 112Carlsbad - 862Carmel-by-the-Sea - 110Carpinteria - 52Carson - 628Cathedral City - 296Cerritos - 530Chico - 471Chino - 616Chowchilla - 104Chula Vista - 1,458Citrus Heights - 219Claremont - 296Clayton - 37Clearlake - 84Cloverdale - 73Clovis - 948Coachella City - 106Colfax - 11Colma - 65Colton - 532Colusa - 53Commerce - 197Compton - 673Concord - 704Corcoran - 108Corning - 60Corona - 1,048Coronado - 390Corte Madera - 85Costa Mesa - 971Cotati - 67Covina - 296Crescent City - 97Cudahy - 31Culver City - 893Cupertino - 198Cypress - 242Daly City - 806Dana Point - 96Davis - 631Del Mar - 82Del Rey Oaks - 13Delano - 48Desert Hot Springs - 121Diamond Bar - 75Dinuba - 272Dixon - 147Dos Palos - 36Downey - 586Duarte - 73Dublin - 117Dunsmuir - 15
East Palo Alto - 114El Cajon - 712El Centro - 353El Cerrito - 256El Monte - 515El Segundo - 444Elk Grove - 275Emeryville - 79Encinitas - 320Escalon - 58Escondido - 1,182Etna - 8Eureka - 335Exeter - 45Fairfax - 59Fairfi eld - 705Farmersville - 48Fillmore - 59Firebaugh - 66Folsom - 677Fontana - 886Fort Bragg - 89Fortuna - 94Fountain Valley - 295Fowler - 41Fremont - 1,157Fullerton - 856Galt - 231Garden Grove - 924Gardena - 545Gilroy - 336Glendale - 2,636Glendora - 288Goleta - 58Gonzales - 56Grand Terrace - 88Grass Valley - 152Greenfi eld - 62Gridley - 72Grover Beach - 108Guadalupe - 72Gustine - 31Half Moon Bay - 72Hanford - 315Hawaiian Gardens - 101Hawthorne - 520Hayward - 1,070Healdsburg - 172Hemet - 449Hercules - 215Hermosa Beach - 221Hesperia - 170Hidden Hills - 5
Highland - 48Hillsborough - 137Hollister - 170Hughson - 49Huntington Beach - 1,341Huntington Park - 242Imperial - 65Imperial Beach - 119Indian Wells - 55Indio - 337Industry - 30Inglewood - 1,099Ione - 27Irvine - 1,076Irwindale - 113Jackson - 42Kerman - 70King City - 66Kingsburg - 94La Canada Flintridge - 47La Habra - 575La Habra Heights - 29La Mesa - 334La Mirada - 126La Palma - 98La Puente - 63La Quinta - 132La Verne - 219Laguna Beach - 319Laguna Hills - 57Laguna Niguel - 122Laguna Woods - 12Lake Elsinore - 108Lake Forest - 93Lakeport - 60Lakewood - 385Lancaster - 724Larkspur - 74Lathrop - 128Lawndale - 122Lemon Grove - 96Lemoore - 167Lincoln - 248Lindsay - 131Live Oak - 26Livermore - 650Livingston - 103Lodi - 599Loma Linda - 125Lomita - 68Lompoc - 490Long Beach - 6,610Loomis - 17
Los Alamitos - 72Los Altos - 180Los Altos Hills - 22Los Banos - 208Los Gatos - 243Loyalton - 4Lynwood - 320Madera - 403Malibu - 99Mammoth Lakes - 152Manhattan Beach - 367Manteca - 475Marina - 137Martinez - 54Marysville - 98Maywood - 105Menlo Park - 386Merced - 650Mill Valley - 234Millbrae - 210Milpitas - 542Mission Viejo - 196Modesto - 1,451Monrovia - 358Montague - 7Montclair - 327Monte Sereno - 10Montebello - 718Monterey - 645Monterey Park - 521Moorpark - 93Moraga - 51Moreno Valley - 735Morgan Hill - 271Morro Bay - 131Mountain View - 853Mt. Shasta - 53Murrieta - 343Napa - 505National City - 446Needles - 157Nevada City - 41Newark - 301Newman - 62Newport Beach - 1,123Norco - 158Norwalk - 332Novato - 308Oakdale - 136Oakland - 5,319Oakley - 41Oceanside - 1,319Ojai - 47
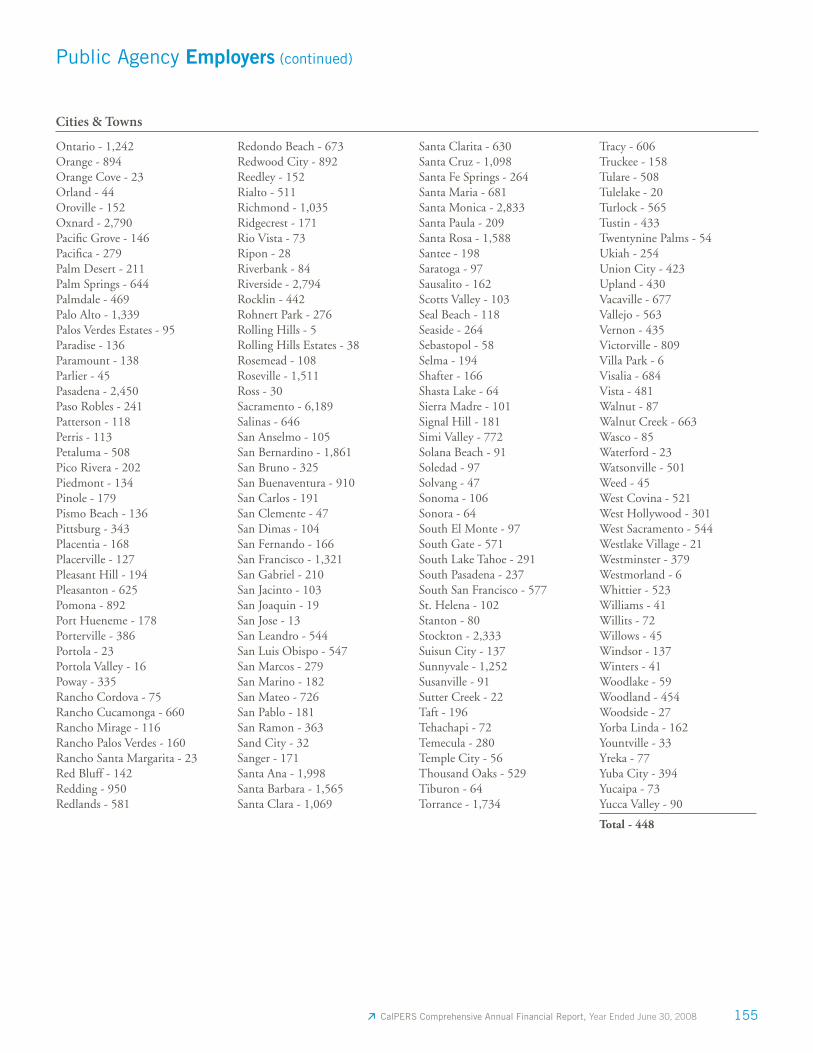
CalPERS Comprehensive Annual Financial Report, Year Ended June 30, 2008 155
Public Agency Employers (continued)
Ontario - 1,242Orange - 894Orange Cove - 23Orland - 44Oroville - 152Oxnard - 2,790Pacifi c Grove - 146Pacifi ca - 279Palm Desert - 211Palm Springs - 644Palmdale - 469Palo Alto - 1,339Palos Verdes Estates - 95Paradise - 136Paramount - 138Parlier - 45Pasadena - 2,450Paso Robles - 241Patterson - 118Perris - 113Petaluma - 508Pico Rivera - 202Piedmont - 134Pinole - 179Pismo Beach - 136Pittsburg - 343Placentia - 168Placerville - 127Pleasant Hill - 194Pleasanton - 625Pomona - 892Port Hueneme - 178Porterville - 386Portola - 23Portola Valley - 16Poway - 335Rancho Cordova - 75Rancho Cucamonga - 660Rancho Mirage - 116Rancho Palos Verdes - 160Rancho Santa Margarita - 23Red Bluff - 142Redding - 950Redlands - 581
Redondo Beach - 673Redwood City - 892Reedley - 152Rialto - 511Richmond - 1,035Ridgecrest - 171Rio Vista - 73Ripon - 28Riverbank - 84Riverside - 2,794Rocklin - 442Rohnert Park - 276Rolling Hills - 5Rolling Hills Estates - 38Rosemead - 108Roseville - 1,511Ross - 30Sacramento - 6,189Salinas - 646San Anselmo - 105San Bernardino - 1,861San Bruno - 325San Buenaventura - 910San Carlos - 191San Clemente - 47San Dimas - 104San Fernando - 166San Francisco - 1,321San Gabriel - 210San Jacinto - 103San Joaquin - 19San Jose - 13San Leandro - 544San Luis Obispo - 547San Marcos - 279San Marino - 182San Mateo - 726San Pablo - 181San Ramon - 363Sand City - 32Sanger - 171Santa Ana - 1,998Santa Barbara - 1,565Santa Clara - 1,069
Santa Clarita - 630Santa Cruz - 1,098Santa Fe Springs - 264Santa Maria - 681Santa Monica - 2,833Santa Paula - 209Santa Rosa - 1,588Santee - 198Saratoga - 97Sausalito - 162Scotts Valley - 103Seal Beach - 118Seaside - 264Sebastopol - 58Selma - 194Shafter - 166Shasta Lake - 64Sierra Madre - 101Signal Hill - 181Simi Valley - 772Solana Beach - 91Soledad - 97Solvang - 47Sonoma - 106Sonora - 64South El Monte - 97South Gate - 571South Lake Tahoe - 291South Pasadena - 237South San Francisco - 577St. Helena - 102Stanton - 80Stockton - 2,333Suisun City - 137Sunnyvale - 1,252Susanville - 91Sutter Creek - 22Taft - 196Tehachapi - 72Temecula - 280Temple City - 56Thousand Oaks - 529Tiburon - 64Torrance - 1,734
Tracy - 606Truckee - 158Tulare - 508Tulelake - 20Turlock - 565Tustin - 433Twentynine Palms - 54Ukiah - 254Union City - 423Upland - 430Vacaville - 677Vallejo - 563Vernon - 435Victorville - 809Villa Park - 6Visalia - 684Vista - 481Walnut - 87Walnut Creek - 663Wasco - 85Waterford - 23Watsonville - 501Weed - 45West Covina - 521West Hollywood - 301West Sacramento - 544Westlake Village - 21Westminster - 379Westmorland - 6Whittier - 523Williams - 41Willits - 72Willows - 45Windsor - 137Winters - 41Woodlake - 59Woodland - 454Woodside - 27Yorba Linda - 162Yountville - 33Yreka - 77Yuba City - 394Yucaipa - 73Yucca Valley - 90
Total - 448
Cities & Towns
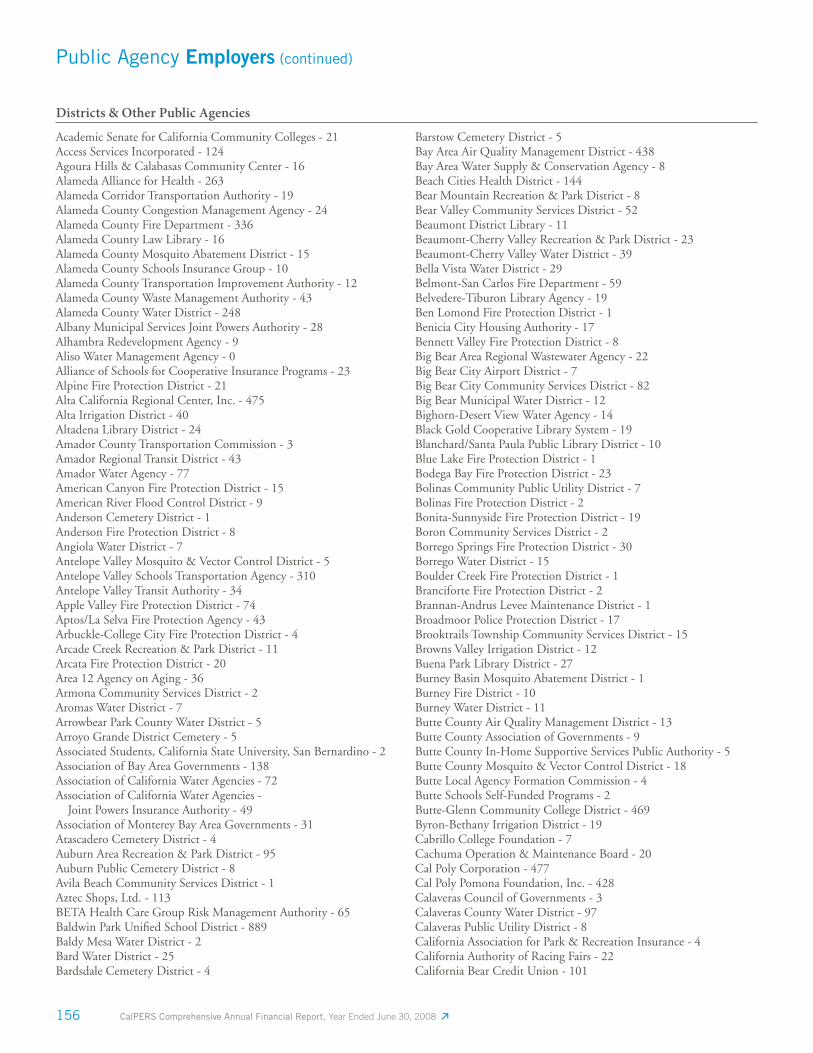
156 CalPERS Comprehensive Annual Financial Report, Year Ended June 30, 2008
Public Agency Employers (continued)
Academic Senate for California Community Colleges - 21Access Services Incorporated - 124Agoura Hills & Calabasas Community Center - 16Alameda Alliance for Health - 263Alameda Corridor Transportation Authority - 19Alameda County Congestion Management Agency - 24Alameda County Fire Department - 336Alameda County Law Library - 16Alameda County Mosquito Abatement District - 15Alameda County Schools Insurance Group - 10Alameda County Transportation Improvement Authority - 12Alameda County Waste Management Authority - 43Alameda County Water District - 248Albany Municipal Services Joint Powers Authority - 28Alhambra Redevelopment Agency - 9Aliso Water Management Agency - 0Alliance of Schools for Cooperative Insurance Programs - 23Alpine Fire Protection District - 21Alta California Regional Center, Inc. - 475Alta Irrigation District - 40Altadena Library District - 24Amador County Transportation Commission - 3Amador Regional Transit District - 43Amador Water Agency - 77American Canyon Fire Protection District - 15American River Flood Control District - 9Anderson Cemetery District - 1Anderson Fire Protection District - 8Angiola Water District - 7Antelope Valley Mosquito & Vector Control District - 5Antelope Valley Schools Transportation Agency - 310Antelope Valley Transit Authority - 34Apple Valley Fire Protection District - 74Aptos/La Selva Fire Protection Agency - 43Arbuckle-College City Fire Protection District - 4Arcade Creek Recreation & Park District - 11Arcata Fire Protection District - 20Area 12 Agency on Aging - 36Armona Community Services District - 2Aromas Water District - 7Arrowbear Park County Water District - 5Arroyo Grande District Cemetery - 5Associated Students, California State University, San Bernardino - 2Association of Bay Area Governments - 138Association of California Water Agencies - 72Association of California Water Agencies - Joint Powers Insurance Authority - 49Association of Monterey Bay Area Governments - 31Atascadero Cemetery District - 4Auburn Area Recreation & Park District - 95Auburn Public Cemetery District - 8Avila Beach Community Services District - 1Aztec Shops, Ltd. - 113BETA Health Care Group Risk Management Authority - 65Baldwin Park Unifi ed School District - 889Baldy Mesa Water District - 2Bard Water District - 25Bardsdale Cemetery District - 4
Barstow Cemetery District - 5Bay Area Air Quality Management District - 438Bay Area Water Supply & Conservation Agency - 8Beach Cities Health District - 144Bear Mountain Recreation & Park District - 8Bear Valley Community Services District - 52Beaumont District Library - 11Beaumont-Cherry Valley Recreation & Park District - 23Beaumont-Cherry Valley Water District - 39Bella Vista Water District - 29Belmont-San Carlos Fire Department - 59Belvedere-Tiburon Library Agency - 19Ben Lomond Fire Protection District - 1Benicia City Housing Authority - 17Bennett Valley Fire Protection District - 8Big Bear Area Regional Wastewater Agency - 22Big Bear City Airport District - 7Big Bear City Community Services District - 82Big Bear Municipal Water District - 12Bighorn-Desert View Water Agency - 14Black Gold Cooperative Library System - 19Blanchard/Santa Paula Public Library District - 10Blue Lake Fire Protection District - 1Bodega Bay Fire Protection District - 23Bolinas Community Public Utility District - 7Bolinas Fire Protection District - 2Bonita-Sunnyside Fire Protection District - 19Boron Community Services District - 2Borrego Springs Fire Protection District - 30Borrego Water District - 15Boulder Creek Fire Protection District - 1Branciforte Fire Protection District - 2Brannan-Andrus Levee Maintenance District - 1Broadmoor Police Protection District - 17Brooktrails Township Community Services District - 15Browns Valley Irrigation District - 12Buena Park Library District - 27Burney Basin Mosquito Abatement District - 1Burney Fire District - 10Burney Water District - 11Butte County Air Quality Management District - 13Butte County Association of Governments - 9Butte County In-Home Supportive Services Public Authority - 5Butte County Mosquito & Vector Control District - 18Butte Local Agency Formation Commission - 4Butte Schools Self-Funded Programs - 2Butte-Glenn Community College District - 469Byron-Bethany Irrigation District - 19Cabrillo College Foundation - 7Cachuma Operation & Maintenance Board - 20Cal Poly Corporation - 477Cal Poly Pomona Foundation, Inc. - 428Calaveras Council of Governments - 3Calaveras County Water District - 97Calaveras Public Utility District - 8California Association for Park & Recreation Insurance - 4California Authority of Racing Fairs - 22California Bear Credit Union - 101
Districts & Other Public Agencies
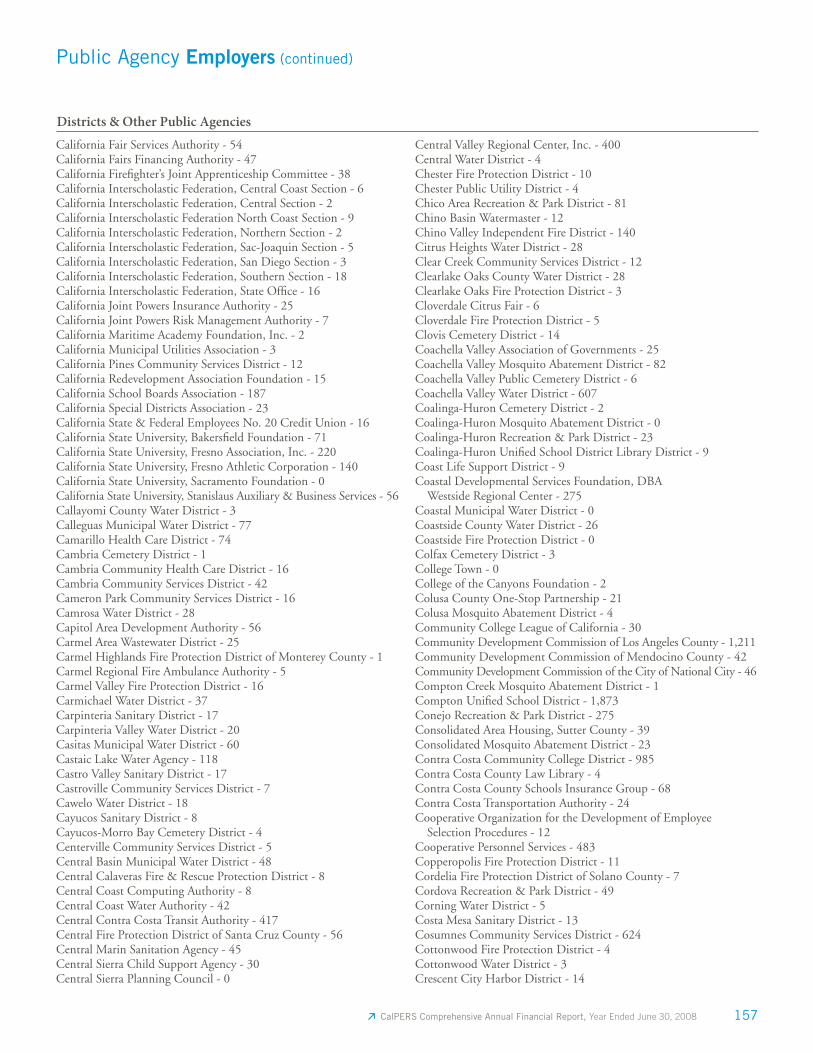
CalPERS Comprehensive Annual Financial Report, Year Ended June 30, 2008 157
Public Agency Employers (continued)
Central Valley Regional Center, Inc. - 400Central Water District - 4Chester Fire Protection District - 10Chester Public Utility District - 4Chico Area Recreation & Park District - 81Chino Basin Watermaster - 12Chino Valley Independent Fire District - 140Citrus Heights Water District - 28Clear Creek Community Services District - 12Clearlake Oaks County Water District - 28Clearlake Oaks Fire Protection District - 3Cloverdale Citrus Fair - 6Cloverdale Fire Protection District - 5Clovis Cemetery District - 14Coachella Valley Association of Governments - 25Coachella Valley Mosquito Abatement District - 82Coachella Valley Public Cemetery District - 6Coachella Valley Water District - 607Coalinga-Huron Cemetery District - 2Coalinga-Huron Mosquito Abatement District - 0Coalinga-Huron Recreation & Park District - 23Coalinga-Huron Unifi ed School District Library District - 9Coast Life Support District - 9Coastal Developmental Services Foundation, DBA Westside Regional Center - 275Coastal Municipal Water District - 0Coastside County Water District - 26Coastside Fire Protection District - 0Colfax Cemetery District - 3College Town - 0College of the Canyons Foundation - 2Colusa County One-Stop Partnership - 21Colusa Mosquito Abatement District - 4Community College League of California - 30Community Development Commission of Los Angeles County - 1,211Community Development Commission of Mendocino County - 42Community Development Commission of the City of National City - 46Compton Creek Mosquito Abatement District - 1Compton Unifi ed School District - 1,873Conejo Recreation & Park District - 275Consolidated Area Housing, Sutter County - 39Consolidated Mosquito Abatement District - 23Contra Costa Community College District - 985Contra Costa County Law Library - 4Contra Costa County Schools Insurance Group - 68Contra Costa Transportation Authority - 24Cooperative Organization for the Development of Employee Selection Procedures - 12Cooperative Personnel Services - 483Copperopolis Fire Protection District - 11Cordelia Fire Protection District of Solano County - 7Cordova Recreation & Park District - 49Corning Water District - 5Costa Mesa Sanitary District - 13Cosumnes Community Services District - 624Cottonwood Fire Protection District - 4Cottonwood Water District - 3Crescent City Harbor District - 14
California Fair Services Authority - 54California Fairs Financing Authority - 47California Firefi ghter’s Joint Apprenticeship Committee - 38California Interscholastic Federation, Central Coast Section - 6California Interscholastic Federation, Central Section - 2California Interscholastic Federation North Coast Section - 9California Interscholastic Federation, Northern Section - 2California Interscholastic Federation, Sac-Joaquin Section - 5California Interscholastic Federation, San Diego Section - 3California Interscholastic Federation, Southern Section - 18California Interscholastic Federation, State Offi ce - 16California Joint Powers Insurance Authority - 25California Joint Powers Risk Management Authority - 7California Maritime Academy Foundation, Inc. - 2California Municipal Utilities Association - 3California Pines Community Services District - 12California Redevelopment Association Foundation - 15California School Boards Association - 187California Special Districts Association - 23California State & Federal Employees No. 20 Credit Union - 16California State University, Bakersfi eld Foundation - 71California State University, Fresno Association, Inc. - 220California State University, Fresno Athletic Corporation - 140 California State University, Sacramento Foundation - 0California State University, Stanislaus Auxiliary & Business Services - 56Callayomi County Water District - 3Calleguas Municipal Water District - 77Camarillo Health Care District - 74Cambria Cemetery District - 1Cambria Community Health Care District - 16Cambria Community Services District - 42Cameron Park Community Services District - 16Camrosa Water District - 28Capitol Area Development Authority - 56Carmel Area Wastewater District - 25Carmel Highlands Fire Protection District of Monterey County - 1Carmel Regional Fire Ambulance Authority - 5Carmel Valley Fire Protection District - 16Carmichael Water District - 37Carpinteria Sanitary District - 17Carpinteria Valley Water District - 20Casitas Municipal Water District - 60Castaic Lake Water Agency - 118Castro Valley Sanitary District - 17Castroville Community Services District - 7Cawelo Water District - 18Cayucos Sanitary District - 8Cayucos-Morro Bay Cemetery District - 4Centerville Community Services District - 5Central Basin Municipal Water District - 48Central Calaveras Fire & Rescue Protection District - 8Central Coast Computing Authority - 8Central Coast Water Authority - 42Central Contra Costa Transit Authority - 417Central Fire Protection District of Santa Cruz County - 56Central Marin Sanitation Agency - 45Central Sierra Child Support Agency - 30Central Sierra Planning Council - 0
Districts & Other Public Agencies
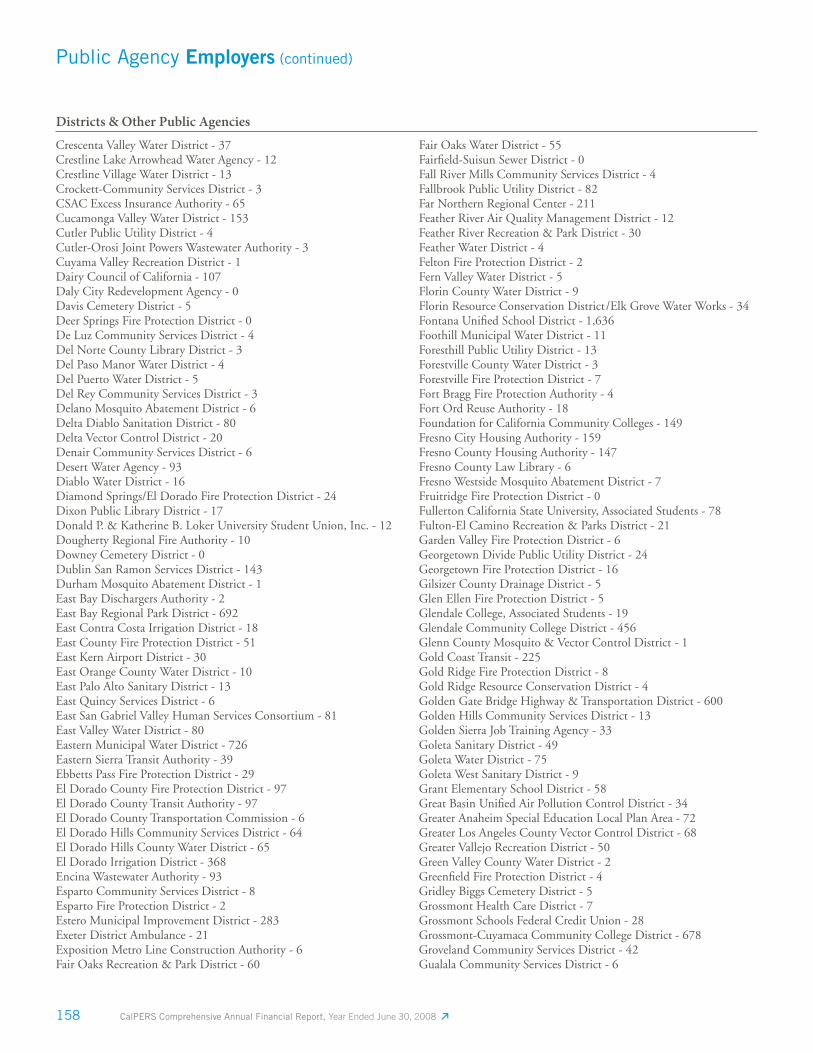
158 CalPERS Comprehensive Annual Financial Report, Year Ended June 30, 2008
Public Agency Employers (continued)
Crescenta Valley Water District - 37Crestline Lake Arrowhead Water Agency - 12Crestline Village Water District - 13Crockett-Community Services District - 3CSAC Excess Insurance Authority - 65Cucamonga Valley Water District - 153Cutler Public Utility District - 4Cutler-Orosi Joint Powers Wastewater Authority - 3Cuyama Valley Recreation District - 1Dairy Council of California - 107Daly City Redevelopment Agency - 0Davis Cemetery District - 5Deer Springs Fire Protection District - 0De Luz Community Services District - 4Del Norte County Library District - 3Del Paso Manor Water District - 4Del Puerto Water District - 5Del Rey Community Services District - 3Delano Mosquito Abatement District - 6Delta Diablo Sanitation District - 80Delta Vector Control District - 20Denair Community Services District - 6Desert Water Agency - 93Diablo Water District - 16Diamond Springs/El Dorado Fire Protection District - 24Dixon Public Library District - 17Donald P. & Katherine B. Loker University Student Union, Inc. - 12Dougherty Regional Fire Authority - 10Downey Cemetery District - 0Dublin San Ramon Services District - 143Durham Mosquito Abatement District - 1East Bay Dischargers Authority - 2East Bay Regional Park District - 692East Contra Costa Irrigation District - 18East County Fire Protection District - 51East Kern Airport District - 30East Orange County Water District - 10East Palo Alto Sanitary District - 13East Quincy Services District - 6East San Gabriel Valley Human Services Consortium - 81East Valley Water District - 80Eastern Municipal Water District - 726Eastern Sierra Transit Authority - 39Ebbetts Pass Fire Protection District - 29El Dorado County Fire Protection District - 97El Dorado County Transit Authority - 97El Dorado County Transportation Commission - 6El Dorado Hills Community Services District - 64El Dorado Hills County Water District - 65El Dorado Irrigation District - 368Encina Wastewater Authority - 93Esparto Community Services District - 8Esparto Fire Protection District - 2Estero Municipal Improvement District - 283Exeter District Ambulance - 21Exposition Metro Line Construction Authority - 6Fair Oaks Recreation & Park District - 60
Fair Oaks Water District - 55Fairfi eld-Suisun Sewer District - 0Fall River Mills Community Services District - 4Fallbrook Public Utility District - 82Far Northern Regional Center - 211Feather River Air Quality Management District - 12Feather River Recreation & Park District - 30Feather Water District - 4Felton Fire Protection District - 2Fern Valley Water District - 5Florin County Water District - 9Florin Resource Conservation District/Elk Grove Water Works - 34Fontana Unifi ed School District - 1,636Foothill Municipal Water District - 11Foresthill Public Utility District - 13Forestville County Water District - 3Forestville Fire Protection District - 7Fort Bragg Fire Protection Authority - 4Fort Ord Reuse Authority - 18 Foundation for California Community Colleges - 149Fresno City Housing Authority - 159Fresno County Housing Authority - 147Fresno County Law Library - 6Fresno Westside Mosquito Abatement District - 7Fruitridge Fire Protection District - 0Fullerton California State University, Associated Students - 78Fulton-El Camino Recreation & Parks District - 21Garden Valley Fire Protection District - 6Georgetown Divide Public Utility District - 24Georgetown Fire Protection District - 16Gilsizer County Drainage District - 5Glen Ellen Fire Protection District - 5Glendale College, Associated Students - 19Glendale Community College District - 456Glenn County Mosquito & Vector Control District - 1Gold Coast Transit - 225Gold Ridge Fire Protection District - 8Gold Ridge Resource Conservation District - 4Golden Gate Bridge Highway & Transportation District - 600Golden Hills Community Services District - 13Golden Sierra Job Training Agency - 33Goleta Sanitary District - 49Goleta Water District - 75Goleta West Sanitary District - 9Grant Elementary School District - 58Great Basin Unifi ed Air Pollution Control District - 34Greater Anaheim Special Education Local Plan Area - 72Greater Los Angeles County Vector Control District - 68Greater Vallejo Recreation District - 50Green Valley County Water District - 2Greenfi eld Fire Protection District - 4Gridley Biggs Cemetery District - 5Grossmont Health Care District - 7Grossmont Schools Federal Credit Union - 28Grossmont-Cuyamaca Community College District - 678Groveland Community Services District - 42Gualala Community Services District - 6
Districts & Other Public Agencies
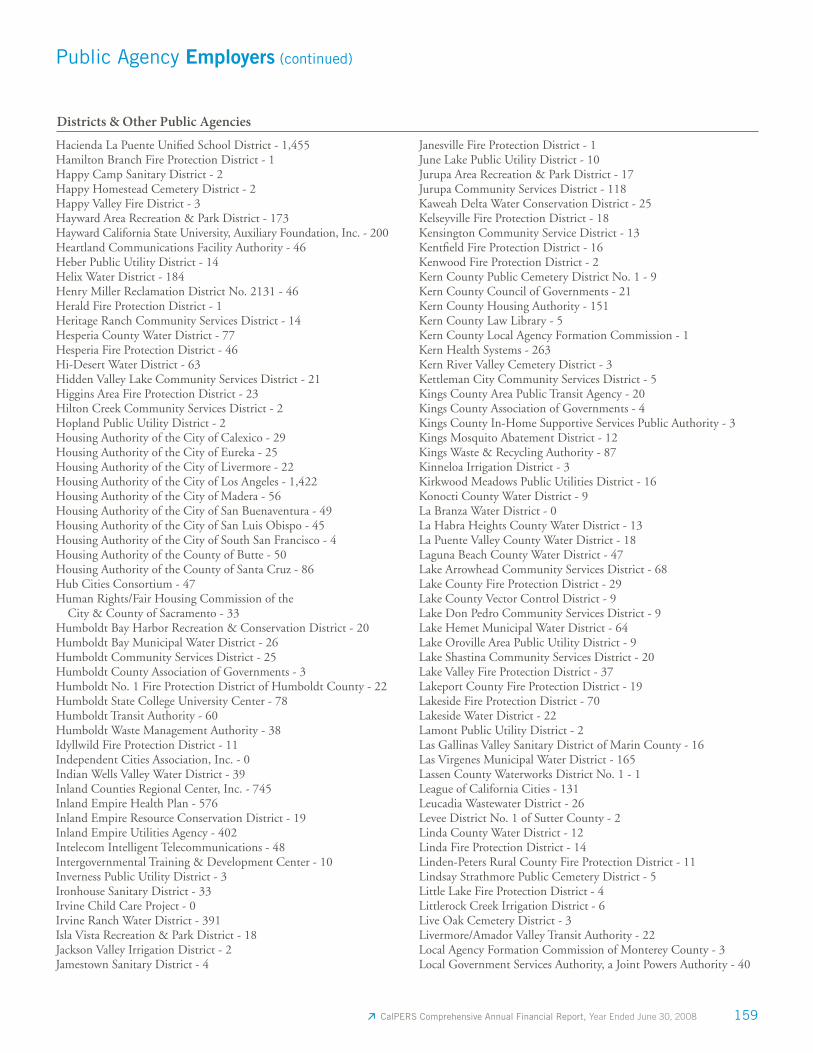
CalPERS Comprehensive Annual Financial Report, Year Ended June 30, 2008 159
Public Agency Employers (continued)
Hacienda La Puente Unifi ed School District - 1,455Hamilton Branch Fire Protection District - 1Happy Camp Sanitary District - 2Happy Homestead Cemetery District - 2Happy Valley Fire District - 3Hayward Area Recreation & Park District - 173Hayward California State University, Auxiliary Foundation, Inc. - 200Heartland Communications Facility Authority - 46Heber Public Utility District - 14Helix Water District - 184Henry Miller Reclamation District No. 2131 - 46Herald Fire Protection District - 1Heritage Ranch Community Services District - 14Hesperia County Water District - 77Hesperia Fire Protection District - 46Hi-Desert Water District - 63Hidden Valley Lake Community Services District - 21Higgins Area Fire Protection District - 23Hilton Creek Community Services District - 2Hopland Public Utility District - 2Housing Authority of the City of Calexico - 29Housing Authority of the City of Eureka - 25Housing Authority of the City of Livermore - 22Housing Authority of the City of Los Angeles - 1,422Housing Authority of the City of Madera - 56Housing Authority of the City of San Buenaventura - 49Housing Authority of the City of San Luis Obispo - 45Housing Authority of the City of South San Francisco - 4 Housing Authority of the County of Butte - 50Housing Authority of the County of Santa Cruz - 86Hub Cities Consortium - 47Human Rights/Fair Housing Commission of the City & County of Sacramento - 33Humboldt Bay Harbor Recreation & Conservation District - 20Humboldt Bay Municipal Water District - 26Humboldt Community Services District - 25Humboldt County Association of Governments - 3Humboldt No. 1 Fire Protection District of Humboldt County - 22Humboldt State College University Center - 78Humboldt Transit Authority - 60Humboldt Waste Management Authority - 38Idyllwild Fire Protection District - 11Independent Cities Association, Inc. - 0Indian Wells Valley Water District - 39Inland Counties Regional Center, Inc. - 745Inland Empire Health Plan - 576Inland Empire Resource Conservation District - 19Inland Empire Utilities Agency - 402Intelecom Intelligent Telecommunications - 48Intergovernmental Training & Development Center - 10Inverness Public Utility District - 3Ironhouse Sanitary District - 33Irvine Child Care Project - 0Irvine Ranch Water District - 391Isla Vista Recreation & Park District - 18Jackson Valley Irrigation District - 2Jamestown Sanitary District - 4
Janesville Fire Protection District - 1June Lake Public Utility District - 10Jurupa Area Recreation & Park District - 17Jurupa Community Services District - 118Kaweah Delta Water Conservation District - 25Kelseyville Fire Protection District - 18Kensington Community Service District - 13Kentfi eld Fire Protection District - 16Kenwood Fire Protection District - 2Kern County Public Cemetery District No. 1 - 9Kern County Council of Governments - 21Kern County Housing Authority - 151Kern County Law Library - 5Kern County Local Agency Formation Commission - 1Kern Health Systems - 263Kern River Valley Cemetery District - 3Kettleman City Community Services District - 5Kings County Area Public Transit Agency - 20Kings County Association of Governments - 4Kings County In-Home Supportive Services Public Authority - 3Kings Mosquito Abatement District - 12Kings Waste & Recycling Authority - 87Kinneloa Irrigation District - 3Kirkwood Meadows Public Utilities District - 16Konocti County Water District - 9La Branza Water District - 0La Habra Heights County Water District - 13La Puente Valley County Water District - 18Laguna Beach County Water District - 47Lake Arrowhead Community Services District - 68Lake County Fire Protection District - 29Lake County Vector Control District - 9Lake Don Pedro Community Services District - 9Lake Hemet Municipal Water District - 64Lake Oroville Area Public Utility District - 9Lake Shastina Community Services District - 20Lake Valley Fire Protection District - 37Lakeport County Fire Protection District - 19Lakeside Fire Protection District - 70Lakeside Water District - 22Lamont Public Utility District - 2Las Gallinas Valley Sanitary District of Marin County - 16Las Virgenes Municipal Water District - 165Lassen County Waterworks District No. 1 - 1League of California Cities - 131Leucadia Wastewater District - 26Levee District No. 1 of Sutter County - 2Linda County Water District - 12Linda Fire Protection District - 14Linden-Peters Rural County Fire Protection District - 11Lindsay Strathmore Public Cemetery District - 5Little Lake Fire Protection District - 4Littlerock Creek Irrigation District - 6Live Oak Cemetery District - 3Livermore/Amador Valley Transit Authority - 22Local Agency Formation Commission of Monterey County - 3Local Government Services Authority, a Joint Powers Authority - 40
Districts & Other Public Agencies
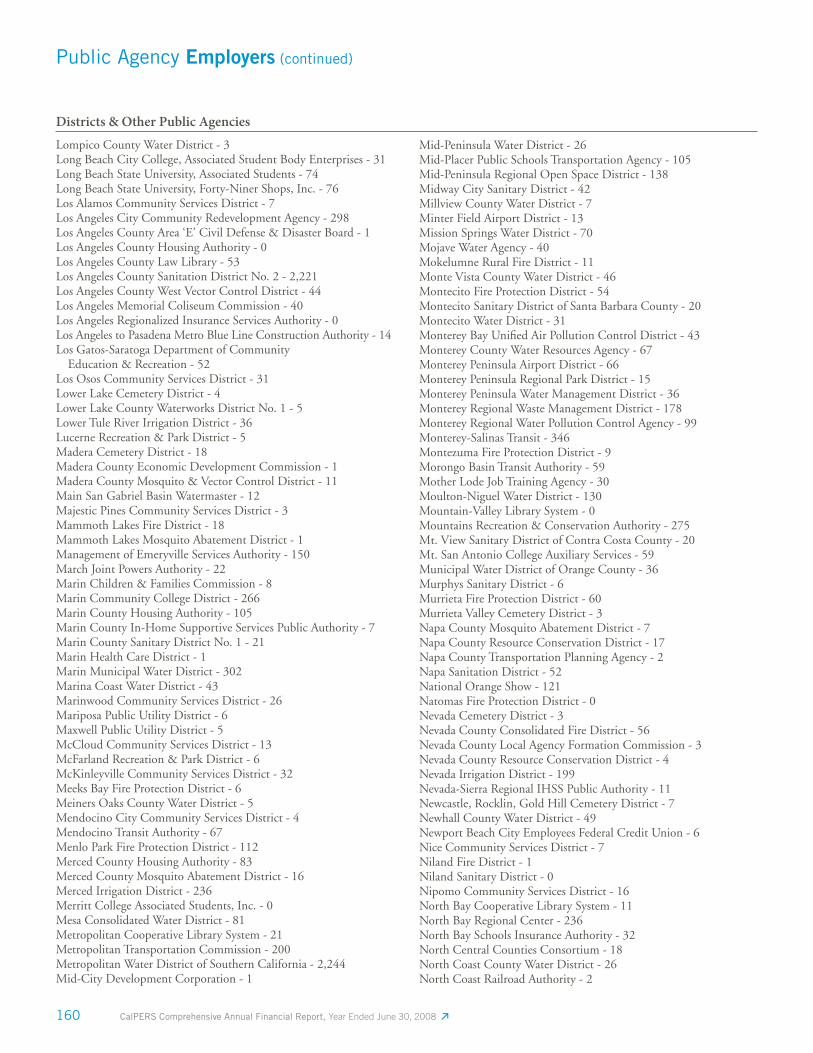
160 CalPERS Comprehensive Annual Financial Report, Year Ended June 30, 2008
Public Agency Employers (continued)
Lompico County Water District - 3Long Beach City College, Associated Student Body Enterprises - 31Long Beach State University, Associated Students - 74Long Beach State University, Forty-Niner Shops, Inc. - 76Los Alamos Community Services District - 7Los Angeles City Community Redevelopment Agency - 298Los Angeles County Area ‘E’ Civil Defense & Disaster Board - 1Los Angeles County Housing Authority - 0Los Angeles County Law Library - 53Los Angeles County Sanitation District No. 2 - 2,221Los Angeles County West Vector Control District - 44Los Angeles Memorial Coliseum Commission - 40Los Angeles Regionalized Insurance Services Authority - 0Los Angeles to Pasadena Metro Blue Line Construction Authority - 14Los Gatos-Saratoga Department of Community Education & Recreation - 52Los Osos Community Services District - 31Lower Lake Cemetery District - 4Lower Lake County Waterworks District No. 1 - 5Lower Tule River Irrigation District - 36Lucerne Recreation & Park District - 5Madera Cemetery District - 18Madera County Economic Development Commission - 1Madera County Mosquito & Vector Control District - 11Main San Gabriel Basin Watermaster - 12Majestic Pines Community Services District - 3Mammoth Lakes Fire District - 18Mammoth Lakes Mosquito Abatement District - 1Management of Emeryville Services Authority - 150March Joint Powers Authority - 22Marin Children & Families Commission - 8Marin Community College District - 266Marin County Housing Authority - 105Marin County In-Home Supportive Services Public Authority - 7Marin County Sanitary District No. 1 - 21Marin Health Care District - 1Marin Municipal Water District - 302Marina Coast Water District - 43Marinwood Community Services District - 26Mariposa Public Utility District - 6Maxwell Public Utility District - 5McCloud Community Services District - 13McFarland Recreation & Park District - 6McKinleyville Community Services District - 32Meeks Bay Fire Protection District - 6Meiners Oaks County Water District - 5Mendocino City Community Services District - 4Mendocino Transit Authority - 67Menlo Park Fire Protection District - 112Merced County Housing Authority - 83Merced County Mosquito Abatement District - 16Merced Irrigation District - 236Merritt College Associated Students, Inc. - 0Mesa Consolidated Water District - 81Metropolitan Cooperative Library System - 21Metropolitan Transportation Commission - 200Metropolitan Water District of Southern California - 2,244Mid-City Development Corporation - 1
Mid-Peninsula Water District - 26Mid-Placer Public Schools Transportation Agency - 105Mid-Peninsula Regional Open Space District - 138Midway City Sanitary District - 42Millview County Water District - 7Minter Field Airport District - 13Mission Springs Water District - 70Mojave Water Agency - 40Mokelumne Rural Fire District - 11Monte Vista County Water District - 46Montecito Fire Protection District - 54Montecito Sanitary District of Santa Barbara County - 20Montecito Water District - 31Monterey Bay Unifi ed Air Pollution Control District - 43Monterey County Water Resources Agency - 67Monterey Peninsula Airport District - 66Monterey Peninsula Regional Park District - 15Monterey Peninsula Water Management District - 36Monterey Regional Waste Management District - 178Monterey Regional Water Pollution Control Agency - 99Monterey-Salinas Transit - 346Montezuma Fire Protection District - 9Morongo Basin Transit Authority - 59Mother Lode Job Training Agency - 30Moulton-Niguel Water District - 130Mountain-Valley Library System - 0Mountains Recreation & Conservation Authority - 275Mt. View Sanitary District of Contra Costa County - 20Mt. San Antonio College Auxiliary Services - 59Municipal Water District of Orange County - 36Murphys Sanitary District - 6Murrieta Fire Protection District - 60Murrieta Valley Cemetery District - 3Napa County Mosquito Abatement District - 7Napa County Resource Conservation District - 17Napa County Transportation Planning Agency - 2Napa Sanitation District - 52National Orange Show - 121Natomas Fire Protection District - 0Nevada Cemetery District - 3Nevada County Consolidated Fire District - 56Nevada County Local Agency Formation Commission - 3Nevada County Resource Conservation District - 4Nevada Irrigation District - 199Nevada-Sierra Regional IHSS Public Authority - 11Newcastle, Rocklin, Gold Hill Cemetery District - 7Newhall County Water District - 49Newport Beach City Employees Federal Credit Union - 6Nice Community Services District - 7Niland Fire District - 1Niland Sanitary District - 0Nipomo Community Services District - 16North Bay Cooperative Library System - 11North Bay Regional Center - 236North Bay Schools Insurance Authority - 32North Central Counties Consortium - 18North Coast County Water District - 26North Coast Railroad Authority - 2
Districts & Other Public Agencies
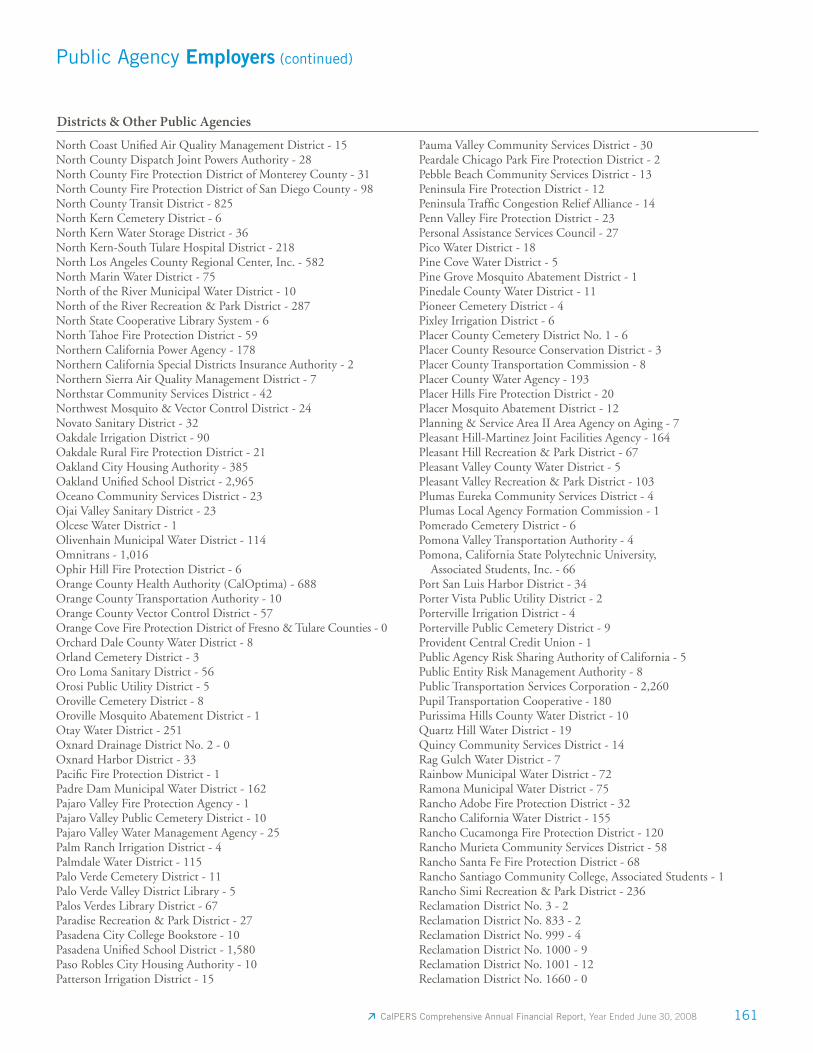
CalPERS Comprehensive Annual Financial Report, Year Ended June 30, 2008 161
Public Agency Employers (continued)
North Coast Unifi ed Air Quality Management District - 15North County Dispatch Joint Powers Authority - 28North County Fire Protection District of Monterey County - 31North County Fire Protection District of San Diego County - 98North County Transit District - 825North Kern Cemetery District - 6North Kern Water Storage District - 36North Kern-South Tulare Hospital District - 218North Los Angeles County Regional Center, Inc. - 582North Marin Water District - 75North of the River Municipal Water District - 10North of the River Recreation & Park District - 287North State Cooperative Library System - 6North Tahoe Fire Protection District - 59Northern California Power Agency - 178Northern California Special Districts Insurance Authority - 2Northern Sierra Air Quality Management District - 7Northstar Community Services District - 42Northwest Mosquito & Vector Control District - 24Novato Sanitary District - 32Oakdale Irrigation District - 90Oakdale Rural Fire Protection District - 21Oakland City Housing Authority - 385Oakland Unifi ed School District - 2,965Oceano Community Services District - 23Ojai Valley Sanitary District - 23Olcese Water District - 1Olivenhain Municipal Water District - 114Omnitrans - 1,016Ophir Hill Fire Protection District - 6Orange County Health Authority (CalOptima) - 688Orange County Transportation Authority - 10Orange County Vector Control District - 57Orange Cove Fire Protection District of Fresno & Tulare Counties - 0Orchard Dale County Water District - 8Orland Cemetery District - 3Oro Loma Sanitary District - 56Orosi Public Utility District - 5Oroville Cemetery District - 8Oroville Mosquito Abatement District - 1Otay Water District - 251Oxnard Drainage District No. 2 - 0Oxnard Harbor District - 33Pacifi c Fire Protection District - 1Padre Dam Municipal Water District - 162Pajaro Valley Fire Protection Agency - 1Pajaro Valley Public Cemetery District - 10Pajaro Valley Water Management Agency - 25Palm Ranch Irrigation District - 4Palmdale Water District - 115Palo Verde Cemetery District - 11Palo Verde Valley District Library - 5Palos Verdes Library District - 67Paradise Recreation & Park District - 27Pasadena City College Bookstore - 10Pasadena Unifi ed School District - 1,580Paso Robles City Housing Authority - 10Patterson Irrigation District - 15
Pauma Valley Community Services District - 30Peardale Chicago Park Fire Protection District - 2Pebble Beach Community Services District - 13Peninsula Fire Protection District - 12Peninsula Traffi c Congestion Relief Alliance - 14Penn Valley Fire Protection District - 23Personal Assistance Services Council - 27Pico Water District - 18Pine Cove Water District - 5Pine Grove Mosquito Abatement District - 1Pinedale County Water District - 11Pioneer Cemetery District - 4Pixley Irrigation District - 6Placer County Cemetery District No. 1 - 6Placer County Resource Conservation District - 3Placer County Transportation Commission - 8Placer County Water Agency - 193Placer Hills Fire Protection District - 20Placer Mosquito Abatement District - 12Planning & Service Area II Area Agency on Aging - 7Pleasant Hill-Martinez Joint Facilities Agency - 164Pleasant Hill Recreation & Park District - 67Pleasant Valley County Water District - 5Pleasant Valley Recreation & Park District - 103Plumas Eureka Community Services District - 4Plumas Local Agency Formation Commission - 1Pomerado Cemetery District - 6Pomona Valley Transportation Authority - 4Pomona, California State Polytechnic University, Associated Students, Inc. - 66Port San Luis Harbor District - 34Porter Vista Public Utility District - 2Porterville Irrigation District - 4Porterville Public Cemetery District - 9Provident Central Credit Union - 1Public Agency Risk Sharing Authority of California - 5Public Entity Risk Management Authority - 8Public Transportation Services Corporation - 2,260Pupil Transportation Cooperative - 180Purissima Hills County Water District - 10Quartz Hill Water District - 19Quincy Community Services District - 14Rag Gulch Water District - 7Rainbow Municipal Water District - 72Ramona Municipal Water District - 75Rancho Adobe Fire Protection District - 32Rancho California Water District - 155Rancho Cucamonga Fire Protection District - 120Rancho Murieta Community Services District - 58Rancho Santa Fe Fire Protection District - 68Rancho Santiago Community College, Associated Students - 1Rancho Simi Recreation & Park District - 236Reclamation District No. 3 - 2Reclamation District No. 833 - 2Reclamation District No. 999 - 4Reclamation District No. 1000 - 9Reclamation District No. 1001 - 12Reclamation District No. 1660 - 0
Districts & Other Public Agencies
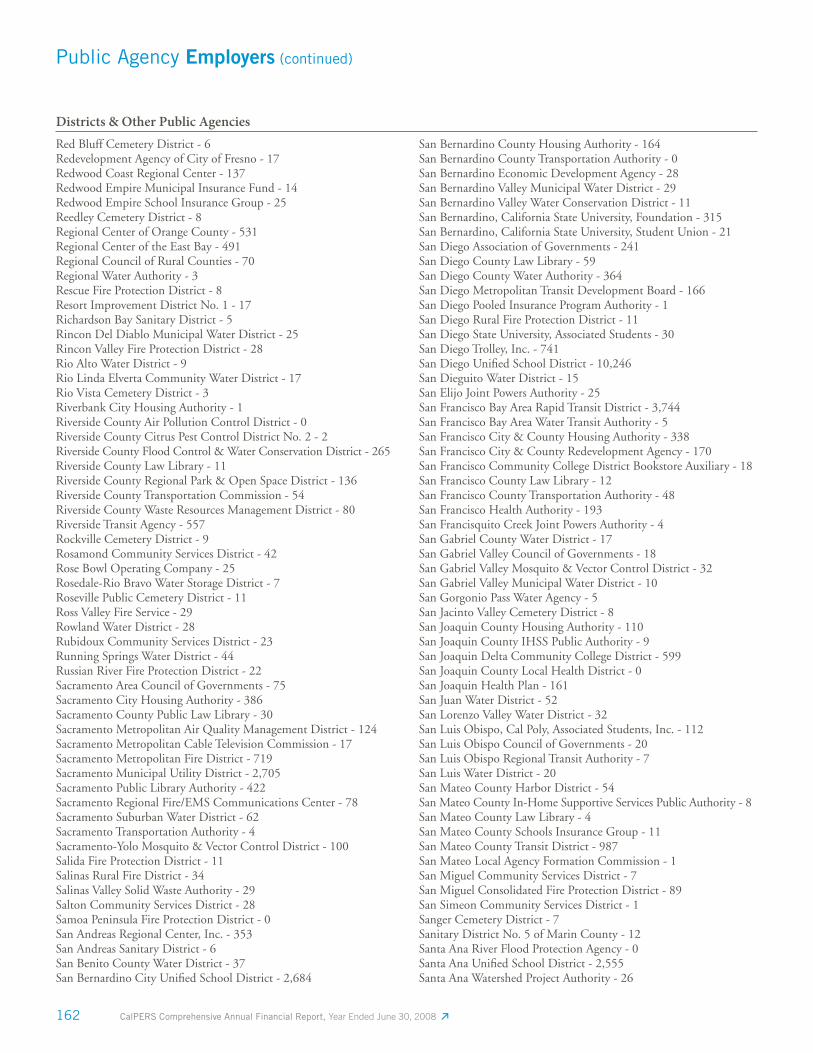
162 CalPERS Comprehensive Annual Financial Report, Year Ended June 30, 2008
Public Agency Employers (continued)
Red Bluff Cemetery District - 6Redevelopment Agency of City of Fresno - 17Redwood Coast Regional Center - 137Redwood Empire Municipal Insurance Fund - 14Redwood Empire School Insurance Group - 25Reedley Cemetery District - 8Regional Center of Orange County - 531Regional Center of the East Bay - 491Regional Council of Rural Counties - 70Regional Water Authority - 3Rescue Fire Protection District - 8Resort Improvement District No. 1 - 17Richardson Bay Sanitary District - 5Rincon Del Diablo Municipal Water District - 25Rincon Valley Fire Protection District - 28Rio Alto Water District - 9Rio Linda Elverta Community Water District - 17Rio Vista Cemetery District - 3Riverbank City Housing Authority - 1Riverside County Air Pollution Control District - 0Riverside County Citrus Pest Control District No. 2 - 2Riverside County Flood Control & Water Conservation District - 265Riverside County Law Library - 11Riverside County Regional Park & Open Space District - 136Riverside County Transportation Commission - 54Riverside County Waste Resources Management District - 80Riverside Transit Agency - 557Rockville Cemetery District - 9Rosamond Community Services District - 42Rose Bowl Operating Company - 25Rosedale-Rio Bravo Water Storage District - 7Roseville Public Cemetery District - 11Ross Valley Fire Service - 29Rowland Water District - 28Rubidoux Community Services District - 23Running Springs Water District - 44Russian River Fire Protection District - 22Sacramento Area Council of Governments - 75Sacramento City Housing Authority - 386Sacramento County Public Law Library - 30Sacramento Metropolitan Air Quality Management District - 124Sacramento Metropolitan Cable Television Commission - 17Sacramento Metropolitan Fire District - 719Sacramento Municipal Utility District - 2,705Sacramento Public Library Authority - 422Sacramento Regional Fire/EMS Communications Center - 78Sacramento Suburban Water District - 62Sacramento Transportation Authority - 4Sacramento-Yolo Mosquito & Vector Control District - 100Salida Fire Protection District - 11Salinas Rural Fire District - 34Salinas Valley Solid Waste Authority - 29Salton Community Services District - 28Samoa Peninsula Fire Protection District - 0San Andreas Regional Center, Inc. - 353San Andreas Sanitary District - 6San Benito County Water District - 37San Bernardino City Unifi ed School District - 2,684
San Bernardino County Housing Authority - 164San Bernardino County Transportation Authority - 0San Bernardino Economic Development Agency - 28San Bernardino Valley Municipal Water District - 29San Bernardino Valley Water Conservation District - 11San Bernardino, California State University, Foundation - 315San Bernardino, California State University, Student Union - 21San Diego Association of Governments - 241San Diego County Law Library - 59San Diego County Water Authority - 364San Diego Metropolitan Transit Development Board - 166San Diego Pooled Insurance Program Authority - 1San Diego Rural Fire Protection District - 11San Diego State University, Associated Students - 30San Diego Trolley, Inc. - 741San Diego Unifi ed School District - 10,246San Dieguito Water District - 15San Elijo Joint Powers Authority - 25San Francisco Bay Area Rapid Transit District - 3,744San Francisco Bay Area Water Transit Authority - 5San Francisco City & County Housing Authority - 338San Francisco City & County Redevelopment Agency - 170San Francisco Community College District Bookstore Auxiliary - 18San Francisco County Law Library - 12San Francisco County Transportation Authority - 48San Francisco Health Authority - 193San Francisquito Creek Joint Powers Authority - 4San Gabriel County Water District - 17San Gabriel Valley Council of Governments - 18San Gabriel Valley Mosquito & Vector Control District - 32San Gabriel Valley Municipal Water District - 10San Gorgonio Pass Water Agency - 5San Jacinto Valley Cemetery District - 8San Joaquin County Housing Authority - 110San Joaquin County IHSS Public Authority - 9San Joaquin Delta Community College District - 599San Joaquin County Local Health District - 0San Joaquin Health Plan - 161San Juan Water District - 52San Lorenzo Valley Water District - 32San Luis Obispo, Cal Poly, Associated Students, Inc. - 112San Luis Obispo Council of Governments - 20San Luis Obispo Regional Transit Authority - 7San Luis Water District - 20San Mateo County Harbor District - 54San Mateo County In-Home Supportive Services Public Authority - 8San Mateo County Law Library - 4San Mateo County Schools Insurance Group - 11San Mateo County Transit District - 987San Mateo Local Agency Formation Commission - 1San Miguel Community Services District - 7San Miguel Consolidated Fire Protection District - 89San Simeon Community Services District - 1Sanger Cemetery District - 7Sanitary District No. 5 of Marin County - 12Santa Ana River Flood Protection Agency - 0Santa Ana Unifi ed School District - 2,555Santa Ana Watershed Project Authority - 26
Districts & Other Public Agencies
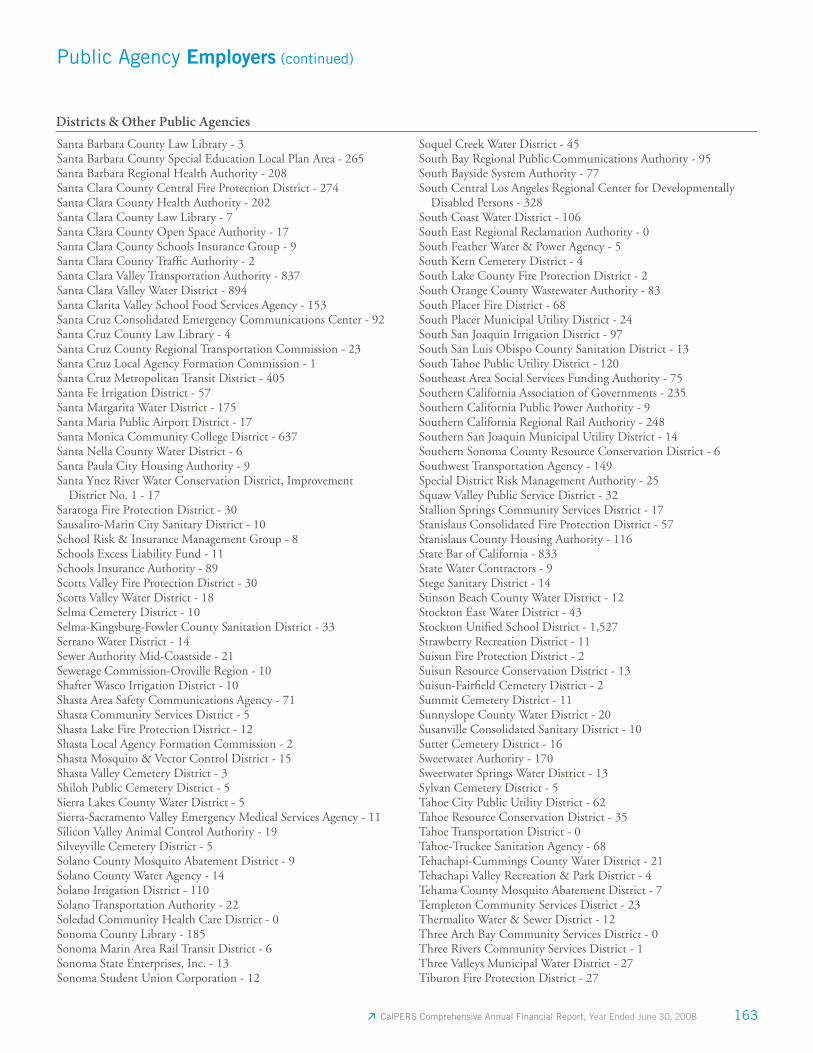
CalPERS Comprehensive Annual Financial Report, Year Ended June 30, 2008 163
Public Agency Employers (continued)
Santa Barbara County Law Library - 3Santa Barbara County Special Education Local Plan Area - 265Santa Barbara Regional Health Authority - 208Santa Clara County Central Fire Protection District - 274Santa Clara County Health Authority - 202Santa Clara County Law Library - 7Santa Clara County Open Space Authority - 17Santa Clara County Schools Insurance Group - 9Santa Clara County Traffi c Authority - 2Santa Clara Valley Transportation Authority - 837Santa Clara Valley Water District - 894Santa Clarita Valley School Food Services Agency - 153Santa Cruz Consolidated Emergency Communications Center - 92Santa Cruz County Law Library - 4Santa Cruz County Regional Transportation Commission - 23Santa Cruz Local Agency Formation Commission - 1Santa Cruz Metropolitan Transit District - 405Santa Fe Irrigation District - 57Santa Margarita Water District - 175Santa Maria Public Airport District - 17Santa Monica Community College District - 637Santa Nella County Water District - 6Santa Paula City Housing Authority - 9Santa Ynez River Water Conservation District, Improvement District No. 1 - 17Saratoga Fire Protection District - 30Sausalito-Marin City Sanitary District - 10School Risk & Insurance Management Group - 8Schools Excess Liability Fund - 11Schools Insurance Authority - 89Scotts Valley Fire Protection District - 30Scotts Valley Water District - 18Selma Cemetery District - 10Selma-Kingsburg-Fowler County Sanitation District - 33Serrano Water District - 14Sewer Authority Mid-Coastside - 21Sewerage Commission-Oroville Region - 10Shafter Wasco Irrigation District - 10Shasta Area Safety Communications Agency - 71Shasta Community Services District - 5Shasta Lake Fire Protection District - 12Shasta Local Agency Formation Commission - 2Shasta Mosquito & Vector Control District - 15Shasta Valley Cemetery District - 3Shiloh Public Cemetery District - 5Sierra Lakes County Water District - 5Sierra-Sacramento Valley Emergency Medical Services Agency - 11Silicon Valley Animal Control Authority - 19Silveyville Cemetery District - 5Solano County Mosquito Abatement District - 9Solano County Water Agency - 14Solano Irrigation District - 110Solano Transportation Authority - 22Soledad Community Health Care District - 0Sonoma County Library - 185Sonoma Marin Area Rail Transit District - 6Sonoma State Enterprises, Inc. - 13Sonoma Student Union Corporation - 12
Soquel Creek Water District - 45South Bay Regional Public Communications Authority - 95South Bayside System Authority - 77South Central Los Angeles Regional Center for Developmentally Disabled Persons - 328South Coast Water District - 106South East Regional Reclamation Authority - 0South Feather Water & Power Agency - 5South Kern Cemetery District - 4South Lake County Fire Protection District - 2South Orange County Wastewater Authority - 83South Placer Fire District - 68South Placer Municipal Utility District - 24South San Joaquin Irrigation District - 97South San Luis Obispo County Sanitation District - 13South Tahoe Public Utility District - 120Southeast Area Social Services Funding Authority - 75Southern California Association of Governments - 235Southern California Public Power Authority - 9Southern California Regional Rail Authority - 248Southern San Joaquin Municipal Utility District - 14Southern Sonoma County Resource Conservation District - 6 Southwest Transportation Agency - 149Special District Risk Management Authority - 25Squaw Valley Public Service District - 32Stallion Springs Community Services District - 17Stanislaus Consolidated Fire Protection District - 57Stanislaus County Housing Authority - 116State Bar of California - 833State Water Contractors - 9Stege Sanitary District - 14Stinson Beach County Water District - 12Stockton East Water District - 43Stockton Unifi ed School District - 1,527Strawberry Recreation District - 11Suisun Fire Protection District - 2Suisun Resource Conservation District - 13Suisun-Fairfi eld Cemetery District - 2Summit Cemetery District - 11Sunnyslope County Water District - 20Susanville Consolidated Sanitary District - 10Sutter Cemetery District - 16Sweetwater Authority - 170Sweetwater Springs Water District - 13Sylvan Cemetery District - 5Tahoe City Public Utility District - 62Tahoe Resource Conservation District - 35Tahoe Transportation District - 0Tahoe-Truckee Sanitation Agency - 68Tehachapi-Cummings County Water District - 21Tehachapi Valley Recreation & Park District - 4Tehama County Mosquito Abatement District - 7Templeton Community Services District - 23Thermalito Water & Sewer District - 12Three Arch Bay Community Services District - 0Three Rivers Community Services District - 1Three Valleys Municipal Water District - 27Tiburon Fire Protection District - 27
Districts & Other Public Agencies
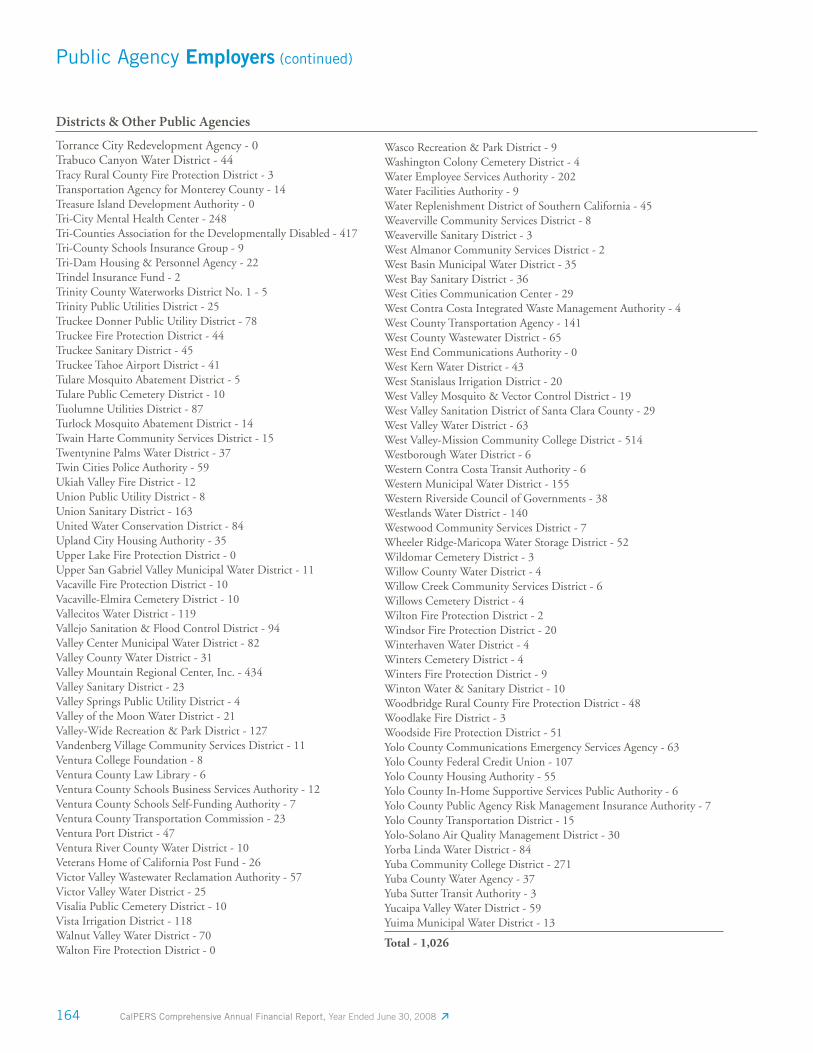
164 CalPERS Comprehensive Annual Financial Report, Year Ended June 30, 2008
Public Agency Employers (continued)
Torrance City Redevelopment Agency - 0Trabuco Canyon Water District - 44Tracy Rural County Fire Protection District - 3Transportation Agency for Monterey County - 14Treasure Island Development Authority - 0Tri-City Mental Health Center - 248Tri-Counties Association for the Developmentally Disabled - 417Tri-County Schools Insurance Group - 9Tri-Dam Housing & Personnel Agency - 22Trindel Insurance Fund - 2Trinity County Waterworks District No. 1 - 5Trinity Public Utilities District - 25Truckee Donner Public Utility District - 78Truckee Fire Protection District - 44Truckee Sanitary District - 45Truckee Tahoe Airport District - 41Tulare Mosquito Abatement District - 5Tulare Public Cemetery District - 10Tuolumne Utilities District - 87Turlock Mosquito Abatement District - 14Twain Harte Community Services District - 15Twentynine Palms Water District - 37Twin Cities Police Authority - 59Ukiah Valley Fire District - 12Union Public Utility District - 8Union Sanitary District - 163United Water Conservation District - 84Upland City Housing Authority - 35Upper Lake Fire Protection District - 0Upper San Gabriel Valley Municipal Water District - 11Vacaville Fire Protection District - 10Vacaville-Elmira Cemetery District - 10Vallecitos Water District - 119Vallejo Sanitation & Flood Control District - 94Valley Center Municipal Water District - 82Valley County Water District - 31Valley Mountain Regional Center, Inc. - 434Valley Sanitary District - 23Valley Springs Public Utility District - 4Valley of the Moon Water District - 21Valley-Wide Recreation & Park District - 127Vandenberg Village Community Services District - 11Ventura College Foundation - 8Ventura County Law Library - 6Ventura County Schools Business Services Authority - 12Ventura County Schools Self-Funding Authority - 7Ventura County Transportation Commission - 23Ventura Port District - 47Ventura River County Water District - 10Veterans Home of California Post Fund - 26Victor Valley Wastewater Reclamation Authority - 57Victor Valley Water District - 25Visalia Public Cemetery District - 10Vista Irrigation District - 118Walnut Valley Water District - 70Walton Fire Protection District - 0
Wasco Recreation & Park District - 9Washington Colony Cemetery District - 4Water Employee Services Authority - 202Water Facilities Authority - 9Water Replenishment District of Southern California - 45Weaverville Community Services District - 8Weaverville Sanitary District - 3West Almanor Community Services District - 2West Basin Municipal Water District - 35West Bay Sanitary District - 36West Cities Communication Center - 29West Contra Costa Integrated Waste Management Authority - 4West County Transportation Agency - 141West County Wastewater District - 65West End Communications Authority - 0West Kern Water District - 43West Stanislaus Irrigation District - 20West Valley Mosquito & Vector Control District - 19West Valley Sanitation District of Santa Clara County - 29West Valley Water District - 63West Valley-Mission Community College District - 514Westborough Water District - 6Western Contra Costa Transit Authority - 6Western Municipal Water District - 155Western Riverside Council of Governments - 38Westlands Water District - 140Westwood Community Services District - 7Wheeler Ridge-Maricopa Water Storage District - 52Wildomar Cemetery District - 3Willow County Water District - 4Willow Creek Community Services District - 6Willows Cemetery District - 4Wilton Fire Protection District - 2Windsor Fire Protection District - 20Winterhaven Water District - 4Winters Cemetery District - 4Winters Fire Protection District - 9Winton Water & Sanitary District - 10Woodbridge Rural County Fire Protection District - 48Woodlake Fire District - 3Woodside Fire Protection District - 51Yolo County Communications Emergency Services Agency - 63Yolo County Federal Credit Union - 107Yolo County Housing Authority - 55Yolo County In-Home Supportive Services Public Authority - 6Yolo County Public Agency Risk Management Insurance Authority - 7Yolo County Transportation District - 15Yolo-Solano Air Quality Management District - 30Yorba Linda Water District - 84Yuba Community College District - 271Yuba County Water Agency - 37Yuba Sutter Transit Authority - 3Yucaipa Valley Water District - 59Yuima Municipal Water District - 13
Total - 1,026
Districts & Other Public Agencies
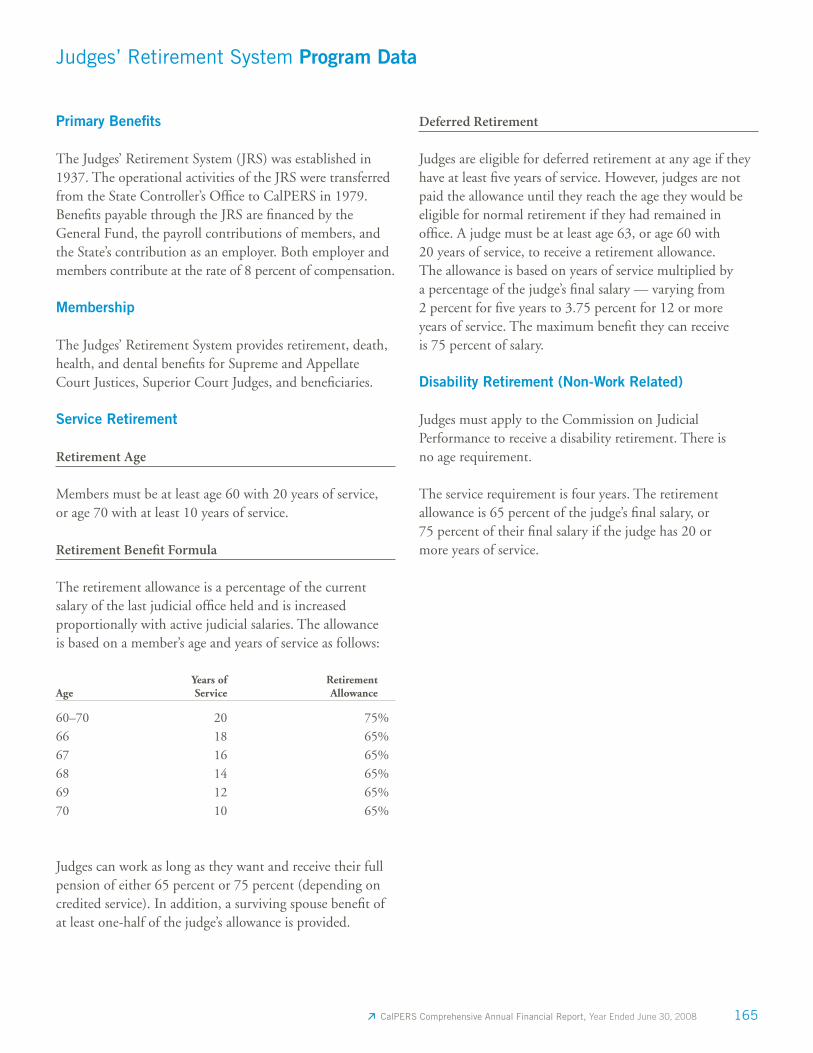
CalPERS Comprehensive Annual Financial Report, Year Ended June 30, 2008 165
Primary Benefi ts
The Judges’ Retirement System (JRS) was established in 1937. The operational activities of the JRS were transferred from the State Controller’s Offi ce to CalPERS in 1979. Benefi ts payable through the JRS are fi nanced by the General Fund, the payroll contributions of members, and the State’s contribu tion as an employer. Both employer and members contribute at the rate of 8 percent of compensation.
Membership
The Judges’ Retirement System provides retirement, death, health, and dental benefi ts for Supreme and Appellate Court Justices, Superior Court Judges, and benefi ciaries.
Service Retirement
Retirement Age
Members must be at least age 60 with 20 years of service, or age 70 with at least 10 years of service.
Retirement Benefi t Formula
The retirement allowance is a percentage of the current salary of the last judicial offi ce held and is increased proportionally with active judicial salaries. The allowance is based on a member’s age and years of service as follows:
AgeYears of Service
Retirement Allowance
60–70 20 75%66 18 65%67 16 65%68 14 65%69 12 65%70 10 65%
Judges can work as long as they want and receive their full pension of either 65 percent or 75 percent (depending on credited service). In addition, a surviving spouse benefi t of at least one-half of the judge’s allowance is provided.
Deferred Retirement
Judges are eligible for deferred retirement at any age if they have at least fi ve years of service. However, judges are not paid the allowance until they reach the age they would be eligible for normal retirement if they had remained in offi ce. A judge must be at least age 63, or age 60 with 20 years of service, to receive a retirement allowance. The allow ance is based on years of service multiplied by a percentage of the judge’s fi nal salary — varying from 2 percent for fi ve years to 3.75 percent for 12 or more years of service. The maximum benefi t they can receive is 75 percent of salary.
Disability Retirement (Non-Work Related)
Judges must apply to the Commission on Judicial Performance to receive a disability retirement. There is no age requirement.
The service requirement is four years. The retirement allowance is 65 percent of the judge’s fi nal salary, or 75 percent of their fi nal salary if the judge has 20 or more years of service.
Judges’ Retirement System Program Data
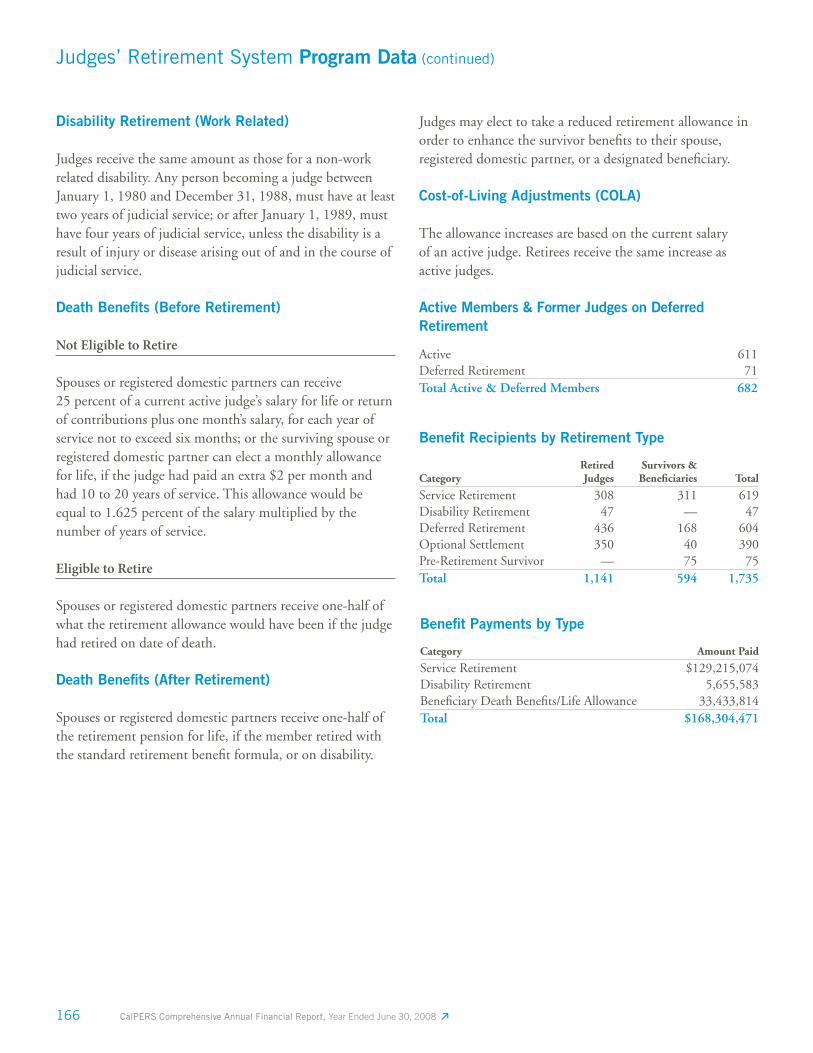
166 CalPERS Comprehensive Annual Financial Report, Year Ended June 30, 2008
Disability Retirement (Work Related)
Judges receive the same amount as those for a non-work related disability. Any person becoming a judge between January 1, 1980 and December 31, 1988, must have at least two years of judicial service; or after January 1, 1989, must have four years of judicial service, unless the disability is a result of injury or disease arising out of and in the course of judicial service.
Death Benefi ts (Before Retirement)
Not Eligible to Retire
Spouses or registered domestic partners can receive 25 percent of a current active judge’s salary for life or return of contributions plus one month’s salary, for each year of service not to exceed six months; or the surviving spouse or registered domestic partner can elect a monthly allowance for life, if the judge had paid an extra $2 per month and had 10 to 20 years of service. This allowance would be equal to 1.625 percent of the salary multi plied by the number of years of service.
Eligible to Retire
Spouses or registered domestic partners receive one-half of what the retirement allowance would have been if the judge had retired on date of death.
Death Benefi ts (After Retirement)
Spouses or registered domestic partners receive one-half of the retirement pension for life, if the member retired with the standard retire ment benefi t formula, or on disability.
Active Members & Former Judges on Deferred Retirement
Active 611Deferred Retirement 71Total Active & Deferred Members 682
Benefi t Recipients by Retirement Type
CategoryRetired Judges
Survivors & Benefi ciaries Total
Service Retirement 308 311 619Disability Retirement 47 — 47Deferred Retirement 436 168 604Optional Settlement 350 40 390Pre-Retirement Survivor — 75 75Total 1,141 594 1,735
Benefi t Payments by Type
Category Amount Paid
Service Retirement $129,215,074Disability Retirement 5,655,583Benefi ciary Death Benefi ts/Life Allowance 33,433,814Total $168,304,471
Judges’ Retirement System Program Data (continued)
Judges may elect to take a reduced retirement allowance in order to enhance the survivor benefi ts to their spouse, registered domestic partner, or a designated benefi ciary.
Cost-of-Living Adjustments (COLA)
The allowance increases are based on the current salary of an active judge. Retirees receive the same increase as active judges.
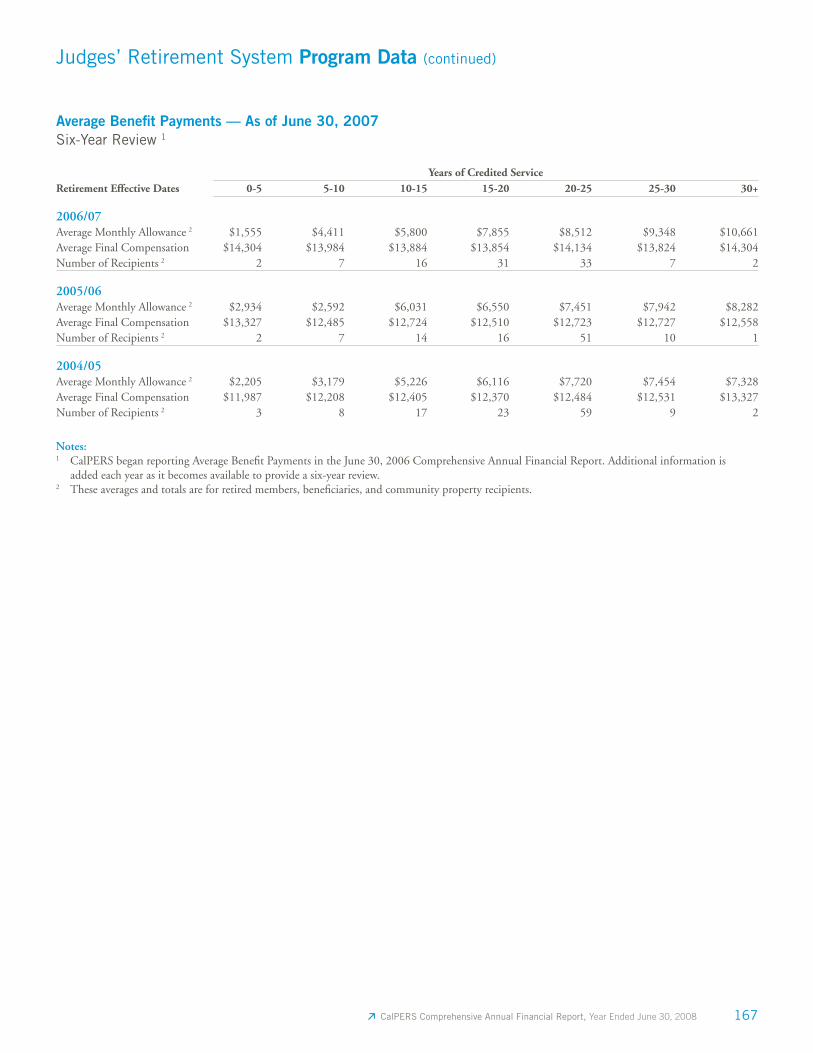
CalPERS Comprehensive Annual Financial Report, Year Ended June 30, 2008 167
Judges’ Retirement System Program Data (continued)
Average Benefi t Payments — As of June 30, 2007Six-Year Review 1
Years of Credited ServiceRetirement Effective Dates 0-5 5-10 10-15 15-20 20-25 25-30 30+
2006/07Average Monthly Allowance 2 $1,555 $4,411 $5,800 $7,855 $8,512 $9,348 $10,661Average Final Compensation $14,304 $13,984 $13,884 $13,854 $14,134 $13,824 $14,304Number of Recipients 2 2 7 16 31 33 7 2
2005/06Average Monthly Allowance 2 $2,934 $2,592 $6,031 $6,550 $7,451 $7,942 $8,282Average Final Compensation $13,327 $12,485 $12,724 $12,510 $12,723 $12,727 $12,558Number of Recipients 2 2 7 14 16 51 10 1
2004/05Average Monthly Allowance 2 $2,205 $3,179 $5,226 $6,116 $7,720 $7,454 $7,328Average Final Compensation $11,987 $12,208 $12,405 $12,370 $12,484 $12,531 $13,327Number of Recipients 2 3 8 17 23 59 9 2
Notes:1 CalPERS began reporting Average Benefi t Payments in the June 30, 2006 Comprehensive Annual Financial Report. Additional information is
added each year as it becomes available to provide a six-year review.2 These averages and totals are for retired members, benefi ciaries, and community property recipients.
168 CalPERS Comprehensive Annual Financial Report, Year Ended June 30, 2008
Primary Benefi ts
The Judges’ Retirement System II (JRS II) was established in 1994 to create a fully funded, actuarially sound retirement system for judges appointed or elected on or after November 9, 1994. This system provides a unique combination of two basic types of retirement benefi ts: a defi ned benefi t plan and a monetary credit plan. The defi ned benefi t plan provides a lifetime monthly retirement allowance of up to 75 percent of fi nal compensation. The monetary credit plan allows for a refund of member contributions, a portion of the employer contributions, and interest. Members contribute at the rate of 8 percent of compensation.
Membership
The JRS II provides retirement, death, health, and dental benefi ts for Supreme and Appellate Court Justices, and Superior Court Judges, fi rst appointed or elected after November 9, 1994, and their benefi ciaries.
Service Retirement
Retirement Age
Judges must be at least age 65 with 20 years of service or age 70 with a minimum of fi ve years of service to receive the defi ned benefi t plan. Judges must have at least fi ve years of service to receive the monetary credit plan.
Retirement Formula
Defi ned Benefi t Plan
This option provides a defi ned benefi t of 3.75 percent of the highest 12-month average salary per year of service, up to 75 percent for judges reaching age 65 with at least 20 years of service. Optional settlements are available which reduce a judge’s retirement allowance to provide a lifetime benefi t for a surviving spouse upon death of the judge.
Monetary Credit Plan
This option provides a cash payment in a single lump sum, or the member may elect to receive an annuity at retirement based on the accumulated contributions of the employee and the employer. To receive the annuity a judge must meet the minimum qualifi cations required under the defi ned benefi t plan. Lifetime benefi ts are not provided under this plan.
Disability Retirement (Non-Work Related)
Judges who have fi ve years of service and become permanently disabled because of a mental or physical disability may apply to the Commission on Judicial Performance for disability retirement.
An allowance is based on the judge’s age and will be the amount equal to the lower of the following:• the monthly benefit of 3.75 percent of the final
compen sation multiplied by the number of years of service the judge would have been credited had the judge continued to work until the age the judge would have first been eligible to retire, or
• 65 percent of the judge’s average monthly salary during the 12 months preceding the retirement date.
Disability Retirement (Work Related)
Judges receive 65 percent of their average monthly salary during the 12 months preceding their retirement date, regardless of age or length of service.
Judges’ Retirement System II Program Data
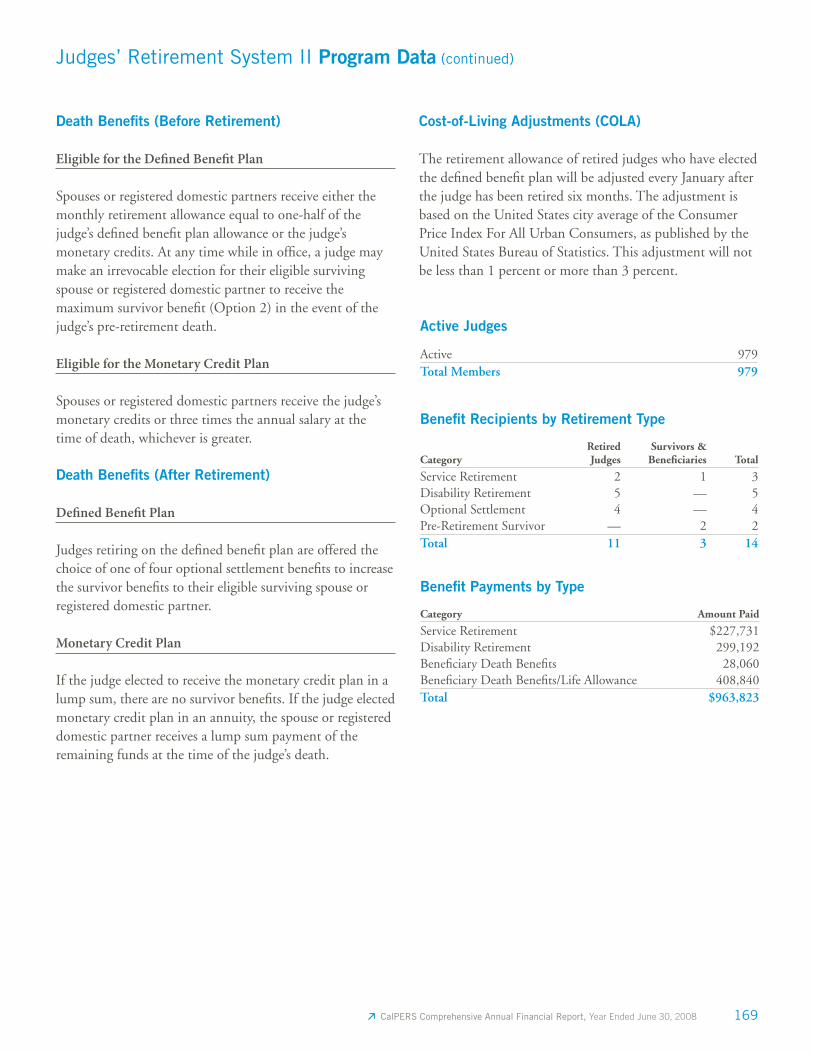
CalPERS Comprehensive Annual Financial Report, Year Ended June 30, 2008 169
Death Benefi ts (Before Retirement)
Eligible for the Defi ned Benefi t Plan
Spouses or registered domestic partners receive either the monthly retirement allowance equal to one-half of the judge’s defi ned benefi t plan allowance or the judge’s monetary credits. At any time while in offi ce, a judge may make an irrevocable election for their eligible surviving spouse or registered domestic partner to receive the maximum survivor benefi t (Option 2) in the event of the judge’s pre-retirement death.
Eligible for the Monetary Credit Plan
Spouses or registered domestic partners receive the judge’s monetary credits or three times the annual salary at the time of death, whichever is greater.
Death Benefi ts (After Retirement)
Defi ned Benefi t Plan
Judges retiring on the defi ned benefi t plan are offered the choice of one of four optional settlement benefi ts to increase the survivor benefi ts to their eligible surviving spouse or registered domestic partner.
Monetary Credit Plan
If the judge elected to receive the monetary credit plan in a lump sum, there are no survivor benefi ts. If the judge elected monetary credit plan in an annuity, the spouse or registered domestic partner receives a lump sum payment of the remaining funds at the time of the judge’s death.
Active Judges
Active 979Total Members 979
Benefi t Recipients by Retirement Type
CategoryRetired Judges
Survivors & Benefi ciaries Total
Service Retirement 2 1 3Disability Retirement 5 — 5Optional Settlement 4 — 4Pre-Retirement Survivor — 2 2Total 11 3 14
Benefi t Payments by Type
Category Amount Paid
Service Retirement $227,731Disability Retirement 299,192Benefi ciary Death Benefi ts 28,060Benefi ciary Death Benefi ts/Life Allowance 408,840Total $963,823
Judges’ Retirement System II Program Data (continued)
Cost-of-Living Adjustments (COLA)
The retirement allowance of retired judges who have elected the defi ned benefi t plan will be adjusted every January after the judge has been retired six months. The adjustment is based on the United States city average of the Consumer Price Index For All Urban Consumers, as published by the United States Bureau of Statistics. This adjustment will not be less than 1 percent or more than 3 percent.
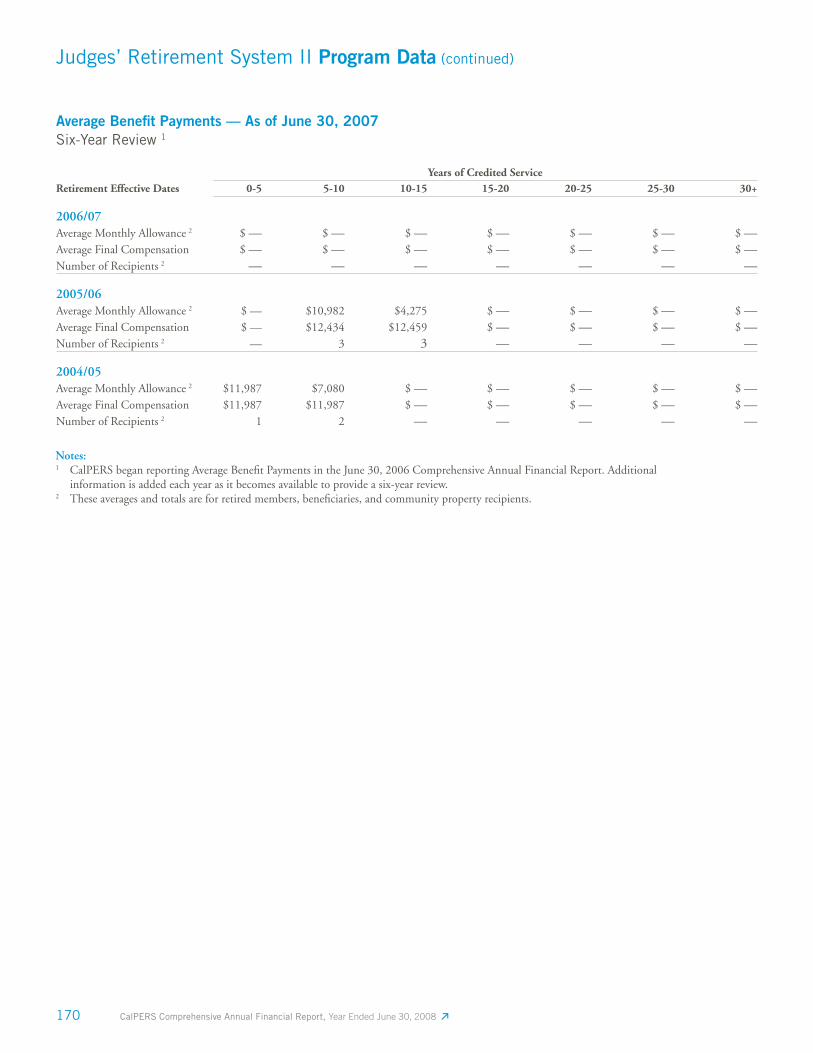
170 CalPERS Comprehensive Annual Financial Report, Year Ended June 30, 2008
Judges’ Retirement System II Program Data (continued)
Average Benefi t Payments — As of June 30, 2007 Six-Year Review 1
Years of Credited ServiceRetirement Effective Dates 0-5 5-10 10-15 15-20 20-25 25-30 30+
2006/07Average Monthly Allowance 2 $ — $ — $ — $ — $ — $ — $ —Average Final Compensation $ — $ — $ — $ — $ — $ — $ —Number of Recipients 2 — — — — — — —
2005/06Average Monthly Allowance 2 $ — $10,982 $4,275 $ — $ — $ — $ —Average Final Compensation $ — $12,434 $12,459 $ — $ — $ — $ —Number of Recipients 2 — 3 3 — — — —
2004/05Average Monthly Allowance 2 $11,987 $7,080 $ — $ — $ — $ — $ —Average Final Compensation $11,987 $11,987 $ — $ — $ — $ — $ —Number of Recipients 2 1 2 — — — — —
Notes:1 CalPERS began reporting Average Benefi t Payments in the June 30, 2006 Comprehensive Annual Financial Report. Additional
information is added each year as it becomes available to provide a six-year review.2 These averages and totals are for retired members, benefi ciaries, and community property recipients.
CalPERS Comprehensive Annual Financial Report, Year Ended June 30, 2008 171
Primary Benefi ts
CalPERS has administered the Legislators’ Retirement System (LRS) since its inception in 1947. The duties of the Board with respect to admin is tering the LRS are the same as for CalPERS on such items as determining membership and benefi t rights, making investments, crediting interest, and obtaining information necessary for administration.
Benefi ts payable by the LRS are fi nanced through member contributions, the State’s contribution as an employer, and interest earned on investments. The employer statutory contribution rate was eliminated in January 2000, and the CalPERS Board is now authorized to establish actuarially determined rates.
When the actuarial value of the assets exceeds the present value of benefi ts, resulting in a 0 percent employer contribution rate, the Board may reduce the member contribution rates for the same fi scal year in which the State rate is 0 percent. For fi scal year 2007-08, the Board has determined that both the employer rate and the member rate will be 0 percent. Interest credited to the member’s accounts is the net earnings rate of investments.
Proposition 140
Proposition 140, the Political Reform Act of 1990, requires that Legislators (Senators and Members of the Assembly) fi rst elected after November 7, 1990 participate in the federal Social Security program and in no other retire ment system.
Membership
Members of the Legislature serving prior to November 7, 1990, elected Constitutional Offi cers, and Legislative Statutory Offi cers are eligible for benefi ts.
Service Retirement
Retirement Age
The retirement age is 60, with four or more years of service credit, or any age with 20 or more years. The retirement age for Legislative Statutory Offi cers is 55, or any age with 20 years or more of service credit.
Members of the Legislature Benefi t Formula
The retirement formula consists of three separate formulas that are totaled together to provide the members with their allowance. The fi rst part of the formula consists of 5 percent of the fi rst $500 of salary up to 15 years of service. The second part is 3 percent per year of the same $500 of salary for years in excess of 15 years. And fi nally, total years of service is multiplied by 3 percent per year of their salary above $500. In no case may a member receive more than two-thirds of their salary.
Constitutional Offi cers’ Benefi t Formula
Five percent per year of service up to eight years (40 percent) of their highest salary. If the member has 24 or more years of service, the retirement allowance is 60 percent of their fi nal salary.
Statutory Offi cers’ Benefi t Formula
Statutory Offi cers receive 3 percent per year of service, not to exceed 66 percent of fi nal monthly compensation.
Early Retirement Options for Members of the Legislature
& Constitutional Offi cers
Legislators and Constitutional Offi cers may retire before age 60 with 15 years of service. However, their retirement allowance is reduced by 2 percent for each year they retire before age 60.
Legislators’ Retirement System Program Data
172 CalPERS Comprehensive Annual Financial Report, Year Ended June 30, 2008
Disability Retirement
Disability retirement uses the same formula as service retirement. There is no reduction if retirement is before age 60 for members of the Legislature.
Death Benefi ts (Before Retirement)
Not Eligible to Retire
One month’s salary for each year of service, plus the return of the member’s contributions with interest payable to a survivor.
Eligible to Retire
If the member has elected one of the optional settlements, their benefi ciary will receive the benefi t provided by the option selected, calculated as if the date of death had been the date of retirement. In lieu of this benefi t, the benefi ciary may elect an allowance of one-half the unmodifi ed retirement allowance, payable until death or remarriage.
Death Benefi ts While in Offi ce
Benefi ciaries receive a lump sum benefi t in an amount equal to the annual compensation of an LRS member during the 12 months preceding the member’s death, regardless of whether the member was eligible to retire.
Death Benefi ts (After Retirement)
Members choose between one of four options. The level of survivor benefi t is based on the option chosen, without a reduction in allowance for members of the Legislature. Constitutional Offi cers and Statutory Offi cers receive a reduced allowance based on their age at time of retirement and the option they choose. Benefi ciaries also receive a $600 lump sum payment.
Cost-of-Living Adjustments (COLA)
The annual COLA is determined by the Consumer Price Index.
Legislators’ Retirement System Program Data (continued)
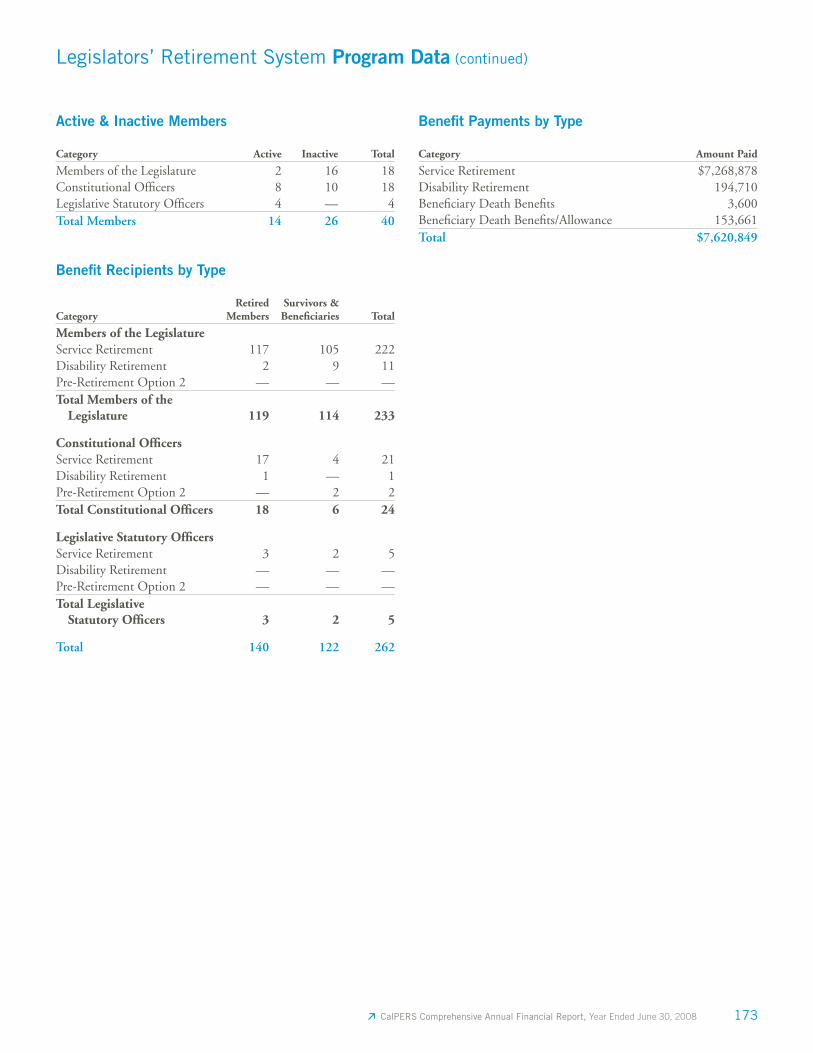
CalPERS Comprehensive Annual Financial Report, Year Ended June 30, 2008 173
Active & Inactive Members
Category Active Inactive Total
Members of the Legislature 2 16 18Constitutional Offi cers 8 10 18Legislative Statutory Offi cers 4 — 4Total Members 14 26 40
Benefi t Recipients by Type
CategoryRetired
MembersSurvivors & Benefi ciaries Total
Members of the LegislatureService Retirement 117 105 222Disability Retirement 2 9 11Pre-Retirement Option 2 — — —Total Members of the Legislature 119 114 233
Constitutional Offi cersService Retirement 17 4 21Disability Retirement 1 — 1Pre-Retirement Option 2 — 2 2Total Constitutional Offi cers 18 6 24
Legislative Statutory Offi cersService Retirement 3 2 5Disability Retirement — — —Pre-Retirement Option 2 — — —Total Legislative Statutory Offi cers 3 2 5
Total 140 122 262
Benefi t Payments by Type
Category Amount Paid
Service Retirement $7,268,878Disability Retirement 194,710Benefi ciary Death Benefi ts 3,600Benefi ciary Death Benefi ts/Allowance 153,661Total $7,620,849
Legislators’ Retirement System Program Data (continued)
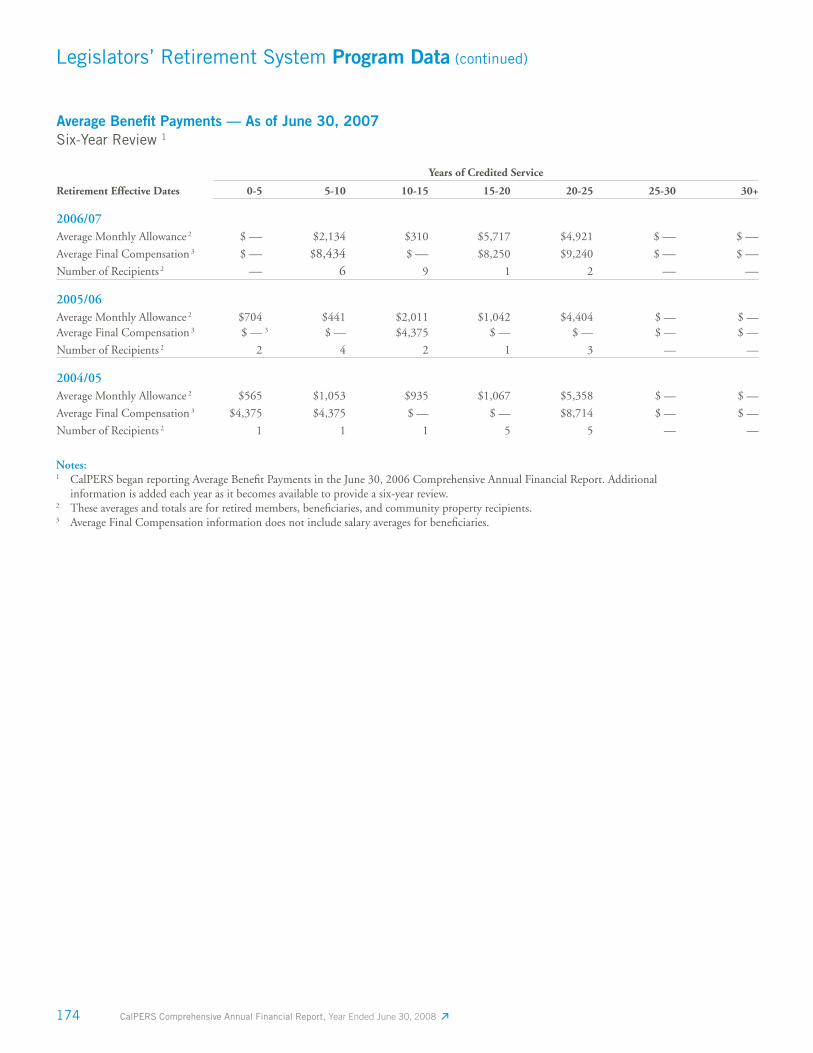
174 CalPERS Comprehensive Annual Financial Report, Year Ended June 30, 2008
Legislators’ Retirement System Program Data (continued)
Average Benefi t Payments — As of June 30, 2007Six-Year Review 1
Years of Credited Service
Retirement Effective Dates 0-5 5-10 10-15 15-20 20-25 25-30 30+
2006/07Average Monthly Allowance 2 $ — $2,134 $310 $5,717 $4,921 $ — $ —Average Final Compensation 3 $ — $8,434 $ — $8,250 $9,240 $ — $ —Number of Recipients 2 — 6 9 1 2 — —
2005/06Average Monthly Allowance 2 $704 $441 $2,011 $1,042 $4,404 $ — $ —Average Final Compensation 3 $ — 3 $ — $4,375 $ — $ — $ — $ —
Number of Recipients 2 2 4 2 1 3 — —
2004/05Average Monthly Allowance 2 $565 $1,053 $935 $1,067 $5,358 $ — $ —
Average Final Compensation 3 $4,375 $4,375 $ — $ — $8,714 $ — $ —
Number of Recipients 2 1 1 1 5 5 — —
Notes:1 CalPERS began reporting Average Benefi t Payments in the June 30, 2006 Comprehensive Annual Financial Report. Additional
information is added each year as it becomes available to provide a six-year review.2 These averages and totals are for retired members, benefi ciaries, and community property recipients.3 Average Final Compensation information does not include salary averages for benefi ciaries.

Statistical Section Other Programs
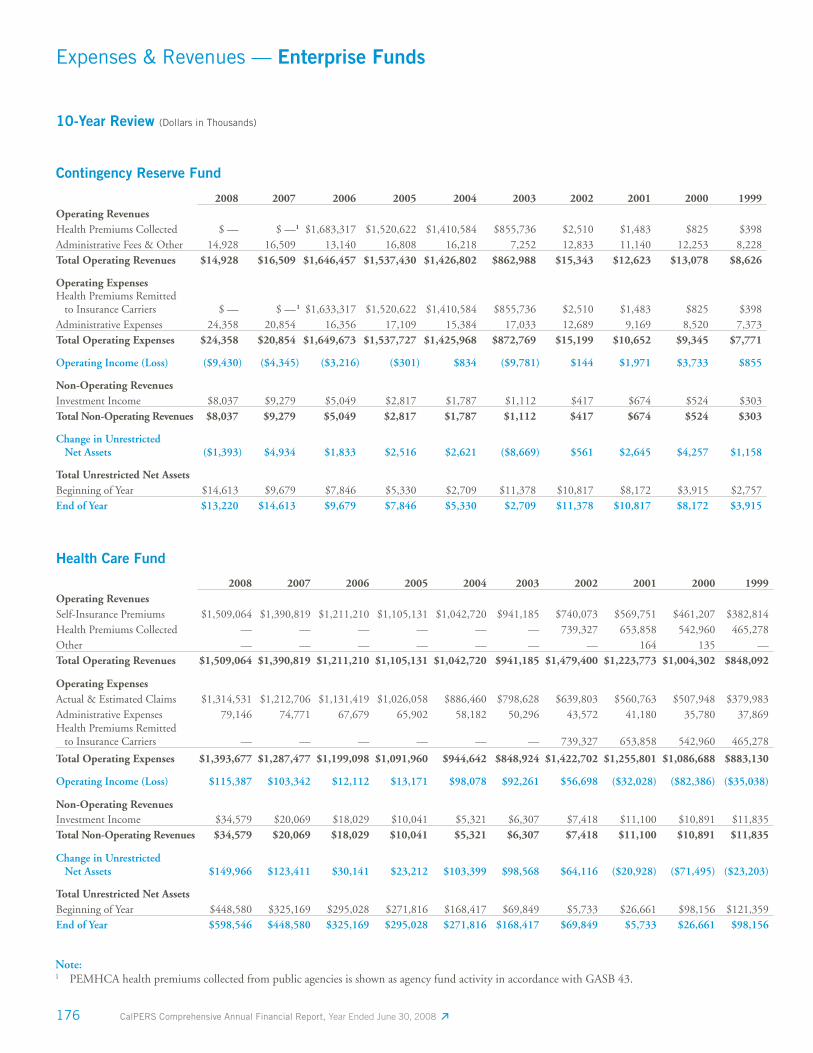
176 CalPERS Comprehensive Annual Financial Report, Year Ended June 30, 2008
Contingency Reserve Fund
2008 2007 2006 2005 2004 2003 2002 2001 2000 1999Operating RevenuesHealth Premiums Collected $ — $ —1 $1,683,317 $1,520,622 $1,410,584 $855,736 $2,510 $1,483 $825 $398Administrative Fees & Other 14,928 16,509 13,140 16,808 16,218 7,252 12,833 11,140 12,253 8,228Total Operating Revenues $14,928 $16,509 $1,646,457 $1,537,430 $1,426,802 $862,988 $15,343 $12,623 $13,078 $8,626
Operating Expenses Health Premiums Remitted to Insurance Carriers $ — $ — 1 $1,633,317 $1,520,622 $1,410,584 $855,736 $2,510 $1,483 $825 $398Administrative Expenses 24,358 20,854 16,356 17,109 15,384 17,033 12,689 9,169 8,520 7,373Total Operating Expenses $24,358 $20,854 $1,649,673 $1,537,727 $1,425,968 $872,769 $15,199 $10,652 $9,345 $7,771
Operating Income (Loss) ($9,430) ($4,345) ($3,216) ($301) $834 ($9,781) $144 $1,971 $3,733 $855
Non-Operating RevenuesInvestment Income $8,037 $9,279 $5,049 $2,817 $1,787 $1,112 $417 $674 $524 $303Total Non-Operating Revenues $8,037 $9,279 $5,049 $2,817 $1,787 $1,112 $417 $674 $524 $303
Change in Unrestricted Net Assets ($1,393) $4,934 $1,833 $2,516 $2,621 ($8,669) $561 $2,645 $4,257 $1,158
Total Unrestricted Net AssetsBeginning of Year $14,613 $9,679 $7,846 $5,330 $2,709 $11,378 $10,817 $8,172 $3,915 $2,757End of Year $13,220 $14,613 $9,679 $7,846 $5,330 $2,709 $11,378 $10,817 $8,172 $3,915
Expenses & Revenues — Enterprise Funds
Health Care Fund
2008 2007 2006 2005 2004 2003 2002 2001 2000 1999Operating RevenuesSelf-Insurance Premiums $1,509,064 $1,390,819 $1,211,210 $1,105,131 $1,042,720 $941,185 $740,073 $569,751 $461,207 $382,814Health Premiums Collected — — — — — — 739,327 653,858 542,960 465,278Other — — — — — — — 164 135 — Total Operating Revenues $1,509,064 $1,390,819 $1,211,210 $1,105,131 $1,042,720 $941,185 $1,479,400 $1,223,773 $1,004,302 $848,092
Operating Expenses Actual & Estimated Claims $1,314,531 $1,212,706 $1,131,419 $1,026,058 $886,460 $798,628 $639,803 $560,763 $507,948 $379,983Administrative Expenses 79,146 74,771 67,679 65,902 58,182 50,296 43,572 41,180 35,780 37,869Health Premiums Remitted to Insurance Carriers — — — — — — 739,327 653,858 542,960 465,278
Total Operating Expenses $1,393,677 $1,287,477 $1,199,098 $1,091,960 $944,642 $848,924 $1,422,702 $1,255,801 $1,086,688 $883,130
Operating Income (Loss) $115,387 $103,342 $12,112 $13,171 $98,078 $92,261 $56,698 ($32,028) ($82,386) ($35,038)
Non-Operating RevenuesInvestment Income $34,579 $20,069 $18,029 $10,041 $5,321 $6,307 $7,418 $11,100 $10,891 $11,835Total Non-Operating Revenues $34,579 $20,069 $18,029 $10,041 $5,321 $6,307 $7,418 $11,100 $10,891 $11,835
Change in Unrestricted Net Assets $149,966 $123,411 $30,141 $23,212 $103,399 $98,568 $64,116 ($20,928) ($71,495) ($23,203)
Total Unrestricted Net AssetsBeginning of Year $448,580 $325,169 $295,028 $271,816 $168,417 $69,849 $5,733 $26,661 $98,156 $121,359End of Year $598,546 $448,580 $325,169 $295,028 $271,816 $168,417 $69,849 $5,733 $26,661 $98,156
10-Year Review (Dollars in Thousands)
Note:1 PEMHCA health premiums collected from public agencies is shown as agency fund activity in accordance with GASB 43.
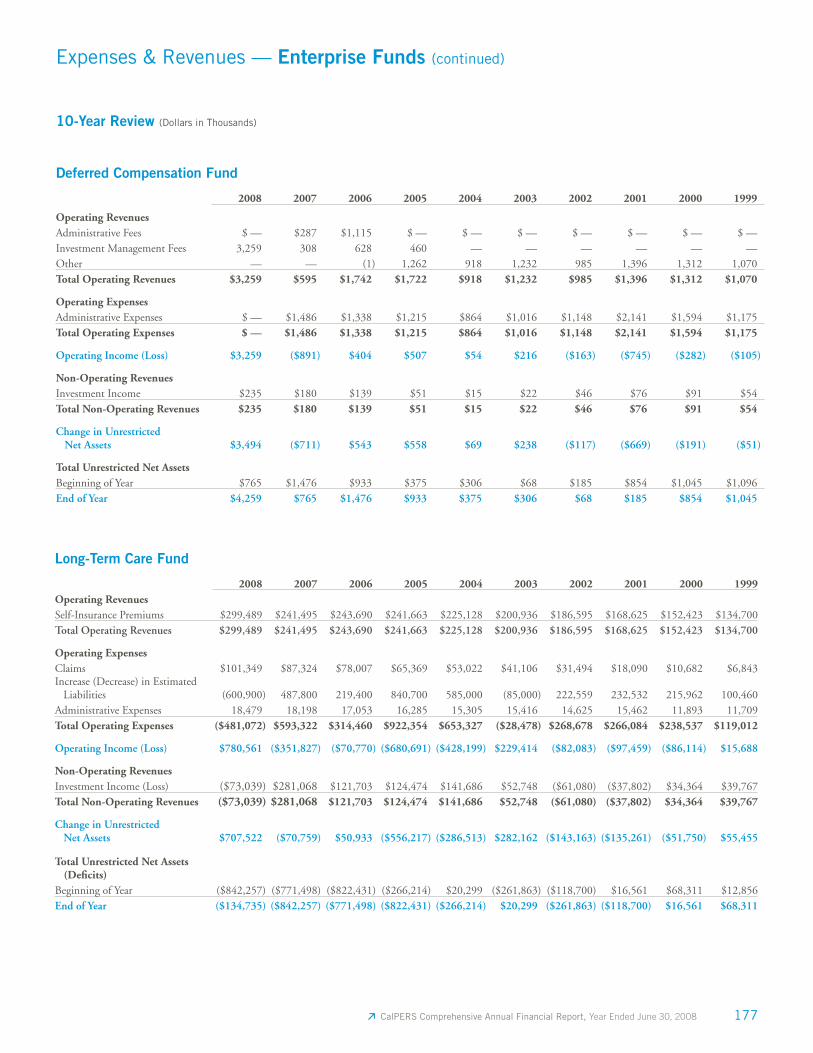
177 CalPERS Comprehensive Annual Financial Report, Year Ended June 30, 2008
Deferred Compensation Fund
2008 2007 2006 2005 2004 2003 2002 2001 2000 1999
Operating RevenuesAdministrative Fees $ — $287 $1,115 $ — $ — $ — $ — $ — $ — $ —Investment Management Fees 3,259 308 628 460 — — — — — —Other — — (1) 1,262 918 1,232 985 1,396 1,312 1,070Total Operating Revenues $3,259 $595 $1,742 $1,722 $918 $1,232 $985 $1,396 $1,312 $1,070
Operating Expenses Administrative Expenses $ — $1,486 $1,338 $1,215 $864 $1,016 $1,148 $2,141 $1,594 $1,175Total Operating Expenses $ — $1,486 $1,338 $1,215 $864 $1,016 $1,148 $2,141 $1,594 $1,175
Operating Income (Loss) $3,259 ($891) $404 $507 $54 $216 ($163) ($745) ($282) ($105)
Non-Operating RevenuesInvestment Income $235 $180 $139 $51 $15 $22 $46 $76 $91 $54Total Non-Operating Revenues $235 $180 $139 $51 $15 $22 $46 $76 $91 $54
Change in Unrestricted Net Assets $3,494 ($711) $543 $558 $69 $238 ($117) ($669) ($191) ($51)
Total Unrestricted Net AssetsBeginning of Year $765 $1,476 $933 $375 $306 $68 $185 $854 $1,045 $1,096End of Year $4,259 $765 $1,476 $933 $375 $306 $68 $185 $854 $1,045
Expenses & Revenues — Enterprise Funds (continued)
Long-Term Care Fund
2008 2007 2006 2005 2004 2003 2002 2001 2000 1999Operating RevenuesSelf-Insurance Premiums $299,489 $241,495 $243,690 $241,663 $225,128 $200,936 $186,595 $168,625 $152,423 $134,700Total Operating Revenues $299,489 $241,495 $243,690 $241,663 $225,128 $200,936 $186,595 $168,625 $152,423 $134,700
Operating Expenses Claims $101,349 $87,324 $78,007 $65,369 $53,022 $41,106 $31,494 $18,090 $10,682 $6,843Increase (Decrease) in Estimated Liabilities (600,900) 487,800 219,400 840,700 585,000 (85,000) 222,559 232,532 215,962 100,460Administrative Expenses 18,479 18,198 17,053 16,285 15,305 15,416 14,625 15,462 11,893 11,709Total Operating Expenses ($481,072) $593,322 $314,460 $922,354 $653,327 ($28,478) $268,678 $266,084 $238,537 $119,012
Operating Income (Loss) $780,561 ($351,827) ($70,770) ($680,691) ($428,199) $229,414 ($82,083) ($97,459) ($86,114) $15,688
Non-Operating RevenuesInvestment Income (Loss) ($73,039) $281,068 $121,703 $124,474 $141,686 $52,748 ($61,080) ($37,802) $34,364 $39,767Total Non-Operating Revenues ($73,039) $281,068 $121,703 $124,474 $141,686 $52,748 ($61,080) ($37,802) $34,364 $39,767
Change in Unrestricted Net Assets $707,522 ($70,759) $50,933 ($556,217) ($286,513) $282,162 ($143,163) ($135,261) ($51,750) $55,455
Total Unrestricted Net Assets (Defi cits)Beginning of Year ($842,257) ($771,498) ($822,431) ($266,214) $20,299 ($261,863) ($118,700) $16,561 $68,311 $12,856End of Year ($134,735) ($842,257) ($771,498) ($822,431) ($266,214) $20,299 ($261,863) ($118,700) $16,561 $68,311
10-Year Review (Dollars in Thousands)
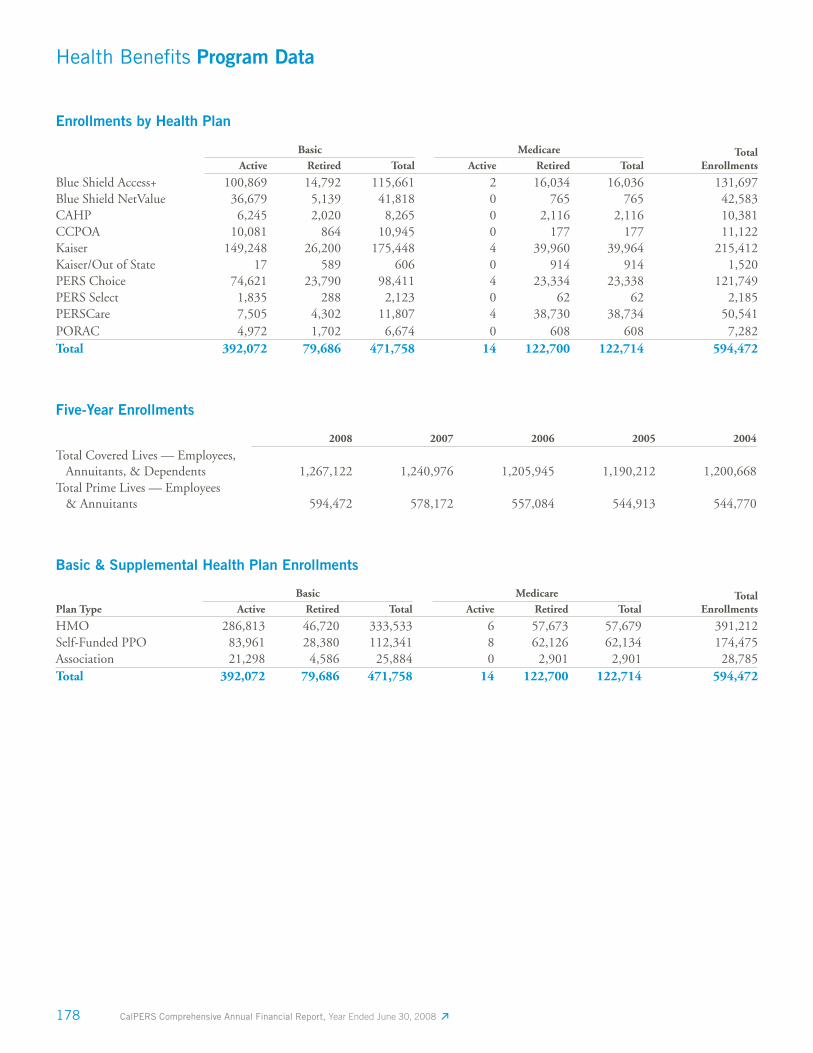
178 CalPERS Comprehensive Annual Financial Report, Year Ended June 30, 2008
Health Benefi ts Program Data
Enrollments by Health Plan
Basic Medicare Total EnrollmentsActive Retired Total Active Retired Total
Blue Shield Access+ 100,869 14,792 115,661 2 16,034 16,036 131,697Blue Shield NetValue 36,679 5,139 41,818 0 765 765 42,583CAHP 6,245 2,020 8,265 0 2,116 2,116 10,381CCPOA 10,081 864 10,945 0 177 177 11,122Kaiser 149,248 26,200 175,448 4 39,960 39,964 215,412Kaiser/Out of State 17 589 606 0 914 914 1,520PERS Choice 74,621 23,790 98,411 4 23,334 23,338 121,749PERS Select 1,835 288 2,123 0 62 62 2,185PERSCare 7,505 4,302 11,807 4 38,730 38,734 50,541PORAC 4,972 1,702 6,674 0 608 608 7,282Total 392,072 79,686 471,758 14 122,700 122,714 594,472
Five-Year Enrollments
2008 2007 2006 2005 2004
Total Covered Lives — Employees, Annuitants, & Dependents 1,267,122 1,240,976 1,205,945 1,190,212 1,200,668Total Prime Lives — Employees & Annuitants 594,472 578,172 557,084 544,913 544,770
Basic & Supplemental Health Plan Enrollments
Basic Medicare Total EnrollmentsPlan Type Active Retired Total Active Retired Total
HMO 286,813 46,720 333,533 6 57,673 57,679 391,212Self-Funded PPO 83,961 28,380 112,341 8 62,126 62,134 174,475Association 21,298 4,586 25,884 0 2,901 2,901 28,785Total 392,072 79,686 471,758 14 122,700 122,714 594,472
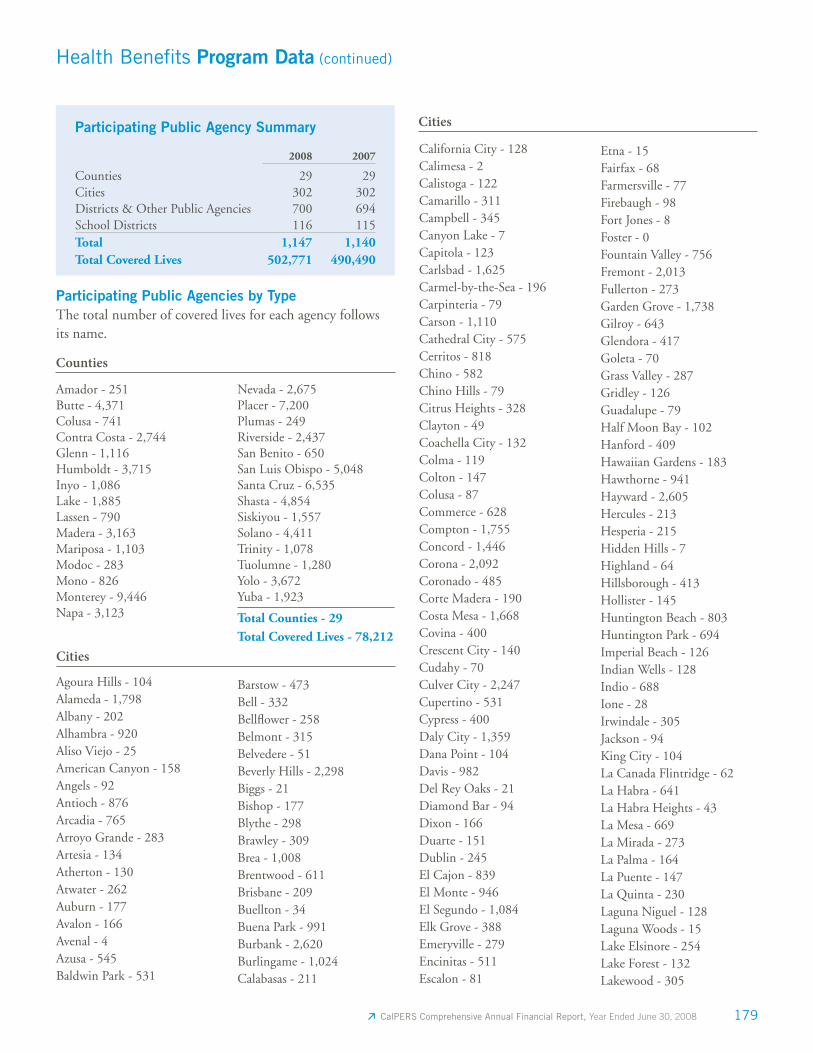
179 CalPERS Comprehensive Annual Financial Report, Year Ended June 30, 2008
Participating Public Agency Summary
2008 2007
Counties 29 29Cities 302 302Districts & Other Public Agencies 700 694School Districts 116 115Total 1,147 1,140Total Covered Lives 502,771 490,490
Participating Public Agencies by TypeThe total number of covered lives for each agency follows its name.
Amador - 251Butte - 4,371Colusa - 741Contra Costa - 2,744Glenn - 1,116Humboldt - 3,715Inyo - 1,086Lake - 1,885Lassen - 790Madera - 3,163Mariposa - 1,103Modoc - 283Mono - 826Monterey - 9,446Napa - 3,123
Nevada - 2,675Placer - 7,200Plumas - 249Riverside - 2,437San Benito - 650San Luis Obispo - 5,048Santa Cruz - 6,535Shasta - 4,854Siskiyou - 1,557Solano - 4,411Trinity - 1,078Tuolumne - 1,280Yolo - 3,672Yuba - 1,923
Total Counties - 29Total Covered Lives - 78,212
Agoura Hills - 104Alameda - 1,798Albany - 202Alhambra - 920Aliso Viejo - 25American Canyon - 158Angels - 92Antioch - 876Arcadia - 765Arroyo Grande - 283Artesia - 134Atherton - 130Atwater - 262Auburn - 177Avalon - 166Avenal - 4Azusa - 545Baldwin Park - 531
Barstow - 473Bell - 332Bellfl ower - 258Belmont - 315Belvedere - 51Beverly Hills - 2,298Biggs - 21Bishop - 177Blythe - 298Brawley - 309Brea - 1,008Brentwood - 611Brisbane - 209Buellton - 34Buena Park - 991Burbank - 2,620Burlingame - 1,024Calabasas - 211
California City - 128Calimesa - 2Calistoga - 122Camarillo - 311Campbell - 345Canyon Lake - 7Capitola - 123Carlsbad - 1,625Carmel-by-the-Sea - 196Carpinteria - 79Carson - 1,110Cathedral City - 575Cerritos - 818Chino - 582Chino Hills - 79Citrus Heights - 328Clayton - 49Coachella City - 132Colma - 119Colton - 147Colusa - 87Commerce - 628Compton - 1,755Concord - 1,446Corona - 2,092Coronado - 485Corte Madera - 190Costa Mesa - 1,668Covina - 400Crescent City - 140Cudahy - 70Culver City - 2,247Cupertino - 531Cypress - 400Daly City - 1,359Dana Point - 104Davis - 982Del Rey Oaks - 21Diamond Bar - 94Dixon - 166Duarte - 151Dublin - 245El Cajon - 839El Monte - 946El Segundo - 1,084Elk Grove - 388Emeryville - 279Encinitas - 511Escalon - 81
Etna - 15Fairfax - 68Farmersville - 77Firebaugh - 98Fort Jones - 8Foster - 0Fountain Valley - 756Fremont - 2,013Fullerton - 273Garden Grove - 1,738Gilroy - 643Glendora - 417Goleta - 70Grass Valley - 287Gridley - 126Guadalupe - 79Half Moon Bay - 102Hanford - 409Hawaiian Gardens - 183Hawthorne - 941Hayward - 2,605Hercules - 213Hesperia - 215Hidden Hills - 7Highland - 64Hillsborough - 413Hollister - 145Huntington Beach - 803Huntington Park - 694Imperial Beach - 126Indian Wells - 128Indio - 688Ione - 28Irwindale - 305Jackson - 94King City - 104La Canada Flintridge - 62La Habra - 641La Habra Heights - 43La Mesa - 669La Mirada - 273La Palma - 164La Puente - 147La Quinta - 230Laguna Niguel - 128Laguna Woods - 15Lake Elsinore - 254Lake Forest - 132Lakewood - 305
Cities
Cities
Health Benefi ts Program Data (continued)
Counties
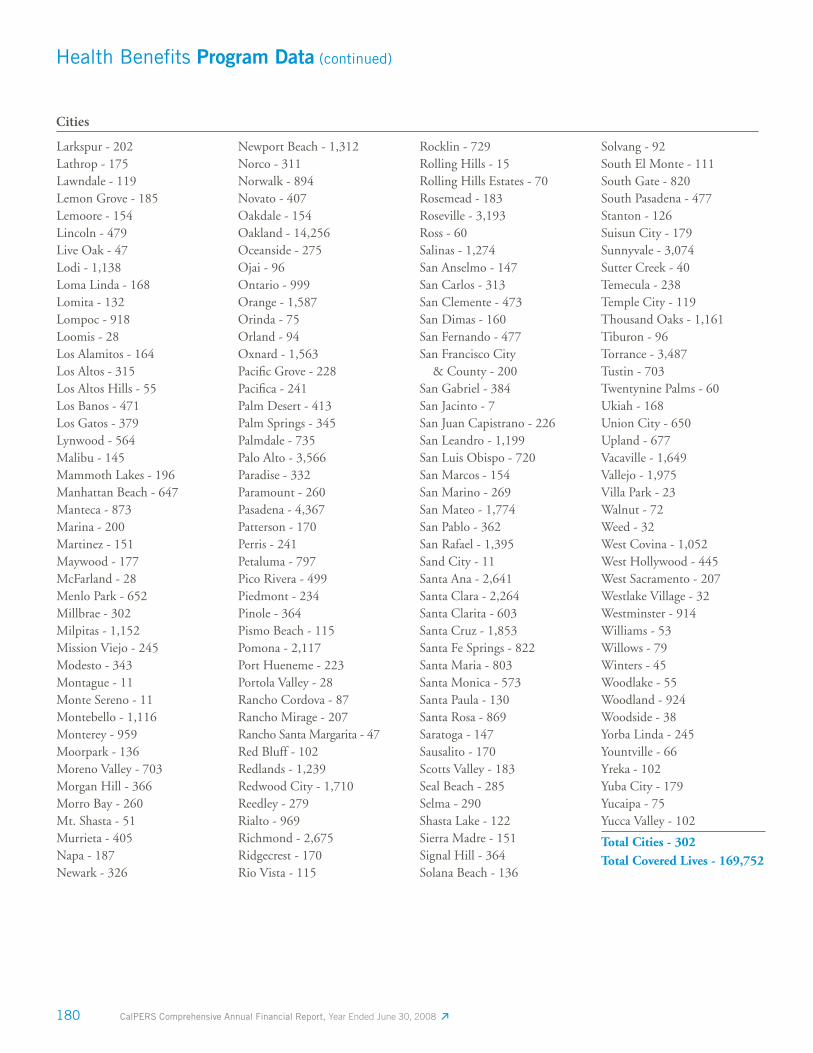
180 CalPERS Comprehensive Annual Financial Report, Year Ended June 30, 2008
Larkspur - 202Lathrop - 175Lawndale - 119Lemon Grove - 185Lemoore - 154Lincoln - 479Live Oak - 47Lodi - 1,138Loma Linda - 168Lomita - 132Lompoc - 918Loomis - 28Los Alamitos - 164Los Altos - 315Los Altos Hills - 55Los Banos - 471Los Gatos - 379Lynwood - 564Malibu - 145Mammoth Lakes - 196Manhattan Beach - 647Manteca - 873Marina - 200Martinez - 151Maywood - 177McFarland - 28Menlo Park - 652Millbrae - 302Milpitas - 1,152Mission Viejo - 245Modesto - 343Montague - 11Monte Sereno - 11Montebello - 1,116Monterey - 959Moorpark - 136Moreno Valley - 703Morgan Hill - 366Morro Bay - 260Mt. Shasta - 51Murrieta - 405Napa - 187Newark - 326
Newport Beach - 1,312Norco - 311Norwalk - 894Novato - 407Oakdale - 154Oakland - 14,256Oceanside - 275Ojai - 96Ontario - 999Orange - 1,587Orinda - 75Orland - 94Oxnard - 1,563Pacifi c Grove - 228Pacifi ca - 241Palm Desert - 413Palm Springs - 345Palmdale - 735Palo Alto - 3,566Paradise - 332Paramount - 260Pasadena - 4,367Patterson - 170Perris - 241Petaluma - 797Pico Rivera - 499Piedmont - 234Pinole - 364Pismo Beach - 115Pomona - 2,117Port Hueneme - 223Portola Valley - 28Rancho Cordova - 87Rancho Mirage - 207Rancho Santa Margarita - 47Red Bluff - 102Redlands - 1,239Redwood City - 1,710Reedley - 279Rialto - 969Richmond - 2,675Ridgecrest - 170Rio Vista - 115
Rocklin - 729Rolling Hills - 15Rolling Hills Estates - 70Rosemead - 183Roseville - 3,193Ross - 60Salinas - 1,274San Anselmo - 147San Carlos - 313San Clemente - 473San Dimas - 160San Fernando - 477San Francisco City & County - 200San Gabriel - 384San Jacinto - 7San Juan Capistrano - 226San Leandro - 1,199San Luis Obispo - 720San Marcos - 154San Marino - 269San Mateo - 1,774San Pablo - 362San Rafael - 1,395Sand City - 11Santa Ana - 2,641Santa Clara - 2,264Santa Clarita - 603Santa Cruz - 1,853Santa Fe Springs - 822Santa Maria - 803Santa Monica - 573Santa Paula - 130Santa Rosa - 869Saratoga - 147Sausalito - 170Scotts Valley - 183Seal Beach - 285Selma - 290Shasta Lake - 122Sierra Madre - 151Signal Hill - 364Solana Beach - 136
Solvang - 92South El Monte - 111South Gate - 820South Pasadena - 477Stanton - 126Suisun City - 179Sunnyvale - 3,074Sutter Creek - 40Temecula - 238Temple City - 119Thousand Oaks - 1,161Tiburon - 96Torrance - 3,487Tustin - 703Twentynine Palms - 60Ukiah - 168Union City - 650Upland - 677Vacaville - 1,649Vallejo - 1,975Villa Park - 23Walnut - 72Weed - 32West Covina - 1,052West Hollywood - 445West Sacramento - 207Westlake Village - 32Westminster - 914Williams - 53Willows - 79Winters - 45Woodlake - 55Woodland - 924Woodside - 38Yorba Linda - 245Yountville - 66Yreka - 102Yuba City - 179Yucaipa - 75Yucca Valley - 102
Total Cities - 302Total Covered Lives - 169,752
Cities
Health Benefi ts Program Data (continued)
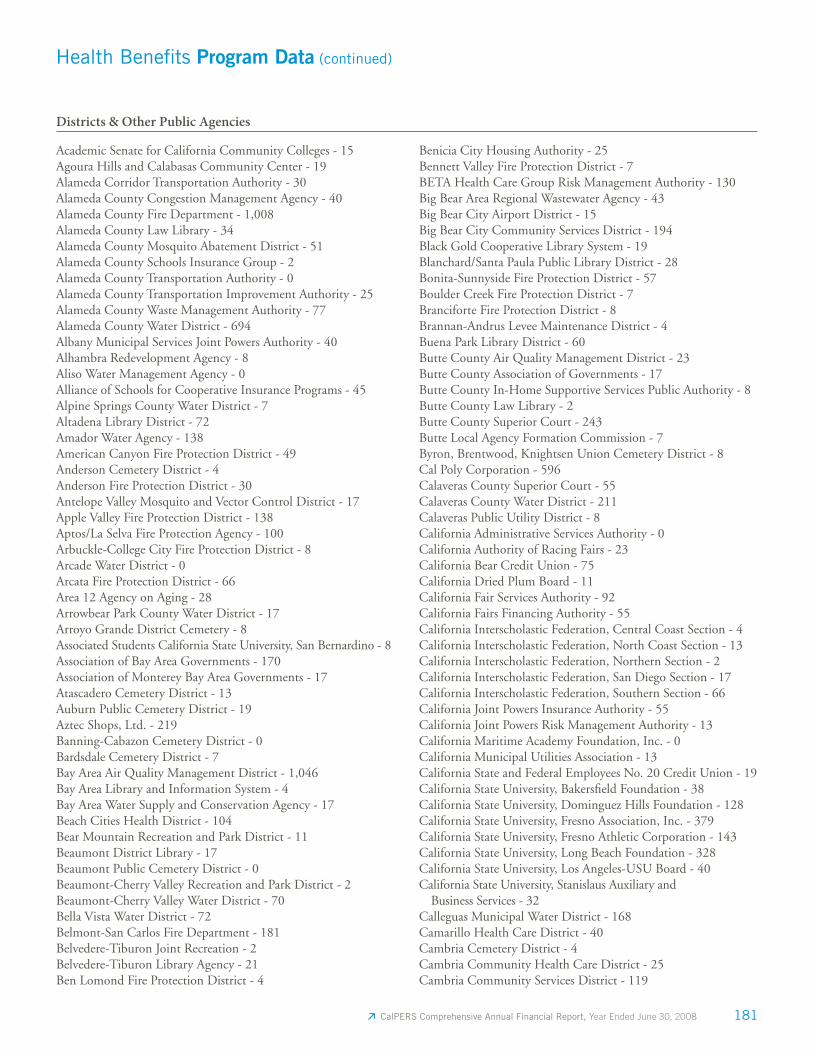
181 CalPERS Comprehensive Annual Financial Report, Year Ended June 30, 2008
Health Benefi ts Program Data (continued)
Academic Senate for California Community Colleges - 15Agoura Hills and Calabasas Community Center - 19Alameda Corridor Transportation Authority - 30Alameda County Congestion Management Agency - 40Alameda County Fire Department - 1,008Alameda County Law Library - 34Alameda County Mosquito Abatement District - 51Alameda County Schools Insurance Group - 2Alameda County Transportation Authority - 0Alameda County Transportation Improvement Authority - 25Alameda County Waste Management Authority - 77Alameda County Water District - 694Albany Municipal Services Joint Powers Authority - 40Alhambra Redevelopment Agency - 8Aliso Water Management Agency - 0Alliance of Schools for Cooperative Insurance Programs - 45Alpine Springs County Water District - 7Altadena Library District - 72Amador Water Agency - 138American Canyon Fire Protection District - 49Anderson Cemetery District - 4Anderson Fire Protection District - 30Antelope Valley Mosquito and Vector Control District - 17Apple Valley Fire Protection District - 138Aptos/La Selva Fire Protection Agency - 100Arbuckle-College City Fire Protection District - 8Arcade Water District - 0Arcata Fire Protection District - 66Area 12 Agency on Aging - 28Arrowbear Park County Water District - 17Arroyo Grande District Cemetery - 8Associated Students California State University, San Bernardino - 8Association of Bay Area Governments - 170Association of Monterey Bay Area Governments - 17Atascadero Cemetery District - 13Auburn Public Cemetery District - 19Aztec Shops, Ltd. - 219Banning-Cabazon Cemetery District - 0Bardsdale Cemetery District - 7Bay Area Air Quality Management District - 1,046Bay Area Library and Information System - 4Bay Area Water Supply and Conservation Agency - 17Beach Cities Health District - 104Bear Mountain Recreation and Park District - 11Beaumont District Library - 17Beaumont Public Cemetery District - 0Beaumont-Cherry Valley Recreation and Park District - 2Beaumont-Cherry Valley Water District - 70Bella Vista Water District - 72Belmont-San Carlos Fire Department - 181Belvedere-Tiburon Joint Recreation - 2Belvedere-Tiburon Library Agency - 21Ben Lomond Fire Protection District - 4
Benicia City Housing Authority - 25Bennett Valley Fire Protection District - 7BETA Health Care Group Risk Management Authority - 130Big Bear Area Regional Wastewater Agency - 43Big Bear City Airport District - 15Big Bear City Community Services District - 194Black Gold Cooperative Library System - 19Blanchard/Santa Paula Public Library District - 28Bonita-Sunnyside Fire Protection District - 57Boulder Creek Fire Protection District - 7Branciforte Fire Protection District - 8Brannan-Andrus Levee Maintenance District - 4Buena Park Library District - 60Butte County Air Quality Management District - 23Butte County Association of Governments - 17Butte County In-Home Supportive Services Public Authority - 8Butte County Law Library - 2Butte County Superior Court - 243Butte Local Agency Formation Commission - 7Byron, Brentwood, Knightsen Union Cemetery District - 8Cal Poly Corporation - 596Calaveras County Superior Court - 55Calaveras County Water District - 211Calaveras Public Utility District - 8California Administrative Services Authority - 0California Authority of Racing Fairs - 23California Bear Credit Union - 75California Dried Plum Board - 11California Fair Services Authority - 92California Fairs Financing Authority - 55California Interscholastic Federation, Central Coast Section - 4California Interscholastic Federation, North Coast Section - 13California Interscholastic Federation, Northern Section - 2California Interscholastic Federation, San Diego Section - 17California Interscholastic Federation, Southern Section - 66California Joint Powers Insurance Authority - 55California Joint Powers Risk Management Authority - 13California Maritime Academy Foundation, Inc. - 0California Municipal Utilities Association - 13California State and Federal Employees No. 20 Credit Union - 19California State University, Bakersfi eld Foundation - 38California State University, Dominguez Hills Foundation - 128California State University, Fresno Association, Inc. - 379California State University, Fresno Athletic Corporation - 143California State University, Long Beach Foundation - 328California State University, Los Angeles-USU Board - 40California State University, Stanislaus Auxiliary and Business Services - 32Calleguas Municipal Water District - 168Camarillo Health Care District - 40Cambria Cemetery District - 4Cambria Community Health Care District - 25Cambria Community Services District - 119
Districts & Other Public Agencies
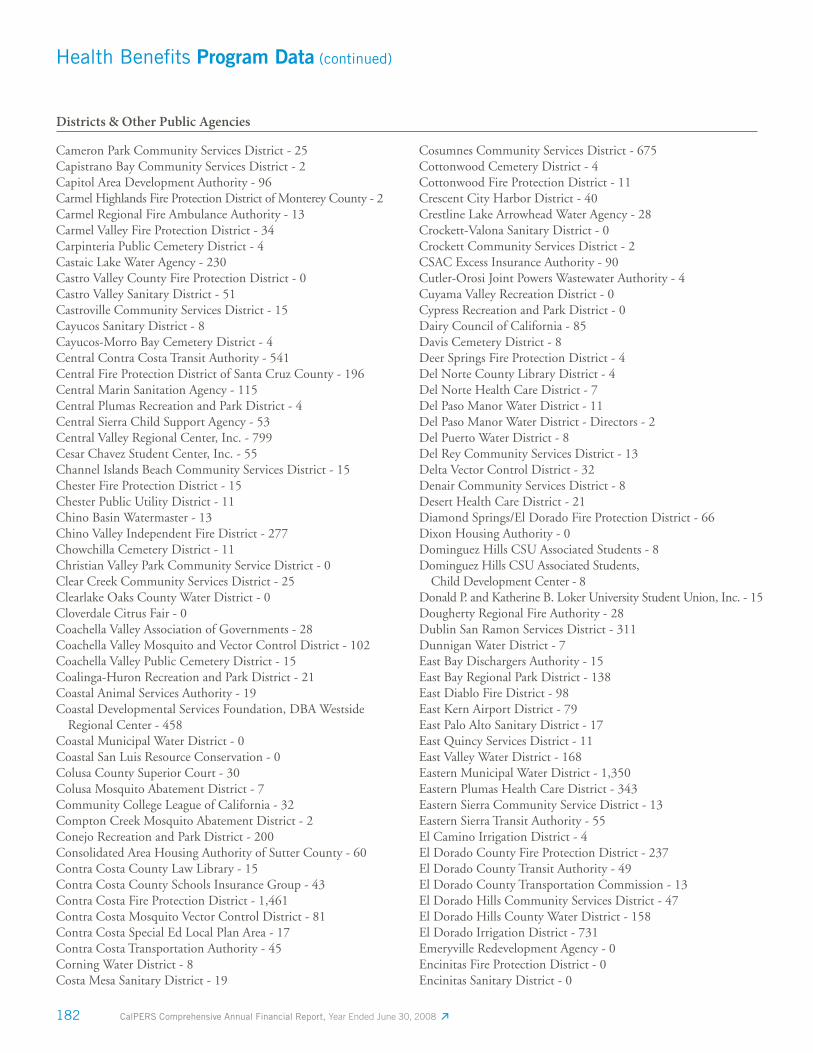
182 CalPERS Comprehensive Annual Financial Report, Year Ended June 30, 2008
Health Benefi ts Program Data (continued)
Cameron Park Community Services District - 25Capistrano Bay Community Services District - 2Capitol Area Development Authority - 96Carmel Highlands Fire Protection District of Monterey County - 2Carmel Regional Fire Ambulance Authority - 13Carmel Valley Fire Protection District - 34Carpinteria Public Cemetery District - 4Castaic Lake Water Agency - 230Castro Valley County Fire Protection District - 0Castro Valley Sanitary District - 51Castroville Community Services District - 15Cayucos Sanitary District - 8Cayucos-Morro Bay Cemetery District - 4Central Contra Costa Transit Authority - 541Central Fire Protection District of Santa Cruz County - 196Central Marin Sanitation Agency - 115Central Plumas Recreation and Park District - 4Central Sierra Child Support Agency - 53Central Valley Regional Center, Inc. - 799Cesar Chavez Student Center, Inc. - 55Channel Islands Beach Community Services District - 15Chester Fire Protection District - 15Chester Public Utility District - 11Chino Basin Watermaster - 13Chino Valley Independent Fire District - 277Chowchilla Cemetery District - 11Christian Valley Park Community Service District - 0Clear Creek Community Services District - 25Clearlake Oaks County Water District - 0Cloverdale Citrus Fair - 0Coachella Valley Association of Governments - 28Coachella Valley Mosquito and Vector Control District - 102Coachella Valley Public Cemetery District - 15Coalinga-Huron Recreation and Park District - 21Coastal Animal Services Authority - 19Coastal Developmental Services Foundation, DBA Westside Regional Center - 458Coastal Municipal Water District - 0Coastal San Luis Resource Conservation - 0Colusa County Superior Court - 30Colusa Mosquito Abatement District - 7Community College League of California - 32Compton Creek Mosquito Abatement District - 2Conejo Recreation and Park District - 200Consolidated Area Housing Authority of Sutter County - 60Contra Costa County Law Library - 15Contra Costa County Schools Insurance Group - 43Contra Costa Fire Protection District - 1,461Contra Costa Mosquito Vector Control District - 81Contra Costa Special Ed Local Plan Area - 17Contra Costa Transportation Authority - 45Corning Water District - 8Costa Mesa Sanitary District - 19
Cosumnes Community Services District - 675Cottonwood Cemetery District - 4Cottonwood Fire Protection District - 11Crescent City Harbor District - 40Crestline Lake Arrowhead Water Agency - 28Crockett-Valona Sanitary District - 0Crockett Community Services District - 2CSAC Excess Insurance Authority - 90Cutler-Orosi Joint Powers Wastewater Authority - 4Cuyama Valley Recreation District - 0Cypress Recreation and Park District - 0Dairy Council of California - 85Davis Cemetery District - 8Deer Springs Fire Protection District - 4Del Norte County Library District - 4Del Norte Health Care District - 7Del Paso Manor Water District - 11Del Paso Manor Water District - Directors - 2Del Puerto Water District - 8Del Rey Community Services District - 13Delta Vector Control District - 32Denair Community Services District - 8Desert Health Care District - 21Diamond Springs/El Dorado Fire Protection District - 66Dixon Housing Authority - 0Dominguez Hills CSU Associated Students - 8Dominguez Hills CSU Associated Students, Child Development Center - 8Donald P. and Katherine B. Loker University Student Union, Inc. - 15Dougherty Regional Fire Authority - 28Dublin San Ramon Services District - 311Dunnigan Water District - 7East Bay Dischargers Authority - 15East Bay Regional Park District - 138East Diablo Fire District - 98East Kern Airport District - 79East Palo Alto Sanitary District - 17East Quincy Services District - 11East Valley Water District - 168Eastern Municipal Water District - 1,350Eastern Plumas Health Care District - 343Eastern Sierra Community Service District - 13Eastern Sierra Transit Authority - 55El Camino Irrigation District - 4El Dorado County Fire Protection District - 237El Dorado County Transit Authority - 49El Dorado County Transportation Commission - 13El Dorado Hills Community Services District - 47El Dorado Hills County Water District - 158El Dorado Irrigation District - 731Emeryville Redevelopment Agency - 0Encinitas Fire Protection District - 0Encinitas Sanitary District - 0
Districts & Other Public Agencies
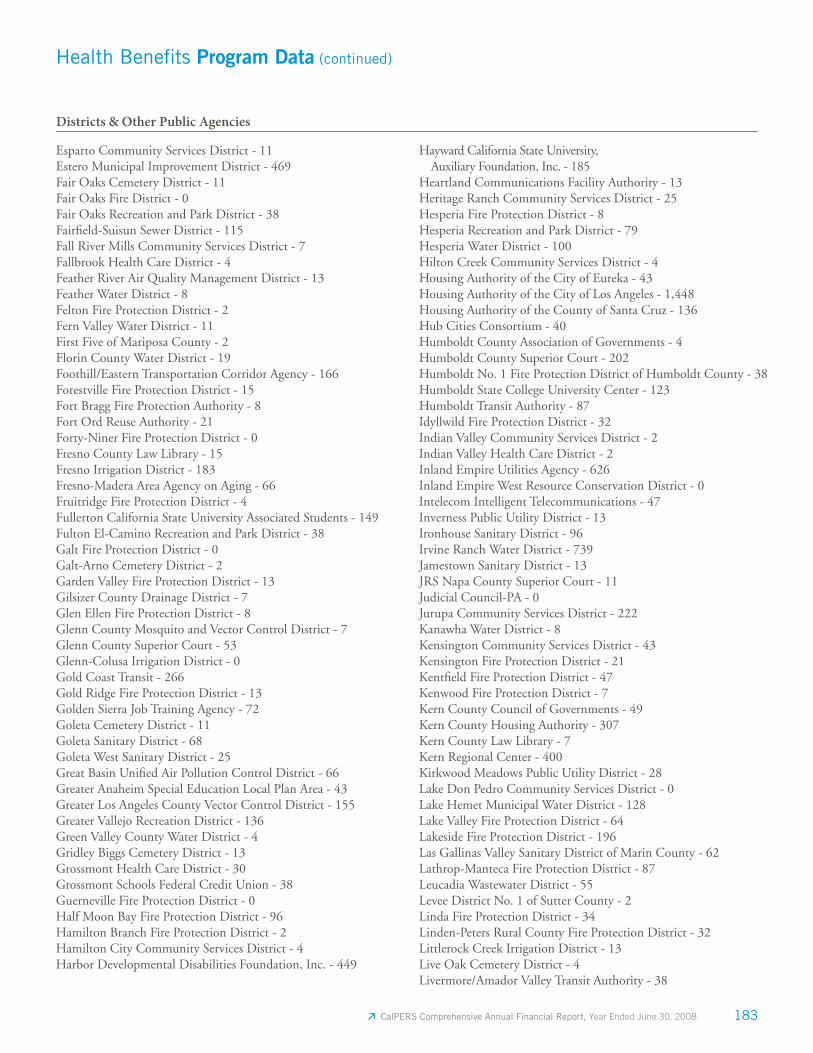
183 CalPERS Comprehensive Annual Financial Report, Year Ended June 30, 2008
Health Benefi ts Program Data (continued)
Esparto Community Services District - 11Estero Municipal Improvement District - 469Fair Oaks Cemetery District - 11Fair Oaks Fire District - 0Fair Oaks Recreation and Park District - 38Fairfi eld-Suisun Sewer District - 115Fall River Mills Community Services District - 7Fallbrook Health Care District - 4Feather River Air Quality Management District - 13Feather Water District - 8Felton Fire Protection District - 2Fern Valley Water District - 11First Five of Mariposa County - 2Florin County Water District - 19Foothill/Eastern Transportation Corridor Agency - 166Forestville Fire Protection District - 15Fort Bragg Fire Protection Authority - 8Fort Ord Reuse Authority - 21Forty-Niner Fire Protection District - 0Fresno County Law Library - 15Fresno Irrigation District - 183Fresno-Madera Area Agency on Aging - 66Fruitridge Fire Protection District - 4Fullerton California State University Associated Students - 149Fulton El-Camino Recreation and Park District - 38Galt Fire Protection District - 0Galt-Arno Cemetery District - 2Garden Valley Fire Protection District - 13Gilsizer County Drainage District - 7Glen Ellen Fire Protection District - 8Glenn County Mosquito and Vector Control District - 7Glenn County Superior Court - 53Glenn-Colusa Irrigation District - 0Gold Coast Transit - 266Gold Ridge Fire Protection District - 13Golden Sierra Job Training Agency - 72Goleta Cemetery District - 11Goleta Sanitary District - 68Goleta West Sanitary District - 25Great Basin Unifi ed Air Pollution Control District - 66Greater Anaheim Special Education Local Plan Area - 43Greater Los Angeles County Vector Control District - 155Greater Vallejo Recreation District - 136Green Valley County Water District - 4Gridley Biggs Cemetery District - 13Grossmont Health Care District - 30Grossmont Schools Federal Credit Union - 38Guerneville Fire Protection District - 0Half Moon Bay Fire Protection District - 96Hamilton Branch Fire Protection District - 2Hamilton City Community Services District - 4Harbor Developmental Disabilities Foundation, Inc. - 449
Hayward California State University, Auxiliary Foundation, Inc. - 185Heartland Communications Facility Authority - 13Heritage Ranch Community Services District - 25Hesperia Fire Protection District - 8Hesperia Recreation and Park District - 79Hesperia Water District - 100Hilton Creek Community Services District - 4Housing Authority of the City of Eureka - 43Housing Authority of the City of Los Angeles - 1,448Housing Authority of the County of Santa Cruz - 136Hub Cities Consortium - 40Humboldt County Association of Governments - 4Humboldt County Superior Court - 202Humboldt No. 1 Fire Protection District of Humboldt County - 38Humboldt State College University Center - 123Humboldt Transit Authority - 87Idyllwild Fire Protection District - 32Indian Valley Community Services District - 2Indian Valley Health Care District - 2Inland Empire Utilities Agency - 626Inland Empire West Resource Conservation District - 0Intelecom Intelligent Telecommunications - 47Inverness Public Utility District - 13Ironhouse Sanitary District - 96Irvine Ranch Water District - 739Jamestown Sanitary District - 13JRS Napa County Superior Court - 11Judicial Council-PA - 0Jurupa Community Services District - 222Kanawha Water District - 8Kensington Community Services District - 43Kensington Fire Protection District - 21Kentfi eld Fire Protection District - 47Kenwood Fire Protection District - 7Kern County Council of Governments - 49Kern County Housing Authority - 307Kern County Law Library - 7Kern Regional Center - 400Kirkwood Meadows Public Utility District - 28Lake Don Pedro Community Services District - 0Lake Hemet Municipal Water District - 128Lake Valley Fire Protection District - 64Lakeside Fire Protection District - 196Las Gallinas Valley Sanitary District of Marin County - 62Lathrop-Manteca Fire Protection District - 87Leucadia Wastewater District - 55Levee District No. 1 of Sutter County - 2Linda Fire Protection District - 34Linden-Peters Rural County Fire Protection District - 32Littlerock Creek Irrigation District - 13Live Oak Cemetery District - 4Livermore/Amador Valley Transit Authority - 38
Districts & Other Public Agencies
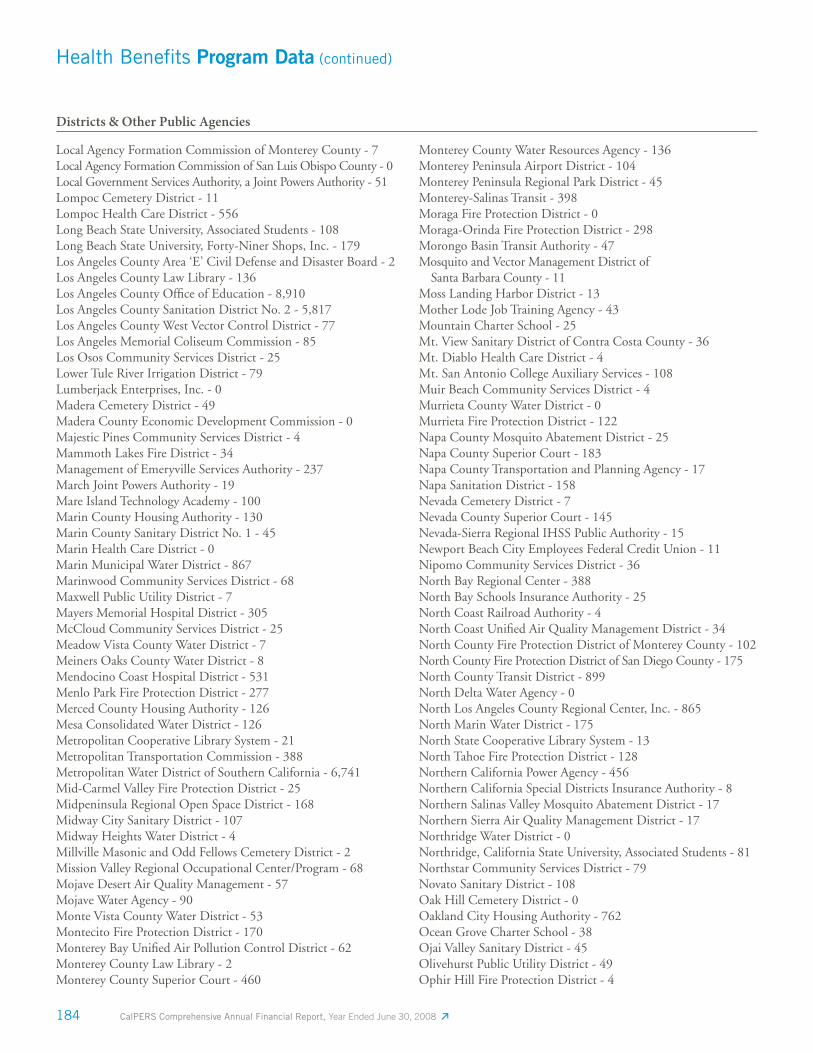
184 CalPERS Comprehensive Annual Financial Report, Year Ended June 30, 2008
Health Benefi ts Program Data (continued)
Local Agency Formation Commission of Monterey County - 7Local Agency Formation Commission of San Luis Obispo County - 0Local Government Services Authority, a Joint Powers Authority - 51Lompoc Cemetery District - 11Lompoc Health Care District - 556Long Beach State University, Associated Students - 108Long Beach State University, Forty-Niner Shops, Inc. - 179Los Angeles County Area ‘E’ Civil Defense and Disaster Board - 2Los Angeles County Law Library - 136Los Angeles County Offi ce of Education - 8,910Los Angeles County Sanitation District No. 2 - 5,817Los Angeles County West Vector Control District - 77Los Angeles Memorial Coliseum Commission - 85Los Osos Community Services District - 25Lower Tule River Irrigation District - 79Lumberjack Enterprises, Inc. - 0Madera Cemetery District - 49Madera County Economic Development Commission - 0Majestic Pines Community Services District - 4Mammoth Lakes Fire District - 34Management of Emeryville Services Authority - 237March Joint Powers Authority - 19Mare Island Technology Academy - 100Marin County Housing Authority - 130Marin County Sanitary District No. 1 - 45Marin Health Care District - 0Marin Municipal Water District - 867Marinwood Community Services District - 68Maxwell Public Utility District - 7Mayers Memorial Hospital District - 305McCloud Community Services District - 25Meadow Vista County Water District - 7Meiners Oaks County Water District - 8Mendocino Coast Hospital District - 531Menlo Park Fire Protection District - 277Merced County Housing Authority - 126Mesa Consolidated Water District - 126Metropolitan Cooperative Library System - 21Metropolitan Transportation Commission - 388Metropolitan Water District of Southern California - 6,741Mid-Carmel Valley Fire Protection District - 25Midpeninsula Regional Open Space District - 168Midway City Sanitary District - 107Midway Heights Water District - 4Millville Masonic and Odd Fellows Cemetery District - 2Mission Valley Regional Occupational Center/Program - 68Mojave Desert Air Quality Management - 57Mojave Water Agency - 90Monte Vista County Water District - 53Montecito Fire Protection District - 170Monterey Bay Unifi ed Air Pollution Control District - 62Monterey County Law Library - 2Monterey County Superior Court - 460
Monterey County Water Resources Agency - 136Monterey Peninsula Airport District - 104Monterey Peninsula Regional Park District - 45Monterey-Salinas Transit - 398Moraga Fire Protection District - 0Moraga-Orinda Fire Protection District - 298Morongo Basin Transit Authority - 47Mosquito and Vector Management District of Santa Barbara County - 11Moss Landing Harbor District - 13Mother Lode Job Training Agency - 43Mountain Charter School - 25Mt. View Sanitary District of Contra Costa County - 36Mt. Diablo Health Care District - 4Mt. San Antonio College Auxiliary Services - 108Muir Beach Community Services District - 4Murrieta County Water District - 0Murrieta Fire Protection District - 122Napa County Mosquito Abatement District - 25Napa County Superior Court - 183Napa County Transportation and Planning Agency - 17Napa Sanitation District - 158Nevada Cemetery District - 7Nevada County Superior Court - 145Nevada-Sierra Regional IHSS Public Authority - 15Newport Beach City Employees Federal Credit Union - 11Nipomo Community Services District - 36North Bay Regional Center - 388North Bay Schools Insurance Authority - 25North Coast Railroad Authority - 4North Coast Unifi ed Air Quality Management District - 34North County Fire Protection District of Monterey County - 102North County Fire Protection District of San Diego County - 175North County Transit District - 899North Delta Water Agency - 0North Los Angeles County Regional Center, Inc. - 865North Marin Water District - 175North State Cooperative Library System - 13North Tahoe Fire Protection District - 128Northern California Power Agency - 456Northern California Special Districts Insurance Authority - 8Northern Salinas Valley Mosquito Abatement District - 17Northern Sierra Air Quality Management District - 17Northridge Water District - 0Northridge, California State University, Associated Students - 81Northstar Community Services District - 79Novato Sanitary District - 108Oak Hill Cemetery District - 0Oakland City Housing Authority - 762Ocean Grove Charter School - 38Ojai Valley Sanitary District - 45Olivehurst Public Utility District - 49Ophir Hill Fire Protection District - 4
Districts & Other Public Agencies
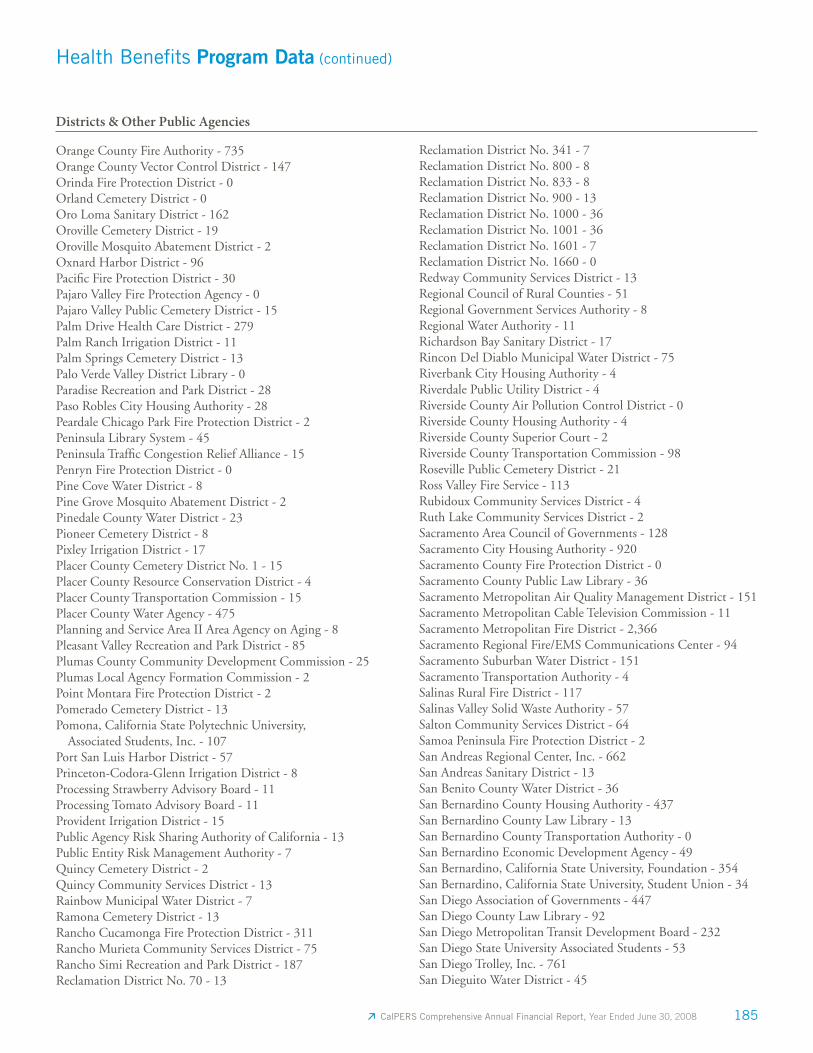
185 CalPERS Comprehensive Annual Financial Report, Year Ended June 30, 2008
Health Benefi ts Program Data (continued)
Orange County Fire Authority - 735Orange County Vector Control District - 147Orinda Fire Protection District - 0Orland Cemetery District - 0Oro Loma Sanitary District - 162Oroville Cemetery District - 19Oroville Mosquito Abatement District - 2Oxnard Harbor District - 96Pacifi c Fire Protection District - 30Pajaro Valley Fire Protection Agency - 0Pajaro Valley Public Cemetery District - 15Palm Drive Health Care District - 279Palm Ranch Irrigation District - 11Palm Springs Cemetery District - 13Palo Verde Valley District Library - 0Paradise Recreation and Park District - 28Paso Robles City Housing Authority - 28Peardale Chicago Park Fire Protection District - 2Peninsula Library System - 45Peninsula Traffi c Congestion Relief Alliance - 15Penryn Fire Protection District - 0Pine Cove Water District - 8Pine Grove Mosquito Abatement District - 2Pinedale County Water District - 23Pioneer Cemetery District - 8Pixley Irrigation District - 17Placer County Cemetery District No. 1 - 15Placer County Resource Conservation District - 4Placer County Transportation Commission - 15Placer County Water Agency - 475Planning and Service Area II Area Agency on Aging - 8Pleasant Valley Recreation and Park District - 85Plumas County Community Development Commission - 25Plumas Local Agency Formation Commission - 2Point Montara Fire Protection District - 2Pomerado Cemetery District - 13Pomona, California State Polytechnic University, Associated Students, Inc. - 107Port San Luis Harbor District - 57Princeton-Codora-Glenn Irrigation District - 8Processing Strawberry Advisory Board - 11Processing Tomato Advisory Board - 11Provident Irrigation District - 15Public Agency Risk Sharing Authority of California - 13Public Entity Risk Management Authority - 7Quincy Cemetery District - 2Quincy Community Services District - 13Rainbow Municipal Water District - 7Ramona Cemetery District - 13Rancho Cucamonga Fire Protection District - 311Rancho Murieta Community Services District - 75Rancho Simi Recreation and Park District - 187Reclamation District No. 70 - 13
Reclamation District No. 341 - 7Reclamation District No. 800 - 8Reclamation District No. 833 - 8Reclamation District No. 900 - 13Reclamation District No. 1000 - 36Reclamation District No. 1001 - 36Reclamation District No. 1601 - 7Reclamation District No. 1660 - 0Redway Community Services District - 13Regional Council of Rural Counties - 51Regional Government Services Authority - 8Regional Water Authority - 11Richardson Bay Sanitary District - 17Rincon Del Diablo Municipal Water District - 75Riverbank City Housing Authority - 4Riverdale Public Utility District - 4Riverside County Air Pollution Control District - 0Riverside County Housing Authority - 4Riverside County Superior Court - 2Riverside County Transportation Commission - 98Roseville Public Cemetery District - 21Ross Valley Fire Service - 113Rubidoux Community Services District - 4Ruth Lake Community Services District - 2Sacramento Area Council of Governments - 128Sacramento City Housing Authority - 920Sacramento County Fire Protection District - 0Sacramento County Public Law Library - 36Sacramento Metropolitan Air Quality Management District - 151Sacramento Metropolitan Cable Television Commission - 11Sacramento Metropolitan Fire District - 2,366Sacramento Regional Fire/EMS Communications Center - 94Sacramento Suburban Water District - 151Sacramento Transportation Authority - 4Salinas Rural Fire District - 117Salinas Valley Solid Waste Authority - 57Salton Community Services District - 64Samoa Peninsula Fire Protection District - 2San Andreas Regional Center, Inc. - 662San Andreas Sanitary District - 13San Benito County Water District - 36San Bernardino County Housing Authority - 437San Bernardino County Law Library - 13San Bernardino County Transportation Authority - 0San Bernardino Economic Development Agency - 49San Bernardino, California State University, Foundation - 354San Bernardino, California State University, Student Union - 34San Diego Association of Governments - 447San Diego County Law Library - 92San Diego Metropolitan Transit Development Board - 232San Diego State University Associated Students - 53San Diego Trolley, Inc. - 761San Dieguito Water District - 45
Districts & Other Public Agencies
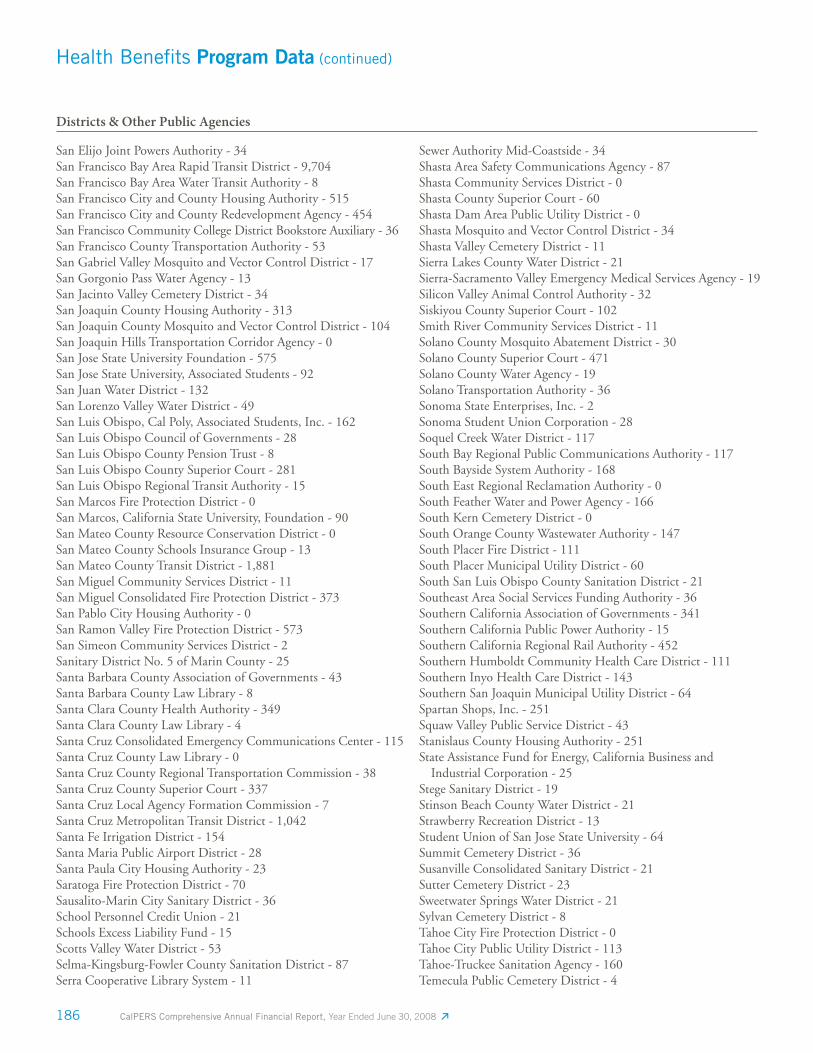
186 CalPERS Comprehensive Annual Financial Report, Year Ended June 30, 2008
Health Benefi ts Program Data (continued)
San Elijo Joint Powers Authority - 34San Francisco Bay Area Rapid Transit District - 9,704San Francisco Bay Area Water Transit Authority - 8San Francisco City and County Housing Authority - 515San Francisco City and County Redevelopment Agency - 454San Francisco Community College District Bookstore Auxiliary - 36San Francisco County Transportation Authority - 53San Gabriel Valley Mosquito and Vector Control District - 17San Gorgonio Pass Water Agency - 13San Jacinto Valley Cemetery District - 34San Joaquin County Housing Authority - 313San Joaquin County Mosquito and Vector Control District - 104San Joaquin Hills Transportation Corridor Agency - 0San Jose State University Foundation - 575San Jose State University, Associated Students - 92San Juan Water District - 132San Lorenzo Valley Water District - 49San Luis Obispo, Cal Poly, Associated Students, Inc. - 162San Luis Obispo Council of Governments - 28San Luis Obispo County Pension Trust - 8San Luis Obispo County Superior Court - 281San Luis Obispo Regional Transit Authority - 15San Marcos Fire Protection District - 0San Marcos, California State University, Foundation - 90San Mateo County Resource Conservation District - 0San Mateo County Schools Insurance Group - 13San Mateo County Transit District - 1,881San Miguel Community Services District - 11San Miguel Consolidated Fire Protection District - 373San Pablo City Housing Authority - 0San Ramon Valley Fire Protection District - 573San Simeon Community Services District - 2Sanitary District No. 5 of Marin County - 25Santa Barbara County Association of Governments - 43Santa Barbara County Law Library - 8Santa Clara County Health Authority - 349Santa Clara County Law Library - 4Santa Cruz Consolidated Emergency Communications Center - 115Santa Cruz County Law Library - 0Santa Cruz County Regional Transportation Commission - 38Santa Cruz County Superior Court - 337Santa Cruz Local Agency Formation Commission - 7Santa Cruz Metropolitan Transit District - 1,042Santa Fe Irrigation District - 154Santa Maria Public Airport District - 28Santa Paula City Housing Authority - 23Saratoga Fire Protection District - 70Sausalito-Marin City Sanitary District - 36School Personnel Credit Union - 21Schools Excess Liability Fund - 15Scotts Valley Water District - 53Selma-Kingsburg-Fowler County Sanitation District - 87Serra Cooperative Library System - 11
Sewer Authority Mid-Coastside - 34Shasta Area Safety Communications Agency - 87Shasta Community Services District - 0Shasta County Superior Court - 60Shasta Dam Area Public Utility District - 0Shasta Mosquito and Vector Control District - 34Shasta Valley Cemetery District - 11Sierra Lakes County Water District - 21Sierra-Sacramento Valley Emergency Medical Services Agency - 19Silicon Valley Animal Control Authority - 32Siskiyou County Superior Court - 102Smith River Community Services District - 11Solano County Mosquito Abatement District - 30Solano County Superior Court - 471Solano County Water Agency - 19Solano Transportation Authority - 36Sonoma State Enterprises, Inc. - 2Sonoma Student Union Corporation - 28Soquel Creek Water District - 117South Bay Regional Public Communications Authority - 117South Bayside System Authority - 168South East Regional Reclamation Authority - 0South Feather Water and Power Agency - 166South Kern Cemetery District - 0South Orange County Wastewater Authority - 147South Placer Fire District - 111South Placer Municipal Utility District - 60South San Luis Obispo County Sanitation District - 21Southeast Area Social Services Funding Authority - 36Southern California Association of Governments - 341Southern California Public Power Authority - 15Southern California Regional Rail Authority - 452Southern Humboldt Community Health Care District - 111Southern Inyo Health Care District - 143Southern San Joaquin Municipal Utility District - 64Spartan Shops, Inc. - 251Squaw Valley Public Service District - 43Stanislaus County Housing Authority - 251State Assistance Fund for Energy, California Business and Industrial Corporation - 25Stege Sanitary District - 19Stinson Beach County Water District - 21Strawberry Recreation District - 13Student Union of San Jose State University - 64Summit Cemetery District - 36Susanville Consolidated Sanitary District - 21Sutter Cemetery District - 23Sweetwater Springs Water District - 21Sylvan Cemetery District - 8Tahoe City Fire Protection District - 0Tahoe City Public Utility District - 113Tahoe-Truckee Sanitation Agency - 160Temecula Public Cemetery District - 4
Districts & Other Public Agencies
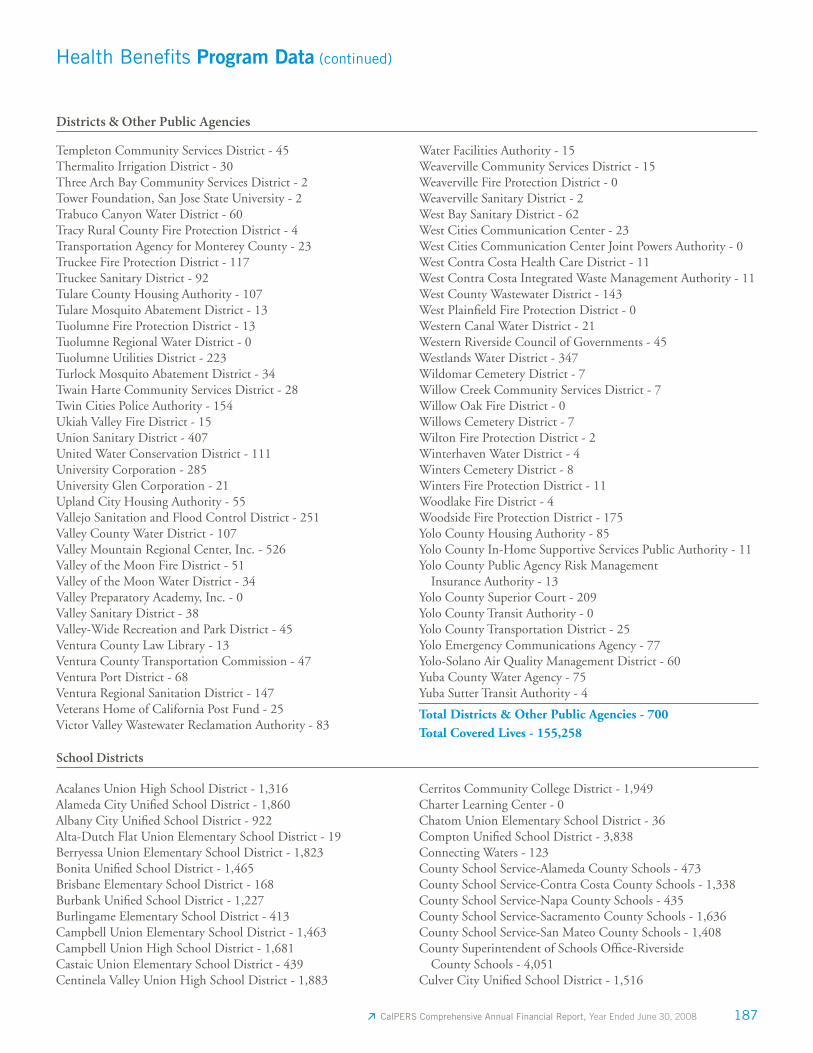
187 CalPERS Comprehensive Annual Financial Report, Year Ended June 30, 2008
Health Benefi ts Program Data (continued)
Templeton Community Services District - 45Thermalito Irrigation District - 30Three Arch Bay Community Services District - 2Tower Foundation, San Jose State University - 2Trabuco Canyon Water District - 60Tracy Rural County Fire Protection District - 4Transportation Agency for Monterey County - 23Truckee Fire Protection District - 117Truckee Sanitary District - 92Tulare County Housing Authority - 107Tulare Mosquito Abatement District - 13Tuolumne Fire Protection District - 13Tuolumne Regional Water District - 0Tuolumne Utilities District - 223Turlock Mosquito Abatement District - 34Twain Harte Community Services District - 28Twin Cities Police Authority - 154Ukiah Valley Fire District - 15Union Sanitary District - 407United Water Conservation District - 111University Corporation - 285University Glen Corporation - 21Upland City Housing Authority - 55Vallejo Sanitation and Flood Control District - 251Valley County Water District - 107Valley Mountain Regional Center, Inc. - 526Valley of the Moon Fire District - 51Valley of the Moon Water District - 34Valley Preparatory Academy, Inc. - 0Valley Sanitary District - 38Valley-Wide Recreation and Park District - 45Ventura County Law Library - 13Ventura County Transportation Commission - 47Ventura Port District - 68Ventura Regional Sanitation District - 147Veterans Home of California Post Fund - 25Victor Valley Wastewater Reclamation Authority - 83
Water Facilities Authority - 15Weaverville Community Services District - 15Weaverville Fire Protection District - 0Weaverville Sanitary District - 2West Bay Sanitary District - 62West Cities Communication Center - 23West Cities Communication Center Joint Powers Authority - 0West Contra Costa Health Care District - 11West Contra Costa Integrated Waste Management Authority - 11West County Wastewater District - 143West Plainfi eld Fire Protection District - 0Western Canal Water District - 21Western Riverside Council of Governments - 45Westlands Water District - 347Wildomar Cemetery District - 7Willow Creek Community Services District - 7Willow Oak Fire District - 0Willows Cemetery District - 7Wilton Fire Protection District - 2Winterhaven Water District - 4Winters Cemetery District - 8Winters Fire Protection District - 11Woodlake Fire District - 4Woodside Fire Protection District - 175Yolo County Housing Authority - 85Yolo County In-Home Supportive Services Public Authority - 11Yolo County Public Agency Risk Management Insurance Authority - 13Yolo County Superior Court - 209Yolo County Transit Authority - 0Yolo County Transportation District - 25Yolo Emergency Communications Agency - 77Yolo-Solano Air Quality Management District - 60Yuba County Water Agency - 75Yuba Sutter Transit Authority - 4
Total Districts & Other Public Agencies - 700Total Covered Lives - 155,258
Districts & Other Public Agencies
Acalanes Union High School District - 1,316Alameda City Unifi ed School District - 1,860Albany City Unifi ed School District - 922Alta-Dutch Flat Union Elementary School District - 19Berryessa Union Elementary School District - 1,823Bonita Unifi ed School District - 1,465Brisbane Elementary School District - 168Burbank Unifi ed School District - 1,227Burlingame Elementary School District - 413Campbell Union Elementary School District - 1,463Campbell Union High School District - 1,681Castaic Union Elementary School District - 439Centinela Valley Union High School District - 1,883
Cerritos Community College District - 1,949Charter Learning Center - 0Chatom Union Elementary School District - 36Compton Unifi ed School District - 3,838Connecting Waters - 123County School Service-Alameda County Schools - 473County School Service-Contra Costa County Schools - 1,338County School Service-Napa County Schools - 435County School Service-Sacramento County Schools - 1,636County School Service-San Mateo County Schools - 1,408County Superintendent of Schools Offi ce-Riverside County Schools - 4,051Culver City Unifi ed School District - 1,516
School Districts
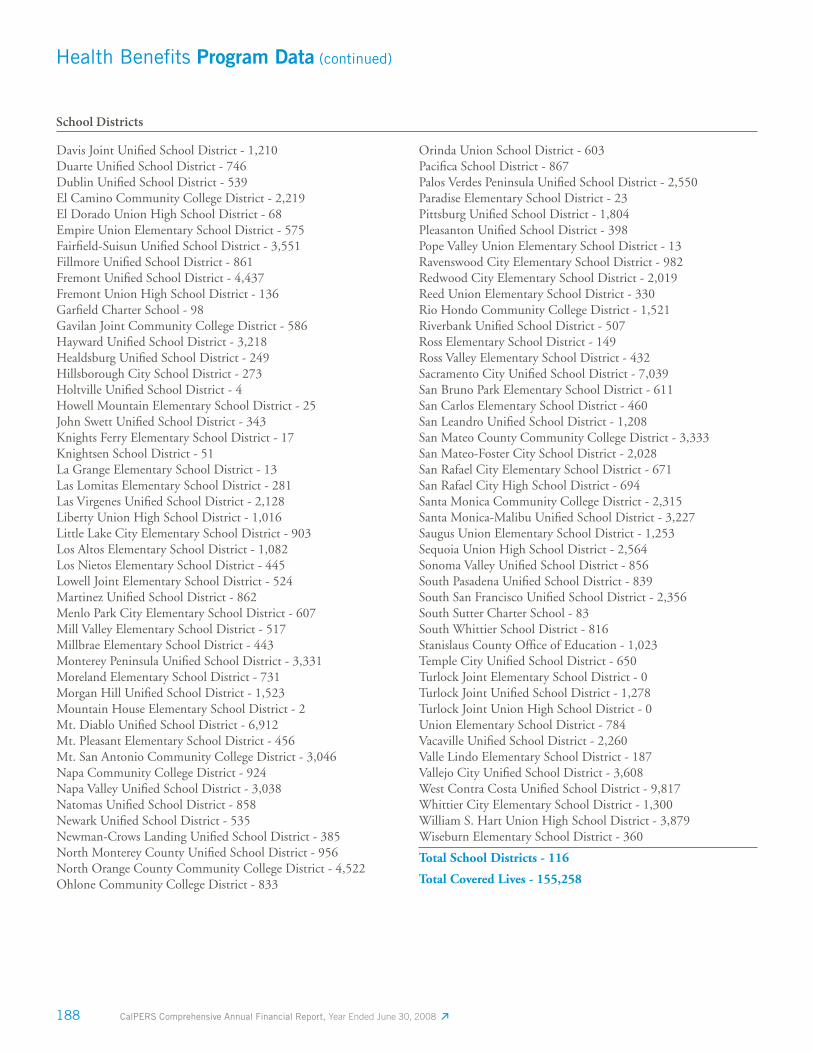
188 CalPERS Comprehensive Annual Financial Report, Year Ended June 30, 2008
Health Benefi ts Program Data (continued)
Davis Joint Unifi ed School District - 1,210Duarte Unifi ed School District - 746Dublin Unifi ed School District - 539El Camino Community College District - 2,219El Dorado Union High School District - 68Empire Union Elementary School District - 575Fairfi eld-Suisun Unifi ed School District - 3,551Fillmore Unifi ed School District - 861Fremont Unifi ed School District - 4,437Fremont Union High School District - 136Garfi eld Charter School - 98Gavilan Joint Community College District - 586Hayward Unifi ed School District - 3,218Healdsburg Unifi ed School District - 249Hillsborough City School District - 273Holtville Unifi ed School District - 4Howell Mountain Elementary School District - 25John Swett Unifi ed School District - 343Knights Ferry Elementary School District - 17Knightsen School District - 51La Grange Elementary School District - 13Las Lomitas Elementary School District - 281Las Virgenes Unifi ed School District - 2,128Liberty Union High School District - 1,016Little Lake City Elementary School District - 903Los Altos Elementary School District - 1,082Los Nietos Elementary School District - 445Lowell Joint Elementary School District - 524Martinez Unifi ed School District - 862Menlo Park City Elementary School District - 607Mill Valley Elementary School District - 517Millbrae Elementary School District - 443Monterey Peninsula Unifi ed School District - 3,331Moreland Elementary School District - 731Morgan Hill Unifi ed School District - 1,523Mountain House Elementary School District - 2Mt. Diablo Unifi ed School District - 6,912Mt. Pleasant Elementary School District - 456Mt. San Antonio Community College District - 3,046Napa Community College District - 924Napa Valley Unifi ed School District - 3,038Natomas Unifi ed School District - 858Newark Unifi ed School District - 535Newman-Crows Landing Unifi ed School District - 385North Monterey County Unifi ed School District - 956North Orange County Community College District - 4,522Ohlone Community College District - 833
Orinda Union School District - 603Pacifi ca School District - 867Palos Verdes Peninsula Unifi ed School District - 2,550Paradise Elementary School District - 23Pittsburg Unifi ed School District - 1,804Pleasanton Unifi ed School District - 398Pope Valley Union Elementary School District - 13Ravenswood City Elementary School District - 982Redwood City Elementary School District - 2,019Reed Union Elementary School District - 330Rio Hondo Community College District - 1,521Riverbank Unifi ed School District - 507Ross Elementary School District - 149Ross Valley Elementary School District - 432Sacramento City Unifi ed School District - 7,039San Bruno Park Elementary School District - 611San Carlos Elementary School District - 460San Leandro Unifi ed School District - 1,208San Mateo County Community College District - 3,333San Mateo-Foster City School District - 2,028San Rafael City Elementary School District - 671San Rafael City High School District - 694Santa Monica Community College District - 2,315Santa Monica-Malibu Unifi ed School District - 3,227Saugus Union Elementary School District - 1,253Sequoia Union High School District - 2,564Sonoma Valley Unifi ed School District - 856South Pasadena Unifi ed School District - 839South San Francisco Unifi ed School District - 2,356South Sutter Charter School - 83South Whittier School District - 816Stanislaus County Offi ce of Education - 1,023Temple City Unifi ed School District - 650Turlock Joint Elementary School District - 0Turlock Joint Unifi ed School District - 1,278Turlock Joint Union High School District - 0Union Elementary School District - 784Vacaville Unifi ed School District - 2,260Valle Lindo Elementary School District - 187Vallejo City Unifi ed School District - 3,608West Contra Costa Unifi ed School District - 9,817Whittier City Elementary School District - 1,300William S. Hart Union High School District - 3,879Wiseburn Elementary School District - 360
Total School Districts - 116
Total Covered Lives - 155,258
School Districts
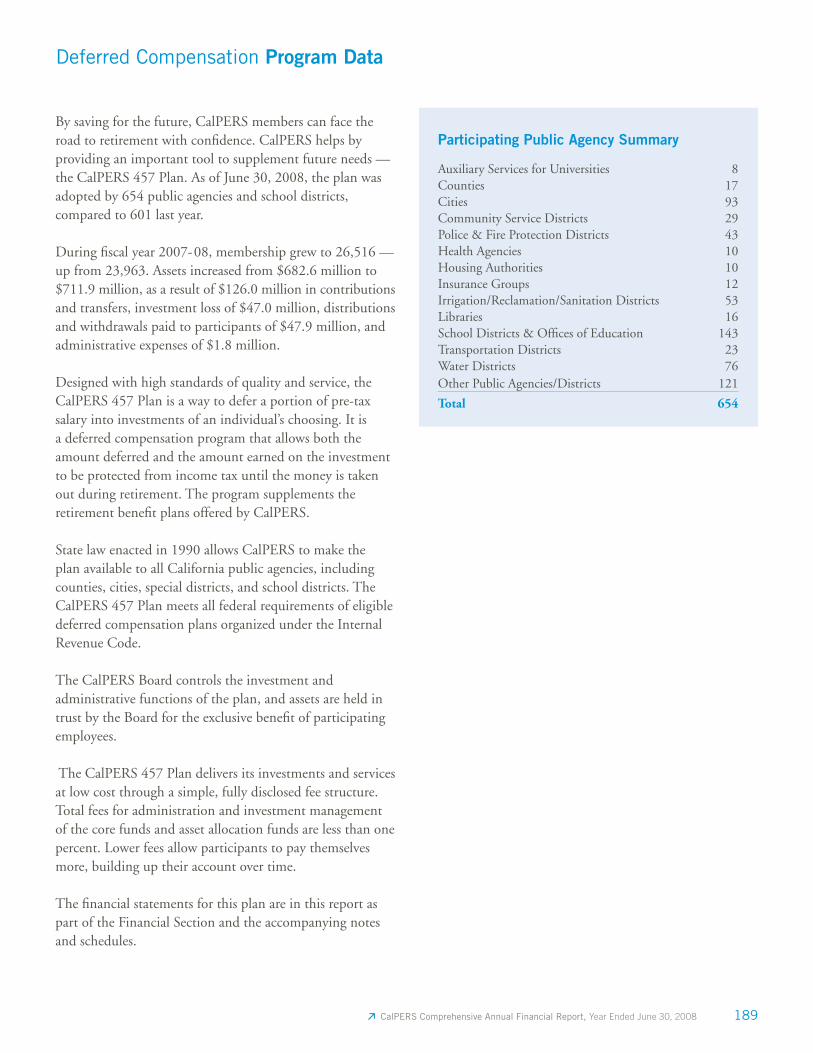
189 CalPERS Comprehensive Annual Financial Report, Year Ended June 30, 2008
Deferred Compensation Program Data
By saving for the future, CalPERS members can face the road to retirement with confi dence. CalPERS helps by providing an important tool to supplement future needs — the CalPERS 457 Plan. As of June 30, 2008, the plan was adopted by 654 public agencies and school districts, compared to 601 last year.
During fi scal year 2007-08, membership grew to 26,516 — up from 23,963. Assets increased from $682.6 million to $711.9 million, as a result of $126.0 million in contributions and transfers, investment loss of $47.0 million, distributions and withdrawals paid to participants of $47.9 million, and administrative expenses of $1.8 million.
Designed with high standards of quality and service, the CalPERS 457 Plan is a way to defer a portion of pre-tax salary into investments of an individual’s choosing. It is a deferred compensation program that allows both the amount deferred and the amount earned on the investment to be protected from income tax until the money is taken out during retirement. The program supplements the retirement benefi t plans offered by CalPERS.
State law enacted in 1990 allows CalPERS to make the plan available to all California public agencies, including counties, cities, special districts, and school districts. The CalPERS 457 Plan meets all federal requirements of eligible deferred compensation plans organized under the Internal Revenue Code.
The CalPERS Board controls the investment and administrative functions of the plan, and assets are held in trust by the Board for the exclusive benefi t of participating employees.
The CalPERS 457 Plan delivers its investments and services at low cost through a simple, fully disclosed fee structure. Total fees for administration and investment management of the core funds and asset allocation funds are less than one percent. Lower fees allow participants to pay themselves more, building up their account over time.
The fi nancial statements for this plan are in this report as part of the Financial Section and the accompanying notes and schedules.
Participating Public Agency Summary
Auxiliary Services for Universities 8Counties 17Cities 93Community Service Districts 29Police & Fire Protection Districts 43Health Agencies 10Housing Authorities 10Insurance Groups 12Irrigation/Reclamation/Sanitation Districts 53Libraries 16School Districts & Offi ces of Education 143Transportation Districts 23Water Districts 76Other Public Agencies/Districts 121
Total 654

190 CalPERS Comprehensive Annual Financial Report, Year Ended June 30, 2008
Long-Term Care Program Data
The CalPERS Long-Term Care (LTC) Program is a member (policy holder) self-funded insurance program that provides fi nancial protection to members from the high cost of extended personal care caused by illness, injury, or the frailty of old age.
Research indicates that six out of every 10 people over the age of 65 will need long-term care during their lifetime. Long-term care policies are useful because personal care services are not covered by traditional health insurance or Medicare. CalPERS offers long-term care policies with different benefi t and time duration options.
During fi scal year 2007-08, CalPERS LTC membership remained stable at 168,140 covered lives. Premium revenues totaled $299.5 million; investments grew to $2.3 billion; and more than $101.3 million in member benefi ts were paid, bringing the total benefi ts paid since the Program’s inception in 1995 to $472.1 million.
The CalPERS LTC Program continues to be one of the largest of its kind in the nation, devoted to providing the best long-term care coverage possible with affordable premiums.
The fi nancial statements for this Program are found in the Financial Section, Management’s Discussion & Analysis, and the Basic Financial Statements section.

Index of Tables, Charts, & Lists
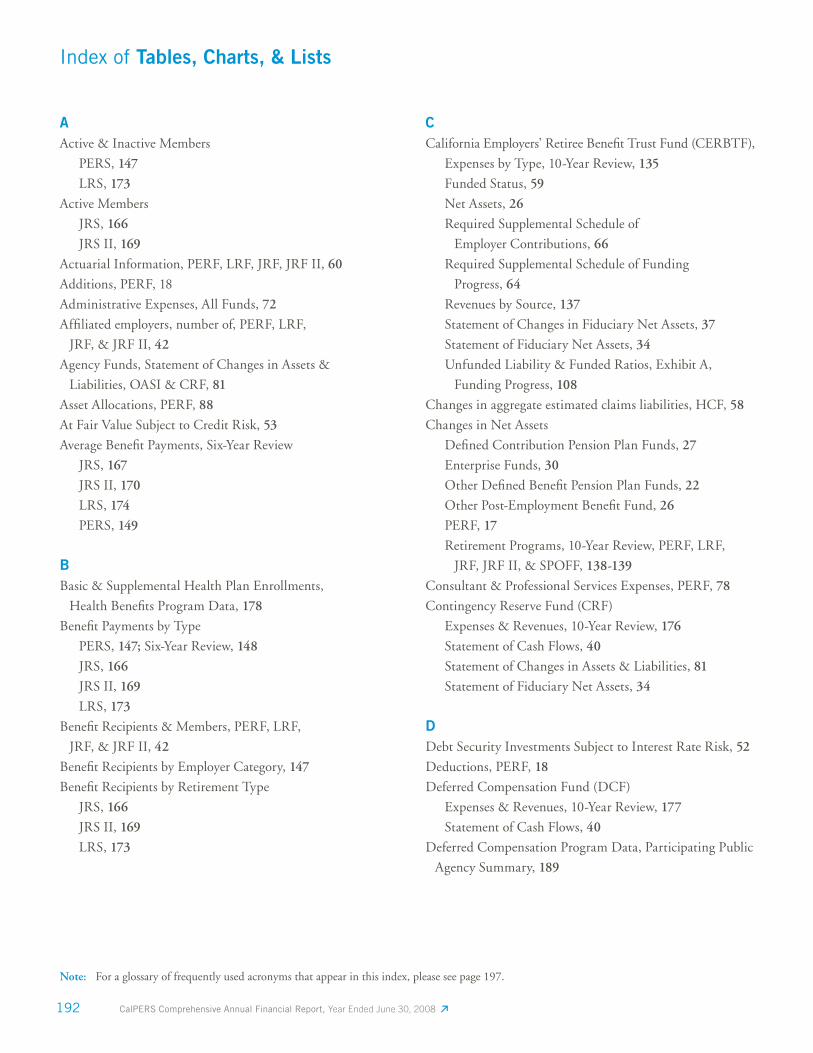
CalPERS Comprehensive Annual Financial Report, Year Ended June 30, 2008 192
Index of Tables, Charts, & Lists
AActive & Inactive Members
PERS, 147
LRS, 173
Active Members
JRS, 166
JRS II, 169
Actuarial Information, PERF, LRF, JRF, JRF II, 60
Additions, PERF, 18
Administrative Expenses, All Funds, 72
Affi liated employers, number of, PERF, LRF,
JRF, & JRF II, 42
Agency Funds, Statement of Changes in Assets &
Liabilities, OASI & CRF, 81
Asset Allocations, PERF, 88
At Fair Value Subject to Credit Risk, 53
Average Benefi t Payments, Six-Year Review
JRS, 167
JRS II, 170
LRS, 174
PERS, 149
BBasic & Supplemental Health Plan Enrollments,
Health Benefi ts Program Data, 178
Benefi t Payments by Type
PERS, 147; Six-Year Review, 148
JRS, 166
JRS II, 169
LRS, 173
Benefi t Recipients & Members, PERF, LRF,
JRF, & JRF II, 42
Benefi t Recipients by Employer Category, 147
Benefi t Recipients by Retirement Type
JRS, 166
JRS II, 169
LRS, 173
CCalifornia Employers’ Retiree Benefi t Trust Fund (CERBTF),
Expenses by Type, 10-Year Review, 135
Funded Status, 59
Net Assets, 26
Required Supplemental Schedule of
Employer Contributions, 66
Required Supplemental Schedule of Funding
Progress, 64
Revenues by Source, 137
Statement of Changes in Fiduciary Net Assets, 37
Statement of Fiduciary Net Assets, 34
Unfunded Liability & Funded Ratios, Exhibit A,
Funding Progress, 108
Changes in aggregate estimated claims liabilities, HCF, 58
Changes in Net Assets
Defi ned Contribution Pension Plan Funds, 27
Enterprise Funds, 30
Other Defi ned Benefi t Pension Plan Funds, 22
Other Post-Employment Benefi t Fund, 26
PERF, 17
Retirement Programs, 10-Year Review, PERF, LRF,
JRF, JRF II, & SPOFF, 138-139
Consultant & Professional Services Expenses, PERF, 78
Contingency Reserve Fund (CRF)
Expenses & Revenues, 10-Year Review, 176
Statement of Cash Flows, 40
Statement of Changes in Assets & Liabilities, 81
Statement of Fiduciary Net Assets, 34
DDebt Security Investments Subject to Interest Rate Risk, 52
Deductions, PERF, 18
Deferred Compensation Fund (DCF)
Expenses & Revenues, 10-Year Review, 177
Statement of Cash Flows, 40
Deferred Compensation Program Data, Participating Public
Agency Summary, 189
Note: For a glossary of frequently used acronyms that appear in this index, please see page 197.
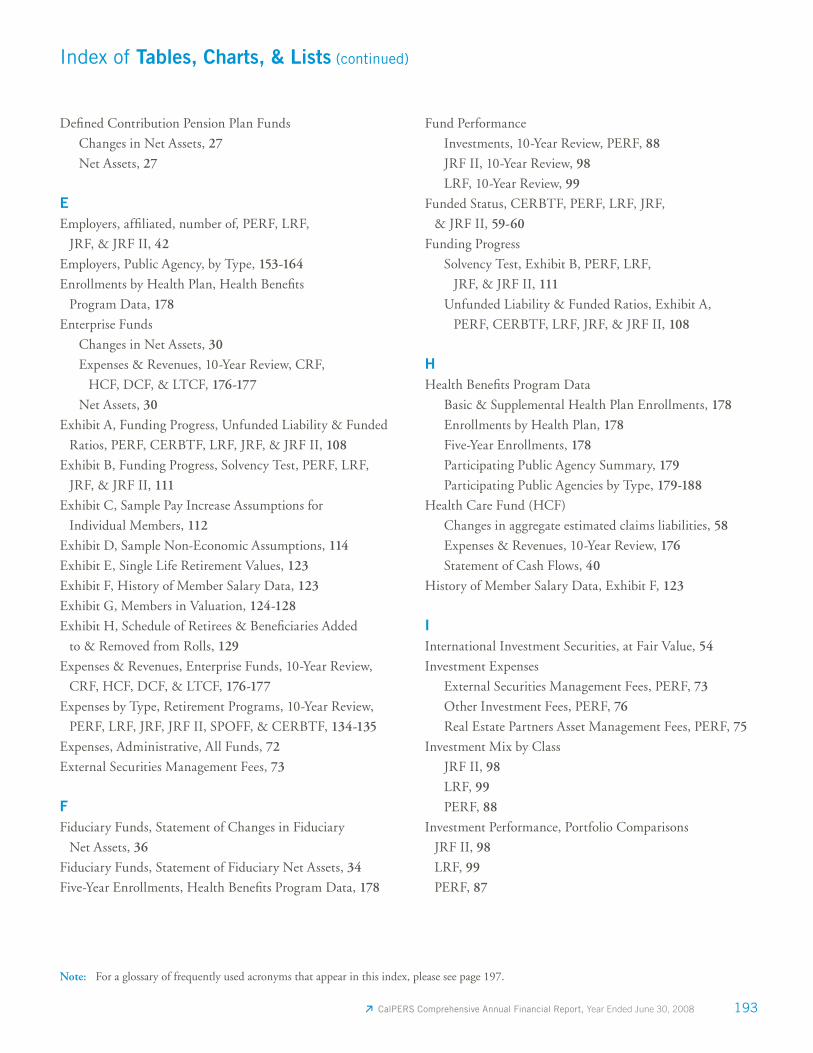
CalPERS Comprehensive Annual Financial Report, Year Ended June 30, 2008 193
Defi ned Contribution Pension Plan Funds
Changes in Net Assets, 27
Net Assets, 27
EEmployers, affi liated, number of, PERF, LRF,
JRF, & JRF II, 42
Employers, Public Agency, by Type, 153-164
Enrollments by Health Plan, Health Benefi ts
Program Data, 178
Enterprise Funds
Changes in Net Assets, 30
Expenses & Revenues, 10-Year Review, CRF,
HCF, DCF, & LTCF, 176-177
Net Assets, 30
Exhibit A, Funding Progress, Unfunded Liability & Funded
Ratios, PERF, CERBTF, LRF, JRF, & JRF II, 108
Exhibit B, Funding Progress, Solvency Test, PERF, LRF,
JRF, & JRF II, 111
Exhibit C, Sample Pay Increase Assumptions for
Individual Members, 112
Exhibit D, Sample Non-Economic Assumptions, 114
Exhibit E, Single Life Retirement Values, 123
Exhibit F, History of Member Salary Data, 123
Exhibit G, Members in Valuation, 124-128
Exhibit H, Schedule of Retirees & Benefi ciaries Added
to & Removed from Rolls, 129
Expenses & Revenues, Enterprise Funds, 10-Year Review,
CRF, HCF, DCF, & LTCF, 176-177
Expenses by Type, Retirement Programs, 10-Year Review,
PERF, LRF, JRF, JRF II, SPOFF, & CERBTF, 134-135
Expenses, Administrative, All Funds, 72
External Securities Management Fees, 73
FFiduciary Funds, Statement of Changes in Fiduciary
Net Assets, 36
Fiduciary Funds, Statement of Fiduciary Net Assets, 34
Five-Year Enrollments, Health Benefi ts Program Data, 178
Fund Performance
Investments, 10-Year Review, PERF, 88
JRF II, 10-Year Review, 98
LRF, 10-Year Review, 99
Funded Status, CERBTF, PERF, LRF, JRF,
& JRF II, 59-60
Funding Progress
Solvency Test, Exhibit B, PERF, LRF,
JRF, & JRF II, 111
Unfunded Liability & Funded Ratios, Exhibit A,
PERF, CERBTF, LRF, JRF, & JRF II, 108
HHealth Benefi ts Program Data
Basic & Supplemental Health Plan Enrollments, 178
Enrollments by Health Plan, 178
Five-Year Enrollments, 178
Participating Public Agency Summary, 179
Participating Public Agencies by Type, 179-188
Health Care Fund (HCF)
Changes in aggregate estimated claims liabilities, 58
Expenses & Revenues, 10-Year Review, 176
Statement of Cash Flows, 40
History of Member Salary Data, Exhibit F, 123
IInternational Investment Securities, at Fair Value, 54
Investment Expenses
External Securities Management Fees, PERF, 73
Other Investment Fees, PERF, 76
Real Estate Partners Asset Management Fees, PERF, 75
Investment Mix by Class
JRF II, 98
LRF, 99
PERF, 88
Investment Performance, Portfolio Comparisons
JRF II, 98
LRF, 99
PERF, 87
Index of Tables, Charts, & Lists (continued)
Note: For a glossary of frequently used acronyms that appear in this index, please see page 197.
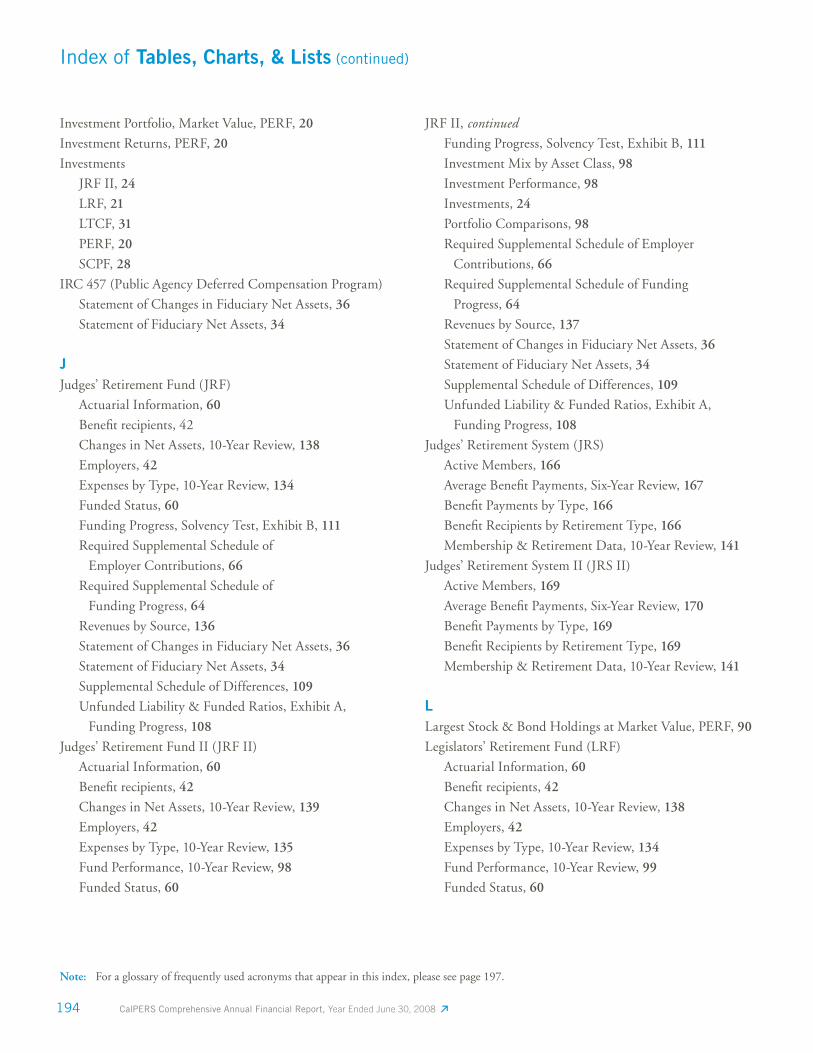
CalPERS Comprehensive Annual Financial Report, Year Ended June 30, 2008 194
Investment Portfolio, Market Value, PERF, 20
Investment Returns, PERF, 20
Investments
JRF II, 24
LRF, 21
LTCF, 31
PERF, 20
SCPF, 28
IRC 457 (Public Agency Deferred Compensation Program)
Statement of Changes in Fiduciary Net Assets, 36
Statement of Fiduciary Net Assets, 34
JJudges’ Retirement Fund (JRF)
Actuarial Information, 60
Benefi t recipients, 42
Changes in Net Assets, 10-Year Review, 138
Employers, 42
Expenses by Type, 10-Year Review, 134
Funded Status, 60
Funding Progress, Solvency Test, Exhibit B, 111
Required Supplemental Schedule of
Employer Contributions, 66
Required Supplemental Schedule of
Funding Progress, 64
Revenues by Source, 136
Statement of Changes in Fiduciary Net Assets, 36
Statement of Fiduciary Net Assets, 34
Supplemental Schedule of Differences, 109
Unfunded Liability & Funded Ratios, Exhibit A,
Funding Progress, 108
Judges’ Retirement Fund II (JRF II)
Actuarial Information, 60
Benefi t recipients, 42
Changes in Net Assets, 10-Year Review, 139
Employers, 42
Expenses by Type, 10-Year Review, 135
Fund Performance, 10-Year Review, 98
Funded Status, 60
JRF II, continued
Funding Progress, Solvency Test, Exhibit B, 111
Investment Mix by Asset Class, 98
Investment Performance, 98
Investments, 24
Portfolio Comparisons, 98
Required Supplemental Schedule of Employer
Contributions, 66
Required Supplemental Schedule of Funding
Progress, 64
Revenues by Source, 137
Statement of Changes in Fiduciary Net Assets, 36
Statement of Fiduciary Net Assets, 34
Supplemental Schedule of Differences, 109
Unfunded Liability & Funded Ratios, Exhibit A,
Funding Progress, 108
Judges’ Retirement System (JRS)
Active Members, 166
Average Benefi t Payments, Six-Year Review, 167
Benefi t Payments by Type, 166
Benefi t Recipients by Retirement Type, 166
Membership & Retirement Data, 10-Year Review, 141
Judges’ Retirement System II (JRS II)
Active Members, 169
Average Benefi t Payments, Six-Year Review, 170
Benefi t Payments by Type, 169
Benefi t Recipients by Retirement Type, 169
Membership & Retirement Data, 10-Year Review, 141
LLargest Stock & Bond Holdings at Market Value, PERF, 90
Legislators’ Retirement Fund (LRF)
Actuarial Information, 60
Benefi t recipients, 42
Changes in Net Assets, 10-Year Review, 138
Employers, 42
Expenses by Type, 10-Year Review, 134
Fund Performance, 10-Year Review, 99
Funded Status, 60
Index of Tables, Charts, & Lists (continued)
Note: For a glossary of frequently used acronyms that appear in this index, please see page 197.
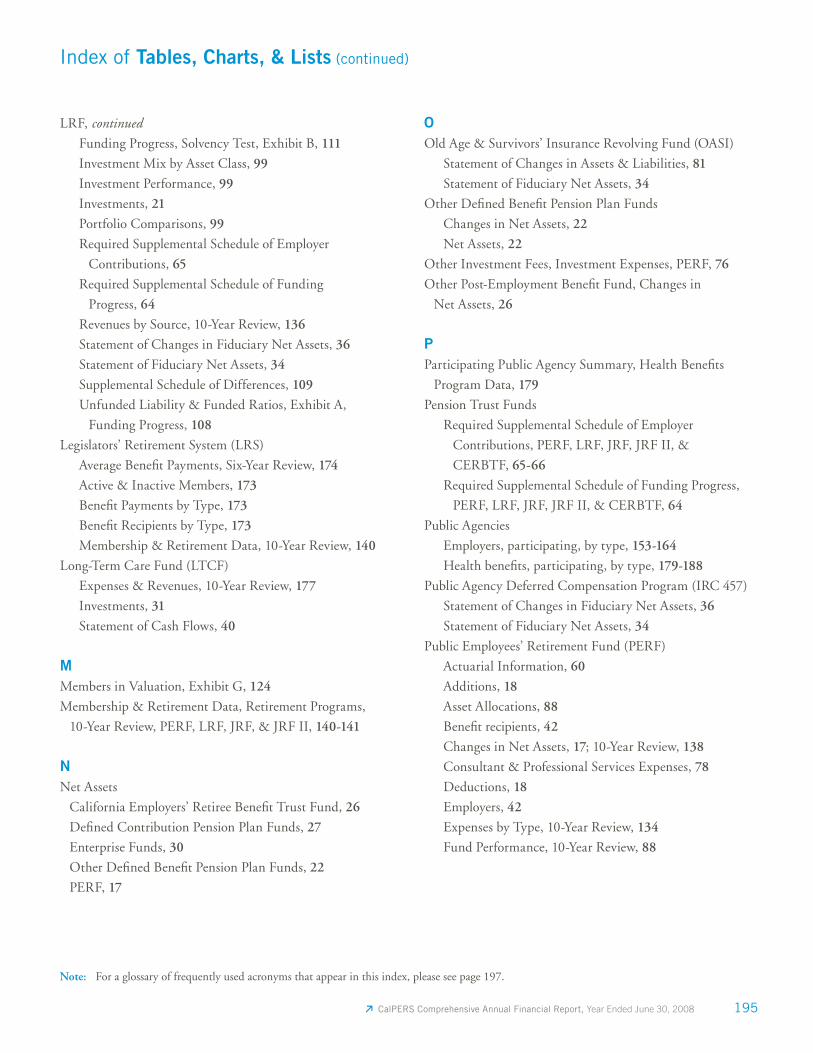
CalPERS Comprehensive Annual Financial Report, Year Ended June 30, 2008 195
LRF, continued
Funding Progress, Solvency Test, Exhibit B, 111
Investment Mix by Asset Class, 99
Investment Performance, 99
Investments, 21
Portfolio Comparisons, 99
Required Supplemental Schedule of Employer
Contributions, 65
Required Supplemental Schedule of Funding
Progress, 64
Revenues by Source, 10-Year Review, 136
Statement of Changes in Fiduciary Net Assets, 36
Statement of Fiduciary Net Assets, 34
Supplemental Schedule of Differences, 109
Unfunded Liability & Funded Ratios, Exhibit A,
Funding Progress, 108
Legislators’ Retirement System (LRS)
Average Benefi t Payments, Six-Year Review, 174
Active & Inactive Members, 173
Benefi t Payments by Type, 173
Benefi t Recipients by Type, 173
Membership & Retirement Data, 10-Year Review, 140
Long-Term Care Fund (LTCF)
Expenses & Revenues, 10-Year Review, 177
Investments, 31
Statement of Cash Flows, 40
MMembers in Valuation, Exhibit G, 124
Membership & Retirement Data, Retirement Programs,
10-Year Review, PERF, LRF, JRF, & JRF II, 140-141
NNet Assets
California Employers’ Retiree Benefi t Trust Fund, 26
Defi ned Contribution Pension Plan Funds, 27
Enterprise Funds, 30
Other Defi ned Benefi t Pension Plan Funds, 22
PERF, 17
OOld Age & Survivors’ Insurance Revolving Fund (OASI)
Statement of Changes in Assets & Liabilities, 81
Statement of Fiduciary Net Assets, 34
Other Defi ned Benefi t Pension Plan Funds
Changes in Net Assets, 22
Net Assets, 22
Other Investment Fees, Investment Expenses, PERF, 76
Other Post-Employment Benefi t Fund, Changes in
Net Assets, 26
PParticipating Public Agency Summary, Health Benefi ts
Program Data, 179
Pension Trust Funds
Required Supplemental Schedule of Employer
Contributions, PERF, LRF, JRF, JRF II, &
CERBTF, 65-66
Required Supplemental Schedule of Funding Progress,
PERF, LRF, JRF, JRF II, & CERBTF, 64
Public Agencies
Employers, participating, by type, 153-164
Health benefi ts, participating, by type, 179-188
Public Agency Deferred Compensation Program (IRC 457)
Statement of Changes in Fiduciary Net Assets, 36
Statement of Fiduciary Net Assets, 34
Public Employees’ Retirement Fund (PERF)
Actuarial Information, 60
Additions, 18
Asset Allocations, 88
Benefi t recipients, 42
Changes in Net Assets, 17; 10-Year Review, 138
Consultant & Professional Services Expenses, 78
Deductions, 18
Employers, 42
Expenses by Type, 10-Year Review, 134
Fund Performance, 10-Year Review, 88
Index of Tables, Charts, & Lists (continued)
Note: For a glossary of frequently used acronyms that appear in this index, please see page 197.
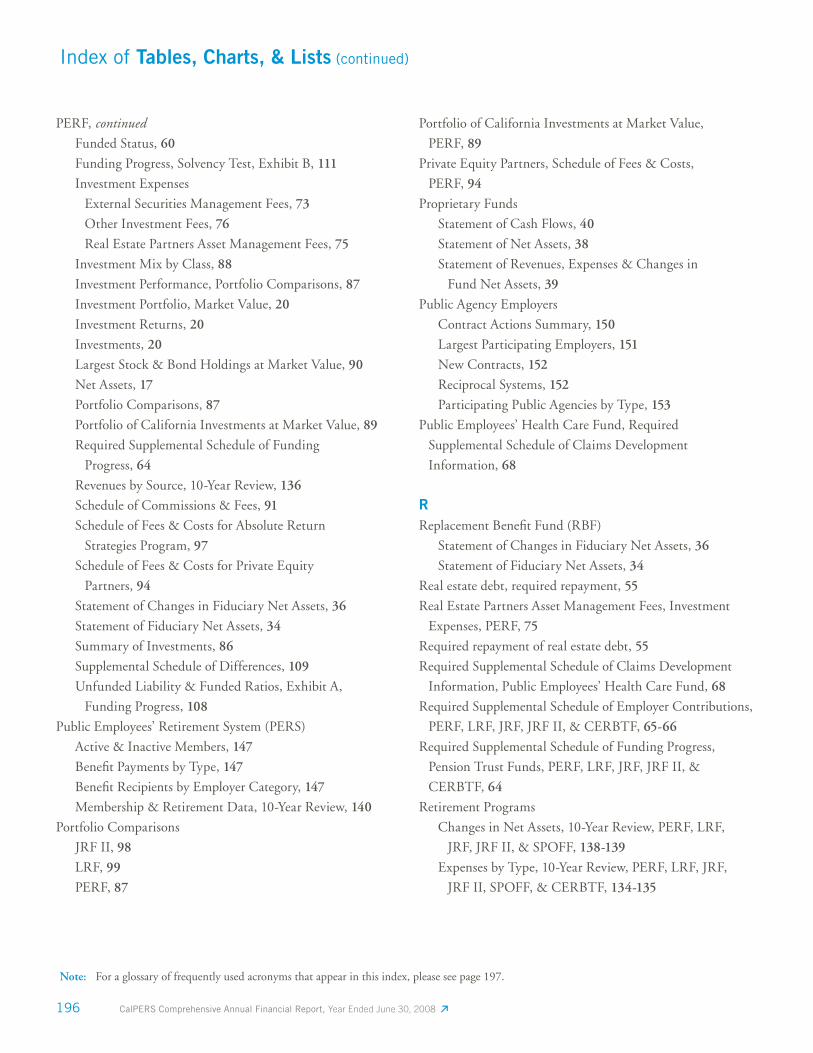
CalPERS Comprehensive Annual Financial Report, Year Ended June 30, 2008 196
PERF, continued
Funded Status, 60
Funding Progress, Solvency Test, Exhibit B, 111
Investment Expenses
External Securities Management Fees, 73
Other Investment Fees, 76
Real Estate Partners Asset Management Fees, 75
Investment Mix by Class, 88
Investment Performance, Portfolio Comparisons, 87
Investment Portfolio, Market Value, 20
Investment Returns, 20
Investments, 20
Largest Stock & Bond Holdings at Market Value, 90
Net Assets, 17
Portfolio Comparisons, 87
Portfolio of California Investments at Market Value, 89
Required Supplemental Schedule of Funding
Progress, 64
Revenues by Source, 10-Year Review, 136
Schedule of Commissions & Fees, 91
Schedule of Fees & Costs for Absolute Return
Strategies Program, 97
Schedule of Fees & Costs for Private Equity
Partners, 94
Statement of Changes in Fiduciary Net Assets, 36
Statement of Fiduciary Net Assets, 34
Summary of Investments, 86
Supplemental Schedule of Differences, 109
Unfunded Liability & Funded Ratios, Exhibit A,
Funding Progress, 108
Public Employees’ Retirement System (PERS)
Active & Inactive Members, 147
Benefi t Payments by Type, 147
Benefi t Recipients by Employer Category, 147
Membership & Retirement Data, 10-Year Review, 140
Portfolio Comparisons
JRF II, 98
LRF, 99
PERF, 87
Portfolio of California Investments at Market Value,
PERF, 89
Private Equity Partners, Schedule of Fees & Costs,
PERF, 94
Proprietary Funds
Statement of Cash Flows, 40
Statement of Net Assets, 38
Statement of Revenues, Expenses & Changes in
Fund Net Assets, 39
Public Agency Employers
Contract Actions Summary, 150
Largest Participating Employers, 151
New Contracts, 152
Reciprocal Systems, 152
Participating Public Agencies by Type, 153
Public Employees’ Health Care Fund, Required
Supplemental Schedule of Claims Development
Information, 68
RReplacement Benefi t Fund (RBF)
Statement of Changes in Fiduciary Net Assets, 36
Statement of Fiduciary Net Assets, 34
Real estate debt, required repayment, 55
Real Estate Partners Asset Management Fees, Investment
Expenses, PERF, 75
Required repayment of real estate debt, 55
Required Supplemental Schedule of Claims Development
Information, Public Employees’ Health Care Fund, 68
Required Supplemental Schedule of Employer Contributions,
PERF, LRF, JRF, JRF II, & CERBTF, 65-66
Required Supplemental Schedule of Funding Progress,
Pension Trust Funds, PERF, LRF, JRF, JRF II, &
CERBTF, 64
Retirement Programs
Changes in Net Assets, 10-Year Review, PERF, LRF,
JRF, JRF II, & SPOFF, 138-139
Expenses by Type, 10-Year Review, PERF, LRF, JRF,
JRF II, SPOFF, & CERBTF, 134-135
Index of Tables, Charts, & Lists (continued)
Note: For a glossary of frequently used acronyms that appear in this index, please see page 197.
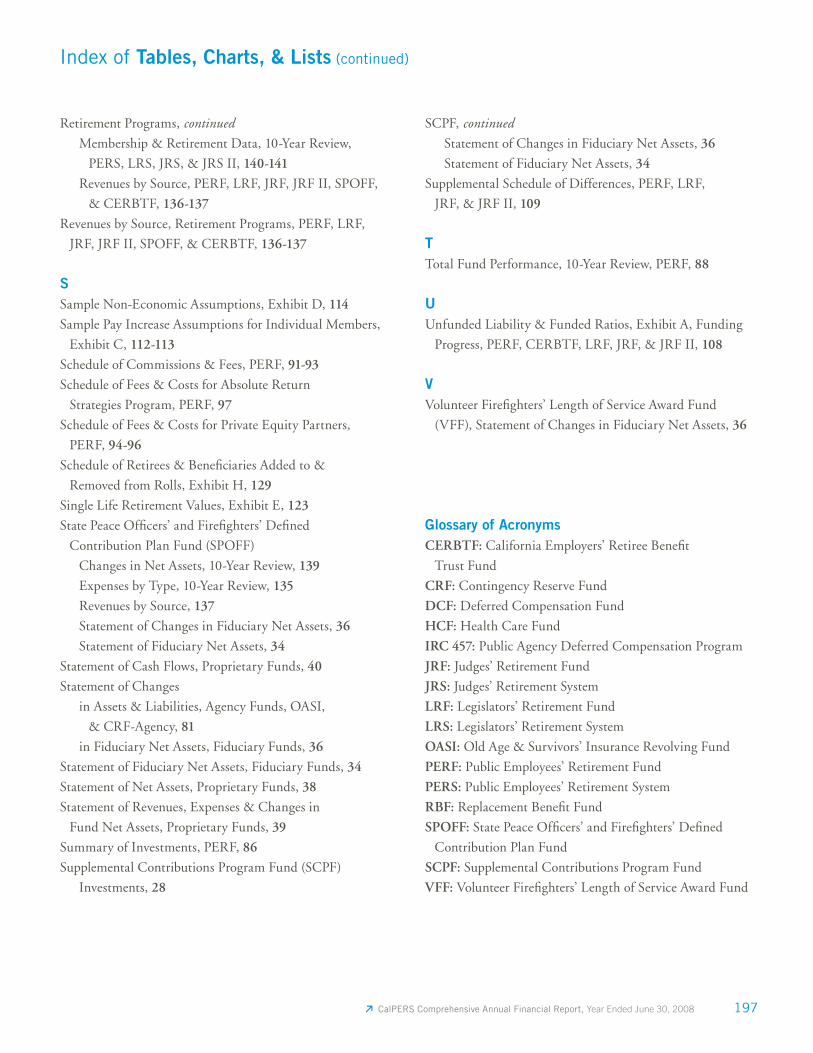
CalPERS Comprehensive Annual Financial Report, Year Ended June 30, 2008 197
Retirement Programs, continued
Membership & Retirement Data, 10-Year Review,
PERS, LRS, JRS, & JRS II, 140-141
Revenues by Source, PERF, LRF, JRF, JRF II, SPOFF,
& CERBTF, 136-137
Revenues by Source, Retirement Programs, PERF, LRF,
JRF, JRF II, SPOFF, & CERBTF, 136-137
SSample Non-Economic Assumptions, Exhibit D, 114
Sample Pay Increase Assumptions for Individual Members,
Exhibit C, 112-113
Schedule of Commissions & Fees, PERF, 91-93
Schedule of Fees & Costs for Absolute Return
Strategies Program, PERF, 97
Schedule of Fees & Costs for Private Equity Partners,
PERF, 94-96
Schedule of Retirees & Benefi ciaries Added to &
Removed from Rolls, Exhibit H, 129
Single Life Retirement Values, Exhibit E, 123
State Peace Offi cers’ and Firefi ghters’ Defi ned
Contribution Plan Fund (SPOFF)
Changes in Net Assets, 10-Year Review, 139
Expenses by Type, 10-Year Review, 135
Revenues by Source, 137
Statement of Changes in Fiduciary Net Assets, 36
Statement of Fiduciary Net Assets, 34
Statement of Cash Flows, Proprietary Funds, 40
Statement of Changes
in Assets & Liabilities, Agency Funds, OASI,
& CRF-Agency, 81
in Fiduciary Net Assets, Fiduciary Funds, 36
Statement of Fiduciary Net Assets, Fiduciary Funds, 34
Statement of Net Assets, Proprietary Funds, 38
Statement of Revenues, Expenses & Changes in
Fund Net Assets, Proprietary Funds, 39
Summary of Investments, PERF, 86
Supplemental Contributions Program Fund (SCPF)
Investments, 28
Index of Tables, Charts, & Lists (continued)
SCPF, continued
Statement of Changes in Fiduciary Net Assets, 36
Statement of Fiduciary Net Assets, 34
Supplemental Schedule of Differences, PERF, LRF,
JRF, & JRF II, 109
TTotal Fund Performance, 10-Year Review, PERF, 88
UUnfunded Liability & Funded Ratios, Exhibit A, Funding
Progress, PERF, CERBTF, LRF, JRF, & JRF II, 108
VVolunteer Firefi ghters’ Length of Service Award Fund
(VFF), Statement of Changes in Fiduciary Net Assets, 36
Glossary of Acronyms CERBTF: California Employers’ Retiree Benefi t
Trust Fund
CRF: Contingency Reserve Fund
DCF: Deferred Compensation Fund
HCF: Health Care Fund
IRC 457: Public Agency Deferred Compensation Program
JRF: Judges’ Retirement Fund
JRS: Judges’ Retirement System
LRF: Legislators’ Retirement Fund
LRS: Legislators’ Retirement System
OASI: Old Age & Survivors’ Insurance Revolving Fund
PERF: Public Employees’ Retirement Fund
PERS: Public Employees’ Retirement System
RBF: Replacement Benefi t Fund
SPOFF: State Peace Offi cers’ and Firefi ghters’ Defi ned
Contribution Plan Fund
SCPF: Supplemental Contributions Program Fund
VFF: Volunteer Firefi ghters’ Length of Service Award Fund
198 CalPERS Comprehensive Annual Financial Report, Year Ended June 30, 2008
100% PCW100% PCW
Environmental StewardshipCalPERS is committed to sustainability. The Fiscal Year
2007-08 CalPERS Comprehensive Annual Financial Report
and Operations Summary are printed on Mohawk Options
100 percent postconsumer paper, which is made with
process chlorine free 100 percent postconsumer recycled
waste fiber. The paper is certified by Green Seal 1 and the
printing process we utilized complies with the Forest
Stewardship Council (FSC) chain-of-custody certification.2
The paper was also manufactured using non-polluting,
wind-generated energy.
This project used 15,925 pounds of 100 percent
postconsumer recycled waste paper. The savings derived 3
from using this paper in lieu of virgin fiber paper is
equivalent to:
153 trees not cut down;•
441 lbs. of waterborne waste not created;•
65,480 gallons of wastewater flow saved;•
7,185 lbs. of solid waste not generated;•
14,148 lbs. of net greenhouse gases prevented; and•
108,290,000 BTUs of energy not consumed.•
Savings from the use of emission-free, wind-generated
electricity are equivalent to planting 497 trees or not driving
7,963 miles.
1 Green Seal is a non-profit organization dedicated to setting environmental standards, product certification, and public education. For more information, see www.greenseal.org.
2 FSC is an independent, non-governmental, not for profit organization that promotes environ-mentally appropriate, socially beneficial, and economically viable management of the world’s forests. FSC maintains an international certification and labeling system for products that come from responsibly managed forests and verified recycled sources. According to their Web site, www.fscus.org, forests are certified against a set of strict environmental and social standards, and fiber from certified forests is tracked from the forest, to producers, to the customer.
3 Values were derived from Mohawk Papers Interactive Environmental Savings Calculator available at www.mohawkpaper.com.
Please recycle.


California Public Employees’ Retirement SystemLincoln Plaza400 Q StreetP.O. Box 942701Sacramento, CA 94229-2701(916) 795-3991
♻ Printed on 100% recycled paper.
TTY: For Speech & Hearing Impaired(916) 795-3240(916) 795-3410 fax
www.calpers.ca.gov