Embed Size (px)
Citation preview
ARTICLE IN PRESS
Contents lists available at ScienceDirect
Journal of Aerosol Science
Journal of Aerosol Science 41 (2010) 541–552
0021-85
doi:10.1
� Cor
E-m
journal homepage: www.elsevier.com/locate/jaerosci
Emissions from a diesel car during regeneration of an active dieselparticulate filter
Harry Dwyer a,�, Alberto Ayala b,c, Sherry Zhang b, John Collins b, Tao Huai b,John Herner b, Wilson Chau b
a University of California, Department of Mechanical and Aerospace Engineering, Davis, CA, USAb California Air Resources Board, Research Division, 1001 I Street, Sacramento, CA 95812, USAc West Virginia University, Department of Mechanical and Aerospace Engineering, USA
a r t i c l e i n f o
Article history:
Received 23 November 2009
Received in revised form
25 March 2010
Accepted 3 April 2010
Keywords:
Diesel particulate matter
Particle number
Size distribution
Regeneration
02/$ - see front matter & 2010 Elsevier Ltd. A
016/j.jaerosci.2010.04.001
responding author.
ail address: [email protected] (H. Dwyer).
a b s t r a c t
The California Air Resources Board (CARB) and the Joint Research Center of the European
Commission (JRC) have collaborated on emissions testing of a light duty diesel vehicle,
which is Euro 4 compliant and comes equipped with a diesel particulate filter (DPF). The
California testing included an investigation of the regeneration of the DPF over cruise
conditions and NEDC test cycles. DPF regeneration is caused by the buildup of soot
in the filter, and for the present test vehicle the regeneration process is assisted by
a fuel borne catalyst. Regulated exhaust emissions increased substantially during the
regeneration events; however, PM emissions levels were below California LEVII
emissions standards. There was a very large increase of volatile particles between
5 and 10 nm, and these volatile particles were generated during all of the observed
regeneration events. It appears that the particle number instruments that use the PMP
methodology do not capture the PM mass increase during DPF regeneration; however,
for one regeneration event there was an apparent large increase in solid particles below
the PMP size limit. The PM mass increase associated with regeneration appears to be
due to semi-volatile particles collected on filters. During the testing, the regeneration
events exhibited considerable variations in the time for regeneration as well as the
amount of PM emissions. From this investigation, several questions have been posed
concerning the emission of very small (o20 nm) volatile and solid particles during DPF
regeneration that need further investigation.
& 2010 Elsevier Ltd. All rights reserved.
1. Introduction and background
The California Air Resources Board (CARB) and the Joint Research Center of the European Commission (JRC) havecollaborated on a number of research areas of mutual interest under a Memorandum of Understanding on Emissions from
Transport signed on October 2005. The CARB investigation was centered on a new solid particle number emissionmeasurement protocol developed under the Particulate Measurement Program (PMP). The PMP was launched under theauspices of the United Nation’s Economic Commission for Europe-Group of Experts on Pollution and Energy (Andersson,Giechaskiel, Munoz-Bueno, Sandbach, & Dilara, 2007). In addition to solid particle number, measurements of regulatedemissions, DPF regeneration emissions, evaporative emissions, and the chemical characterization of particle mass
ll rights reserved.
ARTICLE IN PRESS
H. Dwyer et al. / Journal of Aerosol Science 41 (2010) 541–552542
emissions were conducted. The PMP methodology has been shown to be 20 times more sensitive than traditionalgravimetric methods (Andersson et al., 2007), and it is planned to be an important complementary element to measure andanalyze diesel and gasoline particle mass and number emissions for new vehicles to be certified for emissions compliancefor Europe in the near future. Extensive testing of the newly proposed PMP sampling protocol was accomplished in Europeand Asia to verify the applicability and practicality of the proposed methodology at different laboratories.
A standard vehicle with a DPF, the ‘‘Golden Vehicle’’ (GV), was used as a reference and the GV was sent to Los Angeles inOctober 2006 for testing at the CARB’s Haagen Smit Laboratory. The Haagen Smit Laboratory has a newly equipped test celldedicated to clean vehicle testing, and the testing by CARB provides JRC with an additional data point for its inter-laboratory correlation exercise. The complete testing and reporting of the GV results have been placed in a CARB report(Ayala et al., 2008), and the readers of this paper are encourage to download this report in order to obtain more details. Inaddition to the GV investigation CARB has completed detailed PMP studies for heavy duty vehicles (HD), which involvedboth laboratory and on road testing with the use of the PMP methodology (Ayala et al., 2007; Herner et al., 2009; Herner,Robertson, & Ayala, 2007; Robertson, Herner, Ayala, & Durbin, 2007; Zhang, McMahon, Wei, Huai, & Ayala, 2008).Therefore, the GV program has advanced the knowledge of particulate matter emissions, and it will be very helpful infuture plans and actions for clean cars.
Besides the testing of the PMP methodology, enhanced emissions testing was carried out, which was not part of thePMP. The enhanced emissions testing program included measurements of particles generated during regeneration eventsof the DPF and of the chemical characteristics of the particle mass emissions. Both regeneration events and chemicalcharacteristics are not part of regulated emissions testing; however, they may be considered for regulation in the future. Atthe present time there are considerable interests in emissions from DPF regeneration events (Andersson et al., 2007;Bergmann & Kirchner, 2009; Bikas & Zervas, 2007; Cauda, Hernandez, Fino, Saracco, & Specchia, 2006; CRC Report, 2009;Giechaskiel et al., 2007), but it is difficult to directly relate the present work to these previous studies, since the type of DPF,test procedures, and instrumentation are different. DPF technology is a changing field that will evolve substantially in thecoming years, and the current CARB verification process for DPF regeneration is specific to each model and manufacturerof DPFs.
2. The Golden Vehicle and the testing equipment
The GV is a 2004 Peugeot 407 direct injection diesel passenger car equipped with a DPF, and it had a 2 l, turbocharged,and four cylinder engine. The GV represents a mature DPF technology present on the market and fully Euro 4 compliant(Blanchard et al., 2002; Cauda et al., 2006; CRC Report, 2009; Giechaskiel et al., 2007; Quigley & Seguelong, 2002). The DPFsystem consists of an oxidation catalyst upstream of an uncoated silicon carbide wall-flow DPF and a cerium based fuelborne catalyst to reduce the temperature needed for DPF regeneration. The cerium based fuel-born catalyst is housedseparately from the fuel tank, and the method of doping the fuel with fuel-born catalyst is controlled by the vehicle’s on-board dosing system. A regeneration event is triggered by pressure drop across the DPF, and the vehicle’s engine controlsystem utilizes strategies such as late cycle fuel-injection and exhaust gas recirculation (EGR), shut-off to generate anexotherm in order that diesel particles captured by the DPF can be oxidized during regeneration. The ideal process wouldoxidize hydrocarbons to carbon dioxide and water; however, for real world events both solid and volatile particles aregenerated in large numbers, as well as increased gaseous emissions. During the CARB testing three DPF regeneration eventswere observed, and each of these regeneration events had a different character due to the different type of tests that werebeing carried out. The specific details of each regeneration event have some different characteristics and they will bedescribed in the Results section.
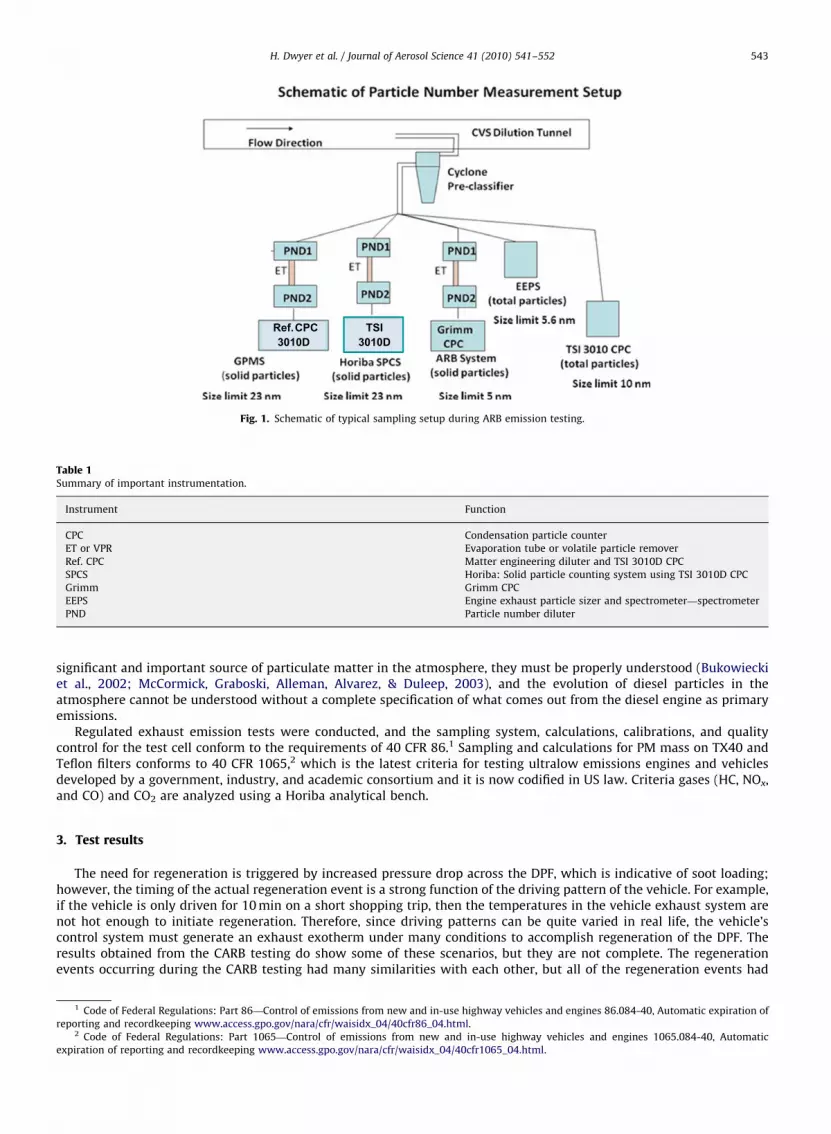
The GV was shipped with instrumentation described as the Golden Particle Measurement System (GPMS), which wasenhanced and slightly modified by CARB (Ayala et al., 2008). Fig. 1 shows the major components of the particlemeasurement system as used, and it consisted of the following parts: (a) a constant volume sampling full-flow dilutiontunnel of the type used commonly for vehicle/engine emissions testing for research and certification; (b) a cyclone with a2.5mm size cut-point, which is a new feature of new test methods proposed in the US and Europe, and all particlemeasurements were taken after the cyclone; (c) five independent particle counting systems with different features;however, the GPMS Gold CPC failed and it was replaced with a CARB reference CPC during the testing. Three of the countingsystems contained an evaporation tube (ET) or volatile particle remover (VRP) as recommended by the PMP protocol forremoval of volatile particles, while two did not, and this setup allowed us to differentiate been solid and total particles.(Note: A summary of the various instruments is given in Table 1.) The instruments used to measure solid particles areconnected to particle number diluters, and these are indicated by the letters PND1 and PND2 in Fig. 1.
During the last two decades there have been considerable advances in instrumentation to measure particulate matterfrom combustion sources (Bukowiecki et al., 2002; Burtscher et al., 2001), and diesel PM has been studied in detail due tothe health effects associated from this source (Wichmann & Peters, 2000). Some examples of the progress that has beenmade for measurements in diesel engines are given in the following references, Moosmuller et al. (2001a, 2001b), Matter,Siegmann, and Burtscher (1999), and Bukowiecki et al. (2002), and for the use of CPCs in diesel engine research seeRef. Sem (2002). Of particular importance to the present paper is the use of ETs to distinguish between solid particles andtotal particles (solid plus volatile particles) (Burtscher, Kunzel, & Huglin, 1998). Since emissions from diesel engines are a
ARTICLE IN PRESS
Ref.CPC3010D
TSI3010D
Fig. 1. Schematic of typical sampling setup during ARB emission testing.
Table 1Summary of important instrumentation.
Instrument Function
CPC Condensation particle counter
ET or VPR Evaporation tube or volatile particle remover
Ref. CPC Matter engineering diluter and TSI 3010D CPC
SPCS Horiba: Solid particle counting system using TSI 3010D CPC
Grimm Grimm CPC
EEPS Engine exhaust particle sizer and spectrometer—spectrometer
PND Particle number diluter
H. Dwyer et al. / Journal of Aerosol Science 41 (2010) 541–552 543
significant and important source of particulate matter in the atmosphere, they must be properly understood (Bukowieckiet al., 2002; McCormick, Graboski, Alleman, Alvarez, & Duleep, 2003), and the evolution of diesel particles in theatmosphere cannot be understood without a complete specification of what comes out from the diesel engine as primaryemissions.
Regulated exhaust emission tests were conducted, and the sampling system, calculations, calibrations, and qualitycontrol for the test cell conform to the requirements of 40 CFR 86.1 Sampling and calculations for PM mass on TX40 andTeflon filters conforms to 40 CFR 1065,2 which is the latest criteria for testing ultralow emissions engines and vehiclesdeveloped by a government, industry, and academic consortium and it is now codified in US law. Criteria gases (HC, NOx,and CO) and CO2 are analyzed using a Horiba analytical bench.
3. Test results
The need for regeneration is triggered by increased pressure drop across the DPF, which is indicative of soot loading;however, the timing of the actual regeneration event is a strong function of the driving pattern of the vehicle. For example,if the vehicle is only driven for 10 min on a short shopping trip, then the temperatures in the vehicle exhaust system arenot hot enough to initiate regeneration. Therefore, since driving patterns can be quite varied in real life, the vehicle’scontrol system must generate an exhaust exotherm under many conditions to accomplish regeneration of the DPF. Theresults obtained from the CARB testing do show some of these scenarios, but they are not complete. The regenerationevents occurring during the CARB testing had many similarities with each other, but all of the regeneration events had
1 Code of Federal Regulations: Part 86—Control of emissions from new and in-use highway vehicles and engines 86.084-40, Automatic expiration of
reporting and recordkeeping www.access.gpo.gov/nara/cfr/waisidx_04/40cfr86_04.html.2 Code of Federal Regulations: Part 1065—Control of emissions from new and in-use highway vehicles and engines 1065.084-40, Automatic
expiration of reporting and recordkeeping www.access.gpo.gov/nara/cfr/waisidx_04/40cfr1065_04.html.
ARTICLE IN PRESS
H. Dwyer et al. / Journal of Aerosol Science 41 (2010) 541–552544
significantly different characteristics. Shown in Table 2 is a list of the three regeneration events that occurred during theCARB testing and some of their characteristics. The details of the three regeneration events will be described in thefollowing sections.
3.1. Part I: the first regeneration event
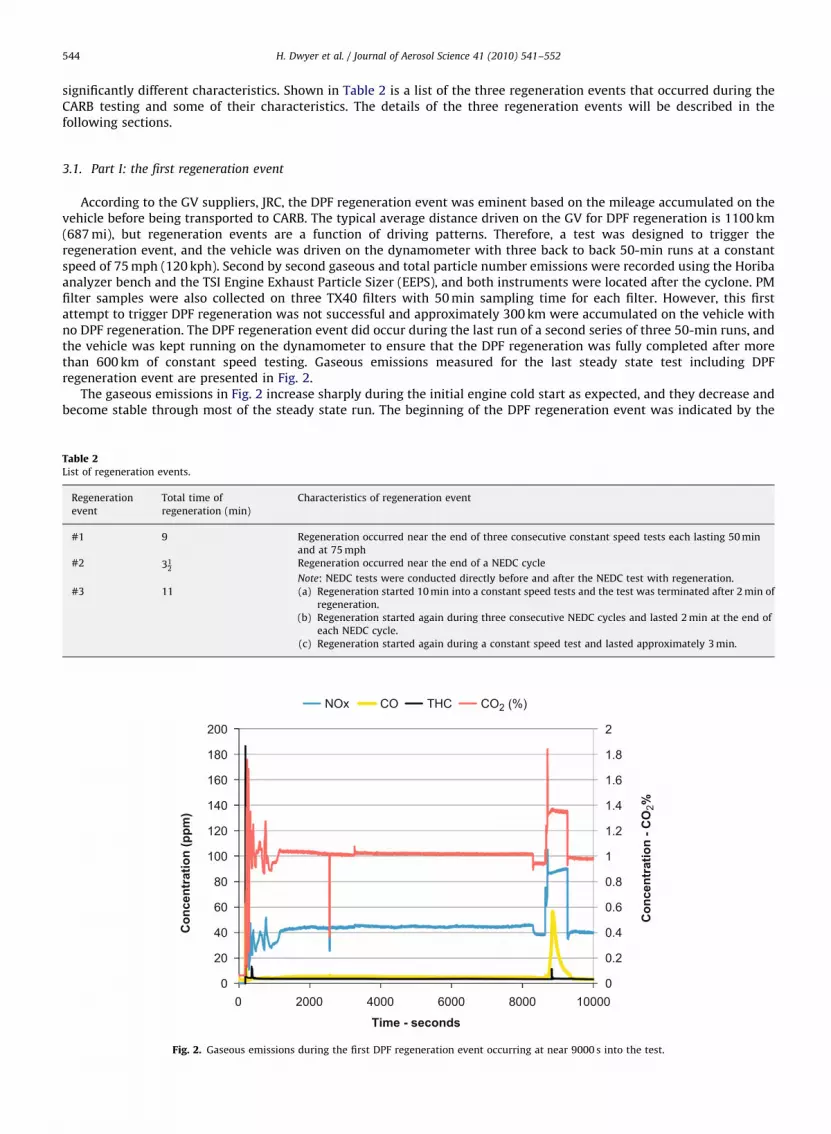
According to the GV suppliers, JRC, the DPF regeneration event was eminent based on the mileage accumulated on thevehicle before being transported to CARB. The typical average distance driven on the GV for DPF regeneration is 1100 km(687 mi), but regeneration events are a function of driving patterns. Therefore, a test was designed to trigger theregeneration event, and the vehicle was driven on the dynamometer with three back to back 50-min runs at a constantspeed of 75 mph (120 kph). Second by second gaseous and total particle number emissions were recorded using the Horibaanalyzer bench and the TSI Engine Exhaust Particle Sizer (EEPS), and both instruments were located after the cyclone. PMfilter samples were also collected on three TX40 filters with 50 min sampling time for each filter. However, this firstattempt to trigger DPF regeneration was not successful and approximately 300 km were accumulated on the vehicle withno DPF regeneration. The DPF regeneration event did occur during the last run of a second series of three 50-min runs, andthe vehicle was kept running on the dynamometer to ensure that the DPF regeneration was fully completed after morethan 600 km of constant speed testing. Gaseous emissions measured for the last steady state test including DPFregeneration event are presented in Fig. 2.
The gaseous emissions in Fig. 2 increase sharply during the initial engine cold start as expected, and they decrease andbecome stable through most of the steady state run. The beginning of the DPF regeneration event was indicated by the
Table 2List of regeneration events.
Regeneration
event
Total time of
regeneration (min)
Characteristics of regeneration event
#1 9 Regeneration occurred near the end of three consecutive constant speed tests each lasting 50 min
and at 75 mph
#2 312
Regeneration occurred near the end of a NEDC cycle
Note: NEDC tests were conducted directly before and after the NEDC test with regeneration.
#3 11 (a) Regeneration started 10 min into a constant speed tests and the test was terminated after 2 min of
regeneration.
(b) Regeneration started again during three consecutive NEDC cycles and lasted 2 min at the end of
each NEDC cycle.
(c) Regeneration started again during a constant speed test and lasted approximately 3 min.
0
0.2
0.4
0.6
0.8
1
1.2
1.4
1.6
1.8
2
0
20
40
60
80
100
120
140
160
180
200
0
NOx CO THC CO2 (%)
Con
cent
ratio
n - C
O2%
Con
cent
ratio
n (p
pm)
Time - seconds2000 4000 6000 8000 10000
Fig. 2. Gaseous emissions during the first DPF regeneration event occurring at near 9000 s into the test.
ARTICLE IN PRESS
H. Dwyer et al. / Journal of Aerosol Science 41 (2010) 541–552 545
sharp rise in the emission concentrations at approximately 9000 s into the cycle, and gaseous emissions increasesignificantly due to generation of an engine exotherm and subsequent regeneration, and peak concentrations for CO, NOx,CO2, and THC were 56.7, 104.9 ppm, 1.83% and 11.3 ppm, respectively. It was estimated that the period of DPF regenerationevent lasted approximately 9 min. Also, during this steady state run only the EEPS particle instrument was engaged tomonitor particle concentration emissions, which increased more than three orders of magnitude during the DPFregeneration. The particle concentration emissions could be higher since the true particle concentration levels were hiddenby the EEPS’s upper and lower measurement ranges. It will be shown from the other regeneration events that the majorityof the particles are volatile and the particle concentration increase may be at least five orders of magnitude.
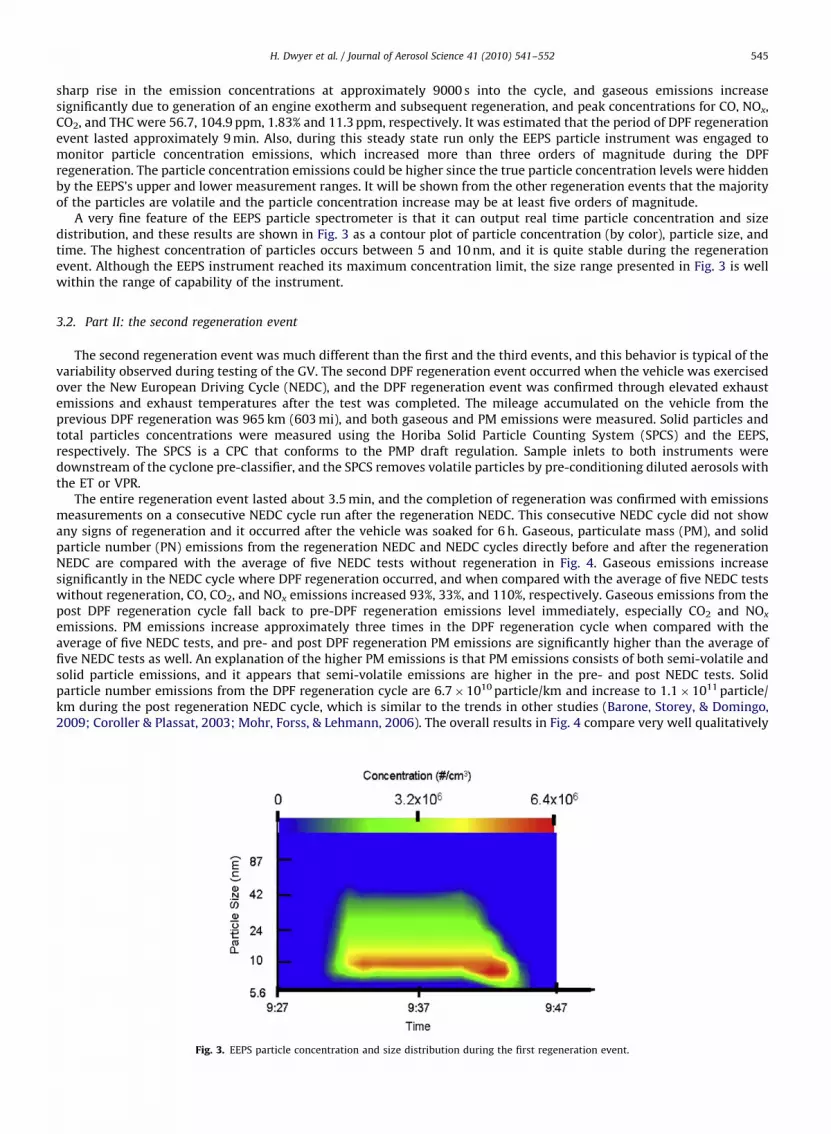
A very fine feature of the EEPS particle spectrometer is that it can output real time particle concentration and sizedistribution, and these results are shown in Fig. 3 as a contour plot of particle concentration (by color), particle size, andtime. The highest concentration of particles occurs between 5 and 10 nm, and it is quite stable during the regenerationevent. Although the EEPS instrument reached its maximum concentration limit, the size range presented in Fig. 3 is wellwithin the range of capability of the instrument.
3.2. Part II: the second regeneration event
The second regeneration event was much different than the first and the third events, and this behavior is typical of thevariability observed during testing of the GV. The second DPF regeneration event occurred when the vehicle was exercisedover the New European Driving Cycle (NEDC), and the DPF regeneration event was confirmed through elevated exhaustemissions and exhaust temperatures after the test was completed. The mileage accumulated on the vehicle from theprevious DPF regeneration was 965 km (603 mi), and both gaseous and PM emissions were measured. Solid particles andtotal particles concentrations were measured using the Horiba Solid Particle Counting System (SPCS) and the EEPS,respectively. The SPCS is a CPC that conforms to the PMP draft regulation. Sample inlets to both instruments weredownstream of the cyclone pre-classifier, and the SPCS removes volatile particles by pre-conditioning diluted aerosols withthe ET or VPR.
The entire regeneration event lasted about 3.5 min, and the completion of regeneration was confirmed with emissionsmeasurements on a consecutive NEDC cycle run after the regeneration NEDC. This consecutive NEDC cycle did not showany signs of regeneration and it occurred after the vehicle was soaked for 6 h. Gaseous, particulate mass (PM), and solidparticle number (PN) emissions from the regeneration NEDC and NEDC cycles directly before and after the regenerationNEDC are compared with the average of five NEDC tests without regeneration in Fig. 4. Gaseous emissions increasesignificantly in the NEDC cycle where DPF regeneration occurred, and when compared with the average of five NEDC testswithout regeneration, CO, CO2, and NOx emissions increased 93%, 33%, and 110%, respectively. Gaseous emissions from thepost DPF regeneration cycle fall back to pre-DPF regeneration emissions level immediately, especially CO2 and NOx
emissions. PM emissions increase approximately three times in the DPF regeneration cycle when compared with theaverage of five NEDC tests, and pre- and post DPF regeneration PM emissions are significantly higher than the average offive NEDC tests as well. An explanation of the higher PM emissions is that PM emissions consists of both semi-volatile andsolid particle emissions, and it appears that semi-volatile emissions are higher in the pre- and post NEDC tests. Solidparticle number emissions from the DPF regeneration cycle are 6.7�1010 particle/km and increase to 1.1�1011 particle/km during the post regeneration NEDC cycle, which is similar to the trends in other studies (Barone, Storey, & Domingo,2009; Coroller & Plassat, 2003; Mohr, Forss, & Lehmann, 2006). The overall results in Fig. 4 compare very well qualitatively
Fig. 3. EEPS particle concentration and size distribution during the first regeneration event.
ARTICLE IN PRESS
H. Dwyer et al. / Journal of Aerosol Science 41 (2010) 541–552546
with regeneration emissions measurements on a Peugeot 607 vehicle (Coroller & Plassat, 2003), which has a similar ceriumbased DPF system. It should be mentioned that the covariance for the normal NEDC tests was high for both particle numberand THC, 48% and 22%, respectively, while all other measurements in Fig. 4 had covariance less than 20%.
Although a clear increase in PM emissions during regeneration was observed, the measured PM levels duringregeneration still fall far below EURO 4 levels, and with a value of 1.8 mg/km they are approximately three times lowerthan California SULEV LEVII standards of 6.25 mg/km. The NOx emissions are indeed much higher than SULEV LEVIIstandards at 560 mg/km, and this was expected, since the GV is a diesel vehicle that did not have any of the advancedaftertreatment systems planned for the future diesel engines. For completeness the CO levels where better than SULEV IIstandards of 0.6 g/km, while total hydrocarbons (THC), were above the SULEV II standards of 6.25 mg/km.
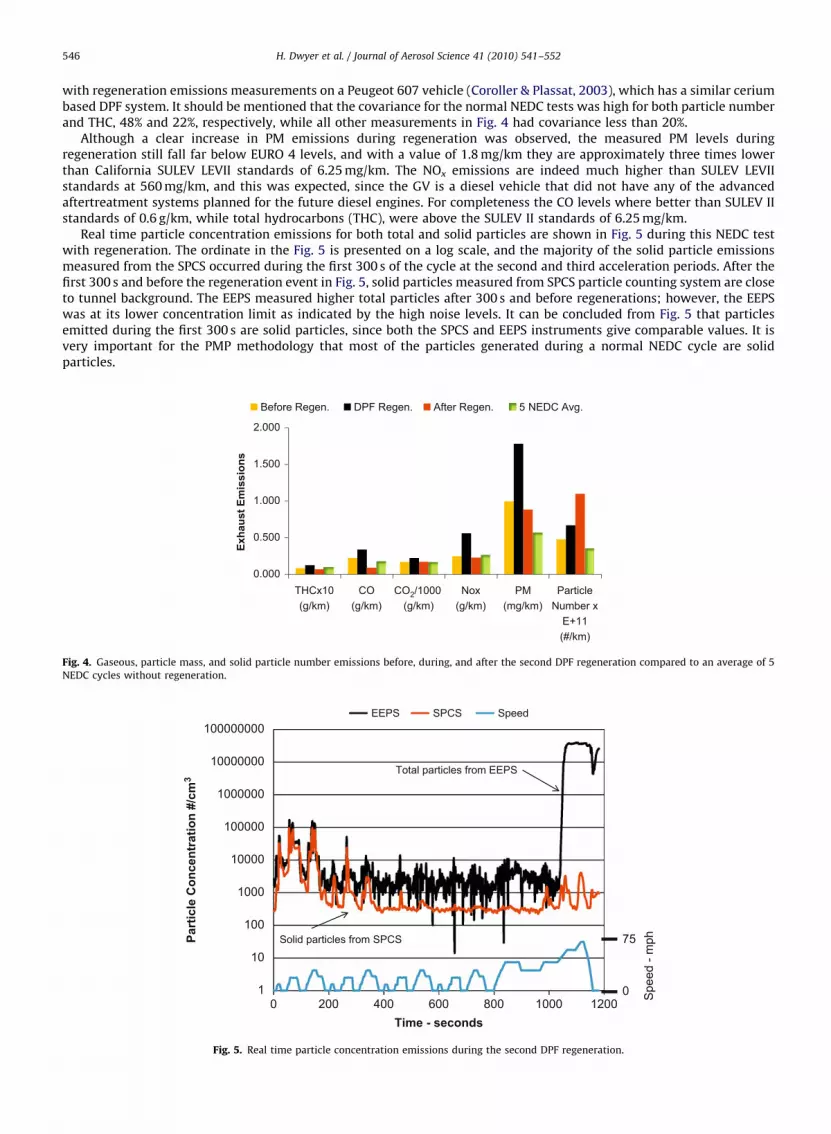
Real time particle concentration emissions for both total and solid particles are shown in Fig. 5 during this NEDC testwith regeneration. The ordinate in the Fig. 5 is presented on a log scale, and the majority of the solid particle emissionsmeasured from the SPCS occurred during the first 300 s of the cycle at the second and third acceleration periods. After thefirst 300 s and before the regeneration event in Fig. 5, solid particles measured from SPCS particle counting system are closeto tunnel background. The EEPS measured higher total particles after 300 s and before regenerations; however, the EEPSwas at its lower concentration limit as indicated by the high noise levels. It can be concluded from Fig. 5 that particlesemitted during the first 300 s are solid particles, since both the SPCS and EEPS instruments give comparable values. It isvery important for the PMP methodology that most of the particles generated during a normal NEDC cycle are solidparticles.
0.000
0.500
1.000
1.500
2.000
THCx10(g/km)
CO(g/km)
CO2/1000(g/km)
Nox(g/km)
PM(mg/km)
ParticleNumber x
E+11(#/km)
Exha
ust E
mis
sion
s
Before Regen. DPF Regen. After Regen. 5 NEDC Avg.
Fig. 4. Gaseous, particle mass, and solid particle number emissions before, during, and after the second DPF regeneration compared to an average of 5
NEDC cycles without regeneration.
1
10
100
1000
10000
100000
1000000
10000000
100000000
0
Part
icle
Con
cent
ratio
n #/
cm3
Time - seconds
EEPS SPCS Speed
Spe
ed -
mph75
0
Total particles from EEPS
Solid particles from SPCS
200 400 600 800 1000 1200
Fig. 5. Real time particle concentration emissions during the second DPF regeneration.
ARTICLE IN PRESS
H. Dwyer et al. / Journal of Aerosol Science 41 (2010) 541–552 547
At the start of regeneration total particle numbers increased at least three orders of magnitude measured from the EEPSand reached peak concentrations of 3.7�107 particle/cm3, which is the same upper limit reached during all other DPFregeneration events. The SPCS CPC only showed a very modest increase of solid particles during regeneration, and thenumber of solid particles during regeneration is small compared to the first 300 s of the NEDC cycle. The SPCS dataindicates that the vast majority of particles released during regeneration are volatile particle, and the SPCS solid particledata does not indicate anything near the three-fold increase of PM measured by the PM filters.
With the use of Figs. 4 and 5 insights can be gained into some differences between particle number emissions and PMemissions. Particle number emissions are a function of the loading of the DPF, and they are the lowest when the DPF isloaded before regeneration. During regeneration they increase due to unloading caused by regeneration, and they are thehighest when the DPF is unloaded after regeneration. PM emissions are by far the highest during regeneration, and thisincrease points to semi-volatile matter contributing to the PM collected on the standard filter materials. The total particlesmeasured by the EEPS and solid particles measured by the SPCS in Fig. 5 are a confirmation of the PM increase due tovolatile particles and the particle number increases in Fig. 4 during and after the regeneration event.
3.3. Part III: the third regeneration event
The most complex regeneration event was the final one, and extensive instrumentation was employed during this eventto measure emissions. The DPF regeneration event was expected to occur at approximately 1100 km; however, after manyconstant speed and NEDC runs regeneration did finally occur when 1700 km were accumulated on the vehicle. Also, thisfinal regeneration was spread out over five different and consecutive tests on the vehicle.
3.4. Section 1
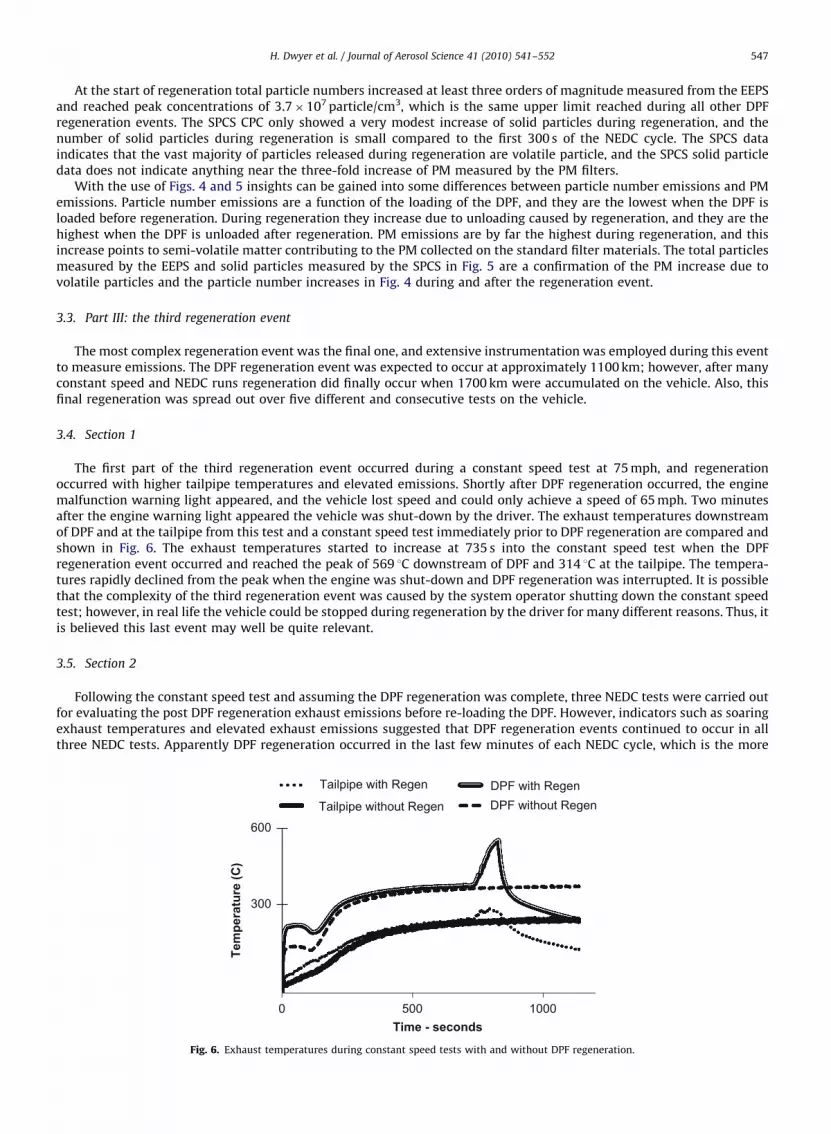
The first part of the third regeneration event occurred during a constant speed test at 75 mph, and regenerationoccurred with higher tailpipe temperatures and elevated emissions. Shortly after DPF regeneration occurred, the enginemalfunction warning light appeared, and the vehicle lost speed and could only achieve a speed of 65 mph. Two minutesafter the engine warning light appeared the vehicle was shut-down by the driver. The exhaust temperatures downstreamof DPF and at the tailpipe from this test and a constant speed test immediately prior to DPF regeneration are compared andshown in Fig. 6. The exhaust temperatures started to increase at 735 s into the constant speed test when the DPFregeneration event occurred and reached the peak of 569 1C downstream of DPF and 314 1C at the tailpipe. The tempera-tures rapidly declined from the peak when the engine was shut-down and DPF regeneration was interrupted. It is possiblethat the complexity of the third regeneration event was caused by the system operator shutting down the constant speedtest; however, in real life the vehicle could be stopped during regeneration by the driver for many different reasons. Thus, itis believed this last event may well be quite relevant.
3.5. Section 2
Following the constant speed test and assuming the DPF regeneration was complete, three NEDC tests were carried outfor evaluating the post DPF regeneration exhaust emissions before re-loading the DPF. However, indicators such as soaringexhaust temperatures and elevated exhaust emissions suggested that DPF regeneration events continued to occur in allthree NEDC tests. Apparently DPF regeneration occurred in the last few minutes of each NEDC cycle, which is the more
0 500 1000
Tem
pera
ture
(C)
Time - seconds
600
300
Tailpipe with Regen
Tailpipe without Regen
DPF with RegenDPF without Regen
Fig. 6. Exhaust temperatures during constant speed tests with and without DPF regeneration.
ARTICLE IN PRESS
H. Dwyer et al. / Journal of Aerosol Science 41 (2010) 541–552548
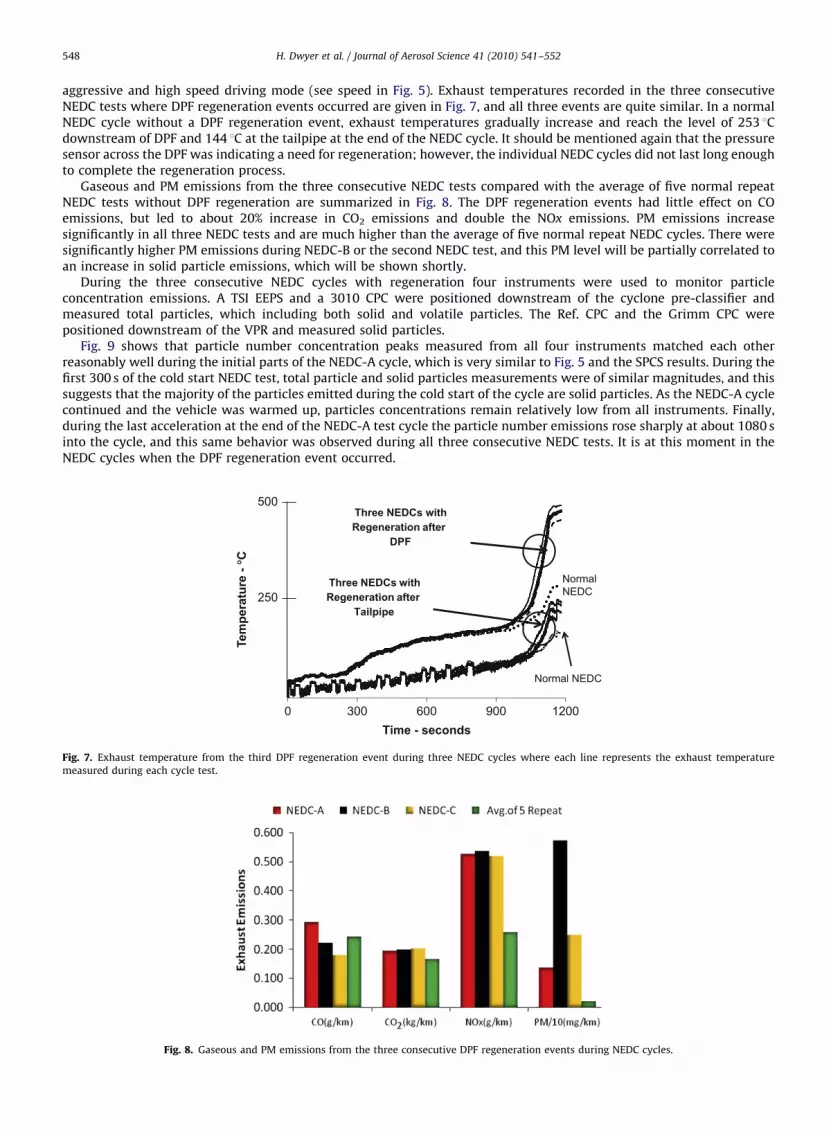
aggressive and high speed driving mode (see speed in Fig. 5). Exhaust temperatures recorded in the three consecutiveNEDC tests where DPF regeneration events occurred are given in Fig. 7, and all three events are quite similar. In a normalNEDC cycle without a DPF regeneration event, exhaust temperatures gradually increase and reach the level of 253 1Cdownstream of DPF and 144 1C at the tailpipe at the end of the NEDC cycle. It should be mentioned again that the pressuresensor across the DPF was indicating a need for regeneration; however, the individual NEDC cycles did not last long enoughto complete the regeneration process.
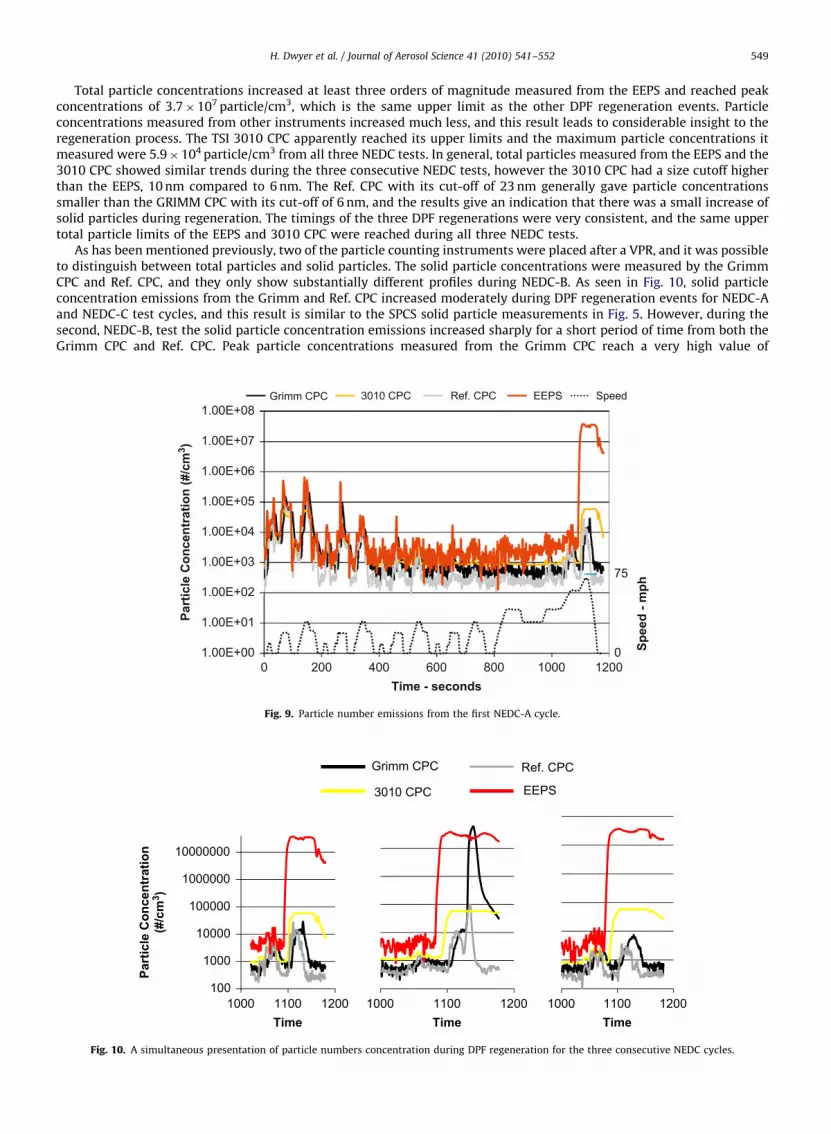
Gaseous and PM emissions from the three consecutive NEDC tests compared with the average of five normal repeatNEDC tests without DPF regeneration are summarized in Fig. 8. The DPF regeneration events had little effect on COemissions, but led to about 20% increase in CO2 emissions and double the NOx emissions. PM emissions increasesignificantly in all three NEDC tests and are much higher than the average of five normal repeat NEDC cycles. There weresignificantly higher PM emissions during NEDC-B or the second NEDC test, and this PM level will be partially correlated toan increase in solid particle emissions, which will be shown shortly.
During the three consecutive NEDC cycles with regeneration four instruments were used to monitor particleconcentration emissions. A TSI EEPS and a 3010 CPC were positioned downstream of the cyclone pre-classifier andmeasured total particles, which including both solid and volatile particles. The Ref. CPC and the Grimm CPC werepositioned downstream of the VPR and measured solid particles.
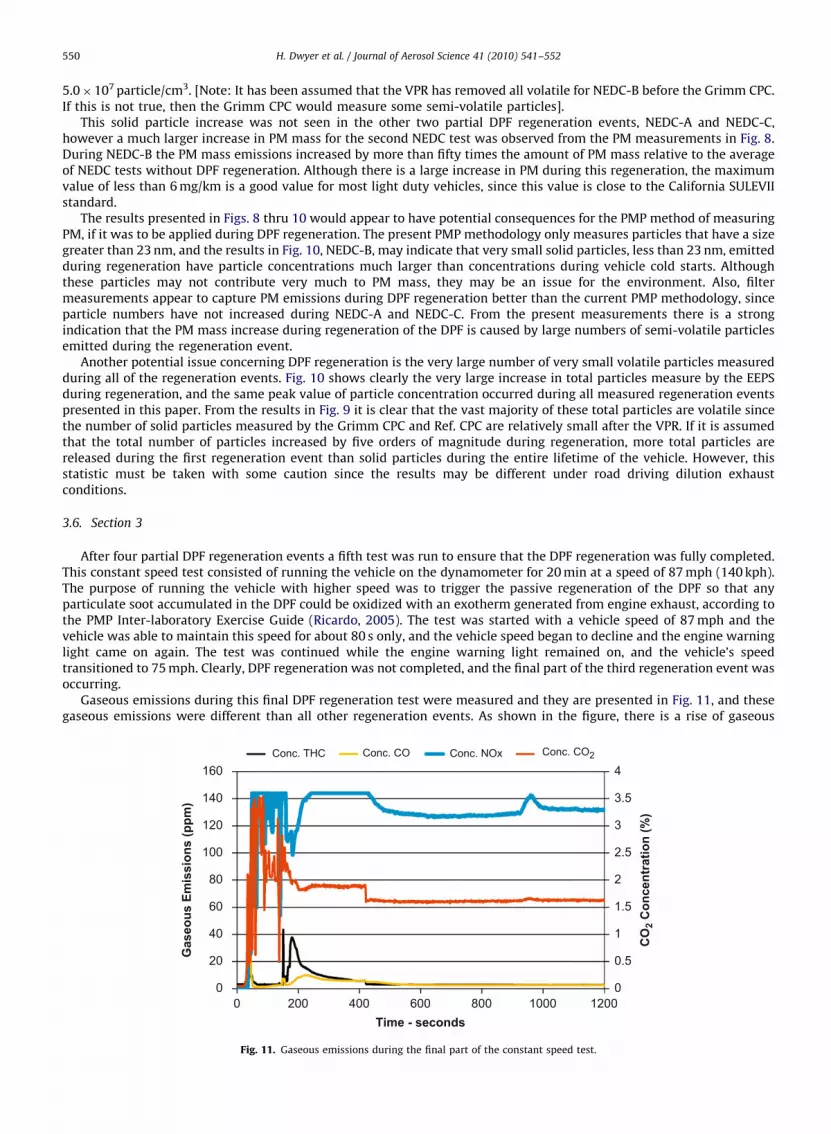
Fig. 9 shows that particle number concentration peaks measured from all four instruments matched each otherreasonably well during the initial parts of the NEDC-A cycle, which is very similar to Fig. 5 and the SPCS results. During thefirst 300 s of the cold start NEDC test, total particle and solid particles measurements were of similar magnitudes, and thissuggests that the majority of the particles emitted during the cold start of the cycle are solid particles. As the NEDC-A cyclecontinued and the vehicle was warmed up, particles concentrations remain relatively low from all instruments. Finally,during the last acceleration at the end of the NEDC-A test cycle the particle number emissions rose sharply at about 1080 sinto the cycle, and this same behavior was observed during all three consecutive NEDC tests. It is at this moment in theNEDC cycles when the DPF regeneration event occurred.
0
Tem
pera
ture
- °°C
Time - seconds
Three NEDCs withRegeneration after
Tailpipe
Three NEDCs withRegeneration after
DPF
NormalNEDC
Normal NEDC
500
250
300 600 900 1200
Fig. 7. Exhaust temperature from the third DPF regeneration event during three NEDC cycles where each line represents the exhaust temperature
measured during each cycle test.
Fig. 8. Gaseous and PM emissions from the three consecutive DPF regeneration events during NEDC cycles.
ARTICLE IN PRESS
H. Dwyer et al. / Journal of Aerosol Science 41 (2010) 541–552 549
Total particle concentrations increased at least three orders of magnitude measured from the EEPS and reached peakconcentrations of 3.7�107 particle/cm3, which is the same upper limit as the other DPF regeneration events. Particleconcentrations measured from other instruments increased much less, and this result leads to considerable insight to theregeneration process. The TSI 3010 CPC apparently reached its upper limits and the maximum particle concentrations itmeasured were 5.9�104 particle/cm3 from all three NEDC tests. In general, total particles measured from the EEPS and the3010 CPC showed similar trends during the three consecutive NEDC tests, however the 3010 CPC had a size cutoff higherthan the EEPS, 10 nm compared to 6 nm. The Ref. CPC with its cut-off of 23 nm generally gave particle concentrationssmaller than the GRIMM CPC with its cut-off of 6 nm, and the results give an indication that there was a small increase ofsolid particles during regeneration. The timings of the three DPF regenerations were very consistent, and the same uppertotal particle limits of the EEPS and 3010 CPC were reached during all three NEDC tests.
As has been mentioned previously, two of the particle counting instruments were placed after a VPR, and it was possibleto distinguish between total particles and solid particles. The solid particle concentrations were measured by the GrimmCPC and Ref. CPC, and they only show substantially different profiles during NEDC-B. As seen in Fig. 10, solid particleconcentration emissions from the Grimm and Ref. CPC increased moderately during DPF regeneration events for NEDC-Aand NEDC-C test cycles, and this result is similar to the SPCS solid particle measurements in Fig. 5. However, during thesecond, NEDC-B, test the solid particle concentration emissions increased sharply for a short period of time from both theGrimm CPC and Ref. CPC. Peak particle concentrations measured from the Grimm CPC reach a very high value of
1.00E+00
1.00E+01
1.00E+02
1.00E+03
1.00E+04
1.00E+05
1.00E+06
1.00E+07
1.00E+08
0
Spee
d - m
ph
Part
icle
Con
cent
ratio
n (#
/cm
3 )
Time - seconds
Grimm CPC 3010 CPC Ref. CPC EEPS Speed
0
75
200 400 600 800 1000 1200
Fig. 9. Particle number emissions from the first NEDC-A cycle.
Time
100
1000
10000
100000
1000000
10000000
1000
Part
icle
Con
cent
ratio
n(#
/cm
3 )
Time Time
Grimm CPC
3010 CPC
Ref. CPC
EEPS
1100 1200 1000 1100 1200 1000 1100 1200
Fig. 10. A simultaneous presentation of particle numbers concentration during DPF regeneration for the three consecutive NEDC cycles.
ARTICLE IN PRESS
H. Dwyer et al. / Journal of Aerosol Science 41 (2010) 541–552550
5.0�107 particle/cm3. [Note: It has been assumed that the VPR has removed all volatile for NEDC-B before the Grimm CPC.If this is not true, then the Grimm CPC would measure some semi-volatile particles].
This solid particle increase was not seen in the other two partial DPF regeneration events, NEDC-A and NEDC-C,however a much larger increase in PM mass for the second NEDC test was observed from the PM measurements in Fig. 8.During NEDC-B the PM mass emissions increased by more than fifty times the amount of PM mass relative to the averageof NEDC tests without DPF regeneration. Although there is a large increase in PM during this regeneration, the maximumvalue of less than 6 mg/km is a good value for most light duty vehicles, since this value is close to the California SULEVIIstandard.
The results presented in Figs. 8 thru 10 would appear to have potential consequences for the PMP method of measuringPM, if it was to be applied during DPF regeneration. The present PMP methodology only measures particles that have a sizegreater than 23 nm, and the results in Fig. 10, NEDC-B, may indicate that very small solid particles, less than 23 nm, emittedduring regeneration have particle concentrations much larger than concentrations during vehicle cold starts. Althoughthese particles may not contribute very much to PM mass, they may be an issue for the environment. Also, filtermeasurements appear to capture PM emissions during DPF regeneration better than the current PMP methodology, sinceparticle numbers have not increased during NEDC-A and NEDC-C. From the present measurements there is a strongindication that the PM mass increase during regeneration of the DPF is caused by large numbers of semi-volatile particlesemitted during the regeneration event.
Another potential issue concerning DPF regeneration is the very large number of very small volatile particles measuredduring all of the regeneration events. Fig. 10 shows clearly the very large increase in total particles measure by the EEPSduring regeneration, and the same peak value of particle concentration occurred during all measured regeneration eventspresented in this paper. From the results in Fig. 9 it is clear that the vast majority of these total particles are volatile sincethe number of solid particles measured by the Grimm CPC and Ref. CPC are relatively small after the VPR. If it is assumedthat the total number of particles increased by five orders of magnitude during regeneration, more total particles arereleased during the first regeneration event than solid particles during the entire lifetime of the vehicle. However, thisstatistic must be taken with some caution since the results may be different under road driving dilution exhaustconditions.
3.6. Section 3
After four partial DPF regeneration events a fifth test was run to ensure that the DPF regeneration was fully completed.This constant speed test consisted of running the vehicle on the dynamometer for 20 min at a speed of 87 mph (140 kph).The purpose of running the vehicle with higher speed was to trigger the passive regeneration of the DPF so that anyparticulate soot accumulated in the DPF could be oxidized with an exotherm generated from engine exhaust, according tothe PMP Inter-laboratory Exercise Guide (Ricardo, 2005). The test was started with a vehicle speed of 87 mph and thevehicle was able to maintain this speed for about 80 s only, and the vehicle speed began to decline and the engine warninglight came on again. The test was continued while the engine warning light remained on, and the vehicle’s speedtransitioned to 75 mph. Clearly, DPF regeneration was not completed, and the final part of the third regeneration event wasoccurring.
Gaseous emissions during this final DPF regeneration test were measured and they are presented in Fig. 11, and thesegaseous emissions were different than all other regeneration events. As shown in the figure, there is a rise of gaseous
0
0.5
1
1.5
2
2.5
3
3.5
4
0
20
40
60
80
100
120
140
160
0
CO
2 Con
cent
ratio
n (%
)
Gas
eous
Em
issi
ons
(ppm
)
Time - seconds
Conc. THC Conc. CO Conc. NOx Conc. CO2
200 400 600 800 1000 1200
Fig. 11. Gaseous emissions during the final part of the constant speed test.
ARTICLE IN PRESS
H. Dwyer et al. / Journal of Aerosol Science 41 (2010) 541–552 551
emissions at the test beginning due to the cold start and NOx concentrations soared to above the upper limit of the NOx
analyzer and remain abnormally high. When the DPF regeneration occurred, CO, total hydrocarbon and CO2 emissionsincreased notably and leveled off. NOx concentrations increased to more than 145 ppm and they remained at 130 ppmthrough the rest of the test. These unusually high NOx emissions are caused by the passive regeneration exotherm that waspurposely created to remove any remaining soot in the DPF.
It is clear from the above discussion that the third or final DPF regeneration event occurred in five separate tests,and the DPF was partially regenerated during each test. The total time for regenerating the DPF was more than 10 min,and this time was much longer than the second DPF regeneration (4 min). The lengthier DPF regeneration could bethe combination of various factors such as more accumulation of particulate matter during the longer mileagebetween regeneration, 1650 km, and the fact that each regeneration event was interrupted by the end of each test,except for the last test. Once the regeneration event was interrupted and cut short, it appears that the engine manage-ment system would try to initiate the regeneration again when the exhaust conditions were suitable and thus force acompletion of DPF regeneration. As a result of the tests it was not known ‘‘how typical’’ the regeneration events arecompared to real life road driving. However, all of the regeneration events did have some similar features, and it is believedthat the results will make a unique contribution to the field, since this California program was the only one of its kindin the US.
Due to the complexity of the various DPF regeneration events it is necessary at this point to make a summary ofthe results in order to obtain a systematic view of the behavior of the GV DPF. The major characteristics of the regenerationemissions from the GV vehicle are now described: (1) PM mass emissions: Although there is a significant increase in PMmass emissions during DPF regeneration, it is clear that the vast majority of the particle matter is released as non-regulatedgases. Even with an increase in PM of more than 50 during one of the NEDC cycles with regeneration, the PM emissionsfrom the GV were within SULEV (LEVII) standards for light duty vehicles; (2) it appears that the PMP methodology withthe SPCS CPC, Ref. CPC, and Grimm CPC does not correlate with the PM mass increase during DPF regeneration of the GV.This result implies that the PM mass emissions during DPF regeneration must be different than normal generationof PM mass, such as those generated during cold starts of NEDC cycles; (3) volatile particle number emissions: The numberof volatile particles released during the GV DPF regeneration is very, very large, and the size distribution is domi-nated by particles less than 10 nm. At the present time the composition of these volatile particles is not known; and (4)regulated gas emissions: In general there was an increase in regulated gas emissions during the GV DPF regenerationevents. The most serious of these increases was NOx, and the levels were typically double non-regeneration testing.This result is directly due to the elevated engine exhaust temperatures that are required for DPF regeneration to occur.It should be interesting to investigate how DPF regeneration will interact with future NOx reduction systems for dieselengines.
Disclaimer
The statements and opinions expressed in this paper are solely the authors’ and do not represent the official position ofthe California Air Resources Board. The mention of trade names, products, and organizations does not constituteendorsement or recommendation for use. The Air Resources Board is a Department of the California EnvironmentalProtection Agency. CARB’s mission is to promote and protect public health, welfare, and ecological resources througheffective reduction of air pollutants while recognizing and considering effects on the economy. CARB oversees all airpollution control efforts in California to attain and maintain health-based air quality standards.
Acknowledgements
CARB staff wishes to extent its appreciation to JRC staff for the opportunity to conduct this research. Of special note arethe helpful interactions with Dr. Penny Dilara, Mr. Barouch Giechaskiel, and Mr. Giorgio Martini.
Dr. Qiang Wei of Horiba, Inc. is specially acknowledged for providing in-kind an SPCS unit for this research. Dr. Wei’stechnical input and participation was critical for the emission measurement comparisons in this project.
We thank Mr. Jon Andersson of Ricardo and Mr. Chris Parking of the UK’s Department for Environment, Food and RuralAffairs for their expert advice during this work.
We also thank Ms. Emma Sandbach from AEA Energy & Environment for calibration of the GPMS and TSI, Inc. for theloan of particle counters.
The assistance with logistics for shipping the Golden Vehicle from Europe to California and back by Dr. Whitney Leemanand Dr. Pablo Cicero-Fernandez of CARB and Dr. Tom Durbin of the University of California, Riverside was greatlyappreciated.
The University of Wisconsin played a vital part in this study by their preparation and analysis of the filters for PM andmetal determination.
The authors also wish to thank all of the CARB laboratory personnel, management, and executive staff for the supportfor this research and for the California-EC collaboration.
ARTICLE IN PRESS
H. Dwyer et al. / Journal of Aerosol Science 41 (2010) 541–552552
References
Andersson, J., Giechaskiel, B., Munoz-Bueno, R., Sandbach, E., & Dilara, P. (2007). Particle Measurement Programme (PMP), Light-duty Inter-laboratoryCorrelation Exercise (ILCE_LD). Final Report, Institute for Environment and Sustainability, EUR 22775 EN.
Ayala, A., Herner, J. D., Zhang, S., Robertson, W., Frodin, B., Huai, T., et al. (2007). Experiences from the CARB PMP-based Program. In Internationalconference on transport and environment: A global challenge, technical and policy solutions, Milan, Italy, March 19–21.
Ayala, A., Zhang, S., Collins, J., Zhan, T., Dwyer, H., Huai, T., et al. (2008). California’s informal participation in the Particle Measurement Programme (PMP) LightDuty Inter-Laboratory Correlation Exercise (ILCE_LD). CARB final research report, October.
Barone, T., Storey, J., & Domingo, N. (2009). Robust diesel particulate filter from School Bus Retrofit Program, Southeast Diesel Collaborative. In 4th annualpartners meeting, June 16.
Bergmann, M., Kirchner, U., Vogt, R., & Benter, T. (2009). On-road and laboratory investigation of low-level PM emissions of a modern diesel particulatefilter equipped diesel passenger car. Atmospheric Environment, 43, 1908–1916.
Bikas, G., & Zervas, E. (2007). Regulated and non-regulated pollutants emitted during the regeneration of a diesel particulate filter. Energy & Fuels, 21,1543–1547.
Blanchard, G., Colignon, C. Y., Griard, C., Rigaudeau, C., Salvat O., & Seguelong, T. (2002). Passenger car series application of a new diesel particulate filtersystem using a new ceria-based, fuel-borne catalyst: From the engine test bench to European vehicle certification. SAE Technical Paper 2002-01-2781.
Bukowiecki, N., Kittelson, D. B., Watts, W. F., Burtscher, H., Weingartner, E., & Baltensperger, U. (2002). Real-time characterization of ultrafine andaccumulation mode particles in ambient combustion aerosols. Journal of Aerosol Science, 33, 1139–1154.
Burtscher, H., Baltensperger, U., Bukowiecki, N., Cohn, P., Huglin, C. Mohr, M., et al. (2001). Separation of volatile and non-volatile aerosol fractions bythermodesorption: Instrumental development and applications. Journal of Aerosol Science, 32, 427–442.
Burtscher, H., Kunzel, S., & Huglin, C. (1998). Characterization of particles in combustion engine exhaust. Journal of Aerosol Science, 29, 389–396.Cauda, E., Hernandez, S., Fino, D., Saracco, G., & Specchia, V. (2006). PM0.1 emissions during diesel trap regeneration. Environmental Science and
Technology, 40, 5532–5537.Coroller, P., & Plassat, G. (2003). Performance and durability of PSA Peugeot Citroen’s DPF system on a taxi fleet in the Paris area. In Proceedings of the 9th
diesel engine emissions reduction conference.CRC Report (2009). ACES phase 1, phase 1 of the advanced collaborative emissions study, June.Giechaskiel, B., Munoz-Bueno, R., Rubino, L., Manfredi, U., Dilara, P., De Santi, G., et al. (2007). Particle Measurement Program (PMP): Particle size and number
emissions before, during and after regeneration events of a Euro 4 DPF equipped light-duty diesel vehicle. SAE 2007-01-1944.Herner, J., Ayala, A., Huai, T., Collins, J., Robertson, W., Rieger, P., et al. (2009). The effect of advanced aftertreatment for PM and NOx control on heavy duty
diesel truck emissions, Environmental Science and Technology 43 (15), 5928–5933.Herner, J., Robertson, W., & Ayala, A. (2007). Investigation of ultrafine particle number measurements from a clean diesel truck using the European PMP
Protocol. SAE Technical Paper 2007-01-1114.Matter, U., Siegmann, H. C., & Burtscher, H. (1999). Dynamic field measurements of submicron particles from diesel engines. Environmental Science and
Technology, 33, 1946–1952.McCormick, R. L., Graboski, M. S., Alleman, T. L., Alvarez, J. R., & Duleep, K. G. (2003). Quantifying the emission benefits of opacity testing and repair of
heavy-duty diesel vehicles. Environmental Science and Technology, 37, 630–637.Mohr, M., Forss, A. M., & Lehmann, U. (2006). Particle emissions from diesel passenger cars equipped with a particle trap in comparison to other
technologies. Environmental Science and Technology, 40, 2375–2383.Moosmuller, H., Arnott, W. P., Rogers, C. F., Bowen, J. L., Gillies, J. A. Pierson, W. R., et al. (2001a). Time-resolved characterization of diesel particulate
emissions. 1. Instruments for particle mass measurements. Environmental Science and Technology, 35, 781–787.Moosmuller, H., Arnott, W. P., Rogers, C. F., Bowen, J. L., Gillies, J. A. Pierson, W. R., et al. (2001b). Time-resolved characterization of diesel particulate
emissions. 2. Instruments for elemental and organic carbon measurements. Environmental Science and Technology, 35, 1935–1942.Quigley, M., & Seguelong, T. (2002). Series application of a diesel particulate filter with a ceria-based fuel-borne catalyst: Preliminary conclusions after one year
of service. SAE Technical Paper 2002-01-0436.Ricardo (2005). UN-GRPE PMP phase 3, inter-laboratory correlation exercise: Framework and laboratory guide. Working Paper No. GRPE-PMP-14-1, Ricardo
Consulting Engineers, Shoreham by Sea, West Sussex, UK, November 25, 2004. /http://www.unece.org/trans/doc/2005/wp29grpe/PMP-2005-14-01e.pdfS.
Robertson, W. H., Herner, J. D., Ayala, A., & Durbin, T. D. (2007). Investigation of ultrafine particle emissions from clean heavy duty vehicles using theEuropean PMP method. In Proceedings of the 13th diesel engine emissions reduction conference, Detroit, August.
Sem, G. J. (2002). Design and performance characteristics of three continuous-flow condensation particle counters: A summary. Atmospheric Research, 62,267–294.
Wichmann, H. E., & Peters, A. (2000). Epidemiological evidence of the effects of ultrafine particle exposure. Philosophical Transactions of the Royal Society ofLondon, Series A, 358, 2751–2768.
Zhang, S., McMahon, W., Wei, Q., Huai, T., & Ayala, A. (2008). Final results from CARB’s assessment of the European reference vehicle from the ParticulateMeasurement Programme. In Proceedings of the 18th CRC on-road vehicle emissions workshop, San Diego, CA, March 31–April 2.