Embed Size (px)
Citation preview
0
D2.1. Report: Mapping the scientific and policy landscape of PM in Africa
Report: Mapping the scientific and policy landscape of PM in Africa ERIKA SELA ANDRÉS
DATE OF SUBMISSION: 10 SEPTEMBER 2021
1
D2.1. Report: Mapping the scientific and policy landscape of PM in Africa
EU-Africa PerMed has received funding from the European Union’s Horizon 2020
Research and Innovation programme under grant agreement No 964333
Project Acronym EU-Africa PerMed
Project Title BUILDING LINKS BETWEEN EUROPE AND AFRICA IN PERSONALISED MEDICINE
Grant Agreement no. 964333
Start date of the project 01/02/2021
End date of the project 31/01/2025
Work Package number WP2
Deliverable Number D2.1
Deliverable title Report: Mapping the scientific and policy landscape of PM in Africa
Lead Beneficiary ECITD/INNOVATEC
Due date M7 (August- 2021)
Date of delivery 10/09/2021
Nature R (Report)
Dissemination level PU (public)
DISCLAIMER This document reflects only the author's view. Responsibility for the information and views expressed therein lies entirely with the authors. The European Commission is not responsible for any use that may be made of the information it contains.
Version Contributors Comments
1.0 Erika Sela/Joaquin Guinea (INNOVATEC) Amr Radwan (ECITD)
First draft of the report
2.0 Teresia Nyawira (NACOSTI) and Lynnette Kamau (APHRC) Revision of part 2
3.0 Erika Sela/Joaquin Guinea (INNOVATEC) Formatting and final review.
2
D2.1. Report: Mapping the scientific and policy landscape of PM in Africa
EU-Africa PerMed has received funding from the European Union’s Horizon 2020
Research and Innovation programme under grant agreement No 964333
TABLE OF CONTENTS
EXECUTIVE SUMMARY 6
PART 1. SCIENTIFIC MAPPING OF PERSONALIZED MEDICINE IN AFRICA 10
1.1 PERSONALIZED MEDICINE DEFINITION ANS CLARIFICATION 10
1.2 METHODOLOGICAL APPROACH 12
1.3 KEY ASSESSMENT INDICATORS AND METRICS USED 13
1.4 RESULTS 16
1.4.1 KEY INSTITUTIONS AND RESEARCH GROUPS 16
1.4.1.1 Articles of PM by African Countries 16
1.4.1.2 Articles with First author from African Countries 17
1.4.1.3 Annual trends of PM scientific production in Africa 17
1.4.1.4 African-African Scientific Collaboration 19
1.4.1.5 Top research institutions from Africa, ranked with number of articles 19
1.4.1.6 Top African authors 21
1.4.1.7 Publications with only African countries 22
1.4.2 MAIN RESEARCH AREAS AND DISEASE CATEGORIES 22
1.4.2.1 Articles on personalised medicine according to research areas (prevention, diagnosis, and treatment) in Africa
22
1.4.2.2 Articles on personalised medicine according to disease category in Africa 22
1.4.2.3 Annual trends of scientific articles by disease category 23
1.4.3 TRENDS AND TYPE OF RESEARCH COLLABORATION 25
1.4.3.1 Articles on personalised medicine (Africa) with countries from Europe as collaborators
25
1.4.3.2 Annual trends of Africa-Europe scientific collaborations on personalized medicine, 2011-2020.
25
1.4.3.3. Annual trends of scientific output for the ten countries from Europe with the most Africa-Europe collaborations
26
1.4.3.4 Top institutions from Europe ranked by number of articles on personalised medicine (in collaboration with at least one African country)
27
1.4.3.5 Articles on personalised medicine according to research area (treatment, prevention or diagnosis) of the African-Europe scientific co-publications
28
1.4.3.6 Top collaborating authors from Europe 29
1.4.3.7 Top non-European international collaborations 30
1.4.3.8 Patentability and innovation potential 31
1.4.4 RESEARCH FUNDING 32
PART 2. HEALTH R&I POLICY LANDSCAPE IN AFRICAN COUNTRIES WITH A SPECIAL FOCUS ON
PERSONALISED MEDICINE 34
2.1 INTRODUCTION 34
2.2 GEOGRAPHICAL SCOPE OF THE REVIEW 35
3
D2.1. Report: Mapping the scientific and policy landscape of PM in Africa
EU-Africa PerMed has received funding from the European Union’s Horizon 2020
Research and Innovation programme under grant agreement No 964333
2.3 METHODOLOGY 36
2.3.1 FRAMEWORK TO GUIDE THE MAPPING OF THE HEALTH R&I POLICY LANDSCAPE IN
AFRICAN COUNTRIES 36
2.3.2 WORKPLAN 40
2.4 THE SCIENCE, TECHNOLOGY AND INNOVATION (STI) POLICY LANDSCAPE IN AFRICA WITH A
SPECIAL FOCUS ON HEALTH/BIOMEDICAL RESEARCH 40
2.4.1 STI POLICIES AT CONTINENTAL AND REGIONAL LEVEL 40
2.4.2 STI POLICY AND GOVERNANCE AT COUNTRY LEVEL 45
2.4.3 MAIN S&T INDICATORS IN AFRICA 46
2.5 R&D FUNDING IN AFRICA, WITH A SPECIAL FOCUS ON HEALTH/BIOMEDICAL RESEARCH 55
2.5.1 RESEARCH FUNDING ORGANIZATIONS IN AFRICA 55
2.5.2 SOURCES OF FUNDING FOR R&D 56
2.5.3 FUNDING OF HEALTH/BIOMEDICAL RESEARCH 61
2.5.4 MAJOR PAN AFRICAN PROGRAMMES SUPPORTING AND FUNDING HEALTH RESARCH 70
2.6 RESULTS OF THE HEALTH R&I POLICY LANDSCAPE MAPPING, WITH A SPECIAL FOCUS ON
PERSONALISED MEDICINE 75
2.7 MAPPING OF PERSONALISED MEDICINE RESEARCH IN AFRICA COUNTRIES. MAIN FINDINGS
FROM THE POLICY MAPPING WORK 81
REFERENCES 84
ANNEX 1: BIBLIOMETRIC SEARCH STRATEGY
LIST OF FIGURES
Figure 1: Personalised Medicine as an umbrella term 11
Figure 2: Total number of PM publications per African country for the period 2011-2020 17
Figure 3: Total PM publications in Africa per year 18
Figure 4: Total PM publications of top 10 African countries 18
Figure 5: Percentage of international collaboration of the total number of Pm articles per year 19
Figure 6: Top 200 African institutions in PM with respect to the number of publications 20
Figure 7: Number of PM publications in Africa according to disease categories 23
Figure 8: Number of PM publications in Africa per year according to disease category 24
Figure 9: Fold increase of PM publications in 2020 compared to 2011 for each disease category 24
Figure 10: Total number of PM co-authored publications of each European country for the period 2011-2020
25
Figure 11: Annual trend of Africa-Europe co-authored publications in PM for the period 2011-2020
26
Figure 12: Total number of co-authored publications (with African institutions) of the top 10 European countries per year
26
4
D2.1. Report: Mapping the scientific and policy landscape of PM in Africa
EU-Africa PerMed has received funding from the European Union’s Horizon 2020
Research and Innovation programme under grant agreement No 964333
Figure 13: Top African institutions and countries for each research area (Prevention, Diagnosis or treatment) and the top European collaborating countries for each
29
Figure 14: Count of Africa's PM publications that have been cited in Patents 31
Figure 15: Count of patents citing Africa's PM publications 31
Figure 16: The health research system 35
Figure 17: Africa States and Subregions 36
Figure 18: STISA-2024 Main Operationalisation Blocks 41
Figure 19: AUDA NEPAD Health Research and Innovation Strategy for Africa (HRISA) 2018-2030 Key strategic objectives
43
Figure 20: STI policies adoption in 15 African countries since the Lagos Programme of Action 45
Figure 21: Investment in R&D as a share of GDP By region and selected country (%), 47
Figure 22: GERD as % of GDP for 36 African countries 48
Figure 23: Trends in R&D spending measured as GERD as % of GDP for Africa, North African countries and Sub-Saharan countries for period 2007-2018
48
Figure 24: Weighted average of health GERD (as % of total GERD) in WHO regions 49
Figure 25: Health GERD as a % of total GERD for some African countries 49
Figure 26: Total researchers per million inhabitants in Full Time Equivalent (FTE) 50
Figure 27: Health researchers as a % of all researchers by WHO region 50
Figure 28: Health researchers as a % of all researchers in Some African countries 51
Figure 29: Increase in Africa´s Scientific Articles and reviews (2005-2016 51
Figure 30: Map of Health research in the WHO Africa region indexed in PubMed from 2000 to 2014
53
Figure 31: Global Innovation Index ranking for African countries, 2015 54
Figure 32: R&D expenditure broken down by source of funds in some African countries for which data are available (2018 or latest year available)
58
Figure 33: Top funders of research in Africa based on data from publications (2009-2014) 60
Figure 34: Main features of top funded researchers in Africa, based on the results of a survey to 5,700 African researchers between May 2016 and February 2017
61
Figure 35: Distribution of Biomedical grants received by African regions in 2017 62
Figure 36: Biomedical grants in Africa by country and region, 2017 63
Figure 37: African Biomedical grants distribution by funder, 2017 64
Figure 38: - African institutions with ≥25 biomedical grant records, 2017 65
Figure 39: Distribution of biomedical grants by health topic, 2017 66
Figure 40: Distribution of genomics and genetics research funding in Africa by major organization in 2015
67
Figure 41: Share of health/biomedical publications by funding type (2011-2015) 69
Figure 42: The Human Heredity and Health in Africa (H3Africa) consortium 73
Figure 43: Representation of the results of the PM/genomic capacities in African countries, following the policy mapping framework of EU-Africa PerMed
80
5
D2.1. Report: Mapping the scientific and policy landscape of PM in Africa
EU-Africa PerMed has received funding from the European Union’s Horizon 2020
Research and Innovation programme under grant agreement No 964333
LIST OF TABLES
Table 1: Different definitions and terminologies for personalised medicine 11
Table 2: Summary of EU-Africa PerMed bibliometric study 12
Table 3: Description of the indicators used for the scientific mapping 16
Table 4: The most active authors in Africa with high PM scientific productivity for the period 2010-2020
22
Table 5: PM publications in Africa according to research area Treatment, Diagnosis and prevention
22
Table 6: Classification of PM publications in Africa according to disease categories 23
Table 7: Top European institutions collaborating with Africa in PM medicine within the period of 2011-2020
28
Table 8: The top European Authors with respect to number of co-authored publications with African institution(s) within the period of 2011-2020
30
Table 9: Top non-European countries collaborating with Africa, based on number of co-authored publications, within the period of 2011-2020
31
Table 10: Major funding agencies from Africa cited in PM articles 32
Table 11: Major non-African funding agencies cited in PM articles 33
Table 12: EU-Africa PerMed framework for the policy mapping 37
Table 13: List of indicators used for the policy mapping 38
Table 14: Top 10 countries in the WHO African region in terms of health research publications from 2000 to 2014, normalized by the indicated variable
52
Table 15: GERD by sources of funding (percentage) 57
Table 16: Major funding organisations in Africa (output > 1 220 pubs between 2009 and 2014) 59
Table 17: Top 10 Countries in Africa ranked by the number of research collaboration in genetics and genomics
67
Table 18: Top 10 research organizations and universities with the most research collaborations in genetic and genomics
68
Table 19: Top Funding Institutions by African region 70
Table 20: Top 5 funding institutions by funding group 70
Table 21: Scoring matrix for African countries for Personalised Medicine and health R&I status 78
Table 22: Classification of African Countries for PM R&I capacities based on the EU-Africa PerMed policy mapping framework
78
6
D2.1. Report: Mapping the scientific and policy landscape of PM in Africa
EU-Africa PerMed has received funding from the European Union’s Horizon 2020
Research and Innovation programme under grant agreement No 964333
EXECUTIVE SUMMARY
PART 1. Scientific mapping
• This study was designed in descriptive scanning model. We employ the bibliometric analytical method for this study to support answering our key questions on the foundations, themes and trends of Personalized Medicine in Africa including the collaboration capacities, identification of competencies and key actors, and generating insights for mutual areas of interest with European institutions. We used PubMed as primary source of data for the period of 2011-2020 and complemented when appropriate with other publishers’ sources to populate relevant metric data.
• The search query found 4340 documents in the personalized medicine related literature. 3205 institutions were involved in all the 4340 PM publications including institutions in Africa and collaborative institutions in the world. The growth of publications over time showed a steep increase after 2015. The increase in this period might be linked to large-scale projects implemented during this period such as H3Africa project. The top 10 list of African research institutions with respect to the number of publications has 6 South African institutions, 3 Egyptian institutions and 1Tunisian institution. Corporate collaboration is very limited with only few companies involved from Africa. Medical centres and hospitals participated with significant percentage in PM publications. Almost 34% of PM publications have at least one hospital based in Africa or a collaborative country.
• In Africa, the top 5 countries with the largest volume of publications are South Africa, Egypt, Tunisia, Nigeria, and Kenya. These 5 countries contributed 64.5% of all PM publications in Africa in the past 10 years. In general, only 11 countries in Africa have a total number of publications more than 100, and 6 countries between 50-100 publications while most countries have published less than 50 articles over the entire period of the analysis.
• One important trend in the African research landscape is collaboration among African countries which is found to be significantly low in volume but steadily growing. 15.8% of all PM publications in the period of 2011-2020 are co-authored by at least 2 African countries. The active countries in African collaboration in PM are, in order of high number of co-authored publications with African institutions, Nigeria, South Africa, Kenya, Uganda and Ghana. South Africa tends to have the highest diversity of collaboration with different African countries. In general, regional (north-south) collaboration in Africa is not significant. On the other front, the publications that involve only African countries is significantly low compared to international collaboration publications. Bilateral collaboration in Africa is frequently observed despite being low in volume (almost 80 publications) while collaboration involving more than 2 African countries with no other countries (non-African countries) has lower number of publications, and it is extremely low for collaboration involving more than 3 African countries with no non-African country involved as a collaborator.
• An interest in infectious diseases followed by cancer, immune system and nervous system diseases was clearly observed where infectious diseases including bacterial, viral, and parasitic diseases showed the largest percentage of publications. Most disease category showed steady growth in publication count over the entire period. The increase of articles in 2020 compared to 2011 was remarkable and more evident in Bacterial infection related publications (14-times increase), followed by Cardiovascular (11-times increase), and virus diseases (almost 8-times increase).
• In general, PM international cooperation in Africa is increasing over time with the least percentage of international collaboration observed in 2012 (29%) and highest percentage in 2020 (75%). European collaboration increased significantly starting in 2013 and reached its peak in 2019 with more than 350 co-authored publications with African institutions. It is worth mentioning that until 2013, the annual number of co-authored publications was less than 50 articles per year; the most prolific countries are the United Kingdom, France, Germany, Italy, and Netherlands. These 5 countries contributed significantly to the total number of PM publications in Africa and the overall international
7
D2.1. Report: Mapping the scientific and policy landscape of PM in Africa
EU-Africa PerMed has received funding from the European Union’s Horizon 2020
Research and Innovation programme under grant agreement No 964333
collaboration spectrum of Africa in PM. Non-European collaboration is highly obvious with the strong presence of USA and followed by Canada, Australia, Saudi Arabia, China, and Japan.
• The Africa public funding institutions most cited in the PerMed articles were the South African Medical Research Council, the Ministry of Higher Education and Scientific Research (Egypt), the Ministère de l’Enseignement Supérieur et de la Recherche Scientifique (Tunisia), the African Academy of Sciences, the Department of Science and Technology, Republic of South Africa, NEPAD and the Cancer Association of South Africa.
PART 2. Policy mapping
• The objective of the policy mapping is to identify policies and programmes in African countries supporting and promoting health R&I, and if there are any specific policies/programmes/initiatives that support Personalised Medicine (PM) activities (research projects, training, infrastructure, innovation, industry already present or operational etc.). The policy mapping focuses on Africa as a whole (African Union) and the 5 Regions: North Africa, East Africa, Central Africa, West Africa and Southern Africa. At country level, we aim to be able to collect information for African countries (members of the AU) and will be available as country data sheets for the internal project use (not included in this review
• To guide the policy mapping, we have developed a framework that includes 6 dimensions in which to focus the search of information, using both quantitative and qualitative indicators: i) Governance of health research; ii) Financing health research; iii) Resources for health research; iv) Health research outputs; v) International collaborations in health research and vi) PM/genomic research.
• Main STI policies at continental level include the Science, Technology and Innovation Strategy for Africa 2024 (STISA–2024), that places science, technology and innovation at the epicentre of the African Union’s outlook for the continent as envisioned in its “Agenda 2063.” In the specific area of health, the Health Research and Innovation Strategy for Africa (HRISA): 2018-2030, was developed by the African Union Development Agency (AUDA-NEPAD). Its mission is to facilitate coordinated, sustainable and responsive Health research and innovation that will provide effective interventions for health in Africa. The WHO Regional Committee for Africa adopted in November 2015 the Research for health: a strategy for the African region, 2016-2025, that aims at improving national health research systems to optimize research production and use.
• At regional level, the Economic Community of West African States (ECOWAS), the East, Central and Southern African Health Community (ECSA-HC), East African Health Research Commission (EAHRC), The Economic Community of Central African States (ECCAS) and The East African Community (EAC) are important actors that participate to some extent in the design of public health policies in the region, and in some cases, they have contributed to define health priorities and launched programmes to support health research.
• In terms of governance of Science, Technology and Innovation STI policies at country level,by 2020, at least 25 African countries have national STI policy frameworks and in most countries, there are parliamentary portfolio committees for STI expected to ensure that national annual expenditure budgets have allocations for STI in general and R&D in particular. Most African STI policies often include commitments to increase investment in R&D to at least 1 per cent of GDP, reflecting Lagos Programme of Action aspirations and those of other African Union frameworks. Sometimes they also include provisions for creating a science and technology development fund, and even public–private partnerships (PPPs) and for the private sector.
• Latest data published by UNESCO (August 2020) show that Africa’s investment in R&I as a share of GDP, has increased since 2014, both in Sub-Saharan Africa as in the Arab states in the north, but it still remains low when compared to other regions: 0,51 for Sub-Saharan countries and 0.59 for Arab countries. A target of 1% of GDP was endorsed at the Eighth Ordinary Session of the Executive Council
8
D2.1. Report: Mapping the scientific and policy landscape of PM in Africa
EU-Africa PerMed has received funding from the European Union’s Horizon 2020
Research and Innovation programme under grant agreement No 964333
of the African Union in Khartoum in 2006, but no countries have yet reached this goal. Countries closer to the 1% target include Kenya, South Africa, Zimbabwe, Egypt and Morocco. Although, in general, the level of R&I investment is still low in most countries, Africa has experienced a continuous growth in R&D expenditure in the last decade, most specially in North-African countries. Not many countries provide data on % of the Gross domestic R&D expenditure (GERD) allocated to health and medical research (Health GERD). From the data available, it is relevant to find that Africa, as a region, has a Health GERD 11.6%, closer to other regions and higher than Europe. African countries which invest more than 18% of their GERD in health research are Eswatini and Botswana (30%), Mozambique (29%), Kenya (27%), Ethiopia (22%) and South Africa (18%).
• Africa is the region that has the highest number of researchers in the fields of health and medical sciences (‘health researchers’) measured as % of total researchers. Gambia has the highest number (58% of all researchers), followed by Burkina Faso (46%), Eswatini (34%) and Kenya (34%).
• The landscape of institutions funding African R&D is complex, and mainly include the public sector, with significant proportions of financing in many countries coming from international funding. As an example, in Kenia which has one of the highest health research financing as a percentage of GDP (0.234% in 2015), most of the funding came from external sources (83.46%), with only 16.54% of the financing realised from domestic sources. In Côte d’Ivoire for instance, public funding for Research for health represented less than 1% of the country’s health budget. In 2008, in Burkina Faso, foreign partners funded 87% of research for health projects. In most countries, most of the funding comes from the government, highlighting the case of Ethiopia, with 97% of governmental funding, followed by Namibia (63%) and Botswana (60%). Important to mention is that in most countries, the level of funding from the private sector is low, with values ranging from 0.5% in Mozambique to 18% in Botswana. A unique case is South Africa, where the business contributes to 41% of the GERD. The low investment levels from the business sector is an indicator of a low number of firms in R&D intensive sectors.
• Bibliometric studies have shown that major African R&I funders are: The National Research Foundation (South Africa), Ministry of Higher Education and Scientific Research (Tunisia), and the Medical Research Council (South Africa).
• Much of the funding to health/biomedical R&I comes from international donors. The most important international funders in Africa are the National Institutes of Health NIH (USA) with over 60%, followed by the Medical Research Council MRC (UK), Fogarty International Center (USA), The Wellcome Trust (UK) and the EDCTP programme (EU).
• The most frequently funded grants involved research on three major infectious diseases: HIV/AIDS (49%), tuberculosis (16%), and malaria (10%). Research on NCDs represented about a quarter of all grants, with awards for cancer (14%), mental health (7%), and diabetes (3%) being the most numerous.
• The major Pan African programme supporting and funding health research is The Alliance for Accelerating Excellence in Science in Africa (AESA), an initiative of the African Academy of Sciences (AAS) and the African Union Development Agency AUDA-NEPAD. AESA provides competitive grants and capacity building support for research across the continent. The funds available through AESA are substantially higher than from most national research agencies in Africa. When it was established in 2015, AESA developed a business plan that set a target of increasing its initial investment of $65 million to a total of $241 million by 2021 (AAS, 2017). To date AESA is on track to meet this ambitious target and has raised over US$ 200 million to finance its activities. The initiative is supported financially by the Wellcome Trust, the Gates Foundation and other development partners, notably UK Foreign, Commonwealth & Development Office (FCDO), formerly DFID.
• In the area of genomic/genetic research, the most important initiative is the Human Heredity and Health in Africa (H3Africa) consortium, which empowers African researchers to be competitive in
9
D2.1. Report: Mapping the scientific and policy landscape of PM in Africa
EU-Africa PerMed has received funding from the European Union’s Horizon 2020
Research and Innovation programme under grant agreement No 964333
genomic science. H3Africa is a major programme initiated in 2010 by the National Institute of Health (NIH), Wellcome Trust and African Society of Human Genetics (AfSHG).It was officially launched in 2012 in Adis Ababa. The programme supports population-based studies that use genetic, clinical and epidemiological tools to better understand how the interplay between human genes and the environment influence disease susceptibility, pathogenesis and prevention with the goal of improving the health of African populations.
• Another important national-led initiative is The Southern African Human Genome Programme (SAHGP), funded by the Department of Science and Technology (DST) of South Africa, is a national and regional initiative that aims to unlock the unique genetic character of Southern African populations. Its vision is to improve quality of life through understanding human genetic diversity.
• The results of the policy mapping have provided valuable information to understand the context and the capacities of African countries to carry out R&D activities, in the area of health/biomedical research and specifically in areas that support the development and future implementation of PM in the health systems. Together with the review of the policy context at continental and regional level presented in this report, we have collected information for the 54 African countries to complete a policy mapping evaluation matrix. This matrix has been constructed using the 6 dimensions of the analytical framework, selecting for each dimension a set of indicators for which information was readily available for most of the African countries. This has been complemented with information coming from desk review, especially for the dimension of PM/genomic research. This matrix has served as a tool to rate the countries for each dimension (very high, high, medium, low, very low) and then attempt to group them based on their achievements in the different dimensions the results are presented in the following figure, that shows the PM/genomic capacities in African countries, following the policy mapping framework of EU-Africa PerMed.
10
D2.1. Report: Mapping the scientific and policy landscape of PM in Africa
PART 1 - SCIENTIFIC MAPPING OF PERSONALISED MEDICINE IN AFRICA
1.1 PERSONALISED MEDICINE DEFINITION AND CLARIFICATION
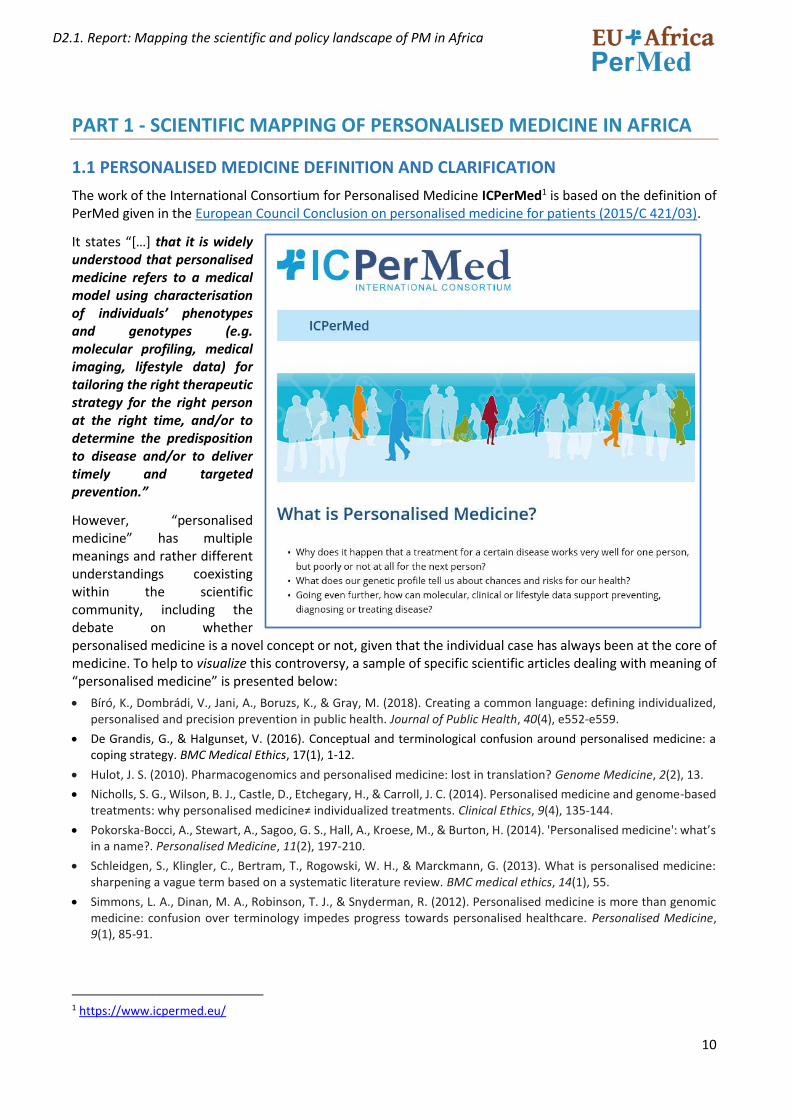
The work of the International Consortium for Personalised Medicine ICPerMed1 is based on the definition of PerMed given in the European Council Conclusion on personalised medicine for patients (2015/C 421/03).
It states “[…] that it is widely understood that personalised medicine refers to a medical model using characterisation of individuals’ phenotypes and genotypes (e.g. molecular profiling, medical imaging, lifestyle data) for tailoring the right therapeutic strategy for the right person at the right time, and/or to determine the predisposition to disease and/or to deliver timely and targeted prevention.”
However, “personalised medicine” has multiple meanings and rather different understandings coexisting within the scientific community, including the debate on whether personalised medicine is a novel concept or not, given that the individual case has always been at the core of medicine. To help to visualize this controversy, a sample of specific scientific articles dealing with meaning of “personalised medicine” is presented below:
• Bíró, K., Dombrádi, V., Jani, A., Boruzs, K., & Gray, M. (2018). Creating a common language: defining individualized, personalised and precision prevention in public health. Journal of Public Health, 40(4), e552-e559.
• De Grandis, G., & Halgunset, V. (2016). Conceptual and terminological confusion around personalised medicine: a coping strategy. BMC Medical Ethics, 17(1), 1-12.
• Hulot, J. S. (2010). Pharmacogenomics and personalised medicine: lost in translation? Genome Medicine, 2(2), 13.
• Nicholls, S. G., Wilson, B. J., Castle, D., Etchegary, H., & Carroll, J. C. (2014). Personalised medicine and genome-based treatments: why personalised medicine≠ individualized treatments. Clinical Ethics, 9(4), 135-144.
• Pokorska-Bocci, A., Stewart, A., Sagoo, G. S., Hall, A., Kroese, M., & Burton, H. (2014). 'Personalised medicine': what’s in a name?. Personalised Medicine, 11(2), 197-210.
• Schleidgen, S., Klingler, C., Bertram, T., Rogowski, W. H., & Marckmann, G. (2013). What is personalised medicine: sharpening a vague term based on a systematic literature review. BMC medical ethics, 14(1), 55.
• Simmons, L. A., Dinan, M. A., Robinson, T. J., & Snyderman, R. (2012). Personalised medicine is more than genomic medicine: confusion over terminology impedes progress towards personalised healthcare. Personalised Medicine, 9(1), 85-91.
1 https://www.icpermed.eu/
11
D2.1. Report: Mapping the scientific and policy landscape of PM in Africa
In this regard, Table 1 shows different synonyms used for personalised medicine, being precision medicine the most used, particularly in the USA probably due to the “Precision Medicine Initiative” announced in 2015 by the former President Barack Obama.
Synonyms for personalised medicine Terms closely related to personalised medicine
• Stratified Medicine
• Individualized Medicine
• Precision Medicine
• Genetic/genome-based medicine
• Biomarker-based medicine
• Targeted medicine
• Tailor-made medicine
• Personalised health
• Systems medicine
• P4 (predictive, preventive, personalised and participatory) Medicine
• Pharmacogenetics/Pharmacogenomics
Table 1. Different definitions and terminologies for personalised medicine. (source: Bosshard, 2018.2)
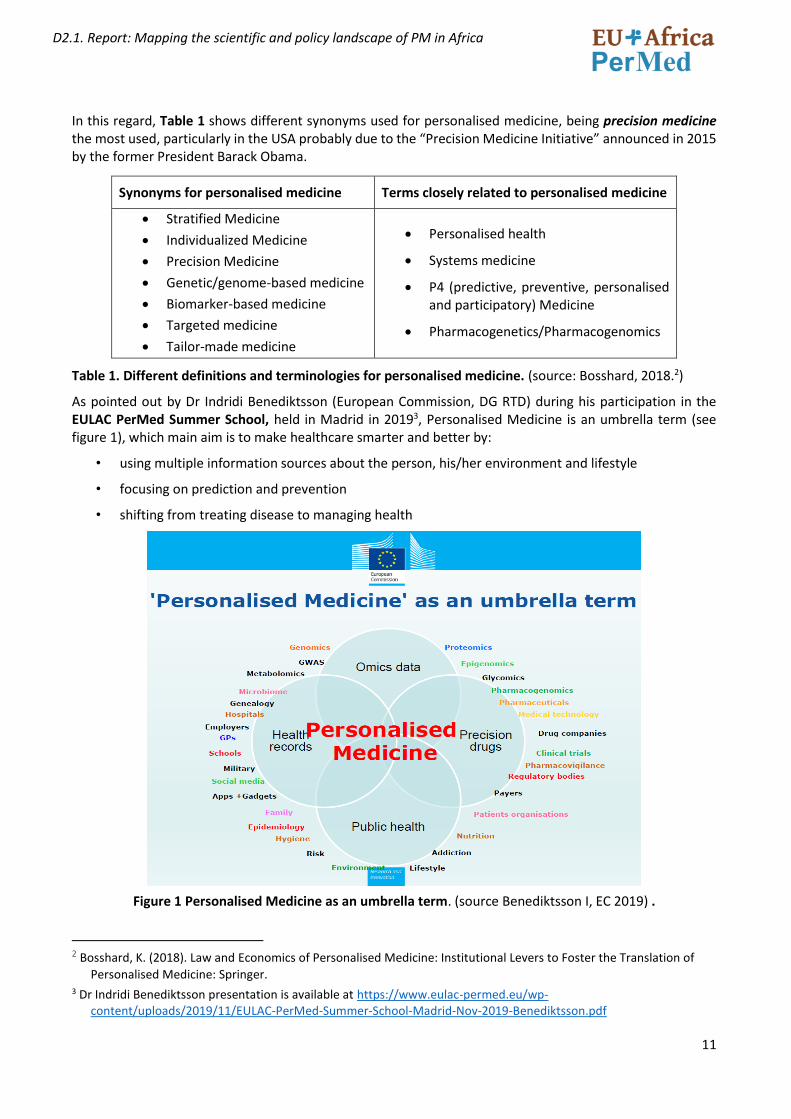
As pointed out by Dr Indridi Benediktsson (European Commission, DG RTD) during his participation in the EULAC PerMed Summer School, held in Madrid in 20193, Personalised Medicine is an umbrella term (see figure 1), which main aim is to make healthcare smarter and better by:
• using multiple information sources about the person, his/her environment and lifestyle
• focusing on prediction and prevention
• shifting from treating disease to managing health
Figure 1 Personalised Medicine as an umbrella term. (source Benediktsson I, EC 2019) .
2 Bosshard, K. (2018). Law and Economics of Personalised Medicine: Institutional Levers to Foster the Translation of
Personalised Medicine: Springer. 3 Dr Indridi Benediktsson presentation is available at https://www.eulac-permed.eu/wp-
content/uploads/2019/11/EULAC-PerMed-Summer-School-Madrid-Nov-2019-Benediktsson.pdf
12
D2.1. Report: Mapping the scientific and policy landscape of PM in Africa
Taking into account this complexity and the multiple meanings and names for “personalised medicine”, but keeping in mind the wide perspective that the European Council definition gives to personalised medicine, we have developed a search strategy for PubMed4 to identify recent scientific articles on personalised medicine with at least one author affiliated to an institution in Africa. The details of this search strategy are included in Annex I.
1.2 METHODOLOGICAL APPROACH
Bibliometrics is the use of mathematical and statistical methods to quantify and analyse the bibliographic information of publications. It is widely acknowledged that bibliometric indicators have become one of the most frequent tools of normal practice in evaluative research management.
This study was designed in descriptive scanning model. We employ the bibliometric analytical method for this study since it provides the tools to answer our key questions on the foundations, themes and trends of Personalized Medicine in Africa including the collaboration capacities, identification of competencies and key actors, and insights for mutual areas of interest with European institutions. The bibliometric method provides an advantage of objectivity and quantifiability and helps to avoid subjective biases. It is informative and also helps to provide validation for findings that other projects and initiatives had intuitively inferred in earlier studies and reports.
In this study, we used PubMed as primary source of data and complemented when appropriate with other publishers’ sources to populate relevant metric data including the traditional databases i.e Scopus for carrying out bibliometric studies since they are reliable sources of citation data. PubMed was chosen because it is a widely recognized database of medical fields with a wide coverage of peer-reviewed publications and provides reliable bibliographic data (PubMed database contains more than 32 million citations and abstracts of biomedical literature). Several search queries with relevant keywords were used (see annex A) to search in the title, abstract, and keywords of the publications in the database from 2011 to 2020. Publications retrieved from PubMed were additionally cross-checked with ScienceDirect and Scopus to accumulate additional metric data associated to PMID publications.
Table 2: Summary of EU-Africa PerMed bibliometric study
PM definition used: European Council definition to Personalised Medicine
Period Covered: Articles published between 01/01/2011 and 31/12/2020
Primary Source: PubMed
Number of articles retrieved: 4382
Number of articles used in the analysis after applying quality measures:
4340
We have used a set of predefined metrics and indicators. The following metrics are data source- and system-agnostic, meaning that they are not tied to any particular provider of data or tools. The resulting benchmarks between datasets provide reliable information to help understand research strengths, and thus help in establishing or monitoring institutional/country strategies. Furthermore, we employed network analysis and
4 We have selected PubMed database because it comprises more than 30 million citations for biomedical literature from
MEDLINE and allows the use of the Medical Subject Headings (MeSH), very useful for controlled vocabulary searching in the biomedical field.
13
D2.1. Report: Mapping the scientific and policy landscape of PM in Africa
visualization tools to assess relevance, key phrase and cluster analysis. The selection of the analytical tools was based on the selected indicators of this bibliometric analysis.
We used science maps to visualize bibliometric networks, commonly known also as bibliometric maps or knowledge maps, to reveal the conceptual framework and scientific structure of PM in Africa. Accordingly, spatial representation of the interrelationship between research elements such as authors or citations or co-occurrence analysis (frequency of co-occurrence of keywords) was used to facilitate the understanding of the structure and developments in the PM field. Various approaches were used for extracting a bibliometric network depending on the preselected indicators of analysis, e.g., authors, documents, journals, cited references, or keywords. The diversity of tools used ensured comprehensive coverage and a highly enriched dataset which is essential to carry out the analysis. Throughout this report, a standard method of measuring change over time is used: Compound Annual Growth Rate (CAGR). CAGR is defined as the year-on-year constant growth rate over a specified period of time.
1.3 KEY ASSESSMENT INDICATORS AND METRICS USED
For the scientific mapping, we have selected indicators to cover three main areas that help us describe the scientific landscape of PM in Africa:
1 Key institutions and research groups
2 Main research areas (prevention, diagnosis, and treatment) and diseases categories
3 Trends and types of collaboration
4 Research funding
The indicators used for each area are explained in the following table.
Table 3. Description of the indicators used for the scientific mapping.
KEY INSTITUTIONS AND RESEARCH GROUPS
Articles of PM by African Countries
This indicator shows the count of PM publications per African country (number of articles published by African country) and shows the order of all African countries based on the number of publications within the predefined duration of this analysis 2011-2020 and based on the search strategy (annex A). This indicator is important to show an overall view of the scientific productivity for each African country.
Articles with first author from African Countries
A publication metric based on the author-level unit of analysis is the author status on a publication—sole author, first author, or last author. First author is the first named author of a publication. This indicator shows the percentage of the PM publications that have the first author from an African institution (an institution that is based in Africa) while identifying the main affiliated institutions of the first African authors and the main collaborating countries, if any. This indicator is useful in providing an additional insight and very preliminary indication of the role of the African authors. Interpretation of the findings of this indicator alone (with respect to role of African authors) might carry some limitations with respect to role of African author (first author is not necessarily the project lead or a senior author). For more reliable indication, it is recommended that this indicator be observed in conjunction with other productivity indicators below such as 3.3.1.7 publications with only African countries.
Annual trends of PM scientific production in Africa
This indicator shows the general overall trend of scientific productivity, with respect to number of publications per year, and it indicates the gradual increase or decrease over time in PM publications for total publications count of African countries, the percentage of international collaboration of the total publications count (international collaboration publication is a publication involving more than one author from at least 2 different countries including an African country) in addition to the overall increase or decrease trend of the top African countries with respect to publications count. Some data associated to the year 2020 might not be fully updated or indexed at the time of the analysis.
14
D2.1. Report: Mapping the scientific and policy landscape of PM in Africa
African-African Scientific Collaboration
This indicator uses co-authored publications among African countries. Co-authored publications are publications involving more than one author with different affiliations. Publications with multiple authors can be indicative of collaborative activity, which can be used to demonstrate productivity. In this context, we use the affiliations as key metric. Institutional affiliations of co-authors may serve as a means of demonstrating collaborative efforts.
Top research institutions from Africa, ranked with number of articles
We have done categorization of the institutional affiliations of African authors. Categories of institutional affiliations used in this report are Universities, medical institutions (healthcare service providers, medical centres and hospitals), Public research centres and governmental organizations (including local authorities, ministries, etc), Corporate (companies of any size) and other institutions (including non-governmental organizations, Regional or international organizations). It is important to consider noting here that the analysis was based on the unique institutional affiliations reported in each publication and the type of institution as well as countries represented by the affiliations. Accordingly, some limitations exist for some categories such as teaching hospitals that were frequently written in publications with their parent organization (the university) such as Hospital X at University XX and here this affiliation might be bibliometrically counted once as a university and/or if one organizational ID is used. All findings were cross-checked and validated using Elsevier Scival analytics and checked with Scimago ranking.
Top African authors
Top authors are the authors who have the large number of publications in the predefined duration of this analysis 2011-2020 and based on the search strategy defined in Annex A. This indicator shows the top 50 African authors, their institutions, and countries, and the total number of PM publications they published.
Publications with only African countries
This indicator analyses the list of publications that involves only African countries with no involvement of non-African country. This indicator is useful when observed together with indicator 3.3.1.4 to show the magnitude of collaboration within Africa and to demonstrate the research activity that doesn’t involve non-African collaboration
MAIN RESEARCH AREAS AND DISEASE CATEGORIES
Articles on personalised medicine according to research areas in Africa
This indicator looks into the classification of all the retrieved 4340 articles of PM in Africa into each of prevention, diagnosis and treatment research areas. 2635 publications were found to be related to one of these research areas, according to search strategy defined in Annex A. This indicator is important, together with indicator 1.3.2.2 and 1.3.2.3, in providing insights regarding areas of interest as evident by number of published research articles.
Articles on personalised medicine according to disease category in Africa
This indicator looks into the classification of all the retrieved 4340 articles of PM in Africa into thirteen different disease categories. Almost 81% of all retrieved publications of PM in Africa within the duration 2011-2020 were found to be related to one of these disease categories. This indicator is important in contributing to having insights about areas of interest.
Annual trends of scientific articles by disease category
This indicator analyses the trends of associated publications to each disease category with respect to annual growth rate of total number of publications and whether there are increase or decrease in number of publications. This indicator is important in contributing to having insights about areas of interest as evident by growing interest (or less interest) per each category over time based on number of published research articles.
TRENDS AND TYPE OF RESEARCH COLLABORATION
Articles on personalised medicine (Africa) with countries from Europe as collaborators
This indicator provides insights about the European countries with respect to number of co-authored publications with African institutions duration the period of 2011-2020. This indicator is important in identifying collaborative countries and regions with African institutions in PM.
Annual trends of Africa-Europe scientific
This indicator provides an overview of Africa-Europe co-authored publications and it is useful in identifying if there is increase or decline in the number of co-authored publications over time and the associated pattern, if any.
15
D2.1. Report: Mapping the scientific and policy landscape of PM in Africa
collaborations on personalized medicine, 2011-2020. Annual trends of scientific output for the ten countries from Europe with the most Africa-Europe collaborations
This indicator identifies and looks into the top 10 European countries and assess the scientific output of each with respect to co-authored publications with African institutions in PM.
Top institutions from Europe ranked by number of articles on personalised medicine (in collaboration with at least one African country).
This indicator identifies and looks into the top 50 European institutions and assess the scientific output of each regarding co-authored publications with African institutions in PM.
Articles on personalised medicine according to research area (treatment, prevention or diagnosis) of the African-Europe scientific co-publications
This indicator looks into the classification of PM publications in Africa based on prevention, diagnosis and treatment and while looking into top African institutions, countries and European collaborative countries.
Top collaborating authors from Europe
Top authors are the authors who have the large number of publications in the predefined duration of this analysis 2011-2020 and based on the search strategy defined in Annex A. This indicator shows the top 20 European authors, their institutions, and countries, and the total number of PM publications they published.
Top non-European international collaborations (countries, institutions, authors,...)
This indicator shows the count of PM publications per non-European collaborative country with Africa and shows the order of all non-European countries based on the number of publications within the predefined duration of this analysis 2011-2020 and based on the search strategy (annex A). This indicator is important to show an overall view of the scientific collaboration for each of these countries based on number of co-authored articles.
Patentability and innovation potential
In Africa, issued patents across all sectors are more frequently registered by non-residents than by residents. In general, Africa lags globally in its number of registered patents (registering only 1,330 patents by residents in 2017, compared to a high of 592,508 in Asia). Furthermore, the majority of patent applications originated elsewhere and filled in Africa. While number of patents is low in Africa, the PM related patents that are originated from Africa is of negligible number. This indicator focuses mainly on patentability and innovation potential, through identifying and assessing articles published by African institutions that are frequently cited by patents in Africa or elsewhere, and from the other side, assessing the patents that cite these articles. This indicator provides general insights and indicative evidence about the potential for patentability and innovation of PM in Africa.
RESEARCH FUNDING
Research Funding
We retrieved funding information from these articles using the SCOPUS database. Out of the 4340 PM articles, funding information was available for 2420 (56%). It is worth noting that the great variances and significant differences of acknowledging financial support in research publication might affect the results obtained because many researchers don’t use coherent way in acknowledging funding agencies or programs.
16
D2.1. Report: Mapping the scientific and policy landscape of PM in Africa
1.4 RESULTS
The results of the analysis performed by ECITD and Innovatec are presented in this report. The report focuses on predefined key parameters and composite indicators of the publication of Personalized Medicine in Africa during the period of 2011-2021 and is based on a quantitative analysis of PM publications including scientific articles, reviews and letters; published in international journals indexed at PubMed, a publication database was generated and enhanced by ECITD. The objective of the analysis is exploratory; to assess the collaboration magnitude, scientific productivity, drawing insights on the possible mutual areas of interest between African countries and Europe, and the profiling of top institutions and its spearheads within different areas of research and the collaboration in the national, regional (African) and international context.
In this section, the results of the performance analysis are reported. Section 3.1 shows the overall results on the overall publications of PM in Africa, top institutions and the overall associated trends, section 3.2 focuses on the main research areas and the classification of articles and section 3.3 analyses collaboration types and associated trends, funding and innovation potential (using academic-corporate collaboration, patents, publication citing patents and patent citations as key indicators). The results of output and impact analyses from different angles are presented in this chapter.
1.4.1 Key institutions and research groups
1.4.1.1 Articles of PM by African Countries
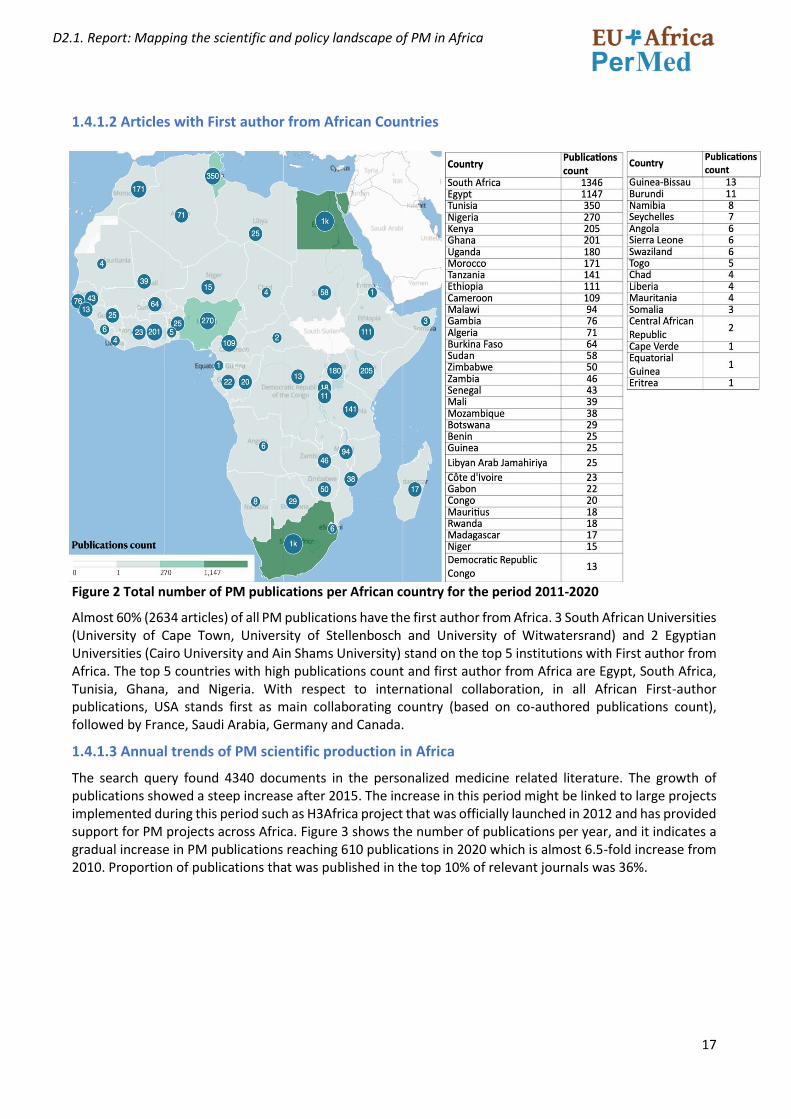
In Africa, the top 5 countries with the largest volume of publications are South Africa, Egypt, Tunisia, Nigeria, and Kenya. These 5 countries contributed 64.5% of all PM publications in Africa in the past 10 years. The data presented in Fig.2 shows how skewed the distribution of PM publication production on the African continent is. In general, only 11 countries in Africa have a total number of publications more than 100, and 6 countries between 50-100 publications while most countries have published less than 50 articles in the predefined duration of the analysis. Figure 2 provides a map view of the African continent with the total number of publications associated to each country. The order of the countries with respect to number of publications is shown on the right side.
17
D2.1. Report: Mapping the scientific and policy landscape of PM in Africa
1.4.1.2 Articles with First author from African Countries
Figure 2 Total number of PM publications per African country for the period 2011-2020
Almost 60% (2634 articles) of all PM publications have the first author from Africa. 3 South African Universities (University of Cape Town, University of Stellenbosch and University of Witwatersrand) and 2 Egyptian Universities (Cairo University and Ain Shams University) stand on the top 5 institutions with First author from Africa. The top 5 countries with high publications count and first author from Africa are Egypt, South Africa, Tunisia, Ghana, and Nigeria. With respect to international collaboration, in all African First-author publications, USA stands first as main collaborating country (based on co-authored publications count), followed by France, Saudi Arabia, Germany and Canada.
1.4.1.3 Annual trends of PM scientific production in Africa
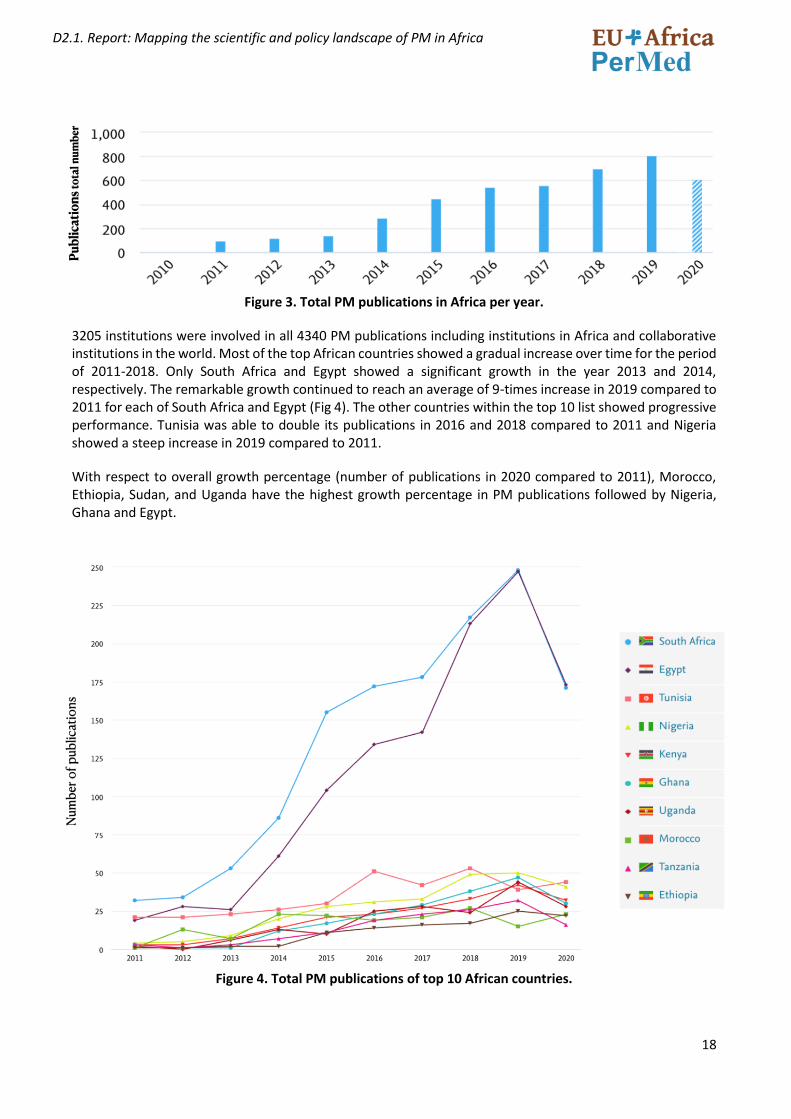
The search query found 4340 documents in the personalized medicine related literature. The growth of publications showed a steep increase after 2015. The increase in this period might be linked to large projects implemented during this period such as H3Africa project that was officially launched in 2012 and has provided support for PM projects across Africa. Figure 3 shows the number of publications per year, and it indicates a gradual increase in PM publications reaching 610 publications in 2020 which is almost 6.5-fold increase from 2010. Proportion of publications that was published in the top 10% of relevant journals was 36%.
18
D2.1. Report: Mapping the scientific and policy landscape of PM in Africa
Figure 3. Total PM publications in Africa per year.
3205 institutions were involved in all 4340 PM publications including institutions in Africa and collaborative institutions in the world. Most of the top African countries showed a gradual increase over time for the period of 2011-2018. Only South Africa and Egypt showed a significant growth in the year 2013 and 2014, respectively. The remarkable growth continued to reach an average of 9-times increase in 2019 compared to 2011 for each of South Africa and Egypt (Fig 4). The other countries within the top 10 list showed progressive performance. Tunisia was able to double its publications in 2016 and 2018 compared to 2011 and Nigeria showed a steep increase in 2019 compared to 2011.
With respect to overall growth percentage (number of publications in 2020 compared to 2011), Morocco, Ethiopia, Sudan, and Uganda have the highest growth percentage in PM publications followed by Nigeria, Ghana and Egypt.
Figure 4. Total PM publications of top 10 African countries.
19
D2.1. Report: Mapping the scientific and policy landscape of PM in Africa
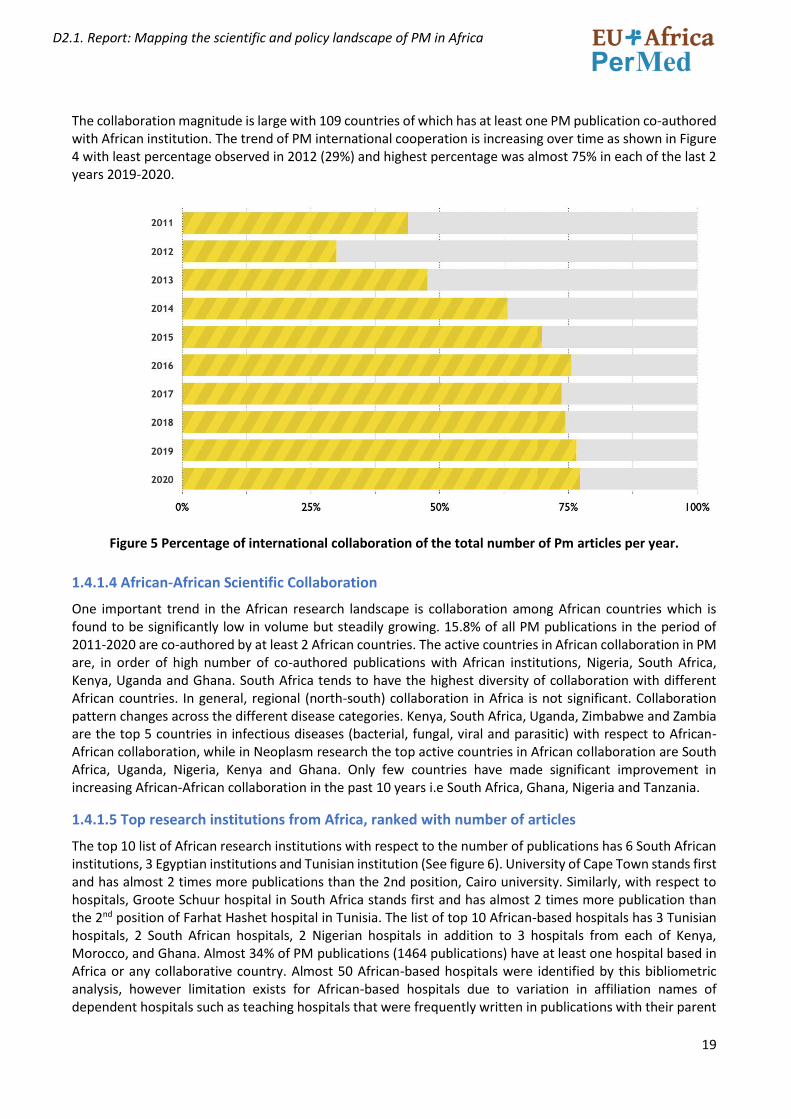
The collaboration magnitude is large with 109 countries of which has at least one PM publication co-authored with African institution. The trend of PM international cooperation is increasing over time as shown in Figure 4 with least percentage observed in 2012 (29%) and highest percentage was almost 75% in each of the last 2 years 2019-2020.
Figure 5 Percentage of international collaboration of the total number of Pm articles per year.
1.4.1.4 African-African Scientific Collaboration
One important trend in the African research landscape is collaboration among African countries which is found to be significantly low in volume but steadily growing. 15.8% of all PM publications in the period of 2011-2020 are co-authored by at least 2 African countries. The active countries in African collaboration in PM are, in order of high number of co-authored publications with African institutions, Nigeria, South Africa, Kenya, Uganda and Ghana. South Africa tends to have the highest diversity of collaboration with different African countries. In general, regional (north-south) collaboration in Africa is not significant. Collaboration pattern changes across the different disease categories. Kenya, South Africa, Uganda, Zimbabwe and Zambia are the top 5 countries in infectious diseases (bacterial, fungal, viral and parasitic) with respect to African-African collaboration, while in Neoplasm research the top active countries in African collaboration are South Africa, Uganda, Nigeria, Kenya and Ghana. Only few countries have made significant improvement in increasing African-African collaboration in the past 10 years i.e South Africa, Ghana, Nigeria and Tanzania.
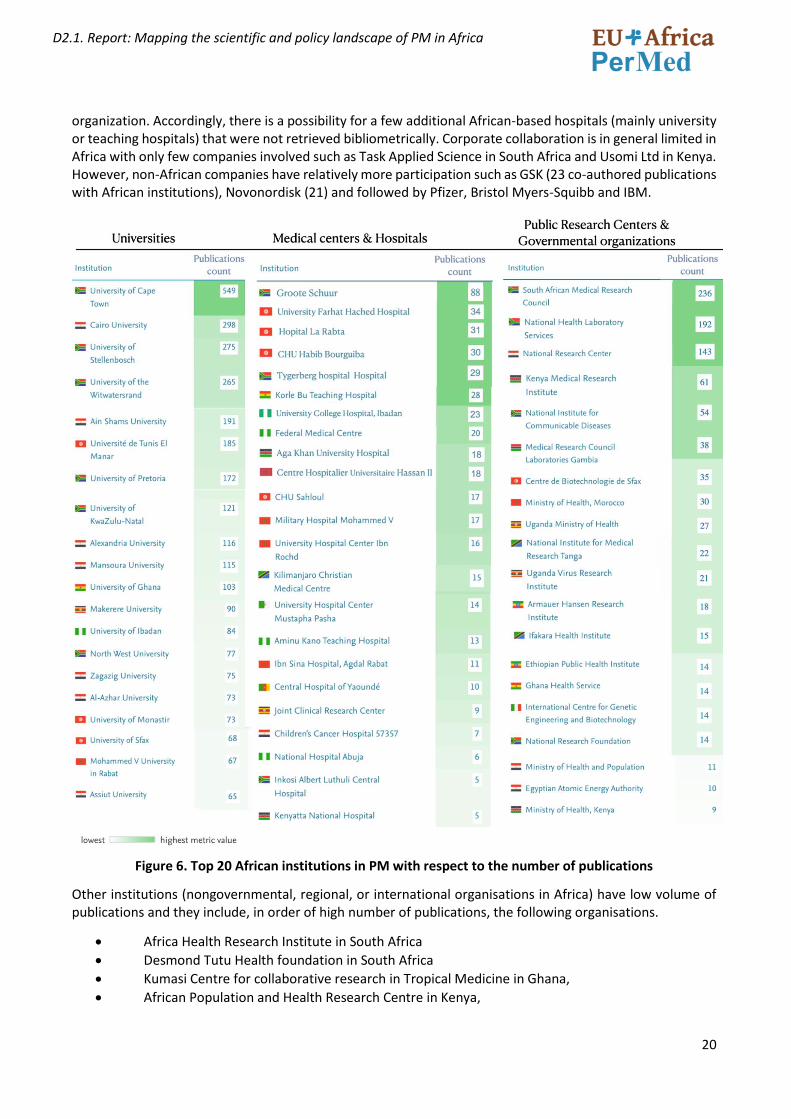
1.4.1.5 Top research institutions from Africa, ranked with number of articles
The top 10 list of African research institutions with respect to the number of publications has 6 South African institutions, 3 Egyptian institutions and Tunisian institution (See figure 6). University of Cape Town stands first and has almost 2 times more publications than the 2nd position, Cairo university. Similarly, with respect to hospitals, Groote Schuur hospital in South Africa stands first and has almost 2 times more publication than the 2nd position of Farhat Hashet hospital in Tunisia. The list of top 10 African-based hospitals has 3 Tunisian hospitals, 2 South African hospitals, 2 Nigerian hospitals in addition to 3 hospitals from each of Kenya, Morocco, and Ghana. Almost 34% of PM publications (1464 publications) have at least one hospital based in Africa or any collaborative country. Almost 50 African-based hospitals were identified by this bibliometric analysis, however limitation exists for African-based hospitals due to variation in affiliation names of dependent hospitals such as teaching hospitals that were frequently written in publications with their parent
20
D2.1. Report: Mapping the scientific and policy landscape of PM in Africa
organization. Accordingly, there is a possibility for a few additional African-based hospitals (mainly university or teaching hospitals) that were not retrieved bibliometrically. Corporate collaboration is in general limited in Africa with only few companies involved such as Task Applied Science in South Africa and Usomi Ltd in Kenya. However, non-African companies have relatively more participation such as GSK (23 co-authored publications with African institutions), Novonordisk (21) and followed by Pfizer, Bristol Myers-Squibb and IBM.
Figure 6. Top 20 African institutions in PM with respect to the number of publications
Other institutions (nongovernmental, regional, or international organisations in Africa) have low volume of publications and they include, in order of high number of publications, the following organisations.
• Africa Health Research Institute in South Africa
• Desmond Tutu Health foundation in South Africa
• Kumasi Centre for collaborative research in Tropical Medicine in Ghana,
• African Population and Health Research Centre in Kenya,
21
D2.1. Report: Mapping the scientific and policy landscape of PM in Africa
• Infectious diseases research collaboration in Uganda,
• Centre International de Recherches Medicales de Franceville in Gabon,
• Management and Development for Health in Tanzania,
• Anova Health Institute in Uganda,
• Epicentre in Uganda
• African Academy of Sciences
• Catholic Caritas Foundation of Nigeria.
• South African National Blood Service
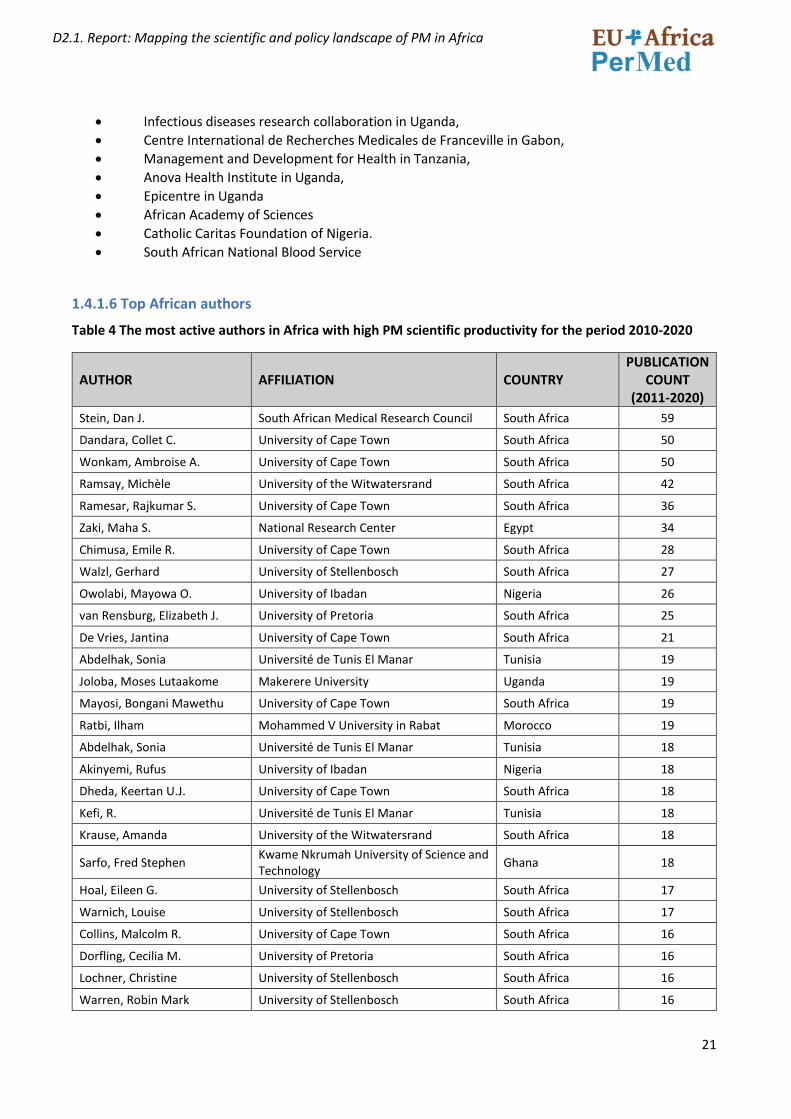
1.4.1.6 Top African authors
Table 4 The most active authors in Africa with high PM scientific productivity for the period 2010-2020
AUTHOR AFFILIATION COUNTRY PUBLICATION
COUNT (2011-2020)
Stein, Dan J. South African Medical Research Council South Africa 59
Dandara, Collet C. University of Cape Town South Africa 50
Wonkam, Ambroise A. University of Cape Town South Africa 50
Ramsay, Michèle University of the Witwatersrand South Africa 42
Ramesar, Rajkumar S. University of Cape Town South Africa 36
Zaki, Maha S. National Research Center Egypt 34
Chimusa, Emile R. University of Cape Town South Africa 28
Walzl, Gerhard University of Stellenbosch South Africa 27
Owolabi, Mayowa O. University of Ibadan Nigeria 26
van Rensburg, Elizabeth J. University of Pretoria South Africa 25
De Vries, Jantina University of Cape Town South Africa 21
Abdelhak, Sonia Université de Tunis El Manar Tunisia 19
Joloba, Moses Lutaakome Makerere University Uganda 19
Mayosi, Bongani Mawethu University of Cape Town South Africa 19
Ratbi, Ilham Mohammed V University in Rabat Morocco 19
Abdelhak, Sonia Université de Tunis El Manar Tunisia 18
Akinyemi, Rufus University of Ibadan Nigeria 18
Dheda, Keertan U.J. University of Cape Town South Africa 18
Kefi, R. Université de Tunis El Manar Tunisia 18
Krause, Amanda University of the Witwatersrand South Africa 18
Sarfo, Fred Stephen Kwame Nkrumah University of Science and Technology
Ghana 18
Hoal, Eileen G. University of Stellenbosch South Africa 17
Warnich, Louise University of Stellenbosch South Africa 17
Collins, Malcolm R. University of Cape Town South Africa 16
Dorfling, Cecilia M. University of Pretoria South Africa 16
Lochner, Christine University of Stellenbosch South Africa 16
Warren, Robin Mark University of Stellenbosch South Africa 16
22
D2.1. Report: Mapping the scientific and policy landscape of PM in Africa
Dalvie, Shareefa South African Medical Research Council South Africa 15
Möller, Marlo University of Pretoria South Africa 15
Norris, Shane A. University of the Witwatersrand South Africa 15
Rebai, Ahmed University of Sfax Tunisia 15
Schutte, Aletta E. Northwest University South Africa 15
Thomford, Nicholas Ekow University of Cape Town South Africa 15
Crowther, Nigel John University of the Witwatersrand South Africa 14
Hazelhurst, Scott University of the Witwatersrand South Africa 14
Matboli, Marwa Ain Shams University Egypt 14
Pepper, Michael S. University of Pretoria South Africa 14
Aseffa, Abraham Armauer Hansen Research Institute Ethiopia 13
Bardien, Soraya University of Stellenbosch South Africa 13
Dzobo, Kevin University of Cape Town South Africa 13
1.4.1.7 Publications with only African countries
Publications that involve only African countries is significantly low compared to international collaboration publications. Bilateral collaboration in Africa is frequently observed despite being low in volume (almost 80 publications) while collaboration involving more than 2 African countries with no other countries (non-African countries) has lower number of publications, and it is extremely low for collaboration involving more than 3 African countries with no non-African country involved as a collaborator. Publications with single authorship (only one author) are 77 articles, publications involving collaboration (institutional collaboration) inside an African country are 583 articles.
1.4.2 Main research areas and disease categories
1.4.2.1 Articles on personalised medicine according to research areas (prevention, diagnosis, and treatment) in Africa
Using the methodology explained in the previous section and the search strategy defined in Annex A, 2635 publications, out of all the retrieved 4340 articles of PM in Africa, were found to be related to one of the research areas: prevention, diagnosis, and treatment and they were mapped accordingly to each. The following table shows that treatment related publications have the highest percentage and is very close to diagnosis related publications while prevention related publications showed significantly lower number of publications compared to other research areas.
Table 5: PM publications in Africa according to research area: Treatment, Diagnosis and Prevention
1.4.2.2 Articles on personalised medicine according to disease category in Africa
Classification of PM articles in Africa according to disease categories were implemented using PubMed MESH terms. This percentage in relation with the total number of articles with MESH (3556) was calculated. Almost
Areas Total publication count %
Treatment 1246 58,5%
Diagnosis 1210 56,8%
Prevention 179 8,4%
23
D2.1. Report: Mapping the scientific and policy landscape of PM in Africa
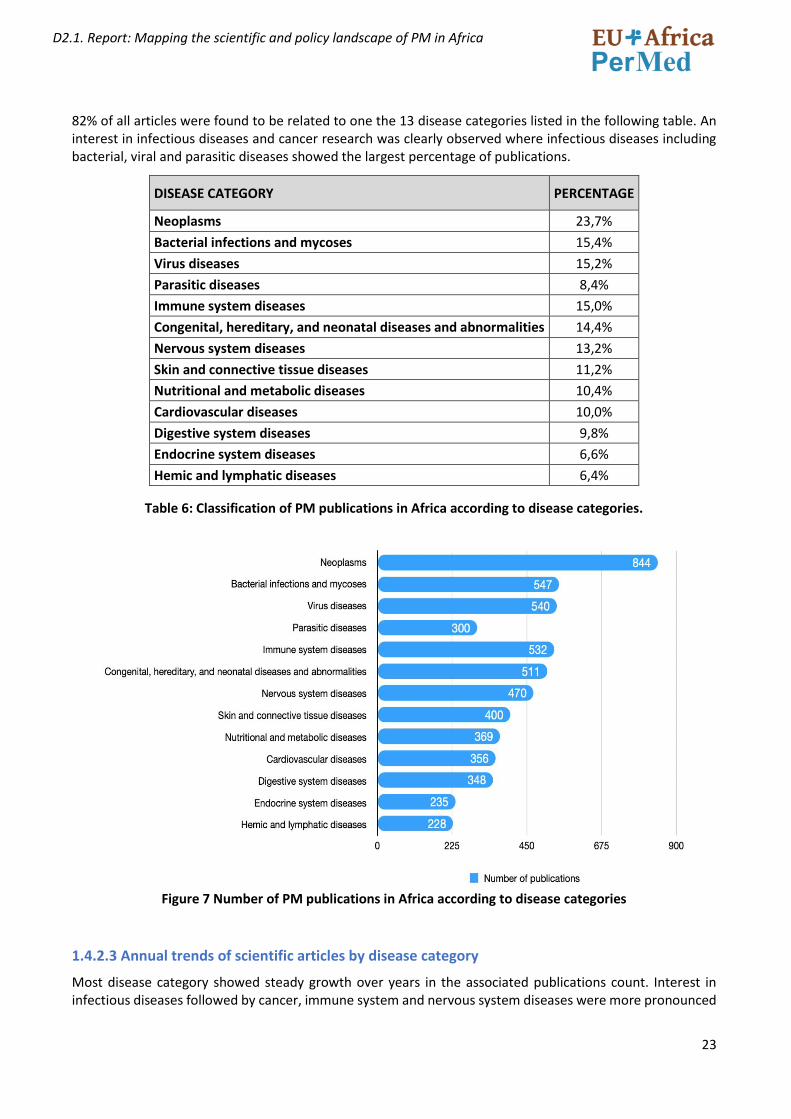
82% of all articles were found to be related to one the 13 disease categories listed in the following table. An interest in infectious diseases and cancer research was clearly observed where infectious diseases including bacterial, viral and parasitic diseases showed the largest percentage of publications.
Table 6: Classification of PM publications in Africa according to disease categories.
Figure 7 Number of PM publications in Africa according to disease categories
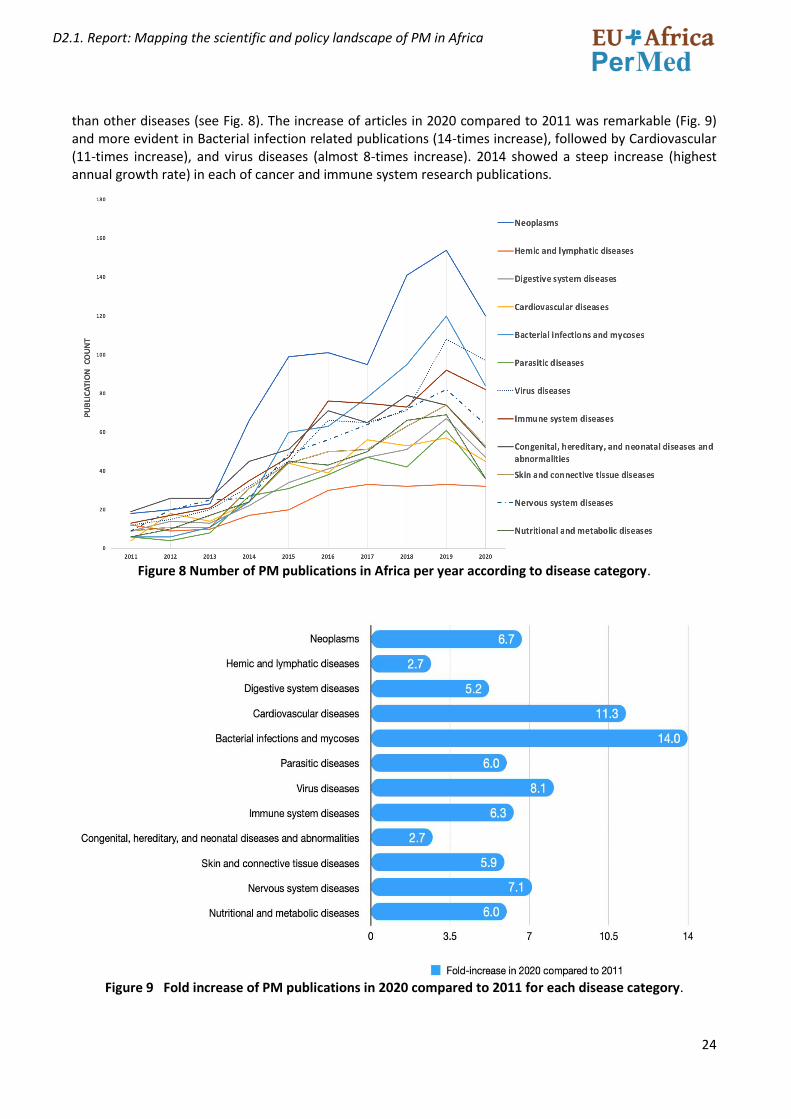
1.4.2.3 Annual trends of scientific articles by disease category
Most disease category showed steady growth over years in the associated publications count. Interest in infectious diseases followed by cancer, immune system and nervous system diseases were more pronounced
DISEASE CATEGORY PERCENTAGE
Neoplasms 23,7%
Bacterial infections and mycoses 15,4%
Virus diseases 15,2%
Parasitic diseases 8,4%
Immune system diseases 15,0%
Congenital, hereditary, and neonatal diseases and abnormalities 14,4%
Nervous system diseases 13,2%
Skin and connective tissue diseases 11,2%
Nutritional and metabolic diseases 10,4%
Cardiovascular diseases 10,0%
Digestive system diseases 9,8%
Endocrine system diseases 6,6%
Hemic and lymphatic diseases 6,4%
24
D2.1. Report: Mapping the scientific and policy landscape of PM in Africa
than other diseases (see Fig. 8). The increase of articles in 2020 compared to 2011 was remarkable (Fig. 9) and more evident in Bacterial infection related publications (14-times increase), followed by Cardiovascular (11-times increase), and virus diseases (almost 8-times increase). 2014 showed a steep increase (highest annual growth rate) in each of cancer and immune system research publications.
Figure 8 Number of PM publications in Africa per year according to disease category.
Figure 9 Fold increase of PM publications in 2020 compared to 2011 for each disease category.
25
D2.1. Report: Mapping the scientific and policy landscape of PM in Africa
1.4.3-Trends and type of research collaboration
1.4.3.1 Articles on personalised medicine (Africa) with countries from Europe as collaborators
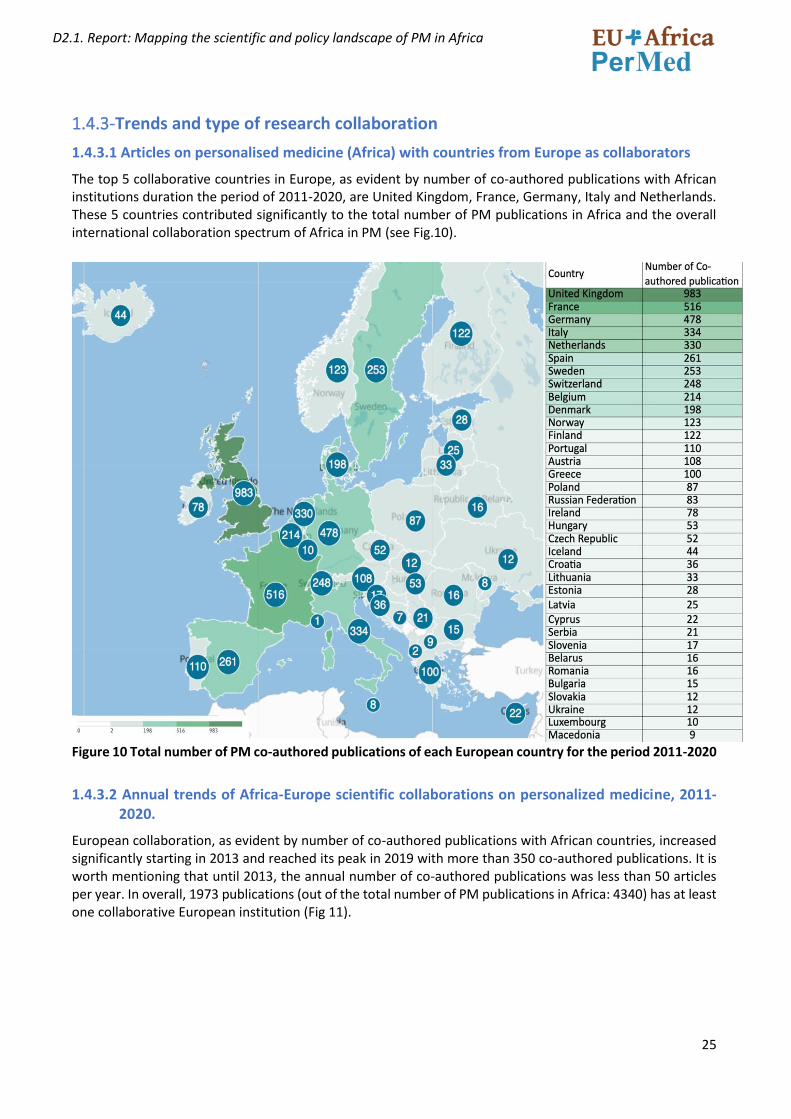
The top 5 collaborative countries in Europe, as evident by number of co-authored publications with African institutions duration the period of 2011-2020, are United Kingdom, France, Germany, Italy and Netherlands. These 5 countries contributed significantly to the total number of PM publications in Africa and the overall international collaboration spectrum of Africa in PM (see Fig.10).
Figure 10 Total number of PM co-authored publications of each European country for the period 2011-2020
1.4.3.2 Annual trends of Africa-Europe scientific collaborations on personalized medicine, 2011-2020.
European collaboration, as evident by number of co-authored publications with African countries, increased significantly starting in 2013 and reached its peak in 2019 with more than 350 co-authored publications. It is worth mentioning that until 2013, the annual number of co-authored publications was less than 50 articles per year. In overall, 1973 publications (out of the total number of PM publications in Africa: 4340) has at least one collaborative European institution (Fig 11).
26
D2.1. Report: Mapping the scientific and policy landscape of PM in Africa
Figure 11. Annual trend of Africa-Europe co-authored publications in PM for the period 2011-2020
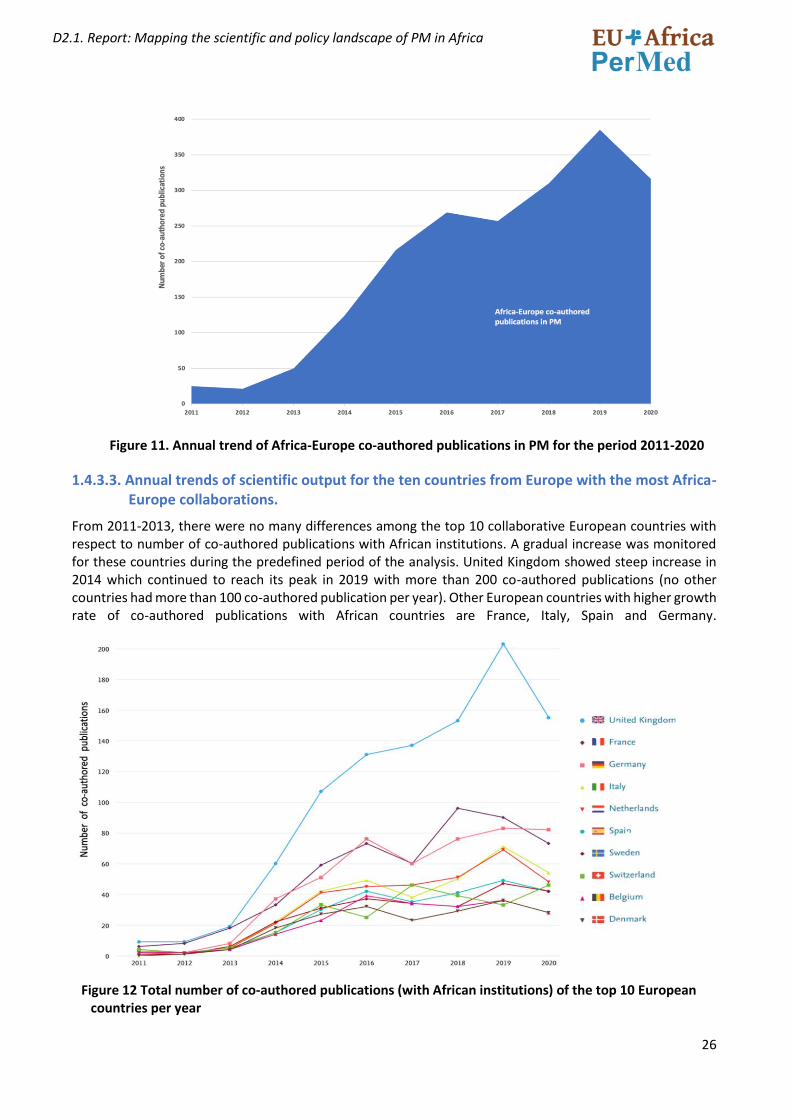
1.4.3.3. Annual trends of scientific output for the ten countries from Europe with the most Africa-Europe collaborations.
From 2011-2013, there were no many differences among the top 10 collaborative European countries with respect to number of co-authored publications with African institutions. A gradual increase was monitored for these countries during the predefined period of the analysis. United Kingdom showed steep increase in 2014 which continued to reach its peak in 2019 with more than 200 co-authored publications (no other countries had more than 100 co-authored publication per year). Other European countries with higher growth rate of co-authored publications with African countries are France, Italy, Spain and Germany.
Figure 12 Total number of co-authored publications (with African institutions) of the top 10 European countries per year
27
D2.1. Report: Mapping the scientific and policy landscape of PM in Africa
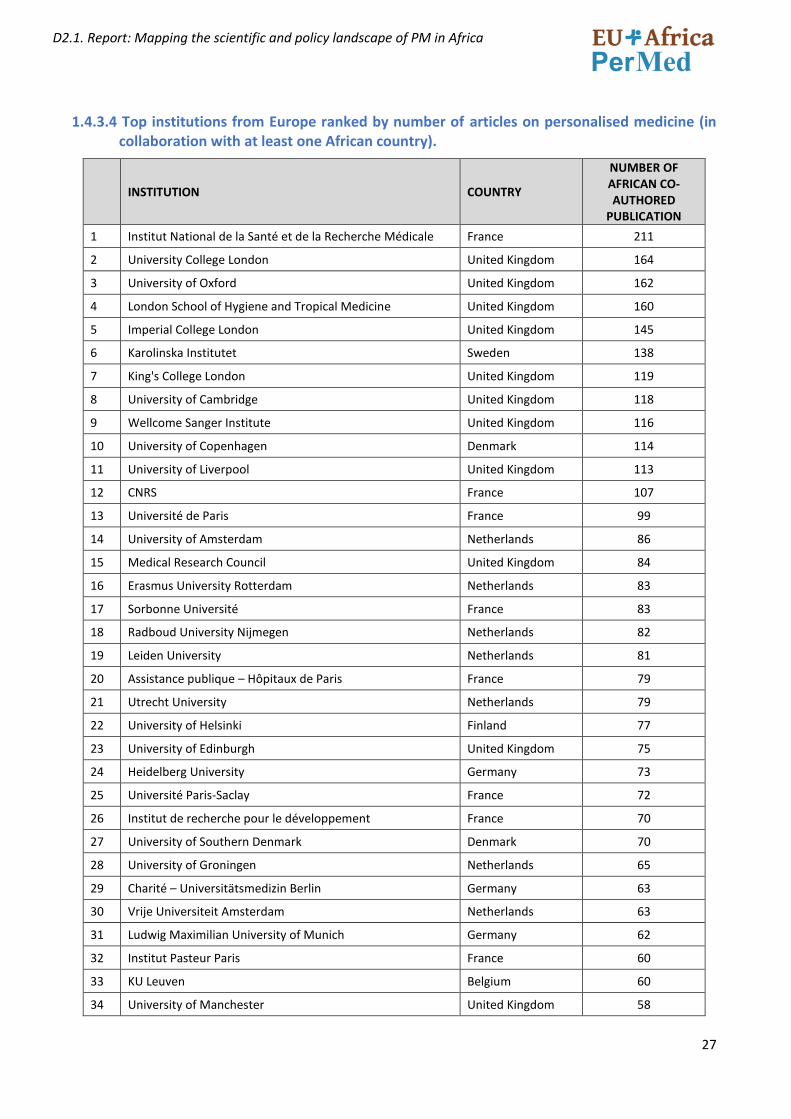
1.4.3.4 Top institutions from Europe ranked by number of articles on personalised medicine (in collaboration with at least one African country).
INSTITUTION COUNTRY
NUMBER OF AFRICAN CO-AUTHORED
PUBLICATION
1 Institut National de la Santé et de la Recherche Médicale France 211
2 University College London United Kingdom 164
3 University of Oxford United Kingdom 162
4 London School of Hygiene and Tropical Medicine United Kingdom 160
5 Imperial College London United Kingdom 145
6 Karolinska Institutet Sweden 138
7 King's College London United Kingdom 119
8 University of Cambridge United Kingdom 118
9 Wellcome Sanger Institute United Kingdom 116
10 University of Copenhagen Denmark 114
11 University of Liverpool United Kingdom 113
12 CNRS France 107
13 Université de Paris France 99
14 University of Amsterdam Netherlands 86
15 Medical Research Council United Kingdom 84
16 Erasmus University Rotterdam Netherlands 83
17 Sorbonne Université France 83
18 Radboud University Nijmegen Netherlands 82
19 Leiden University Netherlands 81
20 Assistance publique – Hôpitaux de Paris France 79
21 Utrecht University Netherlands 79
22 University of Helsinki Finland 77
23 University of Edinburgh United Kingdom 75
24 Heidelberg University Germany 73
25 Université Paris-Saclay France 72
26 Institut de recherche pour le développement France 70
27 University of Southern Denmark Denmark 70
28 University of Groningen Netherlands 65
29 Charité – Universitätsmedizin Berlin Germany 63
30 Vrije Universiteit Amsterdam Netherlands 63
31 Ludwig Maximilian University of Munich Germany 62
32 Institut Pasteur Paris France 60
33 KU Leuven Belgium 60
34 University of Manchester United Kingdom 58
28
D2.1. Report: Mapping the scientific and policy landscape of PM in Africa
INSTITUTION COUNTRY
NUMBER OF AFRICAN CO-AUTHORED
PUBLICATION
35 Oxford University Hospitals NHS Foundation Trust United Kingdom 57
36 Lund University Sweden 55
37 University of Glasgow United Kingdom 55
38 University of Oslo Norway 55
39 Autonomous University of Barcelona Spain 54
40 German Cancer Research Center Germany 52
41 St George's University Hospitals NHS Foundation Trust United Kingdom 52
42 University of Basel Switzerland 52
43 Technical University of Munich Germany 51
44 Wellcome Trust United Kingdom 50
45 CIBER - Center for Biomedical Research Network Spain 49
46 University of Tübingen Germany 49
47 Uppsala University Sweden 48
48 Ghent University Belgium 47
49 University of Porto Portugal 47
50 Kiel University Germany 46
Table 7 Top European institutions collaborating with Africa in PM medicine within the period of 2011-2020
1.4.3.5 Articles on personalised medicine according to research area (treatment, prevention or diagnosis) of the African-Europe scientific co-publications
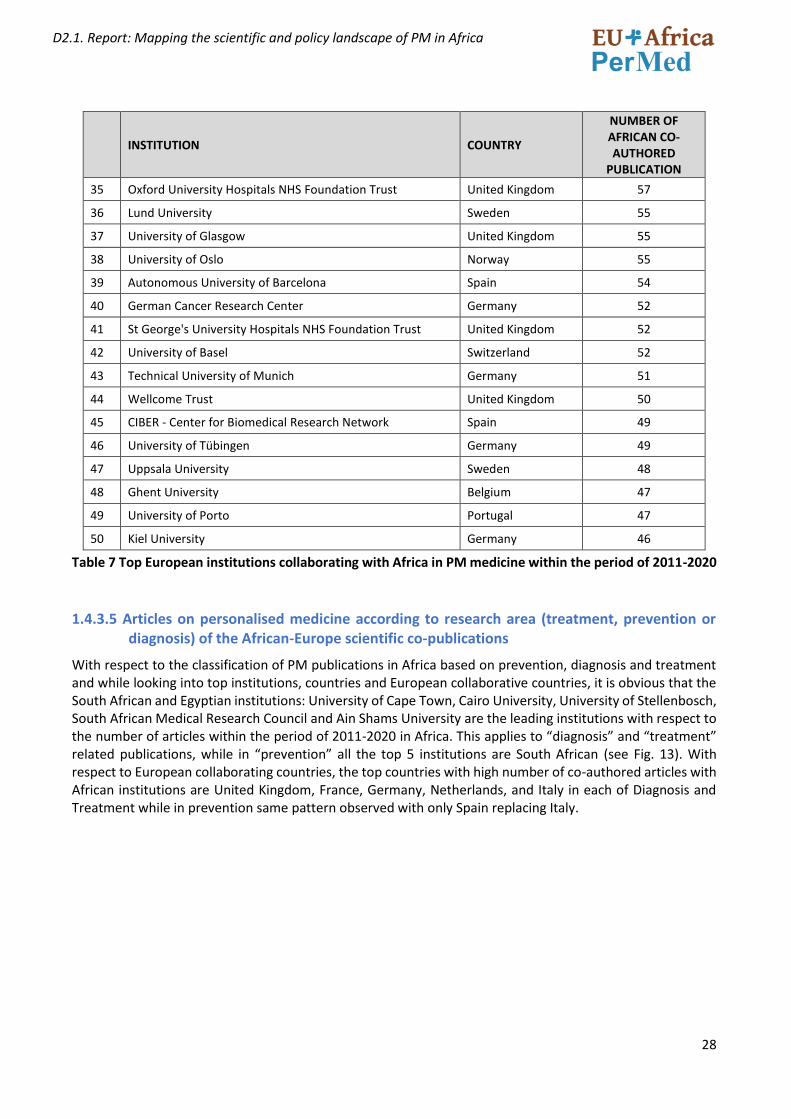
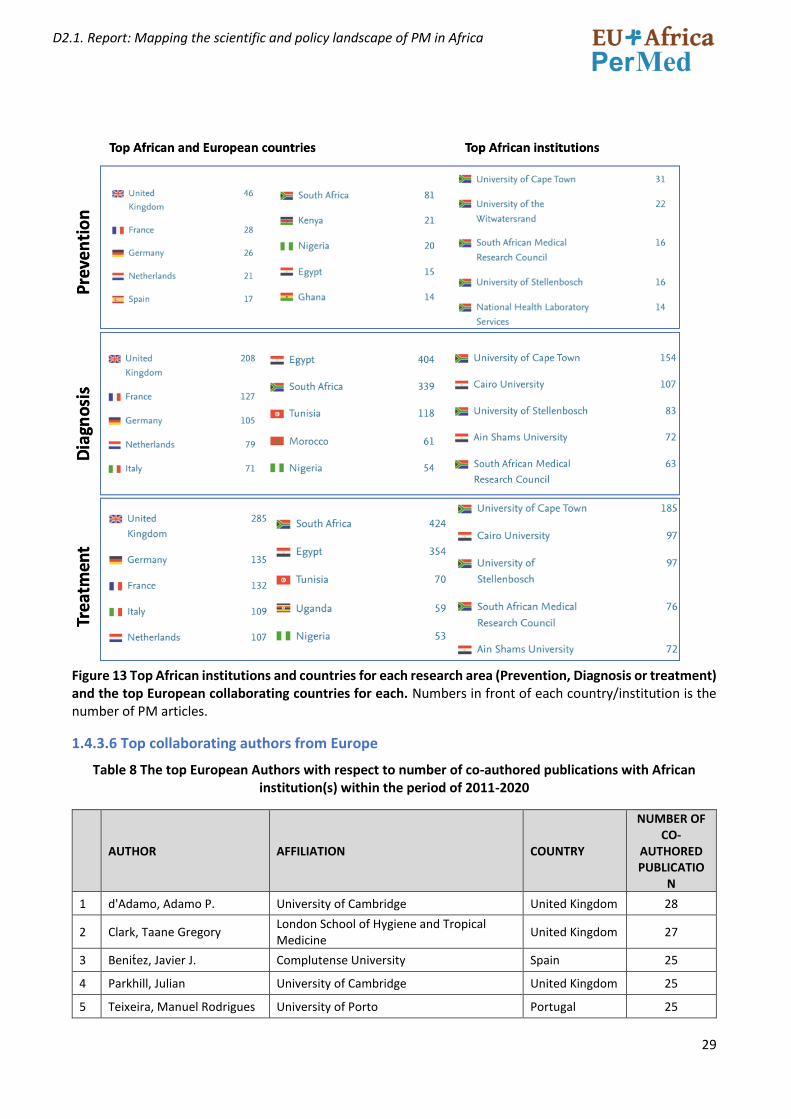
With respect to the classification of PM publications in Africa based on prevention, diagnosis and treatment and while looking into top institutions, countries and European collaborative countries, it is obvious that the South African and Egyptian institutions: University of Cape Town, Cairo University, University of Stellenbosch, South African Medical Research Council and Ain Shams University are the leading institutions with respect to the number of articles within the period of 2011-2020 in Africa. This applies to “diagnosis” and “treatment” related publications, while in “prevention” all the top 5 institutions are South African (see Fig. 13). With respect to European collaborating countries, the top countries with high number of co-authored articles with African institutions are United Kingdom, France, Germany, Netherlands, and Italy in each of Diagnosis and Treatment while in prevention same pattern observed with only Spain replacing Italy.
29
D2.1. Report: Mapping the scientific and policy landscape of PM in Africa
Figure 13 Top African institutions and countries for each research area (Prevention, Diagnosis or treatment) and the top European collaborating countries for each. Numbers in front of each country/institution is the number of PM articles.
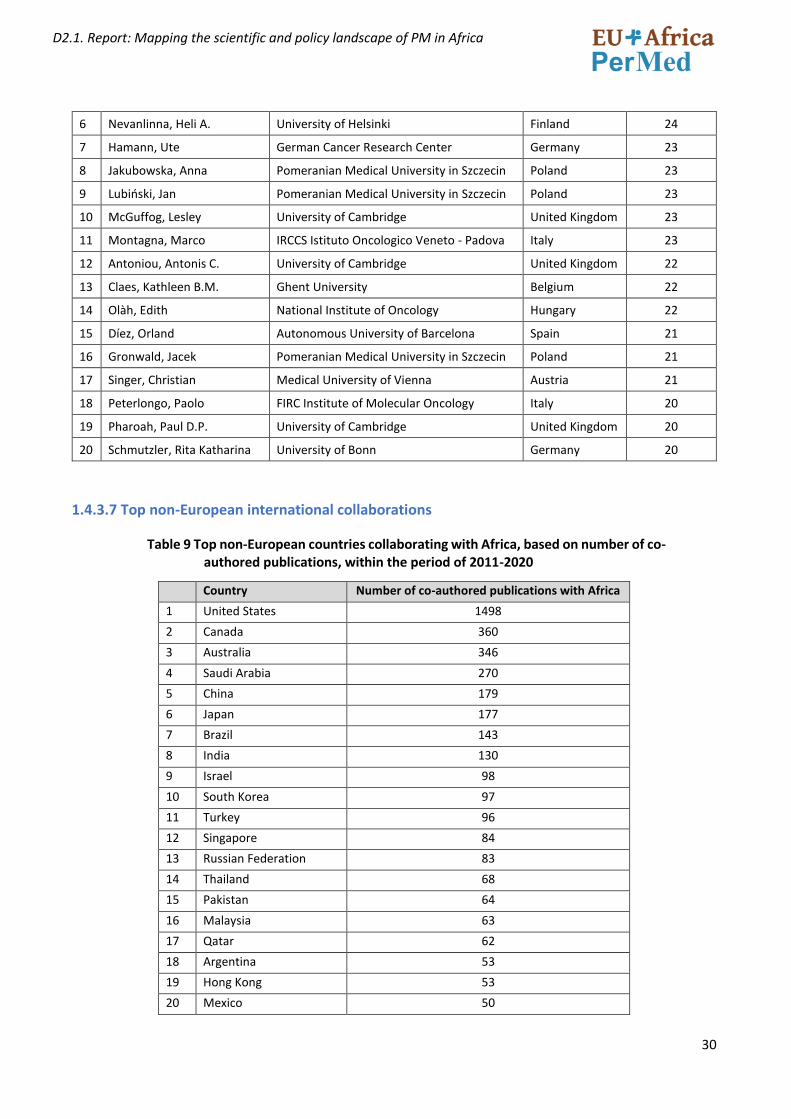
1.4.3.6 Top collaborating authors from Europe
Table 8 The top European Authors with respect to number of co-authored publications with African institution(s) within the period of 2011-2020
AUTHOR AFFILIATION COUNTRY
NUMBER OF CO-
AUTHORED PUBLICATIO
N
1 d'Adamo, Adamo P. University of Cambridge United Kingdom 28
2 Clark, Taane Gregory London School of Hygiene and Tropical Medicine
United Kingdom 27
3 Benitez, Javier J. Complutense University Spain 25
4 Parkhill, Julian University of Cambridge United Kingdom 25
5 Teixeira, Manuel Rodrigues University of Porto Portugal 25
30
D2.1. Report: Mapping the scientific and policy landscape of PM in Africa
6 Nevanlinna, Heli A. University of Helsinki Finland 24
7 Hamann, Ute German Cancer Research Center Germany 23
8 Jakubowska, Anna Pomeranian Medical University in Szczecin Poland 23
9 Lubiński, Jan Pomeranian Medical University in Szczecin Poland 23
10 McGuffog, Lesley University of Cambridge United Kingdom 23
11 Montagna, Marco IRCCS Istituto Oncologico Veneto - Padova Italy 23
12 Antoniou, Antonis C. University of Cambridge United Kingdom 22
13 Claes, Kathleen B.M. Ghent University Belgium 22
14 Olàh, Edith National Institute of Oncology Hungary 22
15 Díez, Orland Autonomous University of Barcelona Spain 21
16 Gronwald, Jacek Pomeranian Medical University in Szczecin Poland 21
17 Singer, Christian Medical University of Vienna Austria 21
18 Peterlongo, Paolo FIRC Institute of Molecular Oncology Italy 20
19 Pharoah, Paul D.P. University of Cambridge United Kingdom 20
20 Schmutzler, Rita Katharina University of Bonn Germany 20
1.4.3.7 Top non-European international collaborations
Table 9 Top non-European countries collaborating with Africa, based on number of co-authored publications, within the period of 2011-2020
Country Number of co-authored publications with Africa
1 United States 1498
2 Canada 360
3 Australia 346
4 Saudi Arabia 270
5 China 179
6 Japan 177
7 Brazil 143
8 India 130
9 Israel 98
10 South Korea 97
11 Turkey 96
12 Singapore 84
13 Russian Federation 83
14 Thailand 68
15 Pakistan 64
16 Malaysia 63
17 Qatar 62
18 Argentina 53
19 Hong Kong 53
20 Mexico 50
31
D2.1. Report: Mapping the scientific and policy landscape of PM in Africa
1.4.3.8 Patentability and innovation potential
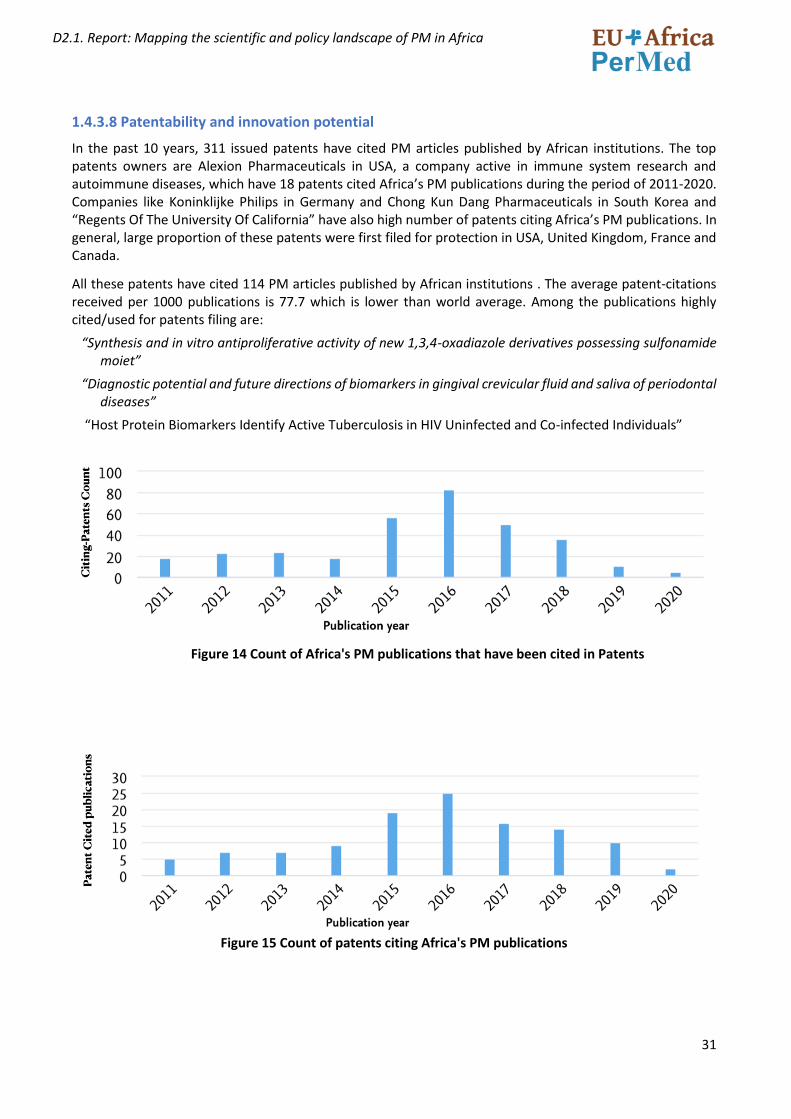
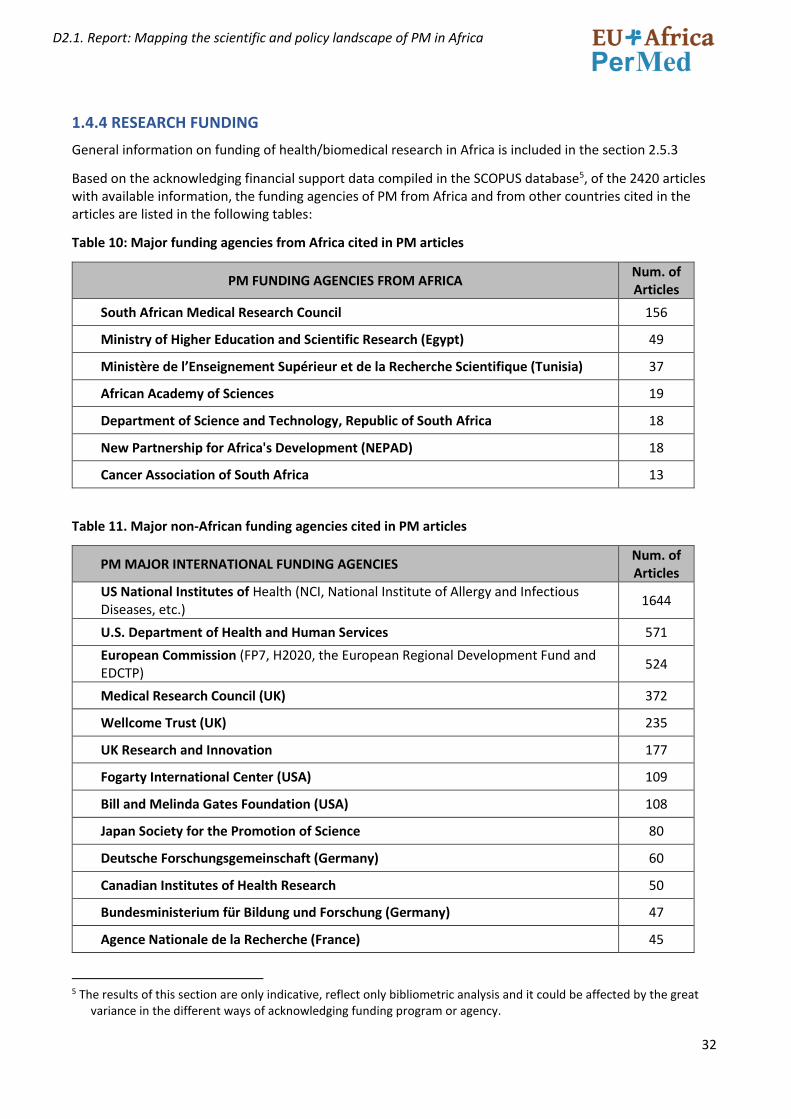
In the past 10 years, 311 issued patents have cited PM articles published by African institutions. The top patents owners are Alexion Pharmaceuticals in USA, a company active in immune system research and autoimmune diseases, which have 18 patents cited Africa’s PM publications during the period of 2011-2020. Companies like Koninklijke Philips in Germany and Chong Kun Dang Pharmaceuticals in South Korea and “Regents Of The University Of California” have also high number of patents citing Africa’s PM publications. In general, large proportion of these patents were first filed for protection in USA, United Kingdom, France and Canada.
All these patents have cited 114 PM articles published by African institutions . The average patent-citations received per 1000 publications is 77.7 which is lower than world average. Among the publications highly cited/used for patents filing are:
“Synthesis and in vitro antiproliferative activity of new 1,3,4-oxadiazole derivatives possessing sulfonamide moiet”
“Diagnostic potential and future directions of biomarkers in gingival crevicular fluid and saliva of periodontal diseases”
“Host Protein Biomarkers Identify Active Tuberculosis in HIV Uninfected and Co-infected Individuals”
Figure 14 Count of Africa's PM publications that have been cited in Patents
Figure 15 Count of patents citing Africa's PM publications
32
D2.1. Report: Mapping the scientific and policy landscape of PM in Africa
1.4.4 RESEARCH FUNDING
General information on funding of health/biomedical research in Africa is included in the section 2.5.3
Based on the acknowledging financial support data compiled in the SCOPUS database5, of the 2420 articles with available information, the funding agencies of PM from Africa and from other countries cited in the articles are listed in the following tables:
Table 10: Major funding agencies from Africa cited in PM articles
PM FUNDING AGENCIES FROM AFRICA Num. of Articles
South African Medical Research Council 156
Ministry of Higher Education and Scientific Research (Egypt) 49
Ministère de l’Enseignement Supérieur et de la Recherche Scientifique (Tunisia) 37
African Academy of Sciences 19
Department of Science and Technology, Republic of South Africa 18
New Partnership for Africa's Development (NEPAD) 18
Cancer Association of South Africa 13
Table 11. Major non-African funding agencies cited in PM articles
PM MAJOR INTERNATIONAL FUNDING AGENCIES Num. of Articles
US National Institutes of Health (NCI, National Institute of Allergy and Infectious Diseases, etc.)
1644
U.S. Department of Health and Human Services 571
European Commission (FP7, H2020, the European Regional Development Fund and EDCTP)
524
Medical Research Council (UK) 372
Wellcome Trust (UK) 235
UK Research and Innovation 177
Fogarty International Center (USA) 109
Bill and Melinda Gates Foundation (USA) 108
Japan Society for the Promotion of Science 80
Deutsche Forschungsgemeinschaft (Germany) 60
Canadian Institutes of Health Research 50
Bundesministerium für Bildung und Forschung (Germany) 47
Agence Nationale de la Recherche (France) 45
5 The results of this section are only indicative, reflect only bibliometric analysis and it could be affected by the great
variance in the different ways of acknowledging funding program or agency.
33
D2.1. Report: Mapping the scientific and policy landscape of PM in Africa
National Natural Science Foundation of China 44
Instituto de Salud Carlos III (Spain) 33
Cancer Research UK 31
Schweizerischer Nationalfonds zur Förderung der Wissenschaftlichen Forschung (Switzerland)
28
Due that the concrete beneficiaries of the funding are not specified in the data analysed, limitation might exist as it is not clear as in the case of articles with authors belonging to institutions in different countries and with multiple sources of funding, whether the funding from a specific institution went to the African institution and/or to the collaborators, but in any case we have included all the funding institution included in the selected articles in the above tables.
34
D2.1. Report: Mapping the scientific and policy landscape of PM in Africa
PART 2 - HEALTH R&I POLICY LANDSCAPE IN AFRICAN COUNTRIES WITH A SPECIAL FOCUS ON PERSONALISED MEDICINE.
2.1 INTRODUCTION
The objective of the policy mapping is to identify policies and programmes in African countries supporting and promoting health R&I, and if there are any specific policies/programmes/initiatives that support Personalised Medicine (PM) activities (research projects, training, infrastructure, innovation, industry already present or operational etc.). It is the result of the work of WP2-Task 2.2 Reviewing the health R&I policy landscape in African countries.
The work has been carried out by a group coordinated by Erika Sela (INNOVATEC). Group members include: Rizwana Mia and Phetole Mahasha (SA-MRC), Lynette Kamau and Evelyn Gitau (APHRC), Teresia Nyawira, Mary Onsarigo and Charity Njambi Musembi (NACOSTI), Nomsa Mulima (ECSA-HC) and Nthabiseng Moiloa and Chimwemwe Chamdimba (AUDA-NEPAD).
We have followed the definition of Personalised Medicine (PM) included in section 1.1 of this document. Keeping in mind this broad definition, our review need not be limited to structured PM policy but also the areas defining a PM ecosystem. These span across the Precision Medicine value chain within thematic areas of research such as: Proteomic and genomic research, health systems research, and data science. These thematic areas are underpinned by a foundation of sound ethics and regulation, skilled personnel, and core infrastructure to support the full ecosystem.
The results of this policy mapping will support and facilitate future project activities planned in WP2 (stakeholder workshop for analysis of main gaps and challenges for PM in Africa), WP3 (Explore and analyse the potential and advantages of collaboration of Africa and Europe in the field of PM and identify areas of mutual interest and added value for future collaboration), WP4 (Enhancing the dialogue between African countries and Europe in collaboration with ICPerMed and ERA PerMed), WP5 (Capacity building and training in PM) and WP6 (Communication and dissemination).
Information collected will be discussed and validated with African stakeholders in a workshop (planned for the first months of 2022) and will provide the project a baseline to:
• Understand the policy context in which PM can be developed and implemented, focused mainly in the policy areas that govern health science, technology and innovation. This must also include the wide area of policy governing the health systems, the delivery of healthcare and policies governing data sharing and data privacy.
• Understand who defines the policy for health research in African countries and who implements/funds it (Governance of the Health R&I system).
• Understand how the policy and funding of research is addressing main health challenges in the countries and regions.
• Understand if Personalised Medicine (PM) is an issue of interest for policymakers, if there are specific plans or programmes for PM in Africa, or a context that could favour the development of PM in African countries.
• Identify international programmes funding Health research and PM in Africa and the level of collaboration with Europe and with other regions and in which health areas this collaboration takes place. Also identify the nature of collaboration specifically the development of Intellectual Property and if this is an enabling factor for down the line health products and solutions.
• Understand the regulatory legislature in different countries and the function of regulatory control bodies in various countries and regions.
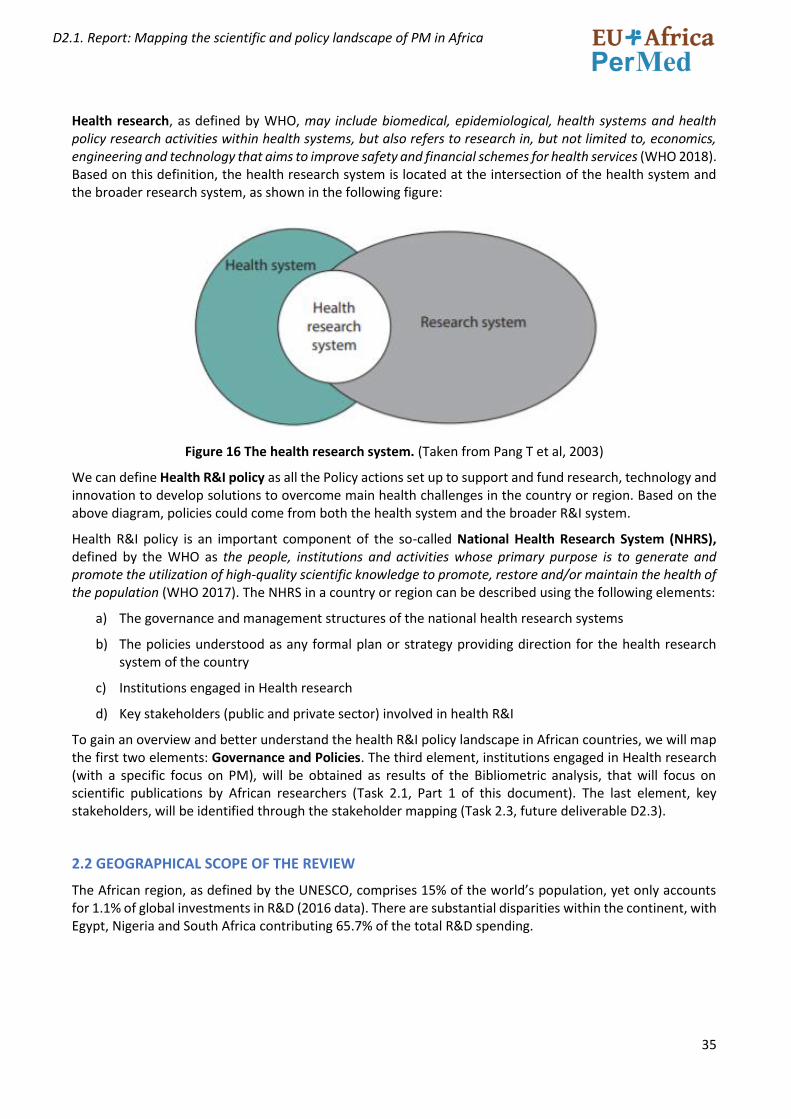
35
D2.1. Report: Mapping the scientific and policy landscape of PM in Africa
Health research, as defined by WHO, may include biomedical, epidemiological, health systems and health policy research activities within health systems, but also refers to research in, but not limited to, economics, engineering and technology that aims to improve safety and financial schemes for health services (WHO 2018). Based on this definition, the health research system is located at the intersection of the health system and the broader research system, as shown in the following figure:
Figure 16 The health research system. (Taken from Pang T et al, 2003)
We can define Health R&I policy as all the Policy actions set up to support and fund research, technology and innovation to develop solutions to overcome main health challenges in the country or region. Based on the above diagram, policies could come from both the health system and the broader R&I system.
Health R&I policy is an important component of the so-called National Health Research System (NHRS), defined by the WHO as the people, institutions and activities whose primary purpose is to generate and promote the utilization of high-quality scientific knowledge to promote, restore and/or maintain the health of the population (WHO 2017). The NHRS in a country or region can be described using the following elements:
a) The governance and management structures of the national health research systems
b) The policies understood as any formal plan or strategy providing direction for the health research system of the country
c) Institutions engaged in Health research
d) Key stakeholders (public and private sector) involved in health R&I
To gain an overview and better understand the health R&I policy landscape in African countries, we will map the first two elements: Governance and Policies. The third element, institutions engaged in Health research (with a specific focus on PM), will be obtained as results of the Bibliometric analysis, that will focus on scientific publications by African researchers (Task 2.1, Part 1 of this document). The last element, key stakeholders, will be identified through the stakeholder mapping (Task 2.3, future deliverable D2.3).
2.2 GEOGRAPHICAL SCOPE OF THE REVIEW
The African region, as defined by the UNESCO, comprises 15% of the world’s population, yet only accounts for 1.1% of global investments in R&D (2016 data). There are substantial disparities within the continent, with Egypt, Nigeria and South Africa contributing 65.7% of the total R&D spending.
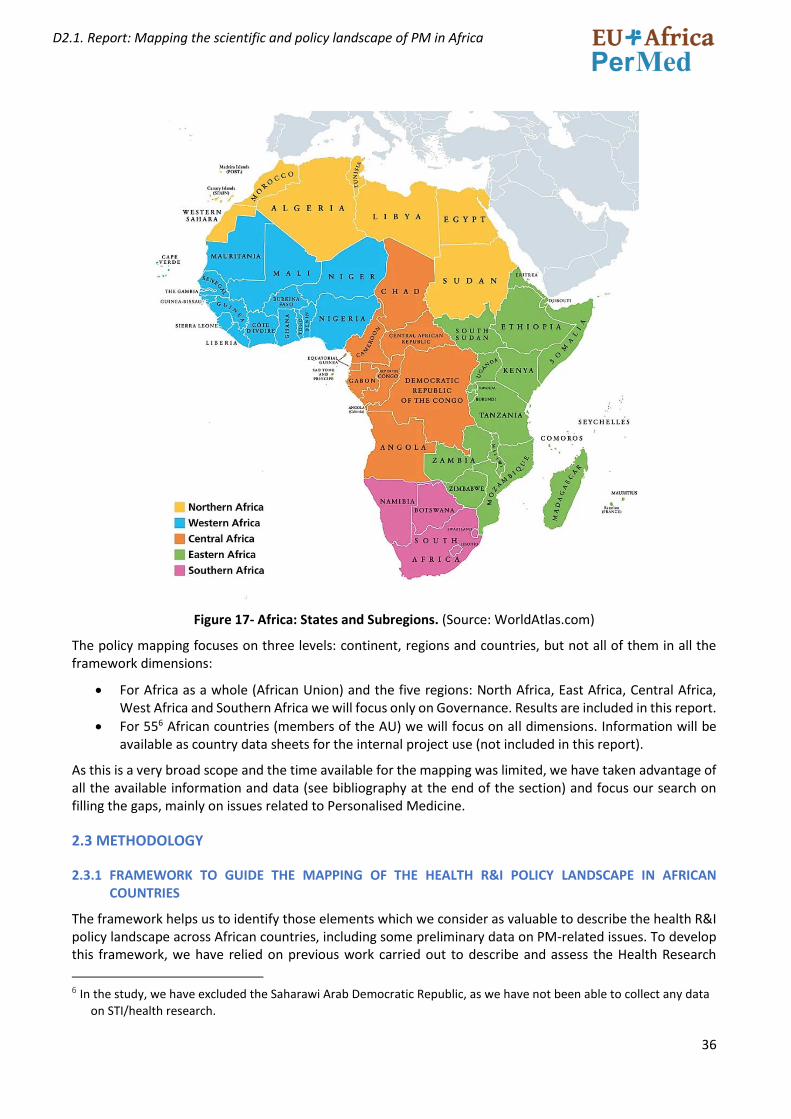
36
D2.1. Report: Mapping the scientific and policy landscape of PM in Africa
Figure 17- Africa: States and Subregions. (Source: WorldAtlas.com)
The policy mapping focuses on three levels: continent, regions and countries, but not all of them in all the framework dimensions:
• For Africa as a whole (African Union) and the five regions: North Africa, East Africa, Central Africa, West Africa and Southern Africa we will focus only on Governance. Results are included in this report.
• For 556 African countries (members of the AU) we will focus on all dimensions. Information will be available as country data sheets for the internal project use (not included in this report).
As this is a very broad scope and the time available for the mapping was limited, we have taken advantage of all the available information and data (see bibliography at the end of the section) and focus our search on filling the gaps, mainly on issues related to Personalised Medicine.
2.3 METHODOLOGY
2.3.1 FRAMEWORK TO GUIDE THE MAPPING OF THE HEALTH R&I POLICY LANDSCAPE IN AFRICAN COUNTRIES
The framework helps us to identify those elements which we consider as valuable to describe the health R&I policy landscape across African countries, including some preliminary data on PM-related issues. To develop this framework, we have relied on previous work carried out to describe and assess the Health Research
6 In the study, we have excluded the Saharawi Arab Democratic Republic, as we have not been able to collect any data
on STI/health research.
37
D2.1. Report: Mapping the scientific and policy landscape of PM in Africa
systems in Africa (Jones C.M. et al. 2021; Kirigia, J.M. et al. 2015; Kirigia, J.M. et al. 2016), as well as studies that focused on mapping Personalized Medicine in Spanish regions (Fundación Instituto Roche (2019 ), or work that identified specific challenges for implementing PM in low and middle income countries (Anaya JM et al. 2016). We have also based our work on a very relevant document: the Framework for the implementation of Genomic medicine for Public Health in Africa prepared by the African Academy of Science and AUDA-NEPAD (ASP Policy Paper 1, 2020), as well as the report “Mapping the scientific and Policy Landscape of PerMed in LAC Region, with results of the mapping, including the identification of stakeholders”7
In 2015, Ministries of Health in the WHO African region endorsed the “Research for health: A strategy for the African region 2016-2025”, a common strategy focused on strengthening NHRS in African countries, as part of the policy goal of achieving Universal Health Coverage, a central target for reaching Health SDG3. To facilitate monitoring and assessment of progress, the strategy established targets and priority interventions for strengthening the NHRS in four areas: i) Governance, ii) Creating and sustaining resources; iii) producing and using research and iv) financing (Kirigia JM 2015, Pang T, 2003). For each of these areas, different indicators have been used to assess the progress towards the targets set up in the WHO strategy, and thus visualise the level of development of the NHRS in each country.
We will use these four areas as a starting point to develop the framework that will guide our mapping work. For each area we have selected a set of indicators (qualitative/quantitative). The four areas have been complemented with two additional ones relevant for our work: International collaboration in Health research and PM/Genomic research.
Presented below is the Analytical framework we propose to guide the collection of information for reviewing the health R&I policy landscape in African countries.
Table 12- EU-AFRICA PERMED FRAMEWORK FOR THE POLICY MAPPING
DIMENSION DESCRIPTION
GOVERNANCE OF HEALTH RESEARCH
Health research governance provides a conducive environment for the coordination and conduct of health research and is considered as a pre-requisite to building research capacity. It includes policymaking, creating an enabling research environment and regulating, monitoring and evaluating performance. Governance should also include the management of intellectual property and dissemination thereof.
FINANCING HEALTH RESEARCH
This dimension includes all aspects related to the raising of funds for health research, their pooling and their efficient, transparent and accountable allocation to individuals, institutions and organizations whose primary objective is to produce, disseminate, archive and promote the use of health research. Also includes how the research agenda is set in terms of prioritization of research problems that are addressed.
RESOURCES FOR HEALTH RESEARCH
This dimension includes those aspects of the system involved in building, strengthening and sustaining the human, infrastructure, institutional and systemic capacities to conduct, disseminate, archive and utilize health research.
HEALTH RESEARCH OUTPUTS
This dimension focuses on the outputs of research, mainly scientific publications and patents filed, but also other activities such as clinical trials, representing biomedical research.
7 This report is public deliverable D2.1 of the H2020 project EULAC PerMed, available in https://www.eulac-
permed.eu/index.php/resources/
38
D2.1. Report: Mapping the scientific and policy landscape of PM in Africa
INTERNATIONAL COLLABORATIONS IN HEALTH RESEARCH
In this area we focus on the level of collaboration with other countries, the activities carried out as part of international, Pan African or regional programmes funding collaborative health research (projects and capacity building actions).
PM/GENOMIC RESEARCH
This area focuses on aspects that are considered relevant for both research and implementation of PM in a country or region. This also includes the areas of data science and health systems. This would be aspects relevant to the transformation of health care to digital health and the capacity to manage and derive benefit from databases on a countries patient population (how far off is this in terms of implementation strategies for PM in these countries?)
For each dimension we suggest a list of indicators (qualitative and quantitative) that will provide us with information on the status of each country in health research and innovation. The selection of the indicators is based on two main criteria:
1) Availability of metrics in public databases, in published articles, studies and report. 2) They have been used in previous studies of African health research systems and information is
available from these studies
Table 13 LIST OF INDICATORS USED FOR THE POLICY MAPPING
DIMENSION PROPOSED INDICATORS8 SOURCES OF DATA
HEALTH RESEARCH AND INNOVATION SYSTEM
The value for the NHRS barometer The NHRS barometer was developed to assess the performance of NHRS functions of member states in the WHO African Region. It gives an indication of the strength of the NHRS, which is seen as a facilitator for the generation and utilization of scientific knowledge and innovations for developing technologies, as well as systems and services to achieve UHC.
WHO assessment of NHRS 2017-2018 (only for 47 states members of Who Africa) (Ref: 5)
GOVERNANCE OF HEALTH RESEARCH
• Existence of STI policies and priorities relevant for health research domain and identification of the document (s)
• Existence of a National Health Research policy and national health research plans and identification of the document (s)
• Existence of Trade and Industry Policy that regulate the implementation of health innovation products and services
• Existence of a Legal framework for health research and/or Health research regulations and identification of the document(s) legislature on IP governance and management as well as Health product regulation etc
• Existence of norms and guidelines to protect human and ethical rights of people participating in research and Identification of the document
Quantitative data (Yes/no): WHO assessment of NHRS 2017-2018 (only for 47 states members of WHO Africa). Ref 18 and 22 (datasets are available upon request)
Qualitative data Details of the documents: web searches validated by the survey
8 IMPORTANT NOTE: These are a set of proposed indicators to start with and can be modified/eliminated if no relevant
information is found, better ones are found when we do the search, or information not available for most countries.
39
D2.1. Report: Mapping the scientific and policy landscape of PM in Africa
• Existence of National ethics committees/ Institutional Review Boards -independent ethics committee for health Research
• Existence of Privacy and Personal Data Protection policies and guidelines at national and continental level
FINANCING HEALTH RESEARCH
• Metrics for Health research funding (GERD and Gross Expenditure on medical and Health Science)
• % of health budget allocated to Research for Health
• Existence of a specific budget line for health research in the MoH
• Existence of a Health research programme and where it is managed (MoH, MoST, Research organization)
UNESCO database: http://data.uis.unesco.org GERD as % GDP (total and medical and health science. Some data are not available for all African countries WHO assessment of NHRS 2017-2018 (only for 47 states members of WHO Africa) Complemented by web searches and survey
RESOURCES FOR HEALTH RESEARCH
• Number Researches per mill inhabitants and medical and health sciences researchers per mill inhabitants.
• Existence of Health research institutions, universities with faculty of health science, collaborations, and national research centres
• Existence of Centres of excellence for Health research
• Existence of National Laboratories focused on health and health research
UNESCO dataBase: http://data.uis.unesco.org African Innovation Outlook III 2019
HEALTH RESEARCH OUTPUTS
• Number of Academic publications in health research with an author from the country
• Number of Clinical trials conducted in the country
Article on health research productivity in Africa: Ref 25. (countries are classified in 4 groups based on the volume of publications) ClinicalTrials.gov
INTERNATIONAL COLLABORATIONS IN HEALTH RESEARCH
• Existence of Guidelines for collaboration agreements on health research involving foreign institutions and agencies
• Number of projects funded by EDCTP2 programme with researchers from the country.
• Number of projects funded by H2020 health programme with
• Participation of organizations in Biomedical research projects funded by major international donors
Public portal of the EDCTP2 grants system9 CORDIS project DBase Records in World RePORT DBase ((Biomedical research projects for period 2019-2019)
PM/GENOMIC RESEARCH
• Number of PM Articles with authors from African countries Results of bibliometric analysis (task 2.1)
• Existence of national Plans, programmes, actions supporting PM research and implementation in the country
Results from bibliometric analysis (Task 2.1) WEB Searches Survey GWAS studies for Africa available in the scientific literature 11
9 EDCTP2 public portal https://www.edctp.org/edctp2-project-portal/ 11 Information available in AAS article: Africans begin to take the reins of research into their own genomes By Elizabeth
Pennisi. Feb. 4, 2021. https://tinyurl.com/ybsnmhmu
40
D2.1. Report: Mapping the scientific and policy landscape of PM in Africa
• Existence of Ethical, social, legal (regulatory) frameworks for genetic data: data ownership, privacy, security/protection, sharing
• Participation of researchers from the country in the H3Africa ad Malaria GENE networks
• Population Genetic Studies, Including Genome-wide association study (GWAS) in the country 10
• Availability of infrastructure of ‘omics research (biobanks, genomic testing, bioinformatics, ..)
• PM training courses available
• Pharma/biotech industry
2.3.2 WORKPLAN
The work plan to carry out the policy mapping included the following activities:
1. Preparation of a framework for analysis to guide the data collection work. The preparation of the framework was based, as already commented, on the analysis of existing documents and studies on health research in Africa.
2. Preparation of a data collection template, based on the framework 3. Identification, review and collection of existing information to complete the data collection template
for each country /region 4. Preparation of the survey to collect information from stakeholders 5. Launching the policy mapping survey 6. Preparation of the report.
It is important to mention that at the same time as we were doing the policy landscape, we also started the identification of relevant stakeholders for the project, useful for completing the stakeholder mapping work (task 2.3). The identification of the stakeholders was a collective work of the group and the consortium and served for sending out the survey (Action 5 of the workplan). This task has taken longer than expected, and as it is a very important task for both the stakeholder mapping (task 2.3) and the preparation and organization of the stakeholder workshop (task 2.4), as well as for other projects WPs, we have decided to prepare the present report without the results of the survey. A document explaining the survey and the results will be prepared and it will be included in the next project deliverable (D2.3 Stakeholder mapping report).
Information collected for the different framework dimensions has served to classify the African countries in different groups, using criteria related to the level of development of the NHRS, level of funding, scientific outputs, international collaboration in Health research and aspects related to PM research (see section 2.7)
2.4 THE SCIENCE, TECHNOLOGY AND INNOVATION (STI) POLICY LANDSCAPE IN AFRICA WITH A SPECIAL FOCUS ON HEALTH/BIOMEDICAL RESEARCH
African countries have launched a wide range of national, regional and continental initiatives for promoting and governing STI, including health and biomedical research. In this section we present the results at regional and continental level, together with an overview of the African S&T system, that helps to understand the context in which the EU-African PerMed project is working.
10 Genome-wide association study (GWAS) aims at identifying genetic variants (genotype) that associated with specific
traits (phenotype). GWA studies investigates genetic markers cross whole genome of large number of individuals and predicts genotype-phenotype associations by statistical analysis at population level.
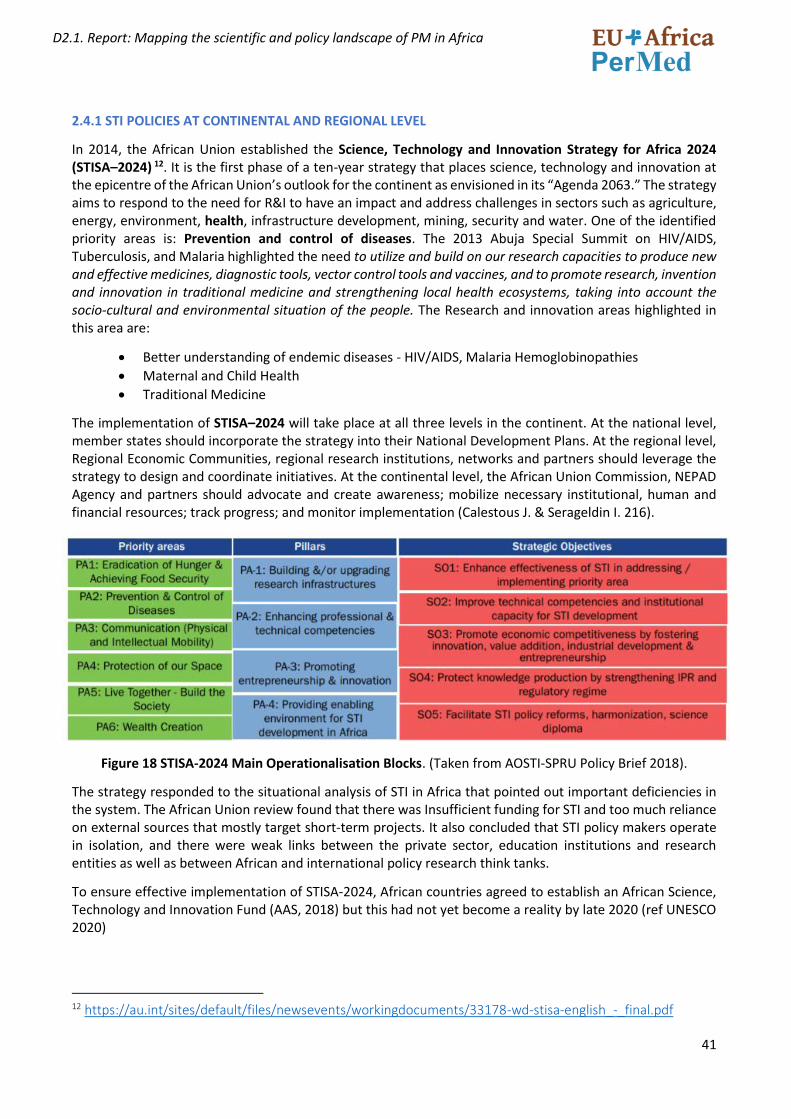
41
D2.1. Report: Mapping the scientific and policy landscape of PM in Africa
2.4.1 STI POLICIES AT CONTINENTAL AND REGIONAL LEVEL
In 2014, the African Union established the Science, Technology and Innovation Strategy for Africa 2024 (STISA–2024) 12. It is the first phase of a ten-year strategy that places science, technology and innovation at the epicentre of the African Union’s outlook for the continent as envisioned in its “Agenda 2063.” The strategy aims to respond to the need for R&I to have an impact and address challenges in sectors such as agriculture, energy, environment, health, infrastructure development, mining, security and water. One of the identified priority areas is: Prevention and control of diseases. The 2013 Abuja Special Summit on HIV/AIDS, Tuberculosis, and Malaria highlighted the need to utilize and build on our research capacities to produce new and effective medicines, diagnostic tools, vector control tools and vaccines, and to promote research, invention and innovation in traditional medicine and strengthening local health ecosystems, taking into account the socio-cultural and environmental situation of the people. The Research and innovation areas highlighted in this area are:
• Better understanding of endemic diseases - HIV/AIDS, Malaria Hemoglobinopathies
• Maternal and Child Health
• Traditional Medicine
The implementation of STISA–2024 will take place at all three levels in the continent. At the national level, member states should incorporate the strategy into their National Development Plans. At the regional level, Regional Economic Communities, regional research institutions, networks and partners should leverage the strategy to design and coordinate initiatives. At the continental level, the African Union Commission, NEPAD Agency and partners should advocate and create awareness; mobilize necessary institutional, human and financial resources; track progress; and monitor implementation (Calestous J. & Serageldin I. 216).
Figure 18 STISA-2024 Main Operationalisation Blocks. (Taken from AOSTI-SPRU Policy Brief 2018).
The strategy responded to the situational analysis of STI in Africa that pointed out important deficiencies in the system. The African Union review found that there was Insufficient funding for STI and too much reliance on external sources that mostly target short-term projects. It also concluded that STI policy makers operate in isolation, and there were weak links between the private sector, education institutions and research entities as well as between African and international policy research think tanks.
To ensure effective implementation of STISA-2024, African countries agreed to establish an African Science, Technology and Innovation Fund (AAS, 2018) but this had not yet become a reality by late 2020 (ref UNESCO 2020)
12 https://au.int/sites/default/files/newsevents/workingdocuments/33178-wd-stisa-english_-_final.pdf
42
D2.1. Report: Mapping the scientific and policy landscape of PM in Africa
Another relevant Pan-African initiative is The African Scientific and Research Innovation Council (ASRIC)13,a continental platform to mobilize African research excellence, innovation and provide a platform for dialogue and voice of the scientific community in building and sustaining continental research-policy nexus with the aim of addressing Africa’s socio-economic development challenges.
When focusing on health research, The Ministerial Conference on Research for Health in the African Region, held in Algiers, Algeria (23.-26 June 2008) adopted the Algiers Declaration renewing the commitment of Member States to strengthen national health research, information systems and knowledge management systems in order to improve health in the African Region. African governments agreed to allocate 5% of the National Health Budget to health research systems. Despite of this political commitment, an assessment carried out by WHO-Africa in 2018 pointed out that only 2 out of 39 countries that participated in the assessment within the WHO African Region had met the target (Nabyonga-Orem J. et al, 2018)
Another important policy milestone for Health research in Africa is the Health Research and Innovation Strategy for Africa (HRISA): 2018-203014, developed by the African Union Development Agency (AUDA-NEPAD). It was adopted in line with the AU Agenda 2063 and SDGs recognises the importance of investment in research and innovation for tackling the challenges faced by the African continent. Its mission is to facilitate coordinated, sustainable and responsive Health research and innovation that will provide effective interventions for health in Africa. The strategy includes an analysis of the situation of the health research and innovation status in Africa conducted in 2017, that points out the main gaps and opportunities to which the Strategy should help to address.
GAPS
• Limited sustainable financing mechanisms for health research in Africa; • Limited participation of the private sector in most of the research projects in Africa; • Inadequate numbers of African scientists leading in research and innovation on the continent; • Limited scale-up of products emerging from research and innovation by African institutions; • Weak Health research systems; • Limited South-South collaboration and coordination between scientists and funding agencies; • Limited/inadequate knowledge management and innovation dissemination systems to elevate the
knowledge outputs of African research; • Inadequate intellectual Property management and regulatory frameworks; • Limited funding for health research and innovation infrastructure by member states, public and private
sector, as well as not- for -profit bodies; • Lack of adaptive and proportionate regulatory systems and Intellectual Property Rights (IPR) systems
that support rather than stifle research and innovation; • Inadequate research skills and expertise, as well as institutional capabilities to facilitate expansion of
the skills and expertise base required to support a strong health-industry innovation nexus; • Poor African representation in international research and funding forums where health innovation
research agenda setting and decisions on resource allocations are made;
OPPORTUNITIES
• There is a growing global interest in strengthening Africa’s health systems. This presents an opportunity to leverage available resources to ground a research culture in Africa.
• Broad access to mobile technology that could drive growth of innovative e-Health solutions; • Integration of information, communication and technologies into health products development and
manufacturing;
13 https://www.asric.africa/ 14 https://www.nepad.org/publication/health-research-and-innovation-strategy-africa-hrisa-2018-2030
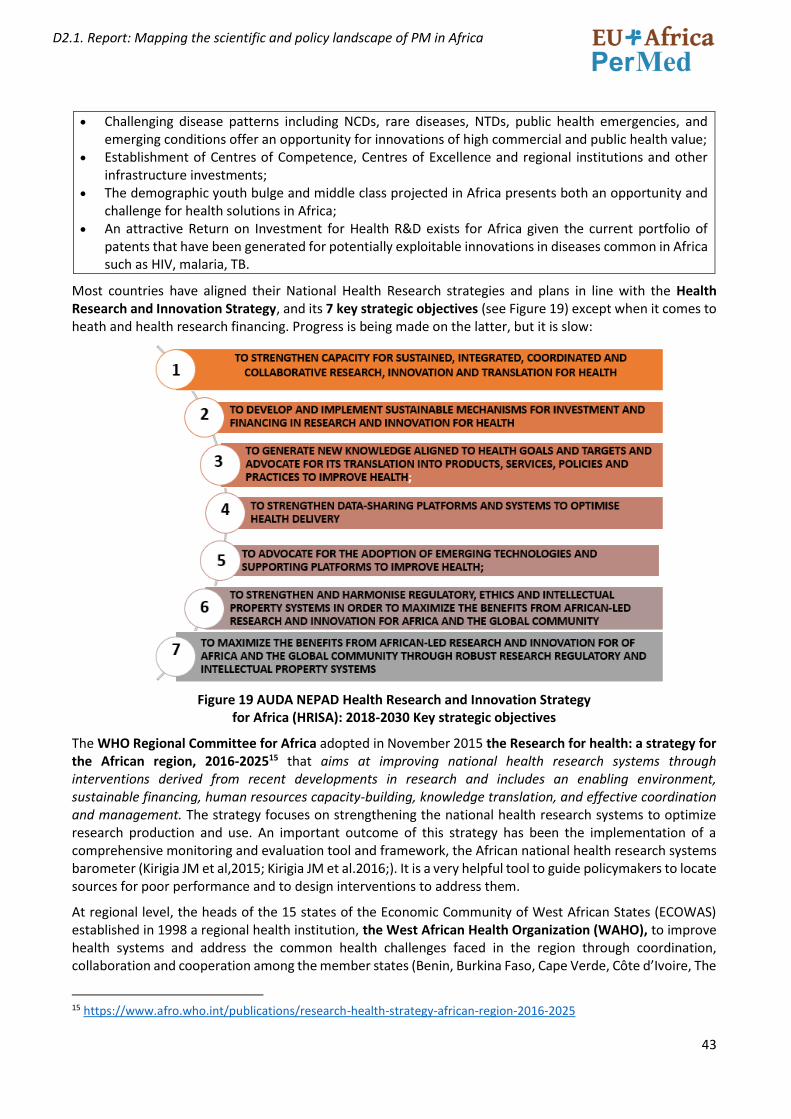
43
D2.1. Report: Mapping the scientific and policy landscape of PM in Africa
• Challenging disease patterns including NCDs, rare diseases, NTDs, public health emergencies, and emerging conditions offer an opportunity for innovations of high commercial and public health value;
• Establishment of Centres of Competence, Centres of Excellence and regional institutions and other infrastructure investments;
• The demographic youth bulge and middle class projected in Africa presents both an opportunity and challenge for health solutions in Africa;
• An attractive Return on Investment for Health R&D exists for Africa given the current portfolio of patents that have been generated for potentially exploitable innovations in diseases common in Africa such as HIV, malaria, TB.
Most countries have aligned their National Health Research strategies and plans in line with the Health Research and Innovation Strategy, and its 7 key strategic objectives (see Figure 19) except when it comes to heath and health research financing. Progress is being made on the latter, but it is slow:
Figure 19 AUDA NEPAD Health Research and Innovation Strategy for Africa (HRISA): 2018-2030 Key strategic objectives
The WHO Regional Committee for Africa adopted in November 2015 the Research for health: a strategy for the African region, 2016-202515 that aims at improving national health research systems through interventions derived from recent developments in research and includes an enabling environment, sustainable financing, human resources capacity-building, knowledge translation, and effective coordination and management. The strategy focuses on strengthening the national health research systems to optimize research production and use. An important outcome of this strategy has been the implementation of a comprehensive monitoring and evaluation tool and framework, the African national health research systems barometer (Kirigia JM et al,2015; Kirigia JM et al.2016;). It is a very helpful tool to guide policymakers to locate sources for poor performance and to design interventions to address them.
At regional level, the heads of the 15 states of the Economic Community of West African States (ECOWAS) established in 1998 a regional health institution, the West African Health Organization (WAHO), to improve health systems and address the common health challenges faced in the region through coordination, collaboration and cooperation among the member states (Benin, Burkina Faso, Cape Verde, Côte d’Ivoire, The
15 https://www.afro.who.int/publications/research-health-strategy-african-region-2016-2025
44
D2.1. Report: Mapping the scientific and policy landscape of PM in Africa
Gambia, Ghana, Guinea, Guinea Bissau, Liberia, Mali, Niger, Nigeria, Sierra Leone, Senegal and Togo). The second WAHO strategic plan (2009–2013) included health research as one of the areas of focus for region. For this, they instituted a research development program for the West Africa region. To ensure adequate funding for the implementation of the program, WAHO, through its regional budgetary allocations, committed US$ 3 million seed money over a period of 5 years to support the development of research in all the member countries (ref: Aidam, J., Sombié, I.2016). This programme has supported the development of health research policies, plans or priorities in eight ECOWAS countries, the funding of 24 research projects, providing for 27 human resources training scholarships, the creation of a regional network for health research institutions, a regional scientific journal, and initiating scientific congresses for dissemination of results at regional level.16. In the last approved WAHO strategy for the period 2016 – 2020, Health Information and Research for Health remain on the priority programmes for Goal - 1: Promotion of priority health policies and programmes in the region. Research is also an important component for the Priority Programme 5: Medicines, Vaccines and other Health Products and Priority Programme 6: Traditional Medicine. 17.
The East, Central and Southern African Health Community (ECSA-HC) is an inter-governmental health organization established in 1974, that fosters and promotes regional cooperation in health among member states (Kenya, Lesotho, Malawi, Mauritius, Eswatini, United Republic of Tanzania, Uganda, Zambia and Zimbabwe). ECSA-HC supports countries through advocacy, capacity building, brokerage, coordination, inter-sectoral collaboration and harmonization of health policies and programmes, including support in Research, Knowledge Management and Monitoring and Evaluation18. ECSA-HC manages and participates in externally funded projects to strengthen health capacity in the region. As an example, ECSA-HC participates in The Southern Africa Tuberculosis and Health Systems Support (SATBHSS) Project funded by the World Bank, (http://www.satbhss.org/. ECSA-HC also received a Grant from the Global Fund to support countries improve rapid molecular TB diagnostics in the region. ECSA-H-C also funds capacity and training activities through the ECSA COLLEGE OF HEALTH SCIENCES
The East African Health Research Commission (EAHRC), established in 1999 by the East African Cooperation (EAC)19 has as main objective to promote, facilitate, and coordinate the conduct and application of health research for improvement of health and for the wellbeing of the people of East Africa. It provides advice upon all matters of health and health-related research that are necessary for knowledge generation, technological development, policy formulation, and practice. The Commission identified domestic financing as one of the key challenges facing research efforts among the partners states of the EAC and included the mobilization of resources to support health research in his Strategic Plan 2016-2021 (EAHRC Policy Brief, June 2018)
The East African Community (EAC) has a project that enhances pandemic response in the East Africa region. It contributes to putting the EAC regional contingency plan into practice and to implementing the regional risk and crisis communication strategy. The project contributes to a uniform, effective, responsible and balanced approach to pandemic preparedness at the regional and national government level. The project also advises the Secretariat on the sustainable integration of ‘One Health’. This approach involves professional disciplines and sectors of society that play an important role in preventing and responding to outbreaks of
16 WAHO Health Information and Research for Health programme. https://www.wahooas.org/web-
ooas/en/programmes/p01-health-information-and-research-health 17 WAHO Strategic plan 2016-2020 https://www.wahooas.org/web-
ooas/sites/default/files/publications/1084/VERSION_ANGLAISE_CORRIGEE.pdf 18 East, Central and Southern African Health Community (ECSA-HC) https://ecsahc.org/ecsa-hc-at-a-glance/ 19 The East African Community is an intergovernmental organisation composed of six countries in the African Great Lakes
region in eastern Africa: Burundi, Kenya, Rwanda, South Sudan, Tanzania, and Uganda. https://www.eahealth.org/about-eahrc
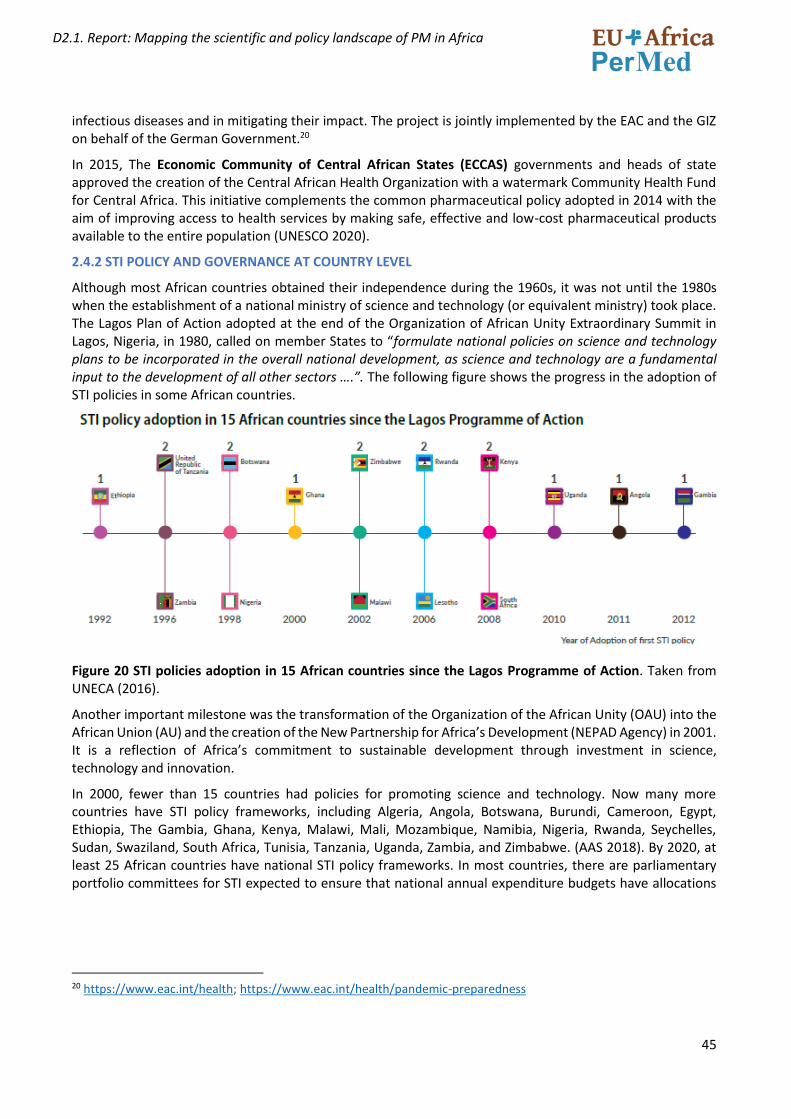
45
D2.1. Report: Mapping the scientific and policy landscape of PM in Africa
infectious diseases and in mitigating their impact. The project is jointly implemented by the EAC and the GIZ on behalf of the German Government.20
In 2015, The Economic Community of Central African States (ECCAS) governments and heads of state approved the creation of the Central African Health Organization with a watermark Community Health Fund for Central Africa. This initiative complements the common pharmaceutical policy adopted in 2014 with the aim of improving access to health services by making safe, effective and low-cost pharmaceutical products available to the entire population (UNESCO 2020).
2.4.2 STI POLICY AND GOVERNANCE AT COUNTRY LEVEL
Although most African countries obtained their independence during the 1960s, it was not until the 1980s when the establishment of a national ministry of science and technology (or equivalent ministry) took place. The Lagos Plan of Action adopted at the end of the Organization of African Unity Extraordinary Summit in Lagos, Nigeria, in 1980, called on member States to “formulate national policies on science and technology plans to be incorporated in the overall national development, as science and technology are a fundamental input to the development of all other sectors ….”. The following figure shows the progress in the adoption of STI policies in some African countries.
Figure 20 STI policies adoption in 15 African countries since the Lagos Programme of Action. Taken from UNECA (2016).
Another important milestone was the transformation of the Organization of the African Unity (OAU) into the African Union (AU) and the creation of the New Partnership for Africa’s Development (NEPAD Agency) in 2001. It is a reflection of Africa’s commitment to sustainable development through investment in science, technology and innovation.
In 2000, fewer than 15 countries had policies for promoting science and technology. Now many more countries have STI policy frameworks, including Algeria, Angola, Botswana, Burundi, Cameroon, Egypt, Ethiopia, The Gambia, Ghana, Kenya, Malawi, Mali, Mozambique, Namibia, Nigeria, Rwanda, Seychelles, Sudan, Swaziland, South Africa, Tunisia, Tanzania, Uganda, Zambia, and Zimbabwe. (AAS 2018). By 2020, at least 25 African countries have national STI policy frameworks. In most countries, there are parliamentary portfolio committees for STI expected to ensure that national annual expenditure budgets have allocations
20 https://www.eac.int/health; https://www.eac.int/health/pandemic-preparedness
46
D2.1. Report: Mapping the scientific and policy landscape of PM in Africa
for STI in general and R&D in particular. These committees are also responsible for providing oversight to the implementation of national STI policy frameworks 21(
Most STI policy frameworks for African countries are built on economic growth and competitiveness rationales. But there is now a change in the vision on STI policies as a tool towards achieving the Sustainable Development Goals (SDGs) and some countries have revised (or an in the process of revising) their STI polices. For example, Seychelles adopted a national STI strategic plan in 2017 and in March 2019, South Africa adopted a new White Paper on STI. Kenya, Namibia and Swaziland are currently reviewing their old STI policy instruments re-orientating them to focus on the SDGs.
Most African STI policies often include commitments to increase investment in R&D to at least 1 per cent of GDP, reflecting Lagos Programme of Action aspirations and those of other African Union frameworks. Sometimes they also include provisions for creating a science and technology development fund, and even public–private partnerships (PPPs) and for the private sector.
The institutional arrangements for STI policy implementation show wide divergence in African countries. While most STI policy is implemented through a ministry responsible for science, technology, education and research, some countries have created other special bodies: National Science, Technology and Innovation Council of Ethiopia, the National and state Innovation Research Councils in Nigeria and the Technology Innovation Agency of South Africa.
In terms of health research, the WHO Africa study on the NHRS carried out in 2017-2018, found that out of the 39 participating countries, 17 have not implemented legislation on Research for health. This lack of strategic documents negatively impacts the capacity to align investments on research, which also creates unnecessarily long timelines to approve or implement research22. Sixty-five per cent of countries possess a national health research strategic plan, ranging from expired, under development, extended to recently launched strategies.
A more thorough revision of institutions governing and funding STI in African countries, including health research governing bodies, will be available in the Project deliverable D2.3 Stakeholder mapping.
2.4.3 MAIN S&T INDICATORS IN AFRICA
Latest data published by UNESCO (August 2020) show that Africa’s investment in R&I as a share of GDP, has increased since 2014, both in Sub-Saharan Africa as in the Arab states in the north, but it still remains low when compared to other regions: 0,51 for Sub-Saharan countries and 0.59 for Arab countries. A target of 1% of GDP was endorsed at the Eighth Ordinary Session of the Executive Council of the African Union in Khartoum in 2006, in order to ensure available funds to implement programmes and projects, but no countries have yet reached this goal.23
21 United Nations African Institute for Economic Development and Planning. Accelerating the implementation of the
“Science, Technology and Innovation Strategy for Africa 2024. Programme introduction. https://archive.uneca.org/sites/default/files/uploaded-documents/IDEP/Cours2020/Cours_en_ligne/STISA/brochure_for_the_stisa-2024_web_based_course.pdf
22 See the EDCTP High-level meeting with African policymakers: Engaging African governments to strengthen national
health research systems with complementary international cooperation. 68th session of the WHO AFRO Regional Committee meeting, Side event • 30 August 2018 • Dakar, Senegal. http://www.edctp.org/web/app/uploads/2018/11/High-Level-Meeting-Dakar-Senegal-30-August-2018-Engaging-African-governments-to-strengthen-national-health-research-systems.pdf
23 According to The United Nations Economic Commission for Africa (UNECA) Malawi is the only country in the AU to have reached the 1 per cent target, but data are not available for Malawi in UNESCO official statistics database. The only published data is 1.06 GERD in 2010 [UNESCO (2014) Mapping Research and Innovation in the Republic of Malawi]
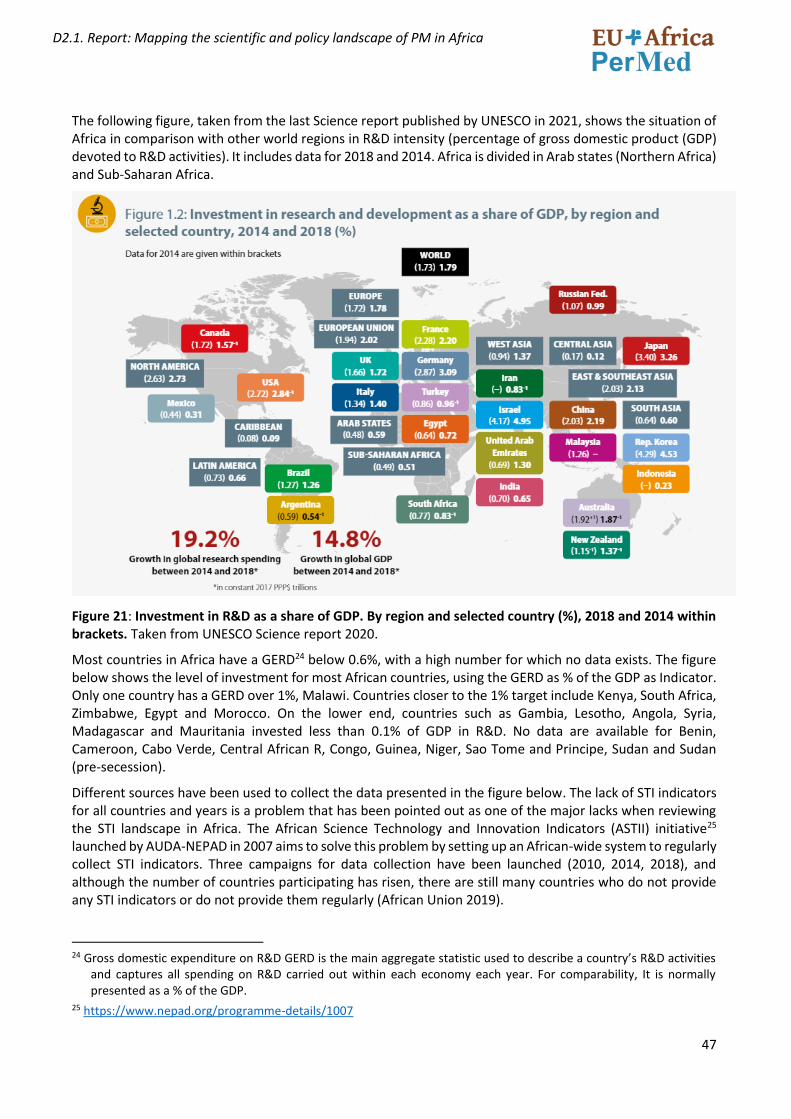
47
D2.1. Report: Mapping the scientific and policy landscape of PM in Africa
The following figure, taken from the last Science report published by UNESCO in 2021, shows the situation of Africa in comparison with other world regions in R&D intensity (percentage of gross domestic product (GDP) devoted to R&D activities). It includes data for 2018 and 2014. Africa is divided in Arab states (Northern Africa) and Sub-Saharan Africa.
Figure 21: Investment in R&D as a share of GDP. By region and selected country (%), 2018 and 2014 within brackets. Taken from UNESCO Science report 2020.
Most countries in Africa have a GERD24 below 0.6%, with a high number for which no data exists. The figure below shows the level of investment for most African countries, using the GERD as % of the GDP as Indicator. Only one country has a GERD over 1%, Malawi. Countries closer to the 1% target include Kenya, South Africa, Zimbabwe, Egypt and Morocco. On the lower end, countries such as Gambia, Lesotho, Angola, Syria, Madagascar and Mauritania invested less than 0.1% of GDP in R&D. No data are available for Benin, Cameroon, Cabo Verde, Central African R, Congo, Guinea, Niger, Sao Tome and Principe, Sudan and Sudan (pre-secession).
Different sources have been used to collect the data presented in the figure below. The lack of STI indicators for all countries and years is a problem that has been pointed out as one of the major lacks when reviewing the STI landscape in Africa. The African Science Technology and Innovation Indicators (ASTII) initiative25 launched by AUDA-NEPAD in 2007 aims to solve this problem by setting up an African-wide system to regularly collect STI indicators. Three campaigns for data collection have been launched (2010, 2014, 2018), and although the number of countries participating has risen, there are still many countries who do not provide any STI indicators or do not provide them regularly (African Union 2019).
24 Gross domestic expenditure on R&D GERD is the main aggregate statistic used to describe a country’s R&D activities
and captures all spending on R&D carried out within each economy each year. For comparability, It is normally presented as a % of the GDP.
25 https://www.nepad.org/programme-details/1007
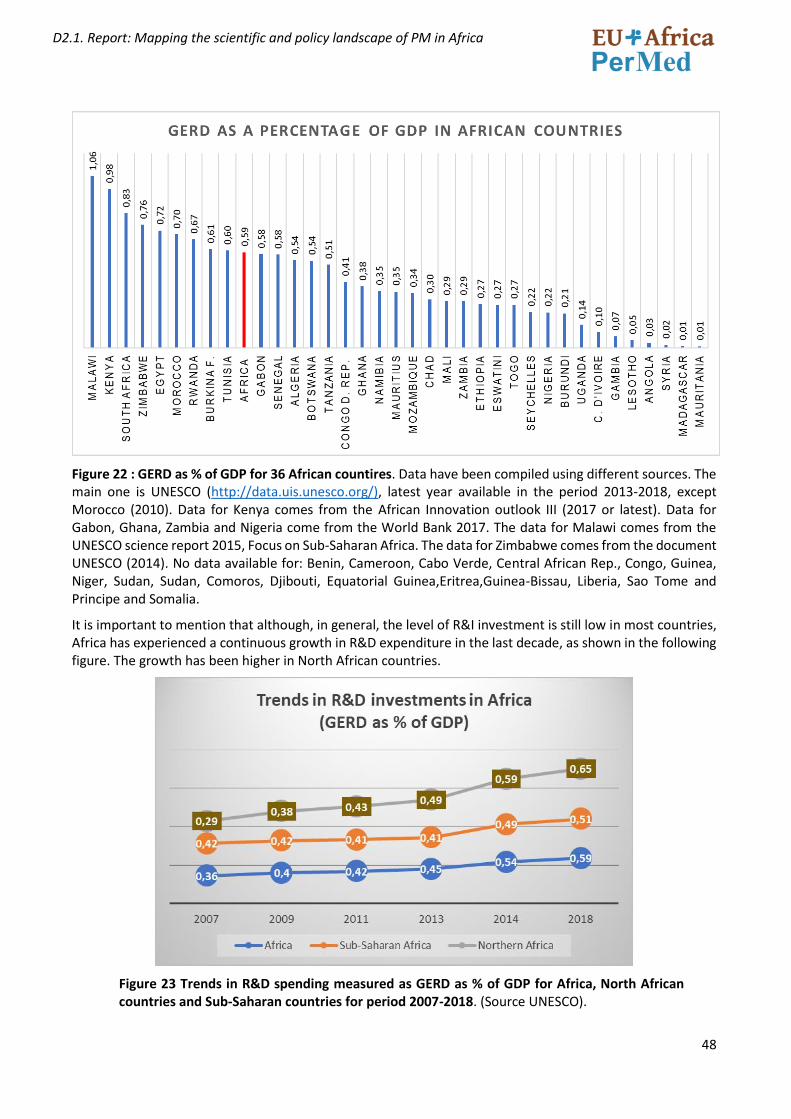
48
D2.1. Report: Mapping the scientific and policy landscape of PM in Africa
Figure 22 : GERD as % of GDP for 36 African countires. Data have been compiled using different sources. The main one is UNESCO (http://data.uis.unesco.org/), latest year available in the period 2013-2018, except Morocco (2010). Data for Kenya comes from the African Innovation outlook III (2017 or latest). Data for Gabon, Ghana, Zambia and Nigeria come from the World Bank 2017. The data for Malawi comes from the UNESCO science report 2015, Focus on Sub-Saharan Africa. The data for Zimbabwe comes from the document UNESCO (2014). No data available for: Benin, Cameroon, Cabo Verde, Central African Rep., Congo, Guinea, Niger, Sudan, Sudan, Comoros, Djibouti, Equatorial Guinea,Eritrea,Guinea-Bissau, Liberia, Sao Tome and Principe and Somalia.
It is important to mention that although, in general, the level of R&I investment is still low in most countries, Africa has experienced a continuous growth in R&D expenditure in the last decade, as shown in the following figure. The growth has been higher in North African countries.
Figure 23 Trends in R&D spending measured as GERD as % of GDP for Africa, North African countries and Sub-Saharan countries for period 2007-2018. (Source UNESCO).
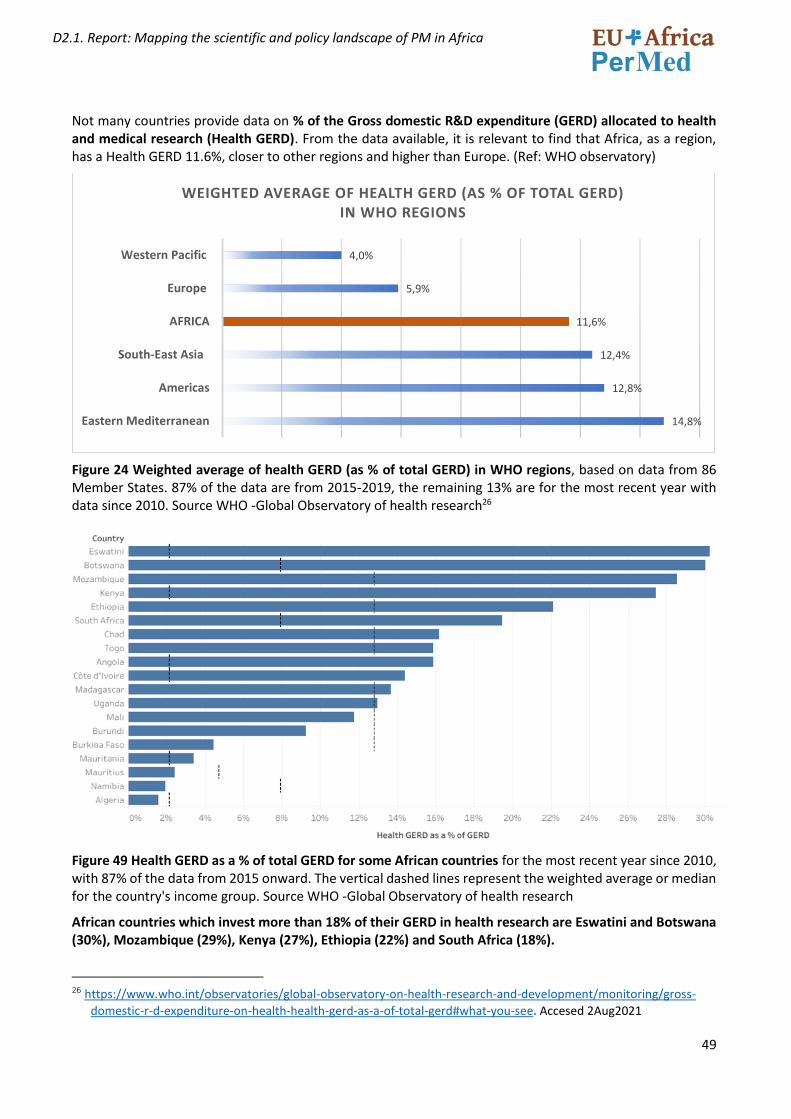
49
D2.1. Report: Mapping the scientific and policy landscape of PM in Africa
Not many countries provide data on % of the Gross domestic R&D expenditure (GERD) allocated to health and medical research (Health GERD). From the data available, it is relevant to find that Africa, as a region, has a Health GERD 11.6%, closer to other regions and higher than Europe. (Ref: WHO observatory)
Figure 24 Weighted average of health GERD (as % of total GERD) in WHO regions, based on data from 86 Member States. 87% of the data are from 2015-2019, the remaining 13% are for the most recent year with data since 2010. Source WHO -Global Observatory of health research26
Figure 49 Health GERD as a % of total GERD for some African countries for the most recent year since 2010, with 87% of the data from 2015 onward. The vertical dashed lines represent the weighted average or median for the country's income group. Source WHO -Global Observatory of health research
African countries which invest more than 18% of their GERD in health research are Eswatini and Botswana (30%), Mozambique (29%), Kenya (27%), Ethiopia (22%) and South Africa (18%).
26 https://www.who.int/observatories/global-observatory-on-health-research-and-development/monitoring/gross-
domestic-r-d-expenditure-on-health-health-gerd-as-a-of-total-gerd#what-you-see. Accesed 2Aug2021
14,8%
12,8%
12,4%
11,6%
5,9%
4,0%
Eastern Mediterranean
Americas
South-East Asia
AFRICA
Europe
Western Pacific
WEIGHTED AVERAGE OF HEALTH GERD (AS % OF TOTAL GERD) IN WHO REGIONS
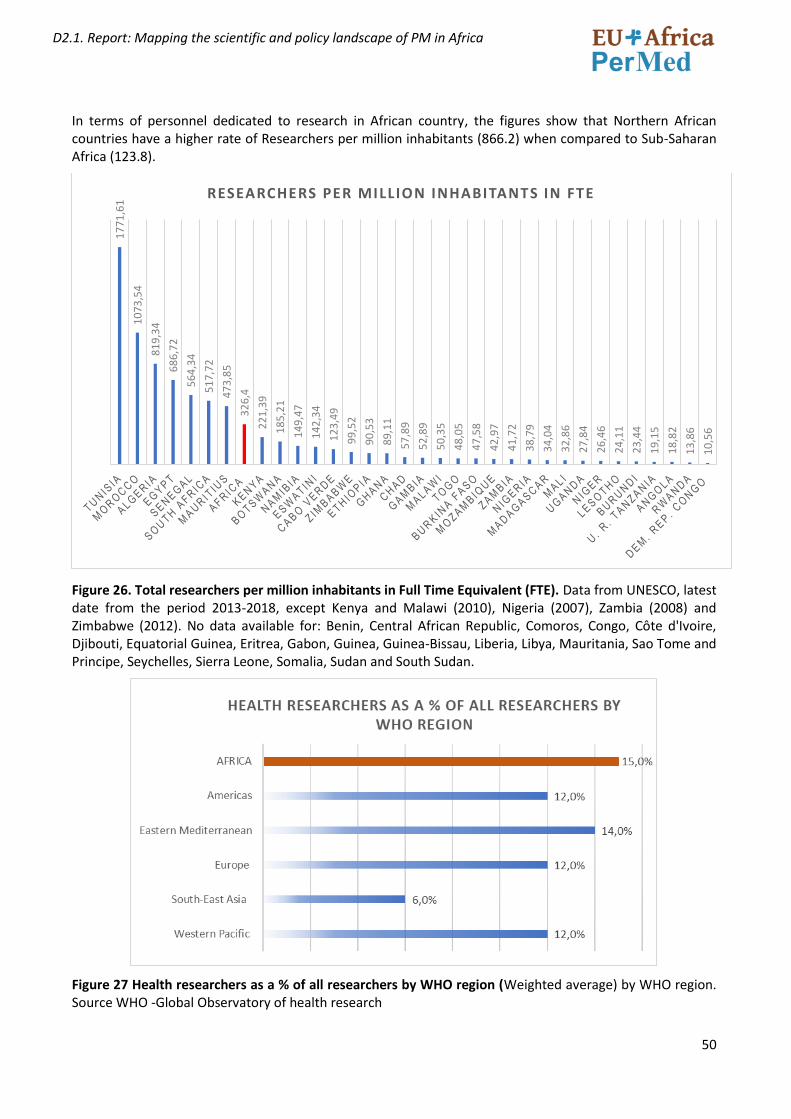
50
D2.1. Report: Mapping the scientific and policy landscape of PM in Africa
In terms of personnel dedicated to research in African country, the figures show that Northern African countries have a higher rate of Researchers per million inhabitants (866.2) when compared to Sub-Saharan Africa (123.8).
Figure 26. Total researchers per million inhabitants in Full Time Equivalent (FTE). Data from UNESCO, latest date from the period 2013-2018, except Kenya and Malawi (2010), Nigeria (2007), Zambia (2008) and Zimbabwe (2012). No data available for: Benin, Central African Republic, Comoros, Congo, Côte d'Ivoire, Djibouti, Equatorial Guinea, Eritrea, Gabon, Guinea, Guinea-Bissau, Liberia, Libya, Mauritania, Sao Tome and Principe, Seychelles, Sierra Leone, Somalia, Sudan and South Sudan.
Figure 27 Health researchers as a % of all researchers by WHO region (Weighted average) by WHO region. Source WHO -Global Observatory of health research
17
71
,61
10
73
,54
81
9,3
4
68
6,7
2
56
4,3
4
51
7,7
2
47
3,8
5
32
6,4
22
1,3
9
18
5,2
1
14
9,4
7
14
2,3
4
12
3,4
9
99
,52
90
,53
89
,11
57
,89
52
,89
50
,35
48
,05
47
,58
42
,97
41
,72
38
,79
34
,04
32
,86
27
,84
26
,46
24
,11
23
,44
19
,15
18
,82
13
,86
10
,56
RESEARCHERS PER MILLION INHABITANTS IN FTE
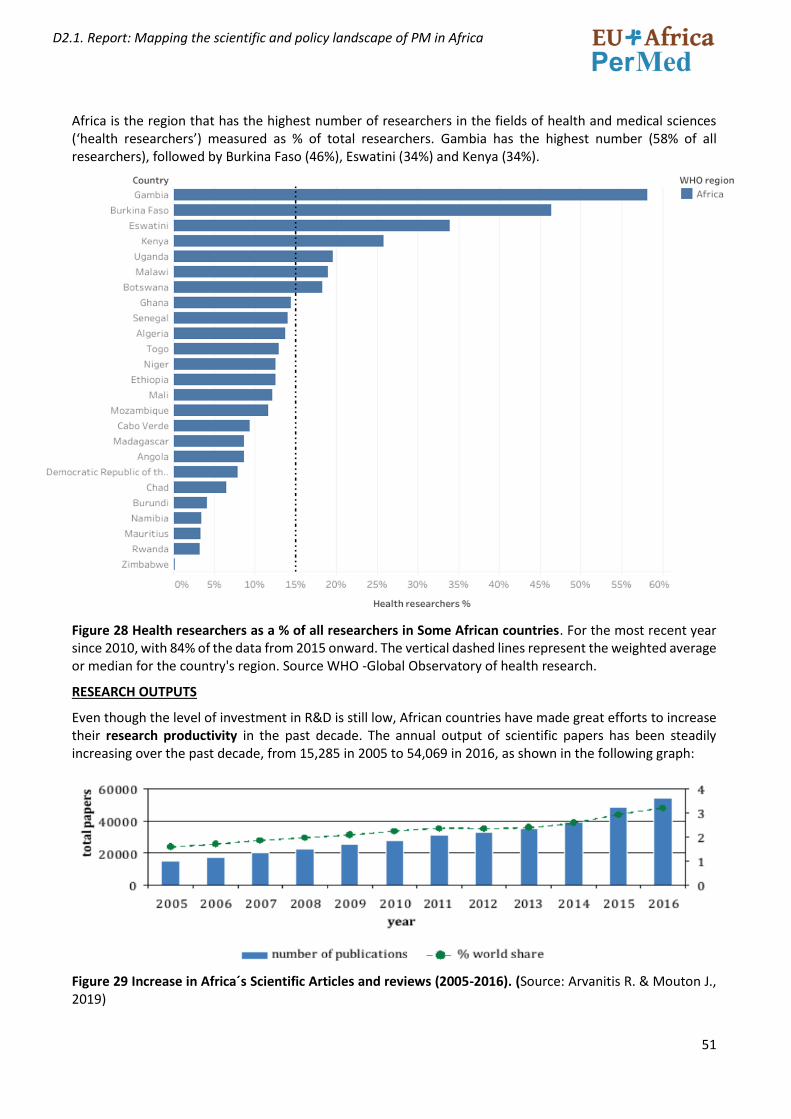
51
D2.1. Report: Mapping the scientific and policy landscape of PM in Africa
Africa is the region that has the highest number of researchers in the fields of health and medical sciences (‘health researchers’) measured as % of total researchers. Gambia has the highest number (58% of all researchers), followed by Burkina Faso (46%), Eswatini (34%) and Kenya (34%).
Figure 28 Health researchers as a % of all researchers in Some African countries. For the most recent year since 2010, with 84% of the data from 2015 onward. The vertical dashed lines represent the weighted average or median for the country's region. Source WHO -Global Observatory of health research.
RESEARCH OUTPUTS
Even though the level of investment in R&D is still low, African countries have made great efforts to increase their research productivity in the past decade. The annual output of scientific papers has been steadily increasing over the past decade, from 15,285 in 2005 to 54,069 in 2016, as shown in the following graph:
Figure 29 Increase in Africa´s Scientific Articles and reviews (2005-2016). (Source: Arvanitis R. & Mouton J., 2019)
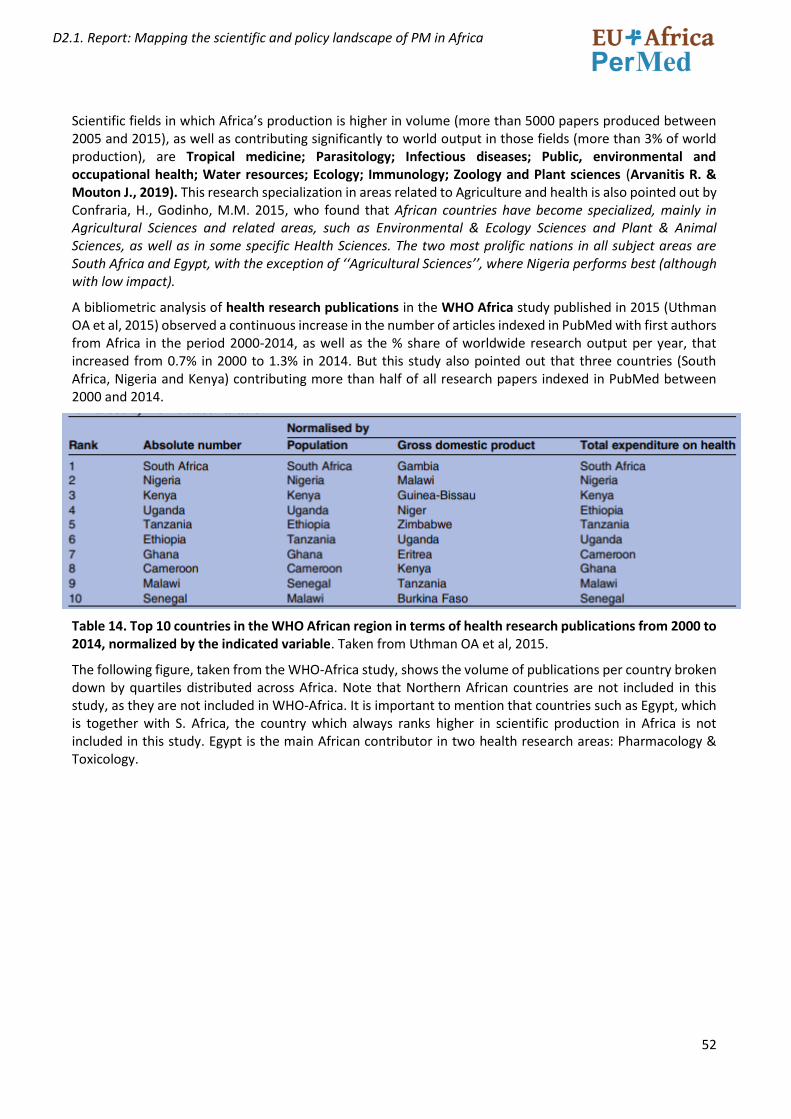
52
D2.1. Report: Mapping the scientific and policy landscape of PM in Africa
Scientific fields in which Africa’s production is higher in volume (more than 5000 papers produced between 2005 and 2015), as well as contributing significantly to world output in those fields (more than 3% of world production), are Tropical medicine; Parasitology; Infectious diseases; Public, environmental and occupational health; Water resources; Ecology; Immunology; Zoology and Plant sciences (Arvanitis R. & Mouton J., 2019). This research specialization in areas related to Agriculture and health is also pointed out by Confraria, H., Godinho, M.M. 2015, who found that African countries have become specialized, mainly in Agricultural Sciences and related areas, such as Environmental & Ecology Sciences and Plant & Animal Sciences, as well as in some specific Health Sciences. The two most prolific nations in all subject areas are South Africa and Egypt, with the exception of ‘‘Agricultural Sciences’’, where Nigeria performs best (although with low impact).
A bibliometric analysis of health research publications in the WHO Africa study published in 2015 (Uthman OA et al, 2015) observed a continuous increase in the number of articles indexed in PubMed with first authors from Africa in the period 2000-2014, as well as the % share of worldwide research output per year, that increased from 0.7% in 2000 to 1.3% in 2014. But this study also pointed out that three countries (South Africa, Nigeria and Kenya) contributing more than half of all research papers indexed in PubMed between 2000 and 2014.
Table 14. Top 10 countries in the WHO African region in terms of health research publications from 2000 to 2014, normalized by the indicated variable. Taken from Uthman OA et al, 2015.
The following figure, taken from the WHO-Africa study, shows the volume of publications per country broken down by quartiles distributed across Africa. Note that Northern African countries are not included in this study, as they are not included in WHO-Africa. It is important to mention that countries such as Egypt, which is together with S. Africa, the country which always ranks higher in scientific production in Africa is not included in this study. Egypt is the main African contributor in two health research areas: Pharmacology & Toxicology.
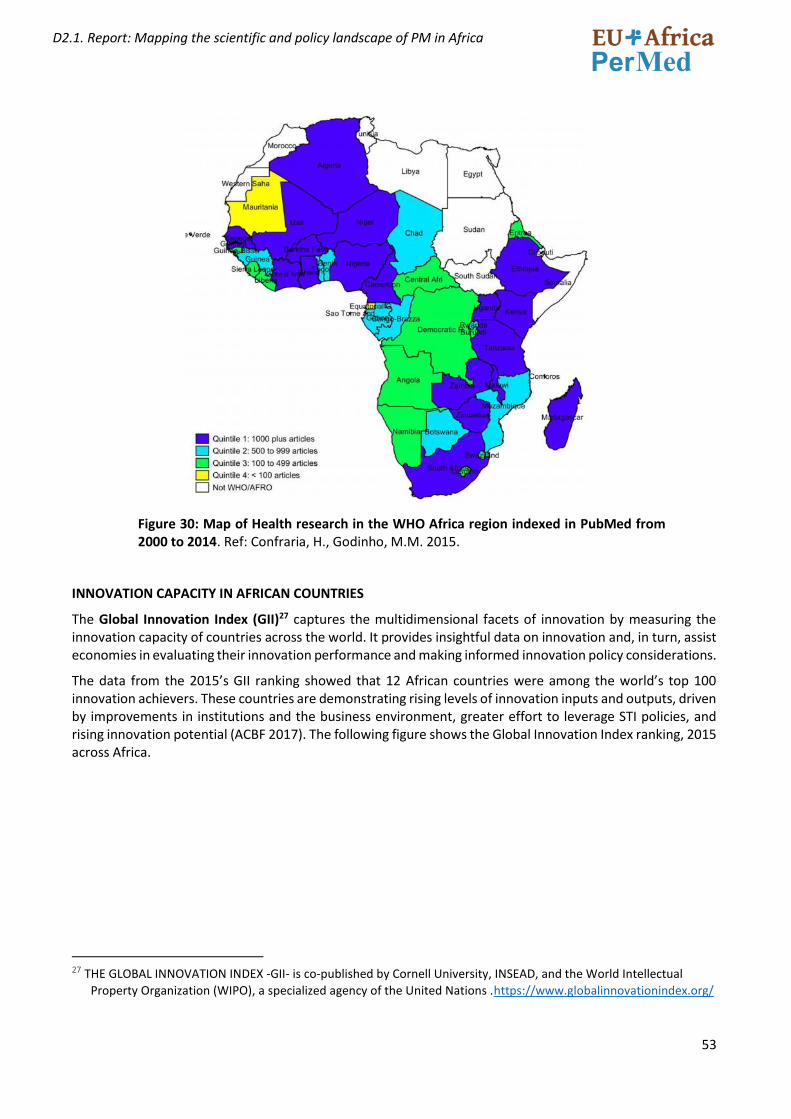
53
D2.1. Report: Mapping the scientific and policy landscape of PM in Africa
Figure 30: Map of Health research in the WHO Africa region indexed in PubMed from 2000 to 2014. Ref: Confraria, H., Godinho, M.M. 2015.
INNOVATION CAPACITY IN AFRICAN COUNTRIES
The Global Innovation Index (GII)27 captures the multidimensional facets of innovation by measuring the innovation capacity of countries across the world. It provides insightful data on innovation and, in turn, assist economies in evaluating their innovation performance and making informed innovation policy considerations.
The data from the 2015’s GII ranking showed that 12 African countries were among the world’s top 100 innovation achievers. These countries are demonstrating rising levels of innovation inputs and outputs, driven by improvements in institutions and the business environment, greater effort to leverage STI policies, and rising innovation potential (ACBF 2017). The following figure shows the Global Innovation Index ranking, 2015 across Africa.
27 THE GLOBAL INNOVATION INDEX -GII- is co-published by Cornell University, INSEAD, and the World Intellectual
Property Organization (WIPO), a specialized agency of the United Nations .https://www.globalinnovationindex.org/
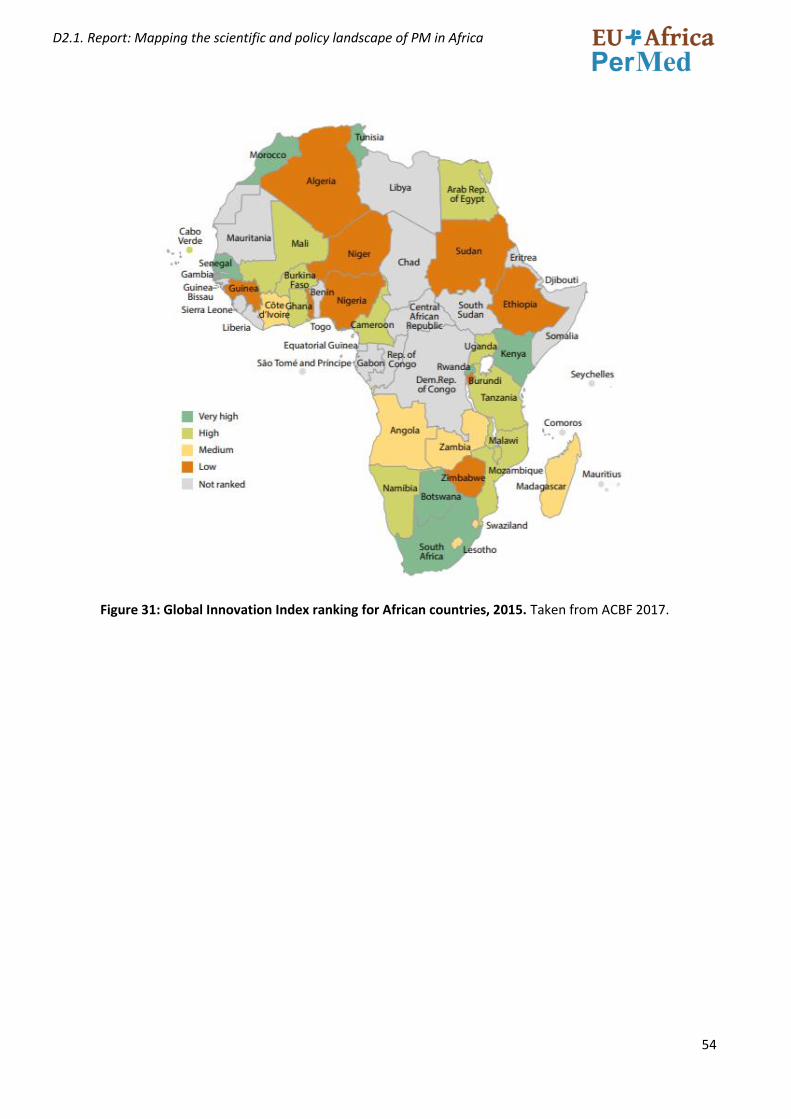
54
D2.1. Report: Mapping the scientific and policy landscape of PM in Africa
Figure 31: Global Innovation Index ranking for African countries, 2015. Taken from ACBF 2017.
55
D2.1. Report: Mapping the scientific and policy landscape of PM in Africa
2.5 R&D FUNDING IN AFRICA, WITH A SPECIAL FOCUS ON HEALTH/BIOMEDICAL RESEARCH
2.5.1 RESEARCH FUNDING ORGANIZATIONS IN AFRICA
Science Granting Councils (SGC) and agencies with equivalent missions such as national commissions for science and technology, national sciences councils and national academies of science are important elements for research funding in Africa. They are in charge of disbursing funds for research and development (R&D); building research capacity through appropriate scholarships and bursaries; setting and monitoring research agendas and priorities; advising on science, technology and innovation (STI) policies; managing bilateral and multilateral science and technology (S&T) agreements; and assessing the communication, uptake and impact of publicly funded research (Mouton, J el al. 2015).
The creation of SGCs and competitive research funds is rather recent in sub- Saharan Africa. Its growth runs in parallel to the African countries commitment to increasing the level of Investment of R&D as a driver for economic and social growth in the continent. In this regard, the establishment of these organization as an important element of the national science systems is seen as a requirement to accomplish the national, regional, and continental science, technology, and innovation (STI) policy agendas. Funding of research is distributed in three different ways:
1. Disbursement of research grants (various categories); 2. Disbursements of scholarships and loans (mostly masters and doctoral students); 3. Funding support for infrastructure development;
Mouton, J el al. 2015 studied the strategic priorities, objectives and practices of SGCs in 17 sub-Saharan African countries and found out that SGCs are embedded in the science and innovation systems of their respective countries. In sub-Saharan Africa, the STI systems vary significantly with regard to socio-political histories, geography, political and economic (in) stability, colonial legacies and, most importantly (for this study), the degree of institutionalization of R & D
Some of the most important findings from this study are summarised below:
• The different research funding models found are the result of different histories in science-policy development, different trajectories in the institutionalization of a science ministry in the respective countries and different science governance models. These governance models are related to the historical roots of these systems in the British and French models of science management.
• A dedicated science funding council is largely a feature of the STI systems of countries in the Anglophone tradition (e.g. Kenya, South Africa, Uganda, Zambia and Zimbabwe). In the Francophone countries, such as Rwanda and Cameroon, there are no STI funding councils (although a project to establish a National Fund for Research and Innovation is currently being discussed in Cameroon). Burkina Faso, Côte d’Ivoire and Senegal, however, have dedicated funding agencies. In the case of Côte d’Ivoire and Senegal, funding systems promoting agricultural research have been recently established.
• In many of the countries the national landscape is characterized by a multitude of funding agencies, programs, and instruments often organized around sectoral interests (e.g., health and agriculture). In addition, these councils face a variety of challenges (e.g., resource constraints, governance issues, lack of clarity on institutional differentiation, lack of coordination within science systems, and marginalization of influence).
• SGCs in sub-Saharan Africa perform a wide range of functions: disbursement of research grants (various categories); disbursements of scholarships and loans (mostly masters and doctoral students); funding support for infrastructure development; communication of results (dissemination and uptake of research reports and findings); supporting scientific publishing and scientific journals; advocacy for STI; collection of data and statistics on S&T and R&D; capacity building and training of researchers; policy advice; setting research agendas and research priorities; management of scientific collaborations and agreements; and coordination of the national innovation system.
56
D2.1. Report: Mapping the scientific and policy landscape of PM in Africa
• The relatively poor investment in R&D in many sub-Saharan Africa countries, which has a direct impact on the science funding models, points to different levels of commitment to science in different countries as well as to different values afforded to science. Some governments clearly recognize the value and importance of science, and therefore invest in science funding and the establishment of a national funding agency. However, many governments have not (at least until very recently) judged science to be of sufficient value and importance to invest in the establishment of a relatively autonomous agency to disburse state funds for R&D. The fact that there has been a surge of interest in reformulating existing science policies, and in the establishment of separate ministries of science, may be indicative of a change, even among those countries that have been slow to invest in R&D.
A recent study by Chataway J, 2019 indicates that the main regional science and research funders in Sub-Saharan Africa (SSA) are the European Commission, Department for International Development (DFID), MasterCard, Wellcome Trust, Gates Foundation and the World Bank, although data on specific quantities of funding are not available in many instances. By far the largest funding flows are into the health sector (USD 4.31 billion), but agriculture also receives significant funding (almost USD 1 billion). International support is mainly for producing individual scientists and research, and support for organisations, as well as support for initiatives that aim to improve the environment within which research takes place in SSA. A wider range of donors are now interested in promoting the formulation and implementation of national STI policies. This is another example of the shifting pattern of STI support, from individuals and organisations, to initiatives that support the science and research environment.
This same study highlighted some national science funding trends in SSA, based on case studies in four countries: Ethiopia, Kenya, Rwanda, and Tanzania. These trends are summarized below:
• The importance of academic excellence in science is acknowledged; nevertheless, there is a significant push towards making science more relevant to national goals and priorities.
• The trend is a move towards increasing funding either through direct public funding for science and research or through engagements with international donors (e.g. DFID, Gates, Wellcome, and the World Bank) or regional funders (e.g. AESA). This trend is in part due to increased pressure from the African science community on governments and other actors, such as the private sector, to fund science better, and also support decision-making and policymaking.
• An increase importance of the private sector. For example, Tanzania has a telecoms fund, which means a percentage of money made by the mobile phone operators in Tanzania is given directly to the National Fund for the Advancement of Science and Technology.
• The importance of political will in determining how much, and for what purpose, science funding was given. The basis of the political momentum is largely related to narratives which emphasise social and economic gains from research in the short term, with an Increased integration between scientific agendas and broader social and economic goals
2.5.2 SOURCES OF FUNDING FOR R&D
The landscape of institutions funding African R&D is complex, and mainly include the public sector, with significant proportions of financing in many countries coming from international funding. As an example, in Kenia which has one of the highest health research financing as a percentage of GDP (0.234% in 2015), most of the funding came from external sources (83.46%), with only 16.54% of the financing realised from domestic sources28. In Côte d’Ivoire for instance, public funding for Research for health represented less than 1% of the
28 Innovative Domestic Financing for Health Research in the East African Community. The East Africa Health
Research Commission. (2018). Policy Brief: Innovative Domestic Financing for Health Research in the East African Community: A baseline assessment and road map towards a sustainable health research and development. Arusha, Tanzania: EAHRC.
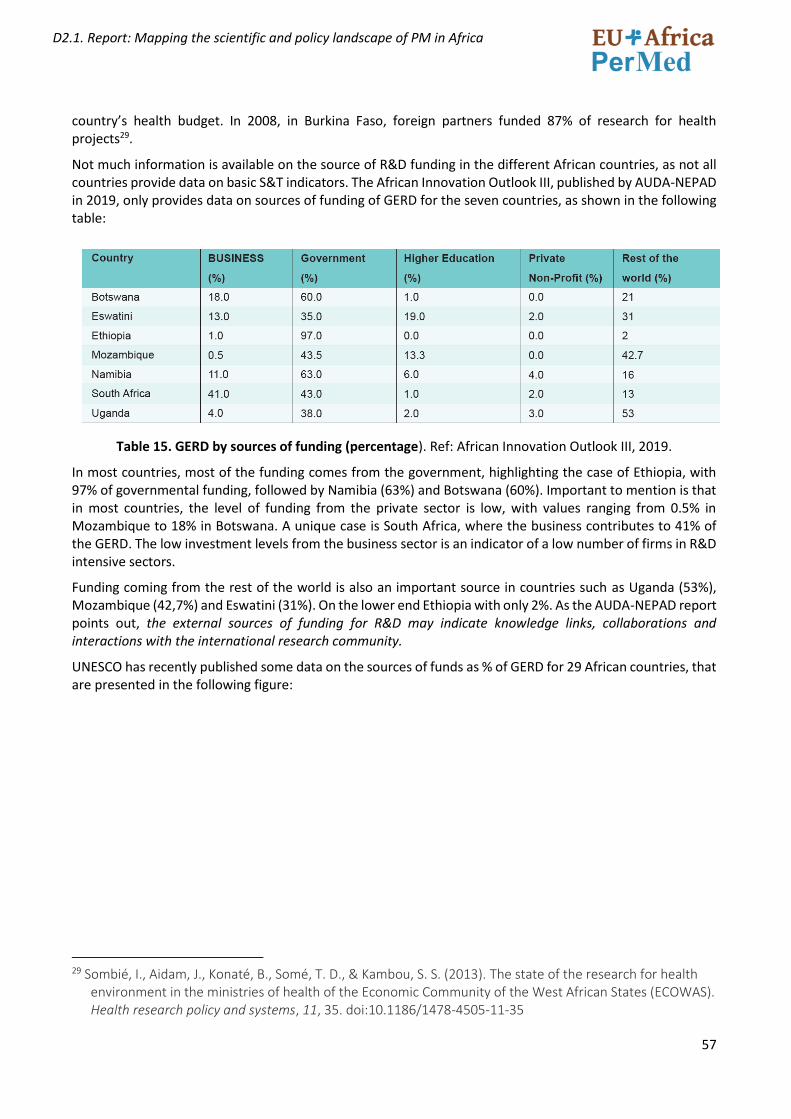
57
D2.1. Report: Mapping the scientific and policy landscape of PM in Africa
country’s health budget. In 2008, in Burkina Faso, foreign partners funded 87% of research for health projects29.
Not much information is available on the source of R&D funding in the different African countries, as not all countries provide data on basic S&T indicators. The African Innovation Outlook III, published by AUDA-NEPAD in 2019, only provides data on sources of funding of GERD for the seven countries, as shown in the following table:
Table 15. GERD by sources of funding (percentage). Ref: African Innovation Outlook III, 2019.
In most countries, most of the funding comes from the government, highlighting the case of Ethiopia, with 97% of governmental funding, followed by Namibia (63%) and Botswana (60%). Important to mention is that in most countries, the level of funding from the private sector is low, with values ranging from 0.5% in Mozambique to 18% in Botswana. A unique case is South Africa, where the business contributes to 41% of the GERD. The low investment levels from the business sector is an indicator of a low number of firms in R&D intensive sectors.
Funding coming from the rest of the world is also an important source in countries such as Uganda (53%), Mozambique (42,7%) and Eswatini (31%). On the lower end Ethiopia with only 2%. As the AUDA-NEPAD report points out, the external sources of funding for R&D may indicate knowledge links, collaborations and interactions with the international research community.
UNESCO has recently published some data on the sources of funds as % of GERD for 29 African countries, that are presented in the following figure:
29 Sombié, I., Aidam, J., Konaté, B., Somé, T. D., & Kambou, S. S. (2013). The state of the research for health
environment in the ministries of health of the Economic Community of the West African States (ECOWAS). Health research policy and systems, 11, 35. doi:10.1186/1478-4505-11-35
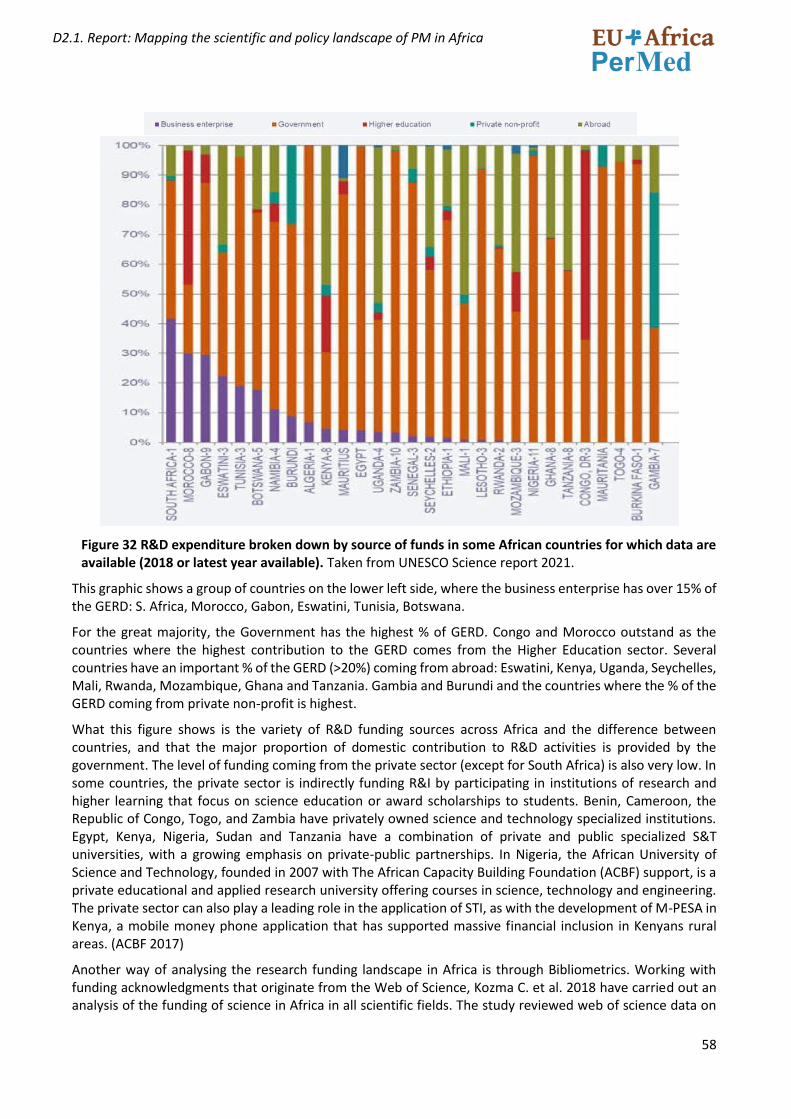
58
D2.1. Report: Mapping the scientific and policy landscape of PM in Africa
Figure 32 R&D expenditure broken down by source of funds in some African countries for which data are available (2018 or latest year available). Taken from UNESCO Science report 2021.
This graphic shows a group of countries on the lower left side, where the business enterprise has over 15% of the GERD: S. Africa, Morocco, Gabon, Eswatini, Tunisia, Botswana.
For the great majority, the Government has the highest % of GERD. Congo and Morocco outstand as the countries where the highest contribution to the GERD comes from the Higher Education sector. Several countries have an important % of the GERD (>20%) coming from abroad: Eswatini, Kenya, Uganda, Seychelles, Mali, Rwanda, Mozambique, Ghana and Tanzania. Gambia and Burundi and the countries where the % of the GERD coming from private non-profit is highest.
What this figure shows is the variety of R&D funding sources across Africa and the difference between countries, and that the major proportion of domestic contribution to R&D activities is provided by the government. The level of funding coming from the private sector (except for South Africa) is also very low. In some countries, the private sector is indirectly funding R&I by participating in institutions of research and higher learning that focus on science education or award scholarships to students. Benin, Cameroon, the Republic of Congo, Togo, and Zambia have privately owned science and technology specialized institutions. Egypt, Kenya, Nigeria, Sudan and Tanzania have a combination of private and public specialized S&T universities, with a growing emphasis on private-public partnerships. In Nigeria, the African University of Science and Technology, founded in 2007 with The African Capacity Building Foundation (ACBF) support, is a private educational and applied research university offering courses in science, technology and engineering. The private sector can also play a leading role in the application of STI, as with the development of M-PESA in Kenya, a mobile money phone application that has supported massive financial inclusion in Kenyans rural areas. (ACBF 2017)
Another way of analysing the research funding landscape in Africa is through Bibliometrics. Working with funding acknowledgments that originate from the Web of Science, Kozma C. et al. 2018 have carried out an analysis of the funding of science in Africa in all scientific fields. The study reviewed web of science data on
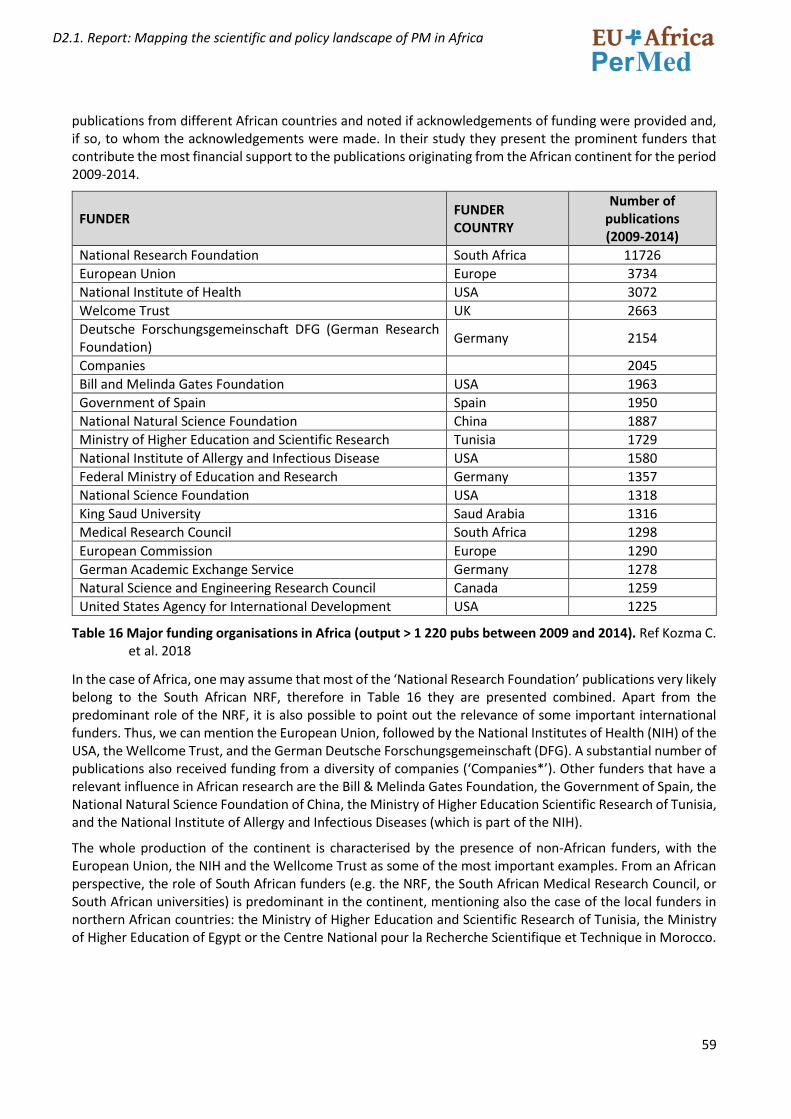
59
D2.1. Report: Mapping the scientific and policy landscape of PM in Africa
publications from different African countries and noted if acknowledgements of funding were provided and, if so, to whom the acknowledgements were made. In their study they present the prominent funders that contribute the most financial support to the publications originating from the African continent for the period 2009-2014.
FUNDER FUNDER COUNTRY
Number of publications (2009-2014)
National Research Foundation South Africa 11726
European Union Europe 3734
National Institute of Health USA 3072
Welcome Trust UK 2663
Deutsche Forschungsgemeinschaft DFG (German Research Foundation)
Germany 2154
Companies 2045
Bill and Melinda Gates Foundation USA 1963
Government of Spain Spain 1950
National Natural Science Foundation China 1887
Ministry of Higher Education and Scientific Research Tunisia 1729
National Institute of Allergy and Infectious Disease USA 1580
Federal Ministry of Education and Research Germany 1357
National Science Foundation USA 1318
King Saud University Saud Arabia 1316
Medical Research Council South Africa 1298
European Commission Europe 1290
German Academic Exchange Service Germany 1278
Natural Science and Engineering Research Council Canada 1259
United States Agency for International Development USA 1225
Table 16 Major funding organisations in Africa (output > 1 220 pubs between 2009 and 2014). Ref Kozma C. et al. 2018
In the case of Africa, one may assume that most of the ‘National Research Foundation’ publications very likely belong to the South African NRF, therefore in Table 16 they are presented combined. Apart from the predominant role of the NRF, it is also possible to point out the relevance of some important international funders. Thus, we can mention the European Union, followed by the National Institutes of Health (NIH) of the USA, the Wellcome Trust, and the German Deutsche Forschungsgemeinschaft (DFG). A substantial number of publications also received funding from a diversity of companies (‘Companies*’). Other funders that have a relevant influence in African research are the Bill & Melinda Gates Foundation, the Government of Spain, the National Natural Science Foundation of China, the Ministry of Higher Education Scientific Research of Tunisia, and the National Institute of Allergy and Infectious Diseases (which is part of the NIH).
The whole production of the continent is characterised by the presence of non-African funders, with the European Union, the NIH and the Wellcome Trust as some of the most important examples. From an African perspective, the role of South African funders (e.g. the NRF, the South African Medical Research Council, or South African universities) is predominant in the continent, mentioning also the case of the local funders in northern African countries: the Ministry of Higher Education and Scientific Research of Tunisia, the Ministry of Higher Education of Egypt or the Centre National pour la Recherche Scientifique et Technique in Morocco.
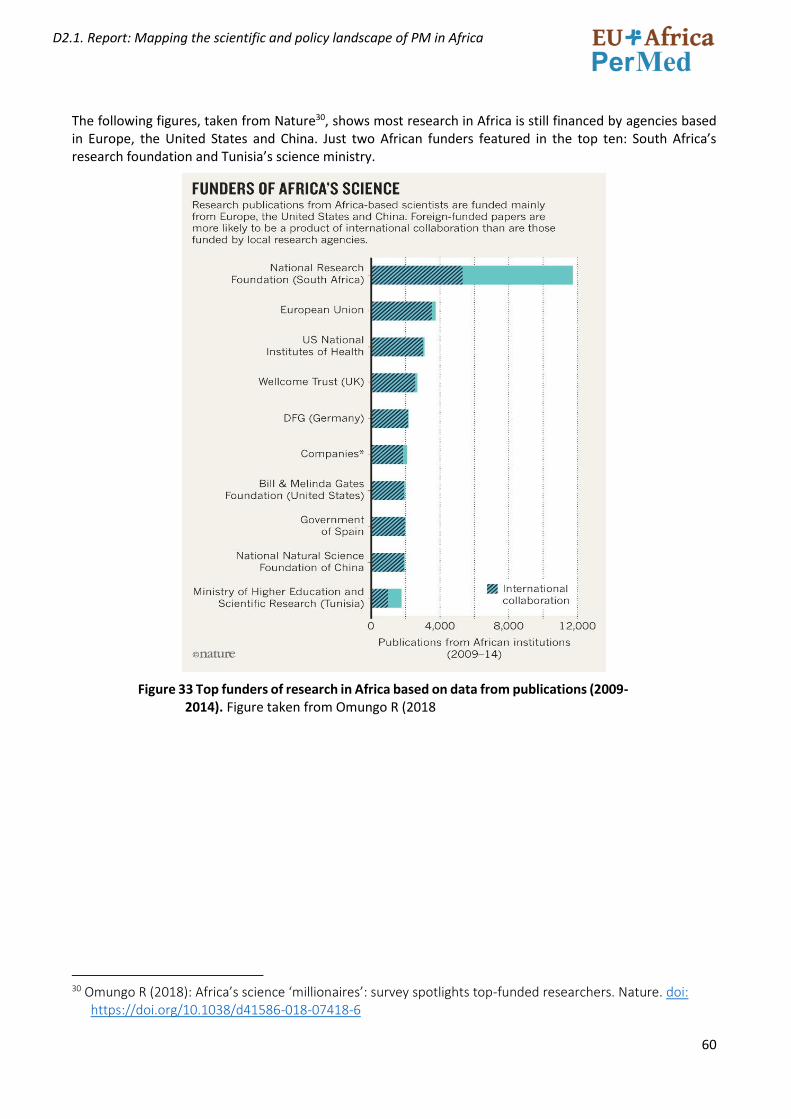
60
D2.1. Report: Mapping the scientific and policy landscape of PM in Africa
The following figures, taken from Nature30, shows most research in Africa is still financed by agencies based in Europe, the United States and China. Just two African funders featured in the top ten: South Africa’s research foundation and Tunisia’s science ministry.
Figure 33 Top funders of research in Africa based on data from publications (2009-2014). Figure taken from Omungo R (2018
30 Omungo R (2018): Africa’s science ‘millionaires’: survey spotlights top-funded researchers. Nature. doi:
https://doi.org/10.1038/d41586-018-07418-6
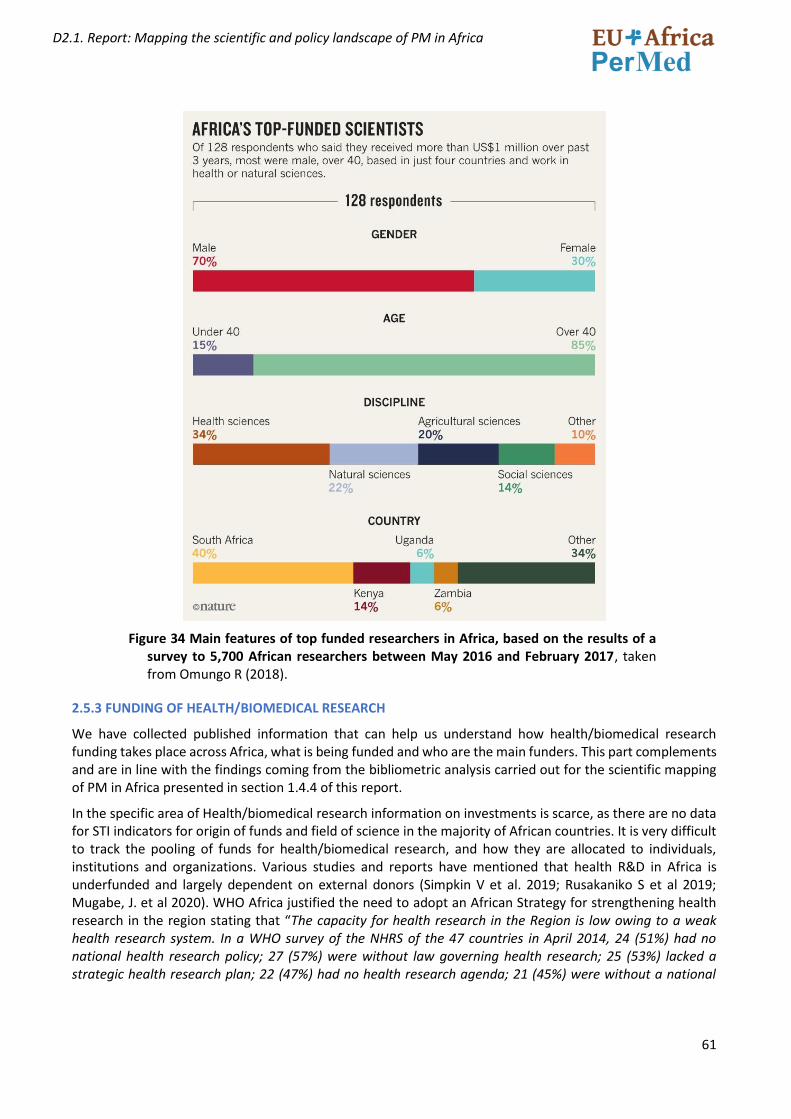
61
D2.1. Report: Mapping the scientific and policy landscape of PM in Africa
Figure 34 Main features of top funded researchers in Africa, based on the results of a survey to 5,700 African researchers between May 2016 and February 2017, taken from Omungo R (2018).
2.5.3 FUNDING OF HEALTH/BIOMEDICAL RESEARCH
We have collected published information that can help us understand how health/biomedical research funding takes place across Africa, what is being funded and who are the main funders. This part complements and are in line with the findings coming from the bibliometric analysis carried out for the scientific mapping of PM in Africa presented in section 1.4.4 of this report.
In the specific area of Health/biomedical research information on investments is scarce, as there are no data for STI indicators for origin of funds and field of science in the majority of African countries. It is very difficult to track the pooling of funds for health/biomedical research, and how they are allocated to individuals, institutions and organizations. Various studies and reports have mentioned that health R&D in Africa is underfunded and largely dependent on external donors (Simpkin V et al. 2019; Rusakaniko S et al 2019; Mugabe, J. et al 2020). WHO Africa justified the need to adopt an African Strategy for strengthening health research in the region stating that “The capacity for health research in the Region is low owing to a weak health research system. In a WHO survey of the NHRS of the 47 countries in April 2014, 24 (51%) had no national health research policy; 27 (57%) were without law governing health research; 25 (53%) lacked a strategic health research plan; 22 (47%) had no health research agenda; 21 (45%) were without a national
62
D2.1. Report: Mapping the scientific and policy landscape of PM in Africa
health research institute/council; and 25 (53%) lacked a dedicated budget to support research in their ministries of health”. 31
This same WHO Africa document stated that “Priority is not given to research as a tool for solving the Region’s health needs, and investments in health research are therefore insufficient. Most research activities are driven by external partners with agendas that do not often address national health priorities. Only 3.8% of new medicines approved between 2000 and 2011 are for diseases that disproportionally affect the Region”
Some attempts to collect information on the sources and amount of funding to health and biomedical research have come from the data provided by major international funders. World RePORT32 is an open-access, interactive mapping database project highlighting biomedical research investments and partnerships from some of the world’s largest funding organizations. Using this database, Adam T. et al. 2020 studied the biomedical research funding landscape in Africa in 2017 and came to some interesting findings that are briefly summarized in the following graphics. In total, 16 countries received about 90% of all awards and 28 countries split the remaining 10%. 11 countries received no international funding from World RePORT partners.
The distribution of funds by region resulted as follows:
Figure 35- Distribution of Biomedical grants received by African regions in 2017. Data from World RePORT (Ref Adam T. et al. 2020). Southern and East African regions received more than 90% of the grants.
31 WHO-Africa: RESEARCH FOR HEALTH: A STRATEGY FOR THE AFRICAN REGION, 2016-2025.
https://www.afro.who.int/sites/default/files/2018-06/afr-rc65-6_-research-for-health---a-strategy-for-the---af_2.pdf
32 https://worldreport.nih.gov/wrapp/.
2%
42%
4%
3%
49%
Grants received by region, 2017
North Africa
East Africa
Central Africa
west Africa
Southern Africa
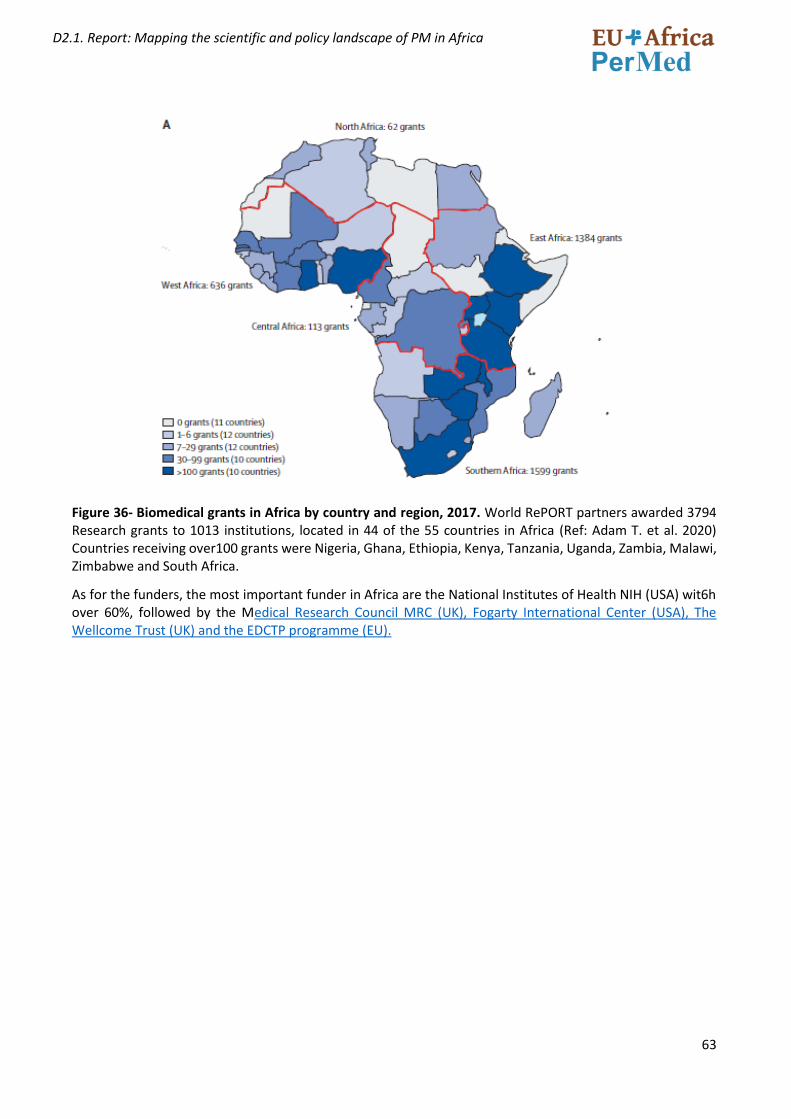
63
D2.1. Report: Mapping the scientific and policy landscape of PM in Africa
Figure 36- Biomedical grants in Africa by country and region, 2017. World RePORT partners awarded 3794 Research grants to 1013 institutions, located in 44 of the 55 countries in Africa (Ref: Adam T. et al. 2020) Countries receiving over100 grants were Nigeria, Ghana, Ethiopia, Kenya, Tanzania, Uganda, Zambia, Malawi, Zimbabwe and South Africa.
As for the funders, the most important funder in Africa are the National Institutes of Health NIH (USA) wit6h over 60%, followed by the Medical Research Council MRC (UK), Fogarty International Center (USA), The Wellcome Trust (UK) and the EDCTP programme (EU).
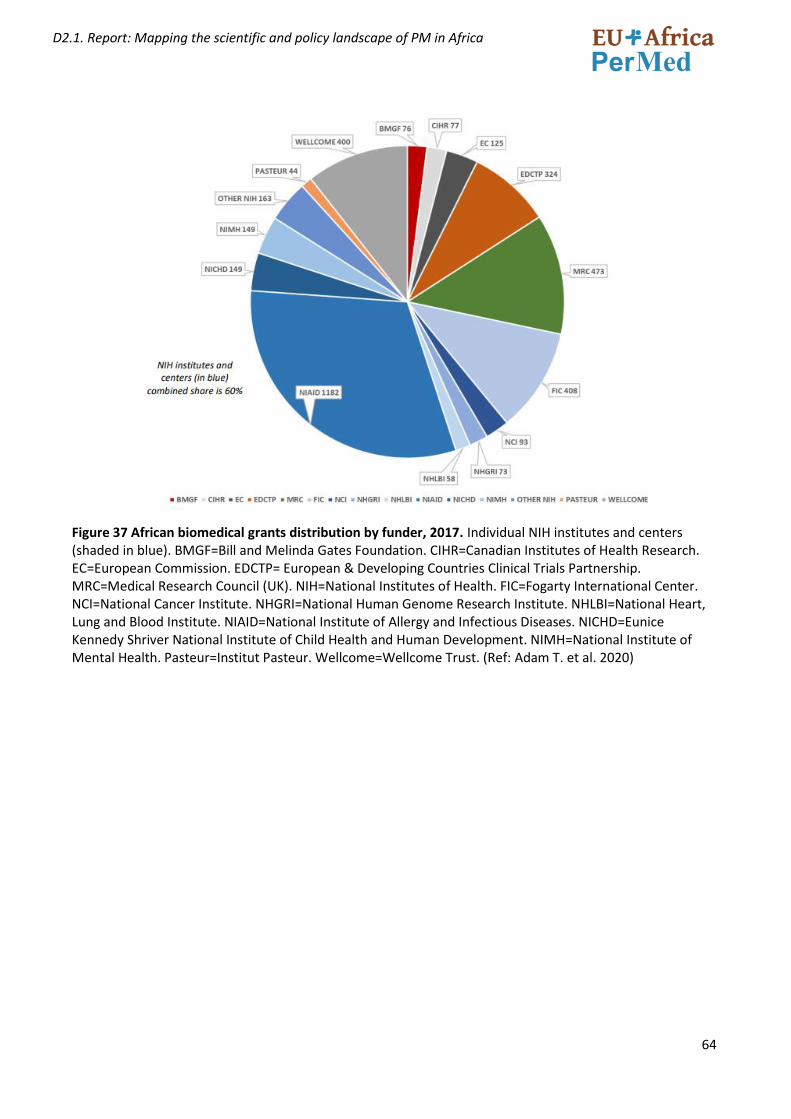
64
D2.1. Report: Mapping the scientific and policy landscape of PM in Africa
Figure 37 African biomedical grants distribution by funder, 2017. Individual NIH institutes and centers (shaded in blue). BMGF=Bill and Melinda Gates Foundation. CIHR=Canadian Institutes of Health Research. EC=European Commission. EDCTP= European & Developing Countries Clinical Trials Partnership. MRC=Medical Research Council (UK). NIH=National Institutes of Health. FIC=Fogarty International Center. NCI=National Cancer Institute. NHGRI=National Human Genome Research Institute. NHLBI=National Heart, Lung and Blood Institute. NIAID=National Institute of Allergy and Infectious Diseases. NICHD=Eunice Kennedy Shriver National Institute of Child Health and Human Development. NIMH=National Institute of Mental Health. Pasteur=Institut Pasteur. Wellcome=Wellcome Trust. (Ref: Adam T. et al. 2020)
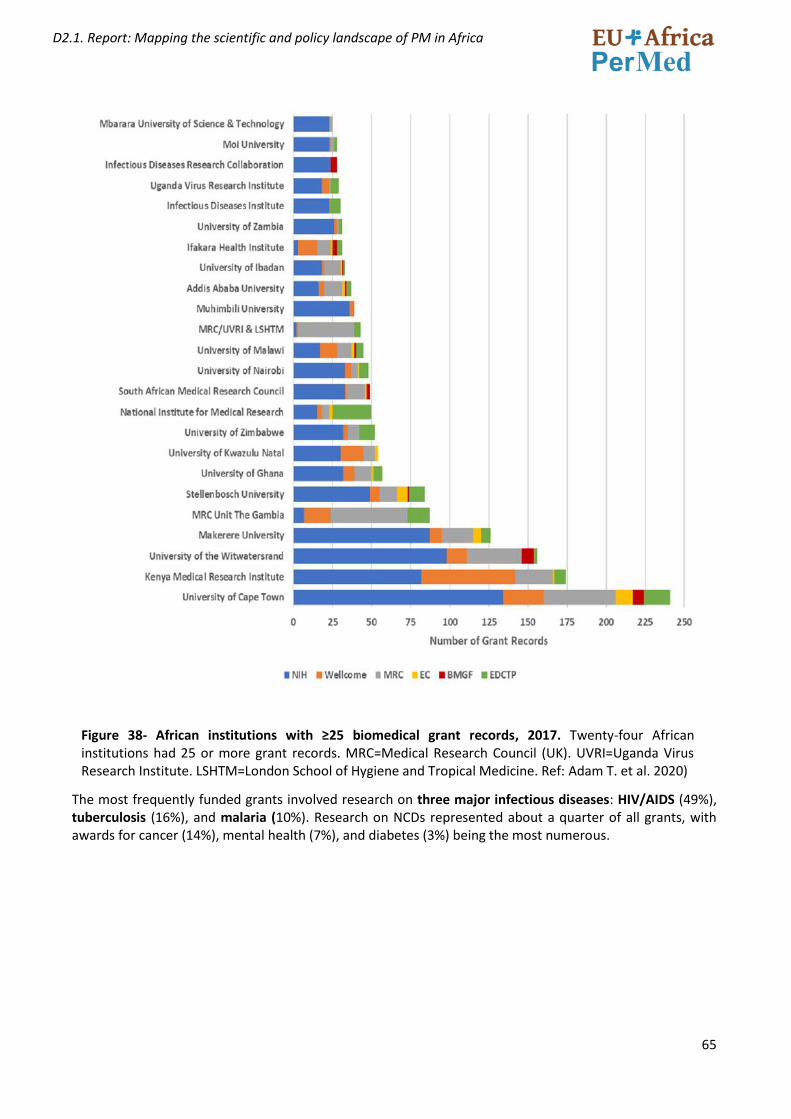
65
D2.1. Report: Mapping the scientific and policy landscape of PM in Africa
Figure 38- African institutions with ≥25 biomedical grant records, 2017. Twenty-four African institutions had 25 or more grant records. MRC=Medical Research Council (UK). UVRI=Uganda Virus Research Institute. LSHTM=London School of Hygiene and Tropical Medicine. Ref: Adam T. et al. 2020)
The most frequently funded grants involved research on three major infectious diseases: HIV/AIDS (49%), tuberculosis (16%), and malaria (10%). Research on NCDs represented about a quarter of all grants, with awards for cancer (14%), mental health (7%), and diabetes (3%) being the most numerous.
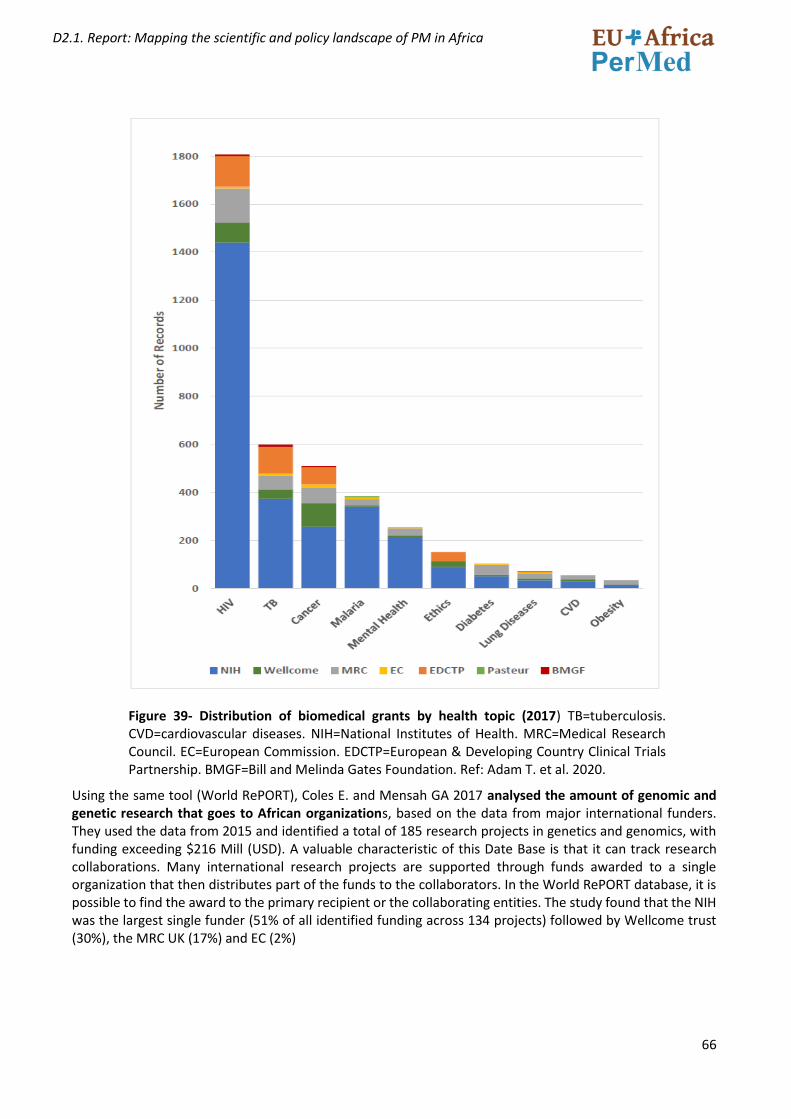
66
D2.1. Report: Mapping the scientific and policy landscape of PM in Africa
Figure 39- Distribution of biomedical grants by health topic (2017) TB=tuberculosis. CVD=cardiovascular diseases. NIH=National Institutes of Health. MRC=Medical Research Council. EC=European Commission. EDCTP=European & Developing Country Clinical Trials Partnership. BMGF=Bill and Melinda Gates Foundation. Ref: Adam T. et al. 2020.
Using the same tool (World RePORT), Coles E. and Mensah GA 2017 analysed the amount of genomic and genetic research that goes to African organizations, based on the data from major international funders. They used the data from 2015 and identified a total of 185 research projects in genetics and genomics, with funding exceeding $216 Mill (USD). A valuable characteristic of this Date Base is that it can track research collaborations. Many international research projects are supported through funds awarded to a single organization that then distributes part of the funds to the collaborators. In the World RePORT database, it is possible to find the award to the primary recipient or the collaborating entities. The study found that the NIH was the largest single funder (51% of all identified funding across 134 projects) followed by Wellcome trust (30%), the MRC UK (17%) and EC (2%)
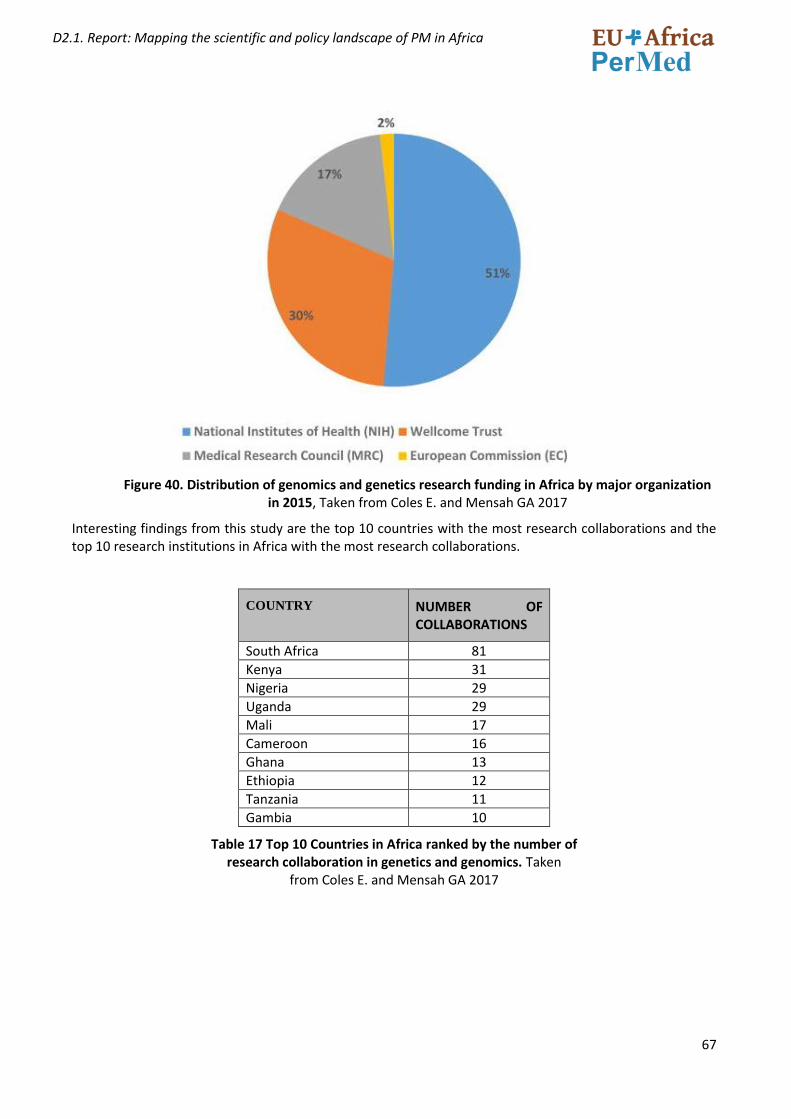
67
D2.1. Report: Mapping the scientific and policy landscape of PM in Africa
Figure 40. Distribution of genomics and genetics research funding in Africa by major organization in 2015, Taken from Coles E. and Mensah GA 2017
Interesting findings from this study are the top 10 countries with the most research collaborations and the top 10 research institutions in Africa with the most research collaborations.
COUNTRY NUMBER OF COLLABORATIONS
South Africa 81
Kenya 31
Nigeria 29
Uganda 29
Mali 17
Cameroon 16
Ghana 13
Ethiopia 12
Tanzania 11
Gambia 10
Table 17 Top 10 Countries in Africa ranked by the number of research collaboration in genetics and genomics. Taken
from Coles E. and Mensah GA 2017
68
D2.1. Report: Mapping the scientific and policy landscape of PM in Africa
RESEARCH ORGANIZATION COUNTRY NUMBER OF
COLLABORATIONS
UNIVERSITY OF CAPE TOWN, South Africa 44
MAKERERE UNIVERSITY Uganda 16
MRC UNIT, THE GAMBIA Gambia 10
INSTITUTE OF HUMAN VIROLOGY NIGERIA Nigeria 9
STELLENBOSCH UNIVERSITY TYGERBERG CAMPUS South Africa 7
UNIVERSITY OF YAOUNDE Cameroon 7
UNIVERSITY OF KWAZULU NATAL South Africa 6
UNIVERSITY OF BAMAKO Mali 6
KENYA MEDICAL RESEARCH INSTITUTE (KEMRI), NAIROBI Kenya 6
UNIVERSITY OF IBADAN Nigeria 5
Table 18 Top 10 research organizations and universities with the most research collaborations in genetic and genomics, taken from Coles E. and Mensah GA 2017
Confraria H., Wang L. 2020 have studied the alignment between the medical research effort performed by African researchers and the burden of disease across African regions using a bibliometric approach, and have analysed the funding institutions acknowledged in the publications. Their findings are relevant to understand the health/biomedical funding landscape in Africa and are summarized below.
• The highest share of research funding in all regions is from public non-African funding institutions (e.g. NIH, EU, USAID, Medical Research Council (UK)), followed by Philanthropic funding institutions (e.g. Wellcome Trust, Gates Foundation) that make particularly relevant contributions in Eastern African countries. Public African funding institutions have higher shares of funding in Southern Africa (e.g. National Research Foundation (ZA), Medical Research Council (ZA)) and Northern Africa (e.g. Tunisian Government, Egyptian Government and the Centre National pour la Recherche Scientifique et Technique in Morocco). These findings are similar to the ones found by Kozma C. et al. 2018 and Coles E. and Mensah GA 2017, previously discussed.
• Southern Africa is the region where the contribution of corporate research funding is relatively higher (7.7% compared with 3.7% in Eastern Africa, 3.4% in West & Central Africa and 1.8% in Northern Africa). Pharmaceutical producers like GlaxoSmithKline, Pfizer and Novartis were the top funders in this category and were acknowledged in all African regions (< 1% of total output in Africa). An interesting result is that on average in Africa, there seems to exist minor overlap between corporate funding and public African funding (15%), compared to substantial overlap between corporate funding and public non-African funding (42%).
• Multilateral funding institutions like WHO, EDCTP and the World Bank are mostly funding medical research in Eastern African countries and West & Central African countries
• “Parasitic and vector diseases”, “HIV/AIDS” and “Tuberculosis” are a priority for most top20 funders. These results are in line with Chapman et al. (2017) that also found that three diseases – HIV/AIDS, malaria and tuberculosis – collectively received more than two-thirds ($2247 m, 70%) of all global funding for neglected disease R&D in 2016. It is also similar to the findings by Taghreed A. et al. 2020, discussed before in this report.
• The only funders that are not so biased towards these three diseases are the National Research Council (in South Africa), Medical Research Council (in South Africa), Tunisian Government, GlaxoSmithKline and Pfizer. These are all African funders and corporations that may have different priorities than international organisations.
• Important to notice is the absence of Public African funders from Eastern Africa and West & Central Africa. In these regions, the importance of international funders such as the NIH, Wellcome Trust,
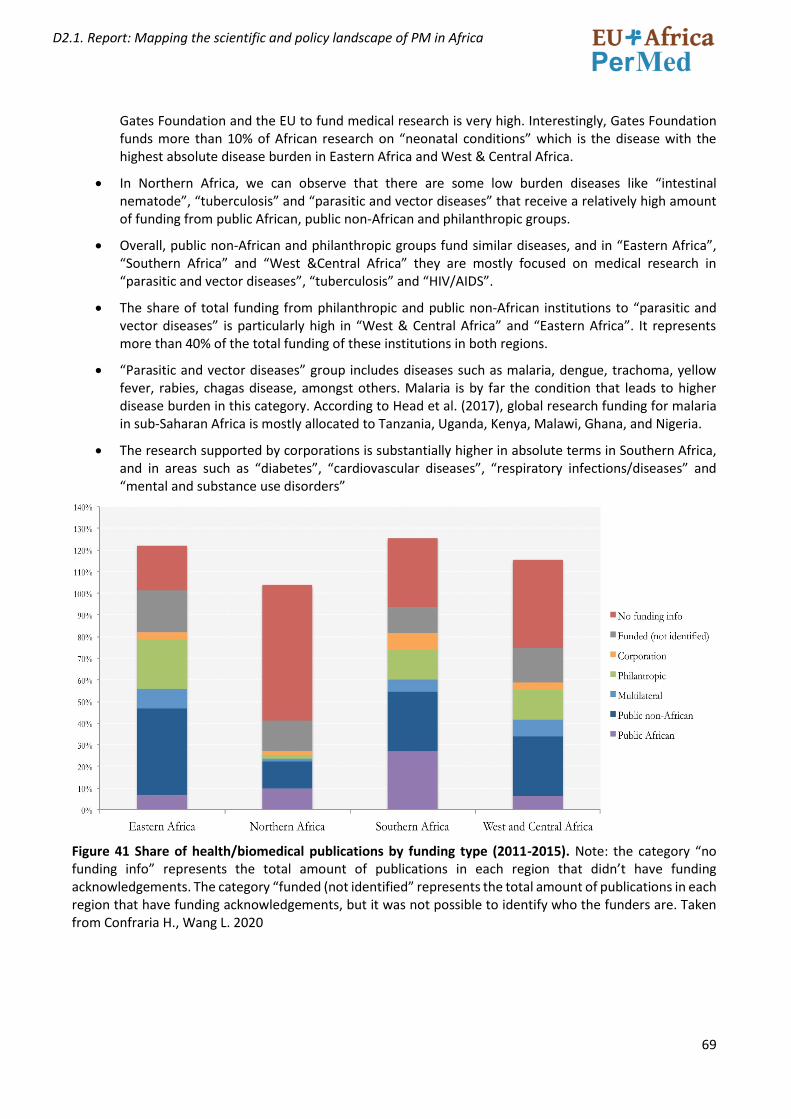
69
D2.1. Report: Mapping the scientific and policy landscape of PM in Africa
Gates Foundation and the EU to fund medical research is very high. Interestingly, Gates Foundation funds more than 10% of African research on “neonatal conditions” which is the disease with the highest absolute disease burden in Eastern Africa and West & Central Africa.
• In Northern Africa, we can observe that there are some low burden diseases like “intestinal nematode”, “tuberculosis” and “parasitic and vector diseases” that receive a relatively high amount of funding from public African, public non-African and philanthropic groups.
• Overall, public non-African and philanthropic groups fund similar diseases, and in “Eastern Africa”, “Southern Africa” and “West &Central Africa” they are mostly focused on medical research in “parasitic and vector diseases”, “tuberculosis” and “HIV/AIDS”.
• The share of total funding from philanthropic and public non-African institutions to “parasitic and vector diseases” is particularly high in “West & Central Africa” and “Eastern Africa”. It represents more than 40% of the total funding of these institutions in both regions.
• “Parasitic and vector diseases” group includes diseases such as malaria, dengue, trachoma, yellow fever, rabies, chagas disease, amongst others. Malaria is by far the condition that leads to higher disease burden in this category. According to Head et al. (2017), global research funding for malaria in sub-Saharan Africa is mostly allocated to Tanzania, Uganda, Kenya, Malawi, Ghana, and Nigeria.
• The research supported by corporations is substantially higher in absolute terms in Southern Africa, and in areas such as “diabetes”, “cardiovascular diseases”, “respiratory infections/diseases” and “mental and substance use disorders”
Figure 41 Share of health/biomedical publications by funding type (2011-2015). Note: the category “no funding info” represents the total amount of publications in each region that didn’t have funding acknowledgements. The category “funded (not identified” represents the total amount of publications in each region that have funding acknowledgements, but it was not possible to identify who the funders are. Taken from Confraria H., Wang L. 2020
70
D2.1. Report: Mapping the scientific and policy landscape of PM in Africa
REGION TOP 5 FUNDERS based on number of publications (2011-2015)
1 2 3 4 5
Northern Africa Tunisian Gov
NIH US King Saud Univ Egyptian Gov EU-EC-ERC
Southern Africa NRF-ZA NIH-US MRC-ZA Wellcome trust Gates Foundation
Eastern Africa NIH-US Wellcome trust
Gates Foundation
USAID EU-EC-ERC
West and Central Africa
NIH-US Gates Foundation
Wellcome Trust
EU-EC-ERC WHO
Table 19 Top Funding Institutions by African region (ref: Confraria H., Wang L. 2020)
REGION TOP 5 FUNDING INSTITUTIONS BY FUNDING GROUP based on number of
publications (2011-2015)
1 2 3 4 5
Public non-Africa NIH-US EU-EC-ERC WHO USAID CDC-US
Public African NRF-ZA MRC-ZA Tunisian Gov DST-ZA Egyptian Gov
Philanthropic Wellcome trust
Gates Foundation
Doris Duke Foundation
Howard Hughes Health Inst
Inst. Pasteur
Corporation Glaxo Smithkline
Pfizer Novartis Merck Sanofi Aventis
Table 20. Top 5 funding institutions by funding group (ref: Confraria H., Wang L. 2020)
2.5.4 MAJOR PAN AFRICAN PROGRAMMES SUPPORTING AND FUNDING HEALTH RESEARCH.
The Alliance for Accelerating Excellence in Science in Africa (AESA)33, is an initiative of the African Academy of Sciences (AAS) and the African Union Development Agency AUDA-NEPAD, and through a resolution of the summit of African Union Heads of Governments. It was launched in 2015. The initiative is supported financially by the Wellcome Trust, the Gates Foundation and other development partners, notably UK UK Foreign, Commonwealth & Development Office (FCDO) (formerly DFID). AESA provides competitive grants and capacity building support for research across the continent.
The mission of AESA is to shift the centre of gravity for African science to Africa through agenda setting, mobilizing Research & Development (R&D) funding, and managing continent-wide Science, Technology & Innovation (STI) programmes that promote the brightest minds, strengthening the best possible science environments in Africa, fostering scientific excellence, inspiring and mentoring emerging research leaders, and accelerating and translating research & innovations into products, policies and practices that will improve and transform lives in Africa.
The Alliance is structured around the following programmes:
i. Climate Impact Research Capacity and Leadership Enhancement ii. Grand Challenges Africa iii. Developing Excellence in Leadership, Training and Science
33 https://www.aasciences.africa/aesa
71
D2.1. Report: Mapping the scientific and policy landscape of PM in Africa
iv. Good Financial Grant Practice v. Human Heredity and Health in Africa vi. Stem Cell Science and Applications vii. Post-doctoral Fellowship schemes viii. Building the capacity of science journalists in Africa ix. Mobility programmes
The majority of the research programmes at the moment is in the area of health research, with one programme also on climate research. It has recently initiated a US$2 million postdoctoral fellowship programme in partnership with the Carnegie Corporation of New York in the general area of science, mathematics and engineering.
The funds available through AESA are substantially higher than from most national research agencies in Africa. AESA explicitly states that it has been established in support of STISA-2024. It is developing a strong focus on innovation and is becoming more transdisciplinary in its approach. When it was established in 2015, AESA developed a business plan that set a target of increasing its initial investment of $65 million to a total of $241 million by 2021 (AAS, 2017). To date AESA is on track to meet this ambitious target and has raised over US$ 200 million to finance its activities.34
The African Academy of Sciences announced the establishment of the Coalition for African Research and Innovation at the World Economic Forum in January 2017. This pan-African mechanism seeks to consolidate and reduce fragmentation of funding, while spurring greater African ownership of research and innovation targeting the Sustainable Development Goals (SDGs) through heightened African investment (AAS, 2018).
The Developing Excellence in Leadership, Training and Science in Africa (DELTAS Africa)35, launched by the African Academy of Science (AAS) is a long-term programme, which, over an initial period of five years (2015-2020), is supporting 11 collaborative teams headed by world class researchers and spanning 54 lead and partner institutions from across the continent to invest in research infrastructure and offer training fellowships and mentorship.
DELTAS Africa’s ultimate goal is to produce researchers with the capacity to publish and lead locally relevant and high-quality research to impact health science, policy and practice in Africa. This new generation of scientists are expected to play a major part in shaping and driving a locally relevant health research agenda in Africa, contributing to improved health and development on the continent.
Up to now, nearly US$100 million have been awarded to 11 leading African researchers to implement cutting edge collaborative research and training programmes spanning 40 lead and partner institutions from across 21 countries in the continent.
To realise its vision, DELTAS Africa funds programmes that address four strategic areas:
1. Scientific quality: To produce world-class scientific research that addresses African health and research priorities through scientific discourse and collaborative supervision, DELTAS Africa promotes collaborations with well-resourced universities, research institutions and think-tanks to strengthen capacity.
2. Research training: To strengthen scientific research training and build career pathways for scientific researchers DELTAS Africa focuses on the tertiary and postgraduate training of science students and professionals along a defined career pathway. Training offered by DELTAS Africa
34 https://au.int/sites/default/files/newsevents/workingdocuments/37841-wd-stisa-2024_report_en.pdf 35 https://www.aasciences.africa/aesa/programmes/developing-excellence-leadership-training-and-science-
africa-deltas-africa
72
D2.1. Report: Mapping the scientific and policy landscape of PM in Africa
programmes is designed to provide individuals at all career stages with the academic support and research facilities they need to develop into world-class researchers.
3. Scientific citizenship: Foster mentorship, leadership and equitable collaboration in science, and engagement with public and policy stakeholders.
4. Research management and environment: To cultivate professional environments to manage and support scientific research
The Consortium for Advanced Research Training in Africa (CARTA)36 , launched in 2008, is a South-South partnership with South-North collaboration. CARTA is jointly-led by the African Population and Health Research Center (APHRC), Kenya and the University of the Witwatersrand (Wits), South Africa.
CARTA has two primary objectives, namely: to strengthen research infrastructure and management capacity at African universities, and to support doctoral training through a model collaborative PhD program in population and public health. The objectives are designed to realize CARTA’s ultimate goal of building local research capacity to understand the determinants of health in Africa and develop effective interventions to improve health systems and outcomes.
CARTA coordinates and funds a vast amount of PhD scholarships. They further offer Joint Advanced Seminars and PhD Fellowships. More than 290 fellows from seven countries have taken part in the programme. Fellows admitted by the consortium have produced over 800 peer-reviewed academic articles. Their subject areas have included infectious diseases, maternal and child health, sexual and reproductive health and other topics of public and population health significance37.
Another example is The Human Heredity and Health in Africa (H3Africa)38 consortium, which empowers African researchers to be competitive in genomic science. H3Africa is a major programme initiated in 2010 by the National Institute of Health (NIH), Wellcome Trust and African Society of Human Genetics (AfSHG).It was officially launched in 2012 in Adis Ababa. The programme supports population based studies that use genetic, clinical and epidemiological tools to better understand how the interplay between human genes and the environment influence disease susceptibility, pathogenesis and prevention with the goal of improving the health of African populations.
The H3Africa consortium facilitates fundamental research into diseases on the African continent while also developing infrastructure, resources, training, and ethical guidelines to support a sustainable African research enterprise – led by African scientists, for the African people. The initiative consists of 51 African projects that include population-based genomic studies of common, non-communicable disorders such as heart and renal disease, as well as communicable diseases such as tuberculosis. These studies are led by African scientists and use genetic, clinical, and epidemiologic methods to identify hereditary and environmental contributions to health and disease. To establish a foundation for African scientists to continue this essential work into the future work, the consortium also supports many crucial capacity building elements, such as: ethical, legal, and social implications research; training and capacity building for bioinformatics; capacity for biobanking; and coordination and networking.
In its efforts to shift the centre of gravity of its funding for African science from the UK to Africa, Wellcome gave a grant of $11M to the African Academy of Sciences and the NEPAD Agency’s Alliance of Accelerating Science in Africa (AESA) to manage the phase II of its component of the H3Africa programme.
36 https://cartafrica.org/ 37 https://www.usnews.com/news/best-countries/articles/2020-09-01/pan-african-initiatives-improving-
health-research 38https://h3africa.org/
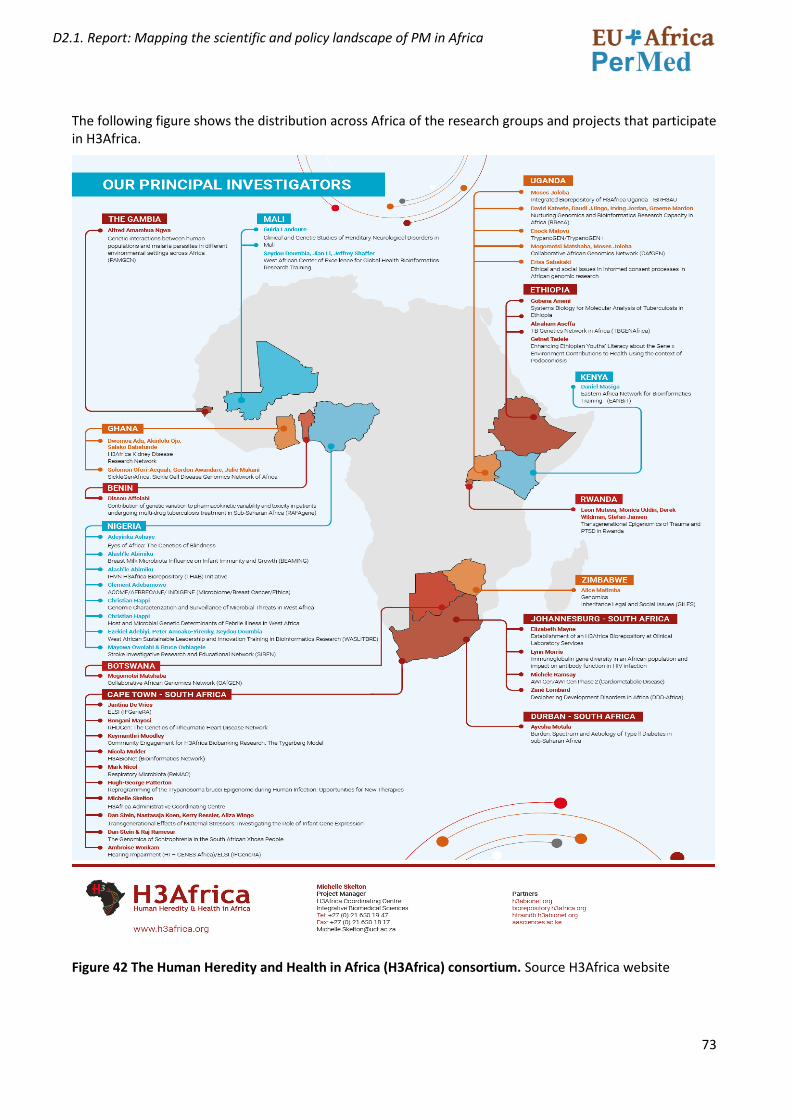
73
D2.1. Report: Mapping the scientific and policy landscape of PM in Africa
The following figure shows the distribution across Africa of the research groups and projects that participate in H3Africa.
Figure 42 The Human Heredity and Health in Africa (H3Africa) consortium. Source H3Africa website
74
D2.1. Report: Mapping the scientific and policy landscape of PM in Africa
The Southern African Human Genome Programme (SAHGP)39 40 funded by the Department of Science and Technology (DST) of South Africa , is a national and regional initiative that aims to unlock the unique genetic character of Southern African populations. Its vision is to improve quality of life through understanding human genetic diversity. This information will be used to promote and support genomic research programmes both nationally and regionally to address critical questions that would benefit the people of the region. The SAHGP aims to make a significant contribution to the understanding of DNA variation among southern Africans and how this, impacts on the health of the people of this region. Aims of the SAHGP:
• To develop capacity for genomic research in southern Africa;
• To establish sustainable resources for genomic research in the region;
• To translate knowledge and information into improvements in human health in the region.
The objective is to derive the maximum benefit from the SAHGP, and that the data should be widely shared with the scientific community for the benefit of the people of the sub-continent and beyond.
The African Scientific and Research Innovation Council (ASRIC) is a continental platform created to mobilize African research excellence, innovation and provide a platform for dialogue and the voice of the scientific community in building and sustaining continental research-policy nexus with the aim of addressing Africa’s socio-economic development challenges.
The African Scientific, Research and Innovation Council (ASRIC) was then adopted in 2014 by the Executive Council of the African Ministerial Conference in charge of Science and Technology.
The African Scientific Research and Innovation Council endorsed the following six priority areas at its second congress in November 2019:
1. Eradication of hunger and food and nutrition security; 2. Prevention and control of diseases and well-being; 3. Communication; 4. Protecting our space; 5. Creating wealth; and 6. Cross-cutting actions for infrastructural and research development.
The 14 flagship projects under these six areas are being developed either through an intra-African call for research proposals or the development of projects by the Council’s Scientific and Innovation Committee.
39 Pepper MS. Launch of the Southern African Human Genome Programme. S Afr Med J. 2011
May;101(5):287-8. doi: 10.7196/samj.4860. PMID: 21837864. 40 https://www.wits.ac.za/news/latest-news/research-news/2017/2017-12/african-genetic-diversity-to-
unlock-disease-susceptibility.html
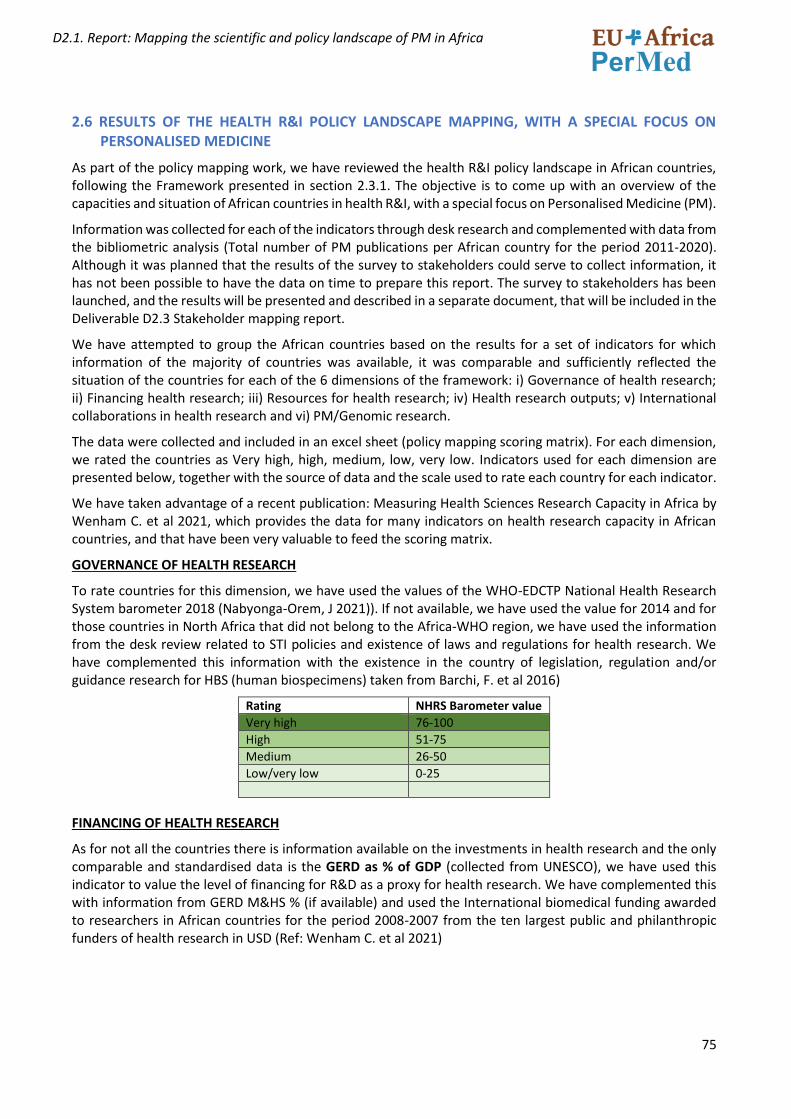
75
D2.1. Report: Mapping the scientific and policy landscape of PM in Africa
2.6 RESULTS OF THE HEALTH R&I POLICY LANDSCAPE MAPPING, WITH A SPECIAL FOCUS ON PERSONALISED MEDICINE
As part of the policy mapping work, we have reviewed the health R&I policy landscape in African countries, following the Framework presented in section 2.3.1. The objective is to come up with an overview of the capacities and situation of African countries in health R&I, with a special focus on Personalised Medicine (PM).
Information was collected for each of the indicators through desk research and complemented with data from the bibliometric analysis (Total number of PM publications per African country for the period 2011-2020). Although it was planned that the results of the survey to stakeholders could serve to collect information, it has not been possible to have the data on time to prepare this report. The survey to stakeholders has been launched, and the results will be presented and described in a separate document, that will be included in the Deliverable D2.3 Stakeholder mapping report.
We have attempted to group the African countries based on the results for a set of indicators for which information of the majority of countries was available, it was comparable and sufficiently reflected the situation of the countries for each of the 6 dimensions of the framework: i) Governance of health research; ii) Financing health research; iii) Resources for health research; iv) Health research outputs; v) International collaborations in health research and vi) PM/Genomic research.
The data were collected and included in an excel sheet (policy mapping scoring matrix). For each dimension, we rated the countries as Very high, high, medium, low, very low. Indicators used for each dimension are presented below, together with the source of data and the scale used to rate each country for each indicator.
We have taken advantage of a recent publication: Measuring Health Sciences Research Capacity in Africa by Wenham C. et al 2021, which provides the data for many indicators on health research capacity in African countries, and that have been very valuable to feed the scoring matrix.
GOVERNANCE OF HEALTH RESEARCH
To rate countries for this dimension, we have used the values of the WHO-EDCTP National Health Research System barometer 2018 (Nabyonga-Orem, J 2021)). If not available, we have used the value for 2014 and for those countries in North Africa that did not belong to the Africa-WHO region, we have used the information from the desk review related to STI policies and existence of laws and regulations for health research. We have complemented this information with the existence in the country of legislation, regulation and/or guidance research for HBS (human biospecimens) taken from Barchi, F. et al 2016)
Rating NHRS Barometer value Very high 76-100 High 51-75 Medium 26-50 Low/very low 0-25
FINANCING OF HEALTH RESEARCH
As for not all the countries there is information available on the investments in health research and the only comparable and standardised data is the GERD as % of GDP (collected from UNESCO), we have used this indicator to value the level of financing for R&D as a proxy for health research. We have complemented this with information from GERD M&HS % (if available) and used the International biomedical funding awarded to researchers in African countries for the period 2008-2007 from the ten largest public and philanthropic funders of health research in USD (Ref: Wenham C. et al 2021)
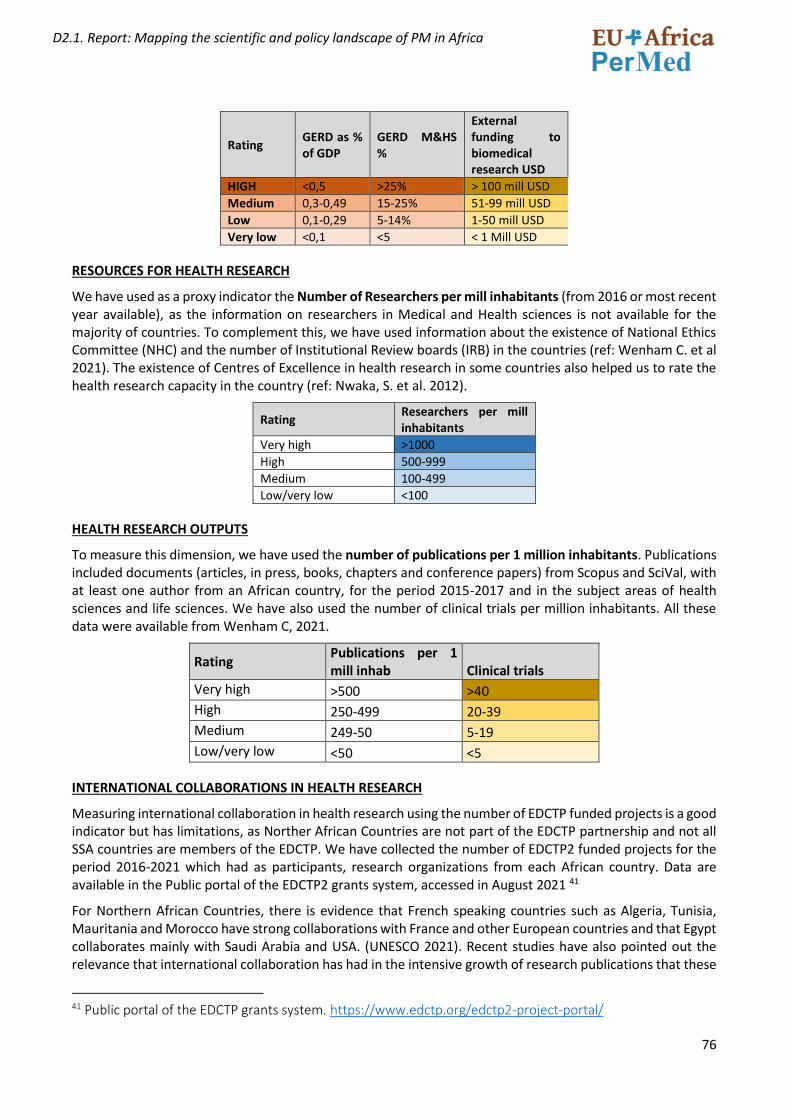
76
D2.1. Report: Mapping the scientific and policy landscape of PM in Africa
Rating GERD as % of GDP
GERD M&HS %
External funding to biomedical research USD
HIGH <0,5 >25% > 100 mill USD Medium 0,3-0,49 15-25% 51-99 mill USD Low 0,1-0,29 5-14% 1-50 mill USD Very low <0,1 <5 < 1 Mill USD
RESOURCES FOR HEALTH RESEARCH
We have used as a proxy indicator the Number of Researchers per mill inhabitants (from 2016 or most recent year available), as the information on researchers in Medical and Health sciences is not available for the majority of countries. To complement this, we have used information about the existence of National Ethics Committee (NHC) and the number of Institutional Review boards (IRB) in the countries (ref: Wenham C. et al 2021). The existence of Centres of Excellence in health research in some countries also helped us to rate the health research capacity in the country (ref: Nwaka, S. et al. 2012).
Rating Researchers per mill inhabitants
Very high >1000 High 500-999 Medium 100-499 Low/very low <100
HEALTH RESEARCH OUTPUTS
To measure this dimension, we have used the number of publications per 1 million inhabitants. Publications included documents (articles, in press, books, chapters and conference papers) from Scopus and SciVal, with at least one author from an African country, for the period 2015-2017 and in the subject areas of health sciences and life sciences. We have also used the number of clinical trials per million inhabitants. All these data were available from Wenham C, 2021.
Rating Publications per 1 mill inhab Clinical trials
Very high >500 >40
High 250-499 20-39
Medium 249-50 5-19
Low/very low <50 <5
INTERNATIONAL COLLABORATIONS IN HEALTH RESEARCH
Measuring international collaboration in health research using the number of EDCTP funded projects is a good indicator but has limitations, as Norther African Countries are not part of the EDCTP partnership and not all SSA countries are members of the EDCTP. We have collected the number of EDCTP2 funded projects for the period 2016-2021 which had as participants, research organizations from each African country. Data are available in the Public portal of the EDCTP2 grants system, accessed in August 2021 41
For Northern African Countries, there is evidence that French speaking countries such as Algeria, Tunisia, Mauritania and Morocco have strong collaborations with France and other European countries and that Egypt collaborates mainly with Saudi Arabia and USA. (UNESCO 2021). Recent studies have also pointed out the relevance that international collaboration has had in the intensive growth of research publications that these
41 Public portal of the EDCTP grants system. https://www.edctp.org/edctp2-project-portal/
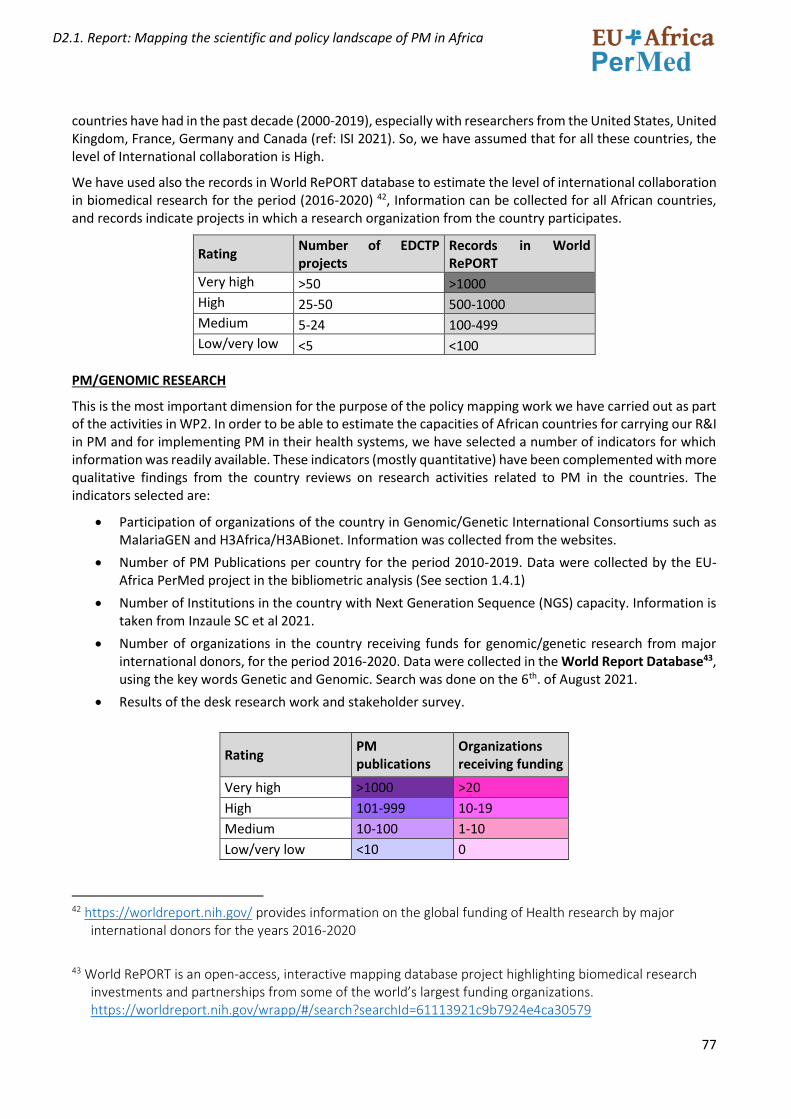
77
D2.1. Report: Mapping the scientific and policy landscape of PM in Africa
countries have had in the past decade (2000-2019), especially with researchers from the United States, United Kingdom, France, Germany and Canada (ref: ISI 2021). So, we have assumed that for all these countries, the level of International collaboration is High.
We have used also the records in World RePORT database to estimate the level of international collaboration in biomedical research for the period (2016-2020) 42, Information can be collected for all African countries, and records indicate projects in which a research organization from the country participates.
Rating Number of EDCTP projects
Records in World RePORT
Very high >50 >1000
High 25-50 500-1000
Medium 5-24 100-499
Low/very low <5 <100
PM/GENOMIC RESEARCH
This is the most important dimension for the purpose of the policy mapping work we have carried out as part of the activities in WP2. In order to be able to estimate the capacities of African countries for carrying our R&I in PM and for implementing PM in their health systems, we have selected a number of indicators for which information was readily available. These indicators (mostly quantitative) have been complemented with more qualitative findings from the country reviews on research activities related to PM in the countries. The indicators selected are:
• Participation of organizations of the country in Genomic/Genetic International Consortiums such as MalariaGEN and H3Africa/H3ABionet. Information was collected from the websites.
• Number of PM Publications per country for the period 2010-2019. Data were collected by the EU-Africa PerMed project in the bibliometric analysis (See section 1.4.1)
• Number of Institutions in the country with Next Generation Sequence (NGS) capacity. Information is taken from Inzaule SC et al 2021.
• Number of organizations in the country receiving funds for genomic/genetic research from major international donors, for the period 2016-2020. Data were collected in the World Report Database43, using the key words Genetic and Genomic. Search was done on the 6th. of August 2021.
• Results of the desk research work and stakeholder survey.
Rating PM publications
Organizations receiving funding
Very high >1000 >20
High 101-999 10-19
Medium 10-100 1-10
Low/very low <10 0
42 https://worldreport.nih.gov/ provides information on the global funding of Health research by major
international donors for the years 2016-2020
43 World RePORT is an open-access, interactive mapping database project highlighting biomedical research
investments and partnerships from some of the world’s largest funding organizations. https://worldreport.nih.gov/wrapp/#/search?searchId=61113921c9b7924e4ca30579
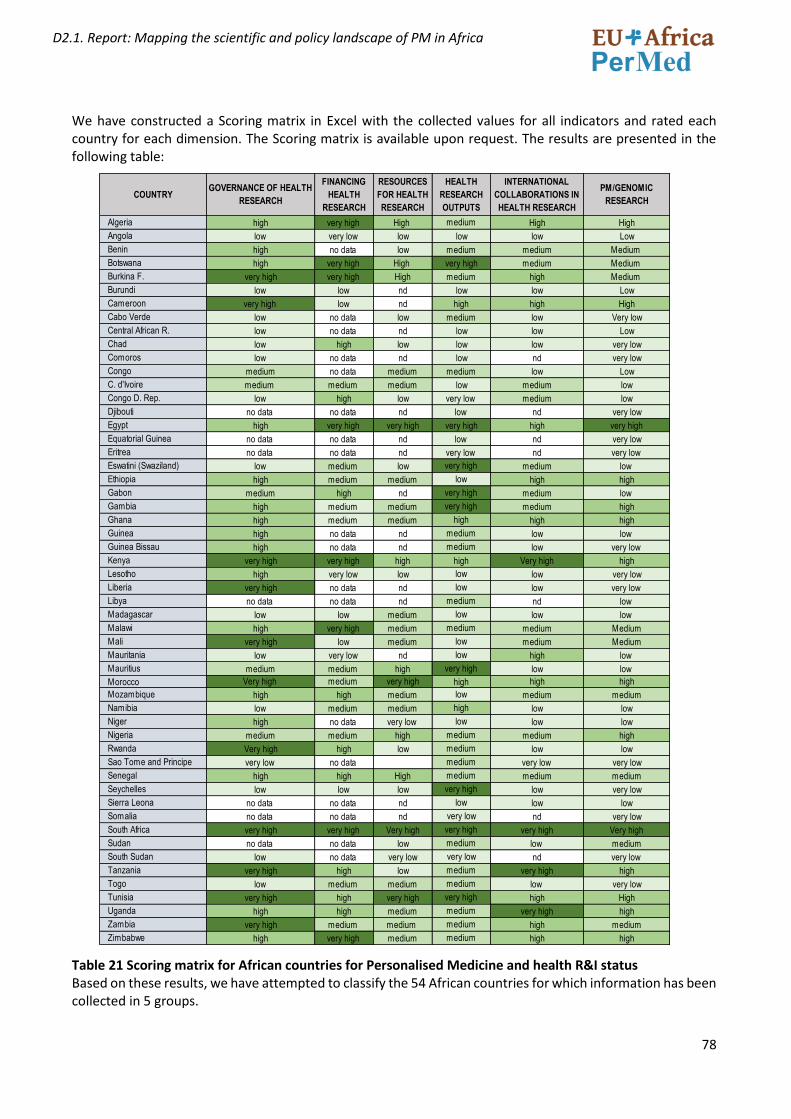
78
D2.1. Report: Mapping the scientific and policy landscape of PM in Africa
We have constructed a Scoring matrix in Excel with the collected values for all indicators and rated each country for each dimension. The Scoring matrix is available upon request. The results are presented in the following table:
Table 21 Scoring matrix for African countries for Personalised Medicine and health R&I status Based on these results, we have attempted to classify the 54 African countries for which information has been collected in 5 groups.
COUNTRYGOVERNANCE OF HEALTH
RESEARCH
FINANCING
HEALTH
RESEARCH
RESOURCES
FOR HEALTH
RESEARCH
HEALTH
RESEARCH
OUTPUTS
INTERNATIONAL
COLLABORATIONS IN
HEALTH RESEARCH
PM/GENOMIC
RESEARCH
Algeria high very high High medium High High
Angola low very low low low low Low
Benin high no data low medium medium Medium
Botswana high very high High very high medium Medium
Burkina F. very high very high High medium high Medium
Burundi low low nd low low Low
Cameroon very high low nd high high High
Cabo Verde low no data low medium low Very low
Central African R. low no data nd low low Low
Chad low high low low low very low
Comoros low no data nd low nd very low
Congo medium no data medium medium low Low
C. d'Ivoire medium medium medium low medium low
Congo D. Rep. low high low very low medium low
Djibouti no data no data nd low nd very low
Egypt high very high very high very high high very high
Equatorial Guinea no data no data nd low nd very low
Eritrea no data no data nd very low nd very low
Eswatini (Swaziland) low medium low very high medium low
Ethiopia high medium medium low high high
Gabon medium high nd very high medium low
Gambia high medium medium very high medium high
Ghana high medium medium high high high
Guinea high no data nd medium low low
Guinea Bissau high no data nd medium low very low
Kenya very high very high high high Very high high
Lesotho high very low low low low very low
Liberia very high no data nd low low very low
Libya no data no data nd medium nd low
Madagascar low low medium low low low
Malawi high very high medium medium medium Medium
Mali very high low medium low medium Medium
Mauritania low very low nd low high low
Mauritius medium medium high very high low low
Morocco Very high medium very high high high high
Mozambique high high medium low medium medium
Namibia low medium medium high low low
Niger high no data very low low low low
Nigeria medium medium high medium medium high
Rwanda Very high high low medium low low
Sao Tome and Principe very low no data medium very low very low
Senegal high high High medium medium medium
Seychelles low low low very high low very low
Sierra Leona no data no data nd low low low
Somalia no data no data nd very low nd very low
South Africa very high very high Very high very high very high Very high
Sudan no data no data low medium low medium
South Sudan low no data very low very low nd very low
Tanzania very high high low medium very high high
Togo low medium medium medium low very low
Tunisia very high high very high very high high High
Uganda high high medium medium very high high
Zambia very high medium medium medium high medium
Zimbabwe high very high medium medium high high
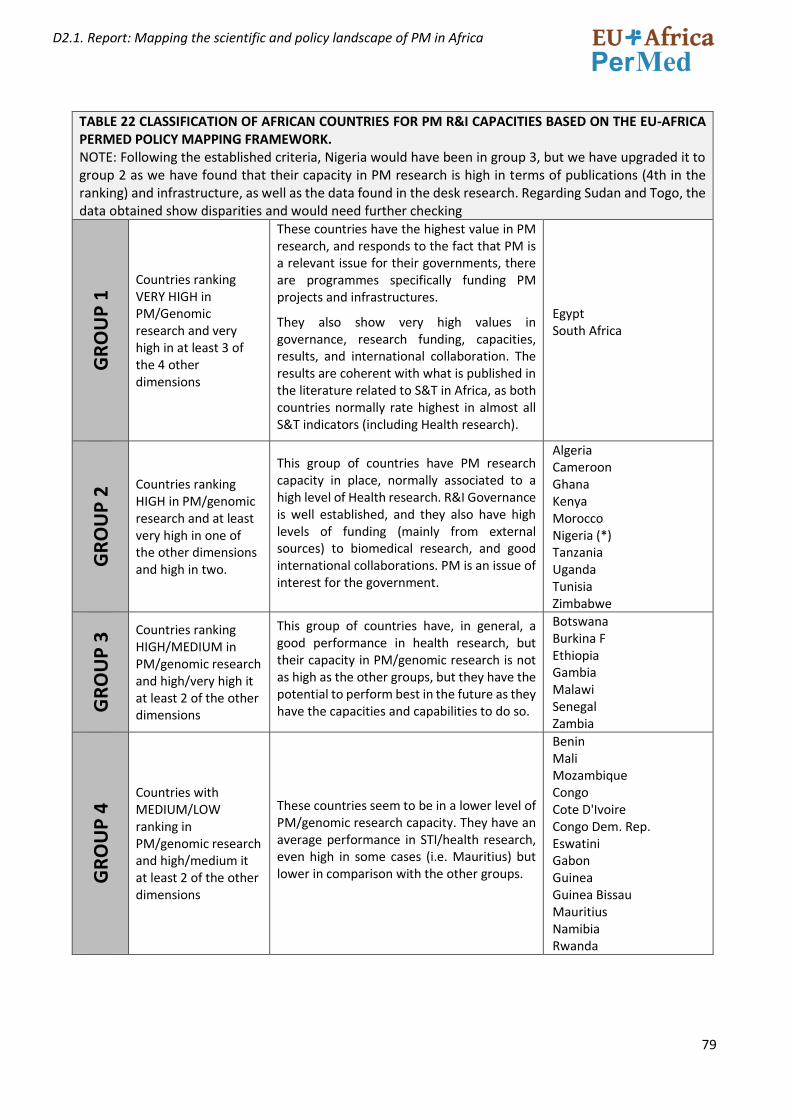
79
D2.1. Report: Mapping the scientific and policy landscape of PM in Africa
TABLE 22 CLASSIFICATION OF AFRICAN COUNTRIES FOR PM R&I CAPACITIES BASED ON THE EU-AFRICA PERMED POLICY MAPPING FRAMEWORK. NOTE: Following the established criteria, Nigeria would have been in group 3, but we have upgraded it to group 2 as we have found that their capacity in PM research is high in terms of publications (4th in the ranking) and infrastructure, as well as the data found in the desk research. Regarding Sudan and Togo, the data obtained show disparities and would need further checking
GR
OU
P 1
Countries ranking VERY HIGH in PM/Genomic research and very high in at least 3 of the 4 other dimensions
These countries have the highest value in PM research, and responds to the fact that PM is a relevant issue for their governments, there are programmes specifically funding PM projects and infrastructures.
They also show very high values in governance, research funding, capacities, results, and international collaboration. The results are coherent with what is published in the literature related to S&T in Africa, as both countries normally rate highest in almost all S&T indicators (including Health research).
Egypt South Africa
GR
OU
P 2
Countries ranking HIGH in PM/genomic research and at least very high in one of the other dimensions and high in two.
This group of countries have PM research capacity in place, normally associated to a high level of Health research. R&I Governance is well established, and they also have high levels of funding (mainly from external sources) to biomedical research, and good international collaborations. PM is an issue of interest for the government.
Algeria Cameroon Ghana Kenya Morocco Nigeria (*) Tanzania Uganda Tunisia Zimbabwe
GR
OU
P 3
Countries ranking HIGH/MEDIUM in PM/genomic research and high/very high it at least 2 of the other dimensions
This group of countries have, in general, a good performance in health research, but their capacity in PM/genomic research is not as high as the other groups, but they have the potential to perform best in the future as they have the capacities and capabilities to do so.
Botswana Burkina F Ethiopia Gambia Malawi Senegal Zambia
GR
OU
P 4
Countries with MEDIUM/LOW ranking in PM/genomic research and high/medium it at least 2 of the other dimensions
These countries seem to be in a lower level of PM/genomic research capacity. They have an average performance in STI/health research, even high in some cases (i.e. Mauritius) but lower in comparison with the other groups.
Benin Mali Mozambique Congo Cote D'Ivoire Congo Dem. Rep. Eswatini Gabon Guinea Guinea Bissau Mauritius Namibia Rwanda

80
D2.1. Report: Mapping the scientific and policy landscape of PM in Africa
GR
OU
P 5
Countries with LOW/VERY LOW in PM/genomic research and majority of low in the rest of dimensions,
This group includes countries with very low performance in PM/genomic research, but also with very low values in general for the rest of the indicators. In some cases, scoring has not been possible for some countries for which there are no data available for major STI indicators.
Two exceptions are Sudan and Togo. Sudan has rated Medium for PM, but it cannot be scored for governance and funding as there are no data and performs low in the other dimensions. Togo has rated low for PM but scores medium for financing health research, resources for health research and research outputs.
Angola Burundi Cabo Verde Central African R. Chad Comoros Djibouti Equatorial Guinea Eritrea Lesotho Liberia Libya Madagascar Mauritania Niger Sao Tome and Principe Seychelles Sierra Leona Somalia Sudan(*) Togo(*)
The distributions of countries by groups is represented in the following map.
Figure 43. Representation of the results of the PM/genomic capacities in African countries, following the policy mapping framework of EU-Africa PerMed.
81
D2.1. Report: Mapping the scientific and policy landscape of PM in Africa
2.7 MAPPING OF PERSONALISED MEDICINE RESEARCH IN AFRICAN COUNTRIES. MAIN FINDINGS FROM THE POLICY MAPPING.
A summary of the main findings of the mapping work of Personalised Medicine research activities in African countries is presented below.
• South Africa and Egypt are the two countries where we have found that PM research is a strategic objective of the Government at present, and specific actions to support R&I activities in this field and its implementation in the health system exist. As an example, the Department of Science and Technology (DST) of South Africa funds the Southern African Human Genome Programme (SAHGP), and has launched the Precision medicine initiative of the Strategic Health Innovation Partnership (SHIP), and the Bioinformatics and Functional Genomics programme. The SA Medical Research Council has a program to support research in the area of PM. In Egypt, the government has launched the Egyptian Genome Program, a national genomic project covering the whole population. Egypt also participates in the ERA PerMed initiative, funding PM research projects.
• In Northern African countries (Algeria, Morocco and Tunisia) we have also found initiatives related to PM. In 2019, the Direction Générale de la Recherche et du Développement Technologique of Algeria launched a call for projects in Cancer, with a specific action line in PM. There is a Human Molecular Genetics Unit at Morocco Pasteur Institute. Also in Morocco, a partnership between Rabat Abulcasis Health Sciences International University (UIASS) and Paris (Imagine) Institute of genetic diseases has been established to better understand genetic diseases, bringing diagnostic, and therapeutic solutions to Moroccan patients and their families .A laboratory of genetic engineering will be created at Fes Euro-mediterraneenne University. A framework agreement was signed between Dassault systems and the ministry of the Higher Education. Projet pilote « Biobanque en cancérologie » 2019 -2021. Genome Tunisia: Ministry of Health of Tunisia is funding health research towards the implementation of Precision medicine in Tunisia and in North Africa mainly with the new project 100% funded by the Ministry of Health ( 10 M$).
• In Sub-Saharan countries, except for South Africa, we have not found research programmes specifically supporting research in PM in the countries. The most important programme funding PM research is the H3Africa initiative, which is Pan-African and coordinated by the AAS. Through this programme, important population genomic studies are taking place in several countries, capacity building actions are also carried out on relevant issues such as Ethics and legal aspects of genomic research, as is support to biobanks and bioinformatic activities, all relevant for the development of PM in Africa.
• In Gambia, The UK MRC Unit in The Gambia is an important health research infrastructure with capacity for genomic/genetic analysis (Study of Human genetic factors that determine resistance and susceptibility to malaria, tuberculosis, Trachoma and other important infectious diseases. It is a relevant partner in international research collaborations.
• Much of the health research in Africa is carried out through international collaborations and funding from international donors, and this includes PM related research. In this regards, French speaking African countries have strong links with Europe, specially France, and The Institut Pasteur International Network is an important health research infrastructure, with 10 centers In Africa: Morocco, Algeria, Tunisia, Senegal, Guinea, Ivory Coast, Cameroon, Niger, Central African Republic and Madagascar.
• English speaking countries, have strong collaboration with the UK, though organizations such as the UK MRC and the Wellcome trust. As an example, Mount Kenya University is collaborating with the Univ. of Edinburgh in a 4-year research project on Precision medicine for early diagnosis of breast cancer, funded by MRC-UK.
• Ghana hosts the West African Centre for cell biology of infectious pathogens / West African genetic Medicine Centre (WAGMC) and the African center of Excellence for Genetic Medicine (College of health
82
D2.1. Report: Mapping the scientific and policy landscape of PM in Africa
sciences, Univ. Of Ghana). Ghana also participates in the African Neurobiobank for Precision stroke Medicine Biobank in collaboration with Nigeria.
• The Nigerian Institute of Human Virology is an important research center participating in international research collaborations in genomic/genetic. The country has a Policy Statement on Storage of Human Samples in Biobanks and Biorepositories in Nigeria (2013). The African Centre of Excellence for Genomics of Infectious Diseases (ACEGID) is located in Ede, South West Nigeria.
• Uganda has a Pathogen Genomics Phenotype and Immunity Programme at the Medical Research Council Uganda and Uganda Virus Research Institute. Dr Segun Fatumo leads the African Computational Genomics (TACG) Research group at the Medical Research Council/Uganda Virus Research Institute (MRC/UVRI) & London School of Hygiene & Tropical Medicine (LSHTM) Uganda Research Unit, in Entebbe, Uganda.
• In Zimbabwe, the Ministry of Higher and Tertiary Education has listed Genomics as a strategic area of research to improve human health and has made significant investment in technology platforms to do so (i.e. the Ion Torrent Genexus NGS platform). It has also partnered with the African Institute of Biomedical Science and Technology to implement this program. The government has established the National Biobank and Genomics Laboratory to support Genomic Medicine Research and services.
• The IBRH3AU Biorepository44 is an Integrated Biorepository under the H3Africa Biorepository Initiative located at Makerere University College of Health Sciences (MakCHS), Uganda, a Center of Academic Excellence, Health Care and Collaborative Research. Over the course of six years, the Integrated Biorepository of H3Africa Uganda will collect, process and store over 400,000 highly valuable samples annotated with relevant clinical information and distribute them to qualified researchers working in the field of genetics/genomics in Africa and beyond. This resource is utilized by communicable and non-communicable disease researchers in an African population.
• 22 countries in SSA Africa have regulations for health research, including guidelines for research ethics committees and good clinical practices (de Vries, J., et al. 2017. Of these, we have found specific national guidelines on genomic research or biobanks in only four countries: Gambia (Guidelines of the National DNA Bank (2001)), Malawi (Procedures and Guidelines for Access and Collection of Genetic Resources in Malawi (2002), Nigeria (Policy Statement on Storage of Human Samples in Biobanks and Biorepositories in Nigeria (2013) and South Africa (Guidelines on Ethics in Reproductive Biology and Genetic Research (2002). (Data from International Compilation of Human Research Standards 2020 Edition).
• An interesting case is Zambia. Although the Health Research Act (HRA 2013) is a comprehensive law that aims to afford protections for the Zambian population, there are two components of this Act that challenge the conduct of genomics research in Zambia (Chanda-Kapata et al., 2015). The first is a requirement that no biological materials may be collected for ‘future unspecified health research’ (HRA Section 47(1)) – effectively prohibiting the use of blanket, broad or tiered consent (although exactly what counts as ‘unspecified' could be debated). The second relates to tight regulations around the storage, export, and re-use of tissue samples. For instance, biological materials may not be stored for ‘unspecified storage' (HRA Section 47(1)) and may only be exported under strict conditions. (ref: Mweemba O. et al 2020)
• There are interesting examples of cross-country collaboration in genomics research. The Collaborative African Genomics Network (CAfGEN) aims to establish sustainable genomics research programs in Botswana and Uganda. The African Neurobiobank for Precision Stroke Medicine Biobank, a collaboration of Ghana and Nigeria.
44 https://www.ibru.mak.ac.ug/
83
D2.1. Report: Mapping the scientific and policy landscape of PM in Africa
• Nigeria (22), South Africa (21), Uganda (16), Kenya (15), Ethiopia (12) and Ghana (11) are the countries that have the highest number of research organizations receiving international donor’s funding for genomic/genetic research (Data from World RePORT, August 2021).
• We have found that research organizations from most African countries participate in Genomic/Genetic International research networks such as MalariaGEN (funded by The Wellcome Trust) and H3Africa (Funded by the NIH).
• There is a group of African countries that are not participating in genomic consortium, do not have Institutions with NGS capacity, have not received international funds for genomic/genetic research and we have not found any reference to PM in our desk review. This group includes Burundi, Cabo Verde, Chad, Comoros, Djibouti, Guinea Bissau, Lesotho, Liberia, Lybia, Sao Tome and Principe, Somalia; South Sudan and Togo. All of these countries rate very low in health research governance, funding, resources, outputs and international collaboration.
• An example of real implementation of PM in the health system is Botswana: A recent change in the HIV management policy in Botswana where the country opted out of efavirenz-based therapies as first-line anti-retroviral therapy (ART), in favour of dolutegravir (in 2016). Genomics studies had showed that about 13.5% of the Botswana population are unable to effectively metabolize efavirenz-based therapies https://www.ncbi.nlm.nih.gov/pmc/articles/PMC6152488/
• The African Institute of Biomedical Science and Technology45, AiBST funded in 2002 in Harare, Zimbabwe, is a research and education institute with the mission to discover, develop and deploy innovative healthcare solutions for Africa. It is an important reference African centre in the fields of Genomic and Pharmaceutical Medicine, Forensic Science and Molecular Diagnostics. It has a MSc programme on Genomic and Precision medicine funded by the EDCTP2 programme.
45 http://aibst.com/about-us/
84
D2.1. Report: Mapping the scientific and policy landscape of PM in Africa
REFERENCES
• AAS (2018): Africa beyond 2030: leveraging knowledge and innovation to secure sustainable development goals, Edit. Evelyn Namubiru-Mwaura, and Elizabeth Marincola. Published by the African Academy of Science. https://www.aasciences.africa/sites/default/files/inline-files/Africa%20Beyond%202030.pdf
• ACBF (2017). Africa Capacity Report 2017: Building Capacity in Science, Technology, and Innovation for Africa’s Transformation. Harare. The African Capacity Building Foundation ACBF.
• Adam T, Akuffo H, Carter JG, Charat Z, Cheetham MJ, Crisafulli A, Danielson CM, Gunning J, Haugen B, Jajkowicz D, Kay S, Kilmarx PH, López JM, Olesen OF, Peñas-Jiménez I, Tesfagiorgis K, Wallick SK, Glass RI. (2020) World RePORT: a database for mapping biomedical research funding. Lancet Glob Health. 2020 Jan;8(1):e27-e29. doi: 10.1016/S2214-109X(19)30459-0. PMID: 31839135.https://www.sciencedirect.com/science/article/pii/S2214109X19304590)
• AESA & Bill and Melinda Gates Foundation - Roundtable Discussion: Precision Public Health in Africa. October 7th 2016, Sheraton, Addis Ababa, Ethiopia
• African Union (2019) CONTEXTUALISING STISA-2024. Africa's STI Implementation Report 2014 – 2019. third ordinary session for the specialized technical committee on education, science and technology (STC-EST) 10th to 12th December 2019, Addis Ababa, Ethiopia. https://au.int/sites/default/files/newsevents/workingdocuments/37841-wd-stisa-2024_report_en.pdf
• Aidam, J., Sombié, I. (2016) The West African Health Organization’s experience in improving the health research environment in the ECOWAS region. Health Res Policy Sys 14, 30 (2016). https://doi.org/10.1186/s12961-016-0102-7
• Akinyemi, R. O., Owolabi, M. O., Oyeniyi, T., Ovbiagele, B., Arnett, D. K., Tiwari, H. K., Walker, R., Ogunniyi, A., Kalaria, R. N., & SIREN group of H3Africa Consortium (2016). Neurogenomics in Africa: Perspectives, progress, possibilities and priorities. Journal of the neurological sciences, 366, 213–223. https://doi.org/10.1016/j.jns.2016.05.006
• Anaya JM, Duarte-Rey C, Sarmiento-Monroy JC, Bardey D, Castiblanco J, Rojas-Villarraga A. Personalized medicine. Closing the gap between knowledge and clinical practice. Autoimmun Rev. 2016 Aug;15(8):833-42. doi: 10.1016/j.autrev.2016.06.005. Epub 2016 Jun 11. PMID: 27302209.
• AOSTI-SPRU (2018): Policy Brief Evaluating Public Policies in Africa: insights from the Science, Technology, and Innovation Strategy for Africa, (STISA-2024).; December 2018. https://blogs.sussex.ac.uk/policy-engagement/files/2019/02/2018-12-STISA-PB-Chux-Daniels.pdf
• Asamani, J.A., Nabyonga-Orem, J. Knowledge translation in Africa: are the structures in place?. Implement Sci Commun 1, 111 (2020). https://doi.org/10.1186/s43058-020-00101-w
• ASP Brief (August 2020): Delivering on Africa’s Most Needed Scientific Priorities. AAS, AESA, AUDA-NEPAD. https://www.aasciences.africa/publications/delivering-africas-most-needed-scientific-priorities
• ASP Policy Paper 1 (2020) A Framework for the Implementation of Genomic Medicine for Public Health in Africa. 8 February 2021. AAS, AESA, AUDA-NEPAD. https://www.aasciences.africa/sites/default/files/Publications/A%20Framework%20for%20the%20Implementation%20of%20Genomic%20Medicine%20for%20Public%20Health%20in%20Africa.pdf
• AUDA-NEPAD (2019) African Innovation Outlook 2019, AUDA-NEPAD, Johannesburg. https://au.int/en/documents/20200213/african-innovation-outlook-iii
• AUDA-NEPAD (2019) Health Research and Innovation Strategy for Africa (HRISA): 2018-2030
• Calestous J. and Serageldin I. (2016) "Rebooting African Development: Science, Technology and Innovation Strategy for Africa," Science, Technology, and Globalization Project Report, July 2016. https://www.belfercenter.org/sites/default/files/files/publication/RebootingAfricaFinal.pdf
85
D2.1. Report: Mapping the scientific and policy landscape of PM in Africa
• Arvanitis R. & Mouton J., (2019): Observing and Funding African Research”, Working Paper du Ceped, n°43, Ceped (UMR 196 Université Paris Descartes IRD), Paris, September 2019. DOI: 10.5281/zenodo.3403895. Available at https://www.ceped.org/wp
• Chanda-Kapata, P., Kapata, N., Moraes, A. N., Chongwe, G., & Munthali, J. (2015). Genomic research in Zambia: confronting the ethics, policy and regulatory frontiers in the 21st Century. Health research policy and systems, 13, 60. https://doi.org/10.1186/s12961-015-0053-4
• Chapman, N., Doubell, A., Oversteegen, L., Chowdhary, V., Rugarabamu, G., Zanetti, R., Ong, M., Borri, J., 2017. Neglected disease research and development: reflecting on a decade of global investment. Policy Cures research, G-7 Finder, 2017. https://www.ghtcoalition.org/pdf/G-FINDER_full_report_GHTC.pdf
• Chataway J., Dobson C., Daniels C., Byrne R., Hanlin R., Tigabu A (2019): Science granting councils in Sub-Saharan Africa: Trends and tensions, Science and Public Policy, Volume 46, Issue 4, August 2019, Pages 620–631, https://doi.org/10.1093/scipol/scz007
• Coles, E., & Mensah, G. A. (2017). Geography of Genetics and Genomics Research Funding in Africa. Global heart, 12(2), 173–176. https://doi.org/10.1016/j.gheart.2017.07.001
• Confraria H., Wang L. (2020) Medical research versus disease burden in Africa. Res. Pol. 2020;49(3):103916.
• Confraria, H., Godinho, M.M. (2015) The impact of African science: a bibliometric analysis. Scientometrics 102, 1241–1268, 2015. https://doi.org/10.1007/s11192-014-1463-8
• Dandara, C., Masimirembwa, C., Haffani, Y. Z., Ogutu, B., Mabuka, J., Aklillu, E., Bolaji, O., & H3Africa (2019). African Pharmacogenomics Consortium: Consolidating pharmacogenomics knowledge, capacity development and translation in Africa: Consolidating pharmacogenomics knowledge, capacity development and translation in Africa. AAS open research, 2, 19. https://doi.org/10.12688/aasopenres.12965.1
• de Vries, J., Munung, S.N., Matimba, A.et al (2017). Regulation of genomic and biobanking research in Africa: a content analysis of ethics guidelines, policies and procedures from 22 African countries. BMC Med Ethics18,8 . https://doi.org/10.1186/s12910-016-0165-6
• EAHRC (2018). Policy Brief: Innovative Domestic Financing for Health Research in the East African Community: A baseline assessment and road map towards a sustainable health research and development. Arusha, Tanzania: The East Africa Health Research Commission EAHRC.
• EDCTP (2018): EDCTP High-level meeting with African policymakers Engaging African governments to strengthen national health research systems with complementary international cooperation. 68th session of the WHO AFRO Regional Committee meeting Side event • 30 August 2018 • Dakar, Senegal http://www.edctp.org/web/app/uploads/2018/11/High-Level-Meeting-Dakar-Senegal-30-August-2018-Engaging-African-governments-to-strengthen-national-health-research-systems.pdf
• Institute for Scientific Information (ISI)™ (2021) The changing research landscape of the Middle East, North Africa and Turkey. Published by Clarivate https://clarivate.com/webofsciencegroup/campaigns/the-changing-research-landscape-of-the-middle-east-north-africa-and-turkey/?campaignname=ISI_GRR2_MENA_Report_SAR_EM_2021&campaignid=7014N000001r&utm_campaign=ISI_GRR2_MENA_Report_SAR_EM_2021&utm_source=blog&utm_medium=press
• Inzaule SC, Tessema SK, Kebede Y, Ogwell Ouma AE, Nkengasong JN. (2021). Genomic-informed pathogen surveillance in Africa: opportunities and challenges. Lancet Infect Dis. 2021 Feb 12:S1473-3099(20)30939-7. doi: 10.1016/S1473-3099(20)30939-7. Epub ahead of print. PMID: 33587898; PMCID: PMC7906676.
• Jones C.M. et al. 2021. Strengthening national health research systems in Africa: lessons and insights from across the continent. London: LSE Health. DOI: https://doi.org/10.6084/m9.figshare.14039807
86
D2.1. Report: Mapping the scientific and policy landscape of PM in Africa
• Kirigia, J.M., Ota, M.O., Motari, M. et al. National health research systems in the WHO African Region: current status and the way forward. Health Res Policy Sys 13, 61 (2015). https://doi.org/10.1186/s12961-015-0054-3. https://health-policy-systems.biomedcentral.com/articles/10.1186/s12961-015-0054-3
• Kirigia, J.M., Ota, M.O., Senkubuge, F.et al (2016) Developing the African national health research systems barometer. Health Res Policy Sys 14, 53. https://doi.org/10.1186/s12961-016-0121-4
• Kozma C., Calero Medina C and Rodrigo Costas R. (2018) Research funding landscapes in Africa, book chapter in The Next Generation of Scientists, By Catherine Beaudry, Johann Mouton & Heidi Prozesky. Published by African Minds, 2018. ISBN 978-1-928331-93-3. https://www.africanminds.co.za/the-next-generation-of-scientists/
• Mouton, J. Gaillard, J., and van Lill, M. (2015) Functions of Science Granting Councils in Sub-Saharan Africa’, in N. Cloete, P. Maassen, and T. Bailey (eds) Knowledge Production and Contradictory Functions in African Higher Education 1, pp. 148. Cape Town: African Minds. https://books.openedition.org/irdeditions/32897?lang=en
• Mugabe, J.; Kulohoma, B. W.; Matoke-Muhia, D.; Ubalijoro, E.; Fagbamigbe, F.A.; Mwaura, G.; Gitaka, J.; Thorn, J. P. R.; Badu, K.; Muchie, M.; Dukhi, N.; Ndung’u, T.; Muposhi, V. K. Bouhaouala-Zahar, B.; Sogbanmu, T. (2020) Securing Africa’s Health Sovereignty: Why Investing in Science and Innovation Matters. AAS Working Paper. Nairobi: August 2020.
• Mugwagwa J., Banda G.; Ozor N.; Bolo M. And Oriama R. (2020) New Approaches for Funding Research and Innovation in Africa – A policy brief. Published by the African Technology Policy Studies Network
• Mweemba O, Musuku J, Matenga TFL et al. Policy makers, regulators and researchers’ perspectives on genomics research and the capacity of the National Health Research Act of 2013 to regulate genomics research in Zambia [version 1; peer review: 2 approved with reservations]. AAS Open Res 2020, 3:32 (https://doi.org/10.12688/aasopenres.13092.1)
• Nabyonga-Orem, J., Asamani, J.A. & Makanga, M. (2021) The state of health research governance in Africa: what do we know and how can we improve?. Health Res Policy Sys 19, 11 https://doi.org/10.1186/s12961-020-00676-9
• Nwaka, Solo. (2017). Building scientific and innovation capacity to tackle Africa's health challenges. https://www.researchgate.net/publication/319956910_Building_scientific_and_innovation_capacity_to_tackle_Africa's_health_challenges
• Omange, R. W., Ocholla, A. O., Kwallah, A. O., Kageha, S. N., Mwangi, J., Cherutich, R. K., T A, O., Nzomo, T., Angwenyi, S., Yonga, P., Kariuki, F., Kyalo, M., Mutai, P. C., Nindo, F., & Songok, E. M. (2016). MEETING REPORT: UNESCO-MERCK AFRICA RESEARCH SUMMIT 2015- ACCELERATING ACCESS AND SUSTAINING INNOVATION 'FROM AFRICA FOR AFRICA'. African journal of infectious diseases, 11(1), 26–43. https://doi.org/10.4314/ajid.v11i1.4537
• Ong, M., Borri, J., 2017. Negl
• Pang T., Sadana R., Hanney S., Bhutta Z. Hyder A, Adnan A. et al. (2003). Knowledge for better health: a conceptual framework and foundation for health research systems / Tikki Pang ... [et al.]. Bulletin of the World Health Organization : the International Journal of Public Health 2003 ; 81(11) :815-820 https://apps.who.int/iris/handle/10665/72104
• PATH (2015) Research and Development for Health in Kenya and South Africa: Landscape Analyses Executive Summaries https://www.path.org/resources/research-and-development-for-health-in-kenya-and-south-africa-landscape-analyses-executive-summaries/
• Radwan A (2018): Science and innovation policies in North African Countries: Exploring challenges and opportunities. Entrepreneurship and Sustainability Issues, Entrepreneurship and Sustainability Center, 2018, 6 (1), pp.268-282. 0.9770/jesi.2018.6.1(17) hal-02121204
• Rusakaniko, S., Makanga, M., Ota, M.O. et al. (2019). Strengthening national health research systems in the WHO African Region – progress towards universal health coverage. Global Health 15, 50.
87
D2.1. Report: Mapping the scientific and policy landscape of PM in Africa
https://doi.org/10.1186/s12992-019-0492-8. https://globalizationandhealth.biomedcentral.com/articles/10.1186/s12992-019-0492-8#citeas
• Simpkin V, Namubiru-Mwaura E, Clarke L, et al. (2018): Investing in health R&D where we are, what limits us, and how to make progress in Africa. BMJ Glob Health 2019;4:e001047. doi:10.1136/ bmjgh-2018-001047. https://gh.bmj.com/content/4/2/e001047
• UNECA (2016) Africa’s science, technology and innovation policies, national, regional and continental. Chapter from Assessing Regional Integration in Africa VII, pp 83-104, April 2016. DOI: https://doi.org/10.18356/688014e0-en
• UNECA(2016) Assessing Regional Integration in Africa VII. Innovation, Competitiveness and Regional Integration, Chapter 5: Africa’s Science, Technology and Innovation Policies—National, Regional and Continental. United Nations Economic Commission for Africa - United Nations; English ed. (21 Abril 2016)
• UNESCO (2014) Mapping Research and Innovation in the Republic of Zimbabwe. G. A. Lemarchand and S. Schneegans, eds. GO SPIN Country Profiles in Science, Technology and Innovation Policy, vol. 2. United Nations Educational, Scientific and Cultural Organization: Paris.
• UNESCO (2021) UNESCO Science Report: The Race Against Time for Smarter Development. S. Schneegans, T. Straza and J. Lewis (eds). UNESCO Publishing: Paris. https://www.unesco.org/reports/science/2021/en/race4smarter-development
• Uthman OA, Wiysonge CS, Ota MO, et al. (2015): Increasing the value of health research in the WHO African Region beyond 2015—reflecting on the past, celebrating the present and building the future: a bibliometric analysis BMJ Open 2015;5:e006340. doi: 10.1136/bmjopen-2014-006340. https://bmjopen.bmj.com/content/5/3/e006340
• Wenham C., Wouters O. Jones CM., Mijumbi RM., Juma PA., Sobngwi-Tambeku JL, Parkhurst J. (2021) Measuring Health Sciences Research Capacity in Africa: Mapping The Available Data. Health Research Policy and Systems. Preprint DOI: 10.21203/rs.3.rs-321693/v1
• WHO Africa (2018) 68th session of the WHO AFRO Regional Committee meeting Side event • 30 August 2018 • Dakar, Senegal. http://www.edctp.org/web/app/uploads/2018/11/High-Level-Meeting-Dakar-Senegal-30-August-2018-Engaging-African-governments-to-strengthen-national-health-research-systems.pdf
• WHO African Region, the National Institute for Health Research (NIHR) Global Health Research Unit Tackling Infection to Benefit Africa (TIBA) and EDCTP (2018) Assessing National Health Research Systems in the WHO African Region. Report. http://www.edctp.org/publication/assessing-national-health-research-systems-african-region-2018/
• Wonkam A, Mayosi BM. (2014): Genomic medicine in Africa: promise, problems and prospects. Genome Med. 2014;6(2):11. Published 2014 Feb 24. doi:10.1186/gm528. https://genomemedicine.biomedcentral.com/articles/10.1186/gm528
• World Bank (2017). Research and development expenditure (% GDP). Washington DC. World Bank 2017.
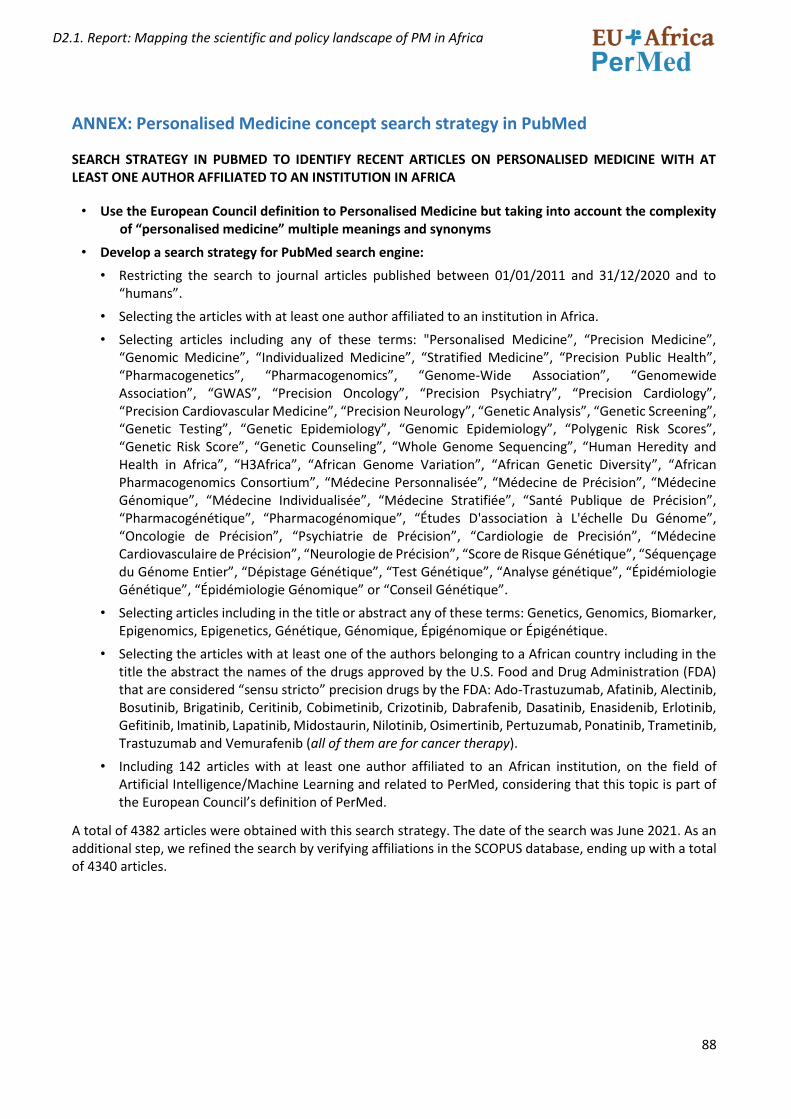
88
D2.1. Report: Mapping the scientific and policy landscape of PM in Africa
ANNEX: Personalised Medicine concept search strategy in PubMed
SEARCH STRATEGY IN PUBMED TO IDENTIFY RECENT ARTICLES ON PERSONALISED MEDICINE WITH AT LEAST ONE AUTHOR AFFILIATED TO AN INSTITUTION IN AFRICA
• Use the European Council definition to Personalised Medicine but taking into account the complexity of “personalised medicine” multiple meanings and synonyms
• Develop a search strategy for PubMed search engine:
• Restricting the search to journal articles published between 01/01/2011 and 31/12/2020 and to “humans”.
• Selecting the articles with at least one author affiliated to an institution in Africa.
• Selecting articles including any of these terms: "Personalised Medicine”, “Precision Medicine”, “Genomic Medicine”, “Individualized Medicine”, “Stratified Medicine”, “Precision Public Health”, “Pharmacogenetics”, “Pharmacogenomics”, “Genome-Wide Association”, “Genomewide Association”, “GWAS”, “Precision Oncology”, “Precision Psychiatry”, “Precision Cardiology”, “Precision Cardiovascular Medicine”, “Precision Neurology”, “Genetic Analysis”, “Genetic Screening”, “Genetic Testing”, “Genetic Epidemiology”, “Genomic Epidemiology”, “Polygenic Risk Scores”, “Genetic Risk Score”, “Genetic Counseling”, “Whole Genome Sequencing”, “Human Heredity and Health in Africa”, “H3Africa”, “African Genome Variation”, “African Genetic Diversity”, “African Pharmacogenomics Consortium”, “Médecine Personnalisée”, “Médecine de Précision”, “Médecine Génomique”, “Médecine Individualisée”, “Médecine Stratifiée”, “Santé Publique de Précision”, “Pharmacogénétique”, “Pharmacogénomique”, “Études D'association à L'échelle Du Génome”, “Oncologie de Précision”, “Psychiatrie de Précision”, “Cardiologie de Precisión”, “Médecine Cardiovasculaire de Précision”, “Neurologie de Précision”, “Score de Risque Génétique”, “Séquençage du Génome Entier”, “Dépistage Génétique”, “Test Génétique”, “Analyse génétique”, “Épidémiologie Génétique”, “Épidémiologie Génomique” or “Conseil Génétique”.
• Selecting articles including in the title or abstract any of these terms: Genetics, Genomics, Biomarker, Epigenomics, Epigenetics, Génétique, Génomique, Épigénomique or Épigénétique.
• Selecting the articles with at least one of the authors belonging to a African country including in the title the abstract the names of the drugs approved by the U.S. Food and Drug Administration (FDA) that are considered “sensu stricto” precision drugs by the FDA: Ado-Trastuzumab, Afatinib, Alectinib, Bosutinib, Brigatinib, Ceritinib, Cobimetinib, Crizotinib, Dabrafenib, Dasatinib, Enasidenib, Erlotinib, Gefitinib, Imatinib, Lapatinib, Midostaurin, Nilotinib, Osimertinib, Pertuzumab, Ponatinib, Trametinib, Trastuzumab and Vemurafenib (all of them are for cancer therapy).
• Including 142 articles with at least one author affiliated to an African institution, on the field of Artificial Intelligence/Machine Learning and related to PerMed, considering that this topic is part of the European Council’s definition of PerMed.
A total of 4382 articles were obtained with this search strategy. The date of the search was June 2021. As an additional step, we refined the search by verifying affiliations in the SCOPUS database, ending up with a total of 4340 articles.
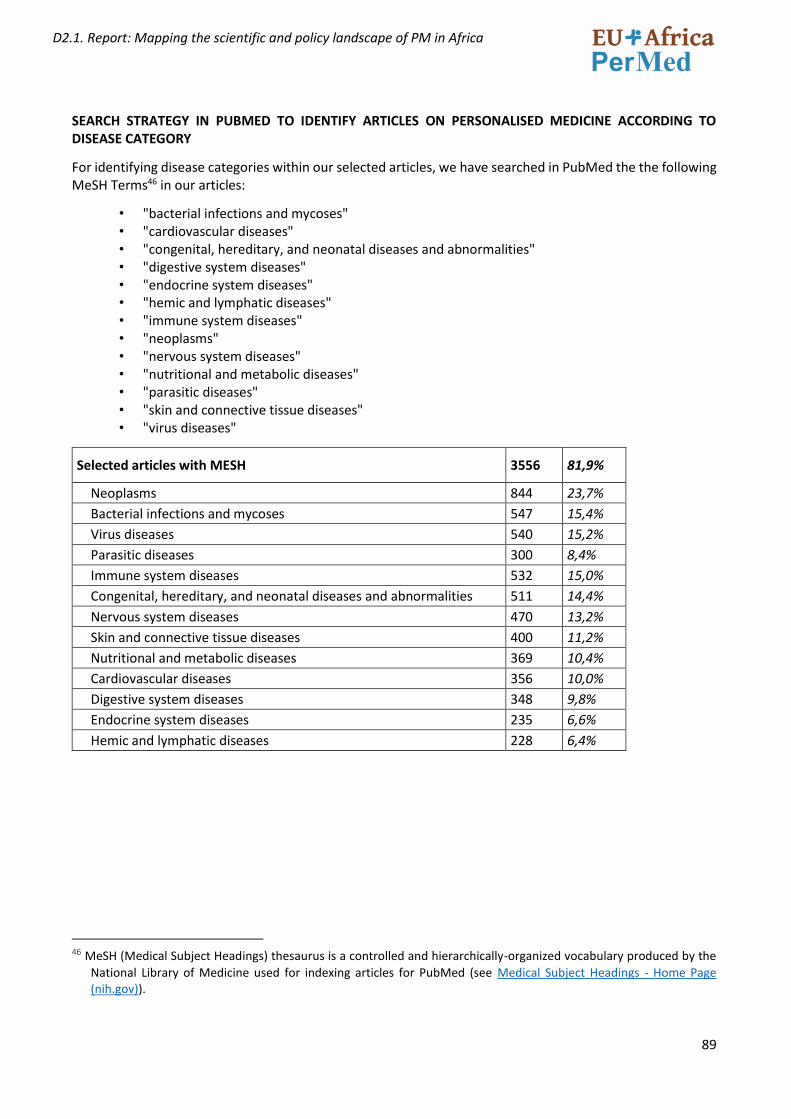
89
D2.1. Report: Mapping the scientific and policy landscape of PM in Africa
SEARCH STRATEGY IN PUBMED TO IDENTIFY ARTICLES ON PERSONALISED MEDICINE ACCORDING TO DISEASE CATEGORY
For identifying disease categories within our selected articles, we have searched in PubMed the the following MeSH Terms46 in our articles:
• "bacterial infections and mycoses" • "cardiovascular diseases" • "congenital, hereditary, and neonatal diseases and abnormalities" • "digestive system diseases" • "endocrine system diseases" • "hemic and lymphatic diseases" • "immune system diseases" • "neoplasms" • "nervous system diseases" • "nutritional and metabolic diseases" • "parasitic diseases" • "skin and connective tissue diseases" • "virus diseases"
Selected articles with MESH 3556 81,9%
Neoplasms 844 23,7%
Bacterial infections and mycoses 547 15,4%
Virus diseases 540 15,2%
Parasitic diseases 300 8,4%
Immune system diseases 532 15,0%
Congenital, hereditary, and neonatal diseases and abnormalities 511 14,4%
Nervous system diseases 470 13,2%
Skin and connective tissue diseases 400 11,2%
Nutritional and metabolic diseases 369 10,4%
Cardiovascular diseases 356 10,0%
Digestive system diseases 348 9,8%
Endocrine system diseases 235 6,6%
Hemic and lymphatic diseases 228 6,4%
46 MeSH (Medical Subject Headings) thesaurus is a controlled and hierarchically-organized vocabulary produced by the
National Library of Medicine used for indexing articles for PubMed (see Medical Subject Headings - Home Page (nih.gov)).
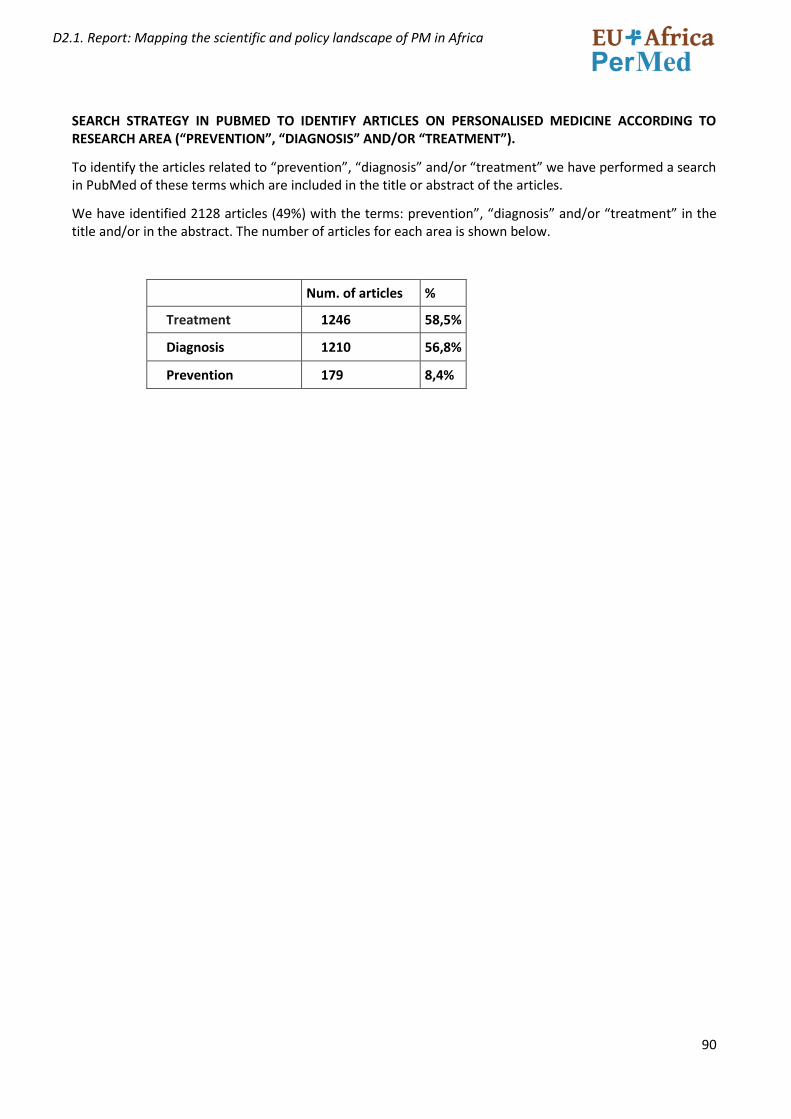
90
D2.1. Report: Mapping the scientific and policy landscape of PM in Africa
SEARCH STRATEGY IN PUBMED TO IDENTIFY ARTICLES ON PERSONALISED MEDICINE ACCORDING TO RESEARCH AREA (“PREVENTION”, “DIAGNOSIS” AND/OR “TREATMENT”).
To identify the articles related to “prevention”, “diagnosis” and/or “treatment” we have performed a search in PubMed of these terms which are included in the title or abstract of the articles.
We have identified 2128 articles (49%) with the terms: prevention”, “diagnosis” and/or “treatment” in the title and/or in the abstract. The number of articles for each area is shown below.
Num. of articles %
Treatment 1246 58,5%
Diagnosis 1210 56,8%
Prevention 179 8,4%