Embed Size (px)
Citation preview
water
Article
Quality Assessment of Bottled and Unbottled Drinking Waterin Bangladesh
Md. Ripaj Uddin 1, Mayeen Uddin Khandaker 2,* , Md. Jainal Abedin 3 , Nahida Akter 4,AHM Shofiul Islam Molla Jamal 1 , Rokaia Sultana 1, Shahnaz Sultana 1 , Mehedi Hasan 1, Hamid Osman 5 ,Basem H. Elesawy 6, M. I. Sayyed 7,8 and A. Sulieman 9
Citation: Uddin, M.R.; Khandaker,
M.U.; Abedin, M.J.; Akter, N.; Molla
Jamal, A.S.I.; Sultana, R.; Sultana, S.;
Hasan, M.; Osman, H.; Elesawy, B.H.;
et al. Quality Assessment of Bottled
and Unbottled Drinking Water in
Bangladesh. Water 2021, 13, 2026.
https://doi.org/10.3390/w13152026
Academic Editor: Sheldon Masters
Received: 11 June 2021
Accepted: 22 July 2021
Published: 24 July 2021
Publisher’s Note: MDPI stays neutral
with regard to jurisdictional claims in
published maps and institutional affil-
iations.
Copyright: © 2021 by the authors.
Licensee MDPI, Basel, Switzerland.
This article is an open access article
distributed under the terms and
conditions of the Creative Commons
Attribution (CC BY) license (https://
creativecommons.org/licenses/by/
4.0/).
1 Institute of National Analytical Research and Service (INARS), Bangladesh Council of Scientific andIndustrial Research (BCSIR), Dhanmondi, Dhaka 1205, Bangladesh; [email protected] (M.R.U.);[email protected] (A.S.I.M.J.); [email protected] (R.S.);[email protected] (S.S.); [email protected] (M.H.)
2 Centre for Applied Physics and Radiation Technologies, School of Engineering and Technology,Sunway University, Bandar Sunway, Subang Jaya 47500, Selangor, Malaysia
3 Faculty of Public Health, Thammasat University, Bangkok 10200, Thailand; [email protected] Institute of Marine Fisheries Technology, University of Chittagong, Chittagong 4331, Bangladesh;
[email protected] Department of Radiology, College of Applied Medical Sciences, Taif University, Taif 21944, Saudi Arabia;
[email protected] Department of Pathology, College of Medicine, Taif University, P.O. Box 11099, Taif 21944, Saudi Arabia;
[email protected] Department of physics, Faculty of Science, Isra University, Amman 11622, Jordan;
[email protected] Department of Nuclear Medicine Research, Institute for Research and Medical Consultations, Imam
Abdulrahman bin Faisal University, Dammam 31441, Saudi Arabia9 Department of Radiology and Medical Imaging, College of Applied Medical Sciences, Prince Sattam Bin
Abdulaziz University, P.O. Box 422, Alkharj 11942, Saudi Arabia; [email protected]* Correspondence: [email protected]
Abstract: The demand for bottled drinking water in Bangladesh is becoming popular due to the lackof safe drinking water sources. The present study was carried out to assess the water quality andpublic health impacts of local brands of bottled drinking water and tube-well water, compared to theimported ones. Several state-of-the-art techniques were employed to determine the contents of pH,EC, salinity, chloride, nitrates, nitrites, fluoride, sulfates, phosphates, bicarbonate, turbidity, color,total hardness, and total dissolved solids in the studied water samples. The measured data showthat the level of dissolved minerals in the local branded bottled water is very low (with an exceptionfor sample codes D1 and D8), while imported brands, Zamzam water, and tube-well water containsatisfactory level of minerals and fulfill Dietary Reference Intake requirements. Total coliform, fecalcoliform, and E. coli were found to be absent in local brands of bottled water and tube-well water.On the other hand, concentrations of some radionuclides 40K, 238U, 226Ra, 210Pb, 210Po, 222Rn, 137Cs,and 232Th in local bottled water and tube-well water were found to be less than the permissible levelgiven by WHO (2011). The results reveal that local bottled drinking water manufacturing companiesmay not be following standard guidelines and quality control steps properly. Thus, improvement intheir standard operating process is urgently needed to ensure strict compliance with guidelines setby Bangladesh standards and testing institutions.
Keywords: bottled and unbottled water; physico-chemical analysis; microbial analysis; elementalanalysis; water quality; dietary reference intake
1. Introduction
Water as a universal solvent is essential for the survival and basic needs of life. Itshould be free from pollutants, toxic substances, pathogens, and hazardous radionuclides.
Water 2021, 13, 2026. https://doi.org/10.3390/w13152026 https://www.mdpi.com/journal/water
Water 2021, 13, 2026 2 of 20
Without water, we can hardly live for a few days whereas without food, we can live forseven days. To get optimum fitness and alertness, every adult body requires at least 2 Lof water per day [1]. All over the world, at least one billion people do not get adequatesafe water, more than 800 million people live in rural areas and only 38% of them haveaccess to safe drinking water. It has been reported that about 75% of the population indeveloping countries has access to fresh water supply [2]. Although about three-fourthsof the Earth’s surface is covered with water, globally, people face a shortage of freshwateraccess. Rivers, seas, lakes, tanks, rainwater, and springs are the main sources of potablewater. However, freshwater crises are increasing day by day globally. Owing to the lackof access to safe drinking water, most people in developing countries face various healthproblems [3]. Statistics show that annually in third world countries, about two millionpeople die because of inadequate sanitation, unsafe drinking water, and poor hygiene.Although developed nations have standard laws, programs, policies, and intentions ofinvestments, they have failed to protect public health and sanitation from drinking water-related diseases [4]. In recent decades, even industrial nations like Sweden, Japan, Canada,the U.K, the U.S., and Australia have faced many waterborne diseases [2].
Tube well-, filtered-, and bottled water are the prime sources of drinking water forconsumers [5]. Although developed nations have access to safe, good quality, and mineral-rich potable water, consumers prefer to drink bottled water. A range of water purificationsystems such as distillation, reverse osmosis, microfiltration, ozonation, carbon filtration,ultraviolet (UV) light, etc. is available. However, in Bangladesh, the reverse osmosis(RO) system is commonly employed by different companies to purify water to be used fordrinking purposes. Note that the RO treatment completely de-mineralizes the water, whichis corrosive and not suitable for drinking purposes. By drinking RO-treated water regularlyover a prolonged period, the consumer may face serious health problems; such an examplehas been experienced in Jordan [2]. To meet the U.S. Food and Drug Administration (FDA,2008) purified water standards, a bottled water plant is required to follow several processes.Then, under sanitary conditions, the treated water is transferred to a sealed bottle andafterward supplied to the market. Statistics show that the global consumption of bottledwater was about 288 and 391 billion liters in 2012 and 2017, respectively [6]. In fact, thedemand for bottled water has increased at an average rate of 7% per year over the last30 years worldwide. This is because it has some advantageous features, such as being easyto carry or handle, available in public facilities, possessing good water quality, being freefrom pathogens, more palatable, refillable, transparent, and easy to dispense [6,7]. Bottledwater follows model code and manufacturing guidelines, hence maintaining standardquality [8].
A large portion of the urban population in developing countries like Bangladesh preferto drink bottled water due to the unsafe tap water supplied by the competent authorities.City dwellers in Bangladesh receive water from WASA (Water Supply and SewerageAuthority; a service-oriented autonomous commercial organization) for use in domestic ordrinking purposes [9]. This organization supplies surface or groundwater from the PadmaRiver after treatment through Water Treatment Plant (WTP) [10–12]. WASA purifies waterthrough some processes like water intake (from the primary reservoir), aeration (increasethe dissolved oxygen level), biological pretreatment (reduce the ammonia concentration),rapid sand filtration (for pH adjustment), chlorination (disinfect the water or make freefrom microbes), and then storage (final reservoir) ([13–15]. More than 90% of rural peopleuse tube-well water for drinking or domestic purposes. Depending on the geographicalstructure, level of groundwater, or safe mineral water layer availability, tube-well depthsvary from 180 to 1000 ft in various areas of Bangladesh. Tube well water in coastal areas isusually rich in minerals and free from microbial loads due to the presence of a sandy layeror carbonate layer, or the availability of surface water in the nearby sea or river [16].
Due to its mineral-rich profile, Zamzam water has been recognized as unique anddiffers from natural water [17,18]. The worldwide Muslim community strongly believesthat it is holy and miracle water. Zamzam water can satisfy both thirst and hunger [19].
Water 2021, 13, 2026 3 of 20
Previous studies [17,20] have reported that this water has medicinal value for curingillness. Recently scientists reported via animal studies that Zamzam water cures cancerand tumors [17]. Due to the presence of high concentrations of various minerals [21], itis considered standard mineral water [17,18]. For instance, the presence of high levelsof calcium, magnesium, sodium, etc. provides medicinal benefits, such as the reductionin risk of premature birth, prevention of heart stroke and eye diseases, and lowering ofblood pressure [19]. Due to its fluoride content, it works for the prevention of dental cariesand also contributes to the good health of bones and teeth [17]. To obtain variation ofthe mineral profile of this water with Bangladeshi water, Zamzam water is included inthis study.
The objectives of this study are to assess the quality of local branded bottled water inBangladesh, and compare it with imported brands, tube well water, and Zamzam water.This study also aims to obtain radiological and microbial status in some selected bottledwater brands.
2. Materials and Methods2.1. Sample Collection and Preservation
For this study, local tap water supplied by Dhaka Water Supply & Sewerage Authority(DWASA), Dhaka, Bangladesh, tube-well water (from a coastal area of BD); bottled water,including two imported brands and 23 commercially available indigenous branded watersamples were collected during three seasons in 2018. According to the indication on theirbody labels certified by Bangladesh Standard and Testing Institution (BSTI), all of thecollected bottled water had a shelf-life of one year. To keep the brand names anonymous,the water samples were given a numerical code from 1 to 9. All bottles were made ofPolyethylene Terephthalate (PET) with plastic screw caps. After taking the sample, thebottles were labeled accurately, mentioning the name, location, collection time, date, etc.,and then stored in a refrigerator at 4 C as well as under dark conditions until the analysiswas completed.
2.2. Sample Preparation and Analysis
The collected samples were analyzed in the laboratory by properly maintaining theLaboratory Quality Management System (LQMS). The samples were shaken well beforetesting the parameters and analyzed as per the standard methods [22] listed in Table 1.To find out the representative natural pH, EC, salinity, chloride, turbidity, color, andTDS, respective data were recorded immediately after collection of each sample within5–10 min at the sampling spot by portable multi-meter. Chlorides, nitrates, and fluoridewere tested by Ion Chromatograph (IC). The sulfates and phosphates were determinedby using a UV spectrophotometer. Bi-carbonate of the samples was determined by 0.2 NHCl where phenolphthalein was used as the indicator. Chlorine was determined by aceticacid, potassium iodide, and 0.1 N NaOH where phenolphthalein was used as an indicator.A complexometric method was followed to determine the Total Hardness (TH) of water.Use was made of Eriochrom Black T and Na2-EDTA indicator as a complexion agent.Equation (1) was used to calculate the TDS of each sample:
TDS (mg/L) = [(a− b)× 1000]÷ Sample volume (1)
where, b = weight of evaporating dish and a = weight of evaporating dish and dried residue.
Water 2021, 13, 2026 4 of 20
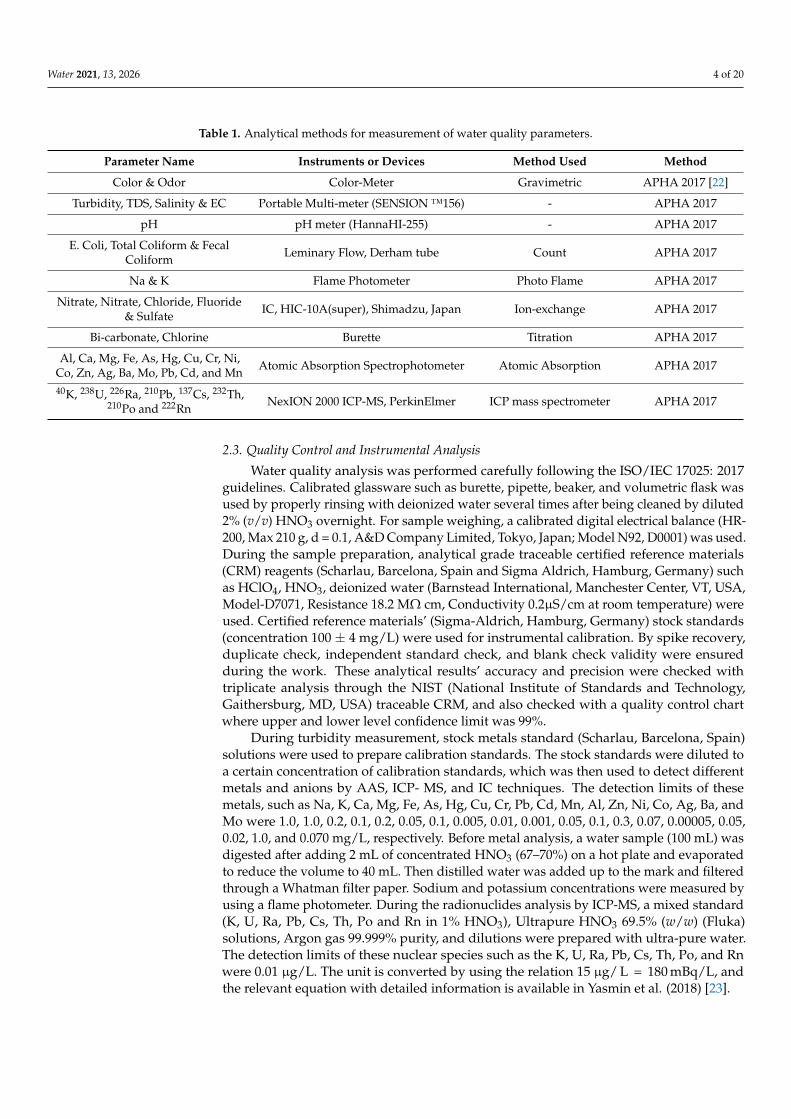
Table 1. Analytical methods for measurement of water quality parameters.
Parameter Name Instruments or Devices Method Used Method
Color & Odor Color-Meter Gravimetric APHA 2017 [22]
Turbidity, TDS, Salinity & EC Portable Multi-meter (SENSION ™156) - APHA 2017
pH pH meter (HannaHI-255) - APHA 2017
E. Coli, Total Coliform & FecalColiform Leminary Flow, Derham tube Count APHA 2017
Na & K Flame Photometer Photo Flame APHA 2017
Nitrate, Nitrate, Chloride, Fluoride& Sulfate IC, HIC-10A(super), Shimadzu, Japan Ion-exchange APHA 2017
Bi-carbonate, Chlorine Burette Titration APHA 2017
Al, Ca, Mg, Fe, As, Hg, Cu, Cr, Ni,Co, Zn, Ag, Ba, Mo, Pb, Cd, and Mn Atomic Absorption Spectrophotometer Atomic Absorption APHA 2017
40K, 238U, 226Ra, 210Pb, 137Cs, 232Th,210Po and 222Rn
NexION 2000 ICP-MS, PerkinElmer ICP mass spectrometer APHA 2017
2.3. Quality Control and Instrumental Analysis
Water quality analysis was performed carefully following the ISO/IEC 17025: 2017guidelines. Calibrated glassware such as burette, pipette, beaker, and volumetric flask wasused by properly rinsing with deionized water several times after being cleaned by diluted2% (v/v) HNO3 overnight. For sample weighing, a calibrated digital electrical balance (HR-200, Max 210 g, d = 0.1, A&D Company Limited, Tokyo, Japan; Model N92, D0001) was used.During the sample preparation, analytical grade traceable certified reference materials(CRM) reagents (Scharlau, Barcelona, Spain and Sigma Aldrich, Hamburg, Germany) suchas HClO4, HNO3, deionized water (Barnstead International, Manchester Center, VT, USA,Model-D7071, Resistance 18.2 MΩ cm, Conductivity 0.2µS/cm at room temperature) wereused. Certified reference materials’ (Sigma-Aldrich, Hamburg, Germany) stock standards(concentration 100 ± 4 mg/L) were used for instrumental calibration. By spike recovery,duplicate check, independent standard check, and blank check validity were ensuredduring the work. These analytical results’ accuracy and precision were checked withtriplicate analysis through the NIST (National Institute of Standards and Technology,Gaithersburg, MD, USA) traceable CRM, and also checked with a quality control chartwhere upper and lower level confidence limit was 99%.
During turbidity measurement, stock metals standard (Scharlau, Barcelona, Spain)solutions were used to prepare calibration standards. The stock standards were diluted toa certain concentration of calibration standards, which was then used to detect differentmetals and anions by AAS, ICP- MS, and IC techniques. The detection limits of thesemetals, such as Na, K, Ca, Mg, Fe, As, Hg, Cu, Cr, Pb, Cd, Mn, Al, Zn, Ni, Co, Ag, Ba, andMo were 1.0, 1.0, 0.2, 0.1, 0.2, 0.05, 0.1, 0.005, 0.01, 0.001, 0.05, 0.1, 0.3, 0.07, 0.00005, 0.05,0.02, 1.0, and 0.070 mg/L, respectively. Before metal analysis, a water sample (100 mL) wasdigested after adding 2 mL of concentrated HNO3 (67–70%) on a hot plate and evaporatedto reduce the volume to 40 mL. Then distilled water was added up to the mark and filteredthrough a Whatman filter paper. Sodium and potassium concentrations were measured byusing a flame photometer. During the radionuclides analysis by ICP-MS, a mixed standard(K, U, Ra, Pb, Cs, Th, Po and Rn in 1% HNO3), Ultrapure HNO3 69.5% (w/w) (Fluka)solutions, Argon gas 99.999% purity, and dilutions were prepared with ultra-pure water.The detection limits of these nuclear species such as the K, U, Ra, Pb, Cs, Th, Po, and Rnwere 0.01 µg/L. The unit is converted by using the relation 15 µg/ L = 180 mBq/L, andthe relevant equation with detailed information is available in Yasmin et al. (2018) [23].
Water 2021, 13, 2026 5 of 20
2.4. Microbiological Analysis
For determining total bacterial load, the collected water samples were diluted upto 10−4 dilutions and cultured following the pour plate technique. Therefore, 1 mL ofsamples was transferred to a sterile screw-capped vial containing 9 mL distilled waterto make a dilution of 1:10 or 10−1. Then using sterile pipettes, 1 mL of the sample from10−1 was transferred to a vial containing 9 mL distilled water to get a dilution of 1:100 or10−2. In this way, the collected water samples were serially diluted up to 10−4 dilutions.Afterward, 1 mL of each dilution was plated by a sterile pipette and covered with a petridish. Respective sterile melted media was poured into the plates and subsequently, theplates were rotated to spread the media evenly. After solidifying the media, the plateswere inverted and incubated overnight at 37 C. The number of colonies was countedby a colony counter. Total plate count was calculated by multiplying the colonies on theplate with the dilution factor. The mean value of the total plate count of each dilutionwas calculated as total counts. Besides this, collected water samples were examined todetermine the total coliform count according to the MPN method [22] and further screenedto check the presence of Escherichia coli. Therefore, water samples were inoculated in LBbroth (yeast extract 0.5%, tryptone 1%, NaCl 1%) at 37 C for the enrichment and wereobserved after overnight incubation. Eosine Methylene Blue (EMB) agar has been used asa selective media for detecting E. coli.
3. Results and Discussion3.1. Discussion on Macro and Micro Minerals
At the International Balneological Congress in Bad Nauheim, Germany, the mineralwater idea was first suggested in 1911, and it was recommended that water having morethan 1000 mg/L of minerals was to be pursued as mineral water. Mineral water hasseveral amounts of dissolved minerals ions such as cations (Na+, K+, Mg2+, Ca2+), anions(Cl−, HCO3
−), and specific medicinal value compounds. These dissolved mineral ioncontents provide several health benefits. Lower values of TDS express the deficiencyof essential minerals in water compliance with the standard limits of drinking waterguidelines set by various international agencies. Calcium, magnesium, and sodium arepotential nutrient minerals for human health. Calcium is a potential mineral for bonedevelopment, magnesium protects from cardiovascular disease, and potassium is beneficialto muscles and the nervous system. We talk of hard water with high concentrations ofcalcium (Ca), magnesium (Mg), bicarbonate (HCO3
−), and sulfate (SO4−) appearing at
mg/L concentrations, which contains high levels of minerals [1]. Hard water is also foundto be protective against osteoporosis, decreased cognitive function in the elderly, decreasedbirth weight, cancer, and diabetes mellitus. The soft water (mineral content almost zero)can substantially contribute to the low concentration of lithium (Li), molybdenum (Mo),selenium (Se), and boron (B) at µg/L via daily intake of water (which is more acidic). Suchkinds of dietary nutrient minerals—Ca, Mg, Na, K, Fe, Zn, Cu, Cr, I, Co, Mo, and Se—arevital for the physiological and physicochemical functioning of the human body [23,24].These elements contribute to metabolic catalysis (Zn, Cu, Se, Mg, Mn, Mo), water andelectrolyte balance (Na, K, Cl), affect bone and membrane structure (Ca, P, Mg, F), hormonefunctions (I, Cr), and oxygen binding (Fe) [24]. Low intake of Ca and Mg contribute torickets in children and osteoporosis in women worldwide [25,26].
In the world malnutrition index, it has been mentioned that the highest malnutritionproblems are faced by children and women in Bangladesh. Zinc, iodine, and iron deficiencyproblems are highly experienced by Bangladeshi children. Pregnant and lactating womensuffer from anemia [16,26]. Calcium and magnesium can be fulfilled with a balanced fooddiet. However, while consumer food has failed to supply these nutrients, drinking watercan serve as a suitable alternative for these mineral sources. Minerals are easily dissolvedin water so these minerals-rich drinking water sources can achieve the target of idealdietary intakes [16,27]. For this purpose, bottled water can be beneficial if they containthese minerals in significant levels. The WHO has recommended that a minimum level
Water 2021, 13, 2026 6 of 20
of some mineral nutrients should be present in drinking water; the nutrients’ names andvalues [1] are listed in Table S1. On the other hand, Table S2 lists some common and rarechemical ingredients usually found in different types of mineral water; the information istaken from ref. [28].
3.2. Discussion on IBWA, FDA, EU, and EPA Regulations for Bottled Water
The International Bottled Water Association (IBWA) is an industrial advocacy organi-zation that was established in 1958 in Alexandria, Virginia. They set an industry standarddocument called IBWA Model Bottled Water Regulation that was first issued in 1982, butthe latest revision was published in March 2005 (Model Code, 2005) to promote their prod-uct [6]. The Model Code has six rules, which extensively highlight water quality protectionfeatures [29]. The Model Code emphasizes the definitions of the different kinds of bottledwater to create water quality protection policies, followed by good manufacturing practicesand operations, sources (free from coliform bacteria), hazard control policies, water trans-portation systems, and ways to protect water sources from contamination [6]. The Code alsorecommends that for microbiological contaminants, bottles should be tested weekly, andfor other contaminants annually; these criteria are also found in EPA Regulation [30–32].
The US has a tradition of good health security, sanitation, and sewage disposal sys-tem [32]. The EPA has gradually monitored the supplied (to the public) water quality andsanitation to control both synthetic compounds and microbial problems. Routine checksare a mandate of the EPA, which is why after a certain period, they examine the microbial(pathogens and viruses) status and disinfection process. The FDA accepts the [33] code asthe final part of the Model Code for Federal Regulations. The federal government considersbottled water as a food product for general consumption; thus, the bottled water industryhas to abide by US consumer protection law and standards of water quality accordingto FDA Regulations (21, 40 CFR, 2006). The bottlers must label their bottles with detailssuch as water source, manufacturer name, and water volume (21 CFR, 2006). When thebottled water contains less than 1.0 gm of any nutrient, it is not mandatory to display theirprovided products’ universal nutrition table on the label (21 CFR 101.13, 2014). However,the bottlers must display their product’s nutrient table as consumer information (21 CFR101.9 (j), 2014). If the bottled water contains more than 1.0 gm of any nutrient that has anutritional benefit or health safety such as “chlorinated” or “little-fat” or “fluoridated”,it is mandatory to display the product nutrients table (21 CFR, 2006). IBWA (2017) andFDA (2008) regulations are almost the same. The EU directive (2009/54/EC) suggests that“natural mineral water” can be marked by its nature and original purity that is protectedfrom all risk of pollution. It has also assessed some certain effects by their nutrient contentsand trace elements [29,34]. Processing and treatment of any bottled water is discouraged byhealth experts, and also rejected by European Economic Community Mineral Water Regula-tions. According to the presence of mineral contents, European brands have been classifiedas low, moderate, and highly mineralized bottled water [35]. There is some variabilitybetween US and European bottled water, but both of them possess higher mineral contentsthan that of Bangladeshi brands. As per their natural character, some mineral water can bemarked as “dietary foods for special health benefits and medicinal value”. The mineralingredients’ concentration should not exceed the standard prescribed level. Table 2 showsthe mineral classification and their specification, as prescribed by FDA (21CFR165.110,2014) and European regulations (Directive 80/777/EEC; 2009/54/EC).
A comparison of Zamzam water, local bottled water, tap water, imported brandedwater, and distilled water with permissible limits of drinking water quality parameters setby different agencies have been assembled in Tables 3 and 4.
The concentrations of water quality parameters in the studied local brands of waterand Zamzam water, imported water, and tube-well water are listed in Tables 5 and 6. Thestatistical values of the water quality parameters of different local brands of water are listedin Table 5.
Water 2021, 13, 2026 7 of 20
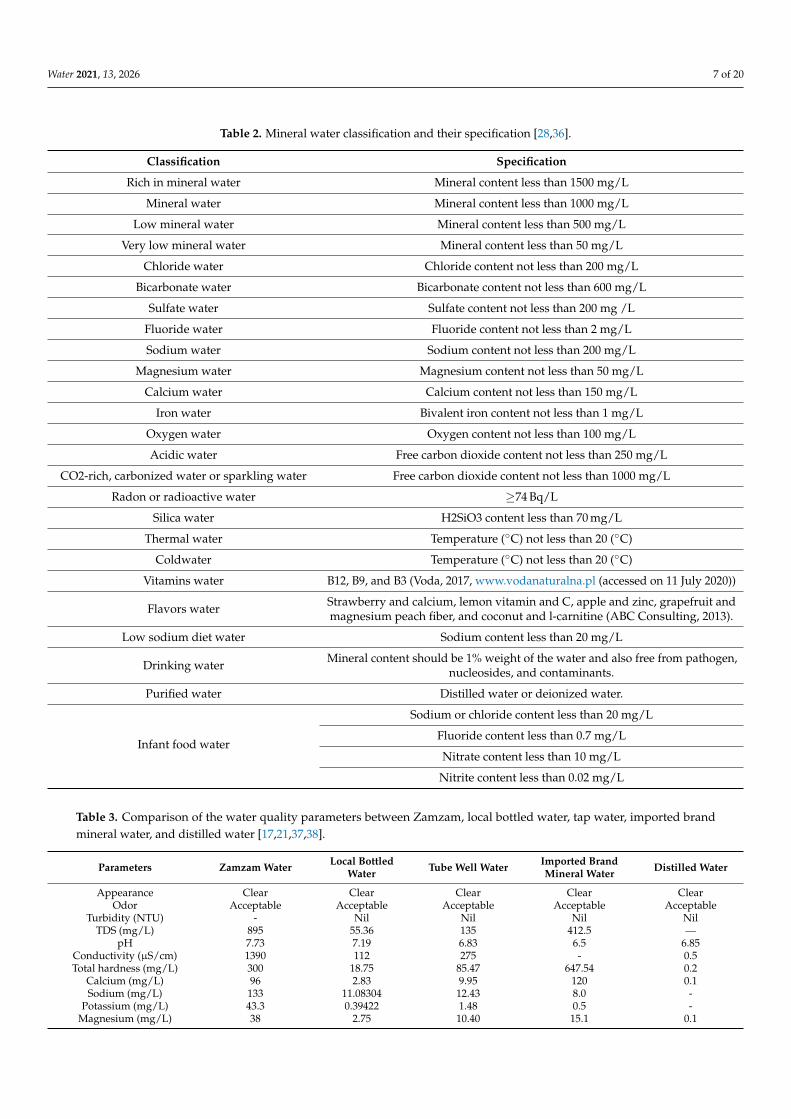
Table 2. Mineral water classification and their specification [28,36].
Classification Specification
Rich in mineral water Mineral content less than 1500 mg/L
Mineral water Mineral content less than 1000 mg/L
Low mineral water Mineral content less than 500 mg/L
Very low mineral water Mineral content less than 50 mg/L
Chloride water Chloride content not less than 200 mg/L
Bicarbonate water Bicarbonate content not less than 600 mg/L
Sulfate water Sulfate content not less than 200 mg /L
Fluoride water Fluoride content not less than 2 mg/L
Sodium water Sodium content not less than 200 mg/L
Magnesium water Magnesium content not less than 50 mg/L
Calcium water Calcium content not less than 150 mg/L
Iron water Bivalent iron content not less than 1 mg/L
Oxygen water Oxygen content not less than 100 mg/L
Acidic water Free carbon dioxide content not less than 250 mg/L
CO2-rich, carbonized water or sparkling water Free carbon dioxide content not less than 1000 mg/L
Radon or radioactive water ≥74 Bq/L
Silica water H2SiO3 content less than 70 mg/L
Thermal water Temperature (C) not less than 20 (C)
Coldwater Temperature (C) not less than 20 (C)
Vitamins water B12, B9, and B3 (Voda, 2017, www.vodanaturalna.pl (accessed on 11 July 2020))
Flavors water Strawberry and calcium, lemon vitamin and C, apple and zinc, grapefruit andmagnesium peach fiber, and coconut and l-carnitine (ABC Consulting, 2013).
Low sodium diet water Sodium content less than 20 mg/L
Drinking water Mineral content should be 1% weight of the water and also free from pathogen,nucleosides, and contaminants.
Purified water Distilled water or deionized water.
Infant food water
Sodium or chloride content less than 20 mg/L
Fluoride content less than 0.7 mg/L
Nitrate content less than 10 mg/L
Nitrite content less than 0.02 mg/L
Table 3. Comparison of the water quality parameters between Zamzam, local bottled water, tap water, imported brandmineral water, and distilled water [17,21,37,38].
Parameters Zamzam Water Local BottledWater Tube Well Water Imported Brand
Mineral Water Distilled Water
Appearance Clear Clear Clear Clear ClearOdor Acceptable Acceptable Acceptable Acceptable Acceptable
Turbidity (NTU) - Nil Nil Nil NilTDS (mg/L) 895 55.36 135 412.5 —
pH 7.73 7.19 6.83 6.5 6.85Conductivity (µS/cm) 1390 112 275 - 0.5Total hardness (mg/L) 300 18.75 85.47 647.54 0.2
Calcium (mg/L) 96 2.83 9.95 120 0.1Sodium (mg/L) 133 11.08304 12.43 8.0 -
Potassium (mg/L) 43.3 0.39422 1.48 0.5 -Magnesium (mg/L) 38 2.75 10.40 15.1 0.1
Water 2021, 13, 2026 8 of 20
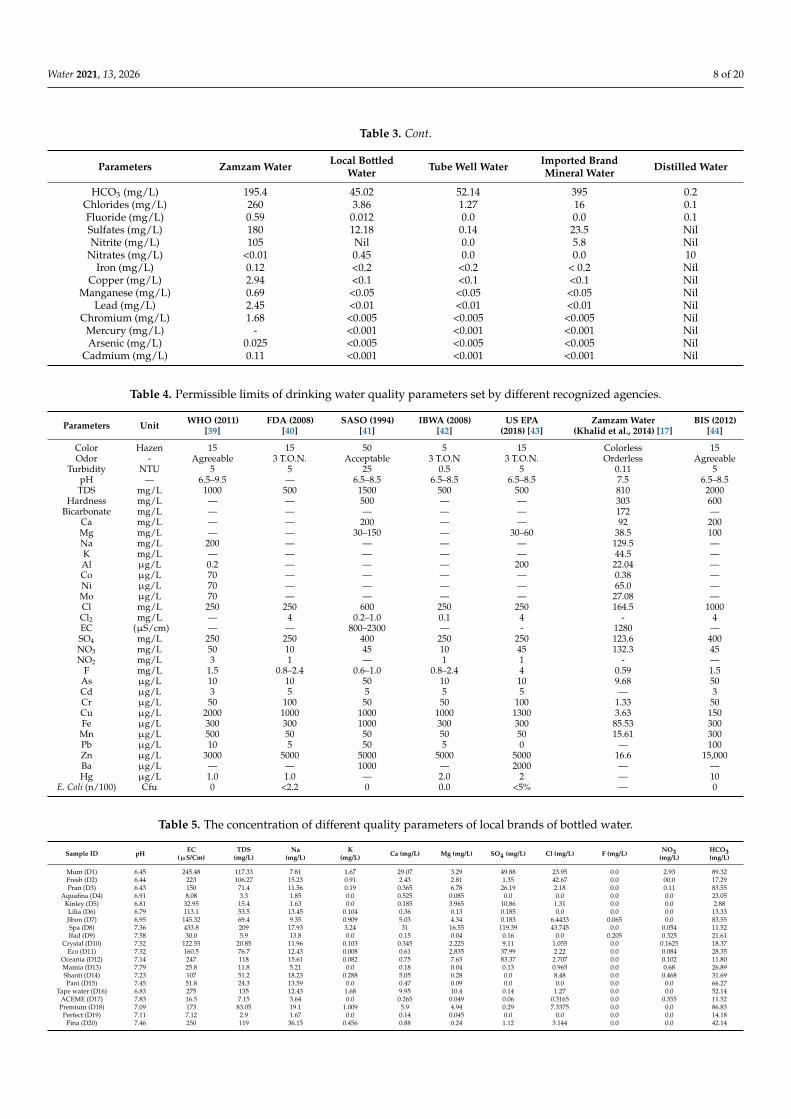
Table 3. Cont.
Parameters Zamzam Water Local BottledWater Tube Well Water Imported Brand
Mineral Water Distilled Water
HCO3 (mg/L) 195.4 45.02 52.14 395 0.2Chlorides (mg/L) 260 3.86 1.27 16 0.1Fluoride (mg/L) 0.59 0.012 0.0 0.0 0.1Sulfates (mg/L) 180 12.18 0.14 23.5 NilNitrite (mg/L) 105 Nil 0.0 5.8 Nil
Nitrates (mg/L) <0.01 0.45 0.0 0.0 10Iron (mg/L) 0.12 <0.2 <0.2 < 0.2 Nil
Copper (mg/L) 2.94 <0.1 <0.1 <0.1 NilManganese (mg/L) 0.69 <0.05 <0.05 <0.05 Nil
Lead (mg/L) 2.45 <0.01 <0.01 <0.01 NilChromium (mg/L) 1.68 <0.005 <0.005 <0.005 Nil
Mercury (mg/L) - <0.001 <0.001 <0.001 NilArsenic (mg/L) 0.025 <0.005 <0.005 <0.005 Nil
Cadmium (mg/L) 0.11 <0.001 <0.001 <0.001 Nil
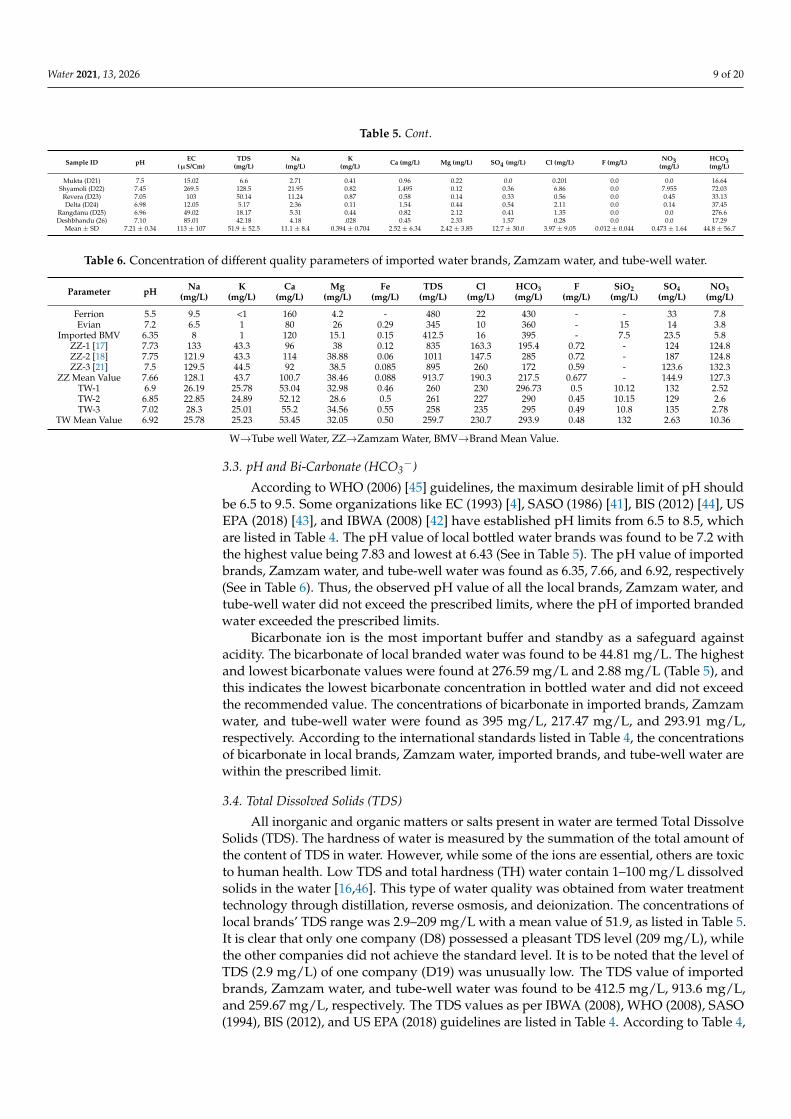
Table 4. Permissible limits of drinking water quality parameters set by different recognized agencies.
Parameters Unit WHO (2011)[39]
FDA (2008)[40]
SASO (1994)[41]
IBWA (2008)[42]
US EPA(2018) [43]
Zamzam Water(Khalid et al., 2014) [17]
BIS (2012)[44]
Color Hazen 15 15 50 5 15 Colorless 15Odor - Agreeable 3 T.O.N. Acceptable 3 T.O.N 3 T.O.N. Orderless Agreeable
Turbidity NTU 5 5 25 0.5 5 0.11 5pH — 6.5–9.5 — 6.5–8.5 6.5–8.5 6.5–8.5 7.5 6.5–8.5TDS mg/L 1000 500 1500 500 500 810 2000
Hardness mg/L — — 500 — — 303 600Bicarbonate mg/L — — — — — 172 —
Ca mg/L — — 200 — — 92 200Mg mg/L — — 30–150 — 30–60 38.5 100Na mg/L 200 — — — — 129.5 —K mg/L — — — — — 44.5 —Al µg/L 0.2 — — — 200 22.04 —Co µg/L 70 — — — — 0.38 —Ni µg/L 70 — — — — 65.0 —Mo µg/L 70 — — — — 27.08 —Cl mg/L 250 250 600 250 250 164.5 1000Cl2 mg/L — 4 0.2–1.0 0.1 4 - 4EC (µS/cm) — — 800–2300 — - 1280 —SO4 mg/L 250 250 400 250 250 123.6 400NO3 mg/L 50 10 45 10 45 132.3 45NO2 mg/L 3 1 — 1 1 - —
F mg/L 1.5 0.8–2.4 0.6–1.0 0.8–2.4 4 0.59 1.5As µg/L 10 10 50 10 10 9.68 50Cd µg/L 3 5 5 5 5 — 3Cr µg/L 50 100 50 50 100 1.33 50Cu µg/L 2000 1000 1000 1000 1300 3.63 150Fe µg/L 300 300 1000 300 300 85.53 300Mn µg/L 500 50 50 50 50 15.61 300Pb µg/L 10 5 50 5 0 — 100Zn µg/L 3000 5000 5000 5000 5000 16.6 15,000Ba µg/L — — 1000 — 2000 — —Hg µg/L 1.0 1.0 — 2.0 2 — 10
E. Coli (n/100) Cfu 0 <2.2 0 0.0 <5% — 0
Table 5. The concentration of different quality parameters of local brands of bottled water.
Sample ID pH EC(µS/Cm)
TDS(mg/L)
Na(mg/L)
K(mg/L) Ca (mg/L) Mg (mg/L) SO4 (mg/L) Cl (mg/L) F (mg/L) NO3
(mg/L)HCO3(mg/L)
Mum (D1) 6.45 245.48 117.33 7.81 1.67 29.07 3.29 49.88 23.95 0.0 2.93 89.32Fresh (D2) 6.44 223 106.27 15.23 0.91 2.43 2.81 1.35 42.67 0.0 00.0 17.29Pran (D3) 6.43 150 71.4 11.56 0.19 0.365 6.78 26.19 2.18 0.0 0.11 83.55
Aquafina (D4) 6.91 8.08 3.3 1.85 0.0 0.525 0.085 0.0 0.0 0.0 0.0 23.05Kinley (D5) 6.81 32.95 15.4 1.63 0.0 0.185 3.965 10.86 1.31 0.0 0.0 2.88Lilia (D6) 6.79 113.1 53.5 13.45 0.104 0.36 0.13 0.185 0.0 0.0 0.0 13.33Jibon (D7) 6.95 145.32 69.4 9.35 0.909 5.03 4.34 0.183 6.4433 0.065 0.0 83.55Spa (D8) 7.36 433.8 209 17.93 3.24 31 16.55 119.39 43.745 0.0 0.054 11.52Ifad (D9) 7.58 30.0 5.9 13.8 0.0 0.15 0.04 0.16 0.0 0.205 0.325 21.61
Crystal (D10) 7.52 122.55 20.85 11.96 0.103 0.345 2.225 9.11 1.055 0.0 0.1625 18.37Eco (D11) 7.32 160.5 76.7 12.43 0.008 0.61 2.835 37.99 2.22 0.0 0.084 28.35
Oceania (D12) 7.14 247 118 15.61 0.082 0.75 7.63 83.37 2.707 0.0 0.102 11.80Mamia (D13) 7.79 25.8 11.8 5.21 0.0 0.18 0.04 0.13 0.965 0.0 0.68 26.89Shanti (D14) 7.23 107 51.2 18.23 0.288 5.05 0.28 0.0 8.48 0.0 0.468 31.69Pani (D15) 7.45 51.8 24.3 13.59 0.0 0.47 0.09 0.0 0.0 0.0 0.0 66.27
Tape water (D16) 6.83 275 135 12.43 1.68 9.95 10.4 0.14 1.27 0.0 0.0 52.14ACEME (D17) 7.83 16.5 7.15 3.64 0.0 0.265 0.049 0.06 0.3165 0.0 0.355 11.52Premium (D18) 7.09 173 83.05 19.1 1.009 5.9 4.94 0.29 7.3375 0.0 0.0 86.83
Perfect (D19) 7.11 7.12 2.9 1.67 0.0 0.14 0.045 0.0 0.0 0.0 0.0 14.18Fina (D20) 7.46 250 119 36.15 0.456 0.88 0.24 1.12 3.144 0.0 0.0 42.14
Water 2021, 13, 2026 9 of 20
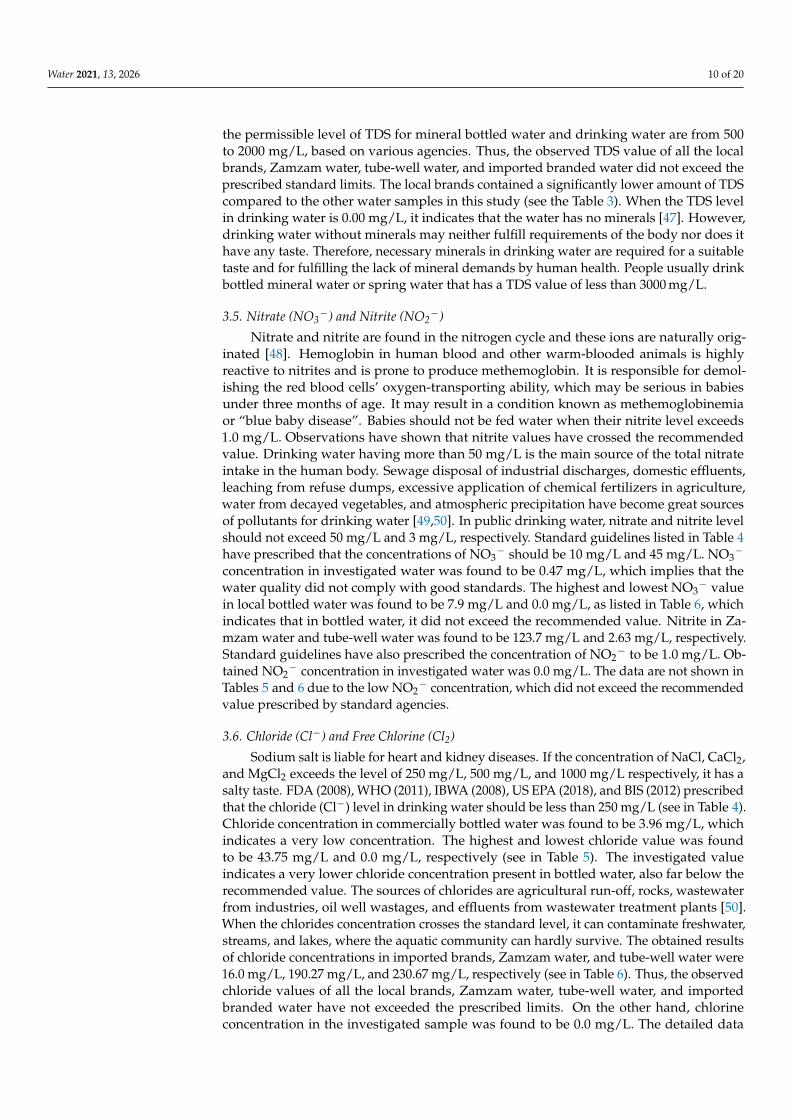
Table 5. Cont.
Sample ID pH EC(µS/Cm)
TDS(mg/L)
Na(mg/L)
K(mg/L) Ca (mg/L) Mg (mg/L) SO4 (mg/L) Cl (mg/L) F (mg/L) NO3
(mg/L)HCO3(mg/L)
Mukta (D21) 7.5 15.02 6.6 2.71 0.41 0.96 0.22 0.0 0.201 0.0 0.0 16.64Shyamoli (D22) 7.45 269.5 128.5 21.95 0.82 1.495 0.12 0.36 6.86 0.0 7.955 72.03
Revera (D23) 7.05 103 50.14 11.24 0.87 0.58 0.14 0.33 0.56 0.0 0.45 33.13Delta (D24) 6.98 12.05 5.17 2.36 0.11 1.54 0.44 0.54 2.11 0.0 0.14 37.45
Rangdanu (D25) 6.96 49.02 18.17 5.31 0.44 0.82 2.12 0.41 1.35 0.0 0.0 276.6Deshbhandu (26) 7.10 85.01 42.18 4.18 .028 0.45 2.33 1.57 0.28 0.0 0.0 17.29
Mean ± SD 7.21 ± 0.34 113 ± 107 51.9 ± 52.5 11.1 ± 8.4 0.394 ± 0.704 2.52 ± 6.34 2.42 ± 3.85 12.7 ± 30.0 3.97 ± 9.05 0.012 ± 0.044 0.473 ± 1.64 44.8 ± 56.7
Table 6. Concentration of different quality parameters of imported water brands, Zamzam water, and tube-well water.
Parameter pH Na(mg/L)
K(mg/L)
Ca(mg/L)
Mg(mg/L)
Fe(mg/L)
TDS(mg/L)
Cl(mg/L)
HCO3(mg/L)
F(mg/L)
SiO2(mg/L)
SO4(mg/L)
NO3(mg/L)
Ferrion 5.5 9.5 <1 160 4.2 - 480 22 430 - - 33 7.8Evian 7.2 6.5 1 80 26 0.29 345 10 360 - 15 14 3.8
Imported BMV 6.35 8 1 120 15.1 0.15 412.5 16 395 - 7.5 23.5 5.8ZZ-1 [17] 7.73 133 43.3 96 38 0.12 835 163.3 195.4 0.72 - 124 124.8ZZ-2 [18] 7.75 121.9 43.3 114 38.88 0.06 1011 147.5 285 0.72 - 187 124.8ZZ-3 [21] 7.5 129.5 44.5 92 38.5 0.085 895 260 172 0.59 - 123.6 132.3
ZZ Mean Value 7.66 128.1 43.7 100.7 38.46 0.088 913.7 190.3 217.5 0.677 - 144.9 127.3TW-1 6.9 26.19 25.78 53.04 32.98 0.46 260 230 296.73 0.5 10.12 132 2.52TW-2 6.85 22.85 24.89 52.12 28.6 0.5 261 227 290 0.45 10.15 129 2.6TW-3 7.02 28.3 25.01 55.2 34.56 0.55 258 235 295 0.49 10.8 135 2.78
TW Mean Value 6.92 25.78 25.23 53.45 32.05 0.50 259.7 230.7 293.9 0.48 132 2.63 10.36
W→Tube well Water, ZZ→Zamzam Water, BMV→Brand Mean Value.
3.3. pH and Bi-Carbonate (HCO3−)
According to WHO (2006) [45] guidelines, the maximum desirable limit of pH shouldbe 6.5 to 9.5. Some organizations like EC (1993) [4], SASO (1986) [41], BIS (2012) [44], USEPA (2018) [43], and IBWA (2008) [42] have established pH limits from 6.5 to 8.5, whichare listed in Table 4. The pH value of local bottled water brands was found to be 7.2 withthe highest value being 7.83 and lowest at 6.43 (See in Table 5). The pH value of importedbrands, Zamzam water, and tube-well water was found as 6.35, 7.66, and 6.92, respectively(See in Table 6). Thus, the observed pH value of all the local brands, Zamzam water, andtube-well water did not exceed the prescribed limits, where the pH of imported brandedwater exceeded the prescribed limits.
Bicarbonate ion is the most important buffer and standby as a safeguard againstacidity. The bicarbonate of local branded water was found to be 44.81 mg/L. The highestand lowest bicarbonate values were found at 276.59 mg/L and 2.88 mg/L (Table 5), andthis indicates the lowest bicarbonate concentration in bottled water and did not exceedthe recommended value. The concentrations of bicarbonate in imported brands, Zamzamwater, and tube-well water were found as 395 mg/L, 217.47 mg/L, and 293.91 mg/L,respectively. According to the international standards listed in Table 4, the concentrationsof bicarbonate in local brands, Zamzam water, imported brands, and tube-well water arewithin the prescribed limit.
3.4. Total Dissolved Solids (TDS)
All inorganic and organic matters or salts present in water are termed Total DissolveSolids (TDS). The hardness of water is measured by the summation of the total amount ofthe content of TDS in water. However, while some of the ions are essential, others are toxicto human health. Low TDS and total hardness (TH) water contain 1–100 mg/L dissolvedsolids in the water [16,46]. This type of water quality was obtained from water treatmenttechnology through distillation, reverse osmosis, and deionization. The concentrations oflocal brands’ TDS range was 2.9–209 mg/L with a mean value of 51.9, as listed in Table 5.It is clear that only one company (D8) possessed a pleasant TDS level (209 mg/L), whilethe other companies did not achieve the standard level. It is to be noted that the level ofTDS (2.9 mg/L) of one company (D19) was unusually low. The TDS value of importedbrands, Zamzam water, and tube-well water was found to be 412.5 mg/L, 913.6 mg/L,and 259.67 mg/L, respectively. The TDS values as per IBWA (2008), WHO (2008), SASO(1994), BIS (2012), and US EPA (2018) guidelines are listed in Table 4. According to Table 4,
Water 2021, 13, 2026 10 of 20
the permissible level of TDS for mineral bottled water and drinking water are from 500to 2000 mg/L, based on various agencies. Thus, the observed TDS value of all the localbrands, Zamzam water, tube-well water, and imported branded water did not exceed theprescribed standard limits. The local brands contained a significantly lower amount of TDScompared to the other water samples in this study (see the Table 3). When the TDS levelin drinking water is 0.00 mg/L, it indicates that the water has no minerals [47]. However,drinking water without minerals may neither fulfill requirements of the body nor does ithave any taste. Therefore, necessary minerals in drinking water are required for a suitabletaste and for fulfilling the lack of mineral demands by human health. People usually drinkbottled mineral water or spring water that has a TDS value of less than 3000 mg/L.
3.5. Nitrate (NO3−) and Nitrite (NO2
−)
Nitrate and nitrite are found in the nitrogen cycle and these ions are naturally orig-inated [48]. Hemoglobin in human blood and other warm-blooded animals is highlyreactive to nitrites and is prone to produce methemoglobin. It is responsible for demol-ishing the red blood cells’ oxygen-transporting ability, which may be serious in babiesunder three months of age. It may result in a condition known as methemoglobinemiaor “blue baby disease”. Babies should not be fed water when their nitrite level exceeds1.0 mg/L. Observations have shown that nitrite values have crossed the recommendedvalue. Drinking water having more than 50 mg/L is the main source of the total nitrateintake in the human body. Sewage disposal of industrial discharges, domestic effluents,leaching from refuse dumps, excessive application of chemical fertilizers in agriculture,water from decayed vegetables, and atmospheric precipitation have become great sourcesof pollutants for drinking water [49,50]. In public drinking water, nitrate and nitrite levelshould not exceed 50 mg/L and 3 mg/L, respectively. Standard guidelines listed in Table 4have prescribed that the concentrations of NO3
− should be 10 mg/L and 45 mg/L. NO3−
concentration in investigated water was found to be 0.47 mg/L, which implies that thewater quality did not comply with good standards. The highest and lowest NO3
− valuein local bottled water was found to be 7.9 mg/L and 0.0 mg/L, as listed in Table 6, whichindicates that in bottled water, it did not exceed the recommended value. Nitrite in Za-mzam water and tube-well water was found to be 123.7 mg/L and 2.63 mg/L, respectively.Standard guidelines have also prescribed the concentration of NO2
− to be 1.0 mg/L. Ob-tained NO2
− concentration in investigated water was 0.0 mg/L. The data are not shown inTables 5 and 6 due to the low NO2
− concentration, which did not exceed the recommendedvalue prescribed by standard agencies.
3.6. Chloride (Cl−) and Free Chlorine (Cl2)
Sodium salt is liable for heart and kidney diseases. If the concentration of NaCl, CaCl2,and MgCl2 exceeds the level of 250 mg/L, 500 mg/L, and 1000 mg/L respectively, it has asalty taste. FDA (2008), WHO (2011), IBWA (2008), US EPA (2018), and BIS (2012) prescribedthat the chloride (Cl−) level in drinking water should be less than 250 mg/L (see in Table 4).Chloride concentration in commercially bottled water was found to be 3.96 mg/L, whichindicates a very low concentration. The highest and lowest chloride value was foundto be 43.75 mg/L and 0.0 mg/L, respectively (see in Table 5). The investigated valueindicates a very lower chloride concentration present in bottled water, also far below therecommended value. The sources of chlorides are agricultural run-off, rocks, wastewaterfrom industries, oil well wastages, and effluents from wastewater treatment plants [50].When the chlorides concentration crosses the standard level, it can contaminate freshwater,streams, and lakes, where the aquatic community can hardly survive. The obtained resultsof chloride concentrations in imported brands, Zamzam water, and tube-well water were16.0 mg/L, 190.27 mg/L, and 230.67 mg/L, respectively (see in Table 6). Thus, the observedchloride values of all the local brands, Zamzam water, tube-well water, and importedbranded water have not exceeded the prescribed limits. On the other hand, chlorineconcentration in the investigated sample was found to be 0.0 mg/L. The detailed data
Water 2021, 13, 2026 11 of 20
of chlorine concentrations are not shown in Tables 5 and 6 due to their very low values,which certainly do not exceed the recommended values given by the standard agencies(see Table 4).
3.7. Fluoride (F−) and Sulphates (SO42−)
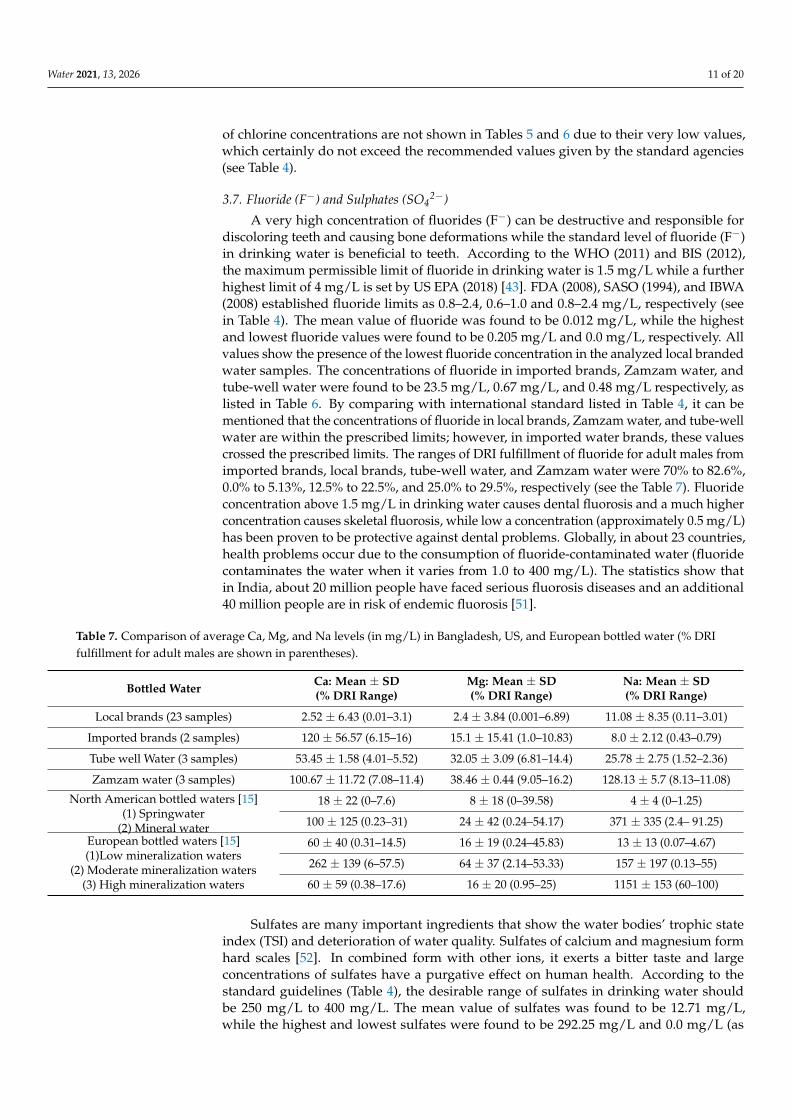
A very high concentration of fluorides (F−) can be destructive and responsible fordiscoloring teeth and causing bone deformations while the standard level of fluoride (F−)in drinking water is beneficial to teeth. According to the WHO (2011) and BIS (2012),the maximum permissible limit of fluoride in drinking water is 1.5 mg/L while a furtherhighest limit of 4 mg/L is set by US EPA (2018) [43]. FDA (2008), SASO (1994), and IBWA(2008) established fluoride limits as 0.8–2.4, 0.6–1.0 and 0.8–2.4 mg/L, respectively (seein Table 4). The mean value of fluoride was found to be 0.012 mg/L, while the highestand lowest fluoride values were found to be 0.205 mg/L and 0.0 mg/L, respectively. Allvalues show the presence of the lowest fluoride concentration in the analyzed local brandedwater samples. The concentrations of fluoride in imported brands, Zamzam water, andtube-well water were found to be 23.5 mg/L, 0.67 mg/L, and 0.48 mg/L respectively, aslisted in Table 6. By comparing with international standard listed in Table 4, it can bementioned that the concentrations of fluoride in local brands, Zamzam water, and tube-wellwater are within the prescribed limits; however, in imported water brands, these valuescrossed the prescribed limits. The ranges of DRI fulfillment of fluoride for adult males fromimported brands, local brands, tube-well water, and Zamzam water were 70% to 82.6%,0.0% to 5.13%, 12.5% to 22.5%, and 25.0% to 29.5%, respectively (see the Table 7). Fluorideconcentration above 1.5 mg/L in drinking water causes dental fluorosis and a much higherconcentration causes skeletal fluorosis, while low a concentration (approximately 0.5 mg/L)has been proven to be protective against dental problems. Globally, in about 23 countries,health problems occur due to the consumption of fluoride-contaminated water (fluoridecontaminates the water when it varies from 1.0 to 400 mg/L). The statistics show thatin India, about 20 million people have faced serious fluorosis diseases and an additional40 million people are in risk of endemic fluorosis [51].
Table 7. Comparison of average Ca, Mg, and Na levels (in mg/L) in Bangladesh, US, and European bottled water (% DRIfulfillment for adult males are shown in parentheses).
Bottled Water Ca: Mean ± SD(% DRI Range)
Mg: Mean ± SD(% DRI Range)
Na: Mean ± SD(% DRI Range)
Local brands (23 samples) 2.52 ± 6.43 (0.01–3.1) 2.4 ± 3.84 (0.001–6.89) 11.08 ± 8.35 (0.11–3.01)
Imported brands (2 samples) 120 ± 56.57 (6.15–16) 15.1 ± 15.41 (1.0–10.83) 8.0 ± 2.12 (0.43–0.79)
Tube well Water (3 samples) 53.45 ± 1.58 (4.01–5.52) 32.05 ± 3.09 (6.81–14.4) 25.78 ± 2.75 (1.52–2.36)
Zamzam water (3 samples) 100.67 ± 11.72 (7.08–11.4) 38.46 ± 0.44 (9.05–16.2) 128.13 ± 5.7 (8.13–11.08)
North American bottled waters [15](1) Springwater
(2) Mineral water
18 ± 22 (0–7.6) 8 ± 18 (0–39.58) 4 ± 4 (0–1.25)
100 ± 125 (0.23–31) 24 ± 42 (0.24–54.17) 371 ± 335 (2.4– 91.25)
European bottled waters [15](1)Low mineralization waters
(2) Moderate mineralization waters(3) High mineralization waters
60 ± 40 (0.31–14.5) 16 ± 19 (0.24–45.83) 13 ± 13 (0.07–4.67)
262 ± 139 (6–57.5) 64 ± 37 (2.14–53.33) 157 ± 197 (0.13–55)
60 ± 59 (0.38–17.6) 16 ± 20 (0.95–25) 1151 ± 153 (60–100)
Sulfates are many important ingredients that show the water bodies’ trophic stateindex (TSI) and deterioration of water quality. Sulfates of calcium and magnesium formhard scales [52]. In combined form with other ions, it exerts a bitter taste and largeconcentrations of sulfates have a purgative effect on human health. According to thestandard guidelines (Table 4), the desirable range of sulfates in drinking water shouldbe 250 mg/L to 400 mg/L. The mean value of sulfates was found to be 12.71 mg/L,while the highest and lowest sulfates were found to be 292.25 mg/L and 0.0 mg/L (as
Water 2021, 13, 2026 12 of 20
listed in Table 6), which indicates the presence of sulfates in the lowest concentration inbottled water. The concentrations of sulfates in imported brands, Zamzam water, andtube-well water were 5.8 mg/L, 144.87 mg/L, and 132 mg/L, respectively. According tothe international standards, the concentrations of sulfates in all the local brands, Zamzamwater, imported brands, and tube-well water are within the prescribed limits.
3.8. Calcium (Ca) and Magnesium (Mg)
Table 5 shows the comparison of average Ca, Mg, and Na levels (in mg/L) inBangladeshi, US, and European bottled water (% of DRI fulfillment for adult males isshown in parentheses). Table S3 shows the Dietary Reference Intakes (DRIs) [14,26,53,54]of select mineral elements.
Calcium and magnesium are prime elements in rocks and soil, and their main sourcesare CaCO3, MgCO3, CaMg(CO2)2, CaAl2Si2O8, CaSO4, CaSO4·2H2O, Ca5 (PO4)3F, CaF2,and Ca5 (PO4)3OH. Calcium and magnesium are leached from soil and rocks into thewater, and may exist in water in complex forms such as [CaCO3], [MgCO3], [CaSO4],[MgSO4], [MgOH]+, [CaOH]−, [MgHCO3]+and [CaHCO3]+ [55]. At a temperature of 18 Cand pressure of 1000 hPa, the maximum amount of Ca content present in water is to be>1 g/L [56]. The presence of Ca and Mg in drinking water is of significance for health—bones and teeth. Ca and Mg are linked to a reduction in sudden death, and cardiovascular(ischemic) disease mortality, and most of the drinking water varies from 2:1 to 4:1. A highconcentration of calcium prevents the up-taking of magnesium and thus the optimumbalance of these two minerals prevails in water. Epidemiological research carried out inEurope, the US, and Russia recommend that a level of 20–30 mg/L Ca and 10 mg/L Mg indrinking water may be beneficial [56,57]. Different countries have prescribed certain levelsof standard values such as 75 mg/L Ca and 30–35 mg/L Mg in drinking water to meetnutrient deficiency [58]. According to WHO (2017) [59] guidelines, Ca content and Mgcontent in mineral and drinking water should range from 50–200 mg /L and single-digit to50 mg/L, respectively. Every adult should take 1 g of Ca per day.
The calcium content in imported brands of water ranged from 80 to 160 mg/L witha mean value of 120 mg/L, while in local brands, it is ranged from 0.14 to 31 mg/Lwith a mean value of 2.5 mg/L. In the case of magnesium content, the range and meanvalue for imported brands were 4.2 to 26.0 mg/L and 15.1 mg/L, respectively; for localbrands, it ranged from 0.04 to 16.55 mg/L and a mean of 2.42 mg/L. The local brandscontain a significantly lower amount of calcium and magnesium concentration comparedwith the imported brands, Zamzam water, and tube-well water (see the Table 3). Theconcentration of Ca and Mg in Zamzam water were found as 96 mg/L and 36 mg/L, andin tube-well water 53.44 mg/L and 32.06 mg/L, respectively. When we considered the% of DRI fulfillment of calcium and magnesium for adults, the contribution of importedbrands, Zamzam water, and tube-well water was found to be higher than the local brands(see the Table 7). The average calcium content in the imported brands can fulfill thecalcium demand of DRI from 1.4% to 19.8% for adult males. For adult males, the % ofDRI fulfillment by local brands ranged from 0% to 3.3% only. The % of DRI fulfillment ofmagnesium for adult males by imported and local brands was 1% to 16.6% and 0.002% to7.3%, respectively (see the Table 7).
3.9. Sodium (Na) and Potassium (K)
Sodium and potassium are major elements in soil and rocks. Sodium and potassiumleach into groundwater from soil and rock, and are present in water in complex forms,such as [NaSO4]−, [NaCO3]−, [KCO3]−, [KHCO3], and [NaHCO3] [60]. KCl, KAlSi2O6,and KCl·MgCl2·6H2O are major potassium minerals. The range of sodium concentrationsin imported brands was found to be 6.5–9.5 mg/L with a mean value of 8.0 mg/L (Table 6),while the respective data in local brands were 1.63–36.15 mg/L and 11.08 mg/L. The rangeof potassium concentrations and mean value are 0.0 to 3.25 mg/L and 0.39 mg/L in localbrands, and <1.0 to 1.0 mg/L and 1.0 mg/L in imported brands. The concentrations of Na
Water 2021, 13, 2026 13 of 20
and K in Zamzam water were found to be 128.13 mg/L and 25.78 mg/L, and 28.3 mg/L and43.7 mg/L in tube-well water (Table 6). The American Public Health Association (APHA)has recommended that drinking water should contain a maximum level of 20 mg/L Nafor individuals on a severely restricted Na diet (500 mg of Na per day). In this regard,both the local and imported brands of water often have been found to exceed the 20 mg/Llimits suggested by APHA [22]. This indicates that an individual with a sodium-restricteddiet should avoid some of the local and imported brands of water. The ranges of DRIfulfillment of sodium for adult males by imported brands, local brands, tube-well water,Zamzam water were found to be 0.43% to 0.79%, 0.11% to 3.01%, 1.52% to 2.36%, and8.13% to 11.08% respectively (see the Table 7). The DRI contributions (from local: 0% to0.072% and imported: 0.01% to 0.02%) of potassium for an average adult male indicatesthat none of these bottled water sources contains a significant level of potassium. Theranges of DRI fulfillment of potassium for adult males from tube-well water and Zamzamwater were 1.66% to 2.14%, and 0.92% to 0.98%, respectively (see the Table 7). According toWHO (2017) [59] guidelines, a high Na concentration is very dangerous for children, anddeficiency of potassium can lead to vertigo. The WHO (2017; 2008) also prescribed thatsodium concentration in drinking water is 200 mg/L and there is no limit for potassiumcontent in drinking water.
3.10. The Status of Minerals in Imported Bottled Waters
The US has classified bottled water as spring water and mineral water. Spring watercontains a very low amount of minerals (Ca, Mg, and Na) with ranges of 0–76 mg/L,0–95 mg/L, and 0–15 mg/L, respectively [15]. Local brands of bottled water also contain alow amount of calcium and magnesium than the Bangladesh standards of 200 mg/L and100 mg/L. Calcium and magnesium are essential macronutrients for human health [15]. Bycontinuous consumption of local brands of bottled water, the consumer may be deprivedof essential mineral nutrients. The intake of minerals through the consumption of bottledwater is clinically important (WHO, 2017; 2008). The ranges of DRI fulfillment of (Ca,Mg and Na) for adult males from spring water were 0.0% to 7.6%, 0.0–39.58%, 0.0–1.25%,respectively (see the Table 7), which were slightly higher than that of the local brands. TheUS mineral water contributes a greater % of DRI fulfillment. For an adult male, they canfulfill % of DRI up to 31%, 54.17%, and 91.25% of Ca, Mg, and Na intake (see the Table 7).This shows that the US and European mineral waters fulfill a significant portion of thedietary mineral requirements through the consumption of different mineralized levels.Low mineralized local bottled water can fulfill DRI values of Ca, Mg, and Na with theranges: 0.31% to 14.5%, 0.24% to 45.83%, and 0.07% to 4.67%, while the high mineralizedwater can contribute to DRI fulfillment up to 17.6%, 25% and 100% of Ca, Mg, and Na,respectively (see the Table 7).
3.11. Iron (Fe) and Copper (Cu)
Iron (Fe) and copper (Cu) are important nutrient elements and excess Fe and Cu fromdrinking water may cause intestinal disorders and liver damage. The Fe and Cu contentsin drinking and mineral water vary from 0.01 to 20 mg /L and 1 to 100µg /L, respectively.Iron can be found in colloid form in tap and surface water. Minerals are present in ionicform in water, and the human body can easily absorb these ions from water than foodstuff.At least about 10 to 50 mg/L iron is required daily and is present normally in the ferrous orbivalent form in groundwater [61,62]. Plants and animals both need iron, especially foroxygen transport in the blood of animals. Infants and young face anemia or iron deficiencybecause it is essential for metabolism. Iron appears to be a nuisance than a potential healthhazard. The presence of iron in water with a concentration of 0.1 mg/L as ferrous iron and0.2 mg/L as ferric iron as a bitter or astringent taste. Water used in industrial processesusually contain less than 0.2 mg/L iron. According to standard guidelines (Table 4), thehighest desirable limit of iron in drinking water should be 0.3 mg/L. The mean value of Feand Cu in the investigated sample was found to be less than 300 µg/L. Copper is insoluble
Water 2021, 13, 2026 14 of 20
in water at high pH and soluble at low pH. The permissible limit of copper concentrationin drinking and mineral water is 1 mg /L. The detailed data of Fe and Cu in the analyzedsamples (also for other minerals and chemicals Pb, Cd, Cr, Mn, Hg, and Zn, as described inthe following sub-sections), are not shown in Tables 5 and 6 due to their low concentrations,and the values did not exceed the recommended value of standard agencies.
3.12. Lead (Pb) and Cadmium (Cd)
According to standard guidelines of BIS (2012), WHO (2008;2017), SASO (1994), FDA(2008), IBWA (2008), and US EPA (2018), the highest desirable limit of lead in drinkingwater should be 0.1 mg/L, 0.01 mg/L, 0.03 mg/L, 0.05 mg/L, 0.005 mg/L, and 0.0 mg/L,respectively. The mean value of Pb in the investigated sample was found to be less than10 µg/L, and this value indicates that the water is harmless.
Cadmium is a carcinogenic element that is very toxic and has no known biologicalrole. Scientists believe that excessive concentration of cadmium may cause liver and kidneydamage, anemia, and death [36]. Brittle bone disorder has occurred due to Cd. Accordingto standard guidelines (Table 4), cadmium with a level of 3–5 µg /L is not harmful to health.The mean value of Cd in the investigated sample was found to be less than 3 ppb, and thisvalue indicates that the water is harmless.
3.13. Manganese (Mn) and Chromium (Cr)
Manganese exists in soil and sediment in the form of MnO2 and Mn2O3. Referringto the [63] guidelines, the standard limit of Mn in drinking water is 0.1 mg /L. Less than50 µg/L of Mn in drinking water can be drinkable, but a high level of Mn in water canbe poisonous [64]. A study shows that chlorosis disease occurs due to a lack of Mncontent in the human body. Chromium is leached into water from soil, rock, and burningof fuels (coal, oil). Chromite (FeCr2O4) is the main source of Cr minerals. In water,chromium can be found as ions from Cr+6 and Cr+3 but the Cr+3 ionic form has no toxiceffect. The Cr+6 ionic form has a toxic effect, and prolonged consumption can damagethe liver, kidneys, nerves, and the blood circulatory system [21]. The permissible limit ofchromium concentration in drinking water is 50µg/L. The concentration of Cr and Mn inthe investigated sample was found to be at a pleasant level and below the limiting valuesset by different standard agencies.
3.14. Mercury (Hg) and Zinc (Zn)
According to standard guidelines (Table 4), mercury with a concentration of 1–10 ppbis not harmful to health. The mean value of Hg in the investigated sample was found tobe less than 1–10 ppb, and this value indicates that the water is nontoxic to health. Thestandard limit of Hg in drinking water is less than 0.5 µg/L [2,64].
Zinc is beneficial for metabolism, and essential for healthy growth and a strongimmune system [65]. Zinc in drinking water is generally derived from the galvanizedcoatings of piping [21]. According to standard guidelines as listed in Table 4, Zn withconcentration of 3–5 mg/L is not harmful but it can impart a metallic taste or milkyappearance to water. The mean value of Zn in the investigated sample was found to beless than 3 mg/L, which indicates that the water is harmless for health.
3.15. Molybdenum (Mo) and Arsenic (As)
WHO (2011), FDA (2008), IBWA (2008), and US EPA (2018) have prescribed a provi-sional guideline for arsenic in drinking water—10 µg/L (Table 5). According to BIS (2012)and SASO (1994), the maximum permissible level is 50 µg/L, and the obtained As datashow a level below this limit.
The daily molybdenum dietary requirement for an adult body is 0.2 to 0.3 g. However,a high concentration of this metal causes bone deformation or slower physical developmentand more growth abnormalities. The WHO (2017) suggested that the permissible limit of
Water 2021, 13, 2026 15 of 20
Mo in drinking water is 70 µg/L. The concentration of Mo in the investigated sample wasfound to be at a pleasant level and below the standard limit prescribed by different agencies.
3.16. The Status of Other Parameters
In the studied local brands, imported brands, Zamzam, and tube-well waters, otherquality parameters such as color, order, hardness, alkalinity, dissolved oxygen, turbidity(NTU), phosphate, Co, Al, Ag, Ni, and Ba have not crossed permitted (Table 4) and ECR(1997) limits [66]. In addition, the data are not shown in Tables 5 and 6 due to theirinsignificant concentrations.
3.17. Microbial Status in the Investigated Samples
The status of total Coliform, Fecal Coliform, and E. Coli indicates the water qualitypollution level; the permissible limit given by different agencies is listed in Table 4. IBWA(2008), WHO (2011), SASO (1994), and BIS (2012) recommended that the presence oftotal coliforms might be zero in 100 mL for safe water. FDA (2008) and US EPA (2018)prescribe that the presence of total coliform in drinking water should be <2.2% and <5%,respectively. The WHO (2017) recommends that the permissible limit of Total Coliformand Fecal Coliform is less than 1.8 MPN/100 mL. The presence of E. coli, Total Coliform,Fecal Coliform in local brands, imported brands, and tube-well water were found to be0.0 MPN/100 mL, <1.8 MPN/100 mL, and <1.8 MPN/100 mL, respectively, which indicatesthat the studied bottled water is free of microbial problem and suitable for drinking. Themicrobial data are not shown in any table due to their very low concentrations, and all dataare below the recommended limits given by various agencies [39–44]. Zamzam water wasalso found to be free of E. coli, Total Coliform, and Fecal Coliform, as reported in a recentstudy [67].
3.18. Status of Radionuclides in the Investigated Samples
Apart from physicochemical elements and toxic materials, the radioactive isotopes alsocontaminate drinking water. In groundwater, the concentration of natural radionuclidesis connected to lithological leaching (granite and sandstone aquifers) [14]. The leachingamount is dependent on pH, temperature, water mineralization, etc. Human activitiessuch as melting, mining, fuel combustion, agricultural fertilizer, etc. are responsiblefor radionuclides contamination of drinking water by [14]. Generally, the low level ofradionuclides in water is safe, but a high level of radionuclides in water can cause aserious health problem. In this investigation, some radionuclides such as 40K, 238U, 226Ra,210Pb, 137Cs, 232Th, 210Po, and 222Rn were found to be at pleasant levels, as per WHO(2017) recommendation [59]. The permissible limit for 40K, 238U, 226Ra, 210Pb, 210Po, 222Rn,137Cs and 232Th activity in drinking water is 10 Bq/L, 180 mBq/L, 1.0 Bq/L, 200 mBq/L,100 mBq/L, 100 Bq/L, 100 Bq/L, and 0.1 Bq/L [60,64,68–71], respectively. The radionuclidesdata are not shown in any table due to their very low concentrations, and all data lie belowthe recommended limits given by various agencies [39–44]. Concentrations of 238U, 40K,137Cs, and 232Th in Zamzam water were reported to be 1.6 Bq/L, 3 Bq/L, 0.7 Bq/L, and1.2 Bq/L respectively, which is higher than some agencies values [59,72,73].
3.19. Drawbacks of Bottled Water
The Food and Agriculture Organization (FAO), and the World Wildlife Foundations(WWF) agree that bottled water is not cheaper than tap water because its environmentalcost is so high. Bottled water has been prescribed as a packaged food product sealed inplastic or glass containers or bottles. The plastic bottle is made of Polyvinyl Chloride(PVC) or Polyethylene Terephthalate (PET), which may contain organic (dioxins, biphenylA, phthalates, and other organics) and inorganic (copper, antimony, lead, and nickel)contaminants that are carcinogenic agents and very harmful to human health, ecosystems,and the environment [74,75]. Depending on container type, treatment system, and storageduration, bottled water quality can be affected. The IBWA prescribes that bottles should
Water 2021, 13, 2026 16 of 20
not be reuse or refilled because they contain lethal pathogens and leaches degradableplastic into the water [76]. Reused plastic bottle releases a slow rate of degradable plastic inwater per day —an average range of 1 to 3 ng per liter [8,77]. Evian and Perrier are naturalspring bottled water brands imported from France. The sale price for bottles containing330 and 750 mL of Perrier, 600 mL of Evian, and 500 mL of local brand water are BDT126 and BDT 270, BDT 133, and BDT 15, respectively [15]. Consequently, majority of thepeople do not drink imported brands of water due to the high price. Seasonal variation,groundwater quality, water layer or source availability, natural disaster, and man-madeactivities are responsible for poor water quality [77,78]. However, this purified water canbe compromised [42].
4. Conclusions and Recommendations
This study shows that imported brands, Zamzam water, and tube-well water containmore minerals than local brands of bottled water, and these mineral profiles fulfill theDietary Reference Intakes requirements better than local brands. The obtained data showthat the level of dissolved minerals in local brands of bottled water is very low, whichis quite alarming, and may cause malnourishment. The local brand samples (Code D1and D8) were good in quality to some extent but most were very poor in quality, from ascientific point of view. Local brands of bottled water in Bangladesh contain low nutrientlevels, which is a matter of great concern. Another study showed that local companiesneither maintainBDS-1414:2000 standards nor protect consumer rights [79]. Owing to a lackof laws and policies for the production of quality drinking water, most companies producedistilled water, which is harmful to human health. Most water production companies donot mention the exact water source, adding derivatives and tested value of water qualityparameters on bottle labels. The bottle’s label also has no internal scaling, which is frownedupon by national and international standard guidelines. There is a significant difference inprice between imported and local brands of bottled water. More than 50 national, regional,governmental and non-governmental industries produce drinking water with low quality.
On the other hand, drinking water-related rules and regulations in Bangladesh focusonly on bacteria and toxins, while other parameters are not highlighted. However, concern-ing mineral balance, a good guideline is urgently required for private and public drinkingwater producers to preserve or improve the mineral content and mineral balance in theirdrinking water. Purified water should always be re-mineralized with the least level ofmacro-constituents such as Ca, Mg, HCO3, and SO4. A mixture of calcitic-dolomitic lime-stone is preferable for re-mineralization after RO [1,2]. Regulation is needed to prescribeto standard levels of minerals content. Specific tap or bottled water must have significantspecific health value. Clean, safe, and re-mineralized water provides a win-win situationfor public health. Thus, it should be included as an academic course at the university levelin different educational phases. To provide clean and safe drinking water to all citizens, thebottled water industry should follow strong guidelines; however, currently, many of themuse public water sources for their products, which are a threat to food safety. To protect theenvironment and ensure good health, it is vital that plastic bottled water is avoided and theuse of water in glass bottles is encouraged, as is done in the EU. Globally, we need policyawareness regarding this issue, with the development and enforcement of regulations thatwill provide clean, safe, re-mineralized water [1]. The responsible government departmentshould undertake strict inspection to improve water quality and improve water bottlelabels to showcase the correct water characteristics. If we want safe mineral water, we mustprotect our water sources by keeping raw water as clean as possible, have a well-maintaineddistribution system, adequate treatment by including disinfection, and additional processesto remove or inactivate contaminants. Finally, strong water quality standards, regularobservations, testing, operator training, monitoring, certification, reporting, placing publicnotices, contingency planning, adequate funding, and research are obligatory to ensuresafe drinking water in Bangladesh and worldwide.
Water 2021, 13, 2026 17 of 20
Supplementary Materials: The following are available online at https://www.mdpi.com/article/10.3390/w13152026/s1, Table S1: WHO recommended minimum level of some mineral nutrientsshould be available in drinking water, Table S2: Some common and rare chemical ingredients,Table S3: The Dietary Reference Intakes (DRIs) of selected mineral elements.
Author Contributions: Conceptualization, M.R.U.; methodology, M.R.U.; software, N.A.; validation,A.S.I.M.J. and M.J.A.; formal analysis, M.R.U.; investigation, M.R.U.; resources, R.S., M.H. and S.S.;data curation, M.R.U.; writing—original draft preparation, M.R.U.; writing—review and editing,M.U.K.; visualization, H.O. and A.S.; supervision, M.U.K.; project administration, B.H.E. and M.I.S.;funding acquisition, H.O. and B.H.E. All authors have read and agreed to the published version ofthe manuscript.
Funding: The APC was funded by Taif University Researchers Supporting Project, number (TURSP-2020/127), Taif, Saudi Arabia.
Institutional Review Board Statement: Not Applicable.
Informed Consent Statement: Not Applicable.
Data Availability Statement: All data are available in the manuscript.
Acknowledgments: The authors acknowledge the support of Taif University Researchers SupportingProject, number (TURSP-2020/127), Taif University, Taif, Saudi Arabia.
Conflicts of Interest: The authors declare no conflict of interest.
References1. Rosborg, I.; Kozisek, F. Drinking Water Minerals and Mineral Balance; Springer: Berlin/Heidelberg, Germany, 2016; p. 175. Available
online: https://link.springer.com/book/10.1007%2F978-3-030-18034-8 (accessed on 7 May 2021).2. Puri, A.; Kumar, M. A review of permissible limits of drinking water. Indian J. Occup. Environ. Med. 2012, 16, 40–44. [CrossRef]3. Steve, E.H.; Elizabeth, J. Safe Drinking Water; IWA Publishing: London, UK, 2004; Available online: https://books.google.com.bd/
books?id=KhiKu7nyCD0C (accessed on 10 May 2021).4. European Commission. On the quality of water intended for human consumption. Off. J. Eur. Communities 1998, 330, 32–54. Available
online: http://data.europa.eu/eli/dir/1998/83/oj (accessed on 10 May 2021).5. Chau, N.D.; Tomaszewska, B. Mineral and Bottled Water as Natural Beverages. In Bottled and Packaged Water; Elsevier: Amsterdam,
The Netherlands, 2019; pp. 1–38.6. Brian, C.H. Message in a Bottle, 2006, E/Environmental Magazine. Available online: http://www.emagazine.com/view/?1125
(accessed on 7 May 2021).7. Rahman, I.M.; Barua, S.; Barua, R.; Mutsuddi, R.; Alamgir, M.; Islam, F.; Begum, Z.A.; Hasegawa, H. Quality assessment of the
non-carbonated bottled drinking water marketed in Bangladesh and comparison with tap water. Food Control. 2017, 73, 1149–1158.[CrossRef]
8. Miller, M. Bottled Water: Why is it So Big? Causes for the Rapid Growth of Bottled Water Industries. 2006. Available online:https://digital.library.txstate.edu/bitstream/handle/10877/3296/fulltext.pdf (accessed on 11 May 2021).
9. Jamal, A.H.M.S.I.M.; Ahsan, A.; Ahmed, S.; Akter, S.; Sultana, R.; Nahar, A.; Uddin, R. Physicochemical and MicrobiologicalQuality of Potable Water Supplied by DWASA in Dhaka City of Bangladesh. Am. J. Biol. Environ. Stat. 2020, 6, 1. [CrossRef]
10. Xiao, S.; Lv, X.; Zeng, Y.; Jin, T.; Luo, L.; Zhang, B.; Zhang, G.; Wang, Y.; Feng, L.; Zhu, Y.; et al. Mutagenicity and estrogenicity ofraw water and drinking water in an industrialized city in the Yangtze River Delta. Chemosphere 2017, 185, 647–655. [CrossRef]
11. Hakizimana, J.N.; Gourich, B.; Chafi, M.; Stiriba, Y.; Vial, C.; Drogui, P.; Naja, J. Electrocoagulation process in water treatment: Areview of electrocoagulation modeling approaches. Desalination 2017, 404, 1–21. [CrossRef]
12. Zhang, S.; Gitungo, S.W.; Axe, L.; Raczko, R.F.; Dyksen, J.E. Biologically active filters—An advanced water treatment process forcontaminants of emerging concern. Water Res. 2017, 114, 31–41. [CrossRef]
13. Fares, R.; Aissa, A.; Bouadi, A.; Lounis, M. Biological Treatment of wastewater by Addition of Activated carbon powder (CAP). J.Waste Recycl. 2018, 3, 1–7. Available online: http://www.imedpub.com/resources-recycling-and-waste-management/ (accessedon 11 May 2021).
14. Ahmed, M.B.; Zhou, J.L.; Ngo, H.H.; Guo, W.; Thomaidis, N.; Xu, J. Progress in the biological and chemical treatment technologiesfor emerging contaminant removal from wastewater: A critical review. J. Hazard. Mater. 2017, 323, 274–298. [CrossRef] [PubMed]
15. Ahmed, T.; Rashid, K.; Hossain, I. Nutrient minerals in commercially available bottled waters of Bangladesh: Dietary implications.Bangladesh J. Sci. Ind. Res. 2016, 51, 111–120. [CrossRef]
16. Islam, M.R.; Sarkar, M.K.I.; Afrin, T.; Rahman, S.S.; Talukder, R.I.; Howlader, B.K.; Khaleque, M.A. A study on total dissolvedsolids and hardness level of drinking mineral water in Bangladesh. Am. J. Appl. Chem. 2016, 4, 164–169. Available online:http//:www.who.int/water_sanitation_health/dwq/nutrientschap12.pdf (accessed on 12 May 2021). [CrossRef]
Water 2021, 13, 2026 18 of 20
17. Khalid, N.; Ahmad, A.; Khalid, S.; Ahmed, A.; Irfan, M. Mineral Composition and Health Functionality of Zamzam Water: AReview. Int. J. Food Prop. 2013, 17, 661–677. [CrossRef]
18. Shomar, B. Zamzam water: Concentration of trace elements and other characteristics. Chemosphere 2012, 86, 600–605. [CrossRef]19. Munir, N.; Shoaib, M.; Asad, M.J.; Tanooli, A.Y.; Munir, N.; Sherwani, S.K. Physio-Chemical differences between Aab-E-ZamZam
and mineral water effect of water intake on blood pressure. Am. Eurasian J. Toxicol. Sci. 2015, 7, 83–87. [CrossRef]20. Abu-Taweel, G.M. Effects of perinatal exposure to Zamzam water on the teratological studies of the mice offspring. Saudi J. Biol.
Sci. 2017, 24, 892–900. [CrossRef]21. Alfadul, S.M.; Khan, M.A. Water quality of bottled water in the kingdom of Saudi Arabia: A comparative study with Riyadh
municipal and Zamzam water. J. Environ. Sci. Health Part A 2011, 46, 1519–1528. [CrossRef]22. American Public Health Association. Standard Methods for the Examination of Water and Wastewater, 23th ed.; APHA: Washington,
DC, USA, 2017; Available online: http://www.aphabookstore.org (accessed on 15 May 2021).23. Yasmin, S.; Barua, B.S.; Khandaker, M.U.; Kamal, M.; Rashid, A.; Sani, S.A.; Ahmed, H.; Nikouravan, B.; Bradley, D. The presence
of radioactive materials in soil, sand and sediment samples of Potenga sea beach area, Chittagong, Bangladesh: Geologicalcharacteristics and environmental implication. Results Phys. 2018, 8, 1268–1274. [CrossRef]
24. World Health Organization. Nutrients in Drinking Water; (No. WHO/SDE/WSH/05.09); World Health Organization: Geneva,Switzerland, 2005; Available online: https://apps.who.int/iris/handle/10665/43403 (accessed on 16 May 2021).
25. National Academy of Sciences. Drinking-Water and Health; National Academy Press: Washington, DC, USA, 1997; Volume I,Available online: https://www.nap.edu/catalog/1780.html (accessed on 16 May 2021).
26. National Research Council. Recommended Dietary Allowances, 10th ed.; Food and Nutrition Board, National Academy Press:Washington, DC, USA, 1989; Available online: https://www.nap.edu/catalog/1349.html (accessed on 12 May 2021).
27. Mahmood, S.N.; Siddiqui, I.U.; Sultana, L.; Khan, F.A. Evaluation of chemical and bacteriological quality of locally producedbottled water. J. Chem. Soc. Pak. 2004, 26, 185–190. Available online: https://www.researchgate.net/publication/290515954_Evaluation_of_chemical_and_bacteriological_quality_of_locally_produced_bottled_water (accessed on 7 May 2021).
28. Astel, A. Mineral Water: Types of Mineral Water. Encycl. Food Health 2016, 763–766. [CrossRef]29. Sievers, E. Nutrient Minerals in Drinking Water: Implications for the Nutrition of Infants and Young Children. Nutr. Drink. Water
2005, 164. Available online: https://www.who.int/water_sanitation_health/dwq/nutrientsindw.pdf (accessed on 17 May 2021).30. International Bottled Water Association. 2006. Available online: http://www.bottledwater.org (accessed on 14 May 2021).31. National Resource Defense Council, NRDC. Bottled Water: Pure Drink or Pure Hype. 1999. (Rev. 2006). Available online:
http://www.nrdc.org/water/drinking/nbw.asp (accessed on 5 May 2021).32. Register, F. National primary and secondary drinking water regulations. US EPA 1989, 64, 67450–67467. Available online:
http://www.epa.gov/safewater/consumer/pdf/mcl.pdf (accessed on 2 May 2021).33. NSF International. 2006. Available online: http://www.nsf.org/ (accessed on 1 May 2021).34. Astel, A.; Michalski, R.; Łyko, A.; Jabłonska-Czapla, M.; Bigus, K.; Szopa, S.; Kwiecinska, A. Characterization of bottled mineral
waters marketed in Poland using hierarchical cluster analysis. J. Geochem. Explor. 2014, 143, 136–145. [CrossRef]35. Azoulay, A.; Garzon, P.; Eisenberg, M.J. Comparison of the mineral content of tap water and bottled waters. J. Gen. Intern. Med.
2001, 16, 168–175. [CrossRef]36. Bertoldi, D.; Bontempo, L.; Larcher, R.; Nicolini, G.; Voerkelius, S.; Lorenz, G.D.; Ueckermann, H.; Froeschl, H.; Baxter, M.J.;
Hoogewerff, J.; et al. Survey of the chemical composition of 571 European bottled mineral waters. J. Food Compos. Anal. 2011, 24,376–385. [CrossRef]
37. El-Zaiat, S.Y. Inherent optical properties of Zamzam water in the visible spectrum: Dispersion analysis. Arab. J. Sci. Engineering.Sect. B Eng. 2007, 32, 171–180.
38. Hirst, R.R.; Levitt, J.A.; Corovo, J. Bottled Water and Tap Water: Just the Facts-A Comparison of Regulatory Requirements forQuality and Monitoring Drinking Water in the United States, Drinking Water Research Foundation. Alex. Drink. -Water Res.Foundation. Alex. 2011, VA. Available online: www.bottledwater.org/files/BW%20PWS%20Just%20the%20Facts%202011%20Final.pdf (accessed on 18 May 2021).
39. World Health Organization. Guidelines for Drinking-Water Quality, 4th ed.; World Health Organization: Geneva, Switzerland, 2011;Available online: https://apps.who.int/iris/bitstream/handle/10665/44584/9789241548151_eng.pdf?sequence=1 (accessed on17 May 2021).
40. FDA. Bottled Water Everywhere: Keeping it Safe. Available online: http://www.fda.gov/consumer/updates/bottledwater082508.html (accessed on 26 August 2008).
41. Saudi Arabian Standards Organization. Bottled and Unbottled Drinking Water. Standard No. 409, Saudi Arabia. 1994. Availableonline: http://www.saso-gov.com/index.php?rzmb.html (accessed on 19 May 2021).
42. International Bottled Water Association. Bottled Water Code of Practice; IBWA: Alexandria, VA, USA, 2008; Available online:http://bottledwater.org/public/modelmain.htm (accessed on 5 May 2021).
43. The United States Environmental Protection Agency, US EPA. Edition of the Drinking Water Standards and Health Advisories Tables;Environmental Protection Agency: Washing, DC, USA, 2018. Available online: https://www.epa.gov/sites/production/files/2018-03/documents/dwtable2018.pdf (accessed on 21 May 2021).
44. Bureau of Indian Standards (BIS). Specification for Drinking Water; Indian Standards Institution: New Delhi, India, 2012; pp. 1–5.Available online: https://law.resource.org/pub/in/bis/S06/is.10500.2012.pdf (accessed on 22 May 2021).
Water 2021, 13, 2026 19 of 20
45. World Health Organization. Guidelines for Drinking-Water Quality, 3th ed.; WHO: Geneva, Switzerland, 2006; ISBN 92-4-154696-4.Available online: http://helid.digicollection.org/en/d/Js8578e/ (accessed on 23 May 2021).
46. European Communities, Directive 80/777/EEC, Council Directive of 15 July 1980 on the Approximation of the Laws of theMember States Relating to the Exploitation and Marketing of Natural Mineral Water, L229/1–L229/10. Available online:https://eur-lex.europa.eu/legal-content/EN/ALL/?uri=CELEX%3A31980L0777 (accessed on 24 May 2021).
47. Uddin, R.; Hossain, M.; Akter, S.; Ali, M.E.; Ahsan, A. Assessment of some physicochemical parameters and determining thecorrosive characteristics of the Karnaphuli estuarine water, Chittagong, Bangladesh. Water Sci. 2020, 34, 164–180. [CrossRef]
48. Boyd, D.R. The Water We Drink: An International Comparison of Drinking Water Quality Standards and Guidelines; David SuzukiFoundation: Vancouver, BC, Canada, 2006; Available online: https://davidsuzuki.org/science-learning-centre-article/the-water-we-drink-an-international-comparison-of-drinking-water-standards-and-guidelines/ (accessed on 27 May 2021).
49. Chauhan, J.S.; Badwal, T.; Badola, N. Assessment of potability of spring water and its health implication in a hilly village ofUttarakhand, India. Appl. Water Sci. 2020, 10, 73. [CrossRef]
50. Uddin, M.R.; Bhuyain, R.H.; Ali, M.E.; Ahsan, M.A. Pollution and ecological risk evaluation for the environmental impact onKarnaphuli river, Bangladesh. Int. J. Fish. Aquat. Res. 2019, 4, 38–48. Available online: http://www.fishjournals.com/archives/2019/vol4/issue3/4-3-14 (accessed on 27 May 2021).
51. Ghosh, A.; Mukherjee, K.; Ghosh, S.K.; Saha, B. Sources and toxicity of fluoride in the environment. Res. Chem. Intermed. 2012, 39,2881–2915. [CrossRef]
52. Cheremisinoff, N.P.; Davletshin, A. Hydraulic Fracturing Operations: Handbook of Environmental Management Practices; John Wiley &Sons: Hoboken, NJ, USA, 2015; Available online: https://www.amazon.com/Hydraulic-Fracturing-Operations-Environmental-Management/dp/1118946359 (accessed on 17 May 2021).
53. National Academy of Sciences, NAS, Dietary reference intakes for calcium, phosphorous, magnesium, vitamin D, and fluoride, Institute ofMedicine; National Academy Press: Washington, DC, USA, 1997; Available online: https://www.nationalacademies.org/our-work/summary-report-of-the-dietary-reference-intakes (accessed on 17 May 2021).
54. National Academy of Sciences, NAS, Dietary Reference Intakes (DRIs): Recommended Intakes for Individuals, Elements. Food and NutritionBoard, Institute of Medicine; National Academy Press: Washington, DC, USA, 2004. Available online: https://www.nal.usda.gov/sites/default/files/fnic_uploads/DRIEssentialGuideNutReq.pdf (accessed on 17 May 2021).
55. Drever, J.I. The Geochemistry of Natural Waters, 3rd ed.; Prentice-Hall: Hoboken, NJ, USA, 1997; p. 436. Available online: https://www.amazon.com/Geochemistry-Natural-Waters-Groundwater-Environments/dp/0132727900 (accessed on 19 May 2021).
56. Jaworska-Szulc, B.; Pruszkowska-Caceres, M.; Przewłócka, M. Chemical composition of groundwater in the Quaternary layer ofselected supply and drainage areas in the Gdansk aquifer. Hydrogeology 2017, 1, 57–67. Available online: https://mostwiedzy.pl/pl/magazine/hydrogeologia,1-31533 (accessed on 14 May 2021).
57. Durlach, J. Present, and future of magnesium research. J. Jpn. Soc. Magnes. Res. 1913, 12, 113–135. Available online: http://www.mgwater.com/dur05.shtml (accessed on 27 May 2021).
58. Durlach, J.; Bara, M.; Guiet-Bara, A. Magnesium level in drinking water and cardiovascular risk factor: A hypothe-sis. Magnesium1985, 4, 5–15. Available online: https://europepmc.org/article/med/4033205 (accessed on 17 May 2021). [PubMed]
59. Guidelines for Drinking-Water Quality, 4th ed.; WHO: Geneva, Switzerland; Available online: https://www.who.int/publications/i/item/9789241549950 (accessed on 7 May 2021).
60. Ward, L.A.; Cain, O.L.; Mullally, R.A.; Holliday, K.S.; Wernham, A.G.; Baillie, P.D.; Greenfield, S.M. Health beliefs about bottledwater: A qualitative study. BMC Public Health 2009, 9, 196. [CrossRef]
61. FAO/WHO. Requirement of Vitamin A, Iron, Folate, and Vitamin BFood and Agricultural Organization of the United Nations,FAO Food and Nutrition Series (No. 23), Report of a Joint FAO/WHO Expend Consultation Rome. 1988. Available online:https://books.google.com.bd/books?id=O7kbJ0UbtPwC (accessed on 22 May 2021).
62. Salehi, I.; Ghiasi, M.; Rahmani, A.R.; Sepehr, M.N.; Kiamanesh, M.; Rafati, L. Evaluation of microbial and Physico-chemicalquality of bottled water produced in Hamadan province of Iran. J. Food Qual. Hazards Control. 2014, 1, 21–24.
63. Bolewski, A.; Manecki, A. Particulars Mineralogy; PAE: Warsaw, Poland, 1993; p. 662. Available online: http://www.mineralogia.pl/history.html (accessed on 23 May 2021).
64. RMZ. Regulation of the Minister of Health of Polish Legislation for Concerning Drinking Water Quality; Dz, U., Ed.; Ministry of Health:Warsaw, Poland, 2017; p. 2294. (In Polish)
65. Resma, N.S.; Meaze, A.M.H.; Hossain, S.; Khandaker, M.U.; Kamal, M.; Deb, N. The presence of toxic metals in popular farmedfish species and estimation of health risks through their consumption. Phys. Open 2020, 5, 100052. [CrossRef]
66. Environment Conservation Rules. Department of Environment, Ministry of Environment and Forest, Govt. of the People’sRepublic of Bangladesh. 1997. Available online: http://extwprlegs1.fao.org/docs/pdf/bgd19918.pdf (accessed on 21 May 2021).
67. Al-Barakah, F.N.; Al-Jassas, A.M.; Aly, A.A. Water quality assessment and hydrochemical characterization of Zamzam groundwa-ter, Saudi Arabia. Appl. Water Sci. 2017, 7, 3985–3996. [CrossRef]
68. Shuaibu, H.K.; Khandaker, M.U.; Baballe, A.; Tata, S.; Adamu, M.A. Determination of radon concentration in ground-water ofGadau, Bauchi State, Nigeria and estimation of effective dose. Radiat. Phys. Chem. 2021, 178, 108934. [CrossRef]
69. Khandaker, M.U.; Wahib, N.B.; Amin, Y.M.; Bradley, D. Committed effective dose from naturally occuring radionuclides inshellfish. Radiat. Phys. Chem. 2013, 88, 1–6. [CrossRef]
Water 2021, 13, 2026 20 of 20
70. Khandaker, M.U.; Nasir, N.L.M.; Zakirin, N.S.; Abu Kassim, H.; Asaduzzaman, K.; Bradley, D.; Zulkifli, M.Z.; Hayyan, A.Radiation dose to the Malaysian populace via the consumption of bottled mineral water. Radiat. Phys. Chem. 2017, 140, 173–179.[CrossRef]
71. Khandaker, M.U.; Uwatse, O.B.; Khairi, K.A.B.S.; Faruque, M.R.I.; Bradley, D.A. Terrestrial radionuclides in surface (dam) waterand concomitant dose in metropolitan kuala lumpur. Radiat. Prot. Dosim. 2019, 185, 343–350. [CrossRef]
72. Voda. 2017. Available online: www.vodanaturalna.pl (accessed on 11 July 2020).73. Khandaker, M.U.; Heffny, N.; Adillah, B.; Amin, Y.M.; Bradley, D. Elevated concentration of radioactive potassium in edible algae
cultivated in Malaysian seas and estimation of ingestion dose to humans. Algal Res. 2019, 38, 101386. [CrossRef]74. CDC. Information about COVID-19 Vaccines for Women Who Are Pregnant or Breastfeeding. Available online: https://www.
portspb.ru/ (accessed on 26 May 2021).75. Keresztes, S.; Tatár, E.; Mihucz, V.; Virág, I.; Majdik, C.; Záray, G. Leaching of antimony from polyethylene terephthalate (PET)
bottles into mineral water. Sci. Total. Environ. 2009, 407, 4731–4735. [CrossRef] [PubMed]76. Cecil. Adams. Can Water Be Too Pure? is Too Much Water Bad for You? The Straight Dope. 2002. Available online:
https://www.straightdope.com/21343480/can-water-be-too-pure-is-too-much-water-bad-for-you (accessed on 24 May 2021).77. Lucas. Cutler Water Bottle Bacteria Risk Cited. Algonquin Times. 2003. Available online: http://web.archive.org/web/20030423
015446/http://www.algonquinc.on.ca/times/news5.html (accessed on 17 May 2021).78. Karamanis, D.; Stamoulis, K.; Ioannides, K. Natural radionuclides and heavy metals in bottled water in Greece. Desalination 2007,
213, 90–97. [CrossRef]79. Hasan, N.; Sadik, S.; Saha, S.K.; Rahman, M.Z.; Rahman, M.M. Chemical Characterization and Quality Compliance of Bottled
Mineral Water in Bangladesh. Dhaka Univ. J. Sci. 2011, 59, 33.