Embed Size (px)
Citation preview

IEEE TRANSACTIONS ON SYSTEMS, MAN, AND CYBERNETICS—PART A: SYSTEMS AND HUMANS, VOL. 38, NO. 1, JANUARY 2008 93
Trading With a Stock Chart HeuristicWilliam Leigh, Cheryl J. Frohlich, Steven Hornik, Russell L. Purvis, and Tom L. Roberts
Abstract—The efficient market hypothesis (EMH) is a cor-nerstone of financial economics. The EMH asserts that securityprices fully reflect all available information and that the stockmarket prices securities at their fair values. Therefore, investorscannot consistently “beat the market” because stocks reside inperpetual equilibrium, making research efforts futile. This fliesin the face of the conventional nonacademic wisdom that astuteanalysts can beat the market using technical or fundamental stockanalysis. The purpose of this research is to partially assess whethertechnical analysts, who predict future stock prices by analyzingpast stock prices, can consistently achieve a trading return thatoutperforms the stock market average return. This is tested us-ing knowlege engineering experimentation with one price historypattern—the “bull flag stock chart”—which signals technical ana-lysts of a future stock market price increase. A recognizer for thestock chart pattern is built using a template-matching techniquefrom pattern recognition. The recognizer and associated tradingrules are then tested by simulating trading on over 35 yearsof daily closing price data for the New York Stock ExchangeComposite Index. The experiment is then replicated using thehorizontal rotation or mirror image pattern of the “bull flag”(or “bear flag” stock chart) that signals a future stock marketdecrease. Results are systematic, statistically significant, and fail toconfirm the null hypothesis based on a corollary to the EMH: thatprofit realized from trading determined by this heuristic methodis no better than what would be realized from trading decisionsbased on random choice.
Index Terms—Efficient market hypothesis (EMH), expertsystems, heuristics, knowledge engineering, stock market fore-casting, technical analysis.
I. INTRODUCTION
FOR OVER three decades, a conspicuous contradiction hasexisted in the financial economic literature. On one side
of the contradiction is the efficient market hypothesis (EMH),one of the most widely accepted theories in economics thatis a cornerstone of academic finance. Simply stated, the EMHasserts that security prices fully reflect all available informationand that the stock market prices securities at their fair values.As a result, the stock market is always perfectly mediated, with
Manuscript received February 2, 2002; revised February 27, 2004. This paperwas recommended by Associate Editor P. A. Beling.
W. Leigh and S. Hornik are with the Department of Management InformationSystems, College of Business, University of Central Florida, Orlando, FL32816-1400 USA (e-mail: [email protected]; [email protected];[email protected]).
C. J. Frohlich is with the University of North Florida, Jacksonville,FL 32224-2645 USA (e-mail: [email protected]).
R. L. Purvis is with the Department of Management, Clemson University,Clemson, SC 29634-5124 USA (e-mail: [email protected]).
T. L. Roberts is with the Department of Management and Informa-tion Systems, Louisiana Tech University, Ruston, LA 71272 USA (e-mail:[email protected]).
Color versions of one or more of the figures in this paper are available onlineat http://ieeexplore.ieee.org.
Digital Object Identifier 10.1109/TSMCA.2007.909508
no opportunity for above-normal profits, and expenditures onresearch and trading are a waste of energy and resources. Theother side of the contradiction is the conventional (nonacad-emic) wisdom that astute analysts can beat the market usingtechnical or fundamental stock analysis. Thousands of individ-uals in the investment management industry spend considerableamounts of time daily, gaining access to information, evaluatingthat information, and making investment decisions based onthat information. Consequently, it has been suggested that,“Either the hypothesis has an inherent flaw, or Wall Street andits customer base are in truth totally irrational” [1].
Charles Dow developed the original theory of technicalanalysis in 1884. Modern explications of the original Dowtheory are periodically published [2], and numerous booksand articles that explain and augment the core Dow theoryregularly appear in the practitioner literature. Accordingly,a formidable and well-subscribed knowledge base exists ontechnical analysis stock market forecasting. The purpose of thisresearch is to assess whether returns from trading based on aselected technical analysis market forecasting technique consis-tently and significantly exceed overall stock market investmentreturn performance. The EMH implies that trading based onthis technique will not and cannot outperform overall marketperformance.
Technical analysts look for patterns in the past price andvolume behavior of the stock market to predict future pricebehavior. This sort of analysis is called “stock charting.” Thetheory is that certain patterns in past behavior precede broadmarket increases, and certain other patterns in past price andvolume behavior precede market decreases. This research com-prises knowledge engineering and trading simulation testingwith one of the more pronounced price history patterns of thetechnical analysts—the “bull flag stock chart”—which signalstechnical analysts of a future stock market price increase. Usinga template-matching technique, a pattern recognizer assignsto each trading day in the study scores based on how theimmediate time series price history of that trading day conformsto the stock chart pattern. Associated trading rules based onthese scores are tested by simulating trading on over 35 yearsof daily closing price data for the New York Stock ExchangeComposite Index. The experiment is then replicated using thehorizontal rotation or mirror image pattern of the “bull flag”(or “bear flag” stock chart) that signals a future stock marketdecrease. Considering the bull flag stock chart pattern fromtechnical analysis to be prior knowledge, i.e., it is not learnedor its parameters are optimized, this study may be regarded asconfirmatory in nature.
The rest of the paper is organized as follows. Section IIdefines the theoretical concept of market efficiency and surveyssome of the research supporting and challenging it. In the next
1083-4427/$25.00 © 2007 IEEE
Authorized licensed use limited to: Hong. Downloaded on February 8, 2009 at 00:12 from IEEE Xplore. Restrictions apply.

94 IEEE TRANSACTIONS ON SYSTEMS, MAN, AND CYBERNETICS—PART A: SYSTEMS AND HUMANS, VOL. 38, NO. 1, JANUARY 2008
sections, the paper presents the research design and method,reports the results, explores a thought experiment based onthe results, speculates about wave motion in the stock market,sums up, and concludes.
II. EFFICIENT EMH AND ITS CHALLENGES
According to the definition of market efficiency [3], mar-ket prices instantly reflect all available information: 1) in theabsence of transaction costs; 2) given costless information;and 3) for homogeneous expectations. Right or wrong, moststudies assume that these three conditions are met, for practicalpurposes, in large, modern stock markets. The theory affordsthree degrees of market efficiency. The strong form of the EMHstates that all information (including private information) isimmediately factored into the market’s price for a security. Inthis form, no group of investors (particularly those investorswith inside or privileged corporate information) has informa-tion that allows them to earn abnormal profits. In the semistrongform of the EMH, all public information is considered to beimmediately reflected in the price. Most studies on semistrongefficiency have found that the market rapidly adjusts to newpublic information [4]–[6]. The weak form of the EMH holdsthat information that can be gained from examining the secu-rity’s past price and volume trading history is already reflectedin the securities price.
Although the EMH has been the basis for much of theresearch in financial economics [7] and is considered by someto be the best established empirical fact in economics [8], [7],it is not universally accepted. At the extreme, the theory hasbeen called fundamentally flawed [9] and has been dismissedas impossible [10], and it has been argued that stock prices arenot rationally related to economic realities, negating any impactof informational efficiency [7]. Other studies challenge certainforms of the EMH. For example, several studies have foundthat insiders consistently earn abnormal returns on their stocktransactions [11]–[14], disputing the strong form of the EMH.
The theory is further challenged by a host of studies that offersoft computing approaches to automate stock trading. Theseapproaches, totally ignoring the EMH, regularly appear in theacademic literature and include: 1) neural-network learningfrom price history [12], [15], [16]; 2) neural network using real-world information [17]; 3) neural network using price history,money supply information, and trading group positions [18];4) fuzzy expert system based on several types of information[19]; 5) decision-support system using influence diagram [20];6) rough set extraction of trading rules from price history [21];7) fuzzy logic engineering [22]; 8) data mining based on signal-processing techniques [23]; and 9) rules [24] or agents [25],combining technical heuristics with other knowledge.
More germane to this research are studies that offer evidenceof weak-form market inefficiencies and, therefore, support fortechnical approaches to market trading and forecasting. Thesestudies, based on market momentum, trend reversal, meanreversion, and investor overreaction, are beginning to appearin prestigious academic journals (e.g., [15] and [26]–[29]).Further, surveys [30], [31] of this growing literature that doc-ument “anomalies” to the EMH are now appearing.
Fig. 1. Representation of a stock price chart showing the “bull flag” stockpattern.
Finally, two studies set out to directly test the use of stockchart heuristics and offer support to the EMH. Fama, an earlyEMH theorist, tested stock charting against the random-walkmodel by observing that the price changes, for the periodfrom 1957 to 1962, form a nearly normal frequency distrib-ution (but with one long tail because there were more largeincreases than small ones) [32]. Fama argues, questionably inour view, that since price changes are normally distributed,stock charting cannot be effective as a stock market trading tool.More recently, Lo et al. [33] have used nonparametric kernelregression to search for ten different stock chart patterns (butdid not include the bull flag or bear flag patterns used in thispaper) in the price histories of individual stocks and failed tofind significant profitability in trading simulation experiments,comparing the stock charting decision-making technique torandom choice.
III. RESEARCH DESIGN AND METHOD
A. Stock Chart Pattern Template Values T (i, j)
Fig. 1 illustrates an occurrence of a “flag,” a strong typeof stock chart pattern found in technical analysis instructionalarticles and books. A “flag” exemplifies a “consolidation for-mation,” i.e., a period of repetitive price oscillations in anarrow band, such as that marked by the two dashed, parallel,downward-sloping lines in Fig. 1. A bull flag pattern is ahorizontal or downward-sloping flag pattern that tracks a priceconsolidation, followed by a sharp positive price rise termedthe “breakout.” This occurrence of the bull flag stock chartpattern is encompassed by the dotted oval in Fig. 1. Technicalanalysts interpret the occurrence of a bull flag pattern as a strongupward price trend being interrupted by a period during whichinvestors “consolidate their gains” before a strong positivebullish breakout occurs and the upward price trend resumes.After the bullish breakout, the price is expected to continue inthe upward direction.
Fig. 2(a) contains a quantified synthesis and interpretation ofthe many examples of occurrences of the bull flag stock chartshown in the technical analysis instructional books, such as [2].The template T for the bull flag pattern, as shown in Fig. 1,is represented by a 10 × 10 matrix, whose cells T (i, j) havevalues that range from −2.5 to +1.0. Let the leftmost bottomcell of T , i.e., the cell at row one in column one, be designatedas T (1, 1). Cells with no entries have the numerical value
Authorized licensed use limited to: Hong. Downloaded on February 8, 2009 at 00:12 from IEEE Xplore. Restrictions apply.

LEIGH et al.: TRADING WITH A STOCK CHART HEURISTIC 95
Fig. 2. Matrix representations for the stock chart pattern templates T used inthis paper. The template T for the stock chart patterns is represented with a10 × 10 matrix, whose cells T (i, j) have values that range from −2.5 to +1.0.Let the leftmost bottom cell of T , i.e., the cell at row one in column one,be designated T (1, 1). Cells with no entries have the numerical value of 0.0.(a) Matrix values used for the “bull flag” stock chart pattern. (b) Matrix valuesfor the horizontal rotation or mirror pattern of the bull flag, which is the “bearflag” stock chart pattern.
of 0.0. Fig. 2(b) contains the corresponding horizontal rotationor mirror pattern—the bear flag.
This pattern of positive and negative weighting in Fig. 2(a),and mirrored in Fig. 2(b), is regular and defines areas in thetemplate for the descending price consolidation (leftmost sevencolumns) and for the upward-tilting price breakout (rightmostthree columns) portions of this interpretation of the bull flagheuristic pattern. The columns of the weights in the matrix areequally weighted (the sum of each row’s weight in a columnequals zero). The weights are selected so that those pricesthat deviate the farthest from the bull flag pattern (outlined inshading in Fig. 1) will have the largest negative effect on thetotal fitting score.
This study’s first assignment of weights T (i, j), representingthe bull flag stock chart pattern, used only 0 and 1 values.Although results with the 0–1 weights were encouraging, asecond assignment using fractional weights was devised andtested, as shown in Fig. 3(a). This fractional weighted modelwas used in this research. No other reassignment of weights,optimization, learning, or data mining was used to improveperformance. This, however, is certainly an area of interest forfuture research.
B. Price History Image Values Ik(i, j)
In this paper, 10 × 10 price history images Ik are constructedto end on each trading day k of the 9000 daily closing prices.
Fig. 3. Exhibits for a sample computation of FitAugust 5, 1980 andHeightAugust 5, 1980 for the 60-trading-day price history image window thatends on August 5, 1980. In this paper, 10 × 10 price history images Ik areconstructed to end on each trading day k of the 9000 daily closing prices. Thisis done in correspondence with a price history image window Wk that, in thefirst phase of this experiment, is 60 trading days long. A price history imagewindow Wk of trading days is constructed for each trading day k, and a pricehistory image Ik is computed from those closing prices, as described in thetext. To complete the computation of the measure of agreement between T andIk , the Fitk for the price history image window Wk is calculated by summingthe product of the cross-multiplication of the weights T (i, j) in the patterntemplate with the Ik(i, j) values. The price range, which is the differencefrom the highest to the lowest prices in a 60-day window ending on tradingday k, is divided by the closing price on trading day k to compute a scaledwindow height for each Wk . (a) Windsorized pk values for WAugust 5, 1980.(b) IAugust 5, 1980.
This is done in correspondence with a price history imagewindow Wk that, in the first phase of this experiment, is60 trading days long. The leftmost trading day dk−59 includedin the 60-day window Wk is the trading day that precedes k,which is the current day of interest by 59 trading days, and therightmost trading day in the window Wk is trading day k. Thus,60 daily closing price values pk−59, . . . , pk correspond to the60 trading days in each window Wk.
Within each 60-day window of closing price data, the pricetime series information is “windsorized” [34] to remove noiseby replacing closing price value observations beyond two stan-dard deviations from the mean (of the prices for trading daysincluded in Wk) with the respective two standard deviation(of the prices for trading days in Wk) boundary value. Thewindsorized closing price values, i.e., pk−59 to pk, for the60 trading days in a window Wk of history are broken intoten groups of six sequential trading-day closing prices, witheach column in the price history image matrix Ik assigned toone of the six-day groups. Let Ik(1, 1) designate the cell in thefirst row and the first column of the 10 × 10 price history imagematrix Ik, i.e., the cell in the lower left-hand corner of Ik. Then,for example, prices pk−59, . . . , pk−54 are mapped to the firstcolumn Ik(i, 1), and prices pk−5, . . . , pk are mapped to the lastrightmost column Ik(i, 10).
The value of a closing price is used to associate trading-dayinformation to a row within the assigned column in Ik. The
Authorized licensed use limited to: Hong. Downloaded on February 8, 2009 at 00:12 from IEEE Xplore. Restrictions apply.
96 IEEE TRANSACTIONS ON SYSTEMS, MAN, AND CYBERNETICS—PART A: SYSTEMS AND HUMANS, VOL. 38, NO. 1, JANUARY 2008
price range from the highest to the lowest prices is computedfor the prices in the 60-day window as
maxk
= maximum (pk−59, . . . , pk)
mink
= minimum (pk−59, . . . , pk)
rangek = maxk
−mink
.
One-tenth of this difference defines the price interval ∆k,which is mapped to each of the ten rows of the price historyimage Ik, i.e.,
∆k = rangek/10.
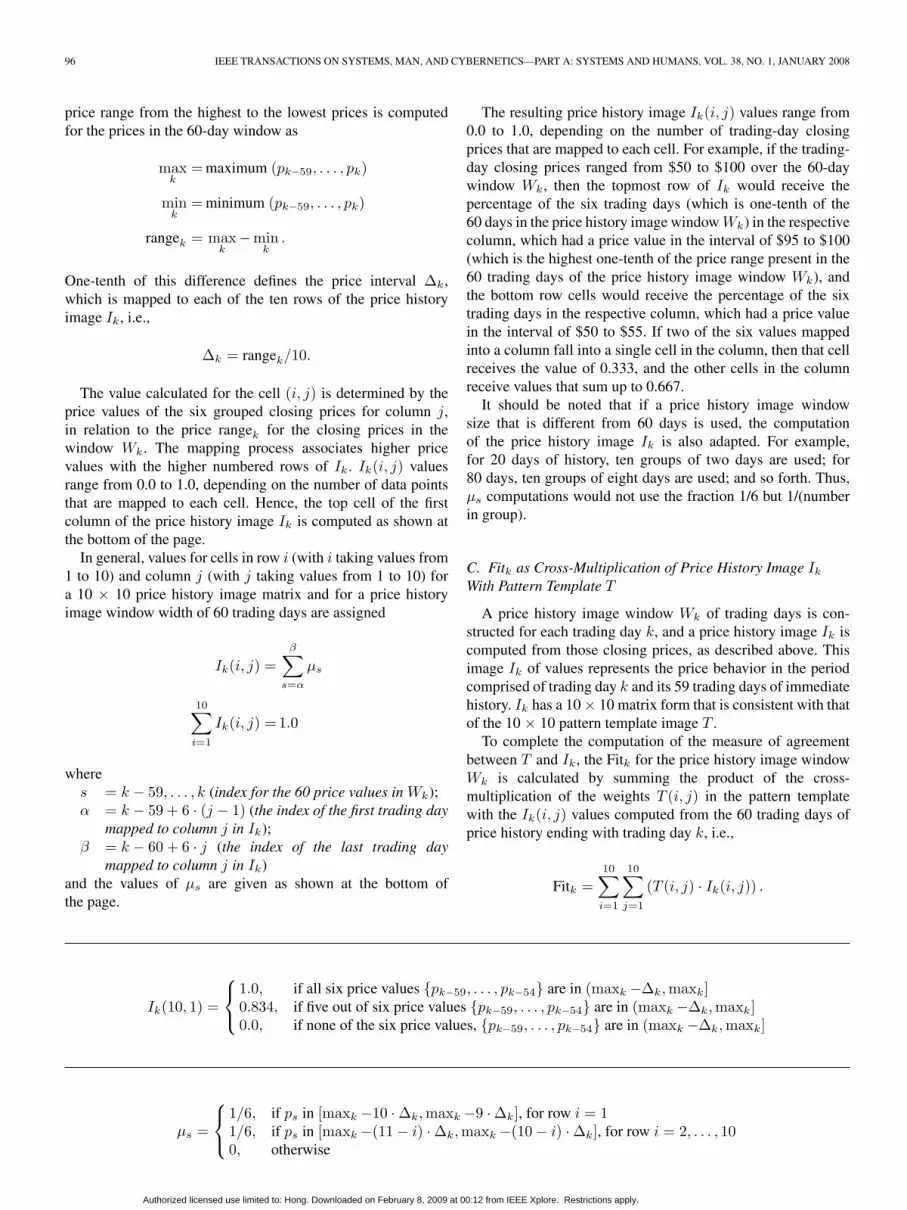
The value calculated for the cell (i, j) is determined by theprice values of the six grouped closing prices for column j,in relation to the price rangek for the closing prices in thewindow Wk. The mapping process associates higher pricevalues with the higher numbered rows of Ik. Ik(i, j) valuesrange from 0.0 to 1.0, depending on the number of data pointsthat are mapped to each cell. Hence, the top cell of the firstcolumn of the price history image Ik is computed as shown atthe bottom of the page.
In general, values for cells in row i (with i taking values from1 to 10) and column j (with j taking values from 1 to 10) fora 10 × 10 price history image matrix and for a price historyimage window width of 60 trading days are assigned
Ik(i, j) =β∑
s=α
µs
10∑i=1
Ik(i, j) = 1.0
wheres = k − 59, . . . , k (index for the 60 price values in Wk);α = k − 59 + 6 · (j − 1) (the index of the first trading day
mapped to column j in Ik);β = k − 60 + 6 · j (the index of the last trading day
mapped to column j in Ik)and the values of µs are given as shown at the bottom ofthe page.
The resulting price history image Ik(i, j) values range from0.0 to 1.0, depending on the number of trading-day closingprices that are mapped to each cell. For example, if the trading-day closing prices ranged from $50 to $100 over the 60-daywindow Wk, then the topmost row of Ik would receive thepercentage of the six trading days (which is one-tenth of the60 days in the price history image window Wk) in the respectivecolumn, which had a price value in the interval of $95 to $100(which is the highest one-tenth of the price range present in the60 trading days of the price history image window Wk), andthe bottom row cells would receive the percentage of the sixtrading days in the respective column, which had a price valuein the interval of $50 to $55. If two of the six values mappedinto a column fall into a single cell in the column, then that cellreceives the value of 0.333, and the other cells in the columnreceive values that sum up to 0.667.
It should be noted that if a price history image windowsize that is different from 60 days is used, the computationof the price history image Ik is also adapted. For example,for 20 days of history, ten groups of two days are used; for80 days, ten groups of eight days are used; and so forth. Thus,µs computations would not use the fraction 1/6 but 1/(numberin group).
C. Fitk as Cross-Multiplication of Price History Image Ik
With Pattern Template T
A price history image window Wk of trading days is con-structed for each trading day k, and a price history image Ik iscomputed from those closing prices, as described above. Thisimage Ik of values represents the price behavior in the periodcomprised of trading day k and its 59 trading days of immediatehistory. Ik has a 10 × 10 matrix form that is consistent with thatof the 10 × 10 pattern template image T .
To complete the computation of the measure of agreementbetween T and Ik, the Fitk for the price history image windowWk is calculated by summing the product of the cross-multiplication of the weights T (i, j) in the pattern templatewith the Ik(i, j) values computed from the 60 trading days ofprice history ending with trading day k, i.e.,
Fitk =10∑
i=1
10∑j=1
(T (i, j) · Ik(i, j)) .
Ik(10, 1) =
1.0, if all six price values {pk−59, . . . , pk−54} are in (maxk −∆k,maxk]0.834, if five out of six price values {pk−59, . . . , pk−54} are in (maxk −∆k,maxk]0.0, if none of the six price values, {pk−59, . . . , pk−54} are in (maxk −∆k,maxk]
µs =
1/6, if ps in [maxk −10 · ∆k,maxk −9 · ∆k], for row i = 11/6, if ps in [maxk −(11 − i) · ∆k,maxk −(10 − i) · ∆k], for row i = 2, . . . , 100, otherwise
Authorized licensed use limited to: Hong. Downloaded on February 8, 2009 at 00:12 from IEEE Xplore. Restrictions apply.

LEIGH et al.: TRADING WITH A STOCK CHART HEURISTIC 97
Note that the highest values of Fitk occur when the price historyimage Ik is in highest conformance with T . Next, the pricerange, which is the difference from the highest to the lowestprices in a 60-day window ending on trading day k, is dividedby the closing price on trading day k to compute a scaledwindow height for each Wk as follows:
Heightk = rangek/pk.
D. Example of Computation for WAugust 5,1980
Fig. 3(a) contains a time series graph of the windsorizedNew York Stock Exchange Composite Index closing valuesfor the 60-trading-day period ending on August 5, 1980. Onlythe first trading-day price out of the 60 prices in the windowwas affected by the treatment. The first trading day’s actualclosing price value of 632.1 was windsorized to 636.7. Fig. 3(b)shows the IAugust 5,1980 values computed for WAugust 5,1980.The resulting FitAugust 5,1980 is −2.92, and the resultingHeightAugust 5,1980 value is (741.2 − 636.7)/731.0 or 0.14.
E. Experimental Methodology
The stock chart pattern heuristics were treated as priorknowledge; template-matching techniques were used from pat-tern recognition to implement a recognizer for the stock chartpatterns. The developed model is then tested as a classifierto predict an increasing (bull flag) or decreasing (bear flag)future stock price. The values output by the recognizer, i.e., Fitkand Heightk, are then used to parameterize “trading rules” thatidentify trading days on which a buy (or sell, in the case of thebear flag) trade is appropriate.
This study is an example of knowledge engineering.General rules (in this case, trading rules based on stock chartrecognition) are acquired through the study of published liter-ature. Then, the rules are operationalized with algorithms andcomputing mechanisms and experimentally tested against datafor which results are known. Expert system and knowledgebase evaluation may be difficult and often involves many di-mensions, but the evaluation of the expert system describedin this paper is more structured and less complex than most,as stock trading performance may be defined in a quantifiedand objective manner. The expert task here, i.e., stock markettrading, is amenable to objective and quantitative evaluationthrough the use of profitability.
The overall average profitability for buying every day ofthe period of interest and holding for h trading days is thencomputed. This overall average profitability is then comparedto the average profitability attained by buying only on thosedays identified as buy days by the stock chart trading rulesand holding for h trading days. Using the central limit theory,the average profitability of buying on every day in the periodand holding for h trading days is equivalent to the averageprofitability of buying randomly and holding for h days. There-fore, any profit resulting from the application of a trading rulefilter that is greater than the average profit for the interval isan “excess” profit. In this way, the EMH is used as the nullhypothesis in this paper, and the finding of consistent and
statistically significant excess profits constitutes a failure toconfirm the EMH.
The Market Average Profit is calculated for both buyingstrategies for a comparison period as follows. First, define asbefore
k index for the 9000 trading days in the period ofthe study;
pk closing price value on trading day k;Fitk fit value computed as described above for trading
day k;Heightk height value computed as described above for
trading day k.Then, let
h number of trading days in the forecast horizon orholding period for stocks purchased; h is set to 5,10, 20, 40, 60, 80, 100 days;
m index of the first trading day in a period ofcomparison;
n index of the last trading day in a period ofcomparison;
σfit trading rule parameter value for the Fitk value;σheight trading rule parameter value for the Heightk value.The Market Average Profit for a comparison period of n −
m + 1 trading days for which the trading practice is to buyevery day at price pk and hold each purchase for h trading daysbefore selling at price pk+h now becomes
Market Average Profit(m,n, h)
=n∑
k=m
[(pk+h − pk)/pk] /(n − m + 1).
Next, results are calculated for the same comparison periodbut, this time, using the following Boolean buying trading rule:
Rule (k, σfit, σheight)
= “If Fitk > σfit and Heightk > σheight
then buy and hold for h trading days and sell.”
First, calculate the number of days a buy decision is made asfollows:
Number of Buys (m,n, σfit, σheight) =n∑
k=m
Rk,σfit,σheight
where
Rk,σfit,σheight ={
1, if Rule (k, σfit, σheight) is true0, otherwise.
Thus
Trading Rule Average Profit (m,n, h, σfit, σheight)
=n∑
k=m
[((pk+h − pk)Rk, σfit, σheight) /pk]
/Number of Buys (m,n, σfit, σheight).
Authorized licensed use limited to: Hong. Downloaded on February 8, 2009 at 00:12 from IEEE Xplore. Restrictions apply.

98 IEEE TRANSACTIONS ON SYSTEMS, MAN, AND CYBERNETICS—PART A: SYSTEMS AND HUMANS, VOL. 38, NO. 1, JANUARY 2008
TABLE IEXPERIMENTAL RESULTS FOR SIMULATED TRADING WITH A 60-TRADING-DAY PRICE HISTORY IMAGE WINDOW FOR THE STOCK CHART PATTERN
TEMPLATES SHOWN IN FIG. 2. THE TRADING RULE TESTED IS, “IF Fitk > σfit AND Heightk > σheight, THEN BUY AND HOLD FOR 60 TRADING DAYS
AND SELL.” THE FIRST ROW OF RESULTS IS AN OVERALL SUMMARY FOR THE COMPLETE TEST PERIOD OF 9000 TRADING DAYS. THE REMAINING
NINE ROWS OF SUMMARY DATA ARE FOR NINE SUBPERIODS OF 1000 TRADING DAYS EACH. (a) BULL FLAG. (b) BEAR FLAG
Finally, we have the following “excess” profits for the period ofcomparison:
Average Excess Profit (m,n, h, σfit, σheight)
= Trading Rule Average Profit (m,n, h, σfit, σheight)
− Market Average Profit (m,n, h).
IV. RESULTS OF SIMULATED TRADING
The described research design and method was applied tothe New York Stock Exchange Composite Index closing pricedata for the period from August 4, 1967 to May 12, 2003. Thisperiod includes 9000 trading days.
Table I(a) includes experimental results for a 60-trading-day price history image window and a 60-trading-day forecasthorizon for the bull flag stock chart pattern template shownin Fig. 2(a). The trading rule tested is, “If Fitk > σfit andHeightk > σheight, then buy and hold for 60 trading days andsell.” The first line of data in Table I(a) shows a Market AverageProfit of 1.83% for the entire period (buy on all 9000 tradingdays and hold for 60 days.) Then, the next value, reading fromleft to right in the first line of data in Table I(a), states that,for σfit = 0 and σheight = 0, the Trading Rule Average Profit is
1.56%. This value of 1.56%, of course, is less than the 1.83%Market Average Profit, but to continue reading to the right, forσfit = 4 and σheight = 0, the Trading Rule Average Profit is2.27%, with a Number of Buys for that trading rule of 838 (outof the 9000 trading days in the test period), and a p-value of0.0834. The p-value is from a one-tailed heteroscedastic t-test.(A Kolmogorov–Smirnov test for normality on the 9000 val-ues for profitability at a 60-trading-day horizon resulted in ap-value less than 0.01, indicating that these data are not nor-mally distributed.)
The entries in the rightmost four columns of the first lineof summary data in Table I(a) are results for trading rules ofthe form, “If Fitk > σfit and Heightk > σheight, then buy andhold for 60 trading days and sell,” for σheight = 0.1. In therightmost position of the first row, for σfit = 4 and σheight =0.1, the Trading Rule Average Profit is 4.59%, with a Numberof Buys of 382 and a p-value of 0.0000. The Trading RuleAverage Profit is higher than the Market Average Profit, and thep-value is 0.0000 for all values of σfit tested when σheight =0.1. Trading Rule Average Profit ranges from 3.17% up to4.59%. Note that as the values for σfit or σheight are increased,the Trading Rule Average Profit generally increases.
The remaining nine rows of summary data in Table I(a) arefor nine subperiods of 1000 trading days each. Blank positions
Authorized licensed use limited to: Hong. Downloaded on February 8, 2009 at 00:12 from IEEE Xplore. Restrictions apply.

LEIGH et al.: TRADING WITH A STOCK CHART HEURISTIC 99
TABLE IIEXPERIMENTAL RESULTS SUMMARIZED FOR 9000 DAYS OF SIMULATED
TRADING WITH A 60-TRADING-DAY PRICE HISTORY IMAGE WINDOW FOR
THE STOCK CHART PATTERN TEMPLATES SHOWN IN FIG. 2. THE TRADING
RULE TESTED IS, “IF Fitk > σfit AND Heightk > σheight, THEN BUY AND
HOLD FOR 60 TRADING DAYS AND SELL”. (a) BULL FLAG. (b) BEAR FLAG
in the table result when the trading rule did not indicateany buys during the subperiod. Results by subperiod are notuniformly supportive of the method, but there is a generalrepetition of the pattern of increasing σfit and σheight, resultingin increasing Trading Rule Average Profit.
Table I(b) includes summary data for simulated trading withthe stock chart pattern template shown in Fig. 2(b). This “bearflag” is the stock chart pattern that results from the horizontalrotation, or mirror, of the “bull flag” pattern, which was usedto obtain the results reported in Table I(a). Table I(b) has thesame structure as Table I(a). The results shown in Table I(b),for a 60-trading-day price history image window width and fora 60-trading-day forecast horizon, are neither conclusive norsuggestive substantively or statistically.
Table II(a) shows the sensitivity of Trading Rule AverageProfit for the 9000-trading-day period to changes in σheight
for the 60-trading-day price history image window and for the60-trading-day forecast horizon of Table I(a) for the bull flagstock chart. The pattern of increasing Trading Rule AverageProfit as σfit and σheight are increased is clear, particularlyfor the higher values of σheight. Fig. 4(a) graphically presentsthe results. Table II(b) shows corresponding data for the bearflag stock chart. The higher values for the parameters σfit andσheight show the negative values for Average Excess Profit thattechnical analysis leads us to expect for this chart.
Table III(a) presents a forecast horizon sensitivity analysisfor the 60-trading-day price history image window for a σheight
value of 0.1 for the bull flag stock chart. To make the AverageExcess Profit statistics comparable across different forecasthorizons, the values are scaled by the absolute value of theMarket Average Profit as follows:
Scaled Average Excess Profit
= Average Excess Profit/|Market Average Profit|.
Fig. 5(a) shows the bull flag analysis results of Table III(a)in graphical form. The maximum values occur at a fore-cast horizon of about 20 trading days (for the 60-trading-day
Fig. 4. Each plotted line corresponds to one of the columns of summarydata in Table II and shows summary simulated trading results for different fitminimum parameter values in the trading rule. Trading results are sensitive tothe height minimum setting in the trading rule for all values of the fit minimumparameter. (a) Bull flag. (b) Bear flag.
TABLE IIIEXPERIMENTAL RESULTS SUMMARIZED FOR 9000 DAYS OF SIMULATED
TRADING WITH A 60-TRADING-DAY PRICE HISTORY IMAGE WINDOW
FOR THE STOCK CHART PATTERN TEMPLATES SHOWN IN FIG. 2.THE TRADING RULE TESTED IS, “IF Fitk > σfit AND Heightk > 0.1,
THEN BUY AND HOLD FOR [FORECAST HORIZON] TRADING
DAYS AND SELL.” (a) BULL FLAG. (b) BEAR FLAG
price history image window). In general, higher values of σfit
correspond to higher Scaled Average Excess Profit results.Table III(b) and Fig. 5(b) have a similar relationship, but forthe bear flag analysis results. For the shorter forecast horizons,the results for the bear flag show the negative values for Scaled
Authorized licensed use limited to: Hong. Downloaded on February 8, 2009 at 00:12 from IEEE Xplore. Restrictions apply.

100 IEEE TRANSACTIONS ON SYSTEMS, MAN, AND CYBERNETICS—PART A: SYSTEMS AND HUMANS, VOL. 38, NO. 1, JANUARY 2008
Fig. 5. Each plotted line corresponds to one of the columns of summarydata in Table III and shows summary simulated trading results for different fitminimum parameter values in the trading rule. Scaling the average excess profitmakes the values comparable for different forecast horizons. Trading results arebetter for higher minimum fit parameter values and for shorter trading horizons.(a) Bull flag. (b) Bear flag.
Average Excess Profit that technical analysis theory leads us toexpect.
In Table III, the best results for the 60-trading-day windowoccur at about the 20-day forecast horizon. The presentationof results in Table IV is structured in the same way as thatin Table I, except for the use of a 20-trading-day forecasthorizon (instead of 60). In Table IV(a), the relationship betweenTrading Rule Average Profit and the parameter values forσfit and σheight is evident: for increasing parameter values ofσfit and σheight, increasing values for Trading Rule AverageProfit and increasing statistical significance are experienced.Statistical significance is strong for the rightmost six columnsof Table IV(a). (A Kolmogorov–Smirnov test for normality onthe 9000 values for profitability at a 20-trading-day horizonresulted in a p-value less than 0.01, indicating that these dataare not normally distributed.)
Table IV(b) shows a profit relationship, opposite that ofTable IV(a), for the bear flag experiment between Trading RuleAverage Profit and the parameter values σfit and σheight. Theresults in Table IV(b) are systematic and achieve statisticalsignificance but are not as strong and clear as the results inTable IV(a). In Table IV(b), for increasing parameter values ofσfit and σheight, decreasing values for Trading Rule AverageProfit and increasing statistical significance are experienced.Statistical significance is strong for the rightmost two columnsof Table IV(b).
Table V contains the results of a sensitivity analysis on pricehistory image window size. Trading is to occur for those days
that have an “above average” value of Fitk and Heightk, sothe trading rule parameters σfit and σheight are redefined asfunctions of k, σfit(k), and σheight(k). The trading rule is,“If Fitk > σfit(k) and Heightk > σheight(k), then buy and holdfor h trading days and sell,” where h takes the values of 5,10, 20, 30, 40, and 50 trading days, and the parameters σfit(k)and σheight(k) are cumulative averages of Fitk and Heightkcalculated beginning one year (252 trading days) before thebeginning of the 9000-trading-day study period and up to andincluding trading day k. The cumulative average calculation isbegun one year before the start of the 9000-trading-day studyperiod so that a stable cumulative average would have beenestablished before the trading rule begins to be applied. Thus,we have
σfit(k) =k∑
i=−251
Fiti/(k + 252)
σheight(k) =k∑
i=−251
Heighti/(k + 252).
Fig. 6 is a graphical presentation of the summary results inTable V. Note that as the price history image window is length-ened, the results consistently reflect increases in the respectiveScaled Average Excess Profit effects for the bull flag (a), thoughthis does not appear as consistently in the graph for the bearflag (b). Generally, the plots are downward sloping for the bullflag (a) and upward sloping for the bear flag (b).
V. THOUGHT EXPERIMENT
The EMH has proven to be a difficult concept to falsify. Alarge body of very technical literature has been developed inacademic finance to defend the EMH from the challenges ofthe “anomalies.” The failure to confirm a null hypothesis, whenthe hypothesis is so well-established as the EMH, is a strongclaim, but not as strong as a claim of falsification of the theory.A claim of falsification requires proof beyond the level of ademonstration of statistical significance.
Our contention is that the experiments reported in this paperare a falsification of the weak form of the EMH. The followingis a procedure, a “thought experiment,” and an argument thatthe results in this paper, specifically the results in Table IV(a),constitute this falsification of this special form of the EMH.
Step 1) Construct a multisided die. Leave as many facesof that die blank as you wish. On the rest of thefaces, write instructions of the form, “Buy and holdfor h trading days and then sell,” with h being anynumbers that you wish, which is randomly assigned.
Step 2) Randomly choose one or several contiguous rowsof subperiod data from Table IV(a), but do notinclude the first row. Now, for the trading days inthe subperiod designated for the chosen row or rows,roll the die for each trading day included and, if thedie face showing for that roll for that trading dayis nonblank, record the amount of the returns frombuying on that day and holding for the h days, asinstructed by the writing on the die face showing.
Authorized licensed use limited to: Hong. Downloaded on February 8, 2009 at 00:12 from IEEE Xplore. Restrictions apply.

LEIGH et al.: TRADING WITH A STOCK CHART HEURISTIC 101
TABLE IVEXPERIMENTAL RESULTS FOR SIMULATED TRADING WITH A 60-TRADING-DAY PRICE HISTORY IMAGE WINDOW FOR THE STOCK CHART PATTERN
TEMPLATES SHOWN IN FIG. 2. THE TRADING RULE TESTED IS, “IF Fitk > σfit AND Heightk > σheight, THEN BUY AND HOLD FOR 20 TRADING DAYS
AND SELL.” THE FIRST ROW OF RESULTS IS AN OVERALL SUMMARY FOR THE COMPLETE TEST PERIOD OF 9000 TRADING DAYS. THE REMAINING
NINE ROWS OF SUMMARY DATA ARE FOR NINE SUBPERIODS OF 1000 TRADING DAYS EACH. (a) BULL FLAG. (b) BEAR FLAG
TABLE VEXPERIMENTAL RESULTS FOR SIMULATED TRADING WITH STOCK CHART
PATTERN TEMPLATES SHOWN IN FIG. 2 FOR FOUR DIFFERENT PRICE
HISTORY IMAGE WINDOW WIDTHS. THE TRADING RULE IS, “IF
Fitk > σfit(k) AND Heightk > σheight(k), THEN BUY AND HOLD FOR hTRADING DAYS AND SELL,” WHERE THE PARAMETERS σfit(k) AND
σheight(k) ARE CUMULATIVE AVERAGES OF Fitk AND Heightk UP TO
AND INCLUDING TRADING DAY k. (a) BULL FLAG. (b) BEAR FLAG
Sum these returns from this trading by the die forall of the trading days in the subperiod. Call this the“trading-by-die-only-total-return.”
Fig. 6. Each plotted line corresponds to one of the rows of summary datain Table V and shows summary simulated trading results for a different pricehistory image window width. (a) Bull flag. (b) Bear flag.
Step 3) Randomly choose a row or set of rows from the sub-period summary data in Table IV(a) for a subperiodor group of subperiods that precede the row or rows
Authorized licensed use limited to: Hong. Downloaded on February 8, 2009 at 00:12 from IEEE Xplore. Restrictions apply.

102 IEEE TRANSACTIONS ON SYSTEMS, MAN, AND CYBERNETICS—PART A: SYSTEMS AND HUMANS, VOL. 38, NO. 1, JANUARY 2008
used for determining the period of the trading-by-diesimulation of Step 1). Formulate a trading rule forany cell in this row or rows that have a Trading RuleAverage Profit % greater than the Market AverageProfit % reported for the subperiod of the row. Thetrading rule is to be supported by the summarydata in the row, specifying buying, if the Fitk andHeightk of a 60-day price history image windowmeet the minimum criteria of that cell, included inthe headings of Table IV, and holding for 20 tradingdays, which is the forecast horizon for Table IV.For example, for the row for subperiod 08/04/67 to09/01/71, a trading rule for the rightmost cell wouldbe, “If the Fitk is greater than 4.0 and the Heightkis greater than 0.1, then buy and hold for 20 tradingdays before selling.”
Step 4) Do the trading-by-die simulation of Step 2) againfor the same trading days with the same die asconstructed in Step 1) and used in Step 2). This time,however, if the die face showing for a trading daysays, “Buy and hold for 20 days before selling,” donot follow this instruction but, instead, follow thedictate of the trading rule developed in Step 2), andsum all of the returns that result from following therule, or the supplemental 20-day rule, on the die facefor all of the trading days in the period simulated inStep 2) to compute a “trading-by-die-augmented-by-stock-chart-heuristic-return.”
Repeat these four steps many times. The values in Table IV(a)make it apparent that, for a great majority of executions ofthe four steps of this thought experiment, the “trading-by-die-augmented-by-stock-chart-heuristic-return” computed inStep 4) will exceed the “trading-by-die-only-total-return” com-puted in Step 2). Of the 90 cells in Table IV(a) that containTrading Rule Average Profit % values for subperiod rows, 22do not exceed the respective subperiod Market Average Profit% values. Of those 22, seven do not exceed because the cells areblank, meaning that no trades were indicated by the minimumFitk and Heightk, as specified in the associated trading rules. Ofthose 22, six are in the bottom row for the period of the stockmarket crash of 1999–2000.
Now, for example, if the row chosen from Table IV(a) inStep 2) is next to the bottom one, for the subperiod 06/02/95,and the multifaced die constructed in Step 1) has at least oneface with the rule, “Buy and hold for h trading days and thensell,” then any rule construction in Step 3) is very likely toresult in a “trading-by-die-augmented-by-stock-chart-heuristic-return” value, which exceeds the “trading-by-die-only-total-return” value.
Note that for every execution of the four steps of the thoughtexperiment, the state of the three EMH assumption conditions(transactions costs, cost of information, and nature of investorexpectations) is identical for Steps 2) and 4), except that thereare no more transactions in the Step 4) trading simulation runthan in Step 2), making lower transaction costs possible forStep 4).
The subperiod selected in Step 2) may be considered to be a“test sample” for the particular replication of the thought exper-
iment, and the subperiod selected in Step 4) may be consideredto be a “learning sample” for the parameter settings to be usedin the trading rule. The construction of a learning experiment bybootstrapping the combinations of test and learning samples, asproposed for this thought experiment, is rigorous. The selectionof the forecast horizon for the building of the alternative tradingrule in Step 3) might draw on tables of summary data similar toTable IV(a), but for other window widths and other forecasthorizons. Table V(a) indicates that results that support theeffectiveness of trading rules based on the bull flag stock chartat several other window widths and forecast horizons. Theselection of these alternative rules for Step 3) for single andmultiple replications of the thought experiment might also beaccomplished in a bootstrap sort of process.
Table IV(a) is a result set for one stock chart pattern, for oneprice history image window size, and for one forecast horizon.The technical analysts claim a knowledge base of many stockchart patterns and the ability to apply that knowledge base tomany price history image window sizes and for many forecasthorizons. The thought experiment is extendible to encompassthe results of experimental efforts that are comparable to theone reported in this paper, but for other stock chart patterns andprice history image window sizes and forecast horizons. Stockchart patterns that signal market declines would be included inStep 3) as a rule of the form, “If the Fitk is greater than σfit
and the Heightk is greater than σheight, then sell and hold for htrading days before rebuying.”
VI. WAVE MOTION
Fig. 7 is a redrafting of the summary results behavior for thefour price history image window widths included in Table Vand Fig. 6. Interpolation is used to supply the data points notincluded in Table V. The time scale zero corresponds to thelowest point of the bull (a) or highest point of the bear (b) flagstock chart template in the fitting window. Note that for thebull flag (a), as the price behavior through time is graphed sothat the low points of the price history image fitting windowsfor the stock charts coincide, the Scaled Average Excess Profitgoes through an inflection (a high for the bull flag and a low forthe bear flag) at roughly the same point (about 40 trading daysfrom the pattern inflection point) for the different price historyimage window widths in (a) and (b). In the range of forecasthorizons included in this analysis, the Scaled Average ExcessProfit for the bull flag (a) never returns to zero—after initialpeaking, the effects (of whatever phenomena caused the pricebehavior to fit well to the bull flag) attenuate but remain abovezero. However, for the bear flag (b), in the range of forecasthorizons included in this analysis, the Scaled Average ExcessProfit achieves a low and then overshoots attenuation to becomepositive.
It is intriguing that the curves in Fig. 7(a) are so similar toeach other, and so are the curves in Fig. 7(b). One would expectthe shorter price history image window widths to detect patterninstances that were not detected by the longer price historyimage window widths, but that does not seem to be the case.If the same pattern instances are detected by all the windowwidths, then there may be some underlying very dominant wave
Authorized licensed use limited to: Hong. Downloaded on February 8, 2009 at 00:12 from IEEE Xplore. Restrictions apply.

LEIGH et al.: TRADING WITH A STOCK CHART HEURISTIC 103
Fig. 7. Each plotted line corresponds to one of the rows of summary datain Table V and shows summary simulated trading results for a differentprice history image window width. This figure differs from Fig. 6 in thatthe horizontal axis maps time from the inflection point [(a) low point of the“bull flag” pattern or (b) high point of the “bear flag” pattern] in fitting ofthe stock chart pattern template used. Plotted points appearing here, which arenot included in Table V, are the result of linear interpolation. (a) Bull flag.(b) Bear flag.
length, which is characteristic of the price behavior in the stockmarkets or in this market index. If the equilibrium of the stockmarket has physics that resemble the physics of a stretchedstring, then the bull and bear flags might be interpreted asplucking of that string. This could lead to much speculation andneeds further examination.
VII. SUMMARY AND CONCLUSION
This research has used a knowledge engineering approachto evaluate EMH by considering the pronounced stock chartprice pattern the “bull flag” that stock market technical analystsconsider as a signal for a stock market price increase. Theexperiment was replicated with the bull flag mirror imagepattern: the bear flag that signals a stock market price decrease.The study was implemented by employing a recognizer forthis pattern and testing that recognizer and associated heuristictrading rules for multiple forecast horizons and price historyimage window sizes through 35 years of New York StockExchange Index data.
The results are systematic, statistically significant, and gen-erally consistent across subperiods, agree with what the tech-nical analysts tell us to expect, and fail to confirm the nullhypothesis: that returns from trading using the predictionsof the heuristic trading rules are no better than what wouldhave been realized from trading decisions based on randomchoice. See the particularly strong results in the rightmost sixcolumns of Table IV(a) and in the rightmost three columns
of Table IV(b). A particularly strong result is that the mirrorimage template pattern of the bull flag template pattern givesprofitability results opposite those from the bull flag templatepattern. All of these positive results support the technical ana-lysts’ claims for the effectiveness of the price pattern heuristicapproach (stock charting) to market prediction. The resultsof this study challenge the weak-form EMH and inspire theconsideration of many variations of this experiment, such asother stock chart patterns, price history image window widths,and forecast horizons in future works. The possibilities forfurther works in learning and optimizing the pattern templateare obvious.
The results of this experiment invite speculation as to theunderlying stock market mechanisms that may be very effec-tively described by stock chart pattern heuristics. We searchedfor recent studies that might suggest the underlying effects atwork and found studies of information flow in market processes[35], [36], psychological studies of herd behavior in the stockmarket [37]–[39], and investor overconfidence [40]. The EMH,as currently formulated, ignores the time effects that can resultfrom information flow and processing mechanisms and shouldbe amended and extended to include these factors.
In future research, we plan to compare the behavior ofdifferent markets. Fig. 7 is an example of a response graphthat we plan to use as a comparative analytic tool. Examinationof this response graph, as prepared for several different stockmarket indices (such as the Dow Jones Industrial Average),may reveal systematic differences between the respective stockmarkets and types of securities that comprise the indices.
Although the effectiveness of technical analysis heuristics isdifficult to explain with currently accepted academic theory, wethink that further analysis of stock market dynamic behavioras wave motion (characteristic of energy systems and/or ofinformation diffusion systems), as suggested in Fig. 7, couldlead to an integrated understanding of the stock market thatis superior to the “random walk” model implied by the EMH.Practical thinking and experimentation such as this can be andshould be a precursor to the development of a formal theory.In due course, normal science will develop models to explainthese and all of the other EMH anomalies, which are currentlystudied as isolated phenomena, in an integrated way.
REFERENCES
[1] P. L. Bernstein, “A new look at the efficient market hypothesis,” J. Portf.Manage., vol. 25, no. 2, pp. 1–2, Winter 1999.
[2] R. Edwards and J. Magee, Technical Analysis of Stock Trends. NewYork: Amacom, 1997.
[3] E. Fama, “Efficient capital markets: A review of theory and empiricalwork,” J. Finance, vol. 25, no. 2, pp. 383–417, May 1970.
[4] N. Chopra, J. Lakonishok and J. Ritter.“Measuring abnormal perfor-mance do stocks overact?” J. Financ. Econ., vol. 31, pp. 235–268,1992.
[5] E. Fama, L. Fisher, M. Jensen, and R. Roll, “The adjustment of stockprices to new information,” Int. Econom. Rev., vol. 10, no. 1, pp. 2–21,Feb. 1969.
[6] R. Ibbotson, J. Sindelar, and J. Ritter, “Initial public offerings,” J. Appl.Corp. Finance, vol. 1, pp. 37–45, Summer 1988.
[7] L. Summers, “Does the stock market rationally reflect fundamentalvalues?” J. Finance, vol. 41, no. 41 pp.591–601, Jul. 1986.
[8] M. Jensen, “Symposium on some anomalous evidence regarding marketefficiency,” J. Financ. Econ., vol. 6, pp. 93–330, 1978.
Authorized licensed use limited to: Hong. Downloaded on February 8, 2009 at 00:12 from IEEE Xplore. Restrictions apply.

104 IEEE TRANSACTIONS ON SYSTEMS, MAN, AND CYBERNETICS—PART A: SYSTEMS AND HUMANS, VOL. 38, NO. 1, JANUARY 2008
[9] R. Ball, “The development, accomplishments and limitations of the theoryof stock market efficiency,” Manage. Finance, vol. 20, no. 2/3, pp. 3–48,1994.
[10] S. Grossman and J. Stiglitz, “On the impossibility of information-ally efficient markets,” Amer. Econ. Rev., vol. 70, no. 3, pp. 393–408,Jun. 1980.
[11] J. Jaffe, “Special information and insider trading,” J. Bus., vol. 47, no. 3,pp. 410–428, Jul. 1974.
[12] K. Nunn, G. Madden and M. Gombola, “Are some investors more ‘inside’than others?” J. Portf. Manage., vol. 9, pp. 19–22, Spring 1983.
[13] M. Rozeff and M. Zaman, “Market efficiency and insider trading: Newevidence,” J. Bus., vol. 61, no. 1, pp. 25–45, Jan. 1988.
[14] E. Fama, “Efficient capital markets,” J. Finance, vol. 46, no. 5, pp. 1575–1617, Dec. 1991.
[15] R. Gencay, “Optimization of technical trading strategies and the prof-itability in security markets,” Econ. Lett., vol. 59, no. 2, pp. 249–254,May 1998.
[16] A. Refenes, A. Zapranis, and G. Francis, “Stock performance modelingusing neural networks: A comparative study with regression models,”Neural Netw., vol. 7, no. 2, pp. 375–388, 1994.
[17] K. Kohara, T. Ishikawa, Y. Fukuhara, and Y. Nakamura, “Stock priceprediction using prior knowledge and neural networks,” Intell. Syst.Accounting, Finance Manage., vol. 6, pp. 11–22, 1997.
[18] G. Grudnitski and L. Osburn, “Forecasting S and P and gold futures prices:An application of neural networks,” J. Futures Mark., vol. 13, no. 6,pp. 631–643, 1993.
[19] K. Lee and W. Kim, “Integration of human knowledge and machineknowledge by using fuzzy post adjustment: Its performance in stockmarket timing prediction,” Expert Syst., vol. 12, no. 4, pp. 331–338, 1995.
[20] K. Poh, “An intelligent decision support system for investment analysis,”Knowl. Inf. Syst., vol. 2, no. 3, pp. 340–358, Aug. 2000.
[21] K. Kim and I. Han, “The extraction of trading rules from stock mar-ket data using rough sets,” Expert Syst., vol. 18, no. 4, pp. 194–202,Sep. 2001.
[22] H. Dourra and P. Siy, “Stock evaluation using fuzzy logic,” Int. J. Theor.Appl. Financ., vol. 4, no. 4, pp. 585–602, 2001.
[23] M. Last, Y. Klein, and A. Kandel, “Knowledge discovery in time seriesdatabases,” IEEE Trans. Syst., Man, Cybern. B, Cybern., vol. 31, no. 1,pp. 160–169, Feb. 2001.
[24] J. Armstrong and F. Collopy, “Causal forces: Structuring knowledge fortime-series extrapolation,” J. Forecast., vol. 13, pp. 103–115, 1993.
[25] S. Skouras, “Financial returns and efficiency as seen by an artificialtechnical analyst,” J. Econ. Dyn. Control, vol. 25, no. 1/2, pp. 213–244,Jan. 2001.
[26] H. Hong, T. Lim, and J. Stein, “Bad news travels slowly: Size, analyst cov-erage, and the profitability of momentum strategies,” J. Finance, vol. 55,no. 1, pp. 205–295, Feb. 2000.
[27] H. Hong and J. Stein, “A unified theory of underreaction, momentumtrading, and overreaction in asset markets,” J. Finance, vol. 54, no. 6,pp. 2143–2184, Dec. 1999.
[28] L. Chan, N. Jegadeesh, and J. Lakonishok, “Momentum strategies,”J. Finance, vol. 51, pp. 1681–1713, 1996.
[29] G. Caginalp, D. Porter, and V. Smith, “Momentum and overreactionin experimental asset markets,” Int. J. Ind. Organ., vol. 18, no. 1, pp. 187–204, Jan. 2000.
[30] J. Conrad and G. Kaul, “An anatomy of trading strategies,” Rev. Financ.Stud., vol. 11, no. 3, pp. 489–519, 1998.
[31] G. Frankfurter and E. McGoun, “Anomalies in finance: What are theyand what are they good for?” Int. Rev. Financ. Analy. vol. 10, no. 4,pp. 407–429, 2001.
[32] E. Fama, “The behavior of stock market prices,” J. Bus., vol. 38, no. 1,pp. 34–105, Jan. 1965.
[33] A. Lo, H. Mamaysky, and J. Wang, “Foundations of technical analysis:Computational algorithms, statistical inference, and empirical implemen-tation,” J. Finance, vol. 55, no. 4, pp. 1705–1765, Aug. 2000.
[34] T. Sargent, Bounded Rationality in Macroeconomics. Oxford, U.K.:Oxford Univ. Press, 1995.
[35] G. Franke and D. Hess, “Information diffusion in electronic and floortrading,” J. Empir. Finance, vol. 7, no. 5, pp. 455–478, Dec. 2000.
[36] T. George and C. Hwang, “Information flow and pricing errors: A unifiedapproach to estimation and testing,” Rev. Financ. Stud., vol. 14, no. 4,pp. 979–1020, Oct. 2001.
[37] L. Nelson, “Persistence and reversal in herd behavior: Theory and appli-cation to the decision to go public,” Rev. Financ. Stud., vol. 15, no. 1,pp. 65–95, Mar. 2002.
[38] E. Chang, J. Cheng, and A. Khorana, “An examination of herd behavior inequity markets: An international perspective,” J. Bank. Finance, vol. 24,no. 10, pp. 1651–1679, Oct. 2000.
[39] A. Banerjee, “A simple model of herd behavior,” Q. J. Econ., vol. CVII,no. 3, pp. 797–817, Aug. 1992.
[40] K. Daniel and S. Titman, “Market efficiency in an irrational world,”Financ. Anal. J., pp. 28–40, Nov./Dec. 1999.
William Leigh is a Professor of management information systems in the De-partment of Management Information System, College of Business, Universityof Central Florida, Orlando. He is the author of several papers published inthe IEEE TRANSACTIONS ON SYSTEMS, MAN, AND CYBERNETICS, DecisionSupport Systems, and other journals. He is currently investigating the use oftechnical indicators for forecasting the stock market.
Cheryl J. Frohlich received the M.B.A. degree from Illinois State University,Normal, and the master’s and Ph.D. degrees in finance from the University ofIllinois, Urbana.
She is with the University of North Florida, Jacksonville, as an AssociateProfessor of finance. She has worked extensively in the banking industry andcontinues to do consulting. She is the author of several articles on banking,investing, and management topics published in scholarly journals, conferences,and practitioner publications, such as the Journal of Service Marketing, theJournal of Business Strategy, Advances in Financial Planning and Forecasting,the Journal of Business and Psychology, the Journal of Business Strategies, theJournal of Business Finance and Accounting, the Journal of Portfolio Manage-ment, the Journal of Financial Research, Review of Quantitative Finance andAccounting, and Florida Banking.
Dr. Frohlich has received several awards for teaching and research, includingthe University’s Outstanding Undergraduate Teaching Award, Finance Teacherof the Year Award, McKnight Fellowship, Kip Research Fellowship, andSecurities and Futures Authority’s Outstanding Paper in Investments.
Steven Hornik is an Assistant Professor of management information systemsin the Department of Management Information System, College of Business,University of Central Florida, Orlando. His research interests include theeffectiveness of technology-mediated learning for training and higher educa-tion and the social implications of technology. He has been involved in theResearch Initiative for Teaching Effectiveness, University of Central Florida,to examine the impact of distance learning outcomes. His research has focusedon the relationship between learner variables (social presence, confidence, andmotivation), the use of technology for learning (self-efficacy), and learningoutcomes.
Russell L. Purvis received the B.S. degree from the University of Miami, CoralGables, FL, the M.B.A. degree from Georgia State University, Atlanta, and thePh.D. degree in business administration (MIS) from Florida State University,Tallahassee.
He is an Associate Professor in the Department of Management, ClemsonUniversity, Clemson, SC. His current research interests include organizationaltransformation through information technologies, issues in the implementationof IT applications within organizations, project management, and stock marketreturns based on the technical analysis market forecasting technique. He hashad papers accepted for publication in Decision Support Systems, the IEEETRANSACTIONS ON ENGINEERING MANAGEMENT, Information and Man-agement, Management Science, and Organization Science, among others.
Tom L. Roberts received the M.B.A. and Ph.D. degrees in information systemsfrom Auburn University, Auburn, AL.
He is currently the Clifford R. King Professor of Information Systems withthe Department of Management and Information Systems, Louisiana TechUniversity, Ruston. His work has been published in the Journal of ManagementInformation Systems, Information and Management, Journal of the Associationof Information Systems, and others. His research interests include informationassurance, collaborative software and technology, information systems person-nel issues, and project management.
Dr. Roberts has work published in the IEEE TRANSACTIONS ON
SOFTWARE ENGINEERING and the IEEE TRANSACTIONS ON PROFESSIONAL
COMMUNICATION.
Authorized licensed use limited to: Hong. Downloaded on February 8, 2009 at 00:12 from IEEE Xplore. Restrictions apply.