Embed Size (px)
Citation preview

Sample COPQ Study

All Rights Reserved, Juran Institute, Inc. (slide name here) 2 .PPT
Managers and workers speak the language of things but Senior leaders speak the language of money
… COPQ allows us to translate the things into money.

All Rights Reserved, Juran Institute, Inc. (slide name here) 3 .PPT
Prevention
Appraisal: Prediction Audit
Appraisal: Detection
Failure: InternalExternal
Cost of AttainingQuality
Cost of Poor Quality
Cost Of Poor Quality

All Rights Reserved, Juran Institute, Inc. (slide name here) 4 .PPT
Components
Non-Conformance
$Conformance
$
$
Quality Costs

All Rights Reserved, Juran Institute, Inc. (slide name here) 5 .PPT
Total Quality Cost
Appraisal Internal Failure
ExternalFailure
I want my
money back!
Cost of Quality (COQ)$
Prevention

All Rights Reserved, Juran Institute, Inc. (slide name here) 6 .PPT
COPQ Overview
Definitions
All activities and processes that do not meet agreed performance and/or expected outcomes
Costs that would disappear if every task were always performed without deficiency
Actual Cost - Minimum Cost = COPQ

All Rights Reserved, Juran Institute, Inc. (slide name here) 7 .PPT
Waste
Testing Costs
Rework
Customer Returns
Inspection CostsRejects
Recalls
Traditional Cost Of Poor Quality
(4-5% of Sales)
When quality costs are initially determined, the categories included are the visible ones as depicted in the iceberg below.
All Rights Reserved, Juran Institute, Inc. (slide name here) 8 .PPT
Late Paperwork
Customer AllowancesPremium Freight CostsPricing orBilling Errors
Excessive FieldServices Expenses
Incorrectly CompletedSales OrderLack of Follow-up
on Current ProgramsExcessive
Employee Turnover Planning Delays
Development Costof Failed Product
Expediting Costs
Excess Inventory
ExcessiveSystem Costs
Overdue Receivables
ComplaintHandling
Unused Capacity
Time with DissatisfiedCustomer
Excessive Overtime
Waste
Testing Costs
Rework
Customer Returns
Inspection CostsRejects
COPQ rangesfrom 15-25% of Sales
As a company gains a broader definition of poor quality,the hidden portion of the iceberg becomes apparent:
Recalls
Cost Of Poor Quality

All Rights Reserved, Juran Institute, Inc. (slide name here) 9 .PPT
Efficiency Study
Total Cost of Poor Quality is $59,728,973Recurring Costs in One Year
$32,089,143
$13,106,268$14,533,562
53.7%
21.9%24.3%
Internal CostsExternal CostsAppraisals Costs

All Rights Reserved, Juran Institute, Inc. (slide name here) 10 .PPT
Efficiency Study
Cumulative TotalCost of Quality is $143,178,401
Internal Failures
External Costs
Appraisal Costs
$115,538,571
$13,106,208
$14,533,562
80.7%
9.2%
10.2%
Internal CostsExternal CostsAppraisals Costs
All Rights Reserved, Juran Institute, Inc. (slide name here) 11 .PPT
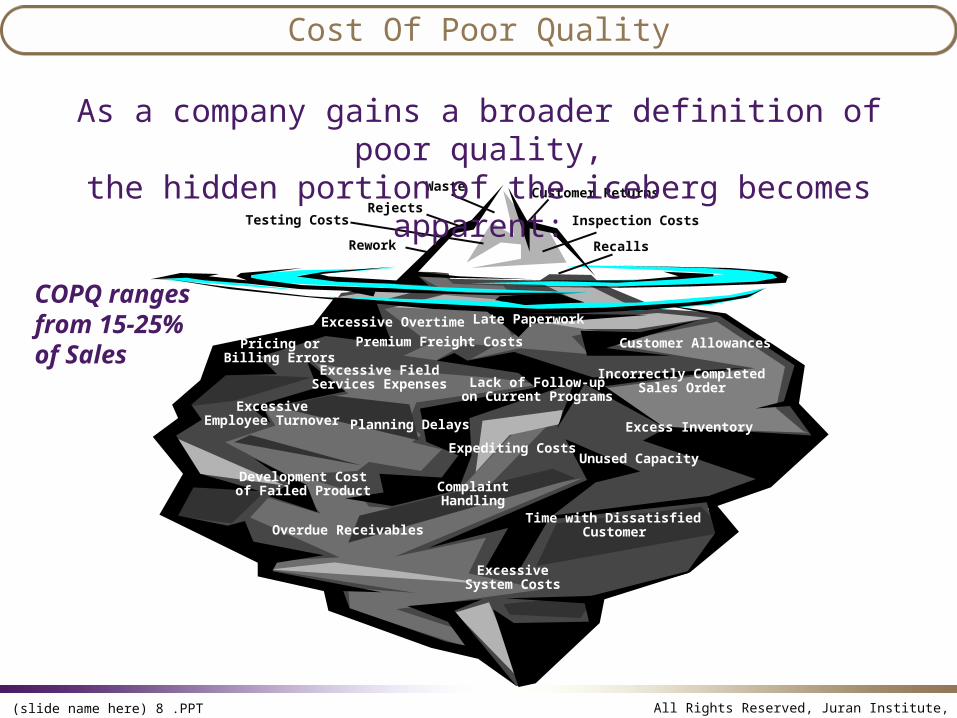
Cumulative Internal Costs
A B C D E F G H J K L M Q N O P0
10
20
30
40
50
60
70
80
90
100
110
120
0%
20%
40%
60%
80%
100%
Categories COPQ
Dol
lars
/Yea
rM
illio
nsC
UM
.%

All Rights Reserved, Juran Institute, Inc. (slide name here) 12 .PPT
Cumulative Internal Costs
INTERNAL COSTS DOLLARS INDIV % CUM % CATEGORIES
Excess inventory reserves $36,253,810 31.38% 31.4% ASafety stock $25,785,999 22.32% 53.7% BIntermediate stock inventory (Net) $16,213,000 14.03% 67.7% CObsolete inventory reserves $11,552,776 10.00% 77.7% DProduction scrap $6,469,000 5.60% 83.3% EExcess inventory reserves carrying costs $5,075,533 4.39% 87.7% FSafety stock carrying costs $3,610,040 3.12% 90.8% GDispositions (Unreserved outermediate scrap) $2,473,000 2.14% 93.0% HProduction rework $2,470,000 2.14% 95.1% JIntermediate stock carrying costs $2,269,540 1.96% 97.1% KObsolete inventory reserves carrying costs $1,617,389 1.40% 98.5% LQC reinspection indirect costs $642,114 0.56% 99.0% MInvestigation of failures-Mfg. Eng. $445,536 0.39% 99.4% NDesign changes $333,000 0.29% 99.7% ODowntime $212,834 0.18% 99.9% P
Vendor rework charges $115,000 0.10% 100.0% QBack-log late payments lost interest 0.00% 100.0% RAccounts receivables 0.00% 100.0% S
0.00% 100.0% TOTAL $115,538,571 100.00%

All Rights Reserved, Juran Institute, Inc. (slide name here) 13 .PPT
Internal Costs – 12 Months
A. Excess inventory reserves - Reserves for on-hand slow moving inventory that exceeds the 24 month sales forecast. Reported on the Year 1 Excess and Obsolete Analysis Report from Cost Accounting.
B. Safety stock - Excess inventory maintained as an in-house bank because of the inability to produce reliable yields, forecast consistently, or receive procured products on a timely basis. FGs valued at 2 months the Year 1 annual standard cost of sales; packaging materials valued at 1 month the usage in dollars; raw materials valued at 1 month the usage in dollars. Information reported from Materials Management and Production Planning.
Component Descriptions

All Rights Reserved, Juran Institute, Inc. (slide name here) 14 .PPT
Internal Costs – 12 Months
C. Intermediate stock inventory (net) – Work-in-process material used as a buffer for inadequate foundry yields, inaccurate sales forecasts and launch plans, design changes which necessitate rapid response, and to support the complexities of instrument assemblies. Data derived from Stock Analysis Report. Net inventory is utilized to not duplicate excess and obsolete reserves costs.
D. Obsolete inventory reserves - Reserves for inventory of inactive product (removed from the price list). Reported on the Year 1 Excess and Obsolete Report.
Component Descriptions (continued)

All Rights Reserved, Juran Institute, Inc. (slide name here) 15 .PPT
Internal Costs – 12 Months
E. Production scrap - Material discarded in one year and reported by cell and product family. Reported on the Scrap Report as well as multiple journal entries.
F. Provisions for excess inventory - Only money provided from the operations to cover identified excess and obsolete inventory. Reported on the Year 1 Excess and Obsolete Report and the Cost of Sales Analysis.
H. Dispositions (unreserved outermediate scrap) - Quarantine and disposal of units with questionable packaging by QA. Reported on the Full Year Dispositions Report.
Component Descriptions (continued)

All Rights Reserved, Juran Institute, Inc. (slide name here) 16 .PPT
Internal Costs – 12 Months
J. Production rework - Rework as reported by department. Dollars are actual direct labor hours by department times the conversion rate.
G., K., L. Carrying costs (excess inventory reserves, safety stock, intermediate stock, obsolete inventory reserves) - Calculated values for the cost to maintain inventory and reserves to inventory. Calculated as the weighted average cost of capital (14%) times the specific inventory or reserves dollars.
Component Descriptions (continued)

All Rights Reserved, Juran Institute, Inc. (slide name here) 17 .PPT
M. QC re-inspection indirect costs - Estimated non-reported QC indirect labor hours expended in a year as part preparation prior to performing a re-inspection of reworked product. Calculated as an estimated 212 indirect hours per week as part preparation for rework times 46 production weeks times $66 per hour (direct labor rate + variable overhead rate).
N. Investigation of failures (Mfg. Eng.) - Estimate of time spent by manufacturing engineering personnel in the investigation and resolution of internal failure problems. Calculated as approximately 35% of time in units 1, 2, and 3 times an average cost/hr. of $35 times the number of personnel.
O. Design changes scrap - Scrap principally on vended items because of design enhancements. Reported on the Year 1 Customer Returns-Scrap/Rework Report.
Component Descriptions (continued)
Internal Costs – 12 Months

All Rights Reserved, Juran Institute, Inc. (slide name here) 18 .PPT
Internal Costs – 12 Months
P. Production downtime - Reported downtime by department/cell. Calculated as actual reported hours of downtime (bar-coded as downtime) times each cells specific fixed overhead rate.
Q. Vendor rework charges - Vendor charges for reworking a product because of company error. 95% was because of a blister packaging re-inspection that had channeling which was suspect for sterility. Reported on the Cost Accounting Sundry Schedule (misc. charges).
R. Backing
S. Accounts receivable
Component Descriptions (continued)

All Rights Reserved, Juran Institute, Inc. (slide name here) 19 .PPT
Internal Costs Category A
Excessive Inventory Reserves is: $36,253,810
Finished goodsWork in processRaw materials
EXCESSINVENTORY
TOTAL $
Finished goods $31,292,402
Work in process $4,460,408
Raw materials $501,000
TOTAL $ $36,253,810
$31,292,402
$4,460,408
$501,000
86.3%
12.3%
1.4%

All Rights Reserved, Juran Institute, Inc. (slide name here) 20 .PPT
Pareto Analysis Product Group
EXCESSIVE RESERVE EFFECT DOLLARS '% INDIV '% CUM CATEGORIES
Unit 1 $15,153,840 41.80% 41.8% A1
Unit 2 $8,682,800 23.95% 65.7% A2
Unit 3 $7,368,144 20.32% 86.1% A3
Unit 4 $4,301,665 11.87% 97.9% A4
Unit 5 $552,631 1.52% 99.5% A5
Other $109,447 0.30% 99.8% A6
Accessories $80,283 0.22% 100.0% A7
Miscellaneous $5,000 0.01% 100.0% A8
TOTAL $36,253,810 100.00%
A1 A2 A3 A4 A5 A6 A7 A80
6
12
18
24
30
36
0%
20%
40%
60%
80%
100%
Product Group Categories
DO
LL
AR
S / Y
EA
R
Millio
ns
CU
M.%
Category A: Excessive Inventory Reserves

All Rights Reserved, Juran Institute, Inc. (slide name here) 21 .PPT
Internal Costs Category B
Safety Stock (Just In Case Inventory)
$24,832,000
$762,083$191,916
SAFETY STOCK TOTAL $Finished goods $24,832,000Raw material $762,083Packaging materials $191,916TOTAL $ $25,785,999
Finished goodsPackagingmaterials$191,916
Raw materialFinished goodsWork in processRaw materials

All Rights Reserved, Juran Institute, Inc. (slide name here) 22 .PPT
Internal Costs Category C
Intermediate Stock is $ 16,213,000
$9,249,000
$6,964,000
57.0%
43.0%
UnitsInstruments
INTERMEDIATE STOCK (NET) TOTAL $
Units $9,249,000Instruments $6,964,000TOTAL $ $16,213,000

All Rights Reserved, Juran Institute, Inc. (slide name here) 23 .PPT
Internal Costs Category C
Unit Products Total Value is $ 9,249,000
Unit 1Unit 2Unit 3Unit 4AccessoriesCustomOtherUltra
STOCK IMPLANTS (NET) TOTAL $
Unit 1 $3,877,000
Unit 2 $2,330,000
Unit 3 $2,151,000
Unit 4 $483,000
Accessories $270,000
Custom $83,000
Other $37,000
Ultra $18,000
TOTAL $ $9,249,000
25.2%
23.3%
5.2%
2.9%0.9%
0.2%
0.4%

All Rights Reserved, Juran Institute, Inc. (slide name here) 24 .PPT
Internal Costs Category C
Instruments Total Value is: $6,964,000
Instrument 2Instrument 1Instrument 3AccessoriesInstrument 4CustomUltraOther
STOCK INSTRUMENTS (NET) TOTAL $
Instrument 2 $3,740,000
Instrument 1 $1,823,000
Instrument 3 $739,000
Accessories $349,000
Instrument 4 $283,000
Custom $22,000
Ultra $7,000
Other $1,000
TOTAL $ $6,964,000
26.2%
53.7%
10.6%
5.0%
4.1%
0.1%0.3%

All Rights Reserved, Juran Institute, Inc. (slide name here) 25 .PPT
Internal Costs Category D
Obsolete Inventory Reserves is: 11,552,776
OBSOLETE INVENTORY TOTAL $
Finished goods $7,639,002
Work in process $3,913,774
TOTAL $ $11,552,776
$7,639,002
$3,913,774
66.1%
33.9%
Finished goodsWork in process
All Rights Reserved, Juran Institute, Inc. (slide name here) 26 .PPT
Pareto Analysis Product Groups
D1 D2 D3 D4 D5 D6 D7 D80
2
4
6
8
10
0%
20%
40%
60%
80%
100%
Product Group Categories
DO
LL
AR
S /
YE
AR
Mil
lio
ns
CU
M.%
OBSOLETE RESERVE EFFECT DOLLARS '% INDIV '% CUM CATEGORIES
Unit 2 $4,154,014 36.05% 36.1% D1
Unit 3 $3,537,586 30.70% 66.8% D2
Unit 1 $2,927,840 25.41% 92.2% D3
Custom $709,309 6.16% 98.3% D4
Other $69,252 0.60% 98.9% D5
Unit 4 $63,752 0.55% 99.5% D6
Miscellaneous $34,025 0.30% 99.8% D7
Accessories $26,998 0.23% 100.0% D8
TOTAL $11,522,776 100.00%
Category D: Obsolete Inventory Reserves

All Rights Reserved, Juran Institute, Inc. (slide name here) 27 .PPT
Year 1 Internal Costs
Pareto Analysis
E Z F G H J K L M Q N O P0
5
10
15
20
25
30
0%
20%
40%
60%
80%
100%
Categories COPQ
Dol
lars
/Yea
rM
illio
nsC
UM
.%

All Rights Reserved, Juran Institute, Inc. (slide name here) 28 .PPT
Year 1 Internal Costs
1996 INTERNAL COSTS DOLLARS / YEAR % INDIV % CUM CATEGORIES
Production scrap $6,469,000 20.16% 20.2% E
Provisions for obsolete & excess inventory $6,356,157 19.81% 40.0% Z
Excess inventory reserves carrying costs $5,075,533 15.82% 55.8% F
Safety stock carrying costs $3,610,040 11.25% 67.0% G
Dispositions (Unreserved outermediate scrap) $2,473,000 7.71% 74.7% H
Production rework $2,470,000 7.70% 82.4% J
Intermediate stock carrying costs $2,269,540 7.07% 89.5% K
Obsolete inventory reserves carrying costs $1,617,389 5.04% 94.6% L
QC reinspection indirect costs $642,114 2.00% 96.6% M
Investigation of failures-Mfg. Eng. $445,536 1.39% 97.9% N
Design changes $333,000 1.04% 99.0% O
Downtime $212,834 0.66% 99.6% PVendor rework charges $115,000 0.36% 100.0% Q
Back-log late payments lost interest 0.00% R
Accounts receivables 0.00% S
TOTAL $32,089,143 100.00%

All Rights Reserved, Juran Institute, Inc. (slide name here) 29 .PPT
Pareto Analysis
SCRAP CATEGORIES DOLLARS / YEAR '% INDIV '% CUM CATEGORIES
Unit 1 $1,843,000 28.5% 28.5% E1
Unit 2 $1,651,000 25.5% 54.0% E2
Unit 3 $1,576,000 24.4% 78.4% E3
Fixed heads $823,000 12.7% 91.1% E4
Custom $237,000 3.7% 94.8% E5
Internal fixation $235,000 3.6% 98.4% E6
Accessories $44,000 0.7% 99.1% E7
External fixation $33,000 0.5% 99.6% E8
Other $27,000 0.4% 100.0% E9
TOTAL PLANT $6,469,000 100.0%
E1 E2 E3 E4 E5 E6 E7 E8 E90
1
2
3
4
5
6
0%
20%
40%
60%
80%
100%
Scrap Categories
DO
LL
AR
S /
YE
AR
Mil
lio
ns
CU
M.%
Internal Costs Category E Production Scrap

All Rights Reserved, Juran Institute, Inc. (slide name here) 30 .PPT
Internal Costs Category E1
Unit 1 Total Scrap Value is: $1,843,000
33.2%
33.0%
13.2%11.2%
9.4%
PCA
OTHER
PRECISION
PARTNERSH
LOCK
Unit 1
PCA $611,000
Other $609,000
Precision $243,000
Partnership $206,000
Lock $174,000
TOTAL $1,843,000

All Rights Reserved, Juran Institute, Inc. (slide name here) 31 .PPT
Internal Costs Category E2
Unit 2 Total Scrap Value is: $1,651,000
Unit 2
PCA $1,154,000
MAX $288,000
OTHER $125,000
MATIC $84,000
TOTAL $1,651,000
69.9%
17.4%
7.6%
5.1%
PCAMAXOTHERMATIC
All Rights Reserved, Juran Institute, Inc. (slide name here) 32 .PPT
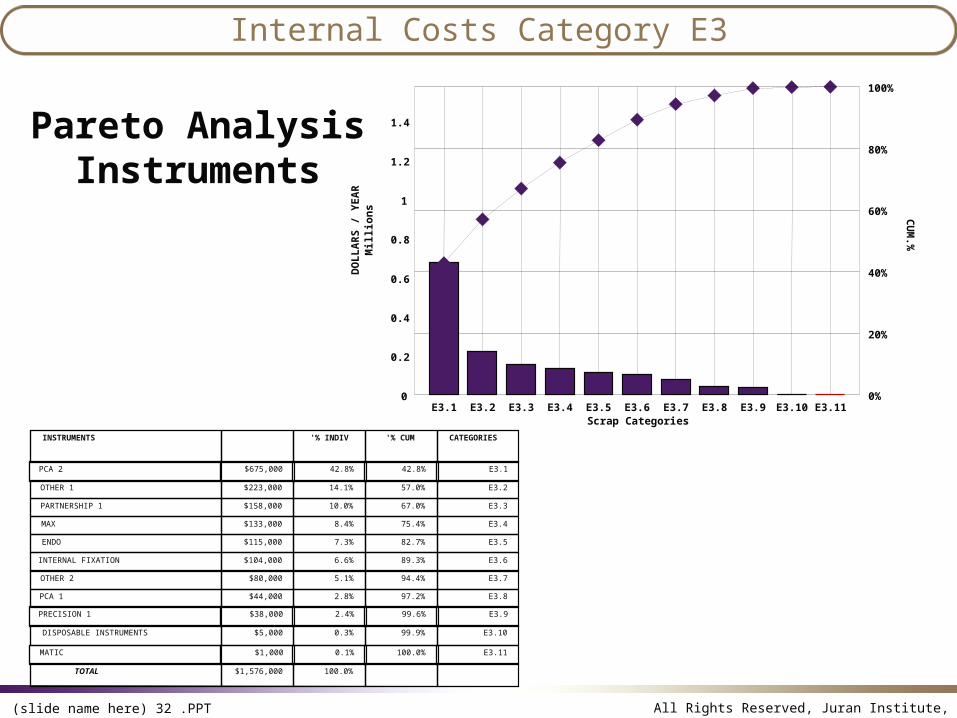
Internal Costs Category E3
Pareto Analysis Instruments
INSTRUMENTS '% INDIV '% CUM CATEGORIES
PCA 2 $675,000 42.8% 42.8% E3.1
OTHER 1 $223,000 14.1% 57.0% E3.2
PARTNERSHIP 1 $158,000 10.0% 67.0% E3.3
MAX $133,000 8.4% 75.4% E3.4
ENDO $115,000 7.3% 82.7% E3.5
INTERNAL FIXATION $104,000 6.6% 89.3% E3.6
OTHER 2 $80,000 5.1% 94.4% E3.7
PCA 1 $44,000 2.8% 97.2% E3.8
PRECISION 1 $38,000 2.4% 99.6% E3.9
DISPOSABLE INSTRUMENTS $5,000 0.3% 99.9% E3.10
MATIC $1,000 0.1% 100.0% E3.11
TOTAL $1,576,000 100.0%
E3.1 E3.2 E3.3 E3.4 E3.5 E3.6 E3.7 E3.8 E3.9 E3.10 E3.110
0.2
0.4
0.6
0.8
1
1.2
1.4
0%
20%
40%
60%
80%
100%
Scrap Categories
DO
LL
AR
S /
YE
AR
Mil
lio
ns C
UM
.%
All Rights Reserved, Juran Institute, Inc. (slide name here) 33 .PPT
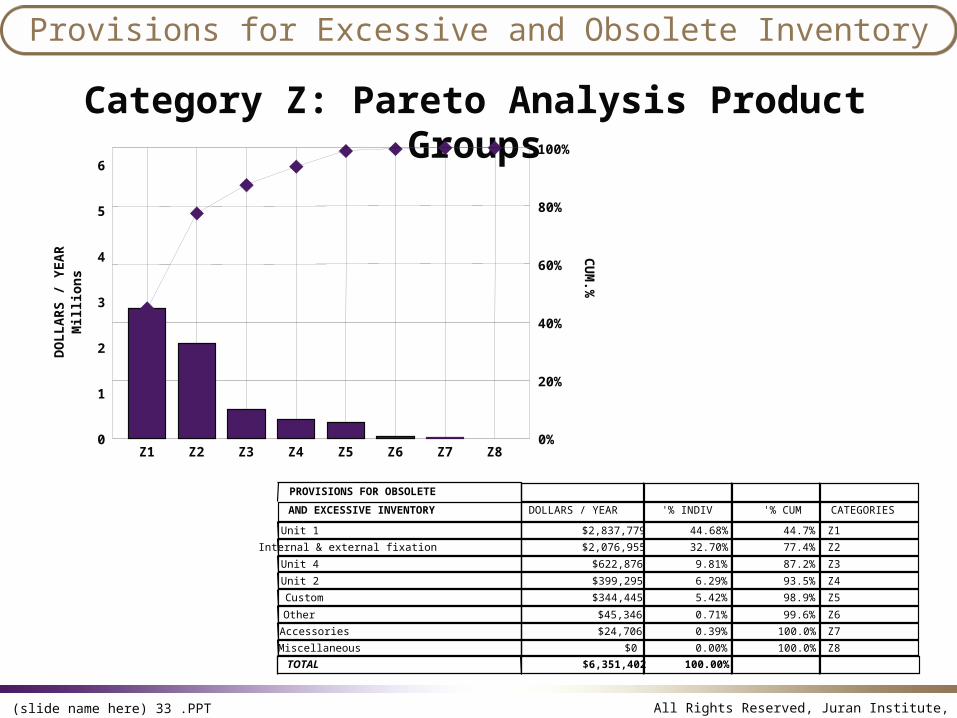
Category Z: Pareto Analysis Product Groups
Z1 Z2 Z3 Z4 Z5 Z6 Z7 Z80
1
2
3
4
5
6
0%
20%
40%
60%
80%
100%
Product Group Categories
DO
LL
AR
S /
YE
AR
Mill
ion
s
CU
M.%
PROVISIONS FOR OBSOLETE
AND EXCESSIVE INVENTORY DOLLARS / YEAR '% INDIV '% CUM CATEGORIES
Unit 1 $2,837,779 44.68% 44.7% Z1
Internal & external fixation $2,076,955 32.70% 77.4% Z2
Unit 4 $622,876 9.81% 87.2% Z3
Unit 2 $399,295 6.29% 93.5% Z4
Custom $344,445 5.42% 98.9% Z5
Other $45,346 0.71% 99.6% Z6
Accessories $24,706 0.39% 100.0% Z7
Miscellaneous $0 0.00% 100.0% Z8
TOTAL $6,351,402 100.00%
Provisions for Excessive and Obsolete Inventory

All Rights Reserved, Juran Institute, Inc. (slide name here) 34 .PPT
Pareto Analysis
Rework Categories
J1 J2 J3 J4 J5 J6 J7 J8 J90
0.5
1
1.5
2
0%
20%
40%
60%
80%
100%
DO
LL
AR
S /
YE
AR
Mill
ion
s
CU
M.%
DESCRIPTION DOLLARS / YEAR '% INDIV '% CUM CATEGORIES
Inspection Instruments $714,000 28.91% 28.9% J1
Inspection Recon $467,000 18.91% 47.8% J2
Unit 2 $390,000 15.79% 63.6% J3
Unit 1 $376,000 15.22% 78.8% J4
Unit 3 $235,000 9.51% 88.3% J5
Packaging $178,000 7.21% 95.5% J6
Foundry $96,000 3.89% 99.4% J7
Plastics $7,000 0.28% 99.7% J8
Custom $7,000 0.28% 100.0% J9
$2,470,000 100.00%
Internal Costs Category J Production Rework

All Rights Reserved, Juran Institute, Inc. (slide name here) 35 .PPT
Internal Costs Category J1
Inspection Instruments Total Value is $714,000
$540,000
$174,000
75.6%
24.4%
Instruments & machinesInspection
INSPECTIONInstruments & machine
$540,000
Inspection $174,000DOLLARS / YEAR $714,000

All Rights Reserved, Juran Institute, Inc. (slide name here) 36 .PPT
Internal Costs Category J2
Inspection Recon Total Value is $467,000
INSPECTION RECON
Inspection $401,000X-ray $66,000DOLLAR / YEAR $467,000
$401,000
$66,000
85.9%
14.1%
InspectionX-ray

All Rights Reserved, Juran Institute, Inc. (slide name here) 37 .PPT
Internal Costs Category J3
Unit 2 Rework Total Value is $390,000
$262,000
$128,000
67.2%
32.8%
Part APart B
Unit 2Part A $262,000Part B $128,000DOLLAR / YEAR $390,000

All Rights Reserved, Juran Institute, Inc. (slide name here) 38 .PPT
Internal Costs Category J4
Unit 1 Rework Total Value is $376,000
Unit 1
Finishing $251,000Titanium $79,000Cup $31,000Screw & pin $9,000Primary A $6,000DOLLARS / YEAR $376,000
$251,000
$79,000
$31,000
$9,000$6,000
66.8%
21.0%
8.2%
2.4%1.6%
FinishingTitaniumCupScrew & pinPrimary A

All Rights Reserved, Juran Institute, Inc. (slide name here) 39 .PPT
Pareto Analysis by Department
281209
201200
219210
287208
211222
205207
206217
2140
30
60
90
120
150
180
210
0%
20%
40%
60%
80%
100%
Departments
Do
llar
s/Y
ear
Th
ou
san
ds CU
M.%
Internal Costs Category O Downtime

All Rights Reserved, Juran Institute, Inc. (slide name here) 40 .PPT
External Cumulative Costs
Pareto Analysis
A B C D E F G H0
2
4
6
8
10
12
14
16
0%
20%
40%
60%
80%
100%
CATEGORIES COPQ
Do
llar
s/Y
ear
Mil
lio
ns
CU
M.%

All Rights Reserved, Juran Institute, Inc. (slide name here) 41 .PPT
External Cumulative Costs
EXTERNAL COSTS DOLLARS / YEAR '% INDIV
'% CUM CATEGORIES
Product liability assessment $5,554,000 31.15% 31.1% ACode 4 scrap customer returns $2,546,311 14.28% 71.9% BLitigation expenses $2,240,000 12.56% 84.5% CRepack labor & overhead $1,041,000 5.84% 90.3% DProduct surveillance compl. invest. $651,713 3.65% 94.0% ETechnical relations department 487 $482,219 2.70% 96.7% FProduct recall Regulatory department 260 $374,857 2.10% 98.8% GCustomer return department 447 $216,168 1.21% 100.0% HLost sales 0.00% 100.0% JRecall campaigns 0.00% 100.0% K TOTAL $13,106,268 1

All Rights Reserved, Juran Institute, Inc. (slide name here) 42 .PPT
External Costs
A. Product liability assessment charges - Product liability charges for self insured risk sensitive, self insured loss sensitive, and excess insurance premiums. The two main elements of product liability costs are a reserve accrual for self assumed losses and premium costs for the insurance that comes over the self assumed loss level. The self insured reserve accrual is allocated based on risk weighted sales and 5 year loss history.
B. Code 4 scrap customer returns - Customer returns identified by the Customer Returns Department as available for scrap by Inspection Code. Reported on the Year 1 Customer Returns and Scrap/Rework Report.
Component Descriptions

All Rights Reserved, Juran Institute, Inc. (slide name here) 43 .PPT
External Costs Category A
Product Liability Assessment 1996 is$ 5,554,000
$4,750,000
$414,000
$390,000
85.5%
7.5%
7.0%
Self insured loss seExcess insurance preSelf insured risk se
PRODUCT LIABILITY ASSESSMENT TOTAL $
Self insured loss sensitive $4,750,000
Excess insurance premium $414,000
Self insured risk sensitive $390,000
TOTAL $ $5,554,000
All Rights Reserved, Juran Institute, Inc. (slide name here) 44 .PPT
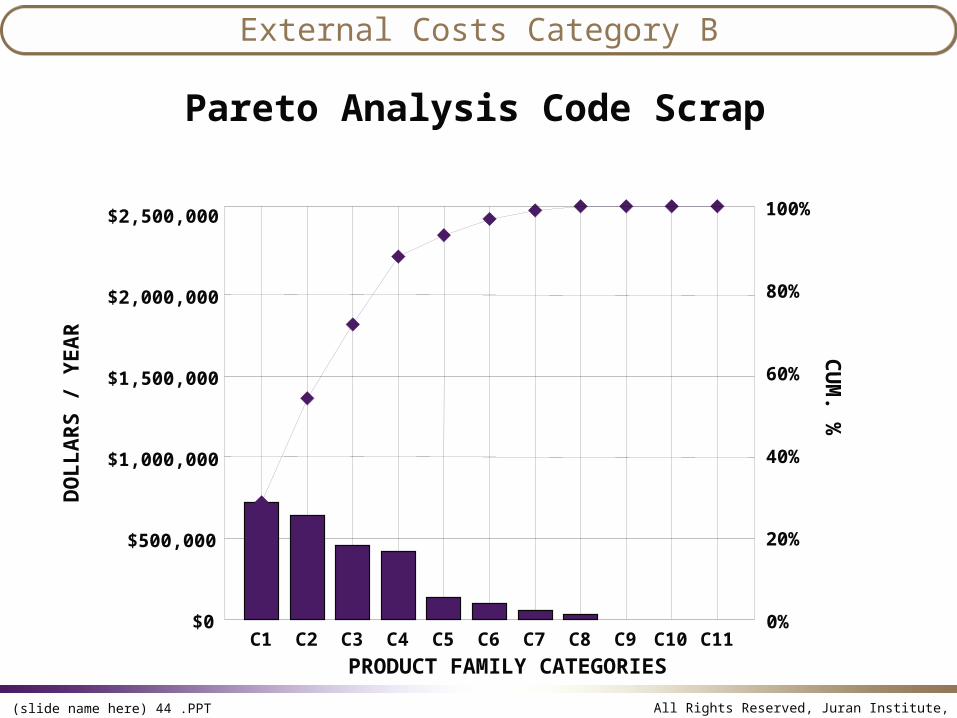
External Costs Category B
Pareto Analysis Code Scrap
C1 C2 C3 C4 C5 C6 C7 C8 C9 C10 C11$0
$500,000
$1,000,000
$1,500,000
$2,000,000
$2,500,000
0%
20%
40%
60%
80%
100%
PRODUCT FAMILY CATEGORIES
DO
LL
AR
S /
YE
AR
CU
M. %

All Rights Reserved, Juran Institute, Inc. (slide name here) 45 .PPT
Code Scrap
DOLLAR VALUE DESTRUCTION CODE 4 1996 CUSTOMER RETURNS-SCRAP & REWORK
% INDIVIDUAL % CUM PRODUCT FAMILY CATEGORY
$721,492 28.33% 28.3% total knees C1$639,928 25.13% 53.5% total hips C2$457,336 17.96% 71.4% total internal fixation C3$416,213 16.35% 87.8% total endos C4$133,536 5.24% 93.0% total custom C5
$97,915 3.85% 96.9% total external C6$53,481 2.10% 99.0% total simplex & acc. C7$26,410 1.04% 100.0% total other ortho C8
0.00% 100.0% C90.00% 100.0% C100.00% 100.0% C11
$2,546,311 100.00% TOTAL
All Rights Reserved, Juran Institute, Inc. (slide name here) 46 .PPT
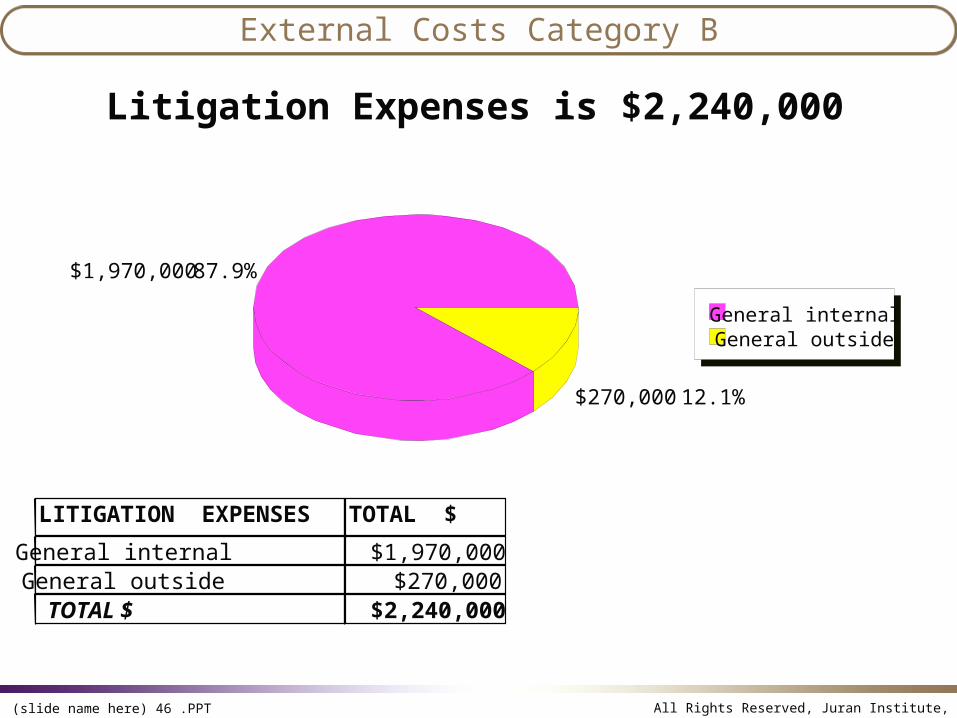
External Costs Category B
Litigation Expenses is $2,240,000
$1,970,000
$270,000
87.9%
12.1%
General internalGeneral outside
LITIGATION EXPENSES TOTAL $
General internal $1,970,000General outside $270,000TOTAL $ $2,240,000

All Rights Reserved, Juran Institute, Inc. (slide name here) 47 .PPT
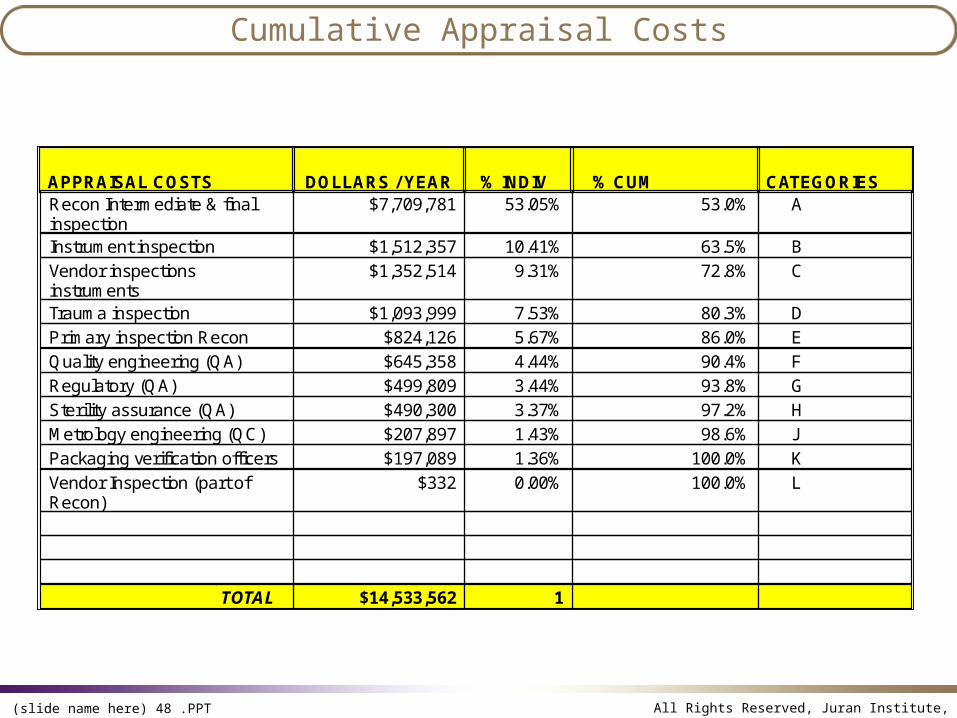
Cumulative Appraisal Costs
Pareto Analysis
A B
C D
E F
G H
J K
L M
N0
2
4
6
8
10
12
14
0%
20%
40%
60%
80%
100%
Categories COQ
Dol
lars
/Yea
rM
illio
nsC
UM
.%
All Rights Reserved, Juran Institute, Inc. (slide name here) 48 .PPT
Cumulative Appraisal Costs
APPRAISAL COSTS DOLLARS / YEAR '% INDIV
'% CUM CATEGORIES
Recon Intermediate & final inspection
$7,709,781 53.05% 53.0% A
Instrument inspection $1,512,357 10.41% 63.5% B
Vendor inspections instruments
$1,352,514 9.31% 72.8% C
Trauma inspection $1,093,999 7.53% 80.3% D
Primary inspection Recon $824,126 5.67% 86.0% E
Quality engineering (QA) $645,358 4.44% 90.4% F
Regulatory (QA) $499,809 3.44% 93.8% G
Sterility assurance (QA) $490,300 3.37% 97.2% H
Metrology engineering (QC) $207,897 1.43% 98.6% J
Packaging verification officers $197,089 1.36% 100.0% K
Vendor Inspection (part of Recon)
$332 0.00% 100.0% L
TOTAL $14,533,562 1

All Rights Reserved, Juran Institute, Inc. (slide name here) 49 .PPT
Appraisal Costs
Component Descriptions
A-E, K,L. Recon intermediate and final inspection, instrument inspection, vendor inspection (instruments), trauma inspection, primary inspection, packaging verification officers - actual dollars spent for inspection of Reconstructive, unit and instrument product. Reported on the Year 1 Responsibility Report for each department.
F. Quality Engineering - time spent in shop floor inspection support and raw material inspection. Calculated as 30% of Year 1 Responsibility Report for Dept. (minus sub-dept. B activity).


![COPQ & ROI Presentation 572 [10-18-16]](https://img.pdfslide.net/doc/110x75/58ee5de51a28abdc0b8b45e5/copq-roi-presentation-572-10-18-16.jpg)